0001081400allspring:ALLSPRINGIndexRussell3000Index15903BroadBasedIndexMember2022-04-300001081400allspring:ALLSPRINGIndexRussell3000GrowthIndex15900AdditionalIndexMember2022-03-310001081400allspring:ALLSPRINGIndexSP500Index15940BroadBasedIndexMember2021-04-300001081400allspring:ALLSPRINGIndexRussell3000Index15946BroadBasedIndexMember2019-01-310001081400allspring:ALLSPRINGIndexRussell3000Index15943BroadBasedIndexMember2019-01-310001081400allspring:ALLSPRINGIndexRussell3000Index15950BroadBasedIndexMember2018-12-310001081400allspring:ALLSPRINGIndexRussell1000GrowthIndex15998AdditionalIndexMember2020-04-300001081400allspring:ALLSPRINGIndexRussell3000Index15995BroadBasedIndexMember2024-03-310001081400allspring:ALLSPRINGIndexRussell1000ValueIndex25194AdditionalIndexMember2021-06-30

UNITED STATES
SECURITIES AND EXCHANGE COMMISSION
Washington, D.C. 20549
FORM N-CSR
CERTIFIED SHAREHOLDER REPORT OF REGISTERED
MANAGEMENT INVESTMENT COMPANIES
Investment Company Act file number: 811-09253
Allspring Funds Trust
(Exact name of registrant as specified in charter)
1415 Vantage Park Drive, 3rd Floor, Charlotte, NC 28203
(Address of principal executive offices) (Zip code)
Matthew Prasse
Allspring Funds Management, LLC
1415 Vantage Park Drive, 3rd Floor, Charlotte, NC 28203
(Name and address of agent for service)
Registrant’s telephone number, including area code: 800-222-8222
Date of fiscal year end: July 31
Registrant is making a filing for 7 of its series: Allspring Disciplined U.S. Core Fund, Allspring Growth Fund, Allspring Large Cap Growth Fund, Allspring Large Company Value Fund, Allspring Large Cap Core Fund, Allspring Premier Large Company Growth Fund, and Allspring Special Large Cap Value Fund.
Date of reporting period: July 31, 2024
ITEM 1. REPORT TO STOCKHOLDERS
Annual Shareholder Report
Disciplined U.S. Core Fund
This annual shareholder report contains important information about Disciplined U.S. Core Fund for the period of August 1, 2023 to July 31, 2024. You can find additional information about the Fund at allspringglobal.com. You can also request this information by contacting us at 1-800-222-8222.
What were the Fund costs for the past year?
The table explains the costs you would have paid within the reporting period based on a hypothetical $10,000 investment.
| CLASS NAME | COST OF A $10,000 INVESTMENT | COSTS PAID AS A % OF A $10,000 INVESTMENT |
|---|
| Institutional Class | $54 | 0.48% |
The manager has contractually committed to waive fees and/or reimburse certain expenses to the extent necessary to cap the Fund's total annual fund operating expense ratio at a specific amount. Without this cap, the costs shown above may have been higher. Please see the prospectus for the amount and the expiration date of the cap. Prior to or after the commitment expiration date, the cap may be increased or the commitment to maintain the cap may be terminated only with the approval of the Board of Trustees.
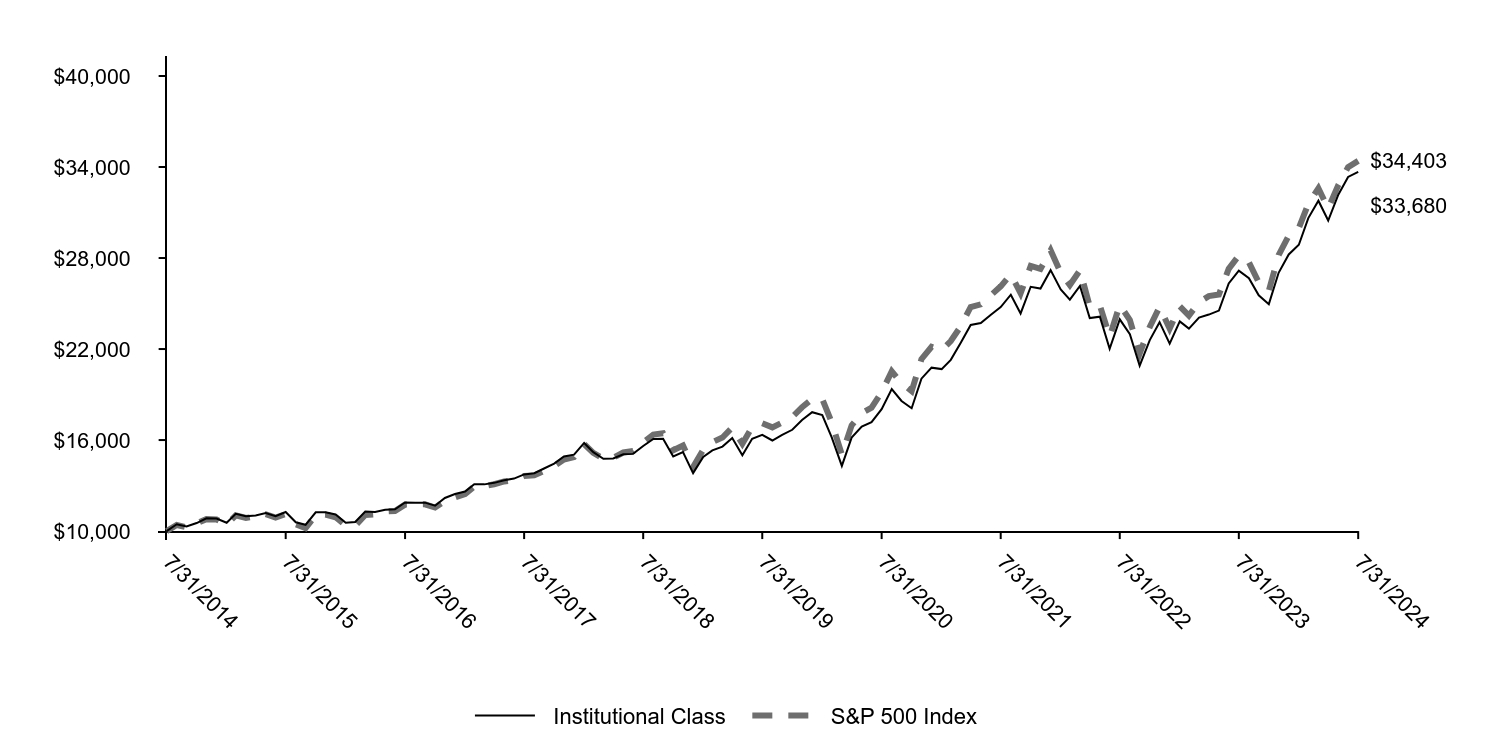
How did the Fund perform last year and what affected its performance?
During the period, the Fund outperformed its benchmark, and the Fund's investment strategy of systematically identifying undervalued companies with superior earnings fundamentals and positive momentum did not cause the Fund’s performance to materially deviate from the manager’s expectations. Characteristics typically favored in the portfolio include attractive valuation, earnings consistency, profitability, and improving sentiment. The manager’s quantitative alpha model results were positive during the period, with the value, quality, and momentum factor groups all exhibiting strength.
Bottom-up stock selection effects within consumer discretionary, financials, and information technology (IT) contributed to relative performance. Negative stock selection effects within materials and real estate detracted from relative performance. The Fund’s underweight to IT also detracted modestly from results. Over the longer term, broad diversification and risk controls surrounding sector weights typically result in stock selection being the main driver of relative performance within the Fund.
Total return based on a $10,000 investment
| Institutional Class | S&P 500 Index |
|---|
| 7/31/2014 | $10,000 | $10,000 |
| 8/31/2014 | $10,449 | $10,400 |
| 9/30/2014 | $10,298 | $10,254 |
| 10/31/2014 | $10,528 | $10,505 |
| 11/30/2014 | $10,844 | $10,787 |
| 12/31/2014 | $10,824 | $10,760 |
| 1/31/2015 | $10,551 | $10,437 |
| 2/28/2015 | $11,133 | $11,037 |
| 3/31/2015 | $10,975 | $10,862 |
| 4/30/2015 | $11,025 | $10,966 |
| 5/31/2015 | $11,191 | $11,108 |
| 6/30/2015 | $10,975 | $10,892 |
| 7/31/2015 | $11,255 | $11,121 |
| 8/31/2015 | $10,580 | $10,450 |
| 9/30/2015 | $10,414 | $10,191 |
| 10/31/2015 | $11,234 | $11,051 |
| 11/30/2015 | $11,241 | $11,084 |
| 12/31/2015 | $11,098 | $10,909 |
| 1/31/2016 | $10,549 | $10,368 |
| 2/29/2016 | $10,598 | $10,354 |
| 3/31/2016 | $11,284 | $11,056 |
| 4/30/2016 | $11,260 | $11,099 |
| 5/31/2016 | $11,405 | $11,298 |
| 6/30/2016 | $11,438 | $11,327 |
| 7/31/2016 | $11,890 | $11,745 |
| 8/31/2016 | $11,874 | $11,762 |
| 9/30/2016 | $11,874 | $11,764 |
| 10/31/2016 | $11,672 | $11,549 |
| 11/30/2016 | $12,181 | $11,977 |
| 12/31/2016 | $12,440 | $12,214 |
| 1/31/2017 | $12,606 | $12,445 |
| 2/28/2017 | $13,087 | $12,939 |
| 3/31/2017 | $13,079 | $12,955 |
| 4/30/2017 | $13,179 | $13,088 |
| 5/31/2017 | $13,345 | $13,272 |
| 6/30/2017 | $13,461 | $13,355 |
| 7/31/2017 | $13,735 | $13,629 |
| 8/31/2017 | $13,818 | $13,671 |
| 9/30/2017 | $14,125 | $13,953 |
| 10/31/2017 | $14,448 | $14,278 |
| 11/30/2017 | $14,913 | $14,716 |
| 12/31/2017 | $15,037 | $14,880 |
| 1/31/2018 | $15,810 | $15,732 |
| 2/28/2018 | $15,202 | $15,152 |
| 3/31/2018 | $14,768 | $14,767 |
| 4/30/2018 | $14,785 | $14,824 |
| 5/31/2018 | $15,063 | $15,181 |
| 6/30/2018 | $15,089 | $15,274 |
| 7/31/2018 | $15,610 | $15,843 |
| 8/31/2018 | $16,070 | $16,359 |
| 9/30/2018 | $16,088 | $16,452 |
| 10/31/2018 | $14,924 | $15,327 |
| 11/30/2018 | $15,202 | $15,640 |
| 12/31/2018 | $13,822 | $14,228 |
| 1/31/2019 | $14,892 | $15,368 |
| 2/28/2019 | $15,319 | $15,861 |
| 3/31/2019 | $15,571 | $16,169 |
| 4/30/2019 | $16,129 | $16,824 |
| 5/31/2019 | $14,994 | $15,755 |
| 6/30/2019 | $16,082 | $16,865 |
| 7/31/2019 | $16,343 | $17,108 |
| 8/31/2019 | $15,971 | $16,837 |
| 9/30/2019 | $16,343 | $17,152 |
| 10/31/2019 | $16,677 | $17,523 |
| 11/30/2019 | $17,319 | $18,159 |
| 12/31/2019 | $17,836 | $18,707 |
| 1/31/2020 | $17,642 | $18,700 |
| 2/29/2020 | $16,182 | $17,161 |
| 3/31/2020 | $14,294 | $15,041 |
| 4/30/2020 | $16,162 | $16,969 |
| 5/31/2020 | $16,883 | $17,778 |
| 6/30/2020 | $17,184 | $18,131 |
| 7/31/2020 | $18,040 | $19,153 |
| 8/31/2020 | $19,364 | $20,530 |
| 9/30/2020 | $18,576 | $19,750 |
| 10/31/2020 | $18,099 | $19,225 |
| 11/30/2020 | $20,045 | $21,329 |
| 12/31/2020 | $20,774 | $22,149 |
| 1/31/2021 | $20,678 | $21,926 |
| 2/28/2021 | $21,286 | $22,530 |
| 3/31/2021 | $22,427 | $23,517 |
| 4/30/2021 | $23,589 | $24,772 |
| 5/31/2021 | $23,717 | $24,945 |
| 6/30/2021 | $24,250 | $25,527 |
| 7/31/2021 | $24,762 | $26,134 |
| 8/31/2021 | $25,583 | $26,929 |
| 9/30/2021 | $24,346 | $25,676 |
| 10/31/2021 | $26,106 | $27,475 |
| 11/30/2021 | $25,988 | $27,285 |
| 12/31/2021 | $27,201 | $28,507 |
| 1/31/2022 | $25,927 | $27,032 |
| 2/28/2022 | $25,256 | $26,223 |
| 3/31/2022 | $26,159 | $27,196 |
| 4/30/2022 | $24,040 | $24,825 |
| 5/31/2022 | $24,132 | $24,870 |
| 6/30/2022 | $22,013 | $22,818 |
| 7/31/2022 | $23,959 | $24,921 |
| 8/31/2022 | $22,974 | $23,905 |
| 9/30/2022 | $20,902 | $21,703 |
| 10/31/2022 | $22,592 | $23,461 |
| 11/30/2022 | $23,773 | $24,772 |
| 12/31/2022 | $22,353 | $23,344 |
| 1/31/2023 | $23,822 | $24,811 |
| 2/28/2023 | $23,346 | $24,206 |
| 3/31/2023 | $24,073 | $25,095 |
| 4/30/2023 | $24,272 | $25,486 |
| 5/31/2023 | $24,537 | $25,597 |
| 6/30/2023 | $26,323 | $27,288 |
| 7/31/2023 | $27,170 | $28,165 |
| 8/31/2023 | $26,667 | $27,717 |
| 9/30/2023 | $25,542 | $26,395 |
| 10/31/2023 | $24,960 | $25,840 |
| 11/30/2023 | $27,025 | $28,200 |
| 12/31/2023 | $28,239 | $29,481 |
| 1/31/2024 | $28,877 | $29,977 |
| 2/29/2024 | $30,633 | $31,577 |
| 3/31/2024 | $31,779 | $32,593 |
| 4/30/2024 | $30,473 | $31,262 |
| 5/31/2024 | $32,171 | $32,812 |
| 6/30/2024 | $33,346 | $33,989 |
| 7/31/2024 | $33,680 | $34,403 |
Disciplined U.S. Core Fund
Annual Shareholder Report | July 31, 2024
AVERAGE ANNUAL TOTAL RETURNS (%)
| 1 Year | 5 Years | 10 Years |
|---|
| Institutional Class | 23.96 | 15.56 | 12.91 |
| S&P 500 Index | 22.15 | 15.00 | 13.15 |
| Total net assets | $1,102,215,985 |
| # of portfolio holdings | 157 |
| Portfolio turnover rate | 37% |
| Total advisory fees paid | $3,431,110 |
What did the Fund invest in?
(Based on long-term investments)
TOP TEN HOLDINGS (% OF NET ASSETS)
| Microsoft Corp. | 6.9 |
| Apple, Inc. | 6.9 |
| NVIDIA Corp. | 6.1 |
| Amazon.com, Inc. | 4.1 |
| Meta Platforms, Inc. Class A | 2.6 |
| Alphabet, Inc. Class C | 2.2 |
| Broadcom, Inc. | 2.0 |
| Alphabet, Inc. Class A | 2.0 |
| Berkshire Hathaway, Inc. Class B | 1.6 |
| JPMorgan Chase & Co. | 1.5 |
SECTOR ALLOCATION (% OF LONG-TERM INVESTMENTS)
| Information technology | 31.0 |
| Financials | 13.5 |
| Health care | 12.1 |
| Consumer discretionary | 9.7 |
| Communication services | 9.5 |
| Industrials | 7.9 |
| Consumer staples | 5.9 |
| Energy | 3.6 |
| Real estate | 2.8 |
| Utilities | 2.4 |
| Materials | 1.6 |
You can find additional information on the Fund's website at allspringglobal.com, including its:
- Prospectus - Financial Information - Fund holdings - Proxy voting information
Annual Shareholder Report
Disciplined U.S. Core Fund
This annual shareholder report contains important information about Disciplined U.S. Core Fund for the period of August 1, 2023 to July 31, 2024. You can find additional information about the Fund at allspringglobal.com. You can also request this information by contacting us at 1-800-222-8222.
What were the Fund costs for the past year?
The table explains the costs you would have paid within the reporting period based on a hypothetical $10,000 investment.
| CLASS NAME | COST OF A $10,000 INVESTMENT | COSTS PAID AS A % OF A $10,000 INVESTMENT |
|---|
| Class R6 | $46 | 0.41% |
The manager has contractually committed to waive fees and/or reimburse certain expenses to the extent necessary to cap the Fund's total annual fund operating expense ratio at a specific amount. Without this cap, the costs shown above may have been higher. Please see the prospectus for the amount and the expiration date of the cap. Prior to or after the commitment expiration date, the cap may be increased or the commitment to maintain the cap may be terminated only with the approval of the Board of Trustees.
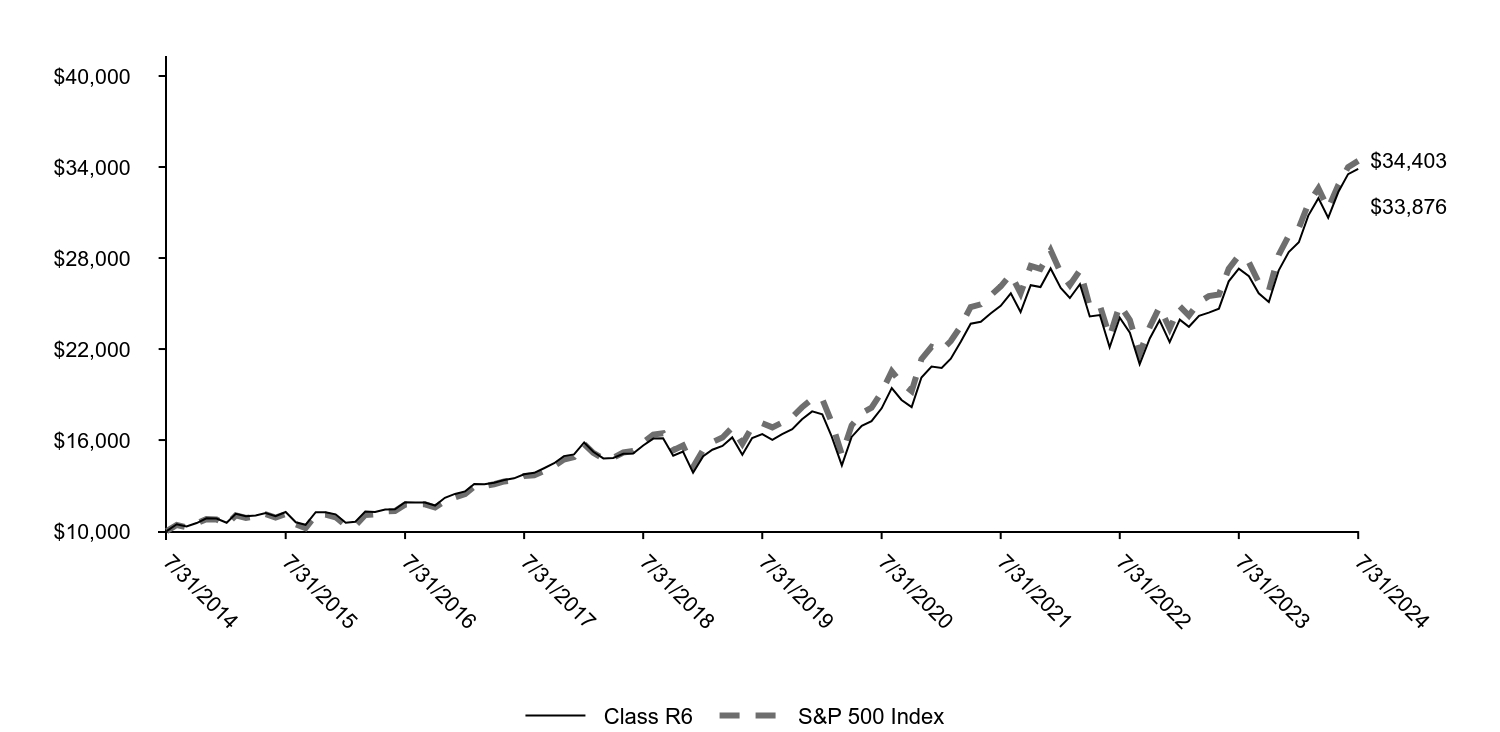
How did the Fund perform last year and what affected its performance?
During the period, the Fund outperformed its benchmark, and the Fund's investment strategy of systematically identifying undervalued companies with superior earnings fundamentals and positive momentum did not cause the Fund’s performance to materially deviate from the manager’s expectations. Characteristics typically favored in the portfolio include attractive valuation, earnings consistency, profitability, and improving sentiment. The manager’s quantitative alpha model results were positive during the period, with the value, quality, and momentum factor groups all exhibiting strength.
Bottom-up stock selection effects within consumer discretionary, financials, and information technology (IT) contributed to relative performance. Negative stock selection effects within materials and real estate detracted from relative performance. The Fund’s underweight to IT also detracted modestly from results. Over the longer term, broad diversification and risk controls surrounding sector weights typically result in stock selection being the main driver of relative performance within the Fund.
Total return based on a $10,000 investment
| Class R6 | S&P 500 Index |
|---|
| 7/31/2014 | $10,000 | $10,000 |
| 8/31/2014 | $10,449 | $10,400 |
| 9/30/2014 | $10,298 | $10,254 |
| 10/31/2014 | $10,528 | $10,505 |
| 11/30/2014 | $10,844 | $10,787 |
| 12/31/2014 | $10,824 | $10,760 |
| 1/31/2015 | $10,551 | $10,437 |
| 2/28/2015 | $11,133 | $11,037 |
| 3/31/2015 | $10,975 | $10,862 |
| 4/30/2015 | $11,025 | $10,966 |
| 5/31/2015 | $11,191 | $11,108 |
| 6/30/2015 | $10,975 | $10,892 |
| 7/31/2015 | $11,255 | $11,121 |
| 8/31/2015 | $10,580 | $10,450 |
| 9/30/2015 | $10,414 | $10,191 |
| 10/31/2015 | $11,241 | $11,051 |
| 11/30/2015 | $11,241 | $11,084 |
| 12/31/2015 | $11,105 | $10,909 |
| 1/31/2016 | $10,552 | $10,368 |
| 2/29/2016 | $10,608 | $10,354 |
| 3/31/2016 | $11,289 | $11,056 |
| 4/30/2016 | $11,265 | $11,099 |
| 5/31/2016 | $11,417 | $11,298 |
| 6/30/2016 | $11,441 | $11,327 |
| 7/31/2016 | $11,897 | $11,745 |
| 8/31/2016 | $11,889 | $11,762 |
| 9/30/2016 | $11,881 | $11,764 |
| 10/31/2016 | $11,681 | $11,549 |
| 11/30/2016 | $12,194 | $11,977 |
| 12/31/2016 | $12,448 | $12,214 |
| 1/31/2017 | $12,613 | $12,445 |
| 2/28/2017 | $13,106 | $12,939 |
| 3/31/2017 | $13,090 | $12,955 |
| 4/30/2017 | $13,189 | $13,088 |
| 5/31/2017 | $13,361 | $13,272 |
| 6/30/2017 | $13,477 | $13,355 |
| 7/31/2017 | $13,748 | $13,629 |
| 8/31/2017 | $13,839 | $13,671 |
| 9/30/2017 | $14,143 | $13,953 |
| 10/31/2017 | $14,472 | $14,278 |
| 11/30/2017 | $14,941 | $14,716 |
| 12/31/2017 | $15,057 | $14,880 |
| 1/31/2018 | $15,841 | $15,732 |
| 2/28/2018 | $15,229 | $15,152 |
| 3/31/2018 | $14,790 | $14,767 |
| 4/30/2018 | $14,816 | $14,824 |
| 5/31/2018 | $15,092 | $15,181 |
| 6/30/2018 | $15,118 | $15,274 |
| 7/31/2018 | $15,643 | $15,843 |
| 8/31/2018 | $16,099 | $16,359 |
| 9/30/2018 | $16,116 | $16,452 |
| 10/31/2018 | $14,963 | $15,327 |
| 11/30/2018 | $15,238 | $15,640 |
| 12/31/2018 | $13,851 | $14,228 |
| 1/31/2019 | $14,931 | $15,368 |
| 2/28/2019 | $15,365 | $15,861 |
| 3/31/2019 | $15,614 | $16,169 |
| 4/30/2019 | $16,177 | $16,824 |
| 5/31/2019 | $15,032 | $15,755 |
| 6/30/2019 | $16,131 | $16,865 |
| 7/31/2019 | $16,389 | $17,108 |
| 8/31/2019 | $16,020 | $16,837 |
| 9/30/2019 | $16,389 | $17,152 |
| 10/31/2019 | $16,721 | $17,523 |
| 11/30/2019 | $17,367 | $18,159 |
| 12/31/2019 | $17,889 | $18,707 |
| 1/31/2020 | $17,695 | $18,700 |
| 2/29/2020 | $16,226 | $17,161 |
| 3/31/2020 | $14,332 | $15,041 |
| 4/30/2020 | $16,207 | $16,969 |
| 5/31/2020 | $16,932 | $17,778 |
| 6/30/2020 | $17,241 | $18,131 |
| 7/31/2020 | $18,092 | $19,153 |
| 8/31/2020 | $19,425 | $20,530 |
| 9/30/2020 | $18,643 | $19,750 |
| 10/31/2020 | $18,169 | $19,225 |
| 11/30/2020 | $20,121 | $21,329 |
| 12/31/2020 | $20,846 | $22,149 |
| 1/31/2021 | $20,751 | $21,926 |
| 2/28/2021 | $21,365 | $22,530 |
| 3/31/2021 | $22,498 | $23,517 |
| 4/30/2021 | $23,674 | $24,772 |
| 5/31/2021 | $23,801 | $24,945 |
| 6/30/2021 | $24,341 | $25,527 |
| 7/31/2021 | $24,850 | $26,134 |
| 8/31/2021 | $25,676 | $26,929 |
| 9/30/2021 | $24,437 | $25,676 |
| 10/31/2021 | $26,206 | $27,475 |
| 11/30/2021 | $26,089 | $27,285 |
| 12/31/2021 | $27,310 | $28,507 |
| 1/31/2022 | $26,034 | $27,032 |
| 2/28/2022 | $25,367 | $26,223 |
| 3/31/2022 | $26,275 | $27,196 |
| 4/30/2022 | $24,148 | $24,825 |
| 5/31/2022 | $24,240 | $24,870 |
| 6/30/2022 | $22,113 | $22,818 |
| 7/31/2022 | $24,067 | $24,921 |
| 8/31/2022 | $23,078 | $23,905 |
| 9/30/2022 | $20,997 | $21,703 |
| 10/31/2022 | $22,699 | $23,461 |
| 11/30/2022 | $23,895 | $24,772 |
| 12/31/2022 | $22,457 | $23,344 |
| 1/31/2023 | $23,941 | $24,811 |
| 2/28/2023 | $23,468 | $24,206 |
| 3/31/2023 | $24,190 | $25,095 |
| 4/30/2023 | $24,400 | $25,486 |
| 5/31/2023 | $24,663 | $25,597 |
| 6/30/2023 | $26,462 | $27,288 |
| 7/31/2023 | $27,303 | $28,165 |
| 8/31/2023 | $26,804 | $27,717 |
| 9/30/2023 | $25,674 | $26,395 |
| 10/31/2023 | $25,097 | $25,840 |
| 11/30/2023 | $27,171 | $28,200 |
| 12/31/2023 | $28,393 | $29,481 |
| 1/31/2024 | $29,041 | $29,977 |
| 2/29/2024 | $30,796 | $31,577 |
| 3/31/2024 | $31,948 | $32,593 |
| 4/30/2024 | $30,652 | $31,262 |
| 5/31/2024 | $32,351 | $32,812 |
| 6/30/2024 | $33,531 | $33,989 |
| 7/31/2024 | $33,876 | $34,403 |
Disciplined U.S. Core Fund
Annual Shareholder Report | July 31, 2024
AVERAGE ANNUAL TOTAL RETURNS (%)
| 1 Year | 5 Years | 10 Years |
|---|
Class R6Footnote Reference* | 24.08 | 15.63 | 12.98 |
| S&P 500 Index | 22.15 | 15.00 | 13.15 |
| Total net assets | $1,102,215,985 |
| # of portfolio holdings | 157 |
| Portfolio turnover rate | 37% |
| Total advisory fees paid | $3,431,110 |
| Footnote | Description |
Footnote* | Historical performance shown for the Class R6 shares prior to their inception on September 30, 2015 reflects the performance of the Institutional Class shares, and includes the higher expenses applicable to the Institutional Class shares. If these expenses had not been included, returns for the Class R6 shares would be higher. |
What did the Fund invest in?
(Based on long-term investments)
TOP TEN HOLDINGS (% OF NET ASSETS)
| Microsoft Corp. | 6.9 |
| Apple, Inc. | 6.9 |
| NVIDIA Corp. | 6.1 |
| Amazon.com, Inc. | 4.1 |
| Meta Platforms, Inc. Class A | 2.6 |
| Alphabet, Inc. Class C | 2.2 |
| Broadcom, Inc. | 2.0 |
| Alphabet, Inc. Class A | 2.0 |
| Berkshire Hathaway, Inc. Class B | 1.6 |
| JPMorgan Chase & Co. | 1.5 |
SECTOR ALLOCATION (% OF LONG-TERM INVESTMENTS)
| Information technology | 31.0 |
| Financials | 13.5 |
| Health care | 12.1 |
| Consumer discretionary | 9.7 |
| Communication services | 9.5 |
| Industrials | 7.9 |
| Consumer staples | 5.9 |
| Energy | 3.6 |
| Real estate | 2.8 |
| Utilities | 2.4 |
| Materials | 1.6 |
You can find additional information on the Fund's website at allspringglobal.com, including its:
- Prospectus - Financial Information - Fund holdings - Proxy voting information
Annual Shareholder Report
Disciplined U.S. Core Fund
This annual shareholder report contains important information about Disciplined U.S. Core Fund for the period of August 1, 2023 to July 31, 2024. You can find additional information about the Fund at allspringglobal.com. You can also request this information by contacting us at 1-800-222-8222.
What were the Fund costs for the past year?
The table explains the costs you would have paid within the reporting period based on a hypothetical $10,000 investment.
| CLASS NAME | COST OF A $10,000 INVESTMENT | COSTS PAID AS A % OF A $10,000 INVESTMENT |
|---|
| Class C | $174 | 1.56% |
The manager has contractually committed to waive fees and/or reimburse certain expenses to the extent necessary to cap the Fund's total annual fund operating expense ratio at a specific amount. Without this cap, the costs shown above may have been higher. Please see the prospectus for the amount and the expiration date of the cap. Prior to or after the commitment expiration date, the cap may be increased or the commitment to maintain the cap may be terminated only with the approval of the Board of Trustees.
How did the Fund perform last year and what affected its performance?
During the period, the Fund outperformed its benchmark, and the Fund's investment strategy of systematically identifying undervalued companies with superior earnings fundamentals and positive momentum did not cause the Fund’s performance to materially deviate from the manager’s expectations. Characteristics typically favored in the portfolio include attractive valuation, earnings consistency, profitability, and improving sentiment. The manager’s quantitative alpha model results were positive during the period, with the value, quality, and momentum factor groups all exhibiting strength.
Bottom-up stock selection effects within consumer discretionary, financials, and information technology (IT) contributed to relative performance. Negative stock selection effects within materials and real estate detracted from relative performance. The Fund’s underweight to IT also detracted modestly from results. Over the longer term, broad diversification and risk controls surrounding sector weights typically result in stock selection being the main driver of relative performance within the Fund.
Total return based on a $10,000 investment

| Class C | S&P 500 Index |
|---|
| 7/31/2014 | $10,000 | $10,000 |
| 8/31/2014 | $10,440 | $10,400 |
| 9/30/2014 | $10,278 | $10,254 |
| 10/31/2014 | $10,498 | $10,505 |
| 11/30/2014 | $10,802 | $10,787 |
| 12/31/2014 | $10,765 | $10,760 |
| 1/31/2015 | $10,489 | $10,437 |
| 2/28/2015 | $11,057 | $11,037 |
| 3/31/2015 | $10,888 | $10,862 |
| 4/30/2015 | $10,926 | $10,966 |
| 5/31/2015 | $11,080 | $11,108 |
| 6/30/2015 | $10,857 | $10,892 |
| 7/31/2015 | $11,118 | $11,121 |
| 8/31/2015 | $10,443 | $10,450 |
| 9/30/2015 | $10,267 | $10,191 |
| 10/31/2015 | $11,072 | $11,051 |
| 11/30/2015 | $11,065 | $11,084 |
| 12/31/2015 | $10,920 | $10,909 |
| 1/31/2016 | $10,367 | $10,368 |
| 2/29/2016 | $10,410 | $10,354 |
| 3/31/2016 | $11,066 | $11,056 |
| 4/30/2016 | $11,032 | $11,099 |
| 5/31/2016 | $11,170 | $11,298 |
| 6/30/2016 | $11,187 | $11,327 |
| 7/31/2016 | $11,610 | $11,745 |
| 8/31/2016 | $11,593 | $11,762 |
| 9/30/2016 | $11,576 | $11,764 |
| 10/31/2016 | $11,369 | $11,549 |
| 11/30/2016 | $11,861 | $11,977 |
| 12/31/2016 | $12,094 | $12,214 |
| 1/31/2017 | $12,244 | $12,445 |
| 2/28/2017 | $12,711 | $12,939 |
| 3/31/2017 | $12,685 | $12,955 |
| 4/30/2017 | $12,764 | $13,088 |
| 5/31/2017 | $12,923 | $13,272 |
| 6/30/2017 | $13,020 | $13,355 |
| 7/31/2017 | $13,267 | $13,629 |
| 8/31/2017 | $13,338 | $13,671 |
| 9/30/2017 | $13,620 | $13,953 |
| 10/31/2017 | $13,929 | $14,278 |
| 11/30/2017 | $14,361 | $14,716 |
| 12/31/2017 | $14,455 | $14,880 |
| 1/31/2018 | $15,197 | $15,732 |
| 2/28/2018 | $14,602 | $15,152 |
| 3/31/2018 | $14,162 | $14,767 |
| 4/30/2018 | $14,171 | $14,824 |
| 5/31/2018 | $14,419 | $15,181 |
| 6/30/2018 | $14,437 | $15,274 |
| 7/31/2018 | $14,913 | $15,843 |
| 8/31/2018 | $15,344 | $16,359 |
| 9/30/2018 | $15,344 | $16,452 |
| 10/31/2018 | $14,226 | $15,327 |
| 11/30/2018 | $14,474 | $15,640 |
| 12/31/2018 | $13,149 | $14,228 |
| 1/31/2019 | $14,153 | $15,368 |
| 2/28/2019 | $14,553 | $15,861 |
| 3/31/2019 | $14,777 | $16,169 |
| 4/30/2019 | $15,294 | $16,824 |
| 5/31/2019 | $14,192 | $15,755 |
| 6/30/2019 | $15,216 | $16,865 |
| 7/31/2019 | $15,450 | $17,108 |
| 8/31/2019 | $15,089 | $16,837 |
| 9/30/2019 | $15,420 | $17,152 |
| 10/31/2019 | $15,713 | $17,523 |
| 11/30/2019 | $16,307 | $18,159 |
| 12/31/2019 | $16,783 | $18,707 |
| 1/31/2020 | $16,581 | $18,700 |
| 2/29/2020 | $15,198 | $17,161 |
| 3/31/2020 | $13,412 | $15,041 |
| 4/30/2020 | $15,148 | $16,969 |
| 5/31/2020 | $15,804 | $17,778 |
| 6/30/2020 | $16,076 | $18,131 |
| 7/31/2020 | $16,853 | $19,153 |
| 8/31/2020 | $18,085 | $20,530 |
| 9/30/2020 | $17,338 | $19,750 |
| 10/31/2020 | $16,874 | $19,225 |
| 11/30/2020 | $18,670 | $21,329 |
| 12/31/2020 | $19,336 | $22,149 |
| 1/31/2021 | $19,226 | $21,926 |
| 2/28/2021 | $19,775 | $22,530 |
| 3/31/2021 | $20,809 | $23,517 |
| 4/30/2021 | $21,864 | $24,772 |
| 5/31/2021 | $21,963 | $24,945 |
| 6/30/2021 | $22,436 | $25,527 |
| 7/31/2021 | $22,886 | $26,134 |
| 8/31/2021 | $23,623 | $26,929 |
| 9/30/2021 | $22,458 | $25,676 |
| 10/31/2021 | $24,062 | $27,475 |
| 11/30/2021 | $23,931 | $27,285 |
| 12/31/2021 | $25,026 | $28,507 |
| 1/31/2022 | $23,834 | $27,032 |
| 2/28/2022 | $23,202 | $26,223 |
| 3/31/2022 | $24,013 | $27,196 |
| 4/30/2022 | $22,045 | $24,825 |
| 5/31/2022 | $22,105 | $24,870 |
| 6/30/2022 | $20,150 | $22,818 |
| 7/31/2022 | $21,902 | $24,921 |
| 8/31/2022 | $21,004 | $23,905 |
| 9/30/2022 | $19,101 | $21,703 |
| 10/31/2022 | $20,648 | $23,461 |
| 11/30/2022 | $21,718 | $24,772 |
| 12/31/2022 | $20,405 | $23,344 |
| 1/31/2023 | $21,750 | $24,811 |
| 2/28/2023 | $21,306 | $24,206 |
| 3/31/2023 | $21,960 | $25,095 |
| 4/30/2023 | $22,133 | $25,486 |
| 5/31/2023 | $22,367 | $25,597 |
| 6/30/2023 | $23,997 | $27,288 |
| 7/31/2023 | $24,750 | $28,165 |
| 8/31/2023 | $24,293 | $27,717 |
| 9/30/2023 | $23,256 | $26,395 |
| 10/31/2023 | $22,725 | $25,840 |
| 11/30/2023 | $24,602 | $28,200 |
| 12/31/2023 | $25,696 | $29,481 |
| 1/31/2024 | $26,277 | $29,977 |
| 2/29/2024 | $27,858 | $31,577 |
| 3/31/2024 | $28,885 | $32,593 |
| 4/30/2024 | $27,696 | $31,262 |
| 5/31/2024 | $29,223 | $32,812 |
| 6/30/2024 | $30,291 | $33,989 |
| 7/31/2024 | $30,575 | $34,403 |
Disciplined U.S. Core Fund
Annual Shareholder Report | July 31, 2024
AVERAGE ANNUAL TOTAL RETURNS (%)
| 1 Year | 5 Years | 10 Years |
|---|
| Class C | 22.64 | 14.28 | 11.82 |
| Class C with Load | 21.64 | 14.28 | 11.82 |
| S&P 500 Index | 22.15 | 15.00 | 13.15 |
| Total net assets | $1,102,215,985 |
| # of portfolio holdings | 157 |
| Portfolio turnover rate | 37% |
| Total advisory fees paid | $3,431,110 |
What did the Fund invest in?
(Based on long-term investments)
TOP TEN HOLDINGS (% OF NET ASSETS)
| Microsoft Corp. | 6.9 |
| Apple, Inc. | 6.9 |
| NVIDIA Corp. | 6.1 |
| Amazon.com, Inc. | 4.1 |
| Meta Platforms, Inc. Class A | 2.6 |
| Alphabet, Inc. Class C | 2.2 |
| Broadcom, Inc. | 2.0 |
| Alphabet, Inc. Class A | 2.0 |
| Berkshire Hathaway, Inc. Class B | 1.6 |
| JPMorgan Chase & Co. | 1.5 |
SECTOR ALLOCATION (% OF LONG-TERM INVESTMENTS)
| Information technology | 31.0 |
| Financials | 13.5 |
| Health care | 12.1 |
| Consumer discretionary | 9.7 |
| Communication services | 9.5 |
| Industrials | 7.9 |
| Consumer staples | 5.9 |
| Energy | 3.6 |
| Real estate | 2.8 |
| Utilities | 2.4 |
| Materials | 1.6 |
You can find additional information on the Fund's website at allspringglobal.com, including its:
- Prospectus - Financial Information - Fund holdings - Proxy voting information
Annual Shareholder Report
Disciplined U.S. Core Fund
This annual shareholder report contains important information about Disciplined U.S. Core Fund for the period of August 1, 2023 to July 31, 2024. You can find additional information about the Fund at allspringglobal.com. You can also request this information by contacting us at 1-800-222-8222.
What were the Fund costs for the past year?
The table explains the costs you would have paid within the reporting period based on a hypothetical $10,000 investment.
| CLASS NAME | COST OF A $10,000 INVESTMENT | COSTS PAID AS A % OF A $10,000 INVESTMENT |
|---|
| Class A | $93 | 0.83% |
The manager has contractually committed to waive fees and/or reimburse certain expenses to the extent necessary to cap the Fund's total annual fund operating expense ratio at a specific amount. Without this cap, the costs shown above may have been higher. Please see the prospectus for the amount and the expiration date of the cap. Prior to or after the commitment expiration date, the cap may be increased or the commitment to maintain the cap may be terminated only with the approval of the Board of Trustees.
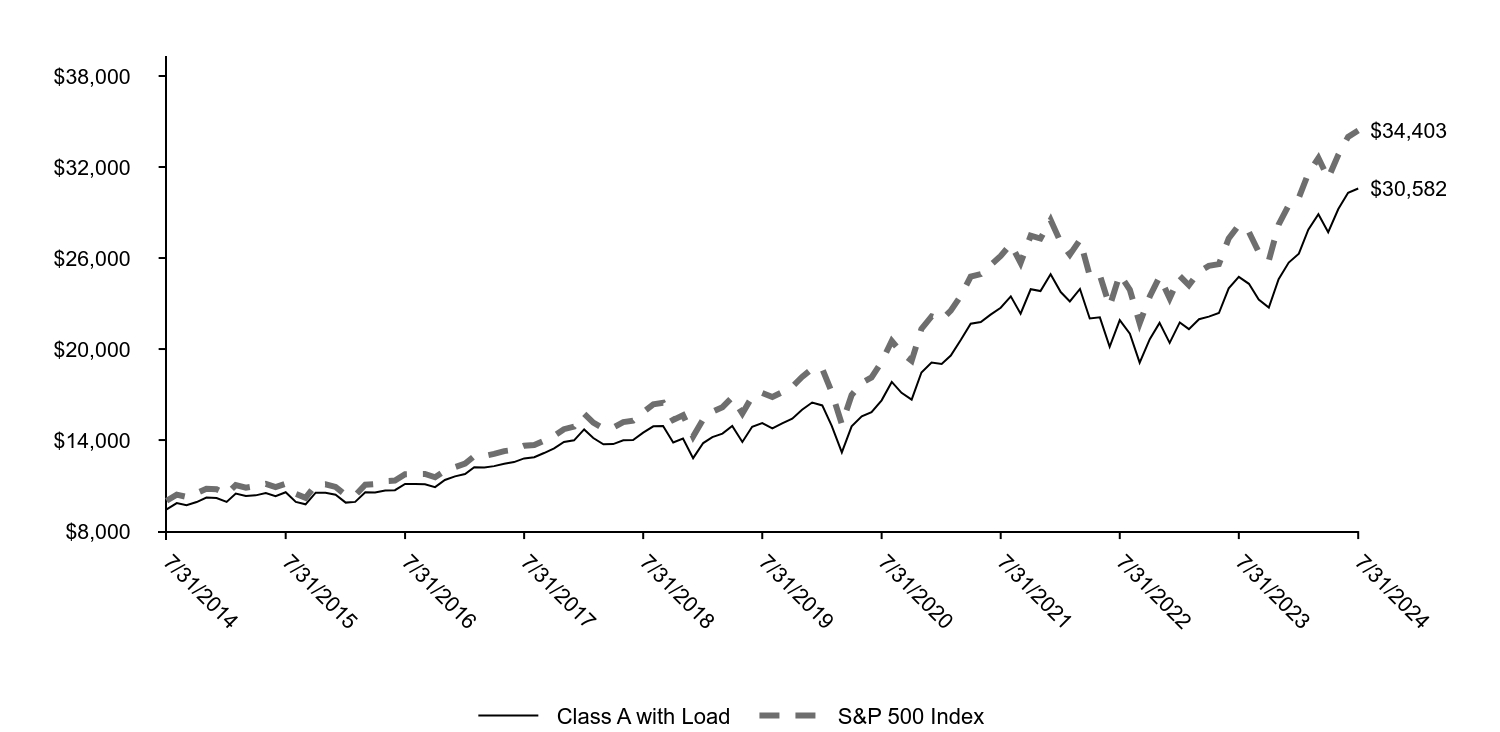
How did the Fund perform last year and what affected its performance?
During the period, the Fund outperformed its benchmark, and the Fund's investment strategy of systematically identifying undervalued companies with superior earnings fundamentals and positive momentum did not cause the Fund’s performance to materially deviate from the manager’s expectations. Characteristics typically favored in the portfolio include attractive valuation, earnings consistency, profitability, and improving sentiment. The manager’s quantitative alpha model results were positive during the period, with the value, quality, and momentum factor groups all exhibiting strength.
Bottom-up stock selection effects within consumer discretionary, financials, and information technology (IT) contributed to relative performance. Negative stock selection effects within materials and real estate detracted from relative performance. The Fund’s underweight to IT also detracted modestly from results. Over the longer term, broad diversification and risk controls surrounding sector weights typically result in stock selection being the main driver of relative performance within the Fund.
Total return based on a $10,000 investment
| Class A with Load | S&P 500 Index |
|---|
| 7/31/2014 | $9,427 | $10,000 |
| 8/31/2014 | $9,844 | $10,400 |
| 9/30/2014 | $9,699 | $10,254 |
| 10/31/2014 | $9,913 | $10,505 |
| 11/30/2014 | $10,208 | $10,787 |
| 12/31/2014 | $10,177 | $10,760 |
| 1/31/2015 | $9,924 | $10,437 |
| 2/28/2015 | $10,470 | $11,037 |
| 3/31/2015 | $10,313 | $10,862 |
| 4/30/2015 | $10,354 | $10,966 |
| 5/31/2015 | $10,505 | $11,108 |
| 6/30/2015 | $10,306 | $10,892 |
| 7/31/2015 | $10,559 | $11,121 |
| 8/31/2015 | $9,924 | $10,450 |
| 9/30/2015 | $9,766 | $10,191 |
| 10/31/2015 | $10,532 | $11,051 |
| 11/30/2015 | $10,532 | $11,084 |
| 12/31/2015 | $10,398 | $10,909 |
| 1/31/2016 | $9,877 | $10,368 |
| 2/29/2016 | $9,923 | $10,354 |
| 3/31/2016 | $10,559 | $11,056 |
| 4/30/2016 | $10,536 | $11,099 |
| 5/31/2016 | $10,674 | $11,298 |
| 6/30/2016 | $10,697 | $11,327 |
| 7/31/2016 | $11,111 | $11,745 |
| 8/31/2016 | $11,103 | $11,762 |
| 9/30/2016 | $11,088 | $11,764 |
| 10/31/2016 | $10,896 | $11,549 |
| 11/30/2016 | $11,371 | $11,977 |
| 12/31/2016 | $11,606 | $12,214 |
| 1/31/2017 | $11,763 | $12,445 |
| 2/28/2017 | $12,210 | $12,939 |
| 3/31/2017 | $12,195 | $12,955 |
| 4/30/2017 | $12,281 | $13,088 |
| 5/31/2017 | $12,438 | $13,272 |
| 6/30/2017 | $12,548 | $13,355 |
| 7/31/2017 | $12,791 | $13,629 |
| 8/31/2017 | $12,869 | $13,671 |
| 9/30/2017 | $13,144 | $13,953 |
| 10/31/2017 | $13,450 | $14,278 |
| 11/30/2017 | $13,874 | $14,716 |
| 12/31/2017 | $13,981 | $14,880 |
| 1/31/2018 | $14,702 | $15,732 |
| 2/28/2018 | $14,137 | $15,152 |
| 3/31/2018 | $13,719 | $14,767 |
| 4/30/2018 | $13,736 | $14,824 |
| 5/31/2018 | $13,990 | $15,181 |
| 6/30/2018 | $14,006 | $15,274 |
| 7/31/2018 | $14,489 | $15,843 |
| 8/31/2018 | $14,906 | $16,359 |
| 9/30/2018 | $14,923 | $16,452 |
| 10/31/2018 | $13,842 | $15,327 |
| 11/30/2018 | $14,096 | $15,640 |
| 12/31/2018 | $12,806 | $14,228 |
| 1/31/2019 | $13,803 | $15,368 |
| 2/28/2019 | $14,196 | $15,861 |
| 3/31/2019 | $14,423 | $16,169 |
| 4/30/2019 | $14,930 | $16,824 |
| 5/31/2019 | $13,873 | $15,755 |
| 6/30/2019 | $14,878 | $16,865 |
| 7/31/2019 | $15,114 | $17,108 |
| 8/31/2019 | $14,773 | $16,837 |
| 9/30/2019 | $15,105 | $17,152 |
| 10/31/2019 | $15,411 | $17,523 |
| 11/30/2019 | $15,997 | $18,159 |
| 12/31/2019 | $16,474 | $18,707 |
| 1/31/2020 | $16,283 | $18,700 |
| 2/29/2020 | $14,933 | $17,161 |
| 3/31/2020 | $13,190 | $15,041 |
| 4/30/2020 | $14,905 | $16,969 |
| 5/31/2020 | $15,562 | $17,778 |
| 6/30/2020 | $15,845 | $18,131 |
| 7/31/2020 | $16,620 | $19,153 |
| 8/31/2020 | $17,833 | $20,530 |
| 9/30/2020 | $17,113 | $19,750 |
| 10/31/2020 | $16,666 | $19,225 |
| 11/30/2020 | $18,454 | $21,329 |
| 12/31/2020 | $19,112 | $22,149 |
| 1/31/2021 | $19,012 | $21,926 |
| 2/28/2021 | $19,571 | $22,530 |
| 3/31/2021 | $20,609 | $23,517 |
| 4/30/2021 | $21,667 | $24,772 |
| 5/31/2021 | $21,786 | $24,945 |
| 6/30/2021 | $22,265 | $25,527 |
| 7/31/2021 | $22,724 | $26,134 |
| 8/31/2021 | $23,473 | $26,929 |
| 9/30/2021 | $22,335 | $25,676 |
| 10/31/2021 | $23,942 | $27,475 |
| 11/30/2021 | $23,822 | $27,285 |
| 12/31/2021 | $24,926 | $28,507 |
| 1/31/2022 | $23,757 | $27,032 |
| 2/28/2022 | $23,141 | $26,223 |
| 3/31/2022 | $23,963 | $27,196 |
| 4/30/2022 | $22,016 | $24,825 |
| 5/31/2022 | $22,091 | $24,870 |
| 6/30/2022 | $20,144 | $22,818 |
| 7/31/2022 | $21,907 | $24,921 |
| 8/31/2022 | $21,009 | $23,905 |
| 9/30/2022 | $19,105 | $21,703 |
| 10/31/2022 | $20,652 | $23,461 |
| 11/30/2022 | $21,723 | $24,772 |
| 12/31/2022 | $20,409 | $23,344 |
| 1/31/2023 | $21,755 | $24,811 |
| 2/28/2023 | $21,311 | $24,206 |
| 3/31/2023 | $21,965 | $25,095 |
| 4/30/2023 | $22,138 | $25,486 |
| 5/31/2023 | $22,373 | $25,597 |
| 6/30/2023 | $24,002 | $27,288 |
| 7/31/2023 | $24,755 | $28,165 |
| 8/31/2023 | $24,299 | $27,717 |
| 9/30/2023 | $23,261 | $26,395 |
| 10/31/2023 | $22,731 | $25,840 |
| 11/30/2023 | $24,607 | $28,200 |
| 12/31/2023 | $25,702 | $29,481 |
| 1/31/2024 | $26,283 | $29,977 |
| 2/29/2024 | $27,865 | $31,577 |
| 3/31/2024 | $28,892 | $32,593 |
| 4/30/2024 | $27,702 | $31,262 |
| 5/31/2024 | $29,230 | $32,812 |
| 6/30/2024 | $30,298 | $33,989 |
| 7/31/2024 | $30,582 | $34,403 |
Disciplined U.S. Core Fund
Annual Shareholder Report | July 31, 2024
AVERAGE ANNUAL TOTAL RETURNS (%)
| 1 Year | 5 Years | 10 Years |
|---|
| Class A | 23.54 | 15.14 | 12.49 |
| Class A with Load | 16.45 | 13.79 | 11.83 |
| S&P 500 Index | 22.15 | 15.00 | 13.15 |
| Total net assets | $1,102,215,985 |
| # of portfolio holdings | 157 |
| Portfolio turnover rate | 37% |
| Total advisory fees paid | $3,431,110 |
What did the Fund invest in?
(Based on long-term investments)
TOP TEN HOLDINGS (% OF NET ASSETS)
| Microsoft Corp. | 6.9 |
| Apple, Inc. | 6.9 |
| NVIDIA Corp. | 6.1 |
| Amazon.com, Inc. | 4.1 |
| Meta Platforms, Inc. Class A | 2.6 |
| Alphabet, Inc. Class C | 2.2 |
| Broadcom, Inc. | 2.0 |
| Alphabet, Inc. Class A | 2.0 |
| Berkshire Hathaway, Inc. Class B | 1.6 |
| JPMorgan Chase & Co. | 1.5 |
SECTOR ALLOCATION (% OF LONG-TERM INVESTMENTS)
| Information technology | 31.0 |
| Financials | 13.5 |
| Health care | 12.1 |
| Consumer discretionary | 9.7 |
| Communication services | 9.5 |
| Industrials | 7.9 |
| Consumer staples | 5.9 |
| Energy | 3.6 |
| Real estate | 2.8 |
| Utilities | 2.4 |
| Materials | 1.6 |
You can find additional information on the Fund's website at allspringglobal.com, including its:
- Prospectus - Financial Information - Fund holdings - Proxy voting information
Annual Shareholder Report
Disciplined U.S. Core Fund
This annual shareholder report contains important information about Disciplined U.S. Core Fund for the period of August 1, 2023 to July 31, 2024. You can find additional information about the Fund at allspringglobal.com. You can also request this information by contacting us at 1-800-222-8222.
What were the Fund costs for the past year?
The table explains the costs you would have paid within the reporting period based on a hypothetical $10,000 investment.
| CLASS NAME | COST OF A $10,000 INVESTMENT | COSTS PAID AS A % OF A $10,000 INVESTMENT |
|---|
| Administrator Class | $83 | 0.74% |
The manager has contractually committed to waive fees and/or reimburse certain expenses to the extent necessary to cap the Fund's total annual fund operating expense ratio at a specific amount. Without this cap, the costs shown above may have been higher. Please see the prospectus for the amount and the expiration date of the cap. Prior to or after the commitment expiration date, the cap may be increased or the commitment to maintain the cap may be terminated only with the approval of the Board of Trustees.
How did the Fund perform last year and what affected its performance?
During the period, the Fund outperformed its benchmark, and the Fund's investment strategy of systematically identifying undervalued companies with superior earnings fundamentals and positive momentum did not cause the Fund’s performance to materially deviate from the manager’s expectations. Characteristics typically favored in the portfolio include attractive valuation, earnings consistency, profitability, and improving sentiment. The manager’s quantitative alpha model results were positive during the period, with the value, quality, and momentum factor groups all exhibiting strength.
Bottom-up stock selection effects within consumer discretionary, financials, and information technology (IT) contributed to relative performance. Negative stock selection effects within materials and real estate detracted from relative performance. The Fund’s underweight to IT also detracted modestly from results. Over the longer term, broad diversification and risk controls surrounding sector weights typically result in stock selection being the main driver of relative performance within the Fund.
Total return based on a $10,000 investment

| Administrator Class | S&P 500 Index |
|---|
| 7/31/2014 | $10,000 | $10,000 |
| 8/31/2014 | $10,452 | $10,400 |
| 9/30/2014 | $10,295 | $10,254 |
| 10/31/2014 | $10,524 | $10,505 |
| 11/30/2014 | $10,837 | $10,787 |
| 12/31/2014 | $10,808 | $10,760 |
| 1/31/2015 | $10,538 | $10,437 |
| 2/28/2015 | $11,120 | $11,037 |
| 3/31/2015 | $10,957 | $10,862 |
| 4/30/2015 | $11,006 | $10,966 |
| 5/31/2015 | $11,163 | $11,108 |
| 6/30/2015 | $10,950 | $10,892 |
| 7/31/2015 | $11,220 | $11,121 |
| 8/31/2015 | $10,545 | $10,450 |
| 9/30/2015 | $10,382 | $10,191 |
| 10/31/2015 | $11,198 | $11,051 |
| 11/30/2015 | $11,198 | $11,084 |
| 12/31/2015 | $11,057 | $10,909 |
| 1/31/2016 | $10,508 | $10,368 |
| 2/29/2016 | $10,556 | $10,354 |
| 3/31/2016 | $11,232 | $11,056 |
| 4/30/2016 | $11,208 | $11,099 |
| 5/31/2016 | $11,352 | $11,298 |
| 6/30/2016 | $11,376 | $11,327 |
| 7/31/2016 | $11,821 | $11,745 |
| 8/31/2016 | $11,813 | $11,762 |
| 9/30/2016 | $11,805 | $11,764 |
| 10/31/2016 | $11,598 | $11,549 |
| 11/30/2016 | $12,108 | $11,977 |
| 12/31/2016 | $12,360 | $12,214 |
| 1/31/2017 | $12,523 | $12,445 |
| 2/28/2017 | $13,004 | $12,939 |
| 3/31/2017 | $12,987 | $12,955 |
| 4/30/2017 | $13,085 | $13,088 |
| 5/31/2017 | $13,248 | $13,272 |
| 6/30/2017 | $13,362 | $13,355 |
| 7/31/2017 | $13,623 | $13,629 |
| 8/31/2017 | $13,713 | $13,671 |
| 9/30/2017 | $14,006 | $13,953 |
| 10/31/2017 | $14,332 | $14,278 |
| 11/30/2017 | $14,789 | $14,716 |
| 12/31/2017 | $14,905 | $14,880 |
| 1/31/2018 | $15,670 | $15,732 |
| 2/28/2018 | $15,066 | $15,152 |
| 3/31/2018 | $14,624 | $14,767 |
| 4/30/2018 | $14,650 | $14,824 |
| 5/31/2018 | $14,913 | $15,181 |
| 6/30/2018 | $14,939 | $15,274 |
| 7/31/2018 | $15,449 | $15,843 |
| 8/31/2018 | $15,899 | $16,359 |
| 9/30/2018 | $15,908 | $16,452 |
| 10/31/2018 | $14,760 | $15,327 |
| 11/30/2018 | $15,041 | $15,640 |
| 12/31/2018 | $13,668 | $14,228 |
| 1/31/2019 | $14,728 | $15,368 |
| 2/28/2019 | $15,145 | $15,861 |
| 3/31/2019 | $15,390 | $16,169 |
| 4/30/2019 | $15,934 | $16,824 |
| 5/31/2019 | $14,810 | $15,755 |
| 6/30/2019 | $15,879 | $16,865 |
| 7/31/2019 | $16,133 | $17,108 |
| 8/31/2019 | $15,771 | $16,837 |
| 9/30/2019 | $16,124 | $17,152 |
| 10/31/2019 | $16,450 | $17,523 |
| 11/30/2019 | $17,085 | $18,159 |
| 12/31/2019 | $17,588 | $18,707 |
| 1/31/2020 | $17,390 | $18,700 |
| 2/29/2020 | $15,953 | $17,161 |
| 3/31/2020 | $14,090 | $15,041 |
| 4/30/2020 | $15,924 | $16,969 |
| 5/31/2020 | $16,624 | $17,778 |
| 6/30/2020 | $16,927 | $18,131 |
| 7/31/2020 | $17,759 | $19,153 |
| 8/31/2020 | $19,064 | $20,530 |
| 9/30/2020 | $18,288 | $19,750 |
| 10/31/2020 | $17,815 | $19,225 |
| 11/30/2020 | $19,726 | $21,329 |
| 12/31/2020 | $20,435 | $22,149 |
| 1/31/2021 | $20,331 | $21,926 |
| 2/28/2021 | $20,930 | $22,530 |
| 3/31/2021 | $22,046 | $23,517 |
| 4/30/2021 | $23,181 | $24,772 |
| 5/31/2021 | $23,305 | $24,945 |
| 6/30/2021 | $23,822 | $25,527 |
| 7/31/2021 | $24,317 | $26,134 |
| 8/31/2021 | $25,123 | $26,929 |
| 9/30/2021 | $23,894 | $25,676 |
| 10/31/2021 | $25,618 | $27,475 |
| 11/30/2021 | $25,505 | $27,285 |
| 12/31/2021 | $26,687 | $28,507 |
| 1/31/2022 | $25,435 | $27,032 |
| 2/28/2022 | $24,776 | $26,223 |
| 3/31/2022 | $25,648 | $27,196 |
| 4/30/2022 | $23,569 | $24,825 |
| 5/31/2022 | $23,659 | $24,870 |
| 6/30/2022 | $21,569 | $22,818 |
| 7/31/2022 | $23,469 | $24,921 |
| 8/31/2022 | $22,507 | $23,905 |
| 9/30/2022 | $20,462 | $21,703 |
| 10/31/2022 | $22,128 | $23,461 |
| 11/30/2022 | $23,279 | $24,772 |
| 12/31/2022 | $21,879 | $23,344 |
| 1/31/2023 | $23,316 | $24,811 |
| 2/28/2023 | $22,845 | $24,206 |
| 3/31/2023 | $23,544 | $25,095 |
| 4/30/2023 | $23,735 | $25,486 |
| 5/31/2023 | $23,989 | $25,597 |
| 6/30/2023 | $25,731 | $27,288 |
| 7/31/2023 | $26,545 | $28,165 |
| 8/31/2023 | $26,061 | $27,717 |
| 9/30/2023 | $24,943 | $26,395 |
| 10/31/2023 | $24,383 | $25,840 |
| 11/30/2023 | $26,392 | $28,200 |
| 12/31/2023 | $27,576 | $29,481 |
| 1/31/2024 | $28,187 | $29,977 |
| 2/29/2024 | $29,895 | $31,577 |
| 3/31/2024 | $30,992 | $32,593 |
| 4/30/2024 | $29,728 | $31,262 |
| 5/31/2024 | $31,381 | $32,812 |
| 6/30/2024 | $32,506 | $33,989 |
| 7/31/2024 | $32,825 | $34,403 |
Disciplined U.S. Core Fund
Annual Shareholder Report | July 31, 2024
AVERAGE ANNUAL TOTAL RETURNS (%)
| 1 Year | 5 Years | 10 Years |
|---|
| Administrator Class | 23.66 | 15.26 | 12.62 |
| S&P 500 Index | 22.15 | 15.00 | 13.15 |
| Total net assets | $1,102,215,985 |
| # of portfolio holdings | 157 |
| Portfolio turnover rate | 37% |
| Total advisory fees paid | $3,431,110 |
What did the Fund invest in?
(Based on long-term investments)
TOP TEN HOLDINGS (% OF NET ASSETS)
| Microsoft Corp. | 6.9 |
| Apple, Inc. | 6.9 |
| NVIDIA Corp. | 6.1 |
| Amazon.com, Inc. | 4.1 |
| Meta Platforms, Inc. Class A | 2.6 |
| Alphabet, Inc. Class C | 2.2 |
| Broadcom, Inc. | 2.0 |
| Alphabet, Inc. Class A | 2.0 |
| Berkshire Hathaway, Inc. Class B | 1.6 |
| JPMorgan Chase & Co. | 1.5 |
SECTOR ALLOCATION (% OF LONG-TERM INVESTMENTS)
| Information technology | 31.0 |
| Financials | 13.5 |
| Health care | 12.1 |
| Consumer discretionary | 9.7 |
| Communication services | 9.5 |
| Industrials | 7.9 |
| Consumer staples | 5.9 |
| Energy | 3.6 |
| Real estate | 2.8 |
| Utilities | 2.4 |
| Materials | 1.6 |
You can find additional information on the Fund's website at allspringglobal.com, including its:
- Prospectus - Financial Information - Fund holdings - Proxy voting information
Annual Shareholder Report
This annual shareholder report contains important information about Growth Fund for the period of August 1, 2023 to July 31, 2024. You can find additional information about the Fund at allspringglobal.com. You can also request this information by contacting us at 1-800-222-8222.
This report describes changes to the Fund that occurred during the reporting period.
What were the Fund costs for the past year?
The table explains the costs you would have paid within the reporting period based on a hypothetical $10,000 investment.
| CLASS NAME | COST OF A $10,000 INVESTMENT | COSTS PAID AS A % OF A $10,000 INVESTMENT |
|---|
| Institutional Class | $83 | 0.75% |
The manager has contractually committed to waive fees and/or reimburse certain expenses to the extent necessary to cap the Fund's total annual fund operating expense ratio at a specific amount. Without this cap, the costs shown above may have been higher. Please see the prospectus for the amount and the expiration date of the cap. Prior to or after the commitment expiration date, the cap may be increased or the commitment to maintain the cap may be terminated only with the approval of the Board of Trustees.
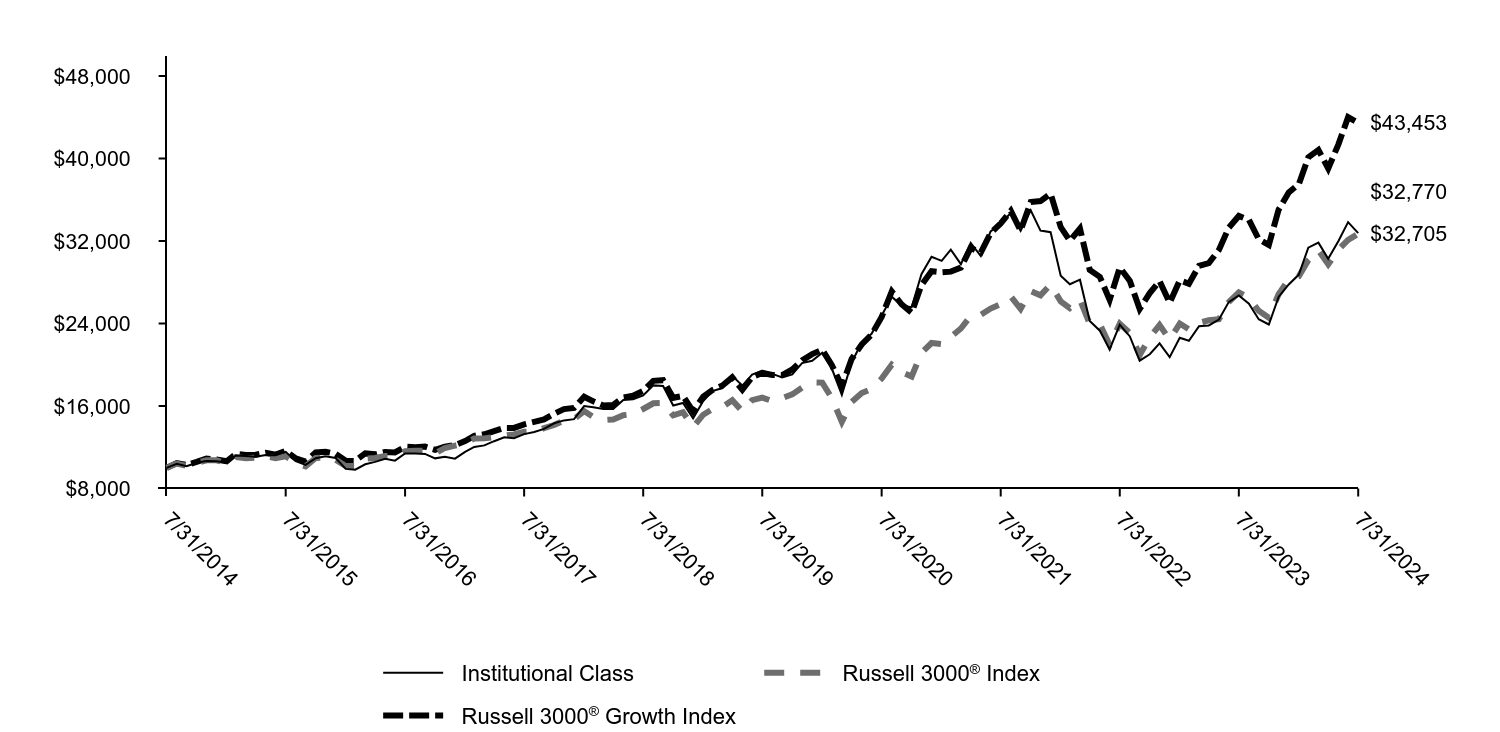
How did the Fund perform last year and what affected its performance?
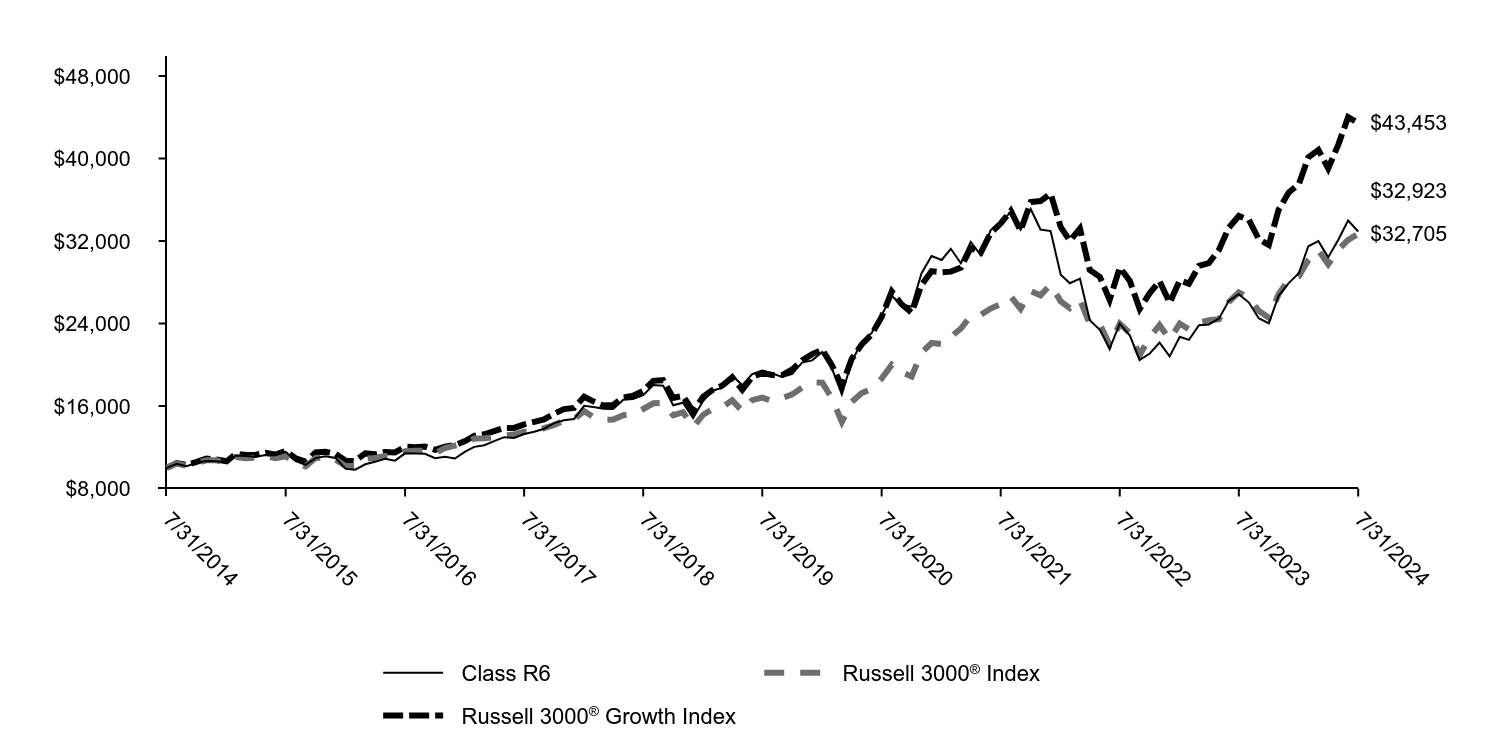
Positive earnings surprises fueled a bull market for large-cap U.S. equities during the 12-month period that ended on July 31, 2024. Companies connected to artificial intelligence (AI) saw their valuations soar. The “Magnificent 7” stocks substantially outperformed the rest of the U.S. equity universe. Inflation concerns and policy uncertainty deterred sentiment for small-cap stocks. Late in the fiscal year, several Magnificent 7 companies struggled to meet high expectations. As a result, market leadership broadened, with small caps narrowing the performance gap relative to mega caps. While portfolio companies that facilitated the structural build-out of AI contributed during the year, there were pockets of weakness. Providers of enterprise software, such as MongoDB, Inc., lowered guidance as uncertainty over future AI capabilities postponed software spending. Demand for electric vehicles declined, with Allegro MicroSystems, Inc. detracting from returns. However, the portfolio’s significant underweight to Tesla, Inc. added to returns. The portfolio also benefited from a position in Shockwave Medical, Inc. There were no meaningful changes to the portfolio during the 12-month period.
Total return based on a $10,000 investment
| Institutional Class | Russell 3000® Index | Russell 3000® Growth Index |
|---|
| 7/31/2014 | $10,000 | $10,000 | $10,000 |
| 8/31/2014 | $10,394 | $10,420 | $10,466 |
| 9/30/2014 | $10,154 | $10,202 | $10,283 |
| 10/31/2014 | $10,490 | $10,483 | $10,581 |
| 11/30/2014 | $10,669 | $10,737 | $10,896 |
| 12/31/2014 | $10,643 | $10,737 | $10,814 |
| 1/31/2015 | $10,531 | $10,438 | $10,643 |
| 2/28/2015 | $11,208 | $11,043 | $11,356 |
| 3/31/2015 | $11,160 | $10,930 | $11,252 |
| 4/30/2015 | $11,078 | $10,980 | $11,278 |
| 5/31/2015 | $11,250 | $11,132 | $11,456 |
| 6/30/2015 | $11,227 | $10,945 | $11,282 |
| 7/31/2015 | $11,552 | $11,128 | $11,637 |
| 8/31/2015 | $10,655 | $10,457 | $10,916 |
| 9/30/2015 | $10,288 | $10,152 | $10,613 |
| 10/31/2015 | $10,943 | $10,954 | $11,503 |
| 11/30/2015 | $11,130 | $11,014 | $11,564 |
| 12/31/2015 | $10,956 | $10,788 | $11,365 |
| 1/31/2016 | $9,901 | $10,180 | $10,686 |
| 2/29/2016 | $9,822 | $10,176 | $10,677 |
| 3/31/2016 | $10,348 | $10,893 | $11,404 |
| 4/30/2016 | $10,582 | $10,960 | $11,315 |
| 5/31/2016 | $10,877 | $11,156 | $11,541 |
| 6/30/2016 | $10,701 | $11,179 | $11,495 |
| 7/31/2016 | $11,401 | $11,623 | $12,053 |
| 8/31/2016 | $11,394 | $11,653 | $12,007 |
| 9/30/2016 | $11,356 | $11,671 | $12,061 |
| 10/31/2016 | $10,925 | $11,419 | $11,742 |
| 11/30/2016 | $11,080 | $11,930 | $12,055 |
| 12/31/2016 | $10,895 | $12,162 | $12,206 |
| 1/31/2017 | $11,557 | $12,391 | $12,600 |
| 2/28/2017 | $12,026 | $12,852 | $13,107 |
| 3/31/2017 | $12,181 | $12,861 | $13,259 |
| 4/30/2017 | $12,587 | $12,997 | $13,558 |
| 5/31/2017 | $12,968 | $13,130 | $13,876 |
| 6/30/2017 | $12,883 | $13,249 | $13,876 |
| 7/31/2017 | $13,275 | $13,498 | $14,225 |
| 8/31/2017 | $13,481 | $13,524 | $14,464 |
| 9/30/2017 | $13,780 | $13,854 | $14,699 |
| 10/31/2017 | $14,327 | $14,157 | $15,241 |
| 11/30/2017 | $14,603 | $14,586 | $15,702 |
| 12/31/2017 | $14,723 | $14,732 | $15,817 |
| 1/31/2018 | $15,997 | $15,509 | $16,898 |
| 2/28/2018 | $15,871 | $14,937 | $16,452 |
| 3/31/2018 | $15,706 | $14,637 | $16,051 |
| 4/30/2018 | $15,699 | $14,693 | $16,104 |
| 5/31/2018 | $16,574 | $15,108 | $16,834 |
| 6/30/2018 | $16,657 | $15,207 | $16,994 |
| 7/31/2018 | $17,019 | $15,711 | $17,477 |
| 8/31/2018 | $17,999 | $16,263 | $18,442 |
| 9/30/2018 | $17,945 | $16,290 | $18,504 |
| 10/31/2018 | $16,047 | $15,090 | $16,796 |
| 11/30/2018 | $16,291 | $15,393 | $16,980 |
| 12/31/2018 | $14,804 | $13,960 | $15,482 |
| 1/31/2019 | $16,477 | $15,158 | $16,902 |
| 2/28/2019 | $17,445 | $15,691 | $17,543 |
| 3/31/2019 | $17,738 | $15,920 | $17,986 |
| 4/30/2019 | $18,927 | $16,556 | $18,780 |
| 5/31/2019 | $17,976 | $15,485 | $17,579 |
| 6/30/2019 | $19,046 | $16,572 | $18,796 |
| 7/31/2019 | $19,402 | $16,819 | $19,204 |
| 8/31/2019 | $19,114 | $16,476 | $19,012 |
| 9/30/2019 | $18,770 | $16,765 | $19,004 |
| 10/31/2019 | $19,071 | $17,126 | $19,540 |
| 11/30/2019 | $20,162 | $17,777 | $20,425 |
| 12/31/2019 | $20,379 | $18,290 | $21,031 |
| 1/31/2020 | $21,173 | $18,270 | $21,456 |
| 2/29/2020 | $19,659 | $16,774 | $19,989 |
| 3/31/2020 | $17,079 | $14,468 | $17,908 |
| 4/30/2020 | $20,225 | $16,384 | $20,558 |
| 5/31/2020 | $22,164 | $17,260 | $21,971 |
| 6/30/2020 | $23,006 | $17,655 | $22,921 |
| 7/31/2020 | $24,754 | $18,657 | $24,628 |
| 8/31/2020 | $26,605 | $20,009 | $27,108 |
| 9/30/2020 | $25,749 | $19,280 | $25,868 |
| 10/31/2020 | $25,581 | $18,864 | $25,050 |
| 11/30/2020 | $28,778 | $21,159 | $27,723 |
| 12/31/2020 | $30,465 | $22,111 | $29,078 |
| 1/31/2021 | $30,072 | $22,012 | $28,968 |
| 2/28/2021 | $31,153 | $22,700 | $29,028 |
| 3/31/2021 | $29,752 | $23,514 | $29,425 |
| 4/30/2021 | $31,814 | $24,726 | $31,334 |
| 5/31/2021 | $30,537 | $24,839 | $30,870 |
| 6/30/2021 | $32,936 | $25,452 | $32,773 |
| 7/31/2021 | $33,691 | $25,882 | $33,699 |
| 8/31/2021 | $34,714 | $26,620 | $34,918 |
| 9/30/2021 | $32,993 | $25,426 | $33,001 |
| 10/31/2021 | $34,978 | $27,145 | $35,775 |
| 11/30/2021 | $33,008 | $26,732 | $35,871 |
| 12/31/2021 | $32,849 | $27,785 | $36,595 |
| 1/31/2022 | $28,634 | $26,150 | $33,351 |
| 2/28/2022 | $27,809 | $25,491 | $32,021 |
| 3/31/2022 | $28,249 | $26,318 | $33,209 |
| 4/30/2022 | $24,239 | $23,956 | $29,195 |
| 5/31/2022 | $23,300 | $23,924 | $28,523 |
| 6/30/2022 | $21,482 | $21,923 | $26,292 |
| 7/31/2022 | $23,890 | $23,979 | $29,436 |
| 8/31/2022 | $22,746 | $23,084 | $28,129 |
| 9/30/2022 | $20,392 | $20,944 | $25,407 |
| 10/31/2022 | $21,018 | $22,661 | $26,948 |
| 11/30/2022 | $22,066 | $23,844 | $28,126 |
| 12/31/2022 | $20,731 | $22,448 | $25,995 |
| 1/31/2023 | $22,624 | $23,994 | $28,187 |
| 2/28/2023 | $22,327 | $23,433 | $27,854 |
| 3/31/2023 | $23,741 | $24,060 | $29,595 |
| 4/30/2023 | $23,810 | $24,316 | $29,850 |
| 5/31/2023 | $24,378 | $24,411 | $31,134 |
| 6/30/2023 | $26,075 | $26,078 | $33,286 |
| 7/31/2023 | $26,725 | $27,013 | $34,430 |
| 8/31/2023 | $25,917 | $26,491 | $34,044 |
| 9/30/2023 | $24,416 | $25,229 | $32,173 |
| 10/31/2023 | $23,905 | $24,560 | $31,615 |
| 11/30/2023 | $26,573 | $26,851 | $35,035 |
| 12/31/2023 | $27,789 | $28,275 | $36,707 |
| 1/31/2024 | $28,744 | $28,588 | $37,519 |
| 2/29/2024 | $31,353 | $30,136 | $40,102 |
| 3/31/2024 | $31,841 | $31,108 | $40,828 |
| 4/30/2024 | $30,276 | $29,739 | $39,028 |
| 5/31/2024 | $31,977 | $31,144 | $41,353 |
| 6/30/2024 | $33,827 | $32,108 | $44,010 |
| 7/31/2024 | $32,770 | $32,705 | $43,453 |
Annual Shareholder Report | July 31, 2024
AVERAGE ANNUAL TOTAL RETURNS (%)
| 1 Year | 5 Years | 10 Years |
|---|
| Institutional Class | 22.64 | 11.05 | 12.60 |
Russell 3000® Index | 21.07 | 14.23 | 12.58 |
Russell 3000® Growth Index | 26.20 | 17.74 | 15.82 |
| Total net assets | $3,744,930,781 |
| # of portfolio holdings | 74 |
| Portfolio turnover rate | 38% |
| Total advisory fees paid | $20,902,798 |
What did the Fund invest in?
(Based on long-term investments)
TOP TEN HOLDINGS (% OF NET ASSETS)
| Microsoft Corp. | 11.7 |
| NVIDIA Corp. | 9.8 |
| Amazon.com, Inc. | 8.5 |
| Apple, Inc. | 6.4 |
| Meta Platforms, Inc. Class A | 5.7 |
| Alphabet, Inc. Class A | 4.0 |
| Monolithic Power Systems, Inc. | 1.8 |
| Tradeweb Markets, Inc. Class A | 1.8 |
| Mastercard, Inc. Class A | 1.8 |
| Visa, Inc. Class A | 1.7 |
SECTOR ALLOCATION (% OF LONG-TERM INVESTMENTS)
| Information technology | 43.9 |
| Consumer discretionary | 17.2 |
| Communication services | 12.2 |
| Financials | 8.4 |
| Industrials | 8.2 |
| Health care | 6.7 |
| Materials | 2.4 |
| Consumer staples | 1.0 |
This is a summary of certain changes and planned changes to the Fund since August 1, 2023.
Effective May 31, 2024, Michael T. Smith, CFA and Christopher J. Warner, CFA were added as portfolio managers of the Fund and effective July 26, 2024, Thomas C. Ognar, CFA and David Nazaret were no longer portfolio managers of the Fund.
You can find additional information on the Fund's website at allspringglobal.com, including its:
- Prospectus - Financial Information - Fund holdings - Proxy voting information
Annual Shareholder Report
This annual shareholder report contains important information about Growth Fund for the period of August 1, 2023 to July 31, 2024. You can find additional information about the Fund at allspringglobal.com. You can also request this information by contacting us at 1-800-222-8222.
This report describes changes to the Fund that occurred during the reporting period.
What were the Fund costs for the past year?
The table explains the costs you would have paid within the reporting period based on a hypothetical $10,000 investment.
| CLASS NAME | COST OF A $10,000 INVESTMENT | COSTS PAID AS A % OF A $10,000 INVESTMENT |
|---|
| Class R6 | $78 | 0.70% |
The manager has contractually committed to waive fees and/or reimburse certain expenses to the extent necessary to cap the Fund's total annual fund operating expense ratio at a specific amount. Without this cap, the costs shown above may have been higher. Please see the prospectus for the amount and the expiration date of the cap. Prior to or after the commitment expiration date, the cap may be increased or the commitment to maintain the cap may be terminated only with the approval of the Board of Trustees.
How did the Fund perform last year and what affected its performance?
Positive earnings surprises fueled a bull market for large-cap U.S. equities during the 12-month period that ended on July 31, 2024. Companies connected to artificial intelligence (AI) saw their valuations soar. The “Magnificent 7” stocks substantially outperformed the rest of the U.S. equity universe. Inflation concerns and policy uncertainty deterred sentiment for small-cap stocks. Late in the fiscal year, several Magnificent 7 companies struggled to meet high expectations. As a result, market leadership broadened, with small caps narrowing the performance gap relative to mega caps. While portfolio companies that facilitated the structural build-out of AI contributed during the year, there were pockets of weakness. Providers of enterprise software, such as MongoDB, Inc., lowered guidance as uncertainty over future AI capabilities postponed software spending. Demand for electric vehicles declined, with Allegro MicroSystems, Inc. detracting from returns. However, the portfolio’s significant underweight to Tesla, Inc. added to returns. The portfolio also benefited from a position in Shockwave Medical, Inc. There were no meaningful changes to the portfolio during the 12-month period.
Total return based on a $10,000 investment
| Class R6 | Russell 3000® Index | Russell 3000® Growth Index |
|---|
| 7/31/2014 | $10,000 | $10,000 | $10,000 |
| 8/31/2014 | $10,394 | $10,420 | $10,466 |
| 9/30/2014 | $10,154 | $10,202 | $10,283 |
| 10/31/2014 | $10,490 | $10,483 | $10,581 |
| 11/30/2014 | $10,669 | $10,737 | $10,896 |
| 12/31/2014 | $10,643 | $10,737 | $10,814 |
| 1/31/2015 | $10,531 | $10,438 | $10,643 |
| 2/28/2015 | $11,208 | $11,043 | $11,356 |
| 3/31/2015 | $11,160 | $10,930 | $11,252 |
| 4/30/2015 | $11,078 | $10,980 | $11,278 |
| 5/31/2015 | $11,250 | $11,132 | $11,456 |
| 6/30/2015 | $11,227 | $10,945 | $11,282 |
| 7/31/2015 | $11,552 | $11,128 | $11,637 |
| 8/31/2015 | $10,655 | $10,457 | $10,916 |
| 9/30/2015 | $10,288 | $10,152 | $10,613 |
| 10/31/2015 | $10,945 | $10,954 | $11,503 |
| 11/30/2015 | $11,132 | $11,014 | $11,564 |
| 12/31/2015 | $10,958 | $10,788 | $11,365 |
| 1/31/2016 | $9,903 | $10,180 | $10,686 |
| 2/29/2016 | $9,824 | $10,176 | $10,677 |
| 3/31/2016 | $10,350 | $10,893 | $11,404 |
| 4/30/2016 | $10,586 | $10,960 | $11,315 |
| 5/31/2016 | $10,882 | $11,156 | $11,541 |
| 6/30/2016 | $10,705 | $11,179 | $11,495 |
| 7/31/2016 | $11,408 | $11,623 | $12,053 |
| 8/31/2016 | $11,401 | $11,653 | $12,007 |
| 9/30/2016 | $11,363 | $11,671 | $12,061 |
| 10/31/2016 | $10,934 | $11,419 | $11,742 |
| 11/30/2016 | $11,089 | $11,930 | $12,055 |
| 12/31/2016 | $10,904 | $12,162 | $12,206 |
| 1/31/2017 | $11,567 | $12,391 | $12,600 |
| 2/28/2017 | $12,038 | $12,852 | $13,107 |
| 3/31/2017 | $12,193 | $12,861 | $13,259 |
| 4/30/2017 | $12,601 | $12,997 | $13,558 |
| 5/31/2017 | $12,979 | $13,130 | $13,876 |
| 6/30/2017 | $12,898 | $13,249 | $13,876 |
| 7/31/2017 | $13,290 | $13,498 | $14,225 |
| 8/31/2017 | $13,498 | $13,524 | $14,464 |
| 9/30/2017 | $13,797 | $13,854 | $14,699 |
| 10/31/2017 | $14,344 | $14,157 | $15,241 |
| 11/30/2017 | $14,620 | $14,586 | $15,702 |
| 12/31/2017 | $14,746 | $14,732 | $15,817 |
| 1/31/2018 | $16,019 | $15,509 | $16,898 |
| 2/28/2018 | $15,894 | $14,937 | $16,452 |
| 3/31/2018 | $15,729 | $14,637 | $16,051 |
| 4/30/2018 | $15,722 | $14,693 | $16,104 |
| 5/31/2018 | $16,600 | $15,108 | $16,834 |
| 6/30/2018 | $16,683 | $15,207 | $16,994 |
| 7/31/2018 | $17,045 | $15,711 | $17,477 |
| 8/31/2018 | $18,028 | $16,263 | $18,442 |
| 9/30/2018 | $17,974 | $16,290 | $18,504 |
| 10/31/2018 | $16,077 | $15,090 | $16,796 |
| 11/30/2018 | $16,321 | $15,393 | $16,980 |
| 12/31/2018 | $14,835 | $13,960 | $15,482 |
| 1/31/2019 | $16,506 | $15,158 | $16,902 |
| 2/28/2019 | $17,482 | $15,691 | $17,543 |
| 3/31/2019 | $17,774 | $15,920 | $17,986 |
| 4/30/2019 | $18,966 | $16,556 | $18,780 |
| 5/31/2019 | $18,012 | $15,485 | $17,579 |
| 6/30/2019 | $19,085 | $16,572 | $18,796 |
| 7/31/2019 | $19,441 | $16,819 | $19,204 |
| 8/31/2019 | $19,153 | $16,476 | $19,012 |
| 9/30/2019 | $18,809 | $16,765 | $19,004 |
| 10/31/2019 | $19,115 | $17,126 | $19,540 |
| 11/30/2019 | $20,209 | $17,777 | $20,425 |
| 12/31/2019 | $20,425 | $18,290 | $21,031 |
| 1/31/2020 | $21,228 | $18,270 | $21,456 |
| 2/29/2020 | $19,706 | $16,774 | $19,989 |
| 3/31/2020 | $17,120 | $14,468 | $17,908 |
| 4/30/2020 | $20,275 | $16,384 | $20,558 |
| 5/31/2020 | $22,217 | $17,260 | $21,971 |
| 6/30/2020 | $23,062 | $17,655 | $22,921 |
| 7/31/2020 | $24,817 | $18,657 | $24,628 |
| 8/31/2020 | $26,675 | $20,009 | $27,108 |
| 9/30/2020 | $25,816 | $19,280 | $25,868 |
| 10/31/2020 | $25,648 | $18,864 | $25,050 |
| 11/30/2020 | $28,859 | $21,159 | $27,723 |
| 12/31/2020 | $30,548 | $22,111 | $29,078 |
| 1/31/2021 | $30,161 | $22,012 | $28,968 |
| 2/28/2021 | $31,244 | $22,700 | $29,028 |
| 3/31/2021 | $29,841 | $23,514 | $29,425 |
| 4/30/2021 | $31,910 | $24,726 | $31,334 |
| 5/31/2021 | $30,630 | $24,839 | $30,870 |
| 6/30/2021 | $33,040 | $25,452 | $32,773 |
| 7/31/2021 | $33,799 | $25,882 | $33,699 |
| 8/31/2021 | $34,826 | $26,620 | $34,918 |
| 9/30/2021 | $33,102 | $25,426 | $33,001 |
| 10/31/2021 | $35,094 | $27,145 | $35,775 |
| 11/30/2021 | $33,118 | $26,732 | $35,871 |
| 12/31/2021 | $32,958 | $27,785 | $36,595 |
| 1/31/2022 | $28,731 | $26,150 | $33,351 |
| 2/28/2022 | $27,908 | $25,491 | $32,021 |
| 3/31/2022 | $28,353 | $26,318 | $33,209 |
| 4/30/2022 | $24,324 | $23,956 | $29,195 |
| 5/31/2022 | $23,387 | $23,924 | $28,523 |
| 6/30/2022 | $21,556 | $21,923 | $26,292 |
| 7/31/2022 | $23,981 | $23,979 | $29,436 |
| 8/31/2022 | $22,829 | $23,084 | $28,129 |
| 9/30/2022 | $20,469 | $20,944 | $25,407 |
| 10/31/2022 | $21,093 | $22,661 | $26,948 |
| 11/30/2022 | $22,150 | $23,844 | $28,126 |
| 12/31/2022 | $20,813 | $22,448 | $25,995 |
| 1/31/2023 | $22,713 | $23,994 | $28,187 |
| 2/28/2023 | $22,417 | $23,433 | $27,854 |
| 3/31/2023 | $23,832 | $24,060 | $29,595 |
| 4/30/2023 | $23,908 | $24,316 | $29,850 |
| 5/31/2023 | $24,474 | $24,411 | $31,134 |
| 6/30/2023 | $26,179 | $26,078 | $33,286 |
| 7/31/2023 | $26,839 | $27,013 | $34,430 |
| 8/31/2023 | $26,028 | $26,491 | $34,044 |
| 9/30/2023 | $24,518 | $25,229 | $32,173 |
| 10/31/2023 | $24,009 | $24,560 | $31,615 |
| 11/30/2023 | $26,688 | $26,851 | $35,035 |
| 12/31/2023 | $27,913 | $28,275 | $36,707 |
| 1/31/2024 | $28,872 | $28,588 | $37,519 |
| 2/29/2024 | $31,492 | $30,136 | $40,102 |
| 3/31/2024 | $31,984 | $31,108 | $40,828 |
| 4/30/2024 | $30,411 | $29,739 | $39,028 |
| 5/31/2024 | $32,120 | $31,144 | $41,353 |
| 6/30/2024 | $33,983 | $32,108 | $44,010 |
| 7/31/2024 | $32,923 | $32,705 | $43,453 |
Annual Shareholder Report | July 31, 2024
AVERAGE ANNUAL TOTAL RETURNS (%)
| 1 Year | 5 Years | 10 Years |
|---|
Class R6Footnote Reference* | 22.69 | 11.11 | 12.65 |
Russell 3000® Index | 21.07 | 14.23 | 12.58 |
Russell 3000® Growth Index | 26.20 | 17.74 | 15.82 |
| Total net assets | $3,744,930,781 |
| # of portfolio holdings | 74 |
| Portfolio turnover rate | 38% |
| Total advisory fees paid | $20,902,798 |
| Footnote | Description |
Footnote* | Historical performance shown for the Class R6 shares prior to their inception on September 28, 2015 reflects the performance of the Institutional Class shares, and includes the higher expenses applicable to the Institutional Class shares. If these expenses had not been included, returns for the Class R6 shares would be higher. |
What did the Fund invest in?
(Based on long-term investments)
TOP TEN HOLDINGS (% OF NET ASSETS)
| Microsoft Corp. | 11.7 |
| NVIDIA Corp. | 9.8 |
| Amazon.com, Inc. | 8.5 |
| Apple, Inc. | 6.4 |
| Meta Platforms, Inc. Class A | 5.7 |
| Alphabet, Inc. Class A | 4.0 |
| Monolithic Power Systems, Inc. | 1.8 |
| Tradeweb Markets, Inc. Class A | 1.8 |
| Mastercard, Inc. Class A | 1.8 |
| Visa, Inc. Class A | 1.7 |
SECTOR ALLOCATION (% OF LONG-TERM INVESTMENTS)
| Information technology | 43.9 |
| Consumer discretionary | 17.2 |
| Communication services | 12.2 |
| Financials | 8.4 |
| Industrials | 8.2 |
| Health care | 6.7 |
| Materials | 2.4 |
| Consumer staples | 1.0 |
This is a summary of certain changes and planned changes to the Fund since August 1, 2023.
Effective May 31, 2024, Michael T. Smith, CFA and Christopher J. Warner, CFA were added as portfolio managers of the Fund and effective July 26, 2024, Thomas C. Ognar, CFA and David Nazaret were no longer portfolio managers of the Fund.
You can find additional information on the Fund's website at allspringglobal.com, including its:
- Prospectus - Financial Information - Fund holdings - Proxy voting information
Annual Shareholder Report
This annual shareholder report contains important information about Growth Fund for the period of August 1, 2023 to July 31, 2024. You can find additional information about the Fund at allspringglobal.com. You can also request this information by contacting us at 1-800-222-8222.
This report describes changes to the Fund that occurred during the reporting period.
What were the Fund costs for the past year?
The table explains the costs you would have paid within the reporting period based on a hypothetical $10,000 investment.
| CLASS NAME | COST OF A $10,000 INVESTMENT | COSTS PAID AS A % OF A $10,000 INVESTMENT |
|---|
| Class C | $210 | 1.90% |
The manager has contractually committed to waive fees and/or reimburse certain expenses to the extent necessary to cap the Fund's total annual fund operating expense ratio at a specific amount. Without this cap, the costs shown above may have been higher. Please see the prospectus for the amount and the expiration date of the cap. Prior to or after the commitment expiration date, the cap may be increased or the commitment to maintain the cap may be terminated only with the approval of the Board of Trustees.
How did the Fund perform last year and what affected its performance?
Positive earnings surprises fueled a bull market for large-cap U.S. equities during the 12-month period that ended on July 31, 2024. Companies connected to artificial intelligence (AI) saw their valuations soar. The “Magnificent 7” stocks substantially outperformed the rest of the U.S. equity universe. Inflation concerns and policy uncertainty deterred sentiment for small-cap stocks. Late in the fiscal year, several Magnificent 7 companies struggled to meet high expectations. As a result, market leadership broadened, with small caps narrowing the performance gap relative to mega caps. While portfolio companies that facilitated the structural build-out of AI contributed during the year, there were pockets of weakness. Providers of enterprise software, such as MongoDB, Inc., lowered guidance as uncertainty over future AI capabilities postponed software spending. Demand for electric vehicles declined, with Allegro MicroSystems, Inc. detracting from returns. However, the portfolio’s significant underweight to Tesla, Inc. added to returns. The portfolio also benefited from a position in Shockwave Medical, Inc. There were no meaningful changes to the portfolio during the 12-month period.
Total return based on a $10,000 investment

| Class C with Load | Russell 3000® Index | Russell 3000® Growth Index |
|---|
| 7/31/2014 | $10,000 | $10,000 | $10,000 |
| 8/31/2014 | $10,383 | $10,420 | $10,466 |
| 9/30/2014 | $10,133 | $10,202 | $10,283 |
| 10/31/2014 | $10,457 | $10,483 | $10,581 |
| 11/30/2014 | $10,624 | $10,737 | $10,896 |
| 12/31/2014 | $10,588 | $10,737 | $10,814 |
| 1/31/2015 | $10,467 | $10,438 | $10,643 |
| 2/28/2015 | $11,129 | $11,043 | $11,356 |
| 3/31/2015 | $11,070 | $10,930 | $11,252 |
| 4/30/2015 | $10,977 | $10,980 | $11,278 |
| 5/31/2015 | $11,136 | $11,132 | $11,456 |
| 6/30/2015 | $11,106 | $10,945 | $11,282 |
| 7/31/2015 | $11,416 | $11,128 | $11,637 |
| 8/31/2015 | $10,518 | $10,457 | $10,916 |
| 9/30/2015 | $10,144 | $10,152 | $10,613 |
| 10/31/2015 | $10,783 | $10,954 | $11,503 |
| 11/30/2015 | $10,957 | $11,014 | $11,564 |
| 12/31/2015 | $10,771 | $10,788 | $11,365 |
| 1/31/2016 | $9,725 | $10,180 | $10,686 |
| 2/29/2016 | $9,641 | $10,176 | $10,677 |
| 3/31/2016 | $10,146 | $10,893 | $11,404 |
| 4/30/2016 | $10,365 | $10,960 | $11,315 |
| 5/31/2016 | $10,644 | $11,156 | $11,541 |
| 6/30/2016 | $10,461 | $11,179 | $11,495 |
| 7/31/2016 | $11,137 | $11,623 | $12,053 |
| 8/31/2016 | $11,119 | $11,653 | $12,007 |
| 9/30/2016 | $11,071 | $11,671 | $12,061 |
| 10/31/2016 | $10,641 | $11,419 | $11,742 |
| 11/30/2016 | $10,783 | $11,930 | $12,055 |
| 12/31/2016 | $10,586 | $12,162 | $12,206 |
| 1/31/2017 | $11,222 | $12,391 | $12,600 |
| 2/28/2017 | $11,666 | $12,852 | $13,107 |
| 3/31/2017 | $11,805 | $12,861 | $13,259 |
| 4/30/2017 | $12,185 | $12,997 | $13,558 |
| 5/31/2017 | $12,543 | $13,130 | $13,876 |
| 6/30/2017 | $12,449 | $13,249 | $13,876 |
| 7/31/2017 | $12,814 | $13,498 | $14,225 |
| 8/31/2017 | $13,002 | $13,524 | $14,464 |
| 9/30/2017 | $13,276 | $13,854 | $14,699 |
| 10/31/2017 | $13,788 | $14,157 | $15,241 |
| 11/30/2017 | $14,040 | $14,586 | $15,702 |
| 12/31/2017 | $14,146 | $14,732 | $15,817 |
| 1/31/2018 | $15,351 | $15,509 | $16,898 |
| 2/28/2018 | $15,217 | $14,937 | $16,452 |
| 3/31/2018 | $15,045 | $14,637 | $16,051 |
| 4/30/2018 | $15,024 | $14,693 | $16,104 |
| 5/31/2018 | $15,843 | $15,108 | $16,834 |
| 6/30/2018 | $15,907 | $15,207 | $16,994 |
| 7/31/2018 | $16,239 | $15,711 | $17,477 |
| 8/31/2018 | $17,155 | $16,263 | $18,442 |
| 9/30/2018 | $17,091 | $16,290 | $18,504 |
| 10/31/2018 | $15,265 | $15,090 | $16,796 |
| 11/30/2018 | $15,484 | $15,393 | $16,980 |
| 12/31/2018 | $14,055 | $13,960 | $15,482 |
| 1/31/2019 | $15,632 | $15,158 | $16,902 |
| 2/28/2019 | $16,538 | $15,691 | $17,543 |
| 3/31/2019 | $16,792 | $15,920 | $17,986 |
| 4/30/2019 | $17,903 | $16,556 | $18,780 |
| 5/31/2019 | $16,983 | $15,485 | $17,579 |
| 6/30/2019 | $17,981 | $16,572 | $18,796 |
| 7/31/2019 | $18,299 | $16,819 | $19,204 |
| 8/31/2019 | $18,009 | $16,476 | $19,012 |
| 9/30/2019 | $17,669 | $16,765 | $19,004 |
| 10/31/2019 | $17,938 | $17,126 | $19,540 |
| 11/30/2019 | $18,943 | $17,777 | $20,425 |
| 12/31/2019 | $19,124 | $18,290 | $21,031 |
| 1/31/2020 | $19,850 | $18,270 | $21,456 |
| 2/29/2020 | $18,414 | $16,774 | $19,989 |
| 3/31/2020 | $15,982 | $14,468 | $17,908 |
| 4/30/2020 | $18,913 | $16,384 | $20,558 |
| 5/31/2020 | $20,704 | $17,260 | $21,971 |
| 6/30/2020 | $21,464 | $17,655 | $22,921 |
| 7/31/2020 | $23,077 | $18,657 | $24,628 |
| 8/31/2020 | $25,164 | $20,009 | $27,108 |
| 9/30/2020 | $24,327 | $19,280 | $25,868 |
| 10/31/2020 | $24,150 | $18,864 | $25,050 |
| 11/30/2020 | $27,140 | $21,159 | $27,723 |
| 12/31/2020 | $28,697 | $22,111 | $29,078 |
| 1/31/2021 | $28,304 | $22,012 | $28,968 |
| 2/28/2021 | $29,297 | $22,700 | $29,028 |
| 3/31/2021 | $27,952 | $23,514 | $29,425 |
| 4/30/2021 | $29,856 | $24,726 | $31,334 |
| 5/31/2021 | $28,625 | $24,839 | $30,870 |
| 6/30/2021 | $30,850 | $25,452 | $32,773 |
| 7/31/2021 | $31,533 | $25,882 | $33,699 |
| 8/31/2021 | $32,454 | $26,620 | $34,918 |
| 9/30/2021 | $30,819 | $25,426 | $33,001 |
| 10/31/2021 | $32,640 | $27,145 | $35,775 |
| 11/30/2021 | $30,767 | $26,732 | $35,871 |
| 12/31/2021 | $30,583 | $27,785 | $36,595 |
| 1/31/2022 | $26,645 | $26,150 | $33,351 |
| 2/28/2022 | $25,857 | $25,491 | $32,021 |
| 3/31/2022 | $26,229 | $26,318 | $33,209 |
| 4/30/2022 | $22,484 | $23,956 | $29,195 |
| 5/31/2022 | $21,592 | $23,924 | $28,523 |
| 6/30/2022 | $19,883 | $21,923 | $26,292 |
| 7/31/2022 | $22,216 | $23,979 | $29,436 |
| 8/31/2022 | $21,139 | $23,084 | $28,129 |
| 9/30/2022 | $18,942 | $20,944 | $25,407 |
| 10/31/2022 | $19,522 | $22,661 | $26,948 |
| 11/30/2022 | $20,484 | $23,844 | $28,126 |
| 12/31/2022 | $19,243 | $22,448 | $25,995 |
| 1/31/2023 | $20,986 | $23,994 | $28,187 |
| 2/28/2023 | $20,710 | $23,433 | $27,854 |
| 3/31/2023 | $22,009 | $24,060 | $29,595 |
| 4/30/2023 | $22,071 | $24,316 | $29,850 |
| 5/31/2023 | $22,587 | $24,411 | $31,134 |
| 6/30/2023 | $24,152 | $26,078 | $33,286 |
| 7/31/2023 | $24,747 | $27,013 | $34,430 |
| 8/31/2023 | $23,992 | $26,491 | $34,044 |
| 9/30/2023 | $22,595 | $25,229 | $32,173 |
| 10/31/2023 | $22,115 | $24,560 | $31,615 |
| 11/30/2023 | $24,570 | $26,851 | $35,035 |
| 12/31/2023 | $25,696 | $28,275 | $36,707 |
| 1/31/2024 | $26,571 | $28,588 | $37,519 |
| 2/29/2024 | $28,965 | $30,136 | $40,102 |
| 3/31/2024 | $29,413 | $31,108 | $40,828 |
| 4/30/2024 | $27,952 | $29,739 | $39,028 |
| 5/31/2024 | $29,512 | $31,144 | $41,353 |
| 6/30/2024 | $31,211 | $32,108 | $44,010 |
| 7/31/2024 | $30,237 | $32,705 | $43,453 |
Annual Shareholder Report | July 31, 2024
AVERAGE ANNUAL TOTAL RETURNS (%)
| 1 Year | 5 Years | 10 Years |
|---|
| Class C | 21.28 | 10.23 | 11.70 |
| Class C with Load | 20.28 | 10.23 | 11.70 |
Russell 3000® Index | 21.07 | 14.23 | 12.58 |
Russell 3000® Growth Index | 26.20 | 17.74 | 15.82 |
| Total net assets | $3,744,930,781 |
| # of portfolio holdings | 74 |
| Portfolio turnover rate | 38% |
| Total advisory fees paid | $20,902,798 |
What did the Fund invest in?
(Based on long-term investments)
TOP TEN HOLDINGS (% OF NET ASSETS)
| Microsoft Corp. | 11.7 |
| NVIDIA Corp. | 9.8 |
| Amazon.com, Inc. | 8.5 |
| Apple, Inc. | 6.4 |
| Meta Platforms, Inc. Class A | 5.7 |
| Alphabet, Inc. Class A | 4.0 |
| Monolithic Power Systems, Inc. | 1.8 |
| Tradeweb Markets, Inc. Class A | 1.8 |
| Mastercard, Inc. Class A | 1.8 |
| Visa, Inc. Class A | 1.7 |
SECTOR ALLOCATION (% OF LONG-TERM INVESTMENTS)
| Information technology | 43.9 |
| Consumer discretionary | 17.2 |
| Communication services | 12.2 |
| Financials | 8.4 |
| Industrials | 8.2 |
| Health care | 6.7 |
| Materials | 2.4 |
| Consumer staples | 1.0 |
This is a summary of certain changes and planned changes to the Fund since August 1, 2023.
Effective May 31, 2024, Michael T. Smith, CFA and Christopher J. Warner, CFA were added as portfolio managers of the Fund and effective July 26, 2024, Thomas C. Ognar, CFA and David Nazaret were no longer portfolio managers of the Fund.
You can find additional information on the Fund's website at allspringglobal.com, including its:
- Prospectus - Financial Information - Fund holdings - Proxy voting information
Annual Shareholder Report
This annual shareholder report contains important information about Growth Fund for the period of August 1, 2023 to July 31, 2024. You can find additional information about the Fund at allspringglobal.com. You can also request this information by contacting us at 1-800-222-8222.
This report describes changes to the Fund that occurred during the reporting period.
What were the Fund costs for the past year?
The table explains the costs you would have paid within the reporting period based on a hypothetical $10,000 investment.
| CLASS NAME | COST OF A $10,000 INVESTMENT | COSTS PAID AS A % OF A $10,000 INVESTMENT |
|---|
| Class A | $123 | 1.11% |
The manager has contractually committed to waive fees and/or reimburse certain expenses to the extent necessary to cap the Fund's total annual fund operating expense ratio at a specific amount. Without this cap, the costs shown above may have been higher. Please see the prospectus for the amount and the expiration date of the cap. Prior to or after the commitment expiration date, the cap may be increased or the commitment to maintain the cap may be terminated only with the approval of the Board of Trustees.
How did the Fund perform last year and what affected its performance?
Positive earnings surprises fueled a bull market for large-cap U.S. equities during the 12-month period that ended on July 31, 2024. Companies connected to artificial intelligence (AI) saw their valuations soar. The “Magnificent 7” stocks substantially outperformed the rest of the U.S. equity universe. Inflation concerns and policy uncertainty deterred sentiment for small-cap stocks. Late in the fiscal year, several Magnificent 7 companies struggled to meet high expectations. As a result, market leadership broadened, with small caps narrowing the performance gap relative to mega caps. While portfolio companies that facilitated the structural build-out of AI contributed during the year, there were pockets of weakness. Providers of enterprise software, such as MongoDB, Inc., lowered guidance as uncertainty over future AI capabilities postponed software spending. Demand for electric vehicles declined, with Allegro MicroSystems, Inc. detracting from returns. However, the portfolio’s significant underweight to Tesla, Inc. added to returns. The portfolio also benefited from a position in Shockwave Medical, Inc. There were no meaningful changes to the portfolio during the 12-month period.
Total return based on a $10,000 investment
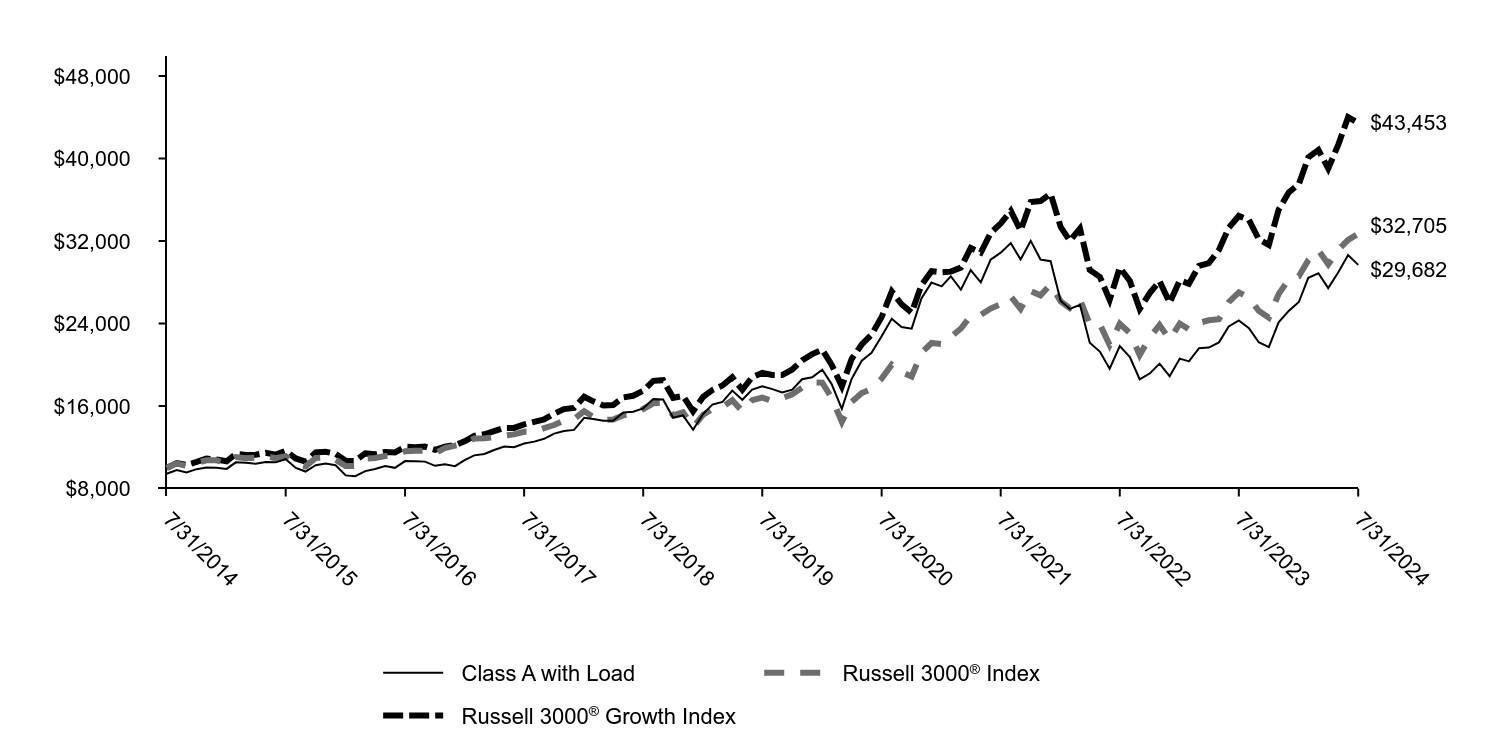
| Class A with Load | Russell 3000® Index | Russell 3000® Growth Index |
|---|
| 7/31/2014 | $9,425 | $10,000 | $10,000 |
| 8/31/2014 | $9,791 | $10,420 | $10,466 |
| 9/30/2014 | $9,563 | $10,202 | $10,283 |
| 10/31/2014 | $9,876 | $10,483 | $10,581 |
| 11/30/2014 | $10,040 | $10,737 | $10,896 |
| 12/31/2014 | $10,010 | $10,737 | $10,814 |
| 1/31/2015 | $9,903 | $10,438 | $10,643 |
| 2/28/2015 | $10,536 | $11,043 | $11,356 |
| 3/31/2015 | $10,488 | $10,930 | $11,252 |
| 4/30/2015 | $10,406 | $10,980 | $11,278 |
| 5/31/2015 | $10,562 | $11,132 | $11,456 |
| 6/30/2015 | $10,538 | $10,945 | $11,282 |
| 7/31/2015 | $10,840 | $11,128 | $11,637 |
| 8/31/2015 | $9,995 | $10,457 | $10,916 |
| 9/30/2015 | $9,647 | $10,152 | $10,613 |
| 10/31/2015 | $10,260 | $10,954 | $11,503 |
| 11/30/2015 | $10,431 | $11,014 | $11,564 |
| 12/31/2015 | $10,261 | $10,788 | $11,365 |
| 1/31/2016 | $9,271 | $10,180 | $10,686 |
| 2/29/2016 | $9,195 | $10,176 | $10,677 |
| 3/31/2016 | $9,684 | $10,893 | $11,404 |
| 4/30/2016 | $9,898 | $10,960 | $11,315 |
| 5/31/2016 | $10,173 | $11,156 | $11,541 |
| 6/30/2016 | $10,004 | $11,179 | $11,495 |
| 7/31/2016 | $10,657 | $11,623 | $12,053 |
| 8/31/2016 | $10,644 | $11,653 | $12,007 |
| 9/30/2016 | $10,607 | $11,671 | $12,061 |
| 10/31/2016 | $10,201 | $11,419 | $11,742 |
| 11/30/2016 | $10,342 | $11,930 | $12,055 |
| 12/31/2016 | $10,166 | $12,162 | $12,206 |
| 1/31/2017 | $10,781 | $12,391 | $12,600 |
| 2/28/2017 | $11,213 | $12,852 | $13,107 |
| 3/31/2017 | $11,353 | $12,861 | $13,259 |
| 4/30/2017 | $11,730 | $12,997 | $13,558 |
| 5/31/2017 | $12,079 | $13,130 | $13,876 |
| 6/30/2017 | $11,996 | $13,249 | $13,876 |
| 7/31/2017 | $12,357 | $13,498 | $14,225 |
| 8/31/2017 | $12,544 | $13,524 | $14,464 |
| 9/30/2017 | $12,819 | $13,854 | $14,699 |
| 10/31/2017 | $13,321 | $14,157 | $15,241 |
| 11/30/2017 | $13,575 | $14,586 | $15,702 |
| 12/31/2017 | $13,683 | $14,732 | $15,817 |
| 1/31/2018 | $14,857 | $15,509 | $16,898 |
| 2/28/2018 | $14,739 | $14,937 | $16,452 |
| 3/31/2018 | $14,580 | $14,637 | $16,051 |
| 4/30/2018 | $14,568 | $14,693 | $16,104 |
| 5/31/2018 | $15,376 | $15,108 | $16,834 |
| 6/30/2018 | $15,449 | $15,207 | $16,994 |
| 7/31/2018 | $15,775 | $15,711 | $17,477 |
| 8/31/2018 | $16,677 | $16,263 | $18,442 |
| 9/30/2018 | $16,624 | $16,290 | $18,504 |
| 10/31/2018 | $14,862 | $15,090 | $16,796 |
| 11/30/2018 | $15,082 | $15,393 | $16,980 |
| 12/31/2018 | $13,701 | $13,960 | $15,482 |
| 1/31/2019 | $15,243 | $15,158 | $16,902 |
| 2/28/2019 | $16,134 | $15,691 | $17,543 |
| 3/31/2019 | $16,401 | $15,920 | $17,986 |
| 4/30/2019 | $17,494 | $16,556 | $18,780 |
| 5/31/2019 | $16,608 | $15,485 | $17,579 |
| 6/30/2019 | $17,590 | $16,572 | $18,796 |
| 7/31/2019 | $17,912 | $16,819 | $19,204 |
| 8/31/2019 | $17,640 | $16,476 | $19,012 |
| 9/30/2019 | $17,318 | $16,765 | $19,004 |
| 10/31/2019 | $17,590 | $17,126 | $19,540 |
| 11/30/2019 | $18,593 | $17,777 | $20,425 |
| 12/31/2019 | $18,783 | $18,290 | $21,031 |
| 1/31/2020 | $19,514 | $18,270 | $21,456 |
| 2/29/2020 | $18,109 | $16,774 | $19,989 |
| 3/31/2020 | $15,728 | $14,468 | $17,908 |
| 4/30/2020 | $18,617 | $16,384 | $20,558 |
| 5/31/2020 | $20,393 | $17,260 | $21,971 |
| 6/30/2020 | $21,164 | $17,655 | $22,921 |
| 7/31/2020 | $22,764 | $18,657 | $24,628 |
| 8/31/2020 | $24,460 | $20,009 | $27,108 |
| 9/30/2020 | $23,666 | $19,280 | $25,868 |
| 10/31/2020 | $23,500 | $18,864 | $25,050 |
| 11/30/2020 | $26,436 | $21,159 | $27,723 |
| 12/31/2020 | $27,970 | $22,111 | $29,078 |
| 1/31/2021 | $27,603 | $22,012 | $28,968 |
| 2/28/2021 | $28,585 | $22,700 | $29,028 |
| 3/31/2021 | $27,289 | $23,514 | $29,425 |
| 4/30/2021 | $29,174 | $24,726 | $31,334 |
| 5/31/2021 | $27,996 | $24,839 | $30,870 |
| 6/30/2021 | $30,182 | $25,452 | $32,773 |
| 7/31/2021 | $30,870 | $25,882 | $33,699 |
| 8/31/2021 | $31,793 | $26,620 | $34,918 |
| 9/30/2021 | $30,209 | $25,426 | $33,001 |
| 10/31/2021 | $32,015 | $27,145 | $35,775 |
| 11/30/2021 | $30,202 | $26,732 | $35,871 |
| 12/31/2021 | $30,043 | $27,785 | $36,595 |
| 1/31/2022 | $26,178 | $26,150 | $33,351 |
| 2/28/2022 | $25,421 | $25,491 | $32,021 |
| 3/31/2022 | $25,812 | $26,318 | $33,209 |
| 4/30/2022 | $22,142 | $23,956 | $29,195 |
| 5/31/2022 | $21,279 | $23,924 | $28,523 |
| 6/30/2022 | $19,611 | $21,923 | $26,292 |
| 7/31/2022 | $21,808 | $23,979 | $29,436 |
| 8/31/2022 | $20,750 | $23,084 | $28,129 |
| 9/30/2022 | $18,594 | $20,944 | $25,407 |
| 10/31/2022 | $19,163 | $22,661 | $26,948 |
| 11/30/2022 | $20,107 | $23,844 | $28,126 |
| 12/31/2022 | $18,889 | $22,448 | $25,995 |
| 1/31/2023 | $20,600 | $23,994 | $28,187 |
| 2/28/2023 | $20,330 | $23,433 | $27,854 |
| 3/31/2023 | $21,604 | $24,060 | $29,595 |
| 4/30/2023 | $21,665 | $24,316 | $29,850 |
| 5/31/2023 | $22,171 | $24,411 | $31,134 |
| 6/30/2023 | $23,708 | $26,078 | $33,286 |
| 7/31/2023 | $24,293 | $27,013 | $34,430 |
| 8/31/2023 | $23,551 | $26,491 | $34,044 |
| 9/30/2023 | $22,180 | $25,229 | $32,173 |
| 10/31/2023 | $21,709 | $24,560 | $31,615 |
| 11/30/2023 | $24,118 | $26,851 | $35,035 |
| 12/31/2023 | $25,224 | $28,275 | $36,707 |
| 1/31/2024 | $26,082 | $28,588 | $37,519 |
| 2/29/2024 | $28,433 | $30,136 | $40,102 |
| 3/31/2024 | $28,872 | $31,108 | $40,828 |
| 4/30/2024 | $27,438 | $29,739 | $39,028 |
| 5/31/2024 | $28,970 | $31,144 | $41,353 |
| 6/30/2024 | $30,637 | $32,108 | $44,010 |
| 7/31/2024 | $29,682 | $32,705 | $43,453 |
Annual Shareholder Report | July 31, 2024
AVERAGE ANNUAL TOTAL RETURNS (%)
| 1 Year | 5 Years | 10 Years |
|---|
| Class A | 22.18 | 10.63 | 12.16 |
| Class A with Load | 15.15 | 9.33 | 11.49 |
Russell 3000® Index | 21.07 | 14.23 | 12.58 |
Russell 3000® Growth Index | 26.20 | 17.74 | 15.82 |
| Total net assets | $3,744,930,781 |
| # of portfolio holdings | 74 |
| Portfolio turnover rate | 38% |
| Total advisory fees paid | $20,902,798 |
What did the Fund invest in?
(Based on long-term investments)
TOP TEN HOLDINGS (% OF NET ASSETS)
| Microsoft Corp. | 11.7 |
| NVIDIA Corp. | 9.8 |
| Amazon.com, Inc. | 8.5 |
| Apple, Inc. | 6.4 |
| Meta Platforms, Inc. Class A | 5.7 |
| Alphabet, Inc. Class A | 4.0 |
| Monolithic Power Systems, Inc. | 1.8 |
| Tradeweb Markets, Inc. Class A | 1.8 |
| Mastercard, Inc. Class A | 1.8 |
| Visa, Inc. Class A | 1.7 |
SECTOR ALLOCATION (% OF LONG-TERM INVESTMENTS)
| Information technology | 43.9 |
| Consumer discretionary | 17.2 |
| Communication services | 12.2 |
| Financials | 8.4 |
| Industrials | 8.2 |
| Health care | 6.7 |
| Materials | 2.4 |
| Consumer staples | 1.0 |
This is a summary of certain changes and planned changes to the Fund since August 1, 2023.
Effective May 31, 2024, Michael T. Smith, CFA and Christopher J. Warner, CFA were added as portfolio managers of the Fund and effective July 26, 2024, Thomas C. Ognar, CFA and David Nazaret were no longer portfolio managers of the Fund.
You can find additional information on the Fund's website at allspringglobal.com, including its:
- Prospectus - Financial Information - Fund holdings - Proxy voting information
Annual Shareholder Report
This annual shareholder report contains important information about Growth Fund for the period of August 1, 2023 to July 31, 2024. You can find additional information about the Fund at allspringglobal.com. You can also request this information by contacting us at 1-800-222-8222.
This report describes changes to the Fund that occurred during the reporting period.
What were the Fund costs for the past year?
The table explains the costs you would have paid within the reporting period based on a hypothetical $10,000 investment.
| CLASS NAME | COST OF A $10,000 INVESTMENT | COSTS PAID AS A % OF A $10,000 INVESTMENT |
|---|
| Administrator Class | $107 | 0.96% |
The manager has contractually committed to waive fees and/or reimburse certain expenses to the extent necessary to cap the Fund's total annual fund operating expense ratio at a specific amount. Without this cap, the costs shown above may have been higher. Please see the prospectus for the amount and the expiration date of the cap. Prior to or after the commitment expiration date, the cap may be increased or the commitment to maintain the cap may be terminated only with the approval of the Board of Trustees.
How did the Fund perform last year and what affected its performance?
Positive earnings surprises fueled a bull market for large-cap U.S. equities during the 12-month period that ended on July 31, 2024. Companies connected to artificial intelligence (AI) saw their valuations soar. The “Magnificent 7” stocks substantially outperformed the rest of the U.S. equity universe. Inflation concerns and policy uncertainty deterred sentiment for small-cap stocks. Late in the fiscal year, several Magnificent 7 companies struggled to meet high expectations. As a result, market leadership broadened, with small caps narrowing the performance gap relative to mega caps. While portfolio companies that facilitated the structural build-out of AI contributed during the year, there were pockets of weakness. Providers of enterprise software, such as MongoDB, Inc., lowered guidance as uncertainty over future AI capabilities postponed software spending. Demand for electric vehicles declined, with Allegro MicroSystems, Inc. detracting from returns. However, the portfolio’s significant underweight to Tesla, Inc. added to returns. The portfolio also benefited from a position in Shockwave Medical, Inc. There were no meaningful changes to the portfolio during the 12-month period.
Total return based on a $10,000 investment
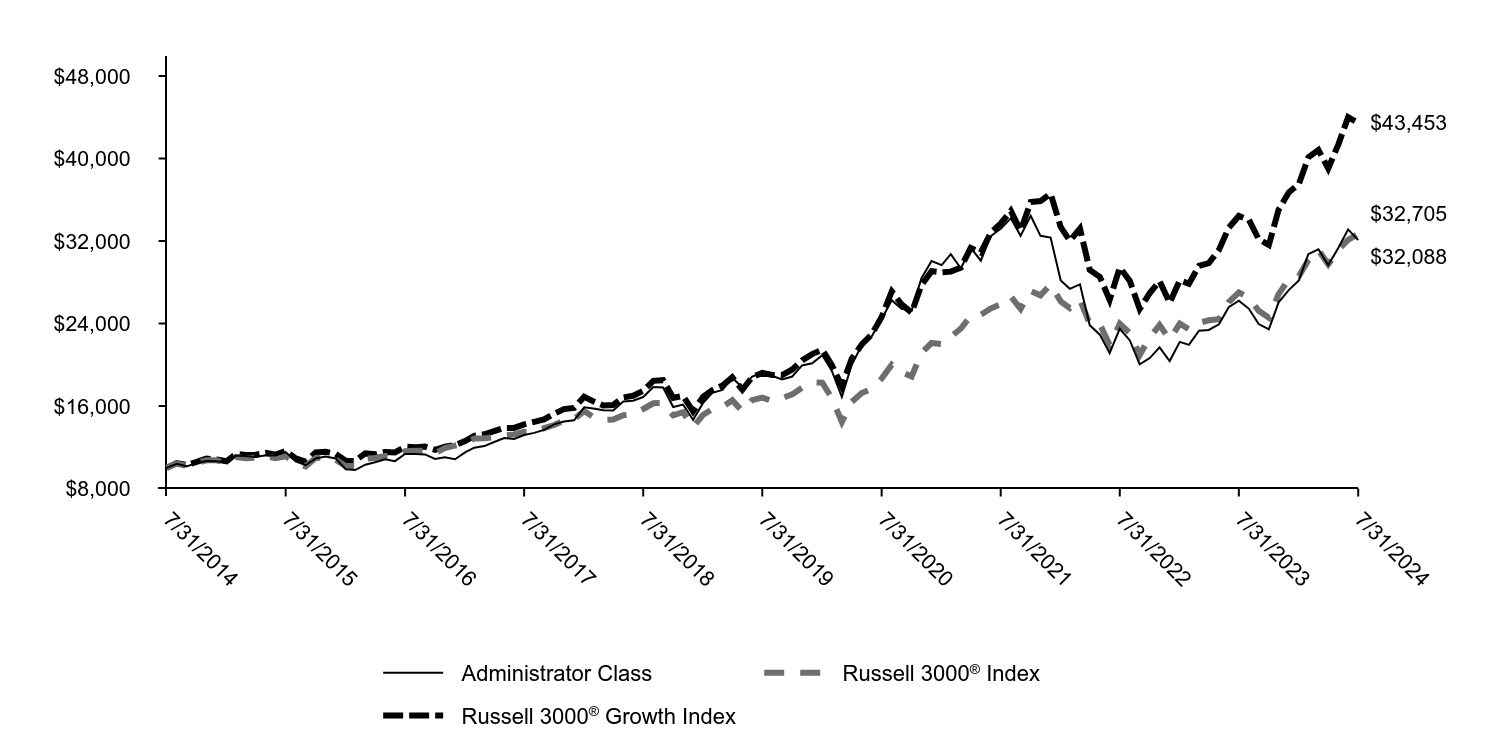
| Administrator Class | Russell 3000® Index | Russell 3000® Growth Index |
|---|
| 7/31/2014 | $10,000 | $10,000 | $10,000 |
| 8/31/2014 | $10,390 | $10,420 | $10,466 |
| 9/30/2014 | $10,150 | $10,202 | $10,283 |
| 10/31/2014 | $10,483 | $10,483 | $10,581 |
| 11/30/2014 | $10,659 | $10,737 | $10,896 |
| 12/31/2014 | $10,632 | $10,737 | $10,814 |
| 1/31/2015 | $10,518 | $10,438 | $10,643 |
| 2/28/2015 | $11,192 | $11,043 | $11,356 |
| 3/31/2015 | $11,142 | $10,930 | $11,252 |
| 4/30/2015 | $11,059 | $10,980 | $11,278 |
| 5/31/2015 | $11,227 | $11,132 | $11,456 |
| 6/30/2015 | $11,203 | $10,945 | $11,282 |
| 7/31/2015 | $11,528 | $11,128 | $11,637 |
| 8/31/2015 | $10,630 | $10,457 | $10,916 |
| 9/30/2015 | $10,259 | $10,152 | $10,613 |
| 10/31/2015 | $10,913 | $10,954 | $11,503 |
| 11/30/2015 | $11,099 | $11,014 | $11,564 |
| 12/31/2015 | $10,919 | $10,788 | $11,365 |
| 1/31/2016 | $9,868 | $10,180 | $10,686 |
| 2/29/2016 | $9,788 | $10,176 | $10,677 |
| 3/31/2016 | $10,310 | $10,893 | $11,404 |
| 4/30/2016 | $10,541 | $10,960 | $11,315 |
| 5/31/2016 | $10,832 | $11,156 | $11,541 |
| 6/30/2016 | $10,656 | $11,179 | $11,495 |
| 7/31/2016 | $11,352 | $11,623 | $12,053 |
| 8/31/2016 | $11,342 | $11,653 | $12,007 |
| 9/30/2016 | $11,302 | $11,671 | $12,061 |
| 10/31/2016 | $10,872 | $11,419 | $11,742 |
| 11/30/2016 | $11,024 | $11,930 | $12,055 |
| 12/31/2016 | $10,838 | $12,162 | $12,206 |
| 1/31/2017 | $11,495 | $12,391 | $12,600 |
| 2/28/2017 | $11,958 | $12,852 | $13,107 |
| 3/31/2017 | $12,113 | $12,861 | $13,259 |
| 4/30/2017 | $12,514 | $12,997 | $13,558 |
| 5/31/2017 | $12,888 | $13,130 | $13,876 |
| 6/30/2017 | $12,802 | $13,249 | $13,876 |
| 7/31/2017 | $13,191 | $13,498 | $14,225 |
| 8/31/2017 | $13,393 | $13,524 | $14,464 |
| 9/30/2017 | $13,687 | $13,854 | $14,699 |
| 10/31/2017 | $14,225 | $14,157 | $15,241 |
| 11/30/2017 | $14,498 | $14,586 | $15,702 |
| 12/31/2017 | $14,619 | $14,732 | $15,817 |
| 1/31/2018 | $15,876 | $15,509 | $16,898 |
| 2/28/2018 | $15,753 | $14,937 | $16,452 |
| 3/31/2018 | $15,584 | $14,637 | $16,051 |
| 4/30/2018 | $15,576 | $14,693 | $16,104 |
| 5/31/2018 | $16,437 | $15,108 | $16,834 |
| 6/30/2018 | $16,518 | $15,207 | $16,994 |
| 7/31/2018 | $16,871 | $15,711 | $17,477 |
| 8/31/2018 | $17,840 | $16,263 | $18,442 |
| 9/30/2018 | $17,786 | $16,290 | $18,504 |
| 10/31/2018 | $15,903 | $15,090 | $16,796 |
| 11/30/2018 | $16,141 | $15,393 | $16,980 |
| 12/31/2018 | $14,667 | $13,960 | $15,482 |
| 1/31/2019 | $16,320 | $15,158 | $16,902 |
| 2/28/2019 | $17,276 | $15,691 | $17,543 |
| 3/31/2019 | $17,562 | $15,920 | $17,986 |
| 4/30/2019 | $18,739 | $16,556 | $18,780 |
| 5/31/2019 | $17,788 | $15,485 | $17,579 |
| 6/30/2019 | $18,845 | $16,572 | $18,796 |
| 7/31/2019 | $19,196 | $16,819 | $19,204 |
| 8/31/2019 | $18,905 | $16,476 | $19,012 |
| 9/30/2019 | $18,564 | $16,765 | $19,004 |
| 10/31/2019 | $18,859 | $17,126 | $19,540 |
| 11/30/2019 | $19,935 | $17,777 | $20,425 |
| 12/31/2019 | $20,142 | $18,290 | $21,031 |
| 1/31/2020 | $20,928 | $18,270 | $21,456 |
| 2/29/2020 | $19,428 | $16,774 | $19,989 |
| 3/31/2020 | $16,871 | $14,468 | $17,908 |
| 4/30/2020 | $19,983 | $16,384 | $20,558 |
| 5/31/2020 | $21,888 | $17,260 | $21,971 |
| 6/30/2020 | $22,720 | $17,655 | $22,921 |
| 7/31/2020 | $24,440 | $18,657 | $24,628 |
| 8/31/2020 | $26,262 | $20,009 | $27,108 |
| 9/30/2020 | $25,415 | $19,280 | $25,868 |
| 10/31/2020 | $25,240 | $18,864 | $25,050 |
| 11/30/2020 | $28,393 | $21,159 | $27,723 |
| 12/31/2020 | $30,050 | $22,111 | $29,078 |
| 1/31/2021 | $29,665 | $22,012 | $28,968 |
| 2/28/2021 | $30,723 | $22,700 | $29,028 |
| 3/31/2021 | $29,337 | $23,514 | $29,425 |
| 4/30/2021 | $31,366 | $24,726 | $31,334 |
| 5/31/2021 | $30,096 | $24,839 | $30,870 |
| 6/30/2021 | $32,458 | $25,452 | $32,773 |
| 7/31/2021 | $33,194 | $25,882 | $33,699 |
| 8/31/2021 | $34,194 | $26,620 | $34,918 |
| 9/30/2021 | $32,499 | $25,426 | $33,001 |
| 10/31/2021 | $34,447 | $27,145 | $35,775 |
| 11/30/2021 | $32,499 | $26,732 | $35,871 |
| 12/31/2021 | $32,337 | $27,785 | $36,595 |
| 1/31/2022 | $28,179 | $26,150 | $33,351 |
| 2/28/2022 | $27,365 | $25,491 | $32,021 |
| 3/31/2022 | $27,796 | $26,318 | $33,209 |
| 4/30/2022 | $23,842 | $23,956 | $29,195 |
| 5/31/2022 | $22,919 | $23,924 | $28,523 |
| 6/30/2022 | $21,120 | $21,923 | $26,292 |
| 7/31/2022 | $23,494 | $23,979 | $29,436 |
| 8/31/2022 | $22,358 | $23,084 | $28,129 |
| 9/30/2022 | $20,040 | $20,944 | $25,407 |
| 10/31/2022 | $20,648 | $22,661 | $26,948 |
| 11/30/2022 | $21,681 | $23,844 | $28,126 |
| 12/31/2022 | $20,363 | $22,448 | $25,995 |
| 1/31/2023 | $22,219 | $23,994 | $28,187 |
| 2/28/2023 | $21,923 | $23,433 | $27,854 |
| 3/31/2023 | $23,309 | $24,060 | $29,595 |
| 4/30/2023 | $23,374 | $24,316 | $29,850 |
| 5/31/2023 | $23,923 | $24,411 | $31,134 |
| 6/30/2023 | $25,584 | $26,078 | $33,286 |
| 7/31/2023 | $26,219 | $27,013 | $34,430 |
| 8/31/2023 | $25,425 | $26,491 | $34,044 |
| 9/30/2023 | $23,945 | $25,229 | $32,173 |
| 10/31/2023 | $23,439 | $24,560 | $31,615 |
| 11/30/2023 | $26,053 | $26,851 | $35,035 |
| 12/31/2023 | $27,243 | $28,275 | $36,707 |
| 1/31/2024 | $28,177 | $28,588 | $37,519 |
| 2/29/2024 | $30,722 | $30,136 | $40,102 |
| 3/31/2024 | $31,201 | $31,108 | $40,828 |
| 4/30/2024 | $29,661 | $29,739 | $39,028 |
| 5/31/2024 | $31,318 | $31,144 | $41,353 |
| 6/30/2024 | $33,125 | $32,108 | $44,010 |
| 7/31/2024 | $32,088 | $32,705 | $43,453 |
Annual Shareholder Report | July 31, 2024
AVERAGE ANNUAL TOTAL RETURNS (%)
| 1 Year | 5 Years | 10 Years |
|---|
| Administrator Class | 22.38 | 10.82 | 12.37 |
Russell 3000® Index | 21.07 | 14.23 | 12.58 |
Russell 3000® Growth Index | 26.20 | 17.74 | 15.82 |
| Total net assets | $3,744,930,781 |
| # of portfolio holdings | 74 |
| Portfolio turnover rate | 38% |
| Total advisory fees paid | $20,902,798 |
What did the Fund invest in?
(Based on long-term investments)
TOP TEN HOLDINGS (% OF NET ASSETS)
| Microsoft Corp. | 11.7 |
| NVIDIA Corp. | 9.8 |
| Amazon.com, Inc. | 8.5 |
| Apple, Inc. | 6.4 |
| Meta Platforms, Inc. Class A | 5.7 |
| Alphabet, Inc. Class A | 4.0 |
| Monolithic Power Systems, Inc. | 1.8 |
| Tradeweb Markets, Inc. Class A | 1.8 |
| Mastercard, Inc. Class A | 1.8 |
| Visa, Inc. Class A | 1.7 |
SECTOR ALLOCATION (% OF LONG-TERM INVESTMENTS)
| Information technology | 43.9 |
| Consumer discretionary | 17.2 |
| Communication services | 12.2 |
| Financials | 8.4 |
| Industrials | 8.2 |
| Health care | 6.7 |
| Materials | 2.4 |
| Consumer staples | 1.0 |
This is a summary of certain changes and planned changes to the Fund since August 1, 2023.
Effective May 31, 2024, Michael T. Smith, CFA and Christopher J. Warner, CFA were added as portfolio managers of the Fund and effective July 26, 2024, Thomas C. Ognar, CFA and David Nazaret were no longer portfolio managers of the Fund.
You can find additional information on the Fund's website at allspringglobal.com, including its:
- Prospectus - Financial Information - Fund holdings - Proxy voting information
Annual Shareholder Report
This annual shareholder report contains important information about Large Cap Core Fund for the period of August 1, 2023 to July 31, 2024. You can find additional information about the Fund at allspringglobal.com. You can also request this information by contacting us at 1-800-222-8222.
What were the Fund costs for the past year?
The table explains the costs you would have paid within the reporting period based on a hypothetical $10,000 investment.
| CLASS NAME | COST OF A $10,000 INVESTMENT | COSTS PAID AS A % OF A $10,000 INVESTMENT |
|---|
| Institutional Class | $74 | 0.67% |
The manager has contractually committed to waive fees and/or reimburse certain expenses to the extent necessary to cap the Fund's total annual fund operating expense ratio at a specific amount. Without this cap, the costs shown above may have been higher. Please see the prospectus for the amount and the expiration date of the cap. Prior to or after the commitment expiration date, the cap may be increased or the commitment to maintain the cap may be terminated only with the approval of the Board of Trustees.
How did the Fund perform last year and what affected its performance?
During the period, the Fund underperformed its benchmark, but the Fund’s investment strategy of systematically identifying undervalued companies with superior earnings fundamentals and positive momentum did not cause the Fund’s performance to materially deviate from the manager’s expectations. Characteristics that are typically favored in the portfolio include attractive valuation, earnings consistency, profitability, and improving sentiment. The manager’s quantitative alpha model results were positive during the period, with the value, quality, and momentum factor groups all exhibiting strength.
Bottom-up stock selection effects within consumer discretionary, financials, and health care contributed to relative performance. The Fund’s underweight to consumer staples and a lack of exposure to utilities also contributed to relative performance.
Negative stock selection effects within information technology (IT), energy, and materials detracted from relative performance. The Fund’s underweight to IT and an overweight to energy and health care also detracted from results.
Total return based on a $10,000 investment
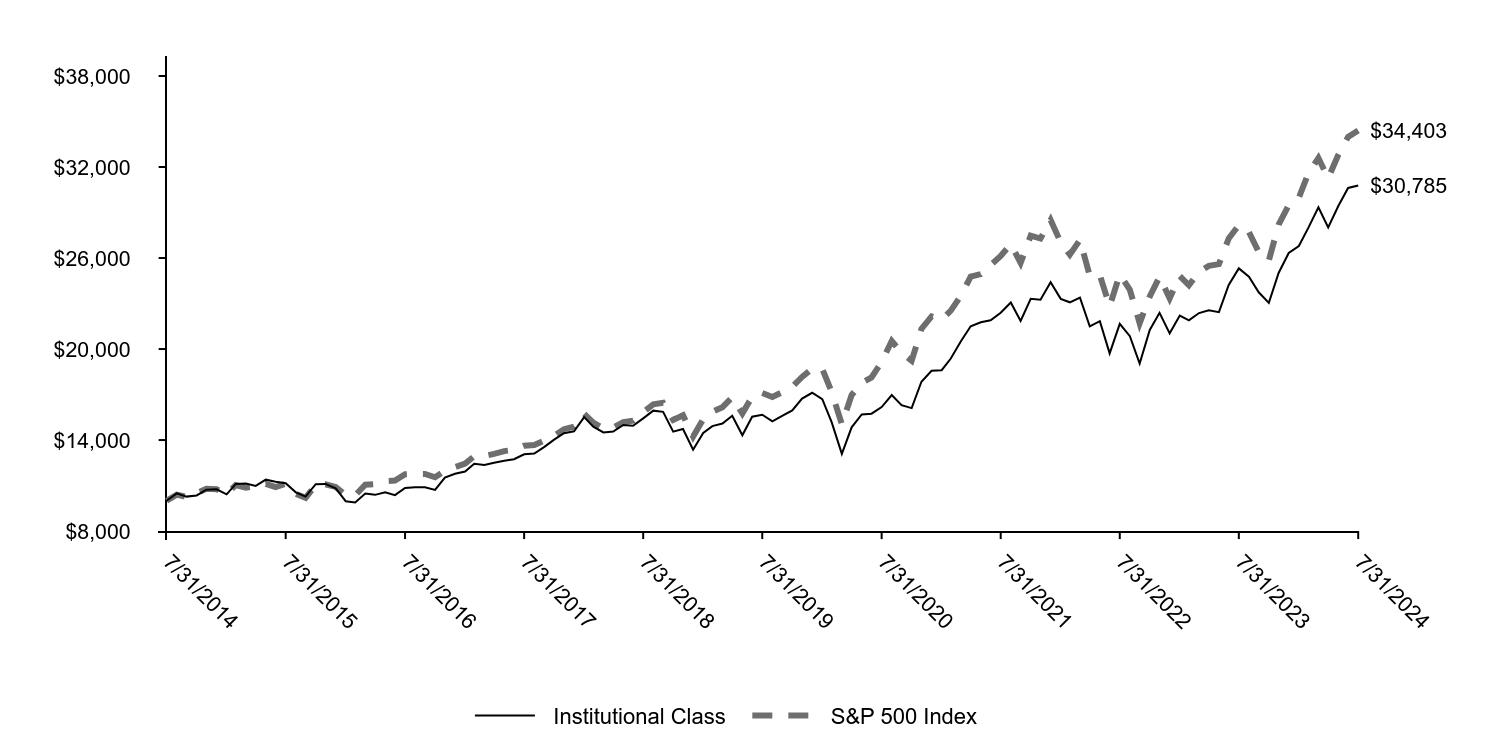
| Institutional Class | S&P 500 Index |
|---|
| 7/31/2014 | $10,000 | $10,000 |
| 8/31/2014 | $10,488 | $10,400 |
| 9/30/2014 | $10,272 | $10,254 |
| 10/31/2014 | $10,348 | $10,505 |
| 11/30/2014 | $10,725 | $10,787 |
| 12/31/2014 | $10,752 | $10,760 |
| 1/31/2015 | $10,422 | $10,437 |
| 2/28/2015 | $11,109 | $11,037 |
| 3/31/2015 | $11,137 | $10,862 |
| 4/30/2015 | $10,976 | $10,966 |
| 5/31/2015 | $11,389 | $11,108 |
| 6/30/2015 | $11,249 | $10,892 |
| 7/31/2015 | $11,151 | $11,121 |
| 8/31/2015 | $10,555 | $10,450 |
| 9/30/2015 | $10,275 | $10,191 |
| 10/31/2015 | $11,088 | $11,051 |
| 11/30/2015 | $11,109 | $11,084 |
| 12/31/2015 | $10,823 | $10,909 |
| 1/31/2016 | $9,968 | $10,368 |
| 2/29/2016 | $9,890 | $10,354 |
| 3/31/2016 | $10,481 | $11,056 |
| 4/30/2016 | $10,388 | $11,099 |
| 5/31/2016 | $10,552 | $11,298 |
| 6/30/2016 | $10,367 | $11,327 |
| 7/31/2016 | $10,844 | $11,745 |
| 8/31/2016 | $10,894 | $11,762 |
| 9/30/2016 | $10,894 | $11,764 |
| 10/31/2016 | $10,709 | $11,549 |
| 11/30/2016 | $11,528 | $11,977 |
| 12/31/2016 | $11,777 | $12,214 |
| 1/31/2017 | $11,928 | $12,445 |
| 2/28/2017 | $12,440 | $12,939 |
| 3/31/2017 | $12,353 | $12,955 |
| 4/30/2017 | $12,505 | $13,088 |
| 5/31/2017 | $12,642 | $13,272 |
| 6/30/2017 | $12,735 | $13,355 |
| 7/31/2017 | $13,060 | $13,629 |
| 8/31/2017 | $13,110 | $13,671 |
| 9/30/2017 | $13,535 | $13,953 |
| 10/31/2017 | $14,026 | $14,278 |
| 11/30/2017 | $14,451 | $14,716 |
| 12/31/2017 | $14,576 | $14,880 |
| 1/31/2018 | $15,512 | $15,732 |
| 2/28/2018 | $14,878 | $15,152 |
| 3/31/2018 | $14,503 | $14,767 |
| 4/30/2018 | $14,562 | $14,824 |
| 5/31/2018 | $14,996 | $15,181 |
| 6/30/2018 | $14,945 | $15,274 |
| 7/31/2018 | $15,431 | $15,843 |
| 8/31/2018 | $15,939 | $16,359 |
| 9/30/2018 | $15,858 | $16,452 |
| 10/31/2018 | $14,554 | $15,327 |
| 11/30/2018 | $14,731 | $15,640 |
| 12/31/2018 | $13,359 | $14,228 |
| 1/31/2019 | $14,465 | $15,368 |
| 2/28/2019 | $14,918 | $15,861 |
| 3/31/2019 | $15,094 | $16,169 |
| 4/30/2019 | $15,605 | $16,824 |
| 5/31/2019 | $14,314 | $15,755 |
| 6/30/2019 | $15,538 | $16,865 |
| 7/31/2019 | $15,672 | $17,108 |
| 8/31/2019 | $15,228 | $16,837 |
| 9/30/2019 | $15,597 | $17,152 |
| 10/31/2019 | $15,949 | $17,523 |
| 11/30/2019 | $16,736 | $18,159 |
| 12/31/2019 | $17,117 | $18,707 |
| 1/31/2020 | $16,698 | $18,700 |
| 2/29/2020 | $15,165 | $17,161 |
| 3/31/2020 | $13,091 | $15,041 |
| 4/30/2020 | $14,838 | $16,969 |
| 5/31/2020 | $15,687 | $17,778 |
| 6/30/2020 | $15,738 | $18,131 |
| 7/31/2020 | $16,177 | $19,153 |
| 8/31/2020 | $16,964 | $20,530 |
| 9/30/2020 | $16,300 | $19,750 |
| 10/31/2020 | $16,106 | $19,225 |
| 11/30/2020 | $17,843 | $21,329 |
| 12/31/2020 | $18,572 | $22,149 |
| 1/31/2021 | $18,608 | $21,926 |
| 2/28/2021 | $19,376 | $22,530 |
| 3/31/2021 | $20,512 | $23,517 |
| 4/30/2021 | $21,506 | $24,772 |
| 5/31/2021 | $21,766 | $24,945 |
| 6/30/2021 | $21,896 | $25,527 |
| 7/31/2021 | $22,393 | $26,134 |
| 8/31/2021 | $23,067 | $26,929 |
| 9/30/2021 | $21,849 | $25,676 |
| 10/31/2021 | $23,316 | $27,475 |
| 11/30/2021 | $23,256 | $27,285 |
| 12/31/2021 | $24,407 | $28,507 |
| 1/31/2022 | $23,311 | $27,032 |
| 2/28/2022 | $23,081 | $26,223 |
| 3/31/2022 | $23,392 | $27,196 |
| 4/30/2022 | $21,498 | $24,825 |
| 5/31/2022 | $21,836 | $24,870 |
| 6/30/2022 | $19,712 | $22,818 |
| 7/31/2022 | $21,660 | $24,921 |
| 8/31/2022 | $20,849 | $23,905 |
| 9/30/2022 | $19,049 | $21,703 |
| 10/31/2022 | $21,254 | $23,461 |
| 11/30/2022 | $22,391 | $24,772 |
| 12/31/2022 | $21,036 | $23,344 |
| 1/31/2023 | $22,206 | $24,811 |
| 2/28/2023 | $21,887 | $24,206 |
| 3/31/2023 | $22,373 | $25,095 |
| 4/30/2023 | $22,555 | $25,486 |
| 5/31/2023 | $22,433 | $25,597 |
| 6/30/2023 | $24,226 | $27,288 |
| 7/31/2023 | $25,319 | $28,165 |
| 8/31/2023 | $24,773 | $27,717 |
| 9/30/2023 | $23,740 | $26,395 |
| 10/31/2023 | $23,041 | $25,840 |
| 11/30/2023 | $25,016 | $28,200 |
| 12/31/2023 | $26,333 | $29,481 |
| 1/31/2024 | $26,796 | $29,977 |
| 2/29/2024 | $27,988 | $31,577 |
| 3/31/2024 | $29,345 | $32,593 |
| 4/30/2024 | $28,021 | $31,262 |
| 5/31/2024 | $29,428 | $32,812 |
| 6/30/2024 | $30,619 | $33,989 |
| 7/31/2024 | $30,785 | $34,403 |
Annual Shareholder Report | July 31, 2024
AVERAGE ANNUAL TOTAL RETURNS (%)
| 1 Year | 5 Years | 10 Years |
|---|
| Institutional Class | 21.59 | 14.46 | 11.90 |
| S&P 500 Index | 22.15 | 15.00 | 13.15 |
| Total net assets | $521,308,565 |
| # of portfolio holdings | 52 |
| Portfolio turnover rate | 31% |
| Total advisory fees paid | $2,691,968 |
What did the Fund invest in?
(Based on long-term investments)
TOP TEN HOLDINGS (% OF NET ASSETS)
| Microsoft Corp. | 5.6 |
| Apple, Inc. | 4.9 |
| Alphabet, Inc. Class C | 4.0 |
| Broadcom, Inc. | 2.7 |
| Amazon.com, Inc. | 2.6 |
| KLA Corp. | 2.4 |
| PulteGroup, Inc. | 2.4 |
| Intuitive Surgical, Inc. | 2.3 |
| First Citizens BancShares, Inc. Class A | 2.3 |
| Arista Networks, Inc. | 2.3 |
SECTOR ALLOCATION (% OF LONG-TERM INVESTMENTS)
| Information technology | 29.0 |
| Health care | 14.0 |
| Consumer discretionary | 11.0 |
| Financials | 10.1 |
| Industrials | 10.0 |
| Communication services | 7.8 |
| Energy | 6.4 |
| Consumer staples | 4.2 |
| Materials | 4.2 |
| Real estate | 3.3 |
You can find additional information on the Fund's website at allspringglobal.com, including its:
- Prospectus - Financial Information - Fund holdings - Proxy voting information
Annual Shareholder Report
This annual shareholder report contains important information about Large Cap Core Fund for the period of August 1, 2023 to July 31, 2024. You can find additional information about the Fund at allspringglobal.com. You can also request this information by contacting us at 1-800-222-8222.
What were the Fund costs for the past year?
The table explains the costs you would have paid within the reporting period based on a hypothetical $10,000 investment.
| CLASS NAME | COST OF A $10,000 INVESTMENT | COSTS PAID AS A % OF A $10,000 INVESTMENT |
|---|
| Class R6 | $72 | 0.65% |
The manager has contractually committed to waive fees and/or reimburse certain expenses to the extent necessary to cap the Fund's total annual fund operating expense ratio at a specific amount. Without this cap, the costs shown above may have been higher. Please see the prospectus for the amount and the expiration date of the cap. Prior to or after the commitment expiration date, the cap may be increased or the commitment to maintain the cap may be terminated only with the approval of the Board of Trustees.
How did the Fund perform last year and what affected its performance?
During the period, the Fund underperformed its benchmark, but the Fund’s investment strategy of systematically identifying undervalued companies with superior earnings fundamentals and positive momentum did not cause the Fund’s performance to materially deviate from the manager’s expectations. Characteristics that are typically favored in the portfolio include attractive valuation, earnings consistency, profitability, and improving sentiment. The manager’s quantitative alpha model results were positive during the period, with the value, quality, and momentum factor groups all exhibiting strength.
Bottom-up stock selection effects within consumer discretionary, financials, and health care contributed to relative performance. The Fund’s underweight to consumer staples and a lack of exposure to utilities also contributed to relative performance.
Negative stock selection effects within information technology (IT), energy, and materials detracted from relative performance. The Fund’s underweight to IT and an overweight to energy and health care also detracted from results.
Total return based on a $10,000 investment
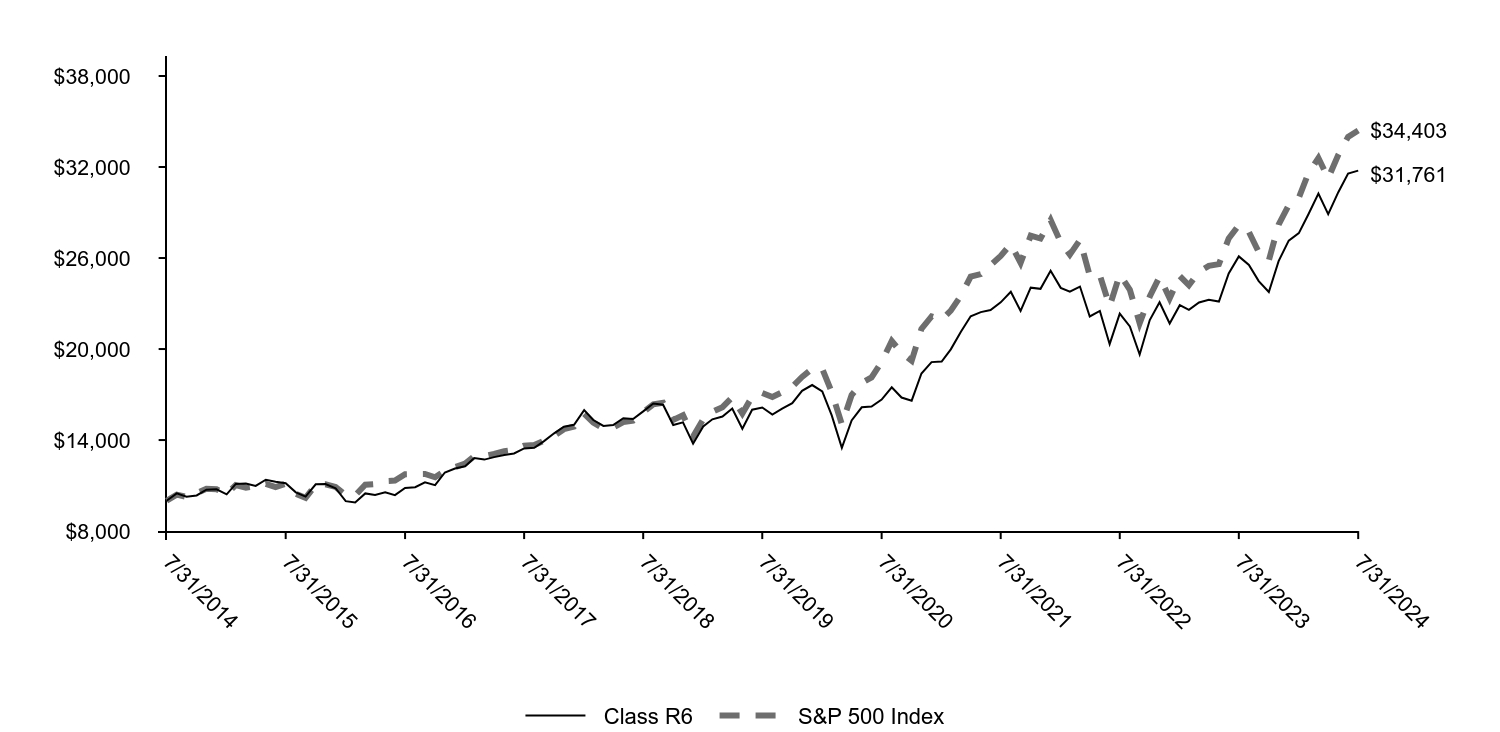
| Class R6 | S&P 500 Index |
|---|
| 7/31/2014 | $10,000 | $10,000 |
| 8/31/2014 | $10,488 | $10,400 |
| 9/30/2014 | $10,271 | $10,254 |
| 10/31/2014 | $10,348 | $10,505 |
| 11/30/2014 | $10,724 | $10,787 |
| 12/31/2014 | $10,751 | $10,760 |
| 1/31/2015 | $10,421 | $10,437 |
| 2/28/2015 | $11,108 | $11,037 |
| 3/31/2015 | $11,136 | $10,862 |
| 4/30/2015 | $10,974 | $10,966 |
| 5/31/2015 | $11,387 | $11,108 |
| 6/30/2015 | $11,247 | $10,892 |
| 7/31/2015 | $11,149 | $11,121 |
| 8/31/2015 | $10,553 | $10,450 |
| 9/30/2015 | $10,273 | $10,191 |
| 10/31/2015 | $11,085 | $11,051 |
| 11/30/2015 | $11,106 | $11,084 |
| 12/31/2015 | $10,824 | $10,909 |
| 1/31/2016 | $9,970 | $10,368 |
| 2/29/2016 | $9,884 | $10,354 |
| 3/31/2016 | $10,482 | $11,056 |
| 4/30/2016 | $10,382 | $11,099 |
| 5/31/2016 | $10,553 | $11,298 |
| 6/30/2016 | $10,368 | $11,327 |
| 7/31/2016 | $10,845 | $11,745 |
| 8/31/2016 | $10,895 | $11,762 |
| 9/30/2016 | $11,215 | $11,764 |
| 10/31/2016 | $11,023 | $11,549 |
| 11/30/2016 | $11,863 | $11,977 |
| 12/31/2016 | $12,125 | $12,214 |
| 1/31/2017 | $12,274 | $12,445 |
| 2/28/2017 | $12,809 | $12,939 |
| 3/31/2017 | $12,712 | $12,955 |
| 4/30/2017 | $12,876 | $13,088 |
| 5/31/2017 | $13,017 | $13,272 |
| 6/30/2017 | $13,114 | $13,355 |
| 7/31/2017 | $13,448 | $13,629 |
| 8/31/2017 | $13,493 | $13,671 |
| 9/30/2017 | $13,932 | $13,953 |
| 10/31/2017 | $14,445 | $14,278 |
| 11/30/2017 | $14,883 | $14,716 |
| 12/31/2017 | $15,009 | $14,880 |
| 1/31/2018 | $15,974 | $15,732 |
| 2/28/2018 | $15,321 | $15,152 |
| 3/31/2018 | $14,933 | $14,767 |
| 4/30/2018 | $14,994 | $14,824 |
| 5/31/2018 | $15,442 | $15,181 |
| 6/30/2018 | $15,389 | $15,274 |
| 7/31/2018 | $15,890 | $15,843 |
| 8/31/2018 | $16,415 | $16,359 |
| 9/30/2018 | $16,331 | $16,452 |
| 10/31/2018 | $14,994 | $15,327 |
| 11/30/2018 | $15,169 | $15,640 |
| 12/31/2018 | $13,760 | $14,228 |
| 1/31/2019 | $14,892 | $15,368 |
| 2/28/2019 | $15,367 | $15,861 |
| 3/31/2019 | $15,549 | $16,169 |
| 4/30/2019 | $16,076 | $16,824 |
| 5/31/2019 | $14,745 | $15,755 |
| 6/30/2019 | $15,998 | $16,865 |
| 7/31/2019 | $16,145 | $17,108 |
| 8/31/2019 | $15,679 | $16,837 |
| 9/30/2019 | $16,068 | $17,152 |
| 10/31/2019 | $16,431 | $17,523 |
| 11/30/2019 | $17,243 | $18,159 |
| 12/31/2019 | $17,627 | $18,707 |
| 1/31/2020 | $17,205 | $18,700 |
| 2/29/2020 | $15,624 | $17,161 |
| 3/31/2020 | $13,484 | $15,041 |
| 4/30/2020 | $15,297 | $16,969 |
| 5/31/2020 | $16,161 | $17,778 |
| 6/30/2020 | $16,214 | $18,131 |
| 7/31/2020 | $16,667 | $19,153 |
| 8/31/2020 | $17,479 | $20,530 |
| 9/30/2020 | $16,804 | $19,750 |
| 10/31/2020 | $16,594 | $19,225 |
| 11/30/2020 | $18,386 | $21,329 |
| 12/31/2020 | $19,138 | $22,149 |
| 1/31/2021 | $19,174 | $21,926 |
| 2/28/2021 | $19,980 | $22,530 |
| 3/31/2021 | $21,139 | $23,517 |
| 4/30/2021 | $22,165 | $24,772 |
| 5/31/2021 | $22,433 | $24,945 |
| 6/30/2021 | $22,567 | $25,527 |
| 7/31/2021 | $23,080 | $26,134 |
| 8/31/2021 | $23,776 | $26,929 |
| 9/30/2021 | $22,519 | $25,676 |
| 10/31/2021 | $24,044 | $27,475 |
| 11/30/2021 | $23,971 | $27,285 |
| 12/31/2021 | $25,166 | $28,507 |
| 1/31/2022 | $24,035 | $27,032 |
| 2/28/2022 | $23,783 | $26,223 |
| 3/31/2022 | $24,119 | $27,196 |
| 4/30/2022 | $22,149 | $24,825 |
| 5/31/2022 | $22,512 | $24,870 |
| 6/30/2022 | $20,320 | $22,818 |
| 7/31/2022 | $22,331 | $24,921 |
| 8/31/2022 | $21,493 | $23,905 |
| 9/30/2022 | $19,636 | $21,703 |
| 10/31/2022 | $21,912 | $23,461 |
| 11/30/2022 | $23,085 | $24,772 |
| 12/31/2022 | $21,687 | $23,344 |
| 1/31/2023 | $22,894 | $24,811 |
| 2/28/2023 | $22,580 | $24,206 |
| 3/31/2023 | $23,067 | $25,095 |
| 4/30/2023 | $23,255 | $25,486 |
| 5/31/2023 | $23,129 | $25,597 |
| 6/30/2023 | $24,980 | $27,288 |
| 7/31/2023 | $26,109 | $28,165 |
| 8/31/2023 | $25,544 | $27,717 |
| 9/30/2023 | $24,478 | $26,395 |
| 10/31/2023 | $23,757 | $25,840 |
| 11/30/2023 | $25,795 | $28,200 |
| 12/31/2023 | $27,145 | $29,481 |
| 1/31/2024 | $27,641 | $29,977 |
| 2/29/2024 | $28,872 | $31,577 |
| 3/31/2024 | $30,257 | $32,593 |
| 4/30/2024 | $28,889 | $31,262 |
| 5/31/2024 | $30,342 | $32,812 |
| 6/30/2024 | $31,573 | $33,989 |
| 7/31/2024 | $31,761 | $34,403 |
Annual Shareholder Report | July 31, 2024
AVERAGE ANNUAL TOTAL RETURNS (%)
| 1 Year | 5 Years | 10 Years |
|---|
Class R6Footnote Reference* | 21.65 | 14.49 | 12.25 |
| S&P 500 Index | 22.15 | 15.00 | 13.15 |
| Total net assets | $521,308,565 |
| # of portfolio holdings | 52 |
| Portfolio turnover rate | 31% |
| Total advisory fees paid | $2,691,968 |
| Footnote | Description |
Footnote* | Historical performance shown for the Class R6 shares prior to their inception on September 30, 2015 reflects the performance of the Institutional Class shares, and includes the higher expenses applicable to the Institutional Class shares. If these expenses had not been included, returns for the Class R6 shares would be higher. |
What did the Fund invest in?
(Based on long-term investments)
TOP TEN HOLDINGS (% OF NET ASSETS)
| Microsoft Corp. | 5.6 |
| Apple, Inc. | 4.9 |
| Alphabet, Inc. Class C | 4.0 |
| Broadcom, Inc. | 2.7 |
| Amazon.com, Inc. | 2.6 |
| KLA Corp. | 2.4 |
| PulteGroup, Inc. | 2.4 |
| Intuitive Surgical, Inc. | 2.3 |
| First Citizens BancShares, Inc. Class A | 2.3 |
| Arista Networks, Inc. | 2.3 |
SECTOR ALLOCATION (% OF LONG-TERM INVESTMENTS)
| Information technology | 29.0 |
| Health care | 14.0 |
| Consumer discretionary | 11.0 |
| Financials | 10.1 |
| Industrials | 10.0 |
| Communication services | 7.8 |
| Energy | 6.4 |
| Consumer staples | 4.2 |
| Materials | 4.2 |
| Real estate | 3.3 |
You can find additional information on the Fund's website at allspringglobal.com, including its:
- Prospectus - Financial Information - Fund holdings - Proxy voting information
Annual Shareholder Report
This annual shareholder report contains important information about Large Cap Core Fund for the period of August 1, 2023 to July 31, 2024. You can find additional information about the Fund at allspringglobal.com. You can also request this information by contacting us at 1-800-222-8222.
What were the Fund costs for the past year?
The table explains the costs you would have paid within the reporting period based on a hypothetical $10,000 investment.
| CLASS NAME | COST OF A $10,000 INVESTMENT | COSTS PAID AS A % OF A $10,000 INVESTMENT |
|---|
| Class C | $200 | 1.82% |
The manager has contractually committed to waive fees and/or reimburse certain expenses to the extent necessary to cap the Fund's total annual fund operating expense ratio at a specific amount. Without this cap, the costs shown above may have been higher. Please see the prospectus for the amount and the expiration date of the cap. Prior to or after the commitment expiration date, the cap may be increased or the commitment to maintain the cap may be terminated only with the approval of the Board of Trustees.
How did the Fund perform last year and what affected its performance?
During the period, the Fund underperformed its benchmark, but the Fund’s investment strategy of systematically identifying undervalued companies with superior earnings fundamentals and positive momentum did not cause the Fund’s performance to materially deviate from the manager’s expectations. Characteristics that are typically favored in the portfolio include attractive valuation, earnings consistency, profitability, and improving sentiment. The manager’s quantitative alpha model results were positive during the period, with the value, quality, and momentum factor groups all exhibiting strength.
Bottom-up stock selection effects within consumer discretionary, financials, and health care contributed to relative performance. The Fund’s underweight to consumer staples and a lack of exposure to utilities also contributed to relative performance.
Negative stock selection effects within information technology (IT), energy, and materials detracted from relative performance. The Fund’s underweight to IT and an overweight to energy and health care also detracted from results.
Total return based on a $10,000 investment
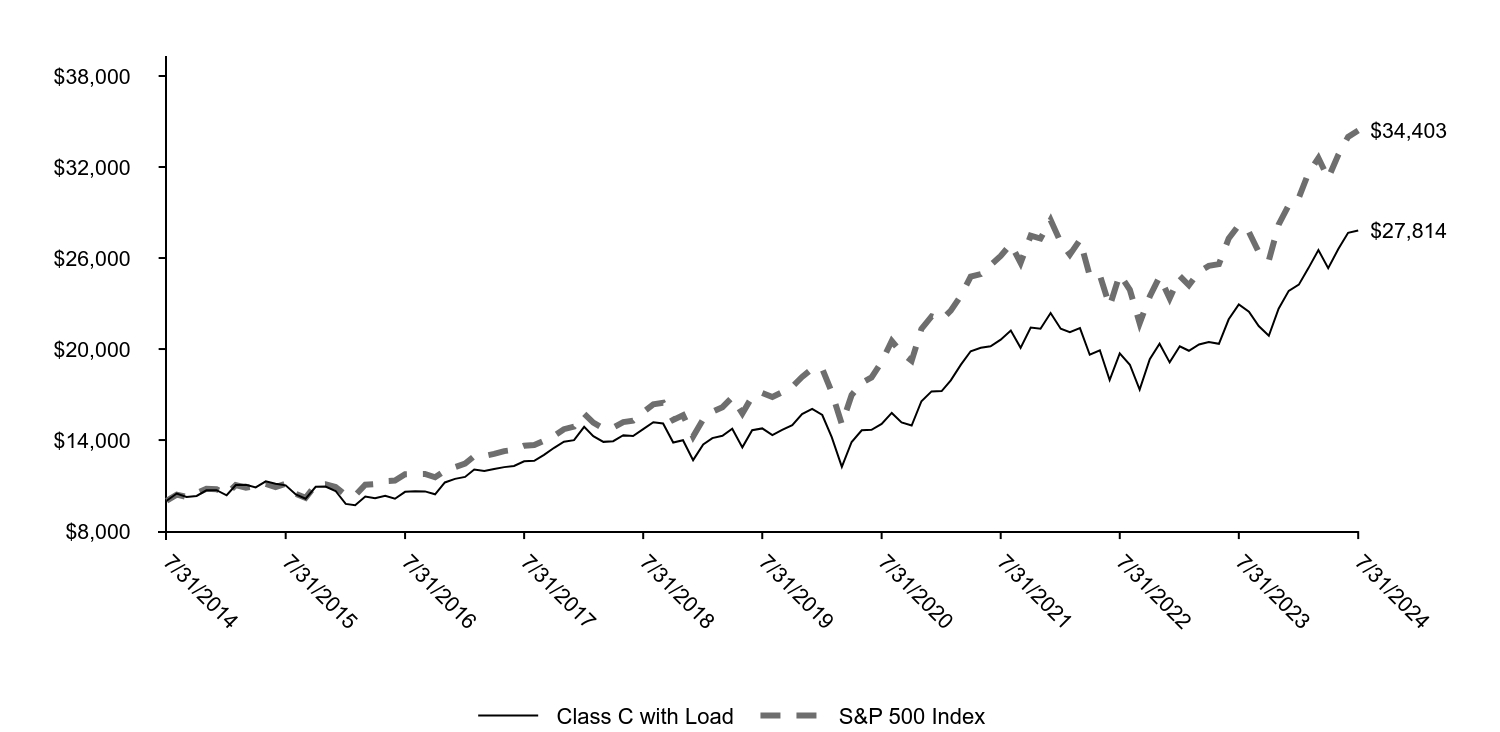
| Class C with Load | S&P 500 Index |
|---|
| 7/31/2014 | $10,000 | $10,000 |
| 8/31/2014 | $10,473 | $10,400 |
| 9/30/2014 | $10,254 | $10,254 |
| 10/31/2014 | $10,318 | $10,505 |
| 11/30/2014 | $10,685 | $10,787 |
| 12/31/2014 | $10,699 | $10,760 |
| 1/31/2015 | $10,360 | $10,437 |
| 2/28/2015 | $11,030 | $11,037 |
| 3/31/2015 | $11,052 | $10,862 |
| 4/30/2015 | $10,882 | $10,966 |
| 5/31/2015 | $11,277 | $11,108 |
| 6/30/2015 | $11,122 | $10,892 |
| 7/31/2015 | $11,016 | $11,121 |
| 8/31/2015 | $10,416 | $10,450 |
| 9/30/2015 | $10,134 | $10,191 |
| 10/31/2015 | $10,917 | $11,051 |
| 11/30/2015 | $10,932 | $11,084 |
| 12/31/2015 | $10,643 | $10,909 |
| 1/31/2016 | $9,789 | $10,368 |
| 2/29/2016 | $9,703 | $10,354 |
| 3/31/2016 | $10,273 | $11,056 |
| 4/30/2016 | $10,166 | $11,099 |
| 5/31/2016 | $10,323 | $11,298 |
| 6/30/2016 | $10,131 | $11,327 |
| 7/31/2016 | $10,586 | $11,745 |
| 8/31/2016 | $10,622 | $11,762 |
| 9/30/2016 | $10,615 | $11,764 |
| 10/31/2016 | $10,422 | $11,549 |
| 11/30/2016 | $11,206 | $11,977 |
| 12/31/2016 | $11,441 | $12,214 |
| 1/31/2017 | $11,569 | $12,445 |
| 2/28/2017 | $12,060 | $12,939 |
| 3/31/2017 | $11,960 | $12,955 |
| 4/30/2017 | $12,095 | $13,088 |
| 5/31/2017 | $12,216 | $13,272 |
| 6/30/2017 | $12,295 | $13,355 |
| 7/31/2017 | $12,601 | $13,629 |
| 8/31/2017 | $12,629 | $13,671 |
| 9/30/2017 | $13,028 | $13,953 |
| 10/31/2017 | $13,491 | $14,278 |
| 11/30/2017 | $13,890 | $14,716 |
| 12/31/2017 | $13,996 | $14,880 |
| 1/31/2018 | $14,874 | $15,732 |
| 2/28/2018 | $14,255 | $15,152 |
| 3/31/2018 | $13,881 | $14,767 |
| 4/30/2018 | $13,924 | $14,824 |
| 5/31/2018 | $14,320 | $15,181 |
| 6/30/2018 | $14,262 | $15,274 |
| 7/31/2018 | $14,716 | $15,843 |
| 8/31/2018 | $15,177 | $16,359 |
| 9/30/2018 | $15,090 | $16,452 |
| 10/31/2018 | $13,838 | $15,327 |
| 11/30/2018 | $13,989 | $15,640 |
| 12/31/2018 | $12,676 | $14,228 |
| 1/31/2019 | $13,705 | $15,368 |
| 2/28/2019 | $14,126 | $15,861 |
| 3/31/2019 | $14,280 | $16,169 |
| 4/30/2019 | $14,750 | $16,824 |
| 5/31/2019 | $13,519 | $15,755 |
| 6/30/2019 | $14,653 | $16,865 |
| 7/31/2019 | $14,767 | $17,108 |
| 8/31/2019 | $14,329 | $16,837 |
| 9/30/2019 | $14,669 | $17,152 |
| 10/31/2019 | $14,985 | $17,523 |
| 11/30/2019 | $15,707 | $18,159 |
| 12/31/2019 | $16,051 | $18,707 |
| 1/31/2020 | $15,651 | $18,700 |
| 2/29/2020 | $14,194 | $17,161 |
| 3/31/2020 | $12,239 | $15,041 |
| 4/30/2020 | $13,872 | $16,969 |
| 5/31/2020 | $14,644 | $17,778 |
| 6/30/2020 | $14,673 | $18,131 |
| 7/31/2020 | $15,064 | $19,153 |
| 8/31/2020 | $15,788 | $20,530 |
| 9/30/2020 | $15,162 | $19,750 |
| 10/31/2020 | $14,957 | $19,225 |
| 11/30/2020 | $16,560 | $21,329 |
| 12/31/2020 | $17,209 | $22,149 |
| 1/31/2021 | $17,232 | $21,926 |
| 2/28/2021 | $17,938 | $22,530 |
| 3/31/2021 | $18,970 | $23,517 |
| 4/30/2021 | $19,855 | $24,772 |
| 5/31/2021 | $20,080 | $24,945 |
| 6/30/2021 | $20,181 | $25,527 |
| 7/31/2021 | $20,618 | $26,134 |
| 8/31/2021 | $21,223 | $26,929 |
| 9/30/2021 | $20,080 | $25,676 |
| 10/31/2021 | $21,414 | $27,475 |
| 11/30/2021 | $21,335 | $27,285 |
| 12/31/2021 | $22,375 | $28,507 |
| 1/31/2022 | $21,338 | $27,032 |
| 2/28/2022 | $21,108 | $26,223 |
| 3/31/2022 | $21,377 | $27,196 |
| 4/30/2022 | $19,623 | $24,825 |
| 5/31/2022 | $19,917 | $24,870 |
| 6/30/2022 | $17,959 | $22,818 |
| 7/31/2022 | $19,713 | $24,921 |
| 8/31/2022 | $18,966 | $23,905 |
| 9/30/2022 | $17,325 | $21,703 |
| 10/31/2022 | $19,327 | $23,461 |
| 11/30/2022 | $20,347 | $24,772 |
| 12/31/2022 | $19,121 | $23,344 |
| 1/31/2023 | $20,179 | $24,811 |
| 2/28/2023 | $19,886 | $24,206 |
| 3/31/2023 | $20,304 | $25,095 |
| 4/30/2023 | $20,457 | $25,486 |
| 5/31/2023 | $20,346 | $25,597 |
| 6/30/2023 | $21,960 | $27,288 |
| 7/31/2023 | $22,948 | $28,165 |
| 8/31/2023 | $22,461 | $27,717 |
| 9/30/2023 | $21,515 | $26,395 |
| 10/31/2023 | $20,875 | $25,840 |
| 11/30/2023 | $22,656 | $28,200 |
| 12/31/2023 | $23,836 | $29,481 |
| 1/31/2024 | $24,245 | $29,977 |
| 2/29/2024 | $25,318 | $31,577 |
| 3/31/2024 | $26,528 | $32,593 |
| 4/30/2024 | $25,334 | $31,262 |
| 5/31/2024 | $26,589 | $32,812 |
| 6/30/2024 | $27,663 | $33,989 |
| 7/31/2024 | $27,814 | $34,403 |
Annual Shareholder Report | July 31, 2024
AVERAGE ANNUAL TOTAL RETURNS (%)
| 1 Year | 5 Years | 10 Years |
|---|
| Class C | 20.28 | 13.16 | 10.77 |
| Class C with Load | 19.28 | 13.16 | 10.77 |
| S&P 500 Index | 22.15 | 15.00 | 13.15 |
| Total net assets | $521,308,565 |
| # of portfolio holdings | 52 |
| Portfolio turnover rate | 31% |
| Total advisory fees paid | $2,691,968 |
What did the Fund invest in?
(Based on long-term investments)
TOP TEN HOLDINGS (% OF NET ASSETS)
| Microsoft Corp. | 5.6 |
| Apple, Inc. | 4.9 |
| Alphabet, Inc. Class C | 4.0 |
| Broadcom, Inc. | 2.7 |
| Amazon.com, Inc. | 2.6 |
| KLA Corp. | 2.4 |
| PulteGroup, Inc. | 2.4 |
| Intuitive Surgical, Inc. | 2.3 |
| First Citizens BancShares, Inc. Class A | 2.3 |
| Arista Networks, Inc. | 2.3 |
SECTOR ALLOCATION (% OF LONG-TERM INVESTMENTS)
| Information technology | 29.0 |
| Health care | 14.0 |
| Consumer discretionary | 11.0 |
| Financials | 10.1 |
| Industrials | 10.0 |
| Communication services | 7.8 |
| Energy | 6.4 |
| Consumer staples | 4.2 |
| Materials | 4.2 |
| Real estate | 3.3 |
You can find additional information on the Fund's website at allspringglobal.com, including its:
- Prospectus - Financial Information - Fund holdings - Proxy voting information
Annual Shareholder Report
This annual shareholder report contains important information about Large Cap Core Fund for the period of August 1, 2023 to July 31, 2024. You can find additional information about the Fund at allspringglobal.com. You can also request this information by contacting us at 1-800-222-8222.
What were the Fund costs for the past year?
The table explains the costs you would have paid within the reporting period based on a hypothetical $10,000 investment.
| CLASS NAME | COST OF A $10,000 INVESTMENT | COSTS PAID AS A % OF A $10,000 INVESTMENT |
|---|
| Class A | $115 | 1.04% |
The manager has contractually committed to waive fees and/or reimburse certain expenses to the extent necessary to cap the Fund's total annual fund operating expense ratio at a specific amount. Without this cap, the costs shown above may have been higher. Please see the prospectus for the amount and the expiration date of the cap. Prior to or after the commitment expiration date, the cap may be increased or the commitment to maintain the cap may be terminated only with the approval of the Board of Trustees.
How did the Fund perform last year and what affected its performance?
During the period, the Fund underperformed its benchmark, but the Fund’s investment strategy of systematically identifying undervalued companies with superior earnings fundamentals and positive momentum did not cause the Fund’s performance to materially deviate from the manager’s expectations. Characteristics that are typically favored in the portfolio include attractive valuation, earnings consistency, profitability, and improving sentiment. The manager’s quantitative alpha model results were positive during the period, with the value, quality, and momentum factor groups all exhibiting strength.
Bottom-up stock selection effects within consumer discretionary, financials, and health care contributed to relative performance. The Fund’s underweight to consumer staples and a lack of exposure to utilities also contributed to relative performance.
Negative stock selection effects within information technology (IT), energy, and materials detracted from relative performance. The Fund’s underweight to IT and an overweight to energy and health care also detracted from results.
Total return based on a $10,000 investment
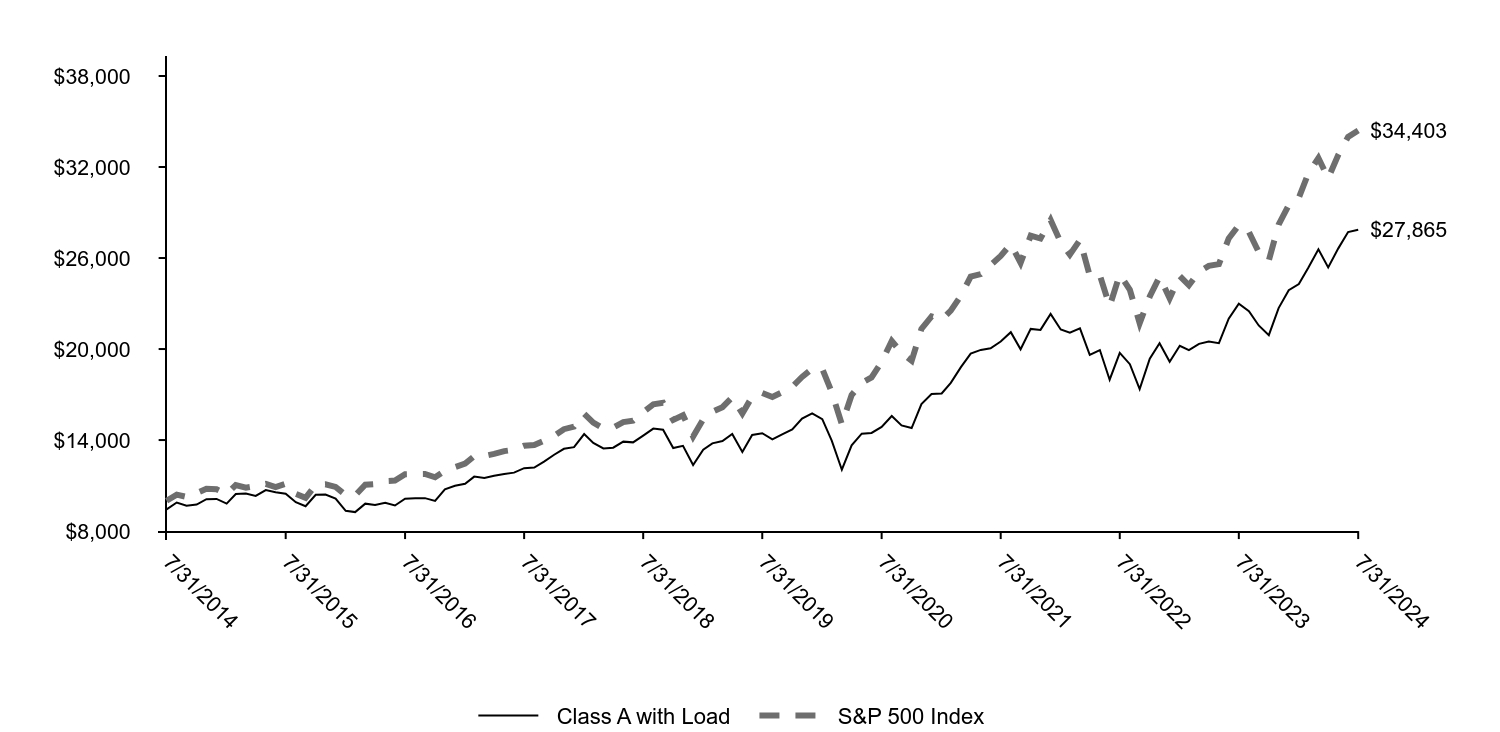
| Class A with Load | S&P 500 Index |
|---|
| 7/31/2014 | $9,426 | $10,000 |
| 8/31/2014 | $9,881 | $10,400 |
| 9/30/2014 | $9,677 | $10,254 |
| 10/31/2014 | $9,749 | $10,505 |
| 11/30/2014 | $10,099 | $10,787 |
| 12/31/2014 | $10,118 | $10,760 |
| 1/31/2015 | $9,807 | $10,437 |
| 2/28/2015 | $10,443 | $11,037 |
| 3/31/2015 | $10,469 | $10,862 |
| 4/30/2015 | $10,317 | $10,966 |
| 5/31/2015 | $10,701 | $11,108 |
| 6/30/2015 | $10,562 | $10,892 |
| 7/31/2015 | $10,463 | $11,121 |
| 8/31/2015 | $9,900 | $10,450 |
| 9/30/2015 | $9,635 | $10,191 |
| 10/31/2015 | $10,390 | $11,051 |
| 11/30/2015 | $10,410 | $11,084 |
| 12/31/2015 | $10,136 | $10,909 |
| 1/31/2016 | $9,333 | $10,368 |
| 2/29/2016 | $9,252 | $10,354 |
| 3/31/2016 | $9,808 | $11,056 |
| 4/30/2016 | $9,714 | $11,099 |
| 5/31/2016 | $9,868 | $11,298 |
| 6/30/2016 | $9,688 | $11,327 |
| 7/31/2016 | $10,129 | $11,745 |
| 8/31/2016 | $10,170 | $11,762 |
| 9/30/2016 | $10,170 | $11,764 |
| 10/31/2016 | $9,989 | $11,549 |
| 11/30/2016 | $10,752 | $11,977 |
| 12/31/2016 | $10,982 | $12,214 |
| 1/31/2017 | $11,117 | $12,445 |
| 2/28/2017 | $11,589 | $12,939 |
| 3/31/2017 | $11,501 | $12,955 |
| 4/30/2017 | $11,643 | $13,088 |
| 5/31/2017 | $11,765 | $13,272 |
| 6/30/2017 | $11,852 | $13,355 |
| 7/31/2017 | $12,149 | $13,629 |
| 8/31/2017 | $12,190 | $13,671 |
| 9/30/2017 | $12,581 | $13,953 |
| 10/31/2017 | $13,033 | $14,278 |
| 11/30/2017 | $13,424 | $14,716 |
| 12/31/2017 | $13,533 | $14,880 |
| 1/31/2018 | $14,398 | $15,732 |
| 2/28/2018 | $13,807 | $15,152 |
| 3/31/2018 | $13,450 | $14,767 |
| 4/30/2018 | $13,498 | $14,824 |
| 5/31/2018 | $13,896 | $15,181 |
| 6/30/2018 | $13,848 | $15,274 |
| 7/31/2018 | $14,295 | $15,843 |
| 8/31/2018 | $14,755 | $16,359 |
| 9/30/2018 | $14,679 | $16,452 |
| 10/31/2018 | $13,471 | $15,327 |
| 11/30/2018 | $13,622 | $15,640 |
| 12/31/2018 | $12,351 | $14,228 |
| 1/31/2019 | $13,371 | $15,368 |
| 2/28/2019 | $13,783 | $15,861 |
| 3/31/2019 | $13,939 | $16,169 |
| 4/30/2019 | $14,406 | $16,824 |
| 5/31/2019 | $13,215 | $15,755 |
| 6/30/2019 | $14,336 | $16,865 |
| 7/31/2019 | $14,452 | $17,108 |
| 8/31/2019 | $14,040 | $16,837 |
| 9/30/2019 | $14,375 | $17,152 |
| 10/31/2019 | $14,702 | $17,523 |
| 11/30/2019 | $15,418 | $18,159 |
| 12/31/2019 | $15,764 | $18,707 |
| 1/31/2020 | $15,376 | $18,700 |
| 2/29/2020 | $13,957 | $17,161 |
| 3/31/2020 | $12,045 | $15,041 |
| 4/30/2020 | $13,654 | $16,969 |
| 5/31/2020 | $14,420 | $17,778 |
| 6/30/2020 | $14,468 | $18,131 |
| 7/31/2020 | $14,865 | $19,153 |
| 8/31/2020 | $15,584 | $20,530 |
| 9/30/2020 | $14,969 | $19,750 |
| 10/31/2020 | $14,790 | $19,225 |
| 11/30/2020 | $16,370 | $21,329 |
| 12/31/2020 | $17,037 | $22,149 |
| 1/31/2021 | $17,070 | $21,926 |
| 2/28/2021 | $17,769 | $22,530 |
| 3/31/2021 | $18,806 | $23,517 |
| 4/30/2021 | $19,702 | $24,772 |
| 5/31/2021 | $19,942 | $24,945 |
| 6/30/2021 | $20,051 | $25,527 |
| 7/31/2021 | $20,499 | $26,134 |
| 8/31/2021 | $21,110 | $26,929 |
| 9/30/2021 | $19,986 | $25,676 |
| 10/31/2021 | $21,329 | $27,475 |
| 11/30/2021 | $21,263 | $27,285 |
| 12/31/2021 | $22,315 | $28,507 |
| 1/31/2022 | $21,293 | $27,032 |
| 2/28/2022 | $21,082 | $26,223 |
| 3/31/2022 | $21,368 | $27,196 |
| 4/30/2022 | $19,611 | $24,825 |
| 5/31/2022 | $19,935 | $24,870 |
| 6/30/2022 | $17,979 | $22,818 |
| 7/31/2022 | $19,748 | $24,921 |
| 8/31/2022 | $19,001 | $23,905 |
| 9/30/2022 | $17,356 | $21,703 |
| 10/31/2022 | $19,362 | $23,461 |
| 11/30/2022 | $20,384 | $24,772 |
| 12/31/2022 | $19,156 | $23,344 |
| 1/31/2023 | $20,216 | $24,811 |
| 2/28/2023 | $19,923 | $24,206 |
| 3/31/2023 | $20,341 | $25,095 |
| 4/30/2023 | $20,494 | $25,486 |
| 5/31/2023 | $20,383 | $25,597 |
| 6/30/2023 | $22,000 | $27,288 |
| 7/31/2023 | $22,990 | $28,165 |
| 8/31/2023 | $22,502 | $27,717 |
| 9/30/2023 | $21,554 | $26,395 |
| 10/31/2023 | $20,913 | $25,840 |
| 11/30/2023 | $22,697 | $28,200 |
| 12/31/2023 | $23,880 | $29,481 |
| 1/31/2024 | $24,289 | $29,977 |
| 2/29/2024 | $25,365 | $31,577 |
| 3/31/2024 | $26,577 | $32,593 |
| 4/30/2024 | $25,380 | $31,262 |
| 5/31/2024 | $26,637 | $32,812 |
| 6/30/2024 | $27,713 | $33,989 |
| 7/31/2024 | $27,865 | $34,403 |
Annual Shareholder Report | July 31, 2024
AVERAGE ANNUAL TOTAL RETURNS (%)
| 1 Year | 5 Years | 10 Years |
|---|
| Class A | 21.20 | 14.03 | 11.45 |
| Class A with Load | 14.21 | 12.69 | 10.79 |
| S&P 500 Index | 22.15 | 15.00 | 13.15 |
| Total net assets | $521,308,565 |
| # of portfolio holdings | 52 |
| Portfolio turnover rate | 31% |
| Total advisory fees paid | $2,691,968 |
What did the Fund invest in?
(Based on long-term investments)
TOP TEN HOLDINGS (% OF NET ASSETS)
| Microsoft Corp. | 5.6 |
| Apple, Inc. | 4.9 |
| Alphabet, Inc. Class C | 4.0 |
| Broadcom, Inc. | 2.7 |
| Amazon.com, Inc. | 2.6 |
| KLA Corp. | 2.4 |
| PulteGroup, Inc. | 2.4 |
| Intuitive Surgical, Inc. | 2.3 |
| First Citizens BancShares, Inc. Class A | 2.3 |
| Arista Networks, Inc. | 2.3 |
SECTOR ALLOCATION (% OF LONG-TERM INVESTMENTS)
| Information technology | 29.0 |
| Health care | 14.0 |
| Consumer discretionary | 11.0 |
| Financials | 10.1 |
| Industrials | 10.0 |
| Communication services | 7.8 |
| Energy | 6.4 |
| Consumer staples | 4.2 |
| Materials | 4.2 |
| Real estate | 3.3 |
You can find additional information on the Fund's website at allspringglobal.com, including its:
- Prospectus - Financial Information - Fund holdings - Proxy voting information
Annual Shareholder Report
This annual shareholder report contains important information about Large Cap Core Fund for the period of August 1, 2023 to July 31, 2024. You can find additional information about the Fund at allspringglobal.com. You can also request this information by contacting us at 1-800-222-8222.
What were the Fund costs for the past year?
The table explains the costs you would have paid within the reporting period based on a hypothetical $10,000 investment.
| CLASS NAME | COST OF A $10,000 INVESTMENT | COSTS PAID AS A % OF A $10,000 INVESTMENT |
|---|
| Administrator Class | $107 | 0.97% |
The manager has contractually committed to waive fees and/or reimburse certain expenses to the extent necessary to cap the Fund's total annual fund operating expense ratio at a specific amount. Without this cap, the costs shown above may have been higher. Please see the prospectus for the amount and the expiration date of the cap. Prior to or after the commitment expiration date, the cap may be increased or the commitment to maintain the cap may be terminated only with the approval of the Board of Trustees.
How did the Fund perform last year and what affected its performance?
During the period, the Fund underperformed its benchmark, but the Fund’s investment strategy of systematically identifying undervalued companies with superior earnings fundamentals and positive momentum did not cause the Fund’s performance to materially deviate from the manager’s expectations. Characteristics that are typically favored in the portfolio include attractive valuation, earnings consistency, profitability, and improving sentiment. The manager’s quantitative alpha model results were positive during the period, with the value, quality, and momentum factor groups all exhibiting strength.
Bottom-up stock selection effects within consumer discretionary, financials, and health care contributed to relative performance. The Fund’s underweight to consumer staples and a lack of exposure to utilities also contributed to relative performance.
Negative stock selection effects within information technology (IT), energy, and materials detracted from relative performance. The Fund’s underweight to IT and an overweight to energy and health care also detracted from results.
Total return based on a $10,000 investment
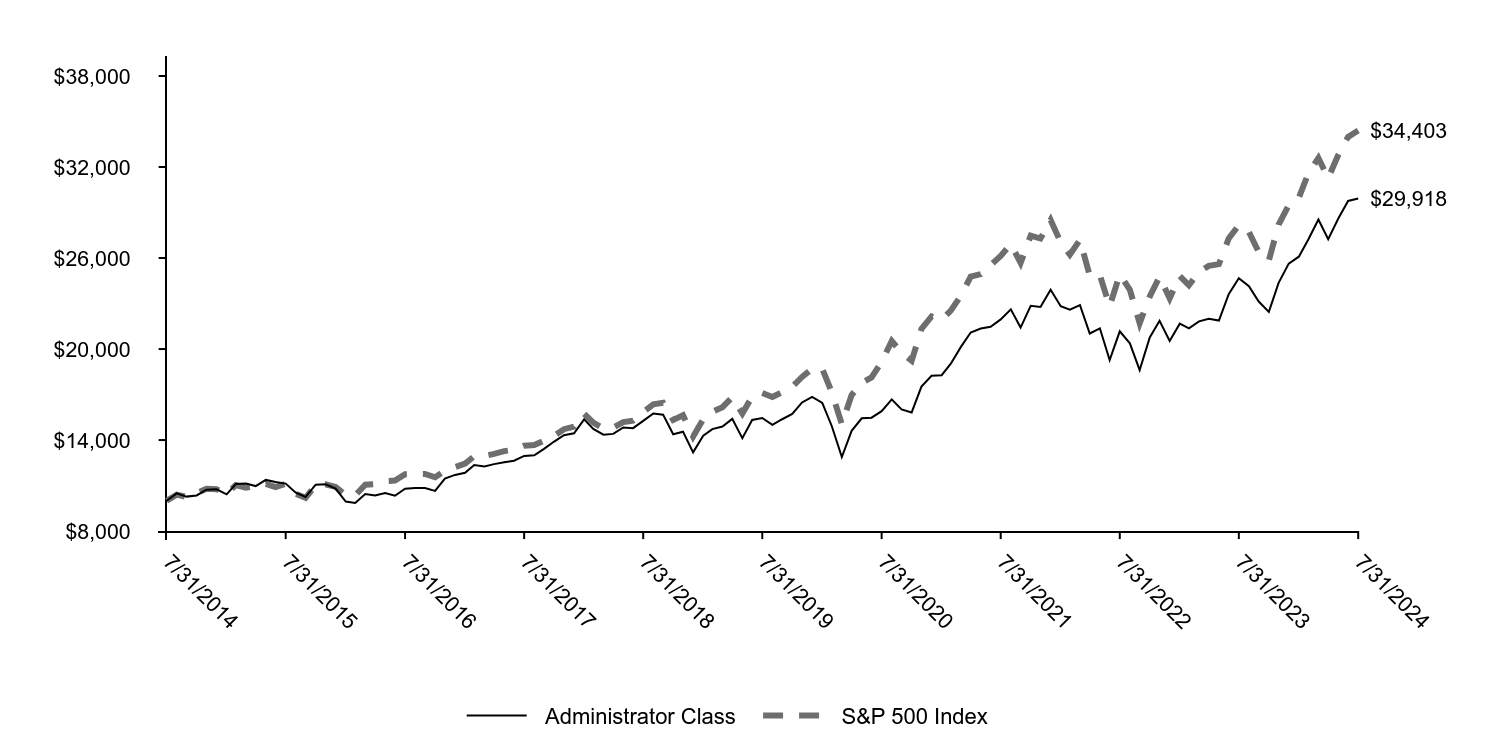
| Administrator Class | S&P 500 Index |
|---|
| 7/31/2014 | $10,000 | $10,000 |
| 8/31/2014 | $10,488 | $10,400 |
| 9/30/2014 | $10,272 | $10,254 |
| 10/31/2014 | $10,349 | $10,505 |
| 11/30/2014 | $10,726 | $10,787 |
| 12/31/2014 | $10,749 | $10,760 |
| 1/31/2015 | $10,420 | $10,437 |
| 2/28/2015 | $11,100 | $11,037 |
| 3/31/2015 | $11,128 | $10,862 |
| 4/30/2015 | $10,967 | $10,966 |
| 5/31/2015 | $11,373 | $11,108 |
| 6/30/2015 | $11,233 | $10,892 |
| 7/31/2015 | $11,128 | $11,121 |
| 8/31/2015 | $10,532 | $10,450 |
| 9/30/2015 | $10,251 | $10,191 |
| 10/31/2015 | $11,058 | $11,051 |
| 11/30/2015 | $11,079 | $11,084 |
| 12/31/2015 | $10,797 | $10,909 |
| 1/31/2016 | $9,943 | $10,368 |
| 2/29/2016 | $9,858 | $10,354 |
| 3/31/2016 | $10,441 | $11,056 |
| 4/30/2016 | $10,349 | $11,099 |
| 5/31/2016 | $10,512 | $11,298 |
| 6/30/2016 | $10,327 | $11,327 |
| 7/31/2016 | $10,797 | $11,745 |
| 8/31/2016 | $10,839 | $11,762 |
| 9/30/2016 | $10,839 | $11,764 |
| 10/31/2016 | $10,647 | $11,549 |
| 11/30/2016 | $11,458 | $11,977 |
| 12/31/2016 | $11,703 | $12,214 |
| 1/31/2017 | $11,845 | $12,445 |
| 2/28/2017 | $12,357 | $12,939 |
| 3/31/2017 | $12,265 | $12,955 |
| 4/30/2017 | $12,414 | $13,088 |
| 5/31/2017 | $12,542 | $13,272 |
| 6/30/2017 | $12,635 | $13,355 |
| 7/31/2017 | $12,955 | $13,629 |
| 8/31/2017 | $12,998 | $13,671 |
| 9/30/2017 | $13,417 | $13,953 |
| 10/31/2017 | $13,901 | $14,278 |
| 11/30/2017 | $14,321 | $14,716 |
| 12/31/2017 | $14,443 | $14,880 |
| 1/31/2018 | $15,364 | $15,732 |
| 2/28/2018 | $14,733 | $15,152 |
| 3/31/2018 | $14,356 | $14,767 |
| 4/30/2018 | $14,407 | $14,824 |
| 5/31/2018 | $14,834 | $15,181 |
| 6/30/2018 | $14,784 | $15,274 |
| 7/31/2018 | $15,262 | $15,843 |
| 8/31/2018 | $15,755 | $16,359 |
| 9/30/2018 | $15,676 | $16,452 |
| 10/31/2018 | $14,385 | $15,327 |
| 11/30/2018 | $14,552 | $15,640 |
| 12/31/2018 | $13,188 | $14,228 |
| 1/31/2019 | $14,280 | $15,368 |
| 2/28/2019 | $14,724 | $15,861 |
| 3/31/2019 | $14,896 | $16,169 |
| 4/30/2019 | $15,397 | $16,824 |
| 5/31/2019 | $14,124 | $15,755 |
| 6/30/2019 | $15,323 | $16,865 |
| 7/31/2019 | $15,455 | $17,108 |
| 8/31/2019 | $15,003 | $16,837 |
| 9/30/2019 | $15,372 | $17,152 |
| 10/31/2019 | $15,717 | $17,523 |
| 11/30/2019 | $16,481 | $18,159 |
| 12/31/2019 | $16,850 | $18,707 |
| 1/31/2020 | $16,451 | $18,700 |
| 2/29/2020 | $14,927 | $17,161 |
| 3/31/2020 | $12,884 | $15,041 |
| 4/30/2020 | $14,608 | $16,969 |
| 5/31/2020 | $15,435 | $17,778 |
| 6/30/2020 | $15,475 | $18,131 |
| 7/31/2020 | $15,903 | $19,153 |
| 8/31/2020 | $16,680 | $20,530 |
| 9/30/2020 | $16,023 | $19,750 |
| 10/31/2020 | $15,823 | $19,225 |
| 11/30/2020 | $17,527 | $21,329 |
| 12/31/2020 | $18,241 | $22,149 |
| 1/31/2021 | $18,275 | $21,926 |
| 2/28/2021 | $19,031 | $22,530 |
| 3/31/2021 | $20,143 | $23,517 |
| 4/30/2021 | $21,094 | $24,772 |
| 5/31/2021 | $21,357 | $24,945 |
| 6/30/2021 | $21,472 | $25,527 |
| 7/31/2021 | $21,953 | $26,134 |
| 8/31/2021 | $22,618 | $26,929 |
| 9/30/2021 | $21,415 | $25,676 |
| 10/31/2021 | $22,847 | $27,475 |
| 11/30/2021 | $22,778 | $27,285 |
| 12/31/2021 | $23,911 | $28,507 |
| 1/31/2022 | $22,827 | $27,032 |
| 2/28/2022 | $22,592 | $26,223 |
| 3/31/2022 | $22,893 | $27,196 |
| 4/30/2022 | $21,026 | $24,825 |
| 5/31/2022 | $21,366 | $24,870 |
| 6/30/2022 | $19,277 | $22,818 |
| 7/31/2022 | $21,170 | $24,921 |
| 8/31/2022 | $20,374 | $23,905 |
| 9/30/2022 | $18,612 | $21,703 |
| 10/31/2022 | $20,765 | $23,461 |
| 11/30/2022 | $21,862 | $24,772 |
| 12/31/2022 | $20,538 | $23,344 |
| 1/31/2023 | $21,676 | $24,811 |
| 2/28/2023 | $21,369 | $24,206 |
| 3/31/2023 | $21,822 | $25,095 |
| 4/30/2023 | $21,997 | $25,486 |
| 5/31/2023 | $21,880 | $25,597 |
| 6/30/2023 | $23,616 | $27,288 |
| 7/31/2023 | $24,666 | $28,165 |
| 8/31/2023 | $24,141 | $27,717 |
| 9/30/2023 | $23,134 | $26,395 |
| 10/31/2023 | $22,449 | $25,840 |
| 11/30/2023 | $24,360 | $28,200 |
| 12/31/2023 | $25,629 | $29,481 |
| 1/31/2024 | $26,088 | $29,977 |
| 2/29/2024 | $27,227 | $31,577 |
| 3/31/2024 | $28,541 | $32,593 |
| 4/30/2024 | $27,243 | $31,262 |
| 5/31/2024 | $28,605 | $32,812 |
| 6/30/2024 | $29,760 | $33,989 |
| 7/31/2024 | $29,918 | $34,403 |
Annual Shareholder Report | July 31, 2024
AVERAGE ANNUAL TOTAL RETURNS (%)
| 1 Year | 5 Years | 10 Years |
|---|
| Administrator Class | 21.29 | 14.12 | 11.58 |
| S&P 500 Index | 22.15 | 15.00 | 13.15 |
| Total net assets | $521,308,565 |
| # of portfolio holdings | 52 |
| Portfolio turnover rate | 31% |
| Total advisory fees paid | $2,691,968 |
What did the Fund invest in?
(Based on long-term investments)
TOP TEN HOLDINGS (% OF NET ASSETS)
| Microsoft Corp. | 5.6 |
| Apple, Inc. | 4.9 |
| Alphabet, Inc. Class C | 4.0 |
| Broadcom, Inc. | 2.7 |
| Amazon.com, Inc. | 2.6 |
| KLA Corp. | 2.4 |
| PulteGroup, Inc. | 2.4 |
| Intuitive Surgical, Inc. | 2.3 |
| First Citizens BancShares, Inc. Class A | 2.3 |
| Arista Networks, Inc. | 2.3 |
SECTOR ALLOCATION (% OF LONG-TERM INVESTMENTS)
| Information technology | 29.0 |
| Health care | 14.0 |
| Consumer discretionary | 11.0 |
| Financials | 10.1 |
| Industrials | 10.0 |
| Communication services | 7.8 |
| Energy | 6.4 |
| Consumer staples | 4.2 |
| Materials | 4.2 |
| Real estate | 3.3 |
You can find additional information on the Fund's website at allspringglobal.com, including its:
- Prospectus - Financial Information - Fund holdings - Proxy voting information
Annual Shareholder Report
This annual shareholder report contains important information about Large Cap Growth Fund for the period of August 1, 2023 to July 31, 2024. You can find additional information about the Fund at allspringglobal.com. You can also request this information by contacting us at 1-800-222-8222.
This report describes changes to the Fund that occurred during the reporting period.
What were the Fund costs for the past year?
The table explains the costs you would have paid within the reporting period based on a hypothetical $10,000 investment.
| CLASS NAME | COST OF A $10,000 INVESTMENT | COSTS PAID AS A % OF A $10,000 INVESTMENT |
|---|
| Institutional Class | $85 | 0.74% |
The manager has contractually committed to waive fees and/or reimburse certain expenses to the extent necessary to cap the Fund's total annual fund operating expense ratio at a specific amount. Without this cap, the costs shown above may have been higher. Please see the prospectus for the amount and the expiration date of the cap. Prior to or after the commitment expiration date, the cap may be increased or the commitment to maintain the cap may be terminated only with the approval of the Board of Trustees.
How did the Fund perform last year and what affected its performance?
Positive earnings surprises fueled a bull market for large-cap U.S. equities during the 12-month period that ended on July 31, 2024. Companies connected to artificial intelligence (AI) saw their valuations soar. The “Magnificent 7” stocks substantially outperformed the rest of the U.S. equity universe. Inflation concerns and policy uncertainty deterred sentiment for small-cap stocks. Late in the fiscal year, several Magnificent 7 companies struggled to meet high expectations. As a result, market leadership broadened, with small caps narrowing the performance gap relative to mega caps. Security selection and positioning within the Magnificent 7, which accounted for nearly half of the benchmark’s weight, contributed to relative performance. The portfolio benefited from a lack of exposure to Tesla, Inc., which underperformed the benchmark. Additionally, the portfolio’s overweight to NVIDIA Corp. and Meta Platforms, Inc., both beneficiaries of the AI movement, added to returns. Security selection within financials, including S&P Global, Inc. and BlackRock, Inc., experienced headwinds and detracted from results. There were no meaningful changes to the portfolio during the 12-month period.
Total return based on a $10,000 investment
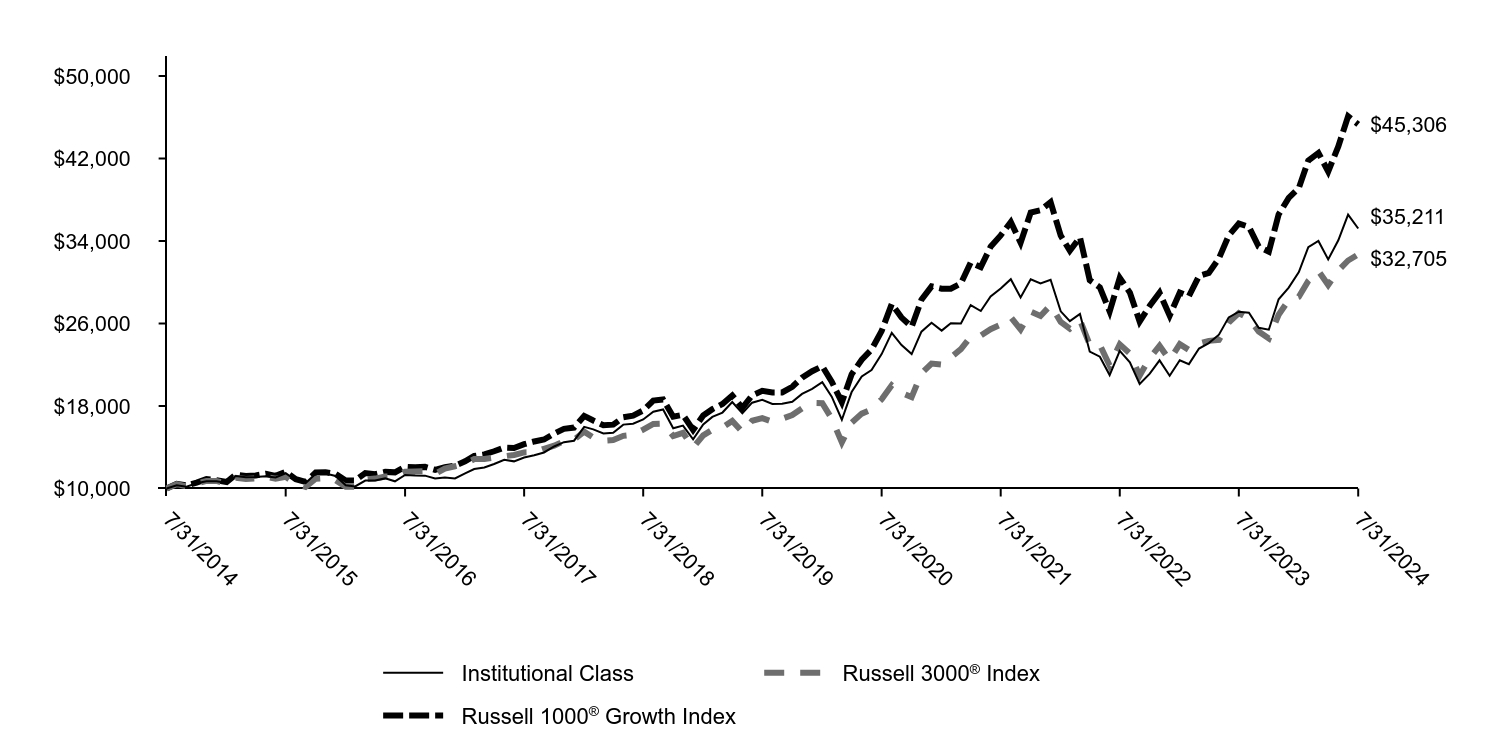
| Institutional Class | Russell 3000® Index | Russell 1000® Growth Index |
|---|
| 7/31/2014 | $10,000 | $10,000 | $10,000 |
| 8/31/2014 | $10,319 | $10,420 | $10,458 |
| 9/30/2014 | $10,183 | $10,202 | $10,306 |
| 10/31/2014 | $10,515 | $10,483 | $10,578 |
| 11/30/2014 | $10,703 | $10,737 | $10,913 |
| 12/31/2014 | $10,706 | $10,737 | $10,800 |
| 1/31/2015 | $10,532 | $10,438 | $10,634 |
| 2/28/2015 | $11,219 | $11,043 | $11,343 |
| 3/31/2015 | $11,096 | $10,930 | $11,214 |
| 4/30/2015 | $11,126 | $10,980 | $11,270 |
| 5/31/2015 | $11,190 | $11,132 | $11,429 |
| 6/30/2015 | $11,071 | $10,945 | $11,227 |
| 7/31/2015 | $11,482 | $11,128 | $11,608 |
| 8/31/2015 | $10,783 | $10,457 | $10,903 |
| 9/30/2015 | $10,530 | $10,152 | $10,634 |
| 10/31/2015 | $11,434 | $10,954 | $11,549 |
| 11/30/2015 | $11,450 | $11,014 | $11,582 |
| 12/31/2015 | $11,219 | $10,788 | $11,412 |
| 1/31/2016 | $10,321 | $10,180 | $10,775 |
| 2/29/2016 | $10,203 | $10,176 | $10,770 |
| 3/31/2016 | $10,774 | $10,893 | $11,496 |
| 4/30/2016 | $10,776 | $10,960 | $11,391 |
| 5/31/2016 | $10,980 | $11,156 | $11,612 |
| 6/30/2016 | $10,699 | $11,179 | $11,567 |
| 7/31/2016 | $11,311 | $11,623 | $12,113 |
| 8/31/2016 | $11,251 | $11,653 | $12,053 |
| 9/30/2016 | $11,248 | $11,671 | $12,097 |
| 10/31/2016 | $10,968 | $11,419 | $11,813 |
| 11/30/2016 | $11,057 | $11,930 | $12,070 |
| 12/31/2016 | $10,976 | $12,162 | $12,219 |
| 1/31/2017 | $11,473 | $12,391 | $12,631 |
| 2/28/2017 | $11,889 | $12,852 | $13,156 |
| 3/31/2017 | $12,032 | $12,861 | $13,308 |
| 4/30/2017 | $12,381 | $12,997 | $13,612 |
| 5/31/2017 | $12,781 | $13,130 | $13,966 |
| 6/30/2017 | $12,633 | $13,249 | $13,929 |
| 7/31/2017 | $13,006 | $13,498 | $14,299 |
| 8/31/2017 | $13,217 | $13,524 | $14,562 |
| 9/30/2017 | $13,495 | $13,854 | $14,751 |
| 10/31/2017 | $14,077 | $14,157 | $15,322 |
| 11/30/2017 | $14,490 | $14,586 | $15,788 |
| 12/31/2017 | $14,635 | $14,732 | $15,911 |
| 1/31/2018 | $15,979 | $15,509 | $17,038 |
| 2/28/2018 | $15,734 | $14,937 | $16,591 |
| 3/31/2018 | $15,340 | $14,637 | $16,136 |
| 4/30/2018 | $15,415 | $14,693 | $16,192 |
| 5/31/2018 | $16,195 | $15,108 | $16,902 |
| 6/30/2018 | $16,276 | $15,207 | $17,065 |
| 7/31/2018 | $16,696 | $15,711 | $17,566 |
| 8/31/2018 | $17,448 | $16,263 | $18,526 |
| 9/30/2018 | $17,661 | $16,290 | $18,630 |
| 10/31/2018 | $15,841 | $15,090 | $16,964 |
| 11/30/2018 | $16,095 | $15,393 | $17,144 |
| 12/31/2018 | $14,773 | $13,960 | $15,670 |
| 1/31/2019 | $16,209 | $15,158 | $17,079 |
| 2/28/2019 | $16,939 | $15,691 | $17,690 |
| 3/31/2019 | $17,365 | $15,920 | $18,193 |
| 4/30/2019 | $18,387 | $16,556 | $19,015 |
| 5/31/2019 | $17,304 | $15,485 | $17,814 |
| 6/30/2019 | $18,322 | $16,572 | $19,037 |
| 7/31/2019 | $18,594 | $16,819 | $19,467 |
| 8/31/2019 | $18,201 | $16,476 | $19,318 |
| 9/30/2019 | $18,213 | $16,765 | $19,320 |
| 10/31/2019 | $18,408 | $17,126 | $19,865 |
| 11/30/2019 | $19,174 | $17,777 | $20,746 |
| 12/31/2019 | $19,662 | $18,290 | $21,372 |
| 1/31/2020 | $20,304 | $18,270 | $21,850 |
| 2/29/2020 | $18,909 | $16,774 | $20,362 |
| 3/31/2020 | $16,670 | $14,468 | $18,359 |
| 4/30/2020 | $19,354 | $16,384 | $21,075 |
| 5/31/2020 | $20,866 | $17,260 | $22,490 |
| 6/30/2020 | $21,486 | $17,655 | $23,470 |
| 7/31/2020 | $23,037 | $18,657 | $25,275 |
| 8/31/2020 | $25,097 | $20,009 | $27,884 |
| 9/30/2020 | $23,911 | $19,280 | $26,572 |
| 10/31/2020 | $23,033 | $18,864 | $25,669 |
| 11/30/2020 | $25,208 | $21,159 | $28,298 |
| 12/31/2020 | $26,069 | $22,111 | $29,599 |
| 1/31/2021 | $25,311 | $22,012 | $29,380 |
| 2/28/2021 | $26,023 | $22,700 | $29,373 |
| 3/31/2021 | $26,002 | $23,514 | $29,878 |
| 4/30/2021 | $27,792 | $24,726 | $31,911 |
| 5/31/2021 | $27,212 | $24,839 | $31,469 |
| 6/30/2021 | $28,621 | $25,452 | $33,444 |
| 7/31/2021 | $29,398 | $25,882 | $34,546 |
| 8/31/2021 | $30,298 | $26,620 | $35,838 |
| 9/30/2021 | $28,519 | $25,426 | $33,830 |
| 10/31/2021 | $30,288 | $27,145 | $36,761 |
| 11/30/2021 | $29,876 | $26,732 | $36,985 |
| 12/31/2021 | $30,241 | $27,785 | $37,767 |
| 1/31/2022 | $27,180 | $26,150 | $34,526 |
| 2/28/2022 | $26,237 | $25,491 | $33,060 |
| 3/31/2022 | $26,922 | $26,318 | $34,353 |
| 4/30/2022 | $23,270 | $23,956 | $30,204 |
| 5/31/2022 | $22,784 | $23,924 | $29,502 |
| 6/30/2022 | $20,999 | $21,923 | $27,165 |
| 7/31/2022 | $23,352 | $23,979 | $30,426 |
| 8/31/2022 | $22,228 | $23,084 | $29,008 |
| 9/30/2022 | $20,133 | $20,944 | $26,188 |
| 10/31/2022 | $21,140 | $22,661 | $27,719 |
| 11/30/2022 | $22,427 | $23,844 | $28,982 |
| 12/31/2022 | $20,933 | $22,448 | $26,763 |
| 1/31/2023 | $22,434 | $23,994 | $28,994 |
| 2/28/2023 | $22,059 | $23,433 | $28,649 |
| 3/31/2023 | $23,573 | $24,060 | $30,608 |
| 4/30/2023 | $24,097 | $24,316 | $30,910 |
| 5/31/2023 | $24,918 | $24,411 | $32,319 |
| 6/30/2023 | $26,594 | $26,078 | $34,529 |
| 7/31/2023 | $27,144 | $27,013 | $35,692 |
| 8/31/2023 | $27,040 | $26,491 | $35,372 |
| 9/30/2023 | $25,578 | $25,229 | $33,448 |
| 10/31/2023 | $25,397 | $24,560 | $32,972 |
| 11/30/2023 | $28,353 | $26,851 | $36,566 |
| 12/31/2023 | $29,482 | $28,275 | $38,185 |
| 1/31/2024 | $30,994 | $28,588 | $39,138 |
| 2/29/2024 | $33,399 | $30,136 | $41,808 |
| 3/31/2024 | $34,008 | $31,108 | $42,544 |
| 4/30/2024 | $32,219 | $29,739 | $40,739 |
| 5/31/2024 | $34,070 | $31,144 | $43,178 |
| 6/30/2024 | $36,560 | $32,108 | $46,090 |
| 7/31/2024 | $35,211 | $32,705 | $45,306 |
Annual Shareholder Report | July 31, 2024
AVERAGE ANNUAL TOTAL RETURNS (%)
| 1 Year | 5 Years | 10 Years |
|---|
| Institutional Class | 29.75 | 13.62 | 13.41 |
Russell 3000® Index | 21.07 | 14.23 | 12.58 |
Russell 1000® Growth Index | 26.94 | 18.41 | 16.31 |
| Total net assets | $974,207,443 |
| # of portfolio holdings | 54 |
| Portfolio turnover rate | 29% |
| Total advisory fees paid | $4,135,246 |
What did the Fund invest in?
(Based on long-term investments)
TOP TEN HOLDINGS (% OF NET ASSETS)
| Microsoft Corp. | 10.6 |
| NVIDIA Corp. | 9.8 |
| Amazon.com, Inc. | 8.0 |
| Apple, Inc. | 7.8 |
| Meta Platforms, Inc. Class A | 5.7 |
| Alphabet, Inc. Class A | 3.9 |
| Visa, Inc. Class A | 2.7 |
| UnitedHealth Group, Inc. | 2.6 |
| Eli Lilly & Co. | 2.5 |
| Tradeweb Markets, Inc. Class A | 2.4 |
SECTOR ALLOCATION (% OF LONG-TERM INVESTMENTS)
| Information technology | 42.7 |
| Consumer discretionary | 15.9 |
| Communication services | 14.1 |
| Health care | 10.7 |
| Financials | 9.3 |
| Industrials | 5.6 |
| Materials | 1.7 |
This is a summary of certain changes and planned changes to the Fund since August 1, 2023.
Effective May 31, 2024, Michael T. Smith, CFA and Christopher J. Warner, CFA were added as portfolio managers of the Fund and effective July 26, 2024, Thomas C. Ognar, CFA and David Nazaret were no longer portfolio managers of the Fund.
You can find additional information on the Fund's website at allspringglobal.com, including its:
- Prospectus - Financial Information - Fund holdings - Proxy voting information
Annual Shareholder Report
This annual shareholder report contains important information about Large Cap Growth Fund for the period of August 1, 2023 to July 31, 2024. You can find additional information about the Fund at allspringglobal.com. You can also request this information by contacting us at 1-800-222-8222.
This report describes changes to the Fund that occurred during the reporting period.
What were the Fund costs for the past year?
The table explains the costs you would have paid within the reporting period based on a hypothetical $10,000 investment.
| CLASS NAME | COST OF A $10,000 INVESTMENT | COSTS PAID AS A % OF A $10,000 INVESTMENT |
|---|
| Class R6 | $74 | 0.64% |
The manager has contractually committed to waive fees and/or reimburse certain expenses to the extent necessary to cap the Fund's total annual fund operating expense ratio at a specific amount. Without this cap, the costs shown above may have been higher. Please see the prospectus for the amount and the expiration date of the cap. Prior to or after the commitment expiration date, the cap may be increased or the commitment to maintain the cap may be terminated only with the approval of the Board of Trustees.
How did the Fund perform last year and what affected its performance?
Positive earnings surprises fueled a bull market for large-cap U.S. equities during the 12-month period that ended on July 31, 2024. Companies connected to artificial intelligence (AI) saw their valuations soar. The “Magnificent 7” stocks substantially outperformed the rest of the U.S. equity universe. Inflation concerns and policy uncertainty deterred sentiment for small-cap stocks. Late in the fiscal year, several Magnificent 7 companies struggled to meet high expectations. As a result, market leadership broadened, with small caps narrowing the performance gap relative to mega caps. Security selection and positioning within the Magnificent 7, which accounted for nearly half of the benchmark’s weight, contributed to relative performance. The portfolio benefited from a lack of exposure to Tesla, Inc., which underperformed the benchmark. Additionally, the portfolio’s overweight to NVIDIA Corp. and Meta Platforms, Inc., both beneficiaries of the AI movement, added to returns. Security selection within financials, including S&P Global, Inc. and BlackRock, Inc., experienced headwinds and detracted from results. There were no meaningful changes to the portfolio during the 12-month period.
Total return based on a $10,000 investment
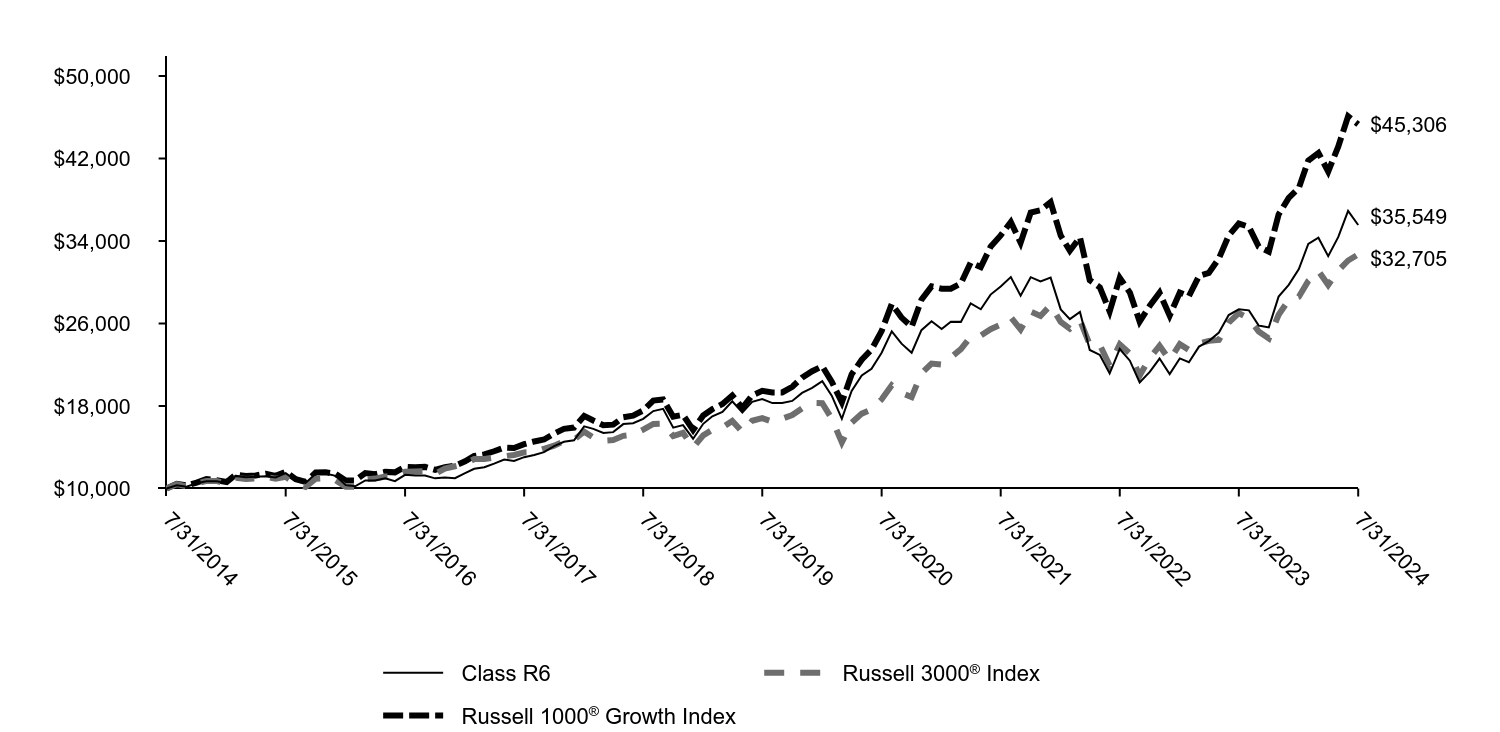
| Class R6 | Russell 3000® Index | Russell 1000® Growth Index |
|---|
| 7/31/2014 | $10,000 | $10,000 | $10,000 |
| 8/31/2014 | $10,319 | $10,420 | $10,458 |
| 9/30/2014 | $10,181 | $10,202 | $10,306 |
| 10/31/2014 | $10,515 | $10,483 | $10,578 |
| 11/30/2014 | $10,703 | $10,737 | $10,913 |
| 12/31/2014 | $10,705 | $10,737 | $10,800 |
| 1/31/2015 | $10,534 | $10,438 | $10,634 |
| 2/28/2015 | $11,221 | $11,043 | $11,343 |
| 3/31/2015 | $11,098 | $10,930 | $11,214 |
| 4/30/2015 | $11,130 | $10,980 | $11,270 |
| 5/31/2015 | $11,193 | $11,132 | $11,429 |
| 6/30/2015 | $11,075 | $10,945 | $11,227 |
| 7/31/2015 | $11,488 | $11,128 | $11,608 |
| 8/31/2015 | $10,790 | $10,457 | $10,903 |
| 9/30/2015 | $10,536 | $10,152 | $10,634 |
| 10/31/2015 | $11,440 | $10,954 | $11,549 |
| 11/30/2015 | $11,458 | $11,014 | $11,582 |
| 12/31/2015 | $11,226 | $10,788 | $11,412 |
| 1/31/2016 | $10,328 | $10,180 | $10,775 |
| 2/29/2016 | $10,212 | $10,176 | $10,770 |
| 3/31/2016 | $10,786 | $10,893 | $11,496 |
| 4/30/2016 | $10,788 | $10,960 | $11,391 |
| 5/31/2016 | $10,994 | $11,156 | $11,612 |
| 6/30/2016 | $10,711 | $11,179 | $11,567 |
| 7/31/2016 | $11,328 | $11,623 | $12,113 |
| 8/31/2016 | $11,267 | $11,653 | $12,053 |
| 9/30/2016 | $11,265 | $11,671 | $12,097 |
| 10/31/2016 | $10,984 | $11,419 | $11,813 |
| 11/30/2016 | $11,076 | $11,930 | $12,070 |
| 12/31/2016 | $10,997 | $12,162 | $12,219 |
| 1/31/2017 | $11,494 | $12,391 | $12,631 |
| 2/28/2017 | $11,913 | $12,852 | $13,156 |
| 3/31/2017 | $12,058 | $12,861 | $13,308 |
| 4/30/2017 | $12,407 | $12,997 | $13,612 |
| 5/31/2017 | $12,810 | $13,130 | $13,966 |
| 6/30/2017 | $12,665 | $13,249 | $13,929 |
| 7/31/2017 | $13,037 | $13,498 | $14,299 |
| 8/31/2017 | $13,251 | $13,524 | $14,562 |
| 9/30/2017 | $13,529 | $13,854 | $14,751 |
| 10/31/2017 | $14,113 | $14,157 | $15,322 |
| 11/30/2017 | $14,529 | $14,586 | $15,788 |
| 12/31/2017 | $14,674 | $14,732 | $15,911 |
| 1/31/2018 | $16,027 | $15,509 | $17,038 |
| 2/28/2018 | $15,783 | $14,937 | $16,591 |
| 3/31/2018 | $15,385 | $14,637 | $16,136 |
| 4/30/2018 | $15,466 | $14,693 | $16,192 |
| 5/31/2018 | $16,246 | $15,108 | $16,902 |
| 6/30/2018 | $16,331 | $15,207 | $17,065 |
| 7/31/2018 | $16,754 | $15,711 | $17,566 |
| 8/31/2018 | $17,508 | $16,263 | $18,526 |
| 9/30/2018 | $17,725 | $16,290 | $18,630 |
| 10/31/2018 | $15,902 | $15,090 | $16,964 |
| 11/30/2018 | $16,155 | $15,393 | $17,144 |
| 12/31/2018 | $14,830 | $13,960 | $15,670 |
| 1/31/2019 | $16,274 | $15,158 | $17,079 |
| 2/28/2019 | $17,008 | $15,691 | $17,690 |
| 3/31/2019 | $17,437 | $15,920 | $18,193 |
| 4/30/2019 | $18,463 | $16,556 | $19,015 |
| 5/31/2019 | $17,377 | $15,485 | $17,814 |
| 6/30/2019 | $18,402 | $16,572 | $19,037 |
| 7/31/2019 | $18,674 | $16,819 | $19,467 |
| 8/31/2019 | $18,281 | $16,476 | $19,318 |
| 9/30/2019 | $18,297 | $16,765 | $19,320 |
| 10/31/2019 | $18,491 | $17,126 | $19,865 |
| 11/30/2019 | $19,266 | $17,777 | $20,746 |
| 12/31/2019 | $19,760 | $18,290 | $21,372 |
| 1/31/2020 | $20,402 | $18,270 | $21,850 |
| 2/29/2020 | $19,002 | $16,774 | $20,362 |
| 3/31/2020 | $16,755 | $14,468 | $18,359 |
| 4/30/2020 | $19,452 | $16,384 | $21,075 |
| 5/31/2020 | $20,973 | $17,260 | $22,490 |
| 6/30/2020 | $21,601 | $17,655 | $23,470 |
| 7/31/2020 | $23,162 | $18,657 | $25,275 |
| 8/31/2020 | $25,235 | $20,009 | $27,884 |
| 9/30/2020 | $24,045 | $19,280 | $26,572 |
| 10/31/2020 | $23,166 | $18,864 | $25,669 |
| 11/30/2020 | $25,351 | $21,159 | $28,298 |
| 12/31/2020 | $26,220 | $22,111 | $29,599 |
| 1/31/2021 | $25,463 | $22,012 | $29,380 |
| 2/28/2021 | $26,179 | $22,700 | $29,373 |
| 3/31/2021 | $26,159 | $23,514 | $29,878 |
| 4/30/2021 | $27,962 | $24,726 | $31,911 |
| 5/31/2021 | $27,383 | $24,839 | $31,469 |
| 6/30/2021 | $28,805 | $25,452 | $33,444 |
| 7/31/2021 | $29,593 | $25,882 | $34,546 |
| 8/31/2021 | $30,497 | $26,620 | $35,838 |
| 9/30/2021 | $28,704 | $25,426 | $33,830 |
| 10/31/2021 | $30,492 | $27,145 | $36,761 |
| 11/30/2021 | $30,080 | $26,732 | $36,985 |
| 12/31/2021 | $30,445 | $27,785 | $37,767 |
| 1/31/2022 | $27,366 | $26,150 | $34,526 |
| 2/28/2022 | $26,420 | $25,491 | $33,060 |
| 3/31/2022 | $27,115 | $26,318 | $34,353 |
| 4/30/2022 | $23,435 | $23,956 | $30,204 |
| 5/31/2022 | $22,950 | $23,924 | $29,502 |
| 6/30/2022 | $21,151 | $21,923 | $27,165 |
| 7/31/2022 | $23,529 | $23,979 | $30,426 |
| 8/31/2022 | $22,395 | $23,084 | $29,008 |
| 9/30/2022 | $20,287 | $20,944 | $26,188 |
| 10/31/2022 | $21,303 | $22,661 | $27,719 |
| 11/30/2022 | $22,600 | $23,844 | $28,982 |
| 12/31/2022 | $21,097 | $22,448 | $26,763 |
| 1/31/2023 | $22,613 | $23,994 | $28,994 |
| 2/28/2023 | $22,239 | $23,433 | $28,649 |
| 3/31/2023 | $23,761 | $24,060 | $30,608 |
| 4/30/2023 | $24,296 | $24,316 | $30,910 |
| 5/31/2023 | $25,122 | $24,411 | $32,319 |
| 6/30/2023 | $26,818 | $26,078 | $34,529 |
| 7/31/2023 | $27,379 | $27,013 | $35,692 |
| 8/31/2023 | $27,276 | $26,491 | $35,372 |
| 9/30/2023 | $25,799 | $25,229 | $33,448 |
| 10/31/2023 | $25,625 | $24,560 | $32,972 |
| 11/30/2023 | $28,611 | $26,851 | $36,566 |
| 12/31/2023 | $29,750 | $28,275 | $38,185 |
| 1/31/2024 | $31,277 | $28,588 | $39,138 |
| 2/29/2024 | $33,708 | $30,136 | $41,808 |
| 3/31/2024 | $34,322 | $31,108 | $42,544 |
| 4/30/2024 | $32,527 | $29,739 | $40,739 |
| 5/31/2024 | $34,398 | $31,144 | $43,178 |
| 6/30/2024 | $36,914 | $32,108 | $46,090 |
| 7/31/2024 | $35,549 | $32,705 | $45,306 |
Annual Shareholder Report | July 31, 2024
AVERAGE ANNUAL TOTAL RETURNS (%)
| 1 Year | 5 Years | 10 Years |
|---|
| Class R6 | 29.87 | 13.74 | 13.52 |
Russell 3000® Index | 21.07 | 14.23 | 12.58 |
Russell 1000® Growth Index | 26.94 | 18.41 | 16.31 |
| Total net assets | $974,207,443 |
| # of portfolio holdings | 54 |
| Portfolio turnover rate | 29% |
| Total advisory fees paid | $4,135,246 |
What did the Fund invest in?
(Based on long-term investments)
TOP TEN HOLDINGS (% OF NET ASSETS)
| Microsoft Corp. | 10.6 |
| NVIDIA Corp. | 9.8 |
| Amazon.com, Inc. | 8.0 |
| Apple, Inc. | 7.8 |
| Meta Platforms, Inc. Class A | 5.7 |
| Alphabet, Inc. Class A | 3.9 |
| Visa, Inc. Class A | 2.7 |
| UnitedHealth Group, Inc. | 2.6 |
| Eli Lilly & Co. | 2.5 |
| Tradeweb Markets, Inc. Class A | 2.4 |
SECTOR ALLOCATION (% OF LONG-TERM INVESTMENTS)
| Information technology | 42.7 |
| Consumer discretionary | 15.9 |
| Communication services | 14.1 |
| Health care | 10.7 |
| Financials | 9.3 |
| Industrials | 5.6 |
| Materials | 1.7 |
This is a summary of certain changes and planned changes to the Fund since August 1, 2023.
Effective May 31, 2024, Michael T. Smith, CFA and Christopher J. Warner, CFA were added as portfolio managers of the Fund and effective July 26, 2024, Thomas C. Ognar, CFA and David Nazaret were no longer portfolio managers of the Fund.
You can find additional information on the Fund's website at allspringglobal.com, including its:
- Prospectus - Financial Information - Fund holdings - Proxy voting information
Annual Shareholder Report
This annual shareholder report contains important information about Large Cap Growth Fund for the period of August 1, 2023 to July 31, 2024. You can find additional information about the Fund at allspringglobal.com. You can also request this information by contacting us at 1-800-222-8222.
This report describes changes to the Fund that occurred during the reporting period.
What were the Fund costs for the past year?
The table explains the costs you would have paid within the reporting period based on a hypothetical $10,000 investment.
| CLASS NAME | COST OF A $10,000 INVESTMENT | COSTS PAID AS A % OF A $10,000 INVESTMENT |
|---|
| Class C | $207 | 1.81% |
The manager has contractually committed to waive fees and/or reimburse certain expenses to the extent necessary to cap the Fund's total annual fund operating expense ratio at a specific amount. Without this cap, the costs shown above may have been higher. Please see the prospectus for the amount and the expiration date of the cap. Prior to or after the commitment expiration date, the cap may be increased or the commitment to maintain the cap may be terminated only with the approval of the Board of Trustees.
How did the Fund perform last year and what affected its performance?
Positive earnings surprises fueled a bull market for large-cap U.S. equities during the 12-month period that ended on July 31, 2024. Companies connected to artificial intelligence (AI) saw their valuations soar. The “Magnificent 7” stocks substantially outperformed the rest of the U.S. equity universe. Inflation concerns and policy uncertainty deterred sentiment for small-cap stocks. Late in the fiscal year, several Magnificent 7 companies struggled to meet high expectations. As a result, market leadership broadened, with small caps narrowing the performance gap relative to mega caps. Security selection and positioning within the Magnificent 7, which accounted for nearly half of the benchmark’s weight, contributed to relative performance. The portfolio benefited from a lack of exposure to Tesla, Inc., which underperformed the benchmark. Additionally, the portfolio’s overweight to NVIDIA Corp. and Meta Platforms, Inc., both beneficiaries of the AI movement, added to returns. Security selection within financials, including S&P Global, Inc. and BlackRock, Inc., experienced headwinds and detracted from results. There were no meaningful changes to the portfolio during the 12-month period.
Total return based on a $10,000 investment
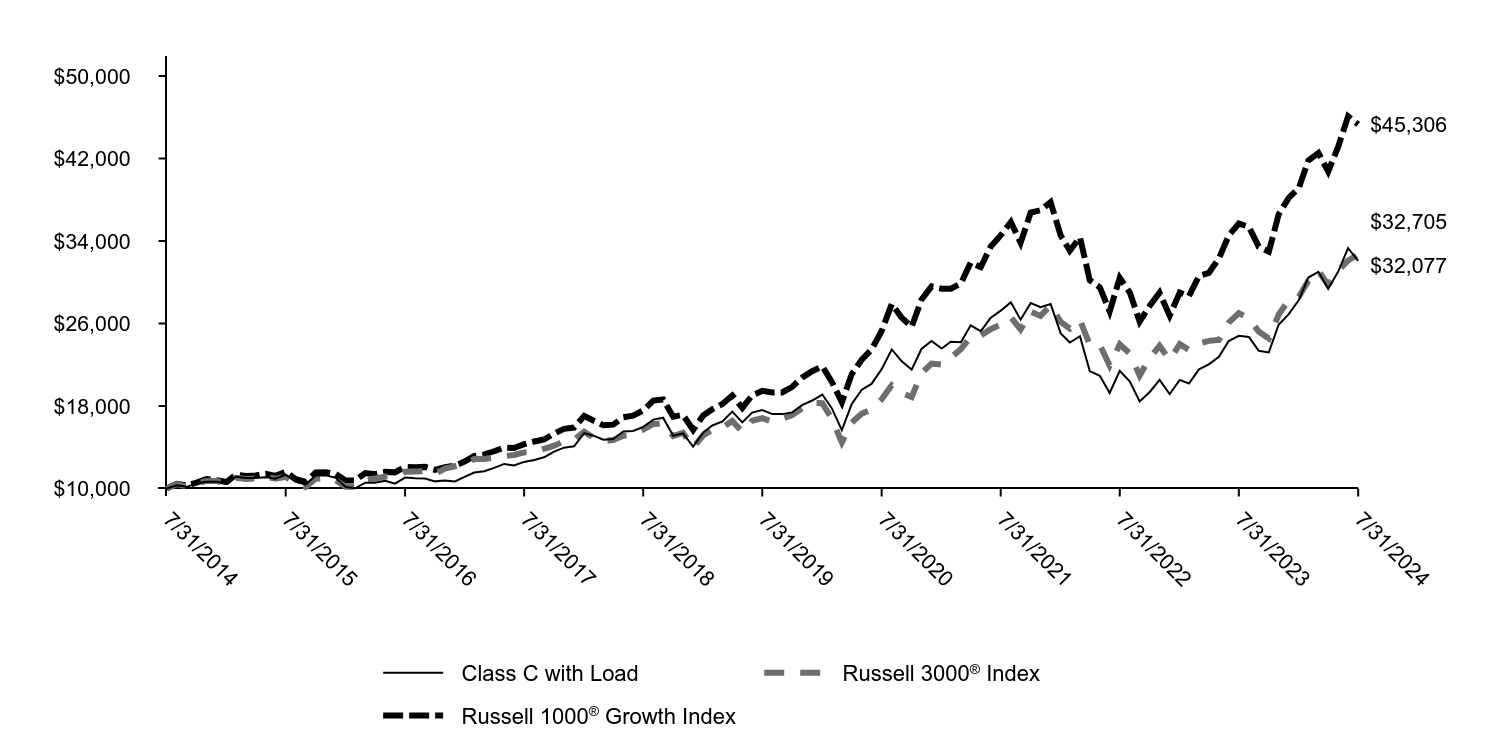
| Class C with Load | Russell 3000® Index | Russell 1000® Growth Index |
|---|
| 7/31/2014 | $10,000 | $10,000 | $10,000 |
| 8/31/2014 | $10,307 | $10,420 | $10,458 |
| 9/30/2014 | $10,161 | $10,202 | $10,306 |
| 10/31/2014 | $10,484 | $10,483 | $10,578 |
| 11/30/2014 | $10,662 | $10,737 | $10,913 |
| 12/31/2014 | $10,653 | $10,737 | $10,800 |
| 1/31/2015 | $10,472 | $10,438 | $10,634 |
| 2/28/2015 | $11,143 | $11,043 | $11,343 |
| 3/31/2015 | $11,010 | $10,930 | $11,214 |
| 4/30/2015 | $11,029 | $10,980 | $11,270 |
| 5/31/2015 | $11,081 | $11,132 | $11,429 |
| 6/30/2015 | $10,952 | $10,945 | $11,227 |
| 7/31/2015 | $11,347 | $11,128 | $11,608 |
| 8/31/2015 | $10,648 | $10,457 | $10,903 |
| 9/30/2015 | $10,386 | $10,152 | $10,634 |
| 10/31/2015 | $11,267 | $10,954 | $11,549 |
| 11/30/2015 | $11,274 | $11,014 | $11,582 |
| 12/31/2015 | $11,035 | $10,788 | $11,412 |
| 1/31/2016 | $10,143 | $10,180 | $10,775 |
| 2/29/2016 | $10,017 | $10,176 | $10,770 |
| 3/31/2016 | $10,569 | $10,893 | $11,496 |
| 4/30/2016 | $10,561 | $10,960 | $11,391 |
| 5/31/2016 | $10,752 | $11,156 | $11,612 |
| 6/30/2016 | $10,468 | $11,179 | $11,567 |
| 7/31/2016 | $11,057 | $11,623 | $12,113 |
| 8/31/2016 | $10,989 | $11,653 | $12,053 |
| 9/30/2016 | $10,977 | $11,671 | $12,097 |
| 10/31/2016 | $10,692 | $11,419 | $11,813 |
| 11/30/2016 | $10,770 | $11,930 | $12,070 |
| 12/31/2016 | $10,681 | $12,162 | $12,219 |
| 1/31/2017 | $11,155 | $12,391 | $12,631 |
| 2/28/2017 | $11,549 | $12,852 | $13,156 |
| 3/31/2017 | $11,677 | $12,861 | $13,308 |
| 4/30/2017 | $12,004 | $12,997 | $13,612 |
| 5/31/2017 | $12,385 | $13,130 | $13,966 |
| 6/30/2017 | $12,231 | $13,249 | $13,929 |
| 7/31/2017 | $12,577 | $13,498 | $14,299 |
| 8/31/2017 | $12,771 | $13,524 | $14,562 |
| 9/30/2017 | $13,026 | $13,854 | $14,751 |
| 10/31/2017 | $13,577 | $14,157 | $15,322 |
| 11/30/2017 | $13,963 | $14,586 | $15,788 |
| 12/31/2017 | $14,088 | $14,732 | $15,911 |
| 1/31/2018 | $15,371 | $15,509 | $17,038 |
| 2/28/2018 | $15,124 | $14,937 | $16,591 |
| 3/31/2018 | $14,728 | $14,637 | $16,136 |
| 4/30/2018 | $14,791 | $14,693 | $16,192 |
| 5/31/2018 | $15,524 | $15,108 | $16,902 |
| 6/30/2018 | $15,587 | $15,207 | $17,065 |
| 7/31/2018 | $15,977 | $15,711 | $17,566 |
| 8/31/2018 | $16,679 | $16,263 | $18,526 |
| 9/30/2018 | $16,869 | $16,290 | $18,630 |
| 10/31/2018 | $15,117 | $15,090 | $16,964 |
| 11/30/2018 | $15,344 | $15,393 | $17,144 |
| 12/31/2018 | $14,073 | $13,960 | $15,670 |
| 1/31/2019 | $15,427 | $15,158 | $17,079 |
| 2/28/2019 | $16,110 | $15,691 | $17,690 |
| 3/31/2019 | $16,499 | $15,920 | $18,193 |
| 4/30/2019 | $17,454 | $16,556 | $19,015 |
| 5/31/2019 | $16,409 | $15,485 | $17,814 |
| 6/30/2019 | $17,361 | $16,572 | $19,037 |
| 7/31/2019 | $17,602 | $16,819 | $19,467 |
| 8/31/2019 | $17,213 | $16,476 | $19,318 |
| 9/30/2019 | $17,213 | $16,765 | $19,320 |
| 10/31/2019 | $17,379 | $17,126 | $19,865 |
| 11/30/2019 | $18,089 | $17,777 | $20,746 |
| 12/31/2019 | $18,532 | $18,290 | $21,372 |
| 1/31/2020 | $19,114 | $18,270 | $21,850 |
| 2/29/2020 | $17,789 | $16,774 | $20,362 |
| 3/31/2020 | $15,668 | $14,468 | $18,359 |
| 4/30/2020 | $18,173 | $16,384 | $21,075 |
| 5/31/2020 | $19,577 | $17,260 | $22,490 |
| 6/30/2020 | $20,140 | $17,655 | $23,470 |
| 7/31/2020 | $21,574 | $18,657 | $25,275 |
| 8/31/2020 | $23,482 | $20,009 | $27,884 |
| 9/30/2020 | $22,356 | $19,280 | $26,572 |
| 10/31/2020 | $21,515 | $18,864 | $25,669 |
| 11/30/2020 | $23,527 | $21,159 | $28,298 |
| 12/31/2020 | $24,301 | $22,111 | $29,599 |
| 1/31/2021 | $23,582 | $22,012 | $29,380 |
| 2/28/2021 | $24,225 | $22,700 | $29,373 |
| 3/31/2021 | $24,178 | $23,514 | $29,878 |
| 4/30/2021 | $25,819 | $24,726 | $31,911 |
| 5/31/2021 | $25,258 | $24,839 | $31,469 |
| 6/30/2021 | $26,543 | $25,452 | $33,444 |
| 7/31/2021 | $27,244 | $25,882 | $34,546 |
| 8/31/2021 | $28,050 | $26,620 | $35,838 |
| 9/30/2021 | $26,374 | $25,426 | $33,830 |
| 10/31/2021 | $27,992 | $27,145 | $36,761 |
| 11/30/2021 | $27,583 | $26,732 | $36,985 |
| 12/31/2021 | $27,894 | $27,785 | $37,767 |
| 1/31/2022 | $25,045 | $26,150 | $34,526 |
| 2/28/2022 | $24,158 | $25,491 | $33,060 |
| 3/31/2022 | $24,766 | $26,318 | $34,353 |
| 4/30/2022 | $21,387 | $23,956 | $30,204 |
| 5/31/2022 | $20,926 | $23,924 | $29,502 |
| 6/30/2022 | $19,264 | $21,923 | $27,165 |
| 7/31/2022 | $21,407 | $23,979 | $30,426 |
| 8/31/2022 | $20,371 | $23,084 | $29,008 |
| 9/30/2022 | $18,445 | $20,944 | $26,188 |
| 10/31/2022 | $19,362 | $22,661 | $27,719 |
| 11/30/2022 | $20,530 | $23,844 | $28,982 |
| 12/31/2022 | $19,162 | $22,448 | $26,763 |
| 1/31/2023 | $20,531 | $23,994 | $28,994 |
| 2/28/2023 | $20,182 | $23,433 | $28,649 |
| 3/31/2023 | $21,558 | $24,060 | $30,608 |
| 4/30/2023 | $22,033 | $24,316 | $30,910 |
| 5/31/2023 | $22,775 | $24,411 | $32,319 |
| 6/30/2023 | $24,302 | $26,078 | $34,529 |
| 7/31/2023 | $24,803 | $27,013 | $35,692 |
| 8/31/2023 | $24,701 | $26,491 | $35,372 |
| 9/30/2023 | $23,358 | $25,229 | $33,448 |
| 10/31/2023 | $23,193 | $24,560 | $32,972 |
| 11/30/2023 | $25,880 | $26,851 | $36,566 |
| 12/31/2023 | $26,905 | $28,275 | $38,185 |
| 1/31/2024 | $28,276 | $28,588 | $39,138 |
| 2/29/2024 | $30,460 | $30,136 | $41,808 |
| 3/31/2024 | $31,012 | $31,108 | $42,544 |
| 4/30/2024 | $29,372 | $29,739 | $40,739 |
| 5/31/2024 | $31,050 | $31,144 | $43,178 |
| 6/30/2024 | $33,311 | $32,108 | $46,090 |
| 7/31/2024 | $32,077 | $32,705 | $45,306 |
Annual Shareholder Report | July 31, 2024
AVERAGE ANNUAL TOTAL RETURNS (%)
| 1 Year | 5 Years | 10 Years |
|---|
| Class C | 28.35 | 12.41 | 12.36 |
| Class C with Load | 27.35 | 12.41 | 12.36 |
Russell 3000® Index | 21.07 | 14.23 | 12.58 |
Russell 1000® Growth Index | 26.94 | 18.41 | 16.31 |
| Total net assets | $974,207,443 |
| # of portfolio holdings | 54 |
| Portfolio turnover rate | 29% |
| Total advisory fees paid | $4,135,246 |
What did the Fund invest in?
(Based on long-term investments)
TOP TEN HOLDINGS (% OF NET ASSETS)
| Microsoft Corp. | 10.6 |
| NVIDIA Corp. | 9.8 |
| Amazon.com, Inc. | 8.0 |
| Apple, Inc. | 7.8 |
| Meta Platforms, Inc. Class A | 5.7 |
| Alphabet, Inc. Class A | 3.9 |
| Visa, Inc. Class A | 2.7 |
| UnitedHealth Group, Inc. | 2.6 |
| Eli Lilly & Co. | 2.5 |
| Tradeweb Markets, Inc. Class A | 2.4 |
SECTOR ALLOCATION (% OF LONG-TERM INVESTMENTS)
| Information technology | 42.7 |
| Consumer discretionary | 15.9 |
| Communication services | 14.1 |
| Health care | 10.7 |
| Financials | 9.3 |
| Industrials | 5.6 |
| Materials | 1.7 |
This is a summary of certain changes and planned changes to the Fund since August 1, 2023.
Effective May 31, 2024, Michael T. Smith, CFA and Christopher J. Warner, CFA were added as portfolio managers of the Fund and effective July 26, 2024, Thomas C. Ognar, CFA and David Nazaret were no longer portfolio managers of the Fund.
You can find additional information on the Fund's website at allspringglobal.com, including its:
- Prospectus - Financial Information - Fund holdings - Proxy voting information
Annual Shareholder Report
This annual shareholder report contains important information about Large Cap Growth Fund for the period of August 1, 2023 to July 31, 2024. You can find additional information about the Fund at allspringglobal.com. You can also request this information by contacting us at 1-800-222-8222.
This report describes changes to the Fund that occurred during the reporting period.
What were the Fund costs for the past year?
The table explains the costs you would have paid within the reporting period based on a hypothetical $10,000 investment.
| CLASS NAME | COST OF A $10,000 INVESTMENT | COSTS PAID AS A % OF A $10,000 INVESTMENT |
|---|
| Class A | $118 | 1.03% |
The manager has contractually committed to waive fees and/or reimburse certain expenses to the extent necessary to cap the Fund's total annual fund operating expense ratio at a specific amount. Without this cap, the costs shown above may have been higher. Please see the prospectus for the amount and the expiration date of the cap. Prior to or after the commitment expiration date, the cap may be increased or the commitment to maintain the cap may be terminated only with the approval of the Board of Trustees.
How did the Fund perform last year and what affected its performance?
Positive earnings surprises fueled a bull market for large-cap U.S. equities during the 12-month period that ended on July 31, 2024. Companies connected to artificial intelligence (AI) saw their valuations soar. The “Magnificent 7” stocks substantially outperformed the rest of the U.S. equity universe. Inflation concerns and policy uncertainty deterred sentiment for small-cap stocks. Late in the fiscal year, several Magnificent 7 companies struggled to meet high expectations. As a result, market leadership broadened, with small caps narrowing the performance gap relative to mega caps. Security selection and positioning within the Magnificent 7, which accounted for nearly half of the benchmark’s weight, contributed to relative performance. The portfolio benefited from a lack of exposure to Tesla, Inc., which underperformed the benchmark. Additionally, the portfolio’s overweight to NVIDIA Corp. and Meta Platforms, Inc., both beneficiaries of the AI movement, added to returns. Security selection within financials, including S&P Global, Inc. and BlackRock, Inc., experienced headwinds and detracted from results. There were no meaningful changes to the portfolio during the 12-month period.
Total return based on a $10,000 investment
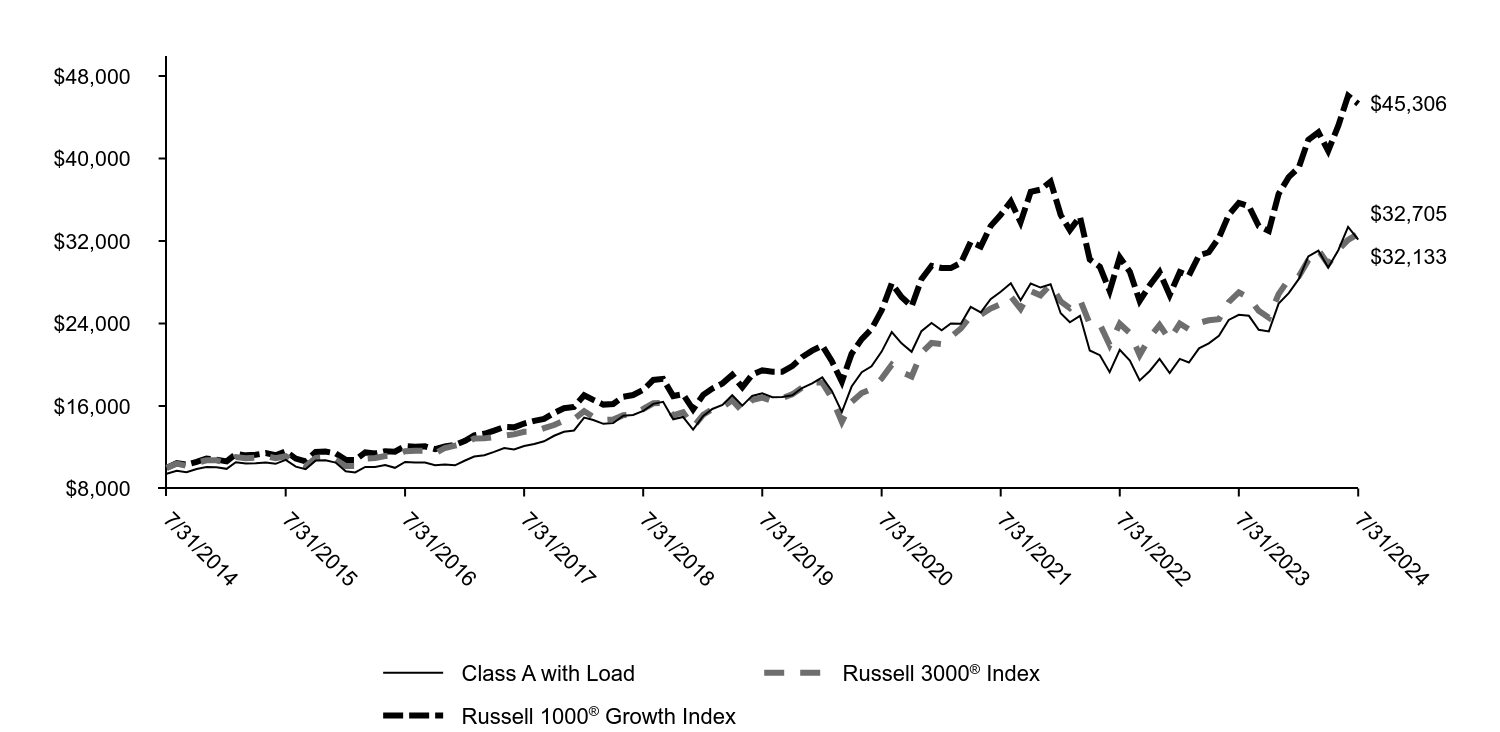
| Class A with Load | Russell 3000® Index | Russell 1000® Growth Index |
|---|
| 7/31/2014 | $9,425 | $10,000 | $10,000 |
| 8/31/2014 | $9,723 | $10,420 | $10,458 |
| 9/30/2014 | $9,589 | $10,202 | $10,306 |
| 10/31/2014 | $9,899 | $10,483 | $10,578 |
| 11/30/2014 | $10,074 | $10,737 | $10,913 |
| 12/31/2014 | $10,072 | $10,737 | $10,800 |
| 1/31/2015 | $9,907 | $10,438 | $10,634 |
| 2/28/2015 | $10,549 | $11,043 | $11,343 |
| 3/31/2015 | $10,429 | $10,930 | $11,214 |
| 4/30/2015 | $10,453 | $10,980 | $11,270 |
| 5/31/2015 | $10,510 | $11,132 | $11,429 |
| 6/30/2015 | $10,394 | $10,945 | $11,227 |
| 7/31/2015 | $10,777 | $11,128 | $11,608 |
| 8/31/2015 | $10,118 | $10,457 | $10,903 |
| 9/30/2015 | $9,877 | $10,152 | $10,634 |
| 10/31/2015 | $10,718 | $10,954 | $11,549 |
| 11/30/2015 | $10,731 | $11,014 | $11,582 |
| 12/31/2015 | $10,511 | $10,788 | $11,412 |
| 1/31/2016 | $9,668 | $10,180 | $10,775 |
| 2/29/2016 | $9,555 | $10,176 | $10,770 |
| 3/31/2016 | $10,086 | $10,893 | $11,496 |
| 4/30/2016 | $10,086 | $10,960 | $11,391 |
| 5/31/2016 | $10,274 | $11,156 | $11,612 |
| 6/30/2016 | $10,008 | $11,179 | $11,567 |
| 7/31/2016 | $10,580 | $11,623 | $12,113 |
| 8/31/2016 | $10,520 | $11,653 | $12,053 |
| 9/30/2016 | $10,513 | $11,671 | $12,097 |
| 10/31/2016 | $10,249 | $11,419 | $11,813 |
| 11/30/2016 | $10,332 | $11,930 | $12,070 |
| 12/31/2016 | $10,251 | $12,162 | $12,219 |
| 1/31/2017 | $10,713 | $12,391 | $12,631 |
| 2/28/2017 | $11,098 | $12,852 | $13,156 |
| 3/31/2017 | $11,229 | $12,861 | $13,308 |
| 4/30/2017 | $11,551 | $12,997 | $13,612 |
| 5/31/2017 | $11,923 | $13,130 | $13,966 |
| 6/30/2017 | $11,783 | $13,249 | $13,929 |
| 7/31/2017 | $12,124 | $13,498 | $14,299 |
| 8/31/2017 | $12,320 | $13,524 | $14,562 |
| 9/30/2017 | $12,574 | $13,854 | $14,751 |
| 10/31/2017 | $13,114 | $14,157 | $15,322 |
| 11/30/2017 | $13,494 | $14,586 | $15,788 |
| 12/31/2017 | $13,626 | $14,732 | $15,911 |
| 1/31/2018 | $14,873 | $15,509 | $17,038 |
| 2/28/2018 | $14,643 | $14,937 | $16,591 |
| 3/31/2018 | $14,270 | $14,637 | $16,136 |
| 4/30/2018 | $14,339 | $14,693 | $16,192 |
| 5/31/2018 | $15,058 | $15,108 | $16,902 |
| 6/30/2018 | $15,129 | $15,207 | $17,065 |
| 7/31/2018 | $15,517 | $15,711 | $17,566 |
| 8/31/2018 | $16,209 | $16,263 | $18,526 |
| 9/30/2018 | $16,403 | $16,290 | $18,630 |
| 10/31/2018 | $14,712 | $15,090 | $16,964 |
| 11/30/2018 | $14,941 | $15,393 | $17,144 |
| 12/31/2018 | $13,712 | $13,960 | $15,670 |
| 1/31/2019 | $15,040 | $15,158 | $17,079 |
| 2/28/2019 | $15,714 | $15,691 | $17,690 |
| 3/31/2019 | $16,103 | $15,920 | $18,193 |
| 4/30/2019 | $17,046 | $16,556 | $19,015 |
| 5/31/2019 | $16,037 | $15,485 | $17,814 |
| 6/30/2019 | $16,979 | $16,572 | $19,037 |
| 7/31/2019 | $17,225 | $16,819 | $19,467 |
| 8/31/2019 | $16,855 | $16,476 | $19,318 |
| 9/30/2019 | $16,863 | $16,765 | $19,320 |
| 10/31/2019 | $17,038 | $17,126 | $19,865 |
| 11/30/2019 | $17,743 | $17,777 | $20,746 |
| 12/31/2019 | $18,196 | $18,290 | $21,372 |
| 1/31/2020 | $18,779 | $18,270 | $21,850 |
| 2/29/2020 | $17,489 | $16,774 | $20,362 |
| 3/31/2020 | $15,414 | $14,468 | $18,359 |
| 4/30/2020 | $17,887 | $16,384 | $21,075 |
| 5/31/2020 | $19,281 | $17,260 | $22,490 |
| 6/30/2020 | $19,851 | $17,655 | $23,470 |
| 7/31/2020 | $21,275 | $18,657 | $25,275 |
| 8/31/2020 | $23,174 | $20,009 | $27,884 |
| 9/30/2020 | $22,076 | $19,280 | $26,572 |
| 10/31/2020 | $21,257 | $18,864 | $25,669 |
| 11/30/2020 | $23,260 | $21,159 | $28,298 |
| 12/31/2020 | $24,048 | $22,111 | $29,599 |
| 1/31/2021 | $23,345 | $22,012 | $29,380 |
| 2/28/2021 | $23,994 | $22,700 | $29,373 |
| 3/31/2021 | $23,969 | $23,514 | $29,878 |
| 4/30/2021 | $25,612 | $24,726 | $31,911 |
| 5/31/2021 | $25,071 | $24,839 | $31,469 |
| 6/30/2021 | $26,364 | $25,452 | $33,444 |
| 7/31/2021 | $27,072 | $25,882 | $34,546 |
| 8/31/2021 | $27,894 | $26,620 | $35,838 |
| 9/30/2021 | $26,246 | $25,426 | $33,830 |
| 10/31/2021 | $27,869 | $27,145 | $36,761 |
| 11/30/2021 | $27,486 | $26,732 | $36,985 |
| 12/31/2021 | $27,807 | $27,785 | $37,767 |
| 1/31/2022 | $24,988 | $26,150 | $34,526 |
| 2/28/2022 | $24,121 | $25,491 | $33,060 |
| 3/31/2022 | $24,743 | $26,318 | $34,353 |
| 4/30/2022 | $21,382 | $23,956 | $30,204 |
| 5/31/2022 | $20,931 | $23,924 | $29,502 |
| 6/30/2022 | $19,282 | $21,923 | $27,165 |
| 7/31/2022 | $21,445 | $23,979 | $30,426 |
| 8/31/2022 | $20,406 | $23,084 | $29,008 |
| 9/30/2022 | $18,477 | $20,944 | $26,188 |
| 10/31/2022 | $19,396 | $22,661 | $27,719 |
| 11/30/2022 | $20,566 | $23,844 | $28,982 |
| 12/31/2022 | $19,195 | $22,448 | $26,763 |
| 1/31/2023 | $20,566 | $23,994 | $28,994 |
| 2/28/2023 | $20,217 | $23,433 | $28,649 |
| 3/31/2023 | $21,595 | $24,060 | $30,608 |
| 4/30/2023 | $22,071 | $24,316 | $30,910 |
| 5/31/2023 | $22,814 | $24,411 | $32,319 |
| 6/30/2023 | $24,344 | $26,078 | $34,529 |
| 7/31/2023 | $24,846 | $27,013 | $35,692 |
| 8/31/2023 | $24,745 | $26,491 | $35,372 |
| 9/30/2023 | $23,398 | $25,229 | $33,448 |
| 10/31/2023 | $23,233 | $24,560 | $32,972 |
| 11/30/2023 | $25,926 | $26,851 | $36,566 |
| 12/31/2023 | $26,951 | $28,275 | $38,185 |
| 1/31/2024 | $28,326 | $28,588 | $39,138 |
| 2/29/2024 | $30,513 | $30,136 | $41,808 |
| 3/31/2024 | $31,066 | $31,108 | $42,544 |
| 4/30/2024 | $29,423 | $29,739 | $40,739 |
| 5/31/2024 | $31,104 | $31,144 | $43,178 |
| 6/30/2024 | $33,369 | $32,108 | $46,090 |
| 7/31/2024 | $32,133 | $32,705 | $45,306 |
Annual Shareholder Report | July 31, 2024
AVERAGE ANNUAL TOTAL RETURNS (%)
| 1 Year | 5 Years | 10 Years |
|---|
| Class A | 29.36 | 13.28 | 13.05 |
| Class A with Load | 21.92 | 11.95 | 12.38 |
Russell 3000® Index | 21.07 | 14.23 | 12.58 |
Russell 1000® Growth Index | 26.94 | 18.41 | 16.31 |
| Total net assets | $974,207,443 |
| # of portfolio holdings | 54 |
| Portfolio turnover rate | 29% |
| Total advisory fees paid | $4,135,246 |
What did the Fund invest in?
(Based on long-term investments)
TOP TEN HOLDINGS (% OF NET ASSETS)
| Microsoft Corp. | 10.6 |
| NVIDIA Corp. | 9.8 |
| Amazon.com, Inc. | 8.0 |
| Apple, Inc. | 7.8 |
| Meta Platforms, Inc. Class A | 5.7 |
| Alphabet, Inc. Class A | 3.9 |
| Visa, Inc. Class A | 2.7 |
| UnitedHealth Group, Inc. | 2.6 |
| Eli Lilly & Co. | 2.5 |
| Tradeweb Markets, Inc. Class A | 2.4 |
SECTOR ALLOCATION (% OF LONG-TERM INVESTMENTS)
| Information technology | 42.7 |
| Consumer discretionary | 15.9 |
| Communication services | 14.1 |
| Health care | 10.7 |
| Financials | 9.3 |
| Industrials | 5.6 |
| Materials | 1.7 |
This is a summary of certain changes and planned changes to the Fund since August 1, 2023.
Effective May 31, 2024, Michael T. Smith, CFA and Christopher J. Warner, CFA were added as portfolio managers of the Fund and effective July 26, 2024, Thomas C. Ognar, CFA and David Nazaret were no longer portfolio managers of the Fund.
You can find additional information on the Fund's website at allspringglobal.com, including its:
- Prospectus - Financial Information - Fund holdings - Proxy voting information
Annual Shareholder Report
This annual shareholder report contains important information about Large Cap Growth Fund for the period of August 1, 2023 to July 31, 2024. You can find additional information about the Fund at allspringglobal.com. You can also request this information by contacting us at 1-800-222-8222.
This report describes changes to the Fund that occurred during the reporting period.
What were the Fund costs for the past year?
The table explains the costs you would have paid within the reporting period based on a hypothetical $10,000 investment.
| CLASS NAME | COST OF A $10,000 INVESTMENT | COSTS PAID AS A % OF A $10,000 INVESTMENT |
|---|
| Administrator Class | $109 | 0.95% |
The manager has contractually committed to waive fees and/or reimburse certain expenses to the extent necessary to cap the Fund's total annual fund operating expense ratio at a specific amount. Without this cap, the costs shown above may have been higher. Please see the prospectus for the amount and the expiration date of the cap. Prior to or after the commitment expiration date, the cap may be increased or the commitment to maintain the cap may be terminated only with the approval of the Board of Trustees.
How did the Fund perform last year and what affected its performance?
Positive earnings surprises fueled a bull market for large-cap U.S. equities during the 12-month period that ended on July 31, 2024. Companies connected to artificial intelligence (AI) saw their valuations soar. The “Magnificent 7” stocks substantially outperformed the rest of the U.S. equity universe. Inflation concerns and policy uncertainty deterred sentiment for small-cap stocks. Late in the fiscal year, several Magnificent 7 companies struggled to meet high expectations. As a result, market leadership broadened, with small caps narrowing the performance gap relative to mega caps. Security selection and positioning within the Magnificent 7, which accounted for nearly half of the benchmark’s weight, contributed to relative performance. The portfolio benefited from a lack of exposure to Tesla, Inc., which underperformed the benchmark. Additionally, the portfolio’s overweight to NVIDIA Corp. and Meta Platforms, Inc., both beneficiaries of the AI movement, added to returns. Security selection within financials, including S&P Global, Inc. and BlackRock, Inc., experienced headwinds and detracted from results. There were no meaningful changes to the portfolio during the 12-month period.
Total return based on a $10,000 investment

| Administrator Class | Russell 3000® Index | Russell 1000® Growth Index |
|---|
| 7/31/2014 | $10,000 | $10,000 | $10,000 |
| 8/31/2014 | $10,316 | $10,420 | $10,458 |
| 9/30/2014 | $10,178 | $10,202 | $10,306 |
| 10/31/2014 | $10,508 | $10,483 | $10,578 |
| 11/30/2014 | $10,692 | $10,737 | $10,913 |
| 12/31/2014 | $10,690 | $10,737 | $10,800 |
| 1/31/2015 | $10,518 | $10,438 | $10,634 |
| 2/28/2015 | $11,198 | $11,043 | $11,343 |
| 3/31/2015 | $11,074 | $10,930 | $11,214 |
| 4/30/2015 | $11,102 | $10,980 | $11,270 |
| 5/31/2015 | $11,161 | $11,132 | $11,429 |
| 6/30/2015 | $11,040 | $10,945 | $11,227 |
| 7/31/2015 | $11,448 | $11,128 | $11,608 |
| 8/31/2015 | $10,750 | $10,457 | $10,903 |
| 9/30/2015 | $10,493 | $10,152 | $10,634 |
| 10/31/2015 | $11,391 | $10,954 | $11,549 |
| 11/30/2015 | $11,405 | $11,014 | $11,582 |
| 12/31/2015 | $11,173 | $10,788 | $11,412 |
| 1/31/2016 | $10,276 | $10,180 | $10,775 |
| 2/29/2016 | $10,157 | $10,176 | $10,770 |
| 3/31/2016 | $10,723 | $10,893 | $11,496 |
| 4/30/2016 | $10,723 | $10,960 | $11,391 |
| 5/31/2016 | $10,925 | $11,156 | $11,612 |
| 6/30/2016 | $10,643 | $11,179 | $11,567 |
| 7/31/2016 | $11,253 | $11,623 | $12,113 |
| 8/31/2016 | $11,190 | $11,653 | $12,053 |
| 9/30/2016 | $11,185 | $11,671 | $12,097 |
| 10/31/2016 | $10,903 | $11,419 | $11,813 |
| 11/30/2016 | $10,993 | $11,930 | $12,070 |
| 12/31/2016 | $10,909 | $12,162 | $12,219 |
| 1/31/2017 | $11,400 | $12,391 | $12,631 |
| 2/28/2017 | $11,812 | $12,852 | $13,156 |
| 3/31/2017 | $11,953 | $12,861 | $13,308 |
| 4/30/2017 | $12,298 | $12,997 | $13,612 |
| 5/31/2017 | $12,695 | $13,130 | $13,966 |
| 6/30/2017 | $12,546 | $13,249 | $13,929 |
| 7/31/2017 | $12,912 | $13,498 | $14,299 |
| 8/31/2017 | $13,122 | $13,524 | $14,562 |
| 9/30/2017 | $13,393 | $13,854 | $14,751 |
| 10/31/2017 | $13,969 | $14,157 | $15,322 |
| 11/30/2017 | $14,376 | $14,586 | $15,788 |
| 12/31/2017 | $14,518 | $14,732 | $15,911 |
| 1/31/2018 | $15,850 | $15,509 | $17,038 |
| 2/28/2018 | $15,607 | $14,937 | $16,591 |
| 3/31/2018 | $15,210 | $14,637 | $16,136 |
| 4/30/2018 | $15,283 | $14,693 | $16,192 |
| 5/31/2018 | $16,051 | $15,108 | $16,902 |
| 6/30/2018 | $16,130 | $15,207 | $17,065 |
| 7/31/2018 | $16,546 | $15,711 | $17,566 |
| 8/31/2018 | $17,286 | $16,263 | $18,526 |
| 9/30/2018 | $17,494 | $16,290 | $18,630 |
| 10/31/2018 | $15,689 | $15,090 | $16,964 |
| 11/30/2018 | $15,938 | $15,393 | $17,144 |
| 12/31/2018 | $14,628 | $13,960 | $15,670 |
| 1/31/2019 | $16,046 | $15,158 | $17,079 |
| 2/28/2019 | $16,767 | $15,691 | $17,690 |
| 3/31/2019 | $17,185 | $15,920 | $18,193 |
| 4/30/2019 | $18,193 | $16,556 | $19,015 |
| 5/31/2019 | $17,119 | $15,485 | $17,814 |
| 6/30/2019 | $18,123 | $16,572 | $19,037 |
| 7/31/2019 | $18,389 | $16,819 | $19,467 |
| 8/31/2019 | $17,996 | $16,476 | $19,318 |
| 9/30/2019 | $18,008 | $16,765 | $19,320 |
| 10/31/2019 | $18,197 | $17,126 | $19,865 |
| 11/30/2019 | $18,951 | $17,777 | $20,746 |
| 12/31/2019 | $19,432 | $18,290 | $21,372 |
| 1/31/2020 | $20,058 | $18,270 | $21,850 |
| 2/29/2020 | $18,679 | $16,774 | $20,362 |
| 3/31/2020 | $16,467 | $14,468 | $18,359 |
| 4/30/2020 | $19,112 | $16,384 | $21,075 |
| 5/31/2020 | $20,599 | $17,260 | $22,490 |
| 6/30/2020 | $21,211 | $17,655 | $23,470 |
| 7/31/2020 | $22,734 | $18,657 | $25,275 |
| 8/31/2020 | $24,766 | $20,009 | $27,884 |
| 9/30/2020 | $23,595 | $19,280 | $26,572 |
| 10/31/2020 | $22,721 | $18,864 | $25,669 |
| 11/30/2020 | $24,865 | $21,159 | $28,298 |
| 12/31/2020 | $25,707 | $22,111 | $29,599 |
| 1/31/2021 | $24,959 | $22,012 | $29,380 |
| 2/28/2021 | $25,655 | $22,700 | $29,373 |
| 3/31/2021 | $25,629 | $23,514 | $29,878 |
| 4/30/2021 | $27,387 | $24,726 | $31,911 |
| 5/31/2021 | $26,815 | $24,839 | $31,469 |
| 6/30/2021 | $28,196 | $25,452 | $33,444 |
| 7/31/2021 | $28,959 | $25,882 | $34,546 |
| 8/31/2021 | $29,841 | $26,620 | $35,838 |
| 9/30/2021 | $28,078 | $25,426 | $33,830 |
| 10/31/2021 | $29,820 | $27,145 | $36,761 |
| 11/30/2021 | $29,408 | $26,732 | $36,985 |
| 12/31/2021 | $29,761 | $27,785 | $37,767 |
| 1/31/2022 | $26,745 | $26,150 | $34,526 |
| 2/28/2022 | $25,815 | $25,491 | $33,060 |
| 3/31/2022 | $26,482 | $26,318 | $34,353 |
| 4/30/2022 | $22,887 | $23,956 | $30,204 |
| 5/31/2022 | $22,405 | $23,924 | $29,502 |
| 6/30/2022 | $20,646 | $21,923 | $27,165 |
| 7/31/2022 | $22,959 | $23,979 | $30,426 |
| 8/31/2022 | $21,850 | $23,084 | $29,008 |
| 9/30/2022 | $19,787 | $20,944 | $26,188 |
| 10/31/2022 | $20,771 | $22,661 | $27,719 |
| 11/30/2022 | $22,029 | $23,844 | $28,982 |
| 12/31/2022 | $20,561 | $22,448 | $26,763 |
| 1/31/2023 | $22,029 | $23,994 | $28,994 |
| 2/28/2023 | $21,659 | $23,433 | $28,649 |
| 3/31/2023 | $23,141 | $24,060 | $30,608 |
| 4/30/2023 | $23,650 | $24,316 | $30,910 |
| 5/31/2023 | $24,451 | $24,411 | $32,319 |
| 6/30/2023 | $26,098 | $26,078 | $34,529 |
| 7/31/2023 | $26,634 | $27,013 | $35,692 |
| 8/31/2023 | $26,528 | $26,491 | $35,372 |
| 9/30/2023 | $25,086 | $25,229 | $33,448 |
| 10/31/2023 | $24,907 | $24,560 | $32,972 |
| 11/30/2023 | $27,805 | $26,851 | $36,566 |
| 12/31/2023 | $28,907 | $28,275 | $38,185 |
| 1/31/2024 | $30,378 | $28,588 | $39,138 |
| 2/29/2024 | $32,732 | $30,136 | $41,808 |
| 3/31/2024 | $33,320 | $31,108 | $42,544 |
| 4/30/2024 | $31,571 | $29,739 | $40,739 |
| 5/31/2024 | $33,376 | $31,144 | $43,178 |
| 6/30/2024 | $35,808 | $32,108 | $46,090 |
| 7/31/2024 | $34,473 | $32,705 | $45,306 |
Annual Shareholder Report | July 31, 2024
AVERAGE ANNUAL TOTAL RETURNS (%)
| 1 Year | 5 Years | 10 Years |
|---|
| Administrator Class | 29.46 | 13.39 | 13.17 |
Russell 3000® Index | 21.07 | 14.23 | 12.58 |
Russell 1000® Growth Index | 26.94 | 18.41 | 16.31 |
| Total net assets | $974,207,443 |
| # of portfolio holdings | 54 |
| Portfolio turnover rate | 29% |
| Total advisory fees paid | $4,135,246 |
What did the Fund invest in?
(Based on long-term investments)
TOP TEN HOLDINGS (% OF NET ASSETS)
| Microsoft Corp. | 10.6 |
| NVIDIA Corp. | 9.8 |
| Amazon.com, Inc. | 8.0 |
| Apple, Inc. | 7.8 |
| Meta Platforms, Inc. Class A | 5.7 |
| Alphabet, Inc. Class A | 3.9 |
| Visa, Inc. Class A | 2.7 |
| UnitedHealth Group, Inc. | 2.6 |
| Eli Lilly & Co. | 2.5 |
| Tradeweb Markets, Inc. Class A | 2.4 |
SECTOR ALLOCATION (% OF LONG-TERM INVESTMENTS)
| Information technology | 42.7 |
| Consumer discretionary | 15.9 |
| Communication services | 14.1 |
| Health care | 10.7 |
| Financials | 9.3 |
| Industrials | 5.6 |
| Materials | 1.7 |
This is a summary of certain changes and planned changes to the Fund since August 1, 2023.
Effective May 31, 2024, Michael T. Smith, CFA and Christopher J. Warner, CFA were added as portfolio managers of the Fund and effective July 26, 2024, Thomas C. Ognar, CFA and David Nazaret were no longer portfolio managers of the Fund.
You can find additional information on the Fund's website at allspringglobal.com, including its:
- Prospectus - Financial Information - Fund holdings - Proxy voting information
Annual Shareholder Report
This annual shareholder report contains important information about Large Company Value Fund for the period of August 1, 2023 to July 31, 2024. You can find additional information about the Fund at allspringglobal.com. You can also request this information by contacting us at 1-800-222-8222.
What were the Fund costs for the past year?
The table explains the costs you would have paid within the reporting period based on a hypothetical $10,000 investment.
| CLASS NAME | COST OF A $10,000 INVESTMENT | COSTS PAID AS A % OF A $10,000 INVESTMENT |
|---|
| Institutional Class | $55 | 0.50% |
The manager has contractually committed to waive fees and/or reimburse certain expenses to the extent necessary to cap the Fund's total annual fund operating expense ratio at a specific amount. Without this cap, the costs shown above may have been higher. Please see the prospectus for the amount and the expiration date of the cap. Prior to or after the commitment expiration date, the cap may be increased or the commitment to maintain the cap may be terminated only with the approval of the Board of Trustees.
How did the Fund perform last year and what affected its performance?
U.S. equities continued to move sharply higher, with the S&P 500 Index delivering a 22.15% return for the 12-month period that ended on July 31, 2024. The Fund outperformed its benchmark, the Russell 1000® Value Index, by more than 400 basis points (bps; 100 bps equal 1.00%) for the 12-month period.
The Fund outperformed primarily due to the success of the stock selection model, driven by our intention to weight stocks according to their factor potential. Over the past year, a primary headwind occurred with certain sector exposures. From a sector perspective, the Fund’s overweight to consumer discretionary securities was the greatest detractor.
Throughout the past 12 months, the dynamic stock selection model gravitated toward securities with attractive factor exposures and away from securities with unattractive factor exposures. For instance, exposure to 12-month momentum – high growth increased significantly. On the other hand, there was an outsized decrease in exposure to the yield beta factor.
Total return based on a $10,000 investment

| Institutional Class | Russell 3000® Index | Russell 1000® Value Index |
|---|
| 7/31/2014 | $10,000 | $10,000 | $10,000 |
| 8/31/2014 | $10,455 | $10,420 | $10,368 |
| 9/30/2014 | $10,163 | $10,202 | $10,154 |
| 10/31/2014 | $10,264 | $10,483 | $10,382 |
| 11/30/2014 | $10,441 | $10,737 | $10,594 |
| 12/31/2014 | $10,457 | $10,737 | $10,659 |
| 1/31/2015 | $10,026 | $10,438 | $10,233 |
| 2/28/2015 | $10,594 | $11,043 | $10,728 |
| 3/31/2015 | $10,600 | $10,930 | $10,582 |
| 4/30/2015 | $10,594 | $10,980 | $10,681 |
| 5/31/2015 | $10,744 | $11,132 | $10,810 |
| 6/30/2015 | $10,673 | $10,945 | $10,594 |
| 7/31/2015 | $10,614 | $11,128 | $10,640 |
| 8/31/2015 | $9,977 | $10,457 | $10,007 |
| 9/30/2015 | $9,629 | $10,152 | $9,705 |
| 10/31/2015 | $10,255 | $10,954 | $10,437 |
| 11/30/2015 | $10,386 | $11,014 | $10,477 |
| 12/31/2015 | $10,052 | $10,788 | $10,251 |
| 1/31/2016 | $9,359 | $10,180 | $9,722 |
| 2/29/2016 | $9,381 | $10,176 | $9,719 |
| 3/31/2016 | $10,089 | $10,893 | $10,419 |
| 4/30/2016 | $10,147 | $10,960 | $10,638 |
| 5/31/2016 | $10,326 | $11,156 | $10,803 |
| 6/30/2016 | $10,168 | $11,179 | $10,897 |
| 7/31/2016 | $10,557 | $11,623 | $11,213 |
| 8/31/2016 | $10,608 | $11,653 | $11,300 |
| 9/30/2016 | $10,592 | $11,671 | $11,276 |
| 10/31/2016 | $10,433 | $11,419 | $11,102 |
| 11/30/2016 | $11,054 | $11,930 | $11,736 |
| 12/31/2016 | $11,302 | $12,162 | $12,029 |
| 1/31/2017 | $11,439 | $12,391 | $12,115 |
| 2/28/2017 | $11,867 | $12,852 | $12,550 |
| 3/31/2017 | $11,758 | $12,861 | $12,422 |
| 4/30/2017 | $11,715 | $12,997 | $12,399 |
| 5/31/2017 | $11,722 | $13,130 | $12,387 |
| 6/30/2017 | $11,918 | $13,249 | $12,589 |
| 7/31/2017 | $12,100 | $13,498 | $12,757 |
| 8/31/2017 | $12,049 | $13,524 | $12,608 |
| 9/30/2017 | $12,374 | $13,854 | $12,981 |
| 10/31/2017 | $12,579 | $14,157 | $13,076 |
| 11/30/2017 | $12,945 | $14,586 | $13,476 |
| 12/31/2017 | $13,069 | $14,732 | $13,673 |
| 1/31/2018 | $13,623 | $15,509 | $14,201 |
| 2/28/2018 | $12,851 | $14,937 | $13,523 |
| 3/31/2018 | $12,644 | $14,637 | $13,285 |
| 4/30/2018 | $12,690 | $14,693 | $13,329 |
| 5/31/2018 | $12,863 | $15,108 | $13,408 |
| 6/30/2018 | $12,854 | $15,207 | $13,442 |
| 7/31/2018 | $13,282 | $15,711 | $13,974 |
| 8/31/2018 | $13,482 | $16,263 | $14,180 |
| 9/30/2018 | $13,552 | $16,290 | $14,208 |
| 10/31/2018 | $12,653 | $15,090 | $13,472 |
| 11/30/2018 | $13,084 | $15,393 | $13,875 |
| 12/31/2018 | $11,822 | $13,960 | $12,542 |
| 1/31/2019 | $12,696 | $15,158 | $13,519 |
| 2/28/2019 | $12,984 | $15,691 | $13,951 |
| 3/31/2019 | $13,015 | $15,920 | $14,039 |
| 4/30/2019 | $13,470 | $16,556 | $14,537 |
| 5/31/2019 | $12,716 | $15,485 | $13,603 |
| 6/30/2019 | $13,488 | $16,572 | $14,579 |
| 7/31/2019 | $13,529 | $16,819 | $14,700 |
| 8/31/2019 | $13,125 | $16,476 | $14,268 |
| 9/30/2019 | $13,378 | $16,765 | $14,777 |
| 10/31/2019 | $13,619 | $17,126 | $14,983 |
| 11/30/2019 | $14,099 | $17,777 | $15,446 |
| 12/31/2019 | $14,531 | $18,290 | $15,871 |
| 1/31/2020 | $14,330 | $18,270 | $15,530 |
| 2/29/2020 | $13,208 | $16,774 | $14,026 |
| 3/31/2020 | $11,081 | $14,468 | $11,629 |
| 4/30/2020 | $12,125 | $16,384 | $12,936 |
| 5/31/2020 | $12,733 | $17,260 | $13,380 |
| 6/30/2020 | $12,611 | $17,655 | $13,291 |
| 7/31/2020 | $13,231 | $18,657 | $13,816 |
| 8/31/2020 | $14,075 | $20,009 | $14,387 |
| 9/30/2020 | $13,644 | $19,280 | $14,034 |
| 10/31/2020 | $13,505 | $18,864 | $13,850 |
| 11/30/2020 | $15,394 | $21,159 | $15,713 |
| 12/31/2020 | $15,967 | $22,111 | $16,315 |
| 1/31/2021 | $15,814 | $22,012 | $16,166 |
| 2/28/2021 | $17,050 | $22,700 | $17,143 |
| 3/31/2021 | $17,922 | $23,514 | $18,151 |
| 4/30/2021 | $18,747 | $24,726 | $18,877 |
| 5/31/2021 | $19,220 | $24,839 | $19,318 |
| 6/30/2021 | $19,010 | $25,452 | $19,097 |
| 7/31/2021 | $19,165 | $25,882 | $19,249 |
| 8/31/2021 | $19,662 | $26,620 | $19,631 |
| 9/30/2021 | $18,843 | $25,426 | $18,948 |
| 10/31/2021 | $19,896 | $27,145 | $19,910 |
| 11/30/2021 | $19,275 | $26,732 | $19,208 |
| 12/31/2021 | $20,710 | $27,785 | $20,420 |
| 1/31/2022 | $20,166 | $26,150 | $19,944 |
| 2/28/2022 | $20,166 | $25,491 | $19,713 |
| 3/31/2022 | $20,566 | $26,318 | $20,269 |
| 4/30/2022 | $19,241 | $23,956 | $19,126 |
| 5/31/2022 | $19,724 | $23,924 | $19,498 |
| 6/30/2022 | $18,056 | $21,923 | $17,794 |
| 7/31/2022 | $19,122 | $23,979 | $18,974 |
| 8/31/2022 | $18,557 | $23,084 | $18,409 |
| 9/30/2022 | $16,879 | $20,944 | $16,795 |
| 10/31/2022 | $18,628 | $22,661 | $18,517 |
| 11/30/2022 | $19,700 | $23,844 | $19,674 |
| 12/31/2022 | $18,891 | $22,448 | $18,881 |
| 1/31/2023 | $19,808 | $23,994 | $19,859 |
| 2/28/2023 | $19,065 | $23,433 | $19,159 |
| 3/31/2023 | $18,866 | $24,060 | $19,071 |
| 4/30/2023 | $18,977 | $24,316 | $19,358 |
| 5/31/2023 | $18,388 | $24,411 | $18,611 |
| 6/30/2023 | $19,406 | $26,078 | $19,848 |
| 7/31/2023 | $20,285 | $27,013 | $20,546 |
| 8/31/2023 | $19,678 | $26,491 | $19,991 |
| 9/30/2023 | $18,932 | $25,229 | $19,220 |
| 10/31/2023 | $18,273 | $24,560 | $18,541 |
| 11/30/2023 | $19,606 | $26,851 | $19,940 |
| 12/31/2023 | $20,740 | $28,275 | $21,045 |
| 1/31/2024 | $20,933 | $28,588 | $21,067 |
| 2/29/2024 | $21,949 | $30,136 | $21,844 |
| 3/31/2024 | $23,333 | $31,108 | $22,936 |
| 4/30/2024 | $22,572 | $29,739 | $21,956 |
| 5/31/2024 | $23,479 | $31,144 | $22,652 |
| 6/30/2024 | $23,506 | $32,108 | $22,439 |
| 7/31/2024 | $24,204 | $32,705 | $23,586 |
Annual Shareholder Report | July 31, 2024
AVERAGE ANNUAL TOTAL RETURNS (%)
| 1 Year | 5 Years | 10 Years |
|---|
| Institutional Class | 19.32 | 12.34 | 9.24 |
Russell 3000® Index | 21.07 | 14.23 | 12.58 |
Russell 1000® Value Index | 14.80 | 9.92 | 8.96 |
| Total net assets | $242,851,310 |
| # of portfolio holdings | 124 |
| Portfolio turnover rate | 237% |
| Total advisory fees paid | $582,758 |
What did the Fund invest in?
(Based on long-term investments)
TOP TEN HOLDINGS (% OF NET ASSETS)
| Berkshire Hathaway, Inc. Class B | 3.4 |
| Bristol-Myers Squibb Co. | 2.8 |
| Walmart, Inc. | 2.6 |
| Cigna Group | 2.5 |
| Elevance Health, Inc. | 2.4 |
| Citigroup, Inc. | 2.4 |
| General Dynamics Corp. | 2.3 |
| Parker-Hannifin Corp. | 2.2 |
| Colgate-Palmolive Co. | 2.2 |
| Exxon Mobil Corp. | 2.1 |
SECTOR ALLOCATION (% OF LONG-TERM INVESTMENTS)
| Financials | 23.8 |
| Health care | 16.6 |
| Industrials | 13.7 |
| Information technology | 8.7 |
| Consumer staples | 8.3 |
| Energy | 6.9 |
| Consumer discretionary | 6.2 |
| Communication services | 4.9 |
| Utilities | 3.9 |
| Materials | 4.1 |
| Real estate | 2.9 |
You can find additional information on the Fund's website at allspringglobal.com, including its:
- Prospectus - Financial Information - Fund holdings - Proxy voting information
Annual Shareholder Report
This annual shareholder report contains important information about Large Company Value Fund for the period of August 1, 2023 to July 31, 2024. You can find additional information about the Fund at allspringglobal.com. You can also request this information by contacting us at 1-800-222-8222.
What were the Fund costs for the past year?
The table explains the costs you would have paid within the reporting period based on a hypothetical $10,000 investment.
| CLASS NAME | COST OF A $10,000 INVESTMENT | COSTS PAID AS A % OF A $10,000 INVESTMENT |
|---|
| Class R6 | $44 | 0.40% |
The manager has contractually committed to waive fees and/or reimburse certain expenses to the extent necessary to cap the Fund's total annual fund operating expense ratio at a specific amount. Without this cap, the costs shown above may have been higher. Please see the prospectus for the amount and the expiration date of the cap. Prior to or after the commitment expiration date, the cap may be increased or the commitment to maintain the cap may be terminated only with the approval of the Board of Trustees.
How did the Fund perform last year and what affected its performance?
U.S. equities continued to move sharply higher, with the S&P 500 Index delivering a 22.15% return for the 12-month period that ended on July 31, 2024. The Fund outperformed its benchmark, the Russell 1000® Value Index, by more than 400 basis points (bps; 100 bps equal 1.00%) for the 12-month period.
The Fund outperformed primarily due to the success of the stock selection model, driven by our intention to weight stocks according to their factor potential. Over the past year, a primary headwind occurred with certain sector exposures. From a sector perspective, the Fund’s overweight to consumer discretionary securities was the greatest detractor.
Throughout the past 12 months, the dynamic stock selection model gravitated toward securities with attractive factor exposures and away from securities with unattractive factor exposures. For instance, exposure to 12-month momentum – high growth increased significantly. On the other hand, there was an outsized decrease in exposure to the yield beta factor.
Total return based on a $10,000 investment
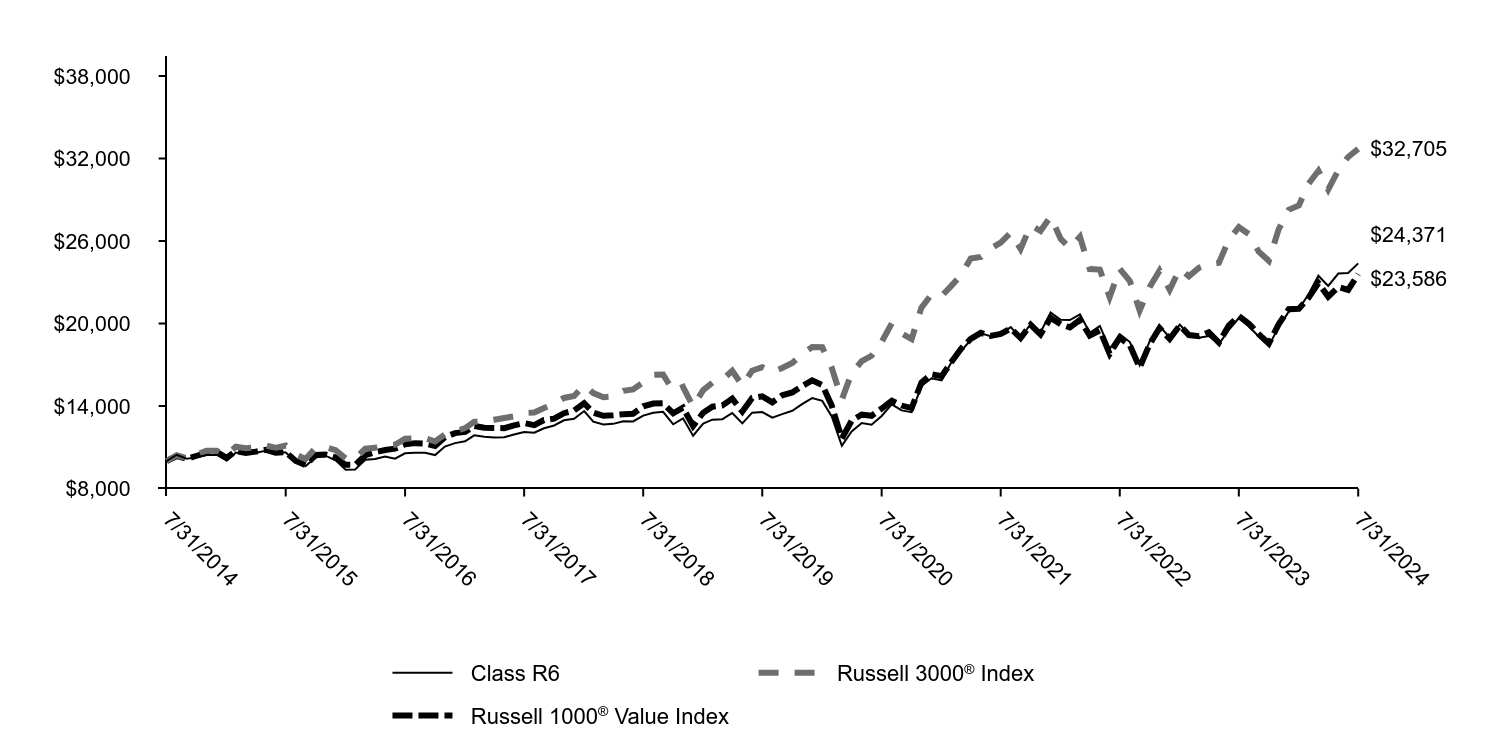
| Class R6 | Russell 3000® Index | Russell 1000® Value Index |
|---|
| 7/31/2014 | $10,000 | $10,000 | $10,000 |
| 8/31/2014 | $10,455 | $10,420 | $10,368 |
| 9/30/2014 | $10,163 | $10,202 | $10,154 |
| 10/31/2014 | $10,264 | $10,483 | $10,382 |
| 11/30/2014 | $10,441 | $10,737 | $10,594 |
| 12/31/2014 | $10,457 | $10,737 | $10,659 |
| 1/31/2015 | $10,026 | $10,438 | $10,233 |
| 2/28/2015 | $10,594 | $11,043 | $10,728 |
| 3/31/2015 | $10,600 | $10,930 | $10,582 |
| 4/30/2015 | $10,594 | $10,980 | $10,681 |
| 5/31/2015 | $10,744 | $11,132 | $10,810 |
| 6/30/2015 | $10,673 | $10,945 | $10,594 |
| 7/31/2015 | $10,614 | $11,128 | $10,640 |
| 8/31/2015 | $9,977 | $10,457 | $10,007 |
| 9/30/2015 | $9,629 | $10,152 | $9,705 |
| 10/31/2015 | $10,255 | $10,954 | $10,437 |
| 11/30/2015 | $10,386 | $11,014 | $10,477 |
| 12/31/2015 | $10,052 | $10,788 | $10,251 |
| 1/31/2016 | $9,359 | $10,180 | $9,722 |
| 2/29/2016 | $9,381 | $10,176 | $9,719 |
| 3/31/2016 | $10,089 | $10,893 | $10,419 |
| 4/30/2016 | $10,147 | $10,960 | $10,638 |
| 5/31/2016 | $10,326 | $11,156 | $10,803 |
| 6/30/2016 | $10,168 | $11,179 | $10,897 |
| 7/31/2016 | $10,557 | $11,623 | $11,213 |
| 8/31/2016 | $10,608 | $11,653 | $11,300 |
| 9/30/2016 | $10,592 | $11,671 | $11,276 |
| 10/31/2016 | $10,433 | $11,419 | $11,102 |
| 11/30/2016 | $11,054 | $11,930 | $11,736 |
| 12/31/2016 | $11,302 | $12,162 | $12,029 |
| 1/31/2017 | $11,439 | $12,391 | $12,115 |
| 2/28/2017 | $11,867 | $12,852 | $12,550 |
| 3/31/2017 | $11,758 | $12,861 | $12,422 |
| 4/30/2017 | $11,715 | $12,997 | $12,399 |
| 5/31/2017 | $11,729 | $13,130 | $12,387 |
| 6/30/2017 | $11,925 | $13,249 | $12,589 |
| 7/31/2017 | $12,107 | $13,498 | $12,757 |
| 8/31/2017 | $12,063 | $13,524 | $12,608 |
| 9/30/2017 | $12,381 | $13,854 | $12,981 |
| 10/31/2017 | $12,586 | $14,157 | $13,076 |
| 11/30/2017 | $12,959 | $14,586 | $13,476 |
| 12/31/2017 | $13,078 | $14,732 | $13,673 |
| 1/31/2018 | $13,633 | $15,509 | $14,201 |
| 2/28/2018 | $12,860 | $14,937 | $13,523 |
| 3/31/2018 | $12,656 | $14,637 | $13,285 |
| 4/30/2018 | $12,702 | $14,693 | $13,329 |
| 5/31/2018 | $12,884 | $15,108 | $13,408 |
| 6/30/2018 | $12,875 | $15,207 | $13,442 |
| 7/31/2018 | $13,304 | $15,711 | $13,974 |
| 8/31/2018 | $13,513 | $16,263 | $14,180 |
| 9/30/2018 | $13,580 | $16,290 | $14,208 |
| 10/31/2018 | $12,671 | $15,090 | $13,472 |
| 11/30/2018 | $13,103 | $15,393 | $13,875 |
| 12/31/2018 | $11,842 | $13,960 | $12,542 |
| 1/31/2019 | $12,717 | $15,158 | $13,519 |
| 2/28/2019 | $13,006 | $15,691 | $13,951 |
| 3/31/2019 | $13,040 | $15,920 | $14,039 |
| 4/30/2019 | $13,495 | $16,556 | $14,537 |
| 5/31/2019 | $12,740 | $15,485 | $13,603 |
| 6/30/2019 | $13,517 | $16,572 | $14,579 |
| 7/31/2019 | $13,559 | $16,819 | $14,700 |
| 8/31/2019 | $13,153 | $16,476 | $14,268 |
| 9/30/2019 | $13,411 | $16,765 | $14,777 |
| 10/31/2019 | $13,652 | $17,126 | $14,983 |
| 11/30/2019 | $14,133 | $17,777 | $15,446 |
| 12/31/2019 | $14,575 | $18,290 | $15,871 |
| 1/31/2020 | $14,373 | $18,270 | $15,530 |
| 2/29/2020 | $13,247 | $16,774 | $14,026 |
| 3/31/2020 | $11,103 | $14,468 | $11,629 |
| 4/30/2020 | $12,152 | $16,384 | $12,936 |
| 5/31/2020 | $12,761 | $17,260 | $13,380 |
| 6/30/2020 | $12,642 | $17,655 | $13,291 |
| 7/31/2020 | $13,275 | $18,657 | $13,816 |
| 8/31/2020 | $14,123 | $20,009 | $14,387 |
| 9/30/2020 | $13,683 | $19,280 | $14,034 |
| 10/31/2020 | $13,554 | $18,864 | $13,850 |
| 11/30/2020 | $15,451 | $21,159 | $15,713 |
| 12/31/2020 | $16,021 | $22,111 | $16,315 |
| 1/31/2021 | $15,867 | $22,012 | $16,166 |
| 2/28/2021 | $17,108 | $22,700 | $17,143 |
| 3/31/2021 | $17,978 | $23,514 | $18,151 |
| 4/30/2021 | $18,817 | $24,726 | $18,877 |
| 5/31/2021 | $19,292 | $24,839 | $19,318 |
| 6/30/2021 | $19,075 | $25,452 | $19,097 |
| 7/31/2021 | $19,242 | $25,882 | $19,249 |
| 8/31/2021 | $19,741 | $26,620 | $19,631 |
| 9/30/2021 | $18,912 | $25,426 | $18,948 |
| 10/31/2021 | $19,981 | $27,145 | $19,910 |
| 11/30/2021 | $19,357 | $26,732 | $19,208 |
| 12/31/2021 | $20,795 | $27,785 | $20,420 |
| 1/31/2022 | $20,264 | $26,150 | $19,944 |
| 2/28/2022 | $20,248 | $25,491 | $19,713 |
| 3/31/2022 | $20,656 | $26,318 | $20,269 |
| 4/30/2022 | $19,322 | $23,956 | $19,126 |
| 5/31/2022 | $19,824 | $23,924 | $19,498 |
| 6/30/2022 | $18,149 | $21,923 | $17,794 |
| 7/31/2022 | $19,222 | $23,979 | $18,974 |
| 8/31/2022 | $18,654 | $23,084 | $18,409 |
| 9/30/2022 | $16,969 | $20,944 | $16,795 |
| 10/31/2022 | $18,715 | $22,661 | $18,517 |
| 11/30/2022 | $19,810 | $23,844 | $19,674 |
| 12/31/2022 | $18,984 | $22,448 | $18,881 |
| 1/31/2023 | $19,924 | $23,994 | $19,859 |
| 2/28/2023 | $19,175 | $23,433 | $19,159 |
| 3/31/2023 | $18,963 | $24,060 | $19,071 |
| 4/30/2023 | $19,091 | $24,316 | $19,358 |
| 5/31/2023 | $18,498 | $24,411 | $18,611 |
| 6/30/2023 | $19,512 | $26,078 | $19,848 |
| 7/31/2023 | $20,398 | $27,013 | $20,546 |
| 8/31/2023 | $19,786 | $26,491 | $19,991 |
| 9/30/2023 | $19,055 | $25,229 | $19,220 |
| 10/31/2023 | $18,391 | $24,560 | $18,541 |
| 11/30/2023 | $19,735 | $26,851 | $19,940 |
| 12/31/2023 | $20,867 | $28,275 | $21,045 |
| 1/31/2024 | $21,062 | $28,588 | $21,067 |
| 2/29/2024 | $22,086 | $30,136 | $21,844 |
| 3/31/2024 | $23,471 | $31,108 | $22,936 |
| 4/30/2024 | $22,736 | $29,739 | $21,956 |
| 5/31/2024 | $23,634 | $31,144 | $22,652 |
| 6/30/2024 | $23,667 | $32,108 | $22,439 |
| 7/31/2024 | $24,371 | $32,705 | $23,586 |
Annual Shareholder Report | July 31, 2024
AVERAGE ANNUAL TOTAL RETURNS (%)
| 1 Year | 5 Years | 10 Years |
|---|
Class R6Footnote Reference* | 19.48 | 12.44 | 9.32 |
Russell 3000® Index | 21.07 | 14.23 | 12.58 |
Russell 1000® Value Index | 14.80 | 9.92 | 8.96 |
| Total net assets | $242,851,310 |
| # of portfolio holdings | 124 |
| Portfolio turnover rate | 237% |
| Total advisory fees paid | $582,758 |
| Footnote | Description |
Footnote* | Historical performance shown for the Class R6 shares prior to their inception on April 7, 2017 reflects the performance of the Institutional Class shares, and includes the higher expenses applicable to the Institutional Class shares. If these expenses had not been included, returns for the Class R6 shares would be higher. |
What did the Fund invest in?
(Based on long-term investments)
TOP TEN HOLDINGS (% OF NET ASSETS)
| Berkshire Hathaway, Inc. Class B | 3.4 |
| Bristol-Myers Squibb Co. | 2.8 |
| Walmart, Inc. | 2.6 |
| Cigna Group | 2.5 |
| Elevance Health, Inc. | 2.4 |
| Citigroup, Inc. | 2.4 |
| General Dynamics Corp. | 2.3 |
| Parker-Hannifin Corp. | 2.2 |
| Colgate-Palmolive Co. | 2.2 |
| Exxon Mobil Corp. | 2.1 |
SECTOR ALLOCATION (% OF LONG-TERM INVESTMENTS)
| Financials | 23.8 |
| Health care | 16.6 |
| Industrials | 13.7 |
| Information technology | 8.7 |
| Consumer staples | 8.3 |
| Energy | 6.9 |
| Consumer discretionary | 6.2 |
| Communication services | 4.9 |
| Utilities | 3.9 |
| Materials | 4.1 |
| Real estate | 2.9 |
You can find additional information on the Fund's website at allspringglobal.com, including its:
- Prospectus - Financial Information - Fund holdings - Proxy voting information
Annual Shareholder Report
This annual shareholder report contains important information about Large Company Value Fund for the period of August 1, 2023 to July 31, 2024. You can find additional information about the Fund at allspringglobal.com. You can also request this information by contacting us at 1-800-222-8222.
What were the Fund costs for the past year?
The table explains the costs you would have paid within the reporting period based on a hypothetical $10,000 investment.
| CLASS NAME | COST OF A $10,000 INVESTMENT | COSTS PAID AS A % OF A $10,000 INVESTMENT |
|---|
| Class C | $171 | 1.57% |
The manager has contractually committed to waive fees and/or reimburse certain expenses to the extent necessary to cap the Fund's total annual fund operating expense ratio at a specific amount. Without this cap, the costs shown above may have been higher. Please see the prospectus for the amount and the expiration date of the cap. Prior to or after the commitment expiration date, the cap may be increased or the commitment to maintain the cap may be terminated only with the approval of the Board of Trustees.
How did the Fund perform last year and what affected its performance?
U.S. equities continued to move sharply higher, with the S&P 500 Index delivering a 22.15% return for the 12-month period that ended on July 31, 2024. The Fund outperformed its benchmark, the Russell 1000® Value Index, by more than 400 basis points (bps; 100 bps equal 1.00%) for the 12-month period.
The Fund outperformed primarily due to the success of the stock selection model, driven by our intention to weight stocks according to their factor potential. Over the past year, a primary headwind occurred with certain sector exposures. From a sector perspective, the Fund’s overweight to consumer discretionary securities was the greatest detractor.
Throughout the past 12 months, the dynamic stock selection model gravitated toward securities with attractive factor exposures and away from securities with unattractive factor exposures. For instance, exposure to 12-month momentum – high growth increased significantly. On the other hand, there was an outsized decrease in exposure to the yield beta factor.
Total return based on a $10,000 investment
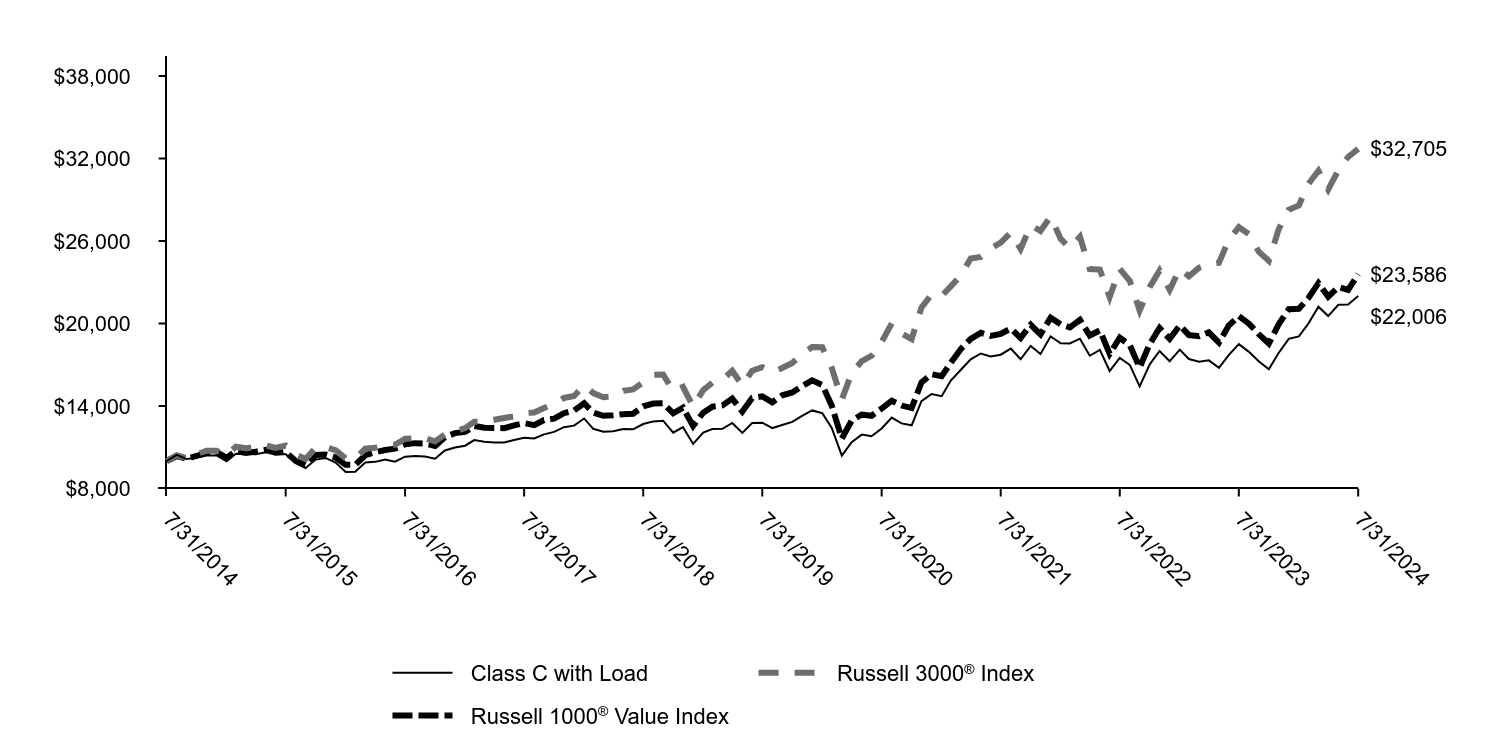
| Class C with Load | Russell 3000® Index | Russell 1000® Value Index |
|---|
| 7/31/2014 | $10,000 | $10,000 | $10,000 |
| 8/31/2014 | $10,444 | $10,420 | $10,368 |
| 9/30/2014 | $10,140 | $10,202 | $10,154 |
| 10/31/2014 | $10,234 | $10,483 | $10,382 |
| 11/30/2014 | $10,403 | $10,737 | $10,594 |
| 12/31/2014 | $10,409 | $10,737 | $10,659 |
| 1/31/2015 | $9,974 | $10,438 | $10,233 |
| 2/28/2015 | $10,524 | $11,043 | $10,728 |
| 3/31/2015 | $10,516 | $10,930 | $10,582 |
| 4/30/2015 | $10,497 | $10,980 | $10,681 |
| 5/31/2015 | $10,644 | $11,132 | $10,810 |
| 6/30/2015 | $10,563 | $10,945 | $10,594 |
| 7/31/2015 | $10,492 | $11,128 | $10,640 |
| 8/31/2015 | $9,846 | $10,457 | $10,007 |
| 9/30/2015 | $9,495 | $10,152 | $9,705 |
| 10/31/2015 | $10,102 | $10,954 | $10,437 |
| 11/30/2015 | $10,224 | $11,014 | $10,477 |
| 12/31/2015 | $9,888 | $10,788 | $10,251 |
| 1/31/2016 | $9,197 | $10,180 | $9,722 |
| 2/29/2016 | $9,211 | $10,176 | $9,719 |
| 3/31/2016 | $9,889 | $10,893 | $10,419 |
| 4/30/2016 | $9,938 | $10,960 | $10,638 |
| 5/31/2016 | $10,104 | $11,156 | $10,803 |
| 6/30/2016 | $9,949 | $11,179 | $10,897 |
| 7/31/2016 | $10,316 | $11,623 | $11,213 |
| 8/31/2016 | $10,358 | $11,653 | $11,300 |
| 9/30/2016 | $10,326 | $11,671 | $11,276 |
| 10/31/2016 | $10,167 | $11,419 | $11,102 |
| 11/30/2016 | $10,763 | $11,930 | $11,736 |
| 12/31/2016 | $10,988 | $12,162 | $12,029 |
| 1/31/2017 | $11,113 | $12,391 | $12,115 |
| 2/28/2017 | $11,522 | $12,852 | $12,550 |
| 3/31/2017 | $11,400 | $12,861 | $12,422 |
| 4/30/2017 | $11,351 | $12,997 | $12,399 |
| 5/31/2017 | $11,344 | $13,130 | $12,387 |
| 6/30/2017 | $11,532 | $13,249 | $12,589 |
| 7/31/2017 | $11,698 | $13,498 | $12,757 |
| 8/31/2017 | $11,636 | $13,524 | $12,608 |
| 9/30/2017 | $11,939 | $13,854 | $12,981 |
| 10/31/2017 | $12,119 | $14,157 | $13,076 |
| 11/30/2017 | $12,459 | $14,586 | $13,476 |
| 12/31/2017 | $12,572 | $14,732 | $13,673 |
| 1/31/2018 | $13,094 | $15,509 | $14,201 |
| 2/28/2018 | $12,341 | $14,937 | $13,523 |
| 3/31/2018 | $12,135 | $14,637 | $13,285 |
| 4/30/2018 | $12,161 | $14,693 | $13,329 |
| 5/31/2018 | $12,323 | $15,108 | $13,408 |
| 6/30/2018 | $12,306 | $15,207 | $13,442 |
| 7/31/2018 | $12,692 | $15,711 | $13,974 |
| 8/31/2018 | $12,880 | $16,263 | $14,180 |
| 9/30/2018 | $12,931 | $16,290 | $14,208 |
| 10/31/2018 | $12,056 | $15,090 | $13,472 |
| 11/30/2018 | $12,459 | $15,393 | $13,875 |
| 12/31/2018 | $11,243 | $13,960 | $12,542 |
| 1/31/2019 | $12,065 | $15,158 | $13,519 |
| 2/28/2019 | $12,323 | $15,691 | $13,951 |
| 3/31/2019 | $12,346 | $15,920 | $14,039 |
| 4/30/2019 | $12,767 | $16,556 | $14,537 |
| 5/31/2019 | $12,040 | $15,485 | $13,603 |
| 6/30/2019 | $12,760 | $16,572 | $14,579 |
| 7/31/2019 | $12,788 | $16,819 | $14,700 |
| 8/31/2019 | $12,395 | $16,476 | $14,268 |
| 9/30/2019 | $12,620 | $16,765 | $14,777 |
| 10/31/2019 | $12,841 | $17,126 | $14,983 |
| 11/30/2019 | $13,283 | $17,777 | $15,446 |
| 12/31/2019 | $13,678 | $18,290 | $15,871 |
| 1/31/2020 | $13,475 | $18,270 | $15,530 |
| 2/29/2020 | $12,411 | $16,774 | $14,026 |
| 3/31/2020 | $10,398 | $14,468 | $11,629 |
| 4/30/2020 | $11,368 | $16,384 | $12,936 |
| 5/31/2020 | $11,921 | $17,260 | $13,380 |
| 6/30/2020 | $11,798 | $17,655 | $13,291 |
| 7/31/2020 | $12,370 | $18,657 | $13,816 |
| 8/31/2020 | $13,156 | $20,009 | $14,387 |
| 9/30/2020 | $12,736 | $19,280 | $14,034 |
| 10/31/2020 | $12,600 | $18,864 | $13,850 |
| 11/30/2020 | $14,348 | $21,159 | $15,713 |
| 12/31/2020 | $14,870 | $22,111 | $16,315 |
| 1/31/2021 | $14,712 | $22,012 | $16,166 |
| 2/28/2021 | $15,848 | $22,700 | $17,143 |
| 3/31/2021 | $16,638 | $23,514 | $18,151 |
| 4/30/2021 | $17,391 | $24,726 | $18,877 |
| 5/31/2021 | $17,818 | $24,839 | $19,318 |
| 6/30/2021 | $17,601 | $25,452 | $19,097 |
| 7/31/2021 | $17,730 | $25,882 | $19,249 |
| 8/31/2021 | $18,178 | $26,620 | $19,631 |
| 9/30/2021 | $17,401 | $25,426 | $18,948 |
| 10/31/2021 | $18,365 | $27,145 | $19,910 |
| 11/30/2021 | $17,779 | $26,732 | $19,208 |
| 12/31/2021 | $19,067 | $27,785 | $20,420 |
| 1/31/2022 | $18,559 | $26,150 | $19,944 |
| 2/28/2022 | $18,545 | $25,491 | $19,713 |
| 3/31/2022 | $18,894 | $26,318 | $20,269 |
| 4/30/2022 | $17,655 | $23,956 | $19,126 |
| 5/31/2022 | $18,082 | $23,924 | $19,498 |
| 6/30/2022 | $16,546 | $21,923 | $17,794 |
| 7/31/2022 | $17,499 | $23,979 | $18,974 |
| 8/31/2022 | $16,978 | $23,084 | $18,409 |
| 9/30/2022 | $15,431 | $20,944 | $16,795 |
| 10/31/2022 | $17,029 | $22,661 | $18,517 |
| 11/30/2022 | $18,003 | $23,844 | $19,674 |
| 12/31/2022 | $17,254 | $22,448 | $18,881 |
| 1/31/2023 | $18,099 | $23,994 | $19,859 |
| 2/28/2023 | $17,414 | $23,433 | $19,159 |
| 3/31/2023 | $17,218 | $24,060 | $19,071 |
| 4/30/2023 | $17,321 | $24,316 | $19,358 |
| 5/31/2023 | $16,779 | $24,411 | $18,611 |
| 6/30/2023 | $17,702 | $26,078 | $19,848 |
| 7/31/2023 | $18,496 | $27,013 | $20,546 |
| 8/31/2023 | $17,937 | $26,491 | $19,991 |
| 9/30/2023 | $17,255 | $25,229 | $19,220 |
| 10/31/2023 | $16,665 | $24,560 | $18,541 |
| 11/30/2023 | $17,860 | $26,851 | $19,940 |
| 12/31/2023 | $18,886 | $28,275 | $21,045 |
| 1/31/2024 | $19,064 | $28,588 | $21,067 |
| 2/29/2024 | $19,981 | $30,136 | $21,844 |
| 3/31/2024 | $21,224 | $31,108 | $22,936 |
| 4/30/2024 | $20,541 | $29,739 | $21,956 |
| 5/31/2024 | $21,358 | $31,144 | $22,652 |
| 6/30/2024 | $21,381 | $32,108 | $22,439 |
| 7/31/2024 | $22,006 | $32,705 | $23,586 |
Annual Shareholder Report | July 31, 2024
AVERAGE ANNUAL TOTAL RETURNS (%)
| 1 Year | 5 Years | 10 Years |
|---|
| Class C | 18.05 | 11.14 | 8.21 |
| Class C with Load | 17.05 | 11.14 | 8.21 |
Russell 3000® Index | 21.07 | 14.23 | 12.58 |
Russell 1000® Value Index | 14.80 | 9.92 | 8.96 |
| Total net assets | $242,851,310 |
| # of portfolio holdings | 124 |
| Portfolio turnover rate | 237% |
| Total advisory fees paid | $582,758 |
What did the Fund invest in?
(Based on long-term investments)
TOP TEN HOLDINGS (% OF NET ASSETS)
| Berkshire Hathaway, Inc. Class B | 3.4 |
| Bristol-Myers Squibb Co. | 2.8 |
| Walmart, Inc. | 2.6 |
| Cigna Group | 2.5 |
| Elevance Health, Inc. | 2.4 |
| Citigroup, Inc. | 2.4 |
| General Dynamics Corp. | 2.3 |
| Parker-Hannifin Corp. | 2.2 |
| Colgate-Palmolive Co. | 2.2 |
| Exxon Mobil Corp. | 2.1 |
SECTOR ALLOCATION (% OF LONG-TERM INVESTMENTS)
| Financials | 23.8 |
| Health care | 16.6 |
| Industrials | 13.7 |
| Information technology | 8.7 |
| Consumer staples | 8.3 |
| Energy | 6.9 |
| Consumer discretionary | 6.2 |
| Communication services | 4.9 |
| Utilities | 3.9 |
| Materials | 4.1 |
| Real estate | 2.9 |
You can find additional information on the Fund's website at allspringglobal.com, including its:
- Prospectus - Financial Information - Fund holdings - Proxy voting information
Annual Shareholder Report
This annual shareholder report contains important information about Large Company Value Fund for the period of August 1, 2023 to July 31, 2024. You can find additional information about the Fund at allspringglobal.com. You can also request this information by contacting us at 1-800-222-8222.
What were the Fund costs for the past year?
The table explains the costs you would have paid within the reporting period based on a hypothetical $10,000 investment.
| CLASS NAME | COST OF A $10,000 INVESTMENT | COSTS PAID AS A % OF A $10,000 INVESTMENT |
|---|
| Class A | $88 | 0.80% |
The manager has contractually committed to waive fees and/or reimburse certain expenses to the extent necessary to cap the Fund's total annual fund operating expense ratio at a specific amount. Without this cap, the costs shown above may have been higher. Please see the prospectus for the amount and the expiration date of the cap. Prior to or after the commitment expiration date, the cap may be increased or the commitment to maintain the cap may be terminated only with the approval of the Board of Trustees.
How did the Fund perform last year and what affected its performance?
U.S. equities continued to move sharply higher, with the S&P 500 Index delivering a 22.15% return for the 12-month period that ended on July 31, 2024. The Fund outperformed its benchmark, the Russell 1000® Value Index, by more than 400 basis points (bps; 100 bps equal 1.00%) for the 12-month period.
The Fund outperformed primarily due to the success of the stock selection model, driven by our intention to weight stocks according to their factor potential. Over the past year, a primary headwind occurred with certain sector exposures. From a sector perspective, the Fund’s overweight to consumer discretionary securities was the greatest detractor.
Throughout the past 12 months, the dynamic stock selection model gravitated toward securities with attractive factor exposures and away from securities with unattractive factor exposures. For instance, exposure to 12-month momentum – high growth increased significantly. On the other hand, there was an outsized decrease in exposure to the yield beta factor.
Total return based on a $10,000 investment

| Class A with Load | Russell 3000® Index | Russell 1000® Value Index |
|---|
| 7/31/2014 | $9,423 | $10,000 | $10,000 |
| 8/31/2014 | $9,849 | $10,420 | $10,368 |
| 9/30/2014 | $9,567 | $10,202 | $10,154 |
| 10/31/2014 | $9,662 | $10,483 | $10,382 |
| 11/30/2014 | $9,825 | $10,737 | $10,594 |
| 12/31/2014 | $9,840 | $10,737 | $10,659 |
| 1/31/2015 | $9,427 | $10,438 | $10,233 |
| 2/28/2015 | $9,957 | $11,043 | $10,728 |
| 3/31/2015 | $9,960 | $10,930 | $10,582 |
| 4/30/2015 | $9,948 | $10,980 | $10,681 |
| 5/31/2015 | $10,090 | $11,132 | $10,810 |
| 6/30/2015 | $10,017 | $10,945 | $10,594 |
| 7/31/2015 | $9,962 | $11,128 | $10,640 |
| 8/31/2015 | $9,355 | $10,457 | $10,007 |
| 9/30/2015 | $9,028 | $10,152 | $9,705 |
| 10/31/2015 | $9,611 | $10,954 | $10,437 |
| 11/30/2015 | $9,729 | $11,014 | $10,477 |
| 12/31/2015 | $9,412 | $10,788 | $10,251 |
| 1/31/2016 | $8,760 | $10,180 | $9,722 |
| 2/29/2016 | $8,780 | $10,176 | $9,719 |
| 3/31/2016 | $9,433 | $10,893 | $10,419 |
| 4/30/2016 | $9,487 | $10,960 | $10,638 |
| 5/31/2016 | $9,649 | $11,156 | $10,803 |
| 6/30/2016 | $9,506 | $11,179 | $10,897 |
| 7/31/2016 | $9,864 | $11,623 | $11,213 |
| 8/31/2016 | $9,912 | $11,653 | $11,300 |
| 9/30/2016 | $9,892 | $11,671 | $11,276 |
| 10/31/2016 | $9,743 | $11,419 | $11,102 |
| 11/30/2016 | $10,319 | $11,930 | $11,736 |
| 12/31/2016 | $10,542 | $12,162 | $12,029 |
| 1/31/2017 | $10,664 | $12,391 | $12,115 |
| 2/28/2017 | $11,072 | $12,852 | $12,550 |
| 3/31/2017 | $10,956 | $12,861 | $12,422 |
| 4/30/2017 | $10,915 | $12,997 | $12,399 |
| 5/31/2017 | $10,922 | $13,130 | $12,387 |
| 6/30/2017 | $11,099 | $13,249 | $12,589 |
| 7/31/2017 | $11,269 | $13,498 | $12,757 |
| 8/31/2017 | $11,221 | $13,524 | $12,608 |
| 9/30/2017 | $11,512 | $13,854 | $12,981 |
| 10/31/2017 | $11,697 | $14,157 | $13,076 |
| 11/30/2017 | $12,039 | $14,586 | $13,476 |
| 12/31/2017 | $12,153 | $14,732 | $13,673 |
| 1/31/2018 | $12,663 | $15,509 | $14,201 |
| 2/28/2018 | $11,940 | $14,937 | $13,523 |
| 3/31/2018 | $11,747 | $14,637 | $13,285 |
| 4/30/2018 | $11,781 | $14,693 | $13,329 |
| 5/31/2018 | $11,943 | $15,108 | $13,408 |
| 6/30/2018 | $11,935 | $15,207 | $13,442 |
| 7/31/2018 | $12,327 | $15,711 | $13,974 |
| 8/31/2018 | $12,514 | $16,263 | $14,180 |
| 9/30/2018 | $12,567 | $16,290 | $14,208 |
| 10/31/2018 | $11,727 | $15,090 | $13,472 |
| 11/30/2018 | $12,130 | $15,393 | $13,875 |
| 12/31/2018 | $10,948 | $13,960 | $12,542 |
| 1/31/2019 | $11,754 | $15,158 | $13,519 |
| 2/28/2019 | $12,023 | $15,691 | $13,951 |
| 3/31/2019 | $12,045 | $15,920 | $14,039 |
| 4/30/2019 | $12,469 | $16,556 | $14,537 |
| 5/31/2019 | $11,765 | $15,485 | $13,603 |
| 6/30/2019 | $12,476 | $16,572 | $14,579 |
| 7/31/2019 | $12,505 | $16,819 | $14,700 |
| 8/31/2019 | $12,127 | $16,476 | $14,268 |
| 9/30/2019 | $12,363 | $16,765 | $14,777 |
| 10/31/2019 | $12,587 | $17,126 | $14,983 |
| 11/30/2019 | $13,025 | $17,777 | $15,446 |
| 12/31/2019 | $13,422 | $18,290 | $15,871 |
| 1/31/2020 | $13,225 | $18,270 | $15,530 |
| 2/29/2020 | $12,193 | $16,774 | $14,026 |
| 3/31/2020 | $10,219 | $14,468 | $11,629 |
| 4/30/2020 | $11,188 | $16,384 | $12,936 |
| 5/31/2020 | $11,741 | $17,260 | $13,380 |
| 6/30/2020 | $11,629 | $17,655 | $13,291 |
| 7/31/2020 | $12,194 | $18,657 | $13,816 |
| 8/31/2020 | $12,967 | $20,009 | $14,387 |
| 9/30/2020 | $12,567 | $19,280 | $14,034 |
| 10/31/2020 | $12,437 | $18,864 | $13,850 |
| 11/30/2020 | $14,177 | $21,159 | $15,713 |
| 12/31/2020 | $14,695 | $22,111 | $16,315 |
| 1/31/2021 | $14,553 | $22,012 | $16,166 |
| 2/28/2021 | $15,687 | $22,700 | $17,143 |
| 3/31/2021 | $16,484 | $23,514 | $18,151 |
| 4/30/2021 | $17,237 | $24,726 | $18,877 |
| 5/31/2021 | $17,664 | $24,839 | $19,318 |
| 6/30/2021 | $17,466 | $25,452 | $19,097 |
| 7/31/2021 | $17,609 | $25,882 | $19,249 |
| 8/31/2021 | $18,058 | $26,620 | $19,631 |
| 9/30/2021 | $17,297 | $25,426 | $18,948 |
| 10/31/2021 | $18,270 | $27,145 | $19,910 |
| 11/30/2021 | $17,697 | $26,732 | $19,208 |
| 12/31/2021 | $18,999 | $27,785 | $20,420 |
| 1/31/2022 | $18,497 | $26,150 | $19,944 |
| 2/28/2022 | $18,497 | $25,491 | $19,713 |
| 3/31/2022 | $18,855 | $26,318 | $20,269 |
| 4/30/2022 | $17,630 | $23,956 | $19,126 |
| 5/31/2022 | $18,077 | $23,924 | $19,498 |
| 6/30/2022 | $16,534 | $21,923 | $17,794 |
| 7/31/2022 | $17,519 | $23,979 | $18,974 |
| 8/31/2022 | $16,998 | $23,084 | $18,409 |
| 9/30/2022 | $15,448 | $20,944 | $16,795 |
| 10/31/2022 | $17,048 | $22,661 | $18,517 |
| 11/30/2022 | $18,023 | $23,844 | $19,674 |
| 12/31/2022 | $17,274 | $22,448 | $18,881 |
| 1/31/2023 | $18,120 | $23,994 | $19,859 |
| 2/28/2023 | $17,434 | $23,433 | $19,159 |
| 3/31/2023 | $17,238 | $24,060 | $19,071 |
| 4/30/2023 | $17,340 | $24,316 | $19,358 |
| 5/31/2023 | $16,798 | $24,411 | $18,611 |
| 6/30/2023 | $17,722 | $26,078 | $19,848 |
| 7/31/2023 | $18,517 | $27,013 | $20,546 |
| 8/31/2023 | $17,957 | $26,491 | $19,991 |
| 9/30/2023 | $17,275 | $25,229 | $19,220 |
| 10/31/2023 | $16,683 | $24,560 | $18,541 |
| 11/30/2023 | $17,880 | $26,851 | $19,940 |
| 12/31/2023 | $18,907 | $28,275 | $21,045 |
| 1/31/2024 | $19,085 | $28,588 | $21,067 |
| 2/29/2024 | $20,004 | $30,136 | $21,844 |
| 3/31/2024 | $21,248 | $31,108 | $22,936 |
| 4/30/2024 | $20,564 | $29,739 | $21,956 |
| 5/31/2024 | $21,382 | $31,144 | $22,652 |
| 6/30/2024 | $21,405 | $32,108 | $22,439 |
| 7/31/2024 | $22,031 | $32,705 | $23,586 |
Annual Shareholder Report | July 31, 2024
AVERAGE ANNUAL TOTAL RETURNS (%)
| 1 Year | 5 Years | 10 Years |
|---|
| Class A | 18.98 | 11.99 | 8.86 |
| Class A with Load | 12.12 | 10.67 | 8.22 |
Russell 3000® Index | 21.07 | 14.23 | 12.58 |
Russell 1000® Value Index | 14.80 | 9.92 | 8.96 |
| Total net assets | $242,851,310 |
| # of portfolio holdings | 124 |
| Portfolio turnover rate | 237% |
| Total advisory fees paid | $582,758 |
What did the Fund invest in?
(Based on long-term investments)
TOP TEN HOLDINGS (% OF NET ASSETS)
| Berkshire Hathaway, Inc. Class B | 3.4 |
| Bristol-Myers Squibb Co. | 2.8 |
| Walmart, Inc. | 2.6 |
| Cigna Group | 2.5 |
| Elevance Health, Inc. | 2.4 |
| Citigroup, Inc. | 2.4 |
| General Dynamics Corp. | 2.3 |
| Parker-Hannifin Corp. | 2.2 |
| Colgate-Palmolive Co. | 2.2 |
| Exxon Mobil Corp. | 2.1 |
SECTOR ALLOCATION (% OF LONG-TERM INVESTMENTS)
| Financials | 23.8 |
| Health care | 16.6 |
| Industrials | 13.7 |
| Information technology | 8.7 |
| Consumer staples | 8.3 |
| Energy | 6.9 |
| Consumer discretionary | 6.2 |
| Communication services | 4.9 |
| Utilities | 3.9 |
| Materials | 4.1 |
| Real estate | 2.9 |
You can find additional information on the Fund's website at allspringglobal.com, including its:
- Prospectus - Financial Information - Fund holdings - Proxy voting information
Annual Shareholder Report
This annual shareholder report contains important information about Large Company Value Fund for the period of August 1, 2023 to July 31, 2024. You can find additional information about the Fund at allspringglobal.com. You can also request this information by contacting us at 1-800-222-8222.
What were the Fund costs for the past year?
The table explains the costs you would have paid within the reporting period based on a hypothetical $10,000 investment.
| CLASS NAME | COST OF A $10,000 INVESTMENT | COSTS PAID AS A % OF A $10,000 INVESTMENT |
|---|
| Administrator Class | $81 | 0.74% |
The manager has contractually committed to waive fees and/or reimburse certain expenses to the extent necessary to cap the Fund's total annual fund operating expense ratio at a specific amount. Without this cap, the costs shown above may have been higher. Please see the prospectus for the amount and the expiration date of the cap. Prior to or after the commitment expiration date, the cap may be increased or the commitment to maintain the cap may be terminated only with the approval of the Board of Trustees.
How did the Fund perform last year and what affected its performance?
U.S. equities continued to move sharply higher, with the S&P 500 Index delivering a 22.15% return for the 12-month period that ended on July 31, 2024. The Fund outperformed its benchmark, the Russell 1000® Value Index, by more than 400 basis points (bps; 100 bps equal 1.00%) for the 12-month period.
The Fund outperformed primarily due to the success of the stock selection model, driven by our intention to weight stocks according to their factor potential. Over the past year, a primary headwind occurred with certain sector exposures. From a sector perspective, the Fund’s overweight to consumer discretionary securities was the greatest detractor.
Throughout the past 12 months, the dynamic stock selection model gravitated toward securities with attractive factor exposures and away from securities with unattractive factor exposures. For instance, exposure to 12-month momentum – high growth increased significantly. On the other hand, there was an outsized decrease in exposure to the yield beta factor.
Total return based on a $10,000 investment
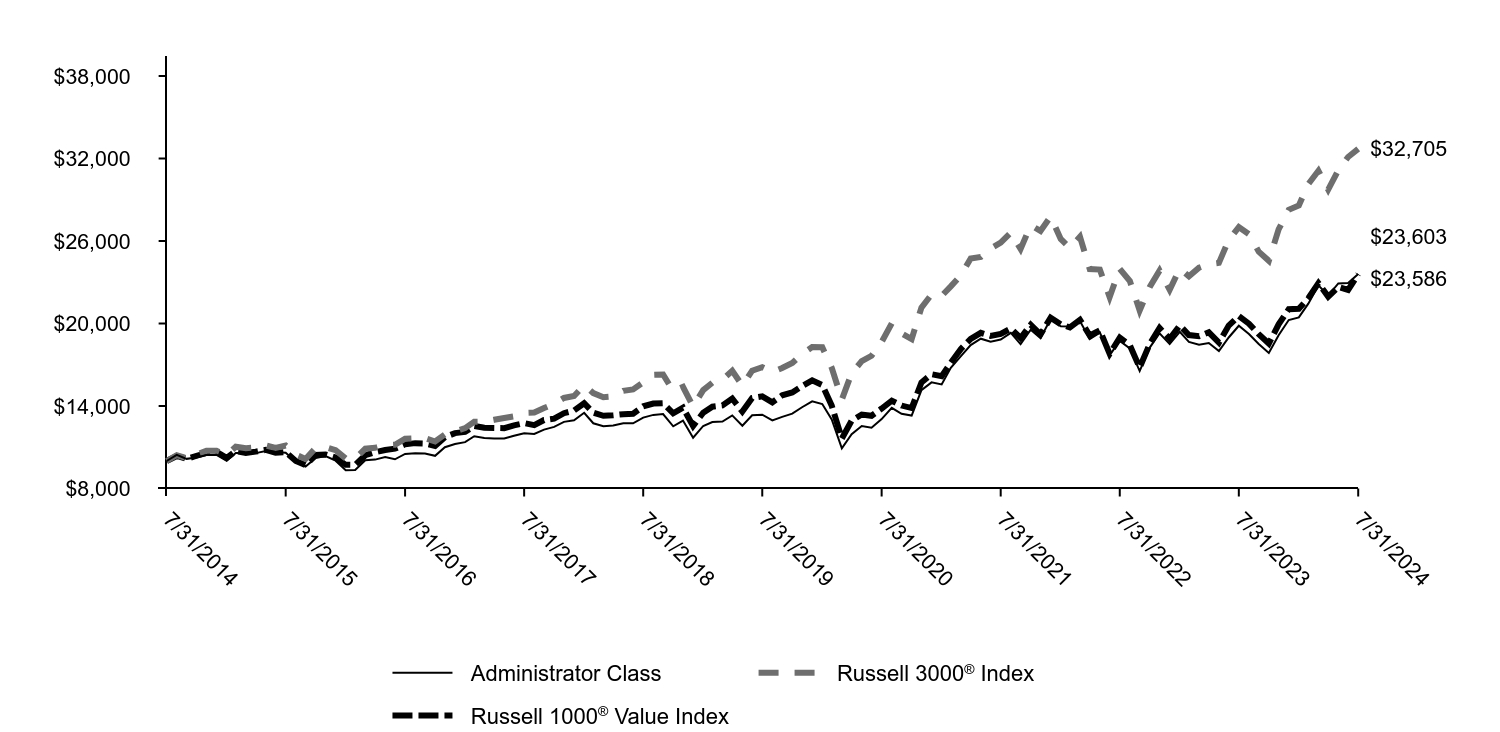
| Administrator Class | Russell 3000® Index | Russell 1000® Value Index |
|---|
| 7/31/2014 | $10,000 | $10,000 | $10,000 |
| 8/31/2014 | $10,449 | $10,420 | $10,368 |
| 9/30/2014 | $10,156 | $10,202 | $10,154 |
| 10/31/2014 | $10,256 | $10,483 | $10,382 |
| 11/30/2014 | $10,434 | $10,737 | $10,594 |
| 12/31/2014 | $10,448 | $10,737 | $10,659 |
| 1/31/2015 | $10,019 | $10,438 | $10,233 |
| 2/28/2015 | $10,585 | $11,043 | $10,728 |
| 3/31/2015 | $10,587 | $10,930 | $10,582 |
| 4/30/2015 | $10,574 | $10,980 | $10,681 |
| 5/31/2015 | $10,730 | $11,132 | $10,810 |
| 6/30/2015 | $10,654 | $10,945 | $10,594 |
| 7/31/2015 | $10,595 | $11,128 | $10,640 |
| 8/31/2015 | $9,954 | $10,457 | $10,007 |
| 9/30/2015 | $9,602 | $10,152 | $9,705 |
| 10/31/2015 | $10,225 | $10,954 | $10,437 |
| 11/30/2015 | $10,356 | $11,014 | $10,477 |
| 12/31/2015 | $10,023 | $10,788 | $10,251 |
| 1/31/2016 | $9,333 | $10,180 | $9,722 |
| 2/29/2016 | $9,348 | $10,176 | $9,719 |
| 3/31/2016 | $10,052 | $10,893 | $10,419 |
| 4/30/2016 | $10,102 | $10,960 | $10,638 |
| 5/31/2016 | $10,281 | $11,156 | $10,803 |
| 6/30/2016 | $10,125 | $11,179 | $10,897 |
| 7/31/2016 | $10,511 | $11,623 | $11,213 |
| 8/31/2016 | $10,561 | $11,653 | $11,300 |
| 9/30/2016 | $10,542 | $11,671 | $11,276 |
| 10/31/2016 | $10,377 | $11,419 | $11,102 |
| 11/30/2016 | $11,001 | $11,930 | $11,736 |
| 12/31/2016 | $11,240 | $12,162 | $12,029 |
| 1/31/2017 | $11,370 | $12,391 | $12,115 |
| 2/28/2017 | $11,802 | $12,852 | $12,550 |
| 3/31/2017 | $11,681 | $12,861 | $12,422 |
| 4/30/2017 | $11,638 | $12,997 | $12,399 |
| 5/31/2017 | $11,645 | $13,130 | $12,387 |
| 6/30/2017 | $11,840 | $13,249 | $12,589 |
| 7/31/2017 | $12,020 | $13,498 | $12,757 |
| 8/31/2017 | $11,962 | $13,524 | $12,608 |
| 9/30/2017 | $12,281 | $13,854 | $12,981 |
| 10/31/2017 | $12,484 | $14,157 | $13,076 |
| 11/30/2017 | $12,846 | $14,586 | $13,476 |
| 12/31/2017 | $12,960 | $14,732 | $13,673 |
| 1/31/2018 | $13,509 | $15,509 | $14,201 |
| 2/28/2018 | $12,744 | $14,937 | $13,523 |
| 3/31/2018 | $12,533 | $14,637 | $13,285 |
| 4/30/2018 | $12,578 | $14,693 | $13,329 |
| 5/31/2018 | $12,749 | $15,108 | $13,408 |
| 6/30/2018 | $12,740 | $15,207 | $13,442 |
| 7/31/2018 | $13,155 | $15,711 | $13,974 |
| 8/31/2018 | $13,353 | $16,263 | $14,180 |
| 9/30/2018 | $13,415 | $16,290 | $14,208 |
| 10/31/2018 | $12,526 | $15,090 | $13,472 |
| 11/30/2018 | $12,943 | $15,393 | $13,875 |
| 12/31/2018 | $11,696 | $13,960 | $12,542 |
| 1/31/2019 | $12,548 | $15,158 | $13,519 |
| 2/28/2019 | $12,833 | $15,691 | $13,951 |
| 3/31/2019 | $12,868 | $15,920 | $14,039 |
| 4/30/2019 | $13,316 | $16,556 | $14,537 |
| 5/31/2019 | $12,562 | $15,485 | $13,603 |
| 6/30/2019 | $13,326 | $16,572 | $14,579 |
| 7/31/2019 | $13,366 | $16,819 | $14,700 |
| 8/31/2019 | $12,957 | $16,476 | $14,268 |
| 9/30/2019 | $13,209 | $16,765 | $14,777 |
| 10/31/2019 | $13,446 | $17,126 | $14,983 |
| 11/30/2019 | $13,909 | $17,777 | $15,446 |
| 12/31/2019 | $14,338 | $18,290 | $15,871 |
| 1/31/2020 | $14,141 | $18,270 | $15,530 |
| 2/29/2020 | $13,028 | $16,774 | $14,026 |
| 3/31/2020 | $10,921 | $14,468 | $11,629 |
| 4/30/2020 | $11,956 | $16,384 | $12,936 |
| 5/31/2020 | $12,542 | $17,260 | $13,380 |
| 6/30/2020 | $12,426 | $17,655 | $13,291 |
| 7/31/2020 | $13,045 | $18,657 | $13,816 |
| 8/31/2020 | $13,862 | $20,009 | $14,387 |
| 9/30/2020 | $13,431 | $19,280 | $14,034 |
| 10/31/2020 | $13,305 | $18,864 | $13,850 |
| 11/30/2020 | $15,157 | $21,159 | $15,713 |
| 12/31/2020 | $15,719 | $22,111 | $16,315 |
| 1/31/2021 | $15,569 | $22,012 | $16,166 |
| 2/28/2021 | $16,780 | $22,700 | $17,143 |
| 3/31/2021 | $17,626 | $23,514 | $18,151 |
| 4/30/2021 | $18,434 | $24,726 | $18,877 |
| 5/31/2021 | $18,897 | $24,839 | $19,318 |
| 6/30/2021 | $18,680 | $25,452 | $19,097 |
| 7/31/2021 | $18,831 | $25,882 | $19,249 |
| 8/31/2021 | $19,318 | $26,620 | $19,631 |
| 9/30/2021 | $18,504 | $25,426 | $18,948 |
| 10/31/2021 | $19,545 | $27,145 | $19,910 |
| 11/30/2021 | $18,927 | $26,732 | $19,208 |
| 12/31/2021 | $20,329 | $27,785 | $20,420 |
| 1/31/2022 | $19,799 | $26,150 | $19,944 |
| 2/28/2022 | $19,784 | $25,491 | $19,713 |
| 3/31/2022 | $20,180 | $26,318 | $20,269 |
| 4/30/2022 | $18,872 | $23,956 | $19,126 |
| 5/31/2022 | $19,343 | $23,924 | $19,498 |
| 6/30/2022 | $17,701 | $21,923 | $17,794 |
| 7/31/2022 | $18,739 | $23,979 | $18,974 |
| 8/31/2022 | $18,190 | $23,084 | $18,409 |
| 9/30/2022 | $16,543 | $20,944 | $16,795 |
| 10/31/2022 | $18,247 | $22,661 | $18,517 |
| 11/30/2022 | $19,290 | $23,844 | $19,674 |
| 12/31/2022 | $18,504 | $22,448 | $18,881 |
| 1/31/2023 | $19,396 | $23,994 | $19,859 |
| 2/28/2023 | $18,657 | $23,433 | $19,159 |
| 3/31/2023 | $18,453 | $24,060 | $19,071 |
| 4/30/2023 | $18,577 | $24,316 | $19,358 |
| 5/31/2023 | $17,989 | $24,411 | $18,611 |
| 6/30/2023 | $18,983 | $26,078 | $19,848 |
| 7/31/2023 | $19,837 | $27,013 | $20,546 |
| 8/31/2023 | $19,231 | $26,491 | $19,991 |
| 9/30/2023 | $18,511 | $25,229 | $19,220 |
| 10/31/2023 | $17,856 | $24,560 | $18,541 |
| 11/30/2023 | $19,150 | $26,851 | $19,940 |
| 12/31/2023 | $20,253 | $28,275 | $21,045 |
| 1/31/2024 | $20,441 | $28,588 | $21,067 |
| 2/29/2024 | $21,441 | $30,136 | $21,844 |
| 3/31/2024 | $22,773 | $31,108 | $22,936 |
| 4/30/2024 | $22,035 | $29,739 | $21,956 |
| 5/31/2024 | $22,914 | $31,144 | $22,652 |
| 6/30/2024 | $22,942 | $32,108 | $22,439 |
| 7/31/2024 | $23,603 | $32,705 | $23,586 |
Annual Shareholder Report | July 31, 2024
AVERAGE ANNUAL TOTAL RETURNS (%)
| 1 Year | 5 Years | 10 Years |
|---|
| Administrator Class | 18.98 | 12.04 | 8.97 |
Russell 3000® Index | 21.07 | 14.23 | 12.58 |
Russell 1000® Value Index | 14.80 | 9.92 | 8.96 |
| Total net assets | $242,851,310 |
| # of portfolio holdings | 124 |
| Portfolio turnover rate | 237% |
| Total advisory fees paid | $582,758 |
What did the Fund invest in?
(Based on long-term investments)
TOP TEN HOLDINGS (% OF NET ASSETS)
| Berkshire Hathaway, Inc. Class B | 3.4 |
| Bristol-Myers Squibb Co. | 2.8 |
| Walmart, Inc. | 2.6 |
| Cigna Group | 2.5 |
| Elevance Health, Inc. | 2.4 |
| Citigroup, Inc. | 2.4 |
| General Dynamics Corp. | 2.3 |
| Parker-Hannifin Corp. | 2.2 |
| Colgate-Palmolive Co. | 2.2 |
| Exxon Mobil Corp. | 2.1 |
SECTOR ALLOCATION (% OF LONG-TERM INVESTMENTS)
| Financials | 23.8 |
| Health care | 16.6 |
| Industrials | 13.7 |
| Information technology | 8.7 |
| Consumer staples | 8.3 |
| Energy | 6.9 |
| Consumer discretionary | 6.2 |
| Communication services | 4.9 |
| Utilities | 3.9 |
| Materials | 4.1 |
| Real estate | 2.9 |
You can find additional information on the Fund's website at allspringglobal.com, including its:
- Prospectus - Financial Information - Fund holdings - Proxy voting information
Annual Shareholder Report
Premier Large Company Growth Fund
This annual shareholder report contains important information about Premier Large Company Growth Fund for the period of August 1, 2023 to July 31, 2024. You can find additional information about the Fund at allspringglobal.com. You can also request this information by contacting us at 1-800-222-8222.
This report describes changes to the Fund that occurred during the reporting period.
What were the Fund costs for the past year?
The table explains the costs you would have paid within the reporting period based on a hypothetical $10,000 investment.
| CLASS NAME | COST OF A $10,000 INVESTMENT | COSTS PAID AS A % OF A $10,000 INVESTMENT |
|---|
| Institutional Class | $80 | 0.70% |
The manager has contractually committed to waive fees and/or reimburse certain expenses to the extent necessary to cap the Fund's total annual fund operating expense ratio at a specific amount. Without this cap, the costs shown above may have been higher. Please see the prospectus for the amount and the expiration date of the cap. Prior to or after the commitment expiration date, the cap may be increased or the commitment to maintain the cap may be terminated only with the approval of the Board of Trustees.
How did the Fund perform last year and what affected its performance?
Positive earnings surprises fueled a bull market for large-cap U.S. equities during the 12-month period that ended on July 31, 2024. Companies connected to artificial intelligence (AI) saw their valuations soar. The “Magnificent 7” stocks substantially outperformed the rest of the U.S. equity universe. Inflation concerns and policy uncertainty deterred sentiment for small-cap stocks. Late in the fiscal year, several Magnificent 7 companies struggled to meet high expectations. As a result, market leadership broadened, with small caps narrowing the performance gap relative to mega caps.
Portfolio companies facilitating the structural build-out of AI outperformed significantly during the year. The portfolio benefited from security selection within the consumer discretionary sector, where Deckers Outdoor Corp. did well, along with select technology positions, including NVIDIA Corp. Holdings within health care, including Exact Sciences Corp. and Penumbra, Inc., detracted from returns. We did not make meaningful changes to the portfolio during the 12-month period.
Total return based on a $10,000 investment
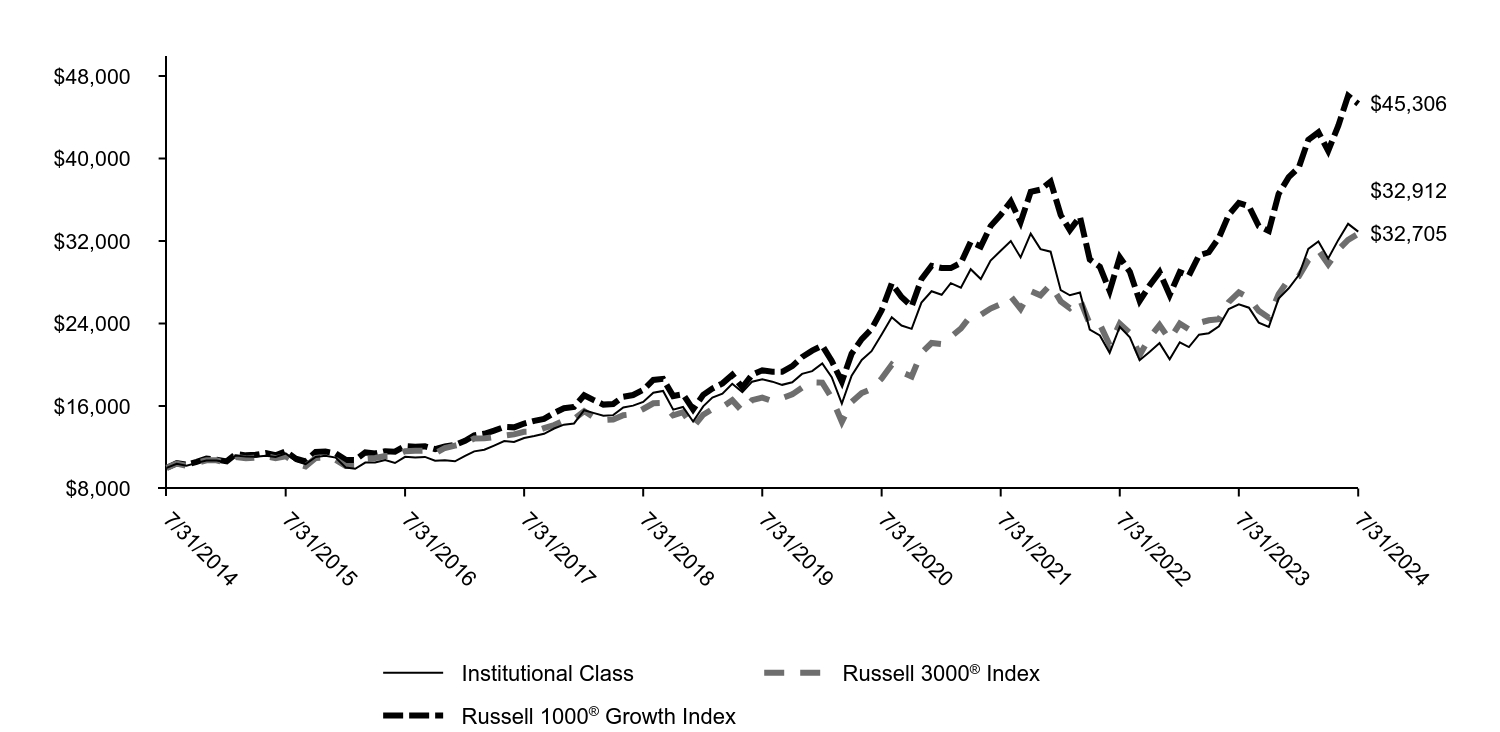
| Institutional Class | Russell 3000® Index | Russell 1000® Growth Index |
|---|
| 7/31/2014 | $10,000 | $10,000 | $10,000 |
| 8/31/2014 | $10,393 | $10,420 | $10,458 |
| 9/30/2014 | $10,203 | $10,202 | $10,306 |
| 10/31/2014 | $10,487 | $10,483 | $10,578 |
| 11/30/2014 | $10,704 | $10,737 | $10,913 |
| 12/31/2014 | $10,708 | $10,737 | $10,800 |
| 1/31/2015 | $10,536 | $10,438 | $10,634 |
| 2/28/2015 | $11,202 | $11,043 | $11,343 |
| 3/31/2015 | $11,092 | $10,930 | $11,214 |
| 4/30/2015 | $11,078 | $10,980 | $11,270 |
| 5/31/2015 | $11,168 | $11,132 | $11,429 |
| 6/30/2015 | $11,065 | $10,945 | $11,227 |
| 7/31/2015 | $11,401 | $11,128 | $11,608 |
| 8/31/2015 | $10,660 | $10,457 | $10,903 |
| 9/30/2015 | $10,371 | $10,152 | $10,634 |
| 10/31/2015 | $11,065 | $10,954 | $11,549 |
| 11/30/2015 | $11,168 | $11,014 | $11,582 |
| 12/31/2015 | $10,996 | $10,788 | $11,412 |
| 1/31/2016 | $10,040 | $10,180 | $10,775 |
| 2/29/2016 | $9,915 | $10,176 | $10,770 |
| 3/31/2016 | $10,518 | $10,893 | $11,496 |
| 4/30/2016 | $10,525 | $10,960 | $11,391 |
| 5/31/2016 | $10,768 | $11,156 | $11,612 |
| 6/30/2016 | $10,473 | $11,179 | $11,567 |
| 7/31/2016 | $11,077 | $11,623 | $12,113 |
| 8/31/2016 | $11,018 | $11,653 | $12,053 |
| 9/30/2016 | $11,062 | $11,671 | $12,097 |
| 10/31/2016 | $10,694 | $11,419 | $11,813 |
| 11/30/2016 | $10,746 | $11,930 | $12,070 |
| 12/31/2016 | $10,642 | $12,162 | $12,219 |
| 1/31/2017 | $11,171 | $12,391 | $12,631 |
| 2/28/2017 | $11,602 | $12,852 | $13,156 |
| 3/31/2017 | $11,757 | $12,861 | $13,308 |
| 4/30/2017 | $12,164 | $12,997 | $13,612 |
| 5/31/2017 | $12,604 | $13,130 | $13,966 |
| 6/30/2017 | $12,514 | $13,249 | $13,929 |
| 7/31/2017 | $12,897 | $13,498 | $14,299 |
| 8/31/2017 | $13,092 | $13,524 | $14,562 |
| 9/30/2017 | $13,304 | $13,854 | $14,751 |
| 10/31/2017 | $13,817 | $14,157 | $15,322 |
| 11/30/2017 | $14,192 | $14,586 | $15,788 |
| 12/31/2017 | $14,307 | $14,732 | $15,911 |
| 1/31/2018 | $15,592 | $15,509 | $17,038 |
| 2/28/2018 | $15,333 | $14,937 | $16,591 |
| 3/31/2018 | $15,063 | $14,637 | $16,136 |
| 4/30/2018 | $15,115 | $14,693 | $16,192 |
| 5/31/2018 | $15,862 | $15,108 | $16,902 |
| 6/30/2018 | $16,038 | $15,207 | $17,065 |
| 7/31/2018 | $16,401 | $15,711 | $17,566 |
| 8/31/2018 | $17,292 | $16,263 | $18,526 |
| 9/30/2018 | $17,458 | $16,290 | $18,630 |
| 10/31/2018 | $15,644 | $15,090 | $16,964 |
| 11/30/2018 | $15,903 | $15,393 | $17,144 |
| 12/31/2018 | $14,496 | $13,960 | $15,670 |
| 1/31/2019 | $15,965 | $15,158 | $17,079 |
| 2/28/2019 | $16,817 | $15,691 | $17,690 |
| 3/31/2019 | $17,188 | $15,920 | $18,193 |
| 4/30/2019 | $18,151 | $16,556 | $19,015 |
| 5/31/2019 | $17,348 | $15,485 | $17,814 |
| 6/30/2019 | $18,361 | $16,572 | $19,037 |
| 7/31/2019 | $18,595 | $16,819 | $19,467 |
| 8/31/2019 | $18,361 | $16,476 | $19,318 |
| 9/30/2019 | $18,052 | $16,765 | $19,320 |
| 10/31/2019 | $18,299 | $17,126 | $19,865 |
| 11/30/2019 | $19,114 | $17,777 | $20,746 |
| 12/31/2019 | $19,383 | $18,290 | $21,372 |
| 1/31/2020 | $20,128 | $18,270 | $21,850 |
| 2/29/2020 | $18,797 | $16,774 | $20,362 |
| 3/31/2020 | $16,241 | $14,468 | $18,359 |
| 4/30/2020 | $18,930 | $16,384 | $21,075 |
| 5/31/2020 | $20,461 | $17,260 | $22,490 |
| 6/30/2020 | $21,313 | $17,655 | $23,470 |
| 7/31/2020 | $22,924 | $18,657 | $25,275 |
| 8/31/2020 | $24,601 | $20,009 | $27,884 |
| 9/30/2020 | $23,803 | $19,280 | $26,572 |
| 10/31/2020 | $23,483 | $18,864 | $25,669 |
| 11/30/2020 | $26,026 | $21,159 | $28,298 |
| 12/31/2020 | $27,125 | $22,111 | $29,599 |
| 1/31/2021 | $26,783 | $22,012 | $29,380 |
| 2/28/2021 | $27,912 | $22,700 | $29,373 |
| 3/31/2021 | $27,481 | $23,514 | $29,878 |
| 4/30/2021 | $29,264 | $24,726 | $31,911 |
| 5/31/2021 | $28,313 | $24,839 | $31,469 |
| 6/30/2021 | $30,096 | $25,452 | $33,444 |
| 7/31/2021 | $31,046 | $25,882 | $34,546 |
| 8/31/2021 | $31,997 | $26,620 | $35,838 |
| 9/30/2021 | $30,408 | $25,426 | $33,830 |
| 10/31/2021 | $32,710 | $27,145 | $36,761 |
| 11/30/2021 | $31,210 | $26,732 | $36,985 |
| 12/31/2021 | $30,963 | $27,785 | $37,767 |
| 1/31/2022 | $27,233 | $26,150 | $34,526 |
| 2/28/2022 | $26,735 | $25,491 | $33,060 |
| 3/31/2022 | $27,011 | $26,318 | $34,353 |
| 4/30/2022 | $23,411 | $23,956 | $30,204 |
| 5/31/2022 | $22,839 | $23,924 | $29,502 |
| 6/30/2022 | $21,159 | $21,923 | $27,165 |
| 7/31/2022 | $23,688 | $23,979 | $30,426 |
| 8/31/2022 | $22,654 | $23,084 | $29,008 |
| 9/30/2022 | $20,439 | $20,944 | $26,188 |
| 10/31/2022 | $21,251 | $22,661 | $27,719 |
| 11/30/2022 | $22,100 | $23,844 | $28,982 |
| 12/31/2022 | $20,531 | $22,448 | $26,763 |
| 1/31/2023 | $22,174 | $23,994 | $28,994 |
| 2/28/2023 | $21,713 | $23,433 | $28,649 |
| 3/31/2023 | $22,913 | $24,060 | $30,608 |
| 4/30/2023 | $23,060 | $24,316 | $30,910 |
| 5/31/2023 | $23,725 | $24,411 | $32,319 |
| 6/30/2023 | $25,405 | $26,078 | $34,529 |
| 7/31/2023 | $25,867 | $27,013 | $35,692 |
| 8/31/2023 | $25,534 | $26,491 | $35,372 |
| 9/30/2023 | $24,090 | $25,229 | $33,448 |
| 10/31/2023 | $23,671 | $24,560 | $32,972 |
| 11/30/2023 | $26,413 | $26,851 | $36,566 |
| 12/31/2023 | $27,414 | $28,275 | $38,185 |
| 1/31/2024 | $28,694 | $28,588 | $39,138 |
| 2/29/2024 | $31,230 | $30,136 | $41,808 |
| 3/31/2024 | $31,958 | $31,108 | $42,544 |
| 4/30/2024 | $30,301 | $29,739 | $40,739 |
| 5/31/2024 | $32,109 | $31,144 | $43,178 |
| 6/30/2024 | $33,665 | $32,108 | $46,090 |
| 7/31/2024 | $32,912 | $32,705 | $45,306 |
Premier Large Company Growth Fund
Annual Shareholder Report | July 31, 2024
AVERAGE ANNUAL TOTAL RETURNS (%)
| 1 Year | 5 Years | 10 Years |
|---|
| Institutional Class | 27.24 | 12.10 | 12.65 |
Russell 3000® Index | 21.07 | 14.23 | 12.58 |
Russell 1000® Growth Index | 26.94 | 18.41 | 16.31 |
| Total net assets | $1,327,151,195 |
| # of portfolio holdings | 61 |
| Portfolio turnover rate | 47% |
| Total advisory fees paid | $8,656,897 |
What did the Fund invest in?
(Based on long-term investments)
TOP TEN HOLDINGS (% OF NET ASSETS)
| NVIDIA Corp. | 11.0 |
| Microsoft Corp. | 10.5 |
| Amazon.com, Inc. | 5.4 |
| Meta Platforms, Inc. Class A | 5.1 |
| Eli Lilly & Co. | 4.1 |
| Apple, Inc. | 3.6 |
| Fair Isaac Corp. | 2.0 |
| Arista Networks, Inc. | 2.0 |
| Tradeweb Markets, Inc. Class A | 1.9 |
| Mastercard, Inc. Class A | 1.9 |
SECTOR ALLOCATION (% OF LONG-TERM INVESTMENTS)
| Information technology | 39.2 |
| Consumer discretionary | 15.6 |
| Communication services | 13.3 |
| Health care | 11.2 |
| Industrials | 10.5 |
| Financials | 7.2 |
| Materials | 1.2 |
| Utilities | 1.1 |
| Consumer staples | 0.7 |
This is a summary of certain changes and planned changes to the Fund since August 1, 2023.
Effective May 31, 2024, Michael T. Smith, CFA and Christopher J. Warner, CFA were added as portfolio managers of the Fund and effective July 26, 2024, Thomas C. Ognar, CFA and David Nazaret were no longer portfolio managers of the Fund.
You can find additional information on the Fund's website at allspringglobal.com, including its:
- Prospectus - Financial Information - Fund holdings - Proxy voting information
Annual Shareholder Report
Premier Large Company Growth Fund
This annual shareholder report contains important information about Premier Large Company Growth Fund for the period of August 1, 2023 to July 31, 2024. You can find additional information about the Fund at allspringglobal.com. You can also request this information by contacting us at 1-800-222-8222.
This report describes changes to the Fund that occurred during the reporting period.
What were the Fund costs for the past year?
The table explains the costs you would have paid within the reporting period based on a hypothetical $10,000 investment.
| CLASS NAME | COST OF A $10,000 INVESTMENT | COSTS PAID AS A % OF A $10,000 INVESTMENT |
|---|
| Class R6 | $74 | 0.65% |
The manager has contractually committed to waive fees and/or reimburse certain expenses to the extent necessary to cap the Fund's total annual fund operating expense ratio at a specific amount. Without this cap, the costs shown above may have been higher. Please see the prospectus for the amount and the expiration date of the cap. Prior to or after the commitment expiration date, the cap may be increased or the commitment to maintain the cap may be terminated only with the approval of the Board of Trustees.
How did the Fund perform last year and what affected its performance?
Positive earnings surprises fueled a bull market for large-cap U.S. equities during the 12-month period that ended on July 31, 2024. Companies connected to artificial intelligence (AI) saw their valuations soar. The “Magnificent 7” stocks substantially outperformed the rest of the U.S. equity universe. Inflation concerns and policy uncertainty deterred sentiment for small-cap stocks. Late in the fiscal year, several Magnificent 7 companies struggled to meet high expectations. As a result, market leadership broadened, with small caps narrowing the performance gap relative to mega caps.
Portfolio companies facilitating the structural build-out of AI outperformed significantly during the year. The portfolio benefited from security selection within the consumer discretionary sector, where Deckers Outdoor Corp. did well, along with select technology positions, including NVIDIA Corp. Holdings within health care, including Exact Sciences Corp. and Penumbra, Inc., detracted from returns. We did not make meaningful changes to the portfolio during the 12-month period.
Total return based on a $10,000 investment

| Class R6 | Russell 3000® Index | Russell 1000® Growth Index |
|---|
| 7/31/2014 | $10,000 | $10,000 | $10,000 |
| 8/31/2014 | $10,386 | $10,420 | $10,458 |
| 9/30/2014 | $10,196 | $10,202 | $10,306 |
| 10/31/2014 | $10,480 | $10,483 | $10,578 |
| 11/30/2014 | $10,704 | $10,737 | $10,913 |
| 12/31/2014 | $10,700 | $10,737 | $10,800 |
| 1/31/2015 | $10,536 | $10,438 | $10,634 |
| 2/28/2015 | $11,194 | $11,043 | $11,343 |
| 3/31/2015 | $11,084 | $10,930 | $11,214 |
| 4/30/2015 | $11,078 | $10,980 | $11,270 |
| 5/31/2015 | $11,167 | $11,132 | $11,429 |
| 6/30/2015 | $11,064 | $10,945 | $11,227 |
| 7/31/2015 | $11,400 | $11,128 | $11,608 |
| 8/31/2015 | $10,659 | $10,457 | $10,903 |
| 9/30/2015 | $10,371 | $10,152 | $10,634 |
| 10/31/2015 | $11,071 | $10,954 | $11,549 |
| 11/30/2015 | $11,174 | $11,014 | $11,582 |
| 12/31/2015 | $10,995 | $10,788 | $11,412 |
| 1/31/2016 | $10,040 | $10,180 | $10,775 |
| 2/29/2016 | $9,915 | $10,176 | $10,770 |
| 3/31/2016 | $10,525 | $10,893 | $11,496 |
| 4/30/2016 | $10,532 | $10,960 | $11,391 |
| 5/31/2016 | $10,775 | $11,156 | $11,612 |
| 6/30/2016 | $10,481 | $11,179 | $11,567 |
| 7/31/2016 | $11,083 | $11,623 | $12,113 |
| 8/31/2016 | $11,024 | $11,653 | $12,053 |
| 9/30/2016 | $11,069 | $11,671 | $12,097 |
| 10/31/2016 | $10,701 | $11,419 | $11,813 |
| 11/30/2016 | $10,752 | $11,930 | $12,070 |
| 12/31/2016 | $10,649 | $12,162 | $12,219 |
| 1/31/2017 | $11,186 | $12,391 | $12,631 |
| 2/28/2017 | $11,609 | $12,852 | $13,156 |
| 3/31/2017 | $11,763 | $12,861 | $13,308 |
| 4/30/2017 | $12,178 | $12,997 | $13,612 |
| 5/31/2017 | $12,609 | $13,130 | $13,966 |
| 6/30/2017 | $12,528 | $13,249 | $13,929 |
| 7/31/2017 | $12,910 | $13,498 | $14,299 |
| 8/31/2017 | $13,114 | $13,524 | $14,562 |
| 9/30/2017 | $13,325 | $13,854 | $14,751 |
| 10/31/2017 | $13,829 | $14,157 | $15,322 |
| 11/30/2017 | $14,204 | $14,586 | $15,788 |
| 12/31/2017 | $14,329 | $14,732 | $15,911 |
| 1/31/2018 | $15,613 | $15,509 | $17,038 |
| 2/28/2018 | $15,354 | $14,937 | $16,591 |
| 3/31/2018 | $15,085 | $14,637 | $16,136 |
| 4/30/2018 | $15,136 | $14,693 | $16,192 |
| 5/31/2018 | $15,882 | $15,108 | $16,902 |
| 6/30/2018 | $16,058 | $15,207 | $17,065 |
| 7/31/2018 | $16,430 | $15,711 | $17,566 |
| 8/31/2018 | $17,321 | $16,263 | $18,526 |
| 9/30/2018 | $17,486 | $16,290 | $18,630 |
| 10/31/2018 | $15,675 | $15,090 | $16,964 |
| 11/30/2018 | $15,933 | $15,393 | $17,144 |
| 12/31/2018 | $14,529 | $13,960 | $15,670 |
| 1/31/2019 | $15,995 | $15,158 | $17,079 |
| 2/28/2019 | $16,846 | $15,691 | $17,690 |
| 3/31/2019 | $17,215 | $15,920 | $18,193 |
| 4/30/2019 | $18,189 | $16,556 | $19,015 |
| 5/31/2019 | $17,388 | $15,485 | $17,814 |
| 6/30/2019 | $18,398 | $16,572 | $19,037 |
| 7/31/2019 | $18,632 | $16,819 | $19,467 |
| 8/31/2019 | $18,411 | $16,476 | $19,318 |
| 9/30/2019 | $18,102 | $16,765 | $19,320 |
| 10/31/2019 | $18,337 | $17,126 | $19,865 |
| 11/30/2019 | $19,162 | $17,777 | $20,746 |
| 12/31/2019 | $19,430 | $18,290 | $21,372 |
| 1/31/2020 | $20,174 | $18,270 | $21,850 |
| 2/29/2020 | $18,846 | $16,774 | $20,362 |
| 3/31/2020 | $16,283 | $14,468 | $18,359 |
| 4/30/2020 | $18,979 | $16,384 | $21,075 |
| 5/31/2020 | $20,506 | $17,260 | $22,490 |
| 6/30/2020 | $21,369 | $17,655 | $23,470 |
| 7/31/2020 | $22,990 | $18,657 | $25,275 |
| 8/31/2020 | $24,676 | $20,009 | $27,884 |
| 9/30/2020 | $23,866 | $19,280 | $26,572 |
| 10/31/2020 | $23,548 | $18,864 | $25,669 |
| 11/30/2020 | $26,098 | $21,159 | $28,298 |
| 12/31/2020 | $27,208 | $22,111 | $29,599 |
| 1/31/2021 | $26,867 | $22,012 | $29,380 |
| 2/28/2021 | $27,993 | $22,700 | $29,373 |
| 3/31/2021 | $27,563 | $23,514 | $29,878 |
| 4/30/2021 | $29,356 | $24,726 | $31,911 |
| 5/31/2021 | $28,393 | $24,839 | $31,469 |
| 6/30/2021 | $30,185 | $25,452 | $33,444 |
| 7/31/2021 | $31,148 | $25,882 | $34,546 |
| 8/31/2021 | $32,110 | $26,620 | $35,838 |
| 9/30/2021 | $30,511 | $25,426 | $33,830 |
| 10/31/2021 | $32,821 | $27,145 | $36,761 |
| 11/30/2021 | $31,311 | $26,732 | $36,985 |
| 12/31/2021 | $31,064 | $27,785 | $37,767 |
| 1/31/2022 | $27,333 | $26,150 | $34,526 |
| 2/28/2022 | $26,837 | $25,491 | $33,060 |
| 3/31/2022 | $27,112 | $26,318 | $34,353 |
| 4/30/2022 | $23,491 | $23,956 | $30,204 |
| 5/31/2022 | $22,921 | $23,924 | $29,502 |
| 6/30/2022 | $21,249 | $21,923 | $27,165 |
| 7/31/2022 | $23,785 | $23,979 | $30,426 |
| 8/31/2022 | $22,738 | $23,084 | $29,008 |
| 9/30/2022 | $20,513 | $20,944 | $26,188 |
| 10/31/2022 | $21,322 | $22,661 | $27,719 |
| 11/30/2022 | $22,186 | $23,844 | $28,982 |
| 12/31/2022 | $20,624 | $22,448 | $26,763 |
| 1/31/2023 | $22,260 | $23,994 | $28,994 |
| 2/28/2023 | $21,800 | $23,433 | $28,649 |
| 3/31/2023 | $23,013 | $24,060 | $30,608 |
| 4/30/2023 | $23,160 | $24,316 | $30,910 |
| 5/31/2023 | $23,822 | $24,411 | $32,319 |
| 6/30/2023 | $25,513 | $26,078 | $34,529 |
| 7/31/2023 | $25,973 | $27,013 | $35,692 |
| 8/31/2023 | $25,642 | $26,491 | $35,372 |
| 9/30/2023 | $24,185 | $25,229 | $33,448 |
| 10/31/2023 | $23,768 | $24,560 | $32,972 |
| 11/30/2023 | $26,536 | $26,851 | $36,566 |
| 12/31/2023 | $27,530 | $28,275 | $38,185 |
| 1/31/2024 | $28,826 | $28,588 | $39,138 |
| 2/29/2024 | $31,367 | $30,136 | $41,808 |
| 3/31/2024 | $32,115 | $31,108 | $42,544 |
| 4/30/2024 | $30,445 | $29,739 | $40,739 |
| 5/31/2024 | $32,264 | $31,144 | $43,178 |
| 6/30/2024 | $33,834 | $32,108 | $46,090 |
| 7/31/2024 | $33,061 | $32,705 | $45,306 |
Premier Large Company Growth Fund
Annual Shareholder Report | July 31, 2024
AVERAGE ANNUAL TOTAL RETURNS (%)
| 1 Year | 5 Years | 10 Years |
|---|
| Class R6 | 27.29 | 12.15 | 12.70 |
Russell 3000® Index | 21.07 | 14.23 | 12.58 |
Russell 1000® Growth Index | 26.94 | 18.41 | 16.31 |
| Total net assets | $1,327,151,195 |
| # of portfolio holdings | 61 |
| Portfolio turnover rate | 47% |
| Total advisory fees paid | $8,656,897 |
What did the Fund invest in?
(Based on long-term investments)
TOP TEN HOLDINGS (% OF NET ASSETS)
| NVIDIA Corp. | 11.0 |
| Microsoft Corp. | 10.5 |
| Amazon.com, Inc. | 5.4 |
| Meta Platforms, Inc. Class A | 5.1 |
| Eli Lilly & Co. | 4.1 |
| Apple, Inc. | 3.6 |
| Fair Isaac Corp. | 2.0 |
| Arista Networks, Inc. | 2.0 |
| Tradeweb Markets, Inc. Class A | 1.9 |
| Mastercard, Inc. Class A | 1.9 |
SECTOR ALLOCATION (% OF LONG-TERM INVESTMENTS)
| Information technology | 39.2 |
| Consumer discretionary | 15.6 |
| Communication services | 13.3 |
| Health care | 11.2 |
| Industrials | 10.5 |
| Financials | 7.2 |
| Materials | 1.2 |
| Utilities | 1.1 |
| Consumer staples | 0.7 |
This is a summary of certain changes and planned changes to the Fund since August 1, 2023.
Effective May 31, 2024, Michael T. Smith, CFA and Christopher J. Warner, CFA were added as portfolio managers of the Fund and effective July 26, 2024, Thomas C. Ognar, CFA and David Nazaret were no longer portfolio managers of the Fund.
You can find additional information on the Fund's website at allspringglobal.com, including its:
- Prospectus - Financial Information - Fund holdings - Proxy voting information
Annual Shareholder Report
Premier Large Company Growth Fund
This annual shareholder report contains important information about Premier Large Company Growth Fund for the period of August 1, 2023 to July 31, 2024. You can find additional information about the Fund at allspringglobal.com. You can also request this information by contacting us at 1-800-222-8222.
This report describes changes to the Fund that occurred during the reporting period.
What were the Fund costs for the past year?
The table explains the costs you would have paid within the reporting period based on a hypothetical $10,000 investment.
| CLASS NAME | COST OF A $10,000 INVESTMENT | COSTS PAID AS A % OF A $10,000 INVESTMENT |
|---|
| Class C | $209 | 1.85% |
The manager has contractually committed to waive fees and/or reimburse certain expenses to the extent necessary to cap the Fund's total annual fund operating expense ratio at a specific amount. Without this cap, the costs shown above may have been higher. Please see the prospectus for the amount and the expiration date of the cap. Prior to or after the commitment expiration date, the cap may be increased or the commitment to maintain the cap may be terminated only with the approval of the Board of Trustees.
How did the Fund perform last year and what affected its performance?
Positive earnings surprises fueled a bull market for large-cap U.S. equities during the 12-month period that ended on July 31, 2024. Companies connected to artificial intelligence (AI) saw their valuations soar. The “Magnificent 7” stocks substantially outperformed the rest of the U.S. equity universe. Inflation concerns and policy uncertainty deterred sentiment for small-cap stocks. Late in the fiscal year, several Magnificent 7 companies struggled to meet high expectations. As a result, market leadership broadened, with small caps narrowing the performance gap relative to mega caps.
Portfolio companies facilitating the structural build-out of AI outperformed significantly during the year. The portfolio benefited from security selection within the consumer discretionary sector, where Deckers Outdoor Corp. did well, along with select technology positions, including NVIDIA Corp. Holdings within health care, including Exact Sciences Corp. and Penumbra, Inc., detracted from returns. We did not make meaningful changes to the portfolio during the 12-month period.
Total return based on a $10,000 investment
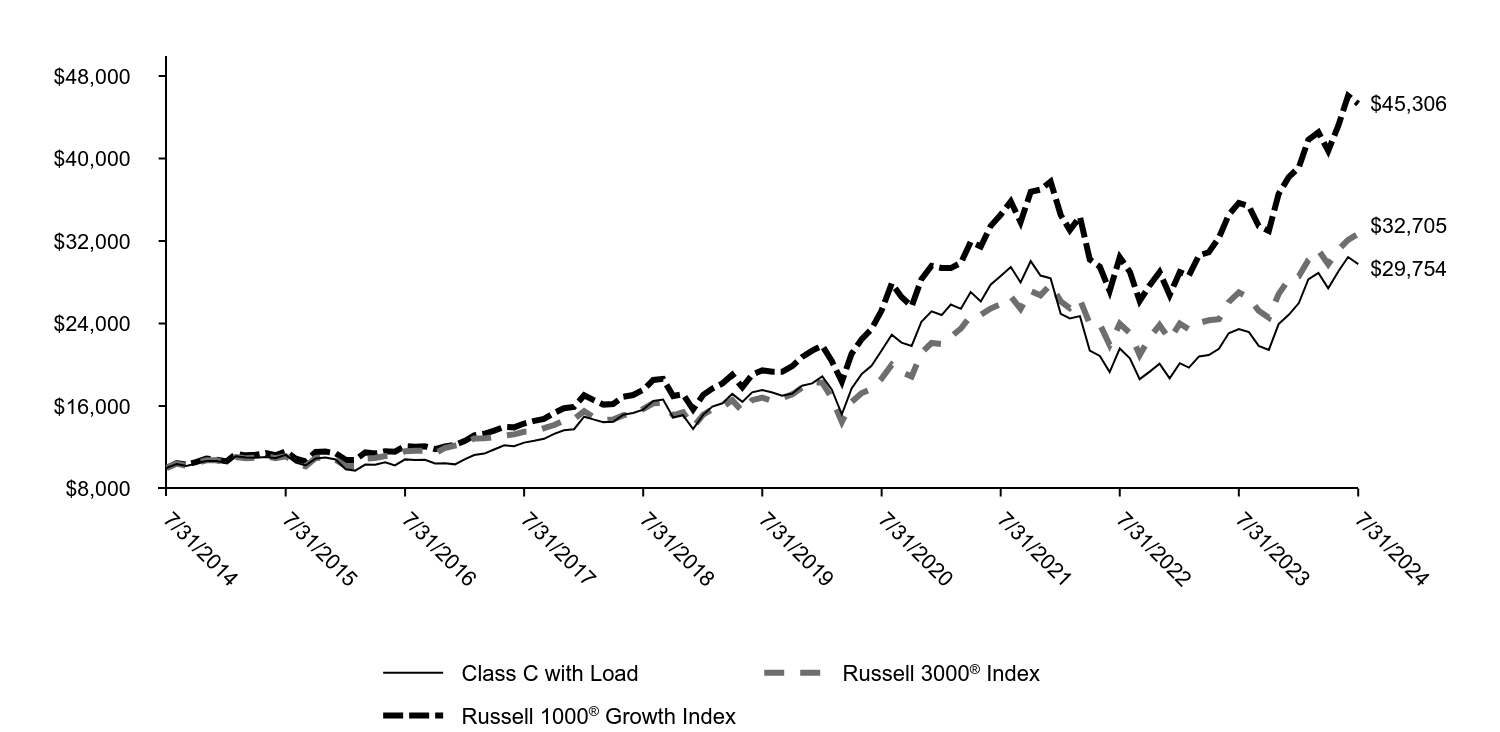
| Class C with Load | Russell 3000® Index | Russell 1000® Growth Index |
|---|
| 7/31/2014 | $10,000 | $10,000 | $10,000 |
| 8/31/2014 | $10,381 | $10,420 | $10,458 |
| 9/30/2014 | $10,186 | $10,202 | $10,306 |
| 10/31/2014 | $10,451 | $10,483 | $10,578 |
| 11/30/2014 | $10,660 | $10,737 | $10,913 |
| 12/31/2014 | $10,657 | $10,737 | $10,800 |
| 1/31/2015 | $10,475 | $10,438 | $10,634 |
| 2/28/2015 | $11,122 | $11,043 | $11,343 |
| 3/31/2015 | $11,004 | $10,930 | $11,214 |
| 4/30/2015 | $10,980 | $10,980 | $11,270 |
| 5/31/2015 | $11,059 | $11,132 | $11,429 |
| 6/30/2015 | $10,941 | $10,945 | $11,227 |
| 7/31/2015 | $11,265 | $11,128 | $11,608 |
| 8/31/2015 | $10,523 | $10,457 | $10,903 |
| 9/30/2015 | $10,230 | $10,152 | $10,634 |
| 10/31/2015 | $10,909 | $10,954 | $11,549 |
| 11/30/2015 | $10,996 | $11,014 | $11,582 |
| 12/31/2015 | $10,814 | $10,788 | $11,412 |
| 1/31/2016 | $9,864 | $10,180 | $10,775 |
| 2/29/2016 | $9,735 | $10,176 | $10,770 |
| 3/31/2016 | $10,317 | $10,893 | $11,496 |
| 4/30/2016 | $10,309 | $10,960 | $11,391 |
| 5/31/2016 | $10,540 | $11,156 | $11,612 |
| 6/30/2016 | $10,240 | $11,179 | $11,567 |
| 7/31/2016 | $10,823 | $11,623 | $12,113 |
| 8/31/2016 | $10,754 | $11,653 | $12,053 |
| 9/30/2016 | $10,780 | $11,671 | $12,097 |
| 10/31/2016 | $10,420 | $11,419 | $11,813 |
| 11/30/2016 | $10,454 | $11,930 | $12,070 |
| 12/31/2016 | $10,341 | $12,162 | $12,219 |
| 1/31/2017 | $10,854 | $12,391 | $12,631 |
| 2/28/2017 | $11,251 | $12,852 | $13,156 |
| 3/31/2017 | $11,387 | $12,861 | $13,308 |
| 4/30/2017 | $11,784 | $12,997 | $13,612 |
| 5/31/2017 | $12,191 | $13,130 | $13,966 |
| 6/30/2017 | $12,094 | $13,249 | $13,929 |
| 7/31/2017 | $12,452 | $13,498 | $14,299 |
| 8/31/2017 | $12,626 | $13,524 | $14,562 |
| 9/30/2017 | $12,820 | $13,854 | $14,751 |
| 10/31/2017 | $13,304 | $14,157 | $15,322 |
| 11/30/2017 | $13,643 | $14,586 | $15,788 |
| 12/31/2017 | $13,751 | $14,732 | $15,911 |
| 1/31/2018 | $14,964 | $15,509 | $17,038 |
| 2/28/2018 | $14,700 | $14,937 | $16,591 |
| 3/31/2018 | $14,437 | $14,637 | $16,136 |
| 4/30/2018 | $14,463 | $14,693 | $16,192 |
| 5/31/2018 | $15,162 | $15,108 | $16,902 |
| 6/30/2018 | $15,320 | $15,207 | $17,065 |
| 7/31/2018 | $15,650 | $15,711 | $17,566 |
| 8/31/2018 | $16,480 | $16,263 | $18,526 |
| 9/30/2018 | $16,625 | $16,290 | $18,630 |
| 10/31/2018 | $14,885 | $15,090 | $16,964 |
| 11/30/2018 | $15,109 | $15,393 | $17,144 |
| 12/31/2018 | $13,765 | $13,960 | $15,670 |
| 1/31/2019 | $15,159 | $15,158 | $17,079 |
| 2/28/2019 | $15,948 | $15,691 | $17,690 |
| 3/31/2019 | $16,267 | $15,920 | $18,193 |
| 4/30/2019 | $17,173 | $16,556 | $19,015 |
| 5/31/2019 | $16,401 | $15,485 | $17,814 |
| 6/30/2019 | $17,324 | $16,572 | $19,037 |
| 7/31/2019 | $17,542 | $16,819 | $19,467 |
| 8/31/2019 | $17,307 | $16,476 | $19,318 |
| 9/30/2019 | $17,005 | $16,765 | $19,320 |
| 10/31/2019 | $17,207 | $17,126 | $19,865 |
| 11/30/2019 | $17,962 | $17,777 | $20,746 |
| 12/31/2019 | $18,191 | $18,290 | $21,372 |
| 1/31/2020 | $18,866 | $18,270 | $21,850 |
| 2/29/2020 | $17,609 | $16,774 | $20,362 |
| 3/31/2020 | $15,190 | $14,468 | $18,359 |
| 4/30/2020 | $17,703 | $16,384 | $21,075 |
| 5/31/2020 | $19,110 | $17,260 | $22,490 |
| 6/30/2020 | $19,897 | $17,655 | $23,470 |
| 7/31/2020 | $21,379 | $18,657 | $25,275 |
| 8/31/2020 | $22,917 | $20,009 | $27,884 |
| 9/30/2020 | $22,148 | $19,280 | $26,572 |
| 10/31/2020 | $21,829 | $18,864 | $25,669 |
| 11/30/2020 | $24,173 | $21,159 | $28,298 |
| 12/31/2020 | $25,176 | $22,111 | $29,599 |
| 1/31/2021 | $24,820 | $22,012 | $29,380 |
| 2/28/2021 | $25,844 | $22,700 | $29,373 |
| 3/31/2021 | $25,421 | $23,514 | $29,878 |
| 4/30/2021 | $27,046 | $24,726 | $31,911 |
| 5/31/2021 | $26,133 | $24,839 | $31,469 |
| 6/30/2021 | $27,758 | $25,452 | $33,444 |
| 7/31/2021 | $28,604 | $25,882 | $34,546 |
| 8/31/2021 | $29,472 | $26,620 | $35,838 |
| 9/30/2021 | $27,981 | $25,426 | $33,830 |
| 10/31/2021 | $30,051 | $27,145 | $36,761 |
| 11/30/2021 | $28,649 | $26,732 | $36,985 |
| 12/31/2021 | $28,375 | $27,785 | $37,767 |
| 1/31/2022 | $24,942 | $26,150 | $34,526 |
| 2/28/2022 | $24,485 | $25,491 | $33,060 |
| 3/31/2022 | $24,714 | $26,318 | $34,353 |
| 4/30/2022 | $21,379 | $23,956 | $30,204 |
| 5/31/2022 | $20,856 | $23,924 | $29,502 |
| 6/30/2022 | $19,287 | $21,923 | $27,165 |
| 7/31/2022 | $21,575 | $23,979 | $30,426 |
| 8/31/2022 | $20,622 | $23,084 | $29,008 |
| 9/30/2022 | $18,603 | $20,944 | $26,188 |
| 10/31/2022 | $19,332 | $22,661 | $27,719 |
| 11/30/2022 | $20,098 | $23,844 | $28,982 |
| 12/31/2022 | $18,677 | $22,448 | $26,763 |
| 1/31/2023 | $20,154 | $23,994 | $28,994 |
| 2/28/2023 | $19,724 | $23,433 | $28,649 |
| 3/31/2023 | $20,809 | $24,060 | $30,608 |
| 4/30/2023 | $20,940 | $24,316 | $30,910 |
| 5/31/2023 | $21,538 | $24,411 | $32,319 |
| 6/30/2023 | $23,052 | $26,078 | $34,529 |
| 7/31/2023 | $23,464 | $27,013 | $35,692 |
| 8/31/2023 | $23,164 | $26,491 | $35,372 |
| 9/30/2023 | $21,833 | $25,229 | $33,448 |
| 10/31/2023 | $21,445 | $24,560 | $32,972 |
| 11/30/2023 | $23,943 | $26,851 | $36,566 |
| 12/31/2023 | $24,844 | $28,275 | $38,185 |
| 1/31/2024 | $25,985 | $28,588 | $39,138 |
| 2/29/2024 | $28,268 | $30,136 | $41,808 |
| 3/31/2024 | $28,905 | $31,108 | $42,544 |
| 4/30/2024 | $27,419 | $29,739 | $40,739 |
| 5/31/2024 | $29,038 | $31,144 | $43,178 |
| 6/30/2024 | $30,444 | $32,108 | $46,090 |
| 7/31/2024 | $29,754 | $32,705 | $45,306 |
Premier Large Company Growth Fund
Annual Shareholder Report | July 31, 2024
AVERAGE ANNUAL TOTAL RETURNS (%)
| 1 Year | 5 Years | 10 Years |
|---|
| Class C | 25.72 | 10.83 | 11.52 |
| Class C with Load | 24.73 | 10.83 | 11.52 |
Russell 3000® Index | 21.07 | 14.23 | 12.58 |
Russell 1000® Growth Index | 26.94 | 18.41 | 16.31 |
| Total net assets | $1,327,151,195 |
| # of portfolio holdings | 61 |
| Portfolio turnover rate | 47% |
| Total advisory fees paid | $8,656,897 |
What did the Fund invest in?
(Based on long-term investments)
TOP TEN HOLDINGS (% OF NET ASSETS)
| NVIDIA Corp. | 11.0 |
| Microsoft Corp. | 10.5 |
| Amazon.com, Inc. | 5.4 |
| Meta Platforms, Inc. Class A | 5.1 |
| Eli Lilly & Co. | 4.1 |
| Apple, Inc. | 3.6 |
| Fair Isaac Corp. | 2.0 |
| Arista Networks, Inc. | 2.0 |
| Tradeweb Markets, Inc. Class A | 1.9 |
| Mastercard, Inc. Class A | 1.9 |
SECTOR ALLOCATION (% OF LONG-TERM INVESTMENTS)
| Information technology | 39.2 |
| Consumer discretionary | 15.6 |
| Communication services | 13.3 |
| Health care | 11.2 |
| Industrials | 10.5 |
| Financials | 7.2 |
| Materials | 1.2 |
| Utilities | 1.1 |
| Consumer staples | 0.7 |
This is a summary of certain changes and planned changes to the Fund since August 1, 2023.
Effective May 31, 2024, Michael T. Smith, CFA and Christopher J. Warner, CFA were added as portfolio managers of the Fund and effective July 26, 2024, Thomas C. Ognar, CFA and David Nazaret were no longer portfolio managers of the Fund.
You can find additional information on the Fund's website at allspringglobal.com, including its:
- Prospectus - Financial Information - Fund holdings - Proxy voting information
Annual Shareholder Report
Premier Large Company Growth Fund
This annual shareholder report contains important information about Premier Large Company Growth Fund for the period of August 1, 2023 to July 31, 2024. You can find additional information about the Fund at allspringglobal.com. You can also request this information by contacting us at 1-800-222-8222.
This report describes changes to the Fund that occurred during the reporting period.
What were the Fund costs for the past year?
The table explains the costs you would have paid within the reporting period based on a hypothetical $10,000 investment.
| CLASS NAME | COST OF A $10,000 INVESTMENT | COSTS PAID AS A % OF A $10,000 INVESTMENT |
|---|
| Class A | $124 | 1.09% |
The manager has contractually committed to waive fees and/or reimburse certain expenses to the extent necessary to cap the Fund's total annual fund operating expense ratio at a specific amount. Without this cap, the costs shown above may have been higher. Please see the prospectus for the amount and the expiration date of the cap. Prior to or after the commitment expiration date, the cap may be increased or the commitment to maintain the cap may be terminated only with the approval of the Board of Trustees.
How did the Fund perform last year and what affected its performance?
Positive earnings surprises fueled a bull market for large-cap U.S. equities during the 12-month period that ended on July 31, 2024. Companies connected to artificial intelligence (AI) saw their valuations soar. The “Magnificent 7” stocks substantially outperformed the rest of the U.S. equity universe. Inflation concerns and policy uncertainty deterred sentiment for small-cap stocks. Late in the fiscal year, several Magnificent 7 companies struggled to meet high expectations. As a result, market leadership broadened, with small caps narrowing the performance gap relative to mega caps.
Portfolio companies facilitating the structural build-out of AI outperformed significantly during the year. The portfolio benefited from security selection within the consumer discretionary sector, where Deckers Outdoor Corp. did well, along with select technology positions, including NVIDIA Corp. Holdings within health care, including Exact Sciences Corp. and Penumbra, Inc., detracted from returns. We did not make meaningful changes to the portfolio during the 12-month period.
Total return based on a $10,000 investment
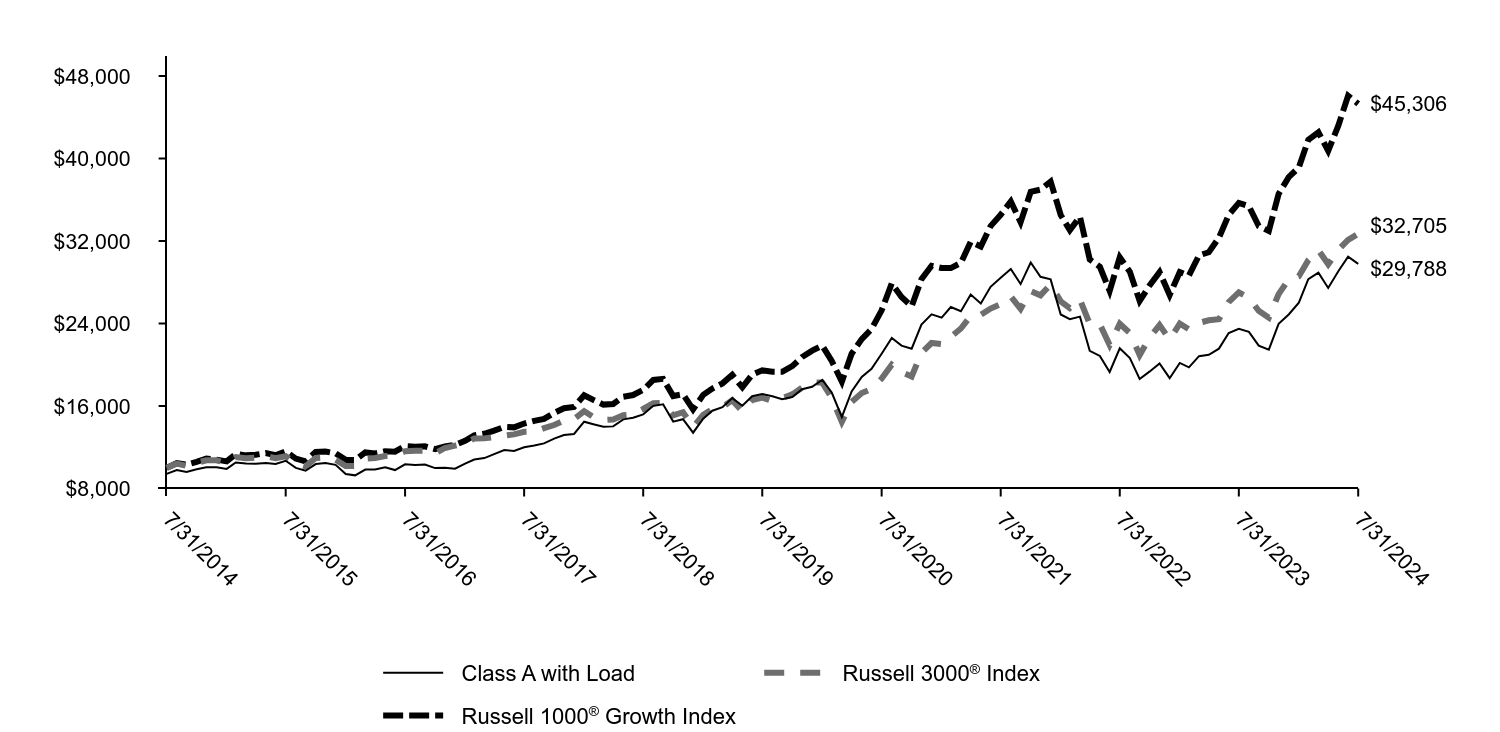
| Class A with Load | Russell 3000® Index | Russell 1000® Growth Index |
|---|
| 7/31/2014 | $9,424 | $10,000 | $10,000 |
| 8/31/2014 | $9,786 | $10,420 | $10,458 |
| 9/30/2014 | $9,605 | $10,202 | $10,306 |
| 10/31/2014 | $9,864 | $10,483 | $10,578 |
| 11/30/2014 | $10,071 | $10,737 | $10,913 |
| 12/31/2014 | $10,068 | $10,737 | $10,800 |
| 1/31/2015 | $9,904 | $10,438 | $10,634 |
| 2/28/2015 | $10,521 | $11,043 | $11,343 |
| 3/31/2015 | $10,416 | $10,930 | $11,214 |
| 4/30/2015 | $10,403 | $10,980 | $11,270 |
| 5/31/2015 | $10,482 | $11,132 | $11,429 |
| 6/30/2015 | $10,383 | $10,945 | $11,227 |
| 7/31/2015 | $10,692 | $11,128 | $11,608 |
| 8/31/2015 | $9,996 | $10,457 | $10,903 |
| 9/30/2015 | $9,720 | $10,152 | $10,634 |
| 10/31/2015 | $10,370 | $10,954 | $11,549 |
| 11/30/2015 | $10,462 | $11,014 | $11,582 |
| 12/31/2015 | $10,291 | $10,788 | $11,412 |
| 1/31/2016 | $9,396 | $10,180 | $10,775 |
| 2/29/2016 | $9,276 | $10,176 | $10,770 |
| 3/31/2016 | $9,840 | $10,893 | $11,496 |
| 4/30/2016 | $9,847 | $10,960 | $11,391 |
| 5/31/2016 | $10,065 | $11,156 | $11,612 |
| 6/30/2016 | $9,790 | $11,179 | $11,567 |
| 7/31/2016 | $10,347 | $11,623 | $12,113 |
| 8/31/2016 | $10,291 | $11,653 | $12,053 |
| 9/30/2016 | $10,326 | $11,671 | $12,097 |
| 10/31/2016 | $9,981 | $11,419 | $11,813 |
| 11/30/2016 | $10,023 | $11,930 | $12,070 |
| 12/31/2016 | $9,923 | $12,162 | $12,219 |
| 1/31/2017 | $10,416 | $12,391 | $12,631 |
| 2/28/2017 | $10,807 | $12,852 | $13,156 |
| 3/31/2017 | $10,948 | $12,861 | $13,308 |
| 4/30/2017 | $11,331 | $12,997 | $13,612 |
| 5/31/2017 | $11,730 | $13,130 | $13,966 |
| 6/30/2017 | $11,644 | $13,249 | $13,929 |
| 7/31/2017 | $12,004 | $13,498 | $14,299 |
| 8/31/2017 | $12,177 | $13,524 | $14,562 |
| 9/30/2017 | $12,372 | $13,854 | $14,751 |
| 10/31/2017 | $12,842 | $14,157 | $15,322 |
| 11/30/2017 | $13,186 | $14,586 | $15,788 |
| 12/31/2017 | $13,289 | $14,732 | $15,911 |
| 1/31/2018 | $14,477 | $15,509 | $17,038 |
| 2/28/2018 | $14,235 | $14,937 | $16,591 |
| 3/31/2018 | $13,984 | $14,637 | $16,136 |
| 4/30/2018 | $14,024 | $14,693 | $16,192 |
| 5/31/2018 | $14,708 | $15,108 | $16,902 |
| 6/30/2018 | $14,859 | $15,207 | $17,065 |
| 7/31/2018 | $15,191 | $15,711 | $17,566 |
| 8/31/2018 | $16,016 | $16,263 | $18,526 |
| 9/30/2018 | $16,167 | $16,290 | $18,630 |
| 10/31/2018 | $14,487 | $15,090 | $16,964 |
| 11/30/2018 | $14,718 | $15,393 | $17,144 |
| 12/31/2018 | $13,412 | $13,960 | $15,670 |
| 1/31/2019 | $14,767 | $15,158 | $17,079 |
| 2/28/2019 | $15,541 | $15,691 | $17,690 |
| 3/31/2019 | $15,880 | $15,920 | $18,193 |
| 4/30/2019 | $16,763 | $16,556 | $19,015 |
| 5/31/2019 | $16,025 | $15,485 | $17,814 |
| 6/30/2019 | $16,944 | $16,572 | $19,037 |
| 7/31/2019 | $17,162 | $16,819 | $19,467 |
| 8/31/2019 | $16,944 | $16,476 | $19,318 |
| 9/30/2019 | $16,654 | $16,765 | $19,320 |
| 10/31/2019 | $16,871 | $17,126 | $19,865 |
| 11/30/2019 | $17,621 | $17,777 | $20,746 |
| 12/31/2019 | $17,860 | $18,290 | $21,372 |
| 1/31/2020 | $18,541 | $18,270 | $21,850 |
| 2/29/2020 | $17,310 | $16,774 | $20,362 |
| 3/31/2020 | $14,938 | $14,468 | $18,359 |
| 4/30/2020 | $17,415 | $16,384 | $21,075 |
| 5/31/2020 | $18,817 | $17,260 | $22,490 |
| 6/30/2020 | $19,603 | $17,655 | $23,470 |
| 7/31/2020 | $21,070 | $18,657 | $25,275 |
| 8/31/2020 | $22,604 | $20,009 | $27,884 |
| 9/30/2020 | $21,857 | $19,280 | $26,572 |
| 10/31/2020 | $21,555 | $18,864 | $25,669 |
| 11/30/2020 | $23,888 | $21,159 | $28,298 |
| 12/31/2020 | $24,891 | $22,111 | $29,599 |
| 1/31/2021 | $24,566 | $22,012 | $29,380 |
| 2/28/2021 | $25,598 | $22,700 | $29,373 |
| 3/31/2021 | $25,185 | $23,514 | $29,878 |
| 4/30/2021 | $26,807 | $24,726 | $31,911 |
| 5/31/2021 | $25,937 | $24,839 | $31,469 |
| 6/30/2021 | $27,559 | $25,452 | $33,444 |
| 7/31/2021 | $28,429 | $25,882 | $34,546 |
| 8/31/2021 | $29,285 | $26,620 | $35,838 |
| 9/30/2021 | $27,825 | $25,426 | $33,830 |
| 10/31/2021 | $29,919 | $27,145 | $36,761 |
| 11/30/2021 | $28,533 | $26,732 | $36,985 |
| 12/31/2021 | $28,281 | $27,785 | $37,767 |
| 1/31/2022 | $24,875 | $26,150 | $34,526 |
| 2/28/2022 | $24,426 | $25,491 | $33,060 |
| 3/31/2022 | $24,669 | $26,318 | $34,353 |
| 4/30/2022 | $21,356 | $23,956 | $30,204 |
| 5/31/2022 | $20,851 | $23,924 | $29,502 |
| 6/30/2022 | $19,297 | $21,923 | $27,165 |
| 7/31/2022 | $21,599 | $23,979 | $30,426 |
| 8/31/2022 | $20,645 | $23,084 | $29,008 |
| 9/30/2022 | $18,623 | $20,944 | $26,188 |
| 10/31/2022 | $19,353 | $22,661 | $27,719 |
| 11/30/2022 | $20,121 | $23,844 | $28,982 |
| 12/31/2022 | $18,698 | $22,448 | $26,763 |
| 1/31/2023 | $20,177 | $23,994 | $28,994 |
| 2/28/2023 | $19,746 | $23,433 | $28,649 |
| 3/31/2023 | $20,832 | $24,060 | $30,608 |
| 4/30/2023 | $20,963 | $24,316 | $30,910 |
| 5/31/2023 | $21,562 | $24,411 | $32,319 |
| 6/30/2023 | $23,078 | $26,078 | $34,529 |
| 7/31/2023 | $23,490 | $27,013 | $35,692 |
| 8/31/2023 | $23,190 | $26,491 | $35,372 |
| 9/30/2023 | $21,857 | $25,229 | $33,448 |
| 10/31/2023 | $21,469 | $24,560 | $32,972 |
| 11/30/2023 | $23,970 | $26,851 | $36,566 |
| 12/31/2023 | $24,872 | $28,275 | $38,185 |
| 1/31/2024 | $26,014 | $28,588 | $39,138 |
| 2/29/2024 | $28,300 | $30,136 | $41,808 |
| 3/31/2024 | $28,937 | $31,108 | $42,544 |
| 4/30/2024 | $27,449 | $29,739 | $40,739 |
| 5/31/2024 | $29,070 | $31,144 | $43,178 |
| 6/30/2024 | $30,478 | $32,108 | $46,090 |
| 7/31/2024 | $29,788 | $32,705 | $45,306 |
Premier Large Company Growth Fund
Annual Shareholder Report | July 31, 2024
AVERAGE ANNUAL TOTAL RETURNS (%)
| 1 Year | 5 Years | 10 Years |
|---|
| Class A | 26.70 | 11.66 | 12.20 |
| Class A with Load | 19.37 | 10.34 | 11.53 |
Russell 3000® Index | 21.07 | 14.23 | 12.58 |
Russell 1000® Growth Index | 26.94 | 18.41 | 16.31 |
| Total net assets | $1,327,151,195 |
| # of portfolio holdings | 61 |
| Portfolio turnover rate | 47% |
| Total advisory fees paid | $8,656,897 |
What did the Fund invest in?
(Based on long-term investments)
TOP TEN HOLDINGS (% OF NET ASSETS)
| NVIDIA Corp. | 11.0 |
| Microsoft Corp. | 10.5 |
| Amazon.com, Inc. | 5.4 |
| Meta Platforms, Inc. Class A | 5.1 |
| Eli Lilly & Co. | 4.1 |
| Apple, Inc. | 3.6 |
| Fair Isaac Corp. | 2.0 |
| Arista Networks, Inc. | 2.0 |
| Tradeweb Markets, Inc. Class A | 1.9 |
| Mastercard, Inc. Class A | 1.9 |
SECTOR ALLOCATION (% OF LONG-TERM INVESTMENTS)
| Information technology | 39.2 |
| Consumer discretionary | 15.6 |
| Communication services | 13.3 |
| Health care | 11.2 |
| Industrials | 10.5 |
| Financials | 7.2 |
| Materials | 1.2 |
| Utilities | 1.1 |
| Consumer staples | 0.7 |
This is a summary of certain changes and planned changes to the Fund since August 1, 2023.
Effective May 31, 2024, Michael T. Smith, CFA and Christopher J. Warner, CFA were added as portfolio managers of the Fund and effective July 26, 2024, Thomas C. Ognar, CFA and David Nazaret were no longer portfolio managers of the Fund.
You can find additional information on the Fund's website at allspringglobal.com, including its:
- Prospectus - Financial Information - Fund holdings - Proxy voting information
Annual Shareholder Report
Premier Large Company Growth Fund
This annual shareholder report contains important information about Premier Large Company Growth Fund for the period of August 1, 2023 to July 31, 2024. You can find additional information about the Fund at allspringglobal.com. You can also request this information by contacting us at 1-800-222-8222.
This report describes changes to the Fund that occurred during the reporting period.
What were the Fund costs for the past year?
The table explains the costs you would have paid within the reporting period based on a hypothetical $10,000 investment.
| CLASS NAME | COST OF A $10,000 INVESTMENT | COSTS PAID AS A % OF A $10,000 INVESTMENT |
|---|
| Administrator Class | $113 | 1.00% |
The manager has contractually committed to waive fees and/or reimburse certain expenses to the extent necessary to cap the Fund's total annual fund operating expense ratio at a specific amount. Without this cap, the costs shown above may have been higher. Please see the prospectus for the amount and the expiration date of the cap. Prior to or after the commitment expiration date, the cap may be increased or the commitment to maintain the cap may be terminated only with the approval of the Board of Trustees.
How did the Fund perform last year and what affected its performance?
Positive earnings surprises fueled a bull market for large-cap U.S. equities during the 12-month period that ended on July 31, 2024. Companies connected to artificial intelligence (AI) saw their valuations soar. The “Magnificent 7” stocks substantially outperformed the rest of the U.S. equity universe. Inflation concerns and policy uncertainty deterred sentiment for small-cap stocks. Late in the fiscal year, several Magnificent 7 companies struggled to meet high expectations. As a result, market leadership broadened, with small caps narrowing the performance gap relative to mega caps.
Portfolio companies facilitating the structural build-out of AI outperformed significantly during the year. The portfolio benefited from security selection within the consumer discretionary sector, where Deckers Outdoor Corp. did well, along with select technology positions, including NVIDIA Corp. Holdings within health care, including Exact Sciences Corp. and Penumbra, Inc., detracted from returns. We did not make meaningful changes to the portfolio during the 12-month period.
Total return based on a $10,000 investment
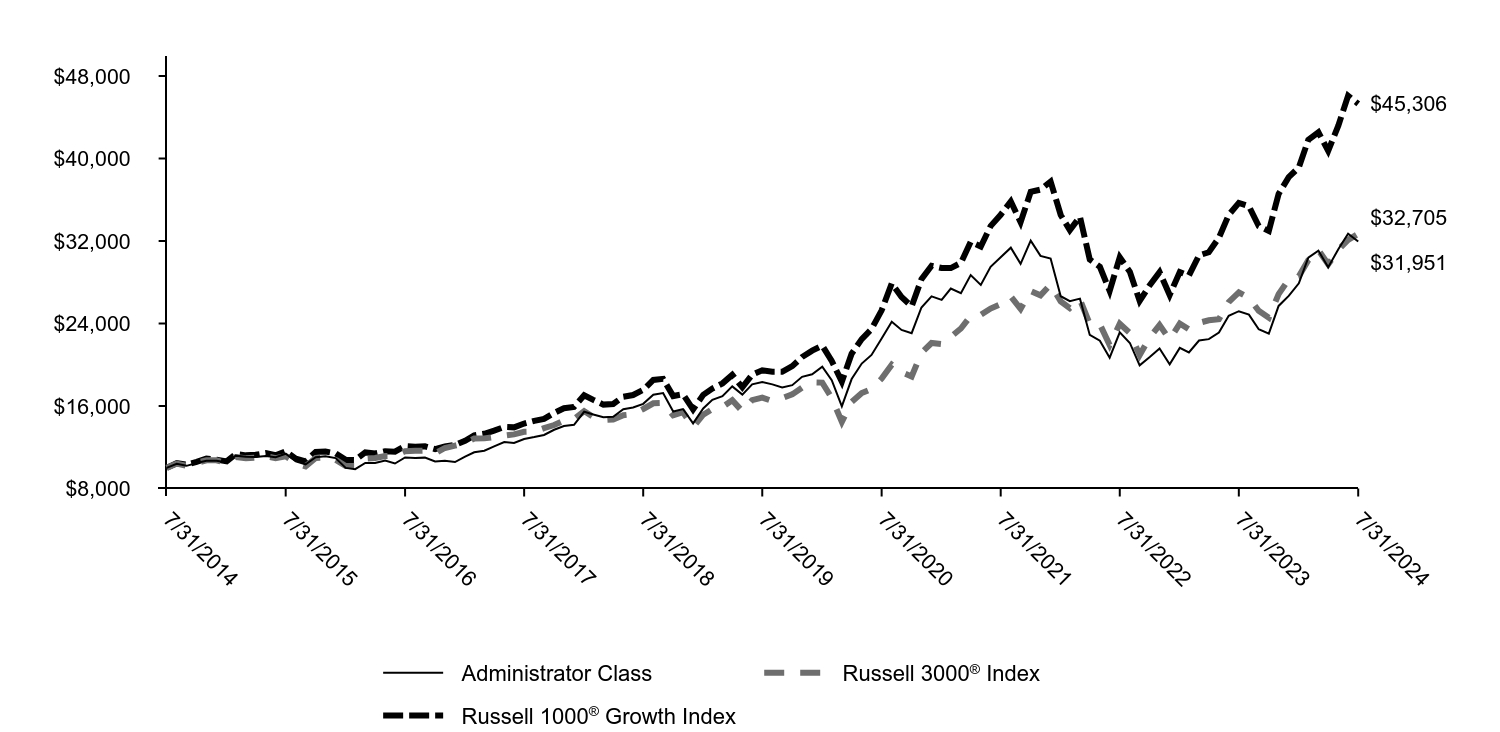
| Administrator Class | Russell 3000® Index | Russell 1000® Growth Index |
|---|
| 7/31/2014 | $10,000 | $10,000 | $10,000 |
| 8/31/2014 | $10,390 | $10,420 | $10,458 |
| 9/30/2014 | $10,198 | $10,202 | $10,306 |
| 10/31/2014 | $10,478 | $10,483 | $10,578 |
| 11/30/2014 | $10,697 | $10,737 | $10,913 |
| 12/31/2014 | $10,694 | $10,737 | $10,800 |
| 1/31/2015 | $10,521 | $10,438 | $10,634 |
| 2/28/2015 | $11,186 | $11,043 | $11,343 |
| 3/31/2015 | $11,068 | $10,930 | $11,214 |
| 4/30/2015 | $11,054 | $10,980 | $11,270 |
| 5/31/2015 | $11,144 | $11,132 | $11,429 |
| 6/30/2015 | $11,034 | $10,945 | $11,227 |
| 7/31/2015 | $11,373 | $11,128 | $11,608 |
| 8/31/2015 | $10,632 | $10,457 | $10,903 |
| 9/30/2015 | $10,340 | $10,152 | $10,634 |
| 10/31/2015 | $11,034 | $10,954 | $11,549 |
| 11/30/2015 | $11,131 | $11,014 | $11,582 |
| 12/31/2015 | $10,950 | $10,788 | $11,412 |
| 1/31/2016 | $9,998 | $10,180 | $10,775 |
| 2/29/2016 | $9,872 | $10,176 | $10,770 |
| 3/31/2016 | $10,474 | $10,893 | $11,496 |
| 4/30/2016 | $10,474 | $10,960 | $11,391 |
| 5/31/2016 | $10,719 | $11,156 | $11,612 |
| 6/30/2016 | $10,422 | $11,179 | $11,567 |
| 7/31/2016 | $11,017 | $11,623 | $12,113 |
| 8/31/2016 | $10,957 | $11,653 | $12,053 |
| 9/30/2016 | $10,994 | $11,671 | $12,097 |
| 10/31/2016 | $10,630 | $11,419 | $11,813 |
| 11/30/2016 | $10,682 | $11,930 | $12,070 |
| 12/31/2016 | $10,569 | $12,162 | $12,219 |
| 1/31/2017 | $11,097 | $12,391 | $12,631 |
| 2/28/2017 | $11,517 | $12,852 | $13,156 |
| 3/31/2017 | $11,666 | $12,861 | $13,308 |
| 4/30/2017 | $12,078 | $12,997 | $13,612 |
| 5/31/2017 | $12,498 | $13,130 | $13,966 |
| 6/30/2017 | $12,408 | $13,249 | $13,929 |
| 7/31/2017 | $12,795 | $13,498 | $14,299 |
| 8/31/2017 | $12,985 | $13,524 | $14,562 |
| 9/30/2017 | $13,191 | $13,854 | $14,751 |
| 10/31/2017 | $13,694 | $14,157 | $15,322 |
| 11/30/2017 | $14,056 | $14,586 | $15,788 |
| 12/31/2017 | $14,173 | $14,732 | $15,911 |
| 1/31/2018 | $15,441 | $15,509 | $17,038 |
| 2/28/2018 | $15,177 | $14,937 | $16,591 |
| 3/31/2018 | $14,913 | $14,637 | $16,136 |
| 4/30/2018 | $14,955 | $14,693 | $16,192 |
| 5/31/2018 | $15,694 | $15,108 | $16,902 |
| 6/30/2018 | $15,863 | $15,207 | $17,065 |
| 7/31/2018 | $16,212 | $15,711 | $17,566 |
| 8/31/2018 | $17,099 | $16,263 | $18,526 |
| 9/30/2018 | $17,257 | $16,290 | $18,630 |
| 10/31/2018 | $15,462 | $15,090 | $16,964 |
| 11/30/2018 | $15,705 | $15,393 | $17,144 |
| 12/31/2018 | $14,311 | $13,960 | $15,670 |
| 1/31/2019 | $15,766 | $15,158 | $17,079 |
| 2/28/2019 | $16,602 | $15,691 | $17,690 |
| 3/31/2019 | $16,956 | $15,920 | $18,193 |
| 4/30/2019 | $17,905 | $16,556 | $19,015 |
| 5/31/2019 | $17,108 | $15,485 | $17,814 |
| 6/30/2019 | $18,095 | $16,572 | $19,037 |
| 7/31/2019 | $18,323 | $16,819 | $19,467 |
| 8/31/2019 | $18,095 | $16,476 | $19,318 |
| 9/30/2019 | $17,791 | $16,765 | $19,320 |
| 10/31/2019 | $18,019 | $17,126 | $19,865 |
| 11/30/2019 | $18,829 | $17,777 | $20,746 |
| 12/31/2019 | $19,078 | $18,290 | $21,372 |
| 1/31/2020 | $19,817 | $18,270 | $21,850 |
| 2/29/2020 | $18,503 | $16,774 | $20,362 |
| 3/31/2020 | $15,971 | $14,468 | $18,359 |
| 4/30/2020 | $18,612 | $16,384 | $21,075 |
| 5/31/2020 | $20,118 | $17,260 | $22,490 |
| 6/30/2020 | $20,952 | $17,655 | $23,470 |
| 7/31/2020 | $22,540 | $18,657 | $25,275 |
| 8/31/2020 | $24,169 | $20,009 | $27,884 |
| 9/30/2020 | $23,375 | $19,280 | $26,572 |
| 10/31/2020 | $23,060 | $18,864 | $25,669 |
| 11/30/2020 | $25,551 | $21,159 | $28,298 |
| 12/31/2020 | $26,626 | $22,111 | $29,599 |
| 1/31/2021 | $26,288 | $22,012 | $29,380 |
| 2/28/2021 | $27,393 | $22,700 | $29,373 |
| 3/31/2021 | $26,948 | $23,514 | $29,878 |
| 4/30/2021 | $28,699 | $24,726 | $31,911 |
| 5/31/2021 | $27,747 | $24,839 | $31,469 |
| 6/30/2021 | $29,497 | $25,452 | $33,444 |
| 7/31/2021 | $30,434 | $25,882 | $34,546 |
| 8/31/2021 | $31,355 | $26,620 | $35,838 |
| 9/30/2021 | $29,789 | $25,426 | $33,830 |
| 10/31/2021 | $32,031 | $27,145 | $36,761 |
| 11/30/2021 | $30,557 | $26,732 | $36,985 |
| 12/31/2021 | $30,300 | $27,785 | $37,767 |
| 1/31/2022 | $26,643 | $26,150 | $34,526 |
| 2/28/2022 | $26,159 | $25,491 | $33,060 |
| 3/31/2022 | $26,411 | $26,318 | $34,353 |
| 4/30/2022 | $22,889 | $23,956 | $30,204 |
| 5/31/2022 | $22,328 | $23,924 | $29,502 |
| 6/30/2022 | $20,683 | $21,923 | $27,165 |
| 7/31/2022 | $23,141 | $23,979 | $30,426 |
| 8/31/2022 | $22,115 | $23,084 | $29,008 |
| 9/30/2022 | $19,948 | $20,944 | $26,188 |
| 10/31/2022 | $20,742 | $22,661 | $27,719 |
| 11/30/2022 | $21,574 | $23,844 | $28,982 |
| 12/31/2022 | $20,045 | $22,448 | $26,763 |
| 1/31/2023 | $21,632 | $23,994 | $28,994 |
| 2/28/2023 | $21,187 | $23,433 | $28,649 |
| 3/31/2023 | $22,347 | $24,060 | $30,608 |
| 4/30/2023 | $22,483 | $24,316 | $30,910 |
| 5/31/2023 | $23,121 | $24,411 | $32,319 |
| 6/30/2023 | $24,747 | $26,078 | $34,529 |
| 7/31/2023 | $25,192 | $27,013 | $35,692 |
| 8/31/2023 | $24,863 | $26,491 | $35,372 |
| 9/30/2023 | $23,445 | $25,229 | $33,448 |
| 10/31/2023 | $23,024 | $24,560 | $32,972 |
| 11/30/2023 | $25,705 | $26,851 | $36,566 |
| 12/31/2023 | $26,675 | $28,275 | $38,185 |
| 1/31/2024 | $27,892 | $28,588 | $39,138 |
| 2/29/2024 | $30,381 | $30,136 | $41,808 |
| 3/31/2024 | $31,058 | $31,108 | $42,544 |
| 4/30/2024 | $29,462 | $29,739 | $40,739 |
| 5/31/2024 | $31,193 | $31,144 | $43,178 |
| 6/30/2024 | $32,708 | $32,108 | $46,090 |
| 7/31/2024 | $31,951 | $32,705 | $45,306 |
Premier Large Company Growth Fund
Annual Shareholder Report | July 31, 2024
AVERAGE ANNUAL TOTAL RETURNS (%)
| 1 Year | 5 Years | 10 Years |
|---|
| Administrator Class | 26.83 | 11.76 | 12.32 |
Russell 3000® Index | 21.07 | 14.23 | 12.58 |
Russell 1000® Growth Index | 26.94 | 18.41 | 16.31 |
| Total net assets | $1,327,151,195 |
| # of portfolio holdings | 61 |
| Portfolio turnover rate | 47% |
| Total advisory fees paid | $8,656,897 |
What did the Fund invest in?
(Based on long-term investments)
TOP TEN HOLDINGS (% OF NET ASSETS)
| NVIDIA Corp. | 11.0 |
| Microsoft Corp. | 10.5 |
| Amazon.com, Inc. | 5.4 |
| Meta Platforms, Inc. Class A | 5.1 |
| Eli Lilly & Co. | 4.1 |
| Apple, Inc. | 3.6 |
| Fair Isaac Corp. | 2.0 |
| Arista Networks, Inc. | 2.0 |
| Tradeweb Markets, Inc. Class A | 1.9 |
| Mastercard, Inc. Class A | 1.9 |
SECTOR ALLOCATION (% OF LONG-TERM INVESTMENTS)
| Information technology | 39.2 |
| Consumer discretionary | 15.6 |
| Communication services | 13.3 |
| Health care | 11.2 |
| Industrials | 10.5 |
| Financials | 7.2 |
| Materials | 1.2 |
| Utilities | 1.1 |
| Consumer staples | 0.7 |
This is a summary of certain changes and planned changes to the Fund since August 1, 2023.
Effective May 31, 2024, Michael T. Smith, CFA and Christopher J. Warner, CFA were added as portfolio managers of the Fund and effective July 26, 2024, Thomas C. Ognar, CFA and David Nazaret were no longer portfolio managers of the Fund.
You can find additional information on the Fund's website at allspringglobal.com, including its:
- Prospectus - Financial Information - Fund holdings - Proxy voting information
Annual Shareholder Report
Special Large Cap Value Fund
This annual shareholder report contains important information about Special Large Cap Value Fund for the period of August 1, 2023 to July 31, 2024. You can find additional information about the Fund at allspringglobal.com. You can also request this information by contacting us at 1-800-222-8222.
What were the Fund costs for the past year?
The table explains the costs you would have paid within the reporting period based on a hypothetical $10,000 investment.
| CLASS NAME | COST OF A $10,000 INVESTMENT | COSTS PAID AS A % OF A $10,000 INVESTMENT |
|---|
| Class R6 | $68 | 0.62% |
The manager has contractually committed to waive fees and/or reimburse certain expenses to the extent necessary to cap the Fund's total annual fund operating expense ratio at a specific amount. Without this cap, the costs shown above may have been higher. Please see the prospectus for the amount and the expiration date of the cap. Prior to or after the commitment expiration date, the cap may be increased or the commitment to maintain the cap may be terminated only with the approval of the Board of Trustees.
How did the Fund perform last year and what affected its performance?
The Fund made minor changes to sector positioning, with an increase in its weight in financials, specifically global systemically important banks, while reducing its weight in health care and communication services, as reward/risk ratios dictated. AerCap Holdings N.V. was the largest relative contributor and is the world’s largest aircraft and engine leasing business, with unrivaled advantages in customer relationships, purchasing power, and market information, which we believe should lead to outsized cash flow growth over time.
The largest detractor was Humana Inc., as management lowered guidance due to pricing set for 2024 not appearing to be sufficient to offset the margin pressure from higher costs across the industry. We believe Humana will be able start to recover this margin compression, just as it has managed successfully through prior periods, as the company maintains a strong underlying cash flow profile.
Total return based on a $10,000 investment

| Class R6 | Russell 3000® Index | Russell 1000® Value Index |
|---|
| 7/31/2014 | $10,000 | $10,000 | $10,000 |
| 8/31/2014 | $10,309 | $10,420 | $10,368 |
| 9/30/2014 | $10,088 | $10,202 | $10,154 |
| 10/31/2014 | $10,331 | $10,483 | $10,382 |
| 11/30/2014 | $10,544 | $10,737 | $10,594 |
| 12/31/2014 | $10,563 | $10,737 | $10,659 |
| 1/31/2015 | $10,192 | $10,438 | $10,233 |
| 2/28/2015 | $10,805 | $11,043 | $10,728 |
| 3/31/2015 | $10,684 | $10,930 | $10,582 |
| 4/30/2015 | $10,861 | $10,980 | $10,681 |
| 5/31/2015 | $10,958 | $11,132 | $10,810 |
| 6/30/2015 | $10,805 | $10,945 | $10,594 |
| 7/31/2015 | $10,974 | $11,128 | $10,640 |
| 8/31/2015 | $10,273 | $10,457 | $10,007 |
| 9/30/2015 | $9,975 | $10,152 | $9,705 |
| 10/31/2015 | $10,805 | $10,954 | $10,437 |
| 11/30/2015 | $10,780 | $11,014 | $10,477 |
| 12/31/2015 | $10,531 | $10,788 | $10,251 |
| 1/31/2016 | $9,857 | $10,180 | $9,722 |
| 2/29/2016 | $9,821 | $10,176 | $9,719 |
| 3/31/2016 | $10,449 | $10,893 | $10,419 |
| 4/30/2016 | $10,540 | $10,960 | $10,638 |
| 5/31/2016 | $10,586 | $11,156 | $10,803 |
| 6/30/2016 | $10,558 | $11,179 | $10,897 |
| 7/31/2016 | $10,831 | $11,623 | $11,213 |
| 8/31/2016 | $10,904 | $11,653 | $11,300 |
| 9/30/2016 | $10,941 | $11,671 | $11,276 |
| 10/31/2016 | $10,722 | $11,419 | $11,102 |
| 11/30/2016 | $11,150 | $11,930 | $11,736 |
| 12/31/2016 | $11,343 | $12,162 | $12,029 |
| 1/31/2017 | $11,501 | $12,391 | $12,115 |
| 2/28/2017 | $11,797 | $12,852 | $12,550 |
| 3/31/2017 | $11,807 | $12,861 | $12,422 |
| 4/30/2017 | $11,837 | $12,997 | $12,399 |
| 5/31/2017 | $11,946 | $13,130 | $12,387 |
| 6/30/2017 | $12,015 | $13,249 | $12,589 |
| 7/31/2017 | $12,351 | $13,498 | $12,757 |
| 8/31/2017 | $12,203 | $13,524 | $12,608 |
| 9/30/2017 | $12,460 | $13,854 | $12,981 |
| 10/31/2017 | $12,589 | $14,157 | $13,076 |
| 11/30/2017 | $12,984 | $14,586 | $13,476 |
| 12/31/2017 | $13,186 | $14,732 | $13,673 |
| 1/31/2018 | $13,920 | $15,509 | $14,201 |
| 2/28/2018 | $13,240 | $14,937 | $13,523 |
| 3/31/2018 | $12,970 | $14,637 | $13,285 |
| 4/30/2018 | $13,099 | $14,693 | $13,329 |
| 5/31/2018 | $13,218 | $15,108 | $13,408 |
| 6/30/2018 | $13,391 | $15,207 | $13,442 |
| 7/31/2018 | $13,952 | $15,711 | $13,974 |
| 8/31/2018 | $14,201 | $16,263 | $14,180 |
| 9/30/2018 | $14,427 | $16,290 | $14,208 |
| 10/31/2018 | $13,650 | $15,090 | $13,472 |
| 11/30/2018 | $14,060 | $15,393 | $13,875 |
| 12/31/2018 | $12,577 | $13,960 | $12,542 |
| 1/31/2019 | $13,614 | $15,158 | $13,519 |
| 2/28/2019 | $14,090 | $15,691 | $13,951 |
| 3/31/2019 | $14,269 | $15,920 | $14,039 |
| 4/30/2019 | $14,971 | $16,556 | $14,537 |
| 5/31/2019 | $14,126 | $15,485 | $13,603 |
| 6/30/2019 | $15,079 | $16,572 | $14,579 |
| 7/31/2019 | $15,400 | $16,819 | $14,700 |
| 8/31/2019 | $15,019 | $16,476 | $14,268 |
| 9/30/2019 | $15,579 | $16,765 | $14,777 |
| 10/31/2019 | $15,650 | $17,126 | $14,983 |
| 11/30/2019 | $16,186 | $17,777 | $15,446 |
| 12/31/2019 | $16,741 | $18,290 | $15,871 |
| 1/31/2020 | $16,197 | $18,270 | $15,530 |
| 2/29/2020 | $14,632 | $16,774 | $14,026 |
| 3/31/2020 | $12,456 | $14,468 | $11,629 |
| 4/30/2020 | $13,743 | $16,384 | $12,936 |
| 5/31/2020 | $14,220 | $17,260 | $13,380 |
| 6/30/2020 | $14,326 | $17,655 | $13,291 |
| 7/31/2020 | $14,804 | $18,657 | $13,816 |
| 8/31/2020 | $15,414 | $20,009 | $14,387 |
| 9/30/2020 | $14,910 | $19,280 | $14,034 |
| 10/31/2020 | $14,605 | $18,864 | $13,850 |
| 11/30/2020 | $16,462 | $21,159 | $15,713 |
| 12/31/2020 | $16,989 | $22,111 | $16,315 |
| 1/31/2021 | $16,611 | $22,012 | $16,166 |
| 2/28/2021 | $17,433 | $22,700 | $17,143 |
| 3/31/2021 | $18,686 | $23,514 | $18,151 |
| 4/30/2021 | $19,414 | $24,726 | $18,877 |
| 5/31/2021 | $19,777 | $24,839 | $19,318 |
| 6/30/2021 | $19,602 | $25,452 | $19,097 |
| 7/31/2021 | $19,845 | $25,882 | $19,249 |
| 8/31/2021 | $20,155 | $26,620 | $19,631 |
| 9/30/2021 | $19,616 | $25,426 | $18,948 |
| 10/31/2021 | $20,842 | $27,145 | $19,910 |
| 11/30/2021 | $20,114 | $26,732 | $19,208 |
| 12/31/2021 | $21,112 | $27,785 | $20,420 |
| 1/31/2022 | $20,534 | $26,150 | $19,944 |
| 2/28/2022 | $20,071 | $25,491 | $19,713 |
| 3/31/2022 | $20,401 | $26,318 | $20,269 |
| 4/30/2022 | $19,046 | $23,956 | $19,126 |
| 5/31/2022 | $19,343 | $23,924 | $19,498 |
| 6/30/2022 | $17,508 | $21,923 | $17,794 |
| 7/31/2022 | $18,880 | $23,979 | $18,974 |
| 8/31/2022 | $18,517 | $23,084 | $18,409 |
| 9/30/2022 | $17,095 | $20,944 | $16,795 |
| 10/31/2022 | $19,227 | $22,661 | $18,517 |
| 11/30/2022 | $20,517 | $23,844 | $19,674 |
| 12/31/2022 | $19,802 | $22,448 | $18,881 |
| 1/31/2023 | $20,584 | $23,994 | $19,859 |
| 2/28/2023 | $19,820 | $23,433 | $19,159 |
| 3/31/2023 | $19,620 | $24,060 | $19,071 |
| 4/30/2023 | $20,239 | $24,316 | $19,358 |
| 5/31/2023 | $19,748 | $24,411 | $18,611 |
| 6/30/2023 | $21,093 | $26,078 | $19,848 |
| 7/31/2023 | $21,639 | $27,013 | $20,546 |
| 8/31/2023 | $21,202 | $26,491 | $19,991 |
| 9/30/2023 | $20,457 | $25,229 | $19,220 |
| 10/31/2023 | $20,093 | $24,560 | $18,541 |
| 11/30/2023 | $21,184 | $26,851 | $19,940 |
| 12/31/2023 | $22,600 | $28,275 | $21,045 |
| 1/31/2024 | $22,844 | $28,588 | $21,067 |
| 2/29/2024 | $23,578 | $30,136 | $21,844 |
| 3/31/2024 | $24,875 | $31,108 | $22,936 |
| 4/30/2024 | $23,972 | $29,739 | $21,956 |
| 5/31/2024 | $24,912 | $31,144 | $22,652 |
| 6/30/2024 | $24,912 | $32,108 | $22,439 |
| 7/31/2024 | $26,097 | $32,705 | $23,586 |
Special Large Cap Value Fund
Annual Shareholder Report | July 31, 2024
AVERAGE ANNUAL TOTAL RETURNS (%)
| 1 Year | 5 Years | 10 Years |
|---|
| Class R6 | 20.60 | 11.13 | 10.07 |
Russell 3000® Index | 21.07 | 14.23 | 12.58 |
Russell 1000® Value Index | 14.80 | 9.92 | 8.96 |
| Total net assets | $1,329,436,518 |
| # of portfolio holdings | 47 |
| Portfolio turnover rate | 36% |
| Total advisory fees paid | $6,909,497 |
What did the Fund invest in?
(Based on long-term investments)
TOP TEN HOLDINGS (% OF NET ASSETS)
| Berkshire Hathaway, Inc. Class B | 4.0 |
| Alphabet, Inc. Class C | 3.6 |
| CBRE Group, Inc. Class A | 3.6 |
| Intercontinental Exchange, Inc. | 3.5 |
| Canadian Pacific Kansas City Ltd. | 3.5 |
| Citigroup, Inc. | 3.5 |
| AerCap Holdings NV | 3.4 |
| JPMorgan Chase & Co. | 3.2 |
| NextEra Energy, Inc. | 3.1 |
| General Motors Co. | 2.9 |
SECTOR ALLOCATION (% OF LONG-TERM INVESTMENTS)
| Financials | 23.4 |
| Industrials | 15.6 |
| Health care | 13.3 |
| Consumer staples | 8.6 |
| Information technology | 8.4 |
| Energy | 7.1 |
| Real estate | 6.4 |
| Consumer discretionary | 5.6 |
| Materials | 4.7 |
| Communication services | 3.7 |
| Utilities | 3.2 |
You can find additional information on the Fund's website at allspringglobal.com, including its:
- Prospectus - Financial Information - Fund holdings - Proxy voting information
Annual Shareholder Report
Special Large Cap Value Fund
This annual shareholder report contains important information about Special Large Cap Value Fund for the period of August 1, 2023 to July 31, 2024. You can find additional information about the Fund at allspringglobal.com. You can also request this information by contacting us at 1-800-222-8222.
What were the Fund costs for the past year?
The table explains the costs you would have paid within the reporting period based on a hypothetical $10,000 investment.
| CLASS NAME | COST OF A $10,000 INVESTMENT | COSTS PAID AS A % OF A $10,000 INVESTMENT |
|---|
| Institutional Class | $77 | 0.70% |
The manager has contractually committed to waive fees and/or reimburse certain expenses to the extent necessary to cap the Fund's total annual fund operating expense ratio at a specific amount. Without this cap, the costs shown above may have been higher. Please see the prospectus for the amount and the expiration date of the cap. Prior to or after the commitment expiration date, the cap may be increased or the commitment to maintain the cap may be terminated only with the approval of the Board of Trustees.
How did the Fund perform last year and what affected its performance?
The Fund made minor changes to sector positioning, with an increase in its weight in financials, specifically global systemically important banks, while reducing its weight in health care and communication services, as reward/risk ratios dictated. AerCap Holdings N.V. was the largest relative contributor and is the world’s largest aircraft and engine leasing business, with unrivaled advantages in customer relationships, purchasing power, and market information, which we believe should lead to outsized cash flow growth over time.
The largest detractor was Humana Inc., as management lowered guidance due to pricing set for 2024 not appearing to be sufficient to offset the margin pressure from higher costs across the industry. We believe Humana will be able start to recover this margin compression, just as it has managed successfully through prior periods, as the company maintains a strong underlying cash flow profile.
Total return based on a $10,000 investment
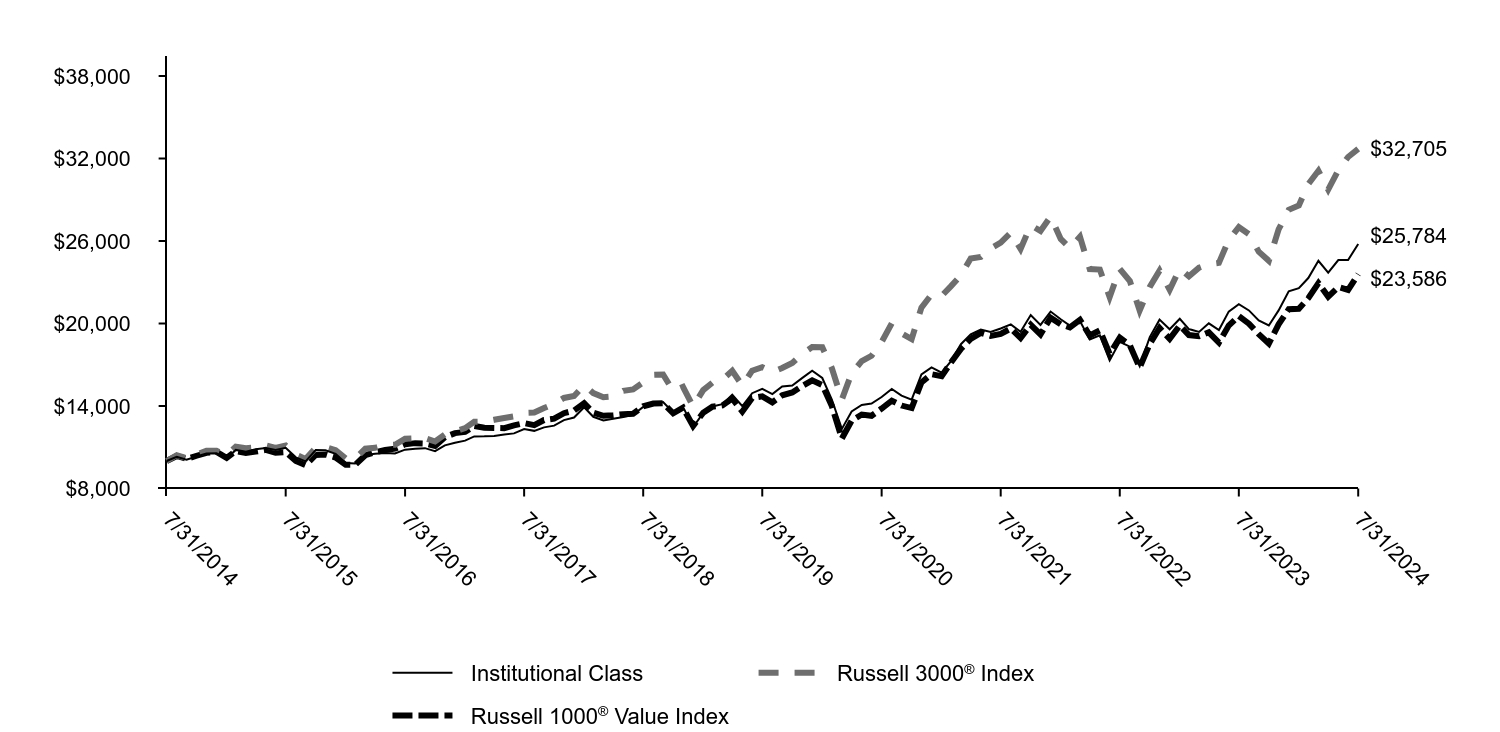
| Institutional Class | Russell 3000® Index | Russell 1000® Value Index |
|---|
| 7/31/2014 | $10,000 | $10,000 | $10,000 |
| 8/31/2014 | $10,307 | $10,420 | $10,368 |
| 9/30/2014 | $10,088 | $10,202 | $10,154 |
| 10/31/2014 | $10,329 | $10,483 | $10,382 |
| 11/30/2014 | $10,541 | $10,737 | $10,594 |
| 12/31/2014 | $10,560 | $10,737 | $10,659 |
| 1/31/2015 | $10,187 | $10,438 | $10,233 |
| 2/28/2015 | $10,807 | $11,043 | $10,728 |
| 3/31/2015 | $10,679 | $10,930 | $10,582 |
| 4/30/2015 | $10,862 | $10,980 | $10,681 |
| 5/31/2015 | $10,950 | $11,132 | $10,810 |
| 6/30/2015 | $10,799 | $10,945 | $10,594 |
| 7/31/2015 | $10,966 | $11,128 | $10,640 |
| 8/31/2015 | $10,266 | $10,457 | $10,007 |
| 9/30/2015 | $9,972 | $10,152 | $9,705 |
| 10/31/2015 | $10,799 | $10,954 | $10,437 |
| 11/30/2015 | $10,775 | $11,014 | $10,477 |
| 12/31/2015 | $10,522 | $10,788 | $10,251 |
| 1/31/2016 | $9,850 | $10,180 | $9,722 |
| 2/29/2016 | $9,823 | $10,176 | $9,719 |
| 3/31/2016 | $10,441 | $10,893 | $10,419 |
| 4/30/2016 | $10,531 | $10,960 | $10,638 |
| 5/31/2016 | $10,576 | $11,156 | $10,803 |
| 6/30/2016 | $10,549 | $11,179 | $10,897 |
| 7/31/2016 | $10,827 | $11,623 | $11,213 |
| 8/31/2016 | $10,898 | $11,653 | $11,300 |
| 9/30/2016 | $10,934 | $11,671 | $11,276 |
| 10/31/2016 | $10,719 | $11,419 | $11,102 |
| 11/30/2016 | $11,140 | $11,930 | $11,736 |
| 12/31/2016 | $11,328 | $12,162 | $12,029 |
| 1/31/2017 | $11,483 | $12,391 | $12,115 |
| 2/28/2017 | $11,785 | $12,852 | $12,550 |
| 3/31/2017 | $11,795 | $12,861 | $12,422 |
| 4/30/2017 | $11,824 | $12,997 | $12,399 |
| 5/31/2017 | $11,931 | $13,130 | $12,387 |
| 6/30/2017 | $12,009 | $13,249 | $12,589 |
| 7/31/2017 | $12,329 | $13,498 | $12,757 |
| 8/31/2017 | $12,193 | $13,524 | $12,608 |
| 9/30/2017 | $12,446 | $13,854 | $12,981 |
| 10/31/2017 | $12,572 | $14,157 | $13,076 |
| 11/30/2017 | $12,971 | $14,586 | $13,476 |
| 12/31/2017 | $13,164 | $14,732 | $13,673 |
| 1/31/2018 | $13,906 | $15,509 | $14,201 |
| 2/28/2018 | $13,217 | $14,937 | $13,523 |
| 3/31/2018 | $12,952 | $14,637 | $13,285 |
| 4/30/2018 | $13,080 | $14,693 | $13,329 |
| 5/31/2018 | $13,196 | $15,108 | $13,408 |
| 6/30/2018 | $13,366 | $15,207 | $13,442 |
| 7/31/2018 | $13,928 | $15,711 | $13,974 |
| 8/31/2018 | $14,182 | $16,263 | $14,180 |
| 9/30/2018 | $14,288 | $16,290 | $14,208 |
| 10/31/2018 | $13,525 | $15,090 | $13,472 |
| 11/30/2018 | $13,938 | $15,393 | $13,875 |
| 12/31/2018 | $12,464 | $13,960 | $12,542 |
| 1/31/2019 | $13,490 | $15,158 | $13,519 |
| 2/28/2019 | $13,963 | $15,691 | $13,951 |
| 3/31/2019 | $14,136 | $15,920 | $14,039 |
| 4/30/2019 | $14,816 | $16,556 | $14,537 |
| 5/31/2019 | $13,986 | $15,485 | $13,603 |
| 6/30/2019 | $14,931 | $16,572 | $14,579 |
| 7/31/2019 | $15,243 | $16,819 | $14,700 |
| 8/31/2019 | $14,862 | $16,476 | $14,268 |
| 9/30/2019 | $15,416 | $16,765 | $14,777 |
| 10/31/2019 | $15,496 | $17,126 | $14,983 |
| 11/30/2019 | $16,027 | $17,777 | $15,446 |
| 12/31/2019 | $16,563 | $18,290 | $15,871 |
| 1/31/2020 | $16,037 | $18,270 | $15,530 |
| 2/29/2020 | $14,488 | $16,774 | $14,026 |
| 3/31/2020 | $12,336 | $14,468 | $11,629 |
| 4/30/2020 | $13,604 | $16,384 | $12,936 |
| 5/31/2020 | $14,078 | $17,260 | $13,380 |
| 6/30/2020 | $14,180 | $17,655 | $13,291 |
| 7/31/2020 | $14,654 | $18,657 | $13,816 |
| 8/31/2020 | $15,243 | $20,009 | $14,387 |
| 9/30/2020 | $14,757 | $19,280 | $14,034 |
| 10/31/2020 | $14,462 | $18,864 | $13,850 |
| 11/30/2020 | $16,294 | $21,159 | $15,713 |
| 12/31/2020 | $16,803 | $22,111 | $16,315 |
| 1/31/2021 | $16,426 | $22,012 | $16,166 |
| 2/28/2021 | $17,245 | $22,700 | $17,143 |
| 3/31/2021 | $18,494 | $23,514 | $18,151 |
| 4/30/2021 | $19,209 | $24,726 | $18,877 |
| 5/31/2021 | $19,560 | $24,839 | $19,318 |
| 6/30/2021 | $19,391 | $25,452 | $19,097 |
| 7/31/2021 | $19,638 | $25,882 | $19,249 |
| 8/31/2021 | $19,937 | $26,620 | $19,631 |
| 9/30/2021 | $19,404 | $25,426 | $18,948 |
| 10/31/2021 | $20,614 | $27,145 | $19,910 |
| 11/30/2021 | $19,898 | $26,732 | $19,208 |
| 12/31/2021 | $20,868 | $27,785 | $20,420 |
| 1/31/2022 | $20,313 | $26,150 | $19,944 |
| 2/28/2022 | $19,853 | $25,491 | $19,713 |
| 3/31/2022 | $20,186 | $26,318 | $20,269 |
| 4/30/2022 | $18,838 | $23,956 | $19,126 |
| 5/31/2022 | $19,139 | $23,924 | $19,498 |
| 6/30/2022 | $17,316 | $21,923 | $17,794 |
| 7/31/2022 | $18,663 | $23,979 | $18,974 |
| 8/31/2022 | $18,315 | $23,084 | $18,409 |
| 9/30/2022 | $16,903 | $20,944 | $16,795 |
| 10/31/2022 | $19,012 | $22,661 | $18,517 |
| 11/30/2022 | $20,281 | $23,844 | $19,674 |
| 12/31/2022 | $19,579 | $22,448 | $18,881 |
| 1/31/2023 | $20,344 | $23,994 | $19,859 |
| 2/28/2023 | $19,596 | $23,433 | $19,159 |
| 3/31/2023 | $19,387 | $24,060 | $19,071 |
| 4/30/2023 | $20,013 | $24,316 | $19,358 |
| 5/31/2023 | $19,527 | $24,411 | $18,611 |
| 6/30/2023 | $20,865 | $26,078 | $19,848 |
| 7/31/2023 | $21,404 | $27,013 | $20,546 |
| 8/31/2023 | $20,952 | $26,491 | $19,991 |
| 9/30/2023 | $20,222 | $25,229 | $19,220 |
| 10/31/2023 | $19,857 | $24,560 | $18,541 |
| 11/30/2023 | $20,952 | $26,851 | $19,940 |
| 12/31/2023 | $22,337 | $28,275 | $21,045 |
| 1/31/2024 | $22,570 | $28,588 | $21,067 |
| 2/29/2024 | $23,306 | $30,136 | $21,844 |
| 3/31/2024 | $24,563 | $31,108 | $22,936 |
| 4/30/2024 | $23,701 | $29,739 | $21,956 |
| 5/31/2024 | $24,617 | $31,144 | $22,652 |
| 6/30/2024 | $24,617 | $32,108 | $22,439 |
| 7/31/2024 | $25,784 | $32,705 | $23,586 |
Special Large Cap Value Fund
Annual Shareholder Report | July 31, 2024
AVERAGE ANNUAL TOTAL RETURNS (%)
| 1 Year | 5 Years | 10 Years |
|---|
| Institutional Class | 20.46 | 11.09 | 9.93 |
Russell 3000® Index | 21.07 | 14.23 | 12.58 |
Russell 1000® Value Index | 14.80 | 9.92 | 8.96 |
| Total net assets | $1,329,436,518 |
| # of portfolio holdings | 47 |
| Portfolio turnover rate | 36% |
| Total advisory fees paid | $6,909,497 |
What did the Fund invest in?
(Based on long-term investments)
TOP TEN HOLDINGS (% OF NET ASSETS)
| Berkshire Hathaway, Inc. Class B | 4.0 |
| Alphabet, Inc. Class C | 3.6 |
| CBRE Group, Inc. Class A | 3.6 |
| Intercontinental Exchange, Inc. | 3.5 |
| Canadian Pacific Kansas City Ltd. | 3.5 |
| Citigroup, Inc. | 3.5 |
| AerCap Holdings NV | 3.4 |
| JPMorgan Chase & Co. | 3.2 |
| NextEra Energy, Inc. | 3.1 |
| General Motors Co. | 2.9 |
SECTOR ALLOCATION (% OF LONG-TERM INVESTMENTS)
| Financials | 23.4 |
| Industrials | 15.6 |
| Health care | 13.3 |
| Consumer staples | 8.6 |
| Information technology | 8.4 |
| Energy | 7.1 |
| Real estate | 6.4 |
| Consumer discretionary | 5.6 |
| Materials | 4.7 |
| Communication services | 3.7 |
| Utilities | 3.2 |
You can find additional information on the Fund's website at allspringglobal.com, including its:
- Prospectus - Financial Information - Fund holdings - Proxy voting information
Annual Shareholder Report
Special Large Cap Value Fund
This annual shareholder report contains important information about Special Large Cap Value Fund for the period of August 1, 2023 to July 31, 2024. You can find additional information about the Fund at allspringglobal.com. You can also request this information by contacting us at 1-800-222-8222.
What were the Fund costs for the past year?
The table explains the costs you would have paid within the reporting period based on a hypothetical $10,000 investment.
| CLASS NAME | COST OF A $10,000 INVESTMENT | COSTS PAID AS A % OF A $10,000 INVESTMENT |
|---|
| Class C | $199 | 1.82% |
The manager has contractually committed to waive fees and/or reimburse certain expenses to the extent necessary to cap the Fund's total annual fund operating expense ratio at a specific amount. Without this cap, the costs shown above may have been higher. Please see the prospectus for the amount and the expiration date of the cap. Prior to or after the commitment expiration date, the cap may be increased or the commitment to maintain the cap may be terminated only with the approval of the Board of Trustees.
How did the Fund perform last year and what affected its performance?
The Fund made minor changes to sector positioning, with an increase in its weight in financials, specifically global systemically important banks, while reducing its weight in health care and communication services, as reward/risk ratios dictated. AerCap Holdings N.V. was the largest relative contributor and is the world’s largest aircraft and engine leasing business, with unrivaled advantages in customer relationships, purchasing power, and market information, which we believe should lead to outsized cash flow growth over time.
The largest detractor was Humana Inc., as management lowered guidance due to pricing set for 2024 not appearing to be sufficient to offset the margin pressure from higher costs across the industry. We believe Humana will be able start to recover this margin compression, just as it has managed successfully through prior periods, as the company maintains a strong underlying cash flow profile.
Total return based on a $10,000 investment
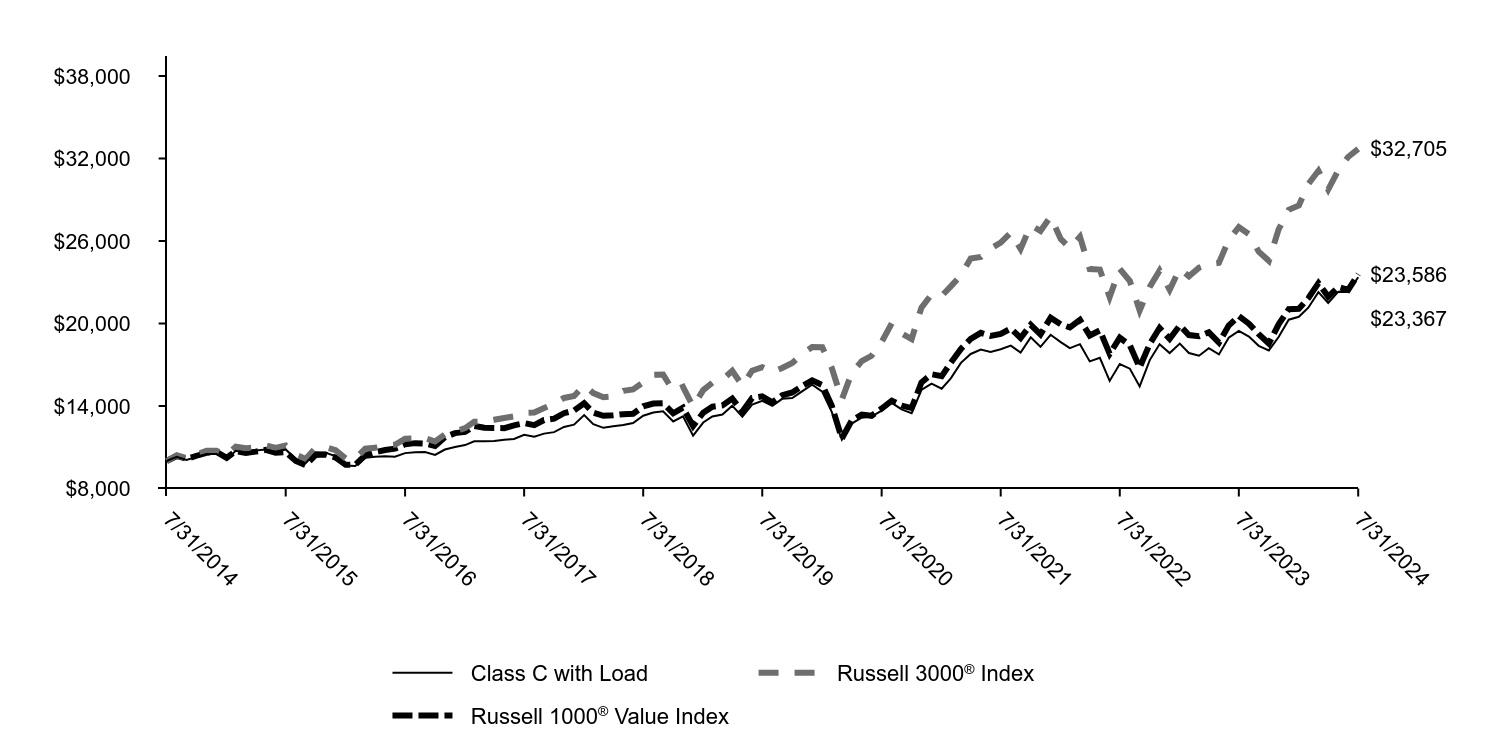
| Class C with Load | Russell 3000® Index | Russell 1000® Value Index |
|---|
| 7/31/2014 | $10,000 | $10,000 | $10,000 |
| 8/31/2014 | $10,299 | $10,420 | $10,368 |
| 9/30/2014 | $10,075 | $10,202 | $10,154 |
| 10/31/2014 | $10,299 | $10,483 | $10,382 |
| 11/30/2014 | $10,501 | $10,737 | $10,594 |
| 12/31/2014 | $10,511 | $10,737 | $10,659 |
| 1/31/2015 | $10,132 | $10,438 | $10,233 |
| 2/28/2015 | $10,737 | $11,043 | $10,728 |
| 3/31/2015 | $10,600 | $10,930 | $10,582 |
| 4/30/2015 | $10,769 | $10,980 | $10,681 |
| 5/31/2015 | $10,842 | $11,132 | $10,810 |
| 6/30/2015 | $10,681 | $10,945 | $10,594 |
| 7/31/2015 | $10,842 | $11,128 | $10,640 |
| 8/31/2015 | $10,141 | $10,457 | $10,007 |
| 9/30/2015 | $9,834 | $10,152 | $9,705 |
| 10/31/2015 | $10,640 | $10,954 | $10,437 |
| 11/30/2015 | $10,608 | $11,014 | $10,477 |
| 12/31/2015 | $10,349 | $10,788 | $10,251 |
| 1/31/2016 | $9,674 | $10,180 | $9,722 |
| 2/29/2016 | $9,638 | $10,176 | $9,719 |
| 3/31/2016 | $10,241 | $10,893 | $10,419 |
| 4/30/2016 | $10,313 | $10,960 | $10,638 |
| 5/31/2016 | $10,349 | $11,156 | $10,803 |
| 6/30/2016 | $10,313 | $11,179 | $10,897 |
| 7/31/2016 | $10,574 | $11,623 | $11,213 |
| 8/31/2016 | $10,638 | $11,653 | $11,300 |
| 9/30/2016 | $10,656 | $11,671 | $11,276 |
| 10/31/2016 | $10,439 | $11,419 | $11,102 |
| 11/30/2016 | $10,836 | $11,930 | $11,736 |
| 12/31/2016 | $11,015 | $12,162 | $12,029 |
| 1/31/2017 | $11,160 | $12,391 | $12,115 |
| 2/28/2017 | $11,431 | $12,852 | $12,550 |
| 3/31/2017 | $11,431 | $12,861 | $12,422 |
| 4/30/2017 | $11,450 | $12,997 | $12,399 |
| 5/31/2017 | $11,547 | $13,130 | $12,387 |
| 6/30/2017 | $11,605 | $13,249 | $12,589 |
| 7/31/2017 | $11,905 | $13,498 | $12,757 |
| 8/31/2017 | $11,760 | $13,524 | $12,608 |
| 9/30/2017 | $11,992 | $13,854 | $12,981 |
| 10/31/2017 | $12,098 | $14,157 | $13,076 |
| 11/30/2017 | $12,475 | $14,586 | $13,476 |
| 12/31/2017 | $12,643 | $14,732 | $13,673 |
| 1/31/2018 | $13,344 | $15,509 | $14,201 |
| 2/28/2018 | $12,674 | $14,937 | $13,523 |
| 3/31/2018 | $12,412 | $14,637 | $13,285 |
| 4/30/2018 | $12,527 | $14,693 | $13,329 |
| 5/31/2018 | $12,622 | $15,108 | $13,408 |
| 6/30/2018 | $12,768 | $15,207 | $13,442 |
| 7/31/2018 | $13,292 | $15,711 | $13,974 |
| 8/31/2018 | $13,522 | $16,263 | $14,180 |
| 9/30/2018 | $13,617 | $16,290 | $14,208 |
| 10/31/2018 | $12,873 | $15,090 | $13,472 |
| 11/30/2018 | $13,250 | $15,393 | $13,875 |
| 12/31/2018 | $11,839 | $13,960 | $12,542 |
| 1/31/2019 | $12,798 | $15,158 | $13,519 |
| 2/28/2019 | $13,238 | $15,691 | $13,951 |
| 3/31/2019 | $13,384 | $15,920 | $14,039 |
| 4/30/2019 | $14,027 | $16,556 | $14,537 |
| 5/31/2019 | $13,215 | $15,485 | $13,603 |
| 6/30/2019 | $14,106 | $16,572 | $14,579 |
| 7/31/2019 | $14,376 | $16,819 | $14,700 |
| 8/31/2019 | $14,016 | $16,476 | $14,268 |
| 9/30/2019 | $14,523 | $16,765 | $14,777 |
| 10/31/2019 | $14,579 | $17,126 | $14,983 |
| 11/30/2019 | $15,064 | $17,777 | $15,446 |
| 12/31/2019 | $15,548 | $18,290 | $15,871 |
| 1/31/2020 | $15,039 | $18,270 | $15,530 |
| 2/29/2020 | $13,572 | $16,774 | $14,026 |
| 3/31/2020 | $11,546 | $14,468 | $11,629 |
| 4/30/2020 | $12,727 | $16,384 | $12,936 |
| 5/31/2020 | $13,149 | $17,260 | $13,380 |
| 6/30/2020 | $13,236 | $17,655 | $13,291 |
| 7/31/2020 | $13,659 | $18,657 | $13,816 |
| 8/31/2020 | $14,231 | $20,009 | $14,387 |
| 9/30/2020 | $13,758 | $19,280 | $14,034 |
| 10/31/2020 | $13,473 | $18,864 | $13,850 |
| 11/30/2020 | $15,163 | $21,159 | $15,713 |
| 12/31/2020 | $15,623 | $22,111 | $16,315 |
| 1/31/2021 | $15,262 | $22,012 | $16,166 |
| 2/28/2021 | $16,008 | $22,700 | $17,143 |
| 3/31/2021 | $17,139 | $23,514 | $18,151 |
| 4/30/2021 | $17,785 | $24,726 | $18,877 |
| 5/31/2021 | $18,108 | $24,839 | $19,318 |
| 6/30/2021 | $17,934 | $25,452 | $19,097 |
| 7/31/2021 | $18,133 | $25,882 | $19,249 |
| 8/31/2021 | $18,394 | $26,620 | $19,631 |
| 9/30/2021 | $17,885 | $25,426 | $18,948 |
| 10/31/2021 | $18,991 | $27,145 | $19,910 |
| 11/30/2021 | $18,307 | $26,732 | $19,208 |
| 12/31/2021 | $19,179 | $27,785 | $20,420 |
| 1/31/2022 | $18,650 | $26,150 | $19,944 |
| 2/28/2022 | $18,212 | $25,491 | $19,713 |
| 3/31/2022 | $18,499 | $26,318 | $20,269 |
| 4/30/2022 | $17,244 | $23,956 | $19,126 |
| 5/31/2022 | $17,501 | $23,924 | $19,498 |
| 6/30/2022 | $15,824 | $21,923 | $17,794 |
| 7/31/2022 | $17,048 | $23,979 | $18,974 |
| 8/31/2022 | $16,712 | $23,084 | $18,409 |
| 9/30/2022 | $15,425 | $20,944 | $16,795 |
| 10/31/2022 | $17,340 | $22,661 | $18,517 |
| 11/30/2022 | $18,495 | $23,844 | $19,674 |
| 12/31/2022 | $17,850 | $22,448 | $18,881 |
| 1/31/2023 | $18,537 | $23,994 | $19,859 |
| 2/28/2023 | $17,850 | $23,433 | $19,159 |
| 3/31/2023 | $17,658 | $24,060 | $19,071 |
| 4/30/2023 | $18,201 | $24,316 | $19,358 |
| 5/31/2023 | $17,754 | $24,411 | $18,611 |
| 6/30/2023 | $18,968 | $26,078 | $19,848 |
| 7/31/2023 | $19,464 | $27,013 | $20,546 |
| 8/31/2023 | $19,048 | $26,491 | $19,991 |
| 9/30/2023 | $18,377 | $25,229 | $19,220 |
| 10/31/2023 | $18,042 | $24,560 | $18,541 |
| 11/30/2023 | $19,016 | $26,851 | $19,940 |
| 12/31/2023 | $20,276 | $28,275 | $21,045 |
| 1/31/2024 | $20,490 | $28,588 | $21,067 |
| 2/29/2024 | $21,147 | $30,136 | $21,844 |
| 3/31/2024 | $22,282 | $31,108 | $22,936 |
| 4/30/2024 | $21,493 | $29,739 | $21,956 |
| 5/31/2024 | $22,315 | $31,144 | $22,652 |
| 6/30/2024 | $22,298 | $32,108 | $22,439 |
| 7/31/2024 | $23,367 | $32,705 | $23,586 |
Special Large Cap Value Fund
Annual Shareholder Report | July 31, 2024
AVERAGE ANNUAL TOTAL RETURNS (%)
| 1 Year | 5 Years | 10 Years |
|---|
| Class C | 19.16 | 9.87 | 8.86 |
| Class C with Load | 18.16 | 9.87 | 8.86 |
Russell 3000® Index | 21.07 | 14.23 | 12.58 |
Russell 1000® Value Index | 14.80 | 9.92 | 8.96 |
| Total net assets | $1,329,436,518 |
| # of portfolio holdings | 47 |
| Portfolio turnover rate | 36% |
| Total advisory fees paid | $6,909,497 |
What did the Fund invest in?
(Based on long-term investments)
TOP TEN HOLDINGS (% OF NET ASSETS)
| Berkshire Hathaway, Inc. Class B | 4.0 |
| Alphabet, Inc. Class C | 3.6 |
| CBRE Group, Inc. Class A | 3.6 |
| Intercontinental Exchange, Inc. | 3.5 |
| Canadian Pacific Kansas City Ltd. | 3.5 |
| Citigroup, Inc. | 3.5 |
| AerCap Holdings NV | 3.4 |
| JPMorgan Chase & Co. | 3.2 |
| NextEra Energy, Inc. | 3.1 |
| General Motors Co. | 2.9 |
SECTOR ALLOCATION (% OF LONG-TERM INVESTMENTS)
| Financials | 23.4 |
| Industrials | 15.6 |
| Health care | 13.3 |
| Consumer staples | 8.6 |
| Information technology | 8.4 |
| Energy | 7.1 |
| Real estate | 6.4 |
| Consumer discretionary | 5.6 |
| Materials | 4.7 |
| Communication services | 3.7 |
| Utilities | 3.2 |
You can find additional information on the Fund's website at allspringglobal.com, including its:
- Prospectus - Financial Information - Fund holdings - Proxy voting information
Annual Shareholder Report
Special Large Cap Value Fund
This annual shareholder report contains important information about Special Large Cap Value Fund for the period of August 1, 2023 to July 31, 2024. You can find additional information about the Fund at allspringglobal.com. You can also request this information by contacting us at 1-800-222-8222.
What were the Fund costs for the past year?
The table explains the costs you would have paid within the reporting period based on a hypothetical $10,000 investment.
| CLASS NAME | COST OF A $10,000 INVESTMENT | COSTS PAID AS A % OF A $10,000 INVESTMENT |
|---|
| Class A | $116 | 1.05% |
The manager has contractually committed to waive fees and/or reimburse certain expenses to the extent necessary to cap the Fund's total annual fund operating expense ratio at a specific amount. Without this cap, the costs shown above may have been higher. Please see the prospectus for the amount and the expiration date of the cap. Prior to or after the commitment expiration date, the cap may be increased or the commitment to maintain the cap may be terminated only with the approval of the Board of Trustees.
How did the Fund perform last year and what affected its performance?
The Fund made minor changes to sector positioning, with an increase in its weight in financials, specifically global systemically important banks, while reducing its weight in health care and communication services, as reward/risk ratios dictated. AerCap Holdings N.V. was the largest relative contributor and is the world’s largest aircraft and engine leasing business, with unrivaled advantages in customer relationships, purchasing power, and market information, which we believe should lead to outsized cash flow growth over time.
The largest detractor was Humana Inc., as management lowered guidance due to pricing set for 2024 not appearing to be sufficient to offset the margin pressure from higher costs across the industry. We believe Humana will be able start to recover this margin compression, just as it has managed successfully through prior periods, as the company maintains a strong underlying cash flow profile.
Total return based on a $10,000 investment

| Class A with Load | Russell 3000® Index | Russell 1000® Value Index |
|---|
| 7/31/2014 | $9,425 | $10,000 | $10,000 |
| 8/31/2014 | $9,709 | $10,420 | $10,368 |
| 9/30/2014 | $9,501 | $10,202 | $10,154 |
| 10/31/2014 | $9,723 | $10,483 | $10,382 |
| 11/30/2014 | $9,917 | $10,737 | $10,594 |
| 12/31/2014 | $9,931 | $10,737 | $10,659 |
| 1/31/2015 | $9,579 | $10,438 | $10,233 |
| 2/28/2015 | $10,156 | $11,043 | $10,728 |
| 3/31/2015 | $10,036 | $10,930 | $10,582 |
| 4/30/2015 | $10,201 | $10,980 | $10,681 |
| 5/31/2015 | $10,283 | $11,132 | $10,810 |
| 6/30/2015 | $10,133 | $10,945 | $10,594 |
| 7/31/2015 | $10,291 | $11,128 | $10,640 |
| 8/31/2015 | $9,631 | $10,457 | $10,007 |
| 9/30/2015 | $9,346 | $10,152 | $9,705 |
| 10/31/2015 | $10,118 | $10,954 | $10,437 |
| 11/30/2015 | $10,096 | $11,014 | $10,477 |
| 12/31/2015 | $9,852 | $10,788 | $10,251 |
| 1/31/2016 | $9,220 | $10,180 | $9,722 |
| 2/29/2016 | $9,187 | $10,176 | $9,719 |
| 3/31/2016 | $9,768 | $10,893 | $10,419 |
| 4/30/2016 | $9,844 | $10,960 | $10,638 |
| 5/31/2016 | $9,886 | $11,156 | $10,803 |
| 6/30/2016 | $9,860 | $11,179 | $10,897 |
| 7/31/2016 | $10,113 | $11,623 | $11,213 |
| 8/31/2016 | $10,180 | $11,653 | $11,300 |
| 9/30/2016 | $10,206 | $11,671 | $11,276 |
| 10/31/2016 | $10,004 | $11,419 | $11,102 |
| 11/30/2016 | $10,391 | $11,930 | $11,736 |
| 12/31/2016 | $10,568 | $12,162 | $12,029 |
| 1/31/2017 | $10,714 | $12,391 | $12,115 |
| 2/28/2017 | $10,978 | $12,852 | $12,550 |
| 3/31/2017 | $10,987 | $12,861 | $12,422 |
| 4/30/2017 | $11,014 | $12,997 | $12,399 |
| 5/31/2017 | $11,114 | $13,130 | $12,387 |
| 6/30/2017 | $11,178 | $13,249 | $12,589 |
| 7/31/2017 | $11,478 | $13,498 | $12,757 |
| 8/31/2017 | $11,342 | $13,524 | $12,608 |
| 9/30/2017 | $11,579 | $13,854 | $12,981 |
| 10/31/2017 | $11,688 | $14,157 | $13,076 |
| 11/30/2017 | $12,052 | $14,586 | $13,476 |
| 12/31/2017 | $12,222 | $14,732 | $13,673 |
| 1/31/2018 | $12,915 | $15,509 | $14,201 |
| 2/28/2018 | $12,272 | $14,937 | $13,523 |
| 3/31/2018 | $12,025 | $14,637 | $13,285 |
| 4/30/2018 | $12,133 | $14,693 | $13,329 |
| 5/31/2018 | $12,242 | $15,108 | $13,408 |
| 6/30/2018 | $12,391 | $15,207 | $13,442 |
| 7/31/2018 | $12,905 | $15,711 | $13,974 |
| 8/31/2018 | $13,132 | $16,263 | $14,180 |
| 9/30/2018 | $13,241 | $16,290 | $14,208 |
| 10/31/2018 | $12,519 | $15,090 | $13,472 |
| 11/30/2018 | $12,895 | $15,393 | $13,875 |
| 12/31/2018 | $11,530 | $13,960 | $12,542 |
| 1/31/2019 | $12,473 | $15,158 | $13,519 |
| 2/28/2019 | $12,912 | $15,691 | $13,951 |
| 3/31/2019 | $13,062 | $15,920 | $14,039 |
| 4/30/2019 | $13,695 | $16,556 | $14,537 |
| 5/31/2019 | $12,912 | $15,485 | $13,603 |
| 6/30/2019 | $13,791 | $16,572 | $14,579 |
| 7/31/2019 | $14,070 | $16,819 | $14,700 |
| 8/31/2019 | $13,716 | $16,476 | $14,268 |
| 9/30/2019 | $14,220 | $16,765 | $14,777 |
| 10/31/2019 | $14,284 | $17,126 | $14,983 |
| 11/30/2019 | $14,777 | $17,777 | $15,446 |
| 12/31/2019 | $15,264 | $18,290 | $15,871 |
| 1/31/2020 | $14,778 | $18,270 | $15,530 |
| 2/29/2020 | $13,341 | $16,774 | $14,026 |
| 3/31/2020 | $11,359 | $14,468 | $11,629 |
| 4/30/2020 | $12,522 | $16,384 | $12,936 |
| 5/31/2020 | $12,950 | $17,260 | $13,380 |
| 6/30/2020 | $13,045 | $17,655 | $13,291 |
| 7/31/2020 | $13,472 | $18,657 | $13,816 |
| 8/31/2020 | $14,018 | $20,009 | $14,387 |
| 9/30/2020 | $13,555 | $19,280 | $14,034 |
| 10/31/2020 | $13,282 | $18,864 | $13,850 |
| 11/30/2020 | $14,968 | $21,159 | $15,713 |
| 12/31/2020 | $15,426 | $22,111 | $16,315 |
| 1/31/2021 | $15,078 | $22,012 | $16,166 |
| 2/28/2021 | $15,823 | $22,700 | $17,143 |
| 3/31/2021 | $16,951 | $23,514 | $18,151 |
| 4/30/2021 | $17,599 | $24,726 | $18,877 |
| 5/31/2021 | $17,935 | $24,839 | $19,318 |
| 6/30/2021 | $17,767 | $25,452 | $19,097 |
| 7/31/2021 | $17,983 | $25,882 | $19,249 |
| 8/31/2021 | $18,260 | $26,620 | $19,631 |
| 9/30/2021 | $17,755 | $25,426 | $18,948 |
| 10/31/2021 | $18,860 | $27,145 | $19,910 |
| 11/30/2021 | $18,200 | $26,732 | $19,208 |
| 12/31/2021 | $19,092 | $27,785 | $20,420 |
| 1/31/2022 | $18,566 | $26,150 | $19,944 |
| 2/28/2022 | $18,143 | $25,491 | $19,713 |
| 3/31/2022 | $18,435 | $26,318 | $20,269 |
| 4/30/2022 | $17,208 | $23,956 | $19,126 |
| 5/31/2022 | $17,471 | $23,924 | $19,498 |
| 6/30/2022 | $15,806 | $21,923 | $17,794 |
| 7/31/2022 | $17,033 | $23,979 | $18,974 |
| 8/31/2022 | $16,697 | $23,084 | $18,409 |
| 9/30/2022 | $15,411 | $20,944 | $16,795 |
| 10/31/2022 | $17,325 | $22,661 | $18,517 |
| 11/30/2022 | $18,479 | $23,844 | $19,674 |
| 12/31/2022 | $17,834 | $22,448 | $18,881 |
| 1/31/2023 | $18,520 | $23,994 | $19,859 |
| 2/28/2023 | $17,834 | $23,433 | $19,159 |
| 3/31/2023 | $17,642 | $24,060 | $19,071 |
| 4/30/2023 | $18,185 | $24,316 | $19,358 |
| 5/31/2023 | $17,738 | $24,411 | $18,611 |
| 6/30/2023 | $18,951 | $26,078 | $19,848 |
| 7/31/2023 | $19,446 | $27,013 | $20,546 |
| 8/31/2023 | $19,031 | $26,491 | $19,991 |
| 9/30/2023 | $18,361 | $25,229 | $19,220 |
| 10/31/2023 | $18,025 | $24,560 | $18,541 |
| 11/30/2023 | $18,999 | $26,851 | $19,940 |
| 12/31/2023 | $20,258 | $28,275 | $21,045 |
| 1/31/2024 | $20,471 | $28,588 | $21,067 |
| 2/29/2024 | $21,128 | $30,136 | $21,844 |
| 3/31/2024 | $22,262 | $31,108 | $22,936 |
| 4/30/2024 | $21,473 | $29,739 | $21,956 |
| 5/31/2024 | $22,295 | $31,144 | $22,652 |
| 6/30/2024 | $22,278 | $32,108 | $22,439 |
| 7/31/2024 | $23,346 | $32,705 | $23,586 |
Special Large Cap Value Fund
Annual Shareholder Report | July 31, 2024
AVERAGE ANNUAL TOTAL RETURNS (%)
| 1 Year | 5 Years | 10 Years |
|---|
| Class A | 20.05 | 10.66 | 9.49 |
| Class A with Load | 13.15 | 9.36 | 8.85 |
Russell 3000® Index | 21.07 | 14.23 | 12.58 |
Russell 1000® Value Index | 14.80 | 9.92 | 8.96 |
| Total net assets | $1,329,436,518 |
| # of portfolio holdings | 47 |
| Portfolio turnover rate | 36% |
| Total advisory fees paid | $6,909,497 |
What did the Fund invest in?
(Based on long-term investments)
TOP TEN HOLDINGS (% OF NET ASSETS)
| Berkshire Hathaway, Inc. Class B | 4.0 |
| Alphabet, Inc. Class C | 3.6 |
| CBRE Group, Inc. Class A | 3.6 |
| Intercontinental Exchange, Inc. | 3.5 |
| Canadian Pacific Kansas City Ltd. | 3.5 |
| Citigroup, Inc. | 3.5 |
| AerCap Holdings NV | 3.4 |
| JPMorgan Chase & Co. | 3.2 |
| NextEra Energy, Inc. | 3.1 |
| General Motors Co. | 2.9 |
SECTOR ALLOCATION (% OF LONG-TERM INVESTMENTS)
| Financials | 23.4 |
| Industrials | 15.6 |
| Health care | 13.3 |
| Consumer staples | 8.6 |
| Information technology | 8.4 |
| Energy | 7.1 |
| Real estate | 6.4 |
| Consumer discretionary | 5.6 |
| Materials | 4.7 |
| Communication services | 3.7 |
| Utilities | 3.2 |
You can find additional information on the Fund's website at allspringglobal.com, including its:
- Prospectus - Financial Information - Fund holdings - Proxy voting information
Annual Shareholder Report
Special Large Cap Value Fund
This annual shareholder report contains important information about Special Large Cap Value Fund for the period of August 1, 2023 to July 31, 2024. You can find additional information about the Fund at allspringglobal.com. You can also request this information by contacting us at 1-800-222-8222.
What were the Fund costs for the past year?
The table explains the costs you would have paid within the reporting period based on a hypothetical $10,000 investment.
| CLASS NAME | COST OF A $10,000 INVESTMENT | COSTS PAID AS A % OF A $10,000 INVESTMENT |
|---|
| Administrator Class | $100 | 0.91% |
The manager has contractually committed to waive fees and/or reimburse certain expenses to the extent necessary to cap the Fund's total annual fund operating expense ratio at a specific amount. Without this cap, the costs shown above may have been higher. Please see the prospectus for the amount and the expiration date of the cap. Prior to or after the commitment expiration date, the cap may be increased or the commitment to maintain the cap may be terminated only with the approval of the Board of Trustees.
How did the Fund perform last year and what affected its performance?
The Fund made minor changes to sector positioning, with an increase in its weight in financials, specifically global systemically important banks, while reducing its weight in health care and communication services, as reward/risk ratios dictated. AerCap Holdings N.V. was the largest relative contributor and is the world’s largest aircraft and engine leasing business, with unrivaled advantages in customer relationships, purchasing power, and market information, which we believe should lead to outsized cash flow growth over time.
The largest detractor was Humana Inc., as management lowered guidance due to pricing set for 2024 not appearing to be sufficient to offset the margin pressure from higher costs across the industry. We believe Humana will be able start to recover this margin compression, just as it has managed successfully through prior periods, as the company maintains a strong underlying cash flow profile.
Total return based on a $10,000 investment
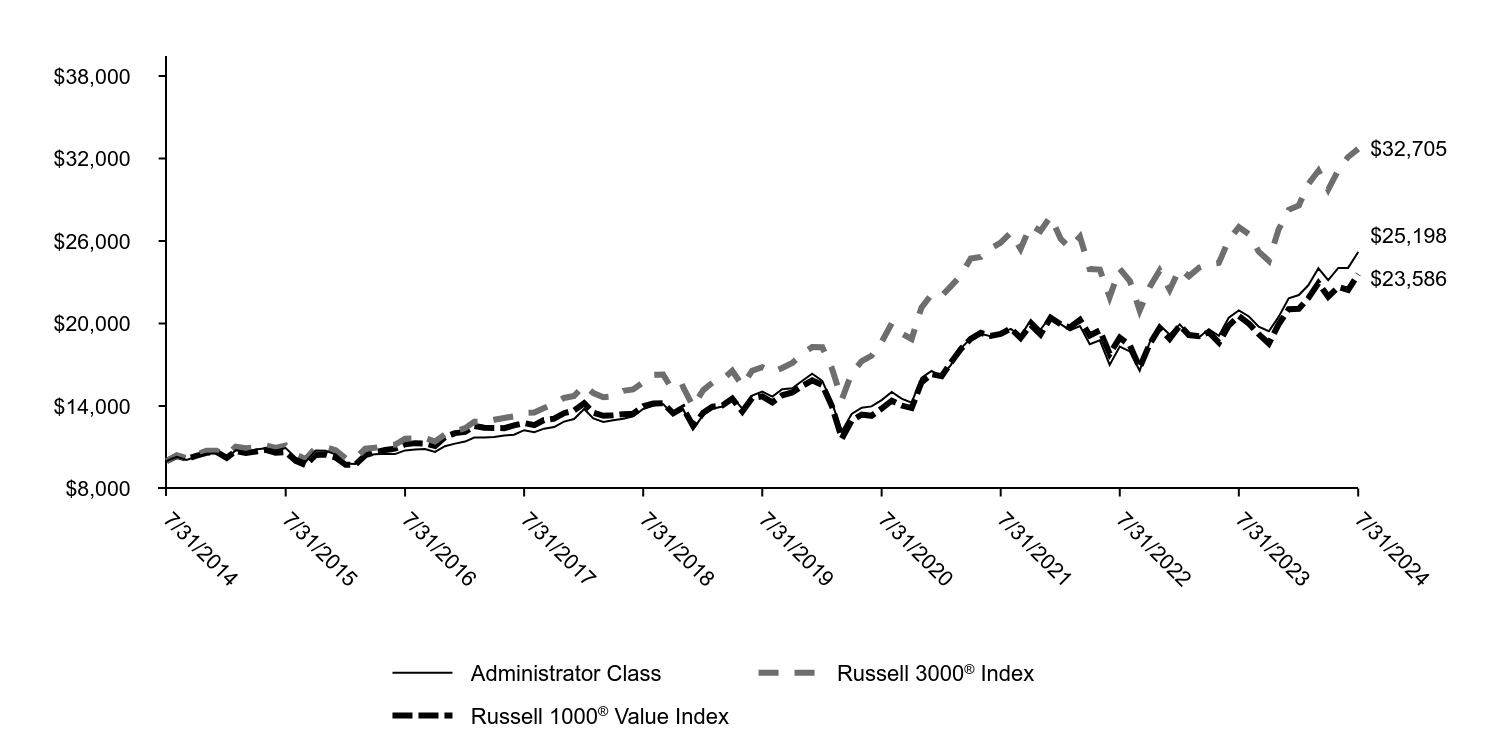
| Administrator Class | Russell 3000® Index | Russell 1000® Value Index |
|---|
| 7/31/2014 | $10,000 | $10,000 | $10,000 |
| 8/31/2014 | $10,305 | $10,420 | $10,368 |
| 9/30/2014 | $10,085 | $10,202 | $10,154 |
| 10/31/2014 | $10,327 | $10,483 | $10,382 |
| 11/30/2014 | $10,533 | $10,737 | $10,594 |
| 12/31/2014 | $10,550 | $10,737 | $10,659 |
| 1/31/2015 | $10,182 | $10,438 | $10,233 |
| 2/28/2015 | $10,788 | $11,043 | $10,728 |
| 3/31/2015 | $10,665 | $10,930 | $10,582 |
| 4/30/2015 | $10,842 | $10,980 | $10,681 |
| 5/31/2015 | $10,934 | $11,132 | $10,810 |
| 6/30/2015 | $10,773 | $10,945 | $10,594 |
| 7/31/2015 | $10,942 | $11,128 | $10,640 |
| 8/31/2015 | $10,243 | $10,457 | $10,007 |
| 9/30/2015 | $9,944 | $10,152 | $9,705 |
| 10/31/2015 | $10,765 | $10,954 | $10,437 |
| 11/30/2015 | $10,742 | $11,014 | $10,477 |
| 12/31/2015 | $10,485 | $10,788 | $10,251 |
| 1/31/2016 | $9,813 | $10,180 | $9,722 |
| 2/29/2016 | $9,779 | $10,176 | $9,719 |
| 3/31/2016 | $10,399 | $10,893 | $10,419 |
| 4/30/2016 | $10,485 | $10,960 | $10,638 |
| 5/31/2016 | $10,528 | $11,156 | $10,803 |
| 6/30/2016 | $10,502 | $11,179 | $10,897 |
| 7/31/2016 | $10,769 | $11,623 | $11,213 |
| 8/31/2016 | $10,838 | $11,653 | $11,300 |
| 9/30/2016 | $10,872 | $11,671 | $11,276 |
| 10/31/2016 | $10,657 | $11,419 | $11,102 |
| 11/30/2016 | $11,079 | $11,930 | $11,736 |
| 12/31/2016 | $11,264 | $12,162 | $12,029 |
| 1/31/2017 | $11,413 | $12,391 | $12,115 |
| 2/28/2017 | $11,701 | $12,852 | $12,550 |
| 3/31/2017 | $11,710 | $12,861 | $12,422 |
| 4/30/2017 | $11,747 | $12,997 | $12,399 |
| 5/31/2017 | $11,850 | $13,130 | $12,387 |
| 6/30/2017 | $11,915 | $13,249 | $12,589 |
| 7/31/2017 | $12,240 | $13,498 | $12,757 |
| 8/31/2017 | $12,101 | $13,524 | $12,608 |
| 9/30/2017 | $12,351 | $13,854 | $12,981 |
| 10/31/2017 | $12,472 | $14,157 | $13,076 |
| 11/30/2017 | $12,863 | $14,586 | $13,476 |
| 12/31/2017 | $13,050 | $14,732 | $13,673 |
| 1/31/2018 | $13,785 | $15,509 | $14,201 |
| 2/28/2018 | $13,100 | $14,937 | $13,523 |
| 3/31/2018 | $12,838 | $14,637 | $13,285 |
| 4/30/2018 | $12,959 | $14,693 | $13,329 |
| 5/31/2018 | $13,070 | $15,108 | $13,408 |
| 6/30/2018 | $13,241 | $15,207 | $13,442 |
| 7/31/2018 | $13,785 | $15,711 | $13,974 |
| 8/31/2018 | $14,037 | $16,263 | $14,180 |
| 9/30/2018 | $14,148 | $16,290 | $14,208 |
| 10/31/2018 | $13,382 | $15,090 | $13,472 |
| 11/30/2018 | $13,785 | $15,393 | $13,875 |
| 12/31/2018 | $12,329 | $13,960 | $12,542 |
| 1/31/2019 | $13,343 | $15,158 | $13,519 |
| 2/28/2019 | $13,801 | $15,691 | $13,951 |
| 3/31/2019 | $13,965 | $15,920 | $14,039 |
| 4/30/2019 | $14,641 | $16,556 | $14,537 |
| 5/31/2019 | $13,812 | $15,485 | $13,603 |
| 6/30/2019 | $14,750 | $16,572 | $14,579 |
| 7/31/2019 | $15,055 | $16,819 | $14,700 |
| 8/31/2019 | $14,684 | $16,476 | $14,268 |
| 9/30/2019 | $15,218 | $16,765 | $14,777 |
| 10/31/2019 | $15,295 | $17,126 | $14,983 |
| 11/30/2019 | $15,818 | $17,777 | $15,446 |
| 12/31/2019 | $16,344 | $18,290 | $15,871 |
| 1/31/2020 | $15,827 | $18,270 | $15,530 |
| 2/29/2020 | $14,286 | $16,774 | $14,026 |
| 3/31/2020 | $12,168 | $14,468 | $11,629 |
| 4/30/2020 | $13,420 | $16,384 | $12,936 |
| 5/31/2020 | $13,877 | $17,260 | $13,380 |
| 6/30/2020 | $13,973 | $17,655 | $13,291 |
| 7/31/2020 | $14,431 | $18,657 | $13,816 |
| 8/31/2020 | $15,020 | $20,009 | $14,387 |
| 9/30/2020 | $14,539 | $19,280 | $14,034 |
| 10/31/2020 | $14,238 | $18,864 | $13,850 |
| 11/30/2020 | $16,043 | $21,159 | $15,713 |
| 12/31/2020 | $16,545 | $22,111 | $16,315 |
| 1/31/2021 | $16,179 | $22,012 | $16,166 |
| 2/28/2021 | $16,972 | $22,700 | $17,143 |
| 3/31/2021 | $18,191 | $23,514 | $18,151 |
| 4/30/2021 | $18,898 | $24,726 | $18,877 |
| 5/31/2021 | $19,252 | $24,839 | $19,318 |
| 6/30/2021 | $19,081 | $25,452 | $19,097 |
| 7/31/2021 | $19,300 | $25,882 | $19,249 |
| 8/31/2021 | $19,605 | $26,620 | $19,631 |
| 9/30/2021 | $19,069 | $25,426 | $18,948 |
| 10/31/2021 | $20,264 | $27,145 | $19,910 |
| 11/30/2021 | $19,556 | $26,732 | $19,208 |
| 12/31/2021 | $20,510 | $27,785 | $20,420 |
| 1/31/2022 | $19,952 | $26,150 | $19,944 |
| 2/28/2022 | $19,497 | $25,491 | $19,713 |
| 3/31/2022 | $19,820 | $26,318 | $20,269 |
| 4/30/2022 | $18,497 | $23,956 | $19,126 |
| 5/31/2022 | $18,777 | $23,924 | $19,498 |
| 6/30/2022 | $16,984 | $21,923 | $17,794 |
| 7/31/2022 | $18,321 | $23,979 | $18,974 |
| 8/31/2022 | $17,969 | $23,084 | $18,409 |
| 9/30/2022 | $16,573 | $20,944 | $16,795 |
| 10/31/2022 | $18,644 | $22,661 | $18,517 |
| 11/30/2022 | $19,893 | $23,844 | $19,674 |
| 12/31/2022 | $19,201 | $22,448 | $18,881 |
| 1/31/2023 | $19,937 | $23,994 | $19,859 |
| 2/28/2023 | $19,201 | $23,433 | $19,159 |
| 3/31/2023 | $18,993 | $24,060 | $19,071 |
| 4/30/2023 | $19,585 | $24,316 | $19,358 |
| 5/31/2023 | $19,105 | $24,411 | $18,611 |
| 6/30/2023 | $20,417 | $26,078 | $19,848 |
| 7/31/2023 | $20,945 | $27,013 | $20,546 |
| 8/31/2023 | $20,513 | $26,491 | $19,991 |
| 9/30/2023 | $19,777 | $25,229 | $19,220 |
| 10/31/2023 | $19,441 | $24,560 | $18,541 |
| 11/30/2023 | $20,481 | $26,851 | $19,940 |
| 12/31/2023 | $21,838 | $28,275 | $21,045 |
| 1/31/2024 | $22,068 | $28,588 | $21,067 |
| 2/29/2024 | $22,777 | $30,136 | $21,844 |
| 3/31/2024 | $24,012 | $31,108 | $22,936 |
| 4/30/2024 | $23,155 | $29,739 | $21,956 |
| 5/31/2024 | $24,045 | $31,144 | $22,652 |
| 6/30/2024 | $24,045 | $32,108 | $22,439 |
| 7/31/2024 | $25,198 | $32,705 | $23,586 |
Special Large Cap Value Fund
Annual Shareholder Report | July 31, 2024
AVERAGE ANNUAL TOTAL RETURNS (%)
| 1 Year | 5 Years | 10 Years |
|---|
| Administrator Class | 20.31 | 10.85 | 9.68 |
Russell 3000® Index | 21.07 | 14.23 | 12.58 |
Russell 1000® Value Index | 14.80 | 9.92 | 8.96 |
| Total net assets | $1,329,436,518 |
| # of portfolio holdings | 47 |
| Portfolio turnover rate | 36% |
| Total advisory fees paid | $6,909,497 |
What did the Fund invest in?
(Based on long-term investments)
TOP TEN HOLDINGS (% OF NET ASSETS)
| Berkshire Hathaway, Inc. Class B | 4.0 |
| Alphabet, Inc. Class C | 3.6 |
| CBRE Group, Inc. Class A | 3.6 |
| Intercontinental Exchange, Inc. | 3.5 |
| Canadian Pacific Kansas City Ltd. | 3.5 |
| Citigroup, Inc. | 3.5 |
| AerCap Holdings NV | 3.4 |
| JPMorgan Chase & Co. | 3.2 |
| NextEra Energy, Inc. | 3.1 |
| General Motors Co. | 2.9 |
SECTOR ALLOCATION (% OF LONG-TERM INVESTMENTS)
| Financials | 23.4 |
| Industrials | 15.6 |
| Health care | 13.3 |
| Consumer staples | 8.6 |
| Information technology | 8.4 |
| Energy | 7.1 |
| Real estate | 6.4 |
| Consumer discretionary | 5.6 |
| Materials | 4.7 |
| Communication services | 3.7 |
| Utilities | 3.2 |
You can find additional information on the Fund's website at allspringglobal.com, including its:
- Prospectus - Financial Information - Fund holdings - Proxy voting information
ITEM 2. CODE OF ETHICS
(a) As of the end of the period covered by the report, Allspring Funds Trust has adopted a code of ethics that applies to its President and Treasurer. A copy of the code of ethics is filed as an exhibit to this Form N-CSR.
(c) During the period covered by this report, there were no amendments to the provisions of the code of ethics adopted in Item 2(a) above.
(d) During the period covered by this report, there were no implicit or explicit waivers to the provisions of the code of ethics adopted in Item 2(a) above.
ITEM 3. AUDIT COMMITTEE FINANCIAL EXPERT
The Board of Trustees of Allspring Funds Trust has determined that Isaiah Harris is an audit committee financial expert, as defined in Item 3 of Form N-CSR. Mr. Harris is independent for purposes of Item 3 of Form N-CSR.
ITEM 4. PRINCIPAL ACCOUNTANT FEES AND SERVICES
(a), (b), (c), (d) The following table presents aggregate fees billed in each of the last two fiscal years for services rendered to the registrant by the registrant’s principal accountant. These fees were billed to the registrant and were approved by the registrant’s audit committee.
| | | | | | | | |
| | | Fiscal year ended
July 31, 2024 | | | Fiscal year ended
July 31, 2023 | |
Audit fees | | $ | 320,270 | | | $ | 309,500 | |
Audit-related fees | | | — | | | | — | |
Tax fees (1) | | | 43,470 | | | | 42,210 | |
All other fees | | | — | | | | — | |
| | | | | | | | |
| | $ | 363,740 | | | $ | 351,710 | |
| (1) | Tax fees consist of fees for tax compliance, tax advice, tax planning and excise tax. |
(e)(1) The Chair of the Audit Committees is authorized to pre-approve: (1) audit services for the mutual funds of Allspring Funds Trust; (2) non-audit tax or compliance consulting or training services provided to the Funds by the independent auditors (“Auditors”) if the fees for any particular engagement are not anticipated to exceed $50,000; and (3) non-audit tax or compliance consulting or training services provided by the Auditors to a Fund’s investment adviser and its controlling entities (where pre-approval is required because the engagement relates directly to the operations and financial reporting of the Fund) if the fee to the Auditors for any particular engagement is not anticipated to exceed $50,000. For any such pre-approval sought from the Chair, Management shall prepare a brief description of the proposed services.
If the Chair approves of such service, he or she shall sign the statement prepared by Management. Such written statement shall be presented to the full Committees at their next regularly scheduled meetings.
(e)(2) Not applicable.
(f) Not applicable.
(g) Not applicable.
(h) Not applicable.
(i) Not applicable.
(j) Not applicable.
ITEM 5. AUDIT COMMITTEE OF LISTED REGISTRANTS
Not applicable.
ITEM 6. INVESTMENTS
(a) The registrant’s Schedule of Investments is included as part of the Financial Statements filed under Item 7(a) of this Form.
(b) Not Applicable due to no such divestments during the semi-annual period covered since the previous Form N-CSR filing.
ITEM 7. FINANCIAL STATEMENTS AND FINANCIAL HIGHLIGHTS FOR OPEN-END MANAGEMENT INVESTMENT COMPANIES
(a) The registrant’s Financial Statements are attached herewith.
(b) The registrant’s Financial Highlights are included as part of the Financial Statements filed under Item 7(a) of this Form.
Allspring Disciplined U.S. Core Fund
Long Form Financial Statements
Annual Report
Allspring Disciplined U.S. Core Fund | 1
Portfolio of investments—July 31, 2024
| | | | | |
| | | | | | |
Communication services: 9.35% | | | | | | |
Diversified telecommunication services: 0.68% | | | | | | |
| | | | | | |
| | | | | | |
| | | | | | |
| | | | | | |
| | | | | | |
Interactive media & services: 6.81% | | | | | | |
| | | | | | |
| | | | | | |
Meta Platforms, Inc. Class A | | | | | | |
| | | | | | |
| | | | | | |
| | | | | | |
Consumer discretionary: 9.55% | | | | | | |
| | | | | | |
| | | | | | |
| | | | | | |
| | | | | | |
| | | | | | |
| | | | | | |
| | | | | | |
| | | | | | |
Hotels, restaurants & leisure: 1.03% | | | | | | |
| | | | | | |
| | | | | | |
Royal Caribbean Cruises Ltd.† | | | | | | |
| | | | | | |
Household durables: 0.56% | | | | | | |
| | | | | | |
| | | | | | |
| | | | | | |
| | | | | | |
| | | | | | |
| | | | | | |
| | | | | | |
Textiles, apparel & luxury goods: 0.70% | | | | | | |
| | | | | | |
The accompanying notes are an integral part of these financial statements.
2 | Allspring Disciplined U.S. Core Fund
Portfolio of investments—July 31, 2024
| | | | | |
Textiles, apparel & luxury goods(continued) | | | | | | |
| | | | | | |
| | | | | | |
| | | | | | |
| | | | | | |
| | | | | | |
| | | | | | |
Consumer staples distribution & retail: 2.59% | | | | | | |
| | | | | | |
| | | | | | |
| | | | | | |
| | | | | | |
| | | | | | |
| | | | | | |
Archer-Daniels-Midland Co. | | | | | | |
| | | | | | |
| | | | | | |
Household products: 1.65% | | | | | | |
| | | | | | |
| | | | | | |
| | | | | | |
| | | | | | |
| | | | | | |
| | | | | | |
Philip Morris International, Inc. | | | | | | |
| | | | | | |
| | | | | | |
Energy equipment & services: 0.19% | | | | | | |
| | | | | | |
Oil, gas & consumable fuels: 3.40% | | | | | | |
| | | | | | |
| | | | | | |
| | | | | | |
| | | | | | |
| | | | | | |
| | | | | | |
| | | | | | |
| | | | | | |
| | | | | | |
| | | | | | |
| | | | | | |
The accompanying notes are an integral part of these financial statements.
Allspring Disciplined U.S. Core Fund | 3
Portfolio of investments—July 31, 2024
| | | | | |
| | | | | | |
| | | | | | |
| | | | | | |
| | | | | | |
| | | | | | |
Ameriprise Financial, Inc. | | | | | | |
Bank of New York Mellon Corp. | | | | | | |
| | | | | | |
Goldman Sachs Group, Inc. | | | | | | |
Interactive Brokers Group, Inc. Class A | | | | | | |
| | | | | | |
| | | | | | |
| | | | | | |
Capital One Financial Corp. | | | | | | |
| | | | | | |
Financial services: 4.62% | | | | | | |
Apollo Global Management, Inc. | | | | | | |
Berkshire Hathaway, Inc. Class B† | | | | | | |
| | | | | | |
| | | | | | |
| | | | | | |
| | | | | | |
| | | | | | |
| | | | | | |
| | | | | | |
| | | | | | |
| | | | | | |
Hartford Financial Services Group, Inc. | | | | | | |
| | | | | | |
| | | | | | |
Reinsurance Group of America, Inc. | | | | | | |
| | | | | | |
| | | | | | |
| | | | | | |
| | | | | | |
| | | | | | |
| | | | | | |
| | | | | | |
| | | | | | |
Regeneron Pharmaceuticals, Inc.† | | | | | | |
United Therapeutics Corp.† | | | | | | |
Vertex Pharmaceuticals, Inc.† | | | | | | |
| | | | | | |
The accompanying notes are an integral part of these financial statements.
4 | Allspring Disciplined U.S. Core Fund
Portfolio of investments—July 31, 2024
| | | | | |
Health care equipment & supplies: 2.12% | | | | | | |
| | | | | | |
| | | | | | |
Edwards Lifesciences Corp.† | | | | | | |
Intuitive Surgical, Inc.† | | | | | | |
| | | | | | |
Zimmer Biomet Holdings, Inc. | | | | | | |
| | | | | | |
Health care providers & services: 3.33% | | | | | | |
| | | | | | |
| | | | | | |
| | | | | | |
| | | | | | |
| | | | | | |
| | | | | | |
| | | | | | |
| | | | | | |
Life sciences tools & services: 0.51% | | | | | | |
Thermo Fisher Scientific, Inc. | | | | | | |
| | | | | | |
| | | | | | |
Jazz Pharmaceuticals PLC† | | | | | | |
| | | | | | |
| | | | | | |
| | | | | | |
| | | | | | |
| | | | | | |
| | | | | | |
Aerospace & defense: 1.84% | | | | | | |
| | | | | | |
| | | | | | |
| | | | | | |
| | | | | | |
| | | | | | |
| | | | | | |
Air freight & logistics: 0.25% | | | | | | |
| | | | | | |
| | | | | | |
| | | | | | |
Commercial services & supplies: 0.36% | | | | | | |
| | | | | | |
The accompanying notes are an integral part of these financial statements.
Allspring Disciplined U.S. Core Fund | 5
Portfolio of investments—July 31, 2024
| | | | | |
Construction & engineering: 0.86% | | | | | | |
| | | | | | |
| | | | | | |
| | | | | | |
Electrical equipment: 0.35% | | | | | | |
| | | | | | |
| | | | | | |
| | | | | | |
Industrial conglomerates: 0.56% | | | | | | |
Honeywell International, Inc. | | | | | | |
| | | | | | |
| | | | | | |
Allison Transmission Holdings, Inc. | | | | | | |
| | | | | | |
| | | | | | |
| | | | | | |
| | | | | | |
Passenger airlines: 0.37% | | | | | | |
United Airlines Holdings, Inc.† | | | | | | |
Professional services: 0.49% | | | | | | |
Automatic Data Processing, Inc. | | | | | | |
CACI International, Inc. Class A† | | | | | | |
| | | | | | |
Trading companies & distributors: 0.19% | | | | | | |
WESCO International, Inc. | | | | | | |
Information technology: 30.66% | | | | | | |
Communications equipment: 1.35% | | | | | | |
| | | | | | |
| | | | | | |
| | | | | | |
Electronic equipment, instruments & components: 0.65% | | | | | | |
| | | | | | |
| | | | | | |
| | | | | | |
| | | | | | |
| | | | | | |
| | | | | | |
| | | | | | |
Semiconductors & semiconductor equipment: 11.12% | | | | | | |
Advanced Micro Devices, Inc.† | | | | | | |
| | | | | | |
The accompanying notes are an integral part of these financial statements.
6 | Allspring Disciplined U.S. Core Fund
Portfolio of investments—July 31, 2024
| | | | | |
Semiconductors & semiconductor equipment(continued) | | | | | | |
| | | | | | |
| | | | | | |
| | | | | | |
| | | | | | |
| | | | | | |
| | | | | | |
| | | | | | |
| | | | | | |
| | | | | | |
| | | | | | |
Cadence Design Systems, Inc.† | | | | | | |
| | | | | | |
| | | | | | |
| | | | | | |
| | | | | | |
| | | | | | |
| | | | | | |
| | | | | | |
Technology hardware, storage & peripherals: 6.86% | | | | | | |
| | | | | | |
| | | | | | |
| | | | | | |
CF Industries Holdings, Inc. | | | | | | |
| | | | | | |
| | | | | | |
| | | | | | |
| | | | | | |
| | | | | | |
| | | | | | |
| | | | | | |
| | | | | | |
| | | | | | |
Hotel & resort REITs: 0.24% | | | | | | |
Host Hotels & Resorts, Inc. | | | | | | |
| | | | | | |
| | | | | | |
| | | | | | |
Simon Property Group, Inc. | | | | | | |
Specialized REITs : 1.27% | | | | | | |
Gaming & Leisure Properties, Inc. | | | | | | |
The accompanying notes are an integral part of these financial statements.
Allspring Disciplined U.S. Core Fund | 7
Portfolio of investments—July 31, 2024
| | | | | |
Specialized REITs (continued) | | | | | | |
| | | | | | |
| | | | | | |
| | | | | | |
| | | | | | |
Electric utilities: 1.77% | | | | | | |
American Electric Power Co., Inc. | | | | | | |
| | | | | | |
| | | | | | |
| | | | | | |
| | | | | | |
| | | | | | |
Public Service Enterprise Group, Inc. | | | | | | |
Total common stocks (Cost $521,682,193) | | | | | | |
| | | | | |
Short-term investments: 0.89% | | | | | | |
Investment companies: 0.89% | | | | | | |
Allspring Government Money Market Fund Select Class♠∞ | | | | | | |
Total short-term investments (Cost $9,805,163) | | | | | | |
Total investments in securities (Cost $531,487,356) | | | | | | |
Other assets and liabilities, net | | | | | | |
| | | | | | |
| Non-income-earning security |
| The issuer of the security is an affiliated person of the Fund as defined in the Investment Company Act of 1940. |
| The rate represents the 7-day annualized yield at period end. |
|
| Real estate investment trust |
Investments in affiliates
An affiliated investment is an investment in which the Fund owns at least 5% of the outstanding voting shares of the issuer or as a result of other relationships, such as the Fund and the issuer having the same investment manager. Transactions with issuers that were affiliates of the Fund at the end of the period were as follows:
| | | | | Net
change in
unrealized
gains
(losses) | | | Income
from
affiliated
securities |
| | | | | | | | |
Allspring Government Money Market Fund Select Class | | | | | | | | |
The accompanying notes are an integral part of these financial statements.
8 | Allspring Disciplined U.S. Core Fund
Portfolio of investments—July 31, 2024
The accompanying notes are an integral part of these financial statements.
Allspring Disciplined U.S. Core Fund | 9
Statement of assets and liabilities—July 31, 2024
Financial statements
Statement of assets and liabilities
| |
Investments in unaffiliated securities, at value (cost $521,682,193) | |
Investments in affiliated securities, at value (cost $9,805,163) | |
Cash at broker segregated for futures contracts | |
Receivable for Fund shares sold | |
| |
Receivable for daily variation margin on open futures contracts | |
Prepaid expenses and other assets | |
| |
| |
Payable for Fund shares redeemed | |
| |
Administration fees payable | |
Shareholder servicing fees payable | |
Distribution fees payable | |
Accrued expenses and other liabilities | |
| |
| |
| |
| |
Total distributable earnings | |
| |
Computation of net asset value and offering price per share | |
| |
Shares outstanding–Class A1 | |
Net asset value per share–Class A | |
Maximum offering price per share – Class A2 | |
| |
Shares outstanding–Class C1 | |
Net asset value per share–Class C | |
| |
Shares outstanding–Class R61 | |
Net asset value per share–Class R6 | |
Net assets–Administrator Class | |
Shares outstanding–Administrator Class1 | |
Net asset value per share–Administrator Class | |
Net assets–Institutional Class | |
Shares outstanding–Institutional Class1 | |
Net asset value per share–Institutional Class | |
1 The Fund has an unlimited number of authorized shares.
2 Maximum offering price is computed as 100/94.25 of net asset value. On investments of $50,000 or more, the offering price is reduced.
The accompanying notes are an integral part of these financial statements.
10 | Allspring Disciplined U.S. Core Fund
Statement of operations—year ended July 31, 2024
Statement of operations
| |
| |
Income from affiliated securities | |
| |
| |
| |
| |
| |
| |
| |
| |
| |
| |
Shareholder servicing fees | |
| |
| |
| |
| |
| |
Custody and accounting fees | |
| |
| |
Shareholder report expenses | |
Trustees’ fees and expenses | |
| |
| |
Less: Fee waivers and/or expense reimbursements | |
| |
| |
| |
| |
| |
| |
Realized and unrealized gains (losses) on investments | |
| |
| |
| |
Net realized gains on investments | |
Net change in unrealized gains (losses) on | |
| |
| |
Net change in unrealized gains (losses) on investments | |
Net realized and unrealized gains (losses) on investments | |
Net increase in net assets resulting from operations | |
The accompanying notes are an integral part of these financial statements.
Allspring Disciplined U.S. Core Fund | 11
Statement of changes in net assets
Statement of changes in net assets
| | |
| | | | |
| | | | |
Net realized gains on investments | | | | |
Net change in unrealized gains (losses) on investments | | | | |
Net increase in net assets resulting from operations | | | | |
Distributions to shareholders from | | | | |
Net investment income and net realized gains | | | | |
| | | | |
| | | | |
| | | | |
| | | | |
| | | | |
| | | | |
Total distributions to shareholders | | | | |
Capital share transactions | | | | |
Proceeds from shares sold | | | | |
| | | | |
| | | | |
| | | | |
| | | | |
| | | | |
| | | | |
| | | | |
Reinvestment of distributions | | | | |
| | | | |
| | | | |
| | | | |
| | | | |
| | | | |
| | | | |
| | | | |
Payment for shares redeemed | | | | |
| | | | |
| | | | |
| | | | |
| | | | |
| | | | |
| | | | |
| | | | |
1 For the period from August 1, 2022 to June 16, 2023. Effective at the close of business on June 16, 2023, Class R shares were converted to Class A shares and are no longer offered by the Fund.
The accompanying notes are an integral part of these financial statements.
12 | Allspring Disciplined U.S. Core Fund
Statement of changes in net assets
Statement of changes in net assets
| | |
| | | | |
| | | | |
| | | | |
| | | | |
| | | | |
Net increase (decrease) in net assets resulting from capital share transactions | | | | |
Total increase (decrease) in net assets | | | | |
| | | | |
| | | | |
| | | | |
2 Effective at the close of business on June 16, 2023, Class R shares were converted to Class A shares and are no longer offered by the Fund.
The accompanying notes are an integral part of these financial statements.
Allspring Disciplined U.S. Core Fund | 13
Financial highlights
(For a share outstanding throughout each period)
| |
| | | | | |
Net asset value, beginning of period | | | | | |
| | | | | |
Net realized and unrealized gains (losses) on investments | | | | | |
Total from investment operations | | | | | |
Distributions to shareholders from | | | | | |
| | | | | |
| | | | | |
Total distributions to shareholders | | | | | |
Net asset value, end of period | | | | | |
| | | | | |
Ratios to average net assets (annualized) | | | | | |
| | | | | |
| | | | | |
| | | | | |
| | | | | |
| | | | | |
Net assets, end of period (000s omitted) | | | | | |
| Calculated based upon average shares outstanding |
| Total return calculations do not include any sales charges. Returns include adjustments required by U.S. GAAP and may differ from net asset values and performance reported elsewhere. |
The accompanying notes are an integral part of these financial statements.
14 | Allspring Disciplined U.S. Core Fund
(For a share outstanding throughout each period)
| |
| | | | | |
Net asset value, beginning of period | | | | | |
Net investment income (loss) | | | | | |
Net realized and unrealized gains (losses) on investments | | | | | |
Total from investment operations | | | | | |
Distributions to shareholders from | | | | | |
| | | | | |
| | | | | |
Total distributions to shareholders | | | | | |
Net asset value, end of period | | | | | |
| | | | | |
Ratios to average net assets (annualized) | | | | | |
| | | | | |
| | | | | |
Net investment income (loss) | | | | | |
| | | | | |
| | | | | |
Net assets, end of period (000s omitted) | | | | | |
| Calculated based upon average shares outstanding |
| Amount is more than $(0.005). |
| Total return calculations do not include any sales charges. Returns include adjustments required by U.S. GAAP and may differ from net asset values and performance reported elsewhere. |
The accompanying notes are an integral part of these financial statements.
Allspring Disciplined U.S. Core Fund | 15
(For a share outstanding throughout each period)
| |
| | | | | |
Net asset value, beginning of period | | | | | |
| | | | | |
Net realized and unrealized gains (losses) on investments | | | | | |
Total from investment operations | | | | | |
Distributions to shareholders from | | | | | |
| | | | | |
| | | | | |
Total distributions to shareholders | | | | | |
Net asset value, end of period | | | | | |
| | | | | |
Ratios to average net assets (annualized) | | | | | |
| | | | | |
| | | | | |
| | | | | |
| | | | | |
| | | | | |
Net assets, end of period (000s omitted) | | | | | |
| Calculated based upon average shares outstanding |
| Returns include adjustments required by U.S. GAAP and may differ from net asset values and performance reported elsewhere. |
The accompanying notes are an integral part of these financial statements.
16 | Allspring Disciplined U.S. Core Fund
(For a share outstanding throughout each period)
| |
| | | | | |
Net asset value, beginning of period | | | | | |
| | | | | |
Net realized and unrealized gains (losses) on investments | | | | | |
Total from investment operations | | | | | |
Distributions to shareholders from | | | | | |
| | | | | |
| | | | | |
Total distributions to shareholders | | | | | |
Net asset value, end of period | | | | | |
| | | | | |
Ratios to average net assets (annualized) | | | | | |
| | | | | |
| | | | | |
| | | | | |
| | | | | |
| | | | | |
Net assets, end of period (000s omitted) | | | | | |
| Calculated based upon average shares outstanding |
| Returns include adjustments required by U.S. GAAP and may differ from net asset values and performance reported elsewhere. |
The accompanying notes are an integral part of these financial statements.
Allspring Disciplined U.S. Core Fund | 17
(For a share outstanding throughout each period)
| |
| | | | | |
Net asset value, beginning of period | | | | | |
| | | | | |
Net realized and unrealized gains (losses) on investments | | | | | |
Total from investment operations | | | | | |
Distributions to shareholders from | | | | | |
| | | | | |
| | | | | |
Total distributions to shareholders | | | | | |
Net asset value, end of period | | | | | |
| | | | | |
Ratios to average net assets (annualized) | | | | | |
| | | | | |
| | | | | |
| | | | | |
| | | | | |
| | | | | |
Net assets, end of period (000s omitted) | | | | | |
| Calculated based upon average shares outstanding |
| Returns include adjustments required by U.S. GAAP and may differ from net asset values and performance reported elsewhere. |
The accompanying notes are an integral part of these financial statements.
18 | Allspring Disciplined U.S. Core Fund
Notes to financial statements
Notes to financial statements
Allspring Funds Trust (the “Trust”), a Delaware statutory trust organized on March 10, 1999, is an open-end management investment company registered under the Investment Company Act of 1940, as amended (the “1940 Act”). As an investment company, the Trust follows the accounting and reporting guidance in Financial Accounting Standards Board (“FASB”) Accounting Standards Codification Topic 946, Financial Services – Investment Companies. These financial statements report on the Allspring Disciplined U.S. Core Fund (the “Fund”) which is a diversified series of the Trust.
Effective at the close of business on June 16, 2023, Class R shares became Class A shares in a tax-free conversion. Shareholders of Class R received Class A shares at a value equal to the value of their Class R shares immediately prior to the conversion. Class R shares are no longer offered by the Fund.
2.
SIGNIFICANT ACCOUNTING POLICIES
The following significant accounting policies, which are consistently followed in the preparation of the financial statements of the Fund, are in conformity with U.S. generally accepted accounting principles (“GAAP”) which require management to make estimates and assumptions that affect the reported amounts of assets and liabilities, disclosure of contingent assets and liabilities at the date of the financial statements, and the reported amounts of income and expenses during the reporting period. Actual results could differ from those estimates.
All investments are valued each business day as of the close of regular trading on the New York Stock Exchange (generally 4 p.m. Eastern Time), although the Fund may deviate from this calculation time under unusual or unexpected circumstances.
Equity securities, exchange-traded funds and futures contracts that are listed on a foreign or domestic exchange or market are valued at the official closing price or, if none, the last sales price.
Investments in registered open-end investment companies (other than those listed on a foreign or domestic exchange or market) are valued at net asset value.
Investments which are not valued using the methods discussed above are valued at their fair value, as determined in good faith by Allspring Funds Management, LLC (“Allspring Funds Management”), which was named the valuation designee by the Board of Trustees. As the valuation designee, Allspring Funds Management is responsible for day-to-day valuation activities for the Allspring Funds. In connection with these responsibilities, Allspring Funds Management has established a Valuation Committee and has delegated to it the authority to take any actions regarding the valuation of portfolio securities that the Valuation Committee deems necessary or appropriate, including determining the fair value of portfolio securities. On a quarterly basis, the Board of Trustees receives reports of valuation actions taken by the Valuation Committee. On at least an annual basis, the Board of Trustees receives an assessment of the adequacy and effectiveness of Allspring Funds Management’s process for determining the fair value of the portfolio of investments.
Futures contracts are agreements between the Fund and a counterparty to buy or sell a specific amount of a commodity, financial instrument or currency at a specified price and on a specified date. The Fund may buy and sell futures contracts in order to gain exposure to, or protect against, changes in security values and is subject to equity price risk. The primary risks associated with the use of futures contracts are the imperfect correlation between changes in market values of securities held by the Fund and the prices of futures contracts, and the possibility of an illiquid market. Futures contracts are generally entered into on a regulated futures exchange and cleared through a clearinghouse associated with the exchange. With futures contracts, there is minimal counterparty risk to the Fund since futures contracts are exchange-traded and the exchange’s clearinghouse, as the counterparty to all exchange-traded futures, guarantees the futures contracts against default.
Upon entering into a futures contract, the Fund is required to deposit either cash or securities (initial margin) with the broker in an amount equal to a certain percentage of the contract value. Subsequent payments (variation margin) are paid to or received from the broker each day equal to the daily changes in the contract value. Such payments are recorded as unrealized gains or losses and, if any, shown as variation margin receivable (payable) in the Statement of Assets and Liabilities. Should the Fund fail to make requested variation margin payments, the broker can gain access to the initial margin to satisfy the Fund’s payment obligations. When the contracts are closed, a realized gain or loss is recorded in the Statement of Operations.
Security transactions and income recognition
Securities transactions are recorded on a trade date basis. Realized gains or losses are recorded on the basis of identified cost.
Dividend income is recognized on the ex-dividend date.
Interest earned on cash balances held at the custodian is recorded as interest income.
Distributions received from REIT investments may be characterized as ordinary income, capital gains, or a return of capital to the Fund based on information provided by the REIT. The proper characterization of REIT distributions is generally not known until after the end of each calendar year. As such, estimates may be used in reporting the character of income and distributions for financial statement purposes.
Allspring Disciplined U.S. Core Fund | 19
Notes to financial statements
Distributions to shareholders
Distributions to shareholders from net investment income and any net realized gains are recorded on the ex-dividend date and paid at least annually. Such distributions are determined in accordance with income tax regulations and may differ from U.S. GAAP. Dividend sources are estimated at the time of declaration. The tax character of distributions is determined as of the Fund’s fiscal year end. Therefore, a portion of the Fund’s distributions made prior to the Fund’s fiscal year end may be categorized as a tax return of capital at year end.
The Fund intends to continue to qualify as a regulated investment company by distributing substantially all of its investment company taxable income and any net realized capital gains (after reduction for capital loss carryforwards) sufficient to relieve it from all, or substantially all, federal income taxes. Accordingly, no provision for federal income taxes was required.
The Fund’s income and federal excise tax returns and all financial records supporting those returns for the prior three fiscal years are subject to examination by the federal and Delaware revenue authorities. Management has analyzed the Fund’s tax positions taken on federal, state, and foreign tax returns, as applicable, for all open tax years and does not believe that there are any uncertain tax positions that require recognition of a tax liability.
As of July 31, 2024, the aggregate cost of all investments for federal income tax purposes was $532,517,135 and the unrealized gains (losses) consisted of:
The separate classes of shares offered by the Fund differ principally in applicable sales charges, distribution, shareholder servicing, and administration fees. Class specific expenses are charged directly to that share class. Investment income, common fund-level expenses, and realized and unrealized gains (losses) on investments are allocated daily to each class of shares based on the relative proportion of net assets of each class.
3.
FAIR VALUATION MEASUREMENTS
Fair value measurements of investments are determined within a framework that has established a fair value hierarchy based upon the various data inputs utilized in determining the value of the Fund’s investments. The three-level hierarchy gives the highest priority to unadjusted quoted prices in active markets for identical assets or liabilities (Level 1) and the lowest priority to unobservable inputs (Level 3). The Fund’s investments are classified within the fair value hierarchy based on the lowest level of input that is significant to the fair value measurement. The inputs are summarized into three broad levels as follows:
•Level 1—quoted prices in active markets for identical securities
•Level 2—other significant observable inputs (including quoted prices for similar securities, interest rates, prepayment speeds, credit risk, etc.)
•Level 3—significant unobservable inputs (including the Fund’s own assumptions in determining the fair value of investments)
The inputs or methodologies used for valuing investments in securities are not necessarily an indication of the risk associated with investing in those securities.
20 | Allspring Disciplined U.S. Core Fund
Notes to financial statements
The following is a summary of the inputs used in valuing the Fund’s assets and liabilities as of July 31, 2024:
| | Other significant
observable inputs
(Level 2) | Significant
unobservable inputs
(Level 3) | |
| | | | |
| | | | |
| | | | |
| | | | |
| | | | |
| | | | |
| | | | |
| | | | |
| | | | |
| | | | |
| | | | |
| | | | |
| | | | |
| | | | |
| | | | |
| | | | |
| | | | |
|
| | | | |
| | | | |
Futures contracts are reported at their cumulative unrealized gains (losses) at measurement date as reported in the table following the Portfolio of Investments. For futures contracts, the current day’s variation margin is reported on the Statement of Assets and Liabilities. All other assets and liabilities are reported at their market value at measurement date.
Additional sector, industry or geographic detail, if any, is included in the Portfolio of Investments.
At July 31, 2024, the Fund did not have any transfers into/out of Level 3.
4.
TRANSACTIONS WITH AFFILIATES
Allspring Funds Management, a wholly owned subsidiary of Allspring Global Investments Holdings, LLC, a holding company indirectly owned by certain private funds of GTCR LLC and Reverence Capital Partners, L.P., is the manager of the Fund and provides advisory and fund-level administrative services under an investment management agreement. Under the investment management agreement, Allspring Funds Management is responsible for, among other services, implementing the investment objectives and strategies of the Fund, supervising the subadviser and providing fund-level administrative services in connection with the Fund’s operations. As compensation for its services under the investment management agreement, Allspring Funds Management is entitled to receive a management fee at the following annual rate based on the Fund’s average daily net assets:
For the year ended July 31, 2024, the management fee was equivalent to an annual rate of 0.35% of the Fund’s average daily net assets.
Allspring Funds Management has retained the services of a subadviser to provide daily portfolio management to the Fund. The fee for subadvisory services is borne by Allspring Funds Management. Allspring Global Investments, LLC, an affiliate of Allspring Funds Management and a wholly owned subsidiary of Allspring Global Investments Holdings, LLC, is the subadviser to the Fund and is entitled to receive a fee from Allspring Funds Management at an annual rate starting at 0.25% and declining to 0.15% as the average daily net assets of the Fund increase.
Under a class-level administration agreement, Allspring Funds Management provides class-level administrative services to the Fund, which includes paying fees and expenses for services provided by the transfer agent, sub-transfer agents, omnibus account servicers and record-keepers. As
Allspring Disciplined U.S. Core Fund | 21
Notes to financial statements
compensation for its services under the class-level administration agreement, Allspring Funds Management receives an annual fee which is calculated based on the average daily net assets of each class as follows:
| Class-level
administration fee |
| |
| |
| |
| |
| |
Waivers and/or expense reimbursements
Allspring Funds Management has contractually committed to waive and/or reimburse management and administration fees to the extent necessary to maintain certain net operating expense ratios for the Fund. When each class of the Fund has exceeded its expense cap, Allspring Funds Management will waive fees and/or reimburse expenses from fund-level expenses on a proportionate basis and then from class specific expenses. When only certain classes exceed their expense caps, waivers and/or reimbursements are applied against class specific expenses before fund-level expenses. Allspring Funds Management has contractually committed through November 30, 2024 to waive fees and/or reimburse expenses to the extent necessary to cap the Fund’s expenses. Prior to or after the commitment expiration date, the cap may be increased or the commitment to maintain the cap may be terminated only with the approval of the Board of Trustees. As of July 31, 2024, the contractual caps are as follows:
The Trust has adopted a distribution plan for Class C shares pursuant to Rule 12b-1 under the 1940 Act. Distribution fees are charged to Class C shares and paid to Allspring Funds Distributor, LLC (“Allspring Funds Distributor”), the principal underwriter, an affiliate of Allspring Funds Management, at an annual rate up to 0.75% of the average daily net assets of Class C shares.
In addition, Allspring Funds Distributor is entitled to receive the front-end sales charge from the purchase of Class A shares and a contingent deferred sales charge on the redemption of certain Class A shares. Allspring Funds Distributor is also entitled to receive the contingent deferred sales charges from redemptions of Class C shares. For the year ended July 31, 2024, Allspring Funds Distributor received $18,261 from the sale of Class A shares and $9 in contingent deferred sales charges from redemptions of Class A shares. No contingent deferred sales charges were incurred by Class C shares for the year ended July 31, 2024.
Shareholder servicing fees
The Trust has entered into contracts with one or more shareholder servicing agents, whereby Class A, Class C and Administrator Class are charged a fee at an annual rate up to 0.25% of the average daily net assets of each respective class. A portion of these total shareholder servicing fees were paid to affiliates of the Fund.
The Fund may purchase or sell portfolio investment securities to certain affiliates pursuant to Rule 17a-7 under the 1940 Act and under procedures adopted by the Board of Trustees. The procedures have been designed to ensure that these interfund transactions, which do not incur broker commissions, are effected at current market prices. Pursuant to these procedures, the Fund did not have any interfund transactions during the year ended July 31, 2024.
5.
INVESTMENT PORTFOLIO TRANSACTIONS
Purchases and sales of investments, excluding U.S. government obligations (if any) and short-term securities, for the year ended July 31, 2024 were $353,018,290 and $384,803,691, respectively.
6.
DERIVATIVE TRANSACTIONS
During the year ended July 31, 2024, the Fund entered into futures contracts to gain market exposure. The Fund had an average notional amount of $15,228,016 in long futures contracts during the year ended July 31, 2024.
22 | Allspring Disciplined U.S. Core Fund
Notes to financial statements
The fair value, realized gains or losses and change in unrealized gains or losses, if any, on derivative instruments are reflected in the corresponding financial statement captions.
The Trust (excluding the money market funds), Allspring Master Trust and Allspring Variable Trust are parties to a $275,000,000 (prior to July 9, 2024: $350,000,000), revolving credit agreement whereby the Fund is permitted to use bank borrowings for temporary or emergency purposes, such as to fund shareholder redemption requests. Interest under the credit agreement is charged to the Fund based on a borrowing rate equal to the higher of the Federal Funds rate or the overnight bank funding rate in effect on that day plus a spread. In addition, an annual commitment fee based on the unused balance is allocated to each participating fund.
For the year ended July 31, 2024, there were no borrowings by the Fund under the agreement.
8.
DISTRIBUTIONS TO SHAREHOLDERS
The tax character of distributions paid were as follows:
As of July 31, 2024, the components of distributable earnings on a tax basis were as follows:
Undistributed
ordinary
income | Undistributed
long-term
gain | |
| | |
As of the end of the period, the Fund concentrated its portfolio of investments in the information technology sector. A fund that invests a substantial portion of its assets in any sector may be more affected by changes in that sector than would be a fund whose investments are not heavily weighted in any sector.
Under the Fund’s organizational documents, the officers and Trustees have been granted certain indemnification rights against certain liabilities that may arise out of performance of their duties to the Fund. The Fund has entered into a separate agreement with each Trustee that converts indemnification rights currently existing under the Fund’s organizational documents into contractual rights that cannot be changed in the future without the consent of the Trustee. Additionally, in the normal course of business, the Fund may enter into contracts with service providers that contain a variety of indemnification clauses. The Fund’s maximum exposure under these arrangements is dependent on future claims that may be made against the Fund and, therefore, cannot be estimated.
Allspring Disciplined U.S. Core Fund | 23
Report of independent registered public accounting firm
To the Shareholders of the Fund and Board of Trustees
Allspring Funds Trust:
Opinion on the Financial Statements
We have audited the accompanying statement of assets and liabilities of Allspring Disciplined U.S. Core Fund (the Fund), one of the funds constituting Allspring Funds Trust, including the portfolio of investments, as of July 31, 2024, the related statement of operations for the year then ended, the statements of changes in net assets for each of the years in the two-year period then ended, and the related notes (collectively, the financial statements) and the financial highlights for each of the years in the five-year period then ended. In our opinion, the financial statements and financial highlights present fairly, in all material respects, the financial position of the Fund as of July 31, 2024, the results of its operations for the year then ended, the changes in its net assets for each of the years in the two-year period then ended, and the financial highlights for each of the years in the five-year period then ended, in conformity with U.S. generally accepted accounting principles.
These financial statements and financial highlights are the responsibility of the Fund’s management. Our responsibility is to express an opinion on these financial statements and financial highlights based on our audits. We are a public accounting firm registered with the Public Company Accounting Oversight Board (United States) (PCAOB) and are required to be independent with respect to the Fund in accordance with the U.S. federal securities laws and the applicable rules and regulations of the Securities and Exchange Commission and the PCAOB.
We conducted our audits in accordance with the standards of the PCAOB. Those standards require that we plan and perform the audit to obtain reasonable assurance about whether the financial statements and financial highlights are free of material misstatement, whether due to error or fraud. Our audits included performing procedures to assess the risks of material misstatement of the financial statements and financial highlights, whether due to error or fraud, and performing procedures that respond to those risks. Such procedures included examining, on a test basis, evidence regarding the amounts and disclosures in the financial statements and financial highlights. Such procedures also included confirmation of securities owned as of July 31, 2024, by correspondence with the custodian, transfer agent and brokers. Our audits also included evaluating the accounting principles used and significant estimates made by management, as well as evaluating the overall presentation of the financial statements and financial highlights. We believe that our audits provide a reasonable basis for our opinion.

We have not been able to determine the specific year that we began serving as the auditor of one or more Allspring Funds investment companies; however, we are aware that we have served as the auditor of one or more Allspring Funds investment companies since at least 1955.
September 25, 2024
24 | Allspring Disciplined U.S. Core Fund
Other information (unaudited)
Other information
For corporate shareholders, pursuant to Section 854 of the Internal Revenue Code, 100% of ordinary income dividends qualify for the corporate dividends-received deduction for the fiscal year ended July 31, 2024.
Pursuant to Section 852 of the Internal Revenue Code, $73,261,827 was designated as a 20% rate gain distribution for the fiscal year ended
July 31, 2024.
Pursuant to Section 854 of the Internal Revenue Code, $8,684,974 of income dividends paid during the fiscal year ended July 31, 2024 has been designated as qualified dividend income (QDI).
For the fiscal year ended July 31, 2024, $369,119 has been designated as interest-related dividends for nonresident alien shareholders pursuant to Section 871 of the Internal Revenue Code.
A description of the policies and procedures used to determine how to vote proxies relating to portfolio securities is available without charge, upon request, by calling 1-866-259-3305, visiting our website at allspringglobal.com, or visiting the SEC website at sec.gov. Information regarding how the proxies related to portfolio securities were voted during the most recent 12-month period ended June 30 is available on the website at allspringglobal.com or by visiting the SEC website at sec.gov.
Quarterly portfolio holdings information
The Fund files its complete schedule of portfolio holdings with the SEC for the first and third quarters of each fiscal year as an exhibit to its reports on Form N-PORT. Shareholders may view the filed Form N-PORT by visiting the SEC website at sec.gov.
Allspring Disciplined U.S. Core Fund | 25
Other information (unaudited)
Item 8. Changes in and disagreements with accountants
Item 9. Matters submitted to fund shareholders for a vote
Item 10. Remuneration paid to directors, officers and others
Refer to information in the Statement of operations.
26 | Allspring Disciplined U.S. Core Fund
Other information (unaudited)
Item 11. Statement regarding basis for the board’s approval of investment advisory contract
Board consideration of investment management and sub-advisory agreements:
Under the Investment Company Act of 1940 (the “1940 Act”), the Board of Trustees (the “Board”) of Allspring Funds Trust (the “Trust”) must determine annually whether to approve the continuation of the Trust’s investment management and sub-advisory agreements. In this regard, at a Board meeting held on May 28-30, 2024 (the “Meeting”), the Board, all the members of which have no direct or indirect interest in the investment management and sub-advisory agreements and are not “interested persons” of the Trust, as defined in the 1940 Act (the “Independent Trustees”), reviewed and approved for the Allspring Disciplined U.S. Core Fund (the “Fund”): (i) an investment management agreement (the “Management Agreement”) with Allspring Funds Management, LLC (“Allspring Funds Management”); and (ii) an investment sub-advisory agreement (the “Sub-Advisory Agreement”) with Allspring Global Investments, LLC (the “Sub-Adviser”), an affiliate of Allspring Funds Management. The Management Agreement and the Sub-Advisory Agreement are collectively referred to as the “Advisory Agreements.”
At the Meeting, the Board considered the factors and reached the conclusions described below relating to the selection of Allspring Funds Management and the Sub-Adviser and the approval of the Advisory Agreements. Prior to the Meeting, including at a meeting of the Board held in April 2024, and at the Meeting, the Trustees conferred extensively among themselves and with representatives of Allspring Funds Management about these matters. The Board has adopted a team-based approach, with each team consisting of a sub-set of Trustees, to assist the full Board in the discharge of its duties in reviewing investment performance and other matters throughout the year. The Independent Trustees were assisted in their evaluation of the Advisory Agreements by independent legal counsel, from whom they received separate legal advice and with whom they met separately.
In providing information to the Board, Allspring Funds Management and the Sub-Adviser were guided by a detailed set of requests for information submitted to them by independent legal counsel on behalf of the Independent Trustees at the start of the Board’s annual contract renewal process earlier in 2024. In considering and approving the Advisory Agreements, the Trustees considered the information they believed relevant, including but not limited to the information discussed below. The Board considered not only the specific information presented in connection with the Meeting, but also the knowledge gained over time through interactions with Allspring Funds Management and the Sub-Adviser about various topics. In this regard, the Board reviewed reports of Allspring Funds Management at each of its quarterly meetings, which included, among other things, portfolio reviews and investment performance reports. In addition, the Board and the teams mentioned above confer with portfolio managers at various times throughout the year. The Board did not identify any particular information or consideration that was all-important or controlling, and each individual Trustee may have attributed different weights to various factors.
After its deliberations, the Board unanimously determined that the compensation payable to Allspring Funds Management and the Sub-Adviser under each of the Advisory Agreements was reasonable, and approved the continuation of the Advisory Agreements for a one-year term. The Board considered the approval of the Advisory Agreements for the Fund as part of its consideration of agreements for funds across the complex, but its approvals were made on a fund-by-fund basis. The following summarizes a number of important, but not necessarily all, factors considered by the Board in support of its approvals.
Nature, extent, and quality of services
The Board received and considered various information regarding the nature, extent, and quality of services provided to the Fund by Allspring Funds Management and the Sub-Adviser under the Advisory Agreements. This information included a description of the investment advisory services and Fund-level administrative services covered by the Management Agreement, as well as, among other things, a summary of the background and experience of senior management of Allspring Global Investments, of which Allspring Funds Management and the Sub-Adviser are a part, and a summary of investments made in the Allspring Global Investments business.* The Board also received information about the services that continue to be provided by Wells Fargo & Co. and/or its affiliates (“Wells Fargo”) since the sale of Wells Fargo Asset Management to Allspring Global Investments Holdings, LLC, a holding company indirectly owned by certain private funds of GTCR LLC and Reverence Capital Partners, L.P., under a transition services agreement and an update on the anticipated timeline for exiting the transition services agreement. In addition, the Board received and considered information about the full range of services provided to the Fund by Allspring Funds Management and its affiliates.
The Board considered the qualifications, background, tenure, and responsibilities of each of the portfolio managers primarily responsible for the day-to-day portfolio management of the Fund. The Board evaluated the ability of Allspring Funds Management and the Sub-Adviser to attract and retain qualified investment professionals, including research, advisory, and supervisory personnel.
The Board further considered the compliance programs and compliance records of Allspring Funds Management and the Sub-Adviser. The Board received and considered information about Allspring Global Investments’ risk management functions, which included information about Allspring Funds
*
The trade name for the asset management firm that includes Allspring Funds Management and the Sub-Adviser is “Allspring Global Investments.”
Allspring Disciplined U.S. Core Fund | 27
Other information (unaudited)
Management’s and the Sub-Adviser’s business continuity plans, their approaches to data privacy and cybersecurity, Allspring Funds Management’s role as administrator of the Fund’s liquidity risk management program, and fair valuation designee. The Board also received and considered information about Allspring Funds Management’s intermediary and vendor oversight program.
Fund investment performance and expenses
The Board considered the investment performance results for the Fund over various time periods ended December 31, 2023. The Board considered these results in comparison to the investment performance of funds in a universe that was determined by Broadridge Inc. (“Broadridge”) to be similar to the Fund (the “Universe”), and in comparison to the Fund’s benchmark index and to other comparative data. Broadridge is an independent provider of investment company data. The Board received a description of the methodology used by Broadridge to select the mutual funds in the performance Universe. The Board noted that the investment performance of the Fund (Administrator Class) was higher than the average investment performance of the Universe for all periods under review. The Board also noted that the investment performance of the Fund was higher than the investment performance of its benchmark index, the S&P 500 Index, for the three-year period under review, in range of the investment performance of its benchmark index for the one-year period under review, and lower for the five- and ten-year periods under review.
The Board also received and considered information regarding the Fund’s net operating expense ratios and their various components, including actual management fees, custodian and other non-management fees, and Rule 12b-1 and non-Rule 12b-1 shareholder service fees. The Board considered these ratios in comparison to the median ratios of funds in class-specific expense groups that were determined by Broadridge to be similar to the Fund (the “Groups”). The Board received a description of the methodology used by Broadridge to select the mutual funds in the expense Groups and an explanation of how funds comprising expense Groups and their expense ratios may vary from year-to-year. Based on the Broadridge reports, the Board noted that the net operating expense ratios of the Fund were lower than the median net operating expense ratios of the expense Groups for each share class, except the Administrator Class, which was equal to the median net operating expense ratio of the expense Group.
The Board took into account the Fund’s investment performance and expense information provided to it among the factors considered in deciding to re-approve the Advisory Agreements.
Investment management and sub-advisory fee rates
The Board reviewed and considered the contractual fee rates payable by the Fund to Allspring Funds Management under the Management Agreement, as well as the contractual fee rates payable by the Fund to Allspring Funds Management for class-level administrative services under a Class-Level Administration Agreement, which include, among other things, class-level transfer agency and sub-transfer agency costs (collectively, the “Management Rates”). The Board also reviewed and considered the contractual investment sub-advisory fee rates payable by Allspring Funds Management to the Sub-Adviser for investment sub-advisory services. It was noted that advisory fee waivers, if any, are at the fund level and not class level.
Among other information reviewed by the Board was a comparison of the Fund’s Management Rates with the average contractual investment management fee rates of funds in the expense Groups at a common asset level as well as transfer agency costs of the funds in the expense Groups. The Board noted that the Management Rates of the Fund were lower than the sum of these average rates for the Fund’s expense Groups for each share class.
The Board also received and considered information about the portion of the total management fee that was retained by Allspring Funds Management after payment of the fee to the Sub-Adviser for sub-advisory services. In assessing the reasonableness of this amount, the Board received and evaluated information about the nature and extent of responsibilities retained and risks assumed by Allspring Funds Management and not delegated to or assumed by the Sub-Adviser, and about Allspring Funds Management’s on-going oversight services. Given the affiliation between Allspring Funds Management and the Sub-Adviser, the Board ascribed limited relevance to the allocation of fees between them.
The Board also received and considered information about the nature and extent of services offered and fee rates charged by Allspring Funds Management and the Sub-Adviser to other types of clients with investment strategies similar to those of the Fund. In this regard, the Board received information about the significantly greater scope of services, and compliance, reporting and other legal and regulatory obligations and risks of managing proprietary mutual funds compared with those associated with managing assets of other types of clients, including third-party sub-advised fund clients and non-mutual fund clients such as institutional separate accounts.
Based on its consideration of the factors and information it deemed relevant, including those described here, the Board determined that the compensation payable to Allspring Funds Management under the Management Agreement and to the Sub-Adviser under the Sub-Advisory Agreement was reasonable.
The Board received and considered information concerning the profitability of Allspring Funds Management, as well as the profitability of Allspring Global Investments, from providing services to the fund complex as a whole. The Board noted that the Sub-Adviser’s profitability information with respect to providing services to the Fund and other funds in the complex was subsumed in the Allspring Global Investments profitability analysis.
28 | Allspring Disciplined U.S. Core Fund
Other information (unaudited)
Allspring Funds Management reported on the methodologies and estimates used in calculating profitability, including a description of the methodology used to allocate certain expenses. Among other things, the Board noted that the levels of profitability reported on a fund-by-fund basis varied widely, depending on factors such as the size, type, and age of fund.
Based on its review, the Board did not deem the profits reported by Allspring Funds Management or Allspring Global Investments from services provided to the Fund to be at a level that would prevent it from approving the continuation of the Advisory Agreements.
The Board received and considered information about the potential for Allspring Funds Management to experience economies of scale in the provision of management services to the Fund, the difficulties of isolating and quantifying economies of scale at an individual fund level, and the extent to which potential scale benefits are shared with Fund shareholders. The Board noted the existence of breakpoints in the Fund’s management fee structure, which operate generally to reduce the Fund’s expense ratios as the Fund grows in size, and the size of the Fund in relation to such breakpoints. The Board considered that in addition to management fee breakpoints, Allspring Funds Management shares potential economies of scale from its management business in a variety of ways, including through fee waiver and expense reimbursement arrangements, competitive management fee rates set at the outset without regard to breakpoints, and investments in the business intended to enhance services available to shareholders.
The Board concluded that Allspring Funds Management’s arrangements with respect to the Fund, including contractual breakpoints, constituted a reasonable approach to sharing potential economies of scale with the Fund and its shareholders.
Other benefits to Allspring Funds Management and the Sub-Advisers
The Board received and considered information regarding potential “fall-out” or ancillary benefits received by Allspring Funds Management and its affiliates, including the Sub-Adviser, as a result of their relationships with the Fund. Ancillary benefits could include, among others, benefits directly attributable to other relationships with the Fund and benefits potentially derived from an increase in Allspring Funds Management’s and the Sub-Adviser’s business as a result of their relationships with the Fund. The Board noted that Allspring Funds Distributor, LLC, an affiliate of Allspring Funds Management, receives distribution-related fees in respect of shares sold or held through it. The Board also reviewed information about soft dollar credits earned and utilized by the Sub-Adviser.
Based on its consideration of the factors and information it deemed relevant, including those described here, the Board did not find that any ancillary benefits received by Allspring Funds Management and its affiliates, including the Sub-Adviser, were unreasonable.
At the Meeting, after considering the above-described factors and based on its deliberations and its evaluation of the information described above, the Board unanimously determined that the compensation payable to Allspring Funds Management and the Sub-Adviser under each of the Advisory Agreements was reasonable, and approved the continuation of the Advisory Agreements for a one-year term.
Allspring Disciplined U.S. Core Fund | 29
For more information
More information about Allspring Funds is available free upon request. To obtain literature, please write, visit the Fund’s website, or call:
Allspring Funds
P.O. Box 219967
Kansas City, MO 64121-9967
Website: allspringglobal.com
Individual investors: 1-800-222-8222
Retail investment professionals: 1-888-877-9275
Institutional investment professionals: 1-800-260-5969
This report and the financial statements contained herein are submitted for the general information of the shareholders of the Fund. If this report is used for promotional purposes, distribution of the report must be accompanied or preceded by a current prospectus. Before investing, please consider the investment objectives, risks, charges, and expenses of the investment. For a current prospectus and, if available, a summary prospectus, containing this information, call 1-800-222-8222 or visit the Fund’s website at allspringglobal.com. Read the prospectus carefully before you invest or send money.
Allspring Global InvestmentsTM is the trade name for the asset management firms of Allspring Global Investments Holdings, LLC, a holding company indirectly owned by certain private funds of GTCR LLC and Reverence Capital Partners, L.P. These firms include but are not limited to Allspring Global Investments, LLC, and Allspring Funds Management, LLC. Certain products managed by Allspring entities are distributed by Allspring Funds Distributor, LLC (a broker-dealer and Member FINRA/SIPC).
This material is for general informational and educational purposes only and is NOT intended to provide investment advice or a recommendation of any kind - including a recommendation for any specific investment, strategy, or plan.
© 2024 Allspring Global Investments Holdings, LLC. All rights reserved.
NCSR0616 07-24
Allspring Special Large Cap Value Fund
Long Form Financial Statements
Annual Report
Allspring Special Large Cap Value Fund | 1
Portfolio of investments—July 31, 2024
| | | | | |
| | | | | | |
Communication services: 3.63% | | | | | | |
Interactive media & services: 3.63% | | | | | | |
| | | | | | |
Consumer discretionary: 5.57% | | | | | | |
| | | | | | |
| | | | | | |
Household durables: 1.74% | | | | | | |
| | | | | | |
Textiles, apparel & luxury goods: 0.96% | | | | | | |
| | | | | | |
| | | | | | |
| | | | | | |
| | | | | | |
Consumer staples distribution & retail : 2.10% | | | | | | |
| | | | | | |
| | | | | | |
Mondelez International, Inc. Class A | | | | | | |
Personal care products: 2.82% | | | | | | |
| | | | | | |
| | | | | | |
Oil, gas & consumable fuels: 6.96% | | | | | | |
| | | | | | |
| | | | | | |
| | | | | | |
| | | | | | |
| | | | | | |
| | | | | | |
| | | | | | |
| | | | | | |
| | | | | | |
| | | | | | |
| | | | | | |
Intercontinental Exchange, Inc. | | | | | | |
Financial services: 7.74% | | | | | | |
Berkshire Hathaway, Inc. Class B† | | | | | | |
| | | | | | |
| | | | | | |
| | | | | | |
The accompanying notes are an integral part of these financial statements.
2 | Allspring Special Large Cap Value Fund
Portfolio of investments—July 31, 2024
| | | | | |
| | | | | | |
American International Group, Inc. | | | | | | |
| | | | | | |
| | | | | | |
Vertex Pharmaceuticals, Inc.† | | | | | | |
Health care equipment & supplies: 2.98% | | | | | | |
Globus Medical, Inc. Class A† | | | | | | |
| | | | | | |
| | | | | | |
Health care providers & services: 6.40% | | | | | | |
| | | | | | |
| | | | | | |
| | | | | | |
| | | | | | |
| | | | | | |
| | | | | | |
| | | | | | |
Aerospace & defense: 4.39% | | | | | | |
L3Harris Technologies, Inc. | | | | | | |
| | | | | | |
| | | | | | |
Commercial services & supplies: 1.08% | | | | | | |
| | | | | | |
Ground transportation: 3.51% | | | | | | |
Canadian Pacific Kansas City Ltd. | | | | | | |
Industrial conglomerates: 2.14% | | | | | | |
| | | | | | |
Honeywell International, Inc. | | | | | | |
| | | | | | |
| | | | | | |
| | | | | | |
Trading companies & distributors: 3.40% | | | | | | |
| | | | | | |
Information technology: 8.31% | | | | | | |
| | | | | | |
| | | | | | |
International Business Machines Corp. | | | | | | |
| | | | | | |
Semiconductors & semiconductor equipment: 1.81% | | | | | | |
| | | | | | |
The accompanying notes are an integral part of these financial statements.
Allspring Special Large Cap Value Fund | 3
Portfolio of investments—July 31, 2024
| | | | | |
| | | | | | |
Cadence Design Systems, Inc.† | | | | | | |
| | | | | | |
| | | | | | |
| | | | | | |
| | | | | | |
CF Industries Holdings, Inc. | | | | | | |
| | | | | | |
| | | | | | |
Construction materials: 1.14% | | | | | | |
| | | | | | |
| | | | | | |
| | | | | | |
| | | | | | |
Real estate management & development: 3.56% | | | | | | |
CBRE Group, Inc. Class A† | | | | | | |
Specialized REITs : 1.76% | | | | | | |
| | | | | | |
| | | | | | |
Electric utilities: 3.13% | | | | | | |
| | | | | | |
Total common stocks (Cost $946,099,519) | | | | | | |
| | | | | |
Short-term investments: 1.30% | | | | | | |
Investment companies: 1.30% | | | | | | |
Allspring Government Money Market Fund Select Class♠∞ | | | | | | |
Total short-term investments (Cost $17,272,868) | | | | | | |
Total investments in securities (Cost $963,372,387) | | | | | | |
Other assets and liabilities, net | | | | | | |
| | | | | | |
| Non-income-earning security |
| The issuer of the security is an affiliated person of the Fund as defined in the Investment Company Act of 1940. |
| The rate represents the 7-day annualized yield at period end. |
|
| American depositary receipt |
| Real estate investment trust |
The accompanying notes are an integral part of these financial statements.
4 | Allspring Special Large Cap Value Fund
Portfolio of investments—July 31, 2024
Investments in affiliates
An affiliated investment is an investment in which the Fund owns at least 5% of the outstanding voting shares of the issuer or as a result of other relationships, such as the Fund and the issuer having the same investment manager. Transactions with issuers that were affiliates of the Fund at the end of the period were as follows:
| | | | | Net
change in
unrealized
gains
(losses) | | | Income
from
affiliated
securities |
| | | | | | | | |
Allspring Government Money Market Fund Select Class | | | | | | | | |
The accompanying notes are an integral part of these financial statements.
Allspring Special Large Cap Value Fund | 5
Statement of assets and liabilities—July 31, 2024
Financial statements
Statement of assets and liabilities
| |
Investments in unaffiliated securities, at value (cost $946,099,519) | |
Investments in affiliated securities, at value (cost $17,272,868) | |
| |
Receivable for investments sold | |
Receivable for Fund shares sold | |
| |
Prepaid expenses and other assets | |
| |
| |
Payable for investments purchased | |
| |
Payable for Fund shares redeemed | |
Shareholder servicing fees payable | |
Administration fees payable | |
Distribution fees payable | |
Accrued expenses and other liabilities | |
| |
| |
| |
| |
Total distributable earnings | |
| |
Computation of net asset value and offering price per share | |
| |
Shares outstanding–Class A1 | |
Net asset value per share–Class A | |
Maximum offering price per share – Class A2 | |
| |
Shares outstanding–Class C1 | |
Net asset value per share–Class C | |
| |
Shares outstanding–Class R61 | |
Net asset value per share–Class R6 | |
Net assets–Administrator Class | |
Shares outstanding–Administrator Class1 | |
Net asset value per share–Administrator Class | |
Net assets–Institutional Class | |
Shares outstanding–Institutional Class1 | |
Net asset value per share–Institutional Class | |
1 The Fund has an unlimited number of authorized shares.
2 Maximum offering price is computed as 100/94.25 of net asset value. On investments of $50,000 or more, the offering price is reduced.
The accompanying notes are an integral part of these financial statements.
6 | Allspring Special Large Cap Value Fund
Statement of operations—year ended July 31, 2024
Statement of operations
| |
Dividends (net of foreign withholdings taxes of $93,477) | |
Income from affiliated securities | |
| |
| |
| |
| |
| |
| |
| |
| |
| |
| |
Shareholder servicing fees | |
| |
| |
| |
| |
| |
Custody and accounting fees | |
| |
| |
Shareholder report expenses | |
Trustees’ fees and expenses | |
| |
| |
Less: Fee waivers and/or expense reimbursements | |
| |
| |
| |
| |
| |
| |
| |
Realized and unrealized gains (losses) on investments | |
Net realized gains (losses) on | |
| |
Foreign currency and foreign currency translations | |
Net realized gains on investments | |
Net change in unrealized gains (losses) on investments | |
Net realized and unrealized gains (losses) on investments | |
Net increase in net assets resulting from operations | |
The accompanying notes are an integral part of these financial statements.
Allspring Special Large Cap Value Fund | 7
Statement of changes in net assets
Statement of changes in net assets
| | |
| | | | |
| | | | |
Net realized gains on investments | | | | |
Net change in unrealized gains (losses) on investments | | | | |
Net increase in net assets resulting from operations | | | | |
Distributions to shareholders from | | | | |
Net investment income and net realized gains | | | | |
| | | | |
| | | | |
| | | | |
| | | | |
| | | | |
| | | | |
Total distributions to shareholders | | | | |
Capital share transactions | | | | |
Proceeds from shares sold | | | | |
| | | | |
| | | | |
| | | | |
| | | | |
| | | | |
| | | | |
| | | | |
Reinvestment of distributions | | | | |
| | | | |
| | | | |
| | | | |
| | | | |
| | | | |
| | | | |
| | | | |
Payment for shares redeemed | | | | |
| | | | |
| | | | |
| | | | |
| | | | |
| | | | |
| | | | |
| | | | |
1 For the period from August 1, 2022 to June 16, 2023. Effective at the close of business on June 16, 2023, Class R shares were converted to Class A shares and are no longer offered by the Fund.
The accompanying notes are an integral part of these financial statements.
8 | Allspring Special Large Cap Value Fund
Statement of changes in net assets
Statement of changes in net assets
| | |
| | | | |
| | | | |
| | | | |
| | | | |
| | | | |
Net increase in net assets resulting from capital share transactions | | | | |
Total increase in net assets | | | | |
| | | | |
| | | | |
| | | | |
2 Effective at the close of business on June 16, 2023, Class R shares were converted to Class A shares and are no longer offered by the Fund.
The accompanying notes are an integral part of these financial statements.
Allspring Special Large Cap Value Fund | 9
Financial highlights
(For a share outstanding throughout each period)
| |
| | | | | |
Net asset value, beginning of period | | | | | |
| | | | | |
| | | | | |
Net realized and unrealized gains (losses) on investments | | | | | |
Total from investment operations | | | | | |
Distributions to shareholders from | | | | | |
| | | | | |
| | | | | |
Total distributions to shareholders | | | | | |
Net asset value, end of period | | | | | |
| | | | | |
Ratios to average net assets (annualized) | | | | | |
| | | | | |
| | | | | |
| | | | | |
| | | | | |
| | | | | |
Net assets, end of period (000s omitted) | | | | | |
| Calculated based upon average shares outstanding |
| Amount is less than $0.005. |
| Total return calculations do not include any sales charges. Returns include adjustments required by U.S. GAAP and may differ from net asset values and performance reported elsewhere. |
| During the year ended July 31, 2021, the Fund received a payment from an affiliate that had an impact of less than 0.005% on total return. |
The accompanying notes are an integral part of these financial statements.
10 | Allspring Special Large Cap Value Fund
(For a share outstanding throughout each period)
| |
| | | | | |
Net asset value, beginning of period | | | | | |
Net investment income (loss) | | | | | |
| | | | | |
Net realized and unrealized gains (losses) on investments | | | | | |
Total from investment operations | | | | | |
Distributions to shareholders from | | | | | |
| | | | | |
Net asset value, end of period | | | | | |
| | | | | |
Ratios to average net assets (annualized) | | | | | |
| | | | | |
| | | | | |
Net investment income (loss) | | | | | |
| | | | | |
| | | | | |
Net assets, end of period (000s omitted) | | | | | |
| Calculated based upon average shares outstanding |
| Total return calculations do not include any sales charges. Returns include adjustments required by U.S. GAAP and may differ from net asset values and performance reported elsewhere. |
| During the year ended July 31, 2021, the Fund received a payment from an affiliate that had a 0.50% impact on the total return. |
The accompanying notes are an integral part of these financial statements.
Allspring Special Large Cap Value Fund | 11
(For a share outstanding throughout each period)
| |
| | | | | |
Net asset value, beginning of period | | | | | |
| | | | | |
Net realized and unrealized gains (losses) on investments | | | | | |
Total from investment operations | | | | | |
Distributions to shareholders from | | | | | |
| | | | | |
| | | | | |
Total distributions to shareholders | | | | | |
Net asset value, end of period | | | | | |
| | | | | |
Ratios to average net assets (annualized) | | | | | |
| | | | | |
| | | | | |
| | | | | |
| | | | | |
| | | | | |
Net assets, end of period (000s omitted) | | | | | |
| Calculated based upon average shares outstanding |
| Returns include adjustments required by U.S. GAAP and may differ from net asset values and performance reported elsewhere. |
The accompanying notes are an integral part of these financial statements.
12 | Allspring Special Large Cap Value Fund
(For a share outstanding throughout each period)
| |
| | | | | |
Net asset value, beginning of period | | | | | |
| | | | | |
| | | | | |
Net realized and unrealized gains (losses) on investments | | | | | |
Total from investment operations | | | | | |
Distributions to shareholders from | | | | | |
| | | | | |
| | | | | |
Total distributions to shareholders | | | | | |
Net asset value, end of period | | | | | |
| | | | | |
Ratios to average net assets (annualized) | | | | | |
| | | | | |
| | | | | |
| | | | | |
| | | | | |
| | | | | |
Net assets, end of period (000s omitted) | | | | | |
| Calculated based upon average shares outstanding |
| Amount is less than $0.005. |
| Returns include adjustments required by U.S. GAAP and may differ from net asset values and performance reported elsewhere. |
| During the year ended July 31, 2021, the Fund received a payment from an affiliate that had a 0.03% impact on the total return. |
The accompanying notes are an integral part of these financial statements.
Allspring Special Large Cap Value Fund | 13
(For a share outstanding throughout each period)
| |
| | | | | |
Net asset value, beginning of period | | | | | |
| | | | | |
Net realized and unrealized gains (losses) on investments | | | | | |
Total from investment operations | | | | | |
Distributions to shareholders from | | | | | |
| | | | | |
| | | | | |
Total distributions to shareholders | | | | | |
Net asset value, end of period | | | | | |
| | | | | |
Ratios to average net assets (annualized) | | | | | |
| | | | | |
| | | | | |
| | | | | |
| | | | | |
| | | | | |
Net assets, end of period (000s omitted) | | | | | |
| Calculated based upon average shares outstanding |
| Returns include adjustments required by U.S. GAAP and may differ from net asset values and performance reported elsewhere. |
The accompanying notes are an integral part of these financial statements.
14 | Allspring Special Large Cap Value Fund
Notes to financial statements
Notes to financial statements
Allspring Funds Trust (the “Trust”), a Delaware statutory trust organized on March 10, 1999, is an open-end management investment company registered under the Investment Company Act of 1940, as amended (the “1940 Act”). As an investment company, the Trust follows the accounting and reporting guidance in Financial Accounting Standards Board (“FASB”) Accounting Standards Codification Topic 946, Financial Services – Investment Companies. These financial statements report on the Allspring Special Large Cap Value Fund (the “Fund”) which is a diversified series of the Trust.
Effective at the close of business on June 16, 2023, Class R shares became Class A shares in a tax-free conversion. Shareholders of Class R received Class A shares at a value equal to the value of their Class R shares immediately prior to the conversion. Class R shares are no longer offered by the Fund.
2.
SIGNIFICANT ACCOUNTING POLICIES
The following significant accounting policies, which are consistently followed in the preparation of the financial statements of the Fund, are in conformity with U.S. generally accepted accounting principles (“GAAP”) which require management to make estimates and assumptions that affect the reported amounts of assets and liabilities, disclosure of contingent assets and liabilities at the date of the financial statements, and the reported amounts of income and expenses during the reporting period. Actual results could differ from those estimates.
All investments are valued each business day as of the close of regular trading on the New York Stock Exchange (generally 4 p.m. Eastern Time), although the Fund may deviate from this calculation time under unusual or unexpected circumstances.
Equity securities and exchange-traded funds that are listed on a foreign or domestic exchange or market are valued at the official closing price or, if none, the last sales price.
Investments in registered open-end investment companies (other than those listed on a foreign or domestic exchange or market) are valued at net asset value.
Investments which are not valued using the methods discussed above are valued at their fair value, as determined in good faith by Allspring Funds Management, LLC (“Allspring Funds Management”), which was named the valuation designee by the Board of Trustees. As the valuation designee, Allspring Funds Management is responsible for day-to-day valuation activities for the Allspring Funds. In connection with these responsibilities, Allspring Funds Management has established a Valuation Committee and has delegated to it the authority to take any actions regarding the valuation of portfolio securities that the Valuation Committee deems necessary or appropriate, including determining the fair value of portfolio securities. On a quarterly basis, the Board of Trustees receives reports of valuation actions taken by the Valuation Committee. On at least an annual basis, the Board of Trustees receives an assessment of the adequacy and effectiveness of Allspring Funds Management’s process for determining the fair value of the portfolio of investments.
Foreign currency translation
The accounting records of the Fund are maintained in U.S. dollars. The values of other assets and liabilities denominated in foreign currencies are translated into U.S. dollars at rates provided by an independent foreign currency pricing source at a time each business day specified by the Valuation Committee. Purchases and sales of securities, and income and expenses are converted at the rate of exchange on the respective dates of such transactions. Net realized foreign exchange gains or losses arise from sales of foreign currencies, currency gains or losses realized between the trade and settlement dates on securities transactions, and the difference between the amounts of dividends, interest and foreign withholding taxes recorded and the U.S. dollar equivalent of the amounts actually paid or received. Net unrealized foreign exchange gains and losses arise from changes in the fair value of assets and liabilities other than investments in securities resulting from changes in exchange rates. The changes in net assets arising from changes in exchange rates of securities and the changes in net assets resulting from changes in market prices of securities are not separately presented. Such changes are included in net realized and unrealized gains or losses from investments.
Security transactions and income recognition
Securities transactions are recorded on a trade date basis. Realized gains or losses are recorded on the basis of identified cost.
Dividend income is recognized on the ex-dividend date. Dividend income is recorded net of foreign taxes withheld where recovery of such taxes is not assured.
Interest earned on cash balances held at the custodian is recorded as interest income.
Distributions received from REIT investments may be characterized as ordinary income, capital gains, or a return of capital to the Fund based on information provided by the REIT. The proper characterization of REIT distributions is generally not known until after the end of each calendar year. As such, estimates may be used in reporting the character of income and distributions for financial statement purposes.
Distributions to shareholders
Distributions to shareholders from net investment income and any net realized gains are recorded on the ex-dividend date and paid at least annually. Such distributions are determined in accordance with income tax regulations and may differ from U.S. GAAP. Dividend sources are estimated at the time
Allspring Special Large Cap Value Fund | 15
Notes to financial statements
of declaration. The tax character of distributions is determined as of the Fund’s fiscal year end. Therefore, a portion of the Fund’s distributions made prior to the Fund’s fiscal year end may be categorized as a tax return of capital at year end.
The Fund intends to continue to qualify as a regulated investment company by distributing substantially all of its investment company taxable income and any net realized capital gains (after reduction for capital loss carryforwards) sufficient to relieve it from all, or substantially all, federal income taxes. Accordingly, no provision for federal income taxes was required.
The Fund’s income and federal excise tax returns and all financial records supporting those returns for the prior three fiscal years are subject to examination by the federal and Delaware revenue authorities. Management has analyzed the Fund’s tax positions taken on federal, state, and foreign tax returns, as applicable, for all open tax years and does not believe that there are any uncertain tax positions that require recognition of a tax liability.
As of July 31, 2024, the aggregate cost of all investments for federal income tax purposes was $965,967,171 and the unrealized gains (losses) consisted of:
The separate classes of shares offered by the Fund differ principally in applicable sales charges, distribution, shareholder servicing, and administration fees. Class specific expenses are charged directly to that share class. Investment income, common fund-level expenses, and realized and unrealized gains (losses) on investments are allocated daily to each class of shares based on the relative proportion of net assets of each class.
3.
FAIR VALUATION MEASUREMENTS
Fair value measurements of investments are determined within a framework that has established a fair value hierarchy based upon the various data inputs utilized in determining the value of the Fund’s investments. The three-level hierarchy gives the highest priority to unadjusted quoted prices in active markets for identical assets or liabilities (Level 1) and the lowest priority to unobservable inputs (Level 3). The Fund’s investments are classified within the fair value hierarchy based on the lowest level of input that is significant to the fair value measurement. The inputs are summarized into three broad levels as follows:
•Level 1—quoted prices in active markets for identical securities
•Level 2—other significant observable inputs (including quoted prices for similar securities, interest rates, prepayment speeds, credit risk, etc.)
•Level 3—significant unobservable inputs (including the Fund’s own assumptions in determining the fair value of investments)
The inputs or methodologies used for valuing investments in securities are not necessarily an indication of the risk associated with investing in those securities.
16 | Allspring Special Large Cap Value Fund
Notes to financial statements
The following is a summary of the inputs used in valuing the Fund’s assets and liabilities as of July 31, 2024:
| | Other significant
observable inputs
(Level 2) | Significant
unobservable inputs
(Level 3) | |
| | | | |
| | | | |
| | | | |
| | | | |
| | | | |
| | | | |
| | | | |
| | | | |
| | | | |
| | | | |
| | | | |
| | | | |
| | | | |
| | | | |
| | | | |
| | | | |
| | | | |
Additional sector, industry or geographic detail, if any, is included in the Portfolio of Investments.
At July 31, 2024, the Fund did not have any transfers into/out of Level 3.
4.
TRANSACTIONS WITH AFFILIATES
Allspring Funds Management, a wholly owned subsidiary of Allspring Global Investments Holdings, LLC, a holding company indirectly owned by certain private funds of GTCR LLC and Reverence Capital Partners, L.P., is the manager of the Fund and provides advisory and fund-level administrative services under an investment management agreement. Under the investment management agreement, Allspring Funds Management is responsible for, among other services, implementing the investment objectives and strategies of the Fund, supervising the subadviser and providing fund-level administrative services in connection with the Fund’s operations. As compensation for its services under the investment management agreement, Allspring Funds Management is entitled to receive a management fee at the following annual rate based on the Fund’s average daily net assets:
For the year ended July 31, 2024, the management fee was equivalent to an annual rate of 0.68% of the Fund’s average daily net assets.
Allspring Funds Management has retained the services of a subadviser to provide daily portfolio management to the Fund. The fee for subadvisory services is borne by Allspring Funds Management. Allspring Global Investments, LLC (“Allspring Investments”), an affiliate of Allspring Funds Management and a wholly owned subsidiary of Allspring Global Investments Holdings, LLC, is the subadviser to the Fund and is entitled to receive a fee from Allspring Funds Management at an annual rate starting at 0.30% and declining to 0.20% as the average daily net assets of the Fund increase. Prior to March 4, 2024, Allspring Investments received a fee at an annual rate which started at 0.35% and declined to 0.25% as the average daily net assets of the Fund increased.
Under a class-level administration agreement, Allspring Funds Management provides class-level administrative services to the Fund, which includes paying fees and expenses for services provided by the transfer agent, sub-transfer agents, omnibus account servicers and record-keepers. As
Allspring Special Large Cap Value Fund | 17
Notes to financial statements
compensation for its services under the class-level administration agreement, Allspring Funds Management receives an annual fee which is calculated based on the average daily net assets of each class as follows:
| Class-level
administration fee |
| |
| |
| |
| |
| |
Waivers and/or expense reimbursements
Allspring Funds Management has contractually committed to waive and/or reimburse management and administration fees to the extent necessary to maintain certain net operating expense ratios for the Fund. When each class of the Fund has exceeded its expense cap, Allspring Funds Management will waive fees and/or reimburse expenses from fund-level expenses on a proportionate basis and then from class specific expenses. When only certain classes exceed their expense caps, waivers and/or reimbursements are applied against class specific expenses before fund-level expenses. Allspring Funds Management has contractually committed through November 30, 2024 to waive fees and/or reimburse expenses to the extent necessary to cap the Fund’s expenses. Prior to or after the commitment expiration date, the cap may be increased or the commitment to maintain the cap may be terminated only with the approval of the Board of Trustees. As of July 31, 2024, the contractual caps are as follows:
| |
| | RATE PRIOR TO MARCH 4, 2024 |
| | |
| | |
| | |
| | |
| | |
The Trust has adopted a distribution plan for Class C shares pursuant to Rule 12b-1 under the 1940 Act. Distribution fees are charged to Class C shares and paid to Allspring Funds Distributor, LLC (“Allspring Funds Distributor”), the principal underwriter, an affiliate of Allspring Funds Management, at an annual rate up to 0.75% of the average daily net assets of Class C shares.
In addition, Allspring Funds Distributor is entitled to receive the front-end sales charge from the purchase of Class A shares and a contingent deferred sales charge on the redemption of certain Class A shares. Allspring Funds Distributor is also entitled to receive the contingent deferred sales charges from redemptions of Class C shares. For the year ended July 31, 2024, Allspring Funds Distributor received $1,413 from the sale of Class A shares. No contingent deferred sales charges were incurred by Class A and Class C shares for the year ended July 31, 2024.
Shareholder servicing fees
The Trust has entered into contracts with one or more shareholder servicing agents, whereby Class A, Class C and Administrator Class are charged a fee at an annual rate up to 0.25% of the average daily net assets of each respective class. A portion of these total shareholder servicing fees were paid to affiliates of the Fund.
The Fund may purchase or sell portfolio investment securities to certain affiliates pursuant to Rule 17a-7 under the 1940 Act and under procedures adopted by the Board of Trustees. The procedures have been designed to ensure that these interfund transactions, which do not incur broker commissions, are effected at current market prices. Pursuant to these procedures, the Fund did not have any interfund transactions during the year ended July 31, 2024.
5.
INVESTMENT PORTFOLIO TRANSACTIONS
Purchases and sales of investments, excluding U.S. government obligations (if any) and short-term securities, for the year ended July 31, 2024 were $461,222,692 and $411,747,011, respectively.
The Trust (excluding the money market funds), Allspring Master Trust and Allspring Variable Trust are parties to a $275,000,000 (prior to July 9, 2024: $350,000,000), revolving credit agreement whereby the Fund is permitted to use bank borrowings for temporary or emergency purposes, such as to fund shareholder redemption requests. Interest under the credit agreement is charged to the Fund based on a borrowing rate equal to the higher of
18 | Allspring Special Large Cap Value Fund
Notes to financial statements
the Federal Funds rate or the overnight bank funding rate in effect on that day plus a spread. In addition, an annual commitment fee based on the unused balance is allocated to each participating fund.
For the year ended July 31, 2024, there were no borrowings by the Fund under the agreement.
7.
DISTRIBUTIONS TO SHAREHOLDERS
The tax character of distributions paid were as follows:
As of July 31, 2024, the components of distributable earnings on a tax basis were as follows:
Undistributed
ordinary
income | Undistributed
long-term
gain | |
| | |
Under the Fund’s organizational documents, the officers and Trustees have been granted certain indemnification rights against certain liabilities that may arise out of performance of their duties to the Fund. The Fund has entered into a separate agreement with each Trustee that converts indemnification rights currently existing under the Fund’s organizational documents into contractual rights that cannot be changed in the future without the consent of the Trustee. Additionally, in the normal course of business, the Fund may enter into contracts with service providers that contain a variety of indemnification clauses. The Fund’s maximum exposure under these arrangements is dependent on future claims that may be made against the Fund and, therefore, cannot be estimated.
Allspring Special Large Cap Value Fund | 19
Report of independent registered public accounting firm
To the Shareholders of the Fund and Board of Trustees
Allspring Funds Trust:
Opinion on the Financial Statements
We have audited the accompanying statement of assets and liabilities of Allspring Special Large Cap Value Fund (the Fund), one of the funds constituting Allspring Funds Trust, including the portfolio of investments, as of July 31, 2024, the related statement of operations for the year then ended, the statements of changes in net assets for each of the years in the two-year period then ended, and the related notes (collectively, the financial statements) and the financial highlights for each of the years in the five-year period then ended. In our opinion, the financial statements and financial highlights present fairly, in all material respects, the financial position of the Fund as of July 31, 2024, the results of its operations for the year then ended, the changes in its net assets for each of the years in the two-year period then ended, and the financial highlights for each of the years in the five-year period then ended, in conformity with U.S. generally accepted accounting principles.
These financial statements and financial highlights are the responsibility of the Fund’s management. Our responsibility is to express an opinion on these financial statements and financial highlights based on our audits. We are a public accounting firm registered with the Public Company Accounting Oversight Board (United States) (PCAOB) and are required to be independent with respect to the Fund in accordance with the U.S. federal securities laws and the applicable rules and regulations of the Securities and Exchange Commission and the PCAOB.
We conducted our audits in accordance with the standards of the PCAOB. Those standards require that we plan and perform the audit to obtain reasonable assurance about whether the financial statements and financial highlights are free of material misstatement, whether due to error or fraud. Our audits included performing procedures to assess the risks of material misstatement of the financial statements and financial highlights, whether due to error or fraud, and performing procedures that respond to those risks. Such procedures included examining, on a test basis, evidence regarding the amounts and disclosures in the financial statements and financial highlights. Such procedures also included confirmation of securities owned as of July 31, 2024, by correspondence with the custodian, transfer agent and brokers, or by other appropriate auditing procedures. Our audits also included evaluating the accounting principles used and significant estimates made by management, as well as evaluating the overall presentation of the financial statements and financial highlights. We believe that our audits provide a reasonable basis for our opinion.

We have not been able to determine the specific year that we began serving as the auditor of one or more Allspring Funds investment companies; however, we are aware that we have served as the auditor of one or more Allspring Funds investment companies since at least 1955.
September 25, 2024
20 | Allspring Special Large Cap Value Fund
Other information (unaudited)
Other information
For corporate shareholders, pursuant to Section 854 of the Internal Revenue Code, 100% of ordinary income dividends qualify for the corporate dividends-received deduction for the fiscal year ended July 31, 2024.
Pursuant to Section 852 of the Internal Revenue Code, $22,601,530 was designated as a 20% rate gain distribution for the fiscal year ended
July 31, 2024.
Pursuant to Section 854 of the Internal Revenue Code, $11,446,121 of income dividends paid during the fiscal year ended July 31, 2024 has been designated as qualified dividend income (QDI).
For the fiscal year ended July 31, 2024, $752,600 has been designated as interest-related dividends for nonresident alien shareholders pursuant to Section 871 of the Internal Revenue Code.
A description of the policies and procedures used to determine how to vote proxies relating to portfolio securities is available without charge, upon request, by calling 1-866-259-3305, visiting our website at allspringglobal.com, or visiting the SEC website at sec.gov. Information regarding how the proxies related to portfolio securities were voted during the most recent 12-month period ended June 30 is available on the website at allspringglobal.com or by visiting the SEC website at sec.gov.
Quarterly portfolio holdings information
The Fund files its complete schedule of portfolio holdings with the SEC for the first and third quarters of each fiscal year as an exhibit to its reports on Form N-PORT. Shareholders may view the filed Form N-PORT by visiting the SEC website at sec.gov.
Allspring Special Large Cap Value Fund | 21
Other information (unaudited)
Item 8. Changes in and disagreements with accountants
Item 9. Matters submitted to fund shareholders for a vote
Item 10. Remuneration paid to directors, officers and others
Refer to information in the Statement of operations.
22 | Allspring Special Large Cap Value Fund
Other information (unaudited)
Item 11. Statement regarding basis for the board’s approval of investment advisory contract
Board consideration of investment management and sub-advisory agreements:
Under the Investment Company Act of 1940 (the “1940 Act”), the Board of Trustees (the “Board”) of Allspring Funds Trust (the “Trust”) must determine annually whether to approve the continuation of the Trust’s investment management and sub-advisory agreements. In this regard, at a Board meeting held on May 28-30, 2024 (the “Meeting”), the Board, all the members of which have no direct or indirect interest in the investment management and sub-advisory agreements and are not “interested persons” of the Trust, as defined in the 1940 Act (the “Independent Trustees”), reviewed and approved for the Allspring Special Large Cap Value Fund (the “Fund”): (i) an investment management agreement (the “Management Agreement”) with Allspring Funds Management, LLC (“Allspring Funds Management”); and (ii) an investment sub-advisory agreement (the “Sub-Advisory Agreement”) with Allspring Global Investments, LLC (the “Sub-Adviser”), an affiliate of Allspring Funds Management. The Management Agreement and the Sub-Advisory Agreement are collectively referred to as the “Advisory Agreements.”
At the Meeting, the Board considered the factors and reached the conclusions described below relating to the selection of Allspring Funds Management and the Sub-Adviser and the approval of the Advisory Agreements. Prior to the Meeting, including at a meeting of the Board held in April 2024, and at the Meeting, the Trustees conferred extensively among themselves and with representatives of Allspring Funds Management about these matters. The Board has adopted a team-based approach, with each team consisting of a sub-set of Trustees, to assist the full Board in the discharge of its duties in reviewing investment performance and other matters throughout the year. The Independent Trustees were assisted in their evaluation of the Advisory Agreements by independent legal counsel, from whom they received separate legal advice and with whom they met separately.
In providing information to the Board, Allspring Funds Management and the Sub-Adviser were guided by a detailed set of requests for information submitted to them by independent legal counsel on behalf of the Independent Trustees at the start of the Board’s annual contract renewal process earlier in 2024. In considering and approving the Advisory Agreements, the Trustees considered the information they believed relevant, including but not limited to the information discussed below. The Board considered not only the specific information presented in connection with the Meeting, but also the knowledge gained over time through interactions with Allspring Funds Management and the Sub-Adviser about various topics. In this regard, the Board reviewed reports of Allspring Funds Management at each of its quarterly meetings, which included, among other things, portfolio reviews and investment performance reports. In addition, the Board and the teams mentioned above confer with portfolio managers at various times throughout the year. The Board did not identify any particular information or consideration that was all-important or controlling, and each individual Trustee may have attributed different weights to various factors.
After its deliberations, the Board unanimously determined that the compensation payable to Allspring Funds Management and the Sub-Adviser under each of the Advisory Agreements was reasonable, and approved the continuation of the Advisory Agreements for a one-year term. The Board considered the approval of the Advisory Agreements for the Fund as part of its consideration of agreements for funds across the complex, but its approvals were made on a fund-by-fund basis. The following summarizes a number of important, but not necessarily all, factors considered by the Board in support of its approvals.
Nature, extent, and quality of services
The Board received and considered various information regarding the nature, extent, and quality of services provided to the Fund by Allspring Funds Management and the Sub-Adviser under the Advisory Agreements. This information included a description of the investment advisory services and Fund-level administrative services covered by the Management Agreement, as well as, among other things, a summary of the background and experience of senior management of Allspring Global Investments, of which Allspring Funds Management and the Sub-Adviser are a part, and a summary of investments made in the Allspring Global Investments business.* The Board also received information about the services that continue to be provided by Wells Fargo & Co. and/or its affiliates (“Wells Fargo”) since the sale of Wells Fargo Asset Management to Allspring Global Investments Holdings, LLC, a holding company indirectly owned by certain private funds of GTCR LLC and Reverence Capital Partners, L.P., under a transition services agreement and an update on the anticipated timeline for exiting the transition services agreement. In addition, the Board received and considered information about the full range of services provided to the Fund by Allspring Funds Management and its affiliates.
The Board considered the qualifications, background, tenure, and responsibilities of each of the portfolio managers primarily responsible for the day-to-day portfolio management of the Fund. The Board evaluated the ability of Allspring Funds Management and the Sub-Adviser to attract and retain qualified investment professionals, including research, advisory, and supervisory personnel.
The Board further considered the compliance programs and compliance records of Allspring Funds Management and the Sub-Adviser. The Board received and considered information about Allspring Global Investments’ risk management functions, which included information about Allspring Funds
*
The trade name for the asset management firm that includes Allspring Funds Management and the Sub-Adviser is “Allspring Global Investments.”
Allspring Special Large Cap Value Fund | 23
Other information (unaudited)
Management’s and the Sub-Adviser’s business continuity plans, their approaches to data privacy and cybersecurity, Allspring Funds Management’s role as administrator of the Fund’s liquidity risk management program, and fair valuation designee. The Board also received and considered information about Allspring Funds Management’s intermediary and vendor oversight program.
Fund investment performance and expenses
The Board considered the investment performance results for the Fund over various time periods ended December 31, 2023. The Board considered these results in comparison to the investment performance of funds in a universe that was determined by Broadridge Inc. (“Broadridge”) to be similar to the Fund (the “Universe”), and in comparison to the Fund’s benchmark index and to other comparative data. Broadridge is an independent provider of investment company data. The Board received a description of the methodology used by Broadridge to select the mutual funds in the performance Universe. The Board noted that the investment performance of the Fund (Administrator Class) was higher than the average investment performance of the Universe for the one- and five-year periods under review, and in range of the average investment performance of the Universe for the three- and ten-year periods under review. The Board also noted that the investment performance of the Fund was higher than the investment performance of its benchmark index, the Russell 1000 Value Index, for all periods under review.
The Board also received and considered information regarding the Fund’s net operating expense ratios and their various components, including actual management fees, custodian and other non-management fees, and Rule 12b-1 and non-Rule 12b-1 shareholder service fees. The Board considered these ratios in comparison to the median ratios of funds in class-specific expense groups that were determined by Broadridge to be similar to the Fund (the “Groups”). The Board received a description of the methodology used by Broadridge to select the mutual funds in the expense Groups and an explanation of how funds comprising expense Groups and their expense ratios may vary from year-to-year. Based on the Broadridge reports, the Board noted that the net operating expense ratios of the Fund were lower than the median net operating expense ratios of the expense Groups for each share class. The Board noted Allspring Funds Management had agreed to reduce the net operating expense caps for each share class.
The Board took into account the Fund’s investment performance and expense information provided to it among the factors considered in deciding to re-approve the Advisory Agreements.
Investment management and sub-advisory fee rates
The Board reviewed and considered the contractual fee rates payable by the Fund to Allspring Funds Management under the Management Agreement, as well as the contractual fee rates payable by the Fund to Allspring Funds Management for class-level administrative services under a Class-Level Administration Agreement, which include, among other things, class-level transfer agency and sub-transfer agency costs (collectively, the “Management Rates”). The Board also reviewed and considered the contractual investment sub-advisory fee rates payable by Allspring Funds Management to the Sub-Adviser for investment sub-advisory services. It was noted that advisory fee waivers, if any, are at the fund level and not class level.
Among other information reviewed by the Board was a comparison of the Fund’s Management Rates with the average contractual investment management fee rates of funds in the expense Groups at a common asset level as well as transfer agency costs of the funds in the expense Groups. The Board noted that the Management Rates of the Fund were in range of the sum of these average rates for the Fund’s expense Groups for each share class, except for the Administrator Class, which was higher than the sum of the average rates for the expense Group.
The Board also received and considered information about the portion of the total management fee that was retained by Allspring Funds Management after payment of the fee to the Sub-Adviser for sub-advisory services. In assessing the reasonableness of this amount, the Board received and evaluated information about the nature and extent of responsibilities retained and risks assumed by Allspring Funds Management and not delegated to or assumed by the Sub-Adviser, and about Allspring Funds Management’s on-going oversight services. Given the affiliation between Allspring Funds Management and the Sub-Adviser, the Board ascribed limited relevance to the allocation of fees between them.
The Board also received and considered information about the nature and extent of services offered and fee rates charged by Allspring Funds Management and the Sub-Adviser to other types of clients with investment strategies similar to those of the Fund. In this regard, the Board received information about the significantly greater scope of services, and compliance, reporting and other legal and regulatory obligations and risks of managing proprietary mutual funds compared with those associated with managing assets of other types of clients, including third-party sub-advised fund clients and non-mutual fund clients such as institutional separate accounts.
Based on its consideration of the factors and information it deemed relevant, including those described here, the Board determined that the compensation payable to Allspring Funds Management under the Management Agreement and to the Sub-Adviser under the Sub-Advisory Agreement was reasonable.
The Board received and considered information concerning the profitability of Allspring Funds Management, as well as the profitability of Allspring Global Investments, from providing services to the fund complex as a whole. The Board noted that the Sub-Adviser’s profitability information with respect to providing services to the Fund and other funds in the complex was subsumed in the Allspring Global Investments profitability analysis.
24 | Allspring Special Large Cap Value Fund
Other information (unaudited)
Allspring Funds Management reported on the methodologies and estimates used in calculating profitability, including a description of the methodology used to allocate certain expenses. Among other things, the Board noted that the levels of profitability reported on a fund-by-fund basis varied widely, depending on factors such as the size, type, and age of fund.
Based on its review, the Board did not deem the profits reported by Allspring Funds Management or Allspring Global Investments from services provided to the Fund to be at a level that would prevent it from approving the continuation of the Advisory Agreements.
The Board received and considered information about the potential for Allspring Funds Management to experience economies of scale in the provision of management services to the Fund, the difficulties of isolating and quantifying economies of scale at an individual fund level, and the extent to which potential scale benefits are shared with Fund shareholders. The Board noted the existence of breakpoints in the Fund’s management fee structure, which operate generally to reduce the Fund’s expense ratios as the Fund grows in size, and the size of the Fund in relation to such breakpoints. The Board considered that in addition to management fee breakpoints, Allspring Funds Management shares potential economies of scale from its management business in a variety of ways, including through fee waiver and expense reimbursement arrangements, competitive management fee rates set at the outset without regard to breakpoints, and investments in the business intended to enhance services available to shareholders.
The Board concluded that Allspring Funds Management’s arrangements with respect to the Fund, including contractual breakpoints, constituted a reasonable approach to sharing potential economies of scale with the Fund and its shareholders.
Other benefits to Allspring Funds Management and the Sub-Adviser
The Board received and considered information regarding potential “fall-out” or ancillary benefits received by Allspring Funds Management and its affiliates, including the Sub-Adviser, as a result of their relationships with the Fund. Ancillary benefits could include, among others, benefits directly attributable to other relationships with the Fund and benefits potentially derived from an increase in Allspring Funds Management’s and the Sub-Adviser’s business as a result of their relationships with the Fund. The Board noted that Allspring Funds Distributor, LLC, an affiliate of Allspring Funds Management, receives distribution-related fees in respect of shares sold or held through it. The Board also reviewed information about soft dollar credits earned and utilized by the Sub-Adviser.
Based on its consideration of the factors and information it deemed relevant, including those described here, the Board did not find that any ancillary benefits received by Allspring Funds Management and its affiliates, including the Sub-Adviser, were unreasonable.
At the Meeting, after considering the above-described factors and based on its deliberations and its evaluation of the information described above, the Board unanimously determined that the compensation payable to Allspring Funds Management and the Sub-Adviser under each of the Advisory Agreements was reasonable, and approved the continuation of the Advisory Agreements for a one-year term.
Allspring Special Large Cap Value Fund | 25
For more information
More information about Allspring Funds is available free upon request. To obtain literature, please write, visit the Fund’s website, or call:
Allspring Funds
P.O. Box 219967
Kansas City, MO 64121-9967
Website: allspringglobal.com
Individual investors: 1-800-222-8222
Retail investment professionals: 1-888-877-9275
Institutional investment professionals: 1-800-260-5969
This report and the financial statements contained herein are submitted for the general information of the shareholders of the Fund. If this report is used for promotional purposes, distribution of the report must be accompanied or preceded by a current prospectus. Before investing, please consider the investment objectives, risks, charges, and expenses of the investment. For a current prospectus and, if available, a summary prospectus, containing this information, call 1-800-222-8222 or visit the Fund’s website at allspringglobal.com. Read the prospectus carefully before you invest or send money.
Allspring Global InvestmentsTM is the trade name for the asset management firms of Allspring Global Investments Holdings, LLC, a holding company indirectly owned by certain private funds of GTCR LLC and Reverence Capital Partners, L.P. These firms include but are not limited to Allspring Global Investments, LLC, and Allspring Funds Management, LLC. Certain products managed by Allspring entities are distributed by Allspring Funds Distributor, LLC (a broker-dealer and Member FINRA/SIPC).
This material is for general informational and educational purposes only and is NOT intended to provide investment advice or a recommendation of any kind - including a recommendation for any specific investment, strategy, or plan.
© 2024 Allspring Global Investments Holdings, LLC. All rights reserved.
NCSR4302 07-24
Allspring Large Cap Core Fund
Long Form Financial Statements
Annual Report
Allspring Large Cap Core Fund | 1
Portfolio of investments—July 31, 2024
| | | | | |
| | | | | | |
Communication services: 7.65% | | | | | | |
| | | | | | |
| | | | | | |
Interactive media & services: 4.03% | | | | | | |
| | | | | | |
| | | | | | |
| | | | | | |
Consumer discretionary: 10.78% | | | | | | |
| | | | | | |
| | | | | | |
Hotels, restaurants & leisure: 1.83% | | | | | | |
Royal Caribbean Cruises Ltd.† | | | | | | |
Household durables: 4.56% | | | | | | |
| | | | | | |
| | | | | | |
| | | | | | |
| | | | | | |
| | | | | | |
| | | | | | |
Consumer staples distribution & retail : 2.14% | | | | | | |
| | | | | | |
Household products: 2.03% | | | | | | |
| | | | | | |
| | | | | | |
Energy equipment & services: 1.31% | | | | | | |
| | | | | | |
Oil, gas & consumable fuels: 4.98% | | | | | | |
| | | | | | |
| | | | | | |
| | | | | | |
| | | | | | |
| | | | | | |
| | | | | | |
| | | | | | |
Citizens Financial Group, Inc. | | | | | | |
First Citizens BancShares, Inc. Class A | | | | | | |
| | | | | | |
| | | | | | |
The accompanying notes are an integral part of these financial statements.
2 | Allspring Large Cap Core Fund
Portfolio of investments—July 31, 2024
| | | | | |
| | | | | | |
Goldman Sachs Group, Inc. | | | | | | |
Virtu Financial, Inc. Class A | | | | | | |
| | | | | | |
| | | | | | |
| | | | | | |
| | | | | | |
| | | | | | |
Regeneron Pharmaceuticals, Inc.† | | | | | | |
United Therapeutics Corp.† | | | | | | |
| | | | | | |
Health care equipment & supplies: 3.44% | | | | | | |
Edwards Lifesciences Corp.† | | | | | | |
Intuitive Surgical, Inc.† | | | | | | |
| | | | | | |
Health care providers & services: 3.29% | | | | | | |
| | | | | | |
| | | | | | |
| | | | | | |
| | | | | | |
Commercial services & supplies: 1.72% | | | | | | |
| | | | | | |
Construction & engineering: 2.18% | | | | | | |
| | | | | | |
Electrical equipment: 1.57% | | | | | | |
| | | | | | |
| | | | | | |
| | | | | | |
| | | | | | |
| | | | | | |
Passenger airlines: 1.83% | | | | | | |
United Airlines Holdings, Inc.† | | | | | | |
Information technology: 28.59% | | | | | | |
Communications equipment: 2.28% | | | | | | |
| | | | | | |
Semiconductors & semiconductor equipment: 9.27% | | | | | | |
| | | | | | |
| | | | | | |
| | | | | | |
| | | | | | |
| | | | | | |
The accompanying notes are an integral part of these financial statements.
Allspring Large Cap Core Fund | 3
Portfolio of investments—July 31, 2024
| | | | | |
| | | | | | |
| | | | | | |
Cadence Design Systems, Inc.† | | | | | | |
| | | | | | |
| | | | | | |
| | | | | | |
| | | | | | |
Technology hardware, storage & peripherals: 4.88% | | | | | | |
| | | | | | |
| | | | | | |
| | | | | | |
CF Industries Holdings, Inc. | | | | | | |
| | | | | | |
| | | | | | |
| | | | | | |
| | | | | | |
| | | | | | |
| | | | | | |
Simon Property Group, Inc. | | | | | | |
Specialized REITs : 1.27% | | | | | | |
| | | | | | |
Total common stocks (Cost $314,378,994) | | | | | | |
| | | | | |
Short-term investments: 1.45% | | | | | | |
Investment companies: 1.45% | | | | | | |
Allspring Government Money Market Fund Select Class♠∞ | | | | | | |
Total short-term investments (Cost $7,562,931) | | | | | | |
Total investments in securities (Cost $321,941,925) | | | | | | |
Other assets and liabilities, net | | | | | | |
| | | | | | |
| Non-income-earning security |
| The issuer of the security is an affiliated person of the Fund as defined in the Investment Company Act of 1940. |
| The rate represents the 7-day annualized yield at period end. |
|
| Real estate investment trust |
The accompanying notes are an integral part of these financial statements.
4 | Allspring Large Cap Core Fund
Portfolio of investments—July 31, 2024
Investments in affiliates
An affiliated investment is an investment in which the Fund owns at least 5% of the outstanding voting shares of the issuer or as a result of other relationships, such as the Fund and the issuer having the same investment manager. Transactions with issuers that were affiliates of the Fund at the end of the period were as follows:
| | | | | Net
change in
unrealized
gains
(losses) | | | Income
from
affiliated
securities |
| | | | | | | | |
Allspring Government Money Market Fund Select Class | | | | | | | | |
The accompanying notes are an integral part of these financial statements.
Allspring Large Cap Core Fund | 5
Statement of assets and liabilities—July 31, 2024
Financial statements
Statement of assets and liabilities
| |
Investments in unaffiliated securities, at value (cost $314,378,994) | |
Investments in affiliated securities, at value (cost $7,562,931) | |
Cash at broker segregated for futures contracts | |
Receivable for Fund shares sold | |
| |
Receivable for daily variation margin on open futures contracts | |
Prepaid expenses and other assets | |
| |
| |
| |
Payable for Fund shares redeemed | |
Shareholder servicing fees payable | |
Administration fees payable | |
Distribution fees payable | |
Accrued expenses and other liabilities | |
| |
| |
| |
| |
Total distributable earnings | |
| |
Computation of net asset value and offering price per share | |
| |
Shares outstanding–Class A1 | |
Net asset value per share–Class A | |
Maximum offering price per share – Class A2 | |
| |
Shares outstanding–Class C1 | |
Net asset value per share–Class C | |
| |
Shares outstanding–Class R61 | |
Net asset value per share–Class R6 | |
Net assets–Administrator Class | |
Shares outstanding–Administrator Class1 | |
Net asset value per share–Administrator Class | |
Net assets–Institutional Class | |
Shares outstanding–Institutional Class1 | |
Net asset value per share–Institutional Class | |
1 The Fund has an unlimited number of authorized shares.
2 Maximum offering price is computed as 100/94.25 of net asset value. On investments of $50,000 or more, the offering price is reduced.
The accompanying notes are an integral part of these financial statements.
6 | Allspring Large Cap Core Fund
Statement of operations—year ended July 31, 2024
Statement of operations
| |
| |
Income from affiliated securities | |
| |
| |
| |
| |
| |
| |
| |
| |
| |
| |
Shareholder servicing fees | |
| |
| |
| |
| |
| |
Custody and accounting fees | |
| |
| |
Shareholder report expenses | |
Trustees’ fees and expenses | |
| |
| |
Less: Fee waivers and/or expense reimbursements | |
| |
| |
| |
| |
| |
| |
| |
| |
The accompanying notes are an integral part of these financial statements.
Allspring Large Cap Core Fund | 7
Statement of operations—year ended July 31, 2024
Statement of operations
Realized and unrealized gains (losses) on investments | |
| |
| |
| |
Net realized gains on investments | |
Net change in unrealized gains (losses) on | |
| |
| |
Net change in unrealized gains (losses) on investments | |
Net realized and unrealized gains (losses) on investments | |
Net increase in net assets resulting from operations | |
The accompanying notes are an integral part of these financial statements.
8 | Allspring Large Cap Core Fund
Statement of changes in net assets
Statement of changes in net assets
| | |
| | | | |
| | | | |
Net realized gains on investments | | | | |
Net change in unrealized gains (losses) on investments | | | | |
Net increase in net assets resulting from operations | | | | |
Distributions to shareholders from | | | | |
Net investment income and net realized gains | | | | |
| | | | |
| | | | |
| | | | |
| | | | |
| | | | |
| | | | |
Total distributions to shareholders | | | | |
Capital share transactions | | | | |
Proceeds from shares sold | | | | |
| | | | |
| | | | |
| | | | |
| | | | |
| | | | |
| | | | |
| | | | |
Reinvestment of distributions | | | | |
| | | | |
| | | | |
| | | | |
| | | | |
| | | | |
| | | | |
| | | | |
Payment for shares redeemed | | | | |
| | | | |
| | | | |
| | | | |
| | | | |
| | | | |
| | | | |
| | | | |
1 For the period from August 1, 2022 to June 16, 2023. Effective at the close of business on June 16, 2023, Class R shares were converted to Class A shares and are no longer offered by the Fund.
The accompanying notes are an integral part of these financial statements.
Allspring Large Cap Core Fund | 9
Statement of changes in net assets
Statement of changes in net assets
| | |
| | | | |
| | | | |
| | | | |
| | | | |
| | | | |
Net increase (decrease) in net assets resulting from capital share transactions | | | | |
Total increase (decrease) in net assets | | | | |
| | | | |
| | | | |
| | | | |
2 Effective at the close of business on June 16, 2023, Class R shares were converted to Class A shares and are no longer offered by the Fund.
The accompanying notes are an integral part of these financial statements.
10 | Allspring Large Cap Core Fund
Financial highlights
(For a share outstanding throughout each period)
| |
| | | | | |
Net asset value, beginning of period | | | | | |
| | | | | |
Net realized and unrealized gains (losses) on investments | | | | | |
Total from investment operations | | | | | |
Distributions to shareholders from | | | | | |
| | | | | |
| | | | | |
Total distributions to shareholders | | | | | |
Net asset value, end of period | | | | | |
| | | | | |
Ratios to average net assets (annualized) | | | | | |
| | | | | |
| | | | | |
| | | | | |
| | | | | |
| | | | | |
Net assets, end of period (000s omitted) | | | | | |
| Calculated based upon average shares outstanding |
| Total return calculations do not include any sales charges. Returns include adjustments required by U.S. GAAP and may differ from net asset values and performance reported elsewhere. |
The accompanying notes are an integral part of these financial statements.
Allspring Large Cap Core Fund | 11
(For a share outstanding throughout each period)
| |
| | | | | |
Net asset value, beginning of period | | | | | |
Net investment income (loss) | | | | | |
Net realized and unrealized gains (losses) on investments | | | | | |
Total from investment operations | | | | | |
Distributions to shareholders from | | | | | |
| | | | | |
| | | | | |
Total distributions to shareholders | | | | | |
Net asset value, end of period | | | | | |
| | | | | |
Ratios to average net assets (annualized) | | | | | |
| | | | | |
| | | | | |
Net investment income (loss) | | | | | |
| | | | | |
| | | | | |
Net assets, end of period (000s omitted) | | | | | |
| Calculated based upon average shares outstanding |
| Total return calculations do not include any sales charges. Returns include adjustments required by U.S. GAAP and may differ from net asset values and performance reported elsewhere. |
The accompanying notes are an integral part of these financial statements.
12 | Allspring Large Cap Core Fund
(For a share outstanding throughout each period)
| |
| | | | | |
Net asset value, beginning of period | | | | | |
| | | | | |
Net realized and unrealized gains (losses) on investments | | | | | |
Total from investment operations | | | | | |
Distributions to shareholders from | | | | | |
| | | | | |
| | | | | |
Total distributions to shareholders | | | | | |
Net asset value, end of period | | | | | |
| | | | | |
Ratios to average net assets (annualized) | | | | | |
| | | | | |
| | | | | |
| | | | | |
| | | | | |
| | | | | |
Net assets, end of period (000s omitted) | | | | | |
| Calculated based upon average shares outstanding |
| Returns include adjustments required by U.S. GAAP and may differ from net asset values and performance reported elsewhere. |
The accompanying notes are an integral part of these financial statements.
Allspring Large Cap Core Fund | 13
(For a share outstanding throughout each period)
| |
| | | | | |
Net asset value, beginning of period | | | | | |
| | | | | |
Net realized and unrealized gains (losses) on investments | | | | | |
Total from investment operations | | | | | |
Distributions to shareholders from | | | | | |
| | | | | |
| | | | | |
Total distributions to shareholders | | | | | |
Net asset value, end of period | | | | | |
| | | | | |
Ratios to average net assets (annualized) | | | | | |
| | | | | |
| | | | | |
| | | | | |
| | | | | |
| | | | | |
Net assets, end of period (000s omitted) | | | | | |
| Calculated based upon average shares outstanding |
| Returns include adjustments required by U.S. GAAP and may differ from net asset values and performance reported elsewhere. |
The accompanying notes are an integral part of these financial statements.
14 | Allspring Large Cap Core Fund
(For a share outstanding throughout each period)
| |
| | | | | |
Net asset value, beginning of period | | | | | |
| | | | | |
Net realized and unrealized gains (losses) on investments | | | | | |
Total from investment operations | | | | | |
Distributions to shareholders from | | | | | |
| | | | | |
| | | | | |
Total distributions to shareholders | | | | | |
Net asset value, end of period | | | | | |
| | | | | |
Ratios to average net assets (annualized) | | | | | |
| | | | | |
| | | | | |
| | | | | |
| | | | | |
| | | | | |
Net assets, end of period (000s omitted) | | | | | |
| Calculated based upon average shares outstanding |
| Returns include adjustments required by U.S. GAAP and may differ from net asset values and performance reported elsewhere. |
The accompanying notes are an integral part of these financial statements.
Allspring Large Cap Core Fund | 15
Notes to financial statements
Notes to financial statements
Allspring Funds Trust (the “Trust”), a Delaware statutory trust organized on March 10, 1999, is an open-end management investment company registered under the Investment Company Act of 1940, as amended (the “1940 Act”). As an investment company, the Trust follows the accounting and reporting guidance in Financial Accounting Standards Board (“FASB”) Accounting Standards Codification Topic 946, Financial Services – Investment Companies. These financial statements report on the Allspring Large Cap Core Fund (the “Fund”) which is a diversified series of the Trust.
Effective at the close of business on June 16, 2023, Class R shares became Class A shares in a tax-free conversion. Shareholders of Class R received Class A shares at a value equal to the value of their Class R shares immediately prior to the conversion. Class R shares are no longer offered by the Fund.
2.
SIGNIFICANT ACCOUNTING POLICIES
The following significant accounting policies, which are consistently followed in the preparation of the financial statements of the Fund, are in conformity with U.S. generally accepted accounting principles (“GAAP”) which require management to make estimates and assumptions that affect the reported amounts of assets and liabilities, disclosure of contingent assets and liabilities at the date of the financial statements, and the reported amounts of income and expenses during the reporting period. Actual results could differ from those estimates.
All investments are valued each business day as of the close of regular trading on the New York Stock Exchange (generally 4 p.m. Eastern Time), although the Fund may deviate from this calculation time under unusual or unexpected circumstances.
Equity securities, exchange-traded funds and futures contracts that are listed on a foreign or domestic exchange or market are valued at the official closing price or, if none, the last sales price.
Investments in registered open-end investment companies (other than those listed on a foreign or domestic exchange or market) are valued at net asset value.
Investments which are not valued using the methods discussed above are valued at their fair value, as determined in good faith by Allspring Funds Management, LLC (“Allspring Funds Management”), which was named the valuation designee by the Board of Trustees. As the valuation designee, Allspring Funds Management is responsible for day-to-day valuation activities for the Allspring Funds. In connection with these responsibilities, Allspring Funds Management has established a Valuation Committee and has delegated to it the authority to take any actions regarding the valuation of portfolio securities that the Valuation Committee deems necessary or appropriate, including determining the fair value of portfolio securities. On a quarterly basis, the Board of Trustees receives reports of valuation actions taken by the Valuation Committee. On at least an annual basis, the Board of Trustees receives an assessment of the adequacy and effectiveness of Allspring Funds Management’s process for determining the fair value of the portfolio of investments.
Futures contracts are agreements between the Fund and a counterparty to buy or sell a specific amount of a commodity, financial instrument or currency at a specified price and on a specified date. The Fund may buy and sell futures contracts in order to gain exposure to, or protect against, changes in security values and is subject to equity price risk. The primary risks associated with the use of futures contracts are the imperfect correlation between changes in market values of securities held by the Fund and the prices of futures contracts, and the possibility of an illiquid market. Futures contracts are generally entered into on a regulated futures exchange and cleared through a clearinghouse associated with the exchange. With futures contracts, there is minimal counterparty risk to the Fund since futures contracts are exchange-traded and the exchange’s clearinghouse, as the counterparty to all exchange-traded futures, guarantees the futures contracts against default.
Upon entering into a futures contract, the Fund is required to deposit either cash or securities (initial margin) with the broker in an amount equal to a certain percentage of the contract value. Subsequent payments (variation margin) are paid to or received from the broker each day equal to the daily changes in the contract value. Such payments are recorded as unrealized gains or losses and, if any, shown as variation margin receivable (payable) in the Statement of Assets and Liabilities. Should the Fund fail to make requested variation margin payments, the broker can gain access to the initial margin to satisfy the Fund’s payment obligations. When the contracts are closed, a realized gain or loss is recorded in the Statement of Operations.
Security transactions and income recognition
Securities transactions are recorded on a trade date basis. Realized gains or losses are recorded on the basis of identified cost.
Dividend income is recognized on the ex-dividend date.
Interest earned on cash balances held at the custodian is recorded as interest income.
Distributions received from REIT investments may be characterized as ordinary income, capital gains, or a return of capital to the Fund based on information provided by the REIT. The proper characterization of REIT distributions is generally not known until after the end of each calendar year. As such, estimates may be used in reporting the character of income and distributions for financial statement purposes.
16 | Allspring Large Cap Core Fund
Notes to financial statements
Distributions to shareholders
Distributions to shareholders from net investment income and any net realized gains are recorded on the ex-dividend date and paid at least annually. Such distributions are determined in accordance with income tax regulations and may differ from U.S. GAAP. Dividend sources are estimated at the time of declaration. The tax character of distributions is determined as of the Fund’s fiscal year end. Therefore, a portion of the Fund’s distributions made prior to the Fund’s fiscal year end may be categorized as a tax return of capital at year end.
The Fund intends to continue to qualify as a regulated investment company by distributing substantially all of its investment company taxable income and any net realized capital gains (after reduction for capital loss carryforwards) sufficient to relieve it from all, or substantially all, federal income taxes. Accordingly, no provision for federal income taxes was required.
The Fund’s income and federal excise tax returns and all financial records supporting those returns for the prior three fiscal years are subject to examination by the federal and Delaware revenue authorities. Management has analyzed the Fund’s tax positions taken on federal, state, and foreign tax returns, as applicable, for all open tax years and does not believe that there are any uncertain tax positions that require recognition of a tax liability.
As of July 31, 2024, the aggregate cost of all investments for federal income tax purposes was $322,245,688 and the unrealized gains (losses) consisted of:
The separate classes of shares offered by the Fund differ principally in applicable sales charges, distribution, shareholder servicing, and administration fees. Class specific expenses are charged directly to that share class. Investment income, common fund-level expenses, and realized and unrealized gains (losses) on investments are allocated daily to each class of shares based on the relative proportion of net assets of each class.
3.
FAIR VALUATION MEASUREMENTS
Fair value measurements of investments are determined within a framework that has established a fair value hierarchy based upon the various data inputs utilized in determining the value of the Fund’s investments. The three-level hierarchy gives the highest priority to unadjusted quoted prices in active markets for identical assets or liabilities (Level 1) and the lowest priority to unobservable inputs (Level 3). The Fund’s investments are classified within the fair value hierarchy based on the lowest level of input that is significant to the fair value measurement. The inputs are summarized into three broad levels as follows:
•Level 1—quoted prices in active markets for identical securities
•Level 2—other significant observable inputs (including quoted prices for similar securities, interest rates, prepayment speeds, credit risk, etc.)
•Level 3—significant unobservable inputs (including the Fund’s own assumptions in determining the fair value of investments)
The inputs or methodologies used for valuing investments in securities are not necessarily an indication of the risk associated with investing in those securities.
Allspring Large Cap Core Fund | 17
Notes to financial statements
The following is a summary of the inputs used in valuing the Fund’s assets and liabilities as of July 31, 2024:
| | Other significant
observable inputs
(Level 2) | Significant
unobservable inputs
(Level 3) | |
| | | | |
| | | | |
| | | | |
| | | | |
| | | | |
| | | | |
| | | | |
| | | | |
| | | | |
| | | | |
| | | | |
| | | | |
| | | | |
| | | | |
| | | | |
| | | | |
| | | | |
| | | | |
Futures contracts are reported at their cumulative unrealized gains (losses) at measurement date as reported in the table following the Portfolio of Investments. For futures contracts, the current day’s variation margin is reported on the Statement of Assets and Liabilities. All other assets and liabilities are reported at their market value at measurement date.
Additional sector, industry or geographic detail, if any, is included in the Portfolio of Investments.
At July 31, 2024, the Fund did not have any transfers into/out of Level 3.
4.
TRANSACTIONS WITH AFFILIATES
Allspring Funds Management, a wholly owned subsidiary of Allspring Global Investments Holdings, LLC, a holding company indirectly owned by certain private funds of GTCR LLC and Reverence Capital Partners, L.P., is the manager of the Fund and provides advisory and fund-level administrative services under an investment management agreement. Under the investment management agreement, Allspring Funds Management is responsible for, among other services, implementing the investment objectives and strategies of the Fund, supervising the subadviser and providing fund-level administrative services in connection with the Fund’s operations. As compensation for its services under the investment management agreement, Allspring Funds Management is entitled to receive a management fee at the following annual rate based on the Fund’s average daily net assets:
For the year ended July 31, 2024, the management fee was equivalent to an annual rate of 0.70% of the Fund’s average daily net assets.
Allspring Funds Management has retained the services of a subadviser to provide daily portfolio management to the Fund. The fee for subadvisory services is borne by Allspring Funds Management. Allspring Global Investments, LLC, an affiliate of Allspring Funds Management and a wholly owned subsidiary of Allspring Global Investments Holdings, LLC, is the subadviser to the Fund and is entitled to receive a fee from Allspring Funds Management at an annual rate starting at 0.35% and declining to 0.30% as the average daily net assets of the Fund increase.
18 | Allspring Large Cap Core Fund
Notes to financial statements
Administration fees
Under a class-level administration agreement, Allspring Funds Management provides class-level administrative services to the Fund, which includes paying fees and expenses for services provided by the transfer agent, sub-transfer agents, omnibus account servicers and record-keepers. As compensation for its services under the class-level administration agreement, Allspring Funds Management receives an annual fee which is calculated based on the average daily net assets of each class as follows:
| Class-level
administration fee |
| |
| |
| |
| |
| |
Waivers and/or expense reimbursements
Allspring Funds Management has contractually committed to waive and/or reimburse management and administration fees to the extent necessary to maintain certain net operating expense ratios for the Fund. When each class of the Fund has exceeded its expense cap, Allspring Funds Management will waive fees and/or reimburse expenses from fund-level expenses on a proportionate basis and then from class specific expenses. When only certain classes exceed their expense caps, waivers and/or reimbursements are applied against class specific expenses before fund-level expenses. Allspring Funds Management has contractually committed through November 30, 2024 to waive fees and/or reimburse expenses to the extent necessary to cap the Fund’s expenses. Prior to or after the commitment expiration date, the cap may be increased or the commitment to maintain the cap may be terminated only with the approval of the Board of Trustees. As of July 31, 2024, the contractual caps are as follows:
The Trust has adopted a distribution plan for Class C shares pursuant to Rule 12b-1 under the 1940 Act. Distribution fees are charged to Class C shares and paid to Allspring Funds Distributor, LLC (“Allspring Funds Distributor”), the principal underwriter, an affiliate of Allspring Funds Management, at an annual rate up to 0.75% of the average daily net assets of Class C shares.
In addition, Allspring Funds Distributor is entitled to receive the front-end sales charge from the purchase of Class A shares and a contingent deferred sales charge on the redemption of certain Class A shares. Allspring Funds Distributor is also entitled to receive the contingent deferred sales charges from redemptions of Class C shares. For the year ended July 31, 2024, Allspring Funds Distributor received $2,316 from the sale of Class A shares. No contingent deferred sales charges were incurred by Class A and Class C shares for the year ended July 31, 2024.
Shareholder servicing fees
The Trust has entered into contracts with one or more shareholder servicing agents, whereby Class A, Class C and Administrator Class are charged a fee at an annual rate up to 0.25% of the average daily net assets of each respective class. A portion of these total shareholder servicing fees were paid to affiliates of the Fund.
The Fund may purchase or sell portfolio investment securities to certain affiliates pursuant to Rule 17a-7 under the 1940 Act and under procedures adopted by the Board of Trustees. The procedures have been designed to ensure that these interfund transactions, which do not incur broker commissions, are effected at current market prices. Pursuant to these procedures, the Fund did not have any interfund transactions during the year ended July 31, 2024.
5.
INVESTMENT PORTFOLIO TRANSACTIONS
Purchases and sales of investments, excluding U.S. government obligations (if any) and short-term securities, for the year ended July 31, 2024 were $143,325,625 and $176,095,083, respectively.
Allspring Large Cap Core Fund | 19
Notes to financial statements
6.
DERIVATIVE TRANSACTIONS
During the year ended July 31, 2024, the Fund entered into futures contracts to gain market exposure. The Fund had an average notional amount of $4,842,174 in long futures contracts during the year ended July 31, 2024.
The fair value, realized gains or losses and change in unrealized gains or losses, if any, on derivative instruments are reflected in the corresponding financial statement captions.
The Trust (excluding the money market funds), Allspring Master Trust and Allspring Variable Trust are parties to a $275,000,000 (prior to July 9, 2024: $350,000,000), revolving credit agreement whereby the Fund is permitted to use bank borrowings for temporary or emergency purposes, such as to fund shareholder redemption requests. Interest under the credit agreement is charged to the Fund based on a borrowing rate equal to the higher of the Federal Funds rate or the overnight bank funding rate in effect on that day plus a spread. In addition, an annual commitment fee based on the unused balance is allocated to each participating fund.
For the year ended July 31, 2024, there were no borrowings by the Fund under the agreement.
8.
DISTRIBUTIONS TO SHAREHOLDERS
The tax character of distributions paid were as follows:
As of July 31, 2024, the components of distributable earnings on a tax basis were as follows:
Undistributed
ordinary
income | Undistributed
long-term
gain | |
| | |
As of the end of the period, the Fund concentrated its portfolio of investments in the information technology sector. A fund that invests a substantial portion of its assets in any sector may be more affected by changes in that sector than would be a fund whose investments are not heavily weighted in any sector.
Under the Fund’s organizational documents, the officers and Trustees have been granted certain indemnification rights against certain liabilities that may arise out of performance of their duties to the Fund. The Fund has entered into a separate agreement with each Trustee that converts indemnification rights currently existing under the Fund’s organizational documents into contractual rights that cannot be changed in the future without the consent of the Trustee. Additionally, in the normal course of business, the Fund may enter into contracts with service providers that contain a variety of indemnification clauses. The Fund’s maximum exposure under these arrangements is dependent on future claims that may be made against the Fund and, therefore, cannot be estimated.
20 | Allspring Large Cap Core Fund
Report of independent registered public accounting firm
To the Shareholders of the Fund and Board of Trustees
Allspring Funds Trust:
Opinion on the Financial Statements
We have audited the accompanying statement of assets and liabilities of Allspring Large Cap Core Fund (the Fund), one of the funds constituting Allspring Funds Trust, including the portfolio of investments, as of July 31, 2024, the related statement of operations for the year then ended, the statements of changes in net assets for each of the years in the two-year period then ended, and the related notes (collectively, the financial statements) and the financial highlights for each of the years in the five-year period then ended. In our opinion, the financial statements and financial highlights present fairly, in all material respects, the financial position of the Fund as of July 31, 2024, the results of its operations for the year then ended, the changes in its net assets for each of the years in the two-year period then ended, and the financial highlights for each of the years in the five-year period then ended, in conformity with U.S. generally accepted accounting principles.
These financial statements and financial highlights are the responsibility of the Fund’s management. Our responsibility is to express an opinion on these financial statements and financial highlights based on our audits. We are a public accounting firm registered with the Public Company Accounting Oversight Board (United States) (PCAOB) and are required to be independent with respect to the Fund in accordance with the U.S. federal securities laws and the applicable rules and regulations of the Securities and Exchange Commission and the PCAOB.
We conducted our audits in accordance with the standards of the PCAOB. Those standards require that we plan and perform the audit to obtain reasonable assurance about whether the financial statements and financial highlights are free of material misstatement, whether due to error or fraud. Our audits included performing procedures to assess the risks of material misstatement of the financial statements and financial highlights, whether due to error or fraud, and performing procedures that respond to those risks. Such procedures included examining, on a test basis, evidence regarding the amounts and disclosures in the financial statements and financial highlights. Such procedures also included confirmation of securities owned as of July 31, 2024, by correspondence with the custodian, transfer agent, and brokers. Our audits also included evaluating the accounting principles used and significant estimates made by management, as well as evaluating the overall presentation of the financial statements and financial highlights. We believe that our audits provide a reasonable basis for our opinion.

We have not been able to determine the specific year that we began serving as the auditor of one or more Allspring Funds investment companies; however, we are aware that we have served as the auditor of one or more Allspring Funds investment companies since at least 1955.
September 25, 2024
Allspring Large Cap Core Fund | 21
Other information (unaudited)
Other information
For corporate shareholders, pursuant to Section 854 of the Internal Revenue Code, 74% of ordinary income dividends qualify for the corporate dividends-received deduction for the fiscal year ended July 31, 2024.
Pursuant to Section 852 of the Internal Revenue Code, $31,834,651 was designated as a 20% rate gain distribution for the fiscal year ended
July 31, 2024.
Pursuant to Section 854 of the Internal Revenue Code, $3,511,431 of income dividends paid during the fiscal year ended July 31, 2024 has been designated as qualified dividend income (QDI).
For the fiscal year ended July 31, 2024, $112,271 has been designated as interest-related dividends for nonresident alien shareholders pursuant to Section 871 of the Internal Revenue Code.
For the fiscal year ended July 31, 2024, $1,726,584 has been designated as short-term capital gain dividends for nonresident alien shareholders pursuant to Section 871 of the Internal Revenue Code.
A description of the policies and procedures used to determine how to vote proxies relating to portfolio securities is available without charge, upon request, by calling 1-866-259-3305, visiting our website at allspringglobal.com, or visiting the SEC website at sec.gov. Information regarding how the proxies related to portfolio securities were voted during the most recent 12-month period ended June 30 is available on the website at allspringglobal.com or by visiting the SEC website at sec.gov.
Quarterly portfolio holdings information
The Fund files its complete schedule of portfolio holdings with the SEC for the first and third quarters of each fiscal year as an exhibit to its reports on Form N-PORT. Shareholders may view the filed Form N-PORT by visiting the SEC website at sec.gov.
22 | Allspring Large Cap Core Fund
Other information (unaudited)
Item 8. Changes in and disagreements with accountants
Item 9. Matters submitted to fund shareholders for a vote
Item 10. Remuneration paid to directors, officers and others
Refer to information in the Statement of operations.
Allspring Large Cap Core Fund | 23
Other information (unaudited)
Item 11. Statement regarding basis for the board’s approval of investment advisory contract
Board consideration of investment management and sub-advisory agreements:
Under the Investment Company Act of 1940 (the “1940 Act”), the Board of Trustees (the “Board”) of Allspring Funds Trust (the “Trust”) must determine annually whether to approve the continuation of the Trust’s investment management and sub-advisory agreements. In this regard, at a Board meeting held on May 28-30, 2024 (the “Meeting”), the Board, all the members of which have no direct or indirect interest in the investment management and sub-advisory agreements and are not “interested persons” of the Trust, as defined in the 1940 Act (the “Independent Trustees”), reviewed and approved for the Allspring Large Cap Core Fund (the “Fund”): (i) an investment management agreement (the “Management Agreement”) with Allspring Funds Management, LLC (“Allspring Funds Management”); and (ii) an investment sub-advisory agreement (the “Sub-Advisory Agreement”) with Allspring Global Investments, LLC (the “Sub-Adviser”), an affiliate of Allspring Funds Management. The Management Agreement and the Sub-Advisory Agreement are collectively referred to as the “Advisory Agreements.”
At the Meeting, the Board considered the factors and reached the conclusions described below relating to the selection of Allspring Funds Management and the Sub-Adviser and the approval of the Advisory Agreements. Prior to the Meeting, including at a meeting of the Board held in April 2024, and at the Meeting, the Trustees conferred extensively among themselves and with representatives of Allspring Funds Management about these matters. The Board has adopted a team-based approach, with each team consisting of a sub-set of Trustees, to assist the full Board in the discharge of its duties in reviewing investment performance and other matters throughout the year. The Independent Trustees were assisted in their evaluation of the Advisory Agreements by independent legal counsel, from whom they received separate legal advice and with whom they met separately.
In providing information to the Board, Allspring Funds Management and the Sub-Adviser were guided by a detailed set of requests for information submitted to them by independent legal counsel on behalf of the Independent Trustees at the start of the Board’s annual contract renewal process earlier in 2024. In considering and approving the Advisory Agreements, the Trustees considered the information they believed relevant, including but not limited to the information discussed below. The Board considered not only the specific information presented in connection with the Meeting, but also the knowledge gained over time through interactions with Allspring Funds Management and the Sub-Adviser about various topics. In this regard, the Board reviewed reports of Allspring Funds Management at each of its quarterly meetings, which included, among other things, portfolio reviews and investment performance reports. In addition, the Board and the teams mentioned above confer with portfolio managers at various times throughout the year. The Board did not identify any particular information or consideration that was all-important or controlling, and each individual Trustee may have attributed different weights to various factors.
After its deliberations, the Board unanimously determined that the compensation payable to Allspring Funds Management and the Sub-Adviser under each of the Advisory Agreements was reasonable, and approved the continuation of the Advisory Agreements for a one-year term. The Board considered the approval of the Advisory Agreements for the Fund as part of its consideration of agreements for funds across the complex, but its approvals were made on a fund-by-fund basis. The following summarizes a number of important, but not necessarily all, factors considered by the Board in support of its approvals.
Nature, extent, and quality of services
The Board received and considered various information regarding the nature, extent, and quality of services provided to the Fund by Allspring Funds Management and the Sub-Adviser under the Advisory Agreements. This information included a description of the investment advisory services and Fund-level administrative services covered by the Management Agreement, as well as, among other things, a summary of the background and experience of senior management of Allspring Global Investments, of which Allspring Funds Management and the Sub-Adviser are a part, and a summary of investments made in the Allspring Global Investments business.* The Board also received information about the services that continue to be provided by Wells Fargo & Co. and/or its affiliates (“Wells Fargo”) since the sale of Wells Fargo Asset Management to Allspring Global Investments Holdings, LLC, a holding company indirectly owned by certain private funds of GTCR LLC and Reverence Capital Partners, L.P., under a transition services agreement and an update on the anticipated timeline for exiting the transition services agreement. In addition, the Board received and considered information about the full range of services provided to the Fund by Allspring Funds Management and its affiliates.
The Board considered the qualifications, background, tenure, and responsibilities of each of the portfolio managers primarily responsible for the day-to-day portfolio management of the Fund. The Board evaluated the ability of Allspring Funds Management and the Sub-Adviser to attract and retain qualified investment professionals, including research, advisory, and supervisory personnel.
The Board further considered the compliance programs and compliance records of Allspring Funds Management and the Sub-Adviser. The Board received and considered information about Allspring Global Investments’ risk management functions, which included information about Allspring Funds
*
The trade name for the asset management firm that includes Allspring Funds Management and the Sub-Adviser is “Allspring Global Investments.”
24 | Allspring Large Cap Core Fund
Other information (unaudited)
Management’s and the Sub-Adviser’s business continuity plans, their approaches to data privacy and cybersecurity, Allspring Funds Management’s role as administrator of the Fund’s liquidity risk management program, and fair valuation designee. The Board also received and considered information about Allspring Funds Management’s intermediary and vendor oversight program.
Fund investment performance and expenses
The Board considered the investment performance results for the Fund over various time periods ended December 31, 2023. The Board considered these results in comparison to the investment performance of funds in a universe that was determined by Broadridge Inc. (“Broadridge”) to be similar to the Fund (the “Universe”), and in comparison to the Fund’s benchmark index and to other comparative data. Broadridge is an independent provider of investment company data. The Board received a description of the methodology used by Broadridge to select the mutual funds in the performance Universe. The Board noted that the investment performance of the Fund (Administrator Class) was higher than the average investment performance of the Universe for all periods under review. The Board also noted that the investment performance of the Fund was higher than the investment performance of its benchmark index, the S&P 500 Index, for the three-year period under review, and lower for the one-, five-, and ten-year periods under review.
The Board also received and considered information regarding the Fund’s net operating expense ratios and their various components, including actual management fees, custodian and other non-management fees, and Rule 12b-1 and non-Rule 12b-1 shareholder service fees. The Board considered these ratios in comparison to the median ratios of funds in class-specific expense groups that were determined by Broadridge to be similar to the Fund (the “Groups”). The Board received a description of the methodology used by Broadridge to select the mutual funds in the expense Groups and an explanation of how funds comprising expense Groups and their expense ratios may vary from year-to-year. Based on the Broadridge reports, the Board noted that the net operating expense ratios of the Fund were lower than the median net operating expense ratios of the expense Groups for each share class, except the Administrator Class, which was equal to the median net operating expense ratio of the expense Group.
The Board took into account the Fund’s investment performance and expense information provided to it among the factors considered in deciding to re-approve the Advisory Agreements.
Investment management and sub-advisory fee rates
The Board reviewed and considered the contractual fee rates payable by the Fund to Allspring Funds Management under the Management Agreement, as well as the contractual fee rates payable by the Fund to Allspring Funds Management for class-level administrative services under a Class-Level Administration Agreement, which include, among other things, class-level transfer agency and sub-transfer agency costs (collectively, the “Management Rates”). The Board also reviewed and considered the contractual investment sub-advisory fee rates payable by Allspring Funds Management to the Sub-Adviser for investment sub-advisory services. It was noted that advisory fee waivers, if any, are at the fund level and not class level.
Among other information reviewed by the Board was a comparison of the Fund’s Management Rates with the average contractual investment management fee rates of funds in the expense Groups at a common asset level as well as transfer agency costs of the funds in the expense Groups. The Board noted that the Management Rates of the Fund were in range of the sum of these average rates for the Fund’s expense Groups for each share class, except the Administrator Class, which was higher than the sum of the average rates for the expense Group.
The Board also received and considered information about the portion of the total management fee that was retained by Allspring Funds Management after payment of the fee to the Sub-Adviser for sub-advisory services. In assessing the reasonableness of this amount, the Board received and evaluated information about the nature and extent of responsibilities retained and risks assumed by Allspring Funds Management and not delegated to or assumed by the Sub-Adviser, and about Allspring Funds Management’s on-going oversight services. Given the affiliation between Allspring Funds Management and the Sub-Adviser, the Board ascribed limited relevance to the allocation of fees between them.
The Board also received and considered information about the nature and extent of services offered and fee rates charged by Allspring Funds Management and the Sub-Adviser to other types of clients with investment strategies similar to those of the Fund. In this regard, the Board received information about the significantly greater scope of services, and compliance, reporting and other legal and regulatory obligations and risks of managing proprietary mutual funds compared with those associated with managing assets of other types of clients, including third-party sub-advised fund clients and non-mutual fund clients such as institutional separate accounts.
Based on its consideration of the factors and information it deemed relevant, including those described here, the Board determined that the compensation payable to Allspring Funds Management under the Management Agreement and to the Sub-Adviser under the Sub-Advisory Agreement was reasonable.
The Board received and considered information concerning the profitability of Allspring Funds Management, as well as the profitability of Allspring Global Investments, from providing services to the fund complex as a whole. The Board noted that the Sub-Adviser’s profitability information with respect to providing services to the Fund and other funds in the complex was subsumed in the Allspring Global Investments profitability analysis.
Allspring Large Cap Core Fund | 25
Other information (unaudited)
Allspring Funds Management reported on the methodologies and estimates used in calculating profitability, including a description of the methodology used to allocate certain expenses. Among other things, the Board noted that the levels of profitability reported on a fund-by-fund basis varied widely, depending on factors such as the size, type, and age of fund.
Based on its review, the Board did not deem the profits reported by Allspring Funds Management or Allspring Global Investments from services provided to the Fund to be at a level that would prevent it from approving the continuation of the Advisory Agreements.
The Board received and considered information about the potential for Allspring Funds Management to experience economies of scale in the provision of management services to the Fund, the difficulties of isolating and quantifying economies of scale at an individual fund level, and the extent to which potential scale benefits are shared with Fund shareholders. The Board noted the existence of breakpoints in the Fund’s management fee structure, which operate generally to reduce the Fund’s expense ratios as the Fund grows in size, and the size of the Fund in relation to such breakpoints. The Board considered that in addition to management fee breakpoints, Allspring Funds Management shares potential economies of scale from its management business in a variety of ways, including through fee waiver and expense reimbursement arrangements, competitive management fee rates set at the outset without regard to breakpoints, and investments in the business intended to enhance services available to shareholders.
The Board concluded that Allspring Funds Management’s arrangements with respect to the Fund, including contractual breakpoints, constituted a reasonable approach to sharing potential economies of scale with the Fund and its shareholders.
Other benefits to Allspring Funds Management and the Sub-Advisers
The Board received and considered information regarding potential “fall-out” or ancillary benefits received by Allspring Funds Management and its affiliates, including the Sub-Adviser, as a result of their relationships with the Fund. Ancillary benefits could include, among others, benefits directly attributable to other relationships with the Fund and benefits potentially derived from an increase in Allspring Funds Management’s and the Sub-Adviser’s business as a result of their relationships with the Fund. The Board noted that Allspring Funds Distributor, LLC, an affiliate of Allspring Funds Management, receives distribution-related fees in respect of shares sold or held through it. The Board also reviewed information about soft dollar credits earned and utilized by the Sub-Adviser.
Based on its consideration of the factors and information it deemed relevant, including those described here, the Board did not find that any ancillary benefits received by Allspring Funds Management and its affiliates, including the Sub-Adviser, were unreasonable.
At the Meeting, after considering the above-described factors and based on its deliberations and its evaluation of the information described above, the Board unanimously determined that the compensation payable to Allspring Funds Management and the Sub-Adviser under each of the Advisory Agreements was reasonable, and approved the continuation of the Advisory Agreements for a one-year term.
26 | Allspring Large Cap Core Fund
This page is intentionally left blank.
This page is intentionally left blank.
For more information
More information about Allspring Funds is available free upon request. To obtain literature, please write, visit the Fund’s website, or call:
Allspring Funds
P.O. Box 219967
Kansas City, MO 64121-9967
Website: allspringglobal.com
Individual investors: 1-800-222-8222
Retail investment professionals: 1-888-877-9275
Institutional investment professionals: 1-800-260-5969
This report and the financial statements contained herein are submitted for the general information of the shareholders of the Fund. If this report is used for promotional purposes, distribution of the report must be accompanied or preceded by a current prospectus. Before investing, please consider the investment objectives, risks, charges, and expenses of the investment. For a current prospectus and, if available, a summary prospectus, containing this information, call 1-800-222-8222 or visit the Fund’s website at allspringglobal.com. Read the prospectus carefully before you invest or send money.
Allspring Global InvestmentsTM is the trade name for the asset management firms of Allspring Global Investments Holdings, LLC, a holding company indirectly owned by certain private funds of GTCR LLC and Reverence Capital Partners, L.P. These firms include but are not limited to Allspring Global Investments, LLC, and Allspring Funds Management, LLC. Certain products managed by Allspring entities are distributed by Allspring Funds Distributor, LLC (a broker-dealer and Member FINRA/SIPC).
This material is for general informational and educational purposes only and is NOT intended to provide investment advice or a recommendation of any kind - including a recommendation for any specific investment, strategy, or plan.
© 2024 Allspring Global Investments Holdings, LLC. All rights reserved.
NCSR4314 07-24
Allspring Premier Large Company Growth Fund
Long Form Financial Statements
Annual Report
Allspring Premier Large Company Growth Fund | 1
Portfolio of investments—July 31, 2024
| | | | | |
| | | | | | |
Communication services: 13.33% | | | | | | |
| | | | | | |
Live Nation Entertainment, Inc.† | | | | | | |
| | | | | | |
| | | | | | |
Take-Two Interactive Software, Inc.† | | | | | | |
| | | | | | |
Interactive media & services: 8.09% | | | | | | |
| | | | | | |
| | | | | | |
Meta Platforms, Inc. Class A | | | | | | |
| | | | | | |
| | | | | | |
Trade Desk, Inc. Class A† | | | | | | |
Consumer discretionary: 15.56% | | | | | | |
| | | | | | |
| | | | | | |
| | | | | | |
| | | | | | |
Hotels, restaurants & leisure: 4.96% | | | | | | |
| | | | | | |
Chipotle Mexican Grill, Inc.† | | | | | | |
| | | | | | |
DraftKings, Inc. Class A† | | | | | | |
Hilton Worldwide Holdings, Inc. | | | | | | |
| | | | | | |
| | | | | | |
Household durables: 0.70% | | | | | | |
| | | | | | |
| | | | | | |
| | | | | | |
Textiles, apparel & luxury goods: 1.80% | | | | | | |
| | | | | | |
| | | | | | |
| | | | | | |
| | | | | | |
Personal care products: 0.67% | | | | | | |
| | | | | | |
The accompanying notes are an integral part of these financial statements.
2 | Allspring Premier Large Company Growth Fund
Portfolio of investments—July 31, 2024
| | | | | |
| | | | | | |
| | | | | | |
| | | | | | |
Tradeweb Markets, Inc. Class A | | | | | | |
| | | | | | |
Financial services: 1.87% | | | | | | |
| | | | | | |
| | | | | | |
Kinsale Capital Group, Inc. | | | | | | |
| | | | | | |
| | | | | | |
| | | | | | |
| | | | | | |
| | | | | | |
Neurocrine Biosciences, Inc.† | | | | | | |
Vertex Pharmaceuticals, Inc.† | | | | | | |
| | | | | | |
Health care equipment & supplies: 2.34% | | | | | | |
| | | | | | |
Intuitive Surgical, Inc.† | | | | | | |
| | | | | | |
Life sciences tools & services: 1.17% | | | | | | |
Thermo Fisher Scientific, Inc. | | | | | | |
| | | | | | |
| | | | | | |
| | | | | | |
| | | | | | |
| | | | | | |
Aerospace & defense: 2.92% | | | | | | |
| | | | | | |
| | | | | | |
| | | | | | |
| | | | | | |
Commercial services & supplies: 2.18% | | | | | | |
| | | | | | |
| | | | | | |
| | | | | | |
Construction & engineering: 1.48% | | | | | | |
| | | | | | |
The accompanying notes are an integral part of these financial statements.
Allspring Premier Large Company Growth Fund | 3
Portfolio of investments—July 31, 2024
| | | | | |
Electrical equipment: 2.24% | | | | | | |
| | | | | | |
| | | | | | |
| | | | | | |
Ground transportation: 1.72% | | | | | | |
| | | | | | |
Information technology: 39.14% | | | | | | |
Communications equipment: 1.98% | | | | | | |
| | | | | | |
Semiconductors & semiconductor equipment: 13.57% | | | | | | |
| | | | | | |
Microchip Technology, Inc. | | | | | | |
Monolithic Power Systems, Inc. | | | | | | |
| | | | | | |
| | | | | | |
| | | | | | |
| | | | | | |
Cadence Design Systems, Inc.† | | | | | | |
| | | | | | |
| | | | | | |
| | | | | | |
| | | | | | |
Palo Alto Networks, Inc.† | | | | | | |
| | | | | | |
| | | | | | |
| | | | | | |
Technology hardware, storage & peripherals: 3.62% | | | | | | |
| | | | | | |
| | | | | | |
| | | | | | |
| | | | | | |
| | | | | | |
Electric utilities: 1.14% | | | | | | |
| | | | | | |
Total common stocks (Cost $644,022,899) | | | | | | |
The accompanying notes are an integral part of these financial statements.
4 | Allspring Premier Large Company Growth Fund
Portfolio of investments—July 31, 2024
| | | | | |
Short-term investments: 0.08% | | | | | | |
Investment companies: 0.08% | | | | | | |
Allspring Government Money Market Fund Select Class♠∞ | | | | | | |
Total short-term investments (Cost $1,141,038) | | | | | | |
Total investments in securities (Cost $645,163,937) | | | | | | |
Other assets and liabilities, net | | | | | | |
| | | | | | |
| Non-income-earning security |
| The issuer of the security is an affiliated person of the Fund as defined in the Investment Company Act of 1940. |
| The rate represents the 7-day annualized yield at period end. |
|
| American depositary receipt |
Investments in affiliates
An affiliated investment is an investment in which the Fund owns at least 5% of the outstanding voting shares of the issuer or as a result of other relationships, such as the Fund and the issuer having the same investment manager. Transactions with issuers that were affiliates of the Fund at the end of the period were as follows:
| | | | | Net
change in
unrealized
gains
(losses) | | | Income
from
affiliated
securities |
| | | | | | | | |
Allspring Government Money Market Fund Select Class | | | | | | | | |
The accompanying notes are an integral part of these financial statements.
Allspring Premier Large Company Growth Fund | 5
Statement of assets and liabilities—July 31, 2024
Financial statements
Statement of assets and liabilities
| |
Investments in unaffiliated securities, at value (cost $644,022,899) | |
Investments in affiliated securities, at value (cost $1,141,038) | |
| |
Receivable for investments sold | |
Receivable for Fund shares sold | |
| |
Prepaid expenses and other assets | |
| |
| |
Payable for investments purchased | |
| |
Payable for Fund shares redeemed | |
Shareholder servicing fee payable | |
Administration fees payable | |
| |
Accrued expenses and other liabilities | |
| |
| |
| |
| |
Total distributable earnings | |
| |
Computation of net asset value and offering price per share | |
| |
Shares outstanding–Class A1 | |
Net asset value per share–Class A | |
Maximum offering price per share – Class A2 | |
| |
Shares outstanding–Class C1 | |
Net asset value per share–Class C | |
| |
Shares outstanding–Class R61 | |
Net asset value per share–Class R6 | |
Net assets–Administrator Class | |
Shares outstanding–Administrator Class1 | |
Net asset value per share–Administrator Class | |
Net assets–Institutional Class | |
Shares outstanding–Institutional Class1 | |
Net asset value per share–Institutional Class | |
1 The Fund has an unlimited number of authorized shares.
2 Maximum offering price is computed as 100/94.25 of net asset value. On investments of $50,000 or more, the offering price is reduced.
The accompanying notes are an integral part of these financial statements.
6 | Allspring Premier Large Company Growth Fund
Statement of operations—year ended July 31, 2024
Statement of operations
| |
Dividends (net of foreign withholdings taxes of $15,544) | |
Income from affiliated securities | |
Interest (net of foreign withholding taxes of $17,735) | |
| |
| |
| |
| |
| |
| |
| |
| |
| |
Shareholder servicing fees | |
| |
| |
| |
| |
| |
Custody and accounting fees | |
| |
| |
Shareholder report expenses | |
Trustees’ fees and expenses | |
| |
| |
Less: Fee waivers and/or expense reimbursements | |
| |
| |
| |
| |
| |
| |
| |
| |
Realized and unrealized gains (losses) on investments | |
| |
| |
Foreign currency and foreign currency translations | |
Net realized gains on investments | |
Net change in unrealized gains (losses) on investments | |
Net realized and unrealized gains (losses) on investments | |
Net increase in net assets resulting from operations | |
The accompanying notes are an integral part of these financial statements.
Allspring Premier Large Company Growth Fund | 7
Statement of changes in net assets
Statement of changes in net assets
| | |
| | | | |
| | | | |
Net realized gains on investments | | | | |
Net change in unrealized gains (losses) on investments | | | | |
Net increase in net assets resulting from operations | | | | |
Distributions to shareholders from | | | | |
Net investment income and net realized gains | | | | |
| | | | |
| | | | |
| | | | |
| | | | |
| | | | |
Total distributions to shareholders | | | | |
Capital share transactions | | | | |
Proceeds from shares sold | | | | |
| | | | |
| | | | |
| | | | |
| | | | |
| | | | |
| | | | |
| | | | |
Reinvestment of distributions | | | | |
| | | | |
| | | | |
| | | | |
| | | | |
| | | | |
| | | | |
Payment for shares redeemed | | | | |
| | | | |
| | | | |
| | | | |
| | | | |
| | | | |
| | | | |
| | | | |
1 For the period from August 1, 2022 to June 16, 2023. Effective at the close of business on June 16, 2023, Class R4 shares were converted to Institutional Class shares and are no longer offered by the Fund.
The accompanying notes are an integral part of these financial statements.
8 | Allspring Premier Large Company Growth Fund
Statement of changes in net assets
Statement of changes in net assets
| | |
| | | | |
| | | | |
| | | | |
| | | | |
| | | | |
Net decrease in net assets resulting from capital share transactions | | | | |
Total decrease in net assets | | | | |
| | | | |
| | | | |
| | | | |
2 Effective at the close of business on June 16, 2023, Class R4 shares were converted to Institutional Class shares and are no longer offered by the Fund.
The accompanying notes are an integral part of these financial statements.
Allspring Premier Large Company Growth Fund | 9
Financial highlights
(For a share outstanding throughout each period)
| |
| | | | | |
Net asset value, beginning of period | | | | | |
| | | | | |
Net realized and unrealized gains (losses) on investments | | | | | |
Total from investment operations | | | | | |
Distributions to shareholders from | | | | | |
| | | | | |
Net asset value, end of period | | | | | |
| | | | | |
Ratios to average net assets (annualized) | | | | | |
| | | | | |
| | | | | |
| | | | | |
| | | | | |
| | | | | |
Net assets, end of period (000s omitted) | | | | | |
| Calculated based upon average shares outstanding |
| Total return calculations do not include any sales charges. Returns include adjustments required by U.S. GAAP and may differ from net asset values and performance reported elsewhere. |
The accompanying notes are an integral part of these financial statements.
10 | Allspring Premier Large Company Growth Fund
(For a share outstanding throughout each period)
| |
| | | | | |
Net asset value, beginning of period | | | | | |
| | | | | |
Net realized and unrealized gains (losses) on investments | | | | | |
Total from investment operations | | | | | |
Distributions to shareholders from | | | | | |
| | | | | |
Net asset value, end of period | | | | | |
| | | | | |
Ratios to average net assets (annualized) | | | | | |
| | | | | |
| | | | | |
| | | | | |
| | | | | |
| | | | | |
Net assets, end of period (000s omitted) | | | | | |
| Calculated based upon average shares outstanding |
| Total return calculations do not include any sales charges. Returns include adjustments required by U.S. GAAP and may differ from net asset values and performance reported elsewhere. |
The accompanying notes are an integral part of these financial statements.
Allspring Premier Large Company Growth Fund | 11
(For a share outstanding throughout each period)
| |
| | | | | |
Net asset value, beginning of period | | | | | |
| | | | | |
Net realized and unrealized gains (losses) on investments | | | | | |
Total from investment operations | | | | | |
Distributions to shareholders from | | | | | |
| | | | | |
Net asset value, end of period | | | | | |
| | | | | |
Ratios to average net assets (annualized) | | | | | |
| | | | | |
| | | | | |
| | | | | |
| | | | | |
| | | | | |
Net assets, end of period (000s omitted) | | | | | |
| Calculated based upon average shares outstanding |
| Returns include adjustments required by U.S. GAAP and may differ from net asset values and performance reported elsewhere. |
The accompanying notes are an integral part of these financial statements.
12 | Allspring Premier Large Company Growth Fund
(For a share outstanding throughout each period)
| |
| | | | | |
Net asset value, beginning of period | | | | | |
| | | | | |
Net realized and unrealized gains (losses) on investments | | | | | |
Total from investment operations | | | | | |
Distributions to shareholders from | | | | | |
| | | | | |
Net asset value, end of period | | | | | |
| | | | | |
Ratios to average net assets (annualized) | | | | | |
| | | | | |
| | | | | |
| | | | | |
| | | | | |
| | | | | |
Net assets, end of period (000s omitted) | | | | | |
| Calculated based upon average shares outstanding |
| Returns include adjustments required by U.S. GAAP and may differ from net asset values and performance reported elsewhere. |
The accompanying notes are an integral part of these financial statements.
Allspring Premier Large Company Growth Fund | 13
(For a share outstanding throughout each period)
| |
| | | | | |
Net asset value, beginning of period | | | | | |
| | | | | |
Net realized and unrealized gains (losses) on investments | | | | | |
Total from investment operations | | | | | |
Distributions to shareholders from | | | | | |
| | | | | |
Net asset value, end of period | | | | | |
| | | | | |
Ratios to average net assets (annualized) | | | | | |
| | | | | |
| | | | | |
| | | | | |
| | | | | |
| | | | | |
Net assets, end of period (000s omitted) | | | | | |
| Calculated based upon average shares outstanding |
| Returns include adjustments required by U.S. GAAP and may differ from net asset values and performance reported elsewhere. |
The accompanying notes are an integral part of these financial statements.
14 | Allspring Premier Large Company Growth Fund
Notes to financial statements
Notes to financial statements
Allspring Funds Trust (the “Trust”), a Delaware statutory trust organized on March 10, 1999, is an open-end management investment company registered under the Investment Company Act of 1940, as amended (the “1940 Act”). As an investment company, the Trust follows the accounting and reporting guidance in Financial Accounting Standards Board (“FASB”) Accounting Standards Codification Topic 946, Financial Services – Investment Companies. These financial statements report on the Allspring Premier Large Company Growth Fund (the “Fund”) which is a diversified series of the Trust.
Effective at the close of business on June 16, 2023, Class R4 shares became Institutional Class shares in a tax-free conversion. Shareholders of Class R4 received Institutional Class shares at a value equal to the value of their Class R4 shares immediately prior to the conversion. Class R4 shares are no longer offered by the Fund.
2.
SIGNIFICANT ACCOUNTING POLICIES
The following significant accounting policies, which are consistently followed in the preparation of the financial statements of the Fund, are in conformity with U.S. generally accepted accounting principles (“GAAP”) which require management to make estimates and assumptions that affect the reported amounts of assets and liabilities, disclosure of contingent assets and liabilities at the date of the financial statements, and the reported amounts of income and expenses during the reporting period. Actual results could differ from those estimates.
All investments are valued each business day as of the close of regular trading on the New York Stock Exchange (generally 4 p.m. Eastern Time), although the Fund may deviate from this calculation time under unusual or unexpected circumstances.
Equity securities and exchange-traded funds that are listed on a foreign or domestic exchange or market are valued at the official closing price or, if none, the last sales price.
Investments in registered open-end investment companies (other than those listed on a foreign or domestic exchange or market) are valued at net asset value.
Investments which are not valued using the methods discussed above are valued at their fair value, as determined in good faith by Allspring Funds Management, LLC (“Allspring Funds Management”), which was named the valuation designee by the Board of Trustees. As the valuation designee, Allspring Funds Management is responsible for day-to-day valuation activities for the Allspring Funds. In connection with these responsibilities, Allspring Funds Management has established a Valuation Committee and has delegated to it the authority to take any actions regarding the valuation of portfolio securities that the Valuation Committee deems necessary or appropriate, including determining the fair value of portfolio securities. On a quarterly basis, the Board of Trustees receives reports of valuation actions taken by the Valuation Committee. On at least an annual basis, the Board of Trustees receives an assessment of the adequacy and effectiveness of Allspring Funds Management’s process for determining the fair value of the portfolio of investments.
Foreign currency translation
The accounting records of the Fund are maintained in U.S. dollars. The values of other assets and liabilities denominated in foreign currencies are translated into U.S. dollars at rates provided by an independent foreign currency pricing source at a time each business day specified by the Valuation Committee. Purchases and sales of securities, and income and expenses are converted at the rate of exchange on the respective dates of such transactions. Net realized foreign exchange gains or losses arise from sales of foreign currencies, currency gains or losses realized between the trade and settlement dates on securities transactions, and the difference between the amounts of dividends, interest and foreign withholding taxes recorded and the U.S. dollar equivalent of the amounts actually paid or received. Net unrealized foreign exchange gains and losses arise from changes in the fair value of assets and liabilities other than investments in securities resulting from changes in exchange rates. The changes in net assets arising from changes in exchange rates of securities and the changes in net assets resulting from changes in market prices of securities are not separately presented. Such changes are included in net realized and unrealized gains or losses from investments.
Security transactions and income recognition
Securities transactions are recorded on a trade date basis. Realized gains or losses are recorded on the basis of identified cost.
Dividend income is recognized on the ex-dividend date. Dividend income is recorded net of foreign taxes withheld where recovery of such taxes is not assured.
Interest earned on cash balances held at the custodian is recorded as interest income.
Income from foreign securities is recorded net of foreign taxes withheld where recovery of such taxes is not assured.
Distributions to shareholders
Distributions to shareholders from net investment income and any net realized gains are recorded on the ex-dividend date and paid at least annually. Such distributions are determined in accordance with income tax regulations and may differ from U.S. GAAP. Dividend sources are estimated at the time
Allspring Premier Large Company Growth Fund | 15
Notes to financial statements
of declaration. The tax character of distributions is determined as of the Fund’s fiscal year end. Therefore, a portion of the Fund’s distributions made prior to the Fund’s fiscal year end may be categorized as a tax return of capital at year end.
The Fund intends to continue to qualify as a regulated investment company by distributing substantially all of its investment company taxable income and any net realized capital gains (after reduction for capital loss carryforwards) sufficient to relieve it from all, or substantially all, federal income taxes. Accordingly, no provision for federal income taxes was required.
The Fund’s income and federal excise tax returns and all financial records supporting those returns for the prior three fiscal years are subject to examination by the federal and Delaware revenue authorities. Management has analyzed the Fund’s tax positions taken on federal, state, and foreign tax returns, as applicable, for all open tax years and does not believe that there are any uncertain tax positions that require recognition of a tax liability.
As of July 31, 2024, the aggregate cost of all investments for federal income tax purposes was $648,149,569 and the unrealized gains (losses) consisted of:
The separate classes of shares offered by the Fund differ principally in applicable sales charges, distribution, shareholder servicing, and administration fees. Class specific expenses are charged directly to that share class. Investment income, common fund-level expenses, and realized and unrealized gains (losses) on investments are allocated daily to each class of shares based on the relative proportion of net assets of each class.
3.
FAIR VALUATION MEASUREMENTS
Fair value measurements of investments are determined within a framework that has established a fair value hierarchy based upon the various data inputs utilized in determining the value of the Fund’s investments. The three-level hierarchy gives the highest priority to unadjusted quoted prices in active markets for identical assets or liabilities (Level 1) and the lowest priority to unobservable inputs (Level 3). The Fund’s investments are classified within the fair value hierarchy based on the lowest level of input that is significant to the fair value measurement. The inputs are summarized into three broad levels as follows:
•Level 1—quoted prices in active markets for identical securities
•Level 2—other significant observable inputs (including quoted prices for similar securities, interest rates, prepayment speeds, credit risk, etc.)
•Level 3—significant unobservable inputs (including the Fund’s own assumptions in determining the fair value of investments)
The inputs or methodologies used for valuing investments in securities are not necessarily an indication of the risk associated with investing in those securities.
The following is a summary of the inputs used in valuing the Fund’s assets and liabilities as of July 31, 2024:
| | Other significant
observable inputs
(Level 2) | Significant
unobservable inputs
(Level 3) | |
| | | | |
| | | | |
| | | | |
| | | | |
| | | | |
| | | | |
| | | | |
| | | | |
| | | | |
| | | | |
| | | | |
| | | | |
| | | | |
| | | | |
| | | | |
16 | Allspring Premier Large Company Growth Fund
Notes to financial statements
Additional sector, industry or geographic detail, if any, is included in the Portfolio of Investments.
At July 31, 2024, the Fund did not have any transfers into/out of Level 3.
4.
TRANSACTIONS WITH AFFILIATES
Allspring Funds Management, a wholly owned subsidiary of Allspring Global Investments Holdings, LLC, a holding company indirectly owned by certain private funds of GTCR LLC and Reverence Capital Partners, L.P., is the manager of the Fund and provides advisory and fund-level administrative services under an investment management agreement. Under the investment management agreement, Allspring Funds Management is responsible for, among other services, implementing the investment objectives and strategies of the Fund, supervising the subadviser and providing fund-level administrative services in connection with the Fund’s operations. As compensation for its services under the investment management agreement, Allspring Funds Management is entitled to receive a management fee at the following annual rate based on the Fund’s average daily net assets:
For the year ended July 31, 2024, the management fee was equivalent to an annual rate of 0.68% of the Fund’s average daily net assets.
Allspring Funds Management has retained the services of a subadviser to provide daily portfolio management to the Fund. The fee for subadvisory services is borne by Allspring Funds Management. Allspring Global Investments, LLC, an affiliate of Allspring Funds Management and a wholly owned subsidiary of Allspring Global Investments Holdings, LLC, is the subadviser to the Fund and is entitled to receive a fee from Allspring Funds Management at an annual rate starting at 0.35% and declining to 0.275% as the average daily net assets of the Fund increase.
Under a class-level administration agreement, Allspring Funds Management provides class-level administrative services to the Fund, which includes paying fees and expenses for services provided by the transfer agent, sub-transfer agents, omnibus account servicers and record-keepers. As compensation for its services under the class-level administration agreement, Allspring Funds Management receives an annual fee which is calculated based on the average daily net assets of each class as follows:
| Class-level
administration fee |
| |
| |
| |
| |
| |
Waivers and/or expense reimbursements
Allspring Funds Management has contractually committed to waive and/or reimburse management and administration fees to the extent necessary to maintain certain net operating expense ratios for the Fund. When each class of the Fund has exceeded its expense cap, Allspring Funds Management will waive fees and/or reimburse expenses from fund-level expenses on a proportionate basis and then from class specific expenses. When only certain classes exceed their expense caps, waivers and/or reimbursements are applied against class specific expenses before fund-level expenses. Allspring Funds Management has contractually committed through November 30, 2024 to waive fees and/or reimburse expenses to the extent necessary to cap the Fund’s expenses. Prior to or after the commitment expiration date, the cap may be increased or the commitment to maintain the cap may be terminated only with the approval of the Board of Trustees. As of July 31, 2024, the contractual caps are as follows:
Allspring Premier Large Company Growth Fund | 17
Notes to financial statements
The Trust has adopted a distribution plan for Class C shares pursuant to Rule 12b-1 under the 1940 Act. A distribution fee is charged to Class C shares and paid to Allspring Funds Distributor, LLC (“Allspring Funds Distributor”), the principal underwriter, an affiliate of Allspring Funds Management, at an annual rate up to 0.75% of the average daily net assets of Class C shares.
In addition, Allspring Funds Distributor is entitled to receive the front-end sales charge from the purchase of Class A shares and a contingent deferred sales charge on the redemption of certain Class A shares. Allspring Funds Distributor is also entitled to receive the contingent deferred sales charges from redemptions of Class C shares. For the year ended July 31, 2024, Allspring Funds Distributor received $12,059 from the sale of Class A shares. No contingent deferred sales charges were incurred by Class A and Class C shares for the year ended July 31, 2024.
Shareholder servicing fees
The Trust has entered into contracts with one or more shareholder servicing agents, whereby Class A, Class C and Administrator Class are charged a fee at an annual rate up to 0.25% of the average daily net assets of each respective class. A portion of these total shareholder servicing fees were paid to affiliates of the Fund.
The Fund may purchase or sell portfolio investment securities to certain affiliates pursuant to Rule 17a-7 under the 1940 Act and under procedures adopted by the Board of Trustees. The procedures have been designed to ensure that these interfund transactions, which do not incur broker commissions, are effected at current market prices. Pursuant to these procedures, the Fund did not have any interfund transactions during the year ended July 31, 2024.
5.
INVESTMENT PORTFOLIO TRANSACTIONS
Purchases and sales of investments, excluding U.S. government obligations (if any) and short-term securities, for the year ended July 31, 2024 were $660,502,393 and $1,716,833,439, respectively.
The Trust (excluding the money market funds), Allspring Master Trust and Allspring Variable Trust are parties to a $275,000,000 (prior to July 9, 2024: $350,000,000), revolving credit agreement whereby the Fund is permitted to use bank borrowings for temporary or emergency purposes, such as to fund shareholder redemption requests. Interest under the credit agreement is charged to the Fund based on a borrowing rate equal to the higher of the Federal Funds rate or the overnight bank funding rate in effect on that day plus a spread. In addition, an annual commitment fee based on the unused balance is allocated to each participating fund.
For the year ended July 31, 2024, there were no borrowings by the Fund under the agreement.
7.
DISTRIBUTIONS TO SHAREHOLDERS
The tax character of distributions paid were as follows:
As of July 31, 2024, the components of distributable earnings on a tax basis were as follows:
Undistributed
ordinary
income | Undistributed
long-term
gain | |
| | |
18 | Allspring Premier Large Company Growth Fund
Notes to financial statements
As of the end of the period, the Fund concentrated its portfolio of investments in the information technology sector. A fund that invests a substantial portion of its assets in any sector may be more affected by changes in that sector than would be a fund whose investments are not heavily weighted in any sector.
Under the Fund’s organizational documents, the officers and Trustees have been granted certain indemnification rights against certain liabilities that may arise out of performance of their duties to the Fund. The Fund has entered into a separate agreement with each Trustee that converts indemnification rights currently existing under the Fund’s organizational documents into contractual rights that cannot be changed in the future without the consent of the Trustee. Additionally, in the normal course of business, the Fund may enter into contracts with service providers that contain a variety of indemnification clauses. The Fund’s maximum exposure under these arrangements is dependent on future claims that may be made against the Fund and, therefore, cannot be estimated.
Allspring Premier Large Company Growth Fund | 19
Report of independent registered public accounting firm
To the Shareholders of the Fund and Board of Trustees
Allspring Funds Trust:
Opinion on the Financial Statements
We have audited the accompanying statement of assets and liabilities of Allspring Premier Large Company Growth Fund (the Fund), one of the funds constituting Allspring Funds Trust, including the portfolio of investments, as of July 31, 2024, the related statement of operations for the year then ended, the statements of changes in net assets for each of the years in the two-year period then ended, and the related notes (collectively, the financial statements) and the financial highlights for each of the years in the five-year period then ended. In our opinion, the financial statements and financial highlights present fairly, in all material respects, the financial position of the Fund as of July 31, 2024, the results of its operations for the year then ended, the changes in its net assets for each of the years in the two-year period then ended, and the financial highlights for each of the years in the five-year period then ended, in conformity with U.S. generally accepted accounting principles.
These financial statements and financial highlights are the responsibility of the Fund’s management. Our responsibility is to express an opinion on these financial statements and financial highlights based on our audits. We are a public accounting firm registered with the Public Company Accounting Oversight Board (United States) (PCAOB) and are required to be independent with respect to the Fund in accordance with the U.S. federal securities laws and the applicable rules and regulations of the Securities and Exchange Commission and the PCAOB.
We conducted our audits in accordance with the standards of the PCAOB. Those standards require that we plan and perform the audit to obtain reasonable assurance about whether the financial statements and financial highlights are free of material misstatement, whether due to error or fraud. Our audits included performing procedures to assess the risks of material misstatement of the financial statements and financial highlights, whether due to error or fraud, and performing procedures that respond to those risks. Such procedures included examining, on a test basis, evidence regarding the amounts and disclosures in the financial statements and financial highlights. Such procedures also included confirmation of securities owned as of July 31, 2024, by correspondence with the custodian, transfer agent and brokers, or by other appropriate auditing procedures. Our audits also included evaluating the accounting principles used and significant estimates made by management, as well as evaluating the overall presentation of the financial statements and financial highlights. We believe that our audits provide a reasonable basis for our opinion.

We have not been able to determine the specific year that we began serving as the auditor of one or more Allspring Funds investment companies; however, we are aware that we have served as the auditor of one or more Allspring Funds investment companies since at least 1955.
September 25, 2024
20 | Allspring Premier Large Company Growth Fund
Other information (unaudited)
Other information
For corporate shareholders, pursuant to Section 854 of the Internal Revenue Code, 17% of ordinary income dividends qualify for the corporate dividends-received deduction for the fiscal year ended July 31, 2024.
Pursuant to Section 852 of the Internal Revenue Code, $465,906,071 was designated as a 20% rate gain distribution for the fiscal year ended
July 31, 2024.
For the fiscal year ended July 31, 2024, $4,042,033 has been designated as short-term capital gain dividends for nonresident alien shareholders pursuant to Section 871 of the Internal Revenue Code.
A description of the policies and procedures used to determine how to vote proxies relating to portfolio securities is available without charge, upon request, by calling 1-866-259-3305, visiting our website at allspringglobal.com, or visiting the SEC website at sec.gov. Information regarding how the proxies related to portfolio securities were voted during the most recent 12-month period ended June 30 is available on the website at allspringglobal.com or by visiting the SEC website at sec.gov.
Quarterly portfolio holdings information
The Fund files its complete schedule of portfolio holdings with the SEC for the first and third quarters of each fiscal year as an exhibit to its reports on Form N-PORT. Shareholders may view the filed Form N-PORT by visiting the SEC website at sec.gov.
Allspring Premier Large Company Growth Fund | 21
Other information (unaudited)
Item 8. Changes in and disagreements with accountants
Item 9. Matters submitted to fund shareholders for a vote
Item 10. Remuneration paid to directors, officers and others
Refer to information in the Statement of operations.
22 | Allspring Premier Large Company Growth Fund
Other information (unaudited)
Item 11. Statement regarding basis for the board’s approval of investment advisory contract
Board Consideration of Investment Management and Sub-Advisory Agreements:
Under the Investment Company Act of 1940 (the “1940 Act”), the Board of Trustees (the “Board”) of Allspring Funds Trust (the “Trust”) must determine annually whether to approve the continuation of the Trust’s investment management and sub-advisory agreements. In this regard, at a Board meeting held on May 28-30, 2024 (the “Meeting”), the Board, all the members of which have no direct or indirect interest in the investment management and sub-advisory agreements and are not “interested persons” of the Trust, as defined in the 1940 Act (the “Independent Trustees”), reviewed and approved for the Allspring Premier Large Company Growth Fund (the “Fund”): (i) an investment management agreement (the “Management Agreement”) with Allspring Funds Management, LLC (“Allspring Funds Management”); and (ii) an investment sub-advisory agreement (the “Sub-Advisory Agreement”) with Allspring Global Investments, LLC (the “Sub-Adviser”), an affiliate of Allspring Funds Management. The Management Agreement and the Sub-Advisory Agreement are collectively referred to as the “Advisory Agreements.”
At the Meeting, the Board considered the factors and reached the conclusions described below relating to the selection of Allspring Funds Management and the Sub-Adviser and the approval of the Advisory Agreements. Prior to the Meeting, including at a meeting of the Board held in April 2024, and at the Meeting, the Trustees conferred extensively among themselves and with representatives of Allspring Funds Management about these matters. The Board has adopted a team-based approach, with each team consisting of a sub-set of Trustees, to assist the full Board in the discharge of its duties in reviewing investment performance and other matters throughout the year. The Independent Trustees were assisted in their evaluation of the Advisory Agreements by independent legal counsel, from whom they received separate legal advice and with whom they met separately.
In providing information to the Board, Allspring Funds Management and the Sub-Adviser were guided by a detailed set of requests for information submitted to them by independent legal counsel on behalf of the Independent Trustees at the start of the Board’s annual contract renewal process earlier in 2024. In considering and approving the Advisory Agreements, the Trustees considered the information they believed relevant, including but not limited to the information discussed below. The Board considered not only the specific information presented in connection with the Meeting, but also the knowledge gained over time through interactions with Allspring Funds Management and the Sub-Adviser about various topics. In this regard, the Board reviewed reports of Allspring Funds Management at each of its quarterly meetings, which included, among other things, portfolio reviews and investment performance reports. In addition, the Board and the teams mentioned above confer with portfolio managers at various times throughout the year. The Board did not identify any particular information or consideration that was all-important or controlling, and each individual Trustee may have attributed different weights to various factors.
After its deliberations, the Board unanimously determined that the compensation payable to Allspring Funds Management and the Sub-Adviser under each of the Advisory Agreements was reasonable, and approved the continuation of the Advisory Agreements for a one-year term. The Board considered the approval of the Advisory Agreements for the Fund as part of its consideration of agreements for funds across the complex, but its approvals were made on a fund-by-fund basis. The following summarizes a number of important, but not necessarily all, factors considered by the Board in support of its approvals.
Nature, extent, and quality of services
The Board received and considered various information regarding the nature, extent, and quality of services provided to the Fund by Allspring Funds Management and the Sub-Adviser under the Advisory Agreements. This information included a description of the investment advisory services and Fund-level administrative services covered by the Management Agreement, as well as, among other things, a summary of the background and experience of senior management of Allspring Global Investments, of which Allspring Funds Management and the Sub-Adviser are a part, and a summary of investments made in the Allspring Global Investments business.* The Board also received information about the services that continue to be provided by Wells Fargo & Co. and/or its affiliates (“Wells Fargo”) since the sale of Wells Fargo Asset Management to Allspring Global Investments Holdings, LLC, a holding company indirectly owned by certain private funds of GTCR LLC and Reverence Capital Partners, L.P., under a transition services agreement and an update on the anticipated timeline for exiting the transition services agreement. In addition, the Board received and considered information about the full range of services provided to the Fund by Allspring Funds Management and its affiliates.
The Board considered the qualifications, background, tenure, and responsibilities of each of the portfolio managers primarily responsible for the day-to-day portfolio management of the Fund. The Board noted that the portfolio managers responsible for the day-to-day portfolio management of the Fund would be changing during the Summer of 2024, and the Board considered the revised portfolio management team that would be taking over portfolio management responsibilities. The Board evaluated the ability of Allspring Funds Management and the Sub-Adviser to attract and retain qualified investment professionals, including research, advisory, and supervisory personnel.
*
The trade name for the asset management firm that includes Allspring Funds Management and the Sub-Adviser is “Allspring Global Investments.”
Allspring Premier Large Company Growth Fund | 23
Other information (unaudited)
The Board further considered the compliance programs and compliance records of Allspring Funds Management and the Sub-Adviser. The Board received and considered information about Allspring Global Investments’ risk management functions, which included information about Allspring Funds Management’s and the Sub-Adviser’s business continuity plans, their approaches to data privacy and cybersecurity, Allspring Funds Management’s role as administrator of the Fund’s liquidity risk management program, and fair valuation designee. The Board also received and considered information about Allspring Funds Management’s intermediary and vendor oversight program.
Fund investment performance and expenses
The Board considered the investment performance results for the Fund over various time periods ended December 31, 2023. The Board considered these results in comparison to the investment performance of funds in a universe that was determined by Broadridge Inc. (“Broadridge”) to be similar to the Fund (the “Universe”), and in comparison to the Fund’s benchmark index and to other comparative data. Broadridge is an independent provider of investment company data. The Board received a description of the methodology used by Broadridge to select the mutual funds in the performance Universe. The Board noted that the investment performance of the Fund (Administrator Class) was higher than the average investment performance of the Universe for all the one- and three-year periods under review, in range of the average investment performance of the Universe for the ten-year period under review, and lower for the five-year period under review. The Board also noted that the investment performance of the Fund was lower than the investment performance of its benchmark index, the Russell 1000 Growth Index, for all periods under review.
The Board also received and considered information regarding the Fund’s net operating expense ratios and their various components, including actual management fees, custodian and other non-management fees, and Rule 12b-1 and non-Rule 12b-1 shareholder service fees. The Board considered these ratios in comparison to the median ratios of funds in class-specific expense groups that were determined by Broadridge to be similar to the Fund (the “Groups”). The Board received a description of the methodology used by Broadridge to select the mutual funds in the expense Groups and an explanation of how funds comprising expense Groups and their expense ratios may vary from year-to-year. Based on the Broadridge reports, the Board noted that the net operating expense ratios of the Fund were lower than the median net operating expense ratios of the expense Groups for each share class.
The Board took into account the Fund’s investment performance and expense information provided to it among the factors considered in deciding to re-approve the Advisory Agreements.
Investment management and sub-advisory fee rates
The Board reviewed and considered the contractual fee rates payable by the Fund to Allspring Funds Management under the Management Agreement, as well as the contractual fee rates payable by the Fund to Allspring Funds Management for class-level administrative services under a Class-Level Administration Agreement, which include, among other things, class-level transfer agency and sub-transfer agency costs (collectively, the “Management Rates”). The Board also reviewed and considered the contractual investment sub-advisory fee rates payable by Allspring Funds Management to the Sub-Adviser for investment sub-advisory services. It was noted that advisory fee waivers, if any, are at the fund level and not class level.
Among other information reviewed by the Board was a comparison of the Fund’s Management Rates with the average contractual investment management fee rates of funds in the expense Groups at a common asset level as well as transfer agency costs of the funds in the expense Groups. The Board noted that the Management Rates of the Fund were lower than the sum of these average rates for the Fund’s expense Groups for each share class, except Class A, which was equal to the sum of the average rates for the expense Group.
The Board also received and considered information about the portion of the total management fee that was retained by Allspring Funds Management after payment of the fee to the Sub-Adviser for sub-advisory services. In assessing the reasonableness of this amount, the Board received and evaluated information about the nature and extent of responsibilities retained and risks assumed by Allspring Funds Management and not delegated to or assumed by the Sub-Adviser, and about Allspring Funds Management’s on-going oversight services. Given the affiliation between Allspring Funds Management and the Sub-Adviser, the Board ascribed limited relevance to the allocation of fees between them.
The Board also received and considered information about the nature and extent of services offered and fee rates charged by Allspring Funds Management and the Sub-Adviser to other types of clients with investment strategies similar to those of the Fund. In this regard, the Board received information about the significantly greater scope of services, and compliance, reporting and other legal and regulatory obligations and risks of managing proprietary mutual funds compared with those associated with managing assets of other types of clients, including third-party sub-advised fund clients and non-mutual fund clients such as institutional separate accounts.
Based on its consideration of the factors and information it deemed relevant, including those described here, the Board determined that the compensation payable to Allspring Funds Management under the Management Agreement and to the Sub-Adviser under the Sub-Advisory Agreement was reasonable.
24 | Allspring Premier Large Company Growth Fund
Other information (unaudited)
Profitability
The Board received and considered information concerning the profitability of Allspring Funds Management, as well as the profitability of Allspring Global Investments, from providing services to the fund complex as a whole. The Board noted that the Sub-Adviser’s profitability information with respect to providing services to the Fund and other funds in the complex was subsumed in the Allspring Global Investments profitability analysis.
Allspring Funds Management reported on the methodologies and estimates used in calculating profitability, including a description of the methodology used to allocate certain expenses. Among other things, the Board noted that the levels of profitability reported on a fund-by-fund basis varied widely, depending on factors such as the size, type, and age of fund.
Based on its review, the Board did not deem the profits reported by Allspring Funds Management or Allspring Global Investments from services provided to the Fund to be at a level that would prevent it from approving the continuation of the Advisory Agreements.
The Board received and considered information about the potential for Allspring Funds Management to experience economies of scale in the provision of management services to the Fund, the difficulties of isolating and quantifying economies of scale at an individual fund level, and the extent to which potential scale benefits are shared with Fund shareholders. The Board noted the existence of breakpoints in the Fund’s management fee structure, which operate generally to reduce the Fund’s expense ratios as the Fund grows in size, and the size of the Fund in relation to such breakpoints. The Board considered that in addition to management fee breakpoints, Allspring Funds Management shares potential economies of scale from its management business in a variety of ways, including through fee waiver and expense reimbursement arrangements, competitive management fee rates set at the outset without regard to breakpoints, and investments in the business intended to enhance services available to shareholders.
The Board concluded that Allspring Funds Management’s arrangements with respect to the Fund, including contractual breakpoints, constituted a reasonable approach to sharing potential economies of scale with the Fund and its shareholders.
Other benefits to Allspring Funds Management and the Sub-Adviser
The Board received and considered information regarding potential “fall-out” or ancillary benefits received by Allspring Funds Management and its affiliates, including the Sub-Adviser, as a result of their relationships with the Fund. Ancillary benefits could include, among others, benefits directly attributable to other relationships with the Fund and benefits potentially derived from an increase in Allspring Funds Management’s and the Sub-Adviser’s business as a result of their relationships with the Fund. The Board noted that Allspring Funds Distributor, LLC, an affiliate of Allspring Funds Management, receives distribution-related fees in respect of shares sold or held through it. The Board also reviewed information about soft dollar credits earned and utilized by the Sub-Adviser.
Based on its consideration of the factors and information it deemed relevant, including those described here, the Board did not find that any ancillary benefits received by Allspring Funds Management and its affiliates, including the Sub-Adviser, were unreasonable.
At the Meeting, after considering the above-described factors and based on its deliberations and its evaluation of the information described above, the Board unanimously determined that the compensation payable to Allspring Funds Management and the Sub-Adviser under each of the Advisory Agreements was reasonable, and approved the continuation of the Advisory Agreements for a one-year term.
Allspring Premier Large Company Growth Fund | 25
For more information
More information about Allspring Funds is available free upon request. To obtain literature, please write, visit the Fund’s website, or call:
Allspring Funds
P.O. Box 219967
Kansas City, MO 64121-9967
Website: allspringglobal.com
Individual investors: 1-800-222-8222
Retail investment professionals: 1-888-877-9275
Institutional investment professionals: 1-800-260-5969
This report and the financial statements contained herein are submitted for the general information of the shareholders of the Fund. If this report is used for promotional purposes, distribution of the report must be accompanied or preceded by a current prospectus. Before investing, please consider the investment objectives, risks, charges, and expenses of the investment. For a current prospectus and, if available, a summary prospectus, containing this information, call 1-800-222-8222 or visit the Fund’s website at allspringglobal.com. Read the prospectus carefully before you invest or send money.
Allspring Global InvestmentsTM is the trade name for the asset management firms of Allspring Global Investments Holdings, LLC, a holding company indirectly owned by certain private funds of GTCR LLC and Reverence Capital Partners, L.P. These firms include but are not limited to Allspring Global Investments, LLC, and Allspring Funds Management, LLC. Certain products managed by Allspring entities are distributed by Allspring Funds Distributor, LLC (a broker-dealer and Member FINRA/SIPC).
This material is for general informational and educational purposes only and is NOT intended to provide investment advice or a recommendation of any kind - including a recommendation for any specific investment, strategy, or plan.
© 2024 Allspring Global Investments Holdings, LLC. All rights reserved.
NCSR4325 07-24
Long Form Financial Statements
Annual Report
Allspring Growth Fund | 1
Portfolio of investments—July 31, 2024
| | | | | |
| | | | | | |
Communication services: 12.20% | | | | | | |
| | | | | | |
Live Nation Entertainment, Inc.† | | | | | | |
| | | | | | |
| | | | | | |
| | | | | | |
Interactive media & services: 10.67% | | | | | | |
| | | | | | |
| | | | | | |
Meta Platforms, Inc. Class A | | | | | | |
| | | | | | |
Consumer discretionary: 17.36% | | | | | | |
| | | | | | |
| | | | | | |
| | | | | | |
| | | | | | |
| | | | | | |
| | | | | | |
Hotels, restaurants & leisure: 4.42% | | | | | | |
| | | | | | |
Chipotle Mexican Grill, Inc.† | | | | | | |
| | | | | | |
DraftKings, Inc. Class A† | | | | | | |
| | | | | | |
| | | | | | |
| | | | | | |
Household durables: 0.70% | | | | | | |
| | | | | | |
| | | | | | |
Boot Barn Holdings, Inc.† | | | | | | |
O’Reilly Automotive, Inc.† | | | | | | |
| | | | | | |
Textiles, apparel & luxury goods: 0.61% | | | | | | |
| | | | | | |
| | | | | | |
Personal care products: 0.98% | | | | | | |
| | | | | | |
| | | | | | |
| | | | | | |
The accompanying notes are an integral part of these financial statements.
2 | Allspring Growth Fund
Portfolio of investments—July 31, 2024
| | | | | |
| | | | | | |
| | | | | | |
LPL Financial Holdings, Inc. | | | | | | |
| | | | | | |
Tradeweb Markets, Inc. Class A | | | | | | |
| | | | | | |
Financial services: 3.47% | | | | | | |
| | | | | | |
| | | | | | |
| | | | | | |
| | | | | | |
Kinsale Capital Group, Inc. | | | | | | |
| | | | | | |
| | | | | | |
| | | | | | |
| | | | | | |
Vertex Pharmaceuticals, Inc.† | | | | | | |
Health care equipment & supplies: 2.48% | | | | | | |
| | | | | | |
Intuitive Surgical, Inc.† | | | | | | |
| | | | | | |
| | | | | | |
Health care technology: 1.14% | | | | | | |
Veeva Systems, Inc. Class A† | | | | | | |
Life sciences tools & services: 0.48% | | | | | | |
| | | | | | |
| | | | | | |
| | | | | | |
| | | | | | |
| | | | | | |
| | | | | | |
Aerospace & defense: 1.30% | | | | | | |
| | | | | | |
| | | | | | |
| | | | | | |
Commercial services & supplies: 3.26% | | | | | | |
Casella Waste Systems, Inc. Class A† | | | | | | |
| | | | | | |
| | | | | | |
| | | | | | |
| | | | | | |
The accompanying notes are an integral part of these financial statements.
Allspring Growth Fund | 3
Portfolio of investments—July 31, 2024
| | | | | |
Construction & engineering: 1.08% | | | | | | |
| | | | | | |
Electrical equipment: 0.78% | | | | | | |
| | | | | | |
Ground transportation: 1.48% | | | | | | |
| | | | | | |
Professional services: 0.29% | | | | | | |
| | | | | | |
Information technology: 44.10% | | | | | | |
Communications equipment: 2.04% | | | | | | |
| | | | | | |
| | | | | | |
| | | | | | |
Electronic equipment, instruments & components: 0.52% | | | | | | |
Zebra Technologies Corp. Class A† | | | | | | |
| | | | | | |
| | | | | | |
Semiconductors & semiconductor equipment: 15.58% | | | | | | |
Advanced Micro Devices, Inc.† | | | | | | |
Allegro MicroSystems, Inc.† | | | | | | |
| | | | | | |
| | | | | | |
| | | | | | |
Microchip Technology, Inc. | | | | | | |
Monolithic Power Systems, Inc. | | | | | | |
| | | | | | |
| | | | | | |
| | | | | | |
Cadence Design Systems, Inc.† | | | | | | |
Clearwater Analytics Holdings, Inc. Class A† | | | | | | |
| | | | | | |
| | | | | | |
Manhattan Associates, Inc.† | | | | | | |
| | | | | | |
| | | | | | |
| | | | | | |
Palo Alto Networks, Inc.† | | | | | | |
| | | | | | |
| | | | | | |
| | | | | | |
Technology hardware, storage & peripherals: 6.39% | | | | | | |
| | | | | | |
The accompanying notes are an integral part of these financial statements.
4 | Allspring Growth Fund
Portfolio of investments—July 31, 2024
| | | | | |
| | | | | | |
| | | | | | |
| | | | | | |
| | | | | | |
| | | | | | |
Construction materials: 0.52% | | | | | | |
| | | | | | |
Total common stocks (Cost $1,571,458,661) | | | | | | |
| | | | | |
Short-term investments: 0.36% | | | | | | |
Investment companies: 0.36% | | | | | | |
Allspring Government Money Market Fund Select Class♠∞ | | | | | | |
Total short-term investments (Cost $13,492,505) | | | | | | |
Total investments in securities (Cost $1,584,951,166) | | | | | | |
Other assets and liabilities, net | | | | | | |
| | | | | | |
| Non-income-earning security |
| The issuer of the security is an affiliated person of the Fund as defined in the Investment Company Act of 1940. |
| The rate represents the 7-day annualized yield at period end. |
|
| American depositary receipt |
Investments in affiliates
An affiliated investment is an investment in which the Fund owns at least 5% of the outstanding voting shares of the issuer or as a result of other relationships, such as the Fund and the issuer having the same investment manager. Transactions with issuers that were affiliates of the Fund at the end of the period were as follows:
| | | | | Net
change in
unrealized
gains
(losses) | | | Income
from
affiliated
securities |
| | | | | | | | |
Allspring Government Money Market Fund Select Class | | | | | | | | |
The accompanying notes are an integral part of these financial statements.
Allspring Growth Fund | 5
Statement of assets and liabilities—July 31, 2024
Financial statements
Statement of assets and liabilities
| |
Investments in unaffiliated securities, at value (cost $1,571,458,661) | |
Investments in affiliated securities, at value (cost $13,492,505) | |
Receivable for investments sold | |
Receivable for Fund shares sold | |
| |
Prepaid expenses and other assets | |
| |
| |
Payable for investments purchased | |
Payable for Fund shares redeemed | |
| |
Shareholder servicing fees payable | |
Administration fees payable | |
| |
Accrued expenses and other liabilities | |
| |
| |
| |
| |
Total distributable earnings | |
| |
Computation of net asset value and offering price per share | |
| |
Shares outstanding–Class A1 | |
Net asset value per share–Class A | |
Maximum offering price per share – Class A2 | |
| |
Shares outstanding–Class C1 | |
Net asset value per share–Class C | |
| |
Shares outstanding–Class R61 | |
Net asset value per share–Class R6 | |
Net assets–Administrator Class | |
Shares outstanding–Administrator Class1 | |
Net asset value per share–Administrator Class | |
Net assets–Institutional Class | |
Shares outstanding–Institutional Class1 | |
Net asset value per share–Institutional Class | |
1 The Fund has an unlimited number of authorized shares.
2 Maximum offering price is computed as 100/94.25 of net asset value. On investments of $50,000 or more, the offering price is reduced.
The accompanying notes are an integral part of these financial statements.
6 | Allspring Growth Fund
Statement of operations—year ended July 31, 2024
Statement of operations
| |
Dividends (net of foreign withholdings taxes of $9,094) | |
Income from affiliated securities | |
| |
| |
| |
| |
| |
| |
| |
| |
| |
| |
Shareholder servicing fees | |
| |
| |
| |
| |
| |
Custody and accounting fees | |
| |
| |
Shareholder report expenses | |
Trustees’ fees and expenses | |
| |
| |
Less: Fee waivers and/or expense reimbursements | |
| |
| |
| |
| |
| |
| |
| |
| |
Realized and unrealized gains (losses) on investments | |
Net realized gains on investments | |
Net change in unrealized gains (losses) on investments | |
Net realized and unrealized gains (losses) on investments | |
Net increase in net assets resulting from operations | |
The accompanying notes are an integral part of these financial statements.
Allspring Growth Fund | 7
Statement of changes in net assets
Statement of changes in net assets
| | |
| | | | |
| | | | |
Net realized gains on investments | | | | |
Net change in unrealized gains (losses) on investments | | | | |
Net increase in net assets resulting from operations | | | | |
Distributions to shareholders from | | | | |
Net investment income and net realized gains | | | | |
| | | | |
| | | | |
| | | | |
| | | | |
| | | | |
Total distributions to shareholders | | | | |
Capital share transactions | | | | |
Proceeds from shares sold | | | | |
| | | | |
| | | | |
| | | | |
| | | | |
| | | | |
| | | | |
Reinvestment of distributions | | | | |
| | | | |
| | | | |
| | | | |
| | | | |
| | | | |
| | | | |
Payment for shares redeemed | | | | |
| | | | |
| | | | |
| | | | |
| | | | |
| | | | |
| | | | |
Net asset value of shares issued in acquisition | | | | |
| | | | |
| | | | |
| | | | |
| | | | |
| | | | |
Net increase (decrease) in net assets resulting from capital share transactions | | | | |
Total increase (decrease) in net assets | | | | |
| | | | |
| | | | |
| | | | |
The accompanying notes are an integral part of these financial statements.
8 | Allspring Growth Fund
Financial highlights
(For a share outstanding throughout each period)
| |
| | | | | |
Net asset value, beginning of period | | | | | |
| | | | | |
| | | | | |
Net realized and unrealized gains (losses) on investments | | | | | |
Total from investment operations | | | | | |
Distributions to shareholders from | | | | | |
| | | | | |
Net asset value, end of period | | | | | |
| | | | | |
Ratios to average net assets (annualized) | | | | | |
| | | | | |
| | | | | |
| | | | | |
| | | | | |
| | | | | |
Net assets, end of period (000s omitted) | | | | | |
| Calculated based upon average shares outstanding |
| Amount is less than $0.005. |
| Total return calculations do not include any sales charges. Returns include adjustments required by U.S. GAAP and may differ from net asset values and performance reported elsewhere. |
| During the year ended July 31, 2021, the Fund received a payment from an affiliate which had a 0.01% impact on the total return. |
The accompanying notes are an integral part of these financial statements.
Allspring Growth Fund | 9
(For a share outstanding throughout each period)
| |
| | | | | |
Net asset value, beginning of period | | | | | |
| | | | | |
| | | | | |
Net realized and unrealized gains (losses) on investments | | | | | |
Total from investment operations | | | | | |
Distributions to shareholders from | | | | | |
| | | | | |
Net asset value, end of period | | | | | |
| | | | | |
Ratios to average net assets (annualized) | | | | | |
| | | | | |
| | | | | |
| | | | | |
| | | | | |
| | | | | |
Net assets, end of period (000s omitted) | | | | | |
| Calculated based upon average shares outstanding |
| Total return calculations do not include any sales charges. Returns include adjustments required by U.S. GAAP and may differ from net asset values and performance reported elsewhere. |
| During the year ended July 31, 2022, the Fund received payments from a service provider which had a 0.14% impact on the total return. |
| During the year ended July 31, 2021, the Fund received a payment from an affiliate which had a 5.92% impact on the total return. |
The accompanying notes are an integral part of these financial statements.
10 | Allspring Growth Fund
(For a share outstanding throughout each period)
| |
| | | | | |
Net asset value, beginning of period | | | | | |
| | | | | |
Net realized and unrealized gains (losses) on investments | | | | | |
Total from investment operations | | | | | |
Distributions to shareholders from | | | | | |
| | | | | |
Net asset value, end of period | | | | | |
| | | | | |
Ratios to average net assets (annualized) | | | | | |
| | | | | |
| | | | | |
| | | | | |
| | | | | |
| | | | | |
Net assets, end of period (000s omitted) | | | | | |
| Calculated based upon average shares outstanding |
| Returns include adjustments required by U.S. GAAP and may differ from net asset values and performance reported elsewhere. |
The accompanying notes are an integral part of these financial statements.
Allspring Growth Fund | 11
(For a share outstanding throughout each period)
| |
| | | | | |
Net asset value, beginning of period | | | | | |
| | | | | |
Net realized and unrealized gains (losses) on investments | | | | | |
Total from investment operations | | | | | |
Distributions to shareholders from | | | | | |
| | | | | |
Net asset value, end of period | | | | | |
| | | | | |
Ratios to average net assets (annualized) | | | | | |
| | | | | |
| | | | | |
| | | | | |
| | | | | |
| | | | | |
Net assets, end of period (000s omitted) | | | | | |
| Calculated based upon average shares outstanding |
| Returns include adjustments required by U.S. GAAP and may differ from net asset values and performance reported elsewhere. |
The accompanying notes are an integral part of these financial statements.
12 | Allspring Growth Fund
(For a share outstanding throughout each period)
| |
| | | | | |
Net asset value, beginning of period | | | | | |
| | | | | |
Net realized and unrealized gains (losses) on investments | | | | | |
Total from investment operations | | | | | |
Distributions to shareholders from | | | | | |
| | | | | |
Net asset value, end of period | | | | | |
| | | | | |
Ratios to average net assets (annualized) | | | | | |
| | | | | |
| | | | | |
| | | | | |
| | | | | |
| | | | | |
Net assets, end of period (000s omitted) | | | | | |
| Calculated based upon average shares outstanding |
| Returns include adjustments required by U.S. GAAP and may differ from net asset values and performance reported elsewhere. |
The accompanying notes are an integral part of these financial statements.
Allspring Growth Fund | 13
Notes to financial statements
Notes to financial statements
Allspring Funds Trust (the “Trust”), a Delaware statutory trust organized on March 10, 1999, is an open-end management investment company registered under the Investment Company Act of 1940, as amended (the “1940 Act”). As an investment company, the Trust follows the accounting and reporting guidance in Financial Accounting Standards Board (“FASB”) Accounting Standards Codification Topic 946, Financial Services – Investment Companies. These financial statements report on the Allspring Growth Fund (the “Fund”) which is a diversified series of the Trust.
2.
SIGNIFICANT ACCOUNTING POLICIES
The following significant accounting policies, which are consistently followed in the preparation of the financial statements of the Fund, are in conformity with U.S. generally accepted accounting principles (“GAAP”) which require management to make estimates and assumptions that affect the reported amounts of assets and liabilities, disclosure of contingent assets and liabilities at the date of the financial statements, and the reported amounts of income and expenses during the reporting period. Actual results could differ from those estimates.
All investments are valued each business day as of the close of regular trading on the New York Stock Exchange (generally 4 p.m. Eastern Time), although the Fund may deviate from this calculation time under unusual or unexpected circumstances.
Equity securities and exchange-traded funds that are listed on a foreign or domestic exchange or market are valued at the official closing price or, if none, the last sales price.
Investments in registered open-end investment companies (other than those listed on a foreign or domestic exchange or market) are valued at net asset value.
Investments which are not valued using the methods discussed above are valued at their fair value, as determined in good faith by Allspring Funds Management, LLC (“Allspring Funds Management”), which was named the valuation designee by the Board of Trustees. As the valuation designee, Allspring Funds Management is responsible for day-to-day valuation activities for the Allspring Funds. In connection with these responsibilities, Allspring Funds Management has established a Valuation Committee and has delegated to it the authority to take any actions regarding the valuation of portfolio securities that the Valuation Committee deems necessary or appropriate, including determining the fair value of portfolio securities. On a quarterly basis, the Board of Trustees receives reports of valuation actions taken by the Valuation Committee. On at least an annual basis, the Board of Trustees receives an assessment of the adequacy and effectiveness of Allspring Funds Management’s process for determining the fair value of the portfolio of investments.
Security transactions and income recognition
Securities transactions are recorded on a trade date basis. Realized gains or losses are recorded on the basis of identified cost.
Dividend income is recognized on the ex-dividend date. Dividend income is recorded net of foreign taxes withheld where recovery of such taxes is not assured.
Interest earned on cash balances held at the custodian is recorded as interest income.
Distributions to shareholders
Distributions to shareholders from net investment income and any net realized gains are recorded on the ex-dividend date and paid at least annually. Such distributions are determined in accordance with income tax regulations and may differ from U.S. GAAP. Dividend sources are estimated at the time of declaration. The tax character of distributions is determined as of the Fund’s fiscal year end. Therefore, a portion of the Fund’s distributions made prior to the Fund’s fiscal year end may be categorized as a tax return of capital at year end.
The Fund intends to continue to qualify as a regulated investment company by distributing substantially all of its investment company taxable income and any net realized capital gains (after reduction for capital loss carryforwards) sufficient to relieve it from all, or substantially all, federal income taxes. Accordingly, no provision for federal income taxes was required.
The Fund’s income and federal excise tax returns and all financial records supporting those returns for the prior three fiscal years are subject to examination by the federal and Delaware revenue authorities. Management has analyzed the Fund’s tax positions taken on federal, state, and foreign tax returns, as applicable, for all open tax years and does not believe that there are any uncertain tax positions that require recognition of a tax liability.
As of July 31, 2024, the aggregate cost of all investments for federal income tax purposes was $1,586,940,482 and the unrealized gains (losses) consisted of:
14 | Allspring Growth Fund
Notes to financial statements
Reclassifications are made to the Fund’s capital accounts for permanent tax differences to reflect income and gains available for distribution (or available capital loss carryforwards) under federal income tax regulations. U.S. GAAP require that certain components of net assets be adjusted to reflect permanent differences between financial and tax reporting. These reclassifications have no effect on net assets or net asset values per share. The primary difference causing such reclassification is due to net operating losses. At July 31, 2024, as a result of permanent book-to-tax differences, the following reclassification adjustments were made on the Statements of Assets and Liabilities:
| Total distributable
earnings |
| |
As of July 31, 2024, the Fund had a qualified late-year ordinary loss of $12,349,009 which will be recognized on the first day of the following fiscal year.
The separate classes of shares offered by the Fund differ principally in applicable sales charges, distribution, shareholder servicing, and administration fees. Class specific expenses are charged directly to that share class. Investment income, common fund-level expenses, and realized and unrealized gains (losses) on investments are allocated daily to each class of shares based on the relative proportion of net assets of each class.
3.
FAIR VALUATION MEASUREMENTS
Fair value measurements of investments are determined within a framework that has established a fair value hierarchy based upon the various data inputs utilized in determining the value of the Fund’s investments. The three-level hierarchy gives the highest priority to unadjusted quoted prices in active markets for identical assets or liabilities (Level 1) and the lowest priority to unobservable inputs (Level 3). The Fund’s investments are classified within the fair value hierarchy based on the lowest level of input that is significant to the fair value measurement. The inputs are summarized into three broad levels as follows:
•Level 1—quoted prices in active markets for identical securities
•Level 2—other significant observable inputs (including quoted prices for similar securities, interest rates, prepayment speeds, credit risk, etc.)
•Level 3—significant unobservable inputs (including the Fund’s own assumptions in determining the fair value of investments)
The inputs or methodologies used for valuing investments in securities are not necessarily an indication of the risk associated with investing in those securities.
The following is a summary of the inputs used in valuing the Fund’s assets and liabilities as of July 31, 2024:
| | Other significant
observable inputs
(Level 2) | Significant
unobservable inputs
(Level 3) | |
| | | | |
| | | | |
| | | | |
| | | | |
| | | | |
| | | | |
| | | | |
| | | | |
| | | | |
| | | | |
| | | | |
| | | | |
| | | | |
| | | | |
Additional sector, industry or geographic detail, if any, is included in the Portfolio of Investments.
At July 31, 2024, the Fund did not have any transfers into/out of Level 3.
Allspring Growth Fund | 15
Notes to financial statements
4.
TRANSACTIONS WITH AFFILIATES
Allspring Funds Management, a wholly owned subsidiary of Allspring Global Investments Holdings, LLC, a holding company indirectly owned by certain private funds of GTCR LLC and Reverence Capital Partners, L.P., is the manager of the Fund and provides advisory and fund-level administrative services under an investment management agreement. Under the investment management agreement, Allspring Funds Management is responsible for, among other services, implementing the investment objectives and strategies of the Fund, supervising the subadviser and providing fund-level administrative services in connection with the Fund’s operations. As compensation for its services under the investment management agreement, Allspring Funds Management is entitled to receive a management fee at the following annual rate based on the Fund’s average daily net assets:
For the year ended July 31, 2024, the management fee was equivalent to an annual rate of 0.72% of the Fund’s average daily net assets.
Allspring Funds Management has retained the services of a subadviser to provide daily portfolio management to the Fund. The fee for subadvisory services is borne by Allspring Funds Management. Allspring Global Investments, LLC, an affiliate of Allspring Funds Management and a wholly owned subsidiary of Allspring Global Investments Holdings, LLC, is the subadviser to the Fund and is entitled to receive a fee from Allspring Funds Management at an annual rate starting at 0.45% and declining to 0.30% as the average daily net assets of the Fund increase.
Under a class-level administration agreement, Allspring Funds Management provides class-level administrative services to the Fund, which includes paying fees and expenses for services provided by the transfer agent, sub-transfer agents, omnibus account servicers and record-keepers. As compensation for its services under the class-level administration agreement, Allspring Funds Management receives an annual fee which is calculated based on the average daily net assets of each class as follows:
| Class-level
administration fee |
| |
| |
| |
| |
| |
Waivers and/or expense reimbursements
Allspring Funds Management has contractually committed to waive and/or reimburse management and administration fees to the extent necessary to maintain certain net operating expense ratios for the Fund. When each class of the Fund has exceeded its expense cap, Allspring Funds Management will waive fees and/or reimburse expenses from fund-level expenses on a proportionate basis and then from class specific expenses. When only certain classes exceed their expense caps, waivers and/or reimbursements are applied against class specific expenses before fund-level expenses. Allspring Funds Management has contractually committed through November 30, 2025 to waive fees and/or reimburse expenses to the extent necessary to cap the Fund’s expenses. Prior to or after the commitment expiration date, the cap may be increased or the commitment to maintain the cap may be terminated only with the approval of the Board of Trustees. As of July 31, 2024, the contractual caps are as follows:
16 | Allspring Growth Fund
Notes to financial statements
Distribution fee
The Trust has adopted a distribution plan for Class C shares pursuant to Rule 12b-1 under the 1940 Act. A distribution fee is charged to Class C shares and paid to Allspring Funds Distributor, LLC (“Allspring Funds Distributor”), the principal underwriter, an affiliate of Allspring Funds Management, at an annual rate up to 0.75% of the average daily net assets of Class C shares.
In addition, Allspring Funds Distributor is entitled to receive the front-end sales charge from the purchase of Class A shares and a contingent deferred sales charge on the redemption of certain Class A shares. Allspring Funds Distributor is also entitled to receive the contingent deferred sales charges from redemptions of Class C shares. For the year ended July 31, 2024, Allspring Funds Distributor received $10,518 from the sale of Class A shares and $256 in contingent deferred sales charges from redemptions of Class A shares. No contingent deferred sales charges were incurred by Class C shares for the year ended July 31, 2024.
Shareholder servicing fees
The Trust has entered into contracts with one or more shareholder servicing agents, whereby Class A, Class C and Administrator Class are charged a fee at an annual rate up to 0.25% of the average daily net assets of each respective class. A portion of these total shareholder servicing fees were paid to affiliates of the Fund.
The Fund may purchase or sell portfolio investment securities to certain affiliates pursuant to Rule 17a-7 under the 1940 Act and under procedures adopted by the Board of Trustees. The procedures have been designed to ensure that these interfund transactions, which do not incur broker commissions, are effected at current market prices. Pursuant to these procedures, the Fund did not have any interfund transactions during the year ended July 31, 2024.
5.
INVESTMENT PORTFOLIO TRANSACTIONS
Purchases and sales of investments, excluding U.S. government obligations (if any) and short-term securities, for the year ended July 31, 2024 were $1,167,441,396 and $2,061,685,037, respectively.
After the close of business on July 26, 2024, the Fund acquired the net assets of Allspring Discovery All Cap Growth Fund. The purpose of the transaction was to combine two funds with similar investment objectives and strategies. Shareholders holding Class A, Class C, Administrator Class and Institutional Class shares of Allspring Discovery All Cap Growth Fund received Class A, Class C, Administrator Class and Institutional Class shares, respectively, of the Fund in the reorganization. The acquisition was accomplished by a tax-free exchange of all of the shares of Allspring Discovery All Cap Growth Fund for 24,451,474 shares of the Fund valued at $747,673,717 at an exchange ratio of 1.67, 1.34, 1.47 and 1.33 for Class A, Class C, Administrator Class and Institutional Class shares, respectively. The investment portfolio of Allspring Discovery All Cap Growth Fund with a fair value of $748,485,211, identified cost of $421,769,452 and unrealized gains (losses) of $326,715,759 at July 26, 2024 was (if portfolio and cash is stated) the principal assets acquired by the Fund. The aggregate net assets of Allspring Discovery All Cap Growth Fund and the Fund immediately prior to the acquisition were $747,673,717 and $2,962,209,027, respectively. The aggregate net assets of the Fund immediately after the acquisition were $3,709,882,744. For financial reporting purposes, assets received and shares issued by the Fund were recorded at fair value; however, the cost basis of the investments received from Allspring Discovery All Cap Growth Fund was carried forward to align with ongoing reporting of the Fund’s realized and unrealized gains and losses with amounts distributable to shareholders for tax purposes.
Assuming the acquisition had been completed August 1, 2023, the beginning of the annual reporting period for the Fund, the pro forma results of operations for the year ended July 31, 2024 would have been as follows:
| |
Net realized and unrealized gains (losses) on investments | |
Net increase in net assets resulting from operations | |
Because the combined investment portfolios have been managed as a single integrated portfolio since the acquisition was completed, it is not practicable to separate the amounts of revenue and earnings of the Allspring Discovery All Cap Growth Fund that have been included in the Fund’s Statement of Operations since July 27, 2024.
The Trust (excluding the money market funds), Allspring Master Trust and Allspring Variable Trust are parties to a $275,000,000 (prior to July 9, 2024: $350,000,000), revolving credit agreement whereby the Fund is permitted to use bank borrowings for temporary or emergency purposes, such as to fund shareholder redemption requests. Interest under the credit agreement is charged to the Fund based on a borrowing rate equal to the higher of the Federal Funds rate or the overnight bank funding rate in effect on that day plus a spread. In addition, an annual commitment fee based on the unused balance is allocated to each participating fund.
Allspring Growth Fund | 17
Notes to financial statements
For the year ended July 31, 2024, there were no borrowings by the Fund under the agreement.
8.
DISTRIBUTIONS TO SHAREHOLDERS
The tax character of distributions paid were as follows:
As of July 31, 2024, the components of distributable earnings on a tax basis were as follows:
Undistributed
long-term
gain | | Late-year
ordinary
losses
deferred |
| | |
As of the end of the period, the Fund concentrated its portfolio of investments in the information technology sector. A fund that invests a substantial portion of its assets in any sector may be more affected by changes in that sector than would be a fund whose investments are not heavily weighted in any sector.
Under the Fund’s organizational documents, the officers and Trustees have been granted certain indemnification rights against certain liabilities that may arise out of performance of their duties to the Fund. The Fund has entered into a separate agreement with each Trustee that converts indemnification rights currently existing under the Fund’s organizational documents into contractual rights that cannot be changed in the future without the consent of the Trustee. Additionally, in the normal course of business, the Fund may enter into contracts with service providers that contain a variety of indemnification clauses. The Fund’s maximum exposure under these arrangements is dependent on future claims that may be made against the Fund and, therefore, cannot be estimated.
18 | Allspring Growth Fund
Report of independent registered public accounting firm
To the Shareholders of the Fund and Board of Trustees
Allspring Funds Trust:
Opinion on the Financial Statements
We have audited the accompanying statement of assets and liabilities of Allspring Growth Fund (the Fund), one of the funds constituting Allspring Funds Trust, including the portfolio of investments, as of July 31, 2024, the related statement of operations for the year then ended, the statements of changes in net assets for each of the years in the two-year period then ended, and the related notes (collectively, the financial statements) and the financial highlights for each of the years in the five-year period then ended. In our opinion, the financial statements and financial highlights present fairly, in all material respects, the financial position of the Fund as of July 31, 2024, the results of its operations for the year then ended, the changes in its net assets for each of the years in the two-year period then ended, and the financial highlights for each of the years in the five-year period then ended, in conformity with U.S. generally accepted accounting principles.
These financial statements and financial highlights are the responsibility of the Fund’s management. Our responsibility is to express an opinion on these financial statements and financial highlights based on our audits. We are a public accounting firm registered with the Public Company Accounting Oversight Board (United States) (PCAOB) and are required to be independent with respect to the Fund in accordance with the U.S. federal securities laws and the applicable rules and regulations of the Securities and Exchange Commission and the PCAOB.
We conducted our audits in accordance with the standards of the PCAOB. Those standards require that we plan and perform the audit to obtain reasonable assurance about whether the financial statements and financial highlights are free of material misstatement, whether due to error or fraud. Our audits included performing procedures to assess the risks of material misstatement of the financial statements and financial highlights, whether due to error or fraud, and performing procedures that respond to those risks. Such procedures included examining, on a test basis, evidence regarding the amounts and disclosures in the financial statements and financial highlights. Such procedures also included confirmation of securities owned as of July 31, 2024, by correspondence with the custodian, transfer agent, and brokers, or by other appropriate auditing procedures. Our audits also included evaluating the accounting principles used and significant estimates made by management, as well as evaluating the overall presentation of the financial statements and financial highlights. We believe that our audits provide a reasonable basis for our opinion.

We have not been able to determine the specific year that we began serving as the auditor of one or more Allspring Funds investment companies; however, we are aware that we have served as the auditor of one or more Allspring Funds investment companies since at least 1955.
September 25, 2024
Allspring Growth Fund | 19
Other information (unaudited)
Other information
Pursuant to Section 852 of the Internal Revenue Code, $273,236,324 was designated as a 20% rate gain distribution for the fiscal year ended
July 31, 2024.
A description of the policies and procedures used to determine how to vote proxies relating to portfolio securities is available without charge, upon request, by calling 1-866-259-3305, visiting our website at allspringglobal.com, or visiting the SEC website at sec.gov. Information regarding how the proxies related to portfolio securities were voted during the most recent 12-month period ended June 30 is available on the website at allspringglobal.com or by visiting the SEC website at sec.gov.
Quarterly portfolio holdings information
The Fund files its complete schedule of portfolio holdings with the SEC for the first and third quarters of each fiscal year as an exhibit to its reports on Form N-PORT. Shareholders may view the filed Form N-PORT by visiting the SEC website at sec.gov.
20 | Allspring Growth Fund
Other information (unaudited)
Item 8. Changes in and disagreements with accountants
Item 9. Matters submitted to fund shareholders for a vote
Item 10. Remuneration paid to directors, officers and others
Refer to information in the Statement of operations.
Allspring Growth Fund | 21
Other information (unaudited)
Item 11. Statement regarding basis for the board’s approval of investment advisory contract
Board consideration of investment management and sub-advisory agreements:
Under the Investment Company Act of 1940 (the “1940 Act”), the Board of Trustees (the “Board”) of Allspring Funds Trust (the “Trust”) must determine annually whether to approve the continuation of the Trust’s investment management and sub-advisory agreements. In this regard, at a Board meeting held on May 28-30, 2024 (the “Meeting”), the Board, all the members of which have no direct or indirect interest in the investment management and sub-advisory agreements and are not “interested persons” of the Trust, as defined in the 1940 Act (the “Independent Trustees”), reviewed and approved for the Allspring Growth Fund (the “Fund”): (i) an investment management agreement (the “Management Agreement”) with Allspring Funds Management, LLC (“Allspring Funds Management”); and (ii) an investment sub-advisory agreement (the “Sub-Advisory Agreement”) with Allspring Global Investments, LLC (the “Sub-Adviser”), an affiliate of Allspring Funds Management. The Management Agreement and the Sub-Advisory Agreement are collectively referred to as the “Advisory Agreements.”
At the Meeting, the Board considered the factors and reached the conclusions described below relating to the selection of Allspring Funds Management and the Sub-Adviser and the approval of the Advisory Agreements. Prior to the Meeting, including at a meeting of the Board held in April 2024, and at the Meeting, the Trustees conferred extensively among themselves and with representatives of Allspring Funds Management about these matters. The Board has adopted a team-based approach, with each team consisting of a sub-set of Trustees, to assist the full Board in the discharge of its duties in reviewing investment performance and other matters throughout the year. The Independent Trustees were assisted in their evaluation of the Advisory Agreements by independent legal counsel, from whom they received separate legal advice and with whom they met separately.
In providing information to the Board, Allspring Funds Management and the Sub-Adviser were guided by a detailed set of requests for information submitted to them by independent legal counsel on behalf of the Independent Trustees at the start of the Board’s annual contract renewal process earlier in 2024. In considering and approving the Advisory Agreements, the Trustees considered the information they believed relevant, including but not limited to the information discussed below. The Board considered not only the specific information presented in connection with the Meeting, but also the knowledge gained over time through interactions with Allspring Funds Management and the Sub-Adviser about various topics. In this regard, the Board reviewed reports of Allspring Funds Management at each of its quarterly meetings, which included, among other things, portfolio reviews and investment performance reports. In addition, the Board and the teams mentioned above confer with portfolio managers at various times throughout the year. The Board did not identify any particular information or consideration that was all-important or controlling, and each individual Trustee may have attributed different weights to various factors.
After its deliberations, the Board unanimously determined that the compensation payable to Allspring Funds Management and the Sub-Adviser under each of the Advisory Agreements was reasonable, and approved the continuation of the Advisory Agreements for a one-year term. The Board considered the approval of the Advisory Agreements for the Fund as part of its consideration of agreements for funds across the complex, but its approvals were made on a fund-by-fund basis. The following summarizes a number of important, but not necessarily all, factors considered by the Board in support of its approvals.
Nature, extent, and quality of services
The Board received and considered various information regarding the nature, extent, and quality of services provided to the Fund by Allspring Funds Management and the Sub-Adviser under the Advisory Agreements. This information included a description of the investment advisory services and Fund-level administrative services covered by the Management Agreement, as well as, among other things, a summary of the background and experience of senior management of Allspring Global Investments, of which Allspring Funds Management and the Sub-Adviser are a part, and a summary of investments made in the Allspring Global Investments business.* The Board also received information about the services that continue to be provided by Wells Fargo & Co. and/or its affiliates (“Wells Fargo”) since the sale of Wells Fargo Asset Management to Allspring Global Investments Holdings, LLC, a holding company indirectly owned by certain private funds of GTCR LLC and Reverence Capital Partners, L.P., under a transition services agreement and an update on the anticipated timeline for exiting the transition services agreement. In addition, the Board received and considered information about the full range of services provided to the Fund by Allspring Funds Management and its affiliates.
The Board considered the qualifications, background, tenure, and responsibilities of each of the portfolio managers primarily responsible for the day-to-day portfolio management of the Fund. The Board noted that the portfolio managers responsible for the day-to-day portfolio management of the Fund would be changing during the Summer of 2024, and the Board considered the revised portfolio management team that would be taking over portfolio management responsibilities. The Board evaluated the ability of Allspring Funds Management and the Sub-Adviser to attract and retain qualified investment professionals, including research, advisory, and supervisory personnel.
*
The trade name for the asset management firm that includes Allspring Funds Management and the Sub-Adviser is “Allspring Global Investments.”
22 | Allspring Growth Fund
Other information (unaudited)
The Board further considered the compliance programs and compliance records of Allspring Funds Management and the Sub-Adviser. The Board received and considered information about Allspring Global Investments’ risk management functions, which included information about Allspring Funds Management’s and the Sub-Adviser’s business continuity plans, their approaches to data privacy and cybersecurity, Allspring Funds Management’s role as administrator of the Fund’s liquidity risk management program, and fair valuation designee. The Board also received and considered information about Allspring Funds Management’s intermediary and vendor oversight program.
Fund investment performance and expenses
The Board considered the investment performance results for the Fund over various time periods ended December 31, 2023. The Board considered these results in comparison to the investment performance of funds in a universe that was determined by Broadridge Inc. (“Broadridge”) to be similar to the Fund (the “Universe”), and in comparison to the Fund’s benchmark index and to other comparative data. Broadridge is an independent provider of investment company data. The Board received a description of the methodology used by Broadridge to select the mutual funds in the performance Universe. The Board noted that the investment performance of the Fund (Administrator Class) was higher than the average investment performance of the Universe for the one-year period under review, and lower for the three-, five-, and ten-year periods under review. The Board also noted that the investment performance of the Fund was lower than the investment performance of its benchmark index, the Russell 3000 Growth Index, for all periods under review.
The Board received information concerning, and discussed factors contributing to, the underperformance of the Fund relative to the Universe and benchmark for the periods identified above. The Board took note of the explanations for the relative underperformance during these periods, including with respect to the investment decisions and market factors that affected the Fund’s investment performance. The Board also took note of the Fund’s outperformance relative to the Universe for the one-year period under review.
The Board also received and considered information regarding the Fund’s net operating expense ratios and their various components, including actual management fees, custodian and other non-management fees, and Rule 12b-1 and non-Rule 12b-1 shareholder service fees. The Board considered these ratios in comparison to the median ratios of funds in class-specific expense groups that were determined by Broadridge to be similar to the Fund (the “Groups”). The Board received a description of the methodology used by Broadridge to select the mutual funds in the expense Groups and an explanation of how funds comprising expense Groups and their expense ratios may vary from year-to-year. Based on the Broadridge reports, the Board noted that the net operating expense ratios of the Fund were lower than the median net operating expense ratios of the expense Groups for each share class, except for the Class A shares, which was in range of the median net operating expense ratios of the expense Group.
The Board took into account the Fund’s investment performance and expense information provided to it among the factors considered in deciding to re-approve the Advisory Agreements.
Investment management and sub-advisory fee rates
The Board reviewed and considered the contractual fee rates payable by the Fund to Allspring Funds Management under the Management Agreement, as well as the contractual fee rates payable by the Fund to Allspring Funds Management for class-level administrative services under a Class-Level Administration Agreement, which include, among other things, class-level transfer agency and sub-transfer agency costs (collectively, the “Management Rates”). The Board also reviewed and considered the contractual investment sub-advisory fee rates payable by Allspring Funds Management to the Sub-Adviser for investment sub-advisory services. It was noted that advisory fee waivers, if any, are at the fund level and not class level.
Among other information reviewed by the Board was a comparison of the Fund’s Management Rates with the average contractual investment management fee rates of funds in the expense Groups at a common asset level as well as transfer agency costs of the funds in the expense Groups. The Board noted that the Management Rates of the Fund were lower than the sum of these average rates for the Fund’s expense Group for the Administrator Class shares, and in range of the sum of the average rates for the expense Groups for the Class A, the Institutional Class, and the Class R6 shares.
The Board also received and considered information about the portion of the total management fee that was retained by Allspring Funds Management after payment of the fee to the Sub-Adviser for sub-advisory services. In assessing the reasonableness of this amount, the Board received and evaluated information about the nature and extent of responsibilities retained and risks assumed by Allspring Funds Management and not delegated to or assumed by the Sub-Adviser, and about Allspring Funds Management’s on-going oversight services. Given the affiliation between Allspring Funds Management and the Sub-Adviser, the Board ascribed limited relevance to the allocation of fees between them.
The Board also received and considered information about the nature and extent of services offered and fee rates charged by Allspring Funds Management and the Sub-Adviser to other types of clients with investment strategies similar to those of the Fund. In this regard, the Board received information about the significantly greater scope of services, and compliance, reporting and other legal and regulatory obligations and risks of managing proprietary mutual funds compared with those associated with managing assets of other types of clients, including third-party sub-advised fund clients and non-mutual fund clients such as institutional separate accounts.
Allspring Growth Fund | 23
Other information (unaudited)
Based on its consideration of the factors and information it deemed relevant, including those described here, the Board determined that the compensation payable to Allspring Funds Management under the Management Agreement and to the Sub-Adviser under the Sub-Advisory Agreement was reasonable.
The Board received and considered information concerning the profitability of Allspring Funds Management, as well as the profitability of Allspring Global Investments, from providing services to the fund complex as a whole. The Board noted that the Sub-Adviser’s profitability information with respect to providing services to the Fund and other funds in the complex was subsumed in the Allspring Global Investments profitability analysis.
Allspring Funds Management reported on the methodologies and estimates used in calculating profitability, including a description of the methodology used to allocate certain expenses. Among other things, the Board noted that the levels of profitability reported on a fund-by-fund basis varied widely, depending on factors such as the size, type, and age of fund.
Based on its review, the Board did not deem the profits reported by Allspring Funds Management or Allspring Global Investments from services provided to the Fund to be at a level that would prevent it from approving the continuation of the Advisory Agreements.
The Board received and considered information about the potential for Allspring Funds Management to experience economies of scale in the provision of management services to the Fund, the difficulties of isolating and quantifying economies of scale at an individual fund level, and the extent to which potential scale benefits are shared with Fund shareholders. The Board noted the existence of breakpoints in the Fund’s management fee structure, which operate generally to reduce the Fund’s expense ratios as the Fund grows in size, and the size of the Fund in relation to such breakpoints. The Board considered that in addition to management fee breakpoints, Allspring Funds Management shares potential economies of scale from its management business in a variety of ways, including through fee waiver and expense reimbursement arrangements, competitive management fee rates set at the outset without regard to breakpoints, and investments in the business intended to enhance services available to shareholders.
The Board concluded that Allspring Funds Management’s arrangements with respect to the Fund, including contractual breakpoints, constituted a reasonable approach to sharing potential economies of scale with the Fund and its shareholders.
Other benefits to Allspring Funds Management and the Sub-Adviser
The Board received and considered information regarding potential “fall-out” or ancillary benefits received by Allspring Funds Management and its affiliates, including the Sub-Adviser, as a result of their relationships with the Fund. Ancillary benefits could include, among others, benefits directly attributable to other relationships with the Fund and benefits potentially derived from an increase in Allspring Funds Management’s and the Sub-Adviser’s business as a result of their relationships with the Fund. The Board noted that Allspring Funds Distributor, LLC, an affiliate of Allspring Funds Management, receives distribution-related fees in respect of shares sold or held through it. The Board also reviewed information about soft dollar credits earned and utilized by the Sub-Adviser.
Based on its consideration of the factors and information it deemed relevant, including those described here, the Board did not find that any ancillary benefits received by Allspring Funds Management and its affiliates, including the Sub-Adviser, were unreasonable.
At the Meeting, after considering the above-described factors and based on its deliberations and its evaluation of the information described above, the Board unanimously determined that the compensation payable to Allspring Funds Management and the Sub-Adviser under each of the Advisory Agreements was reasonable, and approved the continuation of the Advisory Agreements for a one-year term.
24 | Allspring Growth Fund
For more information
More information about Allspring Funds is available free upon request. To obtain literature, please write, visit the Fund’s website, or call:
Allspring Funds
P.O. Box 219967
Kansas City, MO 64121-9967
Website: allspringglobal.com
Individual investors: 1-800-222-8222
Retail investment professionals: 1-888-877-9275
Institutional investment professionals: 1-800-260-5969
This report and the financial statements contained herein are submitted for the general information of the shareholders of the Fund. If this report is used for promotional purposes, distribution of the report must be accompanied or preceded by a current prospectus. Before investing, please consider the investment objectives, risks, charges, and expenses of the investment. For a current prospectus and, if available, a summary prospectus, containing this information, call 1-800-222-8222 or visit the Fund’s website at allspringglobal.com. Read the prospectus carefully before you invest or send money.
Allspring Global InvestmentsTM is the trade name for the asset management firms of Allspring Global Investments Holdings, LLC, a holding company indirectly owned by certain private funds of GTCR LLC and Reverence Capital Partners, L.P. These firms include but are not limited to Allspring Global Investments, LLC, and Allspring Funds Management, LLC. Certain products managed by Allspring entities are distributed by Allspring Funds Distributor, LLC (a broker-dealer and Member FINRA/SIPC).
This material is for general informational and educational purposes only and is NOT intended to provide investment advice or a recommendation of any kind - including a recommendation for any specific investment, strategy, or plan.
© 2024 Allspring Global Investments Holdings, LLC. All rights reserved.
NCSR3009 07-24
Allspring Large Cap Growth Fund
Long Form Financial Statements
Annual Report
Allspring Large Cap Growth Fund | 1
Portfolio of investments—July 31, 2024
| | | | | |
| | | | | | |
Communication services: 13.91% | | | | | | |
| | | | | | |
| | | | | | |
| | | | | | |
| | | | | | |
Interactive media & services: 11.26% | | | | | | |
| | | | | | |
| | | | | | |
Meta Platforms, Inc. Class A | | | | | | |
| | | | | | |
| | | | | | |
Trade Desk, Inc. Class A† | | | | | | |
Wireless telecommunication services: 0.49% | | | | | | |
| | | | | | |
Consumer discretionary: 15.72% | | | | | | |
| | | | | | |
| | | | | | |
| | | | | | |
| | | | | | |
| | | | | | |
| | | | | | |
Hotels, restaurants & leisure: 3.75% | | | | | | |
| | | | | | |
Chipotle Mexican Grill, Inc.† | | | | | | |
| | | | | | |
| | | | | | |
O’Reilly Automotive, Inc.† | | | | | | |
| | | | | | |
| | | | | | |
| | | | | | |
| | | | | | |
| | | | | | |
Tradeweb Markets, Inc. Class A | | | | | | |
| | | | | | |
Financial services: 4.61% | | | | | | |
| | | | | | |
| | | | | | |
| | | | | | |
The accompanying notes are an integral part of these financial statements.
2 | Allspring Large Cap Growth Fund
Portfolio of investments—July 31, 2024
| | | | | |
| | | | | | |
| | | | | | |
| | | | | | |
| | | | | | |
Vertex Pharmaceuticals, Inc.† | | | | | | |
Health care equipment & supplies: 2.33% | | | | | | |
| | | | | | |
Intuitive Surgical, Inc.† | | | | | | |
| | | | | | |
Health care providers & services: 2.58% | | | | | | |
| | | | | | |
Health care technology: 1.42% | | | | | | |
Veeva Systems, Inc. Class A† | | | | | | |
Life sciences tools & services: 0.45% | | | | | | |
| | | | | | |
| | | | | | |
| | | | | | |
| | | | | | |
| | | | | | |
| | | | | | |
Aerospace & defense: 1.12% | | | | | | |
| | | | | | |
| | | | | | |
| | | | | | |
Commercial services & supplies: 1.31% | | | | | | |
| | | | | | |
| | | | | | |
| | | | | | |
Construction & engineering: 0.79% | | | | | | |
| | | | | | |
Ground transportation: 2.34% | | | | | | |
Old Dominion Freight Line, Inc. | | | | | | |
| | | | | | |
| | | | | | |
Information technology: 42.19% | | | | | | |
Communications equipment: 1.94% | | | | | | |
| | | | | | |
| | | | | | |
| | | | | | |
The accompanying notes are an integral part of these financial statements.
Allspring Large Cap Growth Fund | 3
Portfolio of investments—July 31, 2024
| | | | | |
| | | | | | |
| | | | | | |
| | | | | | |
| | | | | | |
Semiconductors & semiconductor equipment: 14.85% | | | | | | |
Advanced Micro Devices, Inc.† | | | | | | |
| | | | | | |
| | | | | | |
| | | | | | |
Microchip Technology, Inc. | | | | | | |
| | | | | | |
| | | | | | |
| | | | | | |
Cadence Design Systems, Inc.† | | | | | | |
| | | | | | |
| | | | | | |
| | | | | | |
| | | | | | |
| | | | | | |
| | | | | | |
Technology hardware, storage & peripherals: 7.80% | | | | | | |
| | | | | | |
| | | | | | |
| | | | | | |
| | | | | | |
| | | | | | |
| | | | | | |
Total common stocks (Cost $371,289,204) | | | | | | |
| | | | | |
Short-term investments: 2.01% | | | | | | |
Investment companies: 2.01% | | | | | | |
Allspring Government Money Market Fund Select Class♠∞ | | | | | | |
Total short-term investments (Cost $19,570,173) | | | | | | |
Total investments in securities (Cost $390,859,377) | | | | | | |
Other assets and liabilities, net | | | | | | |
| | | | | | |
| Non-income-earning security |
| The issuer of the security is an affiliated person of the Fund as defined in the Investment Company Act of 1940. |
| The rate represents the 7-day annualized yield at period end. |
|
| American depositary receipt |
The accompanying notes are an integral part of these financial statements.
4 | Allspring Large Cap Growth Fund
Portfolio of investments—July 31, 2024
Investments in affiliates
An affiliated investment is an investment in which the Fund owns at least 5% of the outstanding voting shares of the issuer or as a result of other relationships, such as the Fund and the issuer having the same investment manager. Transactions with issuers that were affiliates of the Fund at the end of the period were as follows:
| | | | | Net
change in
unrealized
gains
(losses) | | | Income
from
affiliated
securities |
| | | | | | | | |
Allspring Government Money Market Fund Select Class | | | | | | | | |
The accompanying notes are an integral part of these financial statements.
Allspring Large Cap Growth Fund | 5
Statement of assets and liabilities—July 31, 2024
Financial statements
Statement of assets and liabilities
| |
Investments in unaffiliated securities, at value (cost $371,289,204) | |
Investments in affiliated securities, at value (cost $19,570,173) | |
Receivable for investments sold | |
Receivable for Fund shares sold | |
| |
Prepaid expenses and other assets | |
| |
| |
Payable for investments purchased | |
Payable for Fund shares redeemed | |
| |
Shareholder servicing fees payable | |
Administration fees payable | |
Distribution fees payable | |
Trustees’ fees and expenses payable | |
Accrued expenses and other liabilities | |
| |
| |
| |
| |
Total distributable earnings | |
| |
Computation of net asset value and offering price per share | |
| |
Shares outstanding–Class A1 | |
Net asset value per share–Class A | |
Maximum offering price per share – Class A2 | |
| |
Shares outstanding–Class C1 | |
Net asset value per share–Class C | |
| |
Shares outstanding–Class R61 | |
Net asset value per share–Class R6 | |
Net assets–Administrator Class | |
Shares outstanding–Administrator Class1 | |
Net asset value per share–Administrator Class | |
Net assets–Institutional Class | |
Shares outstanding–Institutional Class1 | |
Net asset value per share–Institutional Class | |
1 The Fund has an unlimited number of authorized shares.
2 Maximum offering price is computed as 100/94.25 of net asset value. On investments of $50,000 or more, the offering price is reduced.
The accompanying notes are an integral part of these financial statements.
6 | Allspring Large Cap Growth Fund
Statement of operations—year ended July 31, 2024
Statement of operations
| |
Dividends (net of foreign withholdings taxes of $7,187) | |
Income from affiliated securities | |
| |
| |
| |
| |
| |
| |
| |
| |
| |
| |
Shareholder servicing fees | |
| |
| |
| |
| |
| |
Custody and accounting fees | |
| |
| |
Shareholder report expenses | |
Trustees’ fees and expenses | |
| |
| |
Less: Fee waivers and/or expense reimbursements | |
| |
| |
| |
| |
| |
Realized and unrealized gains (losses) on investments | |
Net realized gains on investments | |
Net change in unrealized gains (losses) on investments | |
Net realized and unrealized gains (losses) on investments | |
Net increase in net assets resulting from operations | |
The accompanying notes are an integral part of these financial statements.
Allspring Large Cap Growth Fund | 7
Statement of changes in net assets
Statement of changes in net assets
| | |
| | | | |
| | | | |
Net realized gains on investments | | | | |
Net change in unrealized gains (losses) on investments | | | | |
Net increase in net assets resulting from operations | | | | |
Distributions to shareholders from | | | | |
Net investment income and net realized gains | | | | |
| | | | |
| | | | |
| | | | |
| | | | |
| | | | |
| | | | |
| | | | |
Total distributions to shareholders | | | | |
Capital share transactions | | | | |
Proceeds from shares sold | | | | |
| | | | |
| | | | |
| | | | |
| | | | |
| | | | |
| | | | |
| | | | |
Reinvestment of distributions | | | | |
| | | | |
| | | | |
| | | | |
| | | | |
| | | | |
| | | | |
| | | | |
| | | | |
Payment for shares redeemed | | | | |
| | | | |
| | | | |
| | | | |
| | | | |
| | | | |
| | | | |
| | | | |
| | | | |
1 For the period from August 1, 2022 to June 16, 2023. Effective at the close of business on June 16, 2023, Class R shares were converted to Class A shares and are no longer offered by the Fund.
2 For the period from August 1, 2022 to June 16, 2023. The class was closed at the close of business on June 16, 2023 and is no longer offered by the Fund.
The accompanying notes are an integral part of these financial statements.
8 | Allspring Large Cap Growth Fund
Statement of changes in net assets
Statement of changes in net assets
| | |
| | | | |
Net asset value of shares issued in acquisition | | | | |
| | | | |
| | | | |
| | | | |
| | | | |
| | | | |
| | | | |
| | | | |
| | | | |
| | | | |
| | | | |
Net increase (decrease) in net assets resulting from capital share transactions | | | | |
Total increase (decrease) in net assets | | | | |
| | | | |
| | | | |
| | | | |
3 Effective at the close of business on June 16, 2023, Class R shares were converted to Class A shares and are no longer offered by the Fund.
The accompanying notes are an integral part of these financial statements.
Allspring Large Cap Growth Fund | 9
Financial highlights
(For a share outstanding throughout each period)
| |
| | | | | |
Net asset value, beginning of period | | | | | |
| | | | | |
Net realized and unrealized gains (losses) on investments | | | | | |
Total from investment operations | | | | | |
Distributions to shareholders from | | | | | |
| | | | | |
Net asset value, end of period | | | | | |
| | | | | |
Ratios to average net assets (annualized) | | | | | |
| | | | | |
| | | | | |
| | | | | |
| | | | | |
| | | | | |
Net assets, end of period (000s omitted) | | | | | |
| Calculated based upon average shares outstanding |
| Total return calculations do not include any sales charges. Returns include adjustments required by U.S. GAAP and may differ from net asset values and performance reported elsewhere. |
The accompanying notes are an integral part of these financial statements.
10 | Allspring Large Cap Growth Fund
(For a share outstanding throughout each period)
| |
| | | | | |
Net asset value, beginning of period | | | | | |
| | | | | |
Net realized and unrealized gains (losses) on investments | | | | | |
Total from investment operations | | | | | |
Distributions to shareholders from | | | | | |
| | | | | |
Net asset value, end of period | | | | | |
| | | | | |
Ratios to average net assets (annualized) | | | | | |
| | | | | |
| | | | | |
| | | | | |
| | | | | |
| | | | | |
Net assets, end of period (000s omitted) | | | | | |
| Calculated based upon average shares outstanding |
| Total return calculations do not include any sales charges. Returns include adjustments required by U.S. GAAP and may differ from net asset values and performance reported elsewhere. |
The accompanying notes are an integral part of these financial statements.
Allspring Large Cap Growth Fund | 11
(For a share outstanding throughout each period)
| |
| | | | | |
Net asset value, beginning of period | | | | | |
Net investment income (loss) | | | | | |
Net realized and unrealized gains (losses) on investments | | | | | |
Total from investment operations | | | | | |
Distributions to shareholders from | | | | | |
| | | | | |
| | | | | |
Total distributions to shareholders | | | | | |
Net asset value, end of period | | | | | |
| | | | | |
Ratios to average net assets (annualized) | | | | | |
| | | | | |
| | | | | |
Net investment income (loss) | | | | | |
| | | | | |
| | | | | |
Net assets, end of period (000s omitted) | | | | | |
| Calculated based upon average shares outstanding |
| Returns include adjustments required by U.S. GAAP and may differ from net asset values and performance reported elsewhere. |
The accompanying notes are an integral part of these financial statements.
12 | Allspring Large Cap Growth Fund
(For a share outstanding throughout each period)
| |
| | | | | |
Net asset value, beginning of period | | | | | |
| | | | | |
Net realized and unrealized gains (losses) on investments | | | | | |
Total from investment operations | | | | | |
Distributions to shareholders from | | | | | |
| | | | | |
| | | | | |
Total distributions to shareholders | | | | | |
Net asset value, end of period | | | | | |
| | | | | |
Ratios to average net assets (annualized) | | | | | |
| | | | | |
| | | | | |
| | | | | |
| | | | | |
| | | | | |
Net assets, end of period (000s omitted) | | | | | |
| Calculated based upon average shares outstanding |
| Returns include adjustments required by U.S. GAAP and may differ from net asset values and performance reported elsewhere. |
The accompanying notes are an integral part of these financial statements.
Allspring Large Cap Growth Fund | 13
(For a share outstanding throughout each period)
| |
| | | | | |
Net asset value, beginning of period | | | | | |
Net investment income (loss) | | | | | |
Net realized and unrealized gains (losses) on investments | | | | | |
Total from investment operations | | | | | |
Distributions to shareholders from | | | | | |
| | | | | |
| | | | | |
Total distributions to shareholders | | | | | |
Net asset value, end of period | | | | | |
| | | | | |
Ratios to average net assets (annualized) | | | | | |
| | | | | |
| | | | | |
Net investment income (loss) | | | | | |
| | | | | |
| | | | | |
Net assets, end of period (000s omitted) | | | | | |
| Calculated based upon average shares outstanding |
| Returns include adjustments required by U.S. GAAP and may differ from net asset values and performance reported elsewhere. |
The accompanying notes are an integral part of these financial statements.
14 | Allspring Large Cap Growth Fund
Notes to financial statements
Notes to financial statements
Allspring Funds Trust (the “Trust”), a Delaware statutory trust organized on March 10, 1999, is an open-end management investment company registered under the Investment Company Act of 1940, as amended (the “1940 Act”). As an investment company, the Trust follows the accounting and reporting guidance in Financial Accounting Standards Board (“FASB”) Accounting Standards Codification Topic 946, Financial Services – Investment Companies. These financial statements report on the Allspring Large Cap Growth Fund (the “Fund”) which is a diversified series of the Trust.
Effective at the close of business on June 16, 2023, Class R shares became Class A shares in a tax-free conversion. Shareholders of Class R received Class A shares at a value equal to the value of their Class R shares immediately prior to the conversion. Class R shares are no longer offered by the Fund. Additionally, all existing Class R4 shares of the Fund were fully redeemed at the close of business on June 16, 2023 and the class was closed and is no longer offered by the Fund.
2.
SIGNIFICANT ACCOUNTING POLICIES
The following significant accounting policies, which are consistently followed in the preparation of the financial statements of the Fund, are in conformity with U.S. generally accepted accounting principles (“GAAP”) which require management to make estimates and assumptions that affect the reported amounts of assets and liabilities, disclosure of contingent assets and liabilities at the date of the financial statements, and the reported amounts of income and expenses during the reporting period. Actual results could differ from those estimates.
All investments are valued each business day as of the close of regular trading on the New York Stock Exchange (generally 4 p.m. Eastern Time), although the Fund may deviate from this calculation time under unusual or unexpected circumstances.
Equity securities and exchange-traded funds that are listed on a foreign or domestic exchange or market are valued at the official closing price or, if none, the last sales price.
Investments in registered open-end investment companies (other than those listed on a foreign or domestic exchange or market) are valued at net asset value.
Investments which are not valued using the methods discussed above are valued at their fair value, as determined in good faith by Allspring Funds Management, LLC (“Allspring Funds Management”), which was named the valuation designee by the Board of Trustees. As the valuation designee, Allspring Funds Management is responsible for day-to-day valuation activities for the Allspring Funds. In connection with these responsibilities, Allspring Funds Management has established a Valuation Committee and has delegated to it the authority to take any actions regarding the valuation of portfolio securities that the Valuation Committee deems necessary or appropriate, including determining the fair value of portfolio securities. On a quarterly basis, the Board of Trustees receives reports of valuation actions taken by the Valuation Committee. On at least an annual basis, the Board of Trustees receives an assessment of the adequacy and effectiveness of Allspring Funds Management’s process for determining the fair value of the portfolio of investments.
Foreign currency translation
The accounting records of the Fund are maintained in U.S. dollars. The values of other assets and liabilities denominated in foreign currencies are translated into U.S. dollars at rates provided by an independent foreign currency pricing source at a time each business day specified by the Valuation Committee. Purchases and sales of securities, and income and expenses are converted at the rate of exchange on the respective dates of such transactions. Net realized foreign exchange gains or losses arise from sales of foreign currencies, currency gains or losses realized between the trade and settlement dates on securities transactions, and the difference between the amounts of dividends, interest and foreign withholding taxes recorded and the U.S. dollar equivalent of the amounts actually paid or received. Net unrealized foreign exchange gains and losses arise from changes in the fair value of assets and liabilities other than investments in securities resulting from changes in exchange rates. The changes in net assets arising from changes in exchange rates of securities and the changes in net assets resulting from changes in market prices of securities are not separately presented. Such changes are included in net realized and unrealized gains or losses from investments.
Security transactions and income recognition
Securities transactions are recorded on a trade date basis. Realized gains or losses are recorded on the basis of identified cost.
Dividend income is recognized on the ex-dividend date. Dividend income is recorded net of foreign taxes withheld where recovery of such taxes is not assured.
Interest earned on cash balances held at the custodian is recorded as interest income.
Distributions received from REIT investments may be characterized as ordinary income, capital gains, or a return of capital to the Fund based on information provided by the REIT. The proper characterization of REIT distributions is generally not known until after the end of each calendar year. As such, estimates may be used in reporting the character of income and distributions for financial statement purposes.
Allspring Large Cap Growth Fund | 15
Notes to financial statements
Distributions to shareholders
Distributions to shareholders from net investment income and any net realized gains are recorded on the ex-dividend date and paid at least annually. Such distributions are determined in accordance with income tax regulations and may differ from U.S. GAAP. Dividend sources are estimated at the time of declaration. The tax character of distributions is determined as of the Fund’s fiscal year end. Therefore, a portion of the Fund’s distributions made prior to the Fund’s fiscal year end may be categorized as a tax return of capital at year end.
The Fund intends to continue to qualify as a regulated investment company by distributing substantially all of its investment company taxable income and any net realized capital gains (after reduction for capital loss carryforwards) sufficient to relieve it from all, or substantially all, federal income taxes. Accordingly, no provision for federal income taxes was required.
The Fund’s income and federal excise tax returns and all financial records supporting those returns for the prior three fiscal years are subject to examination by the federal and Delaware revenue authorities. Management has analyzed the Fund’s tax positions taken on federal, state, and foreign tax returns, as applicable, for all open tax years and does not believe that there are any uncertain tax positions that require recognition of a tax liability.
As of July 31, 2024, the aggregate cost of all investments for federal income tax purposes was $392,439,577 and the unrealized gains (losses) consisted of:
Reclassifications are made to the Fund’s capital accounts for permanent tax differences to reflect income and gains available for distribution (or available capital loss carryforwards) under federal income tax regulations. U.S. GAAP require that certain components of net assets be adjusted to reflect permanent differences between financial and tax reporting. These reclassifications have no effect on net assets or net asset values per share. The primary difference causing such reclassification is due to net operating losses. At July 31, 2024, as a result of permanent book-to-tax differences, the following reclassification adjustments were made on the Statement of Assets and Liabilities:
| Total distributable
earnings |
| |
As of July 31, 2024, the Fund had a qualified late-year ordinary loss of $2,327,661 which will be recognized on the first day of the following fiscal year.
The separate classes of shares offered by the Fund differ principally in applicable sales charges, distribution, shareholder servicing, and administration fees. Class specific expenses are charged directly to that share class. Investment income, common fund-level expenses, and realized and unrealized gains (losses) on investments are allocated daily to each class of shares based on the relative proportion of net assets of each class.
3.
FAIR VALUATION MEASUREMENTS
Fair value measurements of investments are determined within a framework that has established a fair value hierarchy based upon the various data inputs utilized in determining the value of the Fund’s investments. The three-level hierarchy gives the highest priority to unadjusted quoted prices in active markets for identical assets or liabilities (Level 1) and the lowest priority to unobservable inputs (Level 3). The Fund’s investments are classified within the fair value hierarchy based on the lowest level of input that is significant to the fair value measurement. The inputs are summarized into three broad levels as follows:
•Level 1—quoted prices in active markets for identical securities
•Level 2—other significant observable inputs (including quoted prices for similar securities, interest rates, prepayment speeds, credit risk, etc.)
•Level 3—significant unobservable inputs (including the Fund’s own assumptions in determining the fair value of investments)
The inputs or methodologies used for valuing investments in securities are not necessarily an indication of the risk associated with investing in those securities.
16 | Allspring Large Cap Growth Fund
Notes to financial statements
The following is a summary of the inputs used in valuing the Fund’s assets and liabilities as of July 31, 2024:
| | Other significant
observable inputs
(Level 2) | Significant
unobservable inputs
(Level 3) | |
| | | | |
| | | | |
| | | | |
| | | | |
| | | | |
| | | | |
| | | | |
| | | | |
| | | | |
| | | | |
| | | | |
| | | | |
| | | | |
Additional sector, industry or geographic detail, if any, is included in the Portfolio of Investments.
At July 31, 2024, the Fund did not have any transfers into/out of Level 3.
4.
TRANSACTIONS WITH AFFILIATES
Allspring Funds Management, a wholly owned subsidiary of Allspring Global Investments Holdings, LLC, a holding company indirectly owned by certain private funds of GTCR LLC and Reverence Capital Partners, L.P., is the manager of the Fund and provides advisory and fund-level administrative services under an investment management agreement. Under the investment management agreement, Allspring Funds Management is responsible for, among other services, implementing the investment objectives and strategies of the Fund, supervising the subadviser and providing fund-level administrative services in connection with the Fund’s operations. As compensation for its services under the investment management agreement, Allspring Funds Management is entitled to receive a management fee at the following annual rate based on the Fund’s average daily net assets:
For the year ended July 31, 2024, the management fee was equivalent to an annual rate of 0.69% of the Fund’s average daily net assets.
Allspring Funds Management has retained the services of a subadviser to provide daily portfolio management to the Fund. The fee for subadvisory services is borne by Allspring Funds Management. Allspring Global Investments, LLC, an affiliate of Allspring Funds Management and a wholly owned subsidiary of Allspring Global Investments Holdings, LLC, is the subadviser to the Fund and is entitled to receive a fee from Allspring Funds Management at an annual rate starting at 0.30% and declining to 0.20% as the average daily net assets of the Fund increase.
Under a class-level administration agreement, Allspring Funds Management provides class-level administrative services to the Fund, which includes paying fees and expenses for services provided by the transfer agent, sub-transfer agents, omnibus account servicers and record-keepers. As
Allspring Large Cap Growth Fund | 17
Notes to financial statements
compensation for its services under the class-level administration agreement, Allspring Funds Management receives an annual fee which is calculated based on the average daily net assets of each class as follows:
| Class-level
administration fee |
| |
| |
| |
| |
| |
Waivers and/or expense reimbursements
Allspring Funds Management has contractually committed to waive and/or reimburse management and administration fees to the extent necessary to maintain certain net operating expense ratios for the Fund. When each class of the Fund has exceeded its expense cap, Allspring Funds Management will waive fees and/or reimburse expenses from fund-level expenses on a proportionate basis and then from class specific expenses. When only certain classes exceed their expense caps, waivers and/or reimbursements are applied against class specific expenses before fund-level expenses. Allspring Funds Management has contractually committed through November 30, 2025 to waive fees and/or reimburse expenses to the extent necessary to cap the Fund’s expenses. Prior to or after the commitment expiration date, the cap may be increased or the commitment to maintain the cap may be terminated only with the approval of the Board of Trustees. As of July 31, 2024, the contractual caps are as follows:
| |
| | RATE PRIOR TO JUNE 3, 2024 |
| | |
| | |
| | |
| | |
| | |
The Trust has adopted a distribution plan for Class C shares pursuant to Rule 12b-1 under the 1940 Act. Distribution fees are charged to Class C shares and paid to Allspring Funds Distributor, LLC (“Allspring Funds Distributor”), the principal underwriter, an affiliate of Allspring Funds Management, at an annual rate up to 0.75% of the average daily net assets of Class C shares.
In addition, Allspring Funds Distributor is entitled to receive the front-end sales charge from the purchase of Class A shares and a contingent deferred sales charge on the redemption of certain Class A shares. Allspring Funds Distributor is also entitled to receive the contingent deferred sales charges from redemptions of Class C shares. For the year ended July 31, 2024, Allspring Funds Distributor received $3,000 from the sale of Class A shares. No contingent deferred sales charges were incurred by Class A and Class C shares for the year ended July 31, 2024.
Shareholder servicing fees
The Trust has entered into contracts with one or more shareholder servicing agents, whereby Class A, Class C and Administrator Class are charged a fee at an annual rate up to 0.25% of the average daily net assets of each respective class. A portion of these total shareholder servicing fees were paid to affiliates of the Fund.
The Fund may purchase or sell portfolio investment securities to certain affiliates pursuant to Rule 17a-7 under the 1940 Act and under procedures adopted by the Board of Trustees. The procedures have been designed to ensure that these interfund transactions, which do not incur broker commissions, are effected at current market prices. Pursuant to these procedures, the Fund did not have any interfund transactions during the year ended July 31, 2024.
5.
INVESTMENT PORTFOLIO TRANSACTIONS
Purchases and sales of investments, excluding U.S. government obligations (if any) and short-term securities, for the year ended July 31, 2024 were $211,761,899 and $295,656,694, respectively.
After the close of business on July 26, 2024, the Fund acquired the net assets of Allspring Discovery Large Cap Growth Fund. The purpose of the transaction was to combine two funds with similar investment objectives and strategies. Shareholders holding Class A, Class C, Class R6, Administrator Class and Institutional Class shares of Allspring Discovery Large Cap Growth Fund received Class A, Class C, Class R6, Administrator Class and Institutional Class shares, respectively, of the Fund in the reorganization. The acquisition was accomplished by a tax-free exchange of all of the shares of
18 | Allspring Large Cap Growth Fund
Notes to financial statements
Allspring Discovery Large Cap Growth Fund for 4,408,879 shares of the Fund valued at $187,155,995 at an exchange ratio of 0.15, 0.01, 0.19, 0.18 and 0.20 for Class A, Class C, Class R6, Administrator Class and Institutional Class shares, respectively. The investment portfolio of Allspring Discovery Large Cap Growth Fund with a fair value of $187,339,492, identified cost of $100,117,907 and unrealized gains (losses) of $87,221,585 at July 26, 2024 was (if portfolio and cash is stated) the principal assets acquired by the Fund. The aggregate net assets of Allspring Discovery Large Cap Growth Fund and the Fund immediately prior to the acquisition were $187,155,995 and $771,980,335, respectively. The aggregate net assets of the Fund immediately after the acquisition were $959,136,330. For financial reporting purposes, assets received and shares issued by the Fund were recorded at fair value; however, the cost basis of the investments received from Allspring Discovery Large Cap Growth Fund was carried forward to align with ongoing reporting of the Fund’s realized and unrealized gains and losses with amounts distributable to shareholders for tax purposes.
Assuming the acquisition had been completed August 1, 2023, the beginning of the annual reporting period for the Fund, the pro forma results of operations for the year ended July 31, 2024 would have been as follows:
| |
Net realized and unrealized gains (losses) on investments | |
Net increase in net assets resulting from operations | |
Because the combined investment portfolios have been managed as a single integrated portfolio since the acquisition was completed, it is not practicable to separate the amounts of revenue and earnings of the Allspring Discovery Large Cap Growth Fund that have been included in the Fund’s Statement of Operations since July 27, 2024.
The Trust (excluding the money market funds), Allspring Master Trust and Allspring Variable Trust are parties to a $275,000,000 (prior to July 9, 2024: $350,000,000), revolving credit agreement whereby the Fund is permitted to use bank borrowings for temporary or emergency purposes, such as to fund shareholder redemption requests. Interest under the credit agreement is charged to the Fund based on a borrowing rate equal to the higher of the Federal Funds rate or the overnight bank funding rate in effect on that day plus a spread. In addition, an annual commitment fee based on the unused balance is allocated to each participating fund.
For the year ended July 31, 2024, there were no borrowings by the Fund under the agreement.
8.
DISTRIBUTIONS TO SHAREHOLDERS
The tax character of distributions paid were as follows:
As of July 31, 2024, the components of distributable earnings on a tax basis were as follows:
Undistributed
long-term
gain | | Late-year
ordinary
losses
deferred |
| | |
As of the end of the period, the Fund concentrated its portfolio of investments in the information technology sector. A fund that invests a substantial portion of its assets in any sector may be more affected by changes in that sector than would be a fund whose investments are not heavily weighted in any sector.
Under the Fund’s organizational documents, the officers and Trustees have been granted certain indemnification rights against certain liabilities that may arise out of performance of their duties to the Fund. The Fund has entered into a separate agreement with each Trustee that converts indemnification rights currently existing under the Fund’s organizational documents into contractual rights that cannot be changed in the future without the consent of the Trustee. Additionally, in the normal course of business, the Fund may enter into contracts with service providers that contain a variety of indemnification clauses. The Fund’s maximum exposure under these arrangements is dependent on future claims that may be made against the Fund and, therefore, cannot be estimated.
Allspring Large Cap Growth Fund | 19
Report of independent registered public accounting firm
To the Shareholders of the Fund and Board of Trustees
Allspring Funds Trust:
Opinion on the Financial Statements
We have audited the accompanying statement of assets and liabilities of Allspring Large Cap Growth Fund (the Fund), one of the funds constituting Allspring Funds Trust, including the portfolio of investments, as of July 31, 2024, the related statement of operations for the year then ended, the statements of changes in net assets for each of the years in the two-year period then ended, and the related notes (collectively, the financial statements) and the financial highlights for each of the years in the five-year period then ended. In our opinion, the financial statements and financial highlights present fairly, in all material respects, the financial position of the Fund as of July 31, 2024, the results of its operations for the year then ended, the changes in its net assets for each of the years in the two-year period then ended, and the financial highlights for each of the years in the five-year period then ended, in conformity with U.S. generally accepted accounting principles.
These financial statements and financial highlights are the responsibility of the Fund’s management. Our responsibility is to express an opinion on these financial statements and financial highlights based on our audits. We are a public accounting firm registered with the Public Company Accounting Oversight Board (United States) (PCAOB) and are required to be independent with respect to the Fund in accordance with the U.S. federal securities laws and the applicable rules and regulations of the Securities and Exchange Commission and the PCAOB.
We conducted our audits in accordance with the standards of the PCAOB. Those standards require that we plan and perform the audit to obtain reasonable assurance about whether the financial statements and financial highlights are free of material misstatement, whether due to error or fraud. Our audits included performing procedures to assess the risks of material misstatement of the financial statements and financial highlights, whether due to error or fraud, and performing procedures that respond to those risks. Such procedures included examining, on a test basis, evidence regarding the amounts and disclosures in the financial statements and financial highlights. Such procedures also included confirmation of securities owned as of July 31, 2024, by correspondence with the custodian, transfer agent, and brokers, or by other appropriate auditing procedures. Our audits also included evaluating the accounting principles used and significant estimates made by management, as well as evaluating the overall presentation of the financial statements and financial highlights. We believe that our audits provide a reasonable basis for our opinion.

We have not been able to determine the specific year that we began serving as the auditor of one or more Allspring Funds investment companies; however, we are aware that we have served as the auditor of one or more Allspring Funds investment companies since at least 1955.
September 25, 2024
20 | Allspring Large Cap Growth Fund
Other information (unaudited)
Other information
Pursuant to Section 852 of the Internal Revenue Code, $117,561,995 was designated as a 20% rate gain distribution for the fiscal year ended
July 31, 2024.
A description of the policies and procedures used to determine how to vote proxies relating to portfolio securities is available without charge, upon request, by calling 1-866-259-3305, visiting our website at allspringglobal.com, or visiting the SEC website at sec.gov. Information regarding how the proxies related to portfolio securities were voted during the most recent 12-month period ended June 30 is available on the website at allspringglobal.com or by visiting the SEC website at sec.gov.
Quarterly portfolio holdings information
The Fund files its complete schedule of portfolio holdings with the SEC for the first and third quarters of each fiscal year as an exhibit to its reports on Form N-PORT. Shareholders may view the filed Form N-PORT by visiting the SEC website at sec.gov.
Allspring Large Cap Growth Fund | 21
Other information (unaudited)
Item 8. Changes in and disagreements with accountants
Item 9. Matters submitted to fund shareholders for a vote
Item 10. Remuneration paid to directors, officers and others
Refer to information in the Statement of operations.
22 | Allspring Large Cap Growth Fund
Other information (unaudited)
Item 11. Statement regarding basis for the board’s approval of investment advisory contract
Board Consideration of Investment Management and Sub-Advisory Agreements:
Under the Investment Company Act of 1940 (the “1940 Act”), the Board of Trustees (the “Board”) of Allspring Funds Trust (the “Trust”) must determine annually whether to approve the continuation of the Trust’s investment management and sub-advisory agreements. In this regard, at a Board meeting held on May 28-30, 2024 (the “Meeting”), the Board, all the members of which have no direct or indirect interest in the investment management and sub-advisory agreements and are not “interested persons” of the Trust, as defined in the 1940 Act (the “Independent Trustees”), reviewed and approved for the Allspring Large Cap Growth Fund (the “Fund”): (i) an investment management agreement (the “Management Agreement”) with Allspring Funds Management, LLC (“Allspring Funds Management”); and (ii) an investment sub-advisory agreement (the “Sub-Advisory Agreement”) with Allspring Global Investments, LLC (the “Sub-Adviser”), an affiliate of Allspring Funds Management. The Management Agreement and the Sub-Advisory Agreement are collectively referred to as the “Advisory Agreements.”
At the Meeting, the Board considered the factors and reached the conclusions described below relating to the selection of Allspring Funds Management and the Sub-Adviser and the approval of the Advisory Agreements. Prior to the Meeting, including at a meeting of the Board held in April 2024, and at the Meeting, the Trustees conferred extensively among themselves and with representatives of Allspring Funds Management about these matters. The Board has adopted a team-based approach, with each team consisting of a sub-set of Trustees, to assist the full Board in the discharge of its duties in reviewing investment performance and other matters throughout the year. The Independent Trustees were assisted in their evaluation of the Advisory Agreements by independent legal counsel, from whom they received separate legal advice and with whom they met separately.
In providing information to the Board, Allspring Funds Management and the Sub-Adviser were guided by a detailed set of requests for information submitted to them by independent legal counsel on behalf of the Independent Trustees at the start of the Board’s annual contract renewal process earlier in 2024. In considering and approving the Advisory Agreements, the Trustees considered the information they believed relevant, including but not limited to the information discussed below. The Board considered not only the specific information presented in connection with the Meeting, but also the knowledge gained over time through interactions with Allspring Funds Management and the Sub-Adviser about various topics. In this regard, the Board reviewed reports of Allspring Funds Management at each of its quarterly meetings, which included, among other things, portfolio reviews and investment performance reports. In addition, the Board and the teams mentioned above confer with portfolio managers at various times throughout the year. The Board did not identify any particular information or consideration that was all-important or controlling, and each individual Trustee may have attributed different weights to various factors.
After its deliberations, the Board unanimously determined that the compensation payable to Allspring Funds Management and the Sub-Adviser under each of the Advisory Agreements was reasonable, and approved the continuation of the Advisory Agreements for a one-year term. The Board considered the approval of the Advisory Agreements for the Fund as part of its consideration of agreements for funds across the complex, but its approvals were made on a fund-by-fund basis. The following summarizes a number of important, but not necessarily all, factors considered by the Board in support of its approvals.
Nature, extent, and quality of services
The Board received and considered various information regarding the nature, extent, and quality of services provided to the Fund by Allspring Funds Management and the Sub-Adviser under the Advisory Agreements. This information included a description of the investment advisory services and Fund-level administrative services covered by the Management Agreement, as well as, among other things, a summary of the background and experience of senior management of Allspring Global Investments, of which Allspring Funds Management and the Sub-Adviser are a part, and a summary of investments made in the Allspring Global Investments business.* The Board also received information about the services that continue to be provided by Wells Fargo & Co. and/or its affiliates (“Wells Fargo”) since the sale of Wells Fargo Asset Management to Allspring Global Investments Holdings, LLC, a holding company indirectly owned by certain private funds of GTCR LLC and Reverence Capital Partners, L.P., under a transition services agreement and an update on the anticipated timeline for exiting the transition services agreement. In addition, the Board received and considered information about the full range of services provided to the Fund by Allspring Funds Management and its affiliates.
The Board considered the qualifications, background, tenure, and responsibilities of each of the portfolio managers primarily responsible for the day-to-day portfolio management of the Fund. The Board noted that the portfolio managers responsible for the day-to-day portfolio management of the Fund would be changing during the Summer of 2024, and the Board considered the revised portfolio management team that would be taking over portfolio management responsibilities. The Board evaluated the ability of Allspring Funds Management and the Sub-Adviser to attract and retain qualified investment professionals, including research, advisory, and supervisory personnel.
*
The trade name for the asset management firm that includes Allspring Funds Management and the Sub-Adviser is “Allspring Global Investments.”
Allspring Large Cap Growth Fund | 23
Other information (unaudited)
The Board further considered the compliance programs and compliance records of Allspring Funds Management and the Sub-Adviser. The Board received and considered information about Allspring Global Investments’ risk management functions, which included information about Allspring Funds Management’s and the Sub-Adviser’s business continuity plans, their approaches to data privacy and cybersecurity, Allspring Funds Management’s role as administrator of the Fund’s liquidity risk management program, and fair valuation designee. The Board also received and considered information about Allspring Funds Management’s intermediary and vendor oversight program.
Fund investment performance and expenses
The Board considered the investment performance results for the Fund over various time periods ended December 31, 2023. The Board considered these results in comparison to the investment performance of funds in a universe that was determined by Broadridge Inc. (“Broadridge”) to be similar to the Fund (the “Universe”), and in comparison to the Fund’s benchmark index and to other comparative data. Broadridge is an independent provider of investment company data. The Board received a description of the methodology used by Broadridge to select the mutual funds in the performance Universe. The Board noted that the investment performance of the Fund (Administrator Class) was higher than the average investment performance of the Universe for the one-year period under review, and lower for the three-, five-, and ten-year periods under review. The Board also noted that the investment performance of the Fund was lower than the investment performance of its benchmark index, the Russell 1000 Growth Index, for all periods under review.
The Board received information concerning, and discussed factors contributing to, the underperformance of the Fund relative to the Universe and benchmark for the periods identified above. The Board took note of the explanations for the relative underperformance during these periods, including with respect to the investment decisions and market factors that affected the Fund’s investment performance. The Board also took note of the Fund’s outperformance relative to the Universe for the one-year period under review.
The Board also received and considered information regarding the Fund’s net operating expense ratios and their various components, including actual management fees, custodian and other non-management fees, and Rule 12b-1 and non-Rule 12b-1 shareholder service fees. The Board considered these ratios in comparison to the median ratios of funds in class-specific expense groups that were determined by Broadridge to be similar to the Fund (the “Groups”). The Board received a description of the methodology used by Broadridge to select the mutual funds in the expense Groups and an explanation of how funds comprising expense Groups and their expense ratios may vary from year-to-year. Based on the Broadridge reports, the Board noted that the net operating expense ratios of the Fund were in range of the median net operating expense ratios of the expense Groups for each share class. The Board noted Allspring Funds Management had agreed to reduce the net operating expense caps for each share class.
The Board took into account the Fund’s investment performance and expense information provided to it among the factors considered in deciding to re-approve the Advisory Agreements.
Investment management and sub-advisory fee rates
The Board reviewed and considered the contractual fee rates payable by the Fund to Allspring Funds Management under the Management Agreement, as well as the contractual fee rates payable by the Fund to Allspring Funds Management for class-level administrative services under a Class-Level Administration Agreement, which include, among other things, class-level transfer agency and sub-transfer agency costs (collectively, the “Management Rates”). The Board also reviewed and considered the contractual investment sub-advisory fee rates payable by Allspring Funds Management to the Sub-Adviser for investment sub-advisory services. It was noted that advisory fee waivers, if any, are at the fund level and not class level.
Among other information reviewed by the Board was a comparison of the Fund’s Management Rates with the average contractual investment management fee rates of funds in the expense Groups at a common asset level as well as transfer agency costs of the funds in the expense Groups. The Board noted that the Management Rates of the Fund were in range of the sum of these average rates for the Fund’s expense Groups for the Institutional Class and the Class R6 shares, and higher than the sum of the average rates for the expense Groups for the Class A and the Administrator Class shares.
The Board also received and considered information about the portion of the total management fee that was retained by Allspring Funds Management after payment of the fee to the Sub-Adviser for sub-advisory services. In assessing the reasonableness of this amount, the Board received and evaluated information about the nature and extent of responsibilities retained and risks assumed by Allspring Funds Management and not delegated to or assumed by the Sub-Adviser, and about Allspring Funds Management’s on-going oversight services. Given the affiliation between Allspring Funds Management and the Sub-Adviser, the Board ascribed limited relevance to the allocation of fees between them.
The Board also received and considered information about the nature and extent of services offered and fee rates charged by Allspring Funds Management and the Sub-Adviser to other types of clients with investment strategies similar to those of the Fund. In this regard, the Board received information about the significantly greater scope of services, and compliance, reporting and other legal and regulatory obligations and risks of managing proprietary mutual funds compared with those associated with managing assets of other types of clients, including third-party sub-advised fund clients and non-mutual fund clients such as institutional separate accounts.
24 | Allspring Large Cap Growth Fund
Other information (unaudited)
Based on its consideration of the factors and information it deemed relevant, including those described here, the Board determined that the compensation payable to Allspring Funds Management under the Management Agreement and to the Sub-Adviser under the Sub-Advisory Agreement was reasonable.
The Board received and considered information concerning the profitability of Allspring Funds Management, as well as the profitability of Allspring Global Investments, from providing services to the fund complex as a whole. The Board noted that the Sub-Adviser’s profitability information with respect to providing services to the Fund and other funds in the complex was subsumed in the Allspring Global Investments profitability analysis.
Allspring Funds Management reported on the methodologies and estimates used in calculating profitability, including a description of the methodology used to allocate certain expenses. Among other things, the Board noted that the levels of profitability reported on a fund-by-fund basis varied widely, depending on factors such as the size, type, and age of fund.
Based on its review, the Board did not deem the profits reported by Allspring Funds Management or Allspring Global Investments from services provided to the Fund to be at a level that would prevent it from approving the continuation of the Advisory Agreements.
The Board received and considered information about the potential for Allspring Funds Management to experience economies of scale in the provision of management services to the Fund, the difficulties of isolating and quantifying economies of scale at an individual fund level, and the extent to which potential scale benefits are shared with Fund shareholders. The Board noted the existence of breakpoints in the Fund’s management fee structure, which operate generally to reduce the Fund’s expense ratios as the Fund grows in size, and the size of the Fund in relation to such breakpoints. The Board considered that in addition to management fee breakpoints, Allspring Funds Management shares potential economies of scale from its management business in a variety of ways, including through fee waiver and expense reimbursement arrangements, competitive management fee rates set at the outset without regard to breakpoints, and investments in the business intended to enhance services available to shareholders.
The Board concluded that Allspring Funds Management’s arrangements with respect to the Fund, including contractual breakpoints, constituted a reasonable approach to sharing potential economies of scale with the Fund and its shareholders.
Other benefits to Allspring Funds Management and the Sub-Adviser
The Board received and considered information regarding potential “fall-out” or ancillary benefits received by Allspring Funds Management and its affiliates, including the Sub-Adviser, as a result of their relationships with the Fund. Ancillary benefits could include, among others, benefits directly attributable to other relationships with the Fund and benefits potentially derived from an increase in Allspring Funds Management’s and the Sub-Adviser’s business as a result of their relationships with the Fund. The Board noted that Allspring Funds Distributor, LLC, an affiliate of Allspring Funds Management, receives distribution-related fees in respect of shares sold or held through it. The Board also reviewed information about soft dollar credits earned and utilized by the Sub-Adviser.
Based on its consideration of the factors and information it deemed relevant, including those described here, the Board did not find that any ancillary benefits received by Allspring Funds Management and its affiliates, including the Sub-Adviser, were unreasonable.
At the Meeting, after considering the above-described factors and based on its deliberations and its evaluation of the information described above, the Board unanimously determined that the compensation payable to Allspring Funds Management and the Sub-Adviser under each of the Advisory Agreements was reasonable, and approved the continuation of the Advisory Agreements for a one-year term.
Allspring Large Cap Growth Fund | 25
For more information
More information about Allspring Funds is available free upon request. To obtain literature, please write, visit the Fund’s website, or call:
Allspring Funds
P.O. Box 219967
Kansas City, MO 64121-9967
Website: allspringglobal.com
Individual investors: 1-800-222-8222
Retail investment professionals: 1-888-877-9275
Institutional investment professionals: 1-800-260-5969
This report and the financial statements contained herein are submitted for the general information of the shareholders of the Fund. If this report is used for promotional purposes, distribution of the report must be accompanied or preceded by a current prospectus. Before investing, please consider the investment objectives, risks, charges, and expenses of the investment. For a current prospectus and, if available, a summary prospectus, containing this information, call 1-800-222-8222 or visit the Fund’s website at allspringglobal.com. Read the prospectus carefully before you invest or send money.
Allspring Global InvestmentsTM is the trade name for the asset management firms of Allspring Global Investments Holdings, LLC, a holding company indirectly owned by certain private funds of GTCR LLC and Reverence Capital Partners, L.P. These firms include but are not limited to Allspring Global Investments, LLC, and Allspring Funds Management, LLC. Certain products managed by Allspring entities are distributed by Allspring Funds Distributor, LLC (a broker-dealer and Member FINRA/SIPC).
This material is for general informational and educational purposes only and is NOT intended to provide investment advice or a recommendation of any kind - including a recommendation for any specific investment, strategy, or plan.
© 2024 Allspring Global Investments Holdings, LLC. All rights reserved.
NCSR3354 07-24
Allspring Large Company Value Fund
Long Form Financial Statements
Annual Report
Allspring Large Company Value Fund | 1
Portfolio of investments—July 31, 2024
| | | | | |
| | | | | | |
Communication services: 4.79% | | | | | | |
Diversified telecommunication services: 1.56% | | | | | | |
| | | | | | |
Liberty Global Ltd. Class A† | | | | | | |
Liberty Global Ltd. Class C† | | | | | | |
Verizon Communications, Inc. | | | | | | |
| | | | | | |
Interactive media & services: 0.09% | | | | | | |
| | | | | | |
| | | | | | |
| | | | | | |
Wireless telecommunication services: 1.13% | | | | | | |
| | | | | | |
Consumer discretionary: 6.08% | | | | | | |
| | | | | | |
| | | | | | |
| | | | | | |
| | | | | | |
| | | | | | |
| | | | | | |
Hotels, restaurants & leisure: 1.84% | | | | | | |
Chipotle Mexican Grill, Inc.† | | | | | | |
Texas Roadhouse, Inc. Class A | | | | | | |
| | | | | | |
Household durables: 0.02% | | | | | | |
| | | | | | |
| | | | | | |
Abercrombie & Fitch Co. Class A† | | | | | | |
| | | | | | |
| | | | | | |
| | | | | | |
| | | | | | |
Textiles, apparel & luxury goods: 0.43% | | | | | | |
Skechers USA, Inc. Class A† | | | | | | |
| | | | | | |
| | | | | | |
| | | | | | |
| | | | | | |
| | | | | | |
The accompanying notes are an integral part of these financial statements.
2 | Allspring Large Company Value Fund
Portfolio of investments—July 31, 2024
| | | | | |
Consumer staples distribution & retail: 3.88% | | | | | | |
| | | | | | |
| | | | | | |
| | | | | | |
| | | | | | |
| | | | | | |
| | | | | | |
| | | | | | |
Mondelez International, Inc. Class A | | | | | | |
Household products: 2.18% | | | | | | |
| | | | | | |
| | | | | | |
| | | | | | |
| | | | | | |
| | | | | | |
| | | | | | |
Energy equipment & services: 0.86% | | | | | | |
| | | | | | |
Weatherford International PLC† | | | | | | |
| | | | | | |
Oil, gas & consumable fuels: 5.86% | | | | | | |
| | | | | | |
| | | | | | |
| | | | | | |
| | | | | | |
| | | | | | |
| | | | | | |
International Seaways, Inc. | | | | | | |
| | | | | | |
| | | | | | |
| | | | | | |
| | | | | | |
| | | | | | |
| | | | | | |
| | | | | | |
| | | | | | |
Bank of NT Butterfield & Son Ltd. | | | | | | |
| | | | | | |
First Citizens BancShares, Inc. Class A | | | | | | |
| | | | | | |
| | | | | | |
| | | | | | |
| | | | | | |
| | | | | | |
The accompanying notes are an integral part of these financial statements.
Allspring Large Company Value Fund | 3
Portfolio of investments—July 31, 2024
| | | | | |
Capital markets(continued) | | | | | | |
| | | | | | |
| | | | | | |
| | | | | | |
Goldman Sachs Group, Inc. | | | | | | |
Intercontinental Exchange, Inc. | | | | | | |
| | | | | | |
| | | | | | |
| | | | | | |
| | | | | | |
| | | | | | |
| | | | | | |
Capital One Financial Corp. | | | | | | |
| | | | | | |
Financial services: 5.50% | | | | | | |
Berkshire Hathaway, Inc. Class B† | | | | | | |
| | | | | | |
Jackson Financial, Inc. Class A | | | | | | |
| | | | | | |
| | | | | | |
| | | | | | |
| | | | | | |
| | | | | | |
Oscar Health, Inc. Class A† | | | | | | |
| | | | | | |
Reinsurance Group of America, Inc. | | | | | | |
| | | | | | |
| | | | | | |
| | | | | | |
ACADIA Pharmaceuticals, Inc.† | | | | | | |
| | | | | | |
| | | | | | |
Catalyst Pharmaceuticals, Inc.† | | | | | | |
| | | | | | |
Regeneron Pharmaceuticals, Inc.† | | | | | | |
Vertex Pharmaceuticals, Inc.† | | | | | | |
| | | | | | |
Health care equipment & supplies: 1.71% | | | | | | |
| | | | | | |
| | | | | | |
| | | | | | |
Health care providers & services: 6.09% | | | | | | |
| | | | | | |
| | | | | | |
The accompanying notes are an integral part of these financial statements.
4 | Allspring Large Company Value Fund
Portfolio of investments—July 31, 2024
| | | | | |
Health care providers & services(continued) | | | | | | |
| | | | | | |
| | | | | | |
| | | | | | |
Life sciences tools & services: 0.43% | | | | | | |
Thermo Fisher Scientific, Inc. | | | | | | |
| | | | | | |
| | | | | | |
| | | | | | |
| | | | | | |
| | | | | | |
| | | | | | |
| | | | | | |
Aerospace & defense: 5.38% | | | | | | |
| | | | | | |
| | | | | | |
| | | | | | |
| | | | | | |
| | | | | | |
| | | | | | |
| | | | | | |
| | | | | | |
| | | | | | |
Construction & engineering: 0.90% | | | | | | |
| | | | | | |
Ground transportation: 1.62% | | | | | | |
| | | | | | |
Industrial conglomerates: 1.32% | | | | | | |
Honeywell International, Inc. | | | | | | |
| | | | | | |
| | | | | | |
Information technology: 8.50% | | | | | | |
Communications equipment: 2.23% | | | | | | |
| | | | | | |
| | | | | | |
| | | | | | |
Electronic equipment, instruments & components: 0.38% | | | | | | |
| | | | | | |
| | | | | | |
| | | | | | |
The accompanying notes are an integral part of these financial statements.
Allspring Large Company Value Fund | 5
Portfolio of investments—July 31, 2024
| | | | | |
Semiconductors & semiconductor equipment: 5.11% | | | | | | |
| | | | | | |
| | | | | | |
| | | | | | |
| | | | | | |
| | | | | | |
| | | | | | |
| | | | | | |
| | | | | | |
Technology hardware, storage & peripherals: 0.28% | | | | | | |
Hewlett Packard Enterprise Co. | | | | | | |
Super Micro Computer, Inc.† | | | | | | |
| | | | | | |
| | | | | | |
| | | | | | |
| | | | | | |
Construction materials: 1.23% | | | | | | |
| | | | | | |
| | | | | | |
Alpha Metallurgical Resources, Inc. | | | | | | |
| | | | | | |
| | | | | | |
| | | | | | |
| | | | | | |
Innovative Industrial Properties, Inc. | | | | | | |
| | | | | | |
| | | | | | |
Real estate management & development: 0.64% | | | | | | |
Jones Lang LaSalle, Inc.† | | | | | | |
Specialized REITs : 2.00% | | | | | | |
| | | | | | |
| | | | | | |
| | | | | | |
| | | | | | |
Electric utilities: 3.27% | | | | | | |
| | | | | | |
| | | | | | |
| | | | | | |
| | | | | | |
The accompanying notes are an integral part of these financial statements.
6 | Allspring Large Company Value Fund
Portfolio of investments—July 31, 2024
| | | | | |
| | | | | | |
| | | | | | |
Total common stocks (Cost $207,152,883) | | | | | | |
| | | | | |
Short-term investments: 2.11% | | | | | | |
Investment companies: 2.11% | | | | | | |
Allspring Government Money Market Fund Select Class♠∞ | | | | | | |
Total short-term investments (Cost $5,131,370) | | | | | | |
Total investments in securities (Cost $212,284,253) | | | | | | |
Other assets and liabilities, net | | | | | | |
| | | | | | |
| Non-income-earning security |
| The issuer of the security is an affiliated person of the Fund as defined in the Investment Company Act of 1940. |
| The rate represents the 7-day annualized yield at period end. |
|
| Real estate investment trust |
Investments in affiliates
An affiliated investment is an investment in which the Fund owns at least 5% of the outstanding voting shares of the issuer or as a result of other relationships, such as the Fund and the issuer having the same investment manager. Transactions with issuers that were affiliates of the Fund at the end of the period were as follows:
| | | | | Net
change in
unrealized
gains
(losses) | | | Income
from
affiliated
securities |
| | | | | | | | |
Allspring Government Money Market Fund Select Class | | | | | | | | |
The accompanying notes are an integral part of these financial statements.
Allspring Large Company Value Fund | 7
Statement of assets and liabilities—July 31, 2024
Financial statements
Statement of assets and liabilities
| |
Investments in unaffiliated securities, at value (cost $207,152,883) | |
Investments in affiliated securities, at value (cost $5,131,370) | |
Cash at broker segregated for futures contracts | |
| |
Receivable for Fund shares sold | |
Receivable for daily variation margin on open futures contracts | |
Prepaid expenses and other assets | |
| |
| |
Payable for Fund shares redeemed | |
Shareholder servicing fees payable | |
| |
Administration fees payable | |
| |
Trustees’ fees and expenses payable | |
Accrued expenses and other liabilities | |
| |
| |
| |
| |
Total distributable earnings | |
| |
Computation of net asset value and offering price per share | |
| |
Shares outstanding–Class A1 | |
Net asset value per share–Class A | |
Maximum offering price per share – Class A2 | |
| |
Shares outstanding–Class C1 | |
Net asset value per share–Class C | |
| |
Shares outstanding–Class R61 | |
Net asset value per share–Class R6 | |
Net assets–Administrator Class | |
Shares outstanding–Administrator Class1 | |
Net asset value per share–Administrator Class | |
Net assets–Institutional Class | |
Shares outstanding–Institutional Class1 | |
Net asset value per share–Institutional Class | |
1 The Fund has an unlimited number of authorized shares.
2 Maximum offering price is computed as 100/94.25 of net asset value. On investments of $50,000 or more, the offering price is reduced.
The accompanying notes are an integral part of these financial statements.
8 | Allspring Large Company Value Fund
Statement of operations—year ended July 31, 2024
Statement of operations
| |
Dividends (net of foreign withholdings taxes of $1,555) | |
Income from affiliated securities | |
| |
| |
| |
| |
| |
| |
| |
| |
| |
| |
Shareholder servicing fees | |
| |
| |
| |
| |
| |
Custody and accounting fees | |
| |
| |
Shareholder report expenses | |
Trustees’ fees and expenses | |
| |
| |
Less: Fee waivers and/or expense reimbursements | |
| |
| |
| |
| |
| |
Realized and unrealized gains (losses) on investments | |
| |
| |
| |
Net realized gains on investments | |
Net change in unrealized gains (losses) on | |
| |
| |
Net change in unrealized gains (losses) on investments | |
Net realized and unrealized gains (losses) on investments | |
Net increase in net assets resulting from operations | |
The accompanying notes are an integral part of these financial statements.
Allspring Large Company Value Fund | 9
Statement of changes in net assets
Statement of changes in net assets
| | |
| | | | |
| | | | |
Net realized gains on investments | | | | |
Net change in unrealized gains (losses) on investments | | | | |
Net increase in net assets resulting from operations | | | | |
Distributions to shareholders from | | | | |
Net investment income and net realized gains | | | | |
| | | | |
| | | | |
| | | | |
| | | | |
| | | | |
Total distributions to shareholders | | | | |
Capital share transactions | | | | |
Proceeds from shares sold | | | | |
| | | | |
| | | | |
| | | | |
| | | | |
| | | | |
| | | | |
Reinvestment of distributions | | | | |
| | | | |
| | | | |
| | | | |
| | | | |
| | | | |
| | | | |
Payment for shares redeemed | | | | |
| | | | |
| | | | |
| | | | |
| | | | |
| | | | |
| | | | |
Net decrease in net assets resulting from capital share transactions | | | | |
Total increase (decrease) in net assets | | | | |
| | | | |
| | | | |
| | | | |
The accompanying notes are an integral part of these financial statements.
10 | Allspring Large Company Value Fund
Financial highlights
(For a share outstanding throughout each period)
| |
| | | | | |
Net asset value, beginning of period | | | | | |
| | | | | |
Net realized and unrealized gains (losses) on investments | | | | | |
Total from investment operations | | | | | |
Distributions to shareholders from | | | | | |
| | | | | |
| | | | | |
Total distributions to shareholders | | | | | |
Net asset value, end of period | | | | | |
| | | | | |
Ratios to average net assets (annualized) | | | | | |
| | | | | |
| | | | | |
| | | | | |
| | | | | |
| | | | | |
Net assets, end of period (000s omitted) | | | | | |
| Calculated based upon average shares outstanding |
| Total return calculations do not include any sales charges. Returns include adjustments required by U.S. GAAP and may differ from net asset values and performance reported elsewhere. |
The accompanying notes are an integral part of these financial statements.
Allspring Large Company Value Fund | 11
(For a share outstanding throughout each period)
| |
| | | | | |
Net asset value, beginning of period | | | | | |
| | | | | |
Net realized and unrealized gains (losses) on investments | | | | | |
Total from investment operations | | | | | |
Distributions to shareholders from | | | | | |
| | | | | |
| | | | | |
Total distributions to shareholders | | | | | |
Net asset value, end of period | | | | | |
| | | | | |
Ratios to average net assets (annualized) | | | | | |
| | | | | |
| | | | | |
| | | | | |
| | | | | |
| | | | | |
Net assets, end of period (000s omitted) | | | | | |
| Calculated based upon average shares outstanding |
| Total return calculations do not include any sales charges. Returns include adjustments required by U.S. GAAP and may differ from net asset values and performance reported elsewhere. |
The accompanying notes are an integral part of these financial statements.
12 | Allspring Large Company Value Fund
(For a share outstanding throughout each period)
| |
| | | | | |
Net asset value, beginning of period | | | | | |
| | | | | |
Net realized and unrealized gains (losses) on investments | | | | | |
Total from investment operations | | | | | |
Distributions to shareholders from | | | | | |
| | | | | |
| | | | | |
Total distributions to shareholders | | | | | |
Net asset value, end of period | | | | | |
| | | | | |
Ratios to average net assets (annualized) | | | | | |
| | | | | |
| | | | | |
| | | | | |
| | | | | |
| | | | | |
Net assets, end of period (000s omitted) | | | | | |
| Calculated based upon average shares outstanding |
| Returns include adjustments required by U.S. GAAP and may differ from net asset values and performance reported elsewhere. |
The accompanying notes are an integral part of these financial statements.
Allspring Large Company Value Fund | 13
(For a share outstanding throughout each period)
| |
| | | | | |
Net asset value, beginning of period | | | | | |
| | | | | |
Net realized and unrealized gains (losses) on investments | | | | | |
Total from investment operations | | | | | |
Distributions to shareholders from | | | | | |
| | | | | |
| | | | | |
Total distributions to shareholders | | | | | |
Net asset value, end of period | | | | | |
| | | | | |
Ratios to average net assets (annualized) | | | | | |
| | | | | |
| | | | | |
| | | | | |
| | | | | |
| | | | | |
Net assets, end of period (000s omitted) | | | | | |
| Calculated based upon average shares outstanding |
| Returns include adjustments required by U.S. GAAP and may differ from net asset values and performance reported elsewhere. |
The accompanying notes are an integral part of these financial statements.
14 | Allspring Large Company Value Fund
(For a share outstanding throughout each period)
| |
| | | | | |
Net asset value, beginning of period | | | | | |
| | | | | |
Net realized and unrealized gains (losses) on investments | | | | | |
Total from investment operations | | | | | |
Distributions to shareholders from | | | | | |
| | | | | |
| | | | | |
Total distributions to shareholders | | | | | |
Net asset value, end of period | | | | | |
| | | | | |
Ratios to average net assets (annualized) | | | | | |
| | | | | |
| | | | | |
| | | | | |
| | | | | |
| | | | | |
Net assets, end of period (000s omitted) | | | | | |
| Calculated based upon average shares outstanding |
| Returns include adjustments required by U.S. GAAP and may differ from net asset values and performance reported elsewhere. |
The accompanying notes are an integral part of these financial statements.
Allspring Large Company Value Fund | 15
Notes to financial statements
Notes to financial statements
Allspring Funds Trust (the “Trust”), a Delaware statutory trust organized on March 10, 1999, is an open-end management investment company registered under the Investment Company Act of 1940, as amended (the “1940 Act”). As an investment company, the Trust follows the accounting and reporting guidance in Financial Accounting Standards Board (“FASB”) Accounting Standards Codification Topic 946, Financial Services – Investment Companies. These financial statements report on the Allspring Large Company Value Fund (the “Fund”) which is a diversified series of the Trust.
2.
SIGNIFICANT ACCOUNTING POLICIES
The following significant accounting policies, which are consistently followed in the preparation of the financial statements of the Fund, are in conformity with U.S. generally accepted accounting principles (“GAAP”) which require management to make estimates and assumptions that affect the reported amounts of assets and liabilities, disclosure of contingent assets and liabilities at the date of the financial statements, and the reported amounts of income and expenses during the reporting period. Actual results could differ from those estimates.
All investments are valued each business day as of the close of regular trading on the New York Stock Exchange (generally 4 p.m. Eastern Time), although the Fund may deviate from this calculation time under unusual or unexpected circumstances.
Equity securities, exchange-traded funds and futures contracts that are listed on a foreign or domestic exchange or market are valued at the official closing price or, if none, the last sales price.
Investments in registered open-end investment companies (other than those listed on a foreign or domestic exchange or market) are valued at net asset value.
Investments which are not valued using the methods discussed above are valued at their fair value, as determined in good faith by Allspring Funds Management, LLC (“Allspring Funds Management”), which was named the valuation designee by the Board of Trustees. As the valuation designee, Allspring Funds Management is responsible for day-to-day valuation activities for the Allspring Funds. In connection with these responsibilities, Allspring Funds Management has established a Valuation Committee and has delegated to it the authority to take any actions regarding the valuation of portfolio securities that the Valuation Committee deems necessary or appropriate, including determining the fair value of portfolio securities. On a quarterly basis, the Board of Trustees receives reports of valuation actions taken by the Valuation Committee. On at least an annual basis, the Board of Trustees receives an assessment of the adequacy and effectiveness of Allspring Funds Management’s process for determining the fair value of the portfolio of investments.
Foreign currency translation
The accounting records of the Fund are maintained in U.S. dollars. The values of other assets and liabilities denominated in foreign currencies are translated into U.S. dollars at rates provided by an independent foreign currency pricing source at a time each business day specified by the Valuation Committee. Purchases and sales of securities, and income and expenses are converted at the rate of exchange on the respective dates of such transactions. Net realized foreign exchange gains or losses arise from sales of foreign currencies, currency gains or losses realized between the trade and settlement dates on securities transactions, and the difference between the amounts of dividends, interest and foreign withholding taxes recorded and the U.S. dollar equivalent of the amounts actually paid or received. Net unrealized foreign exchange gains and losses arise from changes in the fair value of assets and liabilities other than investments in securities resulting from changes in exchange rates. The changes in net assets arising from changes in exchange rates of securities and the changes in net assets resulting from changes in market prices of securities are not separately presented. Such changes are included in net realized and unrealized gains or losses from investments.
Futures contracts are agreements between the Fund and a counterparty to buy or sell a specific amount of a commodity, financial instrument or currency at a specified price and on a specified date. The Fund may buy and sell futures contracts in order to gain exposure to, or protect against, changes in security values and is subject to equity price risk. The primary risks associated with the use of futures contracts are the imperfect correlation between changes in market values of securities held by the Fund and the prices of futures contracts, and the possibility of an illiquid market. Futures contracts are generally entered into on a regulated futures exchange and cleared through a clearinghouse associated with the exchange. With futures contracts, there is minimal counterparty risk to the Fund since futures contracts are exchange-traded and the exchange’s clearinghouse, as the counterparty to all exchange-traded futures, guarantees the futures contracts against default.
Upon entering into a futures contract, the Fund is required to deposit either cash or securities (initial margin) with the broker in an amount equal to a certain percentage of the contract value. Subsequent payments (variation margin) are paid to or received from the broker each day equal to the daily changes in the contract value. Such payments are recorded as unrealized gains or losses and, if any, shown as variation margin receivable (payable) in the Statement of Assets and Liabilities. Should the Fund fail to make requested variation margin payments, the broker can gain access to the initial margin to satisfy the Fund’s payment obligations. When the contracts are closed, a realized gain or loss is recorded in the Statement of Operations.
Security transactions and income recognition
Securities transactions are recorded on a trade date basis. Realized gains or losses are recorded on the basis of identified cost.
16 | Allspring Large Company Value Fund
Notes to financial statements
Dividend income is recognized on the ex-dividend date. Dividend income is recorded net of foreign taxes withheld where recovery of such taxes is not assured.
Interest earned on cash balances held at the custodian is recorded as interest income.
Distributions received from REIT investments may be characterized as ordinary income, capital gains, or a return of capital to the Fund based on information provided by the REIT. The proper characterization of REIT distributions is generally not known until after the end of each calendar year. As such, estimates may be used in reporting the character of income and distributions for financial statement purposes.
Distributions to shareholders
Distributions to shareholders are recorded on the ex-dividend date and paid from net investment income quarterly and any net realized gains are paid at least annually. Such distributions are determined in accordance with income tax regulations and may differ from U.S. GAAP. Dividend sources are estimated at the time of declaration. The tax character of distributions is determined as of the Fund’s fiscal year end. Therefore, a portion of the Fund’s distributions made prior to the Fund’s fiscal year end may be categorized as a tax return of capital at year end.
The Fund intends to continue to qualify as a regulated investment company by distributing substantially all of its investment company taxable income and any net realized capital gains (after reduction for capital loss carryforwards) sufficient to relieve it from all, or substantially all, federal income taxes. Accordingly, no provision for federal income taxes was required.
The Fund’s income and federal excise tax returns and all financial records supporting those returns for the prior three fiscal years are subject to examination by the federal and Delaware revenue authorities. Management has analyzed the Fund’s tax positions taken on federal, state, and foreign tax returns, as applicable, for all open tax years and does not believe that there are any uncertain tax positions that require recognition of a tax liability.
As of July 31, 2024, the aggregate cost of all investments for federal income tax purposes was $212,766,582 and the unrealized gains (losses) consisted of:
The separate classes of shares offered by the Fund differ principally in applicable sales charges, distribution, shareholder servicing, and administration fees. Class specific expenses are charged directly to that share class. Investment income, common fund-level expenses, and realized and unrealized gains (losses) on investments are allocated daily to each class of shares based on the relative proportion of net assets of each class.
3.
FAIR VALUATION MEASUREMENTS
Fair value measurements of investments are determined within a framework that has established a fair value hierarchy based upon the various data inputs utilized in determining the value of the Fund’s investments. The three-level hierarchy gives the highest priority to unadjusted quoted prices in active markets for identical assets or liabilities (Level 1) and the lowest priority to unobservable inputs (Level 3). The Fund’s investments are classified within the fair value hierarchy based on the lowest level of input that is significant to the fair value measurement. The inputs are summarized into three broad levels as follows:
•Level 1—quoted prices in active markets for identical securities
•Level 2—other significant observable inputs (including quoted prices for similar securities, interest rates, prepayment speeds, credit risk, etc.)
•Level 3—significant unobservable inputs (including the Fund’s own assumptions in determining the fair value of investments)
The inputs or methodologies used for valuing investments in securities are not necessarily an indication of the risk associated with investing in those securities.
Allspring Large Company Value Fund | 17
Notes to financial statements
The following is a summary of the inputs used in valuing the Fund’s assets and liabilities as of July 31, 2024:
| | Other significant
observable inputs
(Level 2) | Significant
unobservable inputs
(Level 3) | |
| | | | |
| | | | |
| | | | |
| | | | |
| | | | |
| | | | |
| | | | |
| | | | |
| | | | |
| | | | |
| | | | |
| | | | |
| | | | |
| | | | |
| | | | |
| | | | |
| | | | |
| | | | |
| | | | |
Futures contracts are reported at their cumulative unrealized gains (losses) at measurement date as reported in the table following the Portfolio of Investments. For futures contracts, the current day’s variation margin is reported on the Statement of Assets and Liabilities. All other assets and liabilities are reported at their market value at measurement date.
Additional sector, industry or geographic detail, if any, is included in the Portfolio of Investments.
At July 31, 2024, the Fund did not have any transfers into/out of Level 3.
4.
TRANSACTIONS WITH AFFILIATES
Allspring Funds Management, a wholly owned subsidiary of Allspring Global Investments Holdings, LLC, a holding company indirectly owned by certain private funds of GTCR LLC and Reverence Capital Partners, L.P., is the manager of the Fund and provides advisory and fund-level administrative services under an investment management agreement. Under the investment management agreement, Allspring Funds Management is responsible for, among other services, implementing the investment objectives and strategies of the Fund, supervising the subadviser and providing fund-level administrative services in connection with the Fund’s operations. As compensation for its services under the investment management agreement, Allspring Funds Management is entitled to receive a management fee at the following annual rate based on the Fund’s average daily net assets:
For the year ended July 31, 2024, the management fee was equivalent to an annual rate of 0.40% of the Fund’s average daily net assets.
Allspring Funds Management has retained the services of a subadviser to provide daily portfolio management to the Fund. The fee for subadvisory services is borne by Allspring Funds Management. Allspring Global Investments, LLC, an affiliate of Allspring Funds Management and a wholly owned subsidiary of Allspring Global Investments Holdings, LLC, is the subadviser to the Fund and is entitled to receive a fee from Allspring Funds Management at an annual rate starting at 0.25% and declining to 0.15% as the average daily net assets of the Fund increase.
Under a class-level administration agreement, Allspring Funds Management provides class-level administrative services to the Fund, which includes paying fees and expenses for services provided by the transfer agent, sub-transfer agents, omnibus account servicers and record-keepers. As
18 | Allspring Large Company Value Fund
Notes to financial statements
compensation for its services under the class-level administration agreement, Allspring Funds Management receives an annual fee which is calculated based on the average daily net assets of each class as follows:
| Class-level
administration fee |
| |
| |
| |
| |
| |
Waivers and/or expense reimbursements
Allspring Funds Management has contractually committed to waive and/or reimburse management and administration fees to the extent necessary to maintain certain net operating expense ratios for the Fund. When each class of the Fund has exceeded its expense cap, Allspring Funds Management will waive fees and/or reimburse expenses from fund-level expenses on a proportionate basis and then from class specific expenses. When only certain classes exceed their expense caps, waivers and/or reimbursements are applied against class specific expenses before fund-level expenses. Allspring Funds Management has contractually committed through November 30, 2024 to waive fees and/or reimburse expenses to the extent necessary to cap the Fund’s expenses. Prior to or after the commitment expiration date, the cap may be increased or the commitment to maintain the cap may be terminated only with the approval of the Board of Trustees. As of July 31, 2024, the contractual caps are as follows:
The Trust has adopted a distribution plan for Class C shares pursuant to Rule 12b-1 under the 1940 Act. A distribution fee is charged to Class C shares and paid to Allspring Funds Distributor, LLC (“Allspring Funds Distributor”), the principal underwriter, an affiliate of Allspring Funds Management, at an annual rate up to 0.75% of the average daily net assets of Class C shares.
In addition, Allspring Funds Distributor is entitled to receive the front-end sales charge from the purchase of Class A shares and a contingent deferred sales charge on the redemption of certain Class A shares. Allspring Funds Distributor is also entitled to receive the contingent deferred sales charges from redemptions of Class C shares. For the year ended July 31, 2024, Allspring Funds Distributor received $1,228 from the sale of Class A shares. No contingent deferred sales charges were incurred by Class A and Class C shares for the year ended July 31, 2024.
Shareholder servicing fees
The Trust has entered into contracts with one or more shareholder servicing agents, whereby Class A, Class C and Administrator Class are charged a fee at an annual rate up to 0.25% of the average daily net assets of each respective class. A portion of these total shareholder servicing fees were paid to affiliates of the Fund.
The Fund may purchase or sell portfolio investment securities to certain affiliates pursuant to Rule 17a-7 under the 1940 Act and under procedures adopted by the Board of Trustees. The procedures have been designed to ensure that these interfund transactions, which do not incur broker commissions, are effected at current market prices. Pursuant to these procedures, the Fund did not have any interfund transactions during the year ended July 31, 2024.
5.
INVESTMENT PORTFOLIO TRANSACTIONS
Purchases and sales of investments, excluding U.S. government obligations (if any) and short-term securities, for the year ended July 31, 2024 were $518,952,455 and $537,652,126, respectively.
6.
DERIVATIVE TRANSACTIONS
During the year ended July 31, 2024, the Fund entered into futures contracts to gain market exposure. The Fund had an average notional amount of $4,873,693 in long futures contracts during the year ended July 31, 2024.
The fair value, realized gains or losses and change in unrealized gains or losses, if any, on derivative instruments are reflected in the corresponding financial statement captions.
Allspring Large Company Value Fund | 19
Notes to financial statements
The Trust (excluding the money market funds), Allspring Master Trust and Allspring Variable Trust are parties to a $275,000,000 (prior to July 9, 2024: $350,000,000), revolving credit agreement whereby the Fund is permitted to use bank borrowings for temporary or emergency purposes, such as to fund shareholder redemption requests. Interest under the credit agreement is charged to the Fund based on a borrowing rate equal to the higher of the Federal Funds rate or the overnight bank funding rate in effect on that day plus a spread. In addition, an annual commitment fee based on the unused balance is allocated to each participating fund.
For the year ended July 31, 2024, there were no borrowings by the Fund under the agreement.
8.
DISTRIBUTIONS TO SHAREHOLDERS
The tax character of distributions paid were as follows:
As of July 31, 2024, the components of distributable earnings on a tax basis were as follows:
Undistributed
ordinary
income | Undistributed
long-term
gain | |
| | |
Under the Fund’s organizational documents, the officers and Trustees have been granted certain indemnification rights against certain liabilities that may arise out of performance of their duties to the Fund. The Fund has entered into a separate agreement with each Trustee that converts indemnification rights currently existing under the Fund’s organizational documents into contractual rights that cannot be changed in the future without the consent of the Trustee. Additionally, in the normal course of business, the Fund may enter into contracts with service providers that contain a variety of indemnification clauses. The Fund’s maximum exposure under these arrangements is dependent on future claims that may be made against the Fund and, therefore, cannot be estimated.
20 | Allspring Large Company Value Fund
Report of independent registered public accounting firm
To the Shareholders of the Fund and Board of Trustees
Allspring Funds Trust:
Opinion on the Financial Statements
We have audited the accompanying statement of assets and liabilities of Allspring Large Company Value Fund (the Fund), one of the funds constituting Allspring Funds Trust, including the portfolio of investments, as of July 31, 2024, the related statement of operations for the year then ended, the statements of changes in net assets for each of the years in the two-year period then ended, and the related notes (collectively, the financial statements) and the financial highlights for each of the years in the five-year period then ended. In our opinion, the financial statements and financial highlights present fairly, in all material respects, the financial position of the Fund as of July 31, 2024, the results of its operations for the year then ended, the changes in its net assets for each of the years in the two-year period then ended, and the financial highlights for each of the years in the five-year period then ended, in conformity with U.S. generally accepted accounting principles.
These financial statements and financial highlights are the responsibility of the Fund’s management. Our responsibility is to express an opinion on these financial statements and financial highlights based on our audits. We are a public accounting firm registered with the Public Company Accounting Oversight Board (United States) (PCAOB) and are required to be independent with respect to the Fund in accordance with the U.S. federal securities laws and the applicable rules and regulations of the Securities and Exchange Commission and the PCAOB.
We conducted our audits in accordance with the standards of the PCAOB. Those standards require that we plan and perform the audit to obtain reasonable assurance about whether the financial statements and financial highlights are free of material misstatement, whether due to error or fraud. Our audits included performing procedures to assess the risks of material misstatement of the financial statements and financial highlights, whether due to error or fraud, and performing procedures that respond to those risks. Such procedures included examining, on a test basis, evidence regarding the amounts and disclosures in the financial statements and financial highlights. Such procedures also included confirmation of securities owned as of July 31, 2024, by correspondence with the custodian, transfer agent and brokers. Our audits also included evaluating the accounting principles used and significant estimates made by management, as well as evaluating the overall presentation of the financial statements and financial highlights. We believe that our audits provide a reasonable basis for our opinion.

We have not been able to determine the specific year that we began serving as the auditor of one or more Allspring Funds investment companies; however, we are aware that we have served as the auditor of one or more Allspring Funds investment companies since at least 1955.
September 25, 2024
Allspring Large Company Value Fund | 21
Other information (unaudited)
Other information
For corporate shareholders, pursuant to Section 854 of the Internal Revenue Code, 26% of ordinary income dividends qualify for the corporate dividends-received deduction for the fiscal year ended July 31, 2024.
Pursuant to Section 854 of the Internal Revenue Code, $714,920 of income dividends paid during the fiscal year ended July 31, 2024 has been designated as qualified dividend income (QDI).
For the fiscal year ended July 31, 2024, $175,017 has been designated as interest-related dividends for nonresident alien shareholders pursuant to Section 871 of the Internal Revenue Code.
A description of the policies and procedures used to determine how to vote proxies relating to portfolio securities is available without charge, upon request, by calling 1-866-259-3305, visiting our website at allspringglobal.com, or visiting the SEC website at sec.gov. Information regarding how the proxies related to portfolio securities were voted during the most recent 12-month period ended June 30 is available on the website at allspringglobal.com or by visiting the SEC website at sec.gov.
Quarterly portfolio holdings information
The Fund files its complete schedule of portfolio holdings with the SEC for the first and third quarters of each fiscal year as an exhibit to its reports on Form N-PORT. Shareholders may view the filed Form N-PORT by visiting the SEC website at sec.gov.
22 | Allspring Large Company Value Fund
Other information (unaudited)
Item 8. Changes in and disagreements with accountants
Item 9. Matters submitted to fund shareholders for a vote
Item 10. Remuneration paid to directors, officers and others
Refer to information in the Statement of operations.
Allspring Large Company Value Fund | 23
Other information (unaudited)
Item 11. Statement regarding basis for the board’s approval of investment advisory contract
Board consideration of investment management and sub-advisory agreements:
Under the Investment Company Act of 1940 (the “1940 Act”), the Board of Trustees (the “Board”) of Allspring Funds Trust (the “Trust”) must determine annually whether to approve the continuation of the Trust’s investment management and sub-advisory agreements. In this regard, at a Board meeting held on May 28-30, 2024 (the “Meeting”), the Board, all the members of which have no direct or indirect interest in the investment management and sub-advisory agreements and are not “interested persons” of the Trust, as defined in the 1940 Act (the “Independent Trustees”), reviewed and approved for the Allspring Large Company Value Fund (the “Fund”): (i) an investment management agreement (the “Management Agreement”) with Allspring Funds Management, LLC (“Allspring Funds Management”); and (ii) an investment sub-advisory agreement (the “Sub-Advisory Agreement”) with Allspring Global Investments, LLC (the “Sub-Adviser”), an affiliate of Allspring Funds Management. The Management Agreement and the Sub-Advisory Agreement are collectively referred to as the “Advisory Agreements.”
At the Meeting, the Board considered the factors and reached the conclusions described below relating to the selection of Allspring Funds Management and the Sub-Adviser and the approval of the Advisory Agreements. Prior to the Meeting, including at a meeting of the Board held in April 2024, and at the Meeting, the Trustees conferred extensively among themselves and with representatives of Allspring Funds Management about these matters. The Board has adopted a team-based approach, with each team consisting of a sub-set of Trustees, to assist the full Board in the discharge of its duties in reviewing investment performance and other matters throughout the year. The Independent Trustees were assisted in their evaluation of the Advisory Agreements by independent legal counsel, from whom they received separate legal advice and with whom they met separately.
In providing information to the Board, Allspring Funds Management and the Sub-Adviser were guided by a detailed set of requests for information submitted to them by independent legal counsel on behalf of the Independent Trustees at the start of the Board’s annual contract renewal process earlier in 2024. In considering and approving the Advisory Agreements, the Trustees considered the information they believed relevant, including but not limited to the information discussed below. The Board considered not only the specific information presented in connection with the Meeting, but also the knowledge gained over time through interactions with Allspring Funds Management and the Sub-Adviser about various topics. In this regard, the Board reviewed reports of Allspring Funds Management at each of its quarterly meetings, which included, among other things, portfolio reviews and investment performance reports. In addition, the Board and the teams mentioned above confer with portfolio managers at various times throughout the year. The Board did not identify any particular information or consideration that was all-important or controlling, and each individual Trustee may have attributed different weights to various factors.
After its deliberations, the Board unanimously determined that the compensation payable to Allspring Funds Management and the Sub-Adviser under each of the Advisory Agreements was reasonable, and approved the continuation of the Advisory Agreements for a one-year term. The Board considered the approval of the Advisory Agreements for the Fund as part of its consideration of agreements for funds across the complex, but its approvals were made on a fund-by-fund basis. The following summarizes a number of important, but not necessarily all, factors considered by the Board in support of its approvals.
Nature, extent, and quality of services
The Board received and considered various information regarding the nature, extent, and quality of services provided to the Fund by Allspring Funds Management and the Sub-Adviser under the Advisory Agreements. This information included a description of the investment advisory services and Fund-level administrative services covered by the Management Agreement, as well as, among other things, a summary of the background and experience of senior management of Allspring Global Investments, of which Allspring Funds Management and the Sub-Adviser are a part, and a summary of investments made in the Allspring Global Investments business.* The Board also received information about the services that continue to be provided by Wells Fargo & Co. and/or its affiliates (“Wells Fargo”) since the sale of Wells Fargo Asset Management to Allspring Global Investments Holdings, LLC, a holding company indirectly owned by certain private funds of GTCR LLC and Reverence Capital Partners, L.P., under a transition services agreement and an update on the anticipated timeline for exiting the transition services agreement. In addition, the Board received and considered information about the full range of services provided to the Fund by Allspring Funds Management and its affiliates.
The Board considered the qualifications, background, tenure, and responsibilities of each of the portfolio managers primarily responsible for the day-to-day portfolio management of the Fund. The Board evaluated the ability of Allspring Funds Management and the Sub-Adviser to attract and retain qualified investment professionals, including research, advisory, and supervisory personnel.
The Board further considered the compliance programs and compliance records of Allspring Funds Management and the Sub-Adviser. The Board received and considered information about Allspring Global Investments’ risk management functions, which included information about Allspring Funds
*
The trade name for the asset management firm that includes Allspring Funds Management and the Sub-Adviser is “Allspring Global Investments.”
24 | Allspring Large Company Value Fund
Other information (unaudited)
Management’s and the Sub-Adviser’s business continuity plans, their approaches to data privacy and cybersecurity, Allspring Funds Management’s role as administrator of the Fund’s liquidity risk management program, and fair valuation designee. The Board also received and considered information about Allspring Funds Management’s intermediary and vendor oversight program.
Fund investment performance and expenses
The Board considered the investment performance results for the Fund over various time periods ended December 31, 2023. The Board considered these results in comparison to the investment performance of funds in a universe that was determined by Broadridge Inc. (“Broadridge”) to be similar to the Fund (the “Universe”), and in comparison to the Fund’s benchmark index and to other comparative data. Broadridge is an independent provider of investment company data. The Board received a description of the methodology used by Broadridge to select the mutual funds in the performance Universe. The Board noted that the investment performance of the Fund (Administrator Class) was higher than or in range of the average investment performance of the Universe for the five- and ten-year periods under review and lower than the average investment performance of the Universe for the one- and three-year periods under review. The Board also noted that the investment performance of the Fund was higher than or in range of the investment performance of its benchmark index, the Russell 1000® Value Index, for the three- and five-year periods under review, but lower for the one- and ten-year periods under review.
The Board also received and considered information regarding the Fund’s net operating expense ratios and their various components, including actual management fees, custodian and other non-management fees, and Rule 12b-1 and non-Rule 12b-1 shareholder service fees. The Board considered these ratios in comparison to the median ratios of funds in class-specific expense groups that were determined by Broadridge to be similar to the Fund (the “Groups”). The Board received a description of the methodology used by Broadridge to select the mutual funds in the expense Groups and an explanation of how funds comprising expense Groups and their expense ratios may vary from year-to-year. Based on the Broadridge reports, the Board noted that the net operating expense ratios of the Fund were lower than the median net operating expense ratios of the expense Groups for each share class.
The Board took into account the Fund’s investment performance and expense information provided to it among the factors considered in deciding to re-approve the Advisory Agreements.
Investment management and sub-advisory fee rates
The Board reviewed and considered the contractual fee rates payable by the Fund to Allspring Funds Management under the Management Agreement, as well as the contractual fee rates payable by the Fund to Allspring Funds Management for class-level administrative services under a Class-Level Administration Agreement, which include, among other things, class-level transfer agency and sub-transfer agency costs (collectively, the “Management Rates”). The Board also reviewed and considered the contractual investment sub-advisory fee rates payable by Allspring Funds Management to the Sub-Adviser for investment sub-advisory services. It was noted that advisory fee waivers, if any, are at the fund level and not class level.
Among other information reviewed by the Board was a comparison of the Fund’s Management Rates with the average contractual investment management fee rates of funds in the expense Groups at a common asset level as well as transfer agency costs of the funds in the expense Groups. The Board noted that the Management Rates of the Fund were lower than the sum of these average rates for the Fund’s expense Groups for each share class.
The Board also received and considered information about the portion of the total management fee that was retained by Allspring Funds Management after payment of the fee to the Sub-Adviser for sub-advisory services. In assessing the reasonableness of this amount, the Board received and evaluated information about the nature and extent of responsibilities retained and risks assumed by Allspring Funds Management and not delegated to or assumed by the Sub-Adviser, and about Allspring Funds Management’s on-going oversight services. Given the affiliation between Allspring Funds Management and the Sub-Adviser, the Board ascribed limited relevance to the allocation of fees between them.
The Board also received and considered information about the nature and extent of services offered and fee rates charged by Allspring Funds Management and the Sub-Adviser to other types of clients with investment strategies similar to those of the Fund. In this regard, the Board received information about the significantly greater scope of services, and compliance, reporting and other legal and regulatory obligations and risks of managing proprietary mutual funds compared with those associated with managing assets of other types of clients, including third-party sub-advised fund clients and non-mutual fund clients such as institutional separate accounts.
Based on its consideration of the factors and information it deemed relevant, including those described here, the Board determined that the compensation payable to Allspring Funds Management under the Management Agreement and to the Sub-Adviser under the Sub-Advisory Agreement was reasonable.
The Board received and considered information concerning the profitability of Allspring Funds Management, as well as the profitability of Allspring Global Investments, from providing services to the fund complex as a whole. The Board noted that the Sub-Adviser’s profitability information with respect to providing services to the Fund and other funds in the complex was subsumed in the Allspring Global Investments profitability analysis.
Allspring Large Company Value Fund | 25
Other information (unaudited)
Allspring Funds Management reported on the methodologies and estimates used in calculating profitability, including a description of the methodology used to allocate certain expenses. Among other things, the Board noted that the levels of profitability reported on a fund-by-fund basis varied widely, depending on factors such as the size, type, and age of fund.
Based on its review, the Board did not deem the profits reported by Allspring Funds Management or Allspring Global Investments from services provided to the Fund to be at a level that would prevent it from approving the continuation of the Advisory Agreements.
The Board received and considered information about the potential for Allspring Funds Management to experience economies of scale in the provision of management services to the Fund, the difficulties of isolating and quantifying economies of scale at an individual fund level, and the extent to which potential scale benefits are shared with Fund shareholders. The Board noted the existence of breakpoints in the Fund’s management fee structure, which operate generally to reduce the Fund’s expense ratios as the Fund grows in size, and the size of the Fund in relation to such breakpoints. The Board considered that in addition to management fee breakpoints, Allspring Funds Management shares potential economies of scale from its management business in a variety of ways, including through fee waiver and expense reimbursement arrangements, competitive management fee rates set at the outset without regard to breakpoints, and investments in the business intended to enhance services available to shareholders.
The Board concluded that Allspring Funds Management’s arrangements with respect to the Fund, including contractual breakpoints, constituted a reasonable approach to sharing potential economies of scale with the Fund and its shareholders.
Other benefits to Allspring Funds Management and the Sub-Advisers
The Board received and considered information regarding potential “fall-out” or ancillary benefits received by Allspring Funds Management and its affiliates, including the Sub-Adviser, as a result of their relationships with the Fund. Ancillary benefits could include, among others, benefits directly attributable to other relationships with the Fund and benefits potentially derived from an increase in Allspring Funds Management’s and the Sub-Adviser’s business as a result of their relationships with the Fund. The Board noted that Allspring Funds Distributor, LLC, an affiliate of Allspring Funds Management, receives distribution-related fees in respect of shares sold or held through it. The Board also reviewed information about soft dollar credits earned and utilized by the Sub-Adviser.
Based on its consideration of the factors and information it deemed relevant, including those described here, the Board did not find that any ancillary benefits received by Allspring Funds Management and its affiliates, including the Sub-Adviser, were unreasonable.
At the Meeting, after considering the above-described factors and based on its deliberations and its evaluation of the information described above, the Board unanimously determined that the compensation payable to Allspring Funds Management and the Sub-Adviser under each of the Advisory Agreements was reasonable, and approved the continuation of the Advisory Agreements for a one-year term.
26 | Allspring Large Company Value Fund
This page is intentionally left blank.
This page is intentionally left blank.
For more information
More information about Allspring Funds is available free upon request. To obtain literature, please write, visit the Fund’s website, or call:
Allspring Funds
P.O. Box 219967
Kansas City, MO 64121-9967
Website: allspringglobal.com
Individual investors: 1-800-222-8222
Retail investment professionals: 1-888-877-9275
Institutional investment professionals: 1-800-260-5969
This report and the financial statements contained herein are submitted for the general information of the shareholders of the Fund. If this report is used for promotional purposes, distribution of the report must be accompanied or preceded by a current prospectus. Before investing, please consider the investment objectives, risks, charges, and expenses of the investment. For a current prospectus and, if available, a summary prospectus, containing this information, call 1-800-222-8222 or visit the Fund’s website at allspringglobal.com. Read the prospectus carefully before you invest or send money.
Allspring Global InvestmentsTM is the trade name for the asset management firms of Allspring Global Investments Holdings, LLC, a holding company indirectly owned by certain private funds of GTCR LLC and Reverence Capital Partners, L.P. These firms include but are not limited to Allspring Global Investments, LLC, and Allspring Funds Management, LLC. Certain products managed by Allspring entities are distributed by Allspring Funds Distributor, LLC (a broker-dealer and Member FINRA/SIPC).
This material is for general informational and educational purposes only and is NOT intended to provide investment advice or a recommendation of any kind - including a recommendation for any specific investment, strategy, or plan.
© 2024 Allspring Global Investments Holdings, LLC. All rights reserved.
NCSR3325 07-24
ITEM 8. CHANGES IN AND DISAGREEMENTS WITH ACCOUNTANTS FOR OPEN-END MANAGEMENT INVESTMENT COMPANIES
Changes in and Disagreements with Accountants for Open-End Management Investment Companies are included as part of the Financial Statements filed under Item 7(a) of this Form.
ITEM 9. PROXY DISCLOSURES FOR OPEN-END MANAGEMENT INVESTMENT COMPANIES
Proxy Disclosures for Open-End Management Investment Companies are included as part of the Financial Statements filed under Item 7(a) of this Form.
ITEM 10. REMUNERATION PAID TO DIRECTORS, OFFICERS, AND OTHERS OF OPEN-END MANAGEMENT INVESTMENT COMPANIES
Renumeration Paid to Directors, Officers, and Others of Open-End Investment Companies is included as part of the Financial Statements filed under Item 7(a) of this Form.
ITEM 11. STATEMENT REGARDING BASIS FOR APPROVAL OF INVESTMENT ADVISORY CONTRACT
The registrant’s Statement Regarding Basis for Approval of Investment Advisory Contract is included as part of the Financial Statements filed under Item 7(a) of this Form.
ITEM 12. DISCLOSURE OF PROXY VOTING POLICIES AND PROCEDURES FOR CLOSED-END MANAGEMENT INVESTMENT COMPANIES
Not applicable.
ITEM 13. PORTFOLIO MANAGERS OF CLOSED-END MANAGEMENT INVESTMENT COMPANIES
Not applicable.
ITEM 14. PURCHASES OF EQUITY SECURITIES BY CLOSED-END MANAGEMENT INVESTMENT COMPANY AND AFFILIATED PURCHASERS
Not applicable.
ITEM 15. SUBMISSION OF MATTERS TO A VOTE OF SECURITY HOLDERS
There have been no material changes to the procedures by which shareholders may recommend nominees to the registrant’s Board of Trustees that have been implemented since the registrant’s last provided disclosure in response to the requirements of this Item.
ITEM 16. CONTROLS AND PROCEDURES
(a) The President and Treasurer have concluded that the Allspring Funds Trust disclosure controls and procedures (as defined in Rule 30a-3(c) under the Investment Company Act of 1940) provide reasonable assurances that material information relating to the registrant is made known to them by the appropriate persons based on their evaluation of these controls and procedures as of a date within 90 days of the filing of this report.
(b) There were no significant changes in the registrant’s internal control over financial reporting (as defined in Rule 30a-3(d) under the Investment Company Act of 1940) that occurred during the period covered by this report that materially affected, or is reasonably likely to materially affect, the registrant’s internal control over financial reporting.
ITEM 17. DISCLOSURES OF SECURITIES LENDING ACTIVITES FOR CLOSED-END MANAGEMENT INVESTMENT COMPANIES
Not applicable.
ITEM 18. RECOVERY OF ERRONEOUSLY AWARDED COMPENSATION
Not applicable.
ITEM 19. EXHIBITS
SIGNATURES
Pursuant to the requirements of the Securities Exchange Act of 1934 and the Investment Company Act of 1940, the registrant has duly caused this report to be signed on its behalf by the undersigned, thereunto duly authorized.
| | |
| Allspring Funds Trust |
| |
| By: | | /s/ Andrew Owen |
| | Andrew Owen |
| | President, Principal Executive Officer |
|
| Date: September 25, 2024 |
Pursuant to the requirements of the Securities Exchange Act of 1934 and the Investment Company Act of 1940, this report has been signed below by the following persons on behalf of the registrant and in the capacities and on the date indicated.
| | |
| Allspring Funds Trust |
| |
| By: | | /s/ Andrew Owen |
| | Andrew Owen |
| | President, Principal Executive Officer |
|
| Date: September 25, 2024 |
| |
| By: | | /s/Jeremy DePalma |
| | Jeremy DePalma |
| | Treasurer, Principal Financial Officer |
|
| Date: September 25, 2024 |