UNITED STATES
SECURITIES AND EXCHANGE COMMISSION
Washington, D.C. 20549
FORM 10-Q
(Mark One)
☒ QUARTERLY REPORT PURSUANT TO SECTION 13 OR 15(d) OF THE SECURITIES EXCHANGE ACT OF 1934
For the quarterly period ended November 30, 2022
or
☐ TRANSITION REPORT PURSUANT TO SECTION 13 OR 15(d) OF THE SECURITIES EXCHANGE ACT OF 1934
For the transition period from ___________ to ___________
Commission File Number 001-08399
WORTHINGTON INDUSTRIES, INC.
(Exact name of registrant as specified in its charter)
| | |
Ohio | | 31-1189815 |
(State or other jurisdiction of incorporation or organization) | | (I.R.S. Employer Identification No.) |
| | |
200 Old Wilson Bridge Road, Columbus, Ohio | | 43085 |
(Address of principal executive offices) | | (Zip Code) |
|
(614) 438-3210 |
(Registrant’s telephone number, including area code) |
|
Not Applicable |
(Former name, former address and former fiscal year, if changed since last report) |
Securities registered pursuant to Section 12(b) of the Act:
| | |
Title of each class | Trading Symbol(s) | Name of each exchange on which registered |
Common Shares, Without Par Value | WOR | New York Stock Exchange |
Indicate by check mark whether the registrant (1) has filed all reports required to be filed by Section 13 or 15(d) of the Securities Exchange Act of 1934 during the preceding 12 months (or for such shorter period that the registrant was required to file such reports), and (2) has been subject to such filing requirements for the past 90 days. Yes ☒ No ☐
Indicate by check mark whether the registrant has submitted electronically every Interactive Data File required to be submitted pursuant to Rule 405 of Regulation S-T (§ 232.405 of this chapter) during the preceding 12 months (or for such shorter period that the registrant was required to submit such files). Yes ☒ No ☐
Indicate by check mark whether the registrant is a large accelerated filer, an accelerated filer, a non-accelerated filer, a smaller reporting company, or an emerging growth company. See the definitions of “large accelerated filer,” “accelerated filer,” “smaller reporting company,” and “emerging growth company” in Rule 12b-2 of the Exchange Act.
| | | | |
Large accelerated filer | ☒ | | Accelerated filer | ☐ |
Non-accelerated filer | ☐ | | Smaller reporting company | ☐ |
| | | Emerging growth company | ☐ |
If an emerging growth company, indicate by check mark if the registrant has elected not to use the extended transition period for complying with any new or revised financial accounting standards provided pursuant to Section 13(a) of the Exchange Act. ☐
Indicate by check mark whether the registrant is a shell company (as defined in Rule 12b-2 of the Exchange Act). Yes ☐ No ☒
APPLICABLE ONLY TO CORPORATE ISSUERS:
Indicate the number of shares outstanding of each of the issuer’s classes of common stock, as of the latest practicable date. On December 30, 2022, the number of Common Shares, without par value, issued and outstanding was 49,707,649.
TABLE OF CONTENTS
i
Table of Contents
Safe Harbor Statement
Selected statements contained in this Quarterly Report on Form 10-Q (this “Form 10-Q”), including, without limitation, in “PART I – Item 2. – Management’s Discussion and Analysis of Financial Condition and Results of Operations,” constitute “forward-looking statements” as that term is used in the Private Securities Litigation Reform Act of 1995 (the “PSLRA”). Forward-looking statements reflect our current expectations, estimates or projections concerning future results or events. These statements are often identified by the use of forward-looking words or phrases such as “believe,” “expect,” “anticipate,” “may,” “could,” “should,” “would,” “intend,” “plan,” “will,” “likely,” “estimate,” “project,” “positioned,” “strategy,” “targets,” “aims,” “seek,” “foresee,” or other similar words or phrases. These forward-looking statements include, without limitation, statements relating to:
•the ever-changing effects of the novel coronavirus (“COVID-19”) pandemic and the various responses of governmental and nongovernmental authorities thereto (such as fiscal stimulus packages, quarantines, shut downs and other restrictions on travel and commercial, social or other activities) on economies (local, national and international) and markets, and on our customers, counterparties, employees and third-party service providers;
•future or expected cash positions, liquidity and ability to access financial markets and capital;
•outlook, strategy or business plans;
•the intended separation of the Company’s Steel Processing business (the “Separation”), see Note A – Basis of Presentation for additional information related to the Separation;
•the timing and method of the Separation;
•the anticipated benefits of the Separation;
•the expected financial and operational performance of, and future opportunities for, each of the two independent, publicly-traded companies following the Separation;
•the tax treatment of the Separation transaction;
•the leadership of each of the two independent, publicly-traded companies following the Separation;
•future or expected growth, growth potential, forward momentum, performance, competitive position, sales, volumes, cash flows, earnings, margins, balance sheet strengths, debt, financial condition or other financial measures;
•pricing trends for raw materials and finished goods and the impact of pricing changes;
•the ability to improve or maintain margins;
•expected demand or demand trends for the Company or its markets;
•additions to product lines and opportunities to participate in new markets;
•expected benefits from transformation and innovation efforts;
•the ability to improve performance and competitive position at the Company’s operations;
•anticipated working capital needs, capital expenditures and asset sales;
•anticipated improvements and efficiencies in costs, operations, sales, inventory management, sourcing and the supply chain and the results thereof;
•projected profitability potential;
•the ability to make acquisitions and the projected timing, results, benefits, costs, charges and expenditures related to acquisitions, joint ventures, headcount reductions and facility dispositions, shutdowns and consolidations;
•projected capacity and the alignment of operations with demand;
•the ability to operate profitably and generate cash in down markets;
•the ability to capture and maintain market share and to develop or take advantage of future opportunities, customer initiatives, new businesses, new products and new markets;
•expectations for Company and customer inventories, jobs and orders;
•expectations for the economy and markets or improvements therein;
•expectations for generating improving and sustainable earnings, earnings potential, margins or shareholder value;
•effects of judicial rulings; and
•other non-historical matters.
Because they are based on beliefs, estimates and assumptions, forward-looking statements are inherently subject to risks and uncertainties that could cause actual results to differ materially from those projected. Any number of factors could affect actual results, including, without limitation, those that follow:
•obtaining final approval of the Separation by the Worthington Industries, Inc. Board of Directors;
•the uncertainty of obtaining regulatory approvals in connection with the Separation, including rulings from the Internal Revenue Service;
•the ability to satisfy the necessary closing conditions to complete the Separation on a timely basis, or at all;
ii
Table of Contents
•the Company’s ability to successfully separate the two independent companies and realize the anticipated benefits of the Separation;
•the risks, uncertainties and impacts related to the COVID-19 pandemic – the duration, extent and severity of which are impossible to predict, including the possibility of future resurgence in the spread of COVID-19 or variants thereof – and the availability, effectiveness and acceptance of vaccines, and other actual or potential public health emergencies and actions taken by governmental authorities or others in connection therewith;
•the effect of national, regional and global economic conditions generally and within major product markets, including significant economic disruptions from COVID-19, the actions taken in connection therewith and the implementation of related fiscal stimulus packages;
•the effect of conditions in national and worldwide financial markets, including inflation, increases in interest rates and economic recession, and with respect to the ability of financial institutions to provide capital;
•the impact of tariffs, the adoption of trade restrictions affecting the Company’s products or suppliers, a United States (“U.S.”) withdrawal from or significant renegotiation of trade agreements, the occurrence of trade wars, the closing of border crossings, and other changes in trade regulations or relationships;
•changing oil prices and/or supply;
•product demand and pricing;
•changes in product mix, product substitution and market acceptance of the Company’s products;
•volatility or fluctuations in the pricing, quality or availability of raw materials (particularly steel), supplies, transportation, utilities, labor and other items required by operations (especially in light of the COVID-19 pandemic and Russia’s invasion of Ukraine);
•effects of sourcing and supply chain constraints;
•the outcome of adverse claims experience with respect to workers’ compensation, product recalls or product liability, casualty events or other matters;
•effects of facility closures and the consolidation of operations;
•the effect of financial difficulties, consolidation and other changes within the steel, automotive, construction and other industries in which the Company participates;
•failure to maintain appropriate levels of inventories;
•financial difficulties (including bankruptcy filings) of original equipment manufacturers, end-users and customers, suppliers, joint venture partners and others with whom the Company does business;
•the ability to realize targeted expense reductions from headcount reductions, facility closures and other cost reduction efforts;
•the ability to realize cost savings and operational, sales and sourcing improvements and efficiencies, and other expected benefits from transformation initiatives, on a timely basis;
•the overall success of, and the ability to integrate, newly-acquired businesses and joint ventures, maintain and develop their customers, and achieve synergies and other expected benefits and cost savings therefrom;
•capacity levels and efficiencies, within facilities, within major product markets and within the industries in which the Company participates as a whole;
•the effect of disruption in the business of suppliers, customers, facilities and shipping operations due to adverse weather, casualty events, equipment breakdowns, labor shortages (especially in light of the COVID-19 pandemic), interruption in utility services, civil unrest, international conflicts (especially in light of Russia’s invasion of Ukraine), terrorist activities, or other causes;
•changes in customer demand, inventories, spending patterns, product choices, and supplier choices;
•risks associated with doing business internationally, including economic, political and social instability (especially in light of Russia’s invasion of Ukraine), foreign currency exchange rate exposure and the acceptance of the Company’s products in global markets;
•the ability to improve and maintain processes and business practices to keep pace with the economic, competitive and technological environment;
•the effect of inflation, interest rate increases and economic recession, which may negatively impact the Company’s operations and financial results;
•deviation of actual results from estimates and/or assumptions used by the Company in the application of its significant accounting policies;
•the level of imports and import prices in the Company’s markets;
•the impact of environmental laws and regulations or the actions of the U.S. Environmental Protection Agency or similar regulators which increase costs or limit the Company’s ability to use or sell certain products;
•the impact of increasing environmental, greenhouse gas emission and sustainability considerations or regulations;
iii
Table of Contents
•the impact of judicial rulings and governmental regulations, both in the U.S. and abroad, including those adopted by the U.S. Securities and Exchange Commission (the “SEC”) and other governmental agencies as contemplated by the Coronavirus Aid, Relief and Economic Security (CARES) Act, the Consolidated Appropriations Act, 2021, the American Rescue Act of 2021, and the Dodd-Frank Wall Street Reform and the Consumer Protection Act of 2010;
•the effect of healthcare laws in the U.S. and potential changes for such laws, especially in light of the COVID-19 pandemic, which may increase the Company’s healthcare and other costs and negatively impact the Company’s operations and financial results;
•the effects of tax laws in the U.S. and potential changes for such laws, which may increase the Company’s costs and negatively impact the Company’s operations and financial results;
•the effects of privacy and information security laws and standards; and
•other risks described from time to time in the filings of Worthington Industries, Inc. with the SEC, including those described in “PART I – Item 1A. — Risk Factors” of the Annual Report on Form 10-K of Worthington Industries, Inc. for the fiscal year ended May 31, 2022.
We note these factors for investors as contemplated by the PSLRA. It is impossible to predict or identify all potential risk factors. Consequently, you should not consider the foregoing list to be a complete set of all potential risks and uncertainties. Any forward-looking statements in this Form 10-Q are based on current information as of the date of this Form 10-Q, and we assume no obligation to correct or update any such statements in the future, except as required by applicable law.
iv
Table of Contents
PART I. FINANCIAL INFORMATION
Item 1. – Financial Statements
WORTHINGTON INDUSTRIES, INC.
CONSOLIDATED BALANCE SHEETS
(In thousands)
| | | | | | | |
| (Unaudited) | | | | |
| November 30, | | | May 31, | |
| 2022 | | | 2022 | |
Assets | | | | | |
Current assets: | | | | | |
Cash and cash equivalents | $ | 129,596 | | | $ | 34,485 | |
Receivables, less allowances of $2,679 and $1,292 at November 30, 2022 | | | | | |
and May 31, 2022, respectively | | 694,668 | | | | 857,493 | |
Inventories: | | | | | |
Raw materials | | 304,692 | | | | 323,609 | |
Work in process | | 159,772 | | | | 255,019 | |
Finished products | | 190,160 | | | | 180,512 | |
Total inventories | | 654,624 | | | | 759,140 | |
Income taxes receivable | | 19,834 | | | | 20,556 | |
Assets held for sale | | 5,191 | | | | 20,318 | |
Prepaid expenses and other current assets | | 98,873 | | | | 93,661 | |
Total current assets | | 1,602,786 | | | | 1,785,653 | |
Investments in unconsolidated affiliates | | 240,859 | | | | 327,381 | |
Operating lease assets | | 103,488 | | | | 98,769 | |
Goodwill | | 412,971 | | | | 401,469 | |
Other intangible assets, net of accumulated amortization of $102,561 and | | | | | |
$93,973 at November 30, 2022 and May 31, 2022, respectively | | 322,934 | | | | 299,017 | |
Other assets | | 25,439 | | | | 34,394 | |
Property, plant and equipment: | | | | | |
Land | | 49,644 | | | | 51,483 | |
Buildings and improvements | | 302,999 | | | | 303,269 | |
Machinery and equipment | | 1,223,841 | | | | 1,196,806 | |
Construction in progress | | 60,673 | | | | 59,363 | |
Total property, plant and equipment | | 1,637,157 | | | | 1,610,921 | |
Less: accumulated depreciation | | 954,974 | | | | 914,581 | |
Total property, plant and equipment, net | | 682,183 | | | | 696,340 | |
Total assets | $ | 3,390,660 | | | $ | 3,643,023 | |
| | | | | |
Liabilities and equity | | | | | |
Current liabilities: | | | | | |
Accounts payable | $ | 481,273 | | | $ | 668,438 | |
Short-term borrowings | | 4,935 | | | | 47,997 | |
Accrued compensation, contributions to employee benefit plans and related taxes | | 86,998 | | | | 117,530 | |
Dividends payable | | 17,663 | | | | 15,988 | |
Other accrued items | | 58,046 | | | | 70,125 | |
Current operating lease liabilities | | 11,719 | | | | 11,618 | |
Income taxes payable | | - | | | | 300 | |
Current maturities of long-term debt | | 257 | | | | 265 | |
Total current liabilities | | 660,891 | | | | 932,261 | |
Other liabilities | | 115,688 | | | | 115,991 | |
Distributions in excess of investment in unconsolidated affiliate | | 91,643 | | | | 81,149 | |
Long-term debt | | 693,453 | | | | 696,345 | |
Noncurrent operating lease liabilities | | 93,513 | | | | 88,183 | |
Deferred income taxes, net | | 96,180 | | | | 115,132 | |
Total liabilities | | 1,751,368 | | | | 2,029,061 | |
Shareholders' equity - controlling interest | | 1,513,393 | | | | 1,480,752 | |
Noncontrolling interests | | 125,899 | | | | 133,210 | |
Total equity | | 1,639,292 | | | | 1,613,962 | |
Total liabilities and equity | $ | 3,390,660 | | | $ | 3,643,023 | |
See condensed notes to consolidated financial statements.
1
Table of Contents
WORTHINGTON INDUSTRIES, INC.
CONSOLIDATED STATEMENTS OF EARNINGS
(In thousands, except per share amounts)
(Unaudited)
| | | | | | | | | | | | | | | |
| Three Months Ended | | | Six Months Ended | |
| November 30, | | | November 30, | |
| 2022 | | | 2021 | | | 2022 | | | 2021 | |
Net sales | $ | 1,175,541 | | | $ | 1,232,861 | | | $ | 2,584,206 | | | $ | 2,343,679 | |
Cost of goods sold | | 1,069,778 | | | | 1,048,270 | | | | 2,309,069 | | | | 1,939,714 | |
Gross margin | | 105,763 | | | | 184,591 | | | | 275,137 | | | | 403,965 | |
Selling, general and administrative expense | | 107,813 | | | | 96,130 | | | | 211,261 | | | | 191,981 | |
Impairment of long-lived assets | | - | | | | - | | | | 312 | | | | - | |
Restructuring and other income, net | | (4,282 | ) | | | (2,004 | ) | | | (5,382 | ) | | | (14,278 | ) |
Separation costs | | 9,246 | | | | - | | | | 9,246 | | | | - | |
Operating income (loss) | | (7,014 | ) | | | 90,465 | | | | 59,700 | | | | 226,262 | |
Other income (expense): | | | | | | | | | | | |
Miscellaneous income (expense), net | | 1,405 | | | | 1,040 | | | | (3,681 | ) | | | 1,670 | |
Interest expense | | (7,612 | ) | | | (7,312 | ) | | | (16,210 | ) | | | (15,030 | ) |
Equity in net income of unconsolidated affiliates | | 36,857 | | | | 60,218 | | | | 68,569 | | | | 113,134 | |
Earnings before income taxes | | 23,636 | | | | 144,411 | | | | 108,378 | | | | 326,036 | |
Income tax expense | | 4,131 | | | | 31,226 | | | | 23,629 | | | | 71,376 | |
Net earnings | | 19,505 | | | | 113,185 | | | | 84,749 | | | | 254,660 | |
Net earnings attributable to noncontrolling interests | | 3,287 | | | | 2,884 | | | | 4,449 | | | | 11,868 | |
Net earnings attributable to controlling interest | $ | 16,218 | | | $ | 110,301 | | | $ | 80,300 | | | $ | 242,792 | |
| | | | | | | | | | | |
Basic | | | | | | | | | | | |
Weighted average common shares outstanding | | 48,558 | | | | 50,381 | | | | 48,518 | | | | 50,618 | |
Earnings per share attributable to controlling interest | $ | 0.33 | | | $ | 2.19 | | | $ | 1.66 | | | $ | 4.80 | |
| | | | | | | | | | | |
Diluted | | | | | | | | | | | |
Weighted average common shares outstanding | | 49,330 | | | | 51,214 | | | | 49,293 | | | | 51,532 | |
Earnings per share attributable to controlling interest | $ | 0.33 | | | $ | 2.15 | | | $ | 1.63 | | | $ | 4.71 | |
| | | | | | | | | | | |
Common shares outstanding at end of period | | 48,572 | | | | 50,334 | | | | 48,572 | | | | 50,334 | |
| | | | | | | | | | | |
Cash dividends declared per share | $ | 0.31 | | | $ | 0.28 | | | $ | 0.62 | | | $ | 0.56 | |
See condensed notes to consolidated financial statements.
2
Table of Contents
WORTHINGTON INDUSTRIES, INC.
CONSOLIDATED STATEMENTS OF COMPREHENSIVE INCOME
(In thousands)
(Unaudited)
| | | | | | | | | | | | | | | |
| Three Months Ended | | | Six Months Ended | |
| November 30, | | | November 30, | |
| 2022 | | | 2021 | | | 2022 | | | 2021 | |
Net earnings | $ | 19,505 | | | $ | 113,185 | | | $ | 84,749 | | | $ | 254,660 | |
Other comprehensive income (loss) | | | | | | | | | | | |
Foreign currency translation, net of tax | | 858 | | | | (4,872 | ) | | | (9,243 | ) | | | (8,847 | ) |
Pension liability adjustment, net of tax | | (82 | ) | | | - | | | | 2,857 | | | | - | |
Cash flow hedges, net of tax | | (4,000 | ) | | | (52,986 | ) | | | (17,300 | ) | | | (53,285 | ) |
Other comprehensive loss | | (3,224 | ) | | | (57,858 | ) | | | (23,686 | ) | | | (62,132 | ) |
Comprehensive income | | 16,281 | | | | 55,327 | | | | 61,063 | | | | 192,528 | |
Comprehensive income attributable to noncontrolling interests | | 3,287 | | | | 2,884 | | | | 4,449 | | | | 11,868 | |
Comprehensive income attributable to controlling interest | $ | 12,994 | | | $ | 52,443 | | | $ | 56,614 | | | $ | 180,660 | |
See condensed notes to consolidated financial statements.
3
Table of Contents
WORTHINGTON INDUSTRIES, INC.
CONSOLIDATED STATEMENTS OF CASH FLOWS
(In thousands)
(Unaudited)
| | | | | | | | | | | | | | | |
| Three Months Ended | | | Six Months Ended | |
| November 30, | | | November 30, | |
| 2022 | | | 2021 | | | 2022 | | | 2021 | |
Operating activities: | | | | | | | | | | | |
Net earnings | $ | 19,505 | | | $ | 113,185 | | | $ | 84,749 | | | $ | 254,660 | |
Adjustments to reconcile net earnings to net cash provided (used) by operating activities: | | | | | | | | | | | |
Depreciation and amortization | | 28,354 | | | | 21,090 | | | | 56,355 | | | | 43,154 | |
Impairment of long-lived assets | | - | | | | - | | | | 312 | | | | - | |
Provision for (benefit from) deferred income taxes | | (3,617 | ) | | | 1,309 | | | | (14,673 | ) | | | 2,675 | |
Bad debt expense | | 1,098 | | | | 335 | | | | 1,440 | | | | 514 | |
Equity in net income of unconsolidated affiliates, net of distributions | | 18,352 | | | | (31,274 | ) | | | 61,197 | | | | (64,492 | ) |
Net gain on sale of assets | | (4,265 | ) | | | (496 | ) | | | (5,034 | ) | | | (13,202 | ) |
Stock-based compensation | | 4,547 | | | | 4,248 | | | | 8,783 | | | | 7,551 | |
Changes in assets and liabilities, net of impact of acquisitions: | | | | | | | | | | | |
Receivables | | 119,674 | | | | (89,817 | ) | | | 157,093 | | | | (121,685 | ) |
Inventories | | 72,293 | | | | (97,182 | ) | | | 113,460 | | | | (260,864 | ) |
Accounts payable | | (100,535 | ) | | | (47,594 | ) | | | (202,116 | ) | | | (926 | ) |
Accrued compensation and employee benefits | | 3,336 | | | | 14,358 | | | | (30,532 | ) | | | (31,819 | ) |
Income taxes payable | | (7,629 | ) | | | (22,922 | ) | | | (300 | ) | | | 12,935 | |
Other operating items, net | | (18,172 | ) | | | 15,656 | | | | (16,755 | ) | | | 2,583 | |
Net cash provided (used) by operating activities | | 132,941 | | | | (119,104 | ) | | | 213,979 | | | | (168,916 | ) |
| | | | | | | | | | | |
Investing activities: | | | | | | | | | | | |
Investment in property, plant and equipment | | (24,490 | ) | | | (24,234 | ) | | | (45,967 | ) | | | (48,159 | ) |
Investment in non-marketable equity securities | | (140 | ) | | | - | | | | (250 | ) | | | - | |
Acquisitions, net of cash acquired | | - | | | | (3,000 | ) | | | (56,088 | ) | | | (107,750 | ) |
Proceeds from sale of investment in ArtiFlex | | - | | | | - | | | | 36,095 | | | | - | |
Proceeds from sale of assets, net of selling costs | | 23,739 | | | | 5,136 | | | | 35,494 | | | | 31,821 | |
Net cash used by investing activities | | (891 | ) | | | (22,098 | ) | | | (30,716 | ) | | | (124,088 | ) |
| | | | | | | | | | | |
Financing activities: | | | | | | | | | | | |
Net repayments of short-term borrowings | | (10,619 | ) | | | - | | | | (43,062 | ) | | | - | |
Principal payments on long-term obligations | | (13 | ) | | | (10 | ) | | | (150 | ) | | | (402 | ) |
Payments for issuance of common shares, net of tax withholdings | | (649 | ) | | | (2,694 | ) | | | (4,115 | ) | | | (6,785 | ) |
Payments to noncontrolling interests | | (11,760 | ) | | | (2,879 | ) | | | (11,760 | ) | | | (12,076 | ) |
Repurchase of common shares | | - | | | | (12,702 | ) | | | - | | | | (73,587 | ) |
Dividends paid | | (15,181 | ) | | | (14,565 | ) | | | (29,065 | ) | | | (29,263 | ) |
Net cash used by financing activities | | (38,222 | ) | | | (32,850 | ) | | | (88,152 | ) | | | (122,113 | ) |
| | | | | | | | | | | |
Increase (decrease) in cash and cash equivalents | | 93,828 | | | | (174,052 | ) | | | 95,111 | | | | (415,117 | ) |
Cash and cash equivalents at beginning of period | | 35,768 | | | | 399,246 | | | | 34,485 | | | | 640,311 | |
Cash and cash equivalents at end of period | $ | 129,596 | | | $ | 225,194 | | | $ | 129,596 | | | $ | 225,194 | |
See condensed notes to consolidated financial statements.
4
Table of Contents
WORTHINGTON INDUSTRIES, INC.
CONDENSED Notes to Consolidated Financial Statements
(Unaudited)
Note A – Basis of Presentation
Basis of Presentation
The consolidated financial statements include the accounts of Worthington Industries, Inc. and consolidated subsidiaries (collectively, “we,” “our,” “Worthington,” or the “Company”). Investments in unconsolidated affiliates are accounted for using the equity method. Significant intercompany accounts and transactions have been eliminated.
We own controlling interests in the following three operating joint ventures: Spartan Steel Coating, L.L.C. (“Spartan”) (52%); TWB Company, L.L.C. (“TWB”) (55%); and Worthington Samuel Coil Processing LLC (“Samuel” or “Samuel joint venture”) (63%). The last remaining manufacturing facility of our Worthington Specialty Processing (“WSP”) joint venture was sold in the second quarter of fiscal 2022. See “Note F – Restructuring and Other Income, Net” for additional information. These joint ventures are consolidated with the equity owned by the other joint venture members shown as “Noncontrolling interests” in our consolidated balance sheets, and the other joint venture members’ portions of net earnings and other comprehensive income (loss) (“OCI”) shown as net earnings or comprehensive income attributable to noncontrolling interests in our consolidated statements of earnings and consolidated statements of comprehensive income, respectively. Investments in unconsolidated affiliates are accounted for using the equity method. See further discussion of our unconsolidated affiliates in “Note D – Investments in Unconsolidated Affiliates.”
These unaudited consolidated financial statements have been prepared in accordance with accounting principles generally accepted in the U.S. for interim financial information and with the instructions to Form 10-Q and Article 10 of Regulation S-X of the SEC. Accordingly, they do not include all of the information and notes required by accounting principles generally accepted in the U.S. (“U.S. GAAP”) for complete financial statements. In the opinion of management, all adjustments, which are of a normal and recurring nature except those which have been disclosed elsewhere in this Form 10-Q, necessary for a fair presentation of the consolidated financial statements for these interim periods, have been included. Operating results for the three months and the six months ended November 30, 2022 are not necessarily indicative of the results that may be expected for the fiscal year ending May 31, 2023 (“fiscal 2023”). For further information, refer to the consolidated financial statements and notes thereto included in the Annual Report on Form 10-K for the fiscal year ended May 31, 2022 (“fiscal 2022”) of Worthington Industries, Inc. (the “2022 Form 10-K”).
The preparation of consolidated financial statements in conformity with U.S. GAAP requires management to make estimates and assumptions that affect the amounts reported in the consolidated financial statements and accompanying notes. Actual results could differ from those estimates.
Steel Processing Separation
On September 29, 2022, the Company announced that the Board of Directors of Worthington Industries, Inc. approved a plan to pursue a separation into two independent, publicly-traded companies – one company is expected to be comprised of the Company’s Steel Processing operating segment, and the other company is expected to be comprised of the Company’s Consumer Products, Building Products and Sustainable Energy Solutions operating segments. The Company plans to effect the separation via a distribution of stock of the Steel Processing business, which is expected to be tax-free to shareholders for U.S. federal income tax purposes. The Separation transaction is expected to be completed by early 2024, but is subject to certain conditions, including, among other things, general market conditions, finalization of the capital structure of the two companies, completion of steps necessary to qualify the Separation as a tax-free transaction, receipt of regulatory approvals and final approval from the Board of Directors of Worthington Industries, Inc. Direct and incremental costs incurred in connection with the anticipated Separation, including audit, advisory, and legal costs, are presented separately in our consolidated statements of earnings as “Separation costs”. Separation costs totaled $9,246,000 during the three and six months ended November 30, 2022.
Note B – Inventory
Due to a decline in steel pricing during the first quarter of fiscal 2023, the net realizable value of our inventory was lower than the cost reflected in our records at August 31, 2022. Accordingly, we recorded a lower of cost or net realizable value adjustment during the first quarter of fiscal 2023 totaling $4,488,000 to reflect this lower value. The entire amount of the adjustment was attributed to our Steel Processing operating segment and was recorded in cost of goods sold in the consolidated statement of earnings for the three months ended August 31, 2022. There was no lower of cost or net realizable value adjustment to inventory during the three months ended November 30, 2022.
5
Table of Contents
Note C – Revenue Recognition
The following table summarizes net sales by operating segment and product class for the periods presented:
| | | | | | | | | | | | | | | |
| Three Months Ended | | | Six Months Ended | |
| November 30, | | | November 30, | |
(in thousands) | 2022 | | | 2021 | | | 2022 | | | 2021 | |
Steel Processing | | | | | | | | | | | |
Direct | $ | 807,259 | | | $ | 900,666 | | | $ | 1,809,394 | | | $ | 1,688,694 | |
Toll | | 34,688 | | | | 37,176 | | | | 71,433 | | | | 71,958 | |
Total | | 841,947 | | | | 937,842 | | | | 1,880,827 | | | | 1,760,652 | |
| | | | | | | | | | | |
Consumer Products (1) | | 153,795 | | | | 140,793 | | | | 342,497 | | | | 288,576 | |
Building Products (1) | | 141,671 | | | | 121,125 | | | | 291,994 | | | | 235,868 | |
Sustainable Energy Solutions (1) | | 38,128 | | | | 33,101 | | | | 68,888 | | | | 58,583 | |
Total | $ | 1,175,541 | | | $ | 1,232,861 | | | $ | 2,584,206 | | | $ | 2,343,679 | |
(1)The products contained within each of these operating segments have similar production processes, require substantially the same raw materials, use similar equipment, and serve similar purposes. Therefore, we believe the products within each of these segments are appropriately combined for purposes of the disclosure requirements prescribed by Accounting Standards Codification (“ASC”) Topic 280 and Topic 606.
The following table summarizes the over time revenue for the periods presented:
| | | | | | | | | | | | | | | |
| Three Months Ended | | | Six Months Ended | |
| November 30, | | | November 30, | |
(in thousands) | 2022 | | | 2021 | | | 2022 | | | 2021 | |
Steel Processing - toll | $ | 34,688 | | | $ | 37,176 | | | $ | 71,433 | | | $ | 71,958 | |
The following table summarizes the unbilled receivables at the dates indicated:
| | | | | | | | | |
| | | November 30, | | | May 31, | |
(in thousands) | Balance Sheet Classification | | 2022 | | | 2022 | |
Unbilled receivables | Receivables | | $ | 3,192 | | | $ | 5,001 | |
There were no contract assets at November 30, 2022 or May 31, 2022.
We have elected the optional exemption, which allows for the exclusion of the amounts for remaining performance obligations that are a part of contracts with an expected duration of one year or less. As of November 30, 2022, there were no unsatisfied or partially satisfied performance obligations related to contracts with an expected duration greater than one year.
Note D – Investments in Unconsolidated Affiliates
Investments in affiliated companies that we do not control, either through majority ownership or otherwise, are accounted for using the equity method. At November 30, 2022, we held noncontrolling investments in the following affiliated companies: Clarkwestern Dietrich Building Systems LLC (“ClarkDietrich”) (25%); Serviacero Planos, S. de R. L. de C.V. (“Serviacero Worthington”) (50%); Taxi Workhorse Holdings, LLC (“Workhorse”) (20%); and Worthington Armstrong Venture (“WAVE”) (50%).
On August 3, 2022, the Company sold its 50% noncontrolling equity interest in ArtiFlex Manufacturing, LLC (“ArtiFlex”) to the unaffiliated joint venture member for approximately $42,086,000, after adjustments for closing debt and final net working capital. Approximately $6,000,000 of the total cash proceeds were attributed to real property in Wooster, Ohio, with a net book value of approximately $6,300,000. This real property was owned by Worthington and leased to ArtiFlex prior to closing of the transaction. The Company recognized a pre-tax loss of approximately $15,759,000 in equity income related to the sale of its 50% noncontrolling equity interest portion of the transaction.
6
Table of Contents
We received distributions from unconsolidated affiliates totaling $129,766,000 during the six months ended November 30, 2022. We have received cumulative distributions from WAVE in excess of our investment balance amounting to $91,643,000, which is shown as a separate liability on our consolidated balance sheet at November 30, 2022. In accordance with the applicable accounting guidance, we have reclassified the negative investment balance to the liabilities section of our consolidated balance sheets. We will continue to record our equity in the net income of WAVE as a debit to the investment account, and if the investment balance becomes positive, it will again be shown as an asset on our consolidated balance sheets. If it becomes probable that any excess distribution may not be returned (upon joint venture liquidation or otherwise), we will recognize any negative investment balance classified as a liability as income immediately.
We use the “cumulative earnings” approach for determining cash flow presentation of distributions from our unconsolidated joint ventures. Distributions received are included in our consolidated statements of cash flows as operating activities, unless the cumulative distributions received, less distributions received in prior periods that were determined to be returns of investment, exceed our portion of the cumulative equity in the net earnings of the joint venture, in which case the excess distributions are deemed to be returns of the investment and are classified as investing activities in our consolidated statements of cash flows.
The following tables summarize combined financial information for our unconsolidated affiliates as of the dates, and for the periods presented:
| | | | | | | |
| November 30, | | | May 31, | |
(in thousands) | 2022 | | | 2022 | |
Cash and cash equivalents | $ | 41,768 | | | $ | 68,563 | |
Other current assets | | 911,881 | | | | 1,148,029 | |
Noncurrent assets | | 301,027 | | | | 369,608 | |
Total assets | $ | 1,254,676 | | | $ | 1,586,200 | |
| | | | | |
Current liabilities | | 292,303 | | | | 345,097 | |
Short-term borrowings | | 10,000 | | | | 5,943 | |
Current maturities of long-term debt | | 36,110 | | | | 33,054 | |
Long-term debt | | 304,108 | | | | 306,814 | |
Other noncurrent liabilities | | 69,667 | | | | 76,437 | |
Equity | | 542,488 | | | | 818,855 | |
Total liabilities and equity | $ | 1,254,676 | | | $ | 1,586,200 | |
| | | | | | | | | | | | | | |
| Three Months Ended | | Six Months Ended | |
| November 30, | | November 30, | |
(in thousands) | 2022 | | | 2021 | | 2022 | | | 2021 | |
Net sales | $ | 711,665 | | | $ | 858,165 | | $ | 1,535,607 | | | $ | 1,603,160 | |
Gross margin | | 147,299 | | | | 226,502 | | | 328,704 | | | | 416,176 | |
Operating income | | 107,356 | | | | 184,779 | | | 245,183 | | | | 330,767 | |
Depreciation and amortization | | 6,864 | | | | 7,848 | | | 15,052 | | | | 16,075 | |
Interest expense | | 3,910 | | | | 2,711 | | | 6,590 | | | | 5,172 | |
Income tax expense | | 1,262 | | | | 8,565 | | | 3,372 | | | | 16,461 | |
Net earnings | | 105,183 | | | | 173,915 | | | 238,421 | | | | 312,803 | |
7
Table of Contents
Note E – Impairment of Long-Lived Assets
Impairment of Long-Lived Assets
Fiscal 2023: During the first quarter of fiscal 2023, we committed to plans to liquidate certain fixed assets at our Samuel joint venture’s toll processing facility in Cleveland, Ohio. As all of the criteria for classification as assets held for sale continue to be met during the quarter ended November 30, 2022, the net assets have been presented separately as assets held for sale in our consolidated balance sheet as of November 30, 2022. In accordance with the applicable accounting guidance, the net assets were recorded at the lower of net book value or fair market value less costs to sell. As a result, a pre-tax impairment charge of $312,000 was recognized during the first quarter of fiscal 2023 to write the book value of the land and building of the asset group to its estimated fair value less cost to sell. The land and building were subsequently sold during the second quarter of fiscal 2023 for net cash proceeds of $3,298,000. Machinery and equipment with a net book value of $1,562,000 continues to be classified as held for sale. No impairment charges were recorded during the second quarter of fiscal 2023.
Fiscal 2022: None
Note F – Restructuring and Other Income, Net
We consider restructuring activities to be programs whereby we fundamentally change our operations, such as closing and consolidating manufacturing facilities or moving manufacturing of a product to another location. Restructuring activities may also involve substantial realignment of the management structure of a business unit in response to changing market conditions.
A progression of the liabilities associated with our restructuring activities, combined with a reconciliation to the restructuring and other income, net financial statement caption, in our consolidated statement of earnings for the six months ended November 30, 2022 is summarized below:
| | | | | | | | | | | | | | | | | | | | |
(in thousands) | | Balance, as of
May 31, 2022 | | | Expense
(Income) | | | Payments | | | Adjustments | | | Balance, as of
November 30, 2022 | |
Early retirement and severance | | $ | 541 | | | $ | 85 | | | $ | (605 | ) | | $ | - | | | $ | 21 | |
Net gain on sale of assets (1)(2) | | | | | | (5,467 | ) | | | | | | | | | |
Restructuring and other income, net | | | $ | (5,382 | ) | | | | | | | | | |
(1)On June 14, 2022, we sold real property in Tulsa, Oklahoma, for net cash proceeds of $5,775,000, resulting in a pre-tax gain of $1,177,000. These assets had been excluded from the sale of our former oil & gas equipment business in January 2021. The assets were classified in assets held for sale on the consolidated balance sheets immediately prior to the closing of the sale.
(2)On October 31, 2022, the Company’s consolidated steel processing joint venture, WSP, sold its remaining manufacturing facility, located in Jackson, Michigan. Net proceeds of $21,277,000 were realized in connection with the transaction, of which $2,000,000 is being held in escrow for general representations and warranties. The transaction resulted in a pre-tax gain of $3,926,000. The assets were classified in assets held for sale on the consolidated balance sheets immediately prior to the closing of the sale.
The total liability associated with our restructuring activities as of November 30, 2022 is expected to be paid in the next twelve months.
8
Table of Contents
Note G – Contingent Liabilities and Commitments
Legal Proceedings
We are defendants in certain legal actions. In the opinion of management, the outcome of these actions, which is not clearly determinable at the present time, would not significantly affect our consolidated financial position or future results of operations. We also believe that environmental issues will not have a material effect on our capital expenditures, consolidated financial position or future results of operations.
Note H – Guarantees
We do not have guarantees that we believe are reasonably likely to have a material current or future effect on our consolidated financial condition, changes in financial condition, revenues or expenses, results of operations, liquidity, capital expenditures or capital resources. However, we had in place $14,137,000 of outstanding stand-by letters of credit issued to third-party service providers at November 30, 2022. No amounts were drawn against these stand-by letters of credit at November 30, 2022. We are also party to an operating lease for an aircraft in which we have guaranteed a residual value at lease termination. The maximum obligation under the terms of this guarantee was approximately $17,524,000 at November 30, 2022.
Note I – Debt
We maintain a $500,000,000 multi-year revolving credit facility (the “Credit Facility”) with a group of lenders. On August 20, 2021, we amended and restated the Credit Facility, extending the final maturity from February 16, 2023 to August 20, 2026 while keeping in place the $500,000,000 aggregate commitments under the Credit Facility. Borrowings under the Credit Facility have maturities of up to one year. We have the option to borrow at rates equal to an applicable margin over the Daily LIBOR Rate, the Prime Rate of PNC Bank, National Association or the Overnight Bank Funding Rate. The Credit Facility contains customary LIBOR benchmark replacement language. The applicable margin is determined by our credit rating. There were no borrowings outstanding under the Credit Facility at November 30, 2022, leaving $500,000,000 available for future use.
We also maintain a revolving trade accounts receivable securitization facility (the “AR Facility”). Pursuant to the terms of the AR Facility, certain of our subsidiaries sell or contribute all of their eligible accounts receivable and other related assets without recourse, on a revolving basis, to Worthington Receivables Company, LLC (“WRC”), a wholly-owned, consolidated, bankruptcy-remote indirect subsidiary. In turn, WRC sells, on a revolving basis, up to $175,000,000 of undivided ownership interests in this pool of accounts receivable to a third-party bank. We retain an undivided interest in this pool and are subject to risk of loss based on the collectability of the receivables from this retained interest. Because the amount eligible to be sold excludes receivables more than 120 days past due, receivables offset by an allowance for doubtful accounts due to bankruptcy or other cause, concentrations over certain limits with specific customers and certain reserve amounts, we believe additional risk of loss is minimal. As of November 30, 2022, there were no borrowings outstanding under the AR Facility, leaving $175,000,000 available for future use.
Tempel China has short-term loan facilities that result in the equivalent of $4,935,000 U.S. dollars outstanding at November 30, 2022. These loans, which are used to finance steel purchases, are collateralized by Tempel China property and equipment and mature in 2023. New loans may be entered into as these loans mature. The effective interest rate on these loans is 3.5% at November 30, 2022.
Note J – Other Comprehensive Income (Loss)
The following table summarizes the tax effects on each component of OCI for the periods presented:
| | | | | | | | | | | | | | | | | | | | | | | |
| Three Months Ended | |
| November 30, 2022 | | | November 30, 2021 | |
| Before-Tax | | | Tax | | | Net-of-Tax | | | Before-Tax | | | Tax | | | Net-of-Tax | |
(in thousands) | | | | | | | | | | | | | | | | | |
Foreign currency translation | $ | 550 | | | $ | 308 | | | $ | 858 | | | $ | (4,507 | ) | | $ | (365 | ) | | $ | (4,872 | ) |
Pension liability adjustment | | 15 | | | | (97 | ) | | | (82 | ) | | | - | | | | - | | | | - | |
Cash flow hedges | | (5,665 | ) | | | 1,665 | | | | (4,000 | ) | | | (68,677 | ) | | | 15,691 | | | | (52,986 | ) |
Other comprehensive loss | $ | (5,100 | ) | | $ | 1,876 | | | $ | (3,224 | ) | | $ | (73,184 | ) | | $ | 15,326 | | | $ | (57,858 | ) |
9
Table of Contents
| | | | | | | | | | | | | | | | | | | | | | | |
| Six Months Ended | |
| November 30, 2022 | | | November 30, 2021 | |
| Before-Tax | | | Tax | | | Net-of-Tax | | | Before-Tax | | | Tax | | | Net-of-Tax | |
(in thousands) | | | | | | | | | | | | | | | | | |
Foreign currency translation | $ | (8,970 | ) | | $ | (273 | ) | | $ | (9,243 | ) | | $ | (8,124 | ) | | $ | (723 | ) | | $ | (8,847 | ) |
Pension liability adjustment | | 3,740 | | | | (883 | ) | | | 2,857 | | | | - | | | | - | | | | - | |
Cash flow hedges | | (22,762 | ) | | | 5,462 | | | | (17,300 | ) | | | (68,876 | ) | | | 15,591 | | | | (53,285 | ) |
Other comprehensive loss | $ | (27,992 | ) | | $ | 4,306 | | | $ | (23,686 | ) | | $ | (77,000 | ) | | $ | 14,868 | | | $ | (62,132 | ) |
Note K – Changes in Equity
The following tables summarize the changes in equity by component and in total for the periods presented:
| | | | | | | | | | | | | | | | | | | | | | | | |
| | Controlling Interest | | | | | | | |
| | | | | Accumulated | | | | | | | | | | | | | |
| | | | | Other | | | | | | | | | | | | | |
| | Additional | | | Comprehensive | | | | | | | | | Non- | | | | |
| | Paid-in | | | Loss, | | | Retained | | | | | | controlling | | | | |
(in thousands) | | Capital | | | Net of Tax | | | Earnings | | | Total | | | Interests | | | Total | |
Balance at May 31, 2022 | | $ | 273,439 | | | $ | (22,850 | ) | | $ | 1,230,163 | | | $ | 1,480,752 | | | $ | 133,210 | | | $ | 1,613,962 | |
Net earnings | | | - | | | | - | | | | 64,082 | | | | 64,082 | | | | 1,162 | | | | 65,244 | |
Other comprehensive loss | | | - | | | | (20,462 | ) | | | - | | | | (20,462 | ) | | | - | | | | (20,462 | ) |
Common shares issued, net of withholding tax | | | (3,466 | ) | | | - | | | | - | | | | (3,466 | ) | | | - | | | | (3,466 | ) |
Common shares in non-qualified plans | | | 136 | | | | - | | | | - | | | | 136 | | | | - | | | | 136 | |
Stock-based compensation | | | 6,976 | | | | - | | | | - | | | | 6,976 | | | | - | | | | 6,976 | |
Cash dividends declared | | | - | | | | - | | | | (15,418 | ) | | | (15,418 | ) | | | - | | | | (15,418 | ) |
Balance at August 31, 2022 | | $ | 277,085 | | | $ | (43,312 | ) | | $ | 1,278,827 | | | $ | 1,512,600 | | | $ | 134,372 | | | $ | 1,646,972 | |
Net earnings | | | - | | | | - | | | | 16,218 | | | | 16,218 | | | | 3,287 | | | | 19,505 | |
Other comprehensive loss | | | - | | | | (3,224 | ) | | | - | | | | (3,224 | ) | | | - | | | | (3,224 | ) |
Common shares issued, net of withholding tax | | | (649 | ) | | | - | | | | - | | | | (649 | ) | | | - | | | | (649 | ) |
Common shares in non-qualified plans | | | 298 | | | | - | | | | - | | | | 298 | | | | - | | | | 298 | |
Stock-based compensation | | | 3,620 | | | | - | | | | - | | | | 3,620 | | | | - | | | | 3,620 | |
Cash dividends declared | | | - | | | | - | | | | (15,470 | ) | | | (15,470 | ) | | | - | | | | (15,470 | ) |
Dividends to noncontrolling interest | | | - | | | | - | | | | - | | | | - | | | | (11,760 | ) | | | (11,760 | ) |
Balance at November 30, 2022 | | $ | 280,354 | | | $ | (46,536 | ) | | $ | 1,279,575 | | | $ | 1,513,393 | | | $ | 125,899 | | | $ | 1,639,292 | |
10
Table of Contents
| | | | | | | | | | | | | | | | | | | | | | | | |
| | Controlling Interest | | | | | | | |
| | | | | Accumulated | | | | | | | | | | | | | |
| | | | | Other | | | | | | | | | | | | | |
| | Additional | | | Comprehensive | | | | | | | | | Non- | | | | |
| | Paid-in | | | Income (Loss), | | | Retained | | | | | | controlling | | | | |
(in thousands) | | Capital | | | Net of Tax | | | Earnings | | | Total | | | Interests | | | Total | |
Balance at May 31, 2021 | | $ | 282,790 | | | $ | 45,387 | | | $ | 1,070,016 | | | $ | 1,398,193 | | | $ | 153,502 | | | $ | 1,551,695 | |
Net earnings | | | - | | | | - | | | | 132,491 | | | | 132,491 | | | | 8,984 | | | | 141,475 | |
Other comprehensive loss | | | - | | | | (4,274 | ) | | | - | | | | (4,274 | ) | | | - | | | | (4,274 | ) |
Common shares issued, net of withholding tax | | | (4,091 | ) | | | - | | | | - | | | | (4,091 | ) | | | - | | | | (4,091 | ) |
Common shares in non-qualified plans | | | 89 | | | | - | | | | - | | | | 89 | | | | - | | | | 89 | |
Stock-based compensation | | | 6,324 | | | | - | | | | - | | | | 6,324 | | | | - | | | | 6,324 | |
Purchases and retirement of common shares | | | (5,477 | ) | | | - | | | | (55,408 | ) | | | (60,885 | ) | | | - | | | | (60,885 | ) |
Cash dividends declared | | | - | | | | - | | | | (14,504 | ) | | | (14,504 | ) | | | - | | | | (14,504 | ) |
Dividends to noncontrolling interests | | | - | | | | - | | | | - | | | | - | | | | (9,197 | ) | | | (9,197 | ) |
Balance at August 31, 2021 | | $ | 279,635 | | | $ | 41,113 | | | $ | 1,132,595 | | | $ | 1,453,343 | | | $ | 153,289 | | | $ | 1,606,632 | |
Net earnings | | | - | | | | - | | | | 110,301 | | | | 110,301 | | | | 2,884 | | | | 113,185 | |
Other comprehensive loss | | | - | | | | (57,858 | ) | | | - | | | | (57,858 | ) | | | - | | | | (57,858 | ) |
Common shares issued, net of withholding tax | | | (2,694 | ) | | | - | | | | - | | | | (2,694 | ) | | | - | | | | (2,694 | ) |
Common shares in non-qualified plans | | | 257 | | | | - | | | | - | | | | 257 | | | | - | | | | 257 | |
Stock-based compensation | | | 3,304 | | | | - | | | | - | | | | 3,304 | | | | - | | | | 3,304 | |
Purchases and retirement of common shares | | | (1,297 | ) | | | - | | | | (11,405 | ) | | | (12,702 | ) | | | - | | | | (12,702 | ) |
Cash dividends declared | | | - | | | | - | | | | (14,154 | ) | | | (14,154 | ) | | | - | | | | (14,154 | ) |
Dividends to noncontrolling interest | | | - | | | | - | | | | - | | | | - | | | | (2,879 | ) | | | (2,879 | ) |
Balance at November 30, 2021 | | $ | 279,205 | | | $ | (16,745 | ) | | $ | 1,217,337 | | | $ | 1,479,797 | | | $ | 153,294 | | | $ | 1,633,091 | |
The following table summarizes the changes in accumulated other comprehensive income (loss) for the periods presented:
| | | | | | | | | | | | | | | | |
| | | | | | | | | | | Accumulated | |
| | Foreign | | | Pension | | | | | | Other | |
| | Currency | | | Liability | | | Cash Flow | | | Comprehensive | |
(in thousands) | | Translation | | | Adjustment | | | Hedges | | | Loss | |
Balance as of May 31, 2022 | | $ | (15,310 | ) | | $ | (6,244 | ) | | $ | (1,296 | ) | | $ | (22,850 | ) |
Other comprehensive loss before reclassifications | | | (8,970 | ) | | | (1,034 | ) | | | (36,041 | ) | | | (46,045 | ) |
Reclassification adjustments to net earnings (a) | | | - | | | | 4,774 | | | | 13,279 | | | | 18,053 | |
Income tax effect | | | (273 | ) | | | (883 | ) | | | 5,462 | | | | 4,306 | |
Balance as of November 30, 2022 | | $ | (24,553 | ) | | $ | (3,387 | ) | | $ | (18,596 | ) | | $ | (46,536 | ) |
| | | | | | | | | | | | | | | | |
| | | | | | | | | | | Accumulated | |
| | Foreign | | | Pension | | | | | | Other | |
| | Currency | | | Liability | | | Cash Flow | | | Comprehensive | |
(in thousands) | | Translation | | | Adjustment | | | Hedges | | | Income (Loss) | |
Balance as of May 31, 2021 | | $ | 1,779 | | | $ | (15,955 | ) | | $ | 59,563 | | | $ | 45,387 | |
Other comprehensive income (loss) before reclassifications | | | (8,124 | ) | | | - | | | | 14,279 | | | | 6,155 | |
Reclassification adjustments to net earnings (a) | | | - | | | | - | | | | (83,155 | ) | | | (83,155 | ) |
Income tax effect | | | (723 | ) | | | - | | | | 15,591 | | | | 14,868 | |
Balance as of November 30, 2021 | | $ | (7,068 | ) | | $ | (15,955 | ) | | $ | 6,278 | | | $ | (16,745 | ) |
11
Table of Contents
(a)The statement of earnings classification of amounts reclassified to net earnings include:
1.Pension liability adjustment – During August 2022, we purchased (using pension plan assets) an annuity contract from a third-party insurance company to transfer approximately 31% of the total projected benefit obligation of The Gerstenslager Company Bargaining Unit Employees’ Pension Plan as of the purchase date. As a result of this transaction: 1) we incurred a non-cash settlement charge of $4,774,000 within “Miscellaneous income (expense), net”; 2) we were relieved of all responsibility for these pension obligations; and 3) the insurance company is now required to pay and administer the retirement benefits owed to 220 beneficiaries; and
2.Cash flow hedges – disclosed in “Note Q – Derivative Financial Instruments and Hedging Activities”.
Note L – Stock-Based Compensation
Non-Qualified Stock Options
During the six months ended November 30, 2022, we granted non-qualified stock options covering a total of 84,400 common shares under our stock-based compensation plans. The weighted average exercise price of $46.39 per share was equal to the market price of the underlying common shares at the grant date. The fair value of these stock options, based on the Black-Scholes option-pricing model, calculated at the grant date, was $16.36 per share. The calculated pre-tax stock-based compensation expense for these stock options is $1,381,000 and will be recognized on a straight-line basis over the three-year vesting period, net of any forfeitures. The following assumptions were used to value these stock options:
| | | | |
Dividend yield | | | 2.33 | % |
Expected volatility | | | 41.63 | % |
Risk-free interest rate | | | 3.19 | % |
Expected term (years) | | | 6.0 | |
Expected volatility is based on the historical volatility of Worthington Industries, Inc.’s common shares and the risk-free interest rate is based on the U.S. Treasury strip rate for the expected term of the stock options. The expected term was developed using historical exercise experience.
Service-Based Restricted Common Shares
During the six months ended November 30, 2022, we granted an aggregate of 308,000 service-based restricted common shares under our stock-based compensation plans, which generally vest three years after their grant date. The fair value of these restricted common shares was equal to the weighted average closing market price of the underlying common shares on the date of grant, or $51.09 per share. The calculated pre-tax stock-based compensation expense for these restricted common shares is $15,216,000 and will be recognized on a straight-line basis over the three-year service-based vesting period.
Market-Based Restricted Common Shares
On June 24, 2022, we granted 10,000 market-based restricted common shares to one key employee under one of our stock-based compensation plans. Vesting of these restricted common shares is contingent upon the average closing price of the common shares reaching $65.00 during any 90 consecutive day period during the five-year period following the date of grant and completion of a three-year service vesting period. The grant date fair value of these restricted common shares, as determined by a Monte Carlo simulation model, was $35.49 per share. The calculated pre-tax stock-based compensation expense for these market-based restricted common shares is $355,000 and will be recognized on a straight-line basis over the three-year service-based vesting period. The following assumptions were used to determine the grant-date fair value and the derived service period for these restricted common shares:
| | | | |
Dividend yield | | | 2.67 | % |
Expected volatility | | | 43.00 | % |
Risk-free interest rate | | | 3.18 | % |
12
Table of Contents
Performance Share Awards
We have awarded performance shares to certain key employees under our stock-based compensation plans. These performance shares are earned based on the level of achievement with respect to corporate targets for cumulative corporate economic value added, earnings per share growth and, in the case of business unit executives, a business unit adjusted earnings before interest and taxes target, in each case for the three-year periods ending May 31, 2023, 2024 and 2025. These performance share awards will be paid, to the extent earned, in common shares of Worthington Industries, Inc. in the fiscal quarter following the end of the applicable three-year performance period. The fair values of our performance shares are determined by the closing market prices of the underlying common shares at the respective grant dates of the performance shares and the pre-tax stock-based compensation expense is based on our periodic assessment of the probability of the targets being achieved and our estimate of the number of common shares that will ultimately be issued. During the six months ended November 30, 2022, we granted performance share awards covering an aggregate of 58,100 common shares (at target levels). The calculated pre-tax stock-based compensation expense for these performance shares is $2,695,000. The ultimate pre-tax stock-based compensation expense to be recognized over the three-year performance period on all tranches will vary based on our periodic assessment of the probability of the targets being achieved.
Income tax expense for the six months ended November 30, 2022 and 2021 reflected estimated annual effective income tax rates of 23.7% and 22.8%, respectively, and exclude any impact from the inclusion of net earnings attributable to noncontrolling interests in our consolidated statements of earnings. Net earnings attributable to noncontrolling interests are a result of our Samuel, Spartan, TWB and WSP (through October 31, 2022) consolidated joint ventures. The net earnings attributable to the noncontrolling interests in Samuel, Spartan, TWB and WSP’s U.S. operations do not generate tax expense to Worthington since the investors in Samuel, Spartan, TWB and WSP’s U.S. operations are taxed directly based on the earnings attributable to them. The tax expense of TWB’s wholly-owned foreign corporations is reported in our consolidated income tax expense. Management is required to estimate the annual effective income tax rate based upon its forecast of annual pre-tax income for domestic and foreign operations. Our actual effective income tax rate for fiscal 2023 could be materially different from the forecasted rate as of November 30, 2022.
Note N – Earnings per Share
The following table sets forth the computation of basic and diluted earnings per share attributable to controlling interest for the periods presented:
| | | | | | | | | | | | | | | |
| Three Months Ended | | | Six Months Ended | |
| November 30, | | | November 30, | |
(in thousands, except per share amounts) | 2022 | | | 2021 | | | 2022 | | | 2021 | |
Numerator (basic & diluted): | | | | | | | | | | | |
Net earnings attributable to controlling interest - | | | | | | | | | | | |
income available to common shareholders | $ | 16,218 | | | $ | 110,301 | | | $ | 80,300 | | | $ | 242,792 | |
Denominator: | | | | | | | | | | | |
Denominator for basic earnings per share attributable to | | | | | | | | | | | |
controlling interest - weighted average common shares | | 48,558 | | | | 50,381 | | | | 48,518 | | | | 50,618 | |
Effect of dilutive securities | | 772 | | | | 833 | | | | 775 | | | | 914 | |
Denominator for diluted earnings per share attributable to | | | | | | | | | | | |
controlling interest - adjusted weighted average common shares | | 49,330 | | | | 51,214 | | | | 49,293 | | | | 51,532 | |
| | | | | | | | | | | |
Basic earnings per share attributable to controlling interest | $ | 0.33 | | | $ | 2.19 | | | $ | 1.66 | | | $ | 4.80 | |
Diluted earnings per share attributable to controlling interest | $ | 0.33 | | | $ | 2.15 | | | $ | 1.63 | | | $ | 4.71 | |
Stock options covering an aggregate of 138,100 and 54,500 common shares for the three months ended November 30, 2022 and 2021, respectively, and 127,492 and 47,352 common shares for the six months ended November 20, 2022 and 2021, respectively have been excluded from the computation of diluted earnings per share because the effect would have been anti-dilutive for those periods.
13
Table of Contents
Note O – Segment Operations
The profit measure that the Company’s Chief Operating Decision Maker ("CODM") uses to assess segment performance and allocate resources is adjusted earnings (loss) before interest and taxes (“adjusted EBIT”). EBIT is calculated by adding interest expense and income tax expense to net earnings attributable to controlling interest. Adjusted EBIT excludes impairment and restructuring charges (gains), but may also exclude other items that management believes are not reflective of, and thus should not be included when evaluating the performance of the Company’s ongoing operations, including direct and incremental costs incurred in connection with the planned Separation of the Company’s Steel Processing business. Adjusted EBIT is a non-GAAP financial measure and is used by management to evaluate segment performance, engage in financial and operational planning and determine incentive compensation because we believe that this financial measure provides additional perspective and, in some circumstances is more closely correlated to, the performance of the Company’s ongoing operations.
The following table presents summarized financial information for our reportable operating segments for the periods indicated.
| | | | | | | | | | | | | | | | | | | | | | |
| Three Months Ended November 30, 2022 | |
(in thousands) | Steel Processing | | | Consumer Products | | | Building Products | | Sustainable Energy Solutions | | | Other | | | Consolidated | |
Net sales | $ | 841,947 | | | $ | 153,795 | | | $ | 141,671 | | $ | 38,128 | | | $ | - | | | $ | 1,175,541 | |
Restructuring and other income, net | | (4,282 | ) | | | - | | | | - | | | - | | | | - | | | | (4,282 | ) |
Separation costs | | - | | | | - | | | | - | | | - | | | | 9,246 | | | | 9,246 | |
Miscellaneous income (expense), net | | 850 | | | | (47 | ) | | | 76 | | | 142 | | | | 384 | | | | 1,405 | |
Equity in net income (loss) of unconsolidated affiliates | | 1,906 | | | | - | | | | 35,107 | | | - | | | | (156 | ) | | | 36,857 | |
Adjusted EBIT (1)(2) | | (17,249 | ) | | | 13,473 | | | | 41,224 | | | 1,143 | | | | (3,291 | ) | | | 35,300 | |
(1)Excludes the noncontrolling interest portion of the restructuring gains within Steel Processing of $1,850.
(2)Excludes $525 in selling, general and administrative expense in Consumer Products related to incremental expense attributable to the Level5 earnout; excludes $9,246 of Separation costs in Other related to direct and incremental costs incurred in connection with the anticipated Separation, including audit, advisory, and legal costs.
| | | | | | | | | | | | | | | | | | | | | | |
| Three Months Ended November 30, 2021 | |
(in thousands) | Steel Processing | | | Consumer Products | | | Building Products | | Sustainable Energy Solutions | | | Other | | | Consolidated | |
Net sales | $ | 937,842 | | | $ | 140,793 | | | $ | 121,125 | | $ | 33,101 | | | $ | - | | | $ | 1,232,861 | |
Restructuring and other income, net | | (182 | ) | | | - | | | | - | | | - | | | | (1,822 | ) | | | (2,004 | ) |
Miscellaneous income, net | | 17 | | | | 159 | | | | 218 | | | 82 | | | | 564 | | | | 1,040 | |
Equity in net income of unconsolidated affiliates | | 8,823 | | | | - | | | | 49,894 | | | - | | | | 1,501 | | | | 60,218 | |
Adjusted EBIT (3) | | 71,925 | | | | 17,584 | | | | 54,718 | | | 796 | | | | 1,893 | | | | 146,916 | |
(3)Excludes the noncontrolling interest portion of the restructuring gains within Steel Processing of $81.
| | | | | | | | | | | | | | | | | | | | | | |
| Six Months Ended November 30, 2022 | |
(in thousands) | Steel Processing | | | Consumer Products | | | Building Products | | Sustainable Energy Solutions | | | Other | | | Consolidated | |
Net sales | $ | 1,880,827 | | | $ | 342,497 | | | $ | 291,994 | | $ | 68,888 | | | $ | - | | | $ | 2,584,206 | |
Impairment of long-lived assets | | 312 | | | | - | | | | - | | | - | | | | - | | | | 312 | |
Restructuring and other income, net | | (4,205 | ) | | | - | | | | - | | | - | | | | (1,177 | ) | | | (5,382 | ) |
Separation costs | | - | | | | - | | | | - | | | - | | | | 9,246 | | | | 9,246 | |
Miscellaneous income (expense), net | | 1,035 | | | | (82 | ) | | | 299 | | | 56 | | | | (4,989 | ) | | | (3,681 | ) |
Equity in net income (loss) of unconsolidated affiliates | | 3,676 | | | | - | | | | 78,973 | | | - | | | | (14,080 | ) | | | 68,569 | |
Adjusted EBIT (4)(5) | | 17,663 | | | | 34,406 | | | | 93,959 | | | (250 | ) | | | 1,854 | | | | 147,632 | |
(4)Excludes a non-cash settlement charge of $4,774 in miscellaneous income (expense), net within Other to accelerate a portion of deferred pension cost as a result of a pension lift-out transaction executed with a third-party insurance company to transfer a portion of the total projected benefit obligation of The Gerstenslager Company Bargaining Unit Employees’ Pension Plan to the third-party insurance company; excludes a loss of $15,759 in equity in net income (loss) of unconsolidated affiliates within Other related to the sale of the Company’s 50% noncontrolling equity investment in ArtiFlex effective August 3, 2022; excludes $1,050 in selling, general and administrative expense in Consumer Products related to incremental compensation expense attributable to the Level5 earnout; and excludes $9,246 of Separation costs in Other related to direct and incremental costs incurred in connection with the anticipated Separation, including audit, advisory, and legal costs.
14
Table of Contents
(5)Excludes the noncontrolling interest portion of the impairment charge and restructuring gains within Steel Processing of $1,734.
| | | | | | | | | | | | | | | | | | | | | | |
| Six Months Ended November 30, 2021 | |
(in thousands) | Steel Processing | | | Consumer Products | | | Building Products | | Sustainable Energy Solutions | | | Other | | | Consolidated | |
Net sales | $ | 1,760,652 | | | $ | 288,576 | | | $ | 235,868 | | $ | 58,583 | | | $ | - | | | $ | 2,343,679 | |
Restructuring and other income, net | | (12,313 | ) | | | - | | | | - | | | (143 | ) | | | (1,822 | ) | | | (14,278 | ) |
Miscellaneous income, net | | 47 | | | | 209 | | | | 144 | | | 22 | | | | 1,248 | | | | 1,670 | |
Equity in net income of unconsolidated affiliates | | 18,172 | | | | - | | | | 92,887 | | | - | | | | 2,075 | | | | 113,134 | |
Adjusted EBIT (6) | | 179,617 | | | | 38,140 | | | | 103,471 | | | (1,760 | ) | | | 1,479 | | | | 320,947 | |
(6)Excludes the noncontrolling interest portion of the restructuring gains within Steel Processing of $6,027.
Total assets for each of our operating segments as of the dates indicated were as follows:
| | | | | | | |
| November 30, | | | May 31, | |
(in thousands) | 2022 | | | 2022 | |
Total assets | | | | | |
Steel Processing | $ | 1,796,136 | | | $ | 2,082,522 | |
Consumer Products | | 627,474 | | | | 577,026 | |
Building Products | | 645,566 | | | | 681,188 | |
Sustainable Energy Solutions | | 120,978 | | | | 114,084 | |
Other | | 200,506 | | | | 188,203 | |
Total assets | $ | 3,390,660 | | | $ | 3,643,023 | |
Note P – Acquisitions
Level5® Tools, LLC
On June 2, 2022, we acquired Level5® Tools, LLC ("Level5"), a leading provider of drywall tools and related accessories. The total purchase price was $59,321,000, including $2,000,000 attributed to an earnout agreement with the selling shareholders, that provides for up to an additional $25,000,000 of cash consideration should certain earnings targets be met annually through calendar 2024. The earnout agreement also requires continued employment of a selling shareholder during the duration of the earnout period. Accordingly, payments to this key employee, to the extent earned, will be accounted for as post-combination compensation expense. During the three months and six months ended November 30, 2022, compensation expense of $525,000 and $1,050,000, respectively, has been accrued within selling, general, and administrative expense in the consolidated statements of earnings related to the earnout.
Level5 is being operated as part of the Consumer Products operating segment and its results have been included in our consolidated statements of earnings since the date of acquisition. Proforma results, including the acquired business since the beginning of fiscal 2022, would not be materially different from the reported results.
The information included herein has been based on the preliminary allocation of the purchase price using estimates of the fair value and useful lives of the assets acquired. The purchase price allocation is subject to further adjustment until all pertinent information regarding the assets acquired is fully evaluated by us, including but not limited to, the fair value accounting.
The assets acquired and liabilities assumed were recognized at their estimated acquisition-date fair values, with goodwill representing the excess of the purchase price over the fair value of the net identifiable assets acquired. In connection with the acquisition of Level5, we identified and valued the following intangible assets:
| | | | | | |
(in thousands) | | | | | |
Category | | Amount | | | Useful Life (Years) |
Trade name | | $ | 13,500 | | | Indefinite |
Customer relationships | | | 13,300 | | | 10 |
Technological know-how | | | 6,500 | | | 20 |
Non-compete agreement | | | 280 | | | 3 |
Total acquired identifiable intangible assets | | $ | 33,580 | | | |
15
Table of Contents
The purchase price includes the fair values of other assets that were not identifiable, not separately recognizable under applicable accounting rules (e.g., assembled workforce) or of immaterial value. The purchase price also includes strategic and synergistic benefits (investment value) specific to us, which resulted in a purchase price in excess of the fair value of the identifiable net assets. This additional investment value resulted in goodwill which will be deductible by us for income tax purposes.
The following table summarizes the consideration transferred and the estimated fair value assigned to the assets acquired and liabilities assumed at the acquisition date. These amounts reflect various preliminary fair value estimates and assumptions, including preliminary work performed by a third-party valuation specialist, and are subject to change within the measurement period as the valuation is finalized. The primary areas of preliminary purchase price allocation subject to change relate to the valuation of acquired tangible assets and liabilities, identification and valuation of residual goodwill and tax effects of acquired assets and assumed liabilities.
| | | | | | | | | | | | |
(in thousands) | | Preliminary
Valuation | | | Measurement
Period
Adjustments | | | Revised
Valuation | |
Cash and cash equivalents | | $ | 1,515 | | | $ | - | | | $ | 1,515 | |
Accounts receivable | | | 2,860 | | | | - | | | | 2,860 | |
Inventories | | | 9,161 | | | | - | | | | 9,161 | |
Prepaid expenses | | | 64 | | | | - | | | | 64 | |
Property, plant and equipment | | | 273 | | | | - | | | | 273 | |
Intangible assets | | | 33,580 | | | | - | | | | 33,580 | |
Operating lease assets | | | 377 | | | | - | | | | 377 | |
Total identifiable assets | | | 47,830 | | | | - | | | | 47,830 | |
Accounts payable | | | (3,175 | ) | | | - | | | | (3,175 | ) |
Accrued expenses | | | (904 | ) | | | 151 | | | | (753 | ) |
Current operating lease liabilities | | | (111 | ) | | | - | | | | (111 | ) |
Noncurrent operating lease liabilities | | | (266 | ) | | | - | | | | (266 | ) |
Net identifiable assets | | | 43,374 | | | | 151 | | | | 43,525 | |
Goodwill | | | 15,947 | | | | - | | | | 15,947 | |
Total purchase price | | | 59,321 | | | | 151 | | | | 59,472 | |
Less: Fair value of earnout | | | (2,000 | ) | | | - | | | | (2,000 | ) |
Plus: Net working capital deficit | | | 282 | | | | (151 | ) | | | 131 | |
Cash purchase price | | $ | 57,603 | | | $ | - | | | $ | 57,603 | |
Note Q – Derivative Financial Instruments and Hedging Activities
We utilize derivative financial instruments to primarily manage exposure to certain risks related to our ongoing operations. The primary risks managed through the use of derivative financial instruments include interest rate risk, foreign currency exchange rate risk and commodity price risk. While certain of our derivative financial instruments are designated as hedging instruments, we also enter into derivative financial instruments that are designed to hedge a risk, but are not designated as hedging instruments and, therefore, do not qualify for hedge accounting. These derivative financial instruments are adjusted to current fair value through earnings at the end of each period.
Interest Rate Risk Management – We are exposed to the impact of interest rate changes. Our objective is to manage the impact of interest rate changes on cash flows and the market value of our borrowings. We utilize a mix of debt maturities along with both fixed-rate and variable-rate debt to manage changes in interest rates. In addition, we enter into interest rate swaps and treasury locks to further manage our exposure to interest rate variations related to our borrowings and to lower our overall borrowing costs.
Foreign Currency Exchange Rate Risk Management – We conduct business in several major international currencies and are, therefore, subject to risks associated with changing foreign currency exchange rates. We enter into various contracts that change in value as foreign currency exchange rates change to manage this exposure. Such contracts limit exposure to both favorable and unfavorable currency exchange rate fluctuations. The translation of foreign currencies into U.S. dollars also subjects us to exposure related to fluctuating currency exchange rates; however, derivative financial instruments are not used to manage this risk.
Commodity Price Risk Management – We are exposed to changes in the price of certain commodities, including steel, natural gas, copper, zinc and other raw materials, and our utility requirements. Our objective is to reduce earnings and cash flow volatility associated with forecasted purchases and sales of these commodities to allow management to focus its attention on business operations. Accordingly, we enter into derivative financial instruments to manage the associated price risk.
16
Table of Contents
We are exposed to counterparty credit risk on all of our derivative financial instruments. Accordingly, we have established and maintain strict counterparty credit guidelines. We have credit support agreements in place with certain counterparties to limit our credit exposure. These agreements require either party to post cash collateral if its cumulative market position exceeds a predefined liability threshold. Amounts posted to the margin accounts accrue interest at market rates and are required to be refunded in the period in which the cumulative market position falls below the required threshold. We do not have significant exposure to any one counterparty, and management believes the overall risk of loss is remote and, in any event, would not be material.
Refer to “Note R – Fair Value” for additional information regarding the accounting treatment for our derivative financial instruments, as well as how fair value is determined.
The following table summarizes the fair value of our derivative financial instruments and the respective lines in which they were recorded in the consolidated balance sheet at November 30, 2022:
| | | | | | | | | | | | |
| | Asset Derivatives | | | Liability Derivatives | |
| | Balance | | | | | Balance | | | |
| | Sheet | | Fair | | | Sheet | | Fair | |
(in thousands) | | Location | | Value | | | Location | | Value | |
Derivatives designated as hedging instruments: | | | | | | | | | | |
Commodity contracts | | Receivables | | $ | 140 | | | Accounts payable | | $ | 16,830 | |
| | Other assets | | | - | | | Other liabilities | | | 941 | |
| | | | | 140 | | | | | | 17,771 | |
Foreign currency exchange contracts | | Other assets | | | 258 | | | Accounts payable | | | - | |
Total | | | | $ | 398 | | | | | $ | 17,771 | |
| | | | | | | | | | |
Derivatives not designated as hedging instruments: | | | | | | | | |
Commodity contracts | | Receivables | | $ | 4,622 | | | Accounts payable | | $ | 2,155 | |
| | Other assets | | | 18 | | | Other liabilities | | | 275 | |
| | | | | 4,640 | | | | | | 2,430 | |
Foreign currency exchange contracts | | Receivables | | | - | | | Accounts payable | | | 94 | |
Total | | | | $ | 4,640 | | | | | $ | 2,524 | |
| | | | | | | | | | |
Total derivative financial instruments | | | | $ | 5,038 | | | | | $ | 20,295 | |
The amounts in the table above reflect the fair value of our derivative financial instruments on a net basis where allowable under master netting arrangements. Had these amounts been recognized on a gross basis, the impact would have been a $6,739,000 increase in “Receivables” with a corresponding increase in “Accounts payable.”
17
Table of Contents
The following table summarizes the fair value of our derivative financial instruments and the respective lines in which they were recorded in the consolidated balance sheet at May 31, 2022:
| | | | | | | | | | | | |
| | Asset Derivatives | | | Liability Derivatives | |
| | Balance | | | | | Balance | | | |
| | Sheet | | Fair | | | Sheet | | Fair | |
(in thousands) | | Location | | Value | | | Location | | Value | |
Derivatives designated as hedging instruments: | | | | | | | | | | |
Commodity contracts | | Receivables | | $ | 1,040 | | | Accounts payable | | $ | 4,517 | |
| | Other assets | | | - | | | Other liabilities | | | 48 | |
| | | | | 1,040 | | | | | | 4,565 | |
Foreign currency exchange contracts | | Receivables | | | - | | | Accounts payable | | | - | |
| | Other assets | | | - | | | Other liabilities | | | 17 | |
| | | | | - | | | | | | 17 | |
Total | | | | $ | 1,040 | | | | | $ | 4,582 | |
| | | | | | | | | | |
Derivatives not designated as hedging instruments: | | | | | | | | |
Commodity contracts | | Receivables | | $ | 11,555 | | | Accounts payable | | $ | 4,142 | |
| | Other assets | | | 48 | | | Other liabilities | | | 24 | |
| | | | | 11,603 | | | | | | 4,166 | |
Foreign currency exchange contracts | | Receivables | | | - | | | Accounts payable | | | 255 | |
Total | | | | $ | 11,603 | | | | | $ | 4,421 | |
| | | | | | | | | | |
Total derivative financial instruments | | | | $ | 12,643 | | | | | $ | 9,003 | |
The amounts in the table above reflect the fair value of our derivative financial instruments on a net basis where allowable under master netting arrangements. Had these amounts been recognized on a gross basis, the impact would have been a $6,300,000 increase in “Receivables” with a corresponding increase in “Accounts payable.”
Cash Flow Hedges
We enter into derivative financial instruments to hedge our exposure to changes in cash flows attributable to commodity price fluctuations associated with certain forecasted transactions. These derivative financial instruments are designated and qualify as cash flow hedges. The earnings effects of these derivative financial instruments are presented in the same statement of earnings line items as the earnings effects of the hedged items. For derivative financial instruments designated as cash flow hedges, we assess hedge effectiveness both at the onset of the hedge and at regular intervals throughout the life of the derivative financial instruments.
The following table summarizes our cash flow hedges outstanding at November 30, 2022:
| | | | | | |
| | Notional | | | |
(in thousands) | | Amount | | | Maturity Date |
Commodity contracts | | $ | 114,516 | | | December 2022 - December 2023 |
Foreign currency exchange contracts | | $ | 1,751 | | | January 2023 - July 2023 |
18
Table of Contents
The following table summarizes the gain (loss) recognized in OCI and the gain (loss) reclassified from Accumulated Other Comprehensive Income (Loss) (“AOCI”) into net earnings for derivative financial instruments designated as cash flow hedges for the periods presented:
| | | | | | | | | | |
(in thousands) | | Gain (Loss)
Recognized in OCI | | | Location of Gain (Loss)
Reclassified from AOCI
into Net Earnings | | Gain (Loss) Reclassified
from AOCI into
Net Earnings | |
For the three months ended November 30, 2022: | |
Commodity contracts | | $ | (19,641 | ) | | Cost of goods sold | | $ | (13,648 | ) |
Interest rate contracts | | | - | | | Interest expense | | | (7 | ) |
Foreign currency exchange contracts | | | 376 | | | Net sales/Cost of goods sold | | | 53 | |
Total | | $ | (19,265 | ) | | | | $ | (13,602 | ) |
| | | | | | | | |
For the three months ended November 30, 2021: | |
Commodity contracts | | $ | (21,002 | ) | | Cost of goods sold | | $ | 47,706 | |
Interest rate contracts | | | - | | | Interest expense | | | 27 | |
Foreign currency exchange contracts | | | 60 | | | Miscellaneous income, net | | | 3 | |
Total | | $ | (20,942 | ) | | | | $ | 47,736 | |
| | | | | | | | |
For the six months ended November 30, 2022: | |
Commodity contracts | | $ | (36,099 | ) | | Cost of goods sold | | $ | (13,192 | ) |
Interest rate contracts | | | - | | | Interest expense | | | (13 | ) |
Foreign currency exchange contracts | | | 58 | | | Net sales/Cost of goods sold | | | (74 | ) |
Total | | $ | (36,041 | ) | | | | $ | (13,279 | ) |
| | | | | | | | |
For the six months ended November 30, 2021: | |
Commodity contracts | | $ | 14,218 | | | Cost of goods sold | | $ | 83,165 | |
Interest rate contracts | | | - | | | Interest expense | | | (13 | ) |
Foreign currency exchange contracts | | | 61 | | | Miscellaneous income, net | | | 3 | |
Total | | $ | 14,279 | | | | | $ | 83,155 | |
The estimated net amount of the losses recognized in AOCI at November 30, 2022 expected to be reclassified into net earnings within the succeeding twelve months is $18,807,000 (net of tax of $5,918,000). This amount was computed using the fair value of the cash flow hedges at November 30, 2022, and will change before actual reclassification from OCI to net earnings during the fiscal years ending May 31, 2023 and May 31, 2024.
Economic (Non-designated) Hedges
We enter into foreign currency exchange contracts to manage our foreign currency exchange rate exposure related to inter-company and financing transactions that do not meet the requirements for hedge accounting treatment. We also enter into certain commodity contracts that do not qualify for hedge accounting treatment. Accordingly, these derivative financial instruments are adjusted to current market value at the end of each period through gain (loss) recognized in earnings.
The following table summarizes our economic (non-designated) derivative financial instruments outstanding at November 30, 2022:
| | | | | | |
| | Notional | | | |
(in thousands) | | Amount | | | Maturity Date(s) |
Commodity contracts | | $ | 5,100 | | | December 2022 - December 2023 |
Foreign currency exchange contracts | | $ | 15,096 | | | December 2022 |
19
Table of Contents
The following table summarizes the gain (loss) recognized in earnings for economic (non-designated) derivative financial instruments for the periods presented:
| | | | | | | | | | |
| | | | Gain (Loss) Recognized | |
| | | | In Earnings for the | |
| | Location of Gain (Loss) | | Three Months Ended November 30, | |
(in thousands) | | Recognized in Earnings | | 2022 | | | 2021 | |
Commodity contracts | | Cost of goods sold | | $ | 3,861 | | | $ | (10,135 | ) |
Foreign currency exchange contracts | | Miscellaneous income, net | | | (47 | ) | | | (588 | ) |
Total | | | | $ | 3,814 | | | $ | (10,723 | ) |
| | | | | | | | | | |
| | | | Gain (Loss) Recognized | |
| | | | in Earnings for the | |
| | Location of Gain (Loss) | | Six Months Ended November 30, | |
(in thousands) | | Recognized in Earnings | | 2022 | | | 2021 | |
| | | | | | | | |
Commodity contracts | | Cost of goods sold | | $ | 2,284 | | | $ | (19,392 | ) |
Foreign currency exchange contracts | | Miscellaneous income, net | | | (141 | ) | | | (249 | ) |
Total | | | | $ | 2,143 | | | $ | (19,641 | ) |
Note R – Fair Value
Fair value is defined as the price that would be received to sell an asset or paid to transfer a liability in an orderly transaction between market participants at the measurement date. Fair value is an exit price concept that assumes an orderly transaction between willing market participants and is required to be based on assumptions that market participants would use in pricing an asset or a liability. Current accounting guidance establishes a three-tier fair value hierarchy as a basis for considering such assumptions and for classifying the inputs used in the valuation methodologies. This hierarchy requires entities to maximize the use of observable inputs and minimize the use of unobservable inputs. The three levels of inputs used to measure fair values are as follows:
Level 1 – Observable prices in active markets for identical assets and liabilities.
Level 2 – Inputs other than quoted prices included within Level 1 that are observable for the assets and liabilities, either directly or indirectly.
Level 3 – Unobservable inputs that are supported by little or no market activity and that are significant to the fair value of the assets and liabilities.
Recurring Fair Value Measurements
At November 30, 2022, our assets and liabilities measured at fair value on a recurring basis were as follows:
| | | | | | | | | | | | | | | | |
| | | | | Significant | | | | | | | |
| | Quoted Prices | | | Other | | | Significant | | | | |
| | in Active | | | Observable | | | Unobservable | | | | |
| | Markets | | | Inputs | | | Inputs | | | | |
(in thousands) | | (Level 1) | | | (Level 2) | | | (Level 3) | | | Totals | |
Assets | | | | | | | | | | | | |
Derivative financial instruments (1) | | $ | - | | | $ | 5,038 | | | $ | - | | | $ | 5,038 | |
Total assets | | $ | - | | | $ | 5,038 | | | $ | - | | | $ | 5,038 | |
| | | | | | | | | | | | |
Liabilities | | | | | | | | | | | | |
Derivative financial instruments (1) | | $ | - | | | $ | 20,295 | | | $ | - | | | $ | 20,295 | |
Total liabilities | | $ | - | | | $ | 20,295 | | | $ | - | | | $ | 20,295 | |
(1)The fair value of our derivative financial instruments is based on the present value of the expected future cash flows considering the risks involved, including non-performance risk, and using discount rates appropriate for the respective maturities. Market observable, Level 2 inputs are used to determine the present value of the expected future cash flows. Refer to “Note Q – Derivative Financial Instruments and Hedging Activities” for additional information regarding our use of derivative financial instruments.
20
Table of Contents
At May 31, 2022, our assets and liabilities measured at fair value on a recurring basis were as follows:
| | | | | | | | | | | | | | | | |
| | | | | Significant | | | | | | | |
| | Quoted Prices | | | Other | | | Significant | | | | |
| | in Active | | | Observable | | | Unobservable | | | | |
| | Markets | | | Inputs | | | Inputs | | | | |
(in thousands) | | (Level 1) | | | (Level 2) | | | (Level 3) | | | Totals | |
Assets | | | | | | | | | | | | |
Derivative financial instruments (1) | | $ | - | | | $ | 12,643 | | | $ | - | | | $ | 12,643 | |
Total assets | | $ | - | | | $ | 12,643 | | | $ | - | | | $ | 12,643 | |
| | | | | | | | | | | | |
Liabilities | | | | | | | | | | | | |
Derivative financial instruments (1) | | $ | - | | | $ | 9,003 | | | $ | - | | | $ | 9,003 | |
Total liabilities | | $ | - | | | $ | 9,003 | | | $ | - | | | $ | 9,003 | |
(1)The fair value of our derivative financial instruments is based on the present value of the expected future cash flows considering the risks involved, including non-performance risk, and using discount rates appropriate for the respective maturities. Market observable, Level 2 inputs are used to determine the present value of the expected future cash flows. Refer to “Note Q – Derivative Financial Instruments and Hedging Activities” for additional information regarding our use of derivative financial instruments.
Non-Recurring Fair Value Measurements
At November 30, 2022, there were no assets measured at fair value on a non-recurring basis on the Company’s consolidated balance sheet.
At May 31, 2022, our assets measured at fair value on a non-recurring basis were as follows:
| | | | | | | | | | | | | | | | |
| | | | | Significant | | | | | | | |
| | Quoted Prices | | | Other | | | Significant | | | | |
| | in Active | | | Observable | | | Unobservable | | | | |
| | Markets | | | Inputs | | | Inputs | | | | |
(in thousands) | | (Level 1) | | | (Level 2) | | | (Level 3) | | | Totals | |
Assets | | | | | | | | | | | | |
Long-lived assets held for sale (1) | | $ | - | | | $ | 700 | | | $ | - | | | $ | 700 | |
Total assets | | $ | - | | | $ | 700 | | | $ | - | | | $ | 700 | |
(1)Comprised of production equipment at our Twinsburg, Ohio facility with an estimated fair market value of $700,000.
The fair value of non-derivative financial instruments included in the carrying amounts of cash and cash equivalents, receivables, income taxes receivable, other assets, accounts payable, accrued compensation, contributions to employee benefit plans and related taxes, other accrued items, income taxes payable and other liabilities approximate carrying value due to their short-term nature. The fair value of long-term debt, including current maturities, based upon models utilizing market observable (Level 2) inputs and credit risk, was $646,856,000 and $684,830,000 at November 30, 2022 and May 31, 2022, respectively. The carrying amount of long-term debt, including current maturities, was $693,710,000 and $696,610,000 at November 30, 2022 and May 31, 2022, respectively.
21
Table of Contents
Item 2. – Management’s Discussion and Analysis of Financial Condition and Results of Operations
Selected statements contained in this “Item 2. – Management’s Discussion and Analysis of Financial Condition and Results of Operations” constitute “forward-looking statements” as that term is used in the Private Securities Litigation Reform Act of 1995. Such forward-looking statements are based, in whole or in part, on management’s beliefs, estimates, assumptions and currently available information. For a more detailed discussion of what constitutes a forward-looking statement and of some of the factors that could cause actual results to differ materially from such forward-looking statements, please refer to the “Safe Harbor Statement” in the beginning of this Form 10-Q and “Part I – Item 1A. – Risk Factors” of the 2022 Form 10-K.
Unless otherwise indicated, all Note references contained in this Part I – Item 2. refer to the Condensed Notes to Consolidated Financial Statements included in “Part I – Item 1. – Financial Statements” of this Form 10-Q.
Introduction
The following discussion and analysis of market and industry trends, business developments, and the results of operations and financial position of Worthington Industries, Inc., together with its subsidiaries (collectively, “we,” “our,” “us”, “Worthington,” or the “Company”), should be read in conjunction with our consolidated financial statements and notes thereto included in “Part I – Item 1. – Financial Statements” of this Form 10-Q. The 2022 Form 10-K includes additional information about Worthington, our operations and our consolidated financial position and should be read in conjunction with this Form 10-Q.
Our operations are managed principally on a products and services basis. Segment information is prepared on the same basis that our management reviews financial information for operational decision-making purposes. Factors used to identify reportable operating segments include the nature of the products and services provided by each business, the management reporting structure, the similarity of economic characteristics and certain quantitative measures, as prescribed by authoritative accounting guidance.
As of November 30, 2022, we held equity positions in seven operating joint ventures. Three of these joint ventures are consolidated within the Steel Processing operating segment with the equity owned by the other joint venture member(s) shown as noncontrolling interests in our consolidated balance sheets, and their portions of net earnings and other comprehensive income shown as net earnings or comprehensive income attributable to noncontrolling interests in our consolidated statements of earnings and consolidated statements of comprehensive income, respectively. The remaining four of our joint ventures are accounted for using the equity method.
Recent Business Developments
•On June 2, 2022, the Company acquired Level5® Tools, LLC (“Level5”), a leading provider of drywall tools and related accessories. The net cash purchase price was approximately $56.1 million, with a potential earnout of up to $25.0 million based on performance through 2024.
•On August 3, 2022, the Company sold its 50% noncontrolling equity interest in ArtiFlex Manufacturing, LLC (“ArtiFlex”) to the unaffiliated joint venture member for approximately $42.1 million after adjustments for closing debt and final net working capital. Approximately $6.0 million of the total cash proceeds were attributed to real property in Wooster, Ohio, with a net book value of $6.3 million. This real property was owned by Worthington and leased to ArtiFlex prior to closing of the transaction. The Company recognized a pre-tax loss of approximately $15.8 million in equity income related to the sale of its 50% noncontrolling equity interest portion of the transaction.
•On September 29, 2022, the Company announced that the Worthington Industries, Inc. Board of Directors approved a plan to pursue a separation of the Company’s Steel Processing business which it expects to complete by early 2024. In the months ahead, this plan will be referred to as “Worthington 2024.” Worthington 2024 will result in two independent, publicly-traded companies that are more specialized and fit-for-purpose, with enhanced prospects for growth and value creation. Worthington plans to effect the Separation via a distribution of stock of the Steel Processing business, which is expected to be tax-free to shareholders for U.S. federal income tax purposes. Refer to “Note A – Basis of Presentation” for additional information.
•On October 31, 2022, the Company’s consolidated joint venture, WSP, sold its remaining manufacturing facility, located in Jackson, Michigan, for net proceeds of approximately $21.3 million, resulting in a pre-tax gain of $3.9 million within restructuring and other income, net. Refer to “Note F – Restructuring and Other Income, Net” for additional information.
•On December 20, 2022, Worthington Industries, Inc’s Board of Directors declared a quarterly dividend of $0.31 per share payable on March 29, 2023, to shareholders of record on March 15, 2023.
•On January 5, 2023 the Company announced the implementation of a Board of Directors transition plan, pursuant to which John H. McConnell II was appointed as a member of the Board of Directors, effective on January 4, 2023, and John P. McConnell intends to steps down in June 2023.
22
Table of Contents
Market & Industry Overview
We sell our products and services to a diverse customer base and a broad range of end markets. The breakdown of net sales by end market for the second quarter of each of fiscal 2023 and fiscal 2022 is illustrated in the following chart:
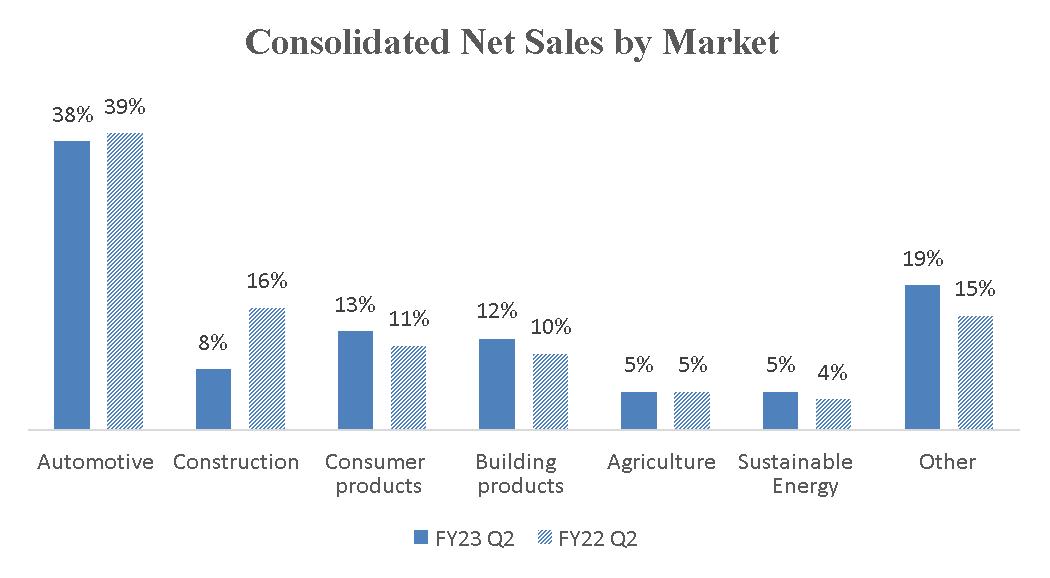
The automotive industry is one of the largest consumers of flat-rolled steel, and thus the largest end market for our Steel Processing operating segment. Approximately 54% of Steel Processing’s net sales are to the automotive market. North American vehicle production, primarily by Ford, General Motors and Stellantis North America (the “Detroit Three automakers”), has a considerable impact on the activity within this operating segment. The majority of the net sales of one of our unconsolidated joint ventures, Serviacero Worthington, is also to the automotive market.
Approximately 11% of the net sales of our Steel Processing operating segment are to the construction market. The construction market is also the predominant end market for our unconsolidated joint ventures within the Building Products operating segment, WAVE and ClarkDietrich. While the market price of steel significantly impacts these businesses, there are other key indicators that are meaningful in analyzing construction market demand, including U.S. gross domestic product (“GDP”), the Dodge Index of construction contracts and, in the case of ClarkDietrich, trends in the relative prices of framing lumber and steel.
Substantially all of the net sales of our Consumer Products, Building Products, and Sustainable Energy Solutions operating segments and approximately 35% of the net sales of our Steel Processing operating segment are to other markets such as agricultural, appliance, consumer products, heavy-truck, industrial products, lawn and garden. Given the many different products that make up these net sales and the wide variety of end markets, it is very difficult to detail the key market indicators that drive these portions of our business. However, we believe that the trend in U.S. GDP growth is a good economic indicator for analyzing the demand of these end markets.
We use the following information to monitor our costs and demand in our major end markets:
| | | | | | | | | | | | | | | | | | | | | | | | |
| | Three Months Ended | | | Six Months Ended | |
| | November 30, | | | November 30, | |
| | 2022 | | | 2021 | | | Inc / (Dec) | | | 2022 | | | 2021 | | | Inc / (Dec) | |
U.S. GDP (% growth year-over-year) (1) | | | 1.8 | % | | | 5.0 | % | | | (3.2 | %) | | | 2.1 | % | | | 4.9 | % | | | (2.8 | %) |
Hot-Rolled Steel ($ per ton) (2) | | $ | 742 | | | $ | 1,888 | | | $ | (1,146 | ) | | $ | 860 | | | $ | 1,825 | | | $ | (965 | ) |
Detroit Three Auto Build (000's vehicles) (3) | | | 1,711 | | | | 1,481 | | | | 230 | | | | 3,472 | | | | 2,856 | | | | 616 | |
No. America Auto Build (000's vehicles) (3) | | | 3,713 | | | | 3,170 | | | | 544 | | | | 7,341 | | | | 6,413 | | | | 928 | |
Zinc ($ per pound) (4) | | $ | 1.36 | | | $ | 1.46 | | | $ | (0.10 | ) | | $ | 1.46 | | | $ | 1.41 | | | $ | 0.05 | |
Natural Gas ($ per mcf) (5) | | $ | 6.77 | | | $ | 5.26 | | | $ | 1.51 | | | $ | 7.32 | | | $ | 4.47 | | | $ | 2.85 | |
On-Highway Diesel Fuel Prices ($ per gallon) (6) | | $ | 4.26 | | | $ | 3.57 | | | $ | 0.69 | | | $ | 4.84 | | | $ | 3.45 | | | $ | 1.39 | |
(1)2021 figures based on revised actuals; (2)CRU Hot-Rolled Index, period average; (3)IHS Global; (4)LME Zinc, period average; (5)NYMEX Henry Hub Natural Gas, period average; (6)Energy Information Administration, period average
23
Table of Contents
U.S. GDP growth rate trends are generally indicative of the strength in demand and, in many cases, pricing for our products. A year-over-year increase in U.S. GDP growth rates is indicative of a stronger economy, which generally increases demand and pricing for our products. Conversely, declining U.S. GDP growth rates generally indicate a weaker economy. Changes in U.S. GDP growth rates can also signal changes in conversion costs related to production and in selling, general and administrative (“SG&A”) expenses.
The market price of hot-rolled steel is one of the most significant factors impacting our selling prices and operating results. When steel prices fall, we typically have higher-priced material flowing through cost of goods sold, while selling prices compress to what the market will bear, negatively impacting our results. On the other hand, in a rising price environment, our results are generally favorably impacted, as lower-priced material purchased in previous periods flows through cost of goods sold, while our selling prices increase at a faster pace to cover current replacement costs. Based on current price levels, we expect to have meaningful inventory holding losses in the third quarter of fiscal 2023.
The following table presents the average quarterly market price per ton of hot-rolled steel during fiscal 2023 (first and second quarters), fiscal 2022 and fiscal 2021:
| | | | | | | | | | | | |
| | Fiscal Year | |
(Dollars per ton)(1) | | 2023 | | | 2022 | | | 2021 | |
1st Quarter | | $ | 978 | | | $ | 1,762 | | | $ | 475 | |
2nd Quarter | | $ | 742 | | | $ | 1,888 | | | $ | 625 | |
3rd Quarter | | N/A | | | $ | 1,421 | | | $ | 1,016 | |
4th Quarter | | N/A | | | $ | 1,280 | | | $ | 1,358 | |
Annual Avg. | | $ | 860 | | | $ | 1,588 | | | $ | 869 | |
(1)CRU Hot-Rolled Index, period average
Sales to one Steel Processing customer in the automotive industry represented 12.3% and 15.6% of consolidated net sales during the second quarter of fiscal 2023 and fiscal 2022, respectively. While our automotive business is largely driven by the production schedules of the Detroit Three automakers, our customer base is much broader and includes other domestic manufacturers and many of their suppliers. During the second quarter of fiscal 2023, vehicle production for the Detroit Three automakers and the North American vehicle production were up 16% and 17%, respectively, over the prior year quarter.
Certain other commodities, such as zinc, natural gas and diesel fuel, represent a significant portion of our cost of goods sold, both directly through our plant operations and indirectly through transportation and freight expense.
Results of Operations
Second Quarter – Fiscal 2023 Compared to Fiscal 2022
The following discussion provides a review of results for the three months ended November 30, 2022 and 2021.
| | | | | | | | | | | |
| Three Months Ended | |
| November 30, | |
(In millions, except per share amounts) | 2022 | | | 2021 | | | Increase/
(Decrease) | |
Net sales | $ | 1,175.5 | | | $ | 1,232.9 | | | $ | (57.4 | ) |
Operating income (loss) | | (7.0 | ) | | | 90.5 | | | | (97.5 | ) |
Equity income | | 36.9 | | | | 60.2 | | | | (23.3 | ) |
Net earnings attributable to controlling interest | | 16.2 | | | | 110.3 | | | | (94.1 | ) |
Earnings per diluted share attributable to controlling interest | $ | 0.33 | | | $ | 2.15 | | | $ | (1.82 | ) |
24
Table of Contents
Net Sales and Volume
The following table provides a breakdown of our consolidated net sales by reportable operating segment, along with the respective percentage of the total consolidated net sales of each, for the periods indicated.
| | | | | | | | | | | | | | | | | | | | |
| Three Months Ended | | |
| November 30, | | |
| | | | % of | | | | | | % of | | | Increase/ | | |
(In millions) | 2022 | | | Net sales | | | 2021 | | | Net sales | | | (Decrease) | | |
Steel Processing | $ | 841.9 | | | | 71.6 | % | | $ | 937.8 | | | | 76.1 | % | | $ | (95.9 | ) | |
Consumer Products | | 153.8 | | | | 13.1 | % | | | 140.8 | | | | 11.4 | % | | | 13.0 | | |
Building Products | | 141.7 | | | | 12.1 | % | | | 121.1 | | | | 9.8 | % | | | 20.6 | | |
Sustainable Energy Solutions | | 38.1 | | | | 3.2 | % | | | 33.1 | | | | 2.7 | % | | | 5.0 | | |
Other | | - | | | | 0.0 | % | | | - | | | | 0.0 | % | | | - | | |
Consolidated Net Sales | $ | 1,175.5 | | | | 100.0 | % | | $ | 1,232.8 | | | | 100.0 | % | | $ | (57.3 | ) | |
The following table provides volume by reportable operating segment for the periods presented.
| | | | | | | | | | | |
| Three Months Ended | |
| November 30, | |
| | | | | | | Increase/ | |
| 2022 | | | 2021 | | | (Decrease) | |
Steel Processing (Tons) | | 925,434 | | | | 1,067,589 | | | | (142,155 | ) |
Consumer Products (Units) | | 16,583,326 | | | | 18,698,589 | | | | (2,115,263 | ) |
Building Products (Units) | | 2,367,770 | | | | 2,565,025 | | | | (197,255 | ) |
Sustainable Energy Solutions (Units) | | 155,687 | | | | 155,001 | | | | 686 | |
•Steel Processing – Net sales decreased $95.9 million from the prior year quarter. The decrease was driven primarily by lower average selling prices, and to a lesser extent, lower tolling volume, partially offset by contributions from the acquisition of Tempel on December 1, 2021. The mix of direct versus toll tons processed was 54% to 46% in the current quarter, compared to 47% to 53% in the prior year quarter. The shift in mix towards direct tons was driven primarily by lower tolling volume with the steel mills and the exit of our consolidated joint venture, WSP.
•Consumer Products – Net sales increased 9.2%, or $13.0 million, over the prior year quarter as higher average selling prices more than offset the impact of lower overall volumes, which were down 13%, excluding contributions from the Level 5 acquisition. End consumer demand began to slow during the quarter, which when combined with reduced inventory levels at certain retail customers, led to lower overall customer orders.
•Building Products – Net sales increased 17.0%, or $20.6 million over the prior year quarter. The increase was driven primarily by higher average selling prices, partially offset by lower volumes. Units shipped were down 8% as customers reduced orders due to higher than optimal inventory levels.
•Sustainable Energy Solutions – Net sales increased $5.0 million, or 15.1%, from the prior year quarter due to the combined impact of increased volume and higher average selling prices.
Gross Margin
| | | | | | | | | | | | | | | | | | | |
| Three Months Ended | |
| November 30, | |
| | | | % of | | | | | | % of | | | Increase/ | |
(In millions) | 2022 | | | Net sales | | | 2021 | | | Net sales | | | (Decrease) | |
Gross Margin | $ | 105.8 | | | | 9.0 | % | | $ | 184.6 | | | | 15.0 | % | | $ | (78.8 | ) |
25
Table of Contents
•Gross margin decreased $78.8 million from the prior year quarter to $105.8 million due primarily to lower contributions from Steel Processing, down $79.7 million, as declining steel prices resulted in an estimated $95.2 million unfavorable swing related to estimated inventory holding losses in the current quarter compared to estimated inventory holding gains in the prior year quarter.
Selling, General and Administrative Expense
| | | | | | | | | | | | | | | | | | | |
| Three Months Ended | |
| November 30, | |
| | | | % of | | | | | | % of | | | Increase/ | |
(In millions) | 2022 | | | Net sales | | | 2021 | | | Net sales | | | (Decrease) | |
Selling, general and administrative expense | $ | 107.8 | | | | 9.2 | % | | $ | 96.1 | | | | 7.8 | % | | $ | 11.7 | |
•SG&A expense increased $11.7 million over the prior year quarter due primarily to the impact of acquisitions, partially offset by lower profit sharing and bonus accruals.
Other Operating Costs/Income
| | | | | | | | | | | |
| Three Months Ended | |
| November 30, | |
| | | | | | | Increase/ | |
(In millions) | 2022 | | | 2021 | | | (Decrease) | |
Restructuring and other income, net | $ | 4.3 | | | $ | 2.0 | | | $ | 2.3 | |
Separation costs | | 9.2 | | | | - | | | | 9.2 | |
•Restructuring and other income, net in both periods was driven by gains realized from the sale of long-lived assets, including a $3.9 million pre-tax gain in the current year quarter related to the sale of our WSP joint venture’s facility in Jackson, Michigan and a $1.8 million pre-tax gain in the prior year quarter related to our exit from the former Cabs facility located in Stow, Ohio. Refer to “Note F – Restructuring and Other Income, Net” for additional information.
•Separation costs of $9.2 million reflect direct and incremental costs incurred in connection with the planned Separation of the Company’s Steel Processing business, including audit, advisory, and legal costs. Refer to “Note A - Basis of Presentation” for additional information.
Equity Income
| | | | | | | | | | | |
| Three Months Ended | |
| November 30, | |
| | | | | | | Increase/ | |
(In millions) | 2022 | | | 2021 | | | (Decrease) | |
WAVE | $ | 19.0 | | | $ | 22.4 | | | $ | (3.4 | ) |
ClarkDietrich | | 16.1 | | | | 27.5 | | | | (11.4 | ) |
Serviacero Worthington | | 1.9 | | | | 8.8 | | | | (6.9 | ) |
ArtiFlex (1) | | - | | | | 1.8 | | | | (1.8 | ) |
Workhorse | | (0.2 | ) | | | (0.3 | ) | | | 0.1 | |
Total Equity Income | $ | 36.8 | | | $ | 60.2 | | | $ | (23.4 | ) |
(1)On August 3, 2022, the Company sold its 50% equity interest in ArtiFlex.
•Equity income from unconsolidated joint ventures decreased $23.4 million from the prior year quarter to $36.8 million, driven primarily by lower contributions from ClarkDietrich and Serviacero Worthington.
26
Table of Contents
Other income
| | | | | | | | | | | |
| Three Months Ended | |
| November 30, | |
| | | | | | | Increase/ | |
(In millions) | 2022 | | | 2021 | | | (Decrease) | |
Miscellaneous income, net | $ | 1.4 | | | $ | 1.0 | | | $ | 0.4 | |
Adjusted EBIT
We evaluate operating segment performance based on adjusted earnings (loss) before interest and taxes (“adjusted EBIT”). EBIT is calculated by adding interest expense and income tax expense to net earnings attributable to controlling interest. Adjusted EBIT excludes impairment and restructuring charges (gains), but may also exclude other items that management believes are not reflective of, and thus should not be included when evaluating, the performance of our ongoing operations, including direct and incremental costs incurred in connection with the planned Separation of the Company’s Steel Processing business. Adjusted EBIT is a non-GAAP measure and is used by management to evaluate segment performance, engage in financial and operational planning and determine incentive compensation because we believe that this measure provides additional perspective and, in some circumstances is more closely correlated to, the performance of our ongoing operations.
The following table provides a reconciliation of consolidated net earnings attributable to controlling interest to adjusted EBIT for the periods presented:
| | | | | | | |
| Three Months Ended | |
| November 30, | |
(In millions) | 2022 | | | 2021 | |
Net earnings attributable to controlling interest | $ | 16.2 | | | $ | 110.3 | |
Interest expense | | 7.6 | | | | 7.3 | |
Income tax expense | | 4.1 | | | | 31.2 | |
Earnings before interest and taxes | $ | 27.9 | | | $ | 148.8 | |
Incremental expense related to Level5 earnout | | 0.5 | | | | - | |
Restructuring and other income, net (1) | | (2.3 | ) | | | (1.9 | ) |
Separation costs | | 9.2 | | | | - | |
Adjusted earnings before interest and taxes | $ | 35.3 | | | $ | 146.9 | |
(1)Excludes the impact of the noncontrolling interests.
The following table provides a summary of adjusted EBIT by segment for the periods presented.
| | | | | | | | | | | |
| Three Months Ended | |
| November 30, | |
| | | | | | | Increase/ | |
(In millions) | 2022 | | | 2021 | | | (Decrease) | |
Steel Processing | $ | (17.2 | ) | | $ | 71.9 | | | $ | (89.1 | ) |
Consumer Products | | 13.5 | | | | 17.6 | | | | (4.1 | ) |
Building Products | | 41.2 | | | | 54.7 | | | | (13.5 | ) |
Sustainable Energy Solutions | | 1.1 | | | | 0.8 | | | | 0.3 | |
Other | | (3.3 | ) | | | 1.9 | | | | (5.2 | ) |
Total Adjusted EBIT | $ | 35.3 | | | $ | 146.9 | | | $ | (111.6 | ) |
•Steel Processing – Adjusted EBIT was down $89.1 million from the prior year quarter to a loss of $17.2 million on lower contributions of both operating income and equity income. Excluding restructuring, operating income was down $84.5 million from the prior year quarter driven primarily by an estimated $95.2 million unfavorable swing related to estimated inventory holding losses of $53.1 million in the current quarter compared to estimated inventory holding gains of $42.1 in the prior year quarter. Adjusted EBIT was also negatively impacted by lower equity income from Serviacero Worthington, down $6.9 million from the prior year quarter, as lower steel prices reduced spreads.
27
Table of Contents
•Consumer Products – Adjusted EBIT was down $4.1 million in the current quarter to $13.5 million, as the favorable impact of higher average selling prices was more than offset by lower volumes and higher input and production costs including $0.7 million of incremental material cost related to the remaining Level5 inventory that was written-up to fair value at acquisition.
•Building Products – Adjusted EBIT decreased $13.5 million from the prior year quarter to $41.2 million, on lower contributions of equity income, down $14.8 million from the strong results in the prior year quarter, partially offset by a $1.4 million increase in operating income driven by higher average selling prices and a favorable product mix.
•Sustainable Energy Solutions – Adjusted EBIT increased $0.3 million over the prior year quarter to $1.1 million on the favorable impact of higher average selling prices, partially offset by higher production costs and an unfavorable product mix.
Interest Expense
| | | | | | | | | | | |
| Three Months Ended | |
| November 30, | |
| | | | | | | Increase/ | |
(In millions) | 2022 | | | 2021 | | | (Decrease) | |
Interest Expense | $ | 7.6 | | | $ | 7.3 | | | $ | 0.3 | |
•Interest expense was $7.6 million in the current quarter, up $0.3 million over the prior year quarter due to the impact of higher average debt levels associated with short-term borrowings.
Income Taxes
| | | | | | | | | | | | | | | | | | | |
| Three Months Ended | |
| November 30, | |
(In millions) | 2022 | | | Effective Tax Rate | | | 2021 | | | Effective Tax Rate | | | Increase/
(Decrease) | |
Income tax expense | $ | 4.1 | | | | 23.7 | % | | $ | 31.2 | | | | 22.8 | % | | $ | (27.1 | ) |
•Income tax expense was $4.1 million in the current quarter compared to income tax expense of $31.2 million in the prior year quarter. The decrease was driven by lower pre-tax earnings. Tax expense in the current quarter reflected an estimated annual effective rate of 23.7% compared to 22.8% for the prior year quarter. For additional information regarding our income taxes, refer to “Note M – Income Taxes”.
Six Months Year-to-Date – Fiscal 2023 compared to Fiscal 2022
The following discussion provides a review of results for the six months ended November 30, 2022 and 2021.
| | | | | | | | | | | |
| Six Months Ended | |
| November 30, | |
(In millions, except per share amounts) | 2022 | | | 2021 | | | Increase/
(Decrease) | |
Net sales | $ | 2,584.2 | | | $ | 2,343.7 | | | $ | 240.5 | |
Operating income | | 59.7 | | | | 226.3 | | | | (166.6 | ) |
Equity income | | 68.6 | | | | 113.1 | | | | (44.5 | ) |
Net earnings attributable to controlling interest | | 80.3 | | | | 242.8 | | | | (162.5 | ) |
Earnings per diluted share attributable to controlling interest | $ | 1.63 | | | $ | 4.71 | | | | (3.08 | ) |
28
Table of Contents
Net Sales and Volume
The following table provides a breakdown of our consolidated net sales by reportable operating segment, along with the respective percentage of the total consolidated net sales represented by each, for the periods indicated.
| | | | | | | | | | | | | | | | | | | |
| Six Months Ended | |
| November 30, | |
| | | | % of | | | | | | % of | | | Increase/ | |
(In millions) | 2022 | | | Net sales | | | 2021 | | | Net sales | | | (Decrease) | |
Steel Processing | $ | 1,880.8 | | | | 72.8 | % | | $ | 1,760.7 | | | | 75.1 | % | | $ | 120.1 | |
Consumer Products | | 342.5 | | | | 13.3 | % | | | 288.6 | | | | 12.3 | % | | | 53.9 | |
Building Products | | 292.0 | | | | 11.3 | % | | | 235.9 | | | | 10.1 | % | | | 56.1 | |
Sustainable Energy Solutions | | 68.9 | | | | 2.7 | % | | | 58.6 | | | | 2.5 | % | | | 10.3 | |
Other | | - | | | | 0.0 | % | | | - | | | | 0.0 | % | | | - | |
Consolidated Net Sales | $ | 2,584.2 | | | | 100.0 | % | | $ | 2,343.8 | | | | 100.0 | % | | $ | 240.4 | |
The following table provides volume by reportable operating segment for the periods presented.
| | | | | | | | | | | |
| Six Months Ended | |
| November 30, | |
| | | | | | | Increase/ | |
| 2022 | | | 2021 | | | (Decrease) | |
Steel Processing (Tons) | | 1,900,083 | | | | 2,129,877 | | | | (229,794 | ) |
Consumer Products (Units) | | 38,966,668 | | | | 40,086,729 | | | | (1,120,061 | ) |
Building Products (Units) | | 5,289,933 | | | | 5,450,736 | | | | (160,803 | ) |
Sustainable Energy Solutions (Units) | | 288,820 | | | | 285,677 | | | | 3,143 | |
•Steel Processing – Net sales increased $120.1 million over the prior year period. The increase was driven primarily by contributions from Tempel, which was acquired on December 1, 2021, partially offset by lower average selling prices and lower tolling volumes. The mix of direct versus toll tons processed was 56% to 44% in the current year period, compared to 48% to 52% in the prior year period. The shift in mix towards direct tons was driven primarily by lower tolling volume with the steel mills and the exit of our consolidated toll processing joint venture, WSP.
•Consumer Products – Net sales increased 18.7%, or $53.9 million, over the prior year period. The increase was driven by higher average selling prices, and, to a lesser extent, contributions from the June 2, 2022 acquisition of Level5. Excluding Level5 units shipped in the current period, overall volumes were down 5% as retail customers reduced inventory levels resulting in lower customer orders.
•Building Products – Net sales increased 23.8%, or $56.1 million, over the prior year period. The increase was driven primarily by higher average selling prices, partially offset by lower volumes.
•Sustainable Energy Solutions – Net sales increased $10.3 million, or 17.6%, over the prior year period due to the combined impact of increased volume and higher average selling prices.
Gross Margin
| | | | | | | | | | | | | | | | | | | |
| Six Months Ended | |
| November 30, | |
| | | | % of | | | | | | % of | | | Increase/ | |
(In millions) | 2022 | | | Net sales | | | 2021 | | | Net sales | | | (Decrease) | |
Gross Margin | $ | 275.1 | | | | 10.6 | % | | $ | 404.0 | | | | 17.2 | % | | $ | (128.9 | ) |
29
Table of Contents
•Gross margin decreased $128.9 million from the prior year period to $275.1 million, due primarily to lower contributions from Steel Processing, down $137.8 million, as declining steel prices resulted in an estimated $143.7 million unfavorable swing from prior year estimated inventory holding gains to current year estimated holding losses.
Selling, General and Administrative Expense
| | | | | | | | | | | | | | | | | | | |
| Six Months Ended | |
| November 30, | |
| | | | % of | | | | | | % of | | | Increase/ | |
(In millions) | 2022 | | | Net sales | | | 2021 | | | Net sales | | | (Decrease) | |
Selling, general and administrative expense | $ | 211.3 | | | | 8.2 | % | | $ | 192.0 | | | | 8.2 | % | | $ | 19.3 | |
•SG&A expense increased $19.3 million over the prior year period due primarily to the impact of acquisitions, partially offset by lower profit sharing and bonus expense.
Other Operating Costs/Income
| | | | | | | | | | | |
| Six Months Ended | |
| November 30, | |
| | | | | | | Increase/ | |
(In millions) | 2022 | | | 2021 | | | (Decrease) | |
Impairment of long-lived assets | $ | 0.3 | | | $ | - | | | $ | 0.3 | |
Restructuring and other income, net | | 3.9 | | | | 14.3 | | | | (10.4 | ) |
Separation costs | | 9.2 | | | | - | | | | (9.2 | ) |
•Impairment of long-lived assets in the current year period was driven by our commitment to a plan to sell certain fixed assets at our Samuel joint venture’s facility in Cleveland, Ohio that were written down to fair value less cost to sell.
•Restructuring and other income, net in the current year period was driven by gains realized from the sale of long-lived assets, including a $3.9 million gain realized from the sale of WSP’s manufacturing facility in Jackson, Michigan. Refer to “Note F – Restructuring and Other Income, Net” for additional information.
•Separation costs of $9.2 million reflect direct and incremental costs incurred in connection with the planned Separation of the Company’s Steel Processing business, including audit, advisory, and legal costs. Refer to “Note A - Basis of Presentation” for additional information.
Equity Income
| | | | | | | | | | | |
| Six Months Ended | |
| November 30, | |
| | | | | | | Increase/ | |
(In millions) | 2022 | | | 2021 | | | (Decrease) | |
WAVE | $ | 42.8 | | | $ | 48.1 | | | $ | (5.3 | ) |
ClarkDietrich | | 36.2 | | | | 44.8 | | | | (8.6 | ) |
Serviacero Worthington | | 3.7 | | | | 18.1 | | | | (14.4 | ) |
ArtiFlex | | (13.4 | ) | | | 3.0 | | | | (16.4 | ) |
Workhorse | | (0.7 | ) | | | (0.9 | ) | | | 0.2 | |
Total Equity Income | $ | 68.6 | | | $ | 113.1 | | | $ | (44.5 | ) |
•Equity income decreased $44.5 million from the prior year period to $68.6 million. The decrease was driven by a $15.8 million pre-tax loss related to the sale of our noncontrolling equity interest in ArtiFlex and lower contributions from WAVE, ClarkDietrich, and Serviacero Worthington.
30
Table of Contents
Other income (expense)
| | | | | | | | | | | |
| Six Months Ended | |
| November 30, | |
| | | | | | | Increase/ | |
(In millions) | 2022 | | | 2021 | | | (Decrease) | |
Miscellaneous income (expense), net | $ | (3.7 | ) | | $ | 1.7 | | | $ | (5.4 | ) |
•Miscellaneous expense in the current year period was driven primarily by the annuitization of a portion of the total projected benefit obligation of the inactive Gerstenslager Company Bargaining Unit Employees’ Pension Plan, which resulted in a pre-tax, non-cash settlement charge of $4.8 million to accelerate a portion of deferred pension cost.
Adjusted EBIT
The following table provides a reconciliation of consolidated net earnings attributable to controlling interest to adjusted EBIT for the periods presented:
| | | | | | | |
| Six Months Ended | |
| November 30, | |
(In millions) | 2022 | | | 2021 | |
Net earnings attributable to controlling interest | $ | 80.3 | | | $ | 242.8 | |
Interest expense | | 16.2 | | | | 15.0 | |
Income tax expense | | 23.6 | | | | 71.4 | |
Earnings before interest and taxes | $ | 120.1 | | | $ | 329.2 | |
Incremental expense related to Level5 earnout | | 1.1 | | | $ | - | |
Impairment of long-lived assets (1) | | 0.2 | | | | - | |
Restructuring and other income, net (1) | | (3.6 | ) | | | (8.3 | ) |
Separation costs | | 9.2 | | | | - | |
Pension settlement charge | | 4.8 | | | | - | |
Loss on sale of investment in ArtiFlex | | 15.8 | | | | - | |
Adjusted earnings before interest and taxes (1) | $ | 147.6 | | | $ | 320.9 | |
(1)Excludes the impact of the noncontrolling interests.
The following table provides a summary of adjusted EBIT by segment for the periods presented.
| | | | | | | | | | | |
| Six Months Ended | |
| November 30, | |
| | | | | | | Increase/ | |
(In millions) | 2022 | | | 2021 | | | (Decrease) | |
Steel Processing | $ | 17.7 | | | $ | 179.6 | | | $ | (161.9 | ) |
Consumer Products | | 34.4 | | | | 38.1 | | | | (3.7 | ) |
Building Products | | 94.0 | | | | 103.5 | | | | (9.5 | ) |
Sustainable Energy Solutions | | (0.3 | ) | | | (1.8 | ) | | | 1.5 | |
Other | | 1.8 | | | | 1.5 | | | | 0.3 | |
Total Adjusted EBIT | $ | 147.6 | | | $ | 320.9 | | | | (173.3 | ) |
•Steel Processing – Adjusted EBIT was down $161.9 million from the prior year period to $17.7 million, on lower contributions of both operating income and equity income. Excluding restructuring, operating income was down $151.9 million from the prior year period driven primarily by an estimated $143.7 million unfavorable swing related to estimated inventory holding losses of $54.6 million in the current year period compared to estimated inventory holding gains of $89.1 million in the prior year period. Adjusted EBIT was also negatively impacted by lower equity income at Serviacero Worthington, down $14.4 million from the prior year period, as lower steel prices reduced spreads.
31
Table of Contents
•Consumer Products – Adjusted EBIT was down $3.7 million from the prior year period to $34.4 million as the favorable impact of higher average selling prices was more than offset by lower volumes and higher input and production costs, including $2.7 million of incremental material cost related to Level 5 inventory that was written-up to fair value at acquisition. Adjusted EBIT was also negatively impacted by higher SG&A expense, up $9.9 million, primarily on the impact of the Level5 acquisition.
•Building Products – Adjusted EBIT decreased $9.5 million from the prior year period to $94.0 million, on lower contributions of equity income, which were down $13.9 million, partially offset by a $4.3 million increase in operating income driven by higher average selling prices and a favorable product mix.
•Sustainable Energy Solutions – Adjusted EBIT was a loss of $0.3 million, favorable by $1.5 million compared to the prior year period, driven by increased volume and higher average selling prices, partially offset by higher production costs and an unfavorable product mix.
Interest Expense
| | | | | | | | | | | |
| Six Months Ended | |
| November 30, | |
| | | | | | | Increase/ | |
(In millions) | 2022 | | | 2021 | | | (Decrease) | |
Interest Expense | $ | 16.2 | | | $ | 15.0 | | | $ | 1.2 | |
•Interest expense was $16.2 million in the current year period, up $1.2 million over the prior year period due to the impact of higher average debt levels associated with short-term borrowings.
Income Taxes
| | | | | | | | | | | | | | | | | | | |
| Six Months Ended | |
| November 30, | |
(In millions) | 2022 | | | Effective Tax Rate | | | 2021 | | | Effective Tax Rate | | | Increase/
(Decrease) | |
Income tax expense | $ | 23.6 | | | | 23.7 | % | | $ | 71.4 | | | | 22.8 | % | | $ | (47.8 | ) |
•Income tax expense was down $47.8 million in the current year period to $23.6 million. The decrease was driven primarily by lower pre-tax earnings. Tax expense in the current year period reflected an estimated annual effective rate of 23.7% compared to 22.8% for the prior year period. For additional information regarding our income taxes, refer to “Note M – Income Taxes”.
Liquidity and Capital Resources
During the six months ended November 30, 2022, we generated $214.0 million of cash from operating activities, invested $46.0 million in property, plant and equipment, spent $56.1 million to acquire Level5, and generated net cash proceeds of $71.6 million from the sale of assets, including $36.1 million from the sale of our noncontrolling equity interest in ArtiFlex. Additionally, we repaid $43.1 million of short-term borrowings and paid dividends of $29.1 million on Worthington Industries, Inc.’s common shares. The following table summarizes our consolidated cash flows for the periods presented:
| | | | | | | |
| Six Months Ended | |
| November 30, | |
(in millions) | 2022 | | | 2021 | |
Net cash provided (used) by operating activities | $ | 214.0 | | | $ | (168.9 | ) |
Net cash used by investing activities | | (30.7 | ) | | | (124.1 | ) |
Net cash used by financing activities | | (88.2 | ) | | | (122.1 | ) |
Increase (decrease) in cash and cash equivalents | | 95.1 | | | | (415.1 | ) |
Cash and cash equivalents at beginning of period | | 34.5 | | | | 640.3 | |
Cash and cash equivalents at end of period | $ | 129.6 | | | $ | 225.2 | |
32
Table of Contents
We believe that the available borrowing capacity of our committed line of credit is sufficient to meet the needs of our existing businesses for normal operating costs, mandatory capital expenditures, debt redemptions, dividend payments, working capital, to the extent not funded by cash provided by operating activities, for at least 12 months and for the foreseeable future thereafter, and expenditures related to the Separation of our Steel Processing business.
Although we do not currently anticipate a need based on our current operating structure, we believe that we could access the financial markets to be in a position to sell long-term debt or equity securities. However, lingering supply chain disruptions and other challenges caused by the COVID-19 pandemic and softening economic conditions could create uncertainty and volatility in the financial markets, which may impact our ability to access capital and the terms under which we can do so. As the impact of such challenges on the economy and our operations is evolving, we will continue to review our discretionary spending and other variable costs as well as our liquidity needs.
We routinely monitor current operational requirements, financial market conditions, and credit relationships and we may choose to seek additional capital by issuing new debt and/or equity securities to strengthen our liquidity or capital structure. We are also in the process of evaluating our post-Separation capital structure. Should we seek such additional capital, there can be no assurance that we would be able to obtain such additional capital on terms acceptable to us, if at all, and such additional equity or debt financing could dilute the interests of our existing shareholders and/or increase our interest costs. We may also from time to time seek to retire or repurchase our outstanding debt through cash purchases, in open-market purchases, privately negotiated transactions or otherwise. Such repurchases, if any, will be upon such terms and at such prices as we may determine, and will depend on prevailing market conditions, our liquidity requirements, contractual restrictions and other factors. The amounts involved in such transaction may or may not be material.
Operating Activities
Our business is cyclical and cash flows from operating activities may fluctuate during the year and from year to year due to economic and industry conditions. We rely on cash and short-term borrowings to meet cyclical increases in working capital needs. These needs generally rise during periods of increased economic activity or increasing raw material prices, requiring higher levels of inventory and accounts receivable. During economic slowdowns, or periods of decreasing raw material costs, working capital needs generally decrease as a result of the reduction of inventories and accounts receivable.
Net cash provided by operating activities was $214.0 million during the six months ended November 30, 2022, compared to a net operating cash outflow of $168.9 million during the six months ended November 30, 2021. This change was primarily due to a $451.9 million decrease in net operating working capital (accounts receivable, inventories, and accounts payable) requirements over the prior year six-month period, mainly driven by the impact of lower average steel prices.
Investing Activities
Net cash used by investing activities was $30.7 million during the six months ended November 30, 2022 compared to $124.1 million during the prior year period. Net cash used by investing activities in the prior year period resulted primarily from cash used to acquire certain assets of the Shiloh Industries’ U.S BlankLight ® business on June 8, 2021, for $104.8 million. Net cash used by investing activities in the current year period resulted from the purchase of the Level5 business on June 2, 2022, for $56.1 million, net of cash acquired, and capital expenditures of $46.0 million, partially offset by combined cash proceeds of $71.4 million from the sale of our equity investment in ArtiFlex, and the sale of our WSP Jackson, Michigan facility and other long-lived assets.
Investment activities are largely discretionary, and future investment activities could be reduced significantly, or eliminated, as economic conditions warrant. We assess acquisition opportunities as they arise, and such opportunities may require additional financing. There can be no assurance, however, that any such opportunities will arise, that any such acquisition opportunities will be consummated, or that any needed additional financing will be available on satisfactory terms if required.
Financing Activities
Net cash used by financing activities was $88.2 million during the six months ended November 30, 2022 compared to $122.1 million in the prior year period. The change was primarily due to $43.1 million of net repayments of short-term borrowings in the current year period and the repurchase of 1,235,000 common shares of Worthington Industries, Inc., at a cost of $73.6 million, in the prior year period.
Common shares – On December 20, 2022, the Worthington Industries, Inc. Board of Directors declared a quarterly dividend of $0.31 per share payable on March 29, 2023, to shareholders of record on March 15, 2023.
33
Table of Contents
On March 20, 2019, the Worthington Industries, Inc. Board of Directors authorized the repurchase of up to 6,600,000 of Worthington Industries, Inc.’s outstanding common shares.
On March 24, 2021, the Worthington Industries, Inc. Board of Directors authorized the repurchase of up to an additional 5,618,464 common shares, increasing the total number of common shares then authorized for repurchase to 10,000,000. As of November 30, 2022, 6,065,000 common shares remained available for repurchase under these two authorizations.
The common shares available for repurchase under the authorizations currently in effect may be repurchased from time to time, with consideration given to the market price of the common shares, the nature of other investment opportunities, cash flows from operations, general economic conditions and other relevant considerations. Repurchases may be made on the open market or through privately negotiated transactions.
Long-term debt and short-term borrowings – As of November 30, 2022, we were in compliance with the financial covenants of our short-term and long-term financial debt agreements. Our debt agreements do not include credit rating triggers or material adverse change provisions. During the first quarter of fiscal 2023, our credit rating was upgraded from Baa3 to Baa2 by Moody’s Investors Service, Inc. There were no outstanding borrowings drawn against our AR Facility at November 30, 2022, leaving the full borrowing capacity of $175.0 million available for future use. This is in addition to $500.0 million of short-term borrowing capacity available under our Credit Facility.
Dividend Policy
We currently have no material contractual or regulatory restrictions on the payment of dividends. Dividends are declared at the discretion of the Worthington Industries, Inc. Board of Directors. The Worthington Industries, Inc. Board of Directors reviews the dividend quarterly and establishes the dividend rate based upon our consolidated financial condition, results of operations, capital requirements, current and projected cash flows, business prospects, and other relevant factors. While we have paid a dividend every quarter since becoming a public company in 1968, there is no guarantee that payments will continue in the future.
Critical Accounting Policies
The discussion and analysis of our financial condition and results of operations is based upon our consolidated financial statements, which have been prepared in accordance with U.S. GAAP. The preparation of these consolidated financial statements requires us to make estimates and assumptions that affect the reported amounts of assets and liabilities and the disclosure of contingent assets and liabilities at the date of the consolidated financial statements and the reported amounts of revenues and expenses during the reporting periods. We continually evaluate our estimates, including those related to our valuation of receivables, inventories, intangible assets, accrued liabilities, income and other tax accruals, contingencies and litigation, and business combinations. We base our estimates on historical experience and various other assumptions that we believe to be reasonable under the circumstances. These results form the basis for making judgments about the carrying values of assets and liabilities that are not readily apparent from other sources. Critical accounting policies are defined as those that reflect our significant judgments and uncertainties that could potentially result in materially different results under different assumptions and conditions. Although actual results historically have not deviated significantly from those determined using our estimates, our consolidated financial position or results of operations could be materially different if we were to report under different conditions or to use different assumptions in the application of such policies. Our critical accounting policies have not significantly changed from those discussed in “Part II – Item 7. – Management’s Discussion and Analysis of Financial Condition and Results of Operations – Critical Accounting Policies” of the 2022 Form 10-K.
Item 3. – Quantitative and Qualitative Disclosures About Market Risk
Market risks have not materially changed from those disclosed in “Part II – Item 7A. – Quantitative and Qualitative Disclosures About Market Risk” of the 2022 Form 10-K.
Item 4. – Controls and Procedures
Evaluation of Disclosure Controls and Procedures
We maintain disclosure controls and procedures [as defined in Rules 13a-15(e) and 15d-15(e) under the Securities Exchange Act of 1934, as amended (the “Exchange Act”)] that are designed to provide reasonable assurance that information required to be disclosed in the reports that Worthington Industries, Inc. files or submits under the Exchange Act is recorded, processed, summarized and reported within the time periods specified in the SEC’s rules and forms, and that such information is accumulated and communicated to our management, including Worthington Industries, Inc.’s principal executive officer and principal financial officer, as appropriate to allow timely decisions regarding required disclosure.
34
Table of Contents
Management, under the supervision of and with the participation of Worthington Industries, Inc.’s principal executive officer and principal financial officer, performed an evaluation of the effectiveness of our disclosure controls and procedures as of the end of the period covered by this Form 10-Q (the quarterly period ended November 30, 2022). Based on that evaluation, Worthington Industries, Inc.’s principal executive officer and principal financial officer have concluded that such disclosure controls and procedures were effective at a reasonable assurance level as of the end of the quarterly period covered by this Form 10-Q.
Changes in Internal Control Over Financial Reporting
There were no changes that occurred during the period covered by this Form 10-Q (the quarterly period ended November 30, 2022) in our internal control over financial reporting (as defined in Rules 13a-15(f) and 15d-15(f) under the Exchange Act) that have materially affected, or are reasonably likely to materially affect, our internal control over financial reporting.
PART II. OTHER INFORMATION
Item 1. – Legal Proceedings
We are involved in various judicial and administrative proceedings, as both plaintiff and defendant, arising in the ordinary course of business. We do not believe that any such proceedings will have a material adverse effect on our business, financial position, results of operation or cash flows.
Item 1A. – Risk Factors
There are certain risks and uncertainties in our business that could cause our actual results to differ materially from those anticipated. In “PART I – Item 1A. – Risk Factors” of the 2022 Form 10-K, as filed with the SEC on August 1, 2022, and available at www.sec.gov or at www.worthingtonindustries.com, we included a detailed discussion of our risk factors. Our risk factors have not changed significantly from those disclosed in the 2022 Form 10-K. These risk factors should be read carefully in connection with evaluating our business and in connection with the forward-looking statements and other information contained in this Form 10-Q. Any of the risks described in the 2022 Form 10-K could materially affect our business, consolidated financial condition or future results and the actual outcome of matters as to which forward-looking statements are made. The risk factors described in the 2022 Form 10-K are not the only risks we face. Additional risks and uncertainties not currently known to us, or that we currently deem to be immaterial, also may materially adversely affect our business, consolidated financial condition and/or future results.
Item 2. – Unregistered Sales of Equity Securities and Use of Proceeds
There were no unregistered sales of equity securities of Worthington Industries, Inc. during the period covered by the Form 10-Q. There were no common shares of Worthington Industries, Inc. repurchased by, or on behalf of, Worthington Industries, Inc. or any affiliated purchaser (as defined in Rule 10b - 18(a)(3) under the Exchange Act) during the three months ended November 30, 2022.
Item 3. – Defaults Upon Senior Securities
Not applicable.
Item 4. – Mine Safety Disclosures
Not applicable.
Item 5. – Other Information
Not applicable.
35
Table of Contents
Item 6. – Exhibits
| | |
Exhibit No. | | Description |
| | |
2.1 | | Equity Interest Purchase Agreement, dated as of October 29, 2021, by and among Worthington Steel of Michigan, Inc., Tempel Holdings Inc., and Tempel Steel Company (Incorporated herein by reference to Exhibit 2.01 to the Current Report on Form 8-K of Worthington Industries, Inc. dated November 1, 2021 and filed with the SEC on the same date (SEC File No. 1-8399)) † |
| | |
3.1 | | Amended Articles of Incorporation of Worthington Industries, Inc., as filed with the Ohio Secretary of State on October 13, 1998 (Incorporated herein by reference to Exhibit 3(a) to the Quarterly Report on Form 10-Q of Worthington Industries, Inc. for the quarterly period ended August 31, 1998 (SEC File No. 0-4016)) P |
| | |
3.2 | | Code of Regulations of Worthington Industries, Inc. (reflecting all amendments through the date of this Quarterly Report on Form 10-Q) [This document represents the Code of Regulations of Worthington Industries, Inc. in compiled form incorporating all amendments.] (Incorporated herein by reference to Exhibit 3(b) to the Quarterly Report on Form 10-Q of Worthington Industries, Inc. for the quarterly period ended August 31, 2000 (SEC File No. 1-8399)) |
| | |
10.1 | | First Amendment to the Receivables Financing Agreement, dated as of October 6, 2022, among Worthington Receivables Company, LLC, Worthington Industries, Inc., PNC Bank, National Association, and PNC Capital Markets LLC (Incorporated herein by reference to Exhibit 10.4 to the Quarterly Report on Form 10-Q of Worthington Industries, Inc. for the quarterly period ended August 31, 2022 (SEC file No. 1-8399)) |
| | |
31.1 | | Rule 13a - 14(a) / 15d - 14(a) Certifications (Principal Executive Officer) * |
| | |
31.2 | | Rule 13a - 14(a) / 15d - 14(a) Certifications (Principal Financial Officer) * |
| | |
32.1 | | Certifications of Principal Executive Officer Pursuant to 18 U.S.C. Section 1350, as Adopted Pursuant to Section 906 of the Sarbanes-Oxley Act of 2002** |
| | |
32.2 | | Certifications of Principal Financial Officer Pursuant to 18 U.S.C. Section 1350, as Adopted Pursuant to Section 906 of the Sarbanes-Oxley Act of 2002** |
| | |
101.INS | | XBRL Instance Document – the instance document does not appear in the Interactive Date File because its XBRL tags are embedded within the Inline XBRL document. |
| | |
101.SCH | | Inline XBRL Taxonomy Extension Schema Document # |
| | |
101.PRE | | Inline XBRL Taxonomy Extension Presentation Linkbase Document # |
| | |
101.LAB | | Inline XBRL Taxonomy Extension Label Linkbase Document # |
| | |
101.CAL | | Inline XBRL Taxonomy Extension Calculation Linkbase Document # |
| | |
101.DEF | | Inline XBRL Taxonomy Extension Definition Linkbase Document # |
| | |
104 | | Cover Page Interactive Data File – the cover page from this Quarterly Report on Form 10-Q for the quarterly period ended November 30, 2022, formatted in Inline XBRL (included within the Exhibit 101 attachments). |
* Filed herewith.
** Furnished herewith.
† The Disclosure Schedules and Exhibits referenced in the Equity Interest Purchase Agreement have been omitted pursuant to Item 601(a)(5) of SEC Regulation S-K. Worthington Industries, Inc. will supplementally furnish a copy of any of the omitted Disclosure Schedules and Exhibits to the SEC on a confidential basis upon request.
# Attached as Exhibit 101 to this Quarterly Report on Form 10-Q of Worthington Industries, Inc. are the following documents formatted in Inline XBRL (Extensible Business Reporting Language):
(i)Consolidated Balance Sheets at November 30, 2022 and May 31, 2022;
(ii)Consolidated Statements of Earnings for the three months and the six months ended November 30, 2022 and November 30, 2021;
(iii)Consolidated Statements of Comprehensive Income for the three months and the six months ended November 30, 2022 and November 30, 2021;
36
Table of Contents
(iv)Consolidated Statements of Cash Flows for the three months and the six months ended November 30, 2022 and November 30, 2021; and
(v)Condensed Notes to Consolidated Financial Statements.
37
Table of Contents
Signatures
Pursuant to the requirements of the Securities Exchange Act of 1934, the Registrant has duly caused this report to be signed on its behalf by the undersigned thereunto duly authorized.
| | |
| | WORTHINGTON INDUSTRIES, INC. |
| | |
Date: January 9, 2023 | By: | /s/ Joseph B. Hayek |
| | Joseph B. Hayek, |
| | Vice President and Chief Financial Officer |
| | (On behalf of the Registrant as Duly Authorized Officer and as Principal Financial Officer) |
| | |
38