UNITED STATES
SECURITIES AND EXCHANGE COMMISSION
Washington, D.C. 20549
FORM 10-Q
(Mark One)
☒ QUARTERLY REPORT PURSUANT TO SECTION 13 OR 15(d) OF THE SECURITIES EXCHANGE ACT OF 1934
For the quarterly period ended November 30, 2023
or
☐ TRANSITION REPORT PURSUANT TO SECTION 13 OR 15(d) OF THE SECURITIES EXCHANGE ACT OF 1934
For the transition period from ___________ to ___________
Commission File Number 001-08399
WORTHINGTON ENTERPRISES, INC.
(Exact name of registrant as specified in its charter)
| | |
Ohio | | 31-1189815 |
(State or other jurisdiction of incorporation or organization) | | (I.R.S. Employer Identification No.) |
| | |
200 West Old Wilson Bridge Road, Columbus, Ohio | | 43085 |
(Address of principal executive offices) | | (Zip Code) |
|
(614) 438-3210 |
(Registrant’s telephone number, including area code) |
|
Not Applicable |
(Former name, former address and former fiscal year, if changed since last report) |
Securities registered pursuant to Section 12(b) of the Act:
| | |
Title of each class | Trading Symbol(s) | Name of each exchange on which registered |
Common Shares, Without Par Value | WOR | New York Stock Exchange |
Indicate by check mark whether the registrant (1) has filed all reports required to be filed by Section 13 or 15(d) of the Securities Exchange Act of 1934 during the preceding 12 months (or for such shorter period that the registrant was required to file such reports), and (2) has been subject to such filing requirements for the past 90 days. Yes ☒ No ☐
Indicate by check mark whether the registrant has submitted electronically every Interactive Data File required to be submitted pursuant to Rule 405 of Regulation S-T (§ 232.405 of this chapter) during the preceding 12 months (or for such shorter period that the registrant was required to submit such files). Yes ☒ No ☐
Indicate by check mark whether the registrant is a large accelerated filer, an accelerated filer, a non-accelerated filer, a smaller reporting company, or an emerging growth company. See the definitions of “large accelerated filer,” “accelerated filer,” “smaller reporting company,” and “emerging growth company” in Rule 12b-2 of the Exchange Act.
| | | | |
Large accelerated filer | ☒ | | Accelerated filer | ☐ |
Non-accelerated filer | ☐ | | Smaller reporting company | ☐ |
| | | Emerging growth company | ☐ |
If an emerging growth company, indicate by check mark if the registrant has elected not to use the extended transition period for complying with any new or revised financial accounting standards provided pursuant to Section 13(a) of the Exchange Act. ☐
Indicate by check mark whether the registrant is a shell company (as defined in Rule 12b-2 of the Exchange Act). Yes ☐ No ☒
APPLICABLE ONLY TO CORPORATE ISSUERS:
On January 4, 2024, the number of common shares, without par value, of the Registrant issued and outstanding was 49,994,385.
TABLE OF CONTENTS
i
Table of Contents
Safe Harbor Statement
Selected statements contained in this Quarterly Report on Form 10-Q (this “Form 10-Q”), including, without limitation, in “PART I – Item 2. – Management’s Discussion and Analysis of Financial Condition and Results of Operations,” constitute “forward-looking statements,” as that term is used in the Private Securities Litigation Reform Act of 1995 (the “PSLRA”). Forward-looking statements reflect the Company’s current expectations, estimates or projections concerning future results or events. These statements are often identified by the use of forward-looking words or phrases such as “believe,” “expect,” “anticipate,” “may,” “could,” “should,” “would,” “intend,” “plan,” “will,” “likely,” “estimate,” “project,” “position,” “strategy,” “target,” “aim,” “seek,” “foresee,” or other similar words or phrases. These forward-looking statements include, without limitation, statements relating to:
•future or expected cash positions, liquidity and ability to access financial markets and capital;
•outlooks, strategies or business plans;
•anticipated benefits of the separation of the Company’s former Steel Processing business (the “Separation”);
•expected financial and operational performance of, and future opportunities for, the Company following the Separation;
•the Company’s performance on a pro forma basis to illustrate the estimated effects of the Separation on historical periods;
•the tax treatment of the Separation transaction;
•future or expected growth, growth potential, forward momentum, performance, competitive position, sales, volumes, cash flows, earnings, margins, balance sheet strengths, debt, financial condition or other financial measures;
•pricing trends for raw materials and finished goods and the impact of pricing changes;
•the ability to improve or maintain margins;
•expected demand or demand trends for the Company or its markets;
•additions to product lines and opportunities to participate in new markets;
•expected benefits from transformation and innovation efforts;
•the ability to improve performance and competitive position at the Company’s operations;
•anticipated working capital needs, capital expenditures and asset sales;
•anticipated improvements and efficiencies in costs, operations, sales, inventory management, sourcing and the supply chain and the results thereof;
•projected profitability potential;
•the ability to make acquisitions, form joint ventures and consolidate operations and the projected timing, results, benefits, costs, charges and expenditures related to acquisitions, joint ventures, headcount reductions and facility dispositions, shutdowns and consolidations;
•projected capacity and the alignment of operations with demand;
•the ability to operate profitably and generate cash in down markets;
•the ability to capture and maintain market share and to develop or take advantage of future opportunities, customer initiatives, new businesses, new products and new markets;
•expectations for Company and customer inventories, jobs and orders;
•expectations for the economy and markets or improvements therein;
•expectations for generating improving and sustainable earnings, earnings potential, margins or shareholder value;
•effects of judicial rulings, laws and regulations;
•effects of the novel coronavirus (“COVID-19”) pandemic and the various responses of governmental and nongovernmental authorities thereto on economies and markets, and on the Company’s customers, counterparties, employees and third-party service providers; and
•other non-historical matters.
Because they are based on beliefs, estimates and assumptions, forward-looking statements are inherently subject to risks and uncertainties that could cause actual results to differ materially from those projected. Any number of factors could affect actual results, including, without limitation, those that follow:
•the uncertainty of obtaining regulatory approvals in connection with the Separation, including rulings from the Internal Revenue Service;
•the Company’s ability to successfully realize the anticipated benefits of the Separation;
•the effect of conditions in national and worldwide financial markets, including inflation, increases in interest rates and economic recession, and with respect to the ability of financial institutions to provide capital;
•the risks, uncertainties and impacts related to the COVID-19 pandemic – the duration, extent and severity of which are impossible to predict, including the possibility of future resurgence in the spread of COVID-19 or variants thereof – and the availability, effectiveness and acceptance of vaccines, and other actual or potential public health emergencies and actions taken by governmental authorities or others in connection therewith;
ii
Table of Contents
•the effect of national, regional and global economic conditions generally and within major product markets, including significant economic disruptions from COVID-19, the actions taken in connection therewith and the implementation of related fiscal stimulus packages;
•the impact of tariffs, the adoption of trade restrictions affecting the Company’s products or suppliers, a United States (“U.S.”) withdrawal from or significant renegotiation of trade agreements, the occurrence of trade wars, the closing of border crossings, and other changes in trade regulations or relationships;
•changing commodity prices and/or supply;
•product demand and pricing;
•changes in product mix, product substitution and market acceptance of the Company’s products;
•volatility or fluctuations in the pricing, quality or availability of raw materials (particularly steel), supplies, transportation, utilities, labor and other items required by operations (especially in light of the COVID-19 pandemic and Russia’s invasion of Ukraine);
•effects of sourcing and supply chain constraints;
•the outcome of adverse claims experience with respect to workers’ compensation, product recalls or product liability, casualty events or other matters;
•effects of facility closures and the consolidation of operations;
•the effect of financial difficulties, consolidation and other changes within the steel, automotive, construction and other industries in which the Company participates;
•failure to maintain appropriate levels of inventories;
•financial difficulties (including bankruptcy filings) of original equipment manufacturers, end-users and customers, suppliers, joint venture partners and others with whom the Company does business;
•the ability to realize targeted expense reductions from headcount reductions, facility closures and other cost reduction efforts;
•the ability to realize cost savings and operational, sales and sourcing improvements and efficiencies, and other expected benefits from transformation initiatives, on a timely basis;
•the overall success of, and the ability to integrate, newly-acquired businesses and joint ventures, maintain and develop their customers, and achieve synergies and other expected benefits and cost savings therefrom;
•capacity levels and efficiencies, within facilities, within major product markets and within the industries in which the Company participates as a whole;
•the effect of disruption in the business of suppliers, customers, facilities and shipping operations due to adverse weather, casualty events, equipment breakdowns, labor shortages, interruption in utility services, civil unrest, international conflicts (especially in light of Russia’s invasion of Ukraine), terrorist activities, or other causes;
•changes in customer demand, inventories, spending patterns, product choices, and supplier choices;
•risks associated with doing business internationally, including economic, political and social instability (especially in light of Russia’s invasion of Ukraine), foreign currency exchange rate exposure and the acceptance of the Company’s products in global markets;
•the ability to improve and maintain processes and business practices to keep pace with the economic, competitive and technological environment;
•the effect of inflation, interest rate increases and economic recession, which may negatively impact the Company’s operations and financial results;
•deviation of actual results from estimates and/or assumptions used by the Company in the application of its significant accounting policies;
•the level of imports and import prices in the Company’s markets;
•the impact of environmental laws and regulations or the actions of the U.S. Environmental Protection Agency or similar regulators which increase costs or limit the Company’s ability to use or sell certain products;
•the impact of increasing environmental, greenhouse gas emission and sustainability regulations or considerations;
•the impact of judicial rulings and governmental regulations, both in the U.S. and abroad, including those adopted by the U.S. Securities and Exchange Commission (the “SEC”) and other governmental agencies as contemplated by the Coronavirus Aid, Relief and Economic Security (CARES) Act, the Consolidated Appropriations Act, 2021, the American Rescue Plan Act of 2021, and the Dodd-Frank Wall Street Reform and Consumer Protection Act of 2010;
•the effect of healthcare laws in the U.S. and potential changes for such laws, which may increase the Company’s healthcare and other costs and negatively impact the Company’s operations and financial results;
•the effect of tax laws in the U.S. and potential changes for such laws, which may increase the Company’s costs and negatively impact its operations and financial results;
•the effects of privacy and information security laws and standards; and
iii
Table of Contents
•other risks described from time to time in the Company’s filings with the SEC, including those described in “PART I – Item 1A. — Risk Factors” of the Company’s Form 10-K for the fiscal year ended May 31, 2023 (“2023 Form 10-K”).
The Company notes these risk factors for investors as contemplated by the PSLRA. Forward-looking statements should be construed in the light of such risks. It is impossible to predict or identify all potential risk factors. Consequently, readers should not consider the foregoing list to be a complete set of all potential risks and uncertainties. Readers are cautioned not to place undue reliance on any forward-looking statements. Any forward-looking statements in this Form 10-Q are based on current information as of the date of this Form 10-Q, and the Company does not undertake, and hereby disclaims, any obligation to correct or update any forward-looking statements, whether as a result of new information, future developments or otherwise, except as required by applicable law.
iv
Table of Contents
EXPLANATORY NOTE
On December 1, 2023, Worthington Industries, Inc. completed the separation of its former Steel Processing business into an independent, publicly traded company: Worthington Steel, Inc. (“Worthington Steel”). Also on December 1, 2023, Worthington Industries, Inc. changed its name to Worthington Enterprises, Inc., with such entity referred to as “Worthington Enterprises” for all past, present and futures periods discussed in this Form 10-Q for the fiscal quarter ended November 30, 2023 (this “Form 10-Q”).
References in this Form 10-Q to “we,” “our,” “us” “Worthington,” or the “Company” are to Worthington Enterprises and its consolidated subsidiaries, which included Worthington Steel and the Steel Processing business through November 30, 2023, the end of our fiscal 2024 second quarter. Accordingly, the financial results of Worthington Enterprises prior to the Separation include our former Steel Processing business. Beginning with our fiscal 2024 third quarter, our historical results will be restated to reflect the operations of our former Steel Processing business as a discontinued operation in periods prior to the December 1, 2023 Separation.
1
Table of Contents
PART I. FINANCIAL INFORMATION
Item 1. – Financial Statements
WORTHINGTON ENTERPRISES, INC.
CONSOLIDATED BALANCE SHEETS
(In thousands)
| | | | | | | | |
| | (Unaudited) | | | | |
| | November 30, | | | May 31, | |
| | 2023 | | | 2023 | |
Assets | | | | | | |
Current assets: | | | | | | |
Cash and cash equivalents | | $ | 430,906 | | | $ | 454,946 | |
Receivables, less allowances of $2,944 and $3,383 at November 30, 2023 and May 31, 2023, respectively | | | 640,826 | | | | 692,887 | |
Inventories: | | | | | | |
Raw materials | | | 245,166 | | | | 264,568 | |
Work in process | | | 156,361 | | | | 183,248 | |
Finished products | | | 174,884 | | | | 160,152 | |
Total inventories | | | 576,411 | | | | 607,968 | |
Income taxes receivable | | | 5,511 | | | | 4,198 | |
Assets held for sale | | | 1,789 | | | | 3,381 | |
Prepaid expenses and other current assets | | | 117,160 | | | | 104,957 | |
Total current assets | | | 1,772,603 | | | | 1,868,337 | |
Investments in unconsolidated affiliates | | | 247,421 | | | | 252,591 | |
Operating lease assets | | | 94,677 | | | | 99,967 | |
Goodwill | | | 416,857 | | | | 414,820 | |
Other intangible assets, net of accumulated amortization of $121,478 and $112,202 at November 30, 2023 and May 31, 2023, respectively | | | 305,649 | | | | 314,226 | |
Other assets | | | 42,916 | | | | 25,323 | |
Property, plant and equipment: | | | | | | |
Land | | | 50,920 | | | | 49,697 | |
Buildings and improvements | | | 312,830 | | | | 308,669 | |
Machinery and equipment | | | 1,293,628 | | | | 1,263,962 | |
Construction in progress | | | 78,536 | | | | 45,165 | |
Total property, plant and equipment | | | 1,735,914 | | | | 1,667,493 | |
Less: accumulated depreciation | | | 1,031,900 | | | | 991,839 | |
Total property, plant and equipment, net | | | 704,014 | | | | 675,654 | |
Total assets | | $ | 3,584,137 | | | $ | 3,650,918 | |
| | | | | | |
Liabilities and equity | | | | | | |
Current liabilities: | | | | | | |
Accounts payable | | $ | 447,119 | | | $ | 528,920 | |
Short-term borrowings | | | 175,000 | | | | 2,813 | |
Accrued compensation, contributions to employee benefit plans and related taxes | | | 80,461 | | | | 93,810 | |
Dividends payable | | | 17,245 | | | | 18,330 | |
Other accrued items | | | 62,270 | | | | 53,362 | |
Current operating lease liabilities | | | 12,493 | | | | 12,608 | |
Income taxes payable | | | 485 | | | | 7,451 | |
Current maturities of long-term debt | | | 150,269 | | | | 264 | |
Total current liabilities | | | 945,342 | | | | 717,558 | |
Other liabilities | | | 112,878 | | | | 113,286 | |
Distributions in excess of investment in unconsolidated affiliate | | | 118,465 | | | | 117,297 | |
Long-term debt | | | 298,549 | | | | 689,718 | |
Noncurrent operating lease liabilities | | | 85,283 | | | | 89,982 | |
Deferred income taxes, net | | | 99,653 | | | | 101,449 | |
Total liabilities | | | 1,660,170 | | | | 1,829,290 | |
Shareholders' equity - controlling interest | | | 1,792,809 | | | | 1,696,011 | |
Noncontrolling interests | | | 131,158 | | | | 125,617 | |
Total equity | | | 1,923,967 | | | | 1,821,628 | |
Total liabilities and equity | | $ | 3,584,137 | | | $ | 3,650,918 | |
See condensed notes to consolidated financial statements.
2
Table of Contents
WORTHINGTON ENTERPRISES, INC.
CONSOLIDATED STATEMENTS OF EARNINGS
(In thousands, except per common share amounts)
(Unaudited)
| | | | | | | | | | | | | | | |
| Three Months Ended | | | Six Months Ended | |
| November 30, | | | November 30, | |
| 2023 | | | 2022 | | | 2023 | | | 2022 | |
Net sales | $ | 1,086,918 | | | $ | 1,175,541 | | | $ | 2,280,174 | | | $ | 2,584,206 | |
Cost of goods sold | | 963,204 | | | | 1,069,778 | | | | 1,958,971 | | | | 2,309,069 | |
Gross margin | | 123,714 | | | | 105,763 | | | | 321,203 | | | | 275,137 | |
Selling, general and administrative expense | | 107,688 | | | | 107,813 | | | | 220,036 | | | | 211,261 | |
Impairment of long-lived assets | | - | | | | - | | | | 1,401 | | | | 312 | |
Restructuring and other expense (income), net | | 6 | | | | (4,282 | ) | | | 6 | | | | (5,382 | ) |
Separation costs | | 21,952 | | | | 9,246 | | | | 27,987 | | | | 9,246 | |
Operating income (loss) | | (5,932 | ) | | | (7,014 | ) | | | 71,773 | | | | 59,700 | |
Other income (expense): | | | | | | | | | | | |
Miscellaneous income (expense), net | | 1,020 | | | | 1,405 | | | | 2,031 | | | | (3,681 | ) |
Loss on extinguishment of debt | | - | | | | - | | | | (1,534 | ) | | | - | |
Interest expense, net | | (2,169 | ) | | | (7,612 | ) | | | (5,252 | ) | | | (16,210 | ) |
Equity in net income of unconsolidated affiliates | | 42,446 | | | | 36,857 | | | | 96,827 | | | | 68,569 | |
Earnings before income taxes | | 35,365 | | | | 23,636 | | | | 163,845 | | | | 108,378 | |
Income tax expense | | 7,198 | | | | 4,131 | | | | 35,975 | | | | 23,629 | |
Net earnings | | 28,167 | | | | 19,505 | | | | 127,870 | | | | 84,749 | |
Net earnings attributable to noncontrolling interests | | 3,865 | | | | 3,287 | | | | 7,461 | | | | 4,449 | |
Net earnings attributable to controlling interest | $ | 24,302 | | | $ | 16,218 | | | $ | 120,409 | | | $ | 80,300 | |
| | | | | | | | | | | |
Basic | | | | | | | | | | | |
Weighted average common shares outstanding | | 49,186 | | | | 48,558 | | | | 49,013 | | | | 48,518 | |
Earnings per common share attributable to controlling interest | $ | 0.49 | | | $ | 0.33 | | | $ | 2.46 | | | $ | 1.66 | |
| | | | | | | | | | | |
Diluted | | | | | | | | | | | |
Weighted average common shares outstanding | | 50,042 | | | | 49,330 | | | | 50,102 | | | | 49,293 | |
Earnings per common share attributable to controlling interest | $ | 0.49 | | | $ | 0.33 | | | $ | 2.40 | | | $ | 1.63 | |
| | | | | | | | | | | |
Common shares outstanding at end of period | | 49,287 | | | | 48,572 | | | | 49,287 | | | | 48,572 | |
| | | | | | | | | | | |
Cash dividends declared per common share | $ | 0.32 | | | $ | 0.31 | | | $ | 0.64 | | | $ | 0.62 | |
See condensed notes to consolidated financial statements.
3
Table of Contents
WORTHINGTON ENTERPRISES, INC.
CONSOLIDATED STATEMENTS OF COMPREHENSIVE INCOME
(In thousands)
(Unaudited)
| | | | | | | | | | | | | | | |
| Three Months Ended | | | Six Months Ended | |
| November 30, | | | November 30, | |
| 2023 | | | 2022 | | | 2023 | | | 2022 | |
Net earnings | $ | 28,167 | | | $ | 19,505 | | | $ | 127,870 | | | $ | 84,749 | |
Other comprehensive income (loss), net of tax | | | | | | | | | | | |
Foreign currency translation | | 897 | | | | 858 | | | | 2,342 | | | | (9,243 | ) |
Pension liability adjustment | | - | | | | (82 | ) | | | (3 | ) | | | 2,857 | |
Cash flow hedges | | 13,549 | | | | (4,000 | ) | | | 6,699 | | | | (17,300 | ) |
Other comprehensive income (loss) | | 14,446 | | | | (3,224 | ) | | | 9,038 | | | | (23,686 | ) |
Comprehensive income | | 42,613 | | | | 16,281 | | | | 136,908 | | | | 61,063 | |
Comprehensive income attributable to noncontrolling interests | | 3,865 | | | | 3,287 | | | | 7,461 | | | | 4,449 | |
Comprehensive income attributable to controlling interest | $ | 38,748 | | | $ | 12,994 | | | $ | 129,447 | | | $ | 56,614 | |
See condensed notes to consolidated financial statements.
4
Table of Contents
WORTHINGTON ENTERPRISES, INC.
CONSOLIDATED STATEMENTS OF CASH FLOWS
(In thousands)
(Unaudited)
| | | | | | | | | | | | | | | |
| Three Months Ended | | | Six Months Ended | |
| November 30, | | | November 30, | |
| 2023 | | | 2022 | | | 2023 | | | 2022 | |
Operating activities: | | | | | | | | | | | |
Net earnings | $ | 28,167 | | | $ | 19,505 | | | $ | 127,870 | | | $ | 84,749 | |
Adjustments to reconcile net earnings to net cash provided by operating activities: | | | | | | | | | | | |
Depreciation and amortization | | 28,007 | | | | 28,354 | | | | 56,332 | | | | 56,355 | |
Impairment of long-lived assets | | - | | | | - | | | | 1,401 | | | | 312 | |
Provision for (benefit from) deferred income taxes | | 1,968 | | | | (3,617 | ) | | | (3,485 | ) | | | (14,673 | ) |
Loss on extinguishment of debt | | - | | | | - | | | | 1,534 | | |
| |
Bad debt expense (income) | | 345 | | | | 1,098 | | | | (454 | ) | | | 1,440 | |
Equity in net income of unconsolidated affiliates, net of distributions | | (4,129 | ) | | | 18,352 | | | | 6,096 | | | | 61,197 | |
Net gain on sale of assets | | (439 | ) | | | (4,265 | ) | | | (334 | ) | | | (5,034 | ) |
Stock-based compensation | | 6,175 | | | | 4,547 | | | | 10,691 | | | | 8,783 | |
Changes in assets and liabilities, net of impact of acquisitions: | | | | | | | | | |
| |
Receivables | | 76,704 | | | | 119,674 | | | | 67,861 | | | | 157,093 | |
Inventories | | 103,150 | | | | 72,293 | | | | 38,823 | | | | 113,460 | |
Accounts payable | | (75,373 | ) | | | (100,535 | ) | | | (75,095 | ) | | | (202,116 | ) |
Accrued compensation and employee benefits | | 2,794 | | | | 3,336 | | | | (9,220 | ) | | | (30,532 | ) |
Income taxes payable | | (35,428 | ) | | | (7,629 | ) | | | (6,966 | ) | | | (300 | ) |
Other operating items, net | | 3,049 | | | | (18,172 | ) | | | (20,368 | ) | | | (16,755 | ) |
Net cash provided by operating activities | | 134,990 | | | | 132,941 | | | | 194,686 | | | | 213,979 | |
| | | | | | | | | | | |
Investing activities: | | | | | | | | | | | |
Investment in property, plant and equipment | | (32,876 | ) | | | (24,490 | ) | | | (62,174 | ) | | | (45,967 | ) |
Proceeds from sale of assets, net of selling costs | | 751 | | | | 23,739 | | | | 802 | | | | 35,494 | |
Acquisitions, net of cash acquired | | (21,013 | ) | | | - | | | | (21,013 | ) | | | (56,088 | ) |
Investment in note receivable | | - | | | | - | | | | (15,000 | ) | | | - | |
Investment in non-marketable equity securities | | (1,500 | ) | | | (140 | ) | | | (1,540 | ) | | | (250 | ) |
Proceeds from the sale of investment in ArtiFlex, net of selling costs | | - | | | | - | | | | - | | | | 36,095 | |
Distribution from unconsolidated affiliate | | 1,085 | | | | - | | | | 1,085 | | | | - | |
Net cash used by investing activities | | (53,553 | ) | | | (891 | ) | | | (97,840 | ) | | | (30,716 | ) |
| | | | | | | | | | | |
Financing activities: | | | | | | | | | | | |
Net proceeds from (repayments of) short-term borrowings | | 175,000 | | | | (10,619 | ) | | | 172,187 | | | | (43,062 | ) |
Principal payments on long-term obligations | | - | | | | (13 | ) | | | (243,757 | ) | | | (150 | ) |
Proceeds from issuance of common shares, net of tax withholdings | | (9,207 | ) | | | (649 | ) | | | (14,337 | ) | | | (4,115 | ) |
Payments to noncontrolling interests | | - | | | | (11,760 | ) | | | (1,921 | ) | | | (11,760 | ) |
Dividends paid | | (17,333 | ) | | | (15,181 | ) | | | (33,058 | ) | | | (29,065 | ) |
Net cash provided (used) by financing activities | | 148,460 | | | | (38,222 | ) | | | (120,886 | ) | | | (88,152 | ) |
| | | | | | | | | | | |
Increase (decrease) in cash and cash equivalents | | 229,897 | | | | 93,828 | | | | (24,040 | ) | | | 95,111 | |
Cash and cash equivalents at beginning of period | | 201,009 | | | | 35,768 | | | | 454,946 | | | | 34,485 | |
Cash and cash equivalents at end of period | $ | 430,906 | | | $ | 129,596 | | | $ | 430,906 | | | $ | 129,596 | |
See condensed notes to consolidated financial statements.
5
Table of Contents
WORTHINGTON ENTERPRISES, INC.
CONDENSED Notes to Consolidated Financial Statements (UNAUDITED)
(In thousands, except per common share amounts)
Note A – Basis of Presentation
Basis of Presentation
These unaudited consolidated financial statements include the accounts of Worthington Enterprises and its consolidated subsidiaries. Significant intercompany accounts and transactions have been eliminated.
We own controlling interests in the following three operating joint ventures: Spartan Steel Coating, L.L.C. (“Spartan”) (52%); TWB Company, L.L.C. (“TWB”) (55%); and Worthington Samuel Coil Processing LLC (“Samuel”) (63%). We also own a 51% controlling interest in Worthington Specialty Processing (“WSP”), which became a non-operating joint venture on October 31, 2022, when the remaining net assets of WSP were sold. These joint ventures are consolidated with the equity owned by the other joint venture members shown as noncontrolling interests in our consolidated balance sheets, and their portions of net earnings and other comprehensive income (loss) (“OCI”) are shown as net earnings or comprehensive income attributable to noncontrolling interests in our consolidated statements of earnings and consolidated statements of comprehensive income, respectively. Investments in affiliates that we do not control are accounted for under the equity method with our proportionate share of income or loss recognized within equity in net income of unconsolidated affiliates (“equity income”) in our consolidated statements of earnings. See further discussion of our unconsolidated affiliates in “Note D – Investments in Unconsolidated Affiliates.”
These unaudited consolidated financial statements have been prepared in accordance with accounting principles generally accepted in the U.S. (“U.S. GAAP”) for interim financial information and with the instructions to Form 10-Q and Article 10 of Regulation S-X of the SEC. Accordingly, they do not include all of the information and notes required by U.S. GAAP for complete financial statements. In the opinion of management, all adjustments, which are of a normal and recurring nature except those which have been disclosed elsewhere in this Form 10-Q, necessary for a fair presentation of the consolidated financial statements for these interim periods, have been included. Operating results for the second quarter of fiscal 2024 are not necessarily indicative of the results that may be expected for the fiscal year ending May 31, 2024 (“fiscal 2024”) or for any other fiscal quarter. For further information, refer to the consolidated financial statements and notes thereto included in the 2023 Form 10-K.
The preparation of consolidated financial statements in conformity with U.S. GAAP requires management to make estimates and assumptions that affect the amounts reported in the consolidated financial statements and accompanying notes. Actual results could differ materially from those estimates.
The Separation of the Steel Processing Business
On December 1, 2023, we completed the Separation and Worthington Steel, comprised of our former Steel Processing business, became an independent, publicly traded company. To effectuate the Separation, we made a pro-rata distribution of all outstanding shares of Worthington Steel, which was tax-free to our shareholders for U.S. federal income tax purposes. Each holder of record of Worthington Enterprises common shares received one common share of Worthington Steel for every one common share of Worthington Enterprises held (the “Distribution”) as of the close of business on November 21, 2023 (the “Record Date”).
On November 30, 2023, in connection with the Separation, we entered into several agreements with Worthington Steel that govern the relationship between Worthington Steel and us following the Distribution, including a Separation and Distribution Agreement, Tax Matters Agreement, Employee Matters Agreement, and Transition Services Agreement.
Direct and incremental costs associated with the Separation are presented as a separate component of operating expense within the Separation costs caption in our consolidated statements of earnings and are held at the corporate level. Separation costs through the first six months of fiscal 2024 consisted primarily of third-party advisory fees and certain non-recurring employee-related costs totaling $15,760 and $7,093, respectively, with the residual related to incremental costs associated with the separation of shared corporate functions. Employee-related costs in fiscal 2024 include $5,437 of incremental compensation expense associated with the modification of unvested long-term incentive compensation awards as required under the Employee Matters Agreement as well as accrued retention bonuses and severance expense. Substantially all of the costs incurred through the first six months of fiscal 2023 related to third-party advisory fees.
6
Table of Contents
Note B – Inventory
During the second quarter of fiscal 2024, we initiated a recall with the Consumer Protection Safety Commission for our recently introduced Balloon Time® Mini helium tank. We have reserved for the estimated direct and incremental costs expected to be incurred to administer the recall program, which we expect to be immaterial due to the small population of tanks purchased by end consumers. However, we booked a reserve of approximately $3,000 to reflect the impacted inventory at its estimated net realizable value. The adjustment was attributed to our Consumer Products operating segment and was recorded in cost of goods sold in the consolidated statement of earnings for the three and six months ended November 30, 2023.
Note C – Revenue Recognition
The following table summarizes net sales by operating segment and product class within the Steel Processing operating segment for the periods presented:
| | | | | | | | | | | | | | | |
| Three Months Ended | | | Six Months Ended | |
| November 30, | | | November 30, | |
(In thousands) | 2023 | | | 2022 | | | 2023 | | | 2022 | |
Steel Processing | | | | | | | | | | | |
Direct | $ | 750,622 | | | $ | 807,259 | | | $ | 1,595,985 | | | $ | 1,809,394 | |
Toll | | 38,033 | | | | 34,688 | | | | 74,008 | | | | 71,433 | |
Total | | 788,655 | | | | 841,947 | | | | 1,669,993 | | | | 1,880,827 | |
| | | | | | | | | | | |
Consumer Products | | 147,738 | | | | 153,795 | | | | 297,151 | | | | 342,497 | |
Building Products | | 122,954 | | | | 141,671 | | | | 256,822 | | | | 291,994 | |
Sustainable Energy Solutions | | 27,537 | | | | 38,128 | | | | 56,174 | | | | 68,888 | |
| | | | | | | | | | | |
Other | | 34 | | | | - | | | | 34 | | | | - | |
Total | $ | 1,086,918 | | | $ | 1,175,541 | | | $ | 2,280,174 | | | $ | 2,584,206 | |
With the exception of toll processing, net sales are recognized at the point in time the performance obligation is satisfied and control is transferred to the customer, typically upon shipment or delivery.
The following table summarizes the unbilled receivables at the dates indicated:
| | | | | | | | | |
| | | November 30, | | | May 31, | |
(In thousands) | Balance Sheet Classification | | 2023 | | | 2023 | |
Unbilled receivables | Receivables | | $ | 4,148 | | | $ | 3,708 | |
There were no contract assets at November 30, 2023 or at May 31, 2023.
7
Table of Contents
Note D – Investments in Unconsolidated Affiliates
Investments in affiliated companies that we do not control, either through majority ownership or otherwise, are accounted for using the equity method and included the following at November 30, 2023: Clarkwestern Dietrich Building Systems LLC (“ClarkDietrich”) (25%); Serviacero Planos, S. de R. L. de C.V. (“Serviacero Worthington”) (50%); Taxi Workhorse Holdings, LLC (“Workhorse”) (20%); and Worthington Armstrong Venture (“WAVE”) (50%).
We also held a 50% noncontrolling equity interest in ArtiFlex Manufacturing, LLC (“ArtiFlex”), through August 3, 2022, when it was purchased by the unrelated joint venture partner. In connection with this transaction, we received net cash proceeds of approximately $36,095 and realized a pre-tax loss of $15,759 within equity income, representing the amount by which the book value of our investment exceeded the net cash proceeds.
During the second quarter of fiscal 2024, we recognized a pre-tax gain of $2,780 within equity income, representing our portion of the overall gain realized in connection with the sale of Workhorse’s operations in Brazil.
We received distributions from unconsolidated affiliates totaling $104,008 during the six months ended November 30, 2023. We have received cumulative distributions from WAVE in excess of our investment balance amounting to $118,465 and $117,297, respectively, at November 30, 2023 and May 31, 2023, which are presented separately within long-term liabilities in our consolidated balance sheets. We will continue to record our equity in the net income of WAVE as a debit to the investment account, and if the investment balance becomes positive, it will again be shown as an asset on our consolidated balance sheets. If it becomes probable that any excess distribution may not be returned (upon joint venture liquidation or otherwise), we will recognize any negative investment balance classified as a liability as income immediately.
We use the “cumulative earnings” approach for determining cash flow presentation of distributions from our unconsolidated joint ventures. Distributions received are included in our consolidated statements of cash flows as operating activities, unless the cumulative distributions exceed our portion of the cumulative equity in the net earnings of the joint venture, in which case the excess distributions are deemed to be returns of the investment and are classified as investing activities in our consolidated statements of cash flows. During the second quarter of fiscal 2024, we classified $1,085 of dividends received from WAVE as an investing activity.
The following tables summarize combined financial information for our unconsolidated affiliates as of the dates, and for the periods presented:
| | | | | | | |
| November 30, | | | May 31, | |
(In thousands) | 2023 | | | 2023 | |
Cash and cash equivalents | $ | 37,728 | | | $ | 49,185 | |
Other current assets | | 871,945 | | | | 899,913 | |
Noncurrent assets | | 372,258 | | | | 394,468 | |
Total assets | $ | 1,281,931 | | | $ | 1,343,566 | |
| | | | | |
Current liabilities | | 282,320 | | | | 247,796 | |
Current maturities of long-term debt | | - | | | | 36,936 | |
Long-term debt | | 349,323 | | | | 349,215 | |
Other noncurrent liabilities | | 138,566 | | | | 144,649 | |
Equity | | 511,722 | | | | 564,970 | |
Total liabilities and equity | $ | 1,281,931 | | | $ | 1,343,566 | |
| | | | | | | | | | | | | | |
| Three Months Ended | | Six Months Ended | |
| November 30, | | November 30, | |
(In thousands) | 2023 | | | 2022 | | 2023 | | | 2022 | |
Net sales | $ | 676,875 | | | $ | 711,665 | | $ | 1,397,308 | | | $ | 1,535,607 | |
Gross margin | | 166,939 | | | | 147,299 | | | 361,247 | | | | 328,704 | |
Operating income | | 134,120 | | | | 107,356 | | | 283,529 | | | | 245,183 | |
Depreciation and amortization | | 8,303 | | | | 6,864 | | | 16,946 | | | | 15,052 | |
Interest expense | | 4,538 | | | | 3,910 | | | 10,277 | | | | 6,590 | |
Income tax expense | | 6,708 | | | | 1,262 | | | 8,354 | | | | 3,372 | |
Net earnings | | 122,670 | | | | 105,183 | | | 266,236 | | | | 238,421 | |
8
Table of Contents
Note E – Impairment of Long-Lived Assets
During the first quarter of fiscal 2023, we committed to plans to liquidate certain fixed assets at the Samuel joint venture’s toll processing facility in Cleveland, Ohio. In accordance with the applicable accounting guidance, the net assets were recorded at the lower of net book value or fair market value less costs to sell resulting in a pre-tax impairment charge of $312.
During the first quarter of fiscal 2024, we lowered our estimate of fair value less costs to sell to reflect the expected scrap value of the equipment, to $150, resulting in a pre-tax impairment charge of $1,401.
Note F – Restructuring and Other Expenses (Income), Net
We consider restructuring activities to be programs whereby we fundamentally change our operations, such as divestitures, closing or consolidating facilities, employee severance (including rationalizing headcount or other significant changes in personnel), and realignment of existing operations (including changes to management structure in response to underlying performance and/or changing market conditions).
We made severance payments of $141, primarily associated with a prior restructuring initiative in the Building Products operating segment during the six months ended November 30, 2023. As a result, there were no liabilities associated with our restructuring activities at November 30, 2023.
Restructuring and other income, net for the six months ended November 30, 2022 of $5,382 resulted primarily from the sale of the remaining real property of our former oil and gas equipment business on June 14, 2022, for net cash proceeds of $5,775, and the sale of WSP on October 31, 2022. The sale resulted in net cash proceeds of $21,277, which resulted in a pre-tax gain of $3,926.
Note G – Contingent Liabilities and Commitments
Legal Proceedings
We are defendants in certain legal actions. In the opinion of management, the outcome of these actions, which is not clearly determinable at the present time, would not significantly affect our consolidated financial position or future results of operations. We also believe that environmental issues will not have a material effect on our capital expenditures, consolidated financial position or future results of operations.
Note H – Guarantees
We do not have guarantees that we believe are reasonably likely to have a material current or future effect on our consolidated financial condition, changes in financial condition, revenues or expenses, results of operations, liquidity, capital expenditures or capital resources. However, at November 30, 2023, we were party to an operating lease for an aircraft in which we have guaranteed a residual value at the termination of the lease on March 30, 2028. The maximum obligation under the terms of this guarantee was approximately $16,143 at November 30, 2023. Based on current facts and circumstances, we have estimated the likelihood of payment pursuant to this guarantee is not probable and, therefore, no amount has been recognized in our consolidated financial statements.
At November 30, 2023, we also had in place $12,137 of outstanding stand-by letters of credit issued to third-party service providers. The fair value of these guarantees, based on premiums paid, was not material and no amounts were drawn against them at November 30, 2023.
9
Table of Contents
Note I – Debt and Receivables Securitization
The following table summarizes our long-term debt and short-term borrowings outstanding at November 30, 2023 and May 31, 2023:
| | | | | | |
| November 30, | | May 31, | |
(In thousands) | 2023 | | 2023 | |
Short-term borrowings | $ | 175,000 | | $ | 2,813 | |
4.60% senior notes due August 10, 2024 | | 150,000 | | | 150,000 | |
4.55% senior notes due April 15, 2026 | | - | | | 243,623 | |
4.30% senior notes due August 1, 2032 | | 200,000 | | | 200,000 | |
1.56% Series A senior note due August 23, 2031 | | 39,962 | | | 39,226 | |
1.90% Series B senior notes due August 23, 2034 | | 59,887 | | | 58,786 | |
Other | | 402 | | | 528 | |
Total debt | | 625,251 | | | 694,976 | |
Unamortized discount and debt issuance costs | | (1,433 | ) | | (2,181 | ) |
Total debt, net | | 623,818 | | | 692,795 | |
Less: current maturities and short-term borrowings | | 325,269 | | | 3,077 | |
Total long-term debt | $ | 298,549 | | $ | 689,718 | |
Maturities of long-term debt and short-term borrowings in fiscal 2024 year and the four fiscal years thereafter, are as follows:
| | | |
(In thousands) | | |
2024 (1) | $ | 175,133 | |
2025 | | 150,269 | |
2026 | | - | |
2027 | | - | |
2028 | | - | |
Thereafter | | 299,849 | |
Total | $ | 625,251 | |
(1)Includes $175,000 associated with the Worthington Steel Credit Facility (as defined below). Subsequent to the Separation on December 1, 2023, we have no remaining obligation. See the “Other Financing Arrangements” section below for additional information.
Long-Term Debt
On April 15, 2014, we issued senior unsecured notes in the principal amount of $250,000, which bear interest at a rate of 4.55% and were scheduled to mature on April 15, 2026 (the “2026 Notes”). During fiscal 2023, we purchased approximately $6,377 of the principal amount of the 2026 Notes in open market transactions, leaving $243,623 within long-term debt at May 31, 2023. On June 29, 2023, we notified the trustee under the indenture to which the 2026 Notes are subject that we had elected to redeem in full the 2026 Notes. On July 28, 2023, we redeemed, in full, the 2026 Notes at a price that approximated the par value of the debt of $243,623. In connection with the debt redemption, we recognized a non-cash loss of $1,534 related primarily to unamortized debt issuance costs and amounts deferred in accumulated other comprehensive income (“AOCI”) associated with an interest rate swap executed prior to the issuance of the 2026 Notes.
Other Financing Arrangements
On November 30, 2023, Worthington Steel entered into a five-year senior secured revolving credit facility (the “Worthington Steel Credit Facility”) with a group of lenders. The Worthington Steel Credit Facility will allow for borrowings of up to $550,000, to the extent secured by eligible accounts receivable and inventory balances at period end, which consist primarily of U.S. Dollar denominated account balances. Amounts drawn under the Worthington Steel Credit Facility have maturities of up to one year and accrue interest at rates equal to an applicable margin over the SOFR Rate. In order to facilitate the post-separation capital structure of each company, $175,000 was drawn on the Worthington Steel Credit Facility immediately prior to the Separation. See “Note S – Subsequent Events” for further information.
We maintain a $500,000 unsecured revolving credit facility (the “Credit Facility”) with a group of lenders. On September 27, 2023, we amended and restated the Credit Facility, extending the final maturity from August 20, 2026 to September 27, 2028 while keeping in place the $500,000 aggregate commitments under the Credit Facility in anticipation of the Separation. Borrowings under the Credit
10
Table of Contents
Facility have maturities of up to one year. We have the option to borrow at rates equal to an applicable margin over the Simple SOFR Rate, the Prime Rate of PNC Bank, National Association or the Overnight Bank Funding Rate. The applicable margin is determined by our Total Leverage Ratio. There were no borrowings outstanding under the Credit Facility at November 30, 2023, leaving $500,000 available for use.
On May 19, 2022, we entered into a five-year revolving trade accounts receivable securitization facility (“AR Facility”) that allowed for short-term borrowings of up to $175,000 through the factoring and subsequent sale, on a revolving basis, of eligible accounts receivable of certain of our subsidiaries to Worthington Receivables Company, LLC, a wholly-owned, consolidated, bankruptcy-remote indirect subsidiary. On June 29, 2023, we elected to terminate the AR Facility. No early termination or other similar fees or penalties were paid in connection with the termination.
Note J – Other Comprehensive Income (Loss)
The following table summarizes the tax effects on each component of OCI for the periods presented:
| | | | | | | | | | | | | | | | | | | | | | | |
| Three Months Ended | |
| November 30, 2023 | | | November 30, 2022 | |
(In thousands) | Before-Tax | | | Tax | | | Net-of-Tax | | | Before-Tax | | | Tax | | | Net-of-Tax | |
Foreign currency translation | $ | 843 | | | $ | 54 | | | $ | 897 | | | $ | 550 | | | $ | 308 | | | $ | 858 | |
Pension liability adjustment | | - | | | | - | | | | - | | | | 15 | | | | (97 | ) | | | (82 | ) |
Cash flow hedges | | 17,390 | | | | (3,841 | ) | | | 13,549 | | | | (5,665 | ) | | | 1,665 | | | | (4,000 | ) |
Other comprehensive income (loss) | $ | 18,233 | | | $ | (3,787 | ) | | $ | 14,446 | | | $ | (5,100 | ) | | $ | 1,876 | | | $ | (3,224 | ) |
| | | | | | | | | | | | | | | | | | | | | | | |
| Six Months Ended | |
| November 30, 2023 | | | November 30, 2022 | |
(In thousands) | Before-Tax | | | Tax | | | Net-of-Tax | | | Before-Tax | | | Tax | | | Net-of-Tax | |
Foreign currency translation | $ | 2,170 | | | $ | 172 | | | $ | 2,342 | | | $ | (8,970 | ) | | $ | (273 | ) | | $ | (9,243 | ) |
Pension liability adjustment | | - | | | | (3 | ) | | | (3 | ) | | | 3,740 | | | | (883 | ) | | | 2,857 | |
Cash flow hedges | | 8,578 | | | | (1,879 | ) | | | 6,699 | | | | (22,762 | ) | | | 5,462 | | | | (17,300 | ) |
Other comprehensive income (loss) | $ | 10,748 | | | $ | (1,710 | ) | | $ | 9,038 | | | $ | (27,992 | ) | | $ | 4,306 | | | $ | (23,686 | ) |
Note K – Changes in Equity
The following tables summarize the changes in equity by component and in total for the periods presented:
| | | | | | | | | | | | | | | | | | | | | | | | |
| | Controlling Interest | | | | | | | |
| | | | | Accumulated | | | | | | | | | | | | | |
| | | | | Other | | | | | | | | | | | | | |
| | Additional | | | Comprehensive | | | | | | | | | Non- | | | | |
| | Paid-in | | | Income (Loss), | | | Retained | | | | | | controlling | | | | |
(In thousands) | | Capital | | | Net of Tax | | | Earnings | | | Subtotal | | | Interests | | | Total | |
Balance at May 31, 2023 | | $ | 290,799 | | | $ | (23,179 | ) | | $ | 1,428,391 | | | $ | 1,696,011 | | | $ | 125,617 | | | $ | 1,821,628 | |
Net earnings | | | - | | | | - | | | | 96,106 | | | | 96,106 | | | | 3,597 | | | | 99,703 | |
Other comprehensive loss | | | - | | | | (5,408 | ) | | | - | | | | (5,408 | ) | | | - | | | | (5,408 | ) |
Common shares issued, net of withholding tax | | | (5,130 | ) | | | - | | | | - | | | | (5,130 | ) | | | - | | | | (5,130 | ) |
Common shares in non-qualified plans | | | 130 | | | | - | | | | - | | | | 130 | | | | - | | | | 130 | |
Stock-based compensation | | | 8,995 | | | | - | | | | - | | | | 8,995 | | | | - | | | | 8,995 | |
Cash dividends declared | | | - | | | | - | | | | (16,081 | ) | | | (16,081 | ) | | | - | | | | (16,081 | ) |
Dividends to noncontrolling interests | | | - | | | | - | | | | - | | | | - | | | | (1,921 | ) | | | (1,921 | ) |
Balance at August 31, 2023 | | $ | 294,794 | | | $ | (28,587 | ) | | $ | 1,508,416 | | | $ | 1,774,623 | | | $ | 127,293 | | | $ | 1,901,916 | |
Net earnings | | | - | | | | - | | | | 24,302 | | | | 24,302 | | | | 3,865 | | | | 28,167 | |
Other comprehensive income | | | - | | | | 14,446 | | | | - | | | | 14,446 | | | | - | | | | 14,446 | |
Common shares issued, net of withholding tax | | | (9,207 | ) | | | - | | | | - | | | | (9,207 | ) | | | - | | | | (9,207 | ) |
Common shares in non-qualified plans | | | 195 | | | | - | | | | - | | | | 195 | | | | - | | | | 195 | |
Stock-based compensation | | | 4,511 | | | | - | | | | - | | | | 4,511 | | | | - | | | | 4,511 | |
Cash dividends declared | | | - | | | | - | | | | (16,061 | ) | | | (16,061 | ) | | | - | | | | (16,061 | ) |
Balance at November 30, 2023 | | $ | 290,293 | | | $ | (14,141 | ) | | $ | 1,516,657 | | | $ | 1,792,809 | | | $ | 131,158 | | | $ | 1,923,967 | |
11
Table of Contents
| | | | | | | | | | | | | | | | | | | | | | | | |
| | Controlling Interest | | | | | | | |
| | | | | Accumulated | | | | | | | | | | | | | |
| | | | | Other | | | | | | | | | | | | | |
| | Additional | | | Comprehensive | | | | | | | | | Non- | | | | |
| | Paid-in | | | Income (Loss), | | | Retained | | | | | | controlling | | | | |
(In thousands) | | Capital | | | Net of Tax | | | Earnings | | | Subtotal | | | Interests | | | Total | |
Balance at May 31, 2022 | | $ | 273,439 | | | $ | (22,850 | ) | | $ | 1,230,163 | | | $ | 1,480,752 | | | $ | 133,210 | | | $ | 1,613,962 | |
Net earnings | | | - | | | | - | | | | 64,082 | | | | 64,082 | | | | 1,162 | | | | 65,244 | |
Other comprehensive loss | | | - | | | | (20,462 | ) | | | - | | | | (20,462 | ) | | | - | | | | (20,462 | ) |
Common shares issued, net of withholding tax | | | (3,466 | ) | | | - | | | | - | | | | (3,466 | ) | | | - | | | | (3,466 | ) |
Common shares in non-qualified plans | | | 136 | | | | - | | | | - | | | | 136 | | | | - | | | | 136 | |
Stock-based compensation | | | 6,976 | | | | - | | | | - | | | | 6,976 | | | | - | | | | 6,976 | |
Cash dividends declared | | | - | | | | - | | | | (15,418 | ) | | | (15,418 | ) | | | - | | | | (15,418 | ) |
Balance at August 31, 2022 | | $ | 277,085 | | | $ | (43,312 | ) | | $ | 1,278,827 | | | $ | 1,512,600 | | | $ | 134,372 | | | $ | 1,646,972 | |
Net earnings | | | - | | | | - | | | | 16,218 | | | | 16,218 | | | | 3,287 | | | | 19,505 | |
Other comprehensive loss | | | - | | | | (3,224 | ) | | | - | | | | (3,224 | ) | | | - | | | | (3,224 | ) |
Common shares issued, net of withholding tax | | | (649 | ) | | | - | | | | - | | | | (649 | ) | | | - | | | | (649 | ) |
Common shares in non-qualified plans | | | 298 | | | | - | | | | - | | | | 298 | | | | - | | | | 298 | |
Stock-based compensation | | | 3,620 | | | | - | | | | - | | | | 3,620 | | | | - | | | | 3,620 | |
Cash dividends declared | | | - | | | | - | | | | (15,470 | ) | | | (15,470 | ) | | | - | | | | (15,470 | ) |
Dividends to noncontrolling interests | | | - | | | | - | | | | - | | | | - | | | | (11,760 | ) | | | (11,760 | ) |
Balance at November 30, 2022 | | $ | 280,354 | | | $ | (46,536 | ) | | $ | 1,279,575 | | | $ | 1,513,393 | | | $ | 125,899 | | | $ | 1,639,292 | |
The following table summarizes the changes in accumulated OCI for the periods presented:
| | | | | | | | | | | | | | | | |
| | | | | | | | | | | Accumulated | |
| | Foreign | | | Pension | | | | | | Other | |
| | Currency | | | Liability | | | Cash Flow | | | Comprehensive | |
(In thousands) | | Translation | | | Adjustment | | | Hedges | | | Loss | |
Balance at May 31, 2023 | | $ | (22,123 | ) | | $ | (1,730 | ) | | $ | 674 | | | $ | (23,179 | ) |
Other comprehensive income before reclassifications | | | 2,170 | | | | - | | | | 12,947 | | | | 15,117 | |
Reclassification adjustments to net earnings (a) | | | - | | | | - | | | | (4,369 | ) | | | (4,369 | ) |
Income tax effect | | | 172 | | | | (3 | ) | | | (1,879 | ) | | | (1,710 | ) |
Balance at November 30, 2023 | | $ | (19,781 | ) | | $ | (1,733 | ) | | $ | 7,373 | | | $ | (14,141 | ) |
| | | | | | | | | | | | | | | | |
| | | | | | | | | | | Accumulated | |
| | Foreign | | | Pension | | | | | | Other | |
| | Currency | | | Liability | | | Cash Flow | | | Comprehensive | |
(In thousands) | | Translation | | | Adjustment | | | Hedges | | | Loss | |
Balance at May 31, 2022 | | $ | (15,310 | ) | | $ | (6,244 | ) | | $ | (1,296 | ) | | $ | (22,850 | ) |
Other comprehensive loss before reclassifications | | | (8,970 | ) | | | (1,034 | ) | | | (36,041 | ) | | | (46,045 | ) |
Reclassification adjustments to net earnings (a)(b) | | | - | | | | 4,774 | | | | 13,279 | | | | 18,053 | |
Income tax effect | | | (273 | ) | | | (883 | ) | | | 5,462 | | | | 4,306 | |
Balance at November 30, 2022 | | $ | (24,553 | ) | | $ | (3,387 | ) | | $ | (18,596 | ) | | $ | (46,536 | ) |
12
Table of Contents
The consolidated statement of earnings classification of amounts reclassified to net income include:
(a)Cash flow hedges – See the disclosure in “Note Q – Derivative Financial Instruments and Hedging Activities;” and
(b)Pension liability adjustment – Reflects a non-cash settlement charge of $4,774 recognized in connection with a pension lift-out transaction completed in August 2022 for The Gerstenslager Company Bargaining Unit Employees’ Pension Plan.
Note L – Stock-Based Compensation
Non-Qualified Stock Options
During the six months ended November 30, 2023, we granted non-qualified stock options covering a total of 54 common shares, no par value, of Worthington Enterprises (the “common shares”) under our stock-based compensation plans. The exercise price of $69.47 per share for the non-qualified stock options granted in fiscal 2024 is equal to the closing market price of the underlying common shares on the grant date. The fair value of these non-qualified stock options, based on the Black-Scholes option-pricing model, calculated at the grant date, was $25.95 per share. The calculated pre-tax stock-based compensation expense for these non-qualified stock options was $1,401 and will be recognized on a straight-line basis over the three-year vesting period, net of any forfeitures. The following assumptions were used to value these non-qualified stock options:
| | | | |
Dividend yield | | | 2.39 | % |
Expected volatility | | | 43.00 | % |
Risk-free interest rate | | | 4.05 | % |
Expected term (years) | | | 6.0 | |
Expected volatility is based on the historical volatility of the common shares and the risk-free interest rate is based on the U.S. Treasury strip rate for the expected term of the non-qualified stock options. The expected term was developed using historical exercise experience.
Service-Based Restricted Common Shares
During the six months ended November 30, 2023, we granted an aggregate of 176 service-based restricted common shares under our stock-based compensation plans, which cliff vest three years from the grant date. The fair value of these restricted common shares was equal to the weighted average closing market price of the underlying common shares on the grant date, or $65.97 per share. The calculated pre-tax stock-based compensation expense for these restricted common shares was $11,640 and will be recognized on a straight-line basis over the three-year service-based vesting period, net of any forfeitures.
Performance Share Awards
We have awarded performance shares to certain key employees under our stock-based compensation plans. These performance shares are earned based on the level of achievement with respect to corporate targets for cumulative corporate economic value added, earnings per share growth and, in the case of business unit executives, a business unit adjusted earnings before interest and taxes (“adjusted EBIT”) target, in each case for the three-year periods ending May 31, 2024, 2025 and 2026. These performance share awards will be paid, to the extent earned, in common shares in the fiscal quarter following the end of the applicable three-year performance period. The fair values of our performance shares are determined by the closing market prices of the underlying common shares at the respective grant dates of the performance shares and the pre-tax stock-based compensation expense is based on our periodic assessment of the probability of the targets being achieved and our estimate of the number of common shares that will ultimately be issued. During the six months ended November 30, 2023, we granted performance share awards covering an aggregate of 47 common shares (at target levels). The calculated pre-tax stock-based compensation expense for these performance shares is $3,235 (at target levels). The ultimate pre-tax stock-based compensation expense to be recognized over the three-year performance period on all tranches will vary based on our periodic assessment of the probability of the targets being achieved.
Note M – Income Taxes
Income tax expense for the three months ended November 30, 2023 and November 30, 2022 reflected estimated annual effective income tax rates of 23.4% and 23.7%, respectively, and excluded any impact from the net earnings attributable to noncontrolling interests in our consolidated statements of earnings. Net earnings attributable to noncontrolling interests are primarily a result of our WSP, Spartan, Samuel and TWB consolidated joint ventures. The net earnings attributable to the noncontrolling interests in our consolidated joint ventures’ U.S. operations do not generate tax expense to us since the investors in the consolidated joint ventures’ U.S. operations are taxed directly based on the earnings attributable to them. The tax expense of TWB’s wholly-owned foreign corporations is reported in our consolidated income tax expense. Management is required to estimate the annual effective income tax rate based upon its forecast
13
Table of Contents
of annual pre-tax income for domestic and foreign operations. Our actual effective income tax rate for fiscal 2024 could be materially different from the forecasted rate as of November 30, 2023.
Note N – Earnings per Share
The following table sets forth the computation of basic and diluted earnings per common share attributable to controlling interest for the periods presented:
| | | | | | | | | | | | | | | |
| Three Months Ended | | | Six Months Ended | |
| November 30, | | | November 30, | |
(In thousands, except per common share amounts) | 2023 | | | 2022 | | | 2023 | | | 2022 | |
Numerator (basic & diluted): | | | | | | | | | | | |
Net earnings attributable to controlling interest - | | | | | | | | | | | |
income available to common shareholders | $ | 24,302 | | | $ | 16,218 | | | $ | 120,409 | | | $ | 80,300 | |
Denominator: | | | | | | | | | | | |
Denominator for basic earnings per common share attributable to | | | | | | | | | | | |
controlling interest – weighted average common shares | | 49,186 | | | | 48,558 | | | | 49,013 | | | | 48,518 | |
Effect of dilutive securities | | 856 | | | | 772 | | | | 1,089 | | | | 775 | |
Denominator for diluted earnings per common share attributable to | | | | | | | | | | | |
controlling interest – adjusted weighted average common shares | | 50,042 | | | | 49,330 | | | | 50,102 | | | | 49,293 | |
| | | | | | | | | | | |
Basic earnings per common share attributable to controlling interest | $ | 0.49 | | | $ | 0.33 | | | $ | 2.46 | | | $ | 1.66 | |
Diluted earnings per common share attributable to controlling interest | $ | 0.49 | | | $ | 0.33 | | | $ | 2.40 | | | $ | 1.63 | |
Non-qualified stock options covering 58 and 138 common shares for the three months ended November 30, 2023 and November 30, 2022, respectively, and 46 and 127 common shares six months ended November 30, 2023 and November 30, 2022, respectively have been excluded from the computation of diluted earnings per common share because the effect would have been anti-dilutive for those periods.
Note O – Segment Operations
Our operations are managed principally on a products and services basis. Factors used to identify reportable segments include the nature of the products and services provided by each business, the management reporting structure, similarity of economic characteristics and certain quantitative measures, as prescribed by authoritative accounting guidance. As of November 30, 2023, our operations were organized under four operating segments: Steel Processing, Consumer Products, Building Products, and Sustainable Energy Solutions. As none of the operating segments were aggregated for segment reporting purposes, they corresponded with the reportable segments.
Segment information is prepared on the same basis that our chief operating decision maker (“CODM”), as defined in the accounting literature, reviews financial information for operational decision-making purposes. Factors used to identify operating segments include the nature of the products and services provided by each business, the management reporting structure, the similarity of economic characteristics and certain quantitative measures, as prescribed by authoritative accounting guidance.
We have identified our Chief Executive Officer as our CODM. Our CODM assesses segment operating performance and allocates resources based on the profitability measure of adjusted EBIT. Adjusted EBIT excludes impairment and restructuring expense (income), but may also exclude other items, as described in the tables below, that management believes are not reflective of, and thus should not be included when evaluating the performance of our ongoing operations. Adjusted EBIT is a non-GAAP financial measure and is used by management to evaluate operating segment performance, engage in financial and operational planning and determine incentive compensation.
Impairment charges are excluded from adjusted EBIT because they do not occur in the ordinary course of our ongoing business operations, are inherently unpredictable in timing and amount, and are non-cash, so their exclusion facilitates the comparison of historical, current and forecasted financial results. Refer to “Note E – Impairment of Long-Lived Assets” for additional information.
Restructuring activities consist of established programs that are not part of our ongoing operations, such as divestitures, closing or consolidating facilities, employee severance (including rationalizing headcount or other significant changes in personnel), and realignment of existing operations (including changes to management structure in response to underlying performance and/or changing market conditions). Refer to “Note F – Restructuring and Other Expense (Income), Net” for additional information.
14
Table of Contents
The following table presents summarized financial information for our reportable segments for the periods indicated.
| | | | | | | | | | | | | | | | | | | | | | |
| Three Months Ended November 30, 2023 | |
(In thousands) | Steel Processing | | | Consumer Products | | | Building Products | | Sustainable Energy Solutions | | | Other | | | Consolidated | |
Net sales | $ | 788,655 | | | $ | 147,738 | | | $ | 122,954 | | $ | 27,537 | | | $ | 34 | | | $ | 1,086,918 | |
Restructuring and other expense, net | | - | | | | - | | | | - | | | - | | | | 6 | | | | 6 | |
Separation costs | | - | | | | - | | | | - | | | - | | | | 21,952 | | | | 21,952 | |
Miscellaneous income (expense), net | | 306 | | | | 12 | | | | 235 | | | 557 | | | | (90 | ) | | | 1,020 | |
Equity income | | 3,778 | | | | - | | | | 35,177 | | | - | | | | 3,491 | | | | 42,446 | |
Adjusted EBIT (1) | | 6,762 | | | | 9,510 | | | | 40,284 | | | (2,617 | ) | | | (1,090 | ) | | | 52,849 | |
(1)Excludes the following items in addition to impairment and restructuring activity:
•Direct and incremental costs associated with the Separation as discussed in “Note A – Basis of Presentation”; and
•Our share of the pre-tax gain realized by Workhorse in connection with the sale of the joint venture’s operations in Brazil of $2,780;
| | | | | | | | | | | | | | | | | | | | | | |
| Three Months Ended November 30, 2022 | |
(In thousands) | Steel Processing | | | Consumer Products | | | Building Products | | Sustainable Energy Solutions | | | Other | | | Consolidated | |
Net sales | $ | 841,947 | | | $ | 153,795 | | | $ | 141,671 | | $ | 38,128 | | | $ | - | | | $ | 1,175,541 | |
Restructuring and other income, net | | (4,282 | ) | | | - | | | | - | | | - | | | | - | | | | (4,282 | ) |
Separation costs | | - | | | | - | | | | - | | | - | | | | 9,246 | | | | 9,246 | |
Miscellaneous income (expense), net | | 850 | | | | (47 | ) | | | 76 | | | 142 | | | | 384 | | | | 1,405 | |
Equity income | | 1,906 | | | | - | | | | 35,107 | | | - | | | | (156 | ) | | | 36,857 | |
Adjusted EBIT (2) | | (17,249 | ) | | | 13,473 | | | | 41,224 | | | 1,143 | | | | (3,291 | ) | | | 35,300 | |
(2)Excludes the following items in addition to impairment and restructuring activity:
•Direct and incremental costs associated with the Separation as discussed in “Note A – Basis of Presentation”;
•Incremental compensation expense of $525 within Consumer Products related to the earnout for the acquisition of Level5 Tools, LLC (“Level5”); and
•Noncontrolling interest portion of impairment of long-lived assets of $1,850 within Steel Processing.
| | | | | | | | | | | | | | | | | | | | | | |
| Six Months Ended November 30, 2023 | |
(in thousands) | Steel Processing | | | Consumer Products | | | Building Products | | Sustainable Energy Solutions | | | Other | | | Consolidated | |
Net sales | $ | 1,669,993 | | | $ | 297,151 | | | $ | 256,822 | | $ | 56,174 | | | $ | 34 | | | $ | 2,280,174 | |
Impairment of long-lived assets | | 1,401 | | | | - | | | | - | | | - | | | | - | | | | 1,401 | |
Restructuring and other expense, net | | - | | | | - | | | | - | | | - | | | | 6 | | | | 6 | |
Separation costs | | - | | | | - | | | | - | | | - | | | | 27,987 | | | | 27,987 | |
Miscellaneous income (expense), net | | 1,018 | | | | 43 | | | | 292 | | | 838 | | | | (160 | ) | | | 2,031 | |
Loss on extinguishment of debt | | - | | | | - | | | | - | | | - | | | | (1,534 | ) | | | (1,534 | ) |
Equity income | | 12,735 | | | | - | | | | 80,219 | | | - | | | | 3,873 | | | | 96,827 | |
Adjusted EBIT (3) | | 84,762 | | | | 18,502 | | | | 94,300 | | | (7,339 | ) | | | (959 | ) | | | 189,266 | |
15
Table of Contents
(3)Excludes the following in addition to impairment and restructuring activity:
•Direct and incremental costs associated with the Separation as discussed in “Note A – Basis of Presentation”;
•The pre-tax loss on extinguishment of debt resulting from the redemption of the 2026 Notes, in full, on July 28, 2023; and
•Noncontrolling interest portion of impairment of long-lived assets of $519 within Steel Processing.
| | | | | | | | | | | | | | | | | | | | | | |
| Six Months Ended November 30, 2022 | |
(in thousands) | Steel Processing | | | Consumer Products | | | Building Products | | Sustainable Energy Solutions | | | Other | | | Consolidated | |
Net sales | $ | 1,880,827 | | | $ | 342,497 | | | $ | 291,994 | | $ | 68,888 | | | $ | - | | | $ | 2,584,206 | |
Impairment of long-lived assets | | 312 | | | | - | | | | - | | | - | | | | - | | | | 312 | |
Restructuring and other income, net | | (4,205 | ) | | | - | | | | - | | | - | | | | (1,177 | ) | | | (5,382 | ) |
Separation costs | | - | | | | - | | | | - | | | - | | | | 9,246 | | | | 9,246 | |
Miscellaneous income (expense), net | | 1,035 | | | | (82 | ) | | | 299 | | | 56 | | | | (4,989 | ) | | | (3,681 | ) |
Equity income | | 3,676 | | | | - | | | | 78,973 | | | - | | | | (14,080 | ) | | | 68,569 | |
Adjusted EBIT (4) | | 17,663 | | | | 34,406 | | | | 93,959 | | | (250 | ) | | | 1,854 | | | | 147,632 | |
(4)Excludes the following in addition to impairment and restructuring activity:
•Direct and incremental costs associated with the Separation as discussed in “Note A – Basis of Presentation.”
•A non-cash settlement charge of $4,774 in miscellaneous income (expense), net within Other related to the pension lift-out transaction associated with the Gerstenslager Company Bargaining Unit Employees’ Pension Plan;
•A loss of $15,759 within equity income related to the August 31, 2022, sale of our 50% noncontrolling interest in ArtiFlex;
•Incremental compensation expense of $1,050 within Consumer Products related to the Level5 earnout agreement; and
•Noncontrolling interest portion of the restructuring gain within Steel processing of $1,734 within Steel Processing.
Total assets for each of our reportable segments at the dates indicated were as follows:
| | | | | | | |
| November 30, | | | May 31, | |
(In thousands) | 2023 | | | 2023 | |
Total assets | | | | | |
Steel Processing | $ | 1,834,226 | | | $ | 1,758,981 | |
Consumer Products | | 622,304 | | | | 615,430 | |
Building Products | | 611,771 | | | | 635,650 | |
Sustainable Energy Solutions | | 103,448 | | | | 129,872 | |
Other | | 412,388 | | | | 510,985 | |
Total assets | $ | 3,584,137 | | | $ | 3,650,918 | |
Note P – Acquisitions
Tempel Steel Europe GmbH
On November 16, 2023, the Company acquired Voestalpine Automotive Components Nagold GmbH & Co. KG, a facility in Nagold, Germany for net cash consideration of $21,013 and the assumption of a $929 pension liability. The business, which will operate as Tempel Steel Europe GmbH (Tempel Steel Europe), provides automotive and electrical steel lamination stamping in Europe. The total purchase consideration was allocated primarily to tangible assets, consisting of $12,282 of property, plant and equipment and $9,069 of net working capital, with the residual recognized as goodwill.
The information included herein has been prepared based on the preliminary allocation of the purchase price using estimates of the fair value and useful lives of the assets acquired. The purchase price allocation is subject to further adjustment until all pertinent information regarding the assets acquired is fully evaluated by the Company.
16
Table of Contents
The purchase price includes the fair values of other assets that were not identifiable, not separately recognizable under accounting rules (e.g., assembled workforce) or of immaterial value. The purchase price also includes strategic benefits specific to us, which resulted in a purchase price in excess of the fair value of the identifiable net assets. The goodwill resulting from the acquisition equaled approximately $591 and will be deductible for income tax purposes.
The results of operations have been included in our combined statements of earnings since the date of acquisition. Proforma results, including the acquired business since the beginning of fiscal 2023, would not be materially different from the reported results.
Level5 Tools, LLC
On June 2, 2022, we acquired Level5, a leading provider of drywall tools and related accessories. The total purchase price was $59,321, including $2,000 attributed to an earnout agreement with the selling shareholders, that provides for up to an additional $25,000 of cash consideration should certain earnings targets be met annually through calendar year 2024. The earnout agreement also requires continued employment of a selling shareholder during the duration of the earnout period. Accordingly, payments to this key employee, to the extent earned, will be accounted for as post-combination compensation expense. As of November 30, 2023, no amounts were accrued as compensation expense for anticipated payments under the second earnout period ending December 31, 2023.
Level5 is being operated as part of the Consumer Products operating segment and its results have been included in our consolidated statements of earnings since the date of acquisition. Proforma results, including the acquired business since the beginning of fiscal 2022, would not be materially different from the reported results.
The assets acquired and liabilities assumed were recognized at their estimated acquisition-date fair values, with goodwill representing the excess of the purchase price over the fair value of the net identifiable assets acquired. In connection with the acquisition of Level5, we identified and valued the following intangible assets:
| | | | | | |
(In thousands) | | | | | |
Category | | Amount | | | Useful Life (Years) |
Trade name | | $ | 13,500 | | | Indefinite |
Customer relationships | | | 13,300 | | | 10 |
Technological know-how | | | 6,500 | | | 20 |
Non-compete agreement | | | 280 | | | 3 |
Total acquired identifiable intangible assets | | $ | 33,580 | | | |
The purchase price includes the fair values of other assets that were not identifiable, not separately recognizable under accounting rules (e.g., assembled workforce) or of immaterial value. The purchase price also includes strategic and synergistic benefits (investment value) specific to us, which resulted in a purchase price in excess of the fair value of the identifiable net assets. This additional investment value resulted in goodwill which will be deductible for income tax purposes.
17
Table of Contents
The following table summarizes the consideration paid and the final fair value assigned to the assets and liabilities assumed at the acquisition date.
| | | | | | | | | | | | |
(In thousands) | | Preliminary
Valuation | | | Measurement
Period
Adjustments | | | Final
Valuation | |
Cash and cash equivalents | | $ | 1,515 | | | $ | - | | | $ | 1,515 | |
Accounts receivable | | | 2,860 | | | | - | | | | 2,860 | |
Inventories | | | 9,161 | | | | - | | | | 9,161 | |
Prepaid expenses | | | 64 | | | | - | | | | 64 | |
Property, plant and equipment | | | 273 | | | | - | | | | 273 | |
Intangible assets | | | 33,580 | | | | - | | | | 33,580 | |
Operating lease assets | | | 377 | | | | - | | | | 377 | |
Total identifiable assets | | | 47,830 | | | | - | | | | 47,830 | |
Accounts payable | | | (3,175 | ) | | | - | | | | (3,175 | ) |
Accrued expenses | | | (904 | ) | | | 151 | | | | (753 | ) |
Current operating lease liabilities | | | (111 | ) | | | - | | | | (111 | ) |
Noncurrent operating lease liabilities | | | (266 | ) | | | - | | | | (266 | ) |
Net identifiable assets | | | 43,374 | | | | 151 | | | | 43,525 | |
Goodwill | | | 15,947 | | | | - | | | | 15,947 | |
Total purchase price | | | 59,321 | | | | 151 | | | | 59,472 | |
Less: Fair value of earnout | | | (2,000 | ) | | | - | | | | (2,000 | ) |
Plus: Net working capital deficit | | | 282 | | | | (151 | ) | | | 131 | |
Cash purchase price | | $ | 57,603 | | | $ | - | | | $ | 57,603 | |
Note Q – Derivative Financial Instruments and Hedging Activities
We utilize derivative financial instruments to primarily manage exposure to certain risks related to our ongoing operations. The primary risks managed through the use of derivative financial instruments include interest rate risk, foreign currency exchange rate risk and commodity price risk. While certain of our derivative financial instruments are designated as hedging instruments, we also enter into derivative financial instruments that are designed to hedge a risk, but are not designated as hedging instruments and, therefore, do not qualify for hedge accounting. These derivative financial instruments are adjusted to current fair value through earnings at the end of each period.
Interest Rate Risk Management – We are exposed to the impact of interest rate changes. Our objective is to manage the impact of interest rate changes on cash flows and the market value of our borrowings. We utilize a mix of debt maturities along with both fixed-rate and variable-rate debt to manage changes in interest rates. In addition, we enter into interest rate swaps and treasury locks to further manage our exposure to interest rate variations related to our borrowings and to lower our overall borrowing costs.
Foreign Currency Exchange Rate Risk Management – We conduct business in several major international currencies and are, therefore, subject to risks associated with changing foreign currency exchange rates. We enter into various contracts that change in value as foreign currency exchange rates change to manage this exposure. Such contracts limit exposure to both favorable and unfavorable currency exchange rate fluctuations. The translation of foreign currencies into U.S. dollars also subjects us to exposure related to fluctuating currency exchange rates; however, derivative financial instruments are not used to manage this risk.
Commodity Price Risk Management – We are exposed to changes in the price of certain commodities, including steel, natural gas, copper, zinc and other raw materials, and our utility requirements. Our objective is to reduce earnings and cash flow volatility associated with forecasted purchases and sales of these commodities to allow management to focus its attention on business operations. Accordingly, we enter into derivative financial instruments to manage the associated price risk.
We are exposed to counterparty credit risk on all of our derivative financial instruments. Accordingly, we have established and maintain strict counterparty credit guidelines. We have credit support agreements in place with certain counterparties to limit our credit exposure. These agreements require either party to post cash collateral if its cumulative market position exceeds a predefined liability threshold. Amounts posted to the margin accounts accrue interest at market rates and are required to be refunded in the period in which the cumulative market position falls below the required threshold. We do not have significant exposure to any one counterparty, and management believes the overall risk of loss is remote and, in any event, would not be material.
18
Table of Contents
Refer to “Note R – Fair Value” for additional information regarding the accounting treatment for our derivative financial instruments, as well as how fair value is determined.
The following table summarizes the fair value of our derivative financial instruments and the respective lines in which they were recorded in the consolidated balance sheet at November 30, 2023:
| | | | | | | | | | | | |
| | Asset Derivatives | | | Liability Derivatives | |
| | Balance | | | | | Balance | | | |
| | Sheet | | Fair | | | Sheet | | Fair | |
(In thousands) | | Location | | Value | | | Location | | Value | |
Derivatives designated as hedging instruments: | | | | | | | | | | |
Commodity contracts | | Receivables | | $ | 12,498 | | | Accounts payable | | $ | 3,743 | |
| | Other assets | | | 47 | | | Other liabilities | | | - | |
| | | | | 12,545 | | | | | | 3,743 | |
| | | | | | | | | | |
Subtotals | | | | $ | 12,545 | | | | | $ | 3,743 | |
| | | | | | | | | | |
Derivatives not designated as hedging instruments: | | | | | | | | |
Commodity contracts | | Receivables | | $ | 2,476 | | | Accounts payable | | $ | 2,609 | |
| | Other assets | | | - | | | Other liabilities | | | 39 | |
Subtotals | | | | | 2,476 | | | | | | 2,648 | |
| | | | | | | | | | |
Total derivative financial instruments | | | | $ | 15,021 | | | | | $ | 6,391 | |
The amounts in the table above reflect the fair value of our derivative financial instruments on a net basis where allowable under master netting arrangements. Had these amounts been recognized on a gross basis, the impact would have been a $5,150 increase in receivables with a corresponding increase in accounts payable.
The following table summarizes the fair value of our derivative financial instruments and the respective lines in which they were recorded in the consolidated balance sheet at May 31, 2023:
| | | | | | | | | | | | |
| | Asset Derivatives | | | Liability Derivatives | |
| | Balance | | | | | Balance | | | |
| | Sheet | | Fair | | | Sheet | | Fair | |
(In thousands) | | Location | | Value | | | Location | | Value | |
Derivatives designated as hedging instruments: | | | | | | | | | | |
Commodity contracts | | Receivables | | $ | 20 | | | Accounts payable | | $ | 6,749 | |
| | Other assets | | | 51 | | | Other liabilities | | | 379 | |
| | | | | 71 | | | | | | 7,128 | |
| | | | | | | | | | |
Foreign currency exchange contracts | | Receivables | | | - | | | Accounts payable | | | 33 | |
| | | | | - | | | | | | 33 | |
| | | | | | | | | | |
Subtotals | | | | $ | 71 | | | | | $ | 7,161 | |
| | | | | | | | | | |
Derivatives not designated as hedging instruments: | | | | | | | | |
Commodity contracts | | Receivables | | $ | 2,539 | | | Accounts payable | | $ | 8,604 | |
| | Other assets | | | - | | | Other liabilities | | | 35 | |
Subtotals | | | | | 2,539 | | | | | | 8,639 | |
| | | | | | | | | | |
Total derivative financial instruments | | | | $ | 2,610 | | | | | $ | 15,800 | |
19
Table of Contents
The amounts in the table above reflect the fair value of our derivative financial instruments on a net basis where allowable under master netting arrangements. Had these amounts been recognized on a gross basis, the impact would have been a $7,576 increase in receivables with a corresponding increase in accounts payable.
Cash Flow Hedges
We enter into derivative financial instruments to hedge our exposure to changes in cash flows attributable to commodity price fluctuations associated with certain forecasted transactions. These derivative financial instruments are designated and qualify as cash flow hedges. The earnings effects of these derivative financial instruments are presented in the same statement of earnings line items as the earnings effects of the hedged items. For derivative financial instruments designated as cash flow hedges, we assess hedge effectiveness both at the onset of the hedge and at regular intervals throughout the life of the derivative financial instruments.
The following table summarizes our cash flow hedges outstanding at November 30, 2023:
| | | | | | |
| | Notional | | | |
(In thousands) | | Amount | | | Maturity Date |
Commodity contracts | | $ | 62,825 | | | December 2023 - June 2025 |
The following table summarizes the gain (loss) recognized in OCI and the gain (loss) reclassified from AOCI into net earnings for derivative financial instruments designated as cash flow hedges for the periods presented:
| | | | | | | | | | |
(In thousands) | | Gain (Loss)
Recognized in OCI | | | Location of Gain (Loss)
Reclassified from AOCI
into Net Earnings | | Gain (Loss) Reclassified
from AOCI into
Net Earnings | |
For the three months ended November 30, 2023: | |
Commodity contracts | | $ | 15,019 | | | Cost of goods sold | | $ | (2,360 | ) |
Interest rate contracts | | | - | | | Interest expense, net | | | 52 | |
Foreign currency exchange contracts | | | (34 | ) | | Net sales/Cost of goods sold | | | (97 | ) |
Total | | $ | 14,985 | | | | | $ | (2,405 | ) |
| | | | | | | | |
For the three months ended November 30, 2022: | |
Commodity contracts | | $ | (19,641 | ) | | Cost of goods sold | | $ | (13,648 | ) |
Interest rate contracts | | | - | | | Interest expense | | | (7 | ) |
Foreign currency exchange contracts | | | 376 | | | Net sales/Cost of goods sold | | | 53 | |
Total | | $ | (19,265 | ) | | | | $ | (13,602 | ) |
| | | | | | | | |
For the six months ended November 30, 2023: | |
Commodity contracts | | $ | 12,958 | | | Cost of goods sold | | $ | 4,970 | |
Interest rate contracts | | | - | | | Loss on extinguishment of debt | | | (641 | ) |
Interest rate contracts | | | - | | | Interest expense, net | | | 84 | |
Foreign currency exchange contracts | | | (11 | ) | | Net sales/Cost of goods sold | | | (44 | ) |
Total | | $ | 12,947 | | | | | $ | 4,369 | |
| | | | | | | | |
For the six months ended November 30, 2022: | |
Commodity contracts | | $ | (36,099 | ) | | Cost of goods sold | | $ | (13,192 | ) |
Interest rate contracts | | | - | | | Interest expense | | | (13 | ) |
Foreign currency exchange contracts | | | 58 | | | Net sales/Cost of goods sold | | | (74 | ) |
Total | | $ | (36,041 | ) | | | | $ | (13,279 | ) |
The estimated net amount of the gain recognized in AOCI at November 30, 2023 expected to be reclassified into net earnings within the succeeding twelve months is $7,678 (net of tax of $1,703). This amount was computed using the fair value of the cash flow hedges at November 30, 2023, and will change before actual reclassification from OCI to net earnings during the fiscal years ending May 31, 2024 and May 31, 2025.
20
Table of Contents
Economic (Non-designated) Hedges
We enter into foreign currency exchange contracts to manage our foreign currency exchange rate exposure related to inter-company and financing transactions that do not meet the requirements for hedge accounting treatment. We also enter into certain commodity contracts that do not qualify for hedge accounting treatment. Accordingly, these derivative financial instruments are adjusted to current market value at the end of each period through gain (loss) recognized in earnings.
The following table summarizes our economic (non-designated) derivative financial instruments outstanding at November 30, 2023:
| | | | | | |
| | Notional | | | |
(In thousands) | | Amount | | | Maturity Date(s) |
Commodity contracts | | $ | 15,509 | | | September 2023 - December 2024 |
The following table summarizes the gain (loss) recognized in earnings for economic (non-designated) derivative financial instruments for the periods presented:
| | | | | | | | | | |
| | | | Gain (Loss) Recognized | |
| | | | in Earnings for the | |
| | Location of Gain (Loss) | | Three Months Ended November 30, | |
(In thousands) | | Recognized in Earnings | | 2023 | | | 2022 | |
Commodity contracts | | Cost of goods sold | | $ | 1,459 | | | $ | 3,861 | |
Foreign currency exchange contracts | | Miscellaneous income, net | | | - | | | | (47 | ) |
Total | | | | $ | 1,459 | | | $ | 3,814 | |
| | | | | | | | | | |
| | | | Gain (Loss) Recognized | |
| | | | in Earnings for the | |
| | Location of Gain (Loss) | | Six Months Ended November 30, | |
(In thousands) | | Recognized in Earnings | | 2023 | | | 2022 | |
Commodity contracts | | Cost of goods sold | | $ | 395 | | | $ | 2,284 | |
Foreign currency exchange contracts | | Miscellaneous income, net | | | - | | | | (141 | ) |
Total | | | | $ | 395 | | | $ | 2,143 | |
Note R – Fair Value
Fair value is defined as the price that would be received to sell an asset or paid to transfer a liability in an orderly transaction between market participants at the measurement date. Fair value is an exit price concept that assumes an orderly transaction between willing market participants and is required to be based on assumptions that market participants would use in pricing an asset or a liability. Current accounting guidance establishes a three-tier fair value hierarchy as a basis for considering such assumptions and for classifying the inputs used in the valuation methodologies. This hierarchy requires entities to maximize the use of observable inputs and minimize the use of unobservable inputs. The three levels of inputs used to measure fair values are as follows:
Level 1 – Observable prices in active markets for identical assets and liabilities.
Level 2 – Inputs other than quoted prices included within Level 1 that are observable for the assets and liabilities, either directly or indirectly.
Level 3 – Unobservable inputs that are supported by little or no market activity and that are significant to the fair value of the assets and liabilities.
21
Table of Contents
Recurring Fair Value Measurements
At November 30, 2023, our assets and liabilities measured at fair value on a recurring basis were as follows:
| | | | | | | | | | | | | | | | |
| | | | | Significant | | | | | | | |
| | Quoted Prices | | | Other | | | Significant | | | | |
| | in Active | | | Observable | | | Unobservable | | | | |
| | Markets | | | Inputs | | | Inputs | | | | |
(In thousands) | | (Level 1) | | | (Level 2) | | | (Level 3) | | | Totals | |
Assets | | | | | | | | | | | | |
Derivative financial instruments (1) | | $ | - | | | $ | 15,021 | | | $ | - | | | $ | 15,021 | |
Total assets | | $ | - | | | $ | 15,021 | | | $ | - | | | $ | 15,021 | |
| | | | | | | | | | | | |
Liabilities | | | | | | | | | | | | |
Derivative financial instruments (1) | | $ | - | | | $ | 6,391 | | | $ | - | | | $ | 6,391 | |
Total liabilities | | $ | - | | | $ | 6,391 | | | $ | - | | | $ | 6,391 | |
(1)The fair value of our derivative financial instruments is based on the present value of the expected future cash flows considering the risks involved, including non-performance risk, and using discount rates appropriate for the respective maturities. Market observable, Level 2 inputs are used to determine the present value of the expected future cash flows. Refer to “Note Q – Derivative Financial Instruments and Hedging Activities” for additional information regarding our use of derivative financial instruments.
At May 31, 2023, our assets and liabilities measured at fair value on a recurring basis were as follows:
| | | | | | | | | | | | | | | | |
| | | | | Significant | | | | | | | |
| | Quoted Prices | | | Other | | | Significant | | | | |
| | in Active | | | Observable | | | Unobservable | | | | |
| | Markets | | | Inputs | | | Inputs | | | | |
(In thousands) | | (Level 1) | | | (Level 2) | | | (Level 3) | | | Totals | |
Assets | | | | | | | | | | | | |
Derivative financial instruments (1) | | $ | - | | | $ | 2,610 | | | $ | - | | | $ | 2,610 | |
Total assets | | $ | - | | | $ | 2,610 | | | $ | - | | | $ | 2,610 | |
| | | | | | | | | | | | |
Liabilities | | | | | | | | | | | | |
Derivative financial instruments (1) | | $ | - | | | $ | 15,800 | | | $ | - | | | $ | 15,800 | |
Total liabilities | | $ | - | | | $ | 15,800 | | | $ | - | | | $ | 15,800 | |
(1)The fair value of our derivative financial instruments is based on the present value of the expected future cash flows considering the risks involved, including non-performance risk, and using discount rates appropriate for the respective maturities. Market observable, Level 2 inputs are used to determine the present value of the expected future cash flows. Refer to “Note Q – Derivative Financial Instruments and Hedging Activities” for additional information regarding our use of derivative financial instruments.
22
Table of Contents
Non-Recurring Fair Value Measurements
At November 30, 2023, there were no assets measured at fair value on a non-recurring basis on our consolidated balance sheet.
At May 31, 2023, our assets measured at fair value on a non-recurring basis were as follows:
| | | | | | | | | | | | | | | | |
| | | | | Significant | | | | | | | |
| | Quoted Prices | | | Other | | | Significant | | | | |
| | in Active | | | Observable | | | Unobservable | | | | |
| | Markets | | | Inputs | | | Inputs | | | | |
(In thousands) | | (Level 1) | | | (Level 2) | | | (Level 3) | | | Totals | |
Assets | | | | | | | | | | | | |
Long-lived assets held for sale (1) | | $ | - | | | $ | 2,623 | | | $ | - | | | $ | 2,623 | |
Long-lived assets held and used (2) | | | - | | | | 70 | | | | - | | | | 70 | |
Total assets | | $ | - | | | $ | 2,693 | | | $ | - | | | $ | 2,693 | |
(1)Comprised of the following: (a) idled equipment at the manufacturing facility in Taylor, Michigan; and (b) the net assets of our former toll processing facility in Cleveland, Ohio.
(2)Comprised of certain assets associated with a capital project at our Building Products facility in Jefferson, Ohio which were written down to their estimated salvage value of $70.
The fair value of non-derivative financial instruments included in the carrying amounts of cash and cash equivalents, receivables, income taxes receivable, other assets, accounts payable, accrued compensation, contributions to employee benefit plans and related taxes, other accrued items, income taxes payable and other liabilities approximate carrying value due to their short-term nature. The fair value of long-term debt, including current maturities, based upon models utilizing market observable (Level 2) inputs and credit risk, was $391,947 and $639,948 at November 30, 2023 and May 31, 2023, respectively. The carrying amount of long-term debt, including current maturities, was $448,818 and $689,982 at November 30, 2023 and May 31, 2023, respectively.
Note S – Subsequent Events
On December 1, 2023, we completed the Separation. The Board of Directors of Worthington Enterprises (the “Board”) approved the completion of the Separation on November 9, 2023, which was effected by the Distribution by Worthington Enterprises of all of the outstanding common stock of Worthington Steel on December 1, 2023 to Worthington Enterprises stockholders who held its common shares as of the close of business on the Record Date. As part of the Distribution, each Worthington Enterprises stockholder of record as of the Record Date received one common share of Worthington Steel for every one common share of Worthington Enterprises held as of the Record Date. Refer to “Note A – Basis of Presentation” for additional information.
In connection with the Separation, we received a cash payment of $150,000 from Worthington Steel, which was funded by the Worthington Steel Credit Facility. On December 6, 2023, we used these cash proceeds to finalize our post-separation capital structure by redeeming, in full, the $150,000 senior unsecured notes that were set to mature in August 2024.
23
Table of Contents
Item 2. – Management’s Discussion and Analysis of Financial Condition and Results of Operations
Selected statements contained in this “Item 2. – Management’s Discussion and Analysis of Financial Condition and Results of Operations” constitute “forward-looking statements” as that term is used in the PSLRA. Such forward-looking statements are based, in whole or in part, on management’s beliefs, estimates, assumptions and currently available information. For a more detailed discussion of what constitutes a forward-looking statement and of some of the factors that could cause actual results to differ materially from such forward-looking statements, please refer to the “Safe Harbor Statement” in the beginning of this Form 10-Q and “Part I – Item 1A. – Risk Factors” of the 2023 Form 10-K.
Unless otherwise indicated, all Note references contained in this “Part I – Item 2 – Management’s Discussion and Analysis of Financial Condition and Results of Operations” refer to the Condensed Notes to Consolidated Financial Statements included in “Part I – Item 1. – Financial Statements” of this Form 10-Q.
Introduction
The following discussion and analysis of market and industry trends, business developments, and the results of our operations and financial position, should be read in conjunction with our consolidated financial statements and notes thereto included in “Part I – Item 1. – Financial Statements” of this Form 10-Q. The 2023 Form 10-K includes additional information about our business, operations and consolidated financial position and should be read in conjunction with this Form 10-Q. This MD&A is designed to provide a reader with material information relevant to an assessment of our financial condition and results of operations and to allow investors to view the Company from the perspective of management. The results of operations contained in this MD&A include all of our operations, including our former Steel Processing business. Beginning in the third quarter of fiscal 2024, our historical results will be restated to reflect the operations of Worthington Steel as a discontinued operation in periods prior to the December 1, 2023, Separation. This MD&A is divided into six main sections:
•Separation of the Steel Processing Business;
•Recent Business Developments;
•Trends and Factors Impacting our Performance;
•Liquidity and Capital Resources; and
•Critical Accounting Estimates
Separation of the Steel Processing Business
On December 1, 2023, we completed the Separation and Worthington Steel, comprised of our former Steel Processing business, became an independent, publicly traded company. The Separation of Worthington Steel from Worthington Enterprises, which is comprised of the Building Products, Consumer Products and Sustainable Energy Solutions businesses, was achieved through Worthington Enterprises’ pro rata distribution of 100% of the outstanding common shares of Worthington Steel to holders of record of Worthington Enterprises common shares as of the close of business on the Record Date. Each holder of record of Worthington Enterprises common shares received one common share of Worthington Steel for every one common share of Worthington Enterprises held at the close of business on the Record Date. In connection with the Separation, Worthington Steel made a cash distribution of $150 million to Worthington Enterprises. Following the completion of the Separation, Worthington Industries, Inc. changed its name to Worthington Enterprises, Inc. Worthington Enterprises’ common shares continue trading on the New York Stock Exchange (“NYSE”) under the ticker symbol “WOR.” On December 1, 2023, the common shares of Worthington Steel began trading on the NYSE under the ticker symbol “WS.”
24
Table of Contents
Recent Business Developments
•On June 29, 2023, we terminated the AR Facility that allowed us to borrow up to $175.0 million. No early termination or other similar fees or penalties were paid in connection with the termination. See “Note I – Debt and Receivables Securitization” for additional information.
•On July 28, 2023, we redeemed the 2026 Notes, which resulted in a non-cash loss of approximately $1.5 million related primarily to unamortized issuance costs and the remaining loss associated with an interest rate swap deferred in AOCI at redemption. See “Note I – Debt and Receivables Securitization” for additional information.
•On December 6, 2023, we used the $150.0 million cash distribution from Worthington Steel to pay off in full the 2024 Notes. The payoff amount consisted of $150.0 million in principal plus accrued interest of $0.5 million. See “Note S – Subsequent Events” for additional information.
Trends and Factors Impacting our Performance
The industries in which we participate are fragmented and highly competitive. Given the broad base of products and services offered, specific competitors vary based on the target industry, product type, service type, size of program and geography. Competition is primarily on the basis of price, product quality and the ability to meet delivery requirements. Our products are priced competitively, primarily based on market factors, including, among other things, market pricing, the cost and availability of raw materials, transportation and shipping costs, and overall economic conditions in the U.S. and abroad.
General Economic and Market Conditions
We sell our products and services to a diverse customer base and a broad range of end markets. The breakdown of net sales by end market for the second quarter of each of fiscal 2024 and fiscal 2023 is illustrated in the following chart:
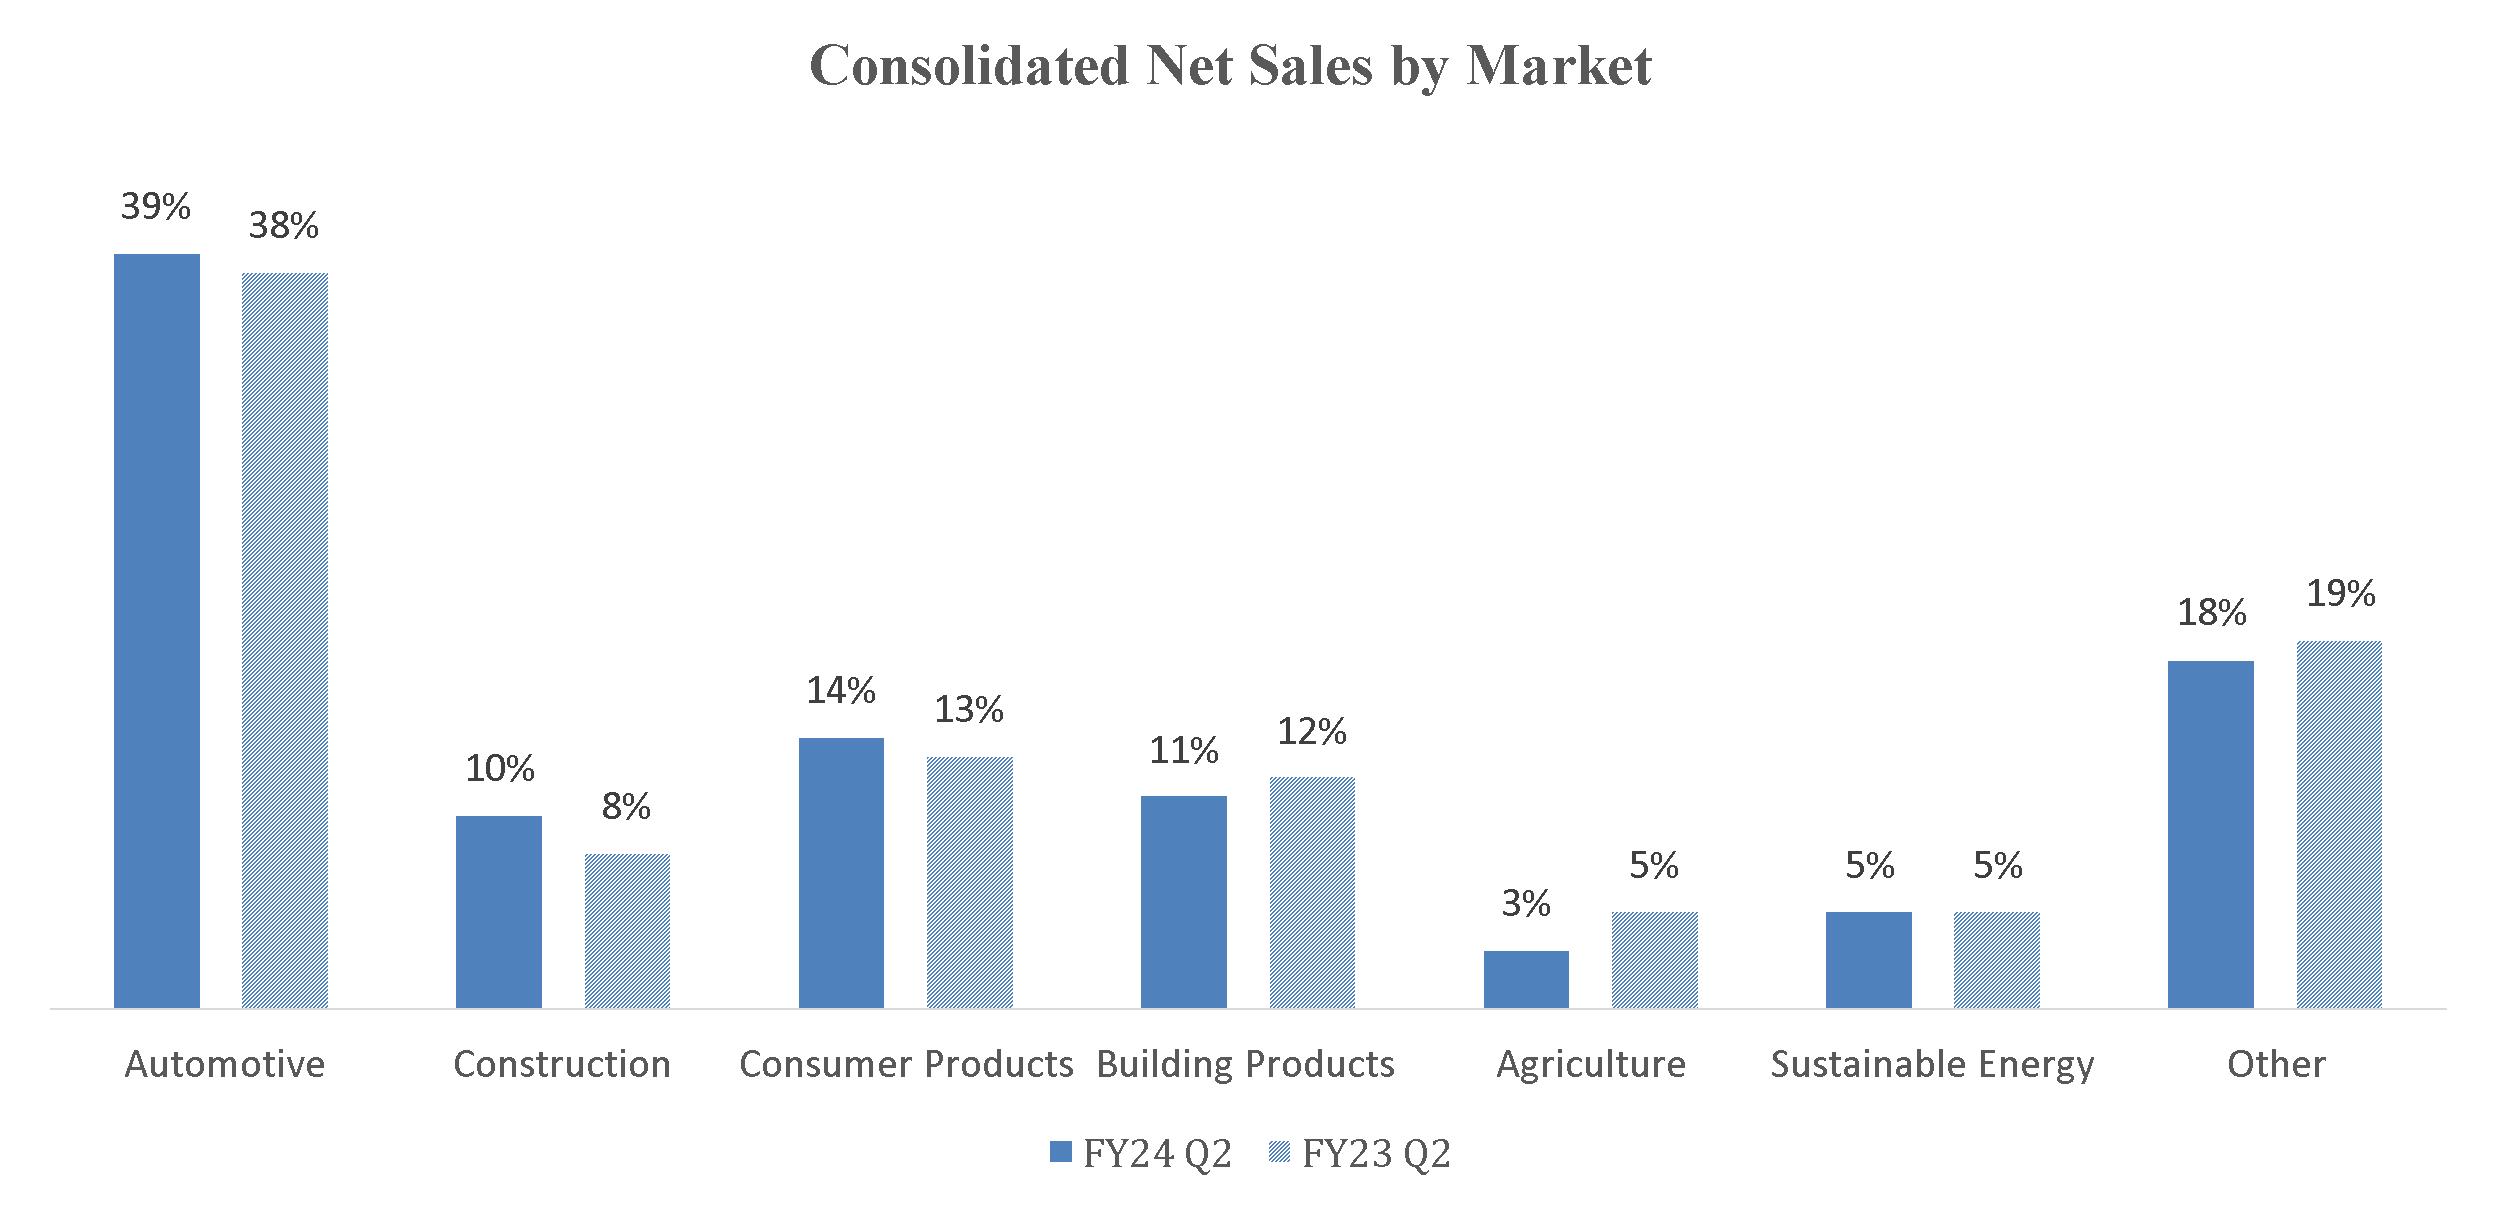
The automotive industry is one of the largest consumers of flat-rolled steel, and thus the largest end market for our Steel Processing operating segment. During the second quarter of fiscal 2024, approximately 53% of Steel Processing’s net sales were to the automotive market. North American vehicle production, primarily by Ford, General Motors and Stellantis North America (the “Detroit Three automakers”), has a considerable impact on the activity within the Steel Processing operating segment, including its unconsolidated joint venture, Serviacero Worthington.
During the second quarter of fiscal 2024, approximately 13% of the net sales of our Steel Processing operating segment were to the construction market. The construction market is also the predominant end market for our unconsolidated joint ventures within the Building Products operating segment, WAVE and ClarkDietrich. While the market price of steel significantly impacts these businesses, there are other key indicators that are meaningful in analyzing construction market demand, including the U.S. gross domestic product (“U.S. GDP”), the Dodge Index of construction contracts and, in the case of ClarkDietrich, trends in the relative prices of framing lumber and steel.
During the second quarter of fiscal 2024, substantially all of the net sales of our Consumer Products, Building Products, and Sustainable Energy Solutions operating segments and approximately 34% of the net sales of our Steel Processing operating segment were to other
25
Table of Contents
markets such as agricultural, appliance, consumer products, heavy-truck, industrial products, including the industrial electric motor, generator, and transformer end markets, and lawn and garden. Given the many different products that make up these net sales and the wide variety of end markets, it is very difficult to detail the key market indicators that drive these portions of our business. However, we believe that the trend in U.S. GDP growth is a good economic indicator for analyzing the demand of these end markets.
U.S. GDP growth rate trends are generally indicative of the strength in demand and, in many cases, pricing for our products. A year-over-year increase in U.S. GDP growth rates is generally indicative of a stronger economy, which generally increases demand and pricing for our products. Conversely, declining U.S. GDP growth rates generally indicate a weaker economy, which generally decreases demand and pricing for our products. Changes in U.S. GDP growth rates can also signal changes in conversion costs related to production and in selling, general, and administrative expense (“SG&A”).
Inflation and government deficits and debt remain at high levels. While inflation has moderated recently, a period of sustained inflation could pressure our margins in future periods. In response to the concerns over inflation risk in the broader U.S. economy, the U.S. Federal Reserve increased its benchmark interest rate significantly during fiscal 2022 and fiscal 2023. Interest rates may remain high in fiscal 2024. Adverse economic conditions resulting from inflationary pressures, U.S. Federal Reserve actions, including continued high interest rates and/or increases in interest rates, geopolitical issues or otherwise are difficult to predict and may have a material adverse impact on our business, results of operations and financial condition. Please see Part I, Item 1A. “Risk Factors” on our 2023 Form 10-K for an additional discussion of risks and potential risks of inflation and adverse economic conditions on our business, financial condition and results of operations.
We use the following information to monitor our costs and demand in our major end markets:
| | | | | | | | | | | | | | | | | | | | | | | | |
| | Three Months Ended | | | Six Months Ended | |
| | November 30, | | | November 30, | |
| | 2023 | | | 2022 (1) | | | Inc/ (Dec) | | | 2023 | | | 2022 (1) | | | Inc/ (Dec) | |
U.S. GDP (% growth year-over-year) | | | 2.8 | % | | | 1.8 | % | | | 1.0 | % | | | 2.5 | % | | | 1.8 | % | | | 0.7 | % |
Hot-Rolled Steel ($ per ton) (2) | | $ | 747 | | | $ | 742 | | | $ | 5 | | | $ | 813 | | | $ | 860 | | | $ | (47 | ) |
Detroit Three Auto Build (000's vehicles) (3) | | | 1,558 | | | | 1,742 | | | | (184 | ) | | | 3,328 | | | | 3,471 | | | | (143 | ) |
No. America Auto Build (000's vehicles) (3) | | | 3,914 | | | | 3,737 | | | | 177 | | | | 7,890 | | | | 7,375 | | | | 515 | |
Zinc ($ per pound) (4) | | $ | 1.14 | | | $ | 1.36 | | | $ | (0.22 | ) | | $ | 1.11 | | | $ | 1.46 | | | $ | (0.35 | ) |
Natural Gas ($ per mcf) (5) | | $ | 2.96 | | | $ | 6.77 | | | $ | (3.81 | ) | | $ | 2.77 | | | $ | 7.32 | | | $ | (4.55 | ) |
On-Highway Diesel Fuel Prices ($ per gallon) (6) | | $ | 4.44 | | | $ | 5.15 | | | $ | (0.71 | ) | | $ | 4.23 | | | $ | 5.29 | | | $ | (1.06 | ) |
(1)2022 figures are based on revised actuals
(2)CRU Hot-Rolled Index: period average
(4)LME Zinc; period average
(5)NYMEX Henry Hub Natural Gas; period average
(6)Energy Information Administration; period average
Sales to one Steel Processing customer in the automotive industry represented 11.1% and 12.3% of consolidated net sales during the second quarter of fiscal 2024 and the second quarter of fiscal 2023, respectively. While our automotive business is largely driven by the production schedules of the Detroit Three automakers, our customer base is much broader and includes other domestic manufacturers and many of their suppliers. During the second quarter of fiscal 2024, vehicle production for the Detroit Three automakers was down 11% due to the United Auto Workers Strike while overall North American vehicle production was up 5%.
Sales for most of our products are generally strongest in our fiscal fourth quarter when our facilities operate at seasonal peaks. Historically, sales have been weaker in our fiscal third quarter, primarily due to reduced seasonal activity in the building and construction industry, as well as customer plant shutdowns due to holidays, particularly in the automotive industry. We do not believe backlog is a significant indicator of our business.
Impact of Raw Material Prices
Our principal raw material is flat-rolled steel, which we purchase from multiple primary steel producers. When steel prices fall, we typically have higher-priced material flowing through cost of goods sold, while selling prices compress to what the market will bear, negatively impacting our results. On the other hand, in a rising price environment, our results are generally favorably impacted, as lower-priced material purchased in previous periods flows through cost of goods sold, while our selling prices increase at a faster pace to cover current replacement costs. Steel prices declined throughout most of fiscal 2023 before increasing significantly in the fourth quarter on
26
Table of Contents
production cuts at major steel mills and the replenishing of inventories in major end markets, then decreased again in the first and second quarters of fiscal 2024. The decline in steel prices in fiscal 2024 resulted in estimated inventory holding losses of $19.3 million during the six months ended November 30, 2023.
The following table presents the average quarterly market price per ton of hot-rolled steel during fiscal 2024 (first and second quarter), fiscal 2023 and fiscal 2022:
| | | | | | | | | | | | |
| | Fiscal Year | |
(Dollars per ton) (1) | | 2024 | | | 2023 | | | 2022 | |
1st Quarter | | $ | 879 | | | $ | 978 | | | $ | 1,762 | |
2nd Quarter | | $ | 747 | | | $ | 742 | | | $ | 1,888 | |
3rd Quarter | | N/A | | | $ | 720 | | | $ | 1,421 | |
4th Quarter | | N/A | | | $ | 1,116 | | | $ | 1,280 | |
Annual Avg. | | $ | 813 | | | $ | 889 | | | $ | 1,588 | |
(1)CRU Hot-Rolled Index, period average
No matter how efficient, our operations, which use steel as a raw material, create some amount of scrap. The expected price of scrap compared to the price of the steel raw material is factored into pricing. Generally, as the price of steel increases, the price of scrap increases by a similar amount. When increases in scrap prices do not keep pace with the increases in the price of the steel raw material, it can have a negative impact on our margins. We refer to this effect as the “scrap gap,” which has narrowed in recent years from historically high levels, including quarter-over-quarter declines in the current period.
Certain other commodities, such as zinc, natural gas and diesel fuel, represent a significant portion of our cost of goods sold, both directly through our plant operations and indirectly through transportation and freight expense.
Results of Operations
Second Quarter – Fiscal 2024 Compared to Fiscal 2023
The following discussion provides a review of results for the three months ended November 30, 2023 and November 30, 2022.
| | | | | | | | | | | | |
| | Three Months Ended | |
| | November 30, | |
(In millions, except per common share amounts) | | 2023 | | | 2022 | | | Increase/
(Decrease) | |
Net sales | | $ | 1,086.9 | | | $ | 1,175.5 | | | $ | (88.6 | ) |
Operating loss | | | (5.9 | ) | | | (7.0 | ) | | | 1.1 | |
Equity income | | | 42.4 | | | | 36.9 | | | | 5.5 | |
Net earnings attributable to controlling interest | | | 24.3 | | | | 16.2 | | | | 8.1 | |
Earnings per diluted common share attributable to controlling interest | | $ | 0.49 | | | $ | 0.33 | | | $ | 0.16 | |
Net Sales and Volume
The following table provides a breakdown of our consolidated net sales by operating segment, along with the respective percentage of the consolidated net sales of each, for the periods indicated.
| | | | | | | | | | | | | | | | | | | | |
| | Three Months Ended | |
| | November 30, | |
| | | | | % of | | | | | | % of | | | Increase/ | |
(In millions) | | 2023 | | | Net sales | | | 2022 | | | Net sales | | | (Decrease) | |
Steel Processing | | $ | 788.7 | | | | 72.6 | % | | $ | 841.9 | | | | 71.6 | % | | $ | (53.2 | ) |
Consumer Products | | | 147.7 | | | | 13.6 | % | | | 153.8 | | | | 13.1 | % | | | (6.1 | ) |
Building Products | | | 123.0 | | | | 11.3 | % | | | 141.7 | | | | 12.1 | % | | | (18.7 | ) |
Sustainable Energy Solutions | | | 27.5 | | | | 2.5 | % | | | 38.1 | | | | 3.2 | % | | | (10.6 | ) |
Consolidated Net Sales | | $ | 1,086.9 | | | | 100.0 | % | | $ | 1,175.5 | | | | 100.0 | % | | $ | (88.6 | ) |
27
Table of Contents
The following table provides volume by operating segment for the periods presented.
| | | | | | | | | | | | |
| | Three Months Ended | |
| | November 30, | |
| | | | | | | | Increase/ | |
| | 2023 | | | 2022 | | | (Decrease) | |
Steel Processing (Tons) | | | 958,736 | | | | 925,434 | | | | 33,302 | |
Consumer Products (Units) | | | 16,885,517 | | | | 16,583,326 | | | | 302,191 | |
Building Products (Units) | | | 2,392,515 | | | | 2,367,770 | | | | 24,745 | |
Sustainable Energy Solutions (Units) | | | 114,063 | | | | 155,687 | | | | (41,624 | ) |
•Steel Processing – Net sales totaled $788.7 million in the second quarter of fiscal 2024, down 6%, or $53.2 million, from the second quarter of fiscal 2023, as the impact of lower average selling prices more than offset the impact of higher direct volumes. The mix of direct versus toll tons processed was 56% to 44% in the second quarter of fiscal 2024, compared to 54% to 46% in the prior year quarter. Excluding the impact of the prior year divestiture of the WSP toll processing facility in Jackson, Michigan, both direct and toll volumes were up approximately 7%.
•Consumer Products – Net sales totaled $147.7 million in the second quarter of fiscal 2024, down 4%, or $6.1 million compared to the second quarter of fiscal 2023, on the combined impact of lower average selling prices and an unfavorable shift in product mix.
•Building Products – Net sales totaled $123.0 million in the second quarter of fiscal 2024, down 13%, or $18.7 million, from the second quarter of fiscal 2023, driven primarily by lower average selling prices and an unfavorable shift in product mix.
•Sustainable Energy Solutions – Net sales totaled $27.5 million in the second quarter of fiscal 2024, down 28%, or $10.6 million, compared to the prior year quarter on lower volumes and an unfavorable shift in product mix.
Gross margin
| | | | | | | | | | | | | | | | | | | | |
| | Three Months Ended | |
| | November 30, | |
| | | | | % of | | | | | | % of | | | Increase/ | |
(In millions) | | 2023 | | | Net sales | | | 2022 | | | Net sales | | | (Decrease) | |
Gross Margin | | $ | 123.7 | | | | 11.4 | % | | $ | 105.8 | | | | 9.0 | % | | $ | 17.9 | |
Gross margin increased $17.9 million over the comparable period in the prior year to $123.7 million, largely driven by lower estimated inventory holding losses in Steel Processing, down $18.3 million from the prior year quarter.
Selling, general and administrative expense
| | | | | | | | | | | | | | | | | | | | |
| | Three Months Ended | |
| | November 30, | |
| | | | | % of | | | | | | % of | | | Increase/ | |
(In millions) | | 2023 | | | Net sales | | | 2022 | | | Net sales | | | (Decrease) | |
Selling, general and administrative expense | | $ | 107.7 | | | | 9.9 | % | | $ | 107.8 | | | | 9.2 | % | | $ | (0.1 | ) |
•SG&A expense of $107.7 million was relatively flat compared to the prior year quarter.
Other operating items
| | | | | | | | | | | | |
| | Three Months Ended | |
| | November 30, | |
| | | | | | | | Increase/ | |
(In millions) | | 2023 | | | 2022 | | | (Decrease) | |
Restructuring and other income, net | | | - | | | | 4.3 | | | | (4.3 | ) |
Separation costs | | | 21.9 | | | | 9.2 | | | | 12.7 | |
28
Table of Contents
•The net gain within restructuring in the prior year quarter was driven primarily by the sale of the remaining facility of WSP, our former operating joint venture.
•Separation costs reflect direct and incremental costs incurred in connection with the Separation as discussed in “Note A – Basis of Presentation.”
Interest expense, net
| | | | | | | | | | | | |
| | Three Months Ended | |
| | November 30, | |
| | | | | | | | Increase/ | |
(In millions) | | 2023 | | | 2022 | | | (Decrease) | |
Interest expense, net | | $ | 2.2 | | | $ | 7.6 | | | $ | (5.4 | ) |
•Interest expense, net of $2.2 million in the second quarter of fiscal 2024 was favorable to the second quarter of fiscal 2023 by $5.4 million due to higher interest income and, to a lesser extent, lower average long-term debt levels due to the July 28, 2023 redemption of our 2026 Notes. Refer to “Note I – Debt and Receivables Securitization” for additional information
Equity income
| | | | | | | | | | | | |
| | Three Months Ended | |
| | November 30, | |
| | | | | | | | Increase/ | |
(In millions) | | 2023 | | | 2022 | | | (Decrease) | |
WAVE | | $ | 21.4 | | | $ | 19.0 | | | $ | 2.4 | |
ClarkDietrich | | | 13.7 | | | | 16.1 | | | | (2.4 | ) |
Serviacero Worthington | | | 3.8 | | | | 1.9 | | | | 1.9 | |
Workhorse | | | 3.5 | | | | (0.2 | ) | | | 3.7 | |
Total Equity Income | | $ | 42.4 | | | $ | 36.8 | | | $ | 5.6 | |
•Equity income increased $5.6 million over the prior year quarter to $42.4 million, due in part to a $2.8 million gain associated with the divestiture of the Brazilian operations of Workhorse. Excluding the impact of the divestiture, equity income was up $2.8 million in the current year quarter, as slightly higher contributions from both WAVE and Serviacero were partially offset by lower contributions from ClarkDietrich.
Income Taxes
| | | | | | | | | | | | | | | | | | | | |
| | Three Months Ended | |
| | November 30, | |
| | | | | Effective | | | | | | Effective | | | Increase/ | |
(In millions) | | 2023 | | | Tax Rate | | | 2022 | | | Tax Rate | | | (Decrease) | |
Income tax expense | | $ | 7.2 | | | | 23.4 | % | | $ | 4.1 | | | | 23.7 | % | | $ | 3.1 | |
•Income tax expense was $7.2 million in the second quarter of fiscal 2024 compared to $4.1 million in the second quarter of fiscal 2023. The increase was driven by higher pre-tax earnings as our effective tax rate was relatively unchanged from the prior year quarter. For additional information regarding our income taxes, refer to “Note M – Income Taxes.”
29
Table of Contents
Adjusted EBIT
We evaluate operating performance on the basis of adjusted EBIT. EBIT, a non-GAAP financial measure, is calculated by adding interest expense and income tax expense to net earnings attributable to controlling interest. Adjusted EBIT excludes impairment and restructuring expense (income), but may also exclude other items, as described below, that management believes are not reflective of, and thus should not be included when evaluating the performance of our ongoing operations. Adjusted EBIT is a non-GAAP financial measure and is used by management to evaluate operating performance, engage in financial and operational planning and determine incentive compensation because we believe that this financial measure provides additional perspective on the performance of our ongoing operations. Additionally, management believes these non-GAAP financial measures provide useful information to investors because they allow for meaningful comparisons and analysis of trends in our businesses and enable investors to evaluate operations and future prospects in the same manner as management.
The following table provides a reconciliation of net earnings attributable to controlling interest (the most comparable GAAP financial measure) to adjusted EBIT for the periods presented:
| | | | | | | | |
| | Three Months Ended | |
| | November 30, | |
(In millions) | | 2023 | | | 2022 | |
Net earnings attributable to controlling interest | | $ | 24.3 | | | $ | 16.2 | |
Interest expense, net | | | 2.2 | | | | 7.6 | |
Income tax expense | | | 7.2 | | | | 4.1 | |
EBIT | | | 33.7 | | | | 27.9 | |
Incremental expense related to Level5 earnout (1) | | | - | | | | 0.5 | |
Restructuring and other income, net (2) | | | - | | | | (2.3 | ) |
Separation costs (3) | | | 21.9 | | | | 9.2 | |
Gain on sale of assets in equity income (4) | | | (2.8 | ) | | | - | |
Adjusted EBIT | | $ | 52.8 | | | $ | 35.3 | |
(1)Reflects incremental compensation expense attributable to the Level5 earnout.
(2)Restructuring activities consist of established programs that are not part of our ongoing operations, such as divestitures, closing or consolidating facilities, employee severance (including rationalizing headcount or other significant changes in personnel), and realignment of existing operations (including changes to management structure in response to underlying performance and/or changing market conditions). The net gain recognized in the prior year quarter resulted primarily from the sale of WSP’s remaining manufacturing facility in Jackson, Michigan and excludes the impact of non-controlling interests.
(3)Reflects direct and incremental costs incurred in connection with the tax-free spin-off of our former Steel Processing business, including third-party advisory fees, certain employee-related costs and non-recurring costs associated with the separation of shared corporate functions.
(4)Reflects a $2.8 million gain associated with the divestiture of the Brazilian operations of Workhorse.
The following table provides a summary of adjusted EBIT by reportable segment for the periods presented.
| | | | | | | | | | | | | | | | | | | | |
| | Three Months Ended | |
| | November 30, | |
| | | | | % of Adjusted | | | | | | % of Adjusted | | | Increase/ | |
(In millions) | | 2023 | | | EBIT | | | 2022 | | | EBIT | | | (Decrease) | |
Steel Processing | | $ | 6.8 | | | | 12.9 | % | | $ | (17.2 | ) | | | (48.7 | %) | | $ | 24.0 | |
Consumer Products | | | 9.5 | | | | 18.0 | % | | | 13.5 | | | | 38.2 | % | | | (4.0 | ) |
Building Products | | | 40.3 | | | | 76.3 | % | | | 41.2 | | | | 116.7 | % | | | (0.9 | ) |
Sustainable Energy Solutions | | | (2.6 | ) | | | (5.0 | %) | | | 1.1 | | | | 3.1 | % | | | (3.7 | ) |
Other | | | (1.2 | ) | | | (2.2 | %) | | | (3.3 | ) | | | (9.3 | %) | | | 2.1 | |
Total Adjusted EBIT | | $ | 52.8 | | | | 100.0 | % | | $ | 35.3 | | | | 100.0 | % | | $ | 17.5 | |
•Steel Processing – Adjusted EBIT was $6.8 million in the second quarter of fiscal 2024, up $24.0 million over the prior year quarter on lower estimated inventory holding losses, down $18.3 million, and a $1.9 million increase in equity earnings at Serviacero.
30
Table of Contents
•Consumer Products – Adjusted EBIT was $9.5 million in the second quarter of fiscal 2024, down $4.0 million compared to the second quarter of fiscal 2023, driven primarily by a $3.1 million reserve related to the voluntary recall of our Balloon Time® Mini helium tank and to a lesser extent unfavorable manufacturing expense.
•Building Products – Adjusted EBIT was $40.3 million in the second quarter of fiscal 2024, a decrease of $0.9 million compared to the second quarter of fiscal 2023, driven primarily by lower volume at our wholly-owned businesses. Equity income was essentially flat in the quarter, as higher contributions from WAVE were almost equally offset by a modest decline at ClarkDietrich.
•Sustainable Energy Solutions – Adjusted EBIT was unfavorable $3.7 million to the prior year quarter resulting in an overall loss of $2.6 million in the second quarter of fiscal 2024 on lower net sales.
Six Months Year-to-Date – Fiscal 2024 compared to Fiscal 2023
The following discussion provides a review of results for the six months ended November 30, 2023 and November 30, 2022.
| | | | | | | | | | | | |
| | Six Months Ended | |
| | November 30, | |
(In millions, except per common share amounts) | | 2023 | | | 2022 | | | Increase/
(Decrease) | |
Net sales | | $ | 2,280.2 | | | $ | 2,584.2 | | | $ | (304.0 | ) |
Operating income | | | 71.8 | | | | 59.7 | | | | 12.1 | |
Equity income | | | 96.8 | | | | 68.6 | | | | 28.2 | |
Net earnings attributable to controlling interest | | | 120.4 | | | | 80.3 | | | | 40.1 | |
Earnings per diluted common share attributable to controlling interest | | $ | 2.40 | | | $ | 1.63 | | | | 0.77 | |
Net Sales and Volume
The following table provides a breakdown of our consolidated net sales by operating segment, along with the respective percentage of the consolidated net sales of each, for the periods indicated.
| | | | | | | | | | | | | | | | | | | | |
| | Six Months Ended | |
| | November 30, | |
| | | | | % of | | | | | | % of | | | Increase/ | |
(In millions) | | 2023 | | | Net sales | | | 2022 | | | Net sales | | | (Decrease) | |
Steel Processing | | $ | 1,670.0 | | | | 73.2 | % | | $ | 1,880.8 | | | | 72.8 | % | | $ | (210.8 | ) |
Consumer Products | | | 297.2 | | | | 13.0 | % | | | 342.5 | | | | 13.3 | % | | | (45.3 | ) |
Building Products | | | 256.8 | | | | 11.3 | % | | | 292.0 | | | | 11.3 | % | | | (35.2 | ) |
Sustainable Energy Solutions | | | 56.2 | | | | 2.5 | % | | | 68.9 | | | | 2.6 | % | | | (12.7 | ) |
Consolidated Net Sales | | $ | 2,280.2 | | | | 100.0 | % | | $ | 2,584.2 | | | | 100.0 | % | | $ | (304.0 | ) |
The following table provides volume by reportable operating segment for the periods presented.
| | | | | | | | | | | | |
| | Six Months Ended | |
| | November 30, | |
| | | | | | | | Increase/ | |
| | 2023 | | | 2023 | | | (Decrease) | |
Steel Processing (Tons) | | | 1,958,394 | | | | 1,900,083 | | | | 58,311 | |
Consumer Products (Units) | | | 33,954,462 | | | | 38,966,668 | | | | (5,012,206 | ) |
Building Products (Units) | | | 5,163,973 | | | | 5,289,933 | | | | (125,960 | ) |
Sustainable Energy Solutions (Units) | | | 220,369 | | | | 288,820 | | | | (68,451 | ) |
•Steel Processing – Net sales totaled $1,670 in the current year period, down 11%, or $210.8 million from the prior year period, driven primarily by lower average selling prices. The mix of direct versus toll tons processed was unchanged at 56% to 44%.
•Consumer Products – Net sales totaled $297.2 million in the current year period, down 13%, or $45.3 million compared to the prior year period, almost entirely on lower volume driven largely by de-stocking at some of our retail customers that continued into the first quarter of fiscal 2024.
31
Table of Contents
•Building Products – Net sales totaled $256.8 million in the current year period, down 12%, or $35.2 million, from the prior year period, driven by lower volume, and to a lesser extent, unfavorable product mix.
•Sustainable Energy Solutions – Net sales totaled $56.2 million in the current year period, down 18%, or $12.7 million, from the prior year period, on lower volumes and an unfavorable shift in product mix.
Gross margin
| | | | | | | | | | | | | | | | | | | | |
| | Six Months Ended | |
| | November 30, | |
| | | | | % of | | | | | | % of | | | Increase/ | |
(In millions) | | 2023 | | | Net sales | | | 2022 | | | Net sales | | | (Decrease) | |
Gross Margin | | $ | 321.2 | | | | 14.1 | % | | $ | 275.1 | | | | 10.6 | % | | $ | 46.1 | |
•Gross margin was $321.2 million for the six months ended November 30, 2023, an increase of $46.1 million compared to the prior year period, driven primarily by lower inventory holding losses at Steel Processing estimated to be $19.3 million compared to $54.6 million in the comparable period in the prior year.
Selling, general and administrative expense
| | | | | | | | | | | | | | | | | | | | |
| | Six Months Ended | |
| | November 30, | |
| | | | | % of | | | | | | % of | | | Increase/ | |
(In millions) | | 2023 | | | Net sales | | | 2022 | | | Net sales | | | (Decrease) | |
Selling, general and administrative expense | | $ | 220.0 | | | | 9.6 | % | | $ | 211.3 | | | | 8.2 | % | | $ | 8.7 | |
•SG&A increased $8.7 million over the prior year quarter primarily due to higher healthcare and other benefit-related costs, and, to a lesser extent, higher wages.
Other operating items
| | | | | | | | | | | | |
| | Six Months Ended | |
| | November 30, | |
| | | | | | | | Increase/ | |
(In millions) | | 2023 | | | 2022 | | | (Decrease) | |
Impairment of long-lived assets | | $ | 1.4 | | | $ | 0.3 | | | $ | 1.1 | |
Restructuring and other income, net | | | - | | | | 5.4 | | | | (5.4 | ) |
Separation costs | | | 28.0 | | | | 9.2 | | | | 18.8 | |
•Impairment of long-lived assets in both the current year and prior year periods was driven by changes in the estimated fair market value less cost to sell related to ongoing efforts to divest certain production equipment of our former toll processing facility in Cleveland, Ohio. Refer to “Note E – Impairment of Long-Lived assets” for additional information.
•Restructuring and other income, net in the prior year period was driven by gains realized from the sale of long-lived assets, including a pre-tax gain of $3.9 million realized from the sale of WSP’s manufacturing facility in Jackson, Michigan and a pre-tax gain of $1.2 million from the sale of real property in Tulsa, Oklahoma.
•Separation costs reflect direct and incremental costs incurred in connection with the Separation as discussed in “Note A – Basis of Presentation.”
Miscellaneous income (expense), net
| | | | | | | | | | | | |
| | Six Months Ended | |
| | November 30, | |
| | | | | | | | Increase/ | |
(In millions) | | 2023 | | | 2022 | | | (Decrease) | |
Miscellaneous income (expense), net | | $ | 2.0 | | | $ | (3.7 | ) | | $ | 5.7 | |
32
Table of Contents
•Miscellaneous expense in the prior year period was driven primarily by the annuitization of a portion of the total projected benefit obligation of the inactive Gerstenslager Company Bargaining Unit Employees’ Pension Plan, which resulted in a pre-tax, non-cash settlement charge of $4.8 million to accelerate a portion of deferred pension cost.
Loss on extinguishment of debt
| | | | | | | | | | | | |
| | Six Months Ended | |
| | November 30, | |
| | | | | | | | Increase/ | |
| | 2023 | | | 2022 | | | (Decrease) | |
Loss on extinguishment of debt | | $ | 1.5 | | | $ | - | | | $ | 1.5 | |
•Loss on extinguishment of debt of $1.5 million resulted from the July 28, 2023 early redemption of the 2026 Notes and consisted primarily of unamortized debt issuance costs and the remaining loss deferred in AOCI associated with an interest rate swap executed prior to the issuance of the 2026 Notes.
Interest expense, net
| | | | | | | | | | | | |
| | Six Months Ended | |
| | November 30, | |
| | | | | | | | Increase/ | |
(In millions) | | 2023 | | | 2022 | | | (Decrease) | |
Interest expense, net | | $ | 5.3 | | | $ | 16.2 | | | $ | (10.9 | ) |
•Interest expense, net of $5.3 million in the current year period was favorable compared to the prior year period by $10.9 million, driven primarily by higher interest income and, to a lesser extent, lower average long-term debt levels due to the July 28, 2023 redemption of our 2026 Notes. Refer to “Note I – Debt and Receivables Securitization” for additional information.
Equity Income
| | | | | | | | | | | | |
| | Six Months Ended | |
| | November 30, | |
| | | | | | | | Increase/ | |
(In millions) | | 2023 | | | 2022 | | | (Decrease) | |
WAVE | | $ | 49.7 | | | $ | 42.8 | | | $ | 6.9 | |
ClarkDietrich | | | 30.5 | | | | 36.2 | | | | (5.7 | ) |
Serviacero Worthington | | | 12.7 | | | | 3.7 | | | | 9.0 | |
ArtiFlex | | | - | | | | (13.4 | ) | | | 13.4 | |
Workhorse | | | 3.9 | | | | (0.7 | ) | | | 4.6 | |
Total Equity Income | | $ | 96.8 | | | $ | 68.6 | | | $ | 28.2 | |
•Equity income increased $28.2 million over the prior year period, which included a $15.8 million loss from the sale of our interest in ArtiFlex, as higher contributions by both Serviacero and WAVE were partially offset by a decline at ClarkDietrich. Serviacero was the biggest driver of the overall increase with equity earnings up $9.0 million, primarily due to higher direct spreads.
33
Table of Contents
Income Taxes
| | | | | | | | | | | | | | | | | | | | |
| | Six Months Ended | |
| | November 30, | |
| | | | | Effective | | | | | | Effective | | | Increase/ | |
(In millions) | | 2023 | | | Tax Rate | | | 2022 | | | Tax Rate | | | (Decrease) | |
Income tax expense | | $ | 36.0 | | | | 23.4 | % | | $ | 23.6 | | | | 23.7 | % | | $ | 12.4 | |
•Income tax expense was $36.0 million in the current year period compared to income tax expense of $23.6 million in the prior year period. The increase was driven by higher pre-tax earnings. For additional information regarding our income taxes, refer to “Note M – Income Taxes.”
Adjusted EBIT
The following table provides a reconciliation of consolidated net earnings attributable to controlling interest to adjusted EBIT for the periods presented:
| | | | | | | | |
| | Six Months Ended | |
| | November 30, | |
(In millions) | | 2023 | | | 2022 | |
Net earnings attributable to controlling interest | | $ | 120.4 | | | $ | 80.3 | |
Interest expense, net | | | 5.3 | | | | 16.2 | |
Income tax expense | | | 36.0 | | | | 23.6 | |
EBIT | | | 161.7 | | | | 120.1 | |
Incremental expense related to Level5 earnout (1) | | | - | | | | 1.1 | |
Impairment of long-lived assets (2) | | | 0.9 | | | | 0.2 | |
Restructuring and other income, net (3) | | | - | | | | (3.6 | ) |
Separation costs (4) | | | 28.0 | | | | 9.2 | |
Loss on extinguisment of debt (5) | | | 1.5 | | | | - | |
Pension settlement charge (6) | | | - | | | | 4.8 | |
Gain on sale of assets in equity income (7) | | | (2.8 | ) | | | - | |
Loss on sale of investment in ArtiFlex (8) | | | - | | | | 15.8 | |
Adjusted EBIT | | $ | 189.3 | | | $ | 147.6 | |
| | | | | | |
(1)Reflects incremental compensation expense attributable to the Level5 earnout.
(2)Impairment charges are excluded because they do not occur in the ordinary course of our ongoing business operations, are inherently unpredictable in timing and amount, and are non-cash, so their exclusion facilitates the comparison of historical, current and forecasted financial results. Non-cash impairment charges in both periods were driven by changes in the estimated fair market value less cost to sell related to ongoing efforts to divest certain production equipment of Samuel’s former toll processing facility in Cleveland, Ohio, and exclude the impact of the noncontrolling interest.
(3)Restructuring activities consist of established programs that are not part of our ongoing operations, such as divestitures, closing or consolidating facilities, employee severance (including rationalizing headcount or other significant changes in personnel), and realignment of existing operations (including changes to management structure in response to underlying performance and/or changing market conditions). The net gain recognized in the prior year quarter resulted primarily from the sale of WSP’s remaining manufacturing facility, located in Jackson, Michigan.
(4)Reflects direct and incremental costs incurred in connection with the tax-free spin-off of our former Steel Processing business, including third-party advisory fees, certain employee-related costs and non-recurring costs associated with the separation of shared corporate functions.
(5)Reflects a $1.5 million loss realized in connection with the July 28, 2023 early redemption of the 2026 Notes.
(6)Reflects a non-cash settlement charge to accelerate a portion of the overall deferred pension cost associated with The Gerstenslager Company Bargaining Unit Employees' Pension Plan as a result of a pension lift-out transaction completed in August 2022 to transfer a portion of the total projected benefit obligation to a third-party insurance company.
(7)Reflects a $2.8 million gain associated with the divestiture of the Brazilian operations of Workhorse.
34
Table of Contents
(8)Reflects the loss realized in connection with the August 3, 2022 sale of our 50% noncontrolling equity investment in ArtiFlex.
The following table provides a summary of adjusted EBIT by reportable segment for the periods presented.
| | | | | | | | | | | | | | | | | | | | |
| | Six Months Ended | |
| | November 30, | |
| | | | | % of Adjusted | | | | | | % of Adjusted | | | Increase/ | |
(In millions) | | 2023 | | | EBIT | | | 2022 | | | EBIT | | | (Decrease) | |
Steel Processing | | $ | 84.8 | | | | 44.8 | % | | $ | 17.7 | | | | 12.0 | % | | $ | 67.1 | |
Consumer Products | | | 18.5 | | | | 9.8 | % | | | 34.4 | | | | 23.3 | % | | | (15.9 | ) |
Building Products | | | 94.3 | | | | 49.8 | % | | | 94.0 | | | | 63.7 | % | | | 0.3 | |
Sustainable Energy Solutions | | | (7.3 | ) | | | (3.9 | %) | | | (0.3 | ) | | | (0.2 | %) | | | (7.0 | ) |
Other | | | (1.0 | ) | | | (0.5 | %) | | | 1.8 | | | | 1.2 | % | | | (2.8 | ) |
Total Adjusted EBIT | | | 189.3 | | | | 100.0 | % | | | 147.6 | | | | 100.0 | % | | $ | 41.7 | |
•Steel Processing – Adjusted EBIT was $84.8 million in the current year period, an increase of $67.1 million compared to the prior year period, due primarily to favorable direct spreads, including $35.3 million associated with the year-over-year favorable swing in estimated inventory holding losses, and, to a lesser extent, higher equity earnings at Serviacero, up $9.0 million.
•Consumer Products – Adjusted EBIT was $18.5 million in the current year period, down $15.9 million compared to the prior year period, driven primarily by lower volumes and higher manufacturing expenses, partially offset by a favorable pricing spread as price increases implemented in fiscal 2023 held steady through November 30, 2023.
•Building Products – Adjusted EBIT was $94.3 million in the current year period, an increase of $0.3 million compared to the prior year period, on a $1.2 million increase in equity income, partially offset by the impact of lower volume.
•Sustainable Energy Solutions – Adjusted EBIT was a loss of $7.3 million for the current year period, a decline of $7.0 million compared to the prior year period, due to lower volumes and higher manufacturing expenses.
Liquidity and Capital Resources
During the six months ended November 30, 2023, we generated $135.0 million of cash from operating activities and invested $32.9 million in property, plant and equipment and $15.0 million in a note receivable. We also received cash proceeds of $175.0 million in the form of short-term borrowings tied to the Worthington Steel Credit Facility, which was used to fund a $150.0 million cash distribution to Worthington Enterprises on December 1, 2023 in connection with the Separation. Additionally, we repaid $243.8 million to redeem the 2026 Notes and paid dividends of $17.3 million.
| | | | | | | | |
| | Six Months Ended | |
| | November 30, | |
(In millions) | | 2023 | | | 2022 | |
Net cash provided by operating activities | | $ | 194.7 | | | $ | 214.0 | |
Net cash used by investing activities | | | (97.8 | ) | | | (30.7 | ) |
Net cash provided (used) by financing activities | | | (120.9 | ) | | | (88.2 | ) |
Increase (decrease) in cash and cash equivalents | | | (24.0 | ) | | | 95.1 | |
Cash and cash equivalents at beginning of period | | | 454.9 | | | | 34.5 | |
Cash and cash equivalents at end of period | | $ | 430.9 | | | $ | 129.6 | |
We believe that the available borrowing capacity of the Credit Facility is sufficient to meet the needs of our existing businesses for normal operating costs, mandatory capital expenditures, debt redemptions, dividend payments and working capital, to the extent not funded by cash provided by operating activities, for at least 12 months and for the foreseeable future thereafter. Our resources include cash and cash equivalents and unused committed lines of credit. There were no borrowings outstanding under the Credit Facility at November 30, 2023, leaving up to $500.0 million available for use.
Although we do not currently anticipate a need, we believe that we could access the financial markets to be in a position to sell long-term debt or equity securities. However, the continuation of soft economic conditions and an uncertain interest rate environment could create volatility in the financial markets, which may impact our ability to access capital and the terms under which we can do so.
35
Table of Contents
We routinely monitor current operational requirements, financial market conditions, and credit relationships and we may choose to seek additional capital by issuing new debt and/or equity securities to strengthen our liquidity or capital structure. Should we seek additional capital, there can be no assurance that we would be able to obtain such additional capital on terms acceptable to us, if at all, and such additional equity or debt financing could dilute the interests of our existing shareholders and/or increase our interest costs. We may also from time to time seek to retire or repurchase our outstanding debt through cash purchases, in open-market purchases, privately-negotiated transactions or otherwise. Such repurchases, if any, will be upon such terms and at such prices as we may determine, and will depend on prevailing market conditions, our liquidity requirements, contractual restrictions and other factors. The amounts involved in any such transaction may or may not be material. To facilitate our post-separation capital structure, on July 28, 2023, we redeemed in full our 2026 Notes for $243.8 million. Subsequent to quarter-end, we finalized our post-separation capital structure by redeeming an additional $150.0 million of long-term debt, as further discussed in “Note S – Subsequent Events.”
Operating Activities
Our business is cyclical and cash flows from operating activities may fluctuate during the year and from year to year due to economic and industry conditions. We rely on cash and short-term borrowings to meet cyclical increases in working capital needs. These needs generally rise during periods of increased economic activity or increasing raw material prices, requiring higher levels of inventory and accounts receivable. During economic slowdowns, or periods of decreasing raw material costs, working capital needs generally decrease as a result of the reduction of inventories and accounts receivable.
Net cash provided by operating activities was $194.7 million during the six months ended November 30, 2023, down $19.3 million from the comparable period in the prior year. The change was due primarily to a $36.8 million change in net operating working capital (accounts receivable, inventories, and accounts payable) requirements over the comparable prior year period, mainly driven by fluctuations in steel prices and lagging price indices.
Investing Activities
Net cash used by investing activities was $97.8 million during the six months ended November 30, 2023, compared to $30.7 million during the prior year period. Net cash used by investing activities in the current year period resulted primarily from capital expenditures of $62.2 million, a $15.0 million investment in a note receivable, and the November 15, 2023 purchase of the Voestalpine business for cash consideration of $21.0 million, net of cash acquired. Net cash used by investing activities in the prior year period resulted primarily from the purchase of the Level5 business on June 2, 2022, for $56.1 million, net of cash acquired, and capital expenditures of $46.0 million, partially offset by combined cash proceeds of $71.6 million from the sale of our equity investment in ArtiFlex, and the sale of the remaining facility of our former operating joint venture, WSP.
Investment activities are largely discretionary, and future investment activities could be reduced significantly, or eliminated, as economic conditions warrant. We assess acquisition opportunities as they arise, and such opportunities may require additional financing. There can be no assurance, however, that any such opportunities will arise, that any such acquisition opportunities will be consummated, or that any needed additional financing will be available on satisfactory terms if required.
Financing Activities
Net cash used by financing activities was $120.9 million during the six months ended November 30, 2023 compared to $88.2 million in the prior year period. The change was primarily due to $172.2 million of net proceeds of short-term borrowings and the repayment of $243.8 million of long-term debt associated with the redemption of the 2026 Notes in July 2023 and net repayments of $43.1 million of short-term borrowings in the six months ended November 30, 2022.
Common shares – On December 19, 2023, Worthington Enterprises’ Board of Directors declared a quarterly dividend of $0.16 per share payable on March 29, 2024, to shareholders of record on March 15, 2024.
On March 20, 2019, the Board authorized the repurchase of up to 6.6 million common shares.
On March 24, 2021, the Board authorized the repurchase of up to an additional 5.6 million common shares, increasing the total number of common shares then authorized for repurchase to 10.0 million. As of November 30, 2023, 6.1 million common shares remained available for repurchase under these two authorizations.
The common shares may be repurchased under these authorizations from time to time, with consideration given to the market price of the common shares, the nature of other investment opportunities, cash flows from operations, general economic conditions and other relevant considerations. Repurchases may be made on the open market or through privately negotiated transactions.
36
Table of Contents
Long-term debt and short-term borrowings – As of November 30, 2023, we were in compliance with the financial covenants of our short-term and long-term debt agreements. Our debt agreements do not include credit rating triggers or material adverse change provisions. There were no borrowings under our Credit Facility at November 30, 2023, leaving the full borrowing capacity of $500.0 million available for use.
Dividend Policy
We currently have no material contractual or regulatory restrictions on the payment of dividends. Dividends are declared at the discretion of the Board. The Board reviews the dividend quarterly and establishes the dividend rate based upon our consolidated financial condition, results of operations, capital requirements, current and projected cash flows, business prospects, and other relevant factors. While we have paid a dividend every quarter since becoming a public company in 1968, there is no guarantee that payments of dividends will continue in the future.
Critical Accounting Estimates
The discussion and analysis of our financial condition and results of operations is based upon our consolidated financial statements, which have been prepared in accordance with U.S. GAAP. The preparation of these consolidated financial statements requires us to make estimates and assumptions that affect the reported amounts of assets and liabilities and the disclosure of contingent assets and liabilities at the date of the consolidated financial statements and the reported amounts of revenues and expenses during the reporting periods. We continually evaluate our estimates, including those related to our valuation of receivables, inventories, intangible assets, accrued liabilities, income and other tax accruals, contingencies and litigation, and business combinations. We base our estimates on historical experience and various other assumptions that we believe to be reasonable under the circumstances. These results form the basis for making judgments about the carrying values of assets and liabilities that are not readily apparent from other sources. Critical accounting policies are defined as those that reflect our significant judgments and uncertainties that could potentially result in materially different results under different assumptions and conditions. Although actual results historically have not deviated significantly from those determined using our estimates, our consolidated financial position or results of operations could be materially different if we were to report under different conditions or to use different assumptions in the application of such policies. Our critical accounting policies have not significantly changed from those discussed in “Part II – Item 7. – Management’s Discussion and Analysis of Financial Condition and Results of Operations – Critical Accounting Estimates” of the 2023 Form 10-K.
Item 3. – Quantitative and Qualitative Disclosures About Market Risk
Market risks have not materially changed from those disclosed in “Part II – Item 7A. – Quantitative and Qualitative Disclosures About Market Risk” of the 2023 Form 10-K.
Item 4. – Controls and Procedures
Evaluation of Disclosure Controls and Procedures
We maintain disclosure controls and procedures (as defined in Rules 13a-15(e) and 15d-15(e) under the Securities Exchange Act of 1934, as amended (the “Exchange Act”)) that are designed to provide reasonable assurance that information required to be disclosed in the reports that Worthington Enterprises files or submits under the Exchange Act is recorded, processed, summarized and reported within the time periods specified in the SEC’s rules and forms, and that such information is accumulated and communicated to our management, including Worthington Enterprises’ principal executive officer and principal financial officer, as appropriate to allow timely decisions regarding required disclosure.
Management, under the supervision of and with the participation of Worthington Enterprises’ principal executive officer and principal financial officer, performed an evaluation of the effectiveness of our disclosure controls and procedures as of the end of the period covered by this Form 10-Q (the quarterly period ended November 30, 2023). Based on that evaluation, Worthington Enterprises’ principal executive officer and principal financial officer have concluded that such disclosure controls and procedures were effective at a reasonable assurance level as of the end of the quarterly period covered by this Form 10-Q.
Changes in Internal Control Over Financial Reporting
There were no changes that occurred during the period covered by this Form 10-Q (the quarterly period ended November 30, 2023) in our internal control over financial reporting (as defined in Rules 13a-15(f) and 15d-15(f) under the Exchange Act) that have materially affected, or are reasonably likely to materially affect, our internal control over financial reporting.
37
Table of Contents
PART II. OTHER INFORMATION
Item 1. – Legal Proceedings
We are involved in various judicial and administrative proceedings, as both plaintiff and defendant, arising in the ordinary course of business. We do not believe that any such proceedings will have a material adverse effect on our business, financial position, results of operation or cash flows.
Item 1A. – Risk Factors
There are certain risks and uncertainties in our business that could cause our actual results to differ materially from those anticipated. In “PART I – Item 1A. – Risk Factors” of the 2023 Form 10-K, as filed with the SEC on July 31, 2023, and available at www.sec.gov or at www.worthingtonenterprises.com, we included a detailed discussion of our risk factors. Our risk factors have not changed significantly from those disclosed in the 2023 Form 10-K. These risk factors should be read carefully in connection with evaluating our business and investments in the common shares and in connection with the forward-looking statements and other information contained in this Form 10-Q. Any of the risks described in the 2023 Form 10-K could materially affect our business, consolidated financial condition or future results and the actual outcome of matters as to which forward-looking statements are made. The risk factors described in the 2023 Form 10-K are not the only risks we face. Additional risks and uncertainties not currently known to us, or that we currently deem to be immaterial, also may materially adversely affect our business, consolidated financial condition and/or future results.
Item 2. – Unregistered Sales of Equity Securities and Use of Proceeds
Unregistered Sales of Equity Securities
There were no equity securities of Worthington Enterprises sold by Worthington Enterprises during the six months ended November 30, 2023, that were not registered under the Securities Act of 1933, as amended.
Issuer Purchases of Equity Securities
Common shares withheld to cover tax withholding obligations in connection with the vesting of restricted common shares are treated as common share repurchases. Those withheld common shares are not considered common share repurchases under an authorized common share repurchase plan. The table below provides information regarding common shares withheld from our employees to satisfy minimum statutory tax withholding obligations arising from the vesting of restricted common shares. The presentation of the table below and related footnote represents full common share amounts.
| | | | | | | | | | | | | | | | |
| | | | | | | | Total Number of | | | | |
| | | | | | | | Common Shares | | | | |
| | | | | | | | Purchased as | | | Maximum Number of | |
| | Total Number | | | Average Price | | | Part of Publicly | | | Common Shares that | |
| | of Common | | | Paid per | | | Announced | | | May Yet Be | |
| Shares | | | Common | | | Plans or | | | Purchased Under the | |
Period | | Purchased | | | Share | | | Programs | | | Plans or Programs (1) | |
September 1-30, 2023 | | 140,488 | | | $ | 69.28 | | | | - | | | | 6,065,000 | |
October 1-31, 2023 | | 23 | | | | 61.55 | | | | - | | | | 6,065,000 | |
November 1-30, 2023 | | 198 | | | | 66.34 | | | | - | | | | 6,065,000 | |
Total | | | 140,709 | | | $ | 69.16 | | | | - | | | | |
(1)The number shown represents, as of the end of each period, the maximum number of common shares that could be purchased under the publicly announced repurchase authorizations then in effect. On March 20, 2019, the Board authorized the repurchase of up to 6,600,000 common shares. On March 24, 2021, the Board authorized the repurchase of up to an additional 5,618,464 common shares, increasing the total number of common shares then authorized for repurchase to 10,000,000 (net of previously repurchased common shares). A total of 3,935,000 common shares have been repurchased since the latest authorization, leaving 6,065,000 common shares available for repurchase under these authorizations at November 30, 2023, and such authorizations are not subject to a fixed expiration date. The common shares available for repurchase under the authorizations currently in effect may be purchased from time to time, with consideration given to the market price of the common shares, the nature of other investment opportunities, cash flows from operations, general economic conditions and other relevant considerations. Repurchases may be made on the open market or through privately-negotiated transactions.
38
Table of Contents
Item 3. – Defaults Upon Senior Securities
Not applicable.
Item 4. – Mine Safety Disclosures
Not applicable.
Item 5. – Other Information
No response required.
39
Table of Contents
Item 6. – Exhibits
| | |
Exhibit No. | | Description |
| | |
2.1 | | Separation and Distribution Agreement, dated November 30, 2023, between Worthington Enterprises, Inc. and Worthington Steel, Inc. (Incorporated herein by reference to Exhibit 2.1 to the Current Report on Form 8-K of Worthington Enterprises, Inc. filed with the SEC on December 5, 2023 (SEC File No. 1-8399)) |
| | |
3.1 | | Amended Articles of Incorporation of Worthington Enterprises, Inc. [This document represents the articles of incorporation of Worthington Enterprises, Inc. in compiled form incorporating all amendments.] * |
| | |
3.2 | | Code of Regulations of Worthington Enterprises, Inc. (reflecting all amendments through the date of this Quarterly Report on Form 10-Q) [This document represents the code of regulations of Worthington Enterprises, Inc. in compiled form incorporating all amendments.] (Incorporated herein by reference to Exhibit 3(b) to the Quarterly Report on Form 10-Q of Worthington Enterprises, Inc. for the quarterly period ended August 31, 2000 (SEC File No. 1-8399)) |
| | |
4.1 | | Fourth Amended and Restated Credit Agreement, dated as of September 27, 2023, among Worthington Enterprises, Inc., as a Borrower; PNC Bank, National Association, as a Lender, the Swingline Lender, an Issuing Bank and Administrative Agent; JPMorgan Chase Bank, N.A. and Bank of America, N.A., as Lenders and Syndication Agents; U.S. Bank National Association, The Huntington National Bank, Fifth Third Bank, National Association, The Northern Trust Company, First National Bank of Pennsylvania and Goldman Sachs Bank USA, as Lenders; and Wells Fargo Bank, National Association and BMO Harris Bank, N.A., as the Departing Lenders; with Citibank, N.A. and The Huntington National Bank serving as Co-Documentation Agents; and JPMorgan Chase Bank, N.A., PNC Capital Markets LLC and BofA Securities, Inc. serving as Joint Bookrunners and Joint Lead Arrangers (Incorporated herein by reference to Exhibit 4.1 to the Current Report on Form 8-K of Worthington Enterprises, Inc. filed with the SEC on September 28, 2023 (SEC File No. 1-8399)) |
| | |
4.2 | | Amendment No. 2 to Note Purchase and Private Shelf Agreement, dated as of November 1, 2023, by and among Worthington Enterprises, Inc., Worthington Industries International S.á.r.l., Worthington Cylinders GmbH, PGIM, Inc., the Prudential Insurance Company of America, Pruco Life Insurance Company of New Jersey, Pruco Life Insurance Company and the other affiliates of Prudential who become party thereto from time to time (Incorporated herein by reference to Exhibit 4.1 to the Current Report on Form 8-K of Worthington Enterprises filed with the SEC on November 7, 2023 (SEC File No. 1-8399)) |
| | |
4.3 | | Form of 2.06% Amended and Restated Series A Note Due August 23, 2031 issued on November 1, 2023, by Worthington Industries International S.á.r.l. (Incorporated herein by reference to Exhibit 4.2 to the Current Report on Form 8-K of Worthington Enterprises filed with the SEC on November 7, 2023 (SEC File No. 1-8399)) |
| | |
4.4 | | Form of 2.40% Amended and Restated Series B Notes Due August 23, 2034 issued on November 1, 2023, by Worthington Cylinders GmbH (Incorporated herein by reference to Exhibit 4.3 to the Current Report on Form 8-K of Worthington Enterprises filed with the SEC on November 7, 2023 (SEC File No. 1-8399)) |
| | |
10.1 | | Transition Services Agreement, dated November 30, 2023, between Worthington Enterprises, Inc. and Worthington Steel, Inc. (Incorporated herein by reference to Exhibit 10.1 to the Current Report on Form 8-K of Worthington Enterprises, Inc. filed with the SEC on December 5, 2023 (SEC File No. 1-8399)) |
| | |
10.2 | | Tax Matters Agreement, dated November 30, 2023, between Worthington Enterprises, Inc. and Worthington Steel, Inc. (Incorporated herein by reference to Exhibit 10.2 to the Current Report on Form 8-K of Worthington Enterprises, Inc. filed with the SEC on December 5, 2023 (SEC File No. 1-8399)) |
| | |
10.3 | | Employee Matters Agreement, dated November 30, 2023, between Worthington Enterprises, Inc. and Worthington Steel, Inc. (Incorporated herein by reference to Exhibit 10.3 to the Current Report on Form 8-K of Worthington Enterprises, Inc. filed with the SEC on December 5, 2023 (SEC File No. 1-8399)) |
| | |
10.4 | | Trademark License Agreement, dated November 30, 2023, between Worthington Enterprises, Inc. and Worthington Steel, Inc. (Incorporated herein by reference to Exhibit 10.4 to the Current Report on Form 8-K of Worthington Enterprises, Inc. filed with the SEC on December 5, 2023 (SEC File No. 1-8399)) |
| | |
10.5 | | WBS License Agreement, dated November 30, 2023, between Worthington Enterprises, Inc. and Worthington Steel, Inc. (Incorporated herein by reference to Exhibit 10.5 to the Current Report on Form 8-K of Worthington Enterprises, Inc. filed with the SEC on December 5, 2023 (SEC File No. 1-8399)) |
40
Table of Contents
| | |
Exhibit No. | | Description |
| | |
10.6 | | Steel Supply Agreement, dated November 30, 2023, between Worthington Enterprises, Inc. and Worthington Steel, Inc. (Incorporated herein by reference to Exhibit 10.6 to the Current Report on Form 8-K of Worthington Enterprises, Inc. filed with the SEC on December 5, 2023 (SEC File No. 1-8399)) + |
| | |
31.1 | | Rule 13a - 14(a) / 15d - 14(a) Certifications (Principal Executive Officer) * |
| | |
31.2 | | Rule 13a - 14(a) / 15d - 14(a) Certifications (Principal Financial Officer) * |
| | |
32.1 | | Certifications of Principal Executive Officer Pursuant to 18 U.S.C. Section 1350, as Adopted Pursuant to Section 906 of the Sarbanes-Oxley Act of 2002** |
| | |
32.2 | | Certifications of Principal Financial Officer Pursuant to 18 U.S.C. Section 1350, as Adopted Pursuant to Section 906 of the Sarbanes-Oxley Act of 2002** |
| | |
101.INS | | XBRL Instance Document – the instance document does not appear in the Interactive Date File because its XBRL tags are embedded within the Inline XBRL document. |
| | |
101.SCH | | Inline XBRL Taxonomy Extension Schema Document # |
| | |
101.PRE | | Inline XBRL Taxonomy Extension Presentation Linkbase Document # |
| | |
101.LAB | | Inline XBRL Taxonomy Extension Label Linkbase Document # |
| | |
101.CAL | | Inline XBRL Taxonomy Extension Calculation Linkbase Document # |
| | |
101.DEF | | Inline XBRL Taxonomy Definition Linkbase Document # |
| | |
104 | | Cover Page Interactive Data File – the cover page from this Quarterly Report on Form 10-Q for the quarterly period ended November 30, 2023, formatted in Inline XBRL (is included within the Exhibit 101 attachments). |
* Filed herewith.
** Furnished herewith.
† Indicates a management contract or compensatory plan or arrangement.
+ Certain portions of this document that constitute confidential information have been redacted in accordance with Regulation S-K, Item 601(b)(10).
# Attached as Exhibit 101 to this Form 10-Q of Worthington Enterprises are the following documents formatted in Inline XBRL (Extensible Business Reporting Language):
(i)Consolidated Balance Sheets at November 30, 2023 and May 31, 2023;
(ii)Consolidated Statements of Earnings for the three months and six months ended November 30, 2023 and November 30, 2022;
(iii)Consolidated Statements of Comprehensive Income for the three months and six months ended November 30, 2023 and November 30, 2022;
(iv)Consolidated Statements of Cash Flows for the three months and six months ended November 30, 2023 and November 30, 2022; and
(v)Condensed Notes to Consolidated Financial Statements.
41
Table of Contents
Signatures
Pursuant to the requirements of the Securities Exchange Act of 1934, the Registrant has duly caused this report to be signed on its behalf by the undersigned thereunto duly authorized.
| | |
| | WORTHINGTON ENTERPRISES, INC. |
| | |
Date: January 9, 2024 | By: | /s/ Joseph B. Hayek |
| | Joseph B. Hayek, |
| | Vice President and Chief Financial Officer |
| | (On behalf of the Registrant as Duly Authorized Officer and as Principal Financial Officer) |
42