
UNITED STATES
SECURITIES AND EXCHANGE COMMISSION
Washington, D.C. 20549
FORM 10-Q
x | QUARTERLY REPORT PURSUANT TO SECTION 13 OR 15(d) OF THE SECURITIES EXCHANGE ACT OF 1934 |
For the quarterly period ended February 28, 2006
OR
¨ | TRANSITION REPORT PURSUANT TO SECTION 13 OR 15(d) OF THE SECURITIES EXCHANGE ACT OF 1934 |
For the transition period from to
Commission File Number 1-8399
WORTHINGTON INDUSTRIES, INC.
(Exact name of registrant as specified in its charter)
| | | | |
| Ohio | | | | 31-1189815 |
| (State or other jurisdiction of incorporation or organization) | | | | (IRS Employer Identification No.) |
| | |
| 200 Old Wilson Bridge Road, Columbus, Ohio | | | | 43085 |
| (Address of principal executive offices) | | | | (Zip Code) |
(Registrant’s telephone number, including area code)
(Former name, former address and former fiscal year, if changed since last report)
Indicate by check mark whether the registrant (1) has filed all reports required to be filed by Section 13 or 15(d) of the Securities Exchange Act of 1934 during the preceding 12 months (or for such shorter period that the registrant was required to file such reports) and (2) has been subject to such filing requirements for the past 90 days.
YES x NO ¨
Indicate by check mark whether the registrant is a large accelerated filer, an accelerated filer, or a non-accelerated filer. See definition of “accelerated filer and large accelerated filer” in Rule 12b-2 of the Exchange Act. (Check one):
Large accelerated filer x Accelerated filer ¨ Non-accelerated filer ¨
Indicate by check mark whether the registrant is a shell company (as defined in Rule 12b-2 of the Exchange Act).
YES ¨ NO x
APPLICABLE ONLY TO CORPORATE ISSUERS:
Indicate the number of shares outstanding of each of the Issuer’s classes of common stock, as of the latest practicable date.
As of March 31, 2006, 88,588,604 of the registrant’s common shares, without par value, were outstanding.
TABLE OF CONTENTS
i
SAFE HARBOR STATEMENT
Selected statements contained in this Quarterly Report on Form 10-Q, including, without limitation, in “PART I –Item 2. –Management’s Discussion and Analysis of Financial Condition and Results of Operations”, constitute “forward-looking statements” as that term is used in the Private Securities Litigation Reform Act of 1995. Such forward-looking statements are based, in whole or in part, on management’s beliefs, estimates, assumptions and currently available information and can often be identified by the words “will”, “may”, “designed to”, “outlook”, “believes”, “should”, “plans”, “expects”, “intends”, “estimates” and similar expressions. These forward-looking statements include, without limitation, statements relating to:
| | • | | future estimated or expected earnings, charges, capacity, working capital, sales, operating results, earnings per share or the earnings impact of certain matters; |
| | • | | pricing trends for raw materials and finished goods; |
| | • | | anticipated capital expenditures and asset sales; |
| | • | | projected timing, results, costs, charges and expenditures related to facility dispositions, shutdowns and consolidations; |
| | • | | new products and markets; |
| | • | | expectations for customer inventories, jobs and orders; |
| | • | | expectations for the economy and markets; |
| | • | | expected benefits from new initiatives, such as the Enterprise Resource Planning System; |
| | • | | the effects of judicial rulings; and |
| | • | | other non-historical trends. |
Because they are based on beliefs, estimates and assumptions, forward-looking statements are inherently subject to risks and uncertainties that could cause actual results to differ materially from those projected. Any number of factors could affect actual results, including, without limitation:
| | • | | product demand and pricing, changes in product mix and market acceptance of products; |
| | • | | fluctuations in pricing, quality or availability of raw materials (particularly steel), supplies, utilities, transportation, and other items required by operations; |
| | • | | effects of facility closures and the consolidation of operations; |
| | • | | the ability to realize cost savings and operational efficiencies on a timely basis; |
| | • | | the ability to integrate newly-acquired businesses and achieve synergies therefrom; |
| | • | | capacity levels and efficiencies within facilities and within the industry as a whole; |
| | • | | financial difficulties (including bankruptcy filings) of customers, suppliers, joint venture partners and others with whom we do business; |
| | • | | the effect of national, regional and worldwide economic conditions generally and within major product markets, including a prolonged or substantial economic downturn; |
| | • | | the effect of adverse weather on suppliers, customers, markets, facilities and shipping operations; |
| | • | | changes in customer inventories, spending patterns and supplier choices; |
| | • | | risks associated with doing business internationally, including economic, political and social instability and foreign currency exposure; |
| | • | | acts of war and terrorist activities; |
| | • | | the ability to improve processes and business practices to keep pace with the economic, competitive and technological environment; |
| | • | | deviation of actual results from estimates and/or assumptions used by us in the application of our significant accounting policies; |
| | • | | level of imports and import prices in our markets; |
| | • | | the impact of judicial rulings and governmental regulations, both in the United States and abroad; and |
| | • | | other risks described from time to time in our filings with the Securities and Exchange Commission. |
Any forward-looking statements in this Quarterly Report on Form 10-Q are based on current information as of the date of this Quarterly Report on Form 10-Q, and we assume no obligation to correct or update any such statements in the future, except as required by applicable law.
ii
PART I. FINANCIAL INFORMATION
Item 1. - Financial Statements
| | | | | | |
| | | February 28,
2006 | | May 31,
2005 |
| ASSETS | | | | | | |
Current assets: | | | | | | |
Cash and cash equivalents | | $ | 71,370 | | $ | 57,249 |
Short-term investments | | | 42,071 | | | — |
Receivables, net | | | 363,900 | | | 404,506 |
Inventories: | | | | | | |
Raw materials | | | 248,201 | | | 227,718 |
Work in process | | | 95,510 | | | 97,168 |
Finished products | | | 101,928 | | | 100,837 |
| | | | | | |
Total inventories | | | 445,639 | | | 425,723 |
Deferred income taxes | | | 19,289 | | | 19,490 |
Prepaid expenses and other current assets | | | 54,846 | | | 31,365 |
| | | | | | |
Total current assets | | | 997,115 | | | 938,333 |
Investments in unconsolidated affiliates | | | 142,995 | | | 136,856 |
Goodwill | | | 176,298 | | | 168,267 |
Other assets | | | 43,765 | | | 33,593 |
| | |
Property, plant and equipment | | | 1,103,332 | | | 1,071,696 |
Less accumulated depreciation | | | 554,271 | | | 518,740 |
| | | | | | |
Property, plant and equipment, net | | | 549,061 | | | 552,956 |
| | | | | | |
Total assets | | $ | 1,909,234 | | $ | 1,830,005 |
| | | | | | |
| LIABILITIES AND SHAREHOLDERS’ EQUITY | | | | | | |
Current liabilities: | | | | | | |
Accounts payable | | $ | 321,047 | | $ | 280,181 |
Current maturities of long-term debt | | | 142,409 | | | 143,432 |
Other current liabilities | | | 105,622 | | | 121,830 |
| | | | | | |
Total current liabilities | | | 569,078 | | | 545,443 |
Other liabilities | | | 56,292 | | | 56,262 |
Long-term debt | | | 245,000 | | | 245,000 |
Deferred income taxes | | | 117,500 | | | 119,462 |
Minority interest | | | 44,601 | | | 43,002 |
Shareholders’ equity | | | 876,763 | | | 820,836 |
| | | | | | |
Total liabilities and shareholders’ equity | | $ | 1,909,234 | | $ | 1,830,005 |
| | | | | | |
See notes to condensed consolidated financial statements.
1
CONDENSED CONSOLIDATED STATEMENTS OF EARNINGS
(Unaudited)
(In thousands, except per share)
| | | | | | | | | | | | | | | | |
| | | Three Months Ended
February 28, | | | Nine Months Ended
February 28, | |
| | | 2006 | | | 2005 | | | 2006 | | | 2005 | |
Net sales | | $ | 681,548 | | | $ | 747,414 | | | $ | 2,075,211 | | | $ | 2,261,922 | |
Cost of goods sold | | | 602,646 | | | | 638,262 | | | | 1,817,549 | | | | 1,868,608 | |
| | | | | | | | | | | | | | | | |
Gross margin | | | 78,902 | | | | 109,152 | | | | 257,662 | | | | 393,314 | |
Selling, general and administrative expense | | | 53,345 | | | | 54,160 | | | | 154,899 | | | | 175,121 | |
Impairment charges and other | | | — | | | | — | | | | — | | | | 5,608 | |
| | | | | | | | | | | | | | | | |
Operating income | | | 25,557 | | | | 54,992 | | | | 102,763 | | | | 212,585 | |
Other income (expense): | | | | | | | | | | | | | | | | |
Miscellaneous expense | | | (255 | ) | | | (812 | ) | | | (60 | ) | | | (7,144 | ) |
Interest expense | | | (6,875 | ) | | | (6,749 | ) | | | (20,157 | ) | | | (18,123 | ) |
Equity in net income of unconsolidated affiliates | | | 8,178 | | | | 14,772 | | | | 35,565 | | | | 39,808 | |
| | | | | | | | | | | | | | | | |
Earnings before income taxes | | | 26,605 | | | | 62,203 | | | | 118,111 | | | | 227,126 | |
Income tax expense | | | 7,448 | | | | 29,081 | | | | 31,519 | | | | 88,522 | |
| | | | | | | | | | | | | | | | |
Net earnings | | $ | 19,157 | | | $ | 33,122 | | | $ | 86,592 | | | $ | 138,604 | |
| | | | | | | | | | | | | | | | |
Average common shares outstanding - basic | | | 88,361 | | | | 87,841 | | | | 88,174 | | | | 87,560 | |
| | | | | | | | | | | | | | | | |
Earnings per share - basic | | $ | 0.22 | | | $ | 0.38 | | | $ | 0.98 | | | $ | 1.58 | |
| | | | | | | | | | | | | | | | |
Average common shares outstanding - diluted | | | 89,152 | | | | 88,698 | | | | 88,870 | | | | 88,492 | |
| | | | | | | | | | | | | | | | |
Earnings per share - diluted | | | 0.21 | | | $ | 0.37 | | | $ | 0.97 | | | $ | 1.57 | |
| | | | | | | | | | | | | | | | |
Cash dividends declared per share | | $ | 0.17 | | | $ | 0.17 | | | $ | 0.51 | | | $ | 0.49 | |
| | | | | | | | | | | | | | | | |
See notes to condensed consolidated financial statements.
2
WORTHINGTON INDUSTRIES, INC.
CONDENSED CONSOLIDATED STATEMENTS OF CASH FLOWS
(Unaudited)
(In thousands)
| | | | | | | | | | | | | | | | |
| | | Three Months Ended
February 28, | | | Nine Months Ended
February 28, | |
| | | 2006 | | | 2005 | | | 2006 | | | 2005 | |
Operating activities: | | | | | | | | | | | | | | | | |
Net earnings | | $ | 19,157 | | | $ | 33,122 | | | $ | 86,592 | | | $ | 138,604 | |
Adjustments to reconcile net earnings to net cash provided (used) by operating activities: | | | | | | | | | | | | | | | | |
Depreciation and amortization | | | 14,024 | | | | 14,072 | | | | 44,133 | | | | 42,579 | |
Impairment charges and other | | | — | | | | — | | | | — | | | | 5,608 | |
Other adjustments | | | 1,340 | | | | 6,469 | | | | (7,811 | ) | | | (28,621 | ) |
Changes in assets and liabilities: | | | | | | | | | | | | | | | | |
Receivables | | | (13,427 | ) | | | (98,872 | ) | | | 46,487 | | | | (45,051 | ) |
Inventories | | | (56,289 | ) | | | (14,526 | ) | | | (20,070 | ) | | | (113,653 | ) |
Accounts payable | | | 6,779 | | | | 13,626 | | | | 39,857 | | | | 900 | |
Other changes | | | (15,543 | ) | | | (17,813 | ) | | | (27,272 | ) | | | (33,644 | ) |
| | | | | | | | | | | | | | | | |
Net cash provided (used) by operating activities | | | (43,959 | ) | | | (63,922 | ) | | | 161,916 | | | | (33,278 | ) |
Investing activities: | | | | | | | | | | | | | | | | |
Investment in property, plant and equipment | | | (18,088 | ) | | | (11,548 | ) | | | (43,101 | ) | | | (30,879 | ) |
Investment in aircraft | | | (16,250 | ) | | | — | | | | (16,250 | ) | | | — | |
Acquisitions, net of cash acquired | | | (6 | ) | | | (81 | ) | | | (6,776 | ) | | | (64,970 | ) |
Investment in unconsolidated affiliate | | | — | | | | — | | | | — | | | | (1,500 | ) |
Proceeds from sale of assets | | | 272 | | | | 172 | | | | 3,054 | | | | 83,976 | |
Purchases of short-term investments | | | (200,492 | ) | | | (72,875 | ) | | | (443,745 | ) | | | (72,875 | ) |
Sales of short-term investments | | | 253,675 | | | | 63,475 | | | | 401,674 | | | | 63,475 | |
| | | | | | | | | | | | | | | | |
Net cash provided (used) by investing activities | | | 19,111 | | | | (20,857 | ) | | | (105,144 | ) | | | (22,773 | ) |
Financing activities: | | | | | | | | | | | | | | | | |
Net proceeds from long-term debt | | | — | | | | 99,480 | | | | — | | | | 99,480 | |
Principal payments on long-term debt | | | (521 | ) | | | (542 | ) | | | (1,011 | ) | | | (2,560 | ) |
Dividends paid | | | (15,012 | ) | | | (14,052 | ) | | | (44,932 | ) | | | (41,953 | ) |
Other | | | 3,029 | | | | (5,113 | ) | | | 3,292 | | | | 5,244 | |
| | | | | | | | | | | | | | | | |
Net cash provided (used) by financing activities | | | (12,504 | ) | | | 79,773 | | | | (42,651 | ) | | | 60,211 | |
| | | | | | | | | | | | | | | | |
Increase (decrease) in cash and cash equivalents | | | (37,352 | ) | | | (5,006 | ) | | | 14,121 | | | | 4,160 | |
Cash and cash equivalents at beginning of period | | | 108,722 | | | | 11,143 | | | | 57,249 | | | | 1,977 | |
| | | | | | | | | | | | | | | | |
Cash and cash equivalents at end of period | | $ | 71,370 | | | $ | 6,137 | | | $ | 71,370 | | | $ | 6,137 | |
| | | | | | | | | | | | | | | | |
See notes to condensed consolidated financial statements.
3
WORTHINGTON INDUSTRIES, INC.
NOTES TO CONDENSED CONSOLIDATED FINANCIAL STATEMENTS
Three and Nine Month Periods Ended February 28, 2006 and 2005
(Unaudited)
NOTE A – Basis of Presentation
The accompanying unaudited condensed consolidated financial statements include the accounts of Worthington Industries, Inc., its subsidiaries and certain of its joint ventures (collectively, the “Company”) and have been prepared in accordance with accounting principles generally accepted in the United States of America (“United States”) for interim financial information and with the instructions to Form 10-Q and Article 10 of Regulation S-X. Accordingly, they do not include all of the information and notes required by accounting principles generally accepted in the United States for complete financial statements. In the opinion of management, all adjustments (consisting of normal recurring accruals) considered necessary for a fair presentation have been included. Operating results for the three and nine months ended February 28, 2006, are not necessarily indicative of the results that may be expected for the fiscal year ending May 31, 2006 (“fiscal 2006”). For further information, refer to the consolidated financial statements and notes thereto included in the Annual Report on Form 10-K of Worthington Industries, Inc. for the fiscal year ended May 31, 2005 (“fiscal 2005”).
Corrections: Operating results for the three months ended February 28, 2006, include the net impact of correcting three errors related to the accrual of expenses in prior periods. First, the under-accrual of income taxes over the last five years at the Acerex, S. A. de C.V. (“Acerex”) joint venture resulted in a $6,062,000 decrease in equity in net income of unconsolidated affiliates during the current quarter. Second, the under-accrual of consulting expenses during the previous five quarters resulted in a $3,985,000 increase to selling, general and administrative expenses during the current quarter. Finally, the over-accrual in the Company’s consolidated income tax provision over the last nine years relating to the foreign earnings of the Worthington Armstrong Venture (“WAVE”) joint venture, resulted in a $3,183,000 reduction to income tax expense in the current quarter. The net impact of these corrections decreased earnings per share for the current quarter and year-to-date periods by $0.04 and $0.01, respectively. This impact is not material to previously reported earnings for any prior fiscal year, estimated income for fiscal 2006 or to the trend of earnings.
Short-term Investments:At February 28, 2006, the Company held $40,000,000 of auction rate municipal bonds classified as available-for-sale securities. The investment in these securities is recorded at cost, which approximates fair market value due to their variable interest rates, which typically reset every 7 to 35 days, and despite the long-term nature of their stated contractual maturities, the Company has the ability to quickly liquidate these securities. As a result, the Company has no cumulative gross unrealized holding gains (losses) or gross realized gains (losses) from these short-term investments. Other miscellaneous investments of $2,071,000 are also included as short-term investments.
Recently Issued Accounting Standards: In November 2004, the Financial Accounting Standards Board (“FASB”) issued Statement of Financial Accounting Standards (“SFAS”) No. 151,Inventory Costs, an amendment of ARB No. 43, Chapter 4(“SFAS 151”). SFAS 151 amends the guidance in Accounting Research Bulletin (“ARB”) No. 43, Chapter 4,Inventory Pricing to clarify the accounting for abnormal amounts of idle facility expense, freight, handling cost, and wasted material (spoilage). In addition, SFAS 151 requires that allocation of fixed production overhead to the costs of conversion be based on the normal capacity of the production facilities. SFAS 151 is effective for inventory costs incurred during fiscal years beginning after June 15, 2005. The Company does not expect the adoption of SFAS 151 to have a material impact on the Company’s financial position or results of operations.
In December 2004, the FASB issued SFAS No. 153,Exchanges of Nonmonetary Assets, an amendment of APB Opinion No. 29 (“SFAS 153”). Accounting Principles Board (“APB”) Opinion No. 29 is based on the principle that exchanges of nonmonetary assets should be measured based on the fair value of the assets exchanged. The guidance in that Opinion, however, included certain exceptions to that principle. SFAS 153 amends APB Opinion No. 29 to eliminate the exception for nonmonetary exchanges of similar productive assets and replaces it with a general exception for exchanges of nonmonetary assets that do not have commercial substance. SFAS 153 is effective for nonmonetary exchanges occurring in fiscal periods beginning after June 15, 2005. The Company does not expect the adoption of SFAS 153 to have a material impact on its financial position or results of operations.
4
NOTE B – Industry Segment Data
Several changes occurred during the second quarter of fiscal 2006 in the Company’s internal organizational and reporting structures. The Automotive Body Panels operating segment, consisting of The Gerstenslager Company, which was previously combined with Steel Processing in the Processed Steel Products segment, was moved to the “Other” category, and the Processed Steel Products segment was renamed Steel Processing. The Construction Services operating segment was formed and consists of Dietrich Building Systems, Inc. (previously included in the Metal Framing segment), Dietrich Residential Construction, LLC (which is now wholly-owned, see Note I), and a research and development project in China. Construction Services will also be reported in the “Other” category. The “Other” category now includes Automotive Body Panels, Construction Services and Steel Packaging operating segments and income and expense items not allocated to the six operating segments. Summarized financial information for the Company’s reportable segments is shown in the following table. All prior period financial information has been reclassified to reflect the segment changes mentioned above.
| | | | | | | | | | | | | | | |
| | | Three Months Ended
February 28, | | | Nine Months Ended
February 28, | |
| In thousands | | 2006 | | | 2005 | | | 2006 | | 2005 | |
Net sales | | | | | | | | | | | | | | | |
Steel Processing | | $ | 351,933 | | | $ | 414,557 | | | $ | 1,068,018 | | $ | 1,280,847 | |
Metal Framing | | | 179,659 | | | | 193,673 | | | | 577,178 | | | 621,746 | |
Pressure Cylinders | | | 110,629 | | | | 112,347 | | | | 324,145 | | | 280,055 | |
Other | | | 39,327 | | | | 26,837 | | | | 105,870 | | | 79,274 | |
| | | | | | | | | | | | | | | |
| | $ | 681,548 | | | $ | 747,414 | | | $ | 2,075,211 | | $ | 2,261,922 | |
| | | | | | | | | | | | | | | |
Operating income | | | | | | | | | | | | | | | |
Steel Processing | | $ | 10,621 | | | $ | 31,207 | | | $ | 43,647 | | $ | 101,762 | |
Metal Framing | | | 5,768 | | | | 14,951 | | | | 30,020 | | | 95,160 | |
Pressure Cylinders | | | 9,881 | | | | 10,450 | | | | 29,049 | | | 22,467 | |
Other | | | (713 | ) | | | (1,616 | ) | | | 47 | | | (6,804 | ) |
| | | | | | | | | | | | | | | |
| | $ | 25,557 | | | $ | 54,992 | | | $ | 102,763 | | $ | 212,585 | |
| | | | | | | | | | | | | | | |
| | | | |
| | | | | | | | | February 28,
2006 | | May 31,
2005 | |
Total assets | | | | | | | | | | | | | | | |
Steel Processing | | | | | | | | | | $ | 784,222 | | $ | 781,049 | |
Metal Framing | | | | | | | | | | | 475,778 | | | 496,155 | |
Pressure Cylinders | | | | | | | | | | | 273,586 | | | 268,862 | |
Other | | | | | | | | | | | 375,648 | | | 283,939 | |
| | | | | | | | | | | | | | | |
| | | | | | | | | | $ | 1,909,234 | | $ | 1,830,005 | |
| | | | | | | | | | | | | | | |
5
NOTE C – Comprehensive Income
The components of other comprehensive income, net of tax, were as follows:
| | | | | | | | | | | | | | | | |
| | | Three Months Ended
February 28, | | | Nine Months Ended
February 28, | |
| In thousands | | 2006 | | | 2005 | | | 2006 | | | 2005 | |
Net earnings | | $ | 19,157 | | | $ | 33,122 | | | $ | 86,592 | | | $ | 138,604 | |
Foreign currency translation | | | 554 | | | | (623 | ) | | | (1,278 | ) | | | 4,129 | |
Cash flow hedges | | | 916 | | | | 252 | | | | 7,871 | | | | 2,001 | |
Other | | | (11 | ) | | | (262 | ) | | | 851 | | | | (194 | ) |
| | | | | | | | | | | | | | | | |
Total comprehensive income | | $ | 20,616 | | | $ | 32,489 | | | $ | 94,036 | | | $ | 144,540 | |
| | | | | | | | | | | | | | | | |
NOTE D – Stock-Based Compensation
At February 28, 2006, the Company had stock option plans for employees and non-employee directors. The Company accounts for these plans under the recognition and measurement principles of APB opinion No. 25,Accounting for Stock Issued to Employees, and related interpretations. No stock-based employee compensation cost is reflected in net earnings, as all options granted under the plans had an exercise price equal to the fair market value of the underlying common shares of Worthington Industries, Inc. on the date of the grant. Pro forma information regarding net earnings and earnings per share is required by SFAS No. 123,Accounting for Stock-Based Compensation (“SFAS 123”), as amended by SFAS No. 148,Accounting for Stock-Based Compensation – Transition and Disclosure.
In December 2004, the FASB issued SFAS No. 123 (revised 2004),Share-Based Payment(“SFAS 123(R)”).SFAS 123(R) is a revision of SFAS 123 and it supercedes APB opinion No. 25 and amends SFAS No. 95,Statement of Cash Flows.Generally, the approach in SFAS 123(R) is similar to the approach described in SFAS 123. However, SFAS 123(R) requires all share-based payments to employees, including grants of employee stock options, to be recognized in the income statement based on their fair values. Pro forma disclosure will not be an alternative. SFAS 123(R) is effective for all fiscal years beginning after June 15, 2005, and thus will become effective for the Company in the fiscal year ending May 31, 2007. Early adoption will be permitted in periods in which financial statements have not yet been issued.
SFAS 123(R) permits public companies to choose between the following two adoption methods:
1. A “modified prospective” method in which compensation cost is recognized beginning with the effective date (a) based on the requirements of SFAS 123(R) for all share-based payments granted after the effective date and (b) based on the requirements of SFAS 123 for all awards granted to employees prior to the effective date of SFAS 123(R) that remain unvested on the effective date.
2. A “modified retrospective” method which includes the requirements of the modified prospective method described above, but also permits entities to restate based on the amounts previously recognized under SFAS 123 for purposes of pro forma disclosures either (a) all prior periods presented or (b) prior interim periods of the year of adoption.
The adoption of SFAS 123(R)’s fair value method will have an impact on the Company’s results of operations, although it will have no impact on the Company’s overall financial position. Stock option expense after the adoption of SFAS 123(R) is not expected to be materially different than the expense reported in the table below, but this will not be known until a full analysis of the impact of SFAS 123(R) is completed. The impact will largely depend on levels of share-based payments granted in the future.
On March 29, 2005, the Securities and Exchange Commission (“SEC”) issued Staff Accounting Bulletin No. 107 (“SAB 107”). SAB 107 provides interpretations expressing the views of the SEC staff regarding the interaction between SFAS 123(R) and certain SEC rules and regulations, and provides the staff’s views regarding
6
the valuation of share-based payment arrangements for public companies. SAB 107 does not modify any of SFAS 123(R)’s conclusions or requirements.
The following table illustrates the effect on net earnings and earnings per share if the Company had accounted for stock option plans using the fair value method, as required by SFAS 123, for the periods indicated:
| | | | | | | | | | | | |
| | | Three Months Ended
February 28, | | Nine Months Ended
February 28, |
| In thousands, except per share | | 2006 | | 2005 | | 2006 | | 2005 |
Net earnings, as reported | | $ | 19,157 | | $ | 33,122 | | $ | 86,592 | | $ | 138,604 |
Deduct: total stock-based employee compensation expense determined under fair value based method, net of tax | | | 604 | | | 439 | | | 1,770 | | | 1,316 |
| | | | | | | | | | | | |
Pro forma net earnings | | $ | 18,553 | | $ | 32,683 | | $ | 84,822 | | $ | 137,288 |
| | | | | | | | | | | | |
Earnings per share: | | | | | | | | | | | | |
Basic, as reported | | $ | 0.22 | | $ | 0.38 | | $ | 0.98 | | $ | 1.58 |
Basic, pro forma | | $ | 0.21 | | $ | 0.37 | | $ | 0.96 | | $ | 1.57 |
Diluted, as reported | | $ | 0.21 | | $ | 0.37 | | $ | 0.97 | | $ | 1.57 |
Diluted, pro forma | | $ | 0.21 | | $ | 0.37 | | $ | 0.96 | | $ | 1.56 |
NOTE E – Employee Pension Plans
The following table summarizes the components of net periodic pension cost for the Company’s defined benefit plans for the periods indicated:
| | | | | | | | | | | | | | | | |
| | | Three Months Ended
February 28, | | | Nine Months Ended
February 28, | |
| In thousands | | 2006 | | | 2005 | | | 2006 | | | 2005 | |
Defined benefit plans: | | | | | | | | | | | | | | | | |
Service cost | | $ | 243 | | | $ | 174 | | | $ | 729 | | | $ | 660 | |
Interest cost | | | 246 | | | | 184 | | | | 738 | | | | 607 | |
Expected return on plan assets | | | (199 | ) | | | (152 | ) | | | (597 | ) | | | (457 | ) |
Net amortization and deferral | | | 81 | | | | 56 | | | | 243 | | | | 233 | |
| | | | | | | | | | | | | | | | |
Net pension cost on defined benefit plans | | $ | 371 | | | $ | 262 | | | $ | 1,113 | | | $ | 1,043 | |
| | | | | | | | | | | | | | | | |
The Company funded its pension obligations with a $2,659,000 payment in fiscal 2006.
NOTE F – Income Taxes
Income tax expense for the first nine months of fiscal 2006 and fiscal 2005 reflects an estimated annual effective income tax rate of 29.7% and 38.7%, respectively. Management is required to estimate the annual effective tax rate based upon its forecast of annual pre-tax income for domestic and foreign operations. To the extent that actual pre-tax results differ from the forecast estimates applied at the end of the most recent interim period, the actual tax rate recognized in fiscal 2006 could be materially different from the forecast rate as of the end of the third quarter.
Income tax expense for the first nine months of fiscal 2006 was reduced by the following: $4,483,000 due to an adjustment to reduce deferred tax liabilities as a result of the new Ohio corporate tax legislation enacted June 30, 2005; $683,000 to decrease accrued income taxes for the first 20% phase-out of the Ohio franchise tax;
7
$1,528,000 to decrease other liabilities due to favorable tax audit settlements and related developments; and $4,721,000 ($1,396,000 recorded in the second quarter of fiscal 2006) for the over-accrual of deferred tax liabilities related to the foreign earnings of the WAVE joint venture.
Income tax expense for the first nine months of fiscal 2005 was reduced by $1,735,000 to decrease other liabilities due to favorable tax audit settlements and related developments and increased by $4,290,000 due to a ruling by the Sixth Circuit Court of Appeals that the state of Ohio’s investment tax program is unconstitutional.
On October 22, 2004, the President of the United States signed the American Jobs Creation Act of 2004 (the “Act”). The Act provides a deduction for income from qualified domestic production activities, which will be phased in from fiscal 2006 through fiscal 2011. Under the guidance of FASB Staff Position No. FAS 109-1,Application of FASB Statement No. 109, Accounting for Income Taxes, to the Tax Deduction on Qualified Production Activities Provided by the American Jobs Creation Act of 2004,the deduction will be treated as a special deduction as described in SFAS No. 109,Accounting for Income Taxes (“SFAS No. 109”). As such, the special deduction will have no effect on deferred tax assets and liabilities existing as of the enactment date. Rather, the impact of this deduction is reflected in the estimated annual effective income tax rate discussed above.
The Act also provides an 85% dividends-received-deduction on qualifying dividends from controlled foreign corporations. On December 21, 2004, the FASB issued FASB Staff Position No. FAS 109-2,Accounting and Disclosure Guidance for the Foreign Earnings Repatriation Provision within the American Jobs Creation Act of 2004, which provides relief concerning the timing of the SFAS No. 109 requirement to accrue deferred taxes for unremitted earnings of foreign subsidiaries. The FASB determined that the provisions of the Act were sufficiently complex and ambiguous that companies may not be in a position to determine the impact of the Act on their plans for repatriation or reinvestment of foreign earnings or the corresponding deferred tax liability. Accrual of any deferred tax liability is not required until companies have the information necessary to determine the amount of earnings to be repatriated and a reasonable estimate can be made of the deferred tax liability.
The Company is still evaluating the potential effect this provision will have should it decide to repatriate earnings from its directly owned foreign operations. This evaluation will be completed in fiscal 2006. Depending on the outcome of this evaluation, the Company could repatriate up to $70,300,000, representing all of its foreign earnings in directly owned operations. Total repatriation of these foreign earnings would increase tax expense by $3,700,000.
8
NOTE G – Investments in Unconsolidated Affiliates
The Company’s investments in unconsolidated affiliated companies, which are not controlled through majority ownership or otherwise, are accounted for using the equity method. These equity investments and the percentage interest owned consist of WAVE (50%), TWB Company, LLC (50%), Acerex (50%), Worthington Specialty Processing (50%), Aegis Metal Framing, LLC (60%), and Viking & Worthington Steel Enterprise, LLC (49%). Dietrich Residential Construction, LLC’s (50%) results are included in the amounts below before the acquisition date (see Note I).
The Company received distributions from these affiliated companies totaling $29,168,000 during the nine months ended February 28, 2006.
Combined financial information for these affiliated companies is summarized in the following table:
| | | | | | |
| In thousands | | February 28,
2006 | | May 31,
2005 |
Cash | | $ | 113,820 | | $ | 111,070 |
Other current assets | | | 185,553 | | | 204,239 |
Noncurrent assets | | | 127,076 | | | 142,065 |
Current maturities of long-term debt | | | 3,158 | | | 56,000 |
Other current liabilities | | | 95,942 | | | 99,894 |
Long-term debt | | | 42,912 | | | 33,362 |
Other noncurrent liabilities | | | 6,292 | | | 3,061 |
| | | | | | | | | | | | |
| | | Three Months Ended
February 28, | | Nine Months Ended
February 28, |
| | | 2006 | | 2005 | | 2006 | | 2005 |
Net sales | | $ | 192,706 | | $ | 191,733 | | $ | 605,487 | | $ | 555,677 |
Gross margin | | | 42,429 | | | 40,166 | | | 129,769 | | | 119,476 |
Depreciation and amortization | | | 4,381 | | | 5,154 | | | 14,231 | | | 15,206 |
Interest expense | | | 594 | | | 816 | | | 2,587 | | | 2,358 |
Income tax expense | | | 14,146 | | | 814 | | | 16,437 | | | 2,453 |
Net earnings | | | 14,460 | | | 24,139 | | | 67,540 | | | 72,921 |
NOTE H – Debt
On September 29, 2005, Worthington Industries, Inc. amended and restated its $435,000,000 long-term revolving credit facility. The amendment provides for an extension of the facility commitments to September 2010; replaces the leverage ratio (debt-to-EBITDA) financial covenant with an interest coverage ratio (EBITDA-to-interest expense) financial covenant of not less than 3.25 times; and reduces the facility fees payable. The proceeds of the amended and restated facility may be used to fund general corporate purposes including working capital, capital expenditures, acquisitions and dividends. The facility was unused at February 28, 2006.
9
NOTE I – Acquisitions
During October 2005, the Company acquired the remaining 50% interest in Dietrich Residential Construction, LLC (“DRC”) from its partner, Pacific Steel Construction, for $3,773,000 cash and debt assumption of $4,153,000. The acquisition was recorded using the purchase accounting method, and the results of DRC, which were previously reported as equity in net income of an unconsolidated affiliate, have been included in the consolidated results of the “Other” category since the date of acquisition. The excess of the purchase price over the historical book value of $6,442,000 has been allocated to goodwill pending final asset valuations.
During November 2005, the Company acquired the remaining 40% interest in Dietrich Metal Framing Canada, Inc. (“DMF”) from its minority partner, Encore Coils Holdings Ltd., for $3,003,000 cash. The acquisition was recorded using the purchase accounting method, and 100% of the results of DMF, which were previously reduced by the minority interest, have been included in the consolidated results of the Metal Framing segment since the date of acquisition. The excess of the purchase price over the historical book value of $1,672,000 has been allocated to goodwill pending final asset valuations.
Pro forma results, including the acquired businesses since the beginning of the earliest period presented, would not be materially different than actual results.
NOTE J – Subsequent Events
On March 2, 2006, the Company announced the planned closure of its Dietrich Metal Framing (“DMF”) manufacturing facility in LaPorte, Indiana. Based on an impairment test of the assets at February 28, 2006, no loss is anticipated. Forty-nine people are employed at the LaPorte facility, which is expected to cease operations by the end of June 2006. The exit costs are not expected to be material.
On April 6, 2006, the Company reached an agreement to sell its 50% interest in Acerex to its partner, Ternium, S. A., for $44,604,000 cash. The sale is expected to close before April 26, 2006.
10
Item 2. - Management’s Discussion and Analysis of Financial Condition and Results of Operations
Selected statements contained in this “Item 2. – Management’s Discussion and Analysis of Financial Condition and Results of Operations” constitute “forward-looking statements” as that term is used in the Private Securities Litigation Reform Act of 1995. Such forward-looking statements are based, in whole or in part, on management’s beliefs, estimates, assumptions and currently available information. For a more detailed discussion of what constitutes a forward-looking statement and of some of the factors that could cause actual results to differ materially from such forward-looking statements, please refer to the “Safe Harbor Statement” in the beginning of this Quarterly Report on Form 10-Q.
Overview
The following discussion and analysis of key economic and industry indicators and trends, business strategy, and the results of operations and financial condition of Worthington Industries, Inc., together with its subsidiaries (collectively, “we,” “our,” “Worthington,” or the “Company”), should be read in conjunction with our consolidated financial statements included in “Item 1. – Financial Statements.” Our Annual Report on Form 10-K for the fiscal year ended May 31, 2005 (“fiscal 2005”), includes additional information about our Company, our operations and our financial position, and should be read in conjunction with this Quarterly Report on Form 10-Q.
Worthington is a diversified metal processing company that focuses on value-added steel processing and manufactured metal products. As of February 28, 2006, excluding our joint ventures, we operated 48 manufacturing facilities worldwide, principally in three reportable business segments: Steel Processing, Metal Framing and Pressure Cylinders. We also held equity positions in 7 joint ventures, which operated 16 manufacturing facilities worldwide as of February 28, 2006.
Key Economic Indicators and Trends
To better understand the markets in which each of our business segments operate and the performance of those segments, we monitor certain national and industry data. During the three months ended February 28, 2006, domestic GDP continued to expand, up 3% over the preceding year’s fiscal third quarter and slightly over the previous quarter.
Commercial construction, the end market for approximately 41% of our net sales, was much improved as indicated by the U.S. Census Bureau’s Index of Private Construction Spending, which was 13% above last year’s third fiscal quarter and 5% higher than the previous quarter. Our largest construction market sector, office buildings, improved 12% above the same quarter of the prior year and 4% above the prior quarter. A more favorable demand environment is conducive to rising prices. We announced two price increases for our metal framing customers, which are scheduled to become effective in March and April. The hurricanes that hit the Gulf Coast states during the first part of our fiscal year ending May 31, 2006 (“fiscal 2006”) had no direct impact on our facilities. However, some Metal Framing customers’ plants, representing approximately 2-3% of Metal Framing’s business, were shut down. We estimate that recovery may take a year or more, but a significant rebuilding period should follow that would benefit this segment. An indirect impact from the hurricanes has increased zinc, energy and transportation costs. These costs were $2.5 million higher than last quarter and $6.8 million higher than last year’s third quarter.
The automotive end market, which represents approximately 33% of our net sales, had mixed results. Total North American vehicle production was slightly lower than the same quarter last year and 13% lower than the previous quarter. However, “Big Three” automotive (collectively, DaimlerChrysler AG, Ford Motor Co. and General Motors Corp.) production was down 6% compared to same quarter last year and 15% lower than the previous quarter. While our tons shipped directly to the Big Three increased 30% over last year’s third quarter, our total automotive volumes decreased 2% below the third quarter of fiscal 2005 and 10% below the previous quarter. The financial condition for some automotive manufacturers and suppliers has recently deteriorated and the debt of several automotive manufacturers and automotive suppliers has been rated below investment grade. Certain automotive suppliers have recently filed voluntary petitions for Chapter 11 bankruptcy protection. We are concerned about the viability of several other automotive suppliers and continue to monitor their status.
11
Key Industry Indicators and Trends
During the last several fiscal years, the steel industry experienced unprecedented steel price fluctuations. Early in the fiscal year ending May 31, 2004, the People’s Republic of China (“China”) was a net importer of steel as its demand for steel exceeded its production capabilities, increasing the demand for steel in the worldwide market and reducing the availability of foreign steel in the United States of America (“United States”). A weaker U.S. dollar and higher transportation costs made foreign steel more expensive than domestic steel, further reducing the supply of imports to the United States. As China increased its production capabilities, it required more steel-making raw materials, especially coke and scrap steel. This resulted in shortages of these key raw materials, fueling further increases in steel prices. Finally, the consolidation of the steel industry within the United States reduced the availability of steel. All of these factors combined during this period of time to cause an unprecedented increase in steel prices.
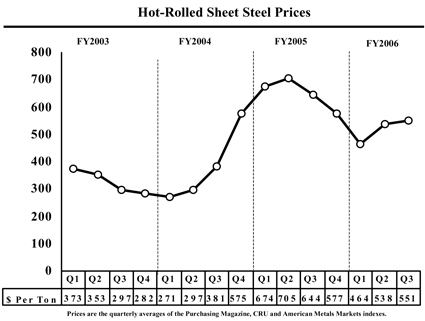
Commodity steel prices peaked in September 2004 and continued to decline until the end of our fiscal 2006 first quarter. China increased steel production significantly, contributing to global supply and placing significant downward pressure on prices. In addition, excess inventories and lower production from automotive and other key metalworking sectors reduced demand. However, since our fiscal first quarter, prices have increased 19% reflecting solid overall demand, constrained domestic supply caused by mill maintenance shutdowns, and modest levels of imports.
Published commodity steel prices during our third quarter of fiscal 2006 were $93 per ton or 14% lower than the same quarter of last fiscal year and $13 per ton or 2% higher than our prior quarter. Weaker demand and tight supply have combined to keep recent prices stable. Some mills have announced slightly higher hot-rolled sheet steel prices, but lower-priced imports may keep pressure on price increases. Increasing zinc costs most likely will cause higher galvanized steel prices.
Business Strategy
Our number one goal is to increase shareholder value. We believe that our business strategy, centered on our core competency of adding value to flat-rolled steel, provides an excellent platform to deliver that value and that we will be able to grow shareholder value by effectively managing and growing our company’s downstream, value-added capabilities. Each of our business segments—Steel Processing, Metal Framing, Pressure Cylinders and our
12
joint ventures—holds a leadership position in its market, which we expect to leverage and grow. We have the capacity to generate sales growth in each of our business segments without significantly increasing capital investment.
The three primary ways by which we accomplish our strategic goal are optimizing existing operations; pursuing strategic acquisitions or joint ventures; and developing and commercializing new products and applications. Over the last several years, this focus has resulted in investing in growth markets and products, consolidating facilities and divesting certain non-strategic assets or other assets that were not delivering appropriate returns. We will continue our efforts to improve efficiencies, consolidate operations and reduce the costs and risks of our existing operations.
We have added products and operations, including joint ventures, which we believe complement our existing business and strengths. Our strong balance sheet provides the financial flexibility to prudently acquire or invest in companies that further extend our product lines or penetrate new markets. Because of our success with joint ventures and alliances, we continue to look for additional opportunities where we can bring together complementary skill sets, manage our risk and effectively invest our capital. Some of these joint ventures and alliances have served as entry points into markets not previously served and have resulted in later buyouts of the other joint venture parties.
Although no individual customer provides more than five percent of our total net sales, diversifying our customer base through new products and new applications for existing products is a priority. We are developing new products and services in our Steel Processing segment. We are developing and testing innovative building products and systems to expand the application of metal framing and we have developed and acquired new Pressure Cylinders products for the retail market.
During the first nine months of fiscal 2006, we took the following actions to implement our strategy and achieve our goals:
| | • | | On September 22, 2005, we announced to the North American market, Dietrich UltraSTEELTM metal framing products using patented technology of Hadley Industries PLC. The licensing agreement grants Dietrich Metal Framing the exclusive rights to manufacture and sell metal framing using the UltraSTEELTM technology in North America. |
| | • | | On September 27, 2005, we announced a joint development agreement with NOVA Chemicals Corporation to evaluate and commercialize novel construction products that combine the structural benefits of light gauge steel framing with the thermal and moisture retardant properties of expandable polystyrene. We are currently developing products that should remove significant obstacles to using steel products for exterior walls in areas where extreme interior/exterior temperature variations may cause condensation. |
| | • | | During October 2005, we acquired the remaining 50% interest in Dietrich Residential Construction, LLC (“DRC”) from our partner, Pacific Steel Construction for $3,773,000 cash and debt assumption of $4,153,000. The acquisition was recorded using the purchase accounting method, and the results of DRC, which were previously reported as an unconsolidated joint venture, have been included in the consolidated results of the “Other” category since the date of acquisition. This acquisition provides panelizing capabilities and further opens the door to U.S. military housing and residential housing markets. |
| | • | | During November 2005, we acquired the remaining 40% interest in Dietrich Metal Framing Canada, Inc. (“DMF”), from the minority shareholder, Encore Coils Holdings Ltd. for $3,003,000 cash. The joint venture was formed in November 2004 as a platform to provide our Metal Framing segment’s light gauge steel framing, proprietary products, building systems and services to the Canadian construction market. The acquisition was recorded using the purchase accounting method, and 100% of the results of DMF, which had been previously reduced by the minority interest, have been included in the consolidated results of the Metal Framing segment since the date of acquisition. |
| | • | | On February 27, 2006, Dietrich Metal Framing announced an exclusive sublicensing agreement with Clark Western for UltraSTEEL™ metal framing products using patented technology of |
13
| | Hadley Industries PLC. Having a second manufacturer of this product will help to make it more readily available in the marketplace and accelerate the adoption of UltraSTEEL™ as the market standard. |
| | • | | On March 2, 2006, we announced the planned closure of our Dietrich Metal Framing manufacturing facility in LaPorte, Indiana. Forty-nine people are employed at this location. Operations are expected to cease by the end of June 2006. The facility processes small-walled, galvanized steel coils, which have become increasingly scarce over the past several years. In addition, Dietrich Metal Framing is converting a significant portion of its manufactured products to UltraSTEEL™. The move to this new process further decreases Dietrich’s need for the products processed in the LaPorte facility. |
The results of operations are mainly driven by two factors, demand and the spread between average selling price of our products and the cost of our raw material, steel. Our inventory costing methods approximate a first-in, first-out (“FIFO”) inventory flow and can significantly affect the spread. In a rising steel-price environment, our reported income is often favorably impacted as lower-priced inventory acquired during the two to three previous months flows through cost of goods sold while our selling prices increase to meet the rising cost of steel. In a decreasing steel-price environment, the inverse often occurs as higher-priced inventory on hand flows through cost of goods sold and our selling prices decrease. This results in what we refer to as inventory holding gains or losses. We strive to limit this impact by controlling inventory levels.
A majority of our full-time employees receive a significant portion of their compensation through profit sharing. As a result, profit sharing expense tends to be a major item when comparing results to prior periods. Because of the significance of profit sharing, a change in operating results can have a significant partially offsetting impact to profit sharing expense.
14
Results of Operations
Third Quarter - Fiscal 2006 Compared to Fiscal 2005
Consolidated Operations
The following table presents consolidated operating results for the periods indicated:
| | | | | | | | | | | | | | | | | |
| | | Three Months Ended
February 28, | |
| | | 2006 | | | 2005 | |
| In millions, except per share | | Actual | | | % of
Net Sales | | | %
Change | | | Actual | | | % of
Net Sales | |
Net sales | | $ | 681.5 | | | 100.0 | % | | -9 | % | | $ | 747.4 | | | 100.0 | % |
Cost of goods sold | | | 602.6 | | | 88.4 | % | | -6 | % | | | 638.2 | | | 85.4 | % |
| | | | | | | | | | | | | | | | | |
Gross margin | | | 78.9 | | | 11.6 | % | | -28 | % | | | 109.2 | | | 14.6 | % |
Selling, general and administrative expense | | | 53.3 | | | 7.8 | % | | -2 | % | | | 54.2 | | | 7.3 | % |
| | | | | | | | | | | | | | | | | |
Operating income | | | 25.6 | | | 3.8 | % | | -53 | % | | | 55.0 | | | 7.4 | % |
Other income (expense): | | | | | | | | | | | | | | | | | |
Miscellaneous expense | | | (0.3 | ) | | | | | -63 | % | | | (0.8 | ) | | | |
Interest expense | | | (6.9 | ) | | -1.0 | % | | 1 | % | | | (6.8 | ) | | -0.9 | % |
Equity in net income of unconsolidated affiliates | | | 8.2 | | | 1.2 | % | | -45 | % | | | 14.8 | | | 2.0 | % |
| | | | | | | | | | | | | | | | | |
Earnings before income taxes | | | 26.6 | | | 3.9 | % | | -57 | % | | | 62.2 | | | 8.3 | % |
Income tax expense | | | 7.4 | | | 1.1 | % | | -75 | % | | | 29.1 | | | 3.9 | % |
| | | | | | | | | | | | | | | | | |
Net earnings | | $ | 19.2 | | | 2.8 | % | | -42 | % | | $ | 33.1 | | | 4.4 | % |
| | | | | | | | | | | | | | | | | |
Average common shares outstanding - diluted | | | 89.2 | | | | | | | | | | 88.7 | | | | |
| | | | | | | | | | | | | | | | | |
Earnings per share - diluted | | $ | 0.21 | | | | | | -43 | % | | $ | 0.37 | | | | |
| | | | | | | | | | | | | | | | | |
Net earnings decreased $13.9 million, to $19.2 million for the third quarter of fiscal 2006, from $33.1 million for the comparable quarter of fiscal 2005. Diluted earnings per share decreased $0.16 per share to $0.21 per share from $0.37 per share for the prior fiscal year. Results for the third quarter of fiscal 2006 included three corrections related to prior periods, which negatively impacted net earnings and diluted earnings per share by $3.2 million, and $0.04, respectively. A description of the issues and the impact of the corrections in the current quarter are as follows:
| | • | | Under-accrual of income taxes over the last five years at the Acerex, S.A. de C.V. (“Acerex”) joint venture in Mexico resulted in a $6.1 million decrease in equity in net income of unconsolidated affiliates in the current quarter. |
| | • | | Under-accrual of consulting expenses during the previous five quarters resulted in a $4.0 million increase to selling, general and administrative (“SG&A”) expense in the current quarter. |
| | • | | Over-accrual in the consolidated income tax provision over the last nine years relating to the foreign earnings of our Worthington Armstrong Venture (“WAVE”) joint venture resulted in a $3.2 million reduction to income tax expense in the current quarter. |
The net impact of these corrections is not material to previously reported earnings for any prior fiscal year, estimated earnings for fiscal 2006 or to the trend of earnings.
Net sales decreased 9%, or $65.9 million, to $681.5 million for the third quarter of fiscal 2006 from $747.4 million for the comparable quarter last fiscal year. Lower selling prices reduced net sales by $70.4 million, reflecting the lower steel prices that prevailed during this quarter versus the comparable period of fiscal 2005. However, an increase in volumes, primarily due to improved demand in the Metal Framing segment and the Construction Services group, increased net sales by $4.5 million.
15
Gross margin decreased 28%, or $30.3 million, to $78.9 million for the third quarter of fiscal 2006 from $109.2 million for the comparable quarter last fiscal year. The decrease in gross margin was due to an unfavorable pricing spread of $28.2 million and an increase in direct labor and manufacturing expenses of $5.0 million, slightly offset by a $2.8 million volume increase. Collectively, these factors decreased gross margin as a percentage of net sales to 11.6% for the third quarter of fiscal 2006 compared to 14.6% for the comparable quarter of fiscal 2005.
SG&A expense decreased 2%, or $0.9 million, to $53.3 million for the third quarter of fiscal 2006 from $54.2 million for the comparable quarter of the prior year. As a percentage of net sales, SG&A expense increased to 7.8% for the third quarter of fiscal 2006 from 7.3% for the comparable quarter of the fiscal 2005. Excluding the impact of the $4.0 million correction related to consulting expenses discussed above, SG&A expense would have decreased 9%, or $4.9 million compared to the third quarter of fiscal 2005. This decrease was primarily due to an $8.6 million decrease in profit sharing and bonus expense resulting from lower earnings, and a $5.3 million reduction in bad debt expense compared to the prior year offset by increases in professional fees of $2.1 million, insurance and taxes of $1.9 million and supplies of $1.6 million. The reduction in bad debt expense reflects a favorable settlement of our claim in a large bankruptcy case in the current quarter.
Miscellaneous expense decreased $0.5 million in the current quarter compared to the third quarter of fiscal 2005. This was due to an increase in, and higher returns on, cash and short-term investments and the reduced elimination for the minority shareholder’s interest in net earnings of Spartan, a consolidated joint venture, due to lower earnings.
Equity in net income of unconsolidated affiliates decreased to $8.2 million for the third quarter from $14.8 million, primarily due to the correction at our Acerex joint venture of $6.1 million as discussed above.
The effective tax rate was 28.0% for the third quarter and 46.8% for the same quarter of the prior year. Income tax expense for the quarter decreased 75%, or $21.7 million, primarily due to lower earnings. In addition, the current quarter’s tax expense reflects the $3.3 million favorable correction for the taxes due on WAVE’s foreign earnings as discussed above. The prior year contained adjustments of $4.3 million, including additional tax expense for the ruling by the Sixth Circuit Court of Appeals that the State of Ohio’s investment tax credit program was unconstitutional.
16
Segment Operations
Steel Processing
Results for the third quarter were well below the same quarter a year ago. Last year’s third quarter was the best third quarter in this segment’s history. Volume for the third quarter declined slightly compared to the same period last year. However, the spread between average selling price and material cost declined significantly compared to last year’s third quarter, negatively impacting results.
The following table presents a summary of operating results for the Steel Processing segment for the periods indicated:
| | | | | | | | | | | | | | | |
| | | Three Months Ended
February 28, | |
| | | 2006 | | | 2005 | |
| Dollars in millions, tons in thousands | | Actual | | % of
Net Sales | | | %
Change | | | Actual | | % of
Net Sales | |
Net sales | | $ | 351.9 | | 100.0 | % | | -15 | % | | $ | 414.6 | | 100.0 | % |
Cost of goods sold | | | 324.0 | | 92.1 | % | | -11 | % | | | 362.1 | | 87.3 | % |
| | | | | | | | | | | | | | | |
Gross margin | | | 27.9 | | 7.9 | % | | -47 | % | | | 52.5 | | 12.7 | % |
Selling, general and administrative expense | | | 17.3 | | 4.9 | % | | -19 | % | | | 21.3 | | 5.1 | % |
| | | | | | | | | | | | | | | |
Operating income | | $ | 10.6 | | 3.0 | % | | -66 | % | | $ | 31.2 | | 7.5 | % |
| | | | | | | | | | | | | | | |
Tons shipped | | | 863 | | | | | -1 | % | | | 870 | | | |
Material cost | | $ | 269.9 | | 76.7 | % | | -13 | % | | $ | 308.6 | | 74.4 | % |
Operating income decreased 66%, or $20.6 million, to $10.6 million, or 3.0% of net sales, for the third quarter of fiscal 2006 from $31.2 million, or 7.5% of net sales, for the comparable period of fiscal 2005. Net sales decreased 15%, or $62.7 million, to $351.9 million from $414.6 million, primarily due to lower selling prices, as volumes declined slightly. In response to competitive pressures in the marketplace, we entered into fixed pricing agreements with certain customers for which we were unable to obtain matching supply agreements. As material costs moved upward with steel prices, the profitability of these transactions declined resulting in a narrower spread between average selling price and material cost, which decreased gross margin by $21.6 million. This was the primary reason for the 47%, or $24.6 million, decline in gross margin to $27.9 million, or 7.9% of net sales, for the third quarter. This compared to the gross margin of $52.5 million, or 12.7% of net sales, for the comparable period of fiscal 2005. Manufacturing expenses were up slightly compared to the prior year as increases in freight, zinc and natural gas expenses were offset by a decrease in profit sharing and bonus expense. SG&A expenses decreased $4.0 million for the third quarter primarily due to a $4.7 million decrease in bad debt expense due to a favorable settlement in the current quarter of our claim in a large bankruptcy case.
17
Metal Framing
During the third quarter of fiscal 2006, this segment entered into an exclusive sublicensing agreement with Clark Western for UltraSTEEL™ metal framing products. On March 2, 2006, we announced the closure of a manufacturing facility in LaPorte, Indiana. These activities are discussed in greater detail above.
The following table presents a summary of operating results for the Metal Framing segment for the periods indicated:
| | | | | | | | | | | | | | | |
| | | Three Months Ended
February 28, | |
| | | 2006 | | | 2005 | |
| Dollars in millions, tons in thousands | | Actual | | % of
Net Sales | | | %
Change | | | Actual | | % of
Net Sales | |
Net sales | | $ | 179.7 | | 100.0 | % | | -7 | % | | $ | 193.7 | | 100.0 | % |
Cost of goods sold | | | 153.5 | | 85.4 | % | | -3 | % | | | 158.4 | | 81.8 | % |
| | | | | | | | | | | | | | | |
Gross margin | | | 26.2 | | 14.6 | % | | -26 | % | | | 35.3 | | 18.2 | % |
Selling, general and administrative expense | | | 20.4 | | 11.4 | % | | 0 | % | | | 20.3 | | 10.5 | % |
| | | | | | | | | | | | | | | |
Operating income | | $ | 5.8 | | 3.2 | % | | -61 | % | | $ | 15.0 | | 7.7 | % |
| | | | | | | | | | | | | | | |
Tons shipped | | | 163 | | | | | 7 | % | | | 153 | | | |
Material cost | | $ | 113.8 | | 63.3 | % | | -7 | % | | $ | 122.6 | | 63.3 | % |
Operating income decreased $9.2 million to $5.8 million, or 3.2% of net sales, for the third quarter from $15.0 million, or 7.7% of net sales, for the comparable period of fiscal 2005. Net sales were $179.7 million for the third quarter compared to $193.7 million for the comparable period of fiscal 2005 due to the impact of lower steel pricing of $28.9 million, which was partially offset by an increase in volume of $14.9 million. Gross margin decreased $9.1 million, to $26.2 million, from $35.3 million and, as a percentage of net sales, was 14.6% compared to 18.2% for the comparable period in the prior year, primarily due to a narrower spread between selling prices and material cost partially offset by the increase in volume. SG&A expense remained flat but increased as a percentage of net sales from 10.5% in fiscal 2005 to 11.4% in the third quarter of fiscal 2006.
18
Pressure Cylinders
Net sales for this segment decreased slightly for the quarter, but would have increased slightly over the prior year quarter based on comparable U.S. dollar and Euro exchange rates. Volumes were down due to pre-buying by a customer of our 14.1 ounce disposable cylinders in advance of higher contract pricing, but average selling prices improved as a result of product mix change.
The following table presents a summary of operating results for the Pressure Cylinders segment for the periods indicated:
| | | | | | | | | | | | | | | |
| | | Three Months Ended
February 28, | |
| | | 2006 | | | 2005 | |
| Dollars in millions, units in thousands | | Actual | | % of
Net Sales | | | %
Change | | | Actual | | % of
Net Sales | |
Net sales | | $ | 110.6 | | 100.0 | % | | -2 | % | | $ | 112.3 | | 100.0 | % |
Cost of goods sold | | | 88.7 | | 80.2 | % | | -3 | % | | | 91.2 | | 81.2 | % |
| | | | | | | | | | | | | | | |
Gross margin | | | 21.9 | | 19.8 | % | | 4 | % | | | 21.1 | | 18.8 | % |
Selling, general and administrative expense | | | 12.0 | | 10.8 | % | | 13 | % | | | 10.6 | | 9.4 | % |
| | | | | | | | | | | | | | | |
Operating income | | $ | 9.9 | | 9.0 | % | | -6 | % | | $ | 10.5 | | 9.3 | % |
| | | | | | | | | | | | | | | |
Units shipped | | | 10,679 | | | | | -6 | % | | | 11,404 | | | |
Material cost | | $ | 51.9 | | 46.9 | % | | -4 | % | | $ | 53.8 | | 47.9 | % |
Operating income decreased 6%, or $0.6 million, to $9.9 million, or 9.0% of net sales, for the third quarter from $10.5 million, or 9.3% of net sales, for the comparable period of fiscal 2005. Net sales decreased 2%, or $1.7 million, to $110.6 million for the third quarter from $112.3 million for the comparable period of fiscal 2005 due to decrease in volume of $5.1 million partially offset by higher pricing of $3.4 million. Gross margin increased $0.8 million, to $21.9 million, from $21.1 million and as a percentage of net sales, was 19.8% for the third quarter compared to 18.8% for the comparable period of fiscal 2005. The improved gross margin was due primarily to improved operating performance at the European operations. SG&A expense increased $1.4 million from the prior year period partially as a result of the segment’s allocated share of the correction for consulting expenses discussed above, and legal fees associated with product liability settlements.
19
Other
The “Other” category includes the Automotive Body Panels, Construction Services and Steel Packaging operating segments, which are immaterial for purposes of separate disclosure, and also includes income and expense items not allocated to the operating segments.
The following table presents a summary of operating results for the Other category for the periods indicated:
| | | | | | | | | | | | | | | | | |
| | | Three Months Ended
February 28, | |
| | | 2006 | | | 2005 | |
| Dollars in millions | | Actual | | | % of
Net Sales | | | %
Change | | | Actual | | | % of
Net Sales | |
Net sales | | $ | 39.3 | | | 100.0 | % | | 47 | % | | $ | 26.8 | | | 100.0 | % |
Cost of goods sold | | | 36.4 | | | 92.6 | % | | 38 | % | | | 26.4 | | | 98.5 | % |
| | | | | | | | | | | | | | | | | |
Gross margin | | | 2.9 | | | 7.4 | % | | 625 | % | | | 0.4 | | | 1.5 | % |
Selling, general and administrative expense | | | 3.6 | | | 9.2 | % | | 80 | % | | | 2.0 | | | 7.5 | % |
| | | | | | | | | | | | | | | | | |
Operating income (loss) | | $ | (0.7 | ) | | -1.8 | % | | 56 | % | | $ | (1.6 | ) | | -6.0 | % |
| | | | | | | | | | | | | | | | | |
The operating loss decreased by $0.9 million to $0.7 million for the third quarter of fiscal 2006 from $1.6 million for the comparable period of fiscal 2005. Net sales increased 47%, or $12.5 million, to $39.3 million for the third quarter from $26.8 million for the comparable period of fiscal 2005 due primarily to increased sales in the Construction Services operating segment. Gross margin increased $2.5 million to $2.9 million for the third quarter from $0.4 million for the comparable period of fiscal 2005. SG&A expense increased $1.6 million from the prior year period primarily due to increased activity in the Construction Services operating segment.
20
Year-to-Date - Fiscal 2006 Compared to Fiscal 2005
Consolidated Operations
The impact of the inventory holding gains and losses continues to be a major factor when comparing our results against the prior year. Average hot-roll prices were 23% lower during the first nine months of fiscal 2006, versus the comparable period of fiscal 2005. The nine months ended February 28, 2006 were negatively impacted by an inventory holding loss estimated at $26.0 million. The nine months ended February 28, 2005 contained an estimated inventory holding gain of $84.0 million.
The following table presents consolidated operating results for the periods indicated:
| | | | | | | | | | | | | | | | | |
| | | Nine Months Ended
February 28, | |
| | | 2006 | | | 2005 | |
| In millions, except per share | | Actual | | | % of
Net Sales | | | %
Change | | | Actual | | | % of
Net Sales | |
Net sales | | $ | 2,075.2 | | | 100.0 | % | | -8 | % | | $ | 2,261.9 | | | 100.0 | % |
Cost of goods sold | | | 1,817.5 | | | 87.6 | % | | -3 | % | | | 1,868.6 | | | 82.6 | % |
| | | | | | | | | | | | | | | | | |
Gross margin | | | 257.7 | | | 12.4 | % | | -34 | % | | | 393.3 | | | 17.4 | % |
Selling, general and administrative expense | | | 154.9 | | | 7.5 | % | | -12 | % | | | 175.1 | | | 7.7 | % |
Impairment charges and other | | | — | | | | | | | | | | 5.6 | | | | |
| | | | | | | | | | | | | | | | | |
Operating income | | | 102.8 | | | 5.0 | % | | -52 | % | | | 212.6 | | | 9.4 | % |
Other income (expense): | | | | | | | | | | | | | | | | | |
Miscellaneous expense | | | (0.1 | ) | | | | | 99 | % | | | (7.2 | ) | | | |
Interest expense | | | (20.2 | ) | | -1.0 | % | | 12 | % | | | (18.1 | ) | | -0.8 | % |
Equity in net income of unconsolidated affiliates | | | 35.6 | | | 1.7 | % | | -11 | % | | | 39.8 | | | 1.8 | % |
| | | | | | | | | | | | | | | | | |
Earnings before income taxes | | | 118.1 | | | 5.7 | % | | -48 | % | | | 227.1 | | | 10.0 | % |
Income tax expense | | | 31.5 | | | 1.5 | % | | -64 | % | | | 88.5 | | | 3.9 | % |
| | | | | | | | | | | | | | | | | |
Net earnings | | $ | 86.6 | | | 4.2 | % | | -38 | % | | $ | 138.6 | | | 6.1 | % |
| | | | | | | | | | | | | | | | | |
Average common shares outstanding - diluted | | | 88.9 | | | | | | | | | | 88.5 | | | | |
| | | | | | | | | | | | | | | | | |
Earnings per share - diluted | | $ | 0.97 | | | | | | -38 | % | | $ | 1.57 | | | | |
| | | | | | | | | | | | | | | | | |
Net earnings decreased $52.0 million, to $86.6 million for the first nine months of fiscal 2006, from $138.6 million for the comparable period of fiscal 2005. Diluted earnings per share decreased $0.60 per share to $0.97 per share from $1.57 per share for the prior fiscal year. Net earnings for the first nine months of fiscal 2006 were negatively impacted by three corrections with a net impact of $3.2 million, discussed previously, and $1.4 million recorded in the second quarter of fiscal 2006 for the over-accrual of deferred tax liabilities related to the foreign earnings of the WAVE joint venture. Net earnings for the first nine months of fiscal 2006 were positively impacted by a $5.2 million reduction in taxes, related to the modification of corporate tax laws in the state of Ohio enacted June 30, 2005 and a $5.3 million pre-tax reduction in insurance reserves. We maintain self-insurance reserves for estimated workers’ compensation, general liability, property damage and other claims. These reserves are supported by a third party actuarial analysis of our loss history. Due to facility consolidations, focus on and investment in safety initiatives, and an emphasis on property loss prevention and product quality, our loss history has improved significantly. This improvement was reflected in the recent actuarial analysis of our loss history and resulted in this favorable reduction to our reserves. Net earnings for the first nine months of fiscal 2005 were reduced by a $5.6 million pre-tax charge in the first quarter related to the sale of our Decatur, Alabama, steel-processing facility and its cold-rolling assets.
21
Net sales decreased 8%, or $186.7 million, to $2,075.2 million for the first nine months of fiscal 2006 from $2,261.9 million for the comparable period last fiscal year. The decrease was due to lower sales prices, reflecting the lower steel prices that prevailed during the first nine months of fiscal 2006 versus the comparable period of fiscal 2005, which reduced net sales by $196.6 million. Higher overall volumes slightly offset the negative impact of the decline in selling prices. The volume increase was primarily due to increased volumes in the Metal Framing and Pressure Cylinder segments and Constructions Services, which is included in Other, but the impact of these volume increases was largely offset by lower volumes in the Steel Processing segment, due to the sale of the cold mill at Decatur in the first quarter of fiscal 2005.
Gross margin decreased 34%, or $135.6 million, to $257.7 million for the first nine months of fiscal 2006 from $393.3 million for the comparable period last fiscal year. The decrease was due to a $157.9 million unfavorable pricing spread partially offset by an increase in overall volume and a decrease in direct labor and manufacturing expenses by $16.8 million and $5.6 million, respectively. The decrease in direct labor and manufacturing expenses was mainly due to a decrease in profit sharing and bonus expense resulting from lower earnings. Gross margin as a percentage of net sales decreased to 12.4% for the first nine months of fiscal 2006 compared to 17.4% for the comparable period of fiscal 2005.
SG&A expense, as a percentage of net sales, decreased to 7.5% for the first nine months of fiscal 2006 compared to 7.7% of net sales for the comparable period of the prior year. In total, SG&A expense decreased 12%, or $20.2 million, to $154.9 million for the first nine months of fiscal 2006 from $175.1 million for the comparable period of fiscal 2005. Excluding the $4.0 million correction for the under-accrual of consulting expenses discussed above, SG&A expense would have decreased 14%, or $24.2 million compared to the same period of fiscal 2005. This decrease was primarily due to a $22.8 million decrease in profit sharing and bonus expense resulting from lower earnings and a $9.0 million reduction in bad debt expense compared to the prior year, offset by increases in professional fees of $3.4 million and insurance and taxes of $1.3 million. The reduction in bad debt expense reflects the favorable settlement of a large bankruptcy case in the current quarter of fiscal 2006.
Miscellaneous expense decreased $7.1 million in the current year compared to the first nine months of fiscal 2005. This was due to an increase in, and higher returns on, cash and short-term investments and the reduced minority interest elimination for our consolidated joint ventures due to lower earnings of those joint ventures.
Interest expense increased 12% or $2.1 million due to higher rates and borrowings.
Equity in net income of unconsolidated affiliates decreased to $35.6 million for the first nine months of fiscal 2006 from $39.8 million for the same period in fiscal 2005, primarily due to the correction of $6.1 million for the under-accrual of income taxes at the Acerex joint venture discussed above. The unconsolidated joint ventures generated $605.5 million in sales during the first nine months of fiscal 2006.
The nine-month effective tax rate was 26.7% for the current year and 39.0% for the prior year. Income tax expense decreased 64%, or $57.0 million, due to lower earnings, and modifications to the corporate tax laws for the state of Ohio and adjustments to our estimated tax liabilities of $11.4 million. The new tax law changes, which are ongoing in nature, resulted in a $5.2 million favorable benefit in fiscal 2006, the majority of which was due to the one-time impact of lower rates on deferred taxes. The prior year contained adjustments of $2.6 million, including additional tax expense for the ruling by the Sixth Circuit Court of Appeals that the state of Ohio’s investment tax credit program was unconstitutional. We estimate that our effective tax rate will be 29.7% for fiscal 2006 compared to 38.7% for fiscal 2005. The main reasons for the difference are changes in our mix of income among the various tax jurisdictions and a U.S. tax deduction, effective this year, based on the amount of income we earn from our manufacturing activities.
22
Segment Operations
Steel Processing
Our Steel Processing segment represented approximately 52% of consolidated net sales. The steel-pricing environment and the automotive industry, which accounts for approximately 60% of this segment’s net sales, significantly impacted the results of this segment. After having risen steadily for the first four months of fiscal 2005 to an all time high in September 2004, steel prices declined significantly. As a result, steel prices were significantly lower in the first nine months of fiscal 2006 than in the first nine months of fiscal 2005, which led to a narrowed spread between our average selling prices and material costs. In addition, sales to the automotive market, for the first nine months of fiscal 2006, were 10% lower than for the comparable period for fiscal 2005.
Effective August 1, 2004, we sold our Decatur, Alabama, steel-processing facility and its cold-rolling assets (“Decatur”) to Nucor Corporation (“Nucor”) for $80.4 million cash. The assets sold at Decatur included the land and buildings, the four-stand tandem cold mill, the temper mill, the pickle line and the annealing furnaces. The sale excluded the slitting and cut-to-length assets and net working capital. The retained assets provide basic steel-processing services to our customers at the Decatur site, which is leased from Nucor. A pre-tax charge of $5.6 million, mainly related to contract termination costs, was recognized during the first quarter of fiscal 2005.
The following table presents a summary of operating results for the Steel Processing segment for the periods indicated:
| | | | | | | | | | | | | | | |
| | | Nine Months Ended
February 28, | |
| | | 2006 | | | 2005 | |
| Dollars in millions, tons in thousands | | Actual | | % of
Net Sales | | | %
Change | | | Actual | | % of
Net Sales | |
Net sales | | $ | 1,068.0 | | 100.0 | % | | -17 | % | | $ | 1,280.8 | | 100.0 | % |
Cost of goods sold | | | 969.4 | | 90.8 | % | | -12 | % | | | 1,098.1 | | 85.7 | % |
| | | | | | | | | | | | | | | |
Gross margin | | | 98.6 | | 9.2 | % | | -46 | % | | | 182.7 | | 14.3 | % |
Selling, general and administrative expense | | | 55.0 | | 5.1 | % | | -27 | % | | | 75.3 | | 5.9 | % |
Impairment charges and other | | | — | | | | | | | | | 5.6 | | 0.4 | % |
| | | | | | | | | | | | | | | |
Operating income | | $ | 43.6 | | 4.1 | % | | -57 | % | | $ | 101.8 | | 7.9 | % |
| | | | | | | | | | | | | | | |
Tons shipped | | | 2,618 | | | | | -4 | % | | | 2,733 | | | |
Material cost | | $ | 811.2 | | 76.0 | % | | -13 | % | | $ | 928.2 | | 72.5 | % |
Operating income decreased 57%, or $58.2 million, to $43.6 million, or 4.1% of net sales, for the first nine months of fiscal 2006 from $101.8 million, or 7.9% of net sales, for the comparable period of fiscal 2005. Net sales decreased 17%, or $212.8 million, to $1,068.0 million from $1,280.8 million, due to a decrease in pricing of $108.4 million and a decrease in volume of $104.5 million, of which $80.1 million was due to the sale of certain Decatur assets. Gross margin declined 46%, or $84.1 million, to $98.6 million, or 9.2% of net sales, for the current period versus $182.7 million, or 14.3% of net sales, for the comparable period of fiscal 2005. A narrower spread between average selling price and material cost combined with a decrease in volume reduced gross margin by $74.8 million and $21.0 million, respectively. Gross margin was favorably impacted by a $14.8 million decrease in profit sharing and bonus expense due to lower earnings and a $5.2 million reduction in manufacturing expenses at our Decatur facility partially offset by increases for freight, zinc and natural gas expense. SG&A expense decreased $20.3 million, to 5.1% of net sales, for the first nine months of fiscal 2006, down from 5.9% of net sales for the comparable period of fiscal 2005. The decline in SG&A expense was largely due to a decrease of $14.0 million in profit sharing and bonus expense, resulting from lower earnings, and an $8.0 million decrease in bad debt expense compared to the prior year. The reduction in bad debt expense reflects the favorable settlement of a large bankruptcy case in the current quarter of fiscal 2006.
23
Metal Framing
Our Metal Framing segment represented approximately 28% of consolidated net sales during the first nine months of fiscal 2006. Volumes for the first nine months of fiscal 2006 increased 9% compared to the same period in fiscal 2005. We believe the improved demand reflects a combination of factors including a general increase in commercial construction, rebuilding in Florida after the hurricanes of fiscal 2005 and an expansion into Canada.
The following table presents a summary of operating results for the Metal Framing segment for the periods indicated:
| | | | | | | | | | | | | | | |
| | | Nine Months Ended
February 28, | |
| | | 2006 | | | 2005 | |
| Dollars in millions, tons in thousands | | Actual | | % of
Net Sales | | | %
Change | | | Actual | | % of
Net Sales | |
Net sales | | $ | 577.2 | | 100.0 | % | | -7 | % | | $ | 621.7 | | 100.0 | % |
Cost of goods sold | | | 490.4 | | 85.0 | % | | 6 | % | | | 463.8 | | 74.6 | % |
| | | | | | | | | | | | | | | |
Gross margin | | | 86.8 | | 15.0 | % | | -45 | % | | | 157.9 | | 25.4 | % |
Selling, general and administrative expense | | | 56.8 | | 9.8 | % | | -9 | % | | | 62.7 | | 10.1 | % |
| | | | | | | | | | | | | | | |
Operating income | | $ | 30.0 | | 5.2 | % | | -68 | % | | $ | 95.2 | | 15.3 | % |
| | | | | | | | | | | | | | | |
Tons shipped | | | 518 | | | | | 9 | % | | | 477 | | | |
Material cost | | $ | 370.6 | | 64.2 | % | | 6 | % | | $ | 350.5 | | 56.4 | % |
Operating income decreased $65.2 million to $30.0 million, or 5.2% of net sales, for the first nine months of fiscal 2006 from $95.2 million, or 15.3% of net sales, for the comparable period of fiscal 2005. The primary driver of the decrease was the narrower spread between average selling price and material cost of $94.0 million, partially offset by an increase in volume of $23.7 million. Net sales decreased 7%, or $44.5 million, to $577.2 million for the first nine months of fiscal 2006 from $621.7 million for the comparable period of fiscal 2005 due to the impact of lower pricing of $106.4 million, partially offset by the impact of an increase in volume of $61.9 million. Gross margin decreased $71.1 million, to $86.8 million, from $157.9 million and, as a percentage of net sales, was 15.0% compared to 25.4% for the comparable period in the prior year. SG&A expense decreased because of a reduction in profit sharing and bonus expense of $10.3 million resulting from lower earnings.
24
Pressure Cylinders
Our Pressure Cylinders segment represented approximately 16% of consolidated net sales during the first nine months of fiscal 2006. This segment had an increase in net sales and improved operating performance for the first nine months of fiscal 2006 compared to the same period in the prior year.
The following table presents a summary of operating results for the Pressure Cylinders segment for the periods indicated:
| | | | | | | | | | | | | | | |
| | | Nine Months Ended
February 28, | |
| | | 2006 | | | 2005 | |
| Dollars in millions, units in thousands | | Actual | | % of
Net Sales | | | %
Change | | | Actual | | % of
Net Sales | |
Net sales | | $ | 324.1 | | 100.0 | % | | 16 | % | | $ | 280.1 | | 100.0 | % |
Cost of goods sold | | | 261.9 | | 80.8 | % | | 14 | % | | | 229.2 | | 81.8 | % |
| | | | | | | | | | | | | | | |
Gross margin | | | 62.2 | | 19.2 | % | | 22 | % | | | 50.9 | | 18.2 | % |
Selling, general and administrative expense | | | 33.2 | | 10.2 | % | | 17 | % | | | 28.4 | | 10.1 | % |
| | | | | | | | | | | | | | | |
Operating income | | $ | 29.0 | | 8.9 | % | | 29 | % | | $ | 22.5 | | 8.0 | % |
| | | | | | | | | | | | | | | |
Units shipped* | | | 36,229 | | | | | 54 | % | | | 23,582 | | | |
Material cost | | $ | 157.2 | | 48.5 | % | | 20 | % | | $ | 131.4 | | 46.9 | % |
* | Excluding the units from the Western Cylinders Assets from both periods, units shipped were 10,127 vs. 10,046. |
Operating income increased 29%, or $6.5 million, to $29.0 million, or 8.9% of net sales, for the first nine months of fiscal 2006 from $22.5 million, or 8.0% of net sales, for the comparable period of fiscal 2005. Net sales increased 16%, or $44.0 million, to $324.1 million for the first nine months of fiscal 2006 from $280.1 million for the comparable period of fiscal 2005. The acquired net assets of the propane and specialty gas cylinder business of Western Industries, Inc. (“Western Cylinder Assets”) contributed $23.7 million to this increase, other North American net sales contributed $8.2 million and improved European sales contributed $12.2 million. Unit volumes were flat, excluding units from the Western Cylinder Assets. Gross margin was 19.2% of net sales for the first nine months of fiscal 2006 compared to 18.2% for the comparable period of fiscal 2005. The improved gross margin is primarily due to a wider spread between average selling price and material cost partially offset by an increase in manufacturing expense related to the Western Cylinder Assets. The Portugal facility ceased production of its unprofitable liquefied petroleum gas cylinders in the first quarter of fiscal 2005, resulting in significantly improved gross margin as a percentage of net sales. The Czech Republic facility expanded its air tank production in fiscal 2005, but incurred high labor and manufacturing expense during the expansion start-up in fiscal 2005. SG&A expense increased $4.8 million from the prior year period due to increased costs of $3.8 million related to the operation of the acquired Western Cylinder Assets and settlement of two product liability claims in the current fiscal year.
25
Other
The following table presents a summary of operating results for the Other category for the periods indicated:
| | | | | | | | | | | | | | | | |
| | | Nine Months Ended
February 28, | |
| | | 2006 | | | 2005 | |
| Dollars in millions | | Actual | | % of
Net Sales | | | %
Change | | | Actual | | | % of
Net Sales | |
Net sales | | $ | 105.9 | | 100.0 | % | | 34 | % | | $ | 79.3 | | | 100.0 | % |
Cost of goods sold | | | 95.9 | | 90.6 | % | | 24 | % | | | 77.4 | | | 97.6 | % |
| | | | | | | | | | | | | | | | |
Gross margin | | | 10.0 | | 9.4 | % | | 426 | % | | | 1.9 | | | 2.4 | % |
Selling, general and administrative expense | | | 10.0 | | 9.4 | % | | 15 | % | | | 8.7 | | | 11.0 | % |
| | | | | | | | | | | | | | | | |
Operating income (loss) | | $ | 0.0 | | 0.0 | % | | 100 | % | | $ | (6.8 | ) | | -8.6 | % |
| | | | | | | | | | | | | | | | |
Operating income improved $6.8 million for the first nine months of fiscal 2006 from an operating loss of $6.8 million for the comparable period of fiscal 2005 primarily due to an improvement in results for Construction Services. Net sales increased 34%, or $26.6 million, to $105.9 million for the first nine months of fiscal 2006 from $79.3 million for the comparable period of fiscal 2005 due primarily to increased sales in the Construction Services segment. Gross margin was 9.4% of net sales for the current period compared to 2.4% for the comparable period of fiscal 2005. SG&A expense increased $1.3 million from the prior year period due to increased activity in the Construction Services operating segment.
Liquidity and Capital Resources
During the first nine months of fiscal 2006, we generated $161.9 million in cash from operating activities. This was primarily the result of $86.6 million in net earnings, a $46.5 million decrease in accounts receivable and an increase in accounts payable of $39.9 million during the period. The difference between the net cash provided by operating activities in fiscal 2006 compared to net cash used by operating activities in fiscal 2005 was primarily the result of changes in inventory and accounts receivable, which were reflective of the decline of steel prices, discussed above.
Consolidated net working capital was $428.0 million at February 28, 2006, compared to $392.9 million at May 31, 2005. An increase in cash and cash equivalents and short-term investments of $56.2 million was mainly attributable to a decrease in accounts receivable of $40.6 million and an increase in accounts payable of $40.9 million, partially offset by an increase in inventory of $19.9 million.
Our primary investing and financing activities included distributing $44.9 million in dividends to shareholders, spending $43.1 million on capital projects, including $10.3 million for our ERP system, purchasing $42.1 million of net short-term investments and investing $16.3 million in a new aircraft. This $16.3 million investment represents progress payments for an aircraft with an estimated purchase price of $19.3 million. This investment is recorded in prepaid and other current assets as the aircraft will be sold and leased back prior to, or near, the end of fiscal 2006. It will replace an existing leased aircraft.
We generated $7.1 million in cash from the issuance of common shares through option exercises and $3.1 million from the sale of assets. We anticipate that our fiscal 2006 capital spending, excluding acquisitions, will approximate annual depreciation. Major ongoing projects include our ERP project, a furnace upgrade at our Spartan joint venture galvanizing facility, and our conversion to UltraSTEEL™ production at our Metal Framing segment.
Our short-term liquidity needs are primarily met by a $435.0 million long-term revolving credit facility; a $100.0 million trade accounts receivable securitization facility and $40.0 million in uncommitted discretionary credit lines. During the third quarter of fiscal 2006, a $20.0 million discretionary credit line was terminated. All credit facilities and lines were unused as of February 28, 2006 and May 31, 2005.
26
Our 7 1/8% Senior Notes mature on May 15, 2006 (principal outstanding of $142.9 million at February 28, 2006). We believe the facilities described in the preceding paragraph, as well as our cash, short-term investments and cash provided by operating activities will be more than adequate to satisfy that obligation.
On September 29, 2005, we amended and restated our $435.0 million long-term revolving credit facility to extend the maturity to September 2010 and to replace the leverage ratio (debt-to-EBITDA) financial covenant with an interest coverage ratio (EBITDA-to-interest expense) financial covenant of not less than 3.25 times. The amended and restated facility also reduces the facility fees payable and provides liquidity beyond the maturity of our 6.70% Notes due in December 2009. The proceeds of the amended and restated facility may be used for general corporate purposes including working capital, capital expenditures, acquisitions and dividends.
Uncommitted lines of credit are extended to us on a discretionary basis. Because the outstanding principal amounts can be adjusted daily, these uncommitted lines typically provide us with the greatest amount of funding flexibility compared to our other sources of short-term capital.
At February 28, 2006, our total debt was $387.4 million compared to $388.4 million at May 31, 2005. Our debt to total capitalization ratio was 30.6% at February 28, 2006, down from 32.1% at May 31, 2005.
On June 13, 2005, we announced that our board of directors authorized the repurchase of up to 10.0 million of our outstanding common shares. The purchases may be made from time to time, on the open market or in private transactions, with consideration given to the market price of the common shares, the nature of other investment opportunities, cash flows from operations and general economic conditions. During the first nine months of fiscal 2006, there were no repurchases of common shares.
We assess acquisition opportunities as they arise. Additional financing may be required if we decide to make additional acquisitions. There can be no assurance, however, that any such opportunities will arise, that any such acquisitions will be consummated, or that any needed additional financing will be available on satisfactory terms when required. Absent any other acquisitions, we anticipate that cash, short-term investments, cash provided by operating activities and unused borrowing capacity should be sufficient to fund expected normal operating costs, repayment of our 7 1/8% Senior Notes upon maturity, dividends, working capital, and capital expenditures for our existing businesses.
Dividend Policy
Dividends are declared at the discretion of our board of directors. Our board of directors reviews the dividend quarterly and establishes the dividend rate based upon our financial condition, results of operations, capital requirements, current and projected cash flows, business prospects and other factors which are deemed relevant. While we have paid a dividend every quarter since becoming a public company in 1968, there is no guarantee that this will continue in the future.
Contractual Cash Obligations and Other Commercial Commitments
Contractual cash obligations and other commercial commitments have not changed significantly from those disclosed in “Item 7 – Management’s Discussion and Analysis of Financial Conditions and Results of Operations” of our Annual Report on Form 10-K for fiscal 2005.
Off-Balance Sheet Arrangements
We had no material off-balance sheet arrangements at February 28, 2006.
Recently Issued Accounting Standards
In November 2004, the Financial Accounting Standards Board (“FASB”) issued Statement of Financial Accounting Standards (“SFAS”) No. 151,Inventory Costs, an amendment of ARB No. 43, Chapter 4 (“SFAS 151”). SFAS 151 amends the guidance in Accounting Research Bulletin No. 43, Chapter 4,Inventory Pricing to clarify the accounting for abnormal amounts of idle facility expense, freight, handling cost and wasted material (spoilage). In addition, SFAS 151 requires that allocation of fixed production overhead to the costs of conversion be based on the normal capacity of the production facilities. SFAS 151 is effective for inventory costs incurred during fiscal years
27
beginning after June 15, 2005. The Company does not expect the adoption of SFAS 151 to have a material impact on the Company’s financial position or results of operations.
In December 2004, the FASB issued SFAS No. 153,Exchanges of Non-monetary Assets, an amendment of APB Opinion No. 29 (“SFAS 153”). Accounting Principles Board (“APB”) Opinion No. 29 is based on the principle that exchanges of non-monetary assets should be measured by the fair value of the assets exchanged. The guidance in that Opinion, however, included certain exceptions to that principle. SFAS 153 amends APB Opinion No. 29 to eliminate the exception for non-monetary exchanges of similar productive assets and replaces it with a general exception for exchanges of non-monetary assets that do not have commercial substance. SFAS 153 is effective for non-monetary exchanges occurring in fiscal periods beginning after June 15, 2005. We do not expect the adoption of SFAS 153 to have a material impact on our financial position or results of operations.
In December 2004, the FASB issued SFAS No. 123 (revised 2004),Share-Based Payment(“SFAS 123(R)”).SFAS 123(R) is a revision of SFAS 123 and it supercedes APB No. 25 and amends SFAS No. 95,Statement of Cash Flows.Generally, the approach in SFAS 123(R) is similar to the approach described in SFAS 123. However, SFAS 123(R) requires all share-based payments to employees, including grants of employee stock options, to be recognized in the income statement based on their fair values. Proforma disclosure will not be an alternative. SFAS 123(R) is effective for all fiscal years beginning after June 15, 2005, and thus will become effective for the Company beginning in the fiscal year ending May 31, 2007 (“fiscal 2007”). We are currently evaluating the impact of adopting Statement 123(R) but do not expect a material impact on our financial position or results of operations
Critical Accounting Policies
The discussion and analysis of our financial condition and results of operations are based upon our consolidated financial statements, which have been prepared in accordance with accounting principles generally accepted in the United States. The preparation of these financial statements requires us to make estimates and assumptions that affect the reported amounts of assets and liabilities and the disclosure of contingent assets and liabilities at the date of the financial statements and the reported amounts of revenues and expenses during the reporting period. We continually evaluate our estimates, including those related to our valuation of receivables, intangible assets, accrued liabilities, income and other tax accruals, and contingencies and litigation. We base our estimates on historical experience and various other assumptions that we believe to be reasonable under the circumstances. These results form the basis for making judgments about the carrying values of assets and liabilities that are not readily apparent from other sources. Critical accounting policies are defined as those that reflect our significant judgments and uncertainties that could potentially result in materially different results under different assumptions and conditions. Although actual results historically have not deviated significantly from those determined using our estimates, as discussed below, our financial position or results of operations could be materially different if we were to report under different conditions or to use different assumptions in the application of such policies. We believe the following accounting policies are the most critical to us since these are the primary areas where financial information is subject to our estimates, assumptions and judgment in the preparation of our consolidated financial statements.
Revenue Recognition:We recognize revenue upon transfer of title and risk of loss provided evidence of an arrangement exists, pricing is fixed and determinable, and collectibility is probable. In circumstances where the collection of payment is highly questionable at the time of shipment, we defer recognition of revenue until payment is collected. We provide an allowance for returns based on experience and current customer activities.
Receivables: We review our receivables on a monthly basis to ensure that they are properly valued and collectible. This is accomplished through two contra-receivable accounts: returns and allowances and allowance for doubtful accounts. Returns and allowances are used to record estimates of returns or other allowances resulting from quality, delivery, discounts or other issues affecting the value of receivables. This account is estimated based on historical trends and current market conditions, with the offset recorded to net sales.
The allowance for doubtful accounts is used to record the estimated risk of loss related to the customers’ ability to pay. This allowance is maintained at a level that we consider appropriate based on factors that affect collectibility, such as the financial health of the customer, historical trends of charge-offs and recoveries, and current and projected economic and market conditions. As we monitor our receivables, we identify customers that may have a problem paying, and we adjust the allowance accordingly, with the offset to SG&A expense.
28
While we believe these allowances are adequate, changes in economic conditions, the financial health of customers, and bankruptcy settlements could impact our future earnings.
Impairment of Long-Lived Assets: We review the carrying value of our long-lived assets, including intangible assets, whenever events or changes in circumstances indicate that the carrying value of an asset or a group of assets may not be recoverable. Accounting standards require an impairment charge to be recognized in the financial statements if the carrying amount exceeds the undiscounted cash flows that asset or group of assets would generate. The loss recognized would be the difference between the fair value and the carrying amount of the asset or group of assets.
Annually, we review goodwill for impairment using the present value technique to determine the estimated fair value of goodwill associated with each reporting entity. There are three significant sets of values used to determine the fair value: estimated future discounted cash flows, capitalization rate and tax rates. The estimated future discounted cash flows used in the model are based on planned growth with an assumed perpetual growth rate. The capitalization rate is based on our current cost of debt and equity capital. Tax rates are maintained at current levels.
Accounting for Derivatives and Other Contracts at Fair Value:We use derivatives in the normal course of business to manage our exposure to fluctuations in commodity prices, foreign currency and interest rates. These derivatives are based on quoted market values. These estimates are based upon valuation methodologies deemed appropriate in the circumstances; however, the use of different assumptions could affect the estimated fair values.
Stock-Based Compensation:We currently account for employee and non-employee stock option plans under the recognition and measurement principles of APB Opinion No. 25,Accounting for Stock Issued to Employees, and the related interpretations.No stock-based employee compensation cost is reflected in net earnings, as all options granted under plans had an exercise price equal to the fair market value of the underlying common shares on the grant date. Beginning in fiscal 2007, we will be required to record an expense for our stock-based compensation plans using the fair value method. Had we accounted for stock-based compensation plans using the fair value method prescribed in SFAS No. 123(R), we estimate that diluted earnings per share would have been reduced by $0.03 per share in fiscal 2005, $0.02 in fiscal 2004 and $0.01 in fiscal 2003.
Income Taxes: In accordance with the provisions of SFAS No. 109,Accounting for Income Taxes, we account for income taxes using the asset and liability method. The asset and liability method requires the recognition of deferred tax assets and liabilities for expected future tax consequences of temporary differences that currently exist between the tax basis and financial reporting basis of our assets and liabilities. In assessing the realizability of deferred tax assets, we consider whether it is more likely than not that some or a portion of the deferred tax assets will not be realized. We provide a valuation allowance for deferred income tax assets when, in our judgment, based upon currently available information and other factors, it is more likely than not that a portion of such deferred income tax assets will not be realized. The determination of the need for a valuation allowance is based on an on-going evaluation of current information including, among other things, estimates of future earnings in different tax jurisdictions and the expected timing of deferred income tax asset reversals. We believe that the determination to record a valuation allowance to reduce deferred income tax assets is a critical accounting estimate because it is based on an estimate of future taxable income in the various tax jurisdictions in which we do business, which is susceptible to change and may or may not occur, and because the impact of adjusting a valuation allowance may be material.
We have a reserve for taxes and associated interest that may become payable in future years as a result of audits by taxing authorities. While we believe the positions taken on previously filed tax returns are appropriate, we have established the tax and interest reserves in recognition that various taxing authorities may challenge our positions. The tax reserves are analyzed periodically and adjustments are made, as events occur to warrant adjustment to the reserve, such as lapsing of applicable statutes of limitations, conclusion of tax audits, additional exposure based on current calculations, identification of new issues, release of administrative guidance or court decisions affecting a particular tax issue.
Self-Insurance Reserves:We are largely self-insured with respect to workers’ compensation, general liability, property damage, employee medical claims and other potential losses. In order to reduce risk and better manage overall loss exposure, we purchase stop-loss insurance that covers individual claims in excess of the deductible amounts. We maintain reserves for the estimated cost to settle open claims as well as an estimate of the cost of claims that have been incurred but not reported. These estimates are based on third-party actuarial valuations
29
that take into consideration the historical average claim volume, the average cost for settled claims, current trends in claim costs, changes in our business and workforce, general economic factors and other assumptions believed to be reasonable under the circumstances. The estimated reserves for these liabilities could be affected if future occurrences and claims differ from assumptions used and historical trends. Facility consolidations, focus on and investment in safety initiatives, and an emphasis on property loss prevention and product quality, has resulted in an improvement in our loss history and the related assumptions used to analyze these reserves. This improvement resulted in a $5.3 million reduction to these insurance reserves that was recorded during the second quarter of fiscal 2006. We will continue to review these reserves on a quarterly basis, or more frequently if factors dictate a more frequent review is warranted.
The critical accounting policies discussed herein are not intended to be a comprehensive list of all of our accounting policies. In many cases, the accounting treatment of a particular transaction is specifically dictated by accounting principles generally accepted in the United States, with no need for our judgment in their application. There are also areas in which our judgment in selecting an available alternative would not produce a materially different result.
Item 3. - Quantitative and Qualitative Disclosures About Market Risk
Market risks have not changed significantly from those disclosed in “Item 7A – Quantitative and Qualitative Disclosures About Market Risk” of our Annual Report on Form 10-K for the fiscal year ended May 31, 2005.
Item 4. - Controls and Procedures
Evaluation of Disclosure Controls and Procedures
Management is responsible for establishing and maintaining disclosure controls and procedures (as defined in Rule 13a-15(e) under the Securities Exchange Act of 1034, as amended (the “Exchange Act”)) that are designed to provide reasonable assurance that information required to be disclosed in the reports that Worthington Industries, Inc. files or submits under the Exchange Act is recorded, processed, summarized and reported within the time periods specified in the Securities and Exchange Commission’s rules and forms, and that such information is accumulated and communicated to management including the principal executive officer and the principal financial officer, as appropriate, to allow timely decisions regarding required disclosure. Because of inherent limitations, disclosure controls and procedures, no matter how well designed and operated, can only provide reasonable, not absolute, assurance that the objectives of disclosure controls and procedures are met.
Management, with the participation of the principal executive officer and principal financial officer, performed an evaluation of the effectiveness of our disclosure controls and procedures (as defined in Rule 13a-15(e) under the Exchange Act) as of the end of the quarterly period covered by this Quarterly Report on Form 10-Q (i.e., as of February 28, 2006). Based on that evaluation, our principal executive officer and principal financial officer have concluded that such disclosure controls and procedures were effective as of the end of the quarterly period covered by this Quarterly Report on Form 10-Q.
Changes in Internal Control Over Financial Reporting
There were no changes, except for those described below related to the ERP implemention, which occurred during our third fiscal quarter ended February 28, 2006, in our internal control over financial reporting (as defined in Rule 13a-15(f) under the Exchange Act) that have materially affected, or are reasonably likely to materially affect, our internal control over financial reporting.
New ERP System: We are in the process of implementing a new software-based ERP system throughout much of Worthington Industries, Inc. and our consolidated subsidiaries. Implementing a new system results in changes to business processes and related controls. We believe that we are adequately controlling the transition to the new processes and controls and that there will be no negative impact to our internal control environment. In fact, one of the expected benefits of the fully implemented ERP system is an enhancement of our current internal control environment.
30
PART II. OTHER INFORMATION
Item 1. - Legal Proceedings
Various legal actions, which generally have arisen in the ordinary course of business, are pending against Worthington Industries, Inc. and its subsidiaries (collectively, “Worthington”). None of this pending litigation, individually or collectively, is expected to have a material adverse effect on Worthington.
Item 2. – Unregistered Sales of Equity Securities and Use of Proceeds
The following table provides information about purchases made by, or on behalf of, Worthington Industries, Inc. or any “affiliated purchaser” (as defined in Rule 10b – 18(a) (3) under the Securities Exchange Act of 1934) of common shares of Worthington Industries, Inc. during each month of the fiscal quarter ended February 28, 2006:
| | | | | | | | |
Period | | Total Number
of Common
Shares
Purchased | | Average Price
Paid per
Common
Share | | Total Number of
Common Shares
Purchased as
part of Publicly
Announced
Plans or
Programs | | Maximum Number
(or Approximate
Dollar Value) of
Common Shares that
May Yet Be
Purchased Under the
Plans or Programs (1) |
December 1-31, 2005 | | — | | — | | — | | 10,000,000 |
January 1-31, 2006 | | — | | — | | — | | 10,000,000 |
February 1-28, 2006 | | — | | — | | — | | 10,000,000 |
Total | | — | | — | | — | | 10,000,000 |
(1) | On June 13, 2005, Worthington Industries, Inc. announced that the board of directors had authorized the repurchase of up to 10 million of its outstanding common shares. The common shares may be purchased from time to time, with consideration given to the market price of the common shares, the nature of other investment opportunities, cash flows from operations and general economic conditions. Repurchases may be made on the open market or through privately negotiated transactions. During the third quarter of fiscal 2006, there were no repurchases of common shares. |
Item 3. – Defaults Upon Senior Securities
Not applicable
Item 4. – Submission of Matters to a Vote of Security Holders
Not applicable
Item 5. – Other Information
Not applicable
31
Item 6. - Exhibits
Exhibits
| | |
31.1 | | Rule 13a - 14(a) / 15d - 14(a) Certification (Principal Executive Officer) |
| |
31.2 | | Rule 13a - 14(a) / 15d - 14(a) Certification (Principal Financial Officer) |
| |
32.1 | | Section 1350 Certification of Principal Executive Officer |
| |
32.2 | | Section 1350 Certification of Principal Financial Officer |
32
SIGNATURES
Pursuant to the requirements of the Securities Exchange Act of 1934, the Registrant has duly caused this report to be signed on its behalf by the undersigned thereunto duly authorized.
| | | | | | | | |
| | | | WORTHINGTON INDUSTRIES, INC. |
| | | |
Date:April 10, 2006 | | | | By: | | /s/ John S. Christie |
| | | | | | John S. Christie, |
| | | | | | President and Chief Financial Officer |
| | | | | | (On behalf of the Registrant and as Principal
Financial Officer) |
33
INDEX TO EXHIBITS
| | | | |
| Exhibit | | Description | | Location |
| | |
31.1 | | Rule 13a - 14(a) / 15d - 14(a) Certification (Principal Executive Officer) | | Filed herewith. |
| | |
31.2 | | Rule 13a - 14(a) / 15d - 14(a) Certification (Principal Financial Officer) | | Filed herewith. |
| | |
32.1 | | Section 1350 Certification of Principal Executive Officer | | Filed herewith. |
| | |
32.2 | | Section 1350 Certification of Principal Financial Officer | | Filed herewith. |
34