Back to Contents
Operating and Financial Review
Operating Review – Summary continued
techniques based on historic experience. General provisions are determined based on historic experience, general credit and lending quality, and current or near-future economic prospects. These determinations are supplemented by various formulaic calculations and the application of management judgement. For further discussion of the impairment charges recorded in 2003 with respect to Provisions for Bad and Doubtful Debts, see the Provisions for Bad and Doubtful Debts sub-section in the Accounting policies section of the financial statements.
We consider accounting estimates related to provisions for bad and doubtful debts “critical accounting estimates” because: (i) they are highly susceptible to change from period to period as the assumptions about future default rates and valuation of potential losses relating to impaired loans and advances are based on recent performance experience, and (ii) any significant difference between our estimated losses (as reflected in the specific and general provisions) and actual losses will require us to take provisions which, if significantly different, could have a material impact on our future profit and loss account and our balance sheet. Our assumptions about estimated losses are based on past performance, past customer behaviour, the credit quality of recent underwritten business and general economic conditions, which are not necessarily an indication of future losses.
Provisions for Bad and Doubtful Debts, less amounts released and recoveries of amounts written off in previous years, are charged to the line item “Provisions for Bad and Doubtful Debts” in the Profit and Loss Account. The specific and general provisions are deducted from the “Loans and advances to banks” and the “Loans and advances to customers” line items on our balance sheet. If we believe that additions to the allowance for such credit losses are required, then we record additional provisions for credit losses, which would be treated as a charge in the line item “Provisions for Bad and Doubtful Debts” in the Profit and Loss Account. Credit exposures that we deem to be uncollectible and credit losses, net of recoveries of previously written off amounts, are first allocated against the cumulative Provisions for Bad and Doubtful Debts, with any difference charged or credited to the line item “Provisions for Bad and Doubtful Debts” within the Profit and Loss Account. For US GAAP reporting purposes, allowances for lending losses related to loans within the scope of SFAS 114 “Accounting by Creditors for Impairment of a Loan,” are determined based on the present value of expected future cash flows discounted at the loan’s effective rate, or at the loan’s observable market price or the fair value of the collateral if the loan is collateral-dependent.
We could have chosen, in the current period, estimates that would have had a materially different impact on our financial presentation. For example, our financial statements for the year ended 31 December 2003 include a provision charge for bad and doubtful debts in our Banking and Savings segment for an amount equal to £130m. This provision was reduced for the third consecutive year (in 2002 it was £151m), reflecting both favourable economic conditions through 2003 resulting in lower defaults and write offs, and improvements to the overall quality of the lending portfolio as a result of effective risk management and debt management operations.
In calculating the general provisions within the Banking and Savings segment, a range of outcomes was calculated based principally on management’s conclusions regarding the current economic outlook. Had management used different assumptions regarding the current economic outlook, a larger or smaller provision for bad and doubtful debts would have resulted in the Banking and Savings segment that could have had a material impact on Abbey’s reported operating loss in 2003. Specifically, if management’s conclusions as to the current economic outlook were different, but within the range of what management deemed to be reasonably possible economic outlooks, the provision charge for bad and doubtful debts in the Banking and Savings segment could have decreased in 2003 from an actual provision charge of £130m (2002: £139m) by as much as £141m (2002: £126m), with a potential
corresponding decrease in Abbey’s operating loss in 2003 of up to 19% (2002: 12%), or increased by £20m (2002: £2m), with a potential corresponding increase in Abbey’s operating loss in 2003 of up to 3% (2002: nil). The actual provision charge of £130m (2002: £139m) in 2003, which was at the high end of the provision range, was based on what management estimated to be the most probable economic outlook within the range of reasonably possible economic outlooks.
(b) Investment securities
Debt securities, equity shares and similar interests held for investment purposes are stated at cost, adjusted for amortisation of premium or discount on an appropriate basis. Provision is made for any impairment. Abbey conducts regular impairment reviews of the investment portfolio and considers indicators, such as serious downgrades in credit ratings, breach of covenants or failure to make interest payments, that may suggest that interest and principal may not be paid in full.
We consider that the accounting estimate related to impairment of our investment securities is a “critical accounting estimate” because: (i) it is highly susceptible to change from period to period because it requires us to make assumptions about the likelihood of the recoverability of the investments’ carrying values based on the length of time the investments’ fair value have been below their carrying amount, the severity of the decline in value, and our ability and intent to hold the securities until their cost is recovered, and (ii) the impact that recognising an impairment would have on the assets reported on our balance sheet as well as our net profit/(loss) could be material.
Impairments of investment securities are charged to the line item “Amounts written off fixed asset investments” in the Profit and Loss Account. Impairment charges are deducted from the “Debt securities” and “Equity shares and other similar interests” line items in our balance sheet.
We could have chosen, in the current period, estimates that would have had a materially different impact on our financial presentation. For example, our financial statements for the year ended 31 December 2003 included a charge for impairment of investment securities in our Wholesale Banking division (part of our Portfolio Business Unit) for an amount equal to £45m (2002: £390m). This provision reflected the length of time the investments’ fair value have been below their carrying amount, and the change in 2003 in our intent regarding our investment securities portfolios. If management had continued to intend to hold the securities until their cost was recovered, the impairment charge could have decreased significantly.
(c) Trading securities and derivatives
Securities which are not held for the purpose of investment, and the associated funding and derivatives classified as trading, are stated at fair value. The fair value of such financial instruments is the estimated amount at which the instrument could be exchanged in a current transaction between willing parties, other than in a forced or liquidation sale. If a quoted market price is available for an instrument, the fair value is calculated based on the market price.
Where quoted market prices are not available, as is the case with certain over-the-counter derivatives, fair value is determined using pricing models which use a mathematical methodology based on accepted financial theories. Depending on the product type and its components, the fair value of over-the-counter derivatives is modelled using one or a combination of pricing models that are widely accepted in the financial services industry.
Pricing models take into account the contract terms of the securities as well as market-based valuation parameters, such as interest rates, volatility, exchange rates and the credit rating of the counterparty. Valuation adjustments are an integral component of the fair value estimation process and are taken on individual positions where either the absolute size of the trade or other specific features
| Abbey Annual Report and Accounts 2003 | 13 |
Back to Contents
Operating and Financial Review
Operating Review – Summarycontinued
of the trade or the particular market (such as counterparty credit risk, concentration or market liquidity) require more than the simple application of pricing models.
When valuation parameters are not observable in the market or cannot be derived from observable market prices, as is the case with certain over-the-counter derivatives, the fair value is derived either through historical analysis of other observable market data (such as spot prices) or through an estimation of a valuation adjustment appropriate for each product. Typically, historical benchmarks are combined with management judgement in this process.
We consider that the accounting estimate related to valuation of trading securities and derivatives where quoted market prices are not available is a “critical accounting estimate” because: (i) it is highly susceptible to change from period to period because it requires management to make assumptions about interest rates, volatility, exchange rates, the credit rating of the counterparty, valuation adjustments and specific features of the transactions and (ii) the impact that recognising a change in the valuations would have on the assets reported on our balance sheet as well as our net profit/ (loss) could be material.
Changes in the valuation of trading securities and derivatives where quoted market prices are not available are accounted for in the line item “Dealing profits” in the Profit and Loss Account and the “Other assets” line item in our balance sheet.
We could have chosen, in the current period, estimates that would have had a materially different impact on our financial presentation. Had management used different assumptions regarding the interest rates, volatility, exchange rates, the credit rating of the counterparty, and valuation adjustments, a larger or smaller change in the valuation of trading securities and derivatives where quoted market prices are not available would have resulted that could have had a material impact on Abbey’s reported operating loss in 2003.
For details of our US GAAP accounting policy refer to Note 58 of the financial statements.
(d) Long-term assurance business
Abbey accounts for the value of the shareholders’ interest in the long-term assurance business using the embedded value basis of accounting, in accordance with UK GAAP for banking groups that own life assurance operations. The embedded value is comprised of the net tangible assets of the life assurance subsidiaries and the present value of the in-force business, which is calculated by projecting future surpluses and other net cash flows attributable to the shareholders arising from business written by the balance sheet date and discounting the result at a rate which reflects the shareholders’ overall risk premium.
Future surpluses will depend on lapse rates, mortality, persistency, investment returns for various categories of investments and levels of expenses (both salary and non-salary). Surpluses are estimated by management through assumptions about future experience, having regard to both actual experience and current economic trends. Surpluses expected to emerge in the future are discounted at risk-adjusted discount rates after provision has been made for taxation. There is an acceptable range into which these assumptions can validly fall, and the use of different assumptions or changes to these assumptions may cause the present value of future surpluses to differ from those assumed at the balance sheet date. This could significantly affect the income recognised, and the value attributed to the in-force business, in the accounts.
The value of the in-force business could also be affected by changes in the amounts and timing of other net cash flows, principally annual management charges and other fees levied upon the policy holders, which are reflected in the Profit and Loss Account using unsmoothed fund values. In addition, to the extent that actual experience is different from that assumed, the effect will be recognised in the Profit and Loss Account for the period. Demographic assumptions are set individually by product. It is therefore not appropriate to apply
a global adjustment to these percentages as it would not give a meaningful sensitivity as different products will react differently or even contrarily to changes in economic conditions.
With respect to the provision required relating to the shareholders’ liability for the realistic balance sheet position, there remains uncertainty as to the final form of the Financial Services Authority’s regulations in this area. As a result, the calculations of the year-end position, and the ultimate amounts of any additional capital to be borne by policyholders and shareholders, have not been finalised. A provision has therefore been made based on management’s current estimate of the potential cost to the shareholder, though it is possible that the final cost will be significantly higher or lower. If we had made different judgements as to the likely outcome of the uncertainties above, the provision would have been increased or reduced significantly.
(e) Impairment of goodwill
The carrying value of goodwill is stated at cost less accumulated amortisation. The carrying value of goodwill is written down by the amount of any impairment, and the loss is recognised in the Profit and Loss Account in the period in which this occurs. Should an external event reverse the effects of a previous impairment, the carrying value of the goodwill may be written up to a value no higher than the original amortised cost. Impairments are calculated with reference to the discounted cash flows of the entity or income generating unit. Assumptions about expected future cash flows require management to make assumptions about interest rates, the health of the economy and operating costs. This involves significant judgement because such factors have fluctuated in the past and are expected to continue to do so.
We consider that the accounting estimate related to impairment of goodwill is a “critical accounting estimate” because: (i) it is highly susceptible to change from period to period because it requires management to make assumptions about future cash flows, interest rates, the health of the economy and operating costs, and (ii) the impact that recognising a goodwill impairment charge would have on the assets reported on our balance sheet as well as on our net profit/ (loss) could be material.
Goodwill impairment charges are accounted for in the line item “Impairment of goodwill” in the Profit and Loss Account and the “Intangible fixed assets” line item in our balance sheet.
We could have chosen, in the current period, estimates that would have had a materially different impact on our financial presentation. Had management used different assumptions regarding the future cash flows, interest rates, the health of the economy and operating costs, a goodwill impairment charge would have resulted that could have had a material impact on Abbey’s reported operating loss in 2003.
Change in accounting policy
Shares purchased through Employee Share Option Plans are held at cost, and taken as a deduction from Shareholders’ Equity in accordance with UITF 38, “Accounting for ESOP Trusts”. Previously, these were accounted for as Other Assets at the lower of cost and net realisable value, with any impairments being taken to the Profit and Loss Account.
The profit and loss impact of this change in accounting policy was to decrease 2002 loss before tax by £37m (2001: nil impact).
Change in accounting estimates
During the year, the basis by which embedded value is calculated was changed from a passive to an active economic basis. This new approach involves applying actual asset mix to economic assumptions (e.g. rates of investment returns, inflation) set with reference to market conditions at the valuation date. Previously, long-term economic and asset allocation assumptions were set by management based on their assessment of long-term trends rather than the current position. As this is a change in estimate, a restatement of prior periods’ results is not required.
| 14 | Abbey Annual Report and Accounts 2003 |
Back to Contents
Operating and Financial Review
Operating Review – Summarycontinued
Current and future developments in UK and US GAAP
Current and future developments in UK and US GAAP are detailed in the notes to the Consolidated Financial Statements. |
| | |
Significant acquisitions and disposals
The results for 2003 have been materially impacted by the disposals described in note 24 of the Consolidated Financial Statements. |
| | |
Profit on disposal of Group undertakings
Profit on disposal of Group undertakings increased from £48m in 2002 to £89m in 2003, primarily due to the disposals of Abbey’s Italian residential lending business. See the Consolidated Financial Statements for further details. |
| | |
Potential impact of International Financial Reporting Standards
Abbey, along with all listed companies in the European Union, will be required to prepare its financial statements under International Financial Reporting Standards (sometimes referred to as International Accounting Standards) from 1 January 2005. These standards represent a significant change from UK GAAP. The effect on our results cannot be accurately predicted at this stage both due to the nature of the standards themselves and the number of uncertainties that remain. The principal uncertainties are: |
 | a number of key International Financial Reporting Standards have not yet been finalised, principally those related to insurance accounting (“Insurance Phase 1”) and “macro hedge” accounting; |
| whether the European Union adopts International Financial Reporting standards for financial instruments (IAS 32 and 39) and insurance accounting; and |
| the approach of the Financial Services Authority towards International Financial Reporting standards and whether the new accounting treatments will be adopted in the calculation of regulatory capital. The Inland Revenue has started to issue guidance in this area and the effect of their proposals is under review. The combination will affect both the tax charge and our accounting and regulatory equity ratios. |
International Financial Reporting Standards includes a number of areas, principally financial instruments and defined benefit pensions, where fair values are required to a far greater extent than under UK GAAP. This will create greater volatility in reported results and have an associated impact on other financial measures.
A company-wide project with the objective of ensuring full compliance with International Financial Reporting Standards in 2005 is underway. Significant deliverables include making the necessary changes to reporting systems to enable compliance with International Financial Reporting Standards, identifying all required changes to accounting policies, and ensuring the resultant solutions are optimal from a business and financial perspective. Key operational and control issues, as well as significant risks and uncertainties, are reported to the project steering committee on a monthly basis.
Given the level of uncertainty as set out above, the effect of International Financial Reporting Standards on Abbey cannot be quantified at this juncture. However, the key changes and their potential effect on Abbey are set out below. |
| Abbey Annual Report and Accounts 2003 | 15 |
Back to Contents
Operating and Financial Review
Operating Review –Summarycontinued
| Issue | | Effect on financial statements |
|
Life assurance
Our current group accounts include the embedded values of our life businesses on the balance sheet, thus recognising the discounted value of future profits (DVFP). The IFRS standards for Life Assurance remain uncertain — an interim standard (“Phase 1”), is due to be released in late March 2004, prior to a comprehensive standard on life assurance being released in the future. However, it is currently anticipated that any contracts, which are largely investment in nature (i.e., do not contain significant insurance risk) will instead be accounted for as financial instruments under IAS 39. The split between insurance and investment products depends on the final form of the IFRS insurance standards. | | Overall reduction in equity on initial adoption as the DVFP of investment products recognised on writing of new business is reversed out, to be recognised in future periods.
IAS 39 accounting for investment products is likely to reduce profits from new business in the year in which the business is written, particularly as DVFP will no longer be recognised but replaced by DAC. There will be an offset in terms of earnings from the in-force book on which DVFP will not have been recognised in prior periods. |
| |
| | |
| Whilst DVFP will no longer be recognised in respect of the investment contracts, we will be able to recognise the amortised value of deferred acquisition costs (DAC). However, the acquisition costs that are deferrable under IFRS are likely to be restricted largely to initial commission, which is likely to be significantly lower in value than the current DVFP. In addition, the current element of actuarial liabilities relating to investment contracts will be replaced by the face value of units and certain guarantees and options will need to be recognised at their time value. | |
| | | |
| The IFRS staff will be starting work on the Phase II project in May 2004 and are aiming to complete an exposure draft by June 2005 for adoption in 2007. This will re-examine from basics the fair value model for insurance contracts and will result in a consistent basis of reporting for insurance contracts for both insurance companies and bancassurers. It is anticipated that fair value will be based upon discounted cash flow techniques. Issues remain, inter alia, over which cash flows should be included and how the margin should be adjusted for risk. | | |
|
Hedge Accounting
IAS 39 requires derivatives to be recognised at fair value, with changes in the valuation impacting the Profit and Loss Account, potentially resulting in significant earnings volatility. Hedge accounting permissibility is much more restricted under IAS 39 than at present under UK GAAP.
Abbey’s retail business makes extensive use of derivatives to manage interest rate risk. As many of the products reprice or mature on a behavioural rather than contractual basis, compliance with the hedge accounting rules of IAS 39 is difficult. The business model is therefore being redesigned to maximise the natural offsets between assets and liabilities and design compliant hedging strategies wherever possible for the remainder. | | IAS 39 would have a significant impact on equity and earnings if the current hedging approach and supporting processes were unchanged.
However, the proposed business model is designed to considerably reduce both the degree of equity and earnings impact, and the volatility arising from IAS 39. |
| |
| |
| |
| | | |
| The degree to which this is practicable depends on the final form of the hedging rules (due end March 2004). Nevertheless, the objective will continue to be to provide an economic hedge for the bank’s market risk exposures. | | |
|
| Treasury | | Little anticipated effect. |
| Little impact is anticipated as the Personal Financial Services treasury business is already largely accounted for on a mark-to-market basis, although there are some changes to detailed valuation rules. | | |
| | | |
| Loan and securities Portfolio Business Unit assets are expected to be minimal by the time IAS is implemented. | | |
|
Pensions
IAS 19 is broadly consistent with the current standard, FRS 17, with the fund valuation dependent on market conditions. | | As with FRS 17, the pension charge is likely to be slightly higher than the present SSAP 24 charge. Equity impact depends to a large extent on market conditions. On initial adoption, any deficit (or surplus) in the pension schemes will be charged (credited) to equity. |
| | |
| In particular, it is proposed that any pension scheme surplus/deficit is taken to a separate component of equity, without impacting the Profit and Loss Account. | |
|
Effective interest rate
IAS 39 requires the inclusion of all origination fees and related costs, including pre-payment penalties in the calculation of the effective interest rate.
It is currently anticipated that the period over which the fees are spread is likely to be consistent with the current approach, therefore making a significant effect on earnings unlikely. | | Little impact on earnings, as a reduction in fees is offset by a corresponding increase to net interest income.
Effect would be more significant if the period is inconsistent with the current approach. |
| |
| |
| |
|
| Provisions | | Slight increase in volatility as provisions reflect the economic climate at the reporting date. This could lead to lower provisions if the economic climate is benign on implementation. |
| IAS 39 will remove the split between general and specific provisions, and only allow provisions on losses that have already been incurred, based on objective evidence of impairment. The “present value of future cash flows” concept is applicable to determine the carrying value of the asset, though allowance can still be made for portfolios of loans taken together. | |
|
| Taxation | | Unknown. |
| Depends on both the final adjustments to IFRS and the as yet unknown rules the Inland Revenue will apply. | | |
|
Software capitalisation
IAS 38 requires the capitalisation of certain expenditure relating to software development costs. | | Increase in equity on initial adoption due to an increase in capitalised assets. Little impact on income. |
| |
|
Assets leased to customers
IAS 17 requirements in respect of the depreciation of operating lease assets appear similar to UK GAAP, but do not permit the current practice of actuarial after-tax depreciation method. As a result, the choice of permitted depreciation methods may become more limited, which may reduce the scope for applying interest methods of depreciation and require a wider use of the straight-line method.
The actual methodology is under debate. | | The allocation of earnings to later years will result in a reduction in equity on initial adoption.
Changing to a new depreciation method will reduce earnings in the early years of the life of the operating lease, with increased earnings in later years. In particular, this will impact the recognition of earnings from the operating leasing businesses. |
| |
| |
| |
|
Deferred taxation
Under IAS 12, deferred taxation provisioning is required in respect of revalued assets. | | Additional deferred taxation provisioning will be required in respect of assets revalued on acquisition.
Increased provisioning for deferred taxation will result in a reduction in equity on initial adoption. |
|
| 16 | Abbey Annual Report and Accounts 2003 |
Back to Contents
Operating and Financial Review
Operating Review –Summary continued
Potential impact of Consultation Paper 195
The Financial Services Authority is due to introduce new supervision rules for all regulated business (including Life companies) in mid-to-late 2004, under a new Integrated Prudential Sourcebook applicable from the start of 2005. This will have an impact on our systems and controls as well as on capital and solvency requirements.
For Life companies writing with-profits business the key implications for capital requirements will arise from the need to consider the value of liabilities due to policyholders calculated on a “realistic” basis as set out under Consultation Paper 195. The “realistic” value will represent all contractual and constructive liabilities to policyholders. Constructive liabilities arise out of a company’s past practice or market announcements, rather than arising from contractual terms. The contractual and constructive liabilities to policy holders include options and guarantees such as guaranteed annuity options, which have been subject to much publicity. In addition, the proposals require an appropriate risk capital margin for credit, market, operational and other risks. The overall impact on our Life companies will depend on the nature of the products written and in particular the nature of guarantees within products. Many of these guarantees and options have been written into with-profit policies and annuities, hence it is reasonable to assume that the new requirements will negatively impact those products, a view generally shared within the industry.
Abbey has set up a project to consider the implications of the Integrated Prudential Sourcebook including an assessment of the capital and operational implications for the Life businesses. A detailed gap analysis has been completed to identify additional operational requirements for the new regulations, which will be implemented throughout 2004. In line with industry best practice, Abbey has developed, and is refining, appropriate models to determine the required level of risk-based capital. This is dependent upon Abbey’s future investment strategy for the relevant funds, which will continue to balance both policyholder and shareholder needs. At this stage it is difficult to quantify the final impact on risk-based capital. Considerable uncertainties remain, arising from the Financial Services Authority’s clarifications needed and refinement of “realistic” model calculations. However, the effect of provisions made in 2002 and 2003 will mean Abbey has already made significant strides towards providing for the cost of guarantees and options on a “realistic” basis as required under the new requirements.
In addition, the Financial Services Authority has published its Consultation Paper 207, treating with-profits policy holders fairly, which sets out a wide range of proposals covering the operation of with-profits funds, including the calculation of payouts on maturities and surrenders on with-profits policies. The implications of these changes are being considered as part of Abbey’s overall Integrated Prudential Sourcebook project.
Potential impact of the Basel II Capital Accord
The Basel II Capital Accord (“Basel II”) is expected to introduce, for banks, more risk-sensitive approaches for the calculation of regulatory capital for credit risks, and a new approach for calculating regulatory capital for operational risks. In addition, Basel II introduces new requirements for disclosure by banks of key risk information and additional requirements relating to risk management and capital planning.
Basel II is currently expected to run in parallel with the existing supervisory regime during 2006, and should be implemented in the UK by the Financial Services Authority, along with the equivalent European Directive, via the Integrated Prudential Sourcebook, in 2007. Basel II is due to be finalised in mid-2004, with the Financial Services Authority’s next consultation paper on implementation scheduled for publication in the third quarter of 2004.
A major project is underway to prepare Abbey for the new requirements and we are currently on schedule, assuming there are no major changes to the draft proposals. Abbey’s strategic aim continues to be to achieve the Advanced Internal Ratings-Based Approach for credit risks for its material portfolios and initially to adopt the Standardised Approach for operational risks, with the aim of moving to the Advanced Measurement Approach in due course. As with all users of the Internal Ratings-Based Approach, Abbey is expected to be subject to capital floors of 90% and then 80% of the capital calculated under the previous methodology, in the first two years of implementation. This will initially limit the potential benefit to a maximum of 10% and 20% of capital requirements, as they would be calculated under current rules in years one and two, respectively.
In light of the timetable set out above, it is still not possible to be precise about the impact of Basel II on Abbey’s regulatory capital ratios. However, Abbey anticipates that it will be able to provide more precise information in early 2005. An indication of the potential effect of the key changes is on the next page.
| Abbey Annual Report and Accounts 2003 | 17 |
Back to Contents
Operating and Financial Review
Operating Review – Summary continued
| Issue | | Capital impact |
|
|
|
Personal Financial Services mortgage assets
Abbey's assets comprise mainly residential mortgages, personal loans and bank accounts, and will fall within the 'retail' asset class under Basel II.
Securitisation
The securitisation proposals continue to be one of the few areas of Basel II that are still subject to a fundamental review.
The latest proposals indicate that the most aggressive approach would eliminate any favourable regulatory capital treatment derived from current securitisation programmes. | | Current estimates, based on a range of assumptions relating both to levels of business and loss estimates, indicate a reduction in risk-weighted assets in the region of 30% to 50%.
As yet unclear, but we understand the maximum negative impact would be the equivalent of holding the assets on the balance sheet. |
|
|
|
Treasury
It is possible that some or all of Abbey's remaining Banking books may be reclassified as trading.
Wholesale PBU assets are expected to be immaterial to total risk-weighted assets by the end of 2006. | | There is likely to be a reduction in trading book risk-weighted assets. |
|
|
|
Life assurance
Capital deductions are likely to continue to be calculated on the current basis but are expected to be made from Tiers 1 and 2 in equal measure, rather than from total capital. | | Expected to reduce Abbey's Tier 1 ratio. |
|
|
|
Expected / unexpected losses
Revised proposals on the treatment of expected and unexpected losses within the internal ratings framework for credit risks have been recently issued and are currently being reviewed. | | Abbey anticipates any potential reduction in Tier 2 capital to be at least offset by the exclusion of expected losses in the IRB framework for all assets through a write-back to capital. Most of this is likely to be in place via IAS 39. |
|
|
|
Operational risk
This is a new charge with no existing equivalent. The Standardised Approach is based on gross income by business line multiplied by a factor for that business line (beta), reflecting its relative riskiness. | | Abbey's operational risk charge will reflect the large proportion of gross income derived from the Retail business line, which is the least risky and attracts the lowest beta.
However, the Basel Committee plans to re-evaluate calibration, which could materially impact the regulatory capital charge under the Standardised Approach. |
|
|
|
Pillar 2 – Supervisory review
The Basel Committee has recently sought to clarify the purpose of Pillar 2 supervisory review of capital. However, the FSA is yet to clarify how it proposes to satisfy itself with, and then respond to, a bank’s approach to Pillar 2. | | There is continuing uncertainty over its regulatory capital impact, if any. |
|
|
|
Potential impact of Consultation Paper 204
Consultation Paper 204 is the Financial Services Authority's interpretation of the EU Finance Group's Directive, defining the capital necessary for a financial conglomerate with operations in banking, insurance, investment management and building society arenas. It has particular significance for those groups operating beneath a holding company structure, which does not apply to Abbey. The overall impact to Abbey is expected to be broadly neutral, if the consultative paper goes forward in its current form, except for one feature relating to subsidiary life groups.
Life companies must be individually capitalised to meet Minimum Solvency Requirements. Where there is a Life holding company between these entities and a Financial Services Authority – supervised parent bank, the solvency test for that holding company has traditionally been a 'soft test' (i.e. providing the parent bank had sufficient surplus capital to meet any shortfall in the life holding company's required solvency, that capital amount did not have to be physically injected). This discretion is likely to be removed under the European drafting. While this is not expected to have a material impact on Abbey, the situation will clearly require monitoring, and appropriate action would need to be taken to mitigate any effect.
| | |
| 18 | Abbey Annual Report and Accounts 2003 |
Back to Contents
Operating and Financial Review
Operating Review – Summary continued
Group summary
Summarised consolidated statutory Profit and Loss Account and selected ratios
| | 31 December | | 31 December | | 31 December | |
| | 2003 | | 2002 | | 2001 | |
| | £m | | £m | | £m | |
|
|
|
|
|
| |
| Net interest income | 2,148 | | 2,689 | | 2,692 | |
|
|
|
|
|
| |
| Non-interest income | 284 | | 811 | | 1,319 | |
|
|
|
|
|
| |
| Total operating income | 2,432 | | 3,500 | | 4,011 | |
|
|
|
|
|
| |
| Administrative expenses and | | | | | | |
| depreciation on fixed assets | (2,126 | ) | (1,955 | ) | (1,820 | ) |
|
|
|
|
|
| |
| Goodwill impairment and amortisation | (38 | ) | (1,202 | ) | (36 | ) |
|
|
|
|
|
| |
| Depreciation and impairment on | | | | | | |
| operating lease assets | (251 | ) | (280 | ) | (256 | ) |
|
|
|
|
|
| |
| Provision for bad and doubtful debts | (474 | ) | (514 | ) | (263 | ) |
|
|
|
|
|
| |
| Provisions for contingent liabilities | | | | | | |
| and commitments | (104 | ) | (50 | ) | 9 | |
|
|
|
|
|
| |
| Amounts written off fixed | | | | | | |
| asset investments | (193 | ) | (511 | ) | (256 | ) |
|
|
|
|
|
| |
| Operating profit (loss) | (754 | ) | (1,012 | ) | 1,389 | |
|
|
|
|
|
| |
| Income from associated undertakings | 12 | | 17 | | 14 | |
|
|
|
|
|
| |
| Profit on disposal of Group undertakings | 89 | | 48 | | 67 | |
|
|
|
|
|
| |
| Profit (loss) on the sale or termination of | | | | | | |
| an operation | (33 | ) | – | | – | |
|
|
|
|
|
| |
| Profit (loss) on ordinary activities | | | | | | |
| before tax | (686 | ) | (947 | ) | 1,470 | |
|
|
|
|
|
| |
| Tax on profit (loss) on ordinary activities | 42 | | (152 | ) | (464 | ) |
|
|
|
|
|
| |
| Profit (loss) on ordinary activities | | | | | | |
| after tax | (644 | ) | (1,099 | ) | 1,006 | |
|
|
|
|
|
| |
| Earnings (loss) per ordinary share | (52.4 | )p | (84.8 | )p | 63.2 | p |
|
|
|
|
|
| |
| Dividend per ordinary share | 25.0 | p | 25.0 | p | 50.0 | p |
|
|
|
|
|
| |
| Equity Shareholders' funds | 4,699 | | 5,602 | | 7,521 | |
|
|
|
|
|
| |
| Net asset value per ordinary share | 321 | p | 384 | p | 468 | p |
|
|
|
|
|
| |
| Tier 1 capital ratio | 10.1 | % | 9.2 | % | 8.4 | % |
|
|
|
|
|
| |
| Equity Tier 1 capital ratio | 6.9 | % | 6.4 | % | 6.4 | % |
|
|
|
|
|
| |
| Closing risk weighted assets (£bn) | 61.2 | | 78.7 | | 84.5 | |
|
|
|
|
|
| |
2003 compared to 2002
Loss on ordinary activities before tax of £686m compared to £947m in 2002. Material movements by line include:
| > | net interest income of £2,148m (2002: £2,689m), down 20%, with lower average asset balances reflecting accelerated Portfolio Business Unit disposals; |
| > | non-interest income of £284m (2002: £811m), down 65% as a result of increased loss realisations driven from Portfolio Business Unit asset sales; |
| > | administrative expenses and depreciation on fixed assets of £2,126m (2002: £1,955m), up 9%, driven by re-organisation expenses including asset write-downs, partly offset by savings from the cost programme; |
| > | goodwill impairment and amortisation of £38m which relates primarily to amortisation of remaining Scottish Provident goodwill, and is significantly lower than the charge in 2002 that was driven by goodwill impairments of £1,138m; |
| > | provisions for bad and doubtful debts of £474m (2002: £514m), down 8% benefiting from lower Portfolio Business Unit related provisions given reduced asset balances; |
| > | provisions for contingent liabilities and commitments up to £104m (2002: £50m) following a £50m provision for product misselling exposures; and |
| > | lower amounts written off fixed-asset investments of £193m (2002: £511m) reflecting provisioning raised in 2002 arising from specific counterparty deterioration in the Portfolio Business Unit, and consistent with the significant reduction in asset balances during 2003. |
| | |
2002 compared to 2001
Loss on ordinary activities before tax of £947m compared to a profit of £1,470m in 2001. Material movements by line item include: |
| > | non-interest income of £811m (2001: £1,319m), down 39%, largely due to the impact of embedded value charges and rebasing, and a £166m decrease in the Banking and Savings segment; |
| > | goodwill impairment and amortisation of £1,202m (2001: £36m), increased significantly due primarily to the impairments of Scottish Provident (£604m), First National (£357m), and Cater Allen Offshore (£149m); |
| > | provisions for bad and doubtful debts of £514m (2001: £263m), up 95%, primarily due to Wholesale Banking and provisions; |
| > | provisions for contingent liabilities and commitments increased £59m to £50m in 2002 partly resulting from releases in 2001 of £25m not repeated, with the balance relating to various potential claims; |
| > | amounts written off fixed asset investments of £511m (2001: £256m), up 100%, which related primarily to a marked deterioration in credit quality in certain sectors where Abbey held risk concentration; |
| > | in 2002 the tax benefit decreased to £152m as compared with £464m in 2001. This was the result of a decrease in profit before taxes and before the charge for goodwill impairment. The tax benefit decreased in 2002 as compared with 2001 as a result of the non-allowable charge for impairment of goodwill, an increase in the effect of non-allowable provisions and other non-equalised items, and the taxation of dividends received from offshore subsidiaries; |
| > | this was reflected in the loss per share of (84.8) pence; |
| > | the 2002 full-year dividend of 25.0 pence, down 50% on 2001. |
| > | Tier 1 capital remained strong at 9.2% (2001: 8.4%), whilst the Equity Tier 1 ratio remained flat at 6.4%. The negative impact on Equity Tier 1 of the embedded value re-basing and Wholesale Banking provisions, was offset by a reduction of risk-weighted assets of £5.8bn, largely due to asset sales in the Wholesale Bank. |
| Abbey Annual Report and Accounts 2003 | 19 |
Back to Contents
Operating and Financial Review
Operating Review – Summary continued
Summarised consolidated statutory profit and loss account analysed between Personal Financial Services and the Portfolio Business Unit
| | 31 December 2003 | | 31 December 2002 | | 31 December 2001 | |
|
|
|
|
|
|
|
|
|
|
|
|
|
|
|
|
|
| |
| | PFS | | PBU | | Total | | PFS | | PBU | | Total | | PFS | | PBU | | Total | |
| | £m | | £m | | £m | | £m | | £m | | £m | | £m | | £m | | £m | |
|
|
|
|
|
|
|
|
|
|
|
|
|
|
|
|
|
| |
| Net interest income | 1,795 | | 353 | | 2,148 | | 1,843 | | 846 | | 2,689 | | 1,819 | | 873 | | 2,692 | |
|
|
|
|
|
|
|
|
|
|
|
|
|
|
|
|
|
| |
| Non-interest income and charges | 615 | | (331 | ) | 284 | | 617 | | 194 | | 811 | | 969 | | 350 | | 1,319 | |
|
|
|
|
|
|
|
|
|
|
|
|
|
|
|
|
|
| |
| Total operating income | 2,410 | | 22 | | 2,432 | | 2,460 | | 1,040 | | 3,500 | | 2,788 | | 1,223 | | 4,011 | |
|
|
|
|
|
|
|
|
|
|
|
|
|
|
|
|
|
| |
| Administrative expenses | (1,842 | ) | (284 | ) | (2,126 | ) | (1,611 | ) | (344 | ) | (1,955 | ) | (1,481 | ) | (339 | ) | (1,820 | ) |
|
|
|
|
|
|
|
|
|
|
|
|
|
|
|
|
|
| |
| Goodwill impairment and amortisation | (28 | ) | (10 | ) | (38 | ) | (811 | ) | (391 | ) | (1,202 | ) | (36 | ) | – | | (36 | ) |
|
|
|
|
|
|
|
|
|
|
|
|
|
|
|
|
|
| |
| Depreciation of operating lease assets | – | | (251 | ) | (251 | ) | (23 | ) | (257 | ) | (280 | ) | (97 | ) | (159 | ) | (256 | ) |
|
|
|
|
|
|
|
|
|
|
|
|
|
|
|
|
|
| |
| Provisions for bad and doubtful debts | (210 | ) | (264 | ) | (474 | ) | (150 | ) | (364 | ) | (514 | ) | (149 | ) | (114 | ) | (263 | ) |
|
|
|
|
|
|
|
|
|
|
|
|
|
|
|
|
|
| |
| Provisions for contingent liabilities | | | | | | | | | | | | | | | | | | |
| and commitments | (85 | ) | (19 | ) | (104 | ) | (46 | ) | (4 | ) | (50 | ) | 9 | | – | | 9 | |
|
|
|
|
|
|
|
|
|
|
|
|
|
|
|
|
|
| |
| Amounts written off fixed asset investments | (10 | ) | (183 | ) | (193 | ) | 2 | | (513 | ) | (511 | ) | (24 | ) | (232 | ) | (256 | ) |
|
|
|
|
|
|
|
|
|
|
|
|
|
|
|
|
|
| |
| Operating (loss) profit | 235 | | (989 | ) | (754 | ) | (179 | ) | (833 | ) | (1 ,012 | ) | 1,010 | | 379 | | 1,389 | |
|
|
|
|
|
|
|
|
|
|
|
|
|
|
|
|
|
| |
| Income from associated undertakings | – | | 12 | | 12 | | – | | 17 | | 17 | | – | | 14 | | 14 | |
|
|
|
|
|
|
|
|
|
|
|
|
|
|
|
|
|
| |
| Profit on disposal of Group undertakings | – | | 89 | | 89 | | – | | 48 | | 48 | | 65 | | 2 | | 67 | |
|
|
|
|
|
|
|
|
|
|
|
|
|
|
|
|
|
| |
| Profit(loss) on the sale or termination of an operation | – | | (33 | ) | (33 | ) | – | | – | | – | | – | | – | | — | |
|
|
|
|
|
|
|
|
|
|
|
|
|
|
|
|
|
| |
| Profit (loss) on ordinaryactivities before tax | 235 | | (921 | ) | (686 | ) | (179 | ) | (768 | ) | (947 | ) | 1,075 | | 395 | | 1,470 | |
|
|
|
|
|
|
|
|
|
|
|
|
|
|
|
|
|
| |
| 20 | Abbey Annual Report and Accounts 2003 |
Back to Contents
Operating and Financial Review
Operating Review – Summarycontinued
Adjustments between the statutory basis and the trading basis
Abbey’s management reviews discrete financial information for each of its segments that includes measures of operating results and assets. However, due to the differing natures of our ongoing Personal Financial Services group of reportable segments and our Portfolio Business Unit group of reportable segments, which is being managed for exit, the Personal Financial Services group of reportable segments and Portfolio Business Unit group of reportable segments is managed differently. The Personal Financial Services group of reportable segments are managed primarily on the basis of its results, which are measured on a trading basis. The Portfolio Business Unit group of reportable segments is managed both on the basis of its results, which is measured on a management basis, and on the basis of its net asset value. On a consolidated level, the trading results of the Personal Financial Services group of reportable segments is aggregated with the management results of the Portfolio Business Unit group of reportable segments to give our summarised trading Profit and Loss Account. The trading basis for our Personal Financial Services group of reportable segments and the management basis for our Portfolio Business Unit group of reportable segments are collectively known as the “trading” basis, as presented below.
Management considers that the trading basis provides the most appropriate way of reviewing the performance of the business. This is because the adjustments are: |
| Embedded value charges and rebasing – these are unpredictable as they depend on both equity and debt markettrends which do not affect the underlying performance of what is a very long-term business. The short-term market movements are, however, a very important factor in the management of the business but these are managed separately with a more risk-based focus. |
| Re-organisation costs – Abbey is going through a significant costs-savings and re-organisation exercise, and management needs to understand the underlying drivers of the cost base that will remain after the exercise is complete, and does not want this view to be clouded by the costs of the exercise. Those costs are managed independently. |
| Goodwill charges – these charges can vary significantly year on year, and hence can materially affect our profit or loss for that year. As a result were view these charges separately to avoid clouding the presentation of underlying results. |
| Depreciation of operating lease assets – The operating lease businesses are managed as financing businesses and therefore management needs tosee the margin earned on the businesses. Residual value risk is separately managed. As a result we net the depreciation against the related income. |
| Income from associated undertakings is included within trading income because it is a regular source of income to our operations. Therefore management believes its inclusion at this level reflects our aggregate income from our activities. |
| Profit on disposal of Group undertakings is included within trading income for reasons similar to those noted above relating to our income from associated undertakings. |
| Abbey Annual Report and Accounts 2003 | 21 |
Back to Contents
Operating and Financial Review
Operating Review – Personal Financial Services
Personal Financial Services profit before tax by segment
| 31 December 2003 | Banking
and
Savings
£m | | Investment
and
Protection
£m | | Treasury
Services
£ m | | General
Insurance
£m | | Group
Infrastructure
£ m | | Total
£m | |
|
|
|
|
|
|
|
|
|
|
|
| |
| Net interest income | 1,720 | | 83 | | 112 | | (5 | ) | (115 | ) | 1,795 | |
|
|
|
|
|
|
|
|
|
|
|
| |
| Non-interest income | 427 | | 214 | | 137 | | 126 | | 90 | | 994 | |
|
|
|
|
|
|
|
|
|
|
|
| |
| Depreciation on operating lease assets | – | | – | | – | | – | | – | | – | |
|
|
|
|
|
|
|
|
|
|
|
| |
| Total trading income | 2,147 | | 297 | | 249 | | 121 | | (25 | ) | 2,789 | |
|
|
|
|
|
|
|
|
|
|
|
| |
| Total trading expenses | (1,132 | ) | (58 | ) | (109 | ) | (48 | ) | (230 | ) | (1,577 | ) |
|
|
|
|
|
|
|
|
|
|
|
| |
| Provision for bad and doubtful debts | (130 | ) | – | | – | | – | | – | | (130 | ) |
|
|
|
|
|
|
|
|
|
|
|
| |
| Provisions for contingent liabilities and commitments | (9 | ) | – | | – | | – | | (52 | ) | (61 | ) |
|
|
|
|
|
|
|
|
|
|
|
| |
| Amounts written off fixed asset investments | – | | – | | – | | – | | – | | – | |
|
|
|
|
|
|
|
|
|
|
|
| |
| Trading profit before tax | 876 | | 239 | | 140 | | 73 | | (307 | ) | 1,021 | |
|
|
|
|
|
|
|
|
|
|
|
| |
| Adjust for: | | | | | | | | | | | | |
|
|
|
|
|
|
|
|
|
|
|
| |
| – Embedded value charges and rebasing | – | | (443 | ) | – | | – | | – | | (443 | ) |
|
|
|
|
|
|
|
|
|
|
|
| |
| – Re-organisation expenses | (169 | ) | (16 | ) | (19 | ) | (41 | ) | (70 | ) | (315 | ) |
|
|
|
|
|
|
|
|
|
|
|
| |
| – Goodwill charges | – | | – | | – | | – | | (28 | ) | (28 | ) |
|
|
|
|
|
|
|
|
|
|
|
| |
| Operating profit (loss) | 707 | | (220 | ) | 121 | | 32 | | (405 | ) | 235 | |
|
|
|
|
|
|
|
|
|
|
|
| |
| | | | | | | | | | | | | |
| | Banking | | Investment | | | | | | | | | |
| | and | | and | | Treasury | | General | | Group | | | |
| | Savings | | Protection | | Services | | Insurance | | Infrastructure | | Total | |
| 31 December 2002 | £m | | £m | | £m | | £m | | £m | | £m | |
|
|
|
|
|
|
|
|
|
|
|
| |
| Net interest income | 1,799 | | 90 | | 132 | | (3 | ) | (175 | ) | 1,843 | |
|
|
|
|
|
|
|
|
|
|
|
| |
| Non-interest income | 454 | | 335 | | 126 | | 149 | | 106 | | 1,170 | |
|
|
|
|
|
|
|
|
|
|
|
| |
| Depreciation on operating lease assets | (23 | ) | – | | – | | – | | – | | (23 | ) |
|
|
|
|
|
|
|
|
|
|
|
| |
| Total trading income | 2,230 | | 425 | | 258 | | 146 | | (69 | ) | 2,990 | |
|
|
|
|
|
|
|
|
|
|
|
| |
| Total trading expenses | (1,108 | ) | (53 | ) | (110 | ) | (54 | ) | (252 | ) | (1,577 | ) |
|
|
|
|
|
|
|
|
|
|
|
| |
| Provision for bad and doubtful debts | (151 | ) | – | | – | | – | | 1 | | (150 | ) |
|
|
|
|
|
|
|
|
|
|
|
| |
| Provisions for contingent liabilities and commitments | (11 | ) | – | | – | | – | | (35 | ) | (46 | ) |
|
|
|
|
|
|
|
|
|
|
|
| |
| Amounts written off fixed asset investments | 2 | | – | | – | | – | | – | | 2 | |
|
|
|
|
|
|
|
|
|
|
|
| |
| Trading profit before tax | 962 | | 372 | | 148 | | 92 | | (355 | ) | 1,219 | |
|
|
|
|
|
|
|
|
|
|
|
| |
| Adjust for: | | | | | | | | | | | | |
|
|
|
|
|
|
|
|
|
|
|
| |
| – Embedded value charges and rebasing | – | | (553 | ) | – | | – | | – | | (553 | ) |
|
|
|
|
|
|
|
|
|
|
|
| |
| – Re-organisation expenses | (23 | ) | – | | – | | – | | (11 | ) | (34 | ) |
|
|
|
|
|
|
|
|
|
|
|
| |
| – Goodwill charges | – | | – | | – | | – | | (811 | ) | (811 | ) |
|
|
|
|
|
|
|
|
|
|
|
| |
| Operating profit (loss) | 939 | | (181 | ) | 148 | | 92 | | (1,177 | ) | (179 | ) |
|
|
|
|
|
|
|
|
|
|
|
| |
| | |
| 22 | Abbey Annual Report and Accounts 2003 |
Back to Contents
Operating and Financial Review
Operating Review – Personal Financial Services continued
| | Banking | | Investment | | | | | | | | | |
| | and | | and | | Treasury | | General | | Group | | | |
| | Savings | | Protection | | Services | | Insurance | | Infrastructure | | Total | |
| 31 December 2001 | £m | | £m | | £m | | £m | | £m | | £m | |
|
|
|
|
|
|
|
|
|
|
|
| |
| Net interest income | 1,680 | | 54 | | 132 | | (4 | ) | (43 | ) | 1,819 | |
|
|
|
|
|
|
|
|
|
|
|
| |
| Non-interest income | 620 | | 363 | | 177 | | 134 | | 147 | | 1,441 | |
|
|
|
|
|
|
|
|
|
|
|
| |
| Depreciation on operating lease assets | (97 | ) | – | | – | | – | | – | | (97 | ) |
|
|
|
|
|
|
|
|
|
|
|
| |
| Total trading income | 2,203 | | 417 | | 309 | | 130 | | 104 | | 3,163 | |
|
|
|
|
|
|
|
|
|
|
|
| |
| Total trading expenses | (1,069 | ) | (46 | ) | (98 | ) | (42 | ) | (226 | ) | (1,481 | ) |
|
|
|
|
|
|
|
|
|
|
|
| |
| Provision for bad and doubtful debts | (149 | ) | – | | – | | – | | – | | (149 | ) |
|
|
|
|
|
|
|
|
|
|
|
| |
| Provisions for contingent liabilities and commitments | (5 | ) | (3 | ) | – | | – | | 17 | | 9 | |
|
|
|
|
|
|
|
|
|
|
|
| |
| Amounts written off fixed asset investments | – | | – | | (24 | ) | – | | – | | (24 | ) |
|
|
|
|
|
|
|
|
|
|
|
| |
| Trading profit before tax | 980 | | 368 | | 187 | | 88 | | (105 | ) | 1,518 | |
|
|
|
|
|
|
|
|
|
|
|
| |
| Adjust for: | | | | | | | | | | | | |
|
|
|
|
|
|
|
|
|
|
|
| |
| – Embedded value charges and rebasing | – | | (407 | ) | – | | – | | – | | (407 | ) |
|
|
|
|
|
|
|
|
|
|
|
| |
| – Re-organisation expenses | – | | – | | – | | – | | – | | – | |
|
|
|
|
|
|
|
|
|
|
|
| |
| – Goodwill charges | – | | – | | – | | – | | (36 | ) | (36 | ) |
|
|
|
|
|
|
|
|
|
|
|
| |
| – Profit from disposal of group undertakings | – | | – | | – | | – | | (65 | ) | (65 | ) |
|
|
|
|
|
|
|
|
|
|
|
| |
| Operating profit (loss) | 980 | | (39 | ) | 187 | | 88 | | (206 | ) | 1,010 | |
|
|
|
|
|
|
|
|
|
|
|
| |
| | 31 December | | 31 December | | 31 December | |
| | 2003 | | 2002 | | 2001 | |
| Trading profit before tax by brand | £m | | £m | | £m | |
|
|
|
|
|
| |
| Banking and Savings: | | | | | | |
|
|
|
|
|
| |
| – Abbey retail | 858 | | 930 | | 985 | |
|
|
|
|
|
| |
| – cahoot | (15 | ) | (25 | ) | (63 | ) |
|
|
|
|
|
| |
| – Cater Allen and Offshore | 33 | | 57 | | 58 | |
|
|
|
|
|
| |
| Total Banking and Savings | 876 | | 962 | | 980 | |
|
|
|
|
|
| |
|
|
|
|
|
| |
| Investment and Protection: | | | | | | |
|
|
|
|
|
| |
| – Scottish Mutual | 50 | | 126 | | 143 | |
|
|
|
|
|
| |
| – Scottish Provident | 113 | | 48 | | 28 | |
|
|
|
|
|
| |
| – Abbey National Life | 79 | | 205 | | 202 | |
|
|
|
|
|
| |
| – Other | (3 | ) | (7 | ) | (5 | ) |
|
|
|
|
|
| |
| Total Investment and Protection | 239 | | 372 | | 368 | |
|
|
|
|
|
| |
| | | | | | | |
| 2003 compared to 2002 |
| > | Personal Financial Services’ trading profit before tax of £1,021m (2002: £1,219m) was down 16%, largely reflecting reduced earnings from the life assurance businesses and a fall in net interest income in Banking and Savings. |
| > | Banking and Savings’ trading profit before tax decreased by 9% to £876m (2002: £962m). This is largely attributable to a fall in the interest spread. |
| > | Investment and Protection’s trading profit before tax decreased to £239m (2002: £372m) largely due to a £142m adverse swing in experience and assumption changes. This was partially offset by a £44m improvement in expected return. Despite relatively stable margins, contributions from new business were also down 15%, reflecting the drop in investment business volumes. The intermediary protection delivered a solid performance, though the 2003 result was boosted by a £25m favourable experience variance. |
| > | Treasury Services’ trading profit before tax was down 5% to £140m (2002: £148m), with a significantly weaker second half performance reflecting less favourable markets. The result was, nevertheless, relatively strong given the narrower Personal Financial Services focus of this business than in previous years. |
| > | General Insurance’s trading profit before tax of £73m was £19m lower than 2002, primarily due to a reduction in retail margin following an increase in the risk premiums payable to the principal underwriter. |
| | |
| | |
| > | Group Infrastructure’s trading loss before tax improved by £48m to (£307)m (2002: £(355)m) due to increased earnings on centrally-held capital and lower expenses. This has been partly offset by a provision of £50m relating to potential product mis-selling. |
| > | Non-trading charges totalled £(786)m (2002: £(1,398)m), comprising embedded value charges and rebasing of £(443)m (2002: £(553)m), re-organisation expenses of £(315)m (2002: £(34)m) and goodwill charges of £(28)m (2002: £(811)m). These are explained in detail in the “Other material items” section. |
| | |
| 2002 compared to 2001 |
| > | Personal Financial Services’ trading profit before tax of £1,219m in 2002 (2001: £1,518m) was down 20%, largely reflecting increased trading losses in the Group Infrastructure segment and lower trading profits in the Treasury Services segment. |
| > | Group Infrastructure’s trading loss before tax increased by £250m to £355m in 2002 (2001: £105m) caused primarily by a decrease in trading income due to the full-year funding impact of the Scottish Provident acquisition, and the impact of increased gearing levels being borne centrally. |
| > | Group Infrastructure’s trading income reflects earnings on the equity (i.e. interest free) element of the Group’s surplus capital. |
| > | Treasury Services’ trading profit decreased £39m due to poorer market conditions in 2002 compared to 2001. |
| > | The non-trading adjustments increased £955m. These adjustments are discussed in more detail in the “Other material items” section. |
| Abbey Annual Report and Accounts 2003 | 23 |
Back to Contents
Operating and Financial Review
Operating Review – Personal Financial Services continued
Business flows relating to the Personal Financial Services businesses are set out below. These flows are used by management to assess the sales performance of Abbey both absolutely and relative to its peers, and to inform management of product trends in the Personal Financial Services market. These flows can also enable the reader to compare Abbey with other Personal Financial Services organisations.
Personal Financial Services business flows
| | | 31 December | | 31 December | | 31 December | |
| | | 2003 | | 2002 | | 2001 | |
|
|
|
|
|
|
| |
| Banking and Savings | | | | | | | |
|
|
|
|
|
|
| |
| Mortgages:(1) | | | | | | | |
|
|
|
|
|
|
| |
| Gross mortgage lending | | £29.1bn | | £22.1bn | | £16.8bn | |
|
|
|
|
|
|
| |
Capital repayments | | £19.7bn | | £15.4bn | | £11.7bn | |
|
|
|
|
|
|
| |
Net mortgage lending | | £9.4bn | | £6.7bn | | £5.1bn | |
|
|
|
|
|
|
| |
Mortgage stock | | £87.8bn | | £78.4bn | | £71.7bn | |
|
|
|
|
|
|
| |
| Of which: | | | | | | | |
|
|
|
|
|
|
| |
– Abbey retail | | £84.7bn | | £75.7bn | | £69.5bn | |
|
|
|
|
|
|
| |
– Housing Association | | £3.1bn | | £2.7bn | | £2.2bn | |
|
|
|
|
|
|
| |
| Market share – gross mortgage lending | | 10.7% | | 10.1% | | 10.5% | |
|
|
|
|
|
|
| |
| Market share – capital repayments | | 11.2% | | 11.0% | | 11.0% | |
|
|
|
|
|
|
| |
| Market share – net mortgage lending | | 9.9% | | 8.6% | | 9.3% | |
|
|
|
|
|
|
| |
| Market share – mortgage stock | | 11.5% | | 11.7% | | 12.1% | |
|
|
|
|
|
|
| |
| Retail deposits:(2) | | | | | | | |
|
|
|
|
|
|
| |
Total net deposit flows | | £1.2bn | | £1.9bn | | £4.6bn | |
|
|
|
|
|
|
| |
| Of which: | | | | | | | |
|
|
|
|
|
|
| |
– Abbey retail | | £0.4bn | | £1.0bn | | £1.3bn | |
|
|
|
|
|
|
| |
– Other | | £0.8bn | | £0.9bn | | £3.3bn | |
|
|
|
|
|
|
| |
Deposit stock | | £60.5bn | | £59.3bn | | £57.4bn | |
|
|
|
|
|
|
| |
| Of which: | | | | | | | |
|
|
|
|
|
|
| |
– Abbey retail | | £49.2bn | | £48.8bn | | £47.7bn | |
|
|
|
|
|
|
| |
– Other | | £11.3bn | | £10.5bn | | £9.7bn | |
|
|
|
|
|
|
| |
| Market share – total | | | | | | | |
| household deposit flows | | 1.6% | | 2.2% | | 7.5% | |
|
|
|
|
|
|
| |
| Market share – outstanding | | | | | | | |
| household deposits | | 7.1% | | 7.6% | | 8.0% | |
|
|
|
|
|
|
| |
| Banking: | | | | | | | |
|
|
|
|
|
|
| |
| Bank account openings: | | | | | | | |
|
|
|
|
|
|
| |
| – Abbey retail | | 344,000 | | 354,000 | | 330,000 | |
|
|
|
|
|
|
| |
| – Other | | 52,000 | | 90,000 | | 138,000 | |
|
|
|
|
|
|
| |
| | | 396,000 | | 444,000 | | 468,000 | |
|
|
|
|
|
|
| |
| Bank account stock: | | | | | | | |
|
|
|
|
|
|
| |
| – Abbey retail | | 3,335,000 | | 3,138,000 | | 2,923,000 | |
|
|
|
|
|
|
| |
| – Other | | 443,000 | | 447,000 | | 411,000 | |
|
|
|
|
|
|
| |
| | | 3,778,000 | | 3,585,000 | | 3,334,000 | |
|
|
|
|
|
|
| |
| Bank account liability: | | | | | | | |
|
|
|
|
|
|
| |
– Abbey retail | | £4.3bn | | £3.5bn | | £2.7bn | |
|
|
|
|
|
|
| |
– Other | | £3.4bn | | £3.9bn | | £4.8bn | |
|
|
|
|
|
|
| |
| | | £7.7bn | | £7.4bn | | £7.5bn | |
|
|
|
|
|
|
| |
| Credit card openings: | | | | | | | |
|
|
|
|
|
|
| |
| – Abbey retail | | 215,000 | | 216,000 | | 162,000 | |
|
|
|
|
|
|
| |
| – Other | | 36,000 | | 48,000 | | 45,000 | |
|
|
|
|
|
|
| |
| | | 251,000 | | 264,000 | | 207,000 | |
|
|
|
|
|
|
| |
| Credit card stock: | | | | | | | |
|
|
|
|
|
|
| |
| – Abbey retail | | 904,000 | | 748,000 | | 583,000 | |
|
|
|
|
|
|
| |
| – Other | | 141,000 | | 114,000 | | 73,000 | |
|
|
|
|
|
|
| |
| | | 1,045,000 | | 862,000 | | 656,000 | |
|
|
|
|
|
|
| |
| | | 31 December | | 31 December | | 31 December | |
| | | 2003 | | 2002 | | 2001 | |
|
|
|
|
|
|
| |
| Gross unsecured personal | | | | | | | |
| loan lending: | | | | | | | |
|
|
|
|
|
|
| |
| – Abbey retail | | £1.0bn | | £1.0bn | | £1.1bn | |
|
|
|
|
|
|
| |
| – Other | | £0.7bn | | £0.5bn | | £0.1bn | |
|
|
|
|
|
|
| |
| | | £1.7bn | | £1.5bn | | £1.2bn | |
|
|
|
|
|
|
| |
| Unsecured lending asset:(3) | | | | | | | |
|
|
|
|
|
|
| |
| – Abbey retail | | £1.9bn | | £2.0bn | | £2.0bn | |
|
|
|
|
|
|
| |
| – Other | | £1.0bn | | £0.6bn | | £0.2bn | |
|
|
|
|
|
|
| |
| | | £2.9bn | | £2.6bn | | £2.2bn | |
|
|
|
|
|
|
| |
| PFS bank account customer base | | 4.2m | | 4.0m | | 3.7m | |
|
|
|
|
|
|
| |
| *SME account openings (net) | | 38,000 | | 36,000 | | 19,000 | |
|
|
|
|
|
|
| |
| SME account stock | | 129,000 | | 91,000 | | 55,000 | |
|
|
|
|
|
|
| |
| SME account liability | | £3.2bn | | £2.9bn | | £2.3bn | |
|
|
|
|
|
|
| |
| | | | | | | | |
| | | 31 December | | 31 December | | 31 December | |
| | | 2003 | | 2002 | | 2001 | |
|
|
|
|
|
|
| |
| Investment and Protection | | | | | | | |
|
|
|
|
|
|
| |
| Investment: | | | | | | | |
|
|
|
|
|
|
| |
| New business premiums | | | | | | | |
| (excluding with-profit bonds) | | £1,381m | | £2,208m | | £1,690m | |
|
|
|
|
|
|
| |
| New business premiums – | | | | | | | |
| value of with-profit bonds(4) | | £56m | | £208m | | £1,454m | |
|
|
|
|
|
|
| |
| Total life assurance new | | | | | | | |
| business premiums | | £1,437m | | £2,416m | | £3,144m | |
|
|
|
|
|
|
| |
| Inscape and James Hay | | | | | | | |
| new business | | £349m | | £351m | | £126m | |
|
|
|
|
|
|
| |
| Total investment new | | | | | | | |
| business premiums | | £1,786m | | £2,767m | | £3,270m | |
|
|
|
|
|
|
| |
| Annualised equivalent | | | | | | | |
| (excluding with-profit bonds) | | £184m | | £302m | | £276m | |
|
|
|
|
|
|
| |
| Annualised equivalent – | | | | | | | |
| with-profit bonds | | – | | £20m | | £145m | |
|
|
|
|
|
|
| |
| Total life assurance | | | | | | | |
| annualised equivalent | | £184m | | £322m | | £421m | |
|
|
|
|
|
|
| |
| Branch and Direct – | | | | | | | |
| annualised equivalent | | £100m | | £170m | | £196m | |
|
|
|
|
|
|
| |
| Independent Financial Advisor (IFA) | | | | | | | |
| – annualised equivalent | | £84m | | £152m | | £225m | |
|
|
|
|
|
|
| |
| Total life assurance annualised | | | | | | | |
| equivalent | | £184m | | £322m | | £421m | |
|
|
|
|
|
|
| |
| Protection: | | | | | | | |
|
|
|
|
|
|
| |
| Annualised equivalent | | £125m | | £112m | | £81m | |
|
|
|
|
|
|
| |
| Branch and Direct – | | | | | | | |
| annualised equivalent | | £28m | | £27m | | £20m | |
|
|
|
|
|
|
| |
| IFA – annualised equivalent | | £97m | | £85m | | £61m | |
|
|
|
|
|
|
| |
| Total protection annualised | | | | | | | |
| equivalent | | £125m | | £112m | | £81m | |
|
|
|
|
|
|
| |
| Funds under management | | | | | | | |
| – life assurance | | £29bn | | £26bn | | £20bn | |
|
|
|
|
|
|
| |
| * Small to Medium Enterprise. | | | | | | | |
| 24 | Abbey Annual Report and Accounts 2003 |
Back to Contents
Operating and Financial Review
Operating Review – Personal Financial Services continued
| | 31 December | | 31 December | | 31 December | |
| | 2003 | | 2002 | | 2001 | |
|
|
|
|
|
| |
| General Insurance | | | | | | |
|
|
|
|
|
| |
| New policy sales: | | | | | | |
|
|
|
|
|
| |
| Building and Contents | 218,000 | | 267,000 | | 220,000 | |
|
|
|
|
|
| |
| Motor | 25,000 | | 35,000 | | 60,000 | |
|
|
|
|
|
| |
| Creditor(5) | 130,000 | | 144,000 | | 150,000 | |
|
|
|
|
|
| |
| Travel | 33,000 | | 26,000 | | 20,000 | |
|
|
|
|
|
| |
| Other(6) | 46,000 | | 35,000 | | 8,000 | |
|
|
|
|
|
| |
| | 452,000 | | 507,000 | | 458,000 | |
|
|
|
|
|
| |
| Policies in force: | | | | | | |
|
|
|
|
|
| |
| Building and Contents | 1,233,000 | | 1,321,000 | | 1,325,000 | |
|
|
|
|
|
| |
| Motor | 68,000 | | 107,000 | | 132,000 | |
|
|
|
|
|
| |
| Creditor(5) | 295,000 | | 296,000 | | 282,000 | |
|
|
|
|
|
| |
| Travel | 8,000 | | 7,000 | | 6,000 | |
|
|
|
|
|
| |
| Other(6) | 174,000 | | 135,000 | | 107,000 | |
|
|
|
|
|
| |
| | 1,778,000 | | 1,866,000 | | 1,852,000 | |
|
|
|
|
|
| |
| (1) | Mortgage data has been adjusted for all periods to remove the impact of the disposed First National business. |
| | |
| (2) | Deposit inflows and stock have been defined to include all (both retail household and non-household) deposits made through the branch network and remote channels in our retail-orientated businesses, which are predominantly UK-based. For market share purposes only, personal deposits have been used to calculate the share of ‘Outstanding Household Deposits’, in terms of both stock and flow, using a market size estimated from the Office of National Statistics data. |
| | |
| (3) | Unsecured lending asset comprises the sum of unsecured personal loans, credit cards (cahoot only) and overdrafts. |
| | |
| (4) | Includes sales of the Prudential Bond for which only commission income is earned, totalling £54m (2002: £11m). These sales do not have an annualised equivalent. |
| | |
| (5) | Comprises the Paymentcare and Unsecured Creditor products. |
| | |
| (6) | Other comprises accidental death and personal accident products. |
2003 compared to 2002
Banking and Savings
Mortgages
Full-year gross mortgage lending of £29.1bn (2002: £22.1bn) was up 32%, and represented a market share of 10.7%, with the second half up 26% on the first half. With re-mortgage activity remaining significant throughout the year, capital repayments increased to £19.7bn (2002: £15.4bn), but were still slightly below natural stock share, and a lower share in the second half of the year.
Net lending of £9.4bn was 40% higher than 2002 (£6.7bn), equating to a market share of 9.9%. Net lending in the second half was up 47% on the first half, and equated to around 10.4% market share.
Credit quality remains excellent, with the increased new business levels being delivered without any relaxation of lending criteria.
Retail deposits
Total retail deposit inflows of £1.2bn were lower than the £1.9bn in 2002, with the estimated market share of total household deposit flows also deteriorating to 1.6% from 2.2%. Inflows into Abbey-branded accounts were £0.4bn (2002: £1.0bn), reflecting positive inflows into the personal and business bank account ranges. In relation to savings accounts, outflows from remote access accounts have been partially offset by inflows into branch-based Flexible Saver and Branch Saver. Cash Individual Savings Account sales were £1.3bn (2002: £1.3bn), in line with last year. The remainder of the inflows relate to Abbey National Offshore £0.5bn and cahoot £0.3bn.
Banking
Bank account openings totalled 396,000 (2002: 444,000), with a total stock of accounts nearing 3.8m. Abbey retail openings of 344,000 were broadly flat on 2002, with a higher proportion of youth segment openings following the re-launch of the Abbey account in September. Abbey retail in-credit balances were up 23% to £4.3bn
(2002: £3.5bn). Openings incahoot and other businesses were 42% lower at 52,000 (2002: 90,000) largely due to an increased number of customers opening the cahoot savings account rather than the current account.
Unsecured lending balances, which incorporate credit card (cahoot only), unsecured personal loans and overdrafts, increased by 12% to £2.9bn (2002: £2.6bn) driven in particular by growth in cahoot unsecured personal loans. Gross unsecured personal loan new business of £1.7bn was up 13% on 2002.
Openings of Small and Medium Enterprise accounts exceeded 38,000, up 6% on 2002 levels, with balances in excess of £3bn. Over 50% of customers now use the e-banking service, which was recently voted Best Small Business Website in a poll by “Business Money”. Our estimated share of the Small and Medium Enterprise market is now 4%.
Credit card openings of 251,000 were down 5% on 2002. However, total credit card stock has grown 21% and is now in excess of 1 million.
Investment and Protection
Total life assurance new business premiums were £1.4bn (2002: £2.4bn), reflecting a general decline in demand due to investor nervousness about stock market conditions relating to with-profits funds. The impact on our new business flows has been more marked as a result of our previous dependence on with-profits, and subsequent withdrawal from this market and declaration of a zero bonus for with-profit policyholders in 2003.
In addition, in the second half of the year, both our branch-based advisor and intermediary sales forces were substantially restructured and retrained behind new offerings, with both programmes well advanced. The combination of the salesforce restructuring and the need to bring new products on line has also contributed to the year on year decline.
By product, the main movements include a significant fall in sales of single premium pension products in Scottish Mutual and Scottish Provident (£(0.4)bn), falls in single premium structured Individual Savings Account and investment bond sales in Abbey National Life (£(0.4)bn), and the withdrawal from the with-profits bond market (£(0.2)bn).
Sales of protection products continued to grow, up 12% to £125m (2002: £112m).
General Insurance
General Insurance policy sales of 452,000 were down 11% on 2002, with a fall in household policy sales, only partially offset by increased sales of personal accident and accidental death policies.
The decline in household policy sales in part reflects the high proportion of mortgage lending through the intermediaries resulting in lower cross sales.
2002 compared to 2001
Banking and Savings
Mortgages
Gross mortgage lending of £22.1bn in 2002 (2001: £16.8bn) was up 32% which, combined with capital repayments, contributed to growth in net mortgage lending, of 31% on 2001. Total net mortgage lending of £6.7bn (2001: £5.1bn) represented a 31% full-year net mortgage lending market share.
Mortgage lending to housing associations represented 0.6% and 0.4% of Abbey’s net lending and stock shares.
Retail deposits
Total retail deposit inflows were £1.9bn in 2002 (2001: £4.6bn). Within these, household inflows represented an estimated share of market household inflows of approximately 2.2%. The 2002 second half performance was stronger than the first, with total retail deposit inflow of £1.7bn, and an estimated household market share of 5.1%. This was supported by a strong performance in the fixed-rate bond market,
| Abbey Annual Report and Accounts 2003 | 25 |
Back to Contents
Operating and Financial Review
Operating Review – Personal Financial Services continued
with inflows of £0.6bn in the second half of the year, and market leading internet-only accounts. cahoot suffered a decline in deposits through 2002, reflecting a repricing to move the in-credit account into positive margin.
Banking
The momentum in bank account openings was maintained from 2001 through 2002, with the opening of 354,000 bank accounts through Abbey retail alone (2001: 330,000). With cahoot and other businesses including Cater Allen Private Banking, total account openings were 444,000 (2001: 468,000).
Credit card openings of 264,000 were up 28% in 2002, largely due to a full-year impact of the relationship with MBNA.
Total cards in issue in 2002 are 862,000. Gross unsecured lending of £1.5bn (2001: £1.2bn) increased by 25% driven by strong growth in cahoot.
Small and Medium Enterprise Banking account openings were 89% higher in 2002 than 2001, with 36,000 accounts opened.
Investment and Protection
Investment new business premiums of £2.8bn were down 15% in 2002, largely reflecting reduced sales of with-profits bonds through both Abbey National Life and Scottish Mutual.
In Abbey National Life, despite an estimated 19% fall in the Investment Individual Savings Account market, our sales increased in 2002 by around 67%, boosting market share to approximately 9%. In total, Individual Savings Account and unit trust sales almost doubled year-on-year in 2002, largely offsetting the fall in with-profit sales through direct channels.
Protection new business volumes continued to grow during 2002. In particular, Scottish Provident UK term assurance new business volumes increased by 47%, representing a market share of over 20%.
Funds under management increased by 30% to £26bn (2001: £20bn) following the transfer of £10bn of Scottish Provident funds to Abbey National Asset Managers in April and inflows of new business, offset by negative investment returns and market movements.
General Insurance
General Insurance new policy sales were up 11% to 507,000 in 2002 (2001: 458,000), reflecting strong sales of both building and contents insurance up 21% and other insurance up 27,000. This was partially offset by reduced motor insurance new policy sales down 42%. In total, policies in force increased from 1,852,000 to 1,866,000 in 2002.
Customer information
The following measures are intended to give helpful information on key customer metrics for Abbey. In future, these will be presented semi-annually. The data at present only includes Abbey-branded products but will be extended to include Abbey’s other Personal Financial Services brands during 2004.
As a first step, we have presented some basic customer metrics that, over time, will demonstrate the impact of our new strategy. Specifically, these are: |
| > | to create more active customer relationships; |
| > | to broaden and deepen these relationships; |
| > | and to increase levels of customer satisfaction. |
| | At 31 December 2003 | |
|
| |
| Customer activity | | |
|
| |
| – Total customer numbers | 15.7m | |
|
| |
| – Active customers(1) | 11.2m | |
|
| |
| – Customers with more than one product holding | 5.4m | |
|
| |
| Customer value | | |
|
| |
| – Trading revenues per active customer (2) | £198 | |
|
| |
| Customer satisfaction | | |
|
| |
| – Customer satisfaction (3) | 5.65 | |
|
| |
| | | |
| (1) | The definitions of “active” depends on the nature of the product, as follows: |
| | | |
| | > | mortgages, loans, investment and insurance policies, which are open; |
| | | |
| | > | savings accounts – balance of over £100 or transaction in last 6 months; and |
| | | |
| | > | Abbey accounts and credit cards – balance of more than £50 or transaction in the last 3 months. |
| | | |
| (2) | Abbey branded revenues (net of credit costs) divided by active customers. |
| | | |
| (3) | Utilising Abbey’s monthly customer tracking survey, undertaken by independent consultants. This represents the mean score measured on a 7-point scale where 1 is “completely dissatisfied” and 7 is “completely satisfied”. |
Personal Financial Services trading income
Personal Financial Services trading income by segment by business
| | 31 December | | 31 December | | 31 December | |
| | 2003 | | 2002 | | 2001 | |
| | £m | | £m | | £m | |
|
|
|
|
|
| |
| Abbey retail | 2,009 | | 2,082 | | 2,096 | |
|
|
|
|
|
| |
| cahoot | 57 | | 30 | | (6 | ) |
|
|
|
|
|
| |
| Cater Allen and Offshore | 81 | | 118 | | 113 | |
|
|
|
|
|
| |
| Banking and Savings | 2,147 | | 2,230 | | 2,203 | |
|
|
|
|
|
| |
| Scottish Mutual | 59 | | 129 | | 147 | |
|
|
|
|
|
| |
| Scottish Provident | 114 | | 49 | | 28 | |
|
|
|
|
|
| |
| Abbey National Life | 89 | | 216 | | 215 | |
|
|
|
|
|
| |
| Other | 35 | | 31 | | 27 | |
|
|
|
|
|
| |
| Investment and Protection | 297 | | 425 | | 417 | |
|
|
|
|
|
| |
| General Insurance | 121 | | 146 | | 130 | |
|
|
|
|
|
| |
| Treasury Services | 249 | | 258 | | 309 | |
|
|
|
|
|
| |
| Group Infrastructure | (25 | ) | (69 | ) | 104 | |
|
|
|
|
|
| |
| Total trading income | 2,789 | | 2,990 | | 3,163 | |
|
|
|
|
|
| |
| Adjust for: | | | | | | |
|
|
|
|
|
| |
| – Embedded value charges and rebasing (1) | (363 | ) | (553 | ) | (407 | ) |
|
|
|
|
|
| |
| – Re-organisation expenses – life assurance | (16 | ) | – | | – | |
|
|
|
|
|
| |
| – Depreciation on operating lease assets | – | | 23 | | 97 | |
|
|
|
|
|
| |
| PFS total operating income | 2,410 | | 2,460 | | 2,853 | |
|
|
|
|
|
| |
| (1) | The £363m embedded value charges and rebasing does not include £80m relating to the tax changes impacting on the Scottish Provident acquisition structure, which are reported as provisions for bad and doubtful debts for statutory purposes. |
2003 compared to 2002
Banking and Savings trading income was £83m lower at £2,147m (2002: £2,230m). A fall in net interest income was largely due to high levels of mortgage redemptions being replaced by lower margin new business. This also contributed to a lower overall Standard Variable Rate asset, and more than offset the strong volume growth. Volume-driven growth in cahoot was offset by a reduced income in Cater Allen and Offshore, reflecting the transfer of debt securities to the Portfolio Business Unit in 2002 £(12)m and changes to the internal transfer pricing with Abbey retail £(12)m.
Investment and Protection trading income of £297m was 30% lower than 2002 £425m. The main contributor to this decrease was the impact of experience variances and assumption changes on the life assurance businesses, which have moved from £84m favourable in 2002 to £58m unfavourable in 2003. This is discussed in more detail
| 26 | Abbey Annual Report and Accounts 2003 |
Back to Contents
Operating and Financial Review
Operating Review – Personal Financial Servicescontinued
in the “life assurance profit before tax” section.
In General Insurance, trading income fell to £121m (2002: £146m), reflecting primarily an increase in the risk premiums payable to the principal underwriter, combined with a fall in policies in force.
Treasury Services trading income fell by £9m to £249m (2002: £258m), largely due to the impact of reduced business opportunities resulting from the narrower Personal Financial Services mandate following the Portfolio Business Unit disposal process.
Group Infrastructure trading income of £(25)m (2002: £(69)m) improved by £44m, with net interest income benefiting from earnings on surplus capital arising from the continued Portfolio Business Unit disposal process and the non-recurrences changes relating to intercompany funding arrangements in 2002. Trading non-interest income was negatively impacted by the non-recurrence of some disposal gains in 2002.
2002 compared to 2001
The Personal Financial Services grouped segments trading income was £173m lower at £2,990m in 2002 (2001: £3,163m).
The movement was principally due to a £173m decrease in Group Infrastructure trading income to £(69)m (2001: £104m) reflecting the full year impact of the Scottish Provident acquisition, changes to intercompany funding arrangements, and the impact of increased gearing levels borne centrally.
Personal Financial Services net interest income and spread
Personal Financial Services net interest income by segment
| | 31 December | | 31 December | | 31 December | |
| | 2003 | | 2002 | | 2001 | |
| | £m | | £m | | £m | |
|
|
|
|
|
| |
| Banking and Savings | 1,720 | | 1,799 | | 1,680 | |
|
|
|
|
|
| |
| Investment and Protection | 83 | | 90 | | 54 | |
|
|
|
|
|
| |
| General Insurance | (5 | ) | (3 | ) | (4 | ) |
|
|
|
|
|
| |
| Treasury Services | 112 | | 132 | | 132 | |
|
|
|
|
|
| |
| Group Infrastructure | (115 | ) | (175 | ) | (43 | ) |
|
|
|
|
|
| |
| Net interest income | 1,795 | | 1,843 | | 1,819 | |
|
|
|
|
|
| |
2003 compared to 2002
Excluding Abbey retail, (which is analysed below) net interest income improved marginally (£14m). This was driven by a reduction in Abbey National Offshore, following the sale of debt securities to the Portfolio Business Unit, and lower earnings in Treasury Services being more than offset by higher earnings in cahoot and increased earnings on surplus capital in Group Infrastructure following the reduction in Portfolio Business Unit assets.
2002 compared to 2001
Total net interest income of £1,843m increased 1% (2001: £1,819m) primarily due to asset growth. This was partially offset by a spread compression. In addition, a low interest rate environment and competitive marketplace resulted in higher levels of redemptions.
Personal Financial Services Banking spread
| | 31 December | | 31 December | |
| | 2003 | | 2002 | |
|
|
|
| |
| Net interest income (£m) | 1,720 | | 1,799 | |
|
|
|
| |
| PFS Banking spread | 1.81% | | 2.03% | |
|
|
|
| |
| PFS Banking margin | 2.00% | | 2.27% | |
|
|
|
| |
The Personal Financial Services Banking spread has been included to show the spread of all the Personal Financial Services lending and savings operations. The largest component part is Abbey retail, but it also includes Abbey branded unsecured loans, Abbey Business, cahoot, Cater Allen Private Bank and Abbey National Offshore.
The Personal Financial Services Banking spread for 2003 was 1.81%, 26 basis points higher than the Abbey retail spread, reflectingthe increased proportion of higher margin unsecured lending and a higher overall proportion of deposit based funding rather than wholesale. The Abbey retail spread is effectively diluted by funding provided by subsidiaries such as Cater Allen and cahoot for which a base rate linked transfer price is paid rather than a retail funding cost.
The Personal Financial Services Banking spread fell by 22 basis points during 2003, impacted by the trends in the Abbey retail spread outlined below, offset by growth in cahoot and Abbey Business.
Personal Financial Services banking spread and margin data for 2001 is not available.
Abbey retail spread
| | 31 December | | 31 December | | 31 December | |
| | 2003 | | 2002 | | 2001 | |
|
|
|
|
|
| |
| Abbey retail net interest | | | | | | |
| income (£m) | 1,599 | | 1,661 | | 1,579 | |
|
|
|
|
|
| |
| Average spread(1) | 1.55% | | 1.79% | | 1.86% | |
|
|
|
|
|
| |
| Average asset spread(2) | 0.75% | | 0.93% | | 0.81% | |
|
|
|
|
|
| |
| Average liability spread(2) | 0.80% | | 0.8%6 | | 1.05% | |
|
|
|
|
|
| |
| Average margin(3) | 1.74% | | 2.03% | | 2.11% | |
|
|
|
|
|
| |
| |
| Note: Abbey retail spread and margin calculations exclude the impact unsecured personal loans, Abbey Business and Housing Associations. |
| | |
| (1) | Average spread is defined as interest received (mortgage and overdraft interest less suspended interest) over average interest earning assets, less interest payable (savings and in-credit bank accounts) over interest bearing liabilities (including an element of wholesale funding). |
| | |
| (2) | Asset and liability spreads are calculated using the third party interest payments (such as mortgage interest receivable or savings interest payable) net of relevant hedging. |
| | |
| (3) | Average margin is defined as net interest income (less suspended interest but including a recapitalisation adjustment that equates to earnings on regulatory capital) divided by the average interest earning assets. |
2003 compared to 2002
The Abbey retail spread of 155 basis points is 24 basis points lower than last year, and down 6 basis points on the first half of 2003.The full year fall was driven by record gross lending over the last 18 months, combined with increased redemption activity resulting in a change in the mix of the mortgage book. In addition, asset growth is being funded at higher marginal rates, in large part from wholesale sources. A narrowing of the margin of the standard variable rate asset through 2002 and 2003 has also contributed to the lower retail spread, as has the low, relatively stable base rate in terms of retail liability spread compression.
Abbey retail net interest income of £1,599m was down 4%(2002: £1,661m), primarily reflecting a fall in the average mortgage book margin, with high levels of redemptions and incentive maturities being replaced by lower margin new lending. The absolute fall in the level of standard variable rate asset, combined with a narrowing standard variable rate margin to realign pricing to the peer group, has also had an adverse impact. Redemption fees of £193m (2002: £198m), reflect lower average penalties per customer.
In 2004, a further drop in net interest income is expected. Whilst product redemption charges through the second half of 2003 were more robust than expected, a further more material decline is forecast for 2004. This reflects a higher proportion of redemptions being penalty free, as well as a further reduction in average penalties per customer given rising interest rates.
In addition, an increased proportion of mortgage incentive period maturities will revert to base-rate linked margins as opposed to a higher standard variable rate – contributing to a more material fall in the absolute level of standard variable rate asset. In contrast to our main competitors, no margin widening has been put in place (to offset the underlying mix deterioration) following the last two base rate changes. This has largely allowed realignment in our mortgage and savings pricing compared to our peer group.
| Abbey Annual Report and Accounts 2003 | 27 |
Back to Contents
Operating and Financial Review
Operating Review – Personal Financial Services continued
2002 compared to 2001
The full-year Abbey retail spread was 179 basis points in 2002, down from 186 basis points for 2001. The 2002 second half spread was 175 basis points.
| | 31 December | | 31 December | | 31 December | |
| | 2003 | | 2002 | | 2001 | |
| Mortgage asset mix | £bn | | £bn | | £bn | |
|
|
|
|
|
| |
| Incentive period | | | | | | |
|
|
|
|
|
| |
| Standard variable rate linked | 19 | | 19 | | 27 | |
|
|
|
|
|
| |
| Base-rate linked | 29 | | 19 | | 2 | |
|
|
|
|
|
| |
| Fixed | 13 | | 14 | | 15 | |
|
|
|
|
|
| |
| Tied in | 1 | | 2 | | 4 | |
|
|
|
|
|
| |
| | 62 | | 54 | | 48 | |
|
|
|
|
|
| |
| Free-to-go | | | | | | |
|
|
|
|
|
| |
| SVR linked | 15 | | 17 | | 20 | |
|
|
|
|
|
| |
| Base-rate linked | 2 | | 1 | | – | |
|
|
|
|
|
| |
| Flexible | 5 | | 3 | | 1 | |
|
|
|
|
|
| |
| Other | 1 | | 1 | | – | |
|
|
|
|
|
| |
| | 23 | | 22 | | 21 | |
|
|
|
|
|
| |
| Total mortgage asset | 85 | | 76 | | 69 | |
|
|
|
|
|
| |
| | |
| (1) | Quoted mortgage asset excludes £3.1bn (2002: £2.7bn; 2001: £2.2bn) of Housing Association lending, consistent with the methodology used to calculate the Abbey retail spread. |
2003 compared to 2002
A revised breakdown of the mortgage asset has been provided to allow a better understanding of the asset mix, lending trends and contractual arrangements post incentive period.
At year end, free-to-go standard variable rate was £15bn, 18% of the total asset. The absolute balance was reduced through 2003, but in particular from September 2003, as an increased proportion of incentive-based customer loans started to mature onto base rate linked reversion products. This latter segment is broadly restricted to lending undertaken between April 2001 and August 2002.
The spread on the standard variable rate asset to base rate at 31 December 2003 was 200 basis points, but on average was seven basis points lower than in 2002.
£29bn of the incentive period mortgage asset is now tied in to products where rates are linked directly to base rates, up from £19bn at the previous year end. Of the base rate linked asset still in the incentive period, approximately 40% reverts to standard variable rate after the introductory period, a percentage that will increase in future periods given the structuring of new product lending since the second half of 2002.
2002 compared to 2001
The stock of free-to-go standard variable rate asset declined marginally through 2002, and as at the end of 2002, represented 22% of the total. The tied standard variable rate asset halved through 2002 to around £2bn.
The majority of the mortgage book in 2002 was an incentive or fixed-rate period, after which it reverts to standard variable rate.
Mortgage new business margins tightened through 2002, and in the second half there was a shift towards fixed rate lending.
| | 31 December | | 31 December | | 31 December | |
| | 2003 | | 2002 | | 2001 | |
| Liability mix | £bn | | £bn | | £bn | |
|
|
|
|
|
| |
| Banking | 4.3 | | 3.5 | | 2.7 | |
|
|
|
|
|
| |
| Remote | 12.2 | | 13.2 | | 13.8 | |
|
|
|
|
|
| |
| Fixed term and tax free savings | 14.5 | | 14.7 | | 13.7 | |
|
|
|
|
|
| |
| Branch-based deposits | 15.3 | | 15.4 | | 15.8 | |
|
|
|
|
|
| |
| Total Abbey branded household liability(1) | 46.3 | | 46.8 | | 46.0 | |
|
|
|
|
|
| |
| Other brands(1) | 14.2 | | 12.5 | | 11.4 | |
|
|
|
|
|
| |
| Total PFS* liability | 60.5 | | 59.3 | | 57.4 | |
|
|
|
|
|
| |
| | |
| (1) | The split is different to that in the “Personal Financial Services business flows” section due to the treatment of Abbey Business. For consistency purposes (with the basis of calculating the Abbey retail spread), Abbey Business is excluded from Abbey-branded. |
| | |
| *Personal Financial Services. |
2003 compared to 2002
Overall, branch-based deposits have remained broadly stable at £15.3bn. At 31 December 2003, the average spread against base rates was 247 basis points, compared with 258 basis points at 31 December 2002. This is a result of margin compression as rates have fallen, combined with changes in mix reflecting modest outflows from older branch-based accounts, offset by positive flows into new lower but still positive margin branch-based offerings, such as Flexible Saver and Branch Saver. Current account growth has also contributed positively to the stability of branch-based balances.
Remote savings balances, including internet and postal, have reduced to £12.2bn (2002: £13.2bn), reflecting modest falls in Postal and Direct Saver. Fixed term and tax-free savings balances fell modestly, with Individual Savings Account inflows partially offsetting bond and TESSA maturities.
Growth in balances outside Abbey retail relate primarily to cahoot and Abbey National Offshore.
Wholesale funding, including securitisation, now represents around 33% of the Personal Financial Services’ funding requirement, compared with around 27% at the end of 2002. The increase in wholesale funding to support growth in mortgage lending has contributed to the narrowing of the liability spread.
2002 compared to 2001
The percentage of branch-based deposits was held broadly constant through 2002, following sharper reductions in previous years.
The spread on branch-based accounts compressed during 2002, reflecting more competitive product offerings and the impact of lower base rates. Growth in current account balances during 2002 helped to support overall spreads.
| 28 | Abbey Annual Report and Accounts 2003 |
Back to Contents
Operating and Financial Review
Operating Review – Personal Financial Servicescontinued
| Trading non-interest income |
| | 31 December | | 31 December | | 31 December | |
| | 2003 | | 2002 | | 2001 | |
| | £m | | £m | | £m | |
|
|
|
|
|
| |
| Mortgages: | | | | | | |
|
|
|
|
|
| |
| Administration, survey and legal fees | 73 | | 65 | | 64 | |
|
|
|
|
|
| |
| Application and booking fees | 43 | | 13 | | 17 | |
|
|
|
|
|
| |
| Fee income on high loan-to-value loans | 55 | | 87 | | 102 | |
|
|
|
|
|
| |
| Introducer fees payable | (20 | ) | (17 | ) | (43 | ) |
|
|
|
|
|
| |
| Other | 12 | | 3 | | 14 | |
|
|
|
|
|
| |
| | 163 | | 151 | | 154 | |
|
|
|
|
|
| |
| Savings | 47 | | 67 | | 70 | |
|
|
|
|
|
| |
| Banking: | | | | | | |
|
|
|
|
|
| |
| Fees and commissions receivable | 246 | | 235 | | 271 | |
|
|
|
|
|
| |
| Fees and commissions payable | (38 | ) | (31 | ) | (23 | ) |
|
|
|
|
|
| |
| Other | 9 | | 9 | | 51 | |
|
|
|
|
|
| |
| | 217 | | 213 | | 299 | |
|
|
|
|
|
| |
| Banking and Savings | 427 | | 431 | | 523 | |
|
|
|
|
|
| |
| Investment and Protection | 214 | | 335 | | 363 | |
|
|
|
|
|
| |
| Building and contents | 94 | | 118 | | 113 | |
|
|
|
|
|
| |
| Motor | 6 | | 6 | | – | |
|
|
|
|
|
| |
| Creditor | 24 | | 22 | | 18 | |
|
|
|
|
|
| |
| Other | 2 | | 3 | | 3 | |
|
|
|
|
|
| |
| General Insurance | 126 | | 149 | | 134 | |
|
|
|
|
|
| |
| Treasury Services | 137 | | 126 | | 177 | |
|
|
|
|
|
| |
| Group Infrastructure | 90 | | 106 | | 147 | |
|
|
|
|
|
| |
| PFS trading non-interest income | 994 | | 1,147 | | 1,344 | |
|
|
|
|
|
| |
2003 compared to 2002
Total mortgage non-interest income has increased by £12m to £163m (2002: £151m). Record new business levels have contributed positively, as has the mix of new business, and revised charges on specific products. Remortgage activity has also increased survey fees. These improvements have been offset by reduced fee income on high loan to value lending, due primarily to lower levels of new business with loan-to-value greater than 90%. Introducer fees payable were also up, reflecting strong lending volumes.
Savings non-interest income of £47m (2002: £67m) was down 30%, resulting from a fall in commissions earned on lower sales of life assurance policies.
Banking related trading non-interest income was £4m higher at £217m. Fees and commissions receivable were higher, attributable to improved credit card income, increased volumes of cahoot flexible loans and higher fees resulting from debit card transactions by Abbey customers.
Investment and Protection trading non-interest income is analysed in the “Life assurance income” section.
General Insurance income has fallen to £126m (2002: £149m). Buildings and contents income has been impacted by an increase in the costs payable to the principal insurer of £18m not passed on to customers. Reduced new business and lower renewals have also contributed to the overall reduction in income.
Treasury Services non-interest income increased 9% to £137m (2002: £126m). Dealing profits were £131m (2002: £103m), reflecting an improvement in global trading conditions.
In Group Infrastructure, non-interest income of £90m (2002: £106m) fell by £16m, reflecting the non-recurrence of one-off gains in 2002.
2002 compared to 2001
Net mortgage related fee income of £151m was down marginally (2001: £154m). Within this decline is a £37m one-off benefit relating to the amortisation of introducer fees over six years (the average life of a mortgage), previously charged in the year incurred. In addition, a £24m benefit associated with mortgage indemnity guarantee fees, resulting from amortisation over six years compared to seven years previously assumed. This has been offset by increased mortgage new business volumes, and a one-off adjustment in 2001 of £32m reflecting treatment of mortgage indemnity guarantee moving from an actuarial to straight-line amortisation basis.
Savings-related fee income was marginally down at £67m (2001: £70m). This was due to a fall in commissions receivable on sales of Abbey National Life policies, arising from lower sales of with-profits bonds.
The trading income of the life businesses is described in the “Life assurance income” section below.
Banking fee income of £235m was down (2001: £271m). This is primarily as a result of profit on sale of the credit card asset to MBNA, as well as reduced interchange fees received from Link, offset by a net increase in bank account income following the introduction of revised tariffs and increased volumes.
The fall in fee income relating to other banking was largely due to the disposal of First National Vehicle Holdings Limited in April 2002.
The growth in General Insurance commissions, up 11% to £149m (2001: £134m), reflected improvements across most product lines, in particular strong growth in the ‘Peace of Mind’ product.
Life assurance income
| | | | | | 31 December 2003 | |
|
|
|
|
|
|
|
| |
| | AN | | Scottish | | Scottish | | | |
| | Life | | Mutual | | Provident | | Total | |
| | £m | | £m | | £m | | £m | |
|
|
|
|
|
|
|
| |
| New business contribution to embedded value | 21 | | 6 | | 18 | | 45 | |
|
|
|
|
|
|
|
| |
| Contribution from existing business to embedded value: | | | | | | | | |
|
|
|
|
|
|
|
| |
| – expected return | 43 | | 128 | | 44 | | 215 | |
|
|
|
|
|
|
|
| |
| – experience variances and changes in assumptions | (14) | | (69 | ) | 25 | | (58 | ) |
|
|
|
|
|
|
|
| |
| Increase in value of long-term assurance businesses | 50 | | 65 | | 87 | | 202 | |
|
|
|
|
|
|
|
| |
| Non-embedded value earnings: | | | | | | | | |
|
|
|
|
|
|
|
| |
| ANUTM and ANPIM | | | | | | | | |
| contribution(1) | 43 | | – | | – | | 43 | |
|
|
|
|
|
|
|
| |
| Other income and | | | | | | | | |
| operating expenses | (14 | ) | (15 | ) | 26 | | (3 | ) |
|
|
|
|
|
|
|
| |
| Trading profit before tax (3) | 79 | | 50 | | 113 | | 242 | |
|
|
|
|
|
|
|
| |
| Less: embedded value charges and rebasing | 26 | | (207 | ) | (262 | ) | (443 | ) |
|
|
|
|
|
|
|
| |
| Less: re-organisation expenses | – | | (8 | ) | (8 | ) | (16 | ) |
|
|
|
|
|
|
|
| |
| Profit (loss) before tax | 105 | | (165 | ) | (157 | ) | (217 | ) |
|
|
|
|
|
|
|
| |
| New business margin (%) (2) | 46% | | 7% | | 22% | | 21% | |
|
|
|
|
|
|
|
| |
| Abbey Annual Report and Accounts 2003 | 29 |
Back to Contents
Operating and Financial Review
Operating Review – Personal Financial Services continued
| | | | | | 31 December 2002 | |
|
|
|
|
|
|
|
| |
| | AN | | Scottish | | Scottish | | | |
| | Life | | Mutual | | Provident | | Total | |
| | £m | | £m | | £m | | £m | |
|
|
|
|
|
|
|
| |
| New business contribution | | | | | | | | |
| to embedded value | 31 | | 7 | | 15 | | 53 | |
|
|
|
|
|
|
|
| |
| Contribution from existing | | | | | | | | |
| business to embedded value: | | | | | | | | |
|
|
|
|
|
|
|
| |
| – expected return | 50 | | 98 | | 23 | | 171 | |
|
|
|
|
|
|
|
| |
| – experience variances and | | | | | | | | |
| changes in assumptions | 50 | | 47 | | (13 | ) | 84 | |
|
|
|
|
|
|
|
| |
| Increase in value of long-term assurance businesses | 131 | | 152 | | 25 | | 308 | |
|
|
|
|
|
|
|
| |
| Non-embedded value earnings: | | | | | | | | |
|
|
|
|
|
|
|
| |
| ANUTM and ANPIM | | | | | | | | |
| contribution (1) | 63 | | – | | – | | 63 | |
|
|
|
|
|
|
|
| |
| Other income and | | | | | | | | |
| operating expenses | 11 | | (26 | ) | 23 | | 8 | |
|
|
|
|
|
|
|
| |
| Trading profit before tax (3) | 205 | | 126 | | 48 | | 379 | |
|
|
|
|
|
|
|
| |
| Less: embedded value charges | | | | | | | | |
| and rebasing | (32 | ) | (481 | ) | (40 | ) | (553 | ) |
|
|
|
|
|
|
|
| |
| Profit (loss) before tax | 173 | | (355 | ) | 8 | | (174 | ) |
|
|
|
|
|
|
|
| |
| New business margin (%) (2) | 41% | | 5% | | 22% | | 19% | |
|
|
|
|
|
|
|
| |
| | | | | | 31 December 2001 | |
|
|
|
|
|
|
|
| |
| | AN | | Scottish | | Scottish | | | |
| | Life | | Mutual | | Provident | | Total | |
| | £m | | £m | | £m | | £m | |
|
|
|
|
|
|
|
| |
| New business contribution | | | | | | | | |
| to embedded value | 52 | | 47 | | 9 | | 108 | |
|
|
|
|
|
|
|
| |
| Contribution from existing | | | | | | | | |
| business to embedded value: | | | | | | | | |
|
|
|
|
|
|
|
| |
| – expected return | 52 | | 94 | | 12 | | 158 | |
|
|
|
|
|
|
|
| |
| – experience variances | | | | | | | | |
| and assumptions | 36 | | 18 | | 13 | | 67 | |
|
|
|
|
|
|
|
| |
| – integration | – | | – | | (13 | ) | (13 | ) |
|
|
|
|
|
|
|
| |
| Increase in value of long-term assurance businesses | 140 | | 159 | | 21 | | 320 | |
|
|
|
|
|
|
|
| |
| Non-embedded value earnings: | | | | | | | | |
|
|
|
|
|
|
|
| |
| ANUTM and ANPIM | | | | | | | | |
| contribution(1) | 53 | | – | | – | | 53 | |
|
|
|
|
|
|
|
| |
| Other income and | | | | | | | | |
| operating expenses | 9 | | (16 | ) | 7 | | – | |
|
|
|
|
|
|
|
| |
| Trading profit before tax (3) | 202 | | 143 | | 28 | | 373 | |
|
|
|
|
|
|
|
| |
| Less: embedded value charges and rebasing | (34 | ) | (319 | ) | (54 | ) | (407 | ) |
|
|
|
|
|
|
|
| |
| Profit (loss) before tax | 168 | | (176 | ) | (26 | ) | (34 | ) |
|
|
|
|
|
|
|
| |
| New business margin (%) (2) | 40% | | 23% | | 20% | | 29% | |
|
|
|
|
|
|
|
| |
| | |
| (1) | ANUTM represents Abbey National Unit Trust Managers, while ANPIM represents Abbey National PEP and ISA Managers. |
| | |
| (2) | New business margin is calculated as new business contribution to Embedded Value, divided by related annualised equivalent premiums for Life contracts. |
| | |
| (3) | The difference between trading profit before tax for the life assurance business and the Investment and Protection segment of £(3m) (2002: £(7m) and 2001 (£15m) ) consists of the profit before tax for the James Hay, Inscape and City Deal Businesses. |
Change in accounting estimates
For 2003, a change has been made to the method for setting the assumptions used in determining the value of future profits from a passive basis, whereby assumptions are based on management’s assessment of long-term investment trends and intentions for asset mix, to an active basis, whereby assumptions are based on actual period-end market conditions and asset mix. The effects of this change on the current year have been included in embedded value rebasing and other adjustments. No adjustment has been made to prior year comparatives.
2003 compared to 2002
New business contribution to embedded value
The decrease in Abbey National Life new business contribution is due to reduced sales of investment products, particularly with-profits bonds together with reduced profitability from protection business resulting from increased reassurance charges. Reduced sales of investment products also lead to a reduction in new business contribution from Scottish Mutual though this is largely offset by reductions in low margin pension business. The increase from Scottish Provident is due to the increase in protection volumes partly offset by reduced profitability in the first half of the year due to increased reassurance rates.
Expected return
Expected return represents the unwind of the discount on the discounted value of future profits, together with the return on shareholders’ funds held in the long-term business fund. Overall, the expected return of £215m (2002: £171m) was up £44m.
In terms of the unwind of the discount, the embedded value rebasing, including the move to an unsmoothed methodology in 2002, involved the restating of the year end balances of the discounted value of future profits for prior years. The impact of lower balances on the unwind of the discount in 2003 was around £70m negative, compared to £30m negative in 2002. This negative impact in 2003 was broadly offset by new business written in 2002 increasing the opening discounted value of future profits.
The balance of the year-on-year increase largely relates to increased earnings on capital injections made into the long-term business fund, totalling £825m made in Scottish Mutual in the latter half of 2002 and, in early 2003, £220m was injected into Scottish Provident.
In 2004, the underlying trends in the expected return will be adversely impacted by a lower risk discount rate, together with the impact of embedded value charges in 2003.
Abbey National Unit Trust Managers and Abbey National PEP and ISA Managers contribution
The reduction in Abbey National Unit Trust Managers’ and Abbey National PEP and ISA Managers’ contributions is due to lower sales volumes with a lower margin sales mix.
Experience variances and changes in assumptions
Experience variances and changes in assumptions capture the effect both in current year, and on the discounted value of future profits, of the difference between actual experience and the assumptions built into the models for calculating the new business contribution and the expected return. However, investment variances and other one-off items are excluded. Taxation adjustments affect profit before tax as profit is calculated on a post tax rate and then grossed up at the rate applicable to the company and type of business in question.
| | |
| 30 | Abbey Annual Report and Accounts 2003 |
Back to Contents
Operating and Financial Review
Operating Review – Personal Financial Servicescontinued
Experience variances and assumption changes of £(58)m (2002: £84m) have deteriorated as follows:
| | | | | | 31 December 2003 | | | | | | 31 December 2002 | |
|
|
|
|
|
|
|
|
|
|
|
|
|
|
|
| |
| | AN | | Scottish | | Scottish | | | | AN | | Scottish | | Scottish | | | |
| | Life | | Mutual | | Provident | | Total | | Life | | Mutual | | Provident | | Total | |
| | £m | | £m | | £m | | £m | | £m | | £m | | £m | | £m | |
|
|
|
|
|
|
|
|
|
|
|
|
|
|
|
| |
| Mortality and morbidity experience | 8 | | (21 | ) | 23 | | 10 | | 41 | | – | | 1 | | 42 | |
|
|
|
|
|
|
|
|
|
|
|
|
|
|
|
| |
| Lapse experience | (8 | ) | (23 | ) | (16 | ) | (47 | ) | (5 | ) | (7 | ) | (2 | ) | (14 | ) |
|
|
|
|
|
|
|
|
|
|
|
|
|
|
|
| |
| Expenses (over)/under run | (1 | ) | (16 | ) | 21 | | 4 | | 2 | | 3 | | (11 | ) | (6 | ) |
|
|
|
|
|
|
|
|
|
|
|
|
|
|
|
| |
| Taxation adjustment | (10 | ) | (16 | ) | 7 | | (19 | ) | 1 | | 66 | | 1 | | 68 | |
|
|
|
|
|
|
|
|
|
|
|
|
|
|
|
| |
| Changes to reserving and modelling methodology | 3 | | 6 | | (11 | ) | (2 | ) | 4 | | – | | 14 | | 18 | |
|
|
|
|
|
|
|
|
|
|
|
|
|
|
|
| |
| Other | (6 | ) | 1 | | 1 | | (4 | ) | 7 | | (15 | ) | (16 | ) | (24 | ) |
|
|
|
|
|
|
|
|
|
|
|
|
|
|
|
| |
| Total experience variances | (14 | ) | (69 | ) | 25 | | (58 | ) | 50 | | 47 | | (13 | ) | 84 | |
|
|
|
|
|
|
|
|
|
|
|
|
|
|
|
| |
Mortality and morbidity experience and assumption changes of £10m were lower than the £42m benefit in 2002 as a result of adverse experience in the Scottish Mutual “Pegasus” products range where recent analysis has shown morbidity rates higher than assumed rates. However, this has been partially offset by an improvement in mortality experience for both Scottish Provident and Abbey National Life, whereby future assumptions have been changed accordingly.2002 included a more significant change in mortality assumptions in Abbey National Life.
Lapse experience and assumption changes of £(47)m were worse than the £(14)m in 2002 due to a general increase in lapse rates across all Life companies.
Expense (over)/under run is a measure of efficiency of cost management within the funds and is impacted by sales volumes, sales mix and actual versus assumed costs. Overall the expense variance across all funds improved from a £(6)m overrun in 2002 to a £4m underrun in 2003. This included a £21m underrun in Scottish Provident principally in relation to growth in Scottish Provident new protection business offset by a £(16)m overrun in Scottish Mutual reflecting the significant reduction in sales.
Taxation experience and assumption change principally relate to the impact of changes to the policy holder tax rate from 22% to 20% which, in effect, increased the cost to the shareholder, countered by regular tax credits and the release of prior year provisions. The 2002 results included a one-off benefit in Scottish Mutual in relation to tax settlements from prior years.
Changes to reserving and modelling methodology and other relates to the impact on returns following refinements to the reserving methodology, modelling changes and the movement in provisions for any unmodelled business.
Embedded value charges and rebasing
Embedded value charges and rebasing remain high at £(443)m (2002: £(553)m). A split of this charge by type and business is contained in the “Other material items” section.
2002 compared to 2001
New business contribution to embedded value fell for Abbey National Life and Scottish Mutual mainly due to the decrease in sales of with-profit bonds, reflected in the decline of overall margins.
The expected return benefited from a full-year contribution from Scottish Provident.
In Abbey National Life the experience variances in 2002 included mortality and critical illness benefits and expense underruns. In Scottish Mutual a one-off benefit from tax settlements was offset by pension lapse losses in the UK and expense overruns in the international businesses. In Scottish Provident the principal item relates to expense overruns during the integration phase.
The main component of the changes in assumptions and other items represents improvements in Abbey National Life mortality experience.
In Scottish Provident integration expenses of £16m were incurred in 2002 in order to achieve annualised savings which reached 86% of the targeted £55m by end 2003 (after allowing for the impact of the increase in new business volumes).
The contribution from Abbey National Unit Trust Managers and Abbey National PEP and ISA Managers has increased in 2002 largely due to the increase in single Individual Savings Account and unit trust volumes, which almost doubled in 2002.
Other income and operating expenses represent net earnings on capital offset by the Group’s internal charge for capital (that impacts non-interest income). Where capital injections are made to the shareholder funds, the earnings on these are recorded as interest income, whereas injections into the long term funds impact embedded value (non-interest income).
The new business margin percentage is influenced by the relative proportions of life, pension and protections products, as well as being impacted by the split between single and regular premium contracts. The main reason for the year-on-year decline in 2002/2001 is due to reduced sales of “with-profits” products. In Scottish Mutual the margin narrowing reflects market pressures.
| Abbey Annual Report and Accounts 2003 | 31 |
Back to Contents
Operating and Financial Review
Operating Review – Personal Financial Services continued
| Life assurance new business premiums |
| | | | | | 31 December 2003 | |
|
|
|
|
|
|
|
| |
| | AN | | Scottish | | Scottish | | | |
| | Life | | Mutual | | Provident | | Total | |
| | £m | | £m | | £m | | £m | |
|
|
|
|
|
|
|
| |
| Single | | | | | | | | |
|
|
|
|
|
|
|
| |
| Pension | 30 | | 280 | | 113 | | 423 | |
|
|
|
|
|
|
|
| |
| Life and investments: | | | | | | | | |
|
|
|
|
|
|
|
| |
| – ISA and unit trusts | 714 | | 3 | | – | | 717 | |
|
|
|
|
|
|
|
| |
| – Life and other bonds | 20 | | 170 | | – | | 190 | |
|
|
|
|
|
|
|
| |
| – With-profits(1) | – | | 2 | | – | | 2 | |
|
|
|
|
|
|
|
| |
| | 764 | | 455 | | 113 | | 1,332 | |
|
|
|
|
|
|
|
| |
| Annual | | | | | | | | |
|
|
|
|
|
|
|
| |
| Pension | 15 | | 24 | | 2 | | 41 | |
|
|
|
|
|
|
|
| |
| Life and investments: | | | | | | | | |
|
|
|
|
|
|
|
| |
| – ISA and unit trusts | 9 | | – | | – | | 9 | |
|
|
|
|
|
|
|
| |
| – Life and other bonds | 1 | | – | | – | | 1 | |
|
|
|
|
|
|
|
| |
| – Term assurance and protection | 28 | | 15 | | 82 | | 125 | |
|
|
|
|
|
|
|
| |
| | 53 | | 39 | | 84 | | 176 | |
|
|
|
|
|
|
|
| |
| Total new business premiums | 817 | | 494 | | 197 | | 1,508 | |
|
|
|
|
|
|
|
| |
| Annualised equivalent(2) | 129 | | 85 | | 95 | | 309 | |
|
|
|
|
|
|
|
| |
| New business margin(3) | 46% | | 7% | | 22% | | 21% | |
|
|
|
|
|
|
|
| |
| (1) | Excludes sales of Prudential Bonds where only commissions are earned, which totalled £54m (2002: £11m). |
| | |
| (2) | Calculated as 10% of single-premium new business premiums, plus annual new business premiums. |
| | |
| (3) | New business margin is calculated as new business contribution to embedded value, divided by related annualised equivalent premiums for life contracts. |
| | | | | | | |
| | | | | | 31 December 2002 | |
|
|
|
|
|
|
|
| |
| | AN | | Scottish | | Scottish | | | |
| | Life | | Mutual | | Provident | | Total | |
| | £m | | £m | | £m | | £m | |
|
|
|
|
|
|
|
| |
| Single | | | | | | | | |
|
|
|
|
|
|
|
| |
| Pension | 29 | | 623 | | 150 | | 802 | |
|
|
|
|
|
|
|
| |
| Life and investments: | | | | | | | | |
|
|
|
|
|
|
|
| |
| – ISA and unit trusts | 1,031 | | 50 | | – | | 1,081 | |
|
|
|
|
|
|
|
| |
| – Life and other bonds | 111 | | 124 | | – | | 235 | |
|
|
|
|
|
|
|
| |
| – With-profits(1) | 101 | | 96 | | – | | 197 | |
|
|
|
|
|
|
|
| |
| | 1,272 | | 893 | | 150 | | 2,315 | |
|
|
|
|
|
|
|
| |
| Annual | | | | | | | | |
|
|
|
|
|
|
|
| |
| Pension | 18 | | 42 | | 4 | | 64 | |
|
|
|
|
|
|
|
| |
| Life and investments: | | | | | | | | |
|
|
|
|
|
|
|
| |
| – ISA and unit trusts | 19 | | – | | – | | 19 | |
|
|
|
|
|
|
|
| |
| – Life and other bonds | 5 | | 2 | | – | | 7 | |
|
|
|
|
|
|
|
| |
| – Term assurance and | | | | | | | | |
| protection | 27 | | 15 | | 70 | | 112 | |
|
|
|
|
|
|
|
| |
| | 69 | | 59 | | 74 | | 202 | |
|
|
|
|
|
|
|
| |
| Total new business premiums | 1,341 | | 952 | | 224 | | 2,517 | |
|
|
|
|
|
|
|
| |
| Annualised equivalent(2) | 196 | | 149 | | 89 | | 434 | |
|
|
|
|
|
|
|
| |
| New business margin(3) | 41% | | 5% | | 22% | | 19% | |
|
|
|
|
|
|
|
| |
| | | | | | | | | |
| (1) | Excludes sales of Prudential Bonds where only commissions are earned, which totalled £11m. |
| | |
| (2) | Calculated as 10% of single-premium new business premiums, plus annual new business premiums. |
| | |
| (3) | New business margin is calculated as new business contribution to embedded value, divided by related annualised equivalent premiums for life contracts. |
| | | | | | 31 December 2001 | |
|
|
|
|
|
|
|
| |
| | AN | | Scottish | | Scottish | | | |
| | Life | | Mutual | | Provident | | Total | |
| | £m | | £m | | £m | | £m | |
|
|
|
|
|
|
|
| |
| Single | | | | | | | | |
|
|
|
|
|
|
|
| |
| Pension | 22 | | 717 | | 34 | | 773 | |
|
|
|
|
|
|
|
| |
| Life and investments: | | | | | | | | |
|
|
|
|
|
|
|
| |
| – ISA and unit trusts | 542 | | 8 | | – | | 550 | |
|
|
|
|
|
|
|
| |
| – Life and other bonds | 104 | | 173 | | 153 | | 430 | |
|
|
|
|
|
|
|
| |
| – With-profits(1) | 705 | | 1,505 | | – | | 2,210 | |
|
|
|
|
|
|
|
| |
| | 1,373 | | 2,403 | | 187 | | 3,963 | |
|
|
|
|
|
|
|
| |
| Annual | | | | | | | | |
|
|
|
|
|
|
|
| |
| Pension | 18 | | 47 | | 8 | | 73 | |
|
|
|
|
|
|
|
| |
| Life and investments: | | | | | | | | |
|
|
|
|
|
|
|
| |
| – ISA and unit trusts | 41 | | – | | – | | 41 | |
|
|
|
|
|
|
|
| |
| – Life and other bonds | – | | 4 | | 20 | | 24 | |
|
|
|
|
|
|
|
| |
| – Term assurance and protection | 20 | | 13 | | 48 | | 81 | |
|
|
|
|
|
|
|
| |
| | 79 | | 64 | | 76 | | 219 | |
|
|
|
|
|
|
|
| |
| Total new business premiums | 1,452 | | 2,467 | | 263 | | 4,182 | |
|
|
|
|
|
|
|
| |
| Annualised equivalent(2) | 216 | | 304 | | 95 | | 615 | |
|
|
|
|
|
|
|
| |
| (1) | Excludes sales of Prudential Bonds where only commissions are earned. |
| | |
| (2) | Calculated as 10% of single premium new business premiums, plus annual new business premiums. |
| | |
| (3) | New business margin is calculated as new business contribution to embedded value, divided by related annualised equivalent premiums for Life contracts. |
Note: the 2001 table above and the “2002 compared to 2001” commentary below are based on a group basis (as presented in our 2002 Annual Report). The primary difference between the Personal Financial Services group of reportable segments basis (shown in the 2003 and 2002 tables and commentary) and the group basis primarily arises on our Scottish Mutual International with-profits new business premiums.
2003 compared to 2002
Total Personal Financial Services life assurance new business premiums of £1.5bn were 40% lower than 2002 (£2.5bn), reflecting the withdrawal from the with-profit bond market and a general decline in demand due to investor nervousness about stock market conditions relating to with-profits policies.
The impact on our new business flows has been more marked as a result of our previous dependence on with-profits.
In addition, in the second half of the year, our branch-based adviser sales force was substantially restructured, with extensive retraining of this sales force, including training relating to multi-manager. Our sales force to the Independent Financial Advisers market was also substantially restructured behind new offerings, with both programmes well advanced. The combination of the sales force restructuring and the need to bring new products on line has also contributed to the year-on-year decline. |
| | A more detailed analysis of the movement includes: |
| > | Abbey National Life new business totalled £817m (2002: £1,341m), down 39%, impacted by a large fall in life and investment products. This was driven by falls in single premium structured Individual Savings Account sales and investment bonds, in addition to the exit from the with-profit bond market. Sales of the new multi-manager contract have been encouraging. |
| > | New business premiums in Scottish Mutual of £494m were 48% lower than 2002, predominantly due to reduced sales of single premium pension products, especially Flexible Trustee Investment Products and Personal pensions. Single premium life sales suffered from the withdrawal from the with-profits market, offset by strong sales of the Flexible Investment bond. |
| > | Scottish Provident new business fell 12% to £197m (2002: £224m), impacted by reduced sales of single premium pension products. The majority of pension sales in 2002 were in respect of |
| | |
| 32 | Abbey Annual Report and Accounts 2003 |
Back to Contents
Operating and Financial Review
Operating Review – Personal Financial Services continued
proceeds from demutualisation compensation payments reinvested in policy benefits. Protection new business increased by 17% to £82m (2002: £70m).
2002 compared to 2001
Single-premium pension sales increased by 5%, largely due to the reinvestment in the first half of 2002 of pension scheme compensation payments made to Scottish Provident policy holders on demutualisation.
Single Individual Savings Account and unit trust sales almost doubled in 2002 to £1.1bn (2001: 0.6bn). The rise was largely due to the increased number of structured Independent Savings Account tranches sold through Abbey National Life during 2002.
Total Life and other bonds were 12% ahead of 2001 mainly due to sales of the Flexible Investment Bond in Scottish Mutual.
As expected, Scottish Mutual and Abbey National Life have suffered in 2002 due to the decline in with-profit bond sales. Abbey National Life signed a deal with Prudential to distribute a version of its “Prudence Bond”, with sales commencing from December 2002.
2002 protection sales were 38% ahead of 2001, largely due to increased sales of term assurance contracts through Scottish Provident, but also boosted by Pegasus “Whole Life” and Abbey National Life protection sales.
Assets under management
The table below shows the Abbey National Asset Managers’ funds under management by company (including related Portfolio Business Unit entities), and split by type of business:
| | | | | | 31 December 2003 | |
|
|
|
|
|
|
|
| |
| | AN | | Scottish | | Scottish | | | |
| | Life | | Mutual | (2) | Provident | | Total | |
| | £bn | | £bn | | £bn | | £bn | |
|
|
|
|
|
|
|
| |
| With-profits fund | – | | 9.4 | | 4.9 | | 14.3 | |
|
|
|
|
|
|
|
| |
| Non-profit fund | 4.8 | | 7.5 | | 2.5 | | 14.8 | |
|
|
|
|
|
|
|
| |
| Total(1) | 4.8 | | 16.9 | | 7.4 | | 29.1 | |
|
|
|
|
|
|
|
| |
| (1) | Total funds under management is split £25.9bn in Personal Financial Services grouped segments, and £3.2bn managed on behalf of entities within the Portfolio Business Unit grouped segments. |
| | | | | | 31 December 2002 | |
|
|
|
|
|
|
|
| |
| | AN | | Scottish | | Scottish | | | |
| | Life | | Mutual | (2) | Provident | | Total | |
| | £bn | | £bn | | £bn | | £bn | |
|
|
|
|
|
|
|
| |
| With-profits fund | – | | 9.3 | | 5.1 | | 14.4 | |
|
|
|
|
|
|
|
| |
| Non-profit fund | 4.9 | | 7.6 | | 2.4 | | 14.9 | |
|
|
|
|
|
|
|
| |
| Total(1) | 4.9 | | 16.9 | | 7.5 | | 29.3 | |
|
|
|
|
|
|
|
| |
| (1) | Total funds under management is split £26.3bn in Personal Financial Services grouped segments, and £3.0bn in Portfolio Business Unit grouped segments. |
| | | | | | 31 December 2001 | |
|
|
|
|
|
|
|
| |
| | AN | | Scottish | | Scottish | | | |
| | Life | | Mutual | (2) | Provident | | Total | |
| | £bn | | £bn | | £bn | | £bn | |
|
|
|
|
|
|
|
| |
| With-profits fund | – | | 9.2 | | – | | 9.2 | |
|
|
|
|
|
|
|
| |
| Non-profit fund | 5.3 | | 7.0 | | 0.3 | | 12.6 | |
|
|
|
|
|
|
|
| |
| Total | 5.3 | | 16.2 | | 0.3 | | 21.8 | |
|
|
|
|
|
|
|
| |
| (1) | Total funds under management is split £20.2bn in Personal Financial Services grouped segments, and £1.6bn in Portfolio Business Unit grouped segments. |
| (2) | Scottish Mutual includes Scottish Mutual International. |
Personal Financial Services trading expenses
Personal Financial Services trading expenses by segment by business
| | | 31 December | | 31 December | | 31 December | |
| | | 2003 | | 2002 | | 2001 | |
| | | £m | | £m | | £m | |
|
|
|
|
|
|
| |
| Abbey retail | | 1,041 | | 1,002 | | 964 | |
|
|
|
|
|
|
| |
| cahoot | | 43 | | 43 | | 50 | |
|
|
|
|
|
|
| |
| Cater Allen and Offshore | | 48 | | 63 | | 55 | |
|
|
|
|
|
|
| |
| Banking and Savings | | 1,132 | | 1,108 | | 1,069 | |
|
|
|
|
|
|
| |
| Scottish Mutual(1) | | 9 | | 3 | | 4 | |
|
|
|
|
|
|
| |
| Scottish Provident(1) | | 1 | | 1 | | – | |
|
|
|
|
|
|
| |
| Abbey National Life (1) | | 10 | | 11 | | 10 | |
|
|
|
|
|
|
| |
| Other | | 38 | | 38 | | 32 | |
|
|
|
|
|
|
| |
| Investment and Protection | | 58 | | 53 | | 46 | |
|
|
|
|
|
|
| |
| General Insurance | | 48 | | 54 | | 42 | |
|
|
|
|
|
|
| |
| Treasury Services | | 109 | | 110 | | 98 | |
|
|
|
|
|
|
| |
| Group Infrastructure | | 230 | | 252 | | 226 | |
|
|
|
|
|
|
| |
| PFS trading expenses | | 1,577 | | 1,577 | | 1,481 | |
|
|
|
|
|
|
| |
| Adjust for: | | | | | | | |
|
|
|
|
|
|
| |
| – re-organisation expenses | | 265 | | 34 | | – | |
|
|
|
|
|
|
| |
| – goodwill charges | | 28 | | 811 | | 36 | |
|
|
|
|
|
|
| |
| PFS expenses | | 1,870 | | 2,422 | | 1,517 | |
|
|
|
|
|
|
| |
| (1) | The quoted operating expenses for the Life Assurance businesses exclude operating expenses which are accounted for as part of embedded value and reported as non-interest income. These totalled £179m (2002: £(201)m). |
2003 compared to 2002
Banking and Savings trading expenses were up £24m to £1,132m (2002: £1,108m). Increased employment costs reflected wage inflation, increased customer-facing head count, and increased national insurance and pension costs. This, combined with marketing spend associated with the business re-launch, has more than offset the cost savings in Abbey retail.
Investment and Protection expenses were up £5m to £58m (2002: £53m), reflecting the costs of rolling out multi-manager in Scottish Mutual, and some additional spend to support the expansion of James Hay.
General Insurance expenses of £48m (2002: £54m) were down £6m, largely due to a significant reduction in head count as part of the cost reduction programme.
Trading expenses in the Treasury Services business of £109m, were stable, reflecting an increase in performance-related payback up to broadly market levels, offset by savings resulting from the cost reduction programme.
In Group Infrastructure trading expenses were down 9% to £230m (2002: £252m), largely as a result of benefits associated with the cost reduction programme, offset by inflation and pension contribution increases, and the non-recurrence of project spend incurred in the second half of 2002.
A breakdown of the non-trading items is provided in the “Other material items” section.
2002 compared to 2001
Banking and Savings trading expenses increased by £39m to £1,108m (2001: £1,069m) as a result of an increase in customer-facing head count, pension cost increases and increased marketing spend.
Trading expenses in Group Infrastructure increased in 2002 by £26m to £252m (2001: £226m), driven by increased (internal audit and risk management) head count, property costs relating to the relocation of head office, and increased pension costs. This was partly offset by reduced corporate advisory fees.
| Abbey Annual Report and Accounts 2003 | 33 |
Back to Contents
Operating and Financial Review
Operating Review – Personal Financial Services continued
Personal Financial Services trading expenses by type
| | 31 December | | 31 December | | 31 December | |
| | 2003 | | 2002 | | 2001 | |
| | £m | | £m | | £m | |
|
|
|
|
|
| |
| Salaries and other compensation | | | | | | |
| payments | 639 | | 638 | | 609 | |
|
|
|
|
|
| |
| Social security costs | 54 | | 51 | | 45 | |
|
|
|
|
|
| |
| Pension costs | 121 | | 81 | | 59 | |
|
|
|
|
|
| |
| Salaries and other staff costs | 814 | | 770 | | 713 | |
|
|
|
|
|
| |
| Bank, legal and professional fees | 91 | | 109 | | 134 | |
|
|
|
|
|
| |
| Advertising and marketing | 91 | | 90 | | 85 | |
|
|
|
|
|
| |
| Bank, legal, marketing and professional expenses | 182 | | 199 | | 219 | |
|
|
|
|
|
| |
| Software, computer and | | | | | | |
| administration expenses | 295 | | 333 | | 284 | |
|
|
|
|
|
| |
| Premises and equipment | | | | | | |
| depreciation | 97 | | 92 | | 102 | |
|
|
|
|
|
| |
| Other property and | | | | | | |
| equipment expenses | 189 | | 183 | | 163 | |
|
|
|
|
|
| |
| PFS trading expenses | 1,577 | | 1,577 | | 1,481 | |
|
|
|
|
|
| |
| (1) | Pension costs relate to Personal Financial Services only, and do not include £12m (2002: £11m, 2001: £9m) relating to the life businesses accounted for on an embedded value basis. |
| |
2003 compared to 2002
Total salaries and other staff costs were up 6% to £814m (2002: £770m) comprising: |
| > | salaries and other compensation payments remained steady, with normal salary inflation, and recruitment into customer-facing roles in the branches and call centres being offset by head count savings from the cost programme; |
| > | social security costs up 6% in total, reflecting the increase in employer’s contribution rate effective from April 2002; and |
| > | an increase in pension costs of £40m to £121m (2002: £81m), largely due to increased charges resulting from the pension fund deficit, as previously announced. A detailed analysis of the pension fund deficit is included in the “Other material items” section. |
Bank, legal, marketing and professional expenses of £182m were down 9% on last year, largely due to the non-recurrence of project spend in the second half of 2002. Advertising and marketing spend was broadly stable, with a reduction in non-Abbey branded spend being offset by increased Abbey-related advertising. Expenditure on the business re-launch was £11m, covering the customer catalogue and increased communications spend. A further £6m has been included as a non-trading charge, largely relating to day one TV and press advertising, and to a lesser extent agency fees.
Software, computer and administration expenses of £295m (2002: £333m) were down 11%, largely reflecting the benefits of the cost reduction programme.
Premises and equipment depreciation expenses of £97m increased by 5%, due to increased information technology costs in relation to upgrading our telecoms network, customer relationship management software and upgrades to the branch information technology infrastructure.
Software, computer and admin expenses of £333m were down 11%, largely reflecting the benefits of the cost reduction.
Other property and equipment expenses were broadly unchanged at £189m (2002: £183m). |
2002 compared to 2001
The main movements in 2002 by line include: |
| > | salaries and other staff costs were up 8% to £770m (2001: £713m), including the increase in pension costs of £22m to £81m (2001: £59m), largely driven by increased charges resulting from the pension fund deficit; |
| > | bank, legal, marketing and professional expenses of £199m were down 9% on 2001, primarily due to cahoot launch costs and corporate activity including bid defence costs in 2001; and |
| > | software, computer and administration expenses of £334m were up 17%, primarily due to investment spend in Treasury Services. Other property and equipment expenses of £183m increased by 12%, due to higher rental costs and relocation expenses. |
Cost reduction and restructuring programme
During the second half of 2002, Abbey embarked upon a major programme of cost reduction activity across the organisation. The principal aim of this activity is to eradicate the duplication of both resources and activities across the organisation so that a more efficient cost base can be achieved and then sustained.
Retaining a focus on cost reduction is an ongoing priority for Abbey. In total the programme is targeting annualised cost savings of over £200m from the Personal Financial Services businesses by the end of 2005.
The work to lower our cost base and promote a higher level of cost-consciousness amongst staff has been a key factor of the strategic review of the business. Regardless of organisational structure, keeping the cost base under close scrutiny is a top priority as the new strategy is implemented, whilst acknowledging that an element of the savings will be reinvested in the business to improve the customer proposition and competitiveness.
Cumulative implementation spend specifically relating to the cost programme to date, amounts to £182m, including an element of empty premises provisions.
Implementation spend relating to the re-organisation of the business was £315m (2002: £34m) in 2003.
Personal Financial Services trading provisions
Personal Financial Services trading provisions by type
| | 31 December | | 31 December | | 31 December | |
| | 2003 | | 2002 | | 2001 | |
| | £m | | £m | | £m | |
|
|
|
|
|
| |
| Mortgages | 8 | | 17 | | 35 | |
|
|
|
|
|
| |
| Unsecured personal loans | 61 | | 47 | | 58 | |
|
|
|
|
|
| |
| Credit cards | 10 | | 4 | | 3 | |
|
|
|
|
|
| |
| Banking | 39 | | 68 | | 44 | |
|
|
|
|
|
| |
| Other | 12 | | 14 | | 9 | |
|
|
|
|
|
| |
| PFS provisions for bad | | | | | | |
| and doubtful debts | 130 | | 150 | | 149 | |
|
|
|
|
|
| |
| Provisions for contingent | | | | | | |
| liabilities and commitments | 61 | | 46 | | (9 | ) |
|
|
|
|
|
| |
| Amounts written off fixed-asset investments | – | | (2 | ) | 24 | |
|
|
|
|
|
| |
| Total PFS trading provisions | 191 | | 194 | | 164 | |
|
|
|
|
|
| |
| Add: embedded value charges and | | | | | | |
| rebasing(1) | 80 | | – | | – | |
|
|
|
|
|
| |
| Add: re-organisation expenses(2) | 34 | | – | | – | |
|
|
|
|
|
| |
| PFS provisions | 305 | | 194 | | 164 | |
|
|
|
|
|
| |
| (1) | Charge relates to the impact of tax law changes on the structure of the Scottish Provident acquisition. |
| | |
| (2) | Includes empty premises provisions arising from the review of site locations and certain asset write-downs. |
| 34 | Abbey Annual Report and Accounts 2003 |
Back to Contents
Operating and Financial Review
Operating Review – Personal Financial Services continued
2003 compared to 2002
In total, Personal Financial Services trading provisions fell by 2% to £191m (2002: £194m).
Personal Financial Services provisions for bad and doubtful debts of £130m fell 13% (2002: £150m).
The mortgage provisions charge of £8m (2002: £17m) benefited from an improvement in arrears, while provisions relating to unsecured personal loans grew by £14m to £61m due to the continued asset growth, particularly in cahoot. Banking provisions decreased to £39m (2002: £68m), with improved credit quality and operational controls impacting positively on arrears levels and write offs.
Provisions for contingent liabilities and commitments of £61m (2002: £46m) include a provision of £50m relating to uncertainty about the regulatory environment for product mis-selling.
2002 compared to 2001
Lending-related provisions remained broadly stable, with a decrease in mortgage related provisioning being offset by increased banking provisions, in part as a result of asset growth in cahoot.
In total, provisions increased by 18% to £194m, almost entirely due to an increase in provisions for contingent liabilities and commitments to £46m (2001: £(9)m). The year-on-year increase was partly the result of £25m write-backs in 2001 not repeated, and additional provisions raised in 2002 in relation to potential claims.
Total Personal Financial Services non-performing loans
| | 31 December | | 31 December | | 31 December | |
| | 2003 | | 2002 | | 2001 | |
| | £m | | £m | | £m | |
|
|
|
|
|
| |
| Loans provided for | 175 | | 174 | | 258 | |
|
|
|
|
|
| |
| Arrears greater than 90 days not provided | 414 | | 528 | | 780 | |
|
|
|
|
|
| |
| Total non-performing loans | 589 | | 702 | | 1,038 | |
|
|
|
|
|
| |
| Total loans and advances to customers(1) | 75,114 | | 66,072 | | 60,313 | |
|
|
|
|
|
| |
| Total provisions | 323 | | 292 | | 304 | |
|
|
|
|
|
| |
| NPLs as a % of loans and advances | 0.78% | | 1.06% | | 1.72% | |
|
|
|
|
|
| |
| Provisions as a % of NPLs | 54.84% | | 41.60% | | 29.29% | |
|
|
|
|
|
| |
| (1) | The quoted loans and advances to customers are net of securitisations. |
2003 compared to 2002
The total value of non-performing loans further decreased to £589m (2002: £702m), benefiting from favourable market conditions, good credit control, and strong credit quality of new business being written.
As a percentage of loans and advances, non-performing loans have decreased to 0.78% (2002: 1.06%), with provision coverage of 54.84% (2002: 41.60%), a comfortable coverage ratio given the level of asset growth and quality.
2002 compared to 2001
The number of non-performing loans decreased in 2002 in each of the major product categories, despite strong asset growth over the period. The number of non-performing secured loans (excluding Abbey Business) decreased in 2002 by around 30%.
In total, the value of non-performing loans as a percentage of loans and advances continued to improve in 2002, ending the year at 1.06% (2001: 1.72%). The level of provisions coverage also increased in 2002, closing at 41.60% (2001: 29.29%).
| Abbey Annual Report and Accounts 2003 | 35 |
Back to Contents
Operating and Financial Review
Operating Review – Personal Financial Services continued
Personal Financial Services mortgage arrears, properties in possession and lending mix
Mortgage arrears
| | | | | | 31 December 2003 | | | | | | 31 December 2002 | |
|
|
|
|
|
|
|
|
|
|
|
| |
| | | | | | CML | (1) | | | | | CML | (1) |
| | Number of | | | | industry | | Number of | | | | industry | |
| Cases | cases (000) | | % of total | | average % | | cases (000) | | % of total | | average % | |
|
|
|
|
|
|
|
|
|
|
|
| |
| 1 – 2 months arrears | 20.2 | | 1.47 | | n/a | | 24.8 | | 1.78 | | n/a | |
|
|
|
|
|
|
|
|
|
|
|
| |
| 3 – 5 months arrears | 5.5 | | 0.40 | | 0.49 | | 8.7 | | 0.63 | | 0.59 | |
|
|
|
|
|
|
|
|
|
|
|
| |
| 6 – 11 months arrears | 2.2 | | 0.16 | | 0.27 | | 3.8 | | 0.27 | | 0.30 | |
|
|
|
|
|
|
|
|
|
|
|
| |
| 12 months + arrears | 0.5 | | 0.03 | | 0.12 | | 1.0 | | 0.07 | | 0.15 | |
|
|
|
|
|
|
|
|
|
|
|
| |
| | | | 31 December 2003 | | | | | | 31 December 2002 | | | |
|
|
|
|
|
|
|
|
|
|
|
| |
| Value of arrears | | | £m | | % of total | | | | £m | | % of total | |
|
|
|
|
|
|
|
|
|
|
|
| |
| 1 – 2 months arrears | | | 11.2 | | 0.01 | | | | 12.7 | | 0.02 | |
|
|
|
|
|
|
|
|
|
|
|
| |
| 3 – 5 months arrears | | | 7.5 | | 0.01 | | | | 11.2 | | 0.01 | |
|
|
|
|
|
|
|
|
|
|
|
| |
| 6 – 11 months arrears | | | 5.3 | | 0.01 | | | | 9.1 | | 0.01 | |
|
|
|
|
|
|
|
|
|
|
|
| |
| 12 months + arrears | | | 3.2 | | – | | | | 6.3 | | 0.01 | |
|
|
|
|
|
|
|
|
|
|
|
| |
| Total arrears | | | 27.2 | | 0.03 | | | | 39.3 | | 0.05 | |
|
|
|
|
|
|
|
|
|
|
|
| |
| Balance sheet provisions | | | 190.1 | | | | | | 180.7 | | | |
|
|
|
|
|
|
|
|
|
|
|
| |
| Coverage (times) | | | 7.0x | | | | | | 4.6x | | | |
|
|
|
|
|
|
|
|
|
|
|
| |
| | | | | | | | | | | | | |
| Mortgage properties in possession | | | | | | | | | | | | |
| | | | | | 31 December 2003 | | | | | | 31 December 2002 | |
|
|
|
|
|
|
|
|
|
|
|
| |
| | | | | | CML | (1) | | | | | CML | (1) |
| | Number | | | | industry | | Number | | | | industry | |
| | cases | | % of loans | | average % | | cases | | % of loans | | average % | |
|
|
|
|
|
|
|
|
|
|
|
| |
| No. of repossessions | 1,642 | | 0.06 | | 0.03 | | 2,628 | | 0.09 | | 0.05 | |
|
|
|
|
|
|
|
|
|
|
|
| |
| No. of Sales | 1,736 | | 0.06 | | 0.04 | | 3,028 | | 0.11 | | 0.06 | |
|
|
|
|
|
|
|
|
|
|
|
| |
| Stock | 325 | | 0.02 | | 0.02 | | 419 | | 0.03 | | 0.02 | |
|
|
|
|
|
|
|
|
|
|
|
| |
| (1) | The abbreviation CML stands for Council of Mortgage Lenders. |
| | |
2003 compared to 2002
Arrears levels in 2003 maintained the downwards momentum of recent periods, with 3-month-plus arrears cases of 8,200 falling 26% from the June 2003 stage, and 39% from December 2002, and comprising 0.59% of the mortgage book, compared to 0.88% for the Council of Mortgage Lenders industry average.
By value, the 3-month-plus arrears category totalled £16m(2002: £27m), with provisions in place of £190m (2002: £181m) providing significant coverage of 7.0 times (2002: 4.6 times) on all arrears.
The number of repossessions fell significantly by 38% to 1,642 (2002: 2,628), resulting in the stock of properties in possession falling to 325 (2002: 419).
2002 compared to 2001
Mortgage arrears continued to improve throughout 2002, with the key highlights being a 30% reduction in the level of 3 month + arrears cases to 13,500 (2001: 19,400). In the second half, arrears continued to reduce falling by 16% compared to the first half of 2002.
In addition, the stock of properties in possession fell by 49% to 419 properties (2001: 819 properties).
| 36 | Abbey Annual Report and Accounts 2003 |
Back to Contents
Operating and Financial Review
Operating Review – Personal Financial Services continued
| Mortgage new business credit quality |
| | 31 December | | 31 December | |
| | 2003 | | 2002 | |
|
|
|
| |
| Loan-to-value analysis: | | | | |
|
|
|
| |
| New business | | | | |
|
|
|
| |
| >90% | 9% | | 14% | |
|
|
|
| |
| 75%-90% | 28% | | 30% | |
|
|
|
| |
| <75% | 63% | | 56% | |
|
|
|
| |
| Average (at inception) | 57% | | 61% | |
|
|
|
| |
| Average loan-to-value of stock (indexed) | 45% | | 46% | |
|
|
|
| |
| New Business Profile: | | | | |
|
|
|
| |
| First-time buyers | 17% | | 18% | |
|
|
|
| |
| Home movers | 33% | | 38% | |
|
|
|
| |
| Remortgagers | 50% | | 44% | |
|
|
|
| |
| Average earnings multiple | 2.5 | | 2.6 | |
|
|
|
| |
Growth in the secured loan portfolio during 2003 has been achieved by continued success in the introducer channel and an increased share of the First Time Buyer market.
Credit quality in 2003 has improved compared with the market, as measured by Council of Mortgage Lenders data. In particular: |
| > | we have a steady market share in the key secured areas of first time buyer, remortgage, switcher and loyal movers. For niche markets such as large loans, buy-to-let, and commercial properties, we are under-represented but are growing following the establishment of a specialised underwriting unit; |
| > | the average (at inception) loan-to-value of new business has decreased in 2003 to 57% from 61% in 2002, driven largely by a smaller proportion of business where the loan-to-value exceeds 90%; |
| > | the expected arrears rates, on 2003 new business, as calculated from the application scorecards, have decreased, driven by general improvement in the quality of applicants; |
| > | arrears in 2003 have continued to decrease, with historic lows on bad debt; |
| > | income multiples for overall business have seen a slight decrease in 2003; and |
| > | the percentage of remortgages with equity release increased during 2003, although the income multiple averages for this tranche of business have decreased. |
| Personal Financial Services Banking and unsecured personal loan arrears |
| | 31 December | | 31 December | | 31 December | |
| | 2003 | | 2002 | | 2001 | |
| | £m | | £m | | £m | |
|
|
|
|
|
| |
| Total banking and unsecured personal loan arrears(1, 2) | 146 | | 126 | | 174 | |
|
|
|
|
|
| |
| Total banking and unsecured personal loan asset | 3,019 | | 2,779 | | 2,433 | |
|
|
|
|
|
| |
| Banking and unsecured | | | | | | |
| personal loan arrears as a % of asset | 4.8% | | 4.5% | | 7.2% | |
|
|
|
|
|
| |
| (1) | Banking arrears are defined as customers whose borrowings exceed their overdraft by over £100. |
| | |
| (2) | UPL arrears are defined as the balances of accounts that are two or more monthly installments in arrears. |
2003 compared to 2002
Arrears levels have increased 16% to £146m (2002: £126m) driven by increases in asset levels and the growing maturity of the cahoot unsecured lending book. Abbey-branded arrears have fallen 15%.
2002 compared to 2001
The reduction in arrears was due to a combination of improvements in new lending criteria, front-end underwriting and middle office operational controls, and the sale of unsecured loan assets previously written-off.
| Personal Financial Services provisions for doubtful debts analysis – balance sheet |
| | 31 December 2003 | | 31 December 2002 | |
|
|
|
|
|
|
|
| |
| | Provisionsbalance
£m | | Balance % ofloan assets | | Provisionsbalance
£m | | Balance % ofloan assets | |
|
|
|
|
|
|
|
| |
| Secured | 190 | | 0.2 | | 181 | | 0.2 | |
|
|
|
|
|
|
|
| |
| Personal banking | 42 | | 8.2 | | 46 | | 9.3 | |
|
|
|
|
|
|
|
| |
| Unsecured personal loans | 43 | | 2.7 | | 45 | | 2.2 | |
|
|
|
|
|
|
|
| |
| Abbey Business | 18 | | 1.2 | | 9 | | 0.6 | |
|
|
|
|
|
|
|
| |
| cahoot | 30 | | 3.2 | | 8 | | 1.3 | |
|
|
|
|
|
|
|
| |
| Banking and Savings | 323 | | 0.4 | | 289 | | 0.4 | |
|
|
|
|
|
|
|
| |
| Scottish Provident | 80 | | 6.3 | | – | | – | |
|
|
|
|
|
|
|
| |
| Group Infrastructure | – | | – | | 3 | | 0.6 | |
|
|
|
|
|
|
|
| |
| Total PFS | 403 | | 0.5 | | 292 | | 0.4 | |
|
|
|
|
|
|
|
| |
Personal Financial Services provisions for bad and doubtful debts increased to £403m (2002: £292m), largely due to the £80m charge at June 2003 in respect of the impact of tax law changes on the structure of the Scottish Provident acquisition. Refer to the “Other material items” section for further detail.
Total provisions for bad and doubtful debts in Banking and Savings increased 12% to £323m (2002: £289m), driven by an increase in cahoot provisions and reflecting volume growth across Personal Financial Services in the period.
| Abbey Annual Report and Accounts 2003 | 37 |
Back to Contents
Operating and Financial Review
Operating Review – Personal Financial Services continued
| Personal Financial Services provisions for doubtful debts analysis – balance sheet reconciliation |
| |
| | Mortgages | | Unsecured | | Other | | Total | |
| | £m | | £m | | £m | | £m | |
|
|
|
|
|
|
|
| |
| At 1 January 2003 | | | | | | | | |
|
|
|
|
|
|
|
| |
| General | 171 | | 23 | | 9 | | 203 | |
|
|
|
|
|
|
|
| |
| Specific | 10 | | 73 | | 6 | | 89 | |
|
|
|
|
|
|
|
| |
| Total | 181 | | 96 | | 15 | | 292 | |
|
|
|
|
|
|
|
| |
| Transfer from P&L account | 6 | | 110 | | 94 | | 210 | |
|
|
|
|
|
|
|
| |
| Recoveries | 5 | | 28 | | 1 | | 34 | |
|
|
|
|
|
|
|
| |
| Irrecoverable amounts written off | (2 | ) | (117 | ) | (14 | ) | (133 | ) |
|
|
|
|
|
|
|
| |
| At 31 December 2003 | 190 | | 117 | | 96 | | 403 | |
|
|
|
|
|
|
|
| |
| General | 183 | | 27 | | 88 | | 298 | |
|
|
|
|
|
|
|
| |
| Specific | 7 | | 90 | | 8 | | 105 | |
|
|
|
|
|
|
|
| |
| Total | 190 | | 117 | | 96 | | 403 | |
|
|
|
|
|
|
|
| |
| At 1 January 2002 | | | | | | | | |
|
|
|
|
|
|
|
| |
| General | 144 | | 17 | | 6 | | 167 | |
|
|
|
|
|
|
|
| |
| Specific | 38 | | 88 | | 4 | | 130 | |
|
|
|
|
|
|
|
| |
| Total | 182 | | 105 | | 10 | | 297 | |
|
|
|
|
|
|
|
| |
| Transfer from P&L account | 18 | | 121 | | 12 | | 151 | |
|
|
|
|
|
|
|
| |
| Recoveries | 4 | | 34 | | 1 | | 39 | |
|
|
|
|
|
|
|
| |
| Irrecoverable amounts | | | | | | | | |
| written off | (23 | ) | (164 | ) | (8 | ) | (195 | ) |
|
|
|
|
|
|
|
| |
| At 31 December 2002 | 181 | | 96 | | 15 | | 292 | |
|
|
|
|
|
|
|
| |
| 38 | Abbey Annual Report and Accounts 2003 |
Back to Contents
Operating and Financial Review
Operating Review – Portfolio Business Unit
Portfolio Business Unit trading profit/(loss) before tax by segment
| 31 December 2003 | Wholesale Banking
£ m | | First National
£m | | Other
£ m | | Total PBU
£ m | |
|
|
|
|
|
|
|
| |
| Net interest income | 22 | | 245 | | 86 | | 353 | |
|
|
|
|
|
|
|
| |
| Non-interest income | (197 | ) | (58 | ) | 25 | | (230 | ) |
|
|
|
|
|
|
|
| |
| Depreciation on operating | | | | | | | | |
| lease assets | (250 | ) | (1 | ) | – | | (251 | ) |
|
|
|
|
|
|
|
| |
| Total trading income | (425 | ) | 186 | | 111 | | (128 | ) |
|
|
|
|
|
|
|
| |
| Total trading expenses | (107 | ) | (137 | ) | (83 | ) | (327 | ) |
|
|
|
|
|
|
|
| |
| Provision for bad and | | | | | | | | |
| doubtful debts | (154 | ) | (99 | ) | (11 | ) | (264 | ) |
|
|
|
|
|
|
|
| |
| Provisions for contingent | | | | | | | | |
| liabilities and commitments | (2 | ) | – | | (17 | ) | (19 | ) |
|
|
|
|
|
|
|
| |
| Amounts written off | | | | | | | | |
| fixed-asset investments | (183 | ) | – | | – | | (183 | ) |
|
|
|
|
|
|
|
| |
| Trading profit/(loss) | | | | | | | | |
| before tax | (871 | ) | (50 | ) | – | | (921 | ) |
|
|
|
|
|
|
|
| |
| Adjust for: | | | | | | | | |
|
|
|
|
|
|
|
| |
| Income from associated | | | | | | | | |
| undertakings | – | | (12 | ) | – | | (12 | ) |
|
|
|
|
|
|
|
| |
| Profit on disposal of Group undertakings | (50 | ) | 1 | | (40 | ) | (89 | ) |
|
|
|
|
|
|
|
| |
| Profit/(loss) on the sale or termination of an operation | 6 | | 27 | | – | | 33 | |
|
|
|
|
|
|
|
| |
| Operating profit/(loss) | (915 | ) | (34 | ) | (40 | ) | (989 | ) |
|
|
|
|
|
|
|
| |
| | | | | | | | | |
| 31 December 2002 | WholesaleBanking
£m | | First National
£m | | Other
£m | | Total PBU
£m | |
|
|
|
|
|
|
|
| |
| Net interest income | 327 | | 464 | | 55 | | 846 | |
|
|
|
|
|
|
|
| |
| Non-interest income | 378 | | (48 | ) | (71 | ) | 259 | |
|
|
|
|
|
|
|
| |
| Depreciation on operating | | | | | | | | |
| lease assets | (252 | ) | (5 | ) | – | | (257 | ) |
|
|
|
|
|
|
|
| |
| Total trading income | 453 | | 411 | | (16 | ) | 848 | |
|
|
|
|
|
|
|
| |
| Total trading expenses | (123 | ) | (546 | ) | (66 | ) | (735 | ) |
|
|
|
|
|
|
|
| |
| Provision for bad and | | | | | | | | |
| doubtful debts | (247 | ) | (15 | ) | (2 | ) | (364 | ) |
|
|
|
|
|
|
|
| |
| Provisions for contingent | | | | | | | | |
| liabilities and commitments | – | | (4 | ) | – | | (4 | ) |
|
|
|
|
|
|
|
| |
| Amounts written off | | | | | | | | |
| fixed-asset investments | (513 | ) | – | | – | | (513 | ) |
|
|
|
|
|
|
|
| |
| Trading (loss) / profit | | | | | | | | |
| before tax | (430 | ) | (254 | ) | (84 | ) | (768 | ) |
|
|
|
|
|
|
|
| |
| Adjust for: | | | | | | | | |
|
|
|
|
|
|
|
| |
| Income from associated | | | | | | | | |
| undertakings | – | | (17 | ) | – | | (17 | ) |
|
|
|
|
|
|
|
| |
| Profit on disposal of Group | | | | | | | | |
| undertakings | (46 | ) | (2 | ) | – | | (48 | ) |
|
|
|
|
|
|
|
| |
| Operating profit/(loss) | (476 | ) | (273 | ) | (84 | ) | (833 | ) |
|
|
|
|
|
|
|
| |
| 31 December 2001 | Wholesale Banking
£m | | First National
£ m | | Other
£m | | Total PBU
£m | |
|
|
|
|
|
|
|
| |
| Net interest income | 376 | | 461 | | 36 | | 873 | |
|
|
|
|
|
|
|
| |
| Non-interest income | 413 | | (33 | ) | (14 | ) | 366 | |
|
|
|
|
|
|
|
| |
| Depreciation on operating | | | | | | | | |
| lease assets | (152 | ) | (7 | ) | – | | (159 | ) |
|
|
|
|
|
|
|
| |
| Total trading income | 637 | | 421 | | 22 | | 1,080 | |
|
|
|
|
|
|
|
| |
| Total trading expenses | (88 | ) | (214 | ) | (37 | ) | (339 | ) |
|
|
|
|
|
|
|
| |
| Provision for bad and | | | | | | | | |
| doubtful debts | – | | (113 | ) | (1 | ) | (14 | ) |
|
|
|
|
|
|
|
| |
| Provisions for contingent | | | | | | | | |
| liabilities and commitments | – | | – | | – | | – | |
|
|
|
|
|
|
|
| |
| Amounts written off | | | | | | | | |
| fixed-asset investments | (232 | ) | – | | – | | (232 | ) |
|
|
|
|
|
|
|
| |
| Trading profit/(loss) | | | | | | | | |
| before tax | 317 | | 94 | | (16 | ) | 395 | |
|
|
|
|
|
|
|
| |
| Adjust for: | | | | | | | | |
|
|
|
|
|
|
|
| |
| Income from associated | | | | | | | | |
| undertakings | – | | (14 | ) | – | | (14 | ) |
|
|
|
|
|
|
|
| |
| Profit on disposal of Group | | | | | | | | |
| undertakings | (2 | ) | – | | – | | (2 | ) |
|
|
|
|
|
|
|
| |
| Operating profit/(loss) | 315 | | 80 | | (16 | ) | 379 | |
|
|
|
|
|
|
|
| |
| | | | | | | | | |
| | | | | | | |
| | 31 December | | 31 December | | 31 December | |
| Profit on ordinary activities | 2003 | | 2002 | | 2001 | |
| by line of business | £m | | £m | | £m | |
|
|
|
|
|
| |
| Other: | | | | | | |
|
|
|
|
|
| |
| – International life assurance businesses | (26 | ) | (92 | ) | (13 | ) |
|
|
|
|
|
| |
| – European banking and other | 26 | | 8 | | (3 | ) |
|
|
|
|
|
| |
| | – | | (84 | ) | (16 | ) |
|
|
|
|
|
| |
| Abbey Annual Report and Accounts 2003 | 39 |
Back to Contents
Operating and Financial Review
Operating Review – Portfolio Business Unitcontinued
2003 compared to 2002
The Portfolio Business Unit trading loss before tax increased by £153m to £921m (2002: £768m), largely due to an increase in the Wholesale Banking trading loss before tax of £441m, which was partially offset by a decrease in the First National trading loss before tax of £204m.
The Wholesale Banking trading loss before tax was £871m (2002: £430m). The loss increase was primarily due to a £878m decrease in trading income which was partially offset by decreases of £330m and £93m in amounts written off fixed-asset investments and provision for bad and doubtful debts, respectively. |
| > | Net interest income decreased by £305m, to £22m in 2003, due to lower average asset balances following accelerated asset disposals. |
| | Non-interest income decreased £575m to £(197)m in 2003, due to increased loss realisations resulting from the asset disposals. |
| > | Amounts written off fixed-asset investments decreased by £330m to £183m in 2003, reflecting provisioning raised in 2002 arising from specific counterparty deteriorations. |
| > | Provisions for bad and doubtful debts decreased by £93m to £154m in 2003, benefiting from reduced asset balances. |
| The First National trading loss before tax was £50m (2002: £254m). The loss decrease was primarily due to a decrease of £219m in net interest income which was more than offset by a £409m decrease in trading expenses. |
| > | Net interest income decreased by £219m to £245m in 2003, primarily due to the sale of the Consumer and Retail Finance businesses to GE Consumer Finance in April 2003. |
| > | Trading expenses decreased by £409m to £137m in 2003, due to the sale (referred to above) and the non-recurrence of the £357m impairment. |
| The other trading loss before tax decreased by £84m to nil in 2003, primarily due to rationalisation costs incurred in 2002 which did not re-occur in 2003. Also results were negatively impacted in 2002 by embedded value charges and rebasing. |
| | |
2002 compared to 2001
The £768m trading loss incurred by Portfolio Business Unit reflected difficult market conditions resulting in a reduction in trading income and fees, while the strategic review of the business led to an active reduction of risk-weighted assets.
The Wholesale Banking trading loss before tax of £430m (2001: profit of £317m) was down £747m, largely resulting from increased provisions,and losses on disposal of credit impaired assets. |
| > | The Wholesale Banking trading income of £453m was 29% lower than the prior year (2001: £637m). Net interest income fell by £49m due predominantly to the reduction of the investment portfolio.Non-interest income decreased £35m due to lower dealing profits and lower fees. Dealing profits and net fee income were lower due to poor global trading conditions and lower new business activities. |
| > | Trading expenses increased £35m from £88m in 2001 to £123m in 2002 primarily as a result of £357m of goodwill impairments in 2002. |
| > | Provisions for bad and doubtful debts increased to £247m (2001: nil).The specific provision charge for 2002 was a reflection of the further deterioration of the high-yield sector as well as certain UK and US power exposures, in addition to stressed airplane and collateralised bond obligation exposures. |
| > | Amounts written off fixed asset investments increased £281m to £513m primarily due to the charges related to exposures to high yield securities, private equity, operating leases and corporate securities/loans in light of the difficult global credit conditions. An operating lease impairment of £38m related to the IEM subsidiary and reflected the general uncertainties existing in the aviation sector.Losses on credit-impaired asset disposal increased significantly to £104m. |
| The trading loss before tax in First National was £254m (2001: profit of £94m), driven by growth in secured lending, a recovery of profits in Motor Finance, a significant reduction in the cost base following completion of certain investment projects, and further cost savings put in place through 2002. This more than offset a fall in income reflecting the poor market conditions in Retail Finance, and one-off profits included in 2001. |
| > | The First National goodwill impairment in 2002 of £357m reflected in trading expenses was a result of an assessment of the carrying value of goodwill against the projected financial performance of the businesses.The amount of the impairment was consistent with the sale of parts of First National to GE Consumer Finance. |
Portfolio Business Unit assets and risk-weighted assets by segment
| | At 31 December 2003 | | At 31 December 2002 | |
|
|
|
|
|
|
|
| |
| | | | Risk | | | | Risk | |
| | | | weighted | | | | weighted | |
| | Assets | | assets | | Assets | | assets | |
| | £bn | | £bn | | £bn | | £bn | |
|
|
|
|
|
|
|
| |
| Debt securities | 1.0 | | 0.4 | | 32.3 | | 11.1 | |
|
|
|
|
|
|
|
| |
| Loan portfolio | 2.0 | | 1.7 | | 8.4 | | 7.2 | |
|
|
|
|
|
|
|
| |
| Leasing businesses | 4.7 | | 3.0 | | 5.7 | | 3.7 | |
|
|
|
|
|
|
|
| |
| Private Equity | 0.4 | | 0.3 | | 0.8 | | 1.1 | |
|
|
|
|
|
|
|
| |
| Other | 0.2 | | – | | 1.4 | | – | |
|
|
|
|
|
|
|
| |
| Wholesale Banking | | | | | | | | |
| exit portfolios | 8.3 | | 5.4 | | 48.6 | | 23.1 | |
|
|
|
|
|
|
|
| |
| Consumer and Retail | | | | | | | | |
| Finance Lending | – | | – | | 4.8 | | 3.9 | |
|
|
|
|
|
|
|
| |
| Motor and Litigation Finance | 2.1 | | 2.4 | | 3.2 | | 3.9 | |
|
|
|
|
|
|
|
| |
| First National(1) | 2.1 | | 2.4 | | 8.0 | | 7.8 | |
|
|
|
|
|
|
|
| |
| European banking and other | 1.9 | | 1.2 | | 3.4 | | 1.8 | |
|
|
|
|
|
|
|
| |
| Other | 1.9 | | 1.2 | | 3.4 | | 1.8 | |
|
|
|
|
|
|
|
| |
| | | | | | | | | |
| Total PBU | 12.3 | | 9.0 | | 60.0 | | 32.7 | |
|
|
|
|
|
|
|
| |
| | | | | | | | | |
| (1) | First National Risk weighted assets exceed the value of assets due to the regulatory treatment of the joint venture with Peugeot, whereby 100% of assets are included for regulatory purposes. |
| |
The following section provides a detailed analysis of the 2003 result and balance sheet movement, but focuses on the outstanding balances in these exit portfolios.
Total Portfolio Business Unit assets of £12.3bn were 80% lower than £60.0bn in 2002, with a 72% reduction in risk weighted assets to £9.0bn (2002: £32.7bn).
The accelerated wind down and sale of Portfolio Business Unit assets has impacted earnings through increased loss realisation on sale, as well as reducing the pre-provision contribution to profit across all of the businesses. |
| > | The outstanding unrealised mark-to-market deficit(net of provisions) on the debt securities portfolio is now £nil (2002: £664m), with the equivalent figure on the loan portfolio £66m (2002: £491m). The deficits do not cover portfolios such as leasing (including aircraft and Porterbrook) or private equity, although aircraftleasing and private equity have now been provided down to management’s estimate of realisable value. |
| > | Of the improvement in the deficit since the third quarter statement, approximately £152m relates to execution and market improvements in actual or expected value, and £53m due to increased provisioning in moving asset values to current estimates of realisable values. |
| > | Subsequent to 31 December2003, we reached an agreement with Coller Capital to sell 77% of the remaining private equity portfolio.The sale is subject to the approval of the general partners of the funds involved, and represents £289m of assets |
| 40 | Abbey Annual Report and Accounts 2003 |
Back to Contents
Operating and Financial Review
Operating Review – Portfolio Business Unitcontinued
| | (net of provisions) and undrawn commitments of £162m. No further loss is expected on completion as the assets were written down to realisable value prior to agreement. |
| > | The First National loss before tax reflects restructuring costs and provisioning, in particular in relation to Motor Finance which is being wound down. |
| > | Losses in the International Life business relate to non-recurring rationalisation costs and changes in assumptions used in the calculation of embedded value, whilst growth in profit before tax in the European banking businesses relates largely to the sale premium received on the sale of Abbey National Bank Italy. |
| > | In December, an agreement (subject to approval) to sell Royal Saint Georges Banque to GE Capital Bank France was announced, relating tototal mortgage assets of £381m. |
Wholesale Banking exit portfolios
Provisions and losses
on asset disposals | 31 December
2003 | | 31 December
2002 | |
|
|
|
|
|
|
|
| |
| | Disposal | | | | | | | |
| | losses | | Provisions | (1) | Total | | Total | |
| | £m | | £m | | £m | | £m | |
|
|
|
|
|
|
|
| |
| Debt securities: | | | | | | | | |
|
|
|
|
|
|
|
| |
| – Corporates | 137 | | (5 | ) | 132 | | 209 | |
|
|
|
|
|
|
|
| |
| – High yield | 2 | | 22 | | 24 | | 165 | |
|
|
|
|
|
|
|
| |
| – CDOs | 310 | | 12 | | 322 | | 128 | |
|
|
|
|
|
|
|
| |
| – Other asset backed | 24 | | 12 | | 36 | | 31 | |
|
|
|
|
|
|
|
| |
| Loan portfolio: | | | | | | | | |
|
|
|
|
|
|
|
| |
| – Project finance | 24 | | 121 | | 145 | | 208 | |
|
|
|
|
|
|
|
| |
| – Real estate | 4 | | 3 | | 7 | | – | |
|
| |
|
|
|
|
| |
| – Other | 46 | | 33 | | 79 | | – | |
|
|
|
|
|
|
|
| |
| Leasing businesses | – | | 64 | | 64 | | 38 | |
|
|
|
|
|
|
|
| |
| Private equity | 64 | | 138 | | 202 | | 123 | |
|
|
|
|
|
|
|
| |
| Total provisions, impairments | | | | | | | |
| and disposal losses | 611 | | 400 | | 1,011 | | 902 | |
|
|
|
|
|
|
|
| |
| | | | | | | | | |
| (1) | The total provisions balance of £400m includes impairments of operating leases of £64m, reported on a statutory basis in depreciation of operating lease assets. Provisions charges also include a net loss on sale of assets with an existing provision of approximately £30m. Within general provisions, releases in relation to the sale of debt securities have been more than off set by an increased level of general provisions against the remaining loan portfolio. |
The largest component of the increased total charge of £1,011m (2002: £902m) reflects losses arising from the disposal of the debt investment securities portfolio. Including the loan portfolio, losses are £344m lower than potential losses anticipated by the unrealised mark-to-market deficit disclosed at 31 December 2002.
Of the total £400m charge, £6m relates to assets sold during 2003 and £394m relates to £1.5bn of assets still on the balance sheet at the year end, of which £0.5bn have been subsequently sold.
The provision charge for 2003 reflects the further deterioration of certain UK and US power exposures(included in Project Finance), in addition to stressed airline exposures (included in other asset-backed securities). In addition, further provisioning of approximately £180m was taken in the fourth quarter to write down certain remaining assets to their estimated realisable value, including debt securities, private equity and aircraft leasing.
The provision charge in relation to the leasing businesses reflects impairment of aircraft leasing, with the holding value now in line with management estimates of the realisable value in current market conditions.
The private equity total losses and provisions of £202m reflect the 53% reduction of the portfolio in 2003, and the write-down of the residual portfolio to management’s estimate of net realisable value. Since 31 December 2003, an agreement has been reached to sell the majority of the residual portfolio at this revised book value.
Balance sheet provisions and coverage
Total balance sheet provisions reduced to £772m during 2003 as a result of asset disposals. Specific provisions are based on a detailed review of individual impaired assets and the write-down to fair value of the residual securities positions. The level of general provisions increased, reflecting additional loan-related general provisions partially offset by a decrease in debt-securities-related general provisions. The difference between the profit and loss provision charge and balance sheet provision movement is a reflection of balance sheet provision releases following asset sales and exchange rate movements. This is detailed in the table below:
| | Specific | | General | | Total | |
| | provisions | | provisions | | provisions | |
| | £m | | £m | | £m | |
|
|
|
|
|
| |
| Opening balance at | | | | | | |
| 1 January 2002 | 278 | | 91 | | 369 | |
|
|
|
|
|
| |
Profit and loss charge in 12 months to
31 December 2002 | 689 | | 71 | | 760 | |
|
|
|
|
|
| |
| Release on disposal | (203 | ) | – | | (203 | ) |
|
|
|
|
|
| |
| Other (incl. foreign exchange | | | | | | |
| movements) | (19 | ) | (16 | ) | (35 | ) |
|
|
|
|
|
| |
| Closing balance at 31 December 2002 | 745 | | 146 | | 891 | |
|
|
|
|
|
| |
| Profit and loss charge in 12 months to December 2003 | 304 | | 32 | | 336 | |
|
|
|
|
|
| |
| Release on disposal | (411 | ) | – | | (411 | ) |
|
|
|
|
|
| |
| Other (incl. foreign exchange movements) | (39 | ) | (5 | ) | (44 | ) |
|
|
|
|
|
| |
| Closing balance at | | | | | | |
| 31 December 2003 | 599 | | 173 | | 772 | |
|
|
|
|
|
| |
| |
| Coverage ratios |
| | | | | |
| | At | | At | |
| | 31 December | | 31 December | |
| | 2003 | | 2002 | |
| | £m | | £m | |
|
|
|
| |
| Debt securities provided against | 335 | | 919 | |
|
|
|
| |
| Specific provisions | (109 | ) | (414 | ) |
|
|
|
| |
| Coverage (%) | 32.5% | | 45.0% | |
|
|
|
| |
| Loans provided against | 696 | | 836 | |
|
|
|
| |
| Specific provisions | (160 | ) | (204 | ) |
|
|
|
| |
| Coverage (%) | 23.0% | | 24.4% | |
|
|
|
| |
| Total asset provided against | 1,031 | | 1,755 | |
|
|
|
| |
| Specific provisions | (269 | ) | (618 | ) |
|
|
|
| |
| General provisions | (173 | ) | (146 | ) |
|
|
|
| |
| Total provisions | (442 | ) | (764 | ) |
|
|
|
| |
| Coverage (%) | 42.9% | | 43.5% | |
|
|
|
| |
The decrease in the coverage ratio for debt securities is due to asset sales. The potential loss on remaining securities positions not covered by the Newark collateralised bond obligation has been provided to current estimated market value.
Total specific provisions in the table of £269m differ from the total on the balance sheet of £599m, due to provisions relating to the Newark collateralised bond obligation and private equity.
Summary portfolio details
The Wholesale Banking exit portfolios at 31 December 2002 included £15.3bn of “on balance sheet” assets in conduit vehicles or credit enhanced structures. All such arrangements have been terminated in 2003, with the exception of the Newark collateralised bond obligation (CBO), which is discussed in more detail in Wholesale Banking exit portfolios – credit exposure analysis.
| Abbey Annual Report and Accounts 2003 | 41 |
Back to Contents
Operating and Financial Review
Operating Review – Portfolio Business Unitcontinued
Debt securities
| | At 31 December 2003 | | At 31 December 2002 | |
|
| |
| |
| | Assets | | RWAs | | Assets | | RWAs | |
| | £bn | | £bn | | £bn | | £bn | |
|
|
|
|
|
|
|
| |
| Banks and financial institutions | – | | – | | 6.5 | | 1.5 | |
|
|
|
|
|
|
|
| |
| Sovereign and government | | | | | | | | |
| agencies | – | | – | | 2.0 | | 0.5 | |
|
|
|
|
|
|
|
| |
| Corporates | 0.1 | | 0.1 | | 6.8 | | 5.4 | |
|
|
|
|
|
|
|
| |
| Asset-Backed Securities | | | | | | | | |
| (excluding CDOs) | 0.2 | | 0.2 | | 11.9 | | 2.2 | |
|
|
|
|
|
|
|
| |
| CDOs | – | | – | | 4.0 | | 1.3 | |
|
|
|
|
|
|
|
| |
| High yield(1) | 0.7 | | 0.1 | | 1.1 | | 0.2 | |
|
|
|
|
|
|
|
| |
| Total debt securities | 1.0 | | 0.4 | | 32.3 | | 11.1 | |
|
|
|
|
|
|
|
| |
| | |
| (1) | See the “Wholesale Banking exit portfolios – credit exposure analysis” section for further details. |
Mark-to-market analysis
| | At
31 December
2003 | | At
31 December
2002
(restated) | |
| | £m | | £m | |
|
|
|
| |
| Debt securities and related derivatives | 1,184 | | 32,774 | |
|
|
|
| |
| Less: provisions(1) | (178 | ) | (500 | ) |
|
|
|
| |
| Book value of debt securities | | | | |
| and related derivatives | 1,006 | | 32,274 | |
|
|
|
| |
| Market value of debt securities and | | | | |
| related derivatives | 1,006 | | 31,610 | |
|
|
|
| |
| Total unrealised mark-to-market deficiton debt securities and related derivatives | – | | (664 | ) |
|
|
|
| |
| | | | | |
| (1) | Including £178m (2002: £414m) of specific and £nil million (2002: £86m) of general provisions. |
The decrease has been driven by sales of assets, generaly at levels better than the market value at 31 December 2002. In total, asset improvement in the year was £151m, including deterioration in certain parts of the portfolio totalling £141m, largely relating to the aircraft asset backed securities.
Since the year-end, £162m of debt securities have been sold, with no overall profit or loss impact.
Fair value of debt securities, equity shares and other similar interests
The following table provides an analysis of the fair value of Abbey’s investment securities by investment category at 31 December 2003. Of the total amortised cost of £1,752m, £657m relates to securities held by Personal Financial Services businesses, and £1,095m relates to securities held by Portfolio Business Unit businesses.
| | Gross | | Gross | | | | | |
| | amortised | | unrealised | | unrealised | | Fair | |
| | cost | | gains | | losses | | value | |
| | £m | | £m | | £m | | £m | |
|
|
|
|
|
|
|
| |
| Equity securities | 19 | | – | | – | | 19 | |
|
|
|
|
|
|
|
| |
| Debt securities issued or | | | | | | | | |
| backed by US treasury and | | | | | | | | |
| other US government | | | | | | | | |
| corporations and agencies | – | | – | | – | | – | |
|
|
|
|
|
|
|
| |
| Debt securities issued or | | | | | | | | |
| backed by foreign governments | – | | – | | – | | – | |
|
|
|
|
|
|
|
| |
| Asset backed and | | | | | | | | |
| corporate debt securities | 1,254 | | 93 | | (43 | ) | 1,304 | |
|
|
|
|
|
|
|
| |
| Mortgage backed securities other than those issued or backed by US government agencies | 42 | | 4 | | (9 | ) | 37 | |
|
|
|
|
|
|
|
| |
| Other debt securities | 437 | | 43 | | – | | 480 | |
|
|
|
|
|
|
|
| |
| | 1,752 | | 140 | | (52 | ) | 1,840 | |
|
|
|
|
|
|
|
| |
Abbey periodicaly reviews its debt securities and equity securities on a case-by-case basis, to determine whether any decline in fair value below the carrying value is an indication of impairment. Among other possible criteria that would lead to a review for impairment, with respect to debt securities and equity securities with readily ascertainable market values, such securities are always reviewed for impairment if the market value of the package (i.e., including the mark-to-market value of any associated swaps) is lower than its cost by more than 10% and the market value of the security is lower than its cost by more than 10%.
The review for impairment of a security includes, among other things, consideration of the credit risk associated with the security (including an assessment of the likelihood of collection of amounts due pursuant to the contractual terms of the security in excess of the cost of the security). Where it is expected that the principal repayments on a security will be below its amortised cost, then an impairment provision is recognised against the cost of the asset and is charged to the Profit and Loss Account.
The assessment methodology for determining whether securities are impaired is based upon management’s perception of whether it is unlikely that an investment, or part of an investment, is capable of being repaid. Such a decision, and the extent of the impairment, are based upon management’s assessment of the most likely amount at risk of non-recovery at some point in the future. This assessment mainly focuses on the principal amount of the relevant asset and considers the future benefits of any proposed restructuring and the value of the underlying business. Previous experiences with other transactions and management’s judgement are used to determine the likely outcome of such events and the likely value based on such factors. Uncertainty exists as the future restructuring details are often not available when the impairment assessment is made and information regarding the value of the underlying business is often restricted and incomplete. Although the market value of the investment is used as an indication of the likely recovery levels, the market value of an investment, assuming one is readily available, can be adversely impacted by external factors such as market liquidity, thus reducing its indicative use. If actual experience differs negatively from the assumptions and other considerations used in the financial statements, unrealised losses may be recognised in the profit and loss account in future periods.
Such an assessment for unrealised losses includes a determination on whether either the market value of the securities or the market value of the package is lower than the book value by more than 10%. In either case, if the market value is lower than the book value byless than 10%, this is deemed to be credit spread widening and not an impairment, with no provision being considered necessary.
The following table provides an analysis of types of securities whose amortised cost exceeds their fair value. Of the total book value of £290m, £286m relates to securities held by Personal Financial Services businesses, and £4m relates to securities held by Portfolio Business Unit businesses.
| 42 | Abbey Annual Report and Accounts 2003 |
Back to Contents
Operating and Financial Review
Operating Review – Portfolio Business Unitcontinued
| | | | | | Maturing in | | Maturing in | | | | | | Non-investment | |
| | | | Maturing | | more than | | more than | | Maturing | | | | grade and | |
| | | | in no | | 1 year but | | 5 years | | in more | | Gross | | notrated | |
| | Book | | more than | | no more than | | but no more | | than 10 | | unrealised | | unrealised | |
| Sector | Value | | 1 year | | 5 years | | than 10 years | | years | | losses | | losses | |
|
|
|
|
|
|
|
|
|
|
|
|
|
| |
| In £m | | | | | | | | | | | | | | |
|
|
|
|
|
|
|
|
|
|
|
|
|
| |
| ABS/MBS | 290 | | 15 | | 29 | | – | | 246 | | 52 | | – | |
|
|
|
|
|
|
|
|
|
|
|
|
|
| |
| CDO | – | | – | | – | | – | | – | | – | | – | |
|
|
|
|
|
|
|
|
|
|
|
|
|
| |
| Corporates | – | | – | | – | | – | | – | | – | | – | |
|
|
|
|
|
|
|
|
|
|
|
|
|
| |
| Sovereigns | – | | – | | – | | – | | – | | – | | – | |
|
|
|
|
|
|
|
|
|
|
|
|
|
| |
| Banks and other financial institutions | – | | – | | – | | – | | – | | – | | – | |
|
|
|
|
|
|
|
|
|
|
|
|
|
| |
| | 290 | | 15 | | 29 | | – | | 246 | | 52 | | – | |
|
|
|
|
|
|
|
|
|
|
|
|
|
| |
The unrealised losses above arise on securities within Abbey’s ongoing Personal Financial Services businesses. These are securities issued by UK housing associations which are described further in the Business Overview. These losses are considered temporary as Abbey has the ability and intent to hold the securities to maturity and Abbey is satisfied that there has been no credit deterioration, particularly as to date Abbey has suffered no defaults on this type of issuer.The unrealised losses arise from changes in interest rates. This is evidenced by the fact that the related derivative hedges, which as they are with Financial Products do not qualify for hedge accounting under FAS 133, have an equal and opposite fair value surplus.
Of the total book value of securities whose book value exceeds their fair value, which totalled £497m at 31 December 2003 (2002: £18,004m), £166m (2002: £15,911m) were valued at over 90% of book value.
Loan portfolio
| | At 31 December 2003 | | At 31 December 2002 | |
|
| |
| |
| | Assets | | RWAs | | Assets | | RWAs | |
| | £bn | | £bn | | £bn | | £bn | |
|
|
|
|
|
|
|
| |
| Infrastructure | 0.6 | | 0.4 | | 1.6 | | 2.2 | |
|
|
|
|
|
|
|
| |
| Project finance: | | | | | | | | |
|
|
|
|
|
|
|
| |
| – real estate | 0.1 | | 0.1 | | 1.5 | | 1.5 | |
|
|
|
|
|
|
|
| |
| – other | 0.9 | | 1.0 | | 1.4 | | 1.8 | |
|
|
|
|
|
|
|
| |
| Acquisition finance | – | | – | | 2.1 | | 1.3 | |
|
|
|
|
|
|
|
| |
| Structured finance lending | 0.4 | | 0.2 | | 1.8 | | 0.4 | |
|
|
|
|
|
|
|
| |
| | 2.0 | | 1.7 | | 8.4 | | 7.2 | |
|
|
|
|
|
|
|
| |
The change in the loan portfolio reflected sales across all portfolios.
Mark-to-market analysis
| | At | | At | |
| | 31 December | | 31 December | |
| | 2003 | | 2002 | |
| | £m | | £m | |
|
|
|
| |
| Loan portfolio and related derivatives | 2,360 | | 8,632 | |
|
|
|
| |
| Less: Provisions(1) | (333 | ) | (264 | ) |
|
|
|
| |
| Book value of loan portfolio and | | | | |
| related derivatives | 2,027 | | 8,368 | |
|
|
|
| |
| Market value of loan portfolio and related derivatives | 1,961 | | 7,877 | |
|
|
|
| |
| Total unrealised mark-to-market deficit | | | | |
| on loan portfolio and related derivatives | (66 | ) | (491 | ) |
|
|
|
| |
| | | | | |
| (1) | Including £160m (2002: £204m) of specific and £173m (2002: £60m) of general provisions. |
| Abbey Annual Report and Accounts 2003 | 43 |
Back to Contents
Operating and Financial Review
Operating Review – Portfolio Business Unitcontinued
The mark-to-market table, which includes a deficit on the related derivatives, indicates the possible fair value of the portfolio assets based on current market conditions and includes an element of general risk assessment relative to net realisable value.
The fall in deficit from the 2002 year end position of £425m, is due to a combination of asset sales, further provisioning and improvement in estimated fair value, in total, of £193m. Power sector exposures that deteriorated in the first six months have recovered in the second half of the year.
Leasing
| | At 31 December 2003 | | At 31 December 2002 | |
|
| |
| |
| | Assets | | RWAs | | Assets | | RWAs | |
| | £bn | | £bn | | £bn | | £bn | |
|
|
|
|
|
|
|
| |
| Finance leases | 2.2 | | 0.6 | | 3.1 | | 1.0 | |
|
|
|
|
|
|
|
| |
| Operating leases | 2.5 | | 2.4 | | 2.6 | | 2.7 | |
|
|
|
|
|
|
|
| |
| | 4.7 | | 3.0 | | 5.7 | | 3.7 | |
|
|
|
|
|
|
|
| |
The finance leasing portfolio is predominantly high quality with over 70% of exposure being to counterparties rated AA or better. The operating lease portfolio principally represents assets held in Porterbrook (£1.9bn) and aircraft leasing (£0.4bn) portfolios. The value of the aircraft leasing business has been written down to net asset value based on current market conditions, while the value of Porterbrook has not yet been confirmed by a full sales process and therefore may well differ from the holding value.
| Private equity |
| | | | | |
| | At | | At | |
| | 31 December | | 31 December | |
| | 2003 | | 2002 | |
| | £m | | £m | |
|
|
|
| |
| Opening balance of draw-downs (net of provisions) | 797 | | 697 | |
|
|
|
| |
| Draw-downs in the current period | 159 | | 311 | |
|
|
|
| |
| Disposals | (445 | ) | (88 | ) |
|
|
|
| |
| New provisions | (138 | ) | (123 | ) |
|
|
|
| |
| Closing balance of draw-downs | 373 | | 797 | |
|
|
|
| |
| Undrawn commitments | 239 | | 672 | |
|
|
|
| |
Of the drawn-down private equity portfolio after provisions, £80m is comprised of US exposures, £37m is direct or quoted investment, with the remainder relating to European (including UK) exposures. The reduction in undrawn commitments is principally due to sales in the period.
An agreement has been reached to sell 77% of the remaining private equity portfolio, representing £289m of assets (net of provisions) and undrawn commitments of £162m. No further loss is expected upon completion as the assets were written down to net realisable value prior to agreement.
The remaining £84m of drawn assets have been written down to management’s estimate of net realisable value. A further £20m of these have been sold since 31 December 2003.
Wholesale Banking exit portfolios – credit exposure analysis
The analysis that follows defines total exposures as being net of specific provisions and includes undrawn commitments. In total these comprise £0.6bn and £0.2bn respectively. In total, approximately 60% of the Wholesale Banking exposures in the Portfolio Business Unit have external ratings.
Credit exposures by credit rating
| | At 31 December 2003 | | At 31 December 2002 | |
|
|
|
|
|
|
|
|
|
|
|
| |
| | | | Average of | | | | | | Average of | | | |
| | Average | | top five | | Total | | Average | | top five | | Total | |
| | exposure | | exposures | (2) | exposure | | exposure | | exposures | | exposure | |
| | £m | | £m | | £bn | | £m | | £m | | £bn | |
|
|
|
|
|
|
|
|
|
|
|
| |
| AAA | 25.7 | | 87.9 | | 0.5 | | 31.0 | | 338.7 | | 15.5 | |
|
|
|
|
|
|
|
|
|
|
|
| |
| AA | 40.0 | | 175.1 | | 1.6 | | 43.0 | | 475.1 | | 7.4 | |
|
|
|
|
|
|
|
|
|
|
|
| |
| A | 20.2 | | 107.9 | | 0.9 | | 46.6 | | 299.6 | | 13.6 | |
|
|
|
|
|
|
|
|
|
|
|
| |
| BBB | 23.7 | | 141.4 | | 1.3 | | 32.1 | | 376.9 | | 8.5 | |
|
|
|
|
|
|
|
|
|
|
|
| |
| Total investment grade | | | | | 4.3 | | | | | | 45.0 | |
|
|
|
|
|
|
|
|
|
|
|
| |
| BB | 17.2 | | 49.4 | | 0.5 | | 17.1 | | 59.9 | | 1.6 | |
|
|
|
|
|
|
|
|
|
|
|
| |
| B | 15.1 | | 41.3 | | 0.4 | | 14.8 | | 43.5 | | 0.6 | |
|
|
|
|
|
|
|
|
|
|
|
| |
| CCC | 14.5 | | 42.1 | | 0.4 | | 13.5 | | 43.6 | | 0.6 | |
|
|
|
|
|
|
|
|
|
|
|
| |
| Total sub-investment grade | | | | | 1.3 | | | | | | 2.8 | |
|
|
|
|
|
|
|
|
|
|
|
| |
| Equity | n/a | | n/a | | 0.5 | | n/a | | n/a | | 0.9 | |
|
|
|
|
|
|
|
|
|
|
|
| |
| Total exposure(1) | | | | | 6.1 | | | | | | 48.7 | |
|
|
|
|
|
|
|
|
|
|
|
| |
| | |
(1)
| Total exposure of £6.1bn is £2.2bn lower than total assets of £8.3bn. This results mainlyfrom the exposure amounts including amounts due from leasing counterparties rather than the asset value of leasing businesses (£(1.7)bn) and the small exposure in respect of the Newark Junior note,rather than the assets held within the structure (£(0.6)bn). |
| (2) | Insome instances there are now less than five individual counterparties. In these cases a true average is reported, which results in an apparent disconnect between the average of the top five and the total exposure. |
| 44 | Abbey Annual Report and Accounts 2003 |
Back to Contents
Operating and Financial Review
Operating Review – Portfolio Business Unitcontinued
Total exposures were reduced by £42.6bn to £6.1bn since 31 December 2002. Significant asset reductions were evident across all ratings, with notable reductions in terms of bank exposures and asset-backed and mortgage-backed securities. Progress has been made in reducing single counterparty exposures.
Sub-investment grade exposures were reduced by £1.5bn. However, £573m of sub-investment grade exposures have migrated from investment grade during 2003, excluding which the underlying movement is £2.1bn or 75%. Of the sub-investment grade exposures 42% are accounted for by Project Finance, (principally UK and US power),15% in asset-backed securities, of which over half have been sold since the year end, with the balance representing infrastructure finance, and finance and operating lease exposures.
AAA, AA and A grade by exposure type
| | At 31 December 2003 | | At 31 December 2002 | |
|
|
|
|
|
|
|
| |
| | Average | | | | Average | | | |
| | of top five | | Total | | of top five | | Total | |
| | exposures | (1) | exposure | | exposures | | exposure | |
| | £m | | £bn | | £m | | £bn | |
|
|
|
|
|
|
|
| |
| Banks and financial | | | | | | | | |
| institutions | 181.8 | | 1.7 | | 461.6 | | 13.1 | |
|
|
|
|
|
|
|
| |
| Sovereign | 128.2 | | 0.3 | | 265.3 | | 1.6 | |
|
|
|
|
|
|
|
| |
| Corporates | 95.3 | | 0.6 | | 186.0 | | 2.9 | |
|
|
|
|
|
|
|
| |
| Asset finance | 52.9 | | 0.3 | | 148.6 | | 2.0 | |
|
|
|
|
|
|
|
| |
| Asset-backed/mortgage- | | | | | | | | |
| backed securities | 14.8 | | 0.1 | | 246.7 | | 16.9 | |
|
|
|
|
|
|
|
| |
| Total exposure | | | 3.0 | | | | 36.5 | |
|
|
|
|
|
|
|
| |
| | |
| (1) | In some instances there are now less than five individualcounterparties. In the secases a true average is reported, which results in an apparent disconnect between the average of the top five and the total exposure. |
Exposure to AAA to A- graded investments fell by 92% to £3.0bn, including a £16.8bn reduction in our exposure to asset-backed and mortgage-backed securities and a £11.4bn reduction in our exposure to outstandings to Banks and Financial Institutions. All of the remaining sovereign exposures are to either the UK or US.The largest corporate exposures relate to established oil and gas, utility and automotive corporations.
| Abbey Annual Report and Accounts 2003 | 45 |
Back to Contents
Operating and Financial Review
Operating Review – Portfolio Business Unitcontinued
| BBB grade by exposure type |
| | At 31 December 2003 | | At 31 December 2002 | |
|
|
|
|
|
|
|
|
|
|
|
| |
| | | | Average | | | | | | Average | | | |
| | Specific | | of top five | | Total | | Specific | | of top five | | Total | |
| | provisions | | exposures | (1) | exposure | | provisions | | exposures | | exposure | |
| | £m | | £m | | £bn | | £m | | £m | | £bn | |
|
|
|
|
|
|
|
|
|
|
|
| |
| Banks and financial institutions | – | | 0.1 | | – | | – | | 39.4 | | 0.4 | |
|
|
|
|
|
|
|
|
|
|
|
| |
| Sovereign | – | | – | | – | | – | | 70.7 | | 0.3 | |
|
|
|
|
|
|
|
|
|
|
|
| |
| Corporates | – | | 10.1 | | 0.1 | | – | | 218.8 | | 2.3 | |
|
|
|
|
|
|
|
|
|
|
|
| |
| Asset finance | – | | 141.4 | | 1.2 | | 1.0 | | 298.8 | | 4.4 | |
|
|
|
|
|
|
|
|
|
|
|
| |
| Asset-backed/mortgage-backed securities | – | | 9.9 | | – | | 58.0 | | 92.2 | | 1.1 | |
|
|
|
|
|
|
|
|
|
|
|
| |
| Total exposure | – | | | | 1.3 | | 59.0 | | | | 8.5 | |
|
|
|
|
|
|
|
|
|
|
|
| |
| | |
| (1) | In some instances there are now less than five individual counterparties. In these cases a true average is reported, which results in an apparent disconnect between the average ofthe top five and the total exposure. |
Exposures to BBB graded investments fell by 85% to £1.3bn, including the disposal of all BBB rated sovereign exposures during the first six months of 2003.
Corporate exposures have fallen by 96% to £0.1bn.
Asset finance exposures have also fallen, by 73% to £1.2bn, due to sales in the Project Finance and Infrastructure portfolios.The top five Asset finance exposures relate to Porterbrook and UK infrastructure projects.
Credit exposures by sector
| | | | | | | | | | Gross | | | | | |
| | Average | | | | Sub- | | Total | | exposure | | | | | |
| | of top five | | Investment | | investment | | (net of | | with specific | | Market | | Specific | |
| | exposures | | grade | | grade | | provisions) | | provisions | | value | | provisions | |
| At 31 December 2003 | £m | | £bn | | £bn | | £bn | | £m | | £m | | £m | |
|
|
|
|
|
|
|
|
|
|
|
|
|
| |
| Banks and financial institutions | 181.8 | | 1.7 | | – | | 1.7 | | – | | – | | – | |
|
|
|
|
|
|
|
|
|
|
|
|
|
| |
| Sovereign | 128.2 | | 0.3 | | – | | 0.3 | | – | | – | | – | |
|
|
|
|
|
|
|
|
|
|
|
|
|
| |
| Corporates: | | | | | | | | | | | | | | |
|
|
|
|
|
|
|
|
|
|
|
|
|
| |
| – Utilities, energy and natural resources – Other | 64.0 | | 0.3 | | – | | 0.3 | | – | | – | | – | |
|
|
|
|
|
|
|
|
|
|
|
|
|
| |
| – Aero, defence and airlines | 20.6 | | – | | 0.1 | | 0.1 | | – | | – | | – | |
|
|
|
|
|
|
|
|
|
|
|
|
|
| |
| – Telecoms | – | | – | | – | | – | | – | | – | | – | |
|
|
|
|
|
|
|
|
|
|
|
|
|
| |
| – Manufacturing and transport | 56.9 | | 0.3 | | 0.1 | | 0.4 | | – | | – | | – | |
|
|
|
|
|
|
|
|
|
|
|
|
|
| |
| | | | | | | | | | | | | | | |
| – Other | 25.5 | | 0.1 | | – | | 0.1 | | – | | – | | – | |
|
|
|
|
|
|
|
|
|
|
|
|
|
| |
| Asset Finance: | | | | | | | | | | | | | | |
|
|
|
|
|
|
|
|
|
|
|
|
|
| |
| – Project finance (excl. property) | 43.4 | | 0.1 | | 0.6 | | 0.7 | | 550.0 | | 395.0 | | 155.0 | |
|
|
|
|
|
|
|
|
|
|
|
|
|
| |
| – Property | 45.7 | | 0.2 | | 0.1 | | 0.3 | | 34.0 | | 31.0 | | 3.0 | |
|
|
|
|
|
|
|
|
|
|
|
|
|
| |
| – Infrastructure finance | 63.7 | | 0.5 | | 0.1 | | 0.6 | | 180.0 | | 158.0 | | 22.0 | |
|
|
|
|
|
|
|
|
|
|
|
|
|
| |
| – Operating leasing | 132.8 | | 0.7 | | 0.1 | | 0.8 | | – | | – | | – | |
|
|
|
|
|
|
|
|
|
|
|
|
|
| |
| ABS/MBS: | | | | | | | | | | | | | | |
|
|
|
|
|
|
|
|
|
|
|
|
|
| |
| – Asset / mortgage-backed | 42.5 | | 0.1 | | 0.2 | | 0.3 | | 41.0 | | 16.0 | | 25.0 | |
|
|
|
|
|
|
|
|
|
|
|
|
|
| |
| – CDOs | 8.8 | | – | | – | | – | | 8.0 | | – | | 8.0 | |
|
|
|
|
|
|
|
|
|
|
|
|
|
| |
| – Federal agency | – | | – | | – | | – | | | | | | – | |
|
|
|
|
|
|
|
|
|
|
|
|
|
| |
| – Stressed airplanes | 39.6 | | – | | – | | – | | 194.0 | | 139.0 | | 55.0 | |
|
|
|
|
|
|
|
|
|
|
|
|
|
| |
| Credit exposure | | | 4.3 | | 1.3 | | 5.6 | | | | | | 268.0 | |
|
|
|
|
|
|
|
|
|
|
|
|
|
| |
| Equity related (excl. undrawns) | | | – | | 0.5 | | 0.5 | | 611.0 | | 280.0 | | 331.0 | (1) |
|
|
|
|
|
|
|
|
|
|
|
|
|
| |
| Total exposure | | | 4.3 | | 1.8 | | 6.1 | | | | | | 599.0 | |
|
|
|
|
|
|
|
|
|
|
|
|
|
| |
|
|
|
|
|
|
|
|
|
|
|
|
|
| |
| 46 | Abbey Annual Report and Accounts 2003 |
Back to Contents
Operating and Financial Review
Operating Review – Portfolio Business Unitcontinued
| | | | | | | | | | Gross | | | | | |
| | Average | | | | Sub- | | Total | | exposure | | | | | |
| | of top five | | Investment | | investment | | (net of | | with specific | | Market | | Specific | |
| | exposures | | grade | | grade | | provisions) | | provisions | | value | | provisions | |
| At 31 December 2002 | £m | | £bn | | £bn | | £bn | | £m | | £m | | £m | |
|
|
|
|
|
|
|
|
|
|
|
|
|
|
|
| Banks and financial institutions | 461.6 | | 13.5 | | 0.1 | | 13.6 | | 55.0 | | 15.0 | | 37.0 | |
|
|
|
|
|
|
|
|
|
|
|
|
|
|
|
| Sovereign | 308.9 | | 1.9 | | – | | 1.9 | | – | | – | | – | |
|
|
|
|
|
|
|
|
|
|
|
|
|
|
|
| Corporates: | | | | | | | | | | | | | | |
|
|
|
|
|
|
|
|
|
|
|
|
|
|
|
| – Utilities, energy and natural resources – Other | 149.6 | | 1.0 | | – | | 1.0 | | 25.0 | | – | | 25.0 | |
|
|
|
|
|
|
|
|
|
|
|
|
|
|
|
| – Utilities, energy and natural resources – Enron | 16.0 | | – | | – | | – | | 16.0 | | – | | 15.0 | |
|
|
|
|
|
|
|
|
|
|
|
|
|
|
|
| – Aero, defence and airlines | 26.0 | | 0.1 | | 0.1 | | 0.2 | | – | | – | | – | |
|
|
|
|
|
|
|
|
|
|
|
|
|
|
|
| – Telecoms | 87.9 | | 0.5 | | 0.1 | | 0.6 | | 312.0 | | 155.0 | | 155.0 | |
|
|
|
|
|
|
|
|
|
|
|
|
|
|
|
| – Manufacturing and transport | 210.3 | | 1.3 | | 0.1 | | 1.4 | | 42.0 | | 18.0 | | 21.0 | |
|
|
|
|
|
|
|
|
|
|
|
|
|
|
|
| – Other | 125.7 | | 2.2 | | 0.9 | | 3.1 | | 7.0 | | 2.0 | | 5.0 | |
|
|
|
|
|
|
|
|
|
|
|
|
|
|
|
| Asset finance: | | | | | | | | | | | | | | |
|
|
|
|
|
|
|
|
|
|
|
|
|
|
|
| – Project finance (excl. property) | 64.2 | | 1.3 | | 0.6 | | 1.9 | | 560.0 | | 351.0 | | 167.0 | |
|
|
|
|
|
|
|
|
|
|
|
|
|
|
|
| – Property | 122.9 | | 1.4 | | 0.1 | | 1.5 | | – | | – | | – | |
|
|
|
|
|
|
|
|
|
|
|
|
|
|
|
| – Infrastructure finance | 236.5 | | 2.9 | | 0.2 | | 3.1 | | – | | – | | – | |
|
|
|
|
|
|
|
|
|
|
|
|
|
|
|
| – Operating leasing | 176.9 | | 0.9 | | 0.2 | | 1.1 | | – | | – | | – | |
|
|
|
|
|
|
|
|
|
|
|
|
|
|
|
| ABS/MBS: | | | | | | | | | | | | | | |
|
|
|
|
|
|
|
|
|
|
|
|
|
|
|
| – Asset / mortgage-backed | 175.5 | | 12.8 | | 0.3 | | 13.1 | | 90.0 | | 23.0 | | 46.0 | |
|
|
|
|
|
|
|
|
|
|
|
|
|
|
|
| – CDOs | 126.8 | | 3.8 | | 0.1 | | 3.9 | | 349.0 | | 264.0 | | 62.0 | |
|
|
|
|
|
|
|
|
|
|
|
|
|
|
|
| – Federal agency | 251.3 | | 0.8 | | – | | 0.8 | | – | | – | | – | |
|
|
|
|
|
|
|
|
|
|
|
|
|
|
|
| – Stressed airplanes | 79.4 | | 0.6 | | – | | 0.6 | | 134.0 | | 89.0 | | 30.0 | |
|
|
|
|
|
|
|
|
|
|
|
|
|
|
|
| Credit exposure | | | 45.0 | | 2.8 | | 47.8 | | | | | | 563.0 | |
|
|
|
|
|
|
|
|
|
|
|
|
|
|
|
| Equity related (excl. undrawns) | | | – | | 0.9 | | 0.9 | | 1,021 | | 893.0 | | 182.0 | (1) |
|
|
|
|
|
|
|
|
|
|
|
|
|
|
|
| Total exposure | | | 45.0 | | 3.7 | | 48.7 | | | | | | 745.0 | |
|
|
|
|
|
|
|
|
|
|
|
|
|
|
|
| | |
| (1) | Balance includes £69m (2002: £55m) specific provisions relating to the Newark collateralised bond obligations. |
ABS/MBS exposures fell from £13.7bn to £0.3bn during the year.
| Abbey Annual Report and Accounts 2003 | 47 |
Back to Contents
Operating and Financial Review
Operating Review – Portfolio Business Unitcontinued
Additional sector analysis
| | At | | At | |
| | 31 December | | 31 December | |
| | 2003 | | 2002 | |
| Aircraft | £m | | £m | |
|
|
|
| |
| IEM Airfinance BV | 174 | | 221 | |
|
|
|
| |
| Asset-backed securities | 183 | | 762 | |
|
|
|
| |
| Other(including operating leases) | 82 | | 194 | |
|
|
|
| |
| | 439 | | 1,177 | |
|
|
|
| |
Overall, aircraft exposures (net of provisions) fell by 63% to £439m. Aircraft asset-backed securities exposures were reduced by 76% to £183m during 2003 reflecting asset sales and additional credit provisions raised. Other aircraft exposure fell from £194m to £82m.
The IEM Airfinance BV and Other credit exposures above result from an exposure to lessees for the unexpired portion of the current leases. These leases are represented in the balance sheet at a net book value of £403m after impairment charges for the year of £64m.
Since the year end, a further £133m of asset-backed securities have been sold.
| | At | | At | |
| | 31 December | | 31 December | |
| US and UK powerlending | 2003 | | 2002 | |
|
|
|
| |
| UK | 221 | | 314 | |
|
|
|
| |
| US | 350 | | 818 | |
|
|
|
| |
| | 571 | | 1,132 | |
|
|
|
| |
| Of which: | | | | |
|
|
|
| |
| Power projects lending on credit watch | 360 | | 351 | |
|
|
|
| |
Within the Project Finance portfolio exposure to power projects fell by 50% to £571m. This included a 30% fall in UK exposure and a 57% fall in US power exposure. Provisions against UK and US Power projects were £80m and £69m respectively.
Credit exposures by region
| | | | Sub- | | | |
| | Investment | | investment | | | |
| | grade | | grade | | Total | |
| At 31 December 2003 | £bn | | £bn | | £bn | |
|
|
|
|
|
| |
| Europe | 3.4 | | 1.0 | | 4.4 | |
|
|
|
|
|
| |
| North America | 0.8 | | 0.6 | | 1.4 | |
|
|
|
|
|
| |
| Asia-pacific | 0.1 | | 0.1 | | 0.2 | |
|
|
|
|
|
| |
| Latin America | – | | 0.1 | | 0.1 | |
|
|
|
|
|
| |
| Middle East | – | | – | | – | |
|
|
|
|
|
| |
| Total exposure | 4.3 | | 1.8 | | 6.1 | |
|
|
|
|
|
| |
| | | | | | | |
| | | | Sub- | | | |
| | Investment | | investment | | | |
| | grade | | grade | | Total | |
| At 31 December 2002 | £bn | | £bn | | £bn | |
|
|
|
|
|
| |
| Europe | 20.2 | | 2.3 | | 22.5 | |
|
|
|
|
|
| |
| North America | 22.0 | | 1.2 | | 23.2 | |
|
|
|
|
|
| |
| Asia-pacific | 2.6 | | 0.1 | | 2.7 | |
|
|
|
|
|
| |
| Latin America | – | | 0.1 | | 0.1 | |
|
|
|
|
|
| |
| Middle East | 0.2 | | – | | 0.2 | |
|
|
|
|
|
| |
| Total exposure | 45.0 | | 3.7 | | 48.7 | |
|
|
|
|
|
| |
The majority of the £42.6bn fall in exposure during 2003 occurred in North America (£21.8bn) and Europe (£18.1bn). The fall in North American exposure is due to sales of investment securities, predominantly asset backed securities, collateralised debt obligations and corporate bonds.
In addition to sales of investment securities, the £18.1bn fall in European exposures includes significant sales of Acquisition Finance, Project Finance, Infrastructure and Property transactions.
Exposures in the Asia-pacific region fell 93% to £0.2bn of which £0.7bn represents sales in sovereign debt.
Sub-investment grade credit exposure
| | At 31 December 2003 | | At 31 December 2002 | |
|
|
|
|
|
|
|
|
|
|
|
| |
| | | | Average | | | | | | Average | | | |
| | Specific | | of top five | | Total | | Specific | | of top five | | Total | |
| | provisions | | exposures | (1) | exposure | | provisions | | exposures | | exposure | |
| | £m | | £m | | £bn | | £m | | £m | | £bn | |
|
|
|
|
|
|
|
|
|
|
|
| |
| Banks and financial institutions | – | | – | | – | | 37.0 | | 18.6 | | 0.1 | |
|
|
|
|
|
|
|
|
|
|
|
| |
| Corporates | – | | 37.0 | | 0.2 | | 52.0 | | 50.4 | | 1.2 | |
|
|
|
|
|
|
|
|
|
|
|
| |
| Asset Finance | 180.0 | | 49.0 | | 0.9 | | 167.0 | | 59.4 | | 1.1 | |
|
|
|
|
|
|
|
|
|
|
|
| |
| ABS / MBS | 88.0 | | 40.5 | | 0.2 | | 80.0 | | 27.8 | | 0.4 | |
|
|
|
|
|
|
|
|
|
|
|
| |
| Credit exposure | 268.0 | | | | 1.3 | | 336.0 | | | | 2.8 | |
|
|
|
|
|
|
|
|
|
|
|
| |
| High yield | 69.0 | | – | | 0.1 | | 223.0 | | 38.3 | | 0.1 | |
|
|
|
|
|
|
|
|
|
|
|
| |
| Private equity (excluding undrawns) | 262.0 | | | | 0.4 | | 127.0 | | | | 0.8 | |
|
|
|
|
|
|
|
|
|
|
|
| |
| Total exposure | 599.0 | | | | 1.8 | | 686.0 | | | | 3.7 | |
|
|
|
|
|
|
|
|
|
|
|
| |
| | |
| (1) | In some instances there are now less than five individual counterparties. In these cases a true average is reported, which results in an apparent disconnect between the average of the top five and the total exposure. |
| 48 | Abbey Annual Report and Accounts 2003 |
Back to Contents
Operating and Financial Review
Operating Review – Portfolio Business Unitcontinued
Sub-investment grade exposures fell 51% to £1.8bn. This was predominantly due to reduced corporate exposures, primarily driven by a £1.0bn reduction in corporates and a £0.2bn reduction in asset backed securities.
Excluding the effect of downward credit migration and equity positions, there has been a 75% reduction in sub-investment grade credit exposure from £2.8bn at 31 December 2002 to £0.7bn at 31 December 2003. The largest remaining asset class is Asset Finance, in which the principal areas of exposure are Project Finance (£576m), Infrastructure (£150m) and IEM Aircraft Leasing (£120m).
85% of £0.2bn of asset-backed / mortgage-backed securities exposure remaining at the end of 2003 was accounted for by aircraft asset-backed securities, of which £133m has been sold during early 2004.
High yield securities
| | At | | At | |
| | 31 December | | 31 December | |
| | 2003 | | 2002 | |
| | £bn | | £bn | |
|
|
|
| |
| Opening asset balance (net of provisions) | 0.8 | | 1.2 | |
|
|
|
| |
| Less: | | | | |
|
|
|
| |
| Asset disposals (net of disposals) | (0.1 | ) | (0.3 | ) |
|
|
|
| |
| Additional provisions | – | | (0.1 | ) |
|
|
|
| |
| High yield securities assets | 0.7 | | 0.8 | |
|
|
|
| |
| Amount covered by credit protection | | | | |
| through the Collateralised Bond Obligation | (0.6 | ) | (0.7 | ) |
|
|
|
| |
| High yield securities exposure | 0.1 | | 0.1 | |
|
|
|
| |
The net exposure to the Junior Note of the Newark collateralised bond obligation is £31m. Dependent on portfolio performance, Abbey remains liable to extra-margin contribution of up to £62m in respect of Newark.
First National
| | At 31 December 2003 | | At 31 December 2002 | |
|
|
|
|
|
|
|
| |
| | | | Risk | | | | Risk | |
| | | | weighted | | | | weighted | |
| | Assets | | assets | | Assets | | assets | |
| | £bn | | £bn | | £bn | | £bn | |
|
|
|
|
|
|
|
| |
| Consumer and | | | | | | | | |
| retail finance lending | – | | – | | 4.8 | | 3.9 | |
|
|
|
|
|
|
|
| |
| Motor finance(1) | 1.8 | | 2.1 | | 2.9 | | 3.6 | |
|
|
|
|
|
|
|
| |
| | | | | | | | | |
| Litigation finance | 0.3 | | 0.3 | | 0.3 | | 0.3 | |
|
|
|
|
|
|
|
| |
| Total First National | 2.1 | | 2.4 | | 8.0 | | 7.8 | |
|
|
|
|
|
|
|
| |
| | |
| (1) | First National Risk weighted assets exceed the value of assets due to the regulatory treatment of the joint venture with Peugeot, whereby 100% of assets are included for regulatory purposes. |
The Consumer and Retail Finance businesses were sold to GE Consumer Finance in April 2003. Motor Finance is now closed to new business, with further reductions in asset balances expected over the next two years. The loss for the year of £(50)m (2002: £(254)m) includes redundancy costs and other restructuring costs associated with the wind-down of the business.
The Litigation Finance performance has been impacted by increased provisioning levels as a result of developments in this market.
There remains a risk offurther provisioning in this business, dependant on credit recovery developments.
Other
International life assurance businesses
| | At | | At | |
| | 31 December | | 31 December | |
| | 2003 | | 2002 | |
| | £m | | £m | |
|
|
|
| |
| Loss before tax | (26 | ) | (92 | ) |
|
|
|
| |
| Embedded value asset | 192 | | 192 | |
|
|
|
| |
| New business premiums | 226 | | 874 | |
|
|
|
| |
The Dublin-based international life assurance businesses have now been largely closed to new business. The loss before tax of £(26)m (2002: £(92)m has been impacted by non-recurring rationalisation costs and changes in assumptions used in the calculation of embedded value.
From 1 January 2005, the results of Scottish Provident Life Assurance Limited included in the table above will be reclassified to Personal Financial Services since, following restructuring, the business will support ongoing Personal Financial Services product offerings.
European operations and other
| | At | | At | |
| | 31 December | | 31 December | |
| | 2003 | | 2002 | |
| | £m | | £m | |
|
|
|
| |
| Profit/(loss) before tax: | | | | |
|
|
|
| |
| – Abbey National Bank Italy | 54 | | 3 | |
|
|
|
| |
| – Abbey National France | 8 | | 3 | |
|
|
|
| |
| – Other | (36 | ) | 2 | |
|
|
|
| |
| Profit before tax | 26 | | 8 | |
|
|
|
| |
| Assets: | | | | |
|
|
|
| |
| Abbey National France | 1,827 | | 1,310 | |
|
|
|
| |
| Abbey National Bank Italy | – | | 1,932 | |
|
|
|
| |
| Other | 82 | | 200 | |
|
|
|
| |
| Total assets | 1,909 | | 3,442 | |
|
|
|
| |
The profit before tax of £26m principally reflects the profit on the sale of Abbey National Bank Italy to UniCredito Italiano SpA on 30 December 2003. The remaining assets relate to Abbey National France, which continues to trade profitably.The agreement to sell Royal Saint Georges Banque announced in December 2003 is at a premium to net asset value, and is subject to regulatory and Banque de France approval. The “other” loss represents further product-related provisioning, with costs incurred in closing certain businesses.
| Abbey Annual Report and Accounts 2003 | 49 |
Back to Contents
Operating and Financial Review
Other Material Items
| Impact of embedded value charges and rebasing | |
| | | | | | | | | | | | | | | | | | 31 December | |
| | | | | | 31 December 2003 | | | | | | 31 December 2002 | | 2001 | |
|
|
|
|
|
|
|
|
|
|
|
|
|
|
|
|
|
|
|
| | AN | | Scottish | | Scottish | | | | AN | | Scottish | | Scottish | | | | | |
| | Life | | Mutual | | Provident | | Total | | Life | | Mutual | | Provident | | Total | | Total | |
| | £m | | £m | | £m | | £m | | £m | | £m | | £m | | £m | | £m | |
|
|
|
|
|
|
|
|
|
|
|
|
|
|
|
|
|
|
|
| Investment assumptions and variances | 26 | | (122 | ) | (22 | ) | (118 | ) | (45 | ) | (143 | ) | (93 | ) | (281 | ) | (236 | ) |
|
|
|
|
|
|
|
|
|
|
|
|
|
|
|
|
|
|
|
| Guaranteed liability / market value adjustments | – | | 57 | | (60 | ) | (3 | ) | – | | (326 | ) | – | | (326 | ) | (172 | ) |
|
|
|
|
|
|
|
|
|
|
|
|
|
|
|
|
|
|
|
| Provision required with respect to the | | | | | | | | | | | | | | | | | | |
| shareholders’ liability for “realistic” balance | | | | | | | | | | | | | | | | | | |
| sheet position | – | | (273 | ) | (100 | ) | (373 | ) | – | | – | | – | | – | | – | |
|
|
|
|
|
|
|
|
|
|
|
|
|
|
|
|
|
|
|
| Change in equity backing assumption | – | | – | | – | | – | | (3 | ) | (30 | ) | (28 | ) | (61 | ) | – | |
|
|
|
|
|
|
|
|
|
|
|
|
|
|
|
|
|
|
|
| Scottish Provident contingent loan provision | – | | – | | (80 | ) | (80 | ) | – | | – | | – | | – | | – | |
|
|
|
|
|
|
|
|
|
|
|
|
|
|
|
|
|
|
|
| Other one-off adjustments | – | | 131 | | – | | 131 | | 16 | | 18 | | 81 | | 115 | | – | |
|
|
|
|
|
|
|
|
|
|
|
|
|
|
|
|
|
|
|
| Total embedded value charges and rebasing | 26 | | (207 | ) | (262 | ) | (443 | ) | (32 | ) | (481 | ) | (40 | ) | (553 | ) | (408 | ) |
|
|
|
|
|
|
|
|
|
|
|
|
|
|
|
|
|
|
|
| | | | | | | | | | | | | | | | | | | |
Investment assumptions and variances
This consists of the adjustment to period end market values and the results of the move to an active basis. Approximately one half of the Scottish Mutual charge of £122m arises out of the move from assumed asset mix to actual asset mix under the new active basis of modelling described in the basis of results presentation. The adjustment to period end market values in 2002 was driven by the significant falls in equity markets. While equity markets have improved in 2003, which has benefited Abbey National Life in particular, the fall in fixed-interest prices at the end of 2003 has had a more significant effect on Scottish Mutual and Scottish Provident.
As set out above, investment assumptions have now been set on an active basis for 2003. 2002 figures have not been restated for the new treatment. Overall, the reduction in the discounted value of future profits arising from lower assumed investment returns going forward is offset by the lower risk discount rate used.
Guaranteed liability / market value adjustments
Significant provisions were made in 2002 with respect to guaranteed annuity and market value adjustment free liabilities. Hedges were also taken out to reduce the volatility of these liabilities. The credit in Scottish Mutual in 2003 represents the benefit of lower assumed bonuses (and consequently guarantee liabilities) partly offset by the effect of lower market levels when the hedges were finalised as compared with the 2002 year end position. Having made significant progress in 2002 to address the shortfall in value in relation to guaranteed annuity options (GAOs) and market value adjustments, the £60m charge in Scottish Provident relates in part to other products not captured by the 2002 review, together with the effect of lower market levels when the hedges were transacted.
Provision required with respect to the shareholders liability for “realistic” balance sheet position.
Provisions of £273m and £100m have been made with respect to potential shareholder support for the Scottish Mutual and Scottish Provident with-profit funds respectively based on the position, prior to existing capital support, expected to be shown in the “realistic” balance sheets to be prepared by 31 March 2004 as part of the new forthcoming Financial Services Authority regulations with respect to the solvency of Life companies. These balance sheets are not yet finalised and their method of calculation remains subject to change as the Financial Services Authority and the Life industry evolves its practices under the new regimes.
Early analysis of the “realistic” balance sheet position of Scottish Mutual indicates that the “realistic” position is likely to be better than shown on the statutory basis. With respect to the current assessment of Scottish Provident, there is likely to be a “realistic” balance sheet liability higher than the statutory position due to a higher assessment of guarantee costs. The provision now being made represents an initial assessment of the potential cost to Abbey’s life companies of supporting the realistic liabilities. The extent of the
support will depend on the final Financial Services Authority position on these matters.
There remains considerable uncertainty as to the effect on the shareholder of the new regime and a significant project is underway to establish ongoing arrangements, including finalising the “realistic” balance sheets and assessing how much of the cost of both supporting liabilities and any additional capital needed under the Financial Services Authority’s new requirements will be borne by the shareholder and policyholder respectively. Until this project is complete and agreement reached with all parties, including the Financial Services Authority, it is not possible to confirm the quantum of this provision. The amount being provided represents management’s current estimate of the potential cost to the shareholder though it remains possible that the final cost to Abbey is higher or lower than the amount provided by a significant margin.
Abbey’s specific exposure reflects its expansion into the “with-profits” arena between 1997 and 2001, with a large proportion of new business written with guarantees for customers at a time when market values were significantly higher than they are today. In addition, Abbey’s life companies do not have large “orphan estates” to cushion subsequent fals in asset values.
In addition to the provision, there remains a possibility that additional capital will need to be injected, though preliminary estimates indicate that any such amount will be modest in the context of the injections made in the past two years.
It is our current intention to publish more information concerning the “realistic” balance sheets and related requirements for action once the outcome of the project mentioned above is completed.
Change in equity backing assumption
The charge of £61m in 2002 relates to the effect on the discounted value of future profits of the reduction in the assumed equity backing ratio from 70% to 30%. The move to an active investment assumption base in 2003 means that the actual equity backing ratio is used with the effect of moving to this basis included within the investment assumptions and variances commented on above.
Scottish Provident contingent loan provision
As reported at the half year, a provision of £80m has been made with respect to tax law changes affecting the Scottish Provident contingent loan set up as part of the acquisition structure.
Other one-off adjustments
The credit in 2003 represents the grossed-up value of a one-off group relief adjustment relating to the prior year.
The credit in 2002 represents the benefit of the reduced asset management costs arising from the move of responsibility for asset management of the Scottish Provident funds from Aberdeen Asset Managers to Abbey National Asset Managers. No adjustment arises from the temporary transfer of asset management responsibility to State Street Global Advisors announced early in 2004 pending the move to a multi-manager approach later this year.
| 50 | Abbey Annual Report and Accounts 2003 |
Back to Contents
Operating and Financial Review
Other Material Items continued
| Re-organisation expenses | | | | | | |
| | 31 December | | 31 December | | 31 December | |
| | 2003 | | 2002 | | 2001 | |
| | £m | | £m | | £m | |
|
|
|
|
|
|
|
| Cost reduction programme | (148 | ) | (34 | ) | – | |
|
|
|
|
|
|
|
| Strategic and regulatory change | (26 | ) | – | | – | |
|
|
|
|
|
|
|
| Asset write-downs | (141 | ) | – | | – | |
|
|
|
|
|
|
|
| Total re-organisation expenses | (315 | ) | (34 | ) | – | |
|
|
|
|
|
|
|
| | | | | | | |
| Cost programme expenses of £148m (2002: £34m) represent the current period implementation costs of specific projects aiming to deliver in excess of £200m annualised cost savings by 2005. |
| Expenses in relation to the strategic restructuring programme and regulatory change projects totalled £26m (2002: £nil), including: |
| costs in relation to implementing the new strategy, of which £6m was business re-launch spend, with the balance including training of branch staff following the salesforce restructuring, and an element of consultancy spend; and |
| costs associated with mandatory regulatory change programmes including International Financial Reporting Standards and Basel II of £9m. These costs are expected to be more significant in 2004. |
Of the re-organisation cost before asset write-downs, £75m relates to employment costs, of which redundancy is the largest component. The balance relates to property, Information Technology and consultancy spend. |
| Asset write-down adjustments of £141m primarily relate to the expensing of costs previously capitalised, in relation to the outsourced processing platforms for mortgages and insurance. The further write-down in the second half of the year of £69m (2003 Half 1: £72m), represents substantially all the remaining capitalised development costs relating to joint ventures, following completion of the reviews into these projects, and marks a shift to a more conservative stance. Of the write-down in the year, £88m related to the EDS joint venture for mortgage processing and £36m related to the general insurance platform development with Capita Eastgate. |
| | |
| Goodwill charges | | | | | | |
| | 31 December | | 31 December | | 31 December | |
| | 2003 | | 2002 | | 2001 | |
| | £m | | £m | | £m | |
|
|
|
|
|
|
|
| Goodwill amortisation | (18 | ) | (64 | ) | (36 | ) |
|
|
|
|
|
|
|
| Goodwill impairment | (10 | ) | (747 | ) | – | |
|
|
|
|
|
|
|
| Total goodwill charges | (28 | ) | (811 | ) | (36 | ) |
|
|
|
|
|
|
|
Goodwill charges of £28m were significantly lower than 2002. The 2003 charge comprises mainly the ongoing amortisation charge in relation to Scottish Provident, while 2002 primarily included £604m of goodwill impairment charges relating to Scottish Provident.
| Pension fund deficit | | | | | | |
| | 31 December | | 31 December | | 31 December | |
| | 2003 | | 2002 | | 2001 | |
| | £m | | £m | | £m | |
|
|
|
|
|
|
|
| Regular cost | 75 | | 85 | | 73 | |
|
|
|
|
|
|
|
| Amortisation of surpluses | | | | | | |
| arising on pension schemes | – | | (3 | ) | (9 | ) |
|
|
|
|
|
|
|
| Amortisation of deficits arising | | | | | | |
| on pension schemes | 45 | | 16 | | 8 | |
|
|
|
|
|
|
|
| Amortisation of surplus arising | | | | | | |
| from fair value adjustment on | | | | | | |
| acquisition of National and Provincial | 2 | | 2 | | 2 | |
|
|
|
|
|
|
|
| P&L charge in respect of defined | | | | | | |
| benefit schemes | 122 | | 100 | | 74 | |
|
|
|
|
|
|
|
| Add: P&L charge in respect | | | | | | |
| of other schemes(1) | 6 | | 1 | | 1 | |
|
|
|
|
|
|
|
| Total pension charges(2) | 128 | | 101 | | 75 | |
|
|
|
|
|
|
|
| Less: Portfolio Business Unit | | | | | | |
| charges | (7 | ) | (20 | ) | (16 | ) |
|
|
|
|
|
|
|
| PFS charges | 121 | | 81 | | 59 | |
|
|
|
|
|
|
|
| | | | | | | |
| (1) | Comprises defined contribution pension schemes. |
| | |
| (2) | Excludes £12m of pension charges relating to the life assurance businesses reported in non-interest income under embedded value accounting (2002:£11m; 2001: £9m). |
The following comments refer to the pension cost for the combined Personal Financial Services and Portfolio Business Unit businesses.
The main Abbey defined-benefit pension scheme was closed to new members in March 2002 and replaced with a defined-contribution scheme.
The decrease in the regular cost to £75m (2002: £85m) as employees leave the defined-benefit scheme is partially offset by salary inflation and increased costs in respect of other schemes.
The annual review of Abbey’s pension schemes in March 2003 indicated a pre-tax deficit of £604m compared to £127m the previous year, leading to a £29m increase in the amortisation charge to £45m (2002: £16m). The estimated December 2003 deficit of £528m reflects changes to the discount rate and other assumptions off setting the impact of equity market growth and implies a 2004 P&L charge of approximately £125m for Personal Financial Services and Portfolio Business Unit combined, compared to £122m in 2003.
The increased charge to £6m (2002: £1m) in relation to other schemes results from increased membership of defined contribution pension schemes.
| FRS 17 disclosure | | | | |
| | 31 December | | 31 December | |
| | 2003 | | 2002 | |
| | £m | | £m | |
|
|
|
|
|
| Total market value of assets | 2,205 | | 1,880 | |
|
|
|
|
|
| Present value of scheme liabilities | (3,306 | ) | (2,722 | ) |
|
|
|
|
|
| FRS 17 scheme deficit | ( 1,101) | | (842 | ) |
|
|
|
|
|
| Related deferred tax asset | 330 | | 253 | |
|
|
|
|
|
| Net FRS 17 scheme deficit | (771 | ) | (589 | ) |
|
|
|
|
|
The table above and the following comments reflect the position of Abbey’s defined-benefit schemes in totality.
At 31 December 2003, the estimated scheme deficit under FRS 17 was £771m post tax (2002: £589m). The differences between FRS 17 and SSAP 24 valuations arise as FRS 17 requires assets to be held at market value and is more prescriptive in the assumptions to be used in assessing liabilities.
Asset growth of £325m in 2003 was primarily driven by investment returns in the year, with contributions to the fund largely offset by benefits paid out.
Liabilities are determined by projecting forward the growth in current accrued pension benefits to reflect inflation and salary growth to the date of pension payment, discounted to present value. The 0.3%
| Abbey Annual Report and Accounts 2003 | 51 |
Back to Contents
Operating and Financial Review
Other Material Items continued
increase in the 2003 inflation assumption to 2.7% is estimated to have increased liabilities by £190m. The discount rate under FRS 17 is based on the long term AA Corporate Bond return which fell 0.25% to 5.5% in 2003, and is estimated to have added a further £160m to the deficit. In total, these changes result in a net discount rate movement of 0.55%, increasing the liability by about £350m. Additionally, the inclusion of a further year’s service cost for members of the current scheme and the unwind of the discount contribute to a £584m increase in pension fund liabilities to £3,306m (2002: £2,722m).
For 2004 the sensitivity to the equity market is estimated at £110m for every 10% movement in the market, assuming an average market return on the 50% of the £2.2bn pension fund asset that is invested in equities. Similarly, a 10 basis point movement in the net discount rate is estimated to have a £65m impact on liabilities. Under FRS 17, the Profit and Loss Account charge for the year would be determined by the assumptions below and the actual service accrued by scheme members.
| | 31 December | | 31 December | |
| | 2003 | | 2002 | |
| | % | | % | |
|
|
|
|
|
| Discount rate for scheme liabilities | 5.50% | | 5.75% | |
|
|
|
|
|
| Pension and deferred pension increases | 2.70% | | 2.40% | |
|
|
|
|
|
| General salary increase | 4.20% | | 3.90% | |
|
|
|
|
|
| General price inflation | 2.70% | | 2.40% | |
|
|
|
|
|
| Expected rate of return on equities | 7.25% | | 8.00% | |
|
|
|
|
|
| Expected rate of return on bonds | 5.50% | | 5.75% | |
|
|
|
|
|
| Expected rate of return on gilts | 4.75% | | 4.50% | |
|
|
|
|
|
| Cash | 3.60% | | 4.50% | |
|
|
|
|
|
Any variance in actual asset returns from the assumptions during the year is reflected in the deficit movement along with changes to the assumptions driving the liability, all of which are taken to the Statement of Recognised Gains and Losses.
Analysis of significant items included in the profit & loss account
Refer to note 62 (r) of the Financial Statements for further detail of the differences between the statutory and trading bases by segment by line item.
UK GAAP to US GAAP reconciliation
(Loss) profit attributable to the shareholders of Abbey National plc under UK GAAP in each of the years ended 31 December 2003, 2002 and 2001 was £(699)m, £(1,161)m (restated) and £947m, respectively. Under US GAAP the corresponding amounts were £(131)m, £(1,393)m (restated) and £947m (restated), respectively. Reconciliations between the UK GAAP and US GAAP amounts, together with detailed explanations of the accounting differences, are included in Notes 58-61 to the Consolidated Financial Statements. As part of the preparation of Abbey’s 2003 Consolidated Financial Statements, certain US GAAP differences for 2002 and 2001 have been restated to reflect the correction of errors in the accounting treatment for the life assurance businesses and securitised assets. The effects of the restatements are set out on page 181.
The principal differences between UK and US GAAP, which affected net income, were as follows:
The treatment of shareholders’ interest in the long term assurance business. Under UK GAAP applicable to banking groups, the net present value of the profits inherent in the long-term assurance business are recognised in the current reporting period. Under US GAAP revenue is recognised when premiums fall due from the policy holders and costs of claims are recognised in the period that such an assured event occurs, resulting in a more even recognition of profit over the life of the related policies.
The methods of accounting for goodwill and intangible assets.
For UK GAAP, FRS 10 continues to require goodwill to be recorded at the income generating unit and to be amortised over a reputable period of 20 years. Since June 2002, US GAAP requires goodwill to be capitalised at a reporting unit level and all goodwill balances are subject to an annual impairment test. Such goodwill is written off to the extent that it is judged to be impaired.
Under US GAAP, intangible assets representing the value of customer relationships associated with acquisitions are established separately. US GAAP net income is therefore lower than UK GAAP due to an amortisation charge in respect of customer related intangibles.
The treatment of non-trading financial instruments and the derivatives that hedge these financial instruments.
The majority of Abbey’s hedging contracts are transacted with an in-house risk management and trading operation, in order to manage financial risks with external markets efficiently. Abbey transfers substantially all of the risk into the external markets on a portfolio basis, in order to benefit from economies of scale. Under UK GAAP, derivatives held as non-trading instruments are accounted for on an accrual basis. Under US GAAP these derivatives are treated as trading, with the unrealised mark-to-market gains and losses taken to the Profit and Loss Account as they arise. As Abbey will continue to hold a significant number of derivatives which are hedge accounted under UK GAAP, net income and shareholders equity under US GAAP will be subject to increased volatility.
Loan origination fees. Under UK GAAP, loan origination fees are taken to the Profit and Loss Account when services are provided, unless the origination fees are in the nature of interest or income, in which case they are taken to the Profit and Loss Account over the period of time that Abbey has the right to recover the incentives in the event of early redemption. For US GAAP, SFAS 91 requires all loan origination fees not offset by directly related costs to be deferred and amortised over the life of the related loan.
Securities. Under UK GAAP, securities held for investment purposes are stated at cost and adjusted for any amortisation of premium or discount, with a provision also being made for any impairment. Securities not held for investment are stated at their market values, with any gains or losses taken to the Profit and Loss Account. Under US GAAP, investments in equity securities with readily determinable market values and all investments in debt securities are classified as trading, available for sale or held to maturity securities, in accordance with SFAS 115. Trading securities are accounted for in the same manner as investments not held for investment purposes under UK GAAP. Available for sale Securities are reported at market value, with any unhedged, unrealised gains and losses taken directly to shareholders funds. Securities covered by fair value hedges will have the unrealised portion of the security and the underlying fair value derivative taken to the profit and loss account. Held to maturity Securities are treated in the same manner as securities held for investment purposes under UK GAAP.
The treatment of dividends declared or proposed after the year-end by the Board of Directors. For UK GAAP, dividends are recorded in the period to which they relate, while under US GAAP dividends are recorded in the period that they are actualy declared.
The tax-effect of the above adjustments are made in accordance with the provisions for accounting for deferred income tax.
| 52 | Abbey Annual Report and Accounts 2003 |
Back to Contents
Operating and Financial Review
Other Material Items continued
| 2003 compared to 2002 |
| Net loss available to ordinary shareholders under US GAAP is £131m in 2003, £568m lower than the equivalent amount available under UK GAAP. In 2002 the US GAAP loss available to ordinary shareholders was £1,393m (restated), £232m higher than the UK GAAP equivalent. |
The UK to US GAAP adjustments increased £800m from expense of £568m in 2002 to a £232m income in 2003. Material movements include the following. |
| An increase of £1,124m in shareholders’ interests in long-term assurance business (from expense of £673m in 2002 to income of £343m in 2003), primarily due to recognition under US GAAP of the deficits in the policyholder with-profits funds whereas, under UK GAAP, only that amount for which the shareholder is responsible is recognised. The deficits were due to the sharp fall in equity markets in 2002 which have partially recovered in 2003, reducing the overall deficit on a US GAAP basis. The difference was reduced in 2003 following the provision for realistic balance sheet liabilities in the UK GAAP result. The improvement was also due to lower levels of new business in 2003 with UK GAAP recognising more of the profit up-front while US GAAP spreads the profit over the life of the contract and there is therefore a greater benefit from the in-force book. |
| An increase in derivatives and hedged underlying transactions of £441m primarily due to the close-out of derivative instruments which hedged Portfolio Business Unit assets as part of the disposal process. |
| A decrease of £882m in goodwill (from income of £714m in 2002 to expense of £168m in 2003) primarily due to a £660m difference on impairments recognised under UK and US GAAP in 2002 (see table below) and additional goodwill of £190m recorded under USGAAP, disposed of in 2003. |
| | |
| 2002 compared to 2001 |
| Net income (loss) available to ordinary shareholders under US GAAP is a £1,393m (restated) loss in 2002, £232m higher than the equivalent amount available under UK GAAP. In 2001 the US GAAP income available to ordinary shareholders was £947m (restated), the same as the UK GAAP equivalent. |
| The UK to US GAAP adjustments decreased £232m due to a £232m expense in 2002. Material movements include: |
| A decrease of £841m in shareholders’ interests in long-term assurance business (from income of £114m in 2001 to expense of £727m in 2002), primarily due to the recognition of deficits in the with-profits funds in 2002 as set out above. |
| A decrease of £121m in income from securitisation primarily due to a higher volume of mortgages securitised in 2001 compared to 2002. |
| Partially offsetting these decreases above is an increase of £671m (from an expense of £77m in 2001 to income of £594m in 2002) in amortisation, primarily due to £1,138m of impairments recognised under UK GAAP in 2002 while only £478m was recognised under US GAAP.The differences between UK and US GAAP impairments is analysed in the table below: |
| | |
| | UK GAAP | | US GAAP | |
| | £m | | £m | |
|
|
|
| |
| Business: | | | | |
|
|
|
| |
| Scottish Provident | 604 | | – | |
|
|
|
| |
| First National | 357 | | 228 | |
|
|
|
| |
| Cater Allen Offshore | 149 | | 118 | |
|
|
|
| |
| Abbey National Business | 12 | | – | |
|
|
|
| |
| Porterbrook | 16 | | – | |
|
|
|
| |
| Structured Wholesale Lending | – | | 121 | |
|
|
|
| |
| Other | – | | 11 | |
|
|
|
| |
| | 1,138 | | 478 | |
|
|
|
| |
Legal proceedings
Abbey and its subsidiaries are party to various legal proceedings in the ordinary course of business, the ultimate resolution of which is not expected to have material adverse effect on the financial position or the results of operations of Abbey.
Material contacts
Abbey and its subsidiaries are party to various contracts in the ordinary course of business save as referred to in note 24 of the Financial Statements and the transfer of Abbey’s fund management activities to State Street in January 2003. For the two years ended 31 December 2003, there have been no material contracts being contracts entered into outside the ordinary course of business.
Audit fees
Please refer to Note 8 of the Consolidated Financial Statements.
| Abbey Annual Report and Accounts 2003 | 53 |
Back to Contents
Operating and Financial Review
Balance Sheet Operating Review
Throughout this section, reference to UK and non-UK refer to the location of the office where the transaction is recorded.
Deposits
The following tables set forth the average balances of deposits for each of the three years ended 31 December 2003.
| | Average: year ended 31 December | |
|
| |
| | 2003 | | 2002 | | 2001 | |
| | £m | | £m | | £m | |
|
|
|
|
|
| |
| Deposits by banks | | | | | | |
|
|
|
|
|
| |
| UK | 7,144 | | 8,159 | | 11,637 | |
|
|
|
|
|
| |
| Non-UK | 1,761 | | 3,758 | | 1,066 | |
|
|
|
|
|
| |
| Total | 8,905 | | 11,917 | | 12,703 | |
|
|
|
|
|
| |
| Customers’ accounts | | | | | | |
| (all interest bearing) | | | | | | |
|
|
|
|
|
| |
| UK | 63,154 | | 63,325 | | 58,197 | |
|
|
|
|
|
| |
| Non-UK | 5,501 | | 5,199 | | 4,889 | |
|
|
|
|
|
| |
| Total | 68,655 | | 68,524 | | 63,086 | |
|
|
|
|
|
| |
| | | | | | | |
| Customers’ accounts – by type | | | | | | |
| | Average: year ended 31 December | |
|
|
|
|
|
| |
| | 2003 | | 2002 | | 2001 | |
| | £m | | £m | | £m | |
|
|
|
|
|
| |
| UK | | | | | | |
|
|
|
|
|
| |
| Retail demand deposits | 42,477 | | 38,726 | | 36,962 | |
|
|
|
|
|
| |
| Retail time deposits | 12,620 | | 14,396 | | 12,664 | |
|
|
|
|
|
| |
| Wholesale deposits | 8,057 | | 10,203 | | 8,571 | |
|
|
|
|
|
| |
| | 63,154 | | 63,325 | | 58,197 | |
|
|
|
|
|
| |
| Non-UK | | | | | | |
|
|
|
|
|
| |
| Retail demand deposits | 1,261 | | 1,320 | | 1,339 | |
|
|
|
|
|
| |
| Retail time deposits | 4,082 | | 3,416 | | 3,150 | |
|
|
|
|
|
| |
| Wholesale deposits | 158 | | 463 | | 400 | |
|
|
|
|
|
| |
| | 5,501 | | 5,199 | | 4,889 | |
|
|
|
|
|
| |
| Total | 68,655 | | 68,524 | | 63,086 | |
|
|
|
|
|
| |
Substantially all retail demand and time deposits are obtained either through the branch network, cahoot or remotely (such as postal accounts) and administered by the branch network, or cahoot, Abbey’s separately branded internet banking proposition. Retail demand and time deposits are also obtained outside the United Kingdom, principally through Abbey National Offshore. They are all interest bearing and interest rates are varied from time to time in response to competitive conditions.
Demand Deposits
Demand deposits largely consist of passbook-based and interest accounts whose balances are available on demand. The category also includes Individual Savings Accounts, current accounts, instant saver savings accounts, remote access accounts, such as those serviced by post, and a number of other accounts which are passbook- or interest-based but which allow the customer a limited number of notice-free withdrawals per year depending on the balance remaining in the account. These accounts are treated as demand deposits because the entire account balance may be withdrawn on demand without penalty as one of the notice-free withdrawals.
Time Deposits
The main constituents of time deposits are notice accounts which require customers to give notice of an intention to make a withdrawal and bond accounts which have a minimum deposit requirement. In each of these accounts early withdrawal incurs an interest penalty.
Wholesale Deposits
Wholesale deposits are those which either are obtained through the London money markets or for which interest rates are quoted on request rather than being publicly advertised. These deposits are of fixed maturity and bear interest rates which reflect the inter-bank money market rates.
Short-term borrowings
The following tables set forth certain information regarding short-term borrowings (composed of deposits by banks, commercial paper and negotiable certificates of deposit) for each of the three years ended 31 December 2003. While deposits by banks are reported in the “deposits” section above, they are also shown under “Short-term borrowings” because of their importance as a source of funding to Abbey.
| Deposits by banks | | | | | | |
| | Year ended 31 December | �� |
|
|
|
|
|
| |
| | 2003 | | 2002 | | 2001 | |
| | £m | | £m | | £m | |
|
|
|
|
|
| |
| Year end balance(1) | 1,178 | | 11,481 | | 10,547 | |
|
|
|
|
|
| |
| Average balance(2) | 8,905 | | 11,917 | | 12,703 | |
|
|
|
|
|
| |
| Maximum balance | 10,979 | | 19,101 | | 16,878 | |
|
|
|
|
|
| |
| | | | | | | |
| | % | | % | | % | |
|
|
|
|
|
| |
| Average interest rate during year | 2.78 | % | 2.75 | % | 4.55 | |
|
|
|
|
|
| |
| Year end interest rate(3) | 2.83 | % | 2.80 | % | 5.41 | |
|
|
|
|
|
| |
At 31 December 2003, deposits by foreign banks amounted to £5,881m (2002: £10,364m, 2001: £2,804m).
| Commercial paper | | | | | | |
| | Year ended 31 December | |
|
|
|
|
|
| |
| | 2003 | | 2002 | | 2001 | |
| | £m | | £m | | £m | |
|
|
|
|
|
| |
| Year end balance | 1,298 | | 8,439 | | 11,062 | |
|
|
|
|
|
| |
| Average balance (2) | 4,199 | | 12,958 | | 10,833 | |
|
|
|
|
|
| |
| Maximum balance | 7,300 | | 15,813 | | 11,633 | |
|
|
|
|
|
| |
| | | | | | | |
| | % | | % | | % | |
|
|
|
|
|
| |
| Average interest rate during year | 1.6 | % | 3.42 | | 4.47 | |
|
|
|
|
|
| |
| Year end interest rate(3) | 5.16 | | 1.46 | | 4.38 | |
|
|
|
|
|
| |
Commercial paper is issued by Abbey generaly in denominations of notless than $50,000, with maturities of up to 365 days. Commercial paper is issued by Abbey National Treasury Services plc and Abbey National North America Corporation, a subsidiary of Abbey National Treasury Services plc.
Included in the above year end balance for 2002 is £3.6bn in respect of commercial paper issued by Moriarty Limited and Moriarty LLC. Moriarty is a bankruptcy-remote asset-backed commercial paper programme sponsored by Abbey National Treasury Services plc.
| 54 | Abbey Annual Report and Accounts 2003 |
Back to Contents
Operating and Financial Review
Balance Sheet Operating Review continued
| Negotiable certificates of deposit | | | | | | |
| | Year ended 31 December | |
|
|
|
|
|
| |
| | 2003 | | 2002 | | 2001 | |
| | £m | | £m | | £m | |
|
|
|
|
|
| |
| Year end balance | 8,211 | | 21,744 | | 21,867 | |
|
|
|
|
|
| |
| Average balance(2) | 13,996 | | 26,917 | | 20,960 | |
|
|
|
|
|
| |
| Maximum balance | 22,429 | | 30,468 | | 24,755 | |
|
|
|
|
|
| |
| | | | | | | |
| | % | | % | | % | |
|
|
|
|
|
| |
| Average interest rate during year | 2.17 | | 2.70 | | 4.67 | |
| Year end interest rate(3) | 3.70 | | 2.75 | | 4.48 | |
|
|
|
|
|
| |
| | | | | | | �� |
| (1) | The year end deposits by banks balance includes non-interest bearing items in the course of transmission of £204m (2002:£221m, 2001: £243m). |
| (2) | Average balances for 2003, 2002 and 2001 are based upon daily data for Abbey National Treasury Services plc and its subsidiaries and monthly data for all other operations. |
| (3) | Year end interest rates are calculated on the basis of the interest earned in the year relative to the year end balance. and is therefore not representative of actual interest rates. |
Certificates of deposit and certain time deposits
The following table sets forth the maturities of Abbey’s certificates of deposit and other large wholesale time deposits from non-bank counterparties in excess of £50,000 (or the non-sterling equivalent of £50,000) at 31 December 2003. A proportion of Abbey’s retail time deposits also exceeds £50,000 at any given date; however, the ease of access and other terms of these accounts means that they may not have been in excess of £50,000 throughout 2003. Furthermore, the customers may withdraw their funds on demand upon payment of an interest penalty. For these reasons, no maturity analysis is presented for such deposits. See “Short-term borrowings” above for information on amounts and maturities of claims under issues of commercial paper.
| | | | In more | | In more | | | | | |
| | | | than three | | than six | | | | | |
| | | | months | | months | | | | | |
| | Not more | | but not | | but not | | In more | | | |
| | than three | | more than | | more than | | than one | | | |
| | months | | six months | | one year | | year | | Total | |
| | £m | | £m | | £m | | £m | | £m | |
|
|
|
|
|
|
|
|
|
| |
| Certificates of deposit: | | | | | | | | | |
|
|
|
|
|
|
|
|
| |
| UK | 1,796 | | 319 | | 1,460 | | 261 | | 3,836 | |
|
|
|
|
|
|
|
|
|
| |
| Non-UK | 2,302 | | 625 | | 888 | | 560 | | 4,375 | |
|
|
|
|
|
|
|
|
|
| |
| Wholesale time | | | | | | | | | | |
| deposits: | | | | | | | | | | |
|
|
|
|
|
|
|
|
|
| |
| UK | 2,229 | | 18 | | 488 | | 2,387 | | 5,122 | |
|
|
|
|
|
|
|
|
|
| |
| Non-UK | 115 | | – | | – | | 16 | | 131 | |
|
|
|
|
|
|
|
|
|
| |
| Total | 6,442 | | 962 | | 2,836 | | 3,224 | | 13,464 | |
|
|
|
|
|
|
|
|
|
| |
At 31 December 2003, there were an additional £3,998m of wholesale deposits which were repayable on demand. All wholesale time deposits exceeded £50,000 at 31 December 2003.
| Abbey Annual Report and Accounts 2003 | 55 |
Back to Contents
Operating and Financial Review
Balance Sheet Operating Review continued
Securities
The following table sets out the book and market values of securities at 31 Decemberfor each of the three years indicated. For further information, see the notes to the Financial Statements.
| | | | 2003 | | | | 2002 | | | | 2001 | |
|
|
|
|
|
|
|
|
|
|
|
| |
| | Net asset | | Market | | Net asset | | Market | | Net asset | | Market | |
| | value | | value | (1) | value | | value | (1) | value | | value | (1) |
| | £m | | £m | | £m | | £m | | £m | | £m | |
|
|
|
|
|
|
|
|
|
|
|
| |
| Investment securities (2, 3) | | | | | | | | | | | | |
|
|
|
|
|
|
|
|
|
|
|
| |
| Debt securities: | | | | | | | | | | | | |
|
|
|
|
|
|
|
|
|
|
|
| |
| UK government | 125 | | 125 | | 133 | | 133 | | 166 | | 167 | |
|
|
|
|
|
|
|
|
|
|
|
| |
| US treasury and other US government agencies and corporations | – | | – | | 778 | | 789 | | 1,318 | | 1,291 | |
|
|
|
|
|
|
|
|
|
|
|
| |
| Other public sector securities | 28 | | 29 | | 1,512 | | 1,699 | | 3,160 | | 3,235 | |
|
|
|
|
|
|
|
|
|
|
|
| |
| Bank and building society certificates of deposit | 204 | | 203 | | 1,011 | | 1,022 | | 529 | | 540 | |
|
|
|
|
|
|
|
|
|
|
|
| |
| Other issuers (4): | | | | | | | | | | | | |
|
|
|
|
|
|
|
|
|
|
|
| |
| Floating rate notes | 330 | | 381 | | 3,138 | | 3,130 | | 7,852 | | 7,863 | |
|
|
|
|
|
|
|
|
|
|
|
| |
| Mortgage-backed securities | 36 | | 37 | | 4,022 | | 4,014 | | 5,149 | | 5,113 | |
|
|
|
|
|
|
|
|
|
|
|
| |
| Other asset-backed securities(5) | 535 | | 483 | | 13,392 | | 13,061 | | 17,976 | | 17,823 | |
|
|
|
|
|
|
|
|
|
|
|
| |
| Other | 495 | | 583 | | 8,989 | | 9,255 | | 11,779 | | 11,958 | |
|
|
|
|
|
|
|
|
|
|
|
| |
| Ordinary shares and similar securities | 394 | | 394 | | 893 | | 901 | | 812 | | 818 | |
|
|
|
|
|
|
|
|
|
|
|
| |
| Sub Total | 2,147 | | 2,235 | | 33,868 | | 34,004 | | 48,741 | | 48,808 | |
|
|
|
|
|
|
|
|
|
|
|
| |
| Other securities (5) | | | | | | | | | | | | |
|
|
|
|
|
|
|
|
|
|
|
| |
| Debt securities: | | | | | | | | | | | | |
|
|
|
|
|
|
|
|
|
|
|
| |
| UK government | 547 | | 547 | | 1,169 | | 1,169 | | 710 | | 710 | |
|
|
|
|
|
|
|
|
|
|
|
| |
| Other public sector securities | 3,798 | | 3,798 | | 4,706 | | 4,706 | | 3,686 | | 3,686 | |
|
|
|
|
|
|
|
|
|
|
|
| |
| Bank and building society certificates of deposit | 15,811 | | 15,811 | | 14,322 | | 14,322 | | 8,315 | | 8,315 | |
|
|
|
|
|
|
|
|
|
|
|
| |
| Other issuers (4): | | | | | | | | | | | | |
|
|
|
|
|
|
|
|
|
|
|
| |
| Floating rate notes | 244 | | 244 | | 43 | | 43 | | 273 | | 273 | |
|
|
|
|
|
|
|
|
|
|
|
| |
| Mortgage-backed securities | 608 | | 608 | | 159 | | 159 | | 114 | | 114 | |
|
|
|
|
|
|
|
|
|
|
|
| |
| Other asset-backed securities(5) | 614 | | 614 | | 260 | | 260 | | 541 | | 541 | |
|
|
|
|
|
|
|
|
|
|
|
| |
| Other | 6,953 | | 6,953 | | 6,173 | | 6,173 | | 6,290 | | 6,290 | |
|
|
|
|
|
|
|
|
|
|
|
| |
| Ordinary shares and similar securities | 1,239 | | 1,239 | | 70 | | 70 | | 3 | | 3 | |
|
|
|
|
|
|
|
|
|
|
|
| |
| Sub Total | 29,814 | | 29,814 | | 26,902 | | 26,902 | | 19,932 | | 19,932 | |
|
|
|
|
|
|
|
|
|
|
|
| |
| Total | 31,961 | | 32,049 | | 60,770 | | 60,906 | | 68,673 | | 68,740 | |
|
|
|
|
|
|
|
|
|
|
|
| |
| | | | | | | | | | | | | |
| (1) | There are hedges in place in respect of certain securities where the rise or fall in their market value will be offset by a substantially equivalent reduction or increase in the value of the hedges. |
| | |
| (2) | Investment securities include government securities held as part of the Abbey’s treasury management portfolio for asset/liability management, liquidity and regulatory purposes and are for use on a continuing basis in the activities of Abbey. In addition, Abbey holds as investment securities listed and unlisted corporate securities. At 31 December 2003, most of Abbey’s securities portfolio was held through Abbey National Treasury Services plc. A substantial majority of Abbey National Treasury Services plc’s securities portfolio was rated AA- or better (or the equivalent) by one or more Rating Organisations. |
| | |
| (3) | Abbey complies with the requirements of SFAS115, “Accounting for Certain Investments in Debt and Equity Securities”. Under this standard the majority of investments classified as investment securities are classified as “available for sale” securities and reported at fair value at 31 December 2003, with unrealised gains and losses reported in a separate component of shareholders’ funds. Further details are provided in the notes to the Financial Statements. |
| | |
| (4) | Other securities comprise securities held for trading purposes and securities used for the stock borrowing and lending business. These securities are carried at market value. |
| | |
| (5) | In 2002 and 2001 this included a portfolio of as set-backed securities managed by Abbey National Treasury Services plc on behalf of Moriarty and its associated companies. See “Short-term borrowings – Commercial paper” included elsewhere in this Annual Report. |
| 56 | Abbey Annual Report and Accounts 2003 |
Back to Contents
Operating and Financial Review
Balance Sheet Operating Review continued
A description of the characteristics of the securities held under each of the subcategories of securities in the table above is provided below.
UK government securities
The holdings of UK government securities (gilts) are primarily at fixed rates. Abbey’s assets and liabilities are predominantly floating rate (as described under “Risk management – market risk” included elsewhere in this Annual Report) which is used as the benchmark for risk management. Fixed-rate securities (including gilts) are generalyhedged into floating rate, on either an individual or an aggregate basis within the overall management of the appropriate book.
US treasury and other US government agencies and corporations
This category comprises US treasury securities, mortgage-backed securities issued or guaranteed by the US Government National Mortgage Association, the Federal National Mortgage Association and the Federal Home Loan Mortgage Corporation (collectively, “Agency Mortgage Backed Securities”).
The mortgage-backed securities are predominantly adjustable rate securities. Any fixed-rate securities are hedged by instruments of a short duration, generally on an aggregate basis within the fixed-rate dollar mortgage-backed securities investment portfolio.
Specific risks from investing in dollar mortgage-backed securities relate to embedded options within the securities including prepayment options and periodic or absolute caps. Prepayment risk arises from uncertainty about the rate at which early repayment will take place on the underlying mortgages on which these securitised assets are based. The rate of prepayment is partly related to underlying demographic and economic conditions (for example, the income level of mortgage holders) and partly to current market interest rates. These risks are modelled using scenario analysis, and option cover is arranged as appropriate. Specific limits have been developed for prepayments along with the range of other risks; these risks are included within the set of limits comprising the Treasury Mandate as described more fully under “Risk management” included elsewhere in this Annual Report.
Other public sector securities
This category comprises issues by governments other than the US and UK governments, issues by supranationals and issues by UK public sector bodies. These are a mixture of fixed-rate and floating-rate securities.
Bank and building society certificates of deposit
Bank and building society certificates of deposit are fixed-rate securities with relatively short maturities. These are managed within the overall position for the relevant book.
Other issuers: floating-rate notes
Floating-rate notes have simple risk profiles and are either managed within the overall position for the relevant book or are hedged into one of the main currencies.
Other issuers: mortgage-backed securities
This category comprises US mortgage-backed securities (other than Agency mortgage-backed securities) and European mortgage-backed securities. The non-Agency mortgage-backed securities have similar characteristics to the Agency mortgage-backed securities discussed above and are managed along with the Agency mortgage-backed securities for market risk purposes. European mortgage-backed securities have prepayment risks but few have cap features.
Other Issuers: other asset-backed securities
This category comprises a range of mostly floating-rate asset-backed securities including home equity loans, commercial mortgages, car dealer, lease and credit card debtors and student loans. A number of the credit card debtors incorporate cap features.
Other issuers: other securities
This category comprises mainly synthetic floating-rate notes (which are fixed-rate bonds packaged into floating rate by means of swaps tailored to provide a match to the characteristics of the underlying bond), along with a number of structured transactions which are hedged, as appropriate, either on an individual basis or as part of the overall management of the books. The synthetic floating-rate notes comprise bonds issued by banks, financial institutions and corporations, the latter being largely guaranteed by banks and financial institutions.
| Abbey Annual Report and Accounts 2003 | 57 |
Back to Contents
Operating and Financial Review
Balance Sheet Operating Review continued
The following table sets out the maturities and weighted average yields of investment securities at 31 December 2003.
| | Maturing within one year: | | Maturing after one but within five years: | Maturing after five years but within ten years: | | Maturing after ten years: | | | | Total | |
|
|
|
|
|
|
|
|
|
|
|
|
|
|
|
|
| |
| | Amount | | Yield | (1) | Amount | | Yield | (1) | Amount | | Yield | (1) | Amount | | Yield | (1) | Amount | | Yield | (1) |
| | £m | | % | | £m | | % | | £m | | % | | £m | | % | | £m | | % | |
|
|
|
|
|
|
|
|
|
|
|
|
|
|
|
|
|
|
|
| |
| UK government | 123 | | 5.92 | | 1 | | 7.21 | | 1 | | 7.21 | | – | | – | | 125 | | 5.94 | |
|
|
|
|
|
|
|
|
|
|
|
|
|
|
|
|
|
|
|
| |
| Other public sector securities | 28 | | 1.57 | | – | | – | | – | | – | | – | | – | | 28 | | 1.57 | |
|
|
|
|
|
|
|
|
|
|
|
|
|
|
|
|
|
|
|
| |
| Bank and building society | | | | | | | | | | | | | | | | | | | | |
| certificates of deposit | 158 | | 4.12 | | 46 | | 4.99 | | – | | – | | – | | – | | 204 | | 5.49 | |
|
|
|
|
|
|
|
|
|
|
|
|
|
|
|
|
|
|
|
| |
| Other issuers | 126 | | 2.93 | | 450 | | 6.92 | | 371 | | 8.50 | | 627 | | 5.62 | | 1,574 | | 6.45 | |
|
|
|
|
|
|
|
|
|
|
|
|
|
|
|
|
|
|
|
| |
| Sub-total | 435 | | 4.76 | | 497 | | 6.66 | | 372 | | 8.49 | | 627 | | 5.62 | | 1,931 | | 6.25 | |
|
|
|
|
|
|
|
|
|
|
|
|
|
|
|
|
|
|
|
| |
| Ordinary shares(2) | 394 | | | | – | | | | – | | | | – | | | | 394 | | | |
|
|
|
|
|
|
|
|
|
|
|
|
|
|
|
|
|
|
|
| |
| Total net asset value | | | | | | | | | | | | | | | | | | | | |
| before provisions | 829 | | | | 497 | | | | 372 | | | | 627 | | – | | 2,325 | | | |
|
|
|
|
|
|
|
|
|
|
|
|
|
|
|
|
|
|
|
| |
| Provisions | – | | – | | – | | | | – | | | | – | | – | | (178 | ) | | |
|
|
|
|
|
|
|
|
|
|
|
|
|
|
|
|
|
|
|
| |
| Total net asset value | 829 | | | | 497 | | | | 372 | | | | 627 | | – | | 2,147 | | | |
|
|
|
|
|
|
|
|
|
|
|
|
|
|
|
|
|
|
|
| |
| Total market value | 829 | | | | 497 | | | | 372 | | | | 627 | | – | | 2,325 | | | |
|
|
|
|
|
|
|
|
|
|
|
|
|
|
|
|
|
|
|
| |
| (1) | The weighted average yield for each range of maturities is calculated by dividing the annualised interest income prevailing at 31 December 2003 by the net asset value of securities held at that date, and is not necessarily representative when there are only a small number of securities in the portfolio. |
| (2) | Ordinary shares by their nature do not permit the calculation of yields which are meaningful in the same way as yields on debt securities; accordingly, these are omitted. |
The following table sets forth the book and market values of those securities of individual counterparties where the aggregate amount of those securities exceeded 10% of Abbey’s shareholders’ funds at 31 December 2003.
| | Book | | Market | |
| | value | | value | |
| | £m | | £m | |
|
|
|
| |
| HBOS plc | 3,529 | | 3,533 | |
|
|
|
| |
| Royal Bank of Scotland Group plc | 2,993 | | 2,995 | |
|
|
|
| |
| Lloyds TSB Group plc | 2,409 | | 2,409 | |
|
|
|
| |
| UK government | 1,970 | | 1,970 | |
|
|
|
| |
| Republic of Italy | 1,268 | | 1,332 | |
|
|
|
| |
| Nationwide Building Society | 1,151 | | 1,512 | |
|
|
|
| |
| UBS AG | 985 | | 990 | |
|
|
|
| |
| Government of Germany | 690 | | 725 | |
|
|
|
| |
| ING Bank BV | 651 | | 652 | |
|
|
|
| |
| Banco Bilbao Vizcaya Agentaria, SA | 618 | | 619 | |
|
|
|
| |
| Barclays Bank plc | 601 | | 604 | |
|
|
|
| |
| Republic of Greece | 591 | | 657 | |
|
|
|
| |
For the purposes of determining the above, shareholders’ funds amounted to £5,331m at 31 December 2003.
Loans and advances to banks
Loans and advances to banks includes loans to banks and building societies and balances with central banks (excluding those balances which can be withdrawn on demand).
The geographical analyses of loans and advances presented in the following table are based on the location of the office from which the loans and advances are made.
| | | | | | Year ended 31 December | |
|
|
|
|
|
|
|
| |
| | 2003 | | 2002 | | 2001 | | 2000 | | 1999 | |
| | £m | | £m | | £m | | £m | | £m | |
|
|
|
|
|
|
|
|
|
| |
| UK | 6,219 | | 6,465 | | 9,288 | | 12,031 | | 11,216 | |
|
|
|
|
|
|
|
|
|
| |
| Non-UK | 936 | | 135 | | 586 | | 137 | | 256 | |
|
|
|
|
|
|
|
|
|
| |
| Total | 7,155 | | 6,600 | | 9,874 | | 12,168 | | 11,472 | |
|
|
|
|
|
|
|
|
|
| |
The following tables set forth loans and advances to banks by maturity and interest rate sensitivity at 31 December 2003.
| | On demand | | In not more than three months | | In more than three months but not more than one year | | In more than one year but not more than five years | | In more than five years | | Total | |
| | £m | | £m | | £m | | £m | | £m | | £m | |
|
|
|
|
|
|
|
|
|
|
|
| |
| UK | 2,172 | | 4,003 | | 11 | | 33 | | – | | 6,219 | |
|
|
|
|
|
|
|
|
|
|
|
| |
| Non-UK | 917 | | 19 | | – | | – | | – | | 936 | |
|
|
|
|
|
|
|
|
|
|
|
| |
| Total | 3,089 | | 4,022 | | 11 | | 33 | | – | | 7,155 | |
|
|
|
|
|
|
|
|
|
|
|
| |
| | | | | | | | | | | | | |
| | Fixed rate | | Variable rate | | Total | |
| | £m | | £m | | £m | |
|
|
|
|
|
|
|
| Interest-bearing loans | | | | | | |
| and advances to banks: | | | | | | |
|
|
|
|
|
| |
| UK | 4,619 | | 1,424 | | 6,043 | |
|
|
|
|
|
| |
| Non-UK | 606 | | 330 | | 936 | |
|
|
|
|
|
| |
| | 5,225 | | 1,754 | | 6,979 | |
|
|
|
|
|
| |
Items in the course of collection
(non-interest bearing) | | |
|
| |
| UK | 176 | |
|
| |
| Non-UK | – | |
|
| |
| Total | 7,155 | |
|
| |
| 58 | Abbey Annual Report and Accounts 2003 |
Back to Contents
Operating and Financial Review
Balance Sheet Operating Review continued
Loans and Advances to Customers
Abbey provides lending facilities primarily to personal customers in the form of mortgages secured on residential properties and also provides finance lease facilities and a limited number of lending facilities to corporate customers. Purchase and resale agreements represent sale and repurchase activity with professional non-bank customers by Treasury Services short-term markets business.
The geographical analyses of loans and advances presented in the following table are based on the location of the office from which the loans and advances are made.
| | | | | | | | Year ended 31 December | |
|
|
|
|
|
|
|
| |
| | 2003 | | 2002 | | 2001 | | 2000 | | 1999 | |
| | £m | | £m | | £m | | £m | | £m | |
|
|
|
|
|
|
|
|
|
| |
| UK | | | | | | | | | | |
|
|
|
|
|
|
|
|
|
| |
| Advances secured on residential properties | 73,481 | | 65,777 | | 60,738 | | 64,053 | | 63,693 | |
|
|
|
|
|
|
|
|
|
| |
| Purchase and resale agreements | 2,958 | | 742 | | 2,704 | | 6,875 | | 77 | |
|
|
|
|
|
|
|
|
|
| |
| Other secured advances | 2,938 | | 4,645 | | 3,920 | | 2,367 | | 2,539 | |
|
|
|
|
|
|
|
|
|
| |
| Corporate advances | 3,762 | | 9,071 | | 9,119 | | 5,534 | | 3,780 | |
|
|
|
|
|
|
|
|
|
| |
| Unsecured personal advances | 3,228 | | 5,162 | | 4,833 | | 4,901 | | 4,724 | |
|
|
|
|
|
|
|
|
|
| |
| Finance lease debtors | 2,558 | | 3,429 | | 4,671 | | 5,174 | | 5,420 | |
|
|
|
|
|
|
|
|
|
| |
| | 88,925 | | 88,826 | | 85,985 | | 88,904 | | 80,233 | |
|
|
|
|
|
|
|
|
|
| |
| Non-UK | | | | | | | | | | |
|
|
|
|
|
|
|
|
|
| |
| Advances secured on residential properties | 1,745 | | 3,186 | | 2,091 | | 1,635 | | 1,270 | |
|
|
|
|
|
|
|
|
|
| |
| Purchase and resale agreements | 6,414 | | 2,358 | | 1,507 | | – | | – | |
|
|
|
|
|
|
|
|
|
| |
| Other secured advances | 33 | | 106 | | 48 | | 104 | | 115 | |
|
|
|
|
|
|
|
|
|
| |
| Unsecured personal advances | 145 | | 123 | | 119 | | 108 | | 103 | |
|
|
|
|
|
|
|
|
|
| |
| Finance lease debtors | 15 | | 18 | | 67 | | 18 | | 21 | |
|
|
|
|
|
|
|
|
|
| |
| | 8,352 | | 5,791 | | 3,832 | | 1,865 | | 1,509 | |
|
|
|
|
|
|
|
|
|
| |
| Total | 97,277 | | 94,617 | | 89,817 | | 90,769 | | 81,742 | |
|
|
|
|
|
|
|
|
|
| |
No single concentration of loans and advances, with the exception of advances secured on residential properties and corporate advances in the United Kingdom, as disclosed above, accounts for more than 10% of total loans and advances and no individual country, other than the UK, accounts for more than 5% of total loans and advances.
The following tables set forth loans and advances to customers by maturity and interest rate sensitivity at 31 December 2003. In the maturity analysis, overdrafts are included in the “On demand” category. Advances secured by residential properties are included in the maturity analysis at their stated maturity; however, such advances may be repaid early. Abbey’s mortgage loans currently have an average life of six years depending on, among otherfactors, housing market conditions.
| | | | | | In more | | | | | | | |
| | | | | | than three | | In more | | | | | |
| | | | | | months but | | than one | | | | | |
| | | | In not more | | not more | | year but not | | In more | | | |
| | On | | than three | | than one | | more than | | than five | | | |
| | demand | | months | | year | | five years | | years | | Total | |
| | £m | | £m | | £m | | £m | | £m | | £m | |
|
|
|
|
|
|
|
|
|
|
|
| |
| UK | | | | | | | | | | | | |
|
|
|
|
|
|
|
|
|
|
|
| |
| Advances secured on residential properties | 581 | | 1,778 | | 1,752 | | 9,574 | | 59,796 | | 73,481 | |
|
|
|
|
|
|
|
|
|
|
|
| |
| Purchase and resale agreements | 1,622 | | 1,029 | | 307 | | – | | – | | 2,958 | |
|
|
|
|
|
|
|
|
|
|
|
| |
| Other secured advances | 126 | | 127 | | 481 | | 1,452 | | 752 | | 2,938 | |
|
|
|
|
|
|
|
|
|
|
|
| |
| Corporate advances | 1,388 | | 528 | | 952 | | 145 | | 749 | | 3,762 | |
|
|
|
|
|
|
|
|
|
|
|
| |
| Unsecured personal advances | 1,085 | | 223 | | 588 | | 1,253 | | 79 | | 3,228 | |
|
|
|
|
|
|
|
|
|
|
|
| |
| Finance lease debtors | – | | 31 | | 66 | | 534 | | 1,927 | | 2,558 | |
|
|
|
|
|
|
|
|
|
|
|
| |
| Total UK | 4,802 | | 3,716 | | 4,146 | | 12,958 | | 63,303 | | 88,925 | |
|
|
|
|
|
|
|
|
|
|
|
| |
| Non-UK | | | | | | | | | | | | |
|
|
|
|
|
|
|
|
|
|
|
| |
| Advances secured on residential properties | 38 | | 27 | | 118 | | 471 | | 1,091 | | 1,745 | |
|
|
|
|
|
|
|
|
|
|
|
| |
| Purchase and resale agreements | 5,890 | | 258 | | 266 | | – | | – | | 6,414 | |
|
|
|
|
|
|
|
|
|
|
|
| |
| Other secured advances | 30 | | – | | 1 | | 2 | | – | | 33 | |
|
|
|
|
|
|
|
|
|
|
|
| |
| Corporate advances | – | | – | | – | | – | | – | | – | |
|
|
|
|
|
|
|
|
|
|
|
| |
| Unsecured advances | 9 | | 1 | | 48 | | 73 | | 14 | | 145 | |
|
|
|
|
|
|
|
|
|
|
|
| |
| Finance lease debtors | – | | – | | 1 | | 3 | | 11 | | 15 | |
|
|
|
|
|
|
|
|
|
|
|
| |
| Total non-UK | 5,967 | | 286 | | 434 | | 549 | | 1,116 | | 8,352 | |
|
|
|
|
|
|
|
|
|
|
|
| |
| Total | 10,769 | | 4,002 | | 4,580 | | 13,507 | | 64,419 | | 97,277 | |
|
|
|
|
|
|
|
|
|
|
|
| |
| Abbey Annual Report and Accounts 2003 | 59 |
Back to Contents
Operating and Financial Review
Balance Sheet Operating Reviewcontinued
| | Fixed | | Variable | | | |
| | rate | | rate | | Total | |
| | £m | | £m | | £m | |
|
|
|
|
|
| |
| UK | 24,794 | | 64,131 | | 88,925 | |
|
|
|
|
|
| |
| Non-UK | 6,662 | | 1,690 | | 8,352 | |
|
|
|
|
|
| |
| | 31,456 | | 65,821 | | 97,277 | |
|
|
|
|
|
| |
Abbey’s policy is to hedge all fixed rate loans and advances to customers using derivative instruments, or by matching with other on-balance sheet interest rate exposures.
Provisions on loans and advances to customers
Abbey’s provisioning policy is in accordance with UK industry best practice as expressed in the British Bankers’ Association Statement of Recommended Practice on advances. A substantial proportion of Abbey’s provisions on loans and advances to customers relates to loans and advances secured, either by a first charge on residential property in the United Kingdom, or by other appropriate security depending on the nature of the loan. |
| | Abbey’s provisioning policy is as follows: |
| > | Suspended interest – interest continues to be debited to all impaired loans. On advances secured by a charge on residential property payment is deemed to be impaired or non-performing when they are 90 days overdue. The homogeneous nature of the loans, together with the size of the loan portfolio, permits a reasonably accurate estimate to be made of the amount of this interest for which eventual recovery is doubtful. This amount is no longer credited to the Profit and Loss Account and is placed in suspense. Interest is no longer accrued when it is determined that there is no realistic prospect of recovery, the exception to this being certain small specialist port folios where it is local market practice to place loans on a non-accrual basis where there is no realistic prospect of recovery. |
| > | Specific provision – a specific provision is established for all impaired loans after a specified period of repayment default where it is likely that some of the capital will not be repaid or recovered through enforcement of any applicable security. The length of the default period depends on the nature of the advance and is generally no more than three months. Once a loan is considered to be impaired an assessment of the likelihood of collecting the principal of this loan is made. This assessment is generally made using statistical techniques developed on previous experience and on management judgment of economic conditions. These techniques estimate the propensity of loans to result in losses net of any recovery where applicable. For advances secured on residential property the propensity of loans to become repossessed is also calculated. |
| > | General provision – a general provision is established to cover losses which are, from experience, known to exist at the balance sheet date but which have not yet been identified. The general provision is determined using management judgment given past loss experience, lending quality and economic prospects, and is supplemented by statistical calculations which corroborate the conclusions reached. |
| > | Amounts written-off – losses are written-off when it becomes certain how much is not going to be recovered from repayment, from realising any attached security, or from claiming on any mortgage indemnity guarantee or other insurance. This write-off is determined on a case-by-case basis. In the case of secured loans it is made when the security has been realised and, since the value scan then be calculated with some certainty, the instances of further write-offs or recoveries are minimal. In the case of unsecured loans, the circumstances surrounding the asset will be considered before deciding to write off completely. The write-off policy is regularly reviewed to assist in determining the adequacy of provisions.
Security is realised in accordance with Abbey’s internal debt management programme. Contact is made with customers at an early stage of arrears with counselling made available to achieve a realistic and sustainable repayment arrangement. Litigation and/or enforcement of security is usually carried out only when the steps described above have been undertaken without success.
As a result of the write-off policy, the provisions may be made a significant time in advance of the related write-off. This is particularly the case for the loans secured on commercial properties included within the Other secured advances category. Legal proceedings to repossess and realise the value of the security, are complex and lengthy processes.This means that, although the likely losses have been identified and appropriate provisions made on a case-by-case basis, fewer cases have been determined precisely and written off, net of recoveries, compared to other classes of lending. |
| 60 | Abbey Annual Report and Accounts 2003 |
Back to Contents
Operating and Financial Review
Balance Sheet Operating Review continued
Analysis of end-of-year provisions on loans and advances to customers
| Specific | 2003 | | 2002 | | 2001 | | 2000 | | 1999 | |
| £m | | £m | | £m | | £m | | £m | |
|
|
|
|
|
|
|
|
|
| |
| Advances secured on residential properties – UK | 8 | | 24 | | 46 | | 50 | | 64 | |
|
|
|
|
|
|
|
|
|
| | |
| Other secured advances – UK | 36 | | 42 | | 45 | | 57 | | 50 | |
|
|
|
|
|
|
|
|
|
| |
| Unsecured personal advances – UK | 171 | | 124 | | 152 | | 170 | | 160 | |
|
|
|
|
|
|
|
|
|
| |
| Corporate advances – UK | 161 | | 204 | | – | | – | | – | |
|
|
|
|
|
|
|
|
|
| |
| Advances secured on residential properties – non-UK | 17 | | 26 | | 16 | | 11 | | 12 | |
|
|
|
|
|
|
|
|
|
| |
| Other secured advances – non-UK | 26 | | 34 | | 27 | | 41 | | 47 | |
|
|
|
|
|
|
|
|
|
| |
| Unsecured personal advances – non-UK | 4 | | 4 | | 4 | | 4 | | 3 | |
|
|
|
|
|
|
|
|
|
| |
| Total specific provisions | 423 | | 458 | | 290 | | 333 | | 336 | |
|
|
|
|
|
|
|
|
|
| |
| General | | | | | | | | | | |
|
|
|
|
|
|
|
|
|
| |
| Advances secured on residential properties – UK | 165 | | 165 | | 145 | | 139 | | 128 | |
|
|
|
|
|
|
|
|
|
| |
| Other secured advances – UK | 58 | | 19 | | 18 | | 15 | | 18 | |
|
|
|
|
|
|
|
|
|
| |
| Unsecured personal advances – UK | 32 | | 32 | | 35 | | 31 | | 38 | |
|
|
|
|
|
|
|
|
|
| |
| Corporate advances – UK | 173 | | 56 | | – | | – | | – | |
|
|
|
|
|
|
|
|
|
| |
| Advances secured on residential properties – non-UK | 12 | | 9 | | 5 | | 3 | | 3 | |
|
|
|
|
|
|
|
|
|
| |
| Other secured advances – non-UK | 2 | | 4 | | 4 | | 5 | | 5 | |
|
|
|
|
|
|
|
|
|
| |
| Unsecured personal advances – non-UK | – | | 3 | | 1 | | 1 | | 1 | |
|
|
|
|
|
|
|
|
|
|
| Total general provisions | 442 | | 288 | | 208 | | 194 | | 193 | |
|
|
|
|
|
|
|
|
|
| |
| Total provisions | 865 | | 746 | | 498 | | 527 | | 529 | |
|
|
|
|
|
|
|
|
|
| |
| | | | | | | | | | | |
| Ratios | % | | % | | % | | % | | % | |
|
|
|
|
|
|
|
|
|
| |
| Provisions at the year end as a percentage of year-end loans and advances to customers | | | | | | | | | | |
|
|
|
|
|
|
|
|
|
| |
| Advances secured on residential properties – UK | 0.24 | | 0.29 | | 0.31 | | 0.30 | | 0.30 | |
|
|
|
|
|
|
|
|
|
| |
| Other secured advances – UK | 3.28 | | 1.30 | | 1.61 | | 3.03 | | 2.64 | |
|
|
|
|
|
|
|
|
|
| |
| Unsecured personal advances – UK | 6.20 | | 3.02 | | 3.87 | | 4.09 | | 4.19 | |
|
|
|
|
|
|
|
|
|
| |
| Corporate advances – UK | 13.83 | | 2.97 | | – | | – | | – | |
|
|
|
|
|
|
|
|
|
| |
| Advances secured on residential properties – non-UK | 1.70 | | 1.10 | | 1.00 | | 0.87 | | 1.18 | |
|
|
|
|
|
|
|
|
|
| |
| Other secured advances – non-UK | 68.29 | | 80.85 | | 64.58 | | 44.23 | | 45.28 | |
|
|
|
|
|
|
|
|
|
| |
| Unsecured personal advances – non-UK | 2.76 | | 5.69 | | 4.20 | | 4.39 | | 3.89 | |
|
|
|
|
|
|
|
|
|
| |
| Total loans and advances to customers | 0.93 | | 0.82 | | 0.59 | | 0.62 | | 0.69 | |
|
|
|
|
|
|
|
|
|
| |
| Amounts written off (net ofrecoveries)(1) | 0.40 | | 0.33 | | 0.37 | | 0.35 | | 0.43 | |
|
|
|
|
|
|
|
|
|
| |
| Percent of loans in each category to total loans | | | | | | | | | | |
|
|
|
|
|
|
|
|
|
| |
| Advances secured on residential properties – UK | 76.62 | | 69.76 | | 67.62 | | 70.57 | | 77.92 | |
|
|
|
|
|
|
|
|
|
| |
| Purchase and resale agreements – UK | 3.08 | | 0.79 | | 3.01 | | 7.57 | | 0.09 | |
|
|
|
|
|
|
|
|
|
| |
| Other secured advances – UK | 3.05 | | 4.99 | | 4.36 | | 2.61 | | 3.10 | |
|
|
|
|
|
|
|
|
|
| |
| Corporate advances – UK | 2.51 | | 9.27 | | 10.15 | | 6.10 | | 4.63 | |
|
|
|
|
|
|
|
|
|
| |
| Unsecured personal advances – UK | 3.40 | | 5.47 | | 5.38 | | 5.40 | | 5.78 | |
|
|
|
|
|
|
|
|
|
| |
| Finance lease debtors – UK | 2.67 | | 3.64 | | 5.20 | | 5.70 | | 6.63 | |
|
|
|
|
|
|
|
|
|
| |
| Advances secured on residential properties – non-UK | 1.78 | | 3.38 | | 2.33 | | 1.80 | | 1.55 | |
|
|
|
|
|
|
|
|
|
| |
| Purchase and resale agreements – non-UK | 6.68 | | 2.50 | | 1.70 | | – | | – | |
|
|
|
|
|
|
|
|
|
| |
| Other secured advances – non-UK | 0.04 | | 0.05 | | 0.05 | | 0.11 | | 0.14 | |
|
|
|
|
|
|
|
|
|
| |
| Unsecured advances – non-UK | 0.15 | | 0.13 | | 0.13 | | 0.12 | | 0.13 | |
|
|
|
|
|
|
|
|
|
| |
| Finance lease debtors – non-UK | 0.02 | | 0.02 | | 0.07 | | 0.02 | | 0.03 | |
|
|
|
|
|
|
|
|
|
| |
| (1) | Amounts written off (net of recoveries) ratio as a percentage of average loans and advances to customers excluding finance leases. |
| Abbey Annual Report and Accounts 2003 | 61 |
Back to Contents
Operating and Financial Review
Balance Sheet Operating Review continued
| Movements in provisions for bad and doubtful debts | | | | | | | | | | |
| | 2003 | | 2002 | | 2001 | | 2000 | | 1999 | |
| | £m | | £m | | £m | | £m | | £m | |
|
|
|
|
|
|
|
|
|
| |
| Provisions at the beginning of the year | 746 | | 498 | | 527 | | 529 | | 561 | |
|
|
|
|
|
|
|
|
|
| |
| Acquisition of subsidiary undertakings | – | | 8 | | – | | – | | – | |
|
|
|
|
|
|
|
|
|
| |
| Disposal of subsidiary undertakings | (94 | ) | (1 | ) | – | | – | | – | |
|
|
|
|
|
|
|
|
|
| |
| | 652 | | 505 | | 527 | | 529 | | 561 | |
|
|
|
|
|
|
|
|
|
| |
| | | | | | | | | | | |
| Amounts written off | | | | | | | | | | |
|
|
|
|
|
|
|
|
|
| |
| Advances secured on residential properties – UK | (16 | ) | (27 | ) | (41 | ) | (39 | ) | (50 | ) |
|
|
|
|
|
|
|
|
|
| |
| Other secured advances – UK | (45 | ) | (33 | ) | (49 | ) | (41 | ) | (52 | ) |
|
|
|
|
|
|
|
|
|
| |
| Unsecured personal advances – UK | (148 | ) | (335 | ) | (296 | ) | (234 | ) | (271 | ) |
|
|
|
|
|
|
|
|
|
| |
| Corporate advances – UK | (80 | ) | – | | – | | – | | – | |
|
|
|
|
|
|
|
|
|
| |
| | (289 | ) | (395 | ) | (386 | ) | (314 | ) | (373 | ) |
|
|
|
|
|
|
|
|
|
| |
| Provisions secured on residential properties – non-UK | (10 | ) | – | | (1 | ) | (2 | ) | (2 | ) |
|
|
|
|
|
|
|
|
|
| |
| Other secured advances – non-UK | (10 | ) | – | | (5 | ) | (7 | ) | (13 | ) |
|
|
|
|
|
|
|
|
|
| |
| Unsecured personal advances – non-UK | – | | (1 | ) | (1 | ) | – | | (1 | ) |
|
|
|
|
|
|
|
|
|
| |
| Total amounts written off | (309 | ) | (396 | ) | (393 | ) | (323 | ) | (389 | ) |
|
|
|
|
|
|
|
|
|
| |
| | | | | | | | | | | |
| Recoveries | | | | | | | | | | |
|
|
|
|
|
|
|
|
|
| |
| Advances secured on residential properties – UK | 4 | | 4 | | 9 | | 3 | | 12 | |
|
|
|
|
|
|
|
|
|
| |
| Other secured advances – UK | – | | 3 | | 8 | | 12 | | 6 | |
|
|
|
|
|
|
|
|
|
| |
| Unsecured personal advances – UK | 38 | | 89 | | 85 | | 33 | | 47 | |
|
|
|
|
|
|
|
|
|
| |
| | 42 | | 96 | | 102 | | 48 | | 65 | |
|
|
|
|
|
|
|
|
|
| |
| Provisions secured on residential properties – non-UK | – | | 5 | | – | | – | | – | |
|
|
|
|
|
|
|
|
|
| |
| Other secured advances – non-UK | – | | 6 | | – | | – | | – | |
|
|
|
|
|
|
|
|
|
| |
| Total amount recovered | 42 | | 107 | | 102 | | 48 | | 65 | |
|
|
|
|
|
|
|
|
|
| |
| | | | | | | | | | | |
| Specific provisions charged against profit | | | | | | | | | | |
|
|
|
|
|
|
|
|
|
| |
| Advances secured on residential properties – UK | 5 | | 1 | | 27 | | 24 | | 12 | |
|
|
|
|
|
|
|
|
|
| |
| Other secured advances – UK | 52 | | 25 | | 29 | | 52 | | 49 | |
|
|
|
|
|
|
|
|
|
| |
| Unsecured personal advances – UK | 205 | | 219 | | 193 | | 213 | | 209 | |
|
|
|
|
|
|
|
|
|
| |
| Corporate advances – UK | 36 | | 207 | | – | | – | | – | |
|
|
|
|
|
|
|
|
|
| |
| | 298 | | 452 | | 249 | | 289 | | 270 | |
|
|
|
|
|
|
|
|
|
| |
| Advances secured on residential properties – non-UK | 4 | | 2 | | 6 | | 1 | | – | |
|
|
|
|
|
|
|
|
|
| |
| Other secured advances – non-UK | – | | (1 | ) | (8 | ) | – | | 1 | |
|
|
|
|
|
|
|
|
|
| |
| Unsecured personal advances – non-UK | – | | 1 | | 1 | | 1 | | 2 | |
|
|
|
|
|
|
|
|
|
| |
| Total specific provisions charged against profit | 302 | | 454 | | 248 | | 291 | | 273 | |
|
|
|
|
|
|
|
|
|
| |
| General provisions charged against profit | 172 | | 60 | | 15 | | (18 | ) | 30 | |
|
|
|
|
|
|
|
|
|
| |
| Exchange and other adjustments | 6 | | 16 | | (1 | ) | – | | (11 | ) |
|
|
|
|
|
|
|
|
|
| |
| Provisions at the end of the year | 865 | | 746 | | 498 | | 527 | | 529 | |
|
|
|
|
|
|
|
|
|
| |
Total provisons on loans and advances to customers of £865m are £119m higher than 2002 (£746m), due to the increase in general provisions on corporate advances-UK from the deterioration of certain UK and US power exposures. Other secured advances-UK general provision has increased due to the requirement of FRS 3 whereby all anticipated bad debt write offs are to be provided for when winding down a business. Other secured specific provisions have remained comparable to the prior year. Specific provisions on unsecured personal advances-UK has increased due to the provision raised by Abbey National Scottish Mutual Assurance Holdings Limited in respect of the two contingent loans owed by the long term business funds of Scottish Mutual Assurance plc and Scottish Provident Limited. Advances secured on residential-UK specific provision has declined as a result of the sale of First National Bank plc.
All non-UK provisions have remained comparable to the prior year.
| 62 | Abbey Annual Report and Accounts 2003 |
Back to Contents
Operating and Financial Review
Balance Sheet Operating Reviewcontinued
| Interest in suspense | | | | | | | | | | |
| | 2003 | | 2002 | | 2001 | | 2000 | | 1999 | |
| | £m | | £m | | £m | | £m | | £m | |
|
|
|
|
|
|
|
|
|
| |
| Interest in suspense at the beginning of the year | 76 | | 96 | | 100 | | 114 | | 150 | |
|
|
|
|
|
|
|
|
|
| |
| Acquisition of subsidiary undertakings | – | | 3 | | – | | – | | – | |
|
|
|
|
|
|
|
|
|
| |
| Net interest suspended during the year | 9 | | 10 | | 23 | | 32 | | 26 | |
|
|
|
|
|
|
|
|
|
| |
| Disposal of subsidiary undertaking | (15 | ) | – | | – | | – | | – | |
|
|
|
|
|
|
|
|
|
| |
| Interest written off | (24 | ) | (38 | ) | (26 | ) | (46 | ) | (51 | ) |
|
|
|
|
|
|
|
|
|
| |
| Exchange and other adjustments | 4 | | 5 | | (1 | ) | – | | (11 | ) |
|
|
|
|
|
|
|
|
|
| |
| Interest in suspense at the end of the year | 50 | | 76 | | 96 | | 100 | | 114 | |
|
|
|
|
|
|
|
|
|
| |
Potential credit risk elements in loans and advances
US banks typically stop accruing interest when loans become overdue by 90 days or more, or when recovery is doubtful. In accordance with the British Bankers’ Association Statement of Recommended Practice on Advances, Abbey continues to charge interest for collection purposes, where appropriate, to accounts whose recovery is in doubt, but the interest is suspended as it accrues and is excluded from interest income in the profit and loss account. This suspension of interest continues until such time as its recovery is considered to be unlikely at which time the advance is written off. While such practice does not affect net income in comparison with the practice followed in the US, it has the effect of increasing the reported level of potential credit risk elements in loans and advances. The amount of this difference at 31 December 2003 was £50m. Other than for the net interest suspended during the year, interest income in the profit and loss account is the same as would have been credited if all loans had been current in accordance with their original terms.
The following table presents the potential credit risk elements in Abbey loans and advances. Additional categories of disclosure are included, however, to record loans and advances where interest continues to be accrued and where either interest is being suspended or specific provisions have been made. Normal US banking practice would be to place such loans and advances on non-accrual status. However, at 31 December 2003, 2002 and 2001 there was a small amount of loan assets placed on non-accrual status within Abbey, including amounts in France, where such treatment is viewed as more appropriate given the nature of the business and the particular circumstances of the loans. The amounts are stated before deductions of the value of security held and specific provision or interest suspended.
| Group non-performing loans and advances | | | | | | | | | | |
| | 2003 | | 2002 | | 2001 | | 2000 | | 1999 | |
| | £m | | £m | | £m | | £m | | £m | |
|
|
|
|
|
|
|
|
|
| |
| Accruing loans and advances on which a proportion of interest has been suspended and/or on which specific provision has been made: | | | | | | | | | | |
| | | | | | | | | | |
|
|
|
|
|
|
|
|
|
| |
| UK | 1,531 | | 515 | | 717 | | 777 | | 789 | |
|
|
|
|
|
|
|
|
|
| |
| Non-UK | 101 | | 154 | | 131 | | 138 | | 149 | |
|
|
|
|
|
|
|
|
|
| |
| | 1,632 | | 669 | | 848 | | 915 | | 938 | |
|
|
|
|
|
|
|
|
|
| |
| Accruing loans and advances 90 days overdue on which no interest has | | | | | | | | | | |
| been suspended and on which no specific provision has been made: | | | | | | | | | | |
|
|
|
|
|
|
|
|
|
| |
| UK | 1,110 | | 1,364 | | 898 | | 871 | | 1,100 | |
|
|
|
|
|
|
|
|
|
| |
| Non-UK | 4 | | 22 | | 19 | | 14 | | 11 | |
|
|
|
|
|
|
|
|
|
| |
| | 1,114 | | 1,386 | | 917 | | 885 | | 1,111 | |
|
|
|
|
|
|
|
|
|
| |
| Non-accruing loans and advances: | | | | | | | | | | |
|
|
|
|
|
|
|
|
|
| |
| UK | – | | – | | 1 | | 125 | | 103 | |
|
|
|
|
|
|
|
|
|
| |
| Non-UK | 30 | | 22 | | 27 | | 35 | | 42 | |
|
|
|
|
|
|
|
|
|
| |
| | 30 | | 22 | | 28 | | 160 | | 145 | |
|
|
|
|
|
|
|
|
|
| |
| Total non-performing loans and advances: | | | | | | | | | | |
|
|
|
|
|
|
|
|
|
| |
| UK | 2,641 | | 1,879 | | 1,616 | | 1,773 | | 1,992 | |
|
|
|
|
|
|
|
|
|
| |
| Non-UK | 135 | | 198 | | 177 | | 187 | | 202 | |
|
|
|
|
|
|
|
|
|
| |
| | 2,776 | | 2,077 | | 1,793 | | 1,960 | | 2,194 | |
|
|
|
|
|
|
|
|
|
| |
| | | | | | | | | | | |
| | % | | % | | % | | % | | % | |
|
|
|
|
|
|
|
|
|
| |
| Non-performing loans and advances as a percentage of loans and | | | | | | | | | | |
| advances to customers excluding finance leases | 3.25 | | 2.36 | | 2.22 | | 2.60 | | 2.90 | |
|
|
|
|
|
|
|
|
|
| |
| Provision as a percentage of total non-performing loans and advances | 31.14 | | 35.95 | | 27.76 | | 26.87 | | 24.11 | |
|
|
|
|
|
|
|
|
|
| |
| Abbey Annual Report and Accounts 2003 | 63 |
Back to Contents
Operating and Financial Review
Balance Sheet Operating Review continued
Overall, non performing loans and advances as a percentage of loans and advances to customers excluding finance leases have increased from 2.36% to 3.25%, and provisions as a percentage of total non-performing loans and advances have decreased from 35.95% to 31.14% in 2003. This movement is attributable to the provision raised in relation to the two contingent loans owed by Scottish Mutual Assurance plc and Scottish Provident Limited to Scottish Mutual Assurance Holdings Limited.
Potential problem loans and advances
The large number of relatively homogeneous residential mortgage loans has enabled Abbey to develop statistical techniques to estimate capital and interest losses with reasonable accuracy.
These techniques are used to establish the amount of provisions for bad and doubtful debts and interest suspensions. In addition, Abbey’s policy of initiating prompt contact with customers in arrears, together with the nature of the security held, means that a significant proportion of non-performing loans will not result in a loss.
The categories of non-performing loans and advances which are statisticaly most likely to result in losses are cases from 6 months to 12 months in arrears and 12 months or more in arrears. Losses on cases for which the property securing the loan has been taken into possession are evaluated individually with the amounts expected to be lost on realisation of the security being established with a high degree of certainty. The following table sets forth the values for each of these categories included in the non-performing loans and advances table above for each of the last five years.
| | 2003 | | 2002 | | 2001 | | 2000 | | 1999 | |
| | £m | | £m | | £m | | £m | | £m | |
|
|
|
|
|
|
|
|
|
| |
| 6 months to 12 | | | | | | | | | | |
| months in arrears | 62 | | 101 | | 114 | | 341 | | 466 | |
|
|
|
|
|
|
|
|
|
| |
| 12 months or | | | | | | | | | | |
| more in arrears | 44 | | 131 | | 11 | | 192 | | 297 | |
|
|
|
|
|
|
|
|
|
| |
| Properties in | | | | | | | | | | |
| possession | 7 | | 9 | | 14 | | 57 | | 80 | |
|
|
|
|
|
|
|
|
|
| |
The approximate anticipated bad debt write offs and recoveries in respect of 2004 are as follows:
| | Group | |
| Amounts written off | £m | |
|
| |
| Advances secured on residential properties – UK | 3 | |
|
| |
| Unsecured personal advances – UK | 16 | |
|
| |
| Corporate advances – UK | 300 | |
|
| |
| Other secured advances – UK | 59 | |
|
| |
| Advances secured on residential properties – non-UK | 10 | |
|
| |
| Other secured advances – non-UK | 22 | |
|
| |
| Unsecured personal advances – non-UK | 2 | |
|
| |
| | 512 | |
|
| |
| | | |
| | Group | |
| Recoveries | £m | |
|
| |
| Advances secured on residential properties – UK | 2 | |
|
| |
| Other secured advances – UK | 6 | |
|
| |
| Unsecured personal advances – UK | 25 | |
|
| |
| Advances secured on residential properties – non-UK | 6 | |
|
| |
| Other secured advances – non-UK | 2 | |
|
| |
| Unsecured personal advances – non-UK | 1 | |
|
| |
| | 42 | |
|
| |
Country risk exposure
Abbey has minimal exposure to countries currently experiencing liquidity problems.
Cross border outstandings
The operations of Abbey involve operations in non-local currencies. These cross border outstandings are controlled through a well-developed system of country limits, which are reviewed to avoid concentrations of transfer, economic or political risks.
Cross border outstandings, which exclude finance provided within the Abbey group of companies, are based on the country of domicile of the borrower or guarantor of ultimate risk and comprise loans and advances to customers and banks, finance lease debtors, interest-bearing investments and other monetary assets denominated in currencies other than the borrower’s local currency, but exclude balances arising from off-balance sheet financial instruments.
At 31 December 2003, the countries where cross border outstandings exceeded 1% of adjusted assets (as defined below) were the United States and Italy and consisted substantially of balances with banks and other financial institutions, governments and official institutions and commercial, industrial and other private sector entities. In this context, adjusted assets are total assets, as presented in the consolidated balance sheet, excluding long term assurance fund assets and balances arising from off-balance sheet financial instruments. On this basis, adjusted assets amounted to £146.6bn at 31 December 2003 compared to £174.4bn at 31 December 2002 and £182.1bn at 31 December 2001.
| 64 | Abbey Annual Report and Accounts 2003 |
Back to Contents
Operating and Financial Review
Balance Sheet Operating Review continued
Cross border outstandings exceeding 1% of adjusted assets
| | | | | | | | | | Commercial, | |
| | Banks and | | industrial and |
| As % of | | other | Governments | other |
| adjusted | | financial | and official | private sector |
| assets | Total | institutions | institutions | entities |
| % | £m | £m | £m | £m |
|
|
|
|
|
|
|
|
|
| |
| At 31 December 2003: | | | | | | | | | | |
|
|
|
|
|
|
|
|
|
| |
| United States | 3.09 | | 4,532 | | 2,693 | | 25 | | 1,815 | |
|
|
|
|
|
|
|
|
|
| |
| Italy | 1.27 | | 1,861 | | 376 | | 1,395 | | 65 | |
|
|
|
|
|
|
|
|
|
| |
| | | | | | | | | | | |
| At 31 December 2002: | | | | | | | | | | |
|
|
|
|
|
|
|
|
|
| |
| United States | 1.65 | | 2,884 | | 1,112 | | 19 | | 1,753 | |
|
|
|
|
|
|
|
|
|
| |
| Germany | 1.25 | | 2,176 | | 1,914 | | – | | 262 | |
|
|
|
|
|
|
|
|
|
| |
| Canada | 1.19 | | 2,068 | | 1,536 | | 53 | | 479 | |
|
|
|
|
|
|
|
|
|
| |
| Netherlands | 1.14 | | 1,993 | | 1,262 | | – | | 731 | |
|
|
|
|
|
|
|
|
|
| |
| | | | | | | | | | | |
| At 31 December 2001: | | | | | | | | | | |
|
|
|
|
|
|
|
|
|
| |
| Germany | 3.28 | | 5,976 | | 5,573 | | – | | 403 | |
|
|
|
|
|
|
|
|
|
| |
| Netherlands | 1.49 | | 2,721 | | 1,531 | | 30 | | 1,160 | |
|
|
|
|
|
|
|
|
|
| |
| United States | 1.83 | | 3,327 | | 1,138 | | 27 | | 2,162 | |
|
|
|
|
|
|
|
|
|
| |
| | | | | | | | | | | |
Cross border outstandings between 0.75% and 1% of adjusted assets
At 31 December 2003, Abbey had aggregate cross border outstandings with France of 0.96% of adjusted assets with aggregate outstandings of £1,408m.
At 31 December 2002, Abbey had no aggregate cross border outstandings between 0.75% and 1% of adjusted assets.
At 31 December 2001, Abbey had aggregate cross border outstandings with Canada of 0.82% and France of 0.96% of adjusted assets with aggregate outstandings of £1,491m and £1,754m respectively.
Tangible fixed assets
| | Year ended 31 December | |
|
|
|
|
|
| |
| | 2003 | | 2002 | | 2001 | |
| | £m | | £m | | £m | |
|
|
|
|
|
| |
| Capital expenditure | 49 | | 165 | | 143 | |
|
|
|
|
|
| |
Capital expenditure to 31 December 2003 amounted to £49m. The majority of this, £46m, was incurred by Banking and Savings mostly related to computer infrastructure.
Capital expenditure to 31 December 2002 amounted to £165m. Expenditure of £139m within Banking and Savings mostly related to computer infrastructure, telecommunications and ATM investment. In Investment and Protection and Treasury Services, £16m and £10m, respectively, were spent.
Capital expenditure to 31 December 2001 amounted to £143m. Expenditure was mainly within Banking and Savings and was £105m. In Investment and Protection and Treasury Services, £24m and £10m, respectively, were spent.
The property interest of Abbey at 31 December 2003 consisted of the following:
| | | | | Operating | | | Floor space | |
| | Freehold | | Leasehold | (1) | leases | | Total | | (Sq. m) | |
|
|
|
|
|
|
|
|
|
| |
| Banking and | | | | | | | | | | |
| Savings | 4 | | 86 | | 864 | | 954 | | 437,649 | |
|
|
|
|
|
|
|
|
|
| |
| Investment | | | | | | | | | | |
| and Protection | – | | 1 | | 9 | | 10 | | 4,611 | |
|
|
|
|
|
|
|
|
|
| |
| Treasury | 3 | | 9 | | – | | 12 | | 20,180 | |
|
|
|
|
|
|
|
|
|
| |
| First National | – | | 3 | | 27 | | 30 | | 13,569 | |
|
|
|
|
|
|
|
|
|
| |
| Other | 11 | | 25 | | – | | 36 | | 158,490 | |
|
|
|
|
|
|
|
|
|
| |
| | 18 | | 124 | | 900 | | 1,042 | | 634,499 | |
|
|
|
|
|
|
|
|
|
| |
| | |
| (1) | Abbey’s leasehold properties are subject to leases ranging from 1 to 999 years in maturity with the majority being 9 years in average duration and subject to annual contracted rental increases. |
The above table shows the number of unique property interests owned by Abbey. This is more than the number of individual properties as Abbey has more than one interest in some properties.
Included in the above table are 45 branches that were not occupied by Abbey as at 31 December 2003. Of Abbey’s individual properties, 892 are located in the UK, 36 in Europe and 12 in the rest of the world. There are no material environmental issues associated with the use of the above properties.
Abbey has four principal sites at Triton Square, London, Nelson Street, Bradford, St. Vincent Street, Glasgow and Grafton Gate East, Milton Keynes. The main computer centre is Shenley Wood House in Milton Keynes. These properties are held under operating leases. The registered office of Abbey is located at Abbey House, 2 Triton Square, Regent’s Place, London NW1 3AN.
Management believes its existing properties and those under construction, in conjunction with the operating lease arrangements in place with Mapeley Columbus Limited, are adequate and suitable for its business as presently conducted or to meet future business needs. All properties are adequately maintained.
| Abbey Annual Report and Accounts 2003 | 65 |
Back to Contents
Operating and Financial Review
Balance Sheet Operating Review continued
Capital management and resources
Capital management and capital allocation
Abbey adopts a centralised capital management approach, based on an assessment of both regulatory requirements and the economic capital impacts of our businesses. The various regulatory minimum capital criteria are augmented by internally assigned buffers. These ratios, buffers and restrictions, together with the relevant costs of differing capital instruments and a consideration of the various other capital management techniques are used to shape the most cost-effective structure to fulfil Abbey’s capital requirement.
The most obvious capital management techniques considered are the issue of equity, preference and subordinated capital instruments. Other levers available include tools involving equity and retained earnings (in particular dividend policy – internal and external). Another obvious measure is control of the amount of assets and risk on the balance sheet and, finally, the use of asset mitigation tools designed to reduce the capital required to back certain classes of asset by disposing of part of the risk associated with them.
Abbey’s capital allocation control process has two main determinants: the capital volumes approved to business units within the planning process, and the need to have access to a capital buffer which is sufficient to cover the capital impact of major contingent events or “capital shocks”. Capital allocation decisions will be influenced by comparison of returns earned on regulatory equity, conducted as part of planning reviews under which capital levels for operating divisions are approved or when additional capital requests are received.
Capital adequacy requirements
Capital adequacy and capital resources are monitored by Abbey on the basis of techniques developed by the Basel Committee on Banking Supervision (the “Basel Committee”) and subsequently implemented in the United Kingdom by the UK regulator, the Financial Services Authority.
The supervision of capital adequacy for banks in the EU is governed by EU Directives, and specifically the Banking Consolidation Directive and the Capital Adequacy Directives.
After continuing consultation, the Basel Committee intends to issue a final draft of the New Capital Accord in 2004 which will replace its 1988 Capital Accord. It is currently expected that the New Capital Accord will be implemented at the end of 2006, although implementation in the EU will be dependent on the adoption of a directive amending the Banking Consolidation Directive and the Capital Adequacy Directives. Although the Basel Committee intends to deliver a more risk-sensitive methodology, including a new operational risk capital charge, its goal is that, on average, the new approach should not raise nor lower regulatory capital for the banking sector. The international minimum risk asset ratio of 8% will be unchanged.
On the basis of the developing proposals, management does not expect any material adverse change to the business of Abbey to arise from the new capital adequacy framework.
Capital ratios
The following capital ratios, which exceed both the Basel Committee minimum risk asset ratio of 8% and the Financial Services Authority’s specific recommendation for Abbey, are calculated for Abbey as supervised by the Major Financial Groups Division of the Financial Services Authority. Abbey recognises the additional security inherent in Tier 1 capital, and hence also presents a Tier 1 to risk-weighted assets ratio. An equity Tier 1 ratio (Tier 1 excluding preference shares) is also presented.
Group capital
| | 2003 | | 2002 | | 2001 | |
| | £m | | £m | | £m | |
|
|
|
|
|
| |
| Balance sheet: | | | | | | |
|
|
|
|
|
| |
| Distributable reserves and | | | | | | |
| shareholders’ funds | 4,961 | | 6,196 | | 7,456 | |
|
|
|
|
|
| |
| Life assurance reserves | | | | | | |
| – non-distributable | 353 | | 153 | | 416 | |
|
|
|
|
|
| |
| Less goodwill recognised(1) | (1,068 | ) | (1,277 | ) | (2,505 | ) |
|
|
|
|
|
| |
| Core equity Tier 1 | 4,246 | | 5,072 | | 5,367 | |
|
|
|
|
|
| |
| Tier 1 capital instruments | 1,957 | | 2,174 | | 1,717 | |
|
|
|
|
|
| |
| Total Tier 1 capital | 6,203 | | 7,246 | | 7,084 | |
|
|
|
|
|
| |
| Undated subordinated debt | 2,976 | | 3,065 | | 3,181 | |
|
|
|
|
|
| |
| Dated subordinated debt | 2,513 | | 2,745 | | 2,719 | |
|
|
|
|
|
| |
| General provisions and other | 531 | | 394 | | 335 | |
|
|
|
|
|
| |
| Total Tier 2 capital | 6,020 | | 6,204 | | 6,235 | |
|
|
|
|
|
| |
| Less: | | | | | | |
|
|
|
|
|
| |
| PFS: investments in Life Assurance | | | | | | |
| businesses | (3,521 | ) | (3,384 | ) | (3,220 | ) |
|
|
|
|
|
| |
| PFS: non-life assurance | | | | | | |
| businesses | (93 | ) | (166 | ) | (177 | ) |
|
|
|
|
|
| |
| PBU | (476 | ) | (807 | ) | (584 | ) |
|
|
|
|
|
| |
| Total supervisory deductions | (4,090 | ) | (4,357 | ) | (3,981 | ) |
|
|
|
|
|
| |
| Total regulatory capital | 8,133 | | 9,093 | | 9,338 | |
|
|
|
|
|
| |
| Risk-weighted Assets: | | | | | | |
|
|
|
|
|
| |
| Personal Financial Services | 52,158 | | 46,019 | | 46,200 | |
|
|
|
|
|
| |
| Portfolio Business Unit | 8,997 | | 32,686 | | 38,258 | |
|
|
|
|
|
| |
| Total Abbey risk-weighted assets | 61,155 | | 78,705 | | 84,458 | |
|
|
|
|
|
| |
| Banking book | 55,873 | | 72,900 | | 76,341 | |
|
|
|
|
|
| |
| Trading book | 5,282 | | 5,805 | | 8,117 | |
|
|
|
|
|
| |
| Total Abbey risk-weighted assets | 61,155 | | 78,705 | | 84,458 | |
|
|
|
|
|
| |
| | | | | | | |
| Capital ratios: | | | | | | |
|
|
|
|
|
| |
| Risk assetratio (%) | 13.3 | % | 11.6 | .% | 11.1 | .% |
|
|
|
|
|
| |
| Tier 1 ratio (%) | 10.1 | % | 9.2 | % | 8.4 | % |
|
|
|
|
|
| |
| Equity Tier 1 ratio (%) | 6.9 | % | 6.4 | % | 6.4 | % |
|
|
|
|
|
| |
| | |
| (1) | Goodwill recognised in the table above of £1,068m differs to that quoted on a statutory basis of £961m, largely as it is deducted from Tier 1 in full on acquisition, whilst the statutory treatment is to amortise the charge over a number of years. The main driver of the decrease since December 2002 is the disposal of First National Bank. |
| 66 | Abbey Annual Report and Accounts 2003 |
Back to Contents
Operating and Financial Review
Balance Sheet Operating Review continued
Balance sheet
As at 31 December 2003, the Equity Tier 1 ratio was 6.9%, and the Risk Asset ratio was 13.3%. The increase in the Equity Tier 1 ratio over the previous year was primarily due to the reduction in Portfolio Business Unit risk-weighted assets exceeding the losses incurred in making those disposals.
Tier 1 capital decreased by £1,043m to £6,203m, as lower retained earnings and the redemption of $200m Tier 1 capital instruments reducing preference dividends by approximately £4m in 2003, and (approximately £10m going forward), were only partially offset by the write back of goodwill in relation to businesses sold during the year. Tier 1 capital includes a £353m non-distributable reserve, representing income from long-term assurance businesses recognised in the Profit and Loss Account, but not yet distributed by the long-term assurance funds.
The £184m decrease in Tier 2 capital was principally due to the amortisation of existing subordinated debt issues as they approach maturity, offset by a £137m increase in general provisions and other.
Supervisory deductions primarily represent capital utilised in non-banking businesses, mainly the equity investment and retained earnings in life assurance and insurance companies. The £267m decrease in the year largely reflects the £443m embedded value charges and rebasing and the Portfolio Business Unit unwind, partly offset by growth in Personal Financial Services life assurance operations.
Risk-weighted assets
Personal Financial Services risk-weighted assets have increased by £6.1bn, mainly reflecting growth in the mortgage asset net of securitisation. Treasury Services risk-weighted assets increased by £0.3bn, driven by growth in short-term trading assets. The remaining increase of £0.3bn principally relates to unsecured lending by cahoot.
Portfolio Business Unit risk-weighted assets have decreased by £23.7bn reflecting asset disposals and business sales.
| Reconciliation of Equity Tier 1 | | | | |
| | £m | | % | |
|
|
|
| |
| Equity Tier 1 at 1 January 2003 | | | 6.4 | |
|
|
|
| |
| Capital impacts: | | | | |
|
|
|
| |
| – Loss after tax(1) | (541 | ) | –0.7 | |
|
|
|
| |
| – Writeback of FNB goodwill on sale | 190 | | +0.2 | |
|
|
|
| |
| – Dividends and other(2) | (475 | ) | –0.6 | |
|
|
|
| |
| | (826 | ) | –1.1 | |
|
|
|
| |
| | | | | |
| Risk-weighted asset impacts: | | | | |
|
|
|
| |
| – Personal Financial Services growth | 6,139 | | –0.4 | |
|
|
|
| |
| – Sale of First National businesses | | | | |
| and Italian mortgage book | (5,622 | ) | +0.4 | |
|
|
|
| |
| – Wholesale Banking PBU | | | | |
| risk-weighted asset reduction | (17,588 | ) | +1.5 | |
|
|
|
| |
| – Other PBU | (479 | ) | +0.1 | |
|
|
|
| |
| | (17,550 | ) | +1.6 | |
|
|
|
| |
| Equity Tier 1 at 31 December 2003 | | | 6.9 | |
|
|
|
| |
| (1) | Loss after tax for regulatory capital purposes excludes goodwill amortisation, as goodwill is deducted from Tier 1 in full on acquisition. Additionally, the regulatory group structure excludes certain non-banking entities, resulting in a slightly different tax charge to that for the statutory group. |
| | |
| (2) | “Dividends and other” includes the net impact of ordinary dividends, preference dividends, scrip dividends and movements in minority interests (including joint ventures). |
Analysis of life assurance capital| | | | 2002 | |
| 2003 | | (restated) | |
| Value of long-term assurance business | £m | | £m | |
|
|
|
| |
| Discounted value of future profits | 1,171 | | 11,209 | |
|
|
|
| |
| Net assets held by long-term assurance funds | 1,101 | | 1,107 | |
|
|
|
| |
| Embedded value of the long-term | | | | |
| assurance business | 2,272 | | 2,316 | |
|
|
|
| |
| Contingent loan to Scottish Provident’s | | | | |
| with-profits sub fund(1) | 538 | | 619 | |
|
|
|
| |
| Total value of long-term assurance business | 2,810 | | 2,935 | |
|
|
|
| |
| Contingent loan to Scottish Mutual | 500 | | 500 | |
|
|
|
| |
| Other net assets of shareholder funds | 582 | | 348 | |
|
|
|
| |
| Total value of long-term assurance business | 3,892 | | 3,783 | |
|
|
|
| |
| (1) | The Scottish Provident with-profits fund has a liability to repay a debt to the Group in respect of a contingent loan established as part of the de-mutualisation scheme. A condition of the arrangement is that the surplus emerging on the non-participating fund accrues to the benefit of the with-profits fund until such time as the obligations under the loan are fully discharged, and that recourse for repayments on the loan is restricted to the surplus emerging on the Scottish Provident non-participating fund. The carrying value of the debt is covered by the current value of the future earnings on the non-participating fund. |
The embedded value of the long-term assurance business is made up of two elements: the discounted value of future profits and the net assets held by the long-term assurance funds.
The discounted value of future profits represents the present value of the surplus expected to emerge in the future from the business in force. This has fallen as a result of the embedded value charges and rebasing, including £373m relating to the pending introduction of new Financial Services Authority regulations in the life industry on “realistic” reporting and related matters.
The net assets held by the long-term assurance funds represent Abbey’s shareholders’ interest in the surplus retained within the long-term funds. This balance is essentially the retained profits of the funds plus capital injected. Although Abbey has made significant injections into the funds, it has remained broadly flat due to the loss incurred in the year.
The movement in the Scottish Provident contingent loan balance is due to an £80m provision for changes in tax law relating to the acquisition structure. The closing balance now consists of two loans as during the year the the surplus transferred to the with-profits fund from the non-participating fund totalled £215m. This replaces part of the existing loan of £215m with an equal contingent amount.
During 2001 Scottish Mutual received capital support from the Group in the form of a contingent loan of £500m.
Other net assets of shareholders’ funds represent Abbey’s interest in the assets of the life companies held outside the long-term funds. It includes unpaid interest on the Scottish Provident and Scottish Mutual contingent loans of £80m and £75m respectively.
| Abbey Annual Report and Accounts 2003 | 67 |
Back to Contents
Operating and Financial Review
Balance Sheet Operating Review continued
Movements in embedded value of the long-term assurance business
| | £m | |
|
| |
| Opening value as at 1 January 2003 | 2,316 | |
|
| |
| Transfers (to)/from shareholders’ funds | 10 | |
|
| |
| Increase in value of long-term business after tax | 110 | |
|
| |
| Investment variances and other adjustments | (369 | ) |
|
| |
| Capital injections from Abbey | 250 | |
|
| |
| Dividends paid to Abbey | (45 | ) |
|
| |
| Closing value at 31 December 2003 | 2,272 | |
|
| |
The increase in the value of long-term business of £161m pre-tax (£110m after tax) is achieved through ongoing management of the existing business and writing new business, and represents the value added before consideration of market movements. The Personal Financial Services portion is £186m pre-tax (including £16m of re-organisation costs not included in the trading result of £202m), and £134m after tax. The investment variances and other adjustments of £363m pre-tax (£369m after tax) relate to the adjustments to period end market values, guaranteed liabilities / market value adjustments and restructuring costs, but exclude the Scottish Provident contingent loan provision of £80m. During 2003, injections into the long-term funds included £220m to Scottish Provident, in three separate tranches (£120m in January 2003, £25m and £75m in March 2003) and £30m to Scottish Mutual in July 2003. Abbey National Life repaid £45m from the long-term fund in March 2003.
Life assurance cashflows| | At 31 | | At 31 | |
| December | | December | |
| 2003 | | 2002 | |
| | £m | | £m | |
|
|
|
| |
| Capital injections made from Group | 343 | | 917 | |
|
|
|
| |
| Dividends and interest paid to Group | (181 | ) | (51 | ) |
|
|
|
| |
| Net cashflows from Group | 162 | | 866 | |
|
|
|
| |
In total, including the shareholder funds, injections totalled £343m, with £181m dividends paid back to the centre. In March 2003, injections into the Abbey National Life shareholder fund totalled £90m while dividends out of the Abbey National Life shareholder fund totalled £135m (in addition to the £45m in dividends discussed above). A dividend of £1m was also paid to Abbey in February 2003 by Scottish Mutual International Fund Managers. Also, during July 2003, Scottish Mutual received a capital injection of £30m into its long-term fund. In July 2003 £2m and July and December 2003 £1m and £2m respectively, were paid into Abbey National Asset Managers.
Estimated life assurance ratios (1)
| | At 31 December 2003 | | At 31 December 2002 | |
|
|
|
|
|
|
|
| |
| | Scottish | | AN | | Scottish | | Scottish | | AN | | Scottish | |
| | Provident | | Life | | Mutual | (2) | Provident | | Life | | Mutual | (2) |
| | % | | % | | % | | % | | % | | % | |
|
|
|
|
|
|
|
| |
| Free asset ratio | 2.2 | | 5.0 | | 4.8 | | 1.7 | | 6.7 | | 0.2 | |
|
|
|
|
|
|
|
|
|
|
|
| |
| Solvency ratio | 164 | | 204 | | 231 | | 148 | | 240 | | 106 | |
|
|
|
|
|
|
|
| |
| | |
| (1) The solvency ratios for 2002 have been updated for the final figures included in the returns to the Financial Services Authority. |
Abbey manages its capital requirements on a consolidated basis. The ratios have been calculated according to the Financial Services Authority guidelines in force at that time.
With respect to Abbey National Life, the decrease is due to dividends paid and the capital strain of new business written being partly offset by the positive benefits of market movements and changes to the reserving basis. The improvement in Scottish Mutual is due to the negative impact of new business (including Scottish Provident branded protection business written in Scottish Mutual on a legal entity basis), a reduction in the implicit item as granted by the Financial Services Authority for solvency purposes from £250m to £125m, being offset by the positive impact of market movements and changes to the reserving basis.
The improvement in Scottish Provident is due to the benefit of capital injections, market movements and adjustments to the reserving basis. The reserving basis is currently being finalised and may affect the final ratio submitted to the Financial Services Authority.
| Off-Balance Sheet Arrangements |
| In the ordinary course of business, Abbey issues guarantees on behalf of customers. The significant types of guarantees are as follows: |
| > | It is normal in the United Kingdom to issue cheque guarantee cards to current account customers holding cheque books, as retailers do not generally accept cheques without such form of guarantee. The guarantee is not automatic but depends on the retailer having sight of the cheque guarantee card at the time the purchase is made. The bank is liable to honour these cheques even where the customer doesn’t have sufficient funds in his account. The bank’s guarantee liability is in theory the number of cheques in issue multiplied by the amount guaranteed per cheque, which can be between £50 and £250. In practice most customers will only write cheques when they have funds in their account to meet the cheque, and cheques are frequently presented without the benefit of the cheque guarantee. On this basis management have assessed the risk with respect to this guarantee as highly remote and consider the risk of loss as part of the provisioning requirement on bank accounts. |
| > | The Wholesale Bank previously purchased credit derivatives, as in-substance guarantees, within what is now Abbey’s Portfolio Business Unit, with the purpose of accepting credit risk when the returns from taking on such risk on an unfunded basis produced more attractive returns than on a funded basis through the granting of loans or purchase of securities. This activity has now been discontinued. This would have been included in the Wholesale Bank’s provisioning review. The Financial Products area of the Personal Financial Services Wholesale Bank continues to purchase credit derivatives on a trading basis, and these are treated as trading derivatives under both UK and US GAAP. |
| > | Standby letters of credit also represent the taking on of credit on behalf of customers when actual funding is not required, normally because a third party is not prepared to accept the credit risk of Abbey’s customer. These are also included in the normal creditprovisioning assessment alongside other forms of credit exposure |
| 68 | Abbey Annual Report and Accounts 2003 |
Back to Contents
Operating and Financial Review
Balance Sheet Operating Review continued
| > | Abbey, as is normal in such activity, gives representations and warranties on the sale of subsidiaries. The maximum potential amount of any claims made against these is significantly higher than actual settlements. Appropriate provision is made with respect to management’s best estimate of the likely outcome, either at the time of sale, or subsequently if additional information becomes available. |
See notes 46, 47 and 48 to the Consolidated Financial Statements for additional information regarding Abbey’s guarantees as well as its commitments and contingencies. In the ordinary course of business, Abbey also enters into securitisation transactions. The Holmes securitisation vehicles are consolidated under UK GAAP, though a linked presentation is used whereby the non-recourse securities liabilities of the vehicles are netted off on the face of the balance sheet against the related mortgage assets. The mortgage assets continue to be administered by Abbey.The Holmes securitisation vehicles provide Abbey with an important source of stable long-term funding and also a regulatory capital benefit. The assets are therefore treated as on-balance sheet. Under US GAAP the vehicles are deconsolidated in accordance with SFAS 140 and an interest-only strip calculated. This is a US GAAP adjustment only and does not affect the way the vehicles or underlying assets are managed.Liquidity disclosures
Liquidity risk is the potential that, although remaining solvent, Abbey does not have sufficient financial resources to enable it to meet its obligations as they fall due, or can secure them only at excessive cost. These obligations include the repayment of deposits on demand or at their contractual maturity; the repayment of loan capital and other borrowings as they mature; the payment of insurance policy benefits, claims and surrenders; the payment of lease obligations as they become due; the payment of operating expenses and taxation; the payment of dividends to shareholders; the ability to fund new and existing loan commitments; and the ability to take advantage of new business opportunities.
Abbey’s board is responsible for defining the liquidity management and control framework and has approved a Liquidity Risk Policy to cover major liquidity risks and define key liquidity limits. Along with its internal Liquidity Risk Policy control framework, Abbey abides by the “Sound Practices for Managing Liquidity in Banking Organisations” set out by the Basel Committee as its standard for liquidity risk management and control. Abbey also complies with the Financial Services Authority’s liquidity requirements, and has appropriate liquidity policies in place.
Analysis of cash flow movements
Cash flow forecasts at the consolidated and subsidiary levels are provided on a monthly basis, and we use trend and variance analyses to project future cash needs, making adjustments to the forecasts when needed. The table below shows our recent net cash flows:
| | Year ended 31 December | |
|
|
|
| |
| | 2003 | | 2002 | | 2001 | |
| | £m | | £m | | £m | |
|
|
|
|
|
| |
| Net cash (outflow) inflow | | | | | | |
| from operating activities | (32,678 | ) | (10,952 | ) | 1,740 | |
|
|
|
|
|
| |
| Net cash (outflow) from returns on | | | | | | |
| investments and servicing of finance | (372 | ) | (462 | ) | (424 | ) |
|
|
|
|
|
| |
| Taxation paid (outflow) | (99 | ) | (496 | ) | (446 | ) |
|
|
|
|
|
| |
| Net cash inflow/(outflow)from capital | | | | | | |
| expenditure and financial investment | 25,189 | | 9,555 | | (1,267 | ) |
|
|
|
|
|
| |
| Acquisitions and disposals | 8,803 | | (536 | ) | (371 | ) |
|
|
|
|
|
| |
| Equity dividends paid | (216 | ) | (648 | ) | (570 | ) |
|
|
|
|
|
| |
| Net cash (outflow) inflow | | | | | | |
| from financing | (193 | ) | 687 | | 1,308 | |
|
|
|
|
|
| |
| Increase (decrease) in cash | 434 | | (2,852 | ) | (30 | ) |
|
|
|
|
|
| |
| | |
2003 compared to 2002
Net cash movements increased by £3,286m to a net inflow of £434m in 2003 as compared with a net outflow of £2,852m in 2002. The increase was primarily due to: |
| > | an increase in the net outflow from operating activities due to a lower level of debt issuance consistent with the lower funding requirement arising from the run down of the Portfolio Business Unit; and |
| > | offsetting this was the net inflow arising from the significant sales of Portfolio Business Unit investment securities and subsidiaries. |
| | |
2002 compared to 2001
The increase in the net cash outflow of £2,822m in 2002 as compared with 2001 was primarily due to: |
| > | a net outflow of loans and advances to customers of £5,104m in 2002 as compared with a net inflow of £4,319m due to the higher volume of securitised mortgages in 2001; |
| > | an increase in the net inflow from sales of investment securities of £9,644m from £3,282m in 2001 to £12,926m in 2002; |
| > | a net inflow of £298m in 2001 from the issuance of ordinary share capital that was not repeated in 2002; and |
| > | a net outflow from the repayment of a loan in 2002 of £222m. |
| Abbey Annual Report and Accounts 2003 | 69 |
Back to Contents
Operating and Financial Review
Balance Sheet Operating Review continued
Sources of liquidity
Abbey has both wholesale and retail sources of funding and attracts them through a variety of entities. The retail sources primarily originate from the Retail savings business, which forms part of the core Personal Financial Services activity. Although primarily callable, these funds provide a stable and predictable core of liquidity due to the nature of the retail accounts and the breadth of personal customer relationships.
Abbey’s wholesale funding sources are diversified across funding types and geography. Through the wholesale markets, Abbey has active relationships with over 500 counterparts across a range of sectors, including banks, central banks, other financial institutions, corporates and investment funds. Other sources of funding include collateralised borrowings, securitisations (primarily mortgages) and long-term debt issuance. While there is no certainty regarding money market lines of credit extended to Abbey, they are actively managed as part of the ongoing business. Currently, no guaranteed lines of credit have been purchased, as they are not common in European banking practice.
The ability to sell assets quickly is also an important source of liquidity for Abbey. Abbey holds marketable investment securities, such as central bank eligible government and other debt securities, which could be disposed of, either by entering into sale and repurchase agreements, or by being sold to provide additional funding should the need arise. Abbey also makes use of asset securitisation arrangements to provide alternative funding sources.
Under Abbey’s Liquidity Risk Policy, in the calculation of liquidity ratios, Abbey only relies on 95% of retail deposits with an allowance for up to 5% of such deposits being withdrawn at any time. With respect to wholesale deposits, for a period up to and including a month, there is no reliance on external wholesale deposits being renewed. These approaches are more conservative than would be expected based on historical experience with respect to these types of deposits.
Short-term funding is accessed through money market instruments, including time deposits, certificates of deposit and commercial paper. Issuance activity in the US continued with the US branch expanding its counterparty base by 36% in 2003, reaching clients unable to deal with non-US domiciled entities. Abbey raised over £13bn of funding from the US time zone. Medium- to long-term funding is accessed primarily through the stand alone bond markets. In addition Abbey utilises its euro and, separately, Securities and Exchange Commission-registered medium-term note programmes. During 2003, Abbey National Treasury Services issued securities totalling £2bn from these and other debt funding programs. The major debt issuance programmes managed by Abbey National Treasury Services on its own behalf, except for the US commercial paper programme which is managed for Abbey National North America LLC, a guaranteed subsidiary of Abbey, are setforth below:
| Outstanding | | | |
| | at 31 | | | Markets | |
| | December | | | Issued | |
| Programme | 2003 | | | in: | |
|
|
|
|
| |
| $15bn medium-term notes | $9.2 | bn | | European | |
|
|
|
|
| |
| $7bn medium-term notes | $4.0 | bn | | United States | |
|
|
|
|
| |
| $4bn commercial paper | $0.2 | bn | | European | |
|
|
|
|
| |
| $20bn commercial paper | $1.7 | bn | | United States | |
|
|
|
|
| |
Uses of liquidity
The principal uses of liquidity for Abbey are the funding of Banking and Savings lending and investment securities, payment of interest expense, dividends paid to shareholders, and the repayment of debt. Our ability to pay dividends depends on a number of factors, including our regulatory capital requirements, distributable reserves and financial performance.
| | | | | | | | Payments due by period | |
|
|
|
|
|
|
|
| |
| Contractual obligations | | | Less than | | 1-3 | | 3-5 | | More than | |
| Total | | 1 year | | years | | years | | 5 years | |
| £m | | £m | | £m | | £m | | £m | |
|
|
|
|
|
|
|
| |
| | | | | | | | | | | |
| Liabilities | | | | | | | | | | |
| of long-term | | | | | | | | | | |
| assurance funds | 28,336 | | 967 | | 2,012 | | 2,534 | | 22,823 | |
|
|
|
|
|
|
|
|
|
| |
| Debt securities | | | | | | | | | | |
| in issue | 24,834 | | 14,724 | | 4,355 | | 2,941 | | 2,814 | |
|
|
|
|
|
|
|
|
|
| |
| Customer accounts | 4,163 | | 1,329 | | 295 | | 346 | | 2,193 | |
|
|
|
|
|
|
|
|
|
| |
| Deposits by banks | 471 | | 36 | | 8 | | 10 | | 417 | |
|
|
|
|
|
|
|
|
|
| |
| Subordinated | | | | | | | | | | |
| liabilities including | | | | | | | | | | |
| convertible debt | 6,337 | | 473 | | 520 | | – | | 5,344 | |
|
|
|
|
|
|
|
|
|
| |
| Operating leases | 1,849 | | 189 | | 255 | | 248 | | 1,157 | |
|
|
|
|
|
|
|
|
|
| |
| Purchase obligations | 1,111 | | 241 | | 332 | | 274 | | 264 | |
|
|
|
|
|
|
|
|
|
| |
| Other long-term | | | | | | | | | | |
| capital instruments | 742 | | – | | – | | 270 | | 472 | |
|
|
|
|
|
|
|
| |
| Total | 67,843 | | 17,959 | | 7,777 | | 6,623 | | 35,484 | |
|
|
|
|
|
|
|
| |
The repayment terms of the debt securities, customer accounts and deposits by banks may be accelerated in line with the covenants contained within the individual loan agreements. Based on previous experience, it is Abbey’s expectation that the undated subordinated liabilities will continue to be outstanding for the foreseeable future. Abbey has entered into significant outsourcing contracts where, in some circumstances, there is no minimum specified spending requirement. In these cases, anticipated spending volumes have been included within purchase obligations. The presentation of the above table would not be significantly different under US GAAP except that the liabilities of the long-term assurance funds would not be included.
Based upon the levels of resources within the business and the ability of Abbey to access the wholesale money markets or issue debt securities should the need arise, Abbey believes that its overall liquidity is sufficient to meet current obligations to customers, policy holders and debt holders, to support expectations for future changes in asset and liability levels, and to carry on normal operations.
| 70 | Abbey Annual Report and Accounts 2003 |
Back to Contents
Operating and Financial Review
Balance Sheet Operating Review continued
Average balance sheet (4, 5)| | | | | | 2003 | | | | | | 2002 | | | | | | 2001 | |
|
|
|
|
|
|
|
|
|
|
|
|
|
|
|
|
|
| |
| Average | | | | Average | | Average | | | | Average | | Average | | | | Average | |
| | balance | | Interes | (1) | rate | | balance | | Interest | (1) | rate | | balance | | Interest | (1) | rate | |
| Assets | £m | | £m | | % | | £m | | £m | | % | | £m | | £m | | % | |
|
|
|
|
|
|
|
|
|
|
|
|
|
|
|
|
|
| |
| Loans and advances to banks | | | | | | | | | | | | | | | | | | |
|
|
|
|
|
|
|
|
|
|
|
|
|
|
|
|
|
| |
| UK | 3,685 | | 155 | | 4.21 | | 3,872 | | 120 | | 3.10 | | 4,050 | | 212 | | 5.23 | |
|
|
|
|
|
|
|
|
|
|
|
|
|
|
|
|
|
| |
| Non-UK | 289 | | 7 | | 2.42 | | 638 | | 41 | | 6.43 | | 382 | | 19 | | 4.97 | |
|
|
|
|
|
|
|
|
|
|
|
|
|
|
|
|
|
| |
| Loans and advances to customers(2) | | | | | | | | | | | | | | | | | | |
|
|
|
|
|
|
|
|
|
|
|
|
|
|
|
|
|
| |
| UK | 83,057 | | 4,373 | | 5.27 | | 83,457 | | 4,868 | | 5.83 | | 76,859 | | 5,344 | | 6.95 | |
|
|
|
|
|
|
|
|
|
|
|
|
|
|
|
|
|
| |
| Non-UK | 4,061 | | 174 | | 4.28 | | 2,879 | | 150 | | 5.20 | | 2,065 | | 124 | | 6.00 | |
|
|
|
|
|
|
|
|
|
|
|
|
|
|
|
|
|
| |
| Lease debtors | | | | | | | | | | | | | | | | | | |
|
|
|
|
|
|
|
|
|
|
|
|
|
|
|
|
|
| |
| UK | 3,098 | | 140 | | 4.52 | | 3,382 | | 202 | | 5.96 | | 3,894 | | 275 | | 7.07 | |
|
|
|
|
|
|
|
|
|
|
|
|
|
|
|
|
|
| |
| Non-UK | 59 | | 2 | | 3.39 | | 68 | | 2 | | 2.94 | | 27 | | 1 | | 3.70 | |
|
|
|
|
|
|
|
|
|
|
|
|
|
|
|
|
|
| |
| Debt securities | | | | | | | | | | | | | | | | | | |
|
|
|
|
|
|
|
|
|
|
|
|
|
|
|
|
|
| |
| UK | 9,284 | | 324 | | 3.49 | | 26,208 | | 941 | | 3.59 | | 36,544 | | 1,833 | | 5.02 | |
|
|
|
|
|
|
|
|
|
|
|
|
|
|
|
|
|
| |
| Non-UK | 2,518 | | 69 | | 2.74 | | 15,828 | | 444 | | 2.81 | | 12,747 | | 579 | | 4.54 | |
|
|
|
|
|
|
|
|
|
|
|
|
|
|
|
|
|
| |
| Total average interest-earning assets | | | | | | | | | | | | | | | | | | |
| and interest income – banking | 106,051 | | 5,244 | | 4.94 | | 136,332 | | 6,768 | | 4.96 | | 136,568 | | 8,387 | | 6.14 | |
|
|
|
|
|
|
|
|
|
|
|
|
|
|
|
|
|
| |
| Total average interest-earning assets | | | | | | | | | | | | | | | | | | |
| and interest income – trading | 41,655 | | 978 | | 2.44 | | 42,696 | | 1,360 | | 3.19 | | 38,365 | | 1,854 | | 4.83 | |
|
|
|
|
|
|
|
|
|
|
|
|
|
|
|
|
|
| |
| Total average interest-earning | | | | | | | | | | | | | | | | | | |
| assets and interest income | 147,706 | | 6,222 | | 4.21 | | 179,028 | | 8,128 | | 4.54 | | 174,933 | | 10,241 | | 5.85 | |
|
|
|
|
|
|
|
|
|
|
|
|
|
|
|
|
|
| |
| Provision for loan losses | (773 | ) | – | | – | | (652 | ) | – | | – | | (591 | ) | – | | – | |
|
|
|
|
|
|
|
|
|
|
|
|
|
|
|
|
|
| |
| Non-interest-earning assets: | | | | | | | | | – | | | | | | | | | |
|
|
|
|
|
|
|
|
|
|
|
|
|
|
|
|
|
| |
| Long term assurance fund assets | 29,757 | | – | | – | | 26,939 | | – | | – | | 21,727 | | – | | – | |
|
|
|
|
|
|
|
|
|
|
|
|
|
|
|
|
|
| |
| Other | 17,429 | | – | | – | | 12,592 | | – | | – | | 12,560 | | – | | – | |
|
|
|
|
|
|
|
|
|
|
|
|
|
|
|
|
|
| |
| Total average assets and interest income | 194,119 | | 6,222 | | 3.21 | | 217,907 | | 8,128 | | 3.73 | | 208,629 | | 10,241 | | 4.91 | |
|
|
|
|
|
|
|
|
|
|
|
|
|
|
|
|
|
| |
| Non-UK assets as a percentage of total | 9.70 | % | – | | – | | 8.90 | % | – | | – | | 7.29 | % | – | | – | |
|
|
|
|
|
|
|
|
|
|
|
|
|
|
|
|
|
| |
| Total average interest-earning | | | | | | | | | | | | | | | | | | |
| assets and net interest income | 147,706 | | 2,148 | | 4.21 | | 179,028 | | 2,689 | | 1.50 | | 174,933 | | 2,711 | | 1.55 | |
|
|
|
|
|
|
|
|
|
|
|
|
|
|
|
|
|
| |
| | | | | | | | | | | | | | | | | | | |
| Liabilities | | | | | | | | | | | | | | | | | | |
|
|
|
|
|
|
|
|
|
|
|
|
|
|
|
|
|
| |
| Deposits by banks | | | | | | | | | | | | | | | | | | |
|
|
|
|
|
|
|
|
|
|
|
|
|
|
|
|
|
| |
| UK | 7,144 | | 244 | | 3.42 | | 8,159 | | 262 | | 3.21 | | 11,637 | | 527 | | 4.53 | |
|
|
|
|
|
|
|
|
|
|
|
|
|
|
|
|
|
| |
| Non-UK | 1,761 | | 24 | | 1.36 | | 3,758 | | 65 | | 1.73 | | 1,066 | | 50 | | 4.71 | |
|
|
|
|
|
|
|
|
|
|
|
|
|
|
|
|
|
| |
| Customer accounts – retail demand deposits (3) | | | | | | | | | | | | | | | | | | |
|
|
|
|
|
|
|
|
|
|
|
|
|
|
|
|
|
| |
| UK | 42,477 | | 1,061 | | 2.50 | | 38,727 | | 1,090 | | 2.82 | | 36,962 | | 1,288 | | 3.48 | |
|
|
|
|
|
|
|
|
|
|
|
|
|
|
|
|
|
| |
| Non-UK | 1,260 | | 28 | | 2.22 | | 1,320 | | 33 | | 2.52 | | 1,339 | | 53 | | 3.99 | |
|
|
|
|
|
|
|
|
|
|
|
|
|
|
|
|
|
| |
| Customer accounts – retail time deposits(3) | | | | | | | | | | | | | | | | | | |
|
|
|
|
|
|
|
|
|
|
|
|
|
|
|
|
|
| |
| UK | 12,620 | | 409 | | 3.25 | | 14,396 | | 467 | | 3.24 | | 12,664 | | 614 | | 4.85 | |
|
|
|
|
|
|
|
|
|
|
|
|
|
|
|
|
|
| |
| Non-UK | 4,083 | | 150 | | 3.67 | | 3,417 | | 107 | | 3.13 | | 3,150 | | 154 | | 4.87 | |
|
|
|
|
|
|
|
|
|
|
|
|
|
|
|
|
|
| |
| Customer accounts – wholesale deposits(3) | | | | | | | | | | | | | | | | | | |
|
|
|
|
|
|
|
|
|
|
|
|
|
|
|
|
|
| |
| UK | 8,057 | | 280 | | 3.48 | | 10,203 | | 335 | | 3.29 | | 8,571 | | 385 | | 4.49 | |
|
|
|
|
|
|
|
|
|
|
|
|
|
|
|
|
|
| |
| Non-UK | 158 | | 2 | | 1.27 | | 463 | | 7 | | 1.42 | | 400 | | 17 | | 4.18 | |
|
|
|
|
|
|
|
|
|
|
|
|
|
|
|
|
|
| |
| Bonds and medium-term notes | | | | | | | | | | | | | | | | | | |
|
|
|
|
|
|
|
|
|
|
|
|
|
|
|
|
|
| |
| UK | 14,002 | | 433 | | 3.09 | | 17,546 | | 634 | | 3.61 | | 23,339 | | 1,136 | | 4.86 | |
|
|
|
|
|
|
|
|
|
|
|
|
|
|
|
|
|
| |
| Non-UK | 395 | | 6 | | 1.52 | | 761 | | 15 | | 1.92 | | 936 | | 35 | | 3.78 | |
|
|
|
|
|
|
|
|
|
|
|
|
|
|
|
|
|
| |
| Other debt securities in issue | | | | | | | | | | | | | | | | | | |
|
|
|
|
|
|
|
|
|
|
|
|
|
|
|
|
|
| |
| UK | 6,551 | | 199 | | 3.04 | | 12,107 | | 467 | | 3.86 | | 18,560 | | 950 | | 5.12 | |
|
|
|
|
|
|
|
|
|
|
|
|
|
|
|
|
|
| |
| Non-UK | 11,963 | | 180 | | 1.50 | | 25,234 | | 541 | | 2.15 | | 13,323 | | 513 | | 3.86 | |
|
|
|
|
|
|
|
|
|
|
|
|
|
|
|
|
|
| |
| Dated and undated loan capital | | | | | | | | | | | | | | | | | | |
| and other subordinated liabilities | | | | | | | | | | | | | | | | | | |
|
|
|
|
|
|
|
|
|
|
|
|
|
|
|
|
|
| |
| UK | 6,875 | | 311 | | 4.52 | | 6,526 | | 324 | | 4.96 | | 5,872 | | 302 | | 5.14 | |
|
|
|
|
|
|
|
|
|
|
|
|
|
|
|
|
|
| |
| Non-UK | 421 | | 7 | | 1.66 | | 586 | | 41 | | 7.00 | | 639 | | 34 | | 5.29 | |
|
|
|
|
|
|
|
|
|
|
|
|
|
|
|
|
|
| |
| Other interest-bearing liabilities | | | | | | | | | | | | | | | | | | |
|
|
|
|
|
|
|
|
|
|
|
|
|
|
|
|
|
| |
| UK | 19 | | 1 | | 5.26 | | 47 | | 1 | | 2.13 | | 27 | | 2 | | 7.18 | |
|
|
|
|
|
|
|
|
|
|
|
|
|
|
|
|
|
| |
| Non-UK | 2 | | – | | 3.25 | | 49 | | 1 | | 2.04 | | 3 | | 1 | | 7.34 | |
|
|
|
|
|
|
|
|
|
|
|
|
|
|
|
|
|
| |
| | |
| Abbey Annual Report and Accounts 2003 | 71 |
Back to Contents
Operating and Financial Review
Balance Sheet Operating Review continued
| | | | | 2003 | 2002 | | | | 2001 | | |
|
|
|
|
|
|
|
|
|
|
|
|
|
|
|
|
|
| |
| | Average | | | | Average | | Average | | | | Average | | Average | | | | Average | |
| | balance | | Interest | (1) | rate | | balance | | Interest | (1) | rate | | balance | | Interest | (1) | rate | |
| | £m | | £m | | % | | £m | | £m | | % | | £m | | £m | | % | |
|
|
|
|
|
|
|
|
|
|
|
|
|
|
|
|
|
| |
| Total average interest-bearing | | | | | | | | | | | | | | | | | | |
| liabilities and interest expense – banking | 117,788 | | 3,335 | | 2.83 | | 143,299 | | 4,390 | | 3.06 | | 138,488 | | 6,061 | | 4.39 | |
|
|
|
|
|
|
|
|
|
|
|
|
|
|
|
|
|
| |
| Total average interest-bearing | | | | | | | | | | | | | | | | | | |
| liabilities and interest expense – trading | 24,269 | | 739 | | 3.04 | | 27,174 | | 1,049 | | 3.86 | | 30,069 | | 1,488 | | 4.95 | |
|
|
|
|
|
|
|
|
|
|
|
|
|
|
|
|
|
| |
| Total average interest-bearing | | | | | | | | | | | | | | | | | | |
| liabilities and interest expense | 142,057 | | 4,074 | | 2.87 | | 170,473 | | 5,439 | | 3.19 | | 168,557 | | 7,549 | | 4.49 | |
|
|
|
|
|
|
|
|
|
|
|
|
|
|
|
|
|
| |
| Non-interest-bearing liabilities: | | | | | | | | | | | | | | | | | | |
|
|
|
|
|
|
|
|
|
|
|
|
|
|
|
|
|
| |
| Long term assurance fund liabilities | 31,763 | | – | | – | | 26,939 | | – | | – | | 21,727 | | – | | – | |
|
|
|
|
|
|
|
|
|
|
|
|
|
|
|
|
|
| |
| Other | 13,994 | | – | | – | | 13,635 | | – | | – | | 11,054 | | – | | – | |
|
|
|
|
|
|
|
|
|
|
|
|
|
|
|
|
|
| |
| Shareholders’ funds | 6,300 | | – | | – | | 6,860 | | – | | – | | 7,291 | | – | | – | |
|
|
|
|
|
|
|
|
|
|
|
|
|
|
|
|
|
| |
| Total average liabilities, shareholders’ | | | | | | | | | | | | | | | | | | |
| funds and interest expense | 194,114 | | 4,074 | | 2.10 | | 217,907 | | 5,439 | | 2.50 | | 208,629 | | 7,549 | | 3.61 | |
|
|
|
|
|
|
|
|
|
|
|
|
|
|
|
|
|
| |
| Non-UK liabilities as a percentage | | | | | | | | | | | | | | | | | | |
| of total | 14.95 | % | – | | – | | 16.33 | % | – | | – | | 9.99 | % | – | | – | |
|
|
|
|
|
|
|
|
|
|
|
|
|
|
|
|
|
| |
| Interest income as a percentage of | | | | | | | | | | | | | | | | | | |
| average interest-earning assets | | | | | 4.17 | | | | | | 4.54 | | | | | | 5.85 | |
|
|
|
|
|
|
|
|
|
|
|
|
|
|
|
|
|
| |
| Interest expense as a percentage | | | | | | | | | | | | | | | | | | |
| of average interest-bearing liabilities | | | | | 2.96 | | | | | | 3.19 | | | | | | 4.47 | |
|
|
|
|
|
|
|
|
|
|
|
|
|
|
|
|
|
| |
| Interest spread | | | | | 1.35 | | | | | | 1.35 | | | | | | 1.39 | |
|
|
|
|
|
|
|
|
|
|
|
|
|
|
|
|
|
| |
| Net interest margin | | | | | 1.45 | | | | | | 1.50 | | | | | | 1.55 | |
|
|
|
|
|
|
|
|
|
|
|
|
|
|
|
|
|
| |
| | | | | | | | | | | | | | | | | | | |
| Interest-earning assets, interest-bearing liabilities and the associated interest reflect a “linked presentation” treatment for certain securitisedassets (see notes to the Consolidated Financial Statements). If a linked presentation was not adopted, the interest spread and net interest margin would be as follows: | |
| |
| |
|
|
|
|
|
|
|
|
|
|
|
|
|
|
|
|
|
| |
| Interest spread | | | | | 1.21 | | | | | | 1.25 | | | | | | 1.32 | |
|
|
|
|
|
|
|
|
|
|
|
|
|
|
|
|
|
| |
| Net interest margin | | | | | 1.32 | | | | | | 1.40 | | | | | | 1.47 | |
|
|
|
|
|
|
|
|
|
|
|
|
|
|
|
|
|
| |
| (1) | For the purpose of the average balance sheet, interest income and interest expense have been stated after allocation of interest on instruments entered into for hedging purposes. |
| |
| (2) | Loans and advances to customers includes non-performing loans. See “Analysis of end-of-year provisions on loans and advances to customers” and “Potential credit risk elements in loans and advances” above. |
| | |
| (3) | Demand deposits, time deposits and wholesale deposits are defined under “Deposits” above. |
| | |
| (4) | Abbey National Treasury Services prepares averages using average daily balances, whereas the remainder of Abbey uses month end averages. These averages are representative of the operations of Abbey. |
| | |
| (5) | The ratio of average interest-earning assets to interest-bearing liabilities for the year ended 31 December 2003 was 1.04% (2002: 1.05%, 2001: 1.04%). |
| | |
| 72 | Abbey Annual Report and Accounts 2003 |
Back to Contents
Operating and Financial Review
Balance Sheet Operating Reviewcontinued
Interest rate sensitivity
Interest rate sensitivity refers to the relationship between interest rates and net interest income resulting from the periodic repricing of assets and liabilities. The largest single administered rate items in the Abbey balance sheet are residential mortgages and retail deposits, the majority of which bear interest at variable rates. The contractual maturity of mortgage loans is generally more than five years, but the maturity of the majority of retail deposits is primarily within three months. This apparent mismatch gives rise to issues which are addressed by Abbey in its liquidity management. However, their effect on interest rate management is less significant. Abbey has the ability to reprice both its retail variable rate liabilities and variable rate mortgage assets, subject to the constraints imposed by the competitive situation in the market place. Management believes this ability enables Abbey to mitigate the impact of interest rate movements on net interest income in UK Banking and Savings. Abbey also offers fixed-rate mortgages and savings products on which the interest rate paid by or to the customer is fixed for an agreed period of time at the start of the contract. Abbey manages the margin on fixed-rate products by the use of derivatives matching the fixed-rate maturity profiles. The risk of prepayment is reduced by imposing penalty charges if the customers terminate their contracts early. Wherever possible, Abbey seeks to minimise the risks associated with movements in market prices such as interest rates or exchange rates. However, given the nature of financial activities, a level of market risk is inevitable. Abbey has developed and implemented structures and systems to manage this market risk exposure.
For additional information, see “Risk management” elsewhere in this Annual Report.
Changes in net interest income – volume and rate analysis
The following table allocates changes in interest income, interest expense and net interest income between changes in volume and changes in rate for the years ended 31 December 2003 and 2002. Volume and rate variances have been calculated on the movement in the average balances and the change in the interest rates on average interest-earning assets and average interest-bearing liabilities. The variance caused by changes in both volume and rate has been alocated to rate changes.
| Abbey Annual Report and Accounts 2003 | 73 |
Back to Contents
Operating and Financial Review
Balance Sheet Operating Review continued
| | | | | | 2003/2002 | | | | | | 2002/2001 | |
|
|
|
|
|
|
|
|
|
|
|
| |
| | Total | | Changes due to | | Total | | Changes due to | |
| | change | | increase/(decrease) in: | | change | | increase/(decrease) in: | |
|
|
|
|
|
|
|
|
|
|
|
| |
| | | Volume | | Rate | | | | Volume | | Rate | |
| Interest income | £m | | £m | | £m | | £m | | £m | | £m | |
|
|
|
|
|
|
|
|
|
|
|
| |
| Loans and advances to banks | | | | | | | | | | | | |
|
|
|
|
|
|
|
|
|
|
|
| |
| UK | 35 | | (6 | ) | 41 | | (93 | ) | (8 | ) | (85 | ) |
|
|
|
|
|
|
|
|
|
|
|
| |
| Non-UK | (34 | ) | (23 | ) | (11 | ) | 22 | | 13 | | 9 | |
|
|
|
|
|
|
|
|
|
|
|
| |
| Loans and advances to customers | | | | | | | | | | | | |
|
|
|
|
|
|
|
|
|
|
|
| |
| UK | (495 | ) | (23 | ) | (472 | ) | (475 | ) | 457 | | (932 | ) |
|
|
|
|
|
|
|
|
|
|
|
| |
| Non-UK | 24 | | 61 | | (37 | ) | 26 | | 49 | | (23 | ) |
|
|
|
|
|
|
|
|
|
|
|
| |
| Lease debtors | | | | | | | | | | | | |
|
|
|
|
|
|
|
|
|
|
|
| |
| UK | (62 | ) | (17 | ) | (45 | ) | (73 | ) | (36 | ) | (37 | ) |
|
|
|
|
|
|
|
|
|
|
|
| |
| Non-UK | – | | – | | – | | (1 | ) | (1 | ) | – | |
|
|
|
|
|
|
|
|
|
|
|
| |
| Debt securities | | | | | | | | | | | | |
|
|
|
|
|
|
|
|
|
|
|
| |
| UK | (617 | ) | (608 | ) | (9 | ) | (891 | ) | (519 | ) | (372 | ) |
|
|
|
|
|
|
|
|
|
|
|
| |
| Non-UK | (375 | ) | (374 | ) | (1 | ) | (134 | ) | 140 | | (274 | ) |
|
|
|
|
|
|
|
|
|
|
|
| |
| Trading assets | | | | | | | | | | | | |
|
|
|
|
|
|
|
|
|
|
|
| |
| UK | (314 | ) | (36 | ) | (278 | ) | (635 | ) | (148 | ) | (487 | ) |
|
|
|
|
|
|
|
|
|
|
|
| |
| Non-UK | (68 | ) | – | | (68 | ) | 141 | | 141 | | – | |
|
|
|
|
|
|
|
|
|
|
|
| |
| Total interest income | | | | | | | | | | | | |
|
|
|
|
|
|
|
|
|
|
|
| |
| UK | (1,453 | ) | (690 | ) | (763 | ) | (2,167 | ) | (254 | ) | (1,913 | ) |
|
|
|
|
|
|
|
|
|
|
|
| |
| Non-UK | (453 | ) | (336 | ) | (117 | ) | 54 | | 342 | | (288 | ) |
|
|
|
|
|
|
|
|
|
|
|
| |
| | (1,906 | ) | (1,026 | ) | (880 | ) | (2,113 | ) | 88 | | (2,201 | ) |
|
|
|
|
|
|
|
|
|
|
|
| |
| | | | | | | | | | | | | |
| Interest expense | | | | | | | | | | | | |
|
|
|
|
|
|
|
|
|
|
|
| |
| Deposits by banks | | | | | | | | | | | | |
|
|
|
|
|
|
|
|
|
|
|
| |
| UK | (18 | ) | (33 | ) | 15 | | (265 | ) | (158 | ) | (107 | ) |
|
|
|
|
|
|
|
|
|
|
|
| |
| Non-UK | (41 | ) | (35 | ) | (6 | ) | 15 | | 127 | | ( 112 | ) |
|
|
|
|
|
|
|
|
|
|
|
| |
| Customer accounts – retail demand deposits | | | | | | | | | | | | |
|
|
|
|
|
|
|
|
|
|
|
| |
| UK | (29 | ) | 106 | | (135 | ) | (199 | ) | 61 | | (260 | ) |
|
|
|
|
|
|
|
|
|
|
|
| |
| Non-UK | (5 | ) | (1 | ) | (4 | ) | (20 | ) | (1 | ) | (19 | ) |
|
|
|
|
|
|
|
|
|
|
|
| |
| Customer accounts – retail time deposits | | | | | | | | | | | | |
|
|
|
|
|
|
|
|
|
|
|
| |
| UK | (58 | ) | (58 | ) | – | | (147 | ) | 84 | | (231 | ) |
|
|
|
|
|
|
|
|
|
|
|
| |
| Non-UK | 43 | | 21 | | 22 | | (47 | ) | 13 | | (60 | ) |
|
|
|
|
|
|
|
|
|
|
|
| |
| Customer accounts – wholesale deposits | | | | | | | | | | | | |
|
|
|
|
|
|
|
|
|
|
|
| |
| UK | (55 | ) | (71 | ) | 16 | | (50 | ) | 73 | | (123 | ) |
|
|
|
|
|
|
|
|
|
|
|
| |
| Non-UK | (5 | ) | (4 | ) | (1 | ) | (10 | ) | (3 | ) | (7 | ) |
|
|
|
|
|
|
|
|
|
|
|
| |
| Bonds and medium-term notes | | | | | | | | | | | | |
|
|
|
|
|
|
|
|
|
|
|
| |
| UK | (201 | ) | (128 | ) | (73 | ) | (502 | ) | (282 | ) | (220 | ) |
|
|
|
|
|
|
|
|
|
|
|
| |
| Non-UK | (9 | ) | (7 | ) | (2 | ) | (20 | ) | (7 | ) | (13 | ) |
|
|
|
|
|
|
|
|
|
|
|
| |
| Other debt securities in issue | | | | | | | | | | | | |
|
|
|
|
|
|
|
|
|
|
|
| |
| UK | (268 | ) | (214 | ) | (54 | ) | (483 | ) | (330 | ) | (153 | ) |
|
|
|
|
|
|
|
|
|
|
|
| |
| Non-UK | (361 | ) | (285 | ) | (76 | ) | 28 | | 460 | | (432 | ) |
|
|
|
|
|
|
|
|
|
|
|
| |
| Dated and undated loan capital and other subordinated liabilities | | | | | | | | | | | | |
|
|
|
|
|
|
|
|
|
|
|
| |
| UK | (13 | ) | 17 | | (30 | ) | 22 | | 23 | | (1 | ) |
|
|
|
|
|
|
|
|
|
|
|
| |
| Non-UK | (34 | ) | (11 | ) | (23 | ) | 7 | | (3 | ) | 10 | |
|
|
|
|
|
|
|
|
|
|
|
| |
| Other interest-bearing liabilities | | | | | | | | | | | | |
|
|
|
|
|
|
|
|
|
|
|
| |
| UK | – | | – | | – | | (1 | ) | – | | (1 | ) |
|
|
|
|
|
|
|
|
|
|
|
| |
| Non-UK | (1 | ) | – | | (1 | ) | 1 | | – | | 1 | |
|
|
|
|
|
|
|
|
|
|
|
| |
| Trading liabilities | | | | | | | | | | | | |
|
|
|
|
|
|
|
|
|
|
|
| |
| UK | (297 | ) | (123 | ) | (174 | ) | (439 | ) | (223 | ) | (216 | ) |
|
|
|
|
|
|
|
|
|
|
|
| |
| Non-UK | (13 | ) | (7 | ) | (6 | ) | – | | – | | – | |
|
|
|
|
|
|
|
|
|
|
|
| |
| Total interest expense | | | | | | | | | | | | |
|
|
|
|
|
|
|
|
|
|
|
| |
| UK | (939 | ) | (504 | ) | (435 | ) | (2,064 | ) | (752 | ) | (1,312 | ) |
|
|
|
|
|
|
|
|
|
|
|
| |
| Non-UK | (426 | ) | (329 | ) | (97 | ) | (46 | ) | 586 | | (632 | ) |
|
|
|
|
|
|
|
|
|
|
|
| |
| | (1,365 | ) | (833 | ) | (532 | ) | (2,110 | ) | (166 | ) | (1,944 | ) |
|
|
|
|
|
|
|
|
|
|
|
| |
| Net interest income | (541 | ) | (193 | ) | (348 | ) | (3 | ) | 254 | | (257 | ) |
|
|
|
|
|
|
|
|
|
|
|
| |
| 74 | Abbey Annual Report and Accounts 2003 |
Back to Contents
Operating and Financial Review
Risk Management
Introduction
Abbey’s risk management focuses on the major areas of credit risk, market risk, liquidity risk, insurance risk, residual value risk and operational risk. Authority flows from the Abbey National plc Board of Directors to the Chief Executive Officer and from him to his direct reports. Delegation of authority is to individuals. Formal standing committees are maintained for effective management or oversight. Their authority is derived from the person they are intended to assist.
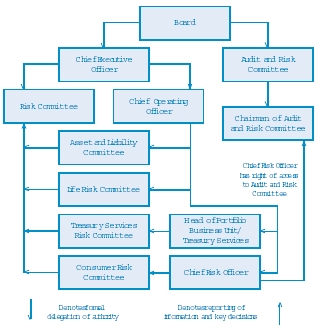
The diagram above shows the structure that was in operation at the end of 2003 in respect of risk management and oversight. Changes are described in the text that follows.
Board: this is the primary governing body. Its role is largely determined by legal and regulatory responsibilities and requirements. Its risk-control responsibilities include setting risk appetite, approving risk policies and reviewing risk profile.
Audit and Risk Committee: this is a key Board committee. Its risk-control responsibilities include reviewing the effectiveness and integrity of risk-management systems and controls, reviewing the risk-governance structure and reviewing compliance with risk-control policies and procedures. It is the duty of the committee to review the effectiveness of the control mechanisms for the management of risk. It is not the responsibility of the committee to form a judgement about the acceptability or appropriateness of these risks. This remains the responsibility of the Board and will be discharged through the Chief Executive Officer.
Risk Committee: this is established under the Chief Executives Officer’s specific authority and comprises senior executives and the Chief Risk Officer. This is a key management mechanism to facilitate cross divisional discussion and consultation, and make recommendations to the Chief Executive Officer on risk control and management issues.
Asset and Liability Committee: this is established under the Chief Operating Officer’s authority and comprises selected senior executives and relevant experts. This committee assists the Chief Operating Officer in discharging his responsibilities for cross divisional asset and liability management, capital structure, funding and liquidity.
Life Risk Committee: this was formed in December 2003 with responsibility for advising the Chief Operating Officer and Chief Risk Officer on matters relating to all the risks facing the balance sheet and Profit and Loss Account of the life companies and related investment businesses.
It replaced the Investment and Asset Management Risk Committee which was formed under the Chief Operating Officer’s authority. The Investment and Asset Management Risk Committee comprised selected executives and relevant experts. This committee assisted the Chief Operating Officer in discharging his responsibility for balance sheet management and shareholder risks in relation to credit and market risks.
Treasury Services Risk Committee: this is formed under the authority of the Head of Treasury Services and is responsible for advising him and the Chief Risk Officer on matters relating to credit, market and operational risk in Treasury Services and the Portfolio Business Unit.
Consumer Risk Committee: this was set up to replace the Credit Committee (including the Retail Credit sub-committee) which was dissolved in November 2003. It is responsible for advising the Chief Risk Officer on credit, market and operational risk matters in Personal Financial Services.
The Credit Committee was formed under the authority of the Chief Risk Officer. It comprised senior risk experts. The Committee assisted the Chief Risk Officer in discharging his responsibilities for credit, market and residual value risk, reviewing risks and recommending mandates and limits.
Chief Risk Officer: The Chief Risk Officer operates under authority delegated by the Chief Operating Officer.The Chief Risk Officer is responsible for establishing and maintaining comprehensive, accurate and effective risk reporting, and clear systems of risks limits. He is also responsible for highlighting to management all matters relevant to understanding risks being taken and to setting risk appetite. The Chief Risk Officer also has direct access to the chairman of the Audit and Risk Committee in respect of risk oversight.
Credit risk
Credit risk is the risk that counterparties will not meet their financial obligations and may result in Abbey losing the principal amount lent, the interest accrued and any unrealised gains (less any security held). Credit risk occurs mainly in Abbey’s loan and investment assets, and in derivative contracts.
Managing credit risk in Banking and Savings
Secured lending. Abbey lends on many types of property but only after a credit risk assessment of the borrower and an assessment of the property is undertaken. The systems used to manage and monitor the quality of the mortgage asset are reviewed regularly to ensure they perform as expected.
The majority of residential lending is subject to national lending policy and national lending authority levels, which are used to structure lending decisions to the same high standard across the retail network, a process further improved by mortgage credit scoring, underwriter accreditation and regular compliance reviews. Details concerning the prospective borrower and the mortgage are subject to a criteria-based decision-making process. Criteria for assessment include credit references, loan-to-value ratio, borrower status and the mortgage credit score.
A responsible approach to lending is taken to ensure borrowers do not borrow more than they can afford. For low-risk applicants this may include the use of self-certification of income.
The majority ofloans provided by Abbey are secured on UK properties. All properties must be permanent in construction; mobile homes are not generally acceptable. Abbey can provide a mortgage for the purchase of properties outside the UK where the property is a second home and the loan is secured on the main property located in the UK, or where Abbey operates a European branch.
| | | |
| Abbey Annual Report and Accounts 2003 | | 75 |
Back to Contents
Operating and Financial Review
Risk Management continued
Prior to granting any first mortgage loan on a property, Abbey has the property valued by an approved and qualified surveyor, who is often an Abbey employee. The valuation is based on set Abbey guidelines. Normally, in the case of additional lending, when the total loan remains below 85% loan-to-value, the original property value is subject to indexation and no further survey is carried out. If the loan exceeds 85% loan-to-value, a revaluation is carried out by a qualified surveyor.
The maximum loan-to-value ratio is usually no more than 95% where the maximum loan is £250,000. Abbey typically charges a fee to customers where the loan-to-value ratio is 90% or higher.
Mortgage indemnity guarantee insurance and high loan-to-value fee. Mortgage indemnity guarantee insurance is an agreement between a lender and an insurance company to underwrite the amount of every mortgage advance that generally exceeds 75% loan-to-value.
The mortgage indemnity guarantee insurance arrangements for loans originated prior to 31 December 2001 for Abbey are as follows: |
| For loans originated prior to 1993, the creditrisk on the amount of every mortgage advance over 75% of the valuation at origination is fully insured with third party insurance companies. The expected insurance recovery is factored into the provision for lending losses. |
| For loans originated between 1993 and 2001, Abbey has obtained almost all of its mortgage indemnity guarantee insurance from its insurance subsidiary Carfax Insurance Limited (“Carfax”).Carfax in turn reinsures a portion of the credit risk where commercially appropriate. Such reinsurance covers a layer of risk above a level of losses that Carfax believes it can prudently bear. Carfax’s reinsurance is the only insurance purchased and accordingly the provision for lending losses includes a provision for losses insured by Carfax. In the “Consolidated Financial Statements”, fees charged to the customer to compensate for the additional risk of mortgage advances are deferred and taken to “Other operating income” in the Profit and Loss Account over the average anticipated life of the loan.
|
From 1 January 2002, Abbey ceased purchasing mortgage indemnity guarantee insurance from Carfax for the Banking and Savings mortgage book. Existing cover remains in force. Abbey continues to charge to customers high loan-to-value fees, which are credited to the Profit and Loss Account over the anticipated life of the loans. Mortgage indemnity guarantee insurance contracts between Carfax and the rest of Abbey are accounted for as intra-Abbey transactions and are eliminated on consolidation.
Mortgage arrears and repossessions. Debt Management Operations is responsible for all debt management initiatives on the secured portfolio for Banking and Savings. Debt management strategies, which include powerdialling, negotiating repayment arrangements and concessions and debt counselling, can start as early as the day after a repayment falls due and will continue until legal action. Different collection strategies are applied to different segments of the portfolio subject to the perceived levels of risk for example, loan-to-value, collections score and account characteristics.
If the agreed repayment arrangement is not maintained, legal proceedings may be taken and may result in the property being taken into possession. Abbey sells the repossessed property at market price and uses the sale proceeds, net of costs, to pay off the outstanding value of the mortgage. The stock ofrepossessed properties held by Abbey varies according to the number of new possessions and the buoyancy of the housing market. |
The following table sets forth information on UK residential mortgage arrears and properties in possession at 31 December 2003, 2002 and 2001 for Abbey compared to the industry average as provided by the Council of Mortgage Lenders.
| | Abbey | | CML | |
|
|
|
|
|
(percentage of total
mortgage loans by number) | |
|
|
|
|
|
| 6 months to 12 months in arrears | | | | |
|
|
|
|
|
| 31 December 2001 | 0.44 | | 0.38 | |
|
|
|
|
|
| 31 December 2002 | 0.27 | | 0.30 | |
|
|
|
|
|
| 31 December 2003 | 0.16 | | 0.25 | |
|
|
|
|
|
| 12 months or more in arrears | | | | |
|
|
|
|
|
| 31 December 2001 | 0.13 | | 0.18 | |
|
|
|
|
|
| 31 December 2002 | 0.07 | | 0.15 | |
|
|
|
|
|
| 31 December 2003 | 0.03 | | 0.11 | |
|
|
|
|
|
| Properties in possession | | | | |
|
|
|
|
|
| 31 December 2001 | 0.06 | | 0.05 | |
|
|
|
|
|
| 31 December 2002 | 0.03 | | 0.02 | |
|
|
|
|
|
| 31 December 2003 | 0.02 | | 0.02 | |
|
|
|
|
|
Bank account and unsecured personal lending. Abbey uses many systems and processes to manage the risks involved in providing unsecured personal loans and overdraft lending or in granting bank account facilities. These include the use of application and behavioural scoring systems to assist in the granting of credit facilities as well as regular monitoring of scorecard performance and the quality of the unsecured lending portfolios.
Behavioural scoring examines the lending relationships that a customer has with Abbey and how the customer uses their bank account. This information generates a score which is used to assist in deciding the level of risk (in terms of overdraftfacility amount, card facilities granted and preferred unsecured personal loan value) for each customer that Abbey is willing to accept. Individual customer scores are normally updated on a monthly basis.
Abbey has successfully extended the use of behavioural scoring into other areas of the business, including the refinement of debt management strategies and bank account transaction processing.
cahoot. The processes used to manage credit risks are similar to those in the rest of Banking and Savings.
Managing credit risk in Abbey Business
Abbey Business provides a varied range of products to assist with the finance requirements of businesses. These products include overdrafts, leasing, lease purchase, factoring, property finance, secured and unsecured loans. Risk management policies are specific to and reflect the risks inherent in each product set. Approval processes for credit risk include the use of judgement, assisted by the use of probability of default and loss given default data, and the use of credit scoring on portfolios of a retail nature. Abbey Business operates within policies and authority levels approved by the Chief Risk Officer. Each product area has a dedicated risk team, reflecting the desire for risk control to be close to the business needs and risks.
| 76 | | Abbey Annual Report and Accounts 2003 |
Back to Contents
Operating and Financial Review
Risk Management continued
Managing credit risk in Treasury Services
The Risk Committee has established a set of risk appetite limits to cover the portfolio mix within Treasury Services. Within these limits, the Chief Risk Officer has approved credit mandates and policies to cover detailed industry/sector limits and asset quality. All transactions falling within these mandates and policies are scrutinised by the appropriate credit approval authority. Specific approval by the Risk Committee is required for any transaction that falls outside the risk appetite. Analyses of credit exposures and credit risk trends are provided for the Treasury Services risk committee each month, and key issues escalated to the Risk Committee as required. Large exposures (as defined by the Financial Services Authority) are reported quarterly to the Risk Committee and the Financial Services Authority.
Credit risk on derivative instruments is assessed using scenario analysis to determine the potential future mark-to-market exposure of the instruments at a 95% statistical confidence level and adding this value to the current mark-to-market value. The resulting “loan equivalent” credit risk is then included against credit limits, along with other non-derivative exposures.
In addition, there is a policy framework to enable the collateralisation of certain derivative instruments (including, in particular, swaps). If collateral is deemed necessary to reduce credit risk, then the amount and nature of the collateral to be obtained is based on management’s credit evaluation of the customer.
Market risk
Market risk is the potential for loss of income or decrease in the value of assets caused by movements in the levels and prices of financial instruments.
A major portion of the market risk arises from exposures to changes in the levels of interest rates, equity markets and credit spreads. Interest rate exposure is generated from providing fixed rate loans and savings products, funding and trading activities in Treasury Services, and management of Abbey’s overall asset and liability structure. Changes in interest rates affect the value of funds managed for the benefit of customers, as well as on specific shareholders’ funds of the life assurance business. The life assurance business is also exposed to changes in the level of equity markets. Other exposure to equity markets is generated by the creation and risk management of structured products by Treasury Services for the Personal Financial Services market and trading activities. Credit spread exposure arises from credit risk management and trading activities within Treasury Services.
Abbey accepts that market risk arises from the full range of activities undertaken as a provider of Personal Financial Services. We actively manage and control market risk by limiting the adverse impact of market movements whilst seeking to enhance earnings within clearly defined parameters. The Market Risk Policy, which is reviewed and approved by the board on an annual basis, sets the framework under which market risks are managed and controlled. Business area policies, risks limits and mandates are established within the context of the Market Risk Policy. The business areas are responsible for ensuring that they have sufficient expertise to manage the risks associated with their operations. The independent Risk function, under the direction of the Chief Risk Officer, ensures that risk taking and risk control occur within the framework prescribed by the board. The Risk function also provides oversight of all risk-taking activities through a rigorous process of regular reviews.
Abbey ensures that exposure to market risks is measured and reported on an accurate and timely basis to senior management. In addition to the regular reporting for the purposes of active risk management, the board also receives consolidated reporting of all market risk exposures on a monthly basis where actual exposure levels are measured against limits.
Senior management recognise that different risk measures are required to best reflect the risks faced in different types of business activities. In measuring exposure to market risk, Abbey uses a range of complementary measures, covering both value and income as
appropriate. The market risk disclosures shown below for trading instruments are calculated using Value at Risk (using a historical simulation approach) whilst disclosures for non-trading instruments are based upon a combination of Value at Risk and sensitivity analysis. At both aggregated and business area levels such analysis is complemented by stress testing.
To achieve consistency in measurement across business areas, we have adopted a series of market risk measurement standards to which business areas are required to adhere. We report market risks by type of exposure in two broad categories:
Short-term market risk covers activities where exposures are subject to frequent change and could be closed out over a short time horizon. Much of the exposure is generated by Treasury Services activities and includes both trading and non-trading portfolios.
Structural market risk includes exposures arising as a result of the structure of portfolios of assets and liabilities, or where the liquidity of the market is such that the exposure could not be closed out over a short time horizon. The risk exposure is generated by features inherent in either a product or portfolio and normally present over the life of the portfolio or product. Such exposures are a result of the decision to undertake specific business activities, can take a number of different forms, and are generally managed over a longer time horizon. Examples of structural market risk include the exposures arising out of the uncertainty of business volumes from the launch of fixed-rate and structured loans and savings products, or from the provision of hedging against such risks. Although most long-term balance sheet positions are hedged, Abbey remains exposed to variances in customer behaviour (often caused by market rate movements) impacting new business take-up and early redemption and causing unfavourable mismatches to arise.
Trading Activities
Trading activities are undertaken by Treasury Services only.They are managed on a continuous basis, and are marked to market on a daily basis.
The following table shows the value at risk-based consolidated exposures for the major risk classes as at 31 December 2003, together with the highest, lowest and average exposures for the year. Exposures within each risk class reflect a range of exposures associated with movements in that financial market. For example, interest rate risks include the impact of absolute rate movements, movements between interest rate bases and movements in implied volatility on interest rate options. The range of possible statistical modelling techniques and assumptions mean these measures are not precise indicators of expected future losses, but are estimates of the potential change in the value of the portfolio over a specified time horizon and within a given confidence interval.
From time to time, losses may exceed the amounts stated where the movements in market rates fall outside the statistical confidence interval used in the calculation of the value at risk analysis. The 95% confidence interval, used as a standard across Abbey, means that the theoretical loss at a risk factor level is likely to be exceeded in one period in twenty. We address this risk by monitoring stress testing measures across the different business areas.
For trading instruments the actual, average, highest and lowest value at risk exposures shown below are all calculated to a 95% level of confidence using a simulation of actual one day market movements over a one year period. The effect of historic correlations between risk factors is additionally shown below. The use of a one day time horizon for all risks associated with trading instruments reflects the horizon over which market movements will affect the measured profit and loss of these activities.
The numbers below represent the potential change in market values of trading instruments. Since trading instruments are recorded at market value, these numbers also represent the potential effect on income. Trading instruments are held only in Treasury Services.
| Abbey Annual Report and Accounts 2003 | | 77 |
Back to Contents
Operating and Financial Review
Risk Management continued
| | Exposure at 31 December | | Exposure for the year ended 31 December | |
|
|
|
|
|
|
|
| |
| | | | Actual | | | | Average | | | | Highest | | | | Lowest | |
| | exposure | | exposure | | exposure | | exposure |
|
|
|
|
|
|
|
|
|
|
|
|
|
|
|
| |
| | 2003 | | 2002 | | 2003 | | 2002 | | 2003 | | 2002 | | 2003 | | 2002 | |
| £m | £m | £m | £m | £m | £m | £m | £m |
|
|
|
|
|
|
|
|
|
|
|
|
|
|
|
| |
| Group trading instruments | | | | | | | | | | | | | | | | |
|
|
|
|
|
|
|
|
|
|
|
|
|
|
|
| |
| Interest rate risks(1) | 3.7 | | 4.0 | | 4.3 | | 5.2 | | 7.5 | | 7.9 | | 2.8 | | 3.7 | |
|
|
|
|
|
|
|
|
|
|
|
|
|
|
|
| |
| Equity risks | 1.6 | | 2.9 | | 2.3 | | 2.0 | | 5.2 | | 4.9 | | 1.4 | | 0.8 | |
|
|
|
|
|
|
|
|
|
|
|
|
|
|
|
| |
| Spread risk | 1.1 | | 2.6 | | 2.0 | | 2.3 | | 2.5 | | 3.0 | | 1.1 | | 1.6 | |
|
|
|
|
|
|
|
|
|
|
|
|
|
|
|
| |
| Other risks(2) | 0.1 | | – | | 0.1 | | 0.1 | | 0.2 | | 0.1 | | – | | – | |
|
|
|
|
|
|
|
|
|
|
|
|
|
|
|
| |
| Correlation offsets(3) | (1.2 | ) | (2.5 | ) | (2.6 | ) | (2.2 | ) | | | | | | | | |
|
|
|
|
|
|
|
|
|
|
|
|
|
|
|
| |
| Total correlated one-day Value at Risk | 5.3 | | 7.0 | | 6.1 | | 7.4 | | 8.4 | | 10.7 | | 4.5 | | 5.8 | |
|
|
|
|
|
|
|
|
|
|
|
|
|
|
|
| |
| (1) | Interest rate risks include property indexrisk. |
| (2) | Other risks include foreign exchange risk. |
| (3) | The highest and lowest exposure figures reported for each risk type did not necessarily occur on the same day as the highest and lowest Total correlated one-day Value at Risk. A corresponding correlation offset effect cannot be calculated and is therefore omitted from the above table. |
| | |
Non-trading activities
An analysis of exposures on non-trading financial instruments is shown below.These numbers represent the potential change in theoretical market values of such instruments, and do notrepresent the potential effects on income for a given time period. Separate income at risk measures are used to supplement these analyses for appropriate portfolios. Non-trading instruments are held for collection in the form of cash over time, and are accounted for at amortised cost, with earnings accrued over the relevant life of the instruments. Abbey’s risk measures, however, focus on potential risks over the life of the non-trading instruments wherever appropriate, and are therefore based on valuation measures, using estimated discounted cash flows where reliable market values are not available.
For Abbey’s non-trading instruments the actual, average, highest and lowest exposures shown below are all calculated to a 95% level of confidence and are based upon one-day market movements for short-term market risks, and market movements of between one day and three months (as appropriate to the management of each portfolio) for structural market risk positions.
| 78 | | Abbey Annual Report and Accounts 2003 |
Back to Contents
Operating and Financial Review
Risk Management continued
| | Exposure at 31 December | | Exposure for the year ended 31 December | |
|
|
|
|
|
|
|
| |
| | | | Actual | | | | Average | | | | Highest | | | | Lowest | |
| | exposure | | exposure | | exposure | | exposure |
|
|
|
|
|
|
|
|
|
|
|
|
|
|
|
| |
| | 2003 | | 2002 | | 2003 | | 2002 | | 2003 | | 2002 | | 2003 | | 2002 | |
| £m | £m | £m | £m | £m | £m | £m | £m |
|
|
|
|
|
|
|
|
|
|
|
|
|
|
|
| |
| Group non-trading instruments | | | | | | | | | | | | | | | | |
|
|
|
|
|
|
|
|
|
|
|
|
|
|
|
|
|
| Short-term market risk | | | | | | | | | | | | | | | | |
|
|
|
|
|
|
|
|
|
|
|
|
|
|
|
| |
| Interest rate risks | 1.0 | | 2.4 | | 1.4 | | 2.2 | | 2.7 | | 3.5 | | 0.5 | | 1.0 | |
|
|
|
|
|
|
|
|
|
|
|
|
|
|
|
| |
| Equity risks | 0.2 | | 0.5 | | 0.3 | | 0.2 | | 0.6 | | 0.7 | | – | | – | |
|
|
|
|
|
|
|
|
|
|
|
|
|
|
|
| |
| Foreign exchange risks | 0.1 | | – | | 0.1 | | – | | 0.2 | | – | | 0.1 | | – | |
|
|
|
|
|
|
|
|
|
|
|
|
|
|
|
| |
| Structural market risk | | | | | | | | | | | | | | | | |
|
|
|
|
|
|
|
|
|
|
|
|
|
|
|
| |
| Interest rate risks | 14.6 | | 90.0 | | 32.0 | | 84.4 | | 51.2 | | 94.2 | | 14.6 | | 73.1 | |
|
|
|
|
|
|
|
|
|
|
|
|
|
|
|
| |
| Equity risks | 5.6 | | 5.3 | | 5.6 | | 9.3 | | 8.0 | | 12.9 | | 3.3 | | 5.3 | |
|
|
|
|
|
|
|
|
|
|
|
|
|
|
|
| |
| Foreign exchange risks | 0.3 | | 1.8 | | 1.6 | | 3.5 | | 1.9 | | 6.1 | | 0.3 | | 1.8 | |
|
|
|
|
|
|
|
|
|
|
|
|
|
|
|
| |
The above sensitivity exposures should not be aggregated, as no account has been taken of the correlation between risk classes.
Managing market risk from Personal Financial Services
Banking and Savings Business
The primary risks within the Banking and Savings business are interest rate related. Abbey is able to mitigate the consequences of interest rate movements on net interest income from Banking and Savings by re-pricing separately the administered variable rate mortgages and variable rate retail deposits, subject to competitive pressures. The absolute levels of interest rate risk are managed via a portfolio of fixed interest rate instruments including interest rate swaps. However, to the extent that variable rate assets and liabilities are not precisely matched, the balance sheet is exposed to changes in the relationship between administered rates and market rates.
In addition to administered variable rate products, Abbey also has a significant volume of fixed rate and structured mortgage and savings products. The market risk exposures from these products are generally hedged with interest rate swaps which are transacted with Treasury Services. The related market risks of such contracts are managed within the market risk framework developed for Treasury Services. However, during the period of product launches the hedging of actual volume can only be estimated, so limits on the maximum exposure are maintained during that period. The business also remains exposed to variances from the expected redemption level of fixed rate and structured products by customers in advance of the contractual maturity, with measures and limits in place to control the exposure.
Managing market risk in Treasury Services
The primary risk exposures for Treasury Services are interest rate, equity, credit spread and some residual exposure to property indices. Equity risks are managed via equity stock, futures and structured equity derivatives. Credit-spread risks are managed via credit derivatives (credit default swaps, total return swaps). Property Index risk is managed via insurance contracts and property derivatives.
Treasury Services operates within a market risk framework designed to ensure that it has the capability to manage risk in a well-controlled manner. A comprehensive set of policies, procedures and processes have been developed and implemented to identify, measure, report, monitor and control risk across Treasury Services. The standardised risk measure adopted is Value at Risk calculated at a 95% confidence level over a 1 day time horizon. On a daily basis, market risk factor sensitivities, Value at Risk measures and stress tests are produced, reported and monitored against limits for each major activity and at the aggregate Treasury Services level. These limits are used to align risk appetite with the business’s risk-taking activities and are reviewed on a regular basis. Early identification and measurement of risks are important elements of the risk management processes. Measurement of risks can involve the use of complex quantitative methods and mathematical principles to model and predict the changes in instruments and portfolio valuation. These methods are essential tools to understand the risk exposures.
Life Business
Abbey faces two main sources of market risk within the Personal Financial Services Life Companies:
Firstly, there are exposures that arise directly from funds held for the account of Abbey in the shareholderfunds of the Life Companies. Abbey directly bears these risks and they are consolidated with other corporate-wide market risk exposures.
Secondly, there are indirect interest rate and equity risk exposures arising where there are insufficient surpluses in the policy holderfunds to fully mitigate the market risks associated with the effects of adverse market movements on the funds. The sources of indirect market risks include Market Value Adjustment free guarantees and Guaranteed Annuity Option exposures where any shortfall on the with-profit-business would be borne by Abbey. These exposures are risk managed using equity index options and forward starting interest rate swaps.
Market risk affects solvency, embedded and realistic balance sheet valuations, and the risks under these different measures are managed simultaneously against their respective limits and controls. The Life Companies Market Risk Function ensures that all risk positions are understood by management and that key issues are escalated.
Group Infrastructure
Risk exposure arises from the pool of interest earning assets funded by non interest bearing liabilities, e.g. share capital, retained profit. To manage this interest rate exposure Abbey uses interest rate swaps and some fixed rate assets to stabilise earnings. This strategy is managed by Treasury Services and operates within the same market risk framework approved by the Board in the Market Risk Policy.
Market risk exposures are managed using a combination of earnings volatility and Value at Risk measures. An appropriate set of limits are established and controls processes are in place to ensure that risk management activities operate within the established framework.
Effect of repricing risks on Abbey
The interest rate repricing gap information is shown in the notes to the consolidated financial statements.
Hedging activity
A significant part of Abbey’s exposures are hedged internally, offset against other categories of exposure in the balance sheet, or by using derivatives as part of an integrated approach to risk management. For further details on the use of derivatives, see the notes to the consolidated financial statements.
Any unhedged residual risks are retained in Abbey businesses and are monitored, reported and managed under the overall market risk framework.
| Abbey Annual Report and Accounts 2003 | | 79 |
Back to Contents
Operating and Financial Review
Risk Management continued
Liquidity risk
Liquidity risk is the potential that, although remaining solvent, Abbey does not have sufficient financial resources to enable it to meet its obligations as they fall due, or can secure them only at excessive cost. Liquidity risk is a key risk faced by financial services organisations.
The Board is responsible for defining the liquidity management and control framework at Abbey and has approved a liquidity risk policy to cover major liquidity risks and define key liquidity limits. Along with its internal Liquidity Risk Policy control framework, Abbey abides by the “Sound Practices for Managing Liquidity in Banking Organisations” set out by the Basel Committee as its standard for liquidity risk management and control.
Liquidity risk management
Management of liquidity at Abbey, including the management of cash flows, raising funding, and managing liquid asset holdings, is the responsibility of the Chief Operating Officer. The active management of liquidity is undertaken by Treasury Services within the framework of the Liquidity Risk Policy. The Asset and Liability Committee and the Risk Committee monitor Abbey’s liquidity position on a monthly basis. The board also receives a monthly update on key liquidity issues and Abbey’s liquidity position is reported to the Financial Services Authority on a monthly basis.
Abbey views the essential elements of liquidity management as controlling potential cash outflows, maintaining prudent levels of highly liquid assets and ensuring that access to funding is available from a diversity of sources. A comprehensive management and monitoring process, and a series of liquidity limits within which liquidity is managed, underpin these elements. For example, as excessive concentration in either liquid assets or contractual liabilities contributes to potential liquidity risk, appropriate limits have been established pursuant to the Liquidity Risk Policy. Management also monitors Abbey’s compliance with the Sterling Stock Liquidity limits set by the Financial Services Authority, which focus on ensuring that sterling cash liabilities due five days in advance can be met by realising liquid assets, with any excesses being reported to the Risk Committee and the board. In addition to such limits, liquidity ratios also have trigger-review levels that require the Treasurer or the Chief Operating Officer to initiate appropriate reviews of current exposure when such levels are exceeded.
The Liquidity Risk Policy has been designed to reduce the lkelihood and impact of either firm specific or system-wide liquidity problems. Abbey intends to maintain sufficient liquid assets and marketable assets to meet the expected cash flow requirements of all its businesses, to ensure customer and counterparty confidence, and to be in a position to withstand liquidity pressures resulting from unexpected or exceptional circumstances.
While Abbey’s liquidity risk is consolidated and primarily controlled at the parent company level, liquidity risk is also measured, monitored and controlled within the specific business area or the subsidiary where it arises. Management recognises that while the liquidity approach developed pursuant to the Liquidity Risk Policy is designed to reduce the likelihood of significant liquidity issues arising, the possibility of such events cannot be eliminated. Consequently, Abbey also operates a Liquidity Contingency Plan to manage and co-ordinate any actions that are required in order to mitigate the effects of a liquidity shortfall. The Liquidity Contingency Plan defines the circumstances under which the plan is activated, the management framework and notification procedures, and the key roles and responsibilities during the operation of the plan.
The Liquidity Contingency Plan becomes operational when the demand for cash, whether from demands for repayment, from wholesale funding or from retail deposits, exceeds the limits for liquidity management defined under the Liquidity Risk Policy. The circumstances that cause this to happen will tend to be sudden, unexpected events that trigger demands for cash that cannot be managed within the procedures, limits and controls defined in the Liquidity Risk Policy.
To be effective, the management of liquidity in a crisis must be timely, proactive and flexible enough to respond to a variety of different circumstances. The management structure for the Liquidity Contingency Plan, which is structured around a small team of individuals with the authority to agree, co-ordinate and implement actions that will control a volatile, dynamic situation, has two key elements:
| the Treasurer is responsible for the rapid assessment ofthe implications of a sudden, unexpected event on the day-to-day liquidity of Abbey,and for the decision to activate the Liquidity Contingency Plan; and |
| the liquidity crisis management team, under the chairmanship of the Treasurer, is the decision-making authority in the event of a liquidity crisis, and is responsible for implementing the Liquidity Contingency Plan. |
The Liquidity Contingency Plan defines a framework for the decision-making process under exceptional circumstances, and it details the tools available to mitigate any such event. These tools include procedures for realising marketable assets, for entering into repo transactions with central banks, and for securing retail deposits and managing wholesale funds. Even though the Liquidity Contingency Plan focuses predominantly on realising marketable assets to meet liabilities, in certain situations additional funding – as well as certificates of deposit, commercial paper and medium term funding – may be sought, depending on the nature of the crisis. The Liquidity Contingency Plan is reviewed and revised on at least an annual basis.
Potentially, if our usual funding sources become unavailable for an extended period of time, the issuance of a retail savings bond may also be considered.
Liquidity risk measurement
Abbey uses net cash flows as a key measure of liquidity risk as they take into account contracted liabilities and contracted assets that have a defined maturity date. Such current cash outflows as well as expected future cash outflows measured over key benchmark time periods and unexpected cash outflows arising from unexpected but plausible events, such as the withdrawal of a percentage of retail deposits at any point in time and the limited ability to renew wholesale deposits, are met through new borrowing, additional sales in the repo market and additional asset sales.
Liquid assets are normally measured at current market values, discounted to reflect transaction costs. Liquid assets may take time to liquidate, due to marketability issues and large position sizes, and may decrease in market value in times of adverse market movement. This expected liquidation time is measured over key benchmark time periods under prudent assumptions in relation to market conditions. The risk related to uncertain assumptions about the behavioural characteristics of assets and liabilities is also considered when measuring liquidity risk.
The ratio of discounted liquid assets that will be available to meet the cumulative liabilities falling due at key benchmark time periods is the principal liquidity measure. The liquidity ratio is subject to periodic stress testing based upon a range of assumptions.
Securitisation of Abbey assets
Abbey, through various special purpose vehicles, provide a wide range of securitised mortgage products to a diverse investor base. There is little liquidity risk related to asset securitisations as the repayment of the securitised notes issued is financed by the expected maturity or repayment of the underlying securitised asset which is recognised in the Liquidity Policy. Abbey does not expect securitisations to represent a greater proportion of its overall funding in the future than at present. However, in times of significant market disruption, residential mortgage backed securitisation, which typicaly remains a very liquid and deep market, might be accessed, and in such circumstances could provide a higher proportion of funding than is presently expected.
| 80 | | Abbey Annual Report and Accounts 2003 |
Back to Contents
Operating and Financial Review
Risk Management continued
Insurance risk
Insurance risk arises when a payment is taken that offers financial protection against specified contingencies, such as life expectancy, sickness, loss or damage or when the customer terminates his contract early. Abbey is only exposed to the contingencies of life expectancy and sickness, that is, mortality and morbidity.The exposure to insurance risk arises in the Life assurance companies.
The Appointed Actuary (UK) was responsible throughout 2003 for the independent review of the management of insurance risk. The Appointed Actuary (UK) chairs the insurance risk committee which consists of a team of insurance experts who aid the Appointed Actuary in his role. An insurance risk policy provides the control framework within which insurance risk is managed. The essential elements of insurance risk management that cover assessment as well as mitigation of the risk include underwriting (from the policy proposal document through to assessment of individual claims), pricing (taking into account the level of underwriting, market experience, external studies and reassurance data), reinsurance (for assistance in pricing of some risks and for spreading of risks) and reserving (holding sufficient funds to meet expected claims).
Operational risk management
Operational risk is the risk of loss to Abbey,resulting from inadequate or failed internal processes, people and systems, or from external events. Risks are categorised by type, such as fraud, process failure, inadequate Human Resource management and damage to assets. They are assessed, not only in terms of their financial impact, but also in terms of their affect on business objectives, regulatory responsibilities and Abbey’s reputation.
An independent operational risk function has responsibility for establishing the framework within which risk is managed and for ensuring its consistent implementation across Abbey.The framework incorporates industry best practice and anticipated regulatory requirements, particularly those emanating from the Basel Committee and the Financial Services Authority.The primary purpose of the framework, which is approved by the Risk Committee and the Board, is to define and articulate Abbey-wide policy, processes, roles and responsibilities.
The management of operational risk is the responsibility of business managers, who identify assess and monitor risks, in line with the processes described in the framework. The operational risk function ensures that all key risks are regularly reported to the Board.
In line with Financial Services Authority’s guidance and industry best practice, the company has crisis management and disaster recovery arrangements to ensure that critical business processes are maintained in the event of an unforeseen interruption. Insurance policies are also purchased to provide cover for a range of potential operational risk losses. The implementation of a board-approved environmental policy is managed as part of the operational risk framework.
Portfolio Business Unit
The Portfolio Business Unit consists of businesses to be managed for value and capital release. The majority of the risk management processes within these businesses follow the same management, measurement and control guidelines as those in Personal Financial Services, except for credit risk in First National businesses and residual value risk, which arise solely in Portfolio Business Unit.
Credit risk
Managing credit risk in Wholesale Banking
The management of wholesale credit risk in the Portfolio Business Unit follows the same management, measurement and control guidelines as that in Treasury Services, except that risk appetite is defined by the reducing portfolio size, and also that Credit personnel for the Portfolio Business Unit form an integral part of the Wholesale Credit Risk function. Regular reviews of credit exposures and counterparties continue to be undertaken and Credit Risk provides advice to the respective business units in the sales process.
Managing credit risk in First National
Motor Finance provides funds via motor dealers acting as introducers to individuals and businesses. A large majority of such arrangements are secured on the vehicles involved. In the course of these operations, advances are also provided to participating dealers. Credit risk management policies and techniques reflect the varying forms of financial products provided by the business and include the use of credit scoring.
First National Litigation Funding plc provides loans via claims management companies and solicitors acting as introducers to individual claimants for the purchase of “after the event” insurance cover. Such cover provides the claimant with insurance against the costs of unsuccessful litigation. The repayment of such loans is made by the claimants, either from damages and costs recovery, or from the insurance policy. Risk management focuses on acceptability of insurance cover, operational risk of payment processes and legal risk of documentation.
Market Risk
Managing market risk in European operations
The Italian branch and French subsidiary are both exposed to market risks arising from Personal Financial Services Banking and Savings activity. These risks are monitored in a manner consistent with the Personal Financial Services Banking and Savings exposures. The French subsidiary also has interest-earning assets funded by non-interest bearing liabilities, similar to the same risk in Group Infrastructure and interest rate risk exposure arising from the litigation funding vehicle. These risks are measured, reviewed and reported by the Personal Financial Services Banking and Savings market risk function.
Managing market risk in Life businesses
Life companies in the Portfolio Business Unit consist of Scottish Mutual International and Scottish Provident International Life Assurance. Abbey’s market risk exposures in Portfolio Business Unit-Life are similar to those in Personal Financial Services-Life. All Portfolio Business Unit-Life market risk exposures are measured, managed and reported in a manner consistent with the Personal Financial Services-Life exposures and by the Life companies’ market risk function.
Managing market risk in Treasury Services Portfolio Business Unit
The majority of Treasury Services Portfolio Business Unit positions were investment assets (bonds, leases and structured loans) fully cash flow matched with interest rate swaps and hedged to minimise interest rate risk exposure. The remaining portfolios are now being managed for value, and market risk management remains a key consideration in this process. Risk measurement, monitoring and control continue to be applied, with oversight by the market risk function.
Insurance risk
Managing insurance risk
The Appointed Actuary (International) has responsibility for managing the pricing and reserving of insurance risk within the Portfolio Business Unit Life companies. A process similar to that employed in the Personal Financial Services companies is used in Portfolio Business Unit companies.
Operational risk
A process similar to that employed in Personal Financial Services is used in the Portfolio Business Unit.
Residual value risk
Residual value risk occurs when the value of a physical asset at the end of certain contracts (e.g. operating leases) potentially may be worth less than that required to achieve the anticipated return from the transaction.
| Abbey Annual Report and Accounts 2003 | 81 |
Back to Contents
Operating and Financial Review
Risk Management continued
Managing residual value risk in Wholesale Banking business in the Portfolio Business Unit
Residual value risk exposure in Wholesale Banking relates principally to trains and other rail assets managed by Porterbrook Leasing Company Limited (“Porterbrook”), as well as aircraft managed by IEM Airfinance BV (“IEM”). Both Porterbrook and IEM are in the Portfolio Business Unit. Periodic revaluations are undertaken and any reductions in assumed values are treated in accordance with generally accepted accounting practice.
Tools such as first loss and residual value guarantees where appropriate (aircraft), and appropriate return conditions are employed by Abbey to mitigate the associated risks. The residual value risk management framework includes business area mandates, asset specific policies and delegated authorities agreed by risk committee and business area risk committees (e.g. Treasury Services risk committee) as appropriate.
Managing residual value risk in First National businesses
Within First National, exposure arises within portfolios of contract purchase agreements relating to motor vehicles. Revaluations of motor vehicles are undertaken at least annually. Losses, when they arise, are treated in accordance with generally accepted accounting practice.
Derivatives
Derivative financial instruments (“derivatives”) are contracts or agreements whose value is derived from one or more underlying indices or asset values inherent in the contract or agreement.
They include interest rate, cross currency and equity related swaps, forward rate agreements, futures, caps, floors, options and swaptions (see table below). Derivatives are used for trading and non-trading purposes. These terms are defined in (“Accounting policies: Derivatives”).
Non-trading derivatives
The main non-trading derivatives are interest rate and cross currency swaps, which are used to hedge Abbey’s exposures to interest rates and exchange rates inherent in non-trading assets, liabilities and positions, including fixed rate lending and structured savings products within the Banking and Savings segment and medium-term note issues, capital issues and fixed-rate asset purchases within Treasury Services.
Derivative products that are combinations of more basic derivatives (such as swaps with embedded option features), or that have leverage features, may be used in circumstances where the underlying position being hedged contains the same risk features. In such cases the derivative used will be structured to match the risks of the underlying asset or liability. Exposure to market risk on such contracts is therefore hedged.
Derivatives used for non-trading activities are accounted for on an accruals basis consistent with the assets, liabilities or positions being hedged.
The following table summarises activities undertaken by Abbey, the related risks associated with such activities and the types of derivatives used in managing such risks. Such risks may also be managed using on-balance sheet instruments as part of an integrated approach to risk management.
| Activity | | Risk | | Type of hedge |
|
| Management of the return on variable rate assets financed by shareholders’ funds and net non-interest bearing liabilities. | | Reduced profitability due to falls in interest rates. | | Receive fixed interest rate swaps. |
|
| Fixed rate lending and investments. | | Sensitivity to increases in interest rates. | | Pay fixed interest rate swaps. |
|
| Fixed rate retail and wholesale funding. | | Sensitivity to falls in interest rates. | | Receive fixed interest rate swaps. |
|
| Equity-linked retail funding. | | Sensitivity to increases in equity market indices. | | Receive equity swaps. |
|
| Management of other net interest income on retail activities. | | Sensitivity ofreturns to changes in interest rates. | | Interest rate swaps and caps/floors according to the type of risk identified. |
|
| Profits earned in foreign currency. | | Sensitivity to strengthening of sterling against other currencies. | | Forward foreign exchange contracts. |
|
| Investment in foreign currency assets. | | Sensitivity to strengthening of sterling against other currencies. | | Cross-currency and foreign exchange swaps.
Foreign currency funding. |
|
| Issuance of products with embedded equity options. | | Sensitivity to changes in underlying rate and rate volatility causing option exercise. | | Interest rate swaps combined with caps/floors. |
|
| Lending and investments. | | Sensitivity to weakening credit quality. | | Purchase credit default and total return swaps. |
|
| Investment in, and issuance of, products with embedded interest rate options. | | Sensitivity to changes in underlying rate and rate volatility causing option exercise. | | Interest rate swaps plus caps/floors, and other matched options. |
|
| Investment in, and issuance of, bonds with put/call features. | | Sensitivity to changes in rates causing option exercise. | | Interest rate swaps combined with swaptions(1) and other matched. |
|
| Firm commitments (e.g. asset purchases, issues arranged). | | Sensitivity to changes in rates between arranging a transaction and completion. | | Hedges are arranged at the time of commitments if there is exposure to rate movements. |
|
| (1) A swaption is an option on a swap which gives the holder the right but not the obligation to buy or sell a swap. |
| Exchange-traded derivatives may additionally be used as hedges in any of the above activities in lieu of interest rate swaps. |
| 82 | Abbey Annual Report and Accounts 2003 |
Back to Contents
Operating and Financial Review
Risk Management continued
The following tables show the contract or underlying principal amounts, positive and negative market values and related book values of derivatives held for non-trading purposes at 31 December 2003 and 2002. The market values represent the amount at which a contract could be exchanged in an arm’s-length transaction, calculated at market rates current at the balance sheet date. Derivatives classified as non-trading are entered into for the purposes of matching or eliminating risk from potential movements in interest rates and exchange rates. Accordingly, they are measured on an accruals basis, equivalent to that used for the asset, liability or position being hedged. The positive and negative market values reported in the following table should not be viewed in isolation, therefore, because they are substantially matched by negative and positive market values on the assets, liabilities and positions being hedged.
| | | | | | | | | | Group | |
|
|
|
|
|
|
|
|
|
| |
| 2003 Contract or underlying principal | (1) | 2003 Positive market values | (2) | 2003 Related book value | | 2003 Negative market values | (2) | 2003 Related book value | |
| | £m | | £m | | £m | | £m | | £m | |
|
|
|
|
|
|
|
|
|
| |
| Exchange rate contracts: | | | | | | | | | | |
|
|
|
|
|
|
|
|
|
| |
| Cross-currency swaps | 22,214 | | 928 | | 124 | | 1,380 | | 183 | |
|
|
|
|
|
|
|
|
|
| |
| Foreign exchange swaps and forwards | 1,630 | | – | | 8 | | – | | – | |
|
|
|
|
|
|
|
|
|
| |
| Foreign exchange options | – | | – | | – | | – | | – | |
|
|
|
|
|
|
|
|
|
| |
| | 23,844 | | 928 | | 132 | | 1,380 | | 183 | |
|
|
|
|
|
|
|
|
|
| |
| Interest rate contracts: | | | | | | | | | | |
|
|
|
|
|
|
|
|
|
| |
| Interest rate swaps | 69,433 | | 2,067 | | 650 | | 1,432 | | 362 | |
|
|
|
|
|
|
|
|
|
| |
| Caps, floors and swaptions | 2,484 | | 21 | | 37 | | 1 | | – | |
|
|
|
|
|
|
|
|
|
| |
| Futures(exchange-traded) | 4,907 | | – | | – | | – | | – | |
|
|
|
|
|
|
|
|
|
| |
| Forward rate agreements | 2,213 | | – | | – | | – | | – | |
|
|
|
|
|
|
|
|
|
| |
| | 79,037 | | 2,088 | | 687 | | 1,433 | | 362 | |
|
|
|
|
|
|
|
|
|
| |
| Equity and commodity contracts: | | | | | | | | | | |
|
|
|
|
|
|
|
|
|
| |
| Equity index options and similar products | 257 | | – | | – | | 86 | | – | |
|
|
|
|
|
|
|
|
|
| |
| | | | | | | | | | | |
| Equity and commodity index swaps | 673 | | 22 | | 9 | | 20 | | 3 | |
|
|
|
|
|
|
|
|
|
| |
| | 930 | | 22 | | 9 | | 106 | | 3 | |
|
|
|
|
|
|
|
|
|
| |
| | 103,811 | | 3,038 | | 828 | | 2,919 | | 548 | |
|
|
|
|
|
|
|
|
|
| |
| | | | | | | | | | Group | |
|
|
|
|
|
|
|
|
|
| |
| 2002 Contract or underlying principal | (1) | 2002 Positive market values | (2) | 2002 Related book value | | 2002 Negative market values | (2) | 2002 Related book value | |
| | £m | | £m | | £m | | £m | | £m | |
|
|
|
|
|
|
|
|
|
| |
| Exchange rate contracts: | | | | | | | | | | |
|
|
|
|
|
|
|
|
|
| |
| Cross-currency swaps | 23,849 | | 835 | | 166 | | 1,236 | | 330 | |
|
|
|
|
|
|
|
|
|
| |
| Foreign exchange | | | | | | | | | | |
| swaps and forwards | 5,663 | | 22 | | 18 | | 82 | | 79 | |
|
|
|
|
|
|
|
|
|
| |
| Foreign exchange options | 29 | | 3 | | – | | – | | – | |
|
|
|
|
|
|
|
|
|
| |
| | 29,541 | | 860 | | 184 | | 1,318 | | 409 | |
|
|
|
|
|
|
|
|
|
| |
| Interest rate contracts: | | | | | | | | | | |
|
|
|
|
|
|
|
|
|
| |
| Interest rate swaps | 99,539 | | 2,421 | | 906 | | 2,306 | | 748 | |
|
|
|
|
|
|
|
|
|
| |
| Caps, floors and swaptions | 6,278 | | 27 | | 70 | | 6 | | – | |
|
|
|
|
|
|
|
|
|
| |
| Futures | | | | | | | | | | |
| (exchange-traded) | 3,745 | | – | | – | | – | | – | |
|
|
|
|
|
|
|
|
|
| |
| | | | | | | | | | | |
| Forward rate agreements | – | | – | | – | | – | | – | |
|
|
|
|
|
|
|
|
|
| |
| | 109,562 | | 2,448 | | 976 | | 2,312 | | 748 | |
|
|
|
|
|
|
|
|
|
| |
| Equity and commodity | | | | | | | | | | |
| contracts: | | | | | | | | | | |
|
|
|
|
|
|
|
|
|
| |
| Equity index options | | | | | | | | | | |
| and similar products | 234 | | 3 | | – | | 48 | | – | |
|
|
|
|
|
|
|
|
|
| |
| Equity and commodity | | | | | | | | | | |
| index swaps | 832 | | 44 | | 3 | | 62 | | 1 | |
|
|
|
|
|
|
|
|
|
| |
| | 1,066 | | 47 | | 3 | | 110 | | 1 | |
|
|
|
|
|
|
|
|
|
| |
| | 140,169 | | 3,355 | | 1,163 | | 3,740 | | 1,158 | |
|
|
|
|
|
|
|
|
|
| |
| (1) | Included in the above analysis of non-trading derivatives are exchang erate contracts, interest rate contracts and equity and commodity contracts, with underlying principal amounts of £1,574m, (2002:£1,955m), £47,685m (2002: £58,208m) and £363m (2002: £274m) respectively, which were undertaken by Abbey entities with Abbey National Financial Products.The total net positive market value of such contracts amounted to £1,425m (2002: net positive £132m). Associated contracts which Abbey National Financial Products transacted with external counterparties are included in the analysis of trading derivatives.Net positive market values of £1,314m (2002: net positive £132m) on all contracts held by AbbeyFinancial Products with other Abbey entities are included within Other assets. |
| | |
| (2) | Positive market values arise where the present value of cash inflows exceeds the present value ofcash outflows on a contract-by-contract basis. Negative market values arise where the present value of cash outflows exceeds the present value of cash inflows on a contract-by-contract basis. |
The following table analyses over-the-counter and other non-exchange traded derivatives held for non-trading purposes by remaining maturity:
| | | | | | | | Group | |
|
|
|
|
|
|
|
| |
| Contract or underlying principal 2003 | | Replacement cost 2003 | | Contract or underlying principal 2002 | | Replacement cost 2002 | |
| £m | | £m | | £m | | £m | |
|
|
|
|
|
|
|
| |
| Non-trading derivatives maturing: | | | | | | | | |
|
|
|
|
|
|
|
| |
| In not more than one year | 36,368 | | 806 | | 55,737 | | 647 | |
|
|
|
|
|
|
|
| |
| In more than one year but | | | | | | | | |
| not more than five years | 47,672 | | 1,257 | | 56,086 | | 1,365 | |
|
|
|
|
|
|
|
| |
| In more than five years | 14,864 | | 975 | | 24,601 | | 1,343 | |
|
|
|
|
|
|
|
| |
| | 98,904 | | 3,038 | | 136,424 | | 3,355 | |
|
|
|
|
|
|
|
| |
| Abbey Annual Report and Accounts 2003 | 83 |
Back to Contents
Operating and Financial Review
Risk Management continued
The following table shows, by nominal amount, the activity in interest rate and cross-currency swaps entered into for hedging purposes, with third parties and Abbey National Financial Products.
| | | | | | 2003 | | | | | | 2002 | |
|
|
|
|
|
|
|
|
|
|
|
| |
| Interest rate swaps | | Cross currency swaps | | Total | | Interest rate swaps | | Cross currency swaps | | Total | |
| | £m | | £m | | £m | | £m | | £m | | £m | |
|
|
|
|
|
|
|
|
|
|
|
| |
| At 1 January (third party contracts) | 46,219 | | 22,252 | | 68,471 | | 45,895 | | 23,157 | | 69,052 | |
|
|
|
|
|
|
|
|
|
|
|
| |
| At 1 January (contracts with ANFP) | 53,320 | | 1,597 | | 54,917 | | 56,627 | | 4,152 | | 60,779 | |
|
|
|
|
|
|
|
|
|
|
|
| |
| New contracts | 22,362 | | 5,483 | | 27,845 | | 29,649 | | 3,423 | | 33,072 | |
|
|
|
|
|
|
|
|
|
|
|
| |
| Acquisitions of subsidiary undertakings | – | | – | | – | | – | | – | | – | |
|
|
|
|
|
|
|
|
|
|
|
| |
| Matured and amortised contracts | (32,416 | ) | (2,636 | ) | (35,052 | ) | (23,930 | ) | (3,187 | ) | (27,117 | ) |
|
|
|
|
|
|
|
|
|
|
|
| |
| Terminated contracts | (14,502 | ) | (4,430 | ) | (18,932 | ) | (3,125 | ) | (983 | ) | (4,108 | ) |
|
|
|
|
|
|
|
|
|
|
|
| |
| Effect of foreign exchange rate and other movements | (1,652 | ) | (28 | ) | (1,680 | ) | (2,270 | ) | (158 | ) | (2,428 | ) |
|
|
|
|
|
|
|
|
|
|
|
| |
| Net (decrease) increase in contracts with ANFP | (3,898 | ) | (24 | ) | (3,922 | ) | (3,307 | ) | (2,555 | ) | (5,862 | ) |
|
|
|
|
|
|
|
|
|
|
|
| |
| At 31 December | 69,433 | | 22,214 | | 91,647 | | 99,539 | | 23,849 | | 123,388 | |
|
|
|
|
|
|
|
|
|
|
|
| |
| | | Pay fixed | | | Receive fixed | | | Pay variable | | Receive variable | |
|
|
|
|
|
|
|
|
|
|
|
|
|
| |
| | Nominal | | | | Nominal | | | | Nominal | | | | Nominal | | | |
| | amount | | Rate | | amount | | Rate | | amount | | Rate | | amount | | Rate | |
| | £m | | % | | £m | | % | | £m | | % | | £m | | % | |
|
|
|
|
|
|
|
|
|
|
|
|
|
| |
| Contracts maturing(1): | | | | | | | | | | | | | | | | |
|
|
|
|
|
|
|
|
|
|
|
|
|
|
|
|
|
| Less than one year | 8,543 | | 4.30 | | 16,729 | | 4.38 | | 23,177 | | 2.67 | | 15,031 | | 2.50 | |
|
|
|
|
|
|
|
|
|
|
|
|
|
|
|
|
|
| One to three years | 9,210 | | 4.70 | | 12,036 | | 4.51 | | 24,688 | | 2.27 | | 21,801 | | 2.23 | |
|
|
|
|
|
|
|
|
|
|
|
|
|
|
|
|
|
| Three to five years | 2,481 | | 5.30 | | 3,292 | | 4.91 | | 9,353 | | 3.17 | | 8,535 | | 2.77 | |
|
|
|
|
|
|
|
|
|
|
|
|
|
|
|
|
|
| Over five years | 5,182 | | 5.82 | | 7,198 | | 6.47 | | 9,240 | | 3.28 | | 7,097 | | 2.77 | |
|
|
|
|
|
|
|
|
|
|
|
|
|
| |
| Total | 25,416 | | | | 39,255 | | | | 66,458 | | | | 52,464 | | | |
|
|
|
|
|
|
|
|
|
|
|
|
|
| |
The total pay fixed nominal amount comprises £25,368m in respect of interest rate swaps and £48m in respect of cross-currency swaps. The total receive fixed nominal amount comprises £34,711m in respect of interest rate swaps and £4,544m in respect of cross-currency swaps. The total pay variable nominal amount comprises £44,064m in respect of interest rate swaps and £22,394m in respect of cross-currency swaps. The total receive variable nominal amount comprises £34,721m in respect of interest rate swaps and £17,743m in respect of cross-currency swaps.
A difference arises when comparing nominal contract assets and nominal contract liabilities. Whereas with single currency swaps there are equal and opposite nominal balances on either side of the swap leg, this is not necessarily the case with cross-currency swaps. At contract date sterling equivalent nominal amounts should be equal and opposite, however, subsequent exchange rate movements will result in divergence in the nominal amounts. This exchange rate divergence explains the difference between nominal contract asset balances and nominal contract liability balances.
The weighted average interest rates presented in the tables above reflect interest rates in a range of currencies. These rates should not be analysed in isolation from the rates on the underlying instruments. The effect of hedges has been included in the average interest rates presented in the average balance sheet included elsewhere in this Annual Report.
The contract amount of each type of end-use contract(excluding cross-currency swaps and interest rate swaps which are included in the swaps detailed above) at 31 December 2003 are set forth by currency in the table below. Of these contracts £9,677m mature within one year and £2,487m mature after one year.
| Contract type by nominal amount | |
|
|
|
|
|
|
|
|
|
| |
Forward
foreign
exchange
and foreign
exchange swaps | | Forward rate agree- ments | | Options caps and floors (OTC) | (1) | Futures (exchange traded) | | Equity contracts | |
| | £m | | £m | | £m | | £m | | £m | |
|
|
|
|
|
|
|
|
|
| |
| Sterling | – | | – | | 2,185 | | – | | 112 | |
|
|
|
|
|
|
|
|
|
| |
| US dollars | – | | 2,213 | | 209 | | 3,843 | | 453 | |
|
|
|
|
|
|
|
|
|
| |
| Euro | 1,540 | | – | | 87 | | 883 | | 357 | |
|
|
|
|
|
|
|
|
|
| |
| Hong Kong dollar | – | | – | | 3 | | – | | – | |
|
|
|
|
|
|
|
|
|
| |
| Switzerland franc | 90 | | – | | – | | 181 | | 8 | |
|
|
|
|
|
|
|
|
|
| |
| Total | 1,630 | | 2,213 | | 2,484 | | 4,907 | | 930 | |
|
|
|
|
|
|
|
|
|
| |
| (1) All Over-the-counter option contracts are in respect of interest related instruments. |
| |
| 84 | Abbey Annual Report and Accounts 2003 |
Back to Contents
Operating and Financial Review
Risk Management continued
Trading derivatives
The following table sets forth the contract or underlying principal (nominal) amounts, positive market values and negative market values of derivatives held for trading purposes at 31 December 2003 and 2002.
| | | | | | | | | | | | Group | |
|
|
|
|
|
|
|
|
|
|
|
| |
| Contract or underlying principal 2003 | | Positive market values 2003 | | Negative market values 2003 | | Contract or underlying principal 2002 | | Positive market values 2002 | | Negative market values 2002 | |
| | £m | | £m | | £m | | £m | | £m | | £m | |
|
|
|
|
|
|
|
|
|
|
|
| |
| Exchange rate contracts: | | | | | | | | | | | | |
|
|
|
|
|
|
|
|
|
|
|
| |
| Cross-currency swaps | 10,572 | | 253 | | 428 | | 10,801 | | 173 | | 218 | |
|
|
|
|
|
|
|
|
|
|
|
| |
| Foreign exchange swaps and forwards | 19,399 | | 76 | | 72 | | 7,558 | | 60 | | 121 | |
|
|
|
|
|
|
|
|
|
|
|
| |
| | 29,971 | | 329 | | 500 | | 18,359 | | 233 | | 339 | |
|
|
|
|
|
|
|
|
|
|
|
| |
| Interest rate contracts: | | | | | | | | | | | | |
|
|
|
|
|
|
|
|
|
|
|
| |
| Interest rate swaps | 380,989 | | 8,254 | | 8,794 | | 329,834 | | 10,006 | | 10,432 | |
|
|
|
|
|
|
|
|
|
|
|
| |
| Caps, floors and swaptions | 56,436 | | 771 | | 796 | | 74,462 | | 714 | | 904 | |
|
|
|
|
|
|
|
|
|
|
|
| |
| Futures(exchange traded) | 5,348 | | 32 | | 28 | | 25,274 | | – | | 8 | |
|
|
|
|
|
|
|
|
|
|
|
| |
| Forward rate agreements | 4,547 | | 2 | | 1 | | 1,722 | | – | | 7 | |
|
|
|
|
|
|
|
|
|
|
|
| |
| | 447,320 | | 9,059 | | 9,619 | | 431,292 | | 10,720 | | 11,351 | |
|
|
|
|
|
|
|
|
|
|
|
| |
| Equity and credit contracts: | | | | | | | | | | | | |
|
|
|
|
|
|
|
|
|
|
|
| |
| Equity index and similar products | 11,561 | | 538 | | 2,535 | | 13,639 | | 348 | | 1,233 | |
|
|
|
|
|
|
|
|
|
|
|
| |
| Equity index options (exchange traded) | 8,363 | | 70 | | 301 | | 2,538 | | – | | 193 | |
|
|
|
|
|
|
|
|
|
|
|
| |
| Credit default swaps and similar products | 16,171 | | 103 | | 74 | | 11,412 | | 154 | | 96 | |
|
|
|
|
|
|
|
|
|
|
|
| |
| | 36,095 | | 711 | | 2,910 | | 27,589 | | 502 | | 1,522 | |
|
|
|
|
|
|
|
|
|
|
|
| |
| Total | 513,386 | | 10,099 | | 13,029 | | 477,240 | | 11,455 | | 13,212 | |
|
|
|
|
|
|
|
|
|
|
|
| |
| Effect of netting | | | (8,456 | ) | (8,456 | ) | | | (9,745 | ) | (9,745 | ) |
|
|
|
|
|
|
|
|
|
|
|
| |
| Fair values of contracts between ANFP and other Abbey entities(1) | – | | – | | 189 | | – | | 132 | | – | |
|
|
|
|
|
|
|
|
|
|
|
| |
| Amount included in Other assets/Other liabilities | | | 1,643 | | 4,762 | | | | 1,842 | | 3,467 | |
|
|
|
|
|
|
|
|
|
|
|
| |
| (1) Associated contracts which Abbey National Financial Products has transacted with external counterparties are included in the analysis of trading derivatives. | |
Positive fair values arise where gross positive fair values exceed gross negative fair values on a contract-by-contract basis. This equates to net replacement cost. Negative fair values arise where gross negative fair values exceed gross positive fair values on a contract-by-contract basis. The totals of positive and negative fair values arising on trading derivatives at 31 December 2003 have been netted where Abbey has a legal right of offset with the relevant counterparty.
| Abbey Annual Report and Accounts 2003 | 85 |
Operating and Financial Review
Risk Management continued
All exchange traded instruments are subject to cash requirements under the standard margin arrangements applied by the individual exchanges. Such instruments are not subjectto significant credit risk.
Treasury Services has a mandate to deal in credit derivatives. Treasury Services acts as principal under this mandate, and takes a fee for guaranteeing the counterparty against the default of the senior obligations of a third party. Amounts in respect of non-trading credit derivative contracts are included under note 46, “Guarantees and assets pledged as collateral security”.
Substantially all of Abbey’s over-the-counter derivatives activity is contracted with financial institutions.
The following table analyses over-the-counter and other non-exchange traded derivatives held for trading purposes by remaining maturity:
| | | | | | | | Group | |
|
|
|
|
|
|
|
| |
| Contract or underlying principal 2003 | | Replacement cost 2003 | | Contract or underlying principal 2002 | | Replacement cost 2002 | |
| | £m | | £m | | £m | | £m | |
|
|
|
|
|
|
|
| |
| Trading derivatives | | | | | | | | |
| maturing (before netting): | | | | | | | | |
|
|
|
|
|
|
|
| |
| In not more than one year | 105,884 | | 1,018 | | 122,334 | | 994 | |
|
|
|
|
|
|
|
| |
| In more than one year but | | | | | | | | |
| not more than five years | 219,871 | | 3,914 | | 186,066 | | 4,585 | |
|
|
|
|
|
|
|
| |
| In more than five years | 173,920 | | 5,065 | | 141,028 | | 5,876 | |
|
|
|
|
|
|
|
| |
| | 499,675 | | 9,997 | | 449,428 | | 11,455 | |
|
|
|
|
|
|
|
| |
Unrecognised gains and losses on financial assets and financial liabilities resulting from hedge accounting
Gains and losses on financial instruments used for hedging are not recognised until the exposure that is being hedged is itself recognised. Unrecognised gains and losses on instruments used for hedging are as follows:
| | | | | | Group | |
|
|
|
|
|
| |
| 2003 Gains | | 2003 Losses | | 2003 Net gains (losses) | |
| | £m | | £m | | £m | |
|
|
|
|
|
| |
| Gains and losses expected | | | | | | |
| to be recognised: | | | | | | |
|
|
|
|
|
| |
| In one year or less | 633 | | (423 | ) | 210 | |
|
|
|
|
|
| |
| After one year | 1,561 | | (2,071 | ) | (510 | ) |
|
|
|
|
|
| |
| | 2,194 | | (2,494 | ) | (300 | ) |
|
|
|
|
|
| |
| |
| 2002 Gains | | 2002 Losses | | 2002 Net gains (losses) | |
| | £m | | £m | | £m | |
|
|
|
|
|
| |
| Gains and losses expected | | | | | | |
| to be recognised: | | | | | | |
|
|
|
|
|
| |
| In one year or less | 678 | | (549 | ) | 129 | |
|
|
|
|
|
| |
| After one year | 1,686 | | (2,205 | ) | (519 | ) |
|
|
|
|
|
| |
| | 2,364 | | (2,754 | ) | (390 | ) |
|
|
|
|
|
| |
The net gain unrecognised at 31 December 2002 and recognised during the year was £129m (2002: £157m).
Deferred gains and losses on financial assets and financial liabilities resulting from hedge accounting
Deferred balances relating to settled derivatives and other financial transactions previously used as hedges will be released to the Profit and Loss Account in the same periods as the income and expense flows from the underlying hedged transactions. The movement in the period is as follows:
| | | | | | Group | |
|
|
|
|
|
| |
| | | | | | Total | |
| | | | | | Net gains | |
| | Gains | | Losses | | (losses) | |
| | £m | | £m | | £m | |
|
|
|
|
|
| |
| At 1 January 2003 | 64 | | (17 | ) | 47 | |
|
|
|
|
|
| |
| Previous year’s deferred gains | | | | | | |
| and losses recognised in the year | (9 | ) | (3 | ) | (12 | ) |
|
|
|
|
|
| |
| Gains and losses deferred in the year | (9 | ) | 9 | | – | |
|
|
|
|
|
| |
| At 31 December 2003 | 46 | | (11 | ) | 35 | |
|
|
|
|
|
| |
| Gains and losses expected | | | | | | |
| to be recognised: | | | | | | |
|
|
|
|
|
| |
| In one year or less | 10 | | (11 | ) | (1 | ) |
|
|
|
|
|
| |
| After one year | 36 | | – | | 36 | |
|
|
|
|
|
| |
Credit Derivatives
The following table presents the notional amounts of credit derivativesprotection bought and sold at 31 December 2003.
| | | | Protection | |
|
|
|
| |
| | Purchased | | Sold | |
| | £m | | £m | |
|
|
|
| |
| Notional amounts | | | | |
|
|
|
| |
| Portfolio Business Unit protection | 1,206 | | – | |
|
|
|
| |
| Proprietary/trading activity(1) | 11,928 | | 7,191 | |
|
|
|
| |
| Total | 13,134 | | 7,191 | |
|
|
|
| |
| (1) This includes £58m (notional) of portfolio credit derivatives. | |
The use of derivatives to manage exposures does not reduce the reported levels of assets on the balance sheet or the level of off-balance sheet commitments.
Portfolio Business Unit protection activity
Within the Portfolio Business Unit, credit derivatives have been used as hedging instruments for assets held on the balance sheet. Purchased protection at 31 December 2003 within the Portfolio Business Unit totalled £1.2bn. This excludes partial protection of a notional £680m obtained through synthetic collateralised debt obligation portfolio hedging activity.These transactions are accrual accounted.
Proprietary/Trading activity
Abbey’s current proprietary/trading activity in credit derivatives is proprietary driven. The business trades in single-name credit derivatives and also a limited number portfolio credit derivative transactions. The credit derivatives’ trading function operates within the same framework as other trading functions. Risk limits are established and closely monitored.
At 31 December 2003, the total notional amounts of protection purchased and sold by the proprietary/trading business were £11.9bn and £7.2bn, respectively. The mismatch between notional amounts is largely attributable to Abbey using credit derivative transactions hedged with securities positions. The overwhelming majority of positions are matched. Consequently the amount of retained credit risk contributed by the credit derivatives trading activity is small in the context of Abbey’s overall credit exposures.
| 86 | Abbey Annual Report and Accounts 2003 |
Back to Contents
Report of the Directors
Directors
Lord Burns
Chairman
Lord Burns (age 59) was appointed Joint Deputy Chairman on 1 December 2001 and Chairman on 1 February 2002. He is also Chairman of Glas Cymru Ltd (Welsh Water) and a Non-Executive Director of Pearson Group plc and British Land plc. He was formerly Permanent Secretary to the Treasury and chaired the Parliamentary Financial Services and Markets Bill Joint Committee. Until October 2001, he was a Non-Executive Director of Legal & General Group plc.
Executive directors
Luqman Arnold
Chief Executive
Luqman Arnold (age 53) was appointed Chief Executive on 21 October 2002. Before joining Abbey, he was at UBS AG where he was President and Chairman of the Group Executive Board. At Banque Paribas he was a member of the Executive Committee and a member of the Management Committee and Board. At Credit Suisse First Boston he was a member of the Operating Committee.
Stephen Hester
Chief Operating Officer
Stephen Hester (age 42) joined Abbey as Finance Director on 13 May 2002 and was appointed Chief Operating Officer in February 2003. His previous career was with Credit Suisse First Boston from 1982 to 2001 holding various positions including, Co-Head UK Investment Banking, Co-Head European Mergers and Acquisitions and Industry Groups, Executive Board member from 1996, Chief Financial Officer, Head of Support Division, and Global Head of Fixed Income Division.
Tony Wyatt
Executive Director, Customer Operations
Tony Wyatt (age 54) was appointed Executive Director of Customer Operations on 1 September 2003, having previously held positions with Novantas, New Power, AT&T, Guardian Royal Exchange and Midland Bank, including roles as Managing Director of Operations and Technology, Director of Group Development, and Banking Systems Director.
Mark Pain
Executive Director, Customer Sales
Mark Pain (age 42) was appointed Finance Director on 1 January 1998 and Managing Director of Wholesale Banking in November 2001. He joined Abbey in 1989, having previously held positions with Touche Ross & Co and TSB Group. His previous appointments at Abbey include Manager of Strategic Planning, Manager of European Operations, Regional Director of Retail, and Group Financial Controller.
Yasmin Jetha
Executive Director, Information Technology
Yasmin Jetha (age 51) was appointed Group Information Technology and Infrastructure Director on 23 January 2001. She joined Abbey in 1985, having previously held positions with Lucas CAV and Nationwide Building Society. Her previous positions in Abbey include Director of Corporate Systems, Director of Retail Lending, and Director of Retail Service and Operations. She is also a Pensions Trustee.
Angus Porter
Executive Director, Customer Propositions
Angus Porter (age 46) was appointed as Customer Propositions Director on 1 July 2003. He was formerly Managing Director for the Consumer Division of BT plc. Before BT, he spent 14 years at Mars Confectionery in a variety of research and development, sales and marketing roles, including four years as Marketing Director. Priscilla Vacassin
Executive Director, Human Resources
Priscilla Vacassin (age 46) was appointed Executive Director, Human Resources on 1 June 2003. She was previously Group Human Resources Director at BAA plc, before which she was Director of Organisational Management and Development at the same company. She also spent 10 years with the Kingfisher Group (1988 to 1998), before which she worked for United Biscuits.
| Abbey Annual Report and Accounts 2003 | 87 |
Back to Contents
Report of the Directors
Directors continued
Non-Executive Directors
Keith Woodley
Deputy Chairman and Senior Independent Non-Executive Director
Keith Woodley (age 64) was appointed as a Non-Executive Director on 5 August 1996. He was made Deputy Chairman and Senior Independent Non-Executive Director in April 1999. He is a former Non-Executive Director of National and Provincial Building Society and a former partner of Deloitte Haskins & Sells. A past President of the Institute of Chartered Accountants in England and Wales, he is currently Complaints Commissioner for the London Stock Exchange and a Council Member and Treasurer of the University of Bath.
Leon Allen
Leon Allen (age 64) was appointed as a Non-Executive Director on 1 October 1998. A US citizen, he was previously employed, for 18 years, at Procter & Gamble and then spent eight years with RJR Nabisco. Following that, he held appointments as Chief Executive of Del Monte Foods Europe, Chairman and Chief Executive of Del Monte Foods International Ltd, and Chairman and Chief Executive of Tetley Group Ltd. He is currently a Non-Executive Chairman of Braes Group Ltd and Non-Executive Chairman of the Appleshaw Group Ltd.
Geoffrey Cooper
Geoffrey Cooper (age 49) was appointed as a Non-Executive Director on 1 January 2004. He joined Alliance UniChem plc in 1994 as Finance Director and was appointed Deputy Chief Executive in 2001. Before joining Alliance UniChem, he was Finance Director of Gateway Group (now Somerfield plc) (1990 to 1993) and a Management Consultant with Spicers Consulting Group and Arthur Young (1980 to 1990).
Richard Hayden
Richard Hayden (age 58) was appointed as a Non-Executive Director on 21 September 1999. A US citizen, he was previously employed at Goldman Sachs where, since 1969, he held a variety of positions including General Partner and Deputy Chairman. He is currently Executive Chairman of GSC Partners Europe Ltd. He is also a Non-Executive Director of COFRA Holdings and an Advisory Director of Perry Capital.
Gerry Murphy
Gerry Murphy (age 48) was appointed as a Non-Executive Director on 1 January 2004. He joined Kingfisher as Chief Executive in February 2003. He was previously Chief Executive of Carlton Communications plc (2000 to 2003). Before joining Carlton, he was Chief Executive of Exel plc (formerly NFC plc), the UK-listed logistics and supply chain management business (1995 to 2000), and Chief Executive of food manufacturers Greencore Group plc (1991 to 1995). He was previously a Non-Executive Director of Novar plc (formerly Caradon plc) (1997-2003).
Vittorio Radice
Vitorio Radice (age 46) was appointed as a Non-Executive Director on 23 October 2001. An Italian citizen, he is Executive Director of Home, at Marks & Spencer plc. He was formerly Chief Executive of Selfridges plc; and a Managing Director of Habitat UK, and is also a Non-Executive Director of Shoppers Stop India Ltd.
Lord Shuttleworth
Lord Shuttleworth (age 55) was appointed as a Non-Executive Director on 5 August 1996 and held the post of Deputy Chairman from 1996 to April 1999. He was formerly Chairman of the National and Provincial Building Society and the Rural Development Commission. He is currently Lord-Lieutenant for the County of Lancashire.
| 88 | Abbey Annual Report and Accounts 2003 |
Back to Contents
Report of the Directors
Directors’ Report
The directors have pleasure in presenting their report for Abbey National plc for the year ended 31 December 2003.
Principal activities
The principal activity of Abbey National plc and its subsidiaries continues to be the provision of an extensive range of Personal Financial Services. The Operating and Financial Review for the year, including a review of non-banking activities, is set out on pages 8 to 86 of this document. Note 23 to the Financial Statements provides a list of the principal subsidiaries and the nature of each company’s business as well as details of overseas branches. Details of important events which have occurred since the end of the financial year and prospects for 2004 are included in the Business review and the Operating and Financial Review sections.
Results and dividends
The loss on ordinary activities before tax for the year ended 31 December 2003 was £686m (2002: £984m).
An interim net dividend of 8.33 pence per ordinary share was paid on 6 October 2003 (2002: 17.65 pence per ordinary share).
The directors propose a final dividend for the year of16.67 pence per ordinary share (2002: 7.35 pence per ordinary share) to be paid on 4 May 2004.
Share capital
The authorised and issued share capital of Abbey is detailed in note 42 to the Financial Statements.
During the year, 249,116 ordinary shares were issued on the exercise of options under the Sharesave scheme, 450 ordinary shares were issued on the exercise of options under the terms of the Employee Share Option Scheme and 114,990 ordinary shares were issued under the terms of the Executive Share Option Scheme. In addition, 2,109,211 ordinary shares were issued in lieu of cash for the final dividend for 2002 and 1,928,522 ordinary shares were issued in lieu of cash for the interim dividend in 2003, in accordance with the terms of the Alternative Dividend Plan. During 2003, shares to meet grants under the Executive Share Option Scheme and Share Matching Scheme were purchased in the market by the Abbey National ESOP Trust and the Abbey National Employee Trust. Shares, which are intended to be used in respect of the conditional rights under the Abbey National Employee Share Ownership Scheme (Partnership Shares) were purchased in the market and held in the Abbey National ESOP Trust.
At the Annual General Meeting on 24 April 2003, shareholders authorised Abbey to make market purchases of its own shares, to a maximum of 145,802,777 ordinary shares of 10 pence each, 125 million 85/8% preference shares of £1.00 each and 200 million 103/8% preference shares of £1.00 each. No purchases have been made during the year under these authorities. These authorities remain valid until the forthcoming Annual General Meeting, when it is intended that resolutions will be put to shareholders to renew them and extend them to cover the series B dollar preference shares. The contractual conditions precedent to any redemption of the 1996 US Dollar denominated preference shares were met during 2003, and Abbey chose to exercise its right to redeem these instruments in July 2003.
Market value of land and buildings
On the basis of a periodic review process, the estimated aggregate market value of the company and its subsidiaries’ land and buildings was below the fixed asset net book value of £39m, as disclosed in note 26 to the Consolidated Financial Statements, by approximately £20m. It is considered that, except where specific provisions have been made, the land and buildings have a value in use to the Abbey group of companies which exceeds the estimated market value, and that the net book value is not impaired.
Directors and directors’ interests
Details of all the current directors are included on pages 87 and 88.
All of the directors have served on the Board for the whole of the period 1 January to 31 December 2003, with the exception of Priscilla Vacassin, Angus Porter and Tony Wyatt who were appointed to the Board on 1 June 2003, 1 July 2003 and 1 September 2003 respectively. Having been appointed to the Board since the last Annual General Meeting, Priscilla Vacassin, Angus Porter, Tony Wyatt, together with Gerry Murphy and Geoffrey Cooper, who were appointed on 1 January 2004, will retire and, being eligible, offer themselves for election at the forthcoming Annual General Meeting. Leon Allen, Yasmin Jetha and Mark Pain will retire by rotation at the Annual General Meeting and, all being eligible, offer themselves for re-election. Malcolm Millington retired as an Executive Director on 8 September 2003. Peter Ogden retired as a Non-Executive Director on 31 December 2003.
In accordance with our Articles of Association, one third (or the nearest whole number below one third) of the Directors of Abbey are required to retire by rotation at each Annual General Meeting, together with the Directors appointed by the Board since the previous Annual General Meeting. The retiring Directors may stand for re-election.
No director had a material interest in any contract of significance, other than a service contract, with Abbey or any of its subsidiaries at any time during the year. Disclosures required by FRS 8, Related Party Disclosures, are set out in note 56 to the Financial Statements.
Directors’ interests in the shares of the Company, awards under the Long Term Incentive Plan and options to acquire shares are set out in the Remuneration report on pages 99 to 105.
Substantial shareholdings
As at 25 February 2004, Abbey has received notification of disclosable interests in the issued ordinary share capital, in accordance with sections 198 to 208 of the Companies Act 1985. Fidelity Management & Research Company has disclosed an interest in 58,767,384 ordinary shares of 10 pence each, representing 4.03% of the issued share capital of Abbey. Franklin Resources Inc. has disclosed an interest in 44,239,862 ordinary shares of 10 pence each, representing 3.04% of the issued share capital of Abbey. Legal & General Investment Management Limited has disclosed an interest in 43,777,126 ordinary shares of 10 pence each, representing 3.01% of the issued share capital of Abbey.
Corporate governance
A report on corporate governance is set out on pages 96 to 98 of this Annual Report. The remuneration policy contained in the Remuneration report on pages 99 to 105 of this Annual Report will be proposed for approval at Abbey’s Annual General Meeting on 22 April 2004.
| Abbey Annual Report and Accounts 2003 | 89 |
Back to Contents
Report of the Directors
Directors’ Report continued
Corporate social responsibility
Abbey continues to be committed to good corporate citizenship and to treating all those who come into contact with us in a fair and ethical manner. We recognise the need to structure our approach to corporate social responsibility and to report regularly on progress. We do so through our annual corporate social responsibility report, which is approved by the board and includes information about our ethical principles, corporate governance, social impact of the business, treatment of employees, community involvement and charitable donations, and our environmental policy and performance. The corporate social responsibility report can be found on our website www.abbey.com > Abbey Corporate, and a hard copy can be obtained by writing to Community Relations at the registered office address on page 198 of this Annual Report.
Management of Corporate Social Responsibility
A Steering Group oversees all corporate social responsibility matters and is responsible for updating the board on strategy and process. This committee is chaired by the Executive Director, Human Resources, demonstrating the significance the board attaches to these issues.
Abbey aims to comply with industry standards including the Association of British Insurers disclosure guidelines on social responsibility, the Department of Trade and Industry Company Law Review and the Accounting for People Reportrecommendations. The Association of British Insurers call for companies to provide information on social, environmental and ethical matters in their annual reports, and we provide such information in this directors’ report, as summarised in the chart below.
| ABI guidelines | | Abbey response |
|
|
|
| 1. With regard to the board, the company should state in its annual report whether: |
|
|
|
| 1.1 The board takes regular account of the significance of social, environmental and ethical matters to the business of the company. | | Abbey’s annual corporate social responsibility report, with supporting information, is considered and approved by the board. The board also regularly reviews Abbey’s ethical, environmental, and human resources policies, which are drafted to reflect and ensure the management of the significant social, environmental and ethical risks identified by the business. |
|
|
|
| 1.2 The board has identified and assessed the significant risks to thecompany’s short- and long-term value arising from social, environmental and ethical matters, as well as the opportunities to enhance value that may arise from an appropriate response. | | Social, environmental and ethical issues are integral to the business. The business, including the Risk and Internal Audit functions, is responsible for identifying and assessing the risks and opportunities arising from social, environmental and ethical matters, and for reporting social, environmental and ethical risks upwards and, where appropriate, to the board. The board has confirmed the identification of social, environmental and ethical risks in the corporate social responsibility report. |
|
|
|
| 1.3 The board has received adequate information to make this assessment and that account is taken of social, environmental and ethical matters in the training of directors. | | The board receives regular reports about social, environmental and ethical mattersincluding the annual corporate social responsibility report. Thereis no explicit account taken of social, environmental and ethical matters in the training of directors, although this is being reviewed. |
|
|
|
| 1.4 The board has ensured that the company has in place effective systems for managing significant risks which, where relevant, incorporate performance management systems and appropriate remuneration incentives. | | There are a number of systems in place for the effective management of social, environmental and ethical risks. The company’s high-level risk architecture explicitly identifies social, environmental and ethical risks, and structures the work programme of Internal Audit and the risk management frameworks of Abbey.The corporate social responsibility steering group, the Chief Executive, and other executive directors have explicit responsibilities to promote ethical practices, environmental management and social responsibility, and receive regular information on our performance. At present, there are no remuneration incentives in place. |
|
|
|
| 2. With regard to policies, procedures and verification, the annual report should: |
|
|
|
| 2.1 Include information on social, environmental and ethical related risks and opportunities that may significantly affect the company’s short- and long-term value, and how they might impact on the business. | | Information is provided in the corporate social responsibility section of the directors’ report, as well as the annual corporate social responsibility report, following broad reporting areas recommended by Business in the Community: workplace, marketplace, community and environment and reflecting the key stakeholder concerns we are aware of. We will review the robustness of this process in line with the recommendations of the Operating and Financial Review Working Group on the assessment and reporting of “material” social, environmental and ethical risks. |
|
|
|
| 2.2 Describe the company’s policies and procedures for managing risks to short- and long-term value arising from social, environmental and ethical matters. If the annual report and accounts states that the company has no such policies and procedures, the board should provide reasons for their absence. | | The directors’ report includes such information within space constraints. Relevant information is provided on key social, environmental and ethical policies such as the statement of ethical principles, the environmental policy, procurement, and policies relating to employee diversity and other human resources issues. Further detail about policies and procedures for managing social, environmental and ethical risks to short- and long-term value is available in the annual corporate social responsibility report and the company website: www.abbey.com > Abbey Corporate. |
|
|
|
| 2.3 Include information about the extent to which the company has complied with its policies and procedures for managing risks arising. | | Some information is provided in the directors’ report, given space constraints. Further detail is presented in the annual corporate social responsibility report. |
|
|
|
| 2.4 Describe the procedures for verification of social, environmental and ethical disclosures. The verification procedure should be such as to achieve a reasonable level of credibility. | | The directors’ report and annual corporate social responsibility report are considered by the company’s Executive Committee and board. In addition, disclosures made in the environmental section of the 2002 corporate social responsibility report were verified independently by SGS United Kingdom. |
|
|
|
| 90 | Abbey Annual Report and Accounts 2003 |
Back to Contents
Report of the Directors
Directors’ Report continued
Code of ethics
Abbey’s ethical policies are set out in “How we do business”. This document, which was reviewed and updated by the board in 2003, confirms that:
| employees should raise concerns if they become aware that ethical polices and principles are not being followed; |
| we value all employees as individuals and treat them as partners in the business; |
| we will consider ethical and environmental concerns when investing Abbey assets; |
| we are committed to adopting sound environmental management practices; and |
| we expect suppliers to operate to high ethical standard. |
The “ethical investment guidelines” are an integral part of the risk management processes for investment decision making. They are found within “How we do business”; this is posted on our website at www.abbey.com > Abbey Corporate >General Information > Our policies.
Procedures are also in place for employees to follow if they feel that there has been a breach of ethical or environmental principles, and they are urged to follow these procedures if they have evidence of any breaches.
We also comply with the applicable code of ethics regulations of the United States Securities and Exchange Commission arising from the Sarbanes-Oxley Act. Amongst other things, the Sarbanes-Oxley Act aims to protect investors by improving the accuracy and reliability of information that companies disclose. It requires companies to disclose whether they have a code of ethics that applies to the Chief Executive and senior financial officers that promotes honest and ethical conduct; full, fair, accurate, timely and understandable disclosures; compliance with applicable governmental laws, rules and regulations; prompt internal reporting of violations; and accountability for adherence to such a code of ethics. We meet these requirements through “How we do business”, our whistleblowing policy, the Financial Services Authority’s Principles for Businesses, and the Financial Services Authority’s Principles and Code of Practice for Approved Persons (together, the Code of Ethics), with which the Chief Executive and senior financial officers must comply. These include requirements to manage conflicts of interest appropriately and to disclose any information the Financial Services Authority may want to know about. We provide a copy of our code of ethics to anyone, free of charge, on application to our registered office address as shown on page 198.
We participate in a number of indices (FTSE4Good and Dow Jones Sustainability indices) and benchmarking exercises focusing on corporate social responsibility issues. We continue to be a member of the FORGE Group, a government-supported consortium of major financial services companies that, in 2002, formalised a structured approach for the management and reporting of corporate social responsibility issues for the financial sector.
| Employees | | |
| | At 31 December 2003 | |
|
| |
| Total employees* | 27,726 | |
|
| |
| Total female employees | 18,402 | |
|
| |
| Total male employees | 9,324 | |
|
| |
| Total full-time employees | 21,116 | |
|
| |
| Total part-time employees | 6,610 | |
|
| |
| Total full-time ethnic minority employees | 1,472 | |
|
| |
| Total part-time ethnic minority employees | 464 | |
|
| |
| Employees aged 50 and under | 25,157 | |
|
| |
| Employees aged over 50 | 2,569 | |
|
| |
| Employee turnover (%) | 14.66 | |
|
| |
| Average days absent per employee | 10 | |
|
| |
| Total number of staff grievances(at final stage) | 9 | |
|
| |
| Total employee satisfaction (%) | 58 | |
| (with everything measured by the employee opinion survey) | | |
|
| |
| Training | | |
|
| |
| Total number of training days | 188,752 | |
|
| |
| Average number of training days per employee | 7 | |
|
| |
| Average £ invested in training per employee | £614 | |
|
| |
| Health and Safety | | |
|
| |
| Total number ofreported accidents | 296 | |
|
| |
| Total number of accidents reported to enforcing authorities | 36 | |
|
| |
| Total number of adjustments to workplaces | 543 | |
|
| |
| Workplace adjustments for disabled employees | 42 | |
|
| |
* The total number of employees, as at 31 December 2003, on a full-time equivalent basis.
| Abbey Annual Report and Accounts 2003 | 91 |
Back to Contents
Report of the Directors
Directors’ Report continued
Workplace
Equality and diversity
Abbey has shown a lasting commitment to workforce diversity and has had some form of diversity policy since the early 1980s. Our “Valuing People as Individuals” policy is consistent with the values that underpin our culture. This policy is available on our website at www.abbey.com > Abbey Corporate > Key facts > Our policies.
We were pleased that our work in the area of diversity was recognised in 2003 when Opportunity Now awarded us the Silver Standard in its benchmarking index on gender equality. In 2003, we undertook an equal pay audit for the third consecutive year. The results showed that overall pay levels of men and women are within 10% of each other.
We’ve continued to work with local communities, particularly where we have large offices. We have nine community partnership groups around the country.Their main role is to distribute donations from our Charitable Trust to meet the needs of the community. There are also a number of diversity action groups. These work to promote a more diverse workforce in their local areas. Our aim is to develop further our relationship with local communities by expanding the number of diversity action groups, and by co-ordinating their work with that of the Community Partnership Groups, to provide a more focused approach to the community.
We’ve continued our involvement in national interest groups throughout 2003. We’ve supported Opportunity Now, the Employers’ Forum on Disability, the Employers’ Forum on Age, and Race for Opportunity. We came 11thin the Race for Opportunity and 4thin the Global Inclusion Disability Benchmark.
Our Disability Employment Action Team has continued to focus on setting up a strong framework for the employment of people with disabilities. This helps to make sure that we have the appropriate processes in place to help recruit, develop and retain employees with disabilities. The following are examples of the Disability Employment Action Team’s work over the past year. |
| A mentoring scheme for employees with disabilities has been set up across Abbey. Mentors from around the country took part in a training day to make sure that they had the appropriate skills to advise employees with disabilities. |
| We provided financial support and took part in the Employers’ Forum on Disability pilot bench marking survey. The Employers’ Forum on Disability is developing a bench marking tool to help enable its members to become “Confident with Disability”. We found the process useful in reviewing our own progress on disability and identifying areas where action still needs to be taken. |
We’re committed to the Disability Discrimination Act and are proud to use the Employment Service “Positive about Disabled People” symbol. We have a partnership agreement with the Employment Service Disability Service to provide access to work for people with disabilities. This aims to make sure that new and existing staff get the necessary aids and equipment to make their working life easier. Work-life balance
Abbey is committed to supporting individuals in achieving a reasonable balance between their home and working life. We understand that people must be valued and supported through the various stages of their lives. As a result, we offer a wide range of flexible working options, including part-time work, job sharing, homeworking, compressed working arrangements, career breaks and extended maternity and adoption arrangements.
Our employees’ health and well-being is very important to us and we want to support them as much as we can. Experience has shown us that employees need help in a number of ways and that’s what our Employee Advice Line is all about. We want to give them the right help in the right way, or point them towards someone who can. |
| Our confidential Employee Advice Line can: |
| answer questions about their employment with Abbey; |
| point them in the right direction if they’ve got a personal problem; and |
| tell them about our external counselling provider which offers professional counselling to Abbey employees on a wide range of work or personal issues. This counselling can be done on the telephoneor face to face. |
Abbey also provides post-trauma counselling. Employees might need this if they’ve experienced violence, a major personal upset or some othertraumatic event at work. Health and Safety
At Abbey we believe that healthy employees working in a safe environment enhance the business and the achievement of our objectives.
Ensuring this is good business practice and a positive investment which protects our people who are our most valuable asset.
In 2003 our Chief Executive set down a new policy statement on health and safety at work and we strengthened our directly employed occupational health and safety team to provide an improved service to the business.
Throughout the year we pursued our goal of health and safety excellence and a number of initiatives were introduced to improve our health and safety performance. We were pleased to experience a significantly reduced number of serious accidents in 2003. Health and safety projects in 2003
Some of the initiatives we undertook in 2003 are listed below. |
| Driver road risk – outside studies show that about 30% of all road accidents involve drivers on company business. We have around 3,000 employees who drive on company business, so we commissioned the Royal Automobile Club to complete a driver “road risk survey” for us. As a result, a new Road Safety Policy is being prepared for the business. |
| Asbestos management – to ensure safe working in the branch network we commissioned a series of asbestos surveys and have put in place clear plans detailing how we will manage any asbestos risk in the future. |
| Stress management – we’ve reviewed our policy on managing work-related stress, and put in place new guidelines and procedures to ensure our people are adequately protected. |
| Sickness absence management – we undertook a comprehensive overhaul of our sickness absence procedures to ensure we deliver an improved service to the business. |
| Contractor safety – we’ve developed new guidelines and procedures to ensure contractors carrying out work for Abbey always operate in a safe way and within health and safetylaw. |
| Health and safety training – we critically analysed the training we provide for our people and are in the process of selecting an e-learning provider for Abbey. |
Employee communications
We believe that involving employees is key to being successful. This means effective communication is vital to everything we do. We publish a magazine every other month for employees – “read” – that combines work-related issues and information with more general articles. Almost all employees have access to our intranet – “net”. We also use more traditional methods of communication, such as team meetings. All these channels are designed to keep employees fully informed of news and developments which may have an impact on them, and also to keep them up to date on financial, economic and otherfactors which affect the company’s performance.
It’s just as important to listen to the views and opinions of our employees and, for the last decade, we’ve asked for their views on a range of issues through departmental and company-wide opinion surveys. These surveys are confidential and employees don’t have to give their names. Data is inputted and analysed by an external company and no-one in Abbey has access to the completed questionnaires.
| 92 | Abbey Annual Report and Accounts 2003 |
Back to Contents
Employee opinion survey
In May 2003, the survey was sent to 26,500 employees, over half of whom completed it. The response rate to the survey increased from 51.9% to 53.7%.
Whilst overall the scores in all categories from last year have decreased, in the majority of cases we are on a par with Financial and Retail average benchmarks. Given the pace and extent of change taking place within Abbey, we have not been surprised at the decline and are addressing these issues.
Despite decreasing from last year, some of the questions in the survey achieved favourable scores. 82% of our employees think that their manager focuses on ensuring that their business area objectives are achieved, 80% of employees are committed to helping the company to succeed, and 74% feel that they have a clear understanding of the goals and objectives of their business area.
Developing our people
Abbey’s Training and Development department supports employees by providing training and development that is effective, efficient and responsive. This department works in partnership with each business area to provide learning and development activities where they will add the most benefit. In 2003, we increased the number of training days by 38% from 2002 to almost 190,000 days.
Facilities
Abbey has seven dedicated learning environments, where we deliver on-line training using a desktop computer.This on-line training ensures we deliver consistent and high-quality training, and that we provide appropriate and cost-effective learning for all employees. The facilities are also available to staff out of hours to help them study outside their job role for their own personal development.
We also provide a library facility where we lend training videos and Office 2000 software.
Performance development
Abbey wants to create a high performance culture. This means we’re committed to developing our employees’ ability to perform at their best, continualy stretching them to deliver better service to our customers, and supporting each other by removing obstacles and using their talent to produce better results.
We believe everyone can give of their best and be successful.
Our approach to performance development is simple and straightforward. It’s about being clear what “best” and “successful” mean. Employees will understand what’s expected of them and get the right development and support to allow them to succeed. And when they’ve done this, they will be recognised and rewarded for their contribution.
Employees are responsible for their performance and their manager is responsible for making sure they are clear about what they need to do to perform to their best, and for supporting them to achieve it.
So what’s involved?
There are four elements to performance development:
| what you’ll do – this is what employees need to achieve and will be clearly linked to their business area’s performance plan; |
| how you’ll be – this will help them understand how they need to behave to do their job well; |
| how you’ll develop – the development that they need to be the best they can in their role; and |
| how are you doing – at least every three months employees should talk to their line manager informally or formally to review how they’re doing against these elements and record the results on their development plan. Twice a year they’ll have formal reviews where they’ll get a rating against an eight-point scale for “Do” and “Be”. |
Report of the Directors
Directors’ Report continued
Working in partnership
Abbey wants to involve and inform our employees on matters that affect them. As well as discussions with line managers, we have continued to use different methods of communicating with all employees. These include “read” (the staff magazine), “vision” (the television channel), and “talk” (the sessions where senior management, including the Chief Executive and the Chairman, have answered staff questions face to face).
In the UK, we achieved our first 25 years of trade union recognition in the business and we marked the anniversary during 2003 by confirming the partnership agreement with Abbey National Group Union, our recognised independent trade union. Abbey National Group Union are affiliated to the Trade Union Congress and operate from their own offices in Hertfordshire.
During 2003, Abbey National Group Union has been involved in many initiatives, and we continue to consult them on significant proposals within the business. Consultation takes place at both national and local levels. We hold regular relationship management meetings to make sure that communication is open and two-way.
Employee share ownership
As in previous years, in 2003 we invited eligible employees to become financial stakeholders in the company by taking part in our Sharesave scheme.
In 2003, we also ran a Partnership Shares scheme that gave staff the opportunity to save money from their pre-tax salary, over 12 months.
Through these schemes, and others we have introduced over the years, a large number of our employees now own shares in the company.
Offshoring
In 2003 Abbey announced a wide-ranging review of how and where we carry out our operational activities, as well as a pilot with the company MsourcE to perform some activities in India. Subsequently, in January 2004, we confirmed that we would invest £25 million in five key UK locations, close three other operational sites, and transfer some banking enquiries jobs to India.
Throughout the review leading up to the decision, we fully consulted the Abbey National Group Union. We agreed with them a range of measures to help staff who were affected, including enhanced relocation and travel packages to help them take advantage of redeployment opportunities, as well as resources and guidance to help others pursue jobs outside of Abbey.
We are sensitive to concerns being raised in the UK Parliament, the media and other forums about the movement of jobs to India. Nonetheless, we believe these decisions are absolutely necessary to the health of Abbey’s future and for giving customers better service at a competitive price. Furthermore MsourcE has a proven track record in treating employees fairly and with respect. The people who work for our operation in India will be treated well, and will be paid to reflect their professionalism.
Marketplace
Abbey made public commitments in 2003 to improve its treatment of all customers. These include: |
| understanding our customers and how they feel about money; |
| creating products our customers will want to buy because they meet a real and definite need; |
| giving good impartial advice, not just to the few,but to everyone; |
| delivering fault less service and following through on what we say we’ll do; |
| being open with customers and using simple everyday language; |
| taking a positive,can-do attitude and removing obstacles between customers and their money; and |
| striving for continual improvement. |
| Our approach is to focus on improving the relationship people have with their money, by helping them to get on top of their money and confront any problems or concerns. |
| Abbey Annual Report and Accounts 2003 | 93 |
Back to Contents
Report of the Directors
Directors’ Report continued
Financial inclusion
Abbey is working with the government and the Post Office on the delivery of “universal banking services”. This work has included the development and launch (in February 2003) of a new basic bank account, appropriate for state-benefit recipients who wish to access their money either at cash machines or at Post Office counters. We actively support the Consumer Credit Counselling Service and Money Advice Trust to assist people who have fallen into financial difficulties.
Measures have been put into place to help ensure that all of Abbey’s services are equally accessible to customers with disabilities. For example, communication aids such as induction loops for hearing-impaired customers exist in most branches, and textphones are in operation across head office sites. Customer and shareholder information remains available in alternative formats including Braille and large print.
Our Chief Executive Luqman Arnold was appointed a member of the Financial Services Authority’s Steering Group on Financial Capability.
Financial inclusion should be about how we treat all customers. When we relaunched the business in September 2003, we said that we intend to democratise money: helping everyone – not just the privileged few – get on top of their money. In one sense this is just a return to our roots; Abbey began as a building society to help ordinary people buy land so that they could vote, because at that time only landowners were enfranchised. We have committed ourselves to communicating in language that everyone can understand and to make it easier for people to get good advice about their money.
Social housing
Abbey’s specialist Social Housing Finance unit delivers long-term finance solutions to Registered Social Landlords to enable them to provide affordable housing for people in need and to undertake wider social inclusion initiatives. Registered Social Landlords (often called Housing Associations) are regulated, non-profit making, community-based organisations. Abbey’s loan commitments currently exceed £4.5 billion, making it a marketleader in this field.
Procurement
Abbey has in place a procurement policy that explicitly promotes competitive tendering and dealing with suppliers in a fair and open manner. The policy requires a record of hospitality received to be maintained by each department and made available for review. Abbey reserves the right to verify the ethical standing of its suppliers as it deems appropriate.
We do not operate a single payment policy in respect of all classes of suppliers. Each individual operating area is responsible for agreeing terms and conditions under which business is to be transacted and for making the supplier aware of these beforehand. It is, and will continue to be, Abbey’s policy to ensure payments are made in accordance with the terms and conditions agreed, except where the supplier fails to comply with those terms and conditions.
Our practice on payment of creditors has been quantified under the terms of the Companies Act 1985 (Directors’ Report)(Statement of Payment Practice) Regulations 1997. Based on the ratio of amounts invoiced by trade creditors during the year to amounts of Abbey trade creditors at 31 December 2003, trade creditor days for Abbey were 19 (2002: 24 days). The equivalent period calculated for Abbey’s legal entities is 20 days (2002: 26 days).
Complaints Management
Abbey is committed to ensuring that customers get the very highest levels of service. We do recognise, however, that from time to time we may do something that does not match the high expectations of our customers. Our commitment to our customers at these times is to provide a clear and responsive approach to dealing with customers’ concerns and to put right what may have gone wrong. Over the course of 2004, we are placing extra emphasis on the systems, practices and training that support our complaint handling systems.
Much greater emphasis will be placed on learning from what our customers are telling us and feeding that back to improve further our products and services. Environmental
Abbey is a signatory to, and an active member of, the United Nations Environment Programme Financial Institutions’ Initiative.
We recognise our responsibility to consider the environmental issues associated with our business activities. Our environmental management strategy is to reduce the direct impacts of our activities, for example energy and resource use, and to manage the indirect risks associated with our main business interests and our supply chain.
Our environmental policy has been approved by the board, and the Chief Operating Officer is accountable for ensuring management acts in accordance with its principles. The policy applies to all business units, covers all significant environmental impacts and risks, and provides the basis for our environmental management system. We encourage the organisations with which we undertake joint ventures or outsourcing operations to support it.
Environmental management is integrated in the Operational Risk framework overseen by the Chief Risk Officer and risk function, and in the management objectives of functions such as procurement and property management. Senior managers are responsible for ensuring compliance with the policy and risk management procedures. Through the risk framework, environmental risks are identified and assessed, and there is opportunity to report significant environmental risks to the board and/or Risk Committee on a monthly basis. Environmental management and performance reporting will be reviewed in 2004 to align it more closely with the wider corporate social responsibility management and reporting framework within Abbey.
Our environmental performance is subject to internal audit on a rolling basis and our disclosures in the public corporate social responsibility report are externally verified. Development of the environmental management system takes into account the recommendations of independent management reviews, emerging industry initiatives and benchmarks, and feedback from stakeholders.
Whilst good progress has been made during 2003 in line with the environmental policy principles, the ongoing changes to business structure necessitate a continuous review of our environmental management priorities. Our objectives for 2003 of: |
| reviewing and strengthening environmental governance arrangements; |
| improving performance data quality and coverage; |
| refocusing performance targets; |
| formalising environmental considerations in product development and partnership arrangements; and |
| monitoring climate related risks and opportunities will be carried forward and form a priority for 2004. |
The environmental policy and more detailed information on risk and performance are published in the annual corporate social responsibility report. Political contributons
No contributions were made for political purposes. Community
Abbey is proud of its involvement in the community and has continued to support a wide range of charitable projects in 2003, primarily through the Abbey Charitable Trust Limited (the Trust). We have built links with the local community, particularly in the areas where we have a large presence, through our employee participation schemes and donations. Donations
In 2003, we made a total cash donation of £1,711,380 (2002: £1,892,635) to charities through the Trust and Abbey.The total value of support to charities and the voluntary sector amounted to £2,170,036 in 2003 (2002: £2,762,360). This comprised cash donations and other support |
| 94 | Abbey Annual Report and Accounts 2003 |
Back to Contents
Report of the Directors
Directors’ Report continued
given in kind, including the value of employee time which is matched on an hour-for-hour basis through Abbey’s volunteering scheme.
Volunteering
We have piloted three new opportunitiesfor employee volunteering in the Camden area of London which will be rolled out to other locations in the UK throughout 2004. E-mentoring matches Year 10 pupils studying vocational General Certificates of Secondary Education (GCSEs) with an Abbey employee who is working in that subject area and the mentoring support is carried out by exchanging e-mails. Number Partners uses specially designed board games to help small groups of eight- and nine-year-olds develop their number skills with the help oftrained groups of volunteers from Abbey head offices. The third opportunity to volunteer is via a scheme called “business experts” where employees with specialist business skills work with charities in the local area. Through our giving and our employees fund-raising efforts we aim to make a difference, and support for employee efforts was £583,868 (2002: £621,500) matching the amount they raised during the year. In all 13% of our employees were involved in one of our matching schemes. These figures are collated using the London Benchmarking Group reporting model.
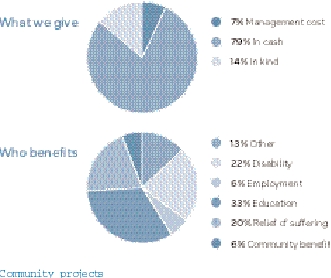
Here are just three examples of the community projects that we have worked on in 2003:
Camden Community Action received £20,000.The charity,set up by the Community Housing Association, will use the money to fund a programme of sports and arts activities for children in the Camden area, where our principal office is situated.
Thanks to a partnership between Abbey and Help the Aged, hundreds of unwanted Christmas presents have been put to good use. The “unwanted Christmas gift appeal” ran for four weeks from 29 December 2003, with 120 Abbey branches participating. The charity was given a boost with a £10,000 donation from the Charitable Trust. All the donated gifts were delivered to Help the Aged shops, where they will be resold to raise money for the charity.
A £14,400 donation from the Charitable Trust enabled the national charity Canine Partners to purchase the entire intake of puppies for the class of 2003/2004. The 32 puppies will be trained over an eighteen-month period to enable them to transform the lives of people with disabilities, as they learn to respond to over 100 commands in order to undertake a wide range of activities. When the puppies are fully trained, they will be placed with a disabled partner and will be able to carry out tasks such as switching on lights, opening and unloading a washing machine, and using cash machines.
New charitable priorities
We have revised our charitable priorities for 2004 to reflect the changes to Abbey’s core values. These changes took place after consultation with local charities, employees and the Board. The Trust will support disadvantaged people through: |
| education and training; |
| local regeneration projects which encouragecross community partnerships; and |
| financial advice which helps them manage their money. |
Further details on Abbey’s involvement in the community and the Trust’s work can be found in the corporate social responsibility report and on the website. Auditors
A resolution to re-appoint Deloitte & Touche LLP as auditors will be proposed at the forthcoming Annual General Meeting.
On 1 August 2003 Deloitte & Touche transferred their business to Deloitte & Touche LLP, a limited liability partnership incorporated under the Limited Liability Partnerships Act 2000. Abbey’s consent has been given to treating the appointment of Deloitte & Touche as extending to Deloitte & Touche LLP with effect from 1 August 2003 under the provisions of section 26(5) of the Companies Act 1989. Statement of directors’ responsibilities
The directors of Abbey National plc are required by United Kingdom company law to prepare financial statements for each financial year which give a true and fair view of the state of affairs of Abbey and its subsidiaries as at the end of the financial year, and of the loss for Abbey and its subsidiaries for the year.They are also responsible for ensuring that proper and adequate accounting records have been maintained and that reasonable procedures have been followed for safeguarding the assets of Abbey and its subsidiaries and for preventing and detecting fraud and other irregularities.
In respect of the financial statements the directors are required to: |
| ensure that suitable accounting policies, which follow generally accepted accounting principles, have been applied consistently; |
| ensure that reasonable and prudent judgements and estimates have been used in the preparation of the financial statements; |
| prepare the financial statements on a going concern basis unless it is inappropriate to presume that Abbey will continue in business; and |
| state whether applicable United Kingdom accounting standards have been followed and to disclose and explain any material departures from the financial statements. |
Annual meeting
Details of the business of the Annual General Meeting can be found in the accompanying booklet Notice of Annual General Meeting 2004.
By Order of the Board

Karen M Fortunato
Company Secretary
25 February 2004
| Abbey Annual Report and Accounts 2003 | 95 |
Back to Contents
Report of the Directors
Corporate Governance
Corporate governance is concerned with how companies are directed and controlled and, in particular, with the role of the Board of Directors and the need to ensure a framework of effective accountability.
Combined Code
This statement, together with the Remuneration Report, set out on pages 99 to 105, explains how Abbey has applied the principles of good practice in corporate governance set out by the Financial Services Authority in Section 1 of the Combined Code. Abbey has complied with all the provisions of Section 1 of the Combined Code throughout the year ended 31 December 2003. The Financial Reporting Council revised the Combined Code in the summer of 2003 to apply to accounting periods beginning on, or after, 1 November 2003. Abbey’s compliance with the Code therefore relates to the version of the Code prior to its revision. The Company intends to review its governance arrangements during 2004, this being the first full accounting year to which the new code will apply.
The Board
At 31 December 2003, the Board comprised a Chairman, seven executive Directors, including the Chief Executive, and six independent non-executive Directors, all of whom bring a wide range of skills and experience to the Board. As from 1 January 2004, the number of independent non-executive Directors has increased to seven. The roles of Chairman and Chief Executive are separated and clearly defined. The Chairman is primarily responsible for the working of the Board and the Chief Executive for the running of the business and implementation of Board strategy and policy.The Chief Executive is assisted in managing the business on a day-to-day basis by the Executive Committee, which he chairs and which meets weekly and comprises his direct reports. The Chief Executive has established the Customer Board, which is chaired by the Executive Director of Customer Propositions Division and which meets weekly. In addition, each quarter the Chief Executive, a non-executive Director Vitorio Radice, and an independent non-Director member, Waheed Ali, attend the Customer Board.
All the non-executive Directors are independent of management and free from any business or other relationship which could materially interfere with the exercise of their independent judgement. They make a significant contribution to the functioning of the Board, thereby helping to ensure that no one individual or group dominates the Board’s decision-making process. The Board met on 12 scheduled occasions during 2003, including a separate session specificaly devoted to the long-term strategic direction of the Company.The Board’s focus is on strategy formulation, policy and control. A corporate governance framework has been adopted by the Board, which identifies its roles and responsibilities and how these are discharged. Within this framework there is a Framework of Delegation, a formal schedule of matters that identifies which decisions are reserved for the Board and how and which decisions are delegated.
Risk management continues to be critical and the Board devotes appropriate time to considering the significant risks (see Internal control below). The Risk Committee plays an important role by monitoring and controlling the level of structural balance sheet and operational risk. Risk Committee also oversees a number of sub committees: principally the Consumer Risk Committee which oversees high-level credit policies and exposures and the Asset and Liability Committee which reviews balance sheet management risks. The Life Risk Committee reviews and monitors risk in the life companies including asset management, the Treasury Services Risk Committee reviews and monitors risk in the Treasury and Portfolio Business Unit. The sub committees report into the Risk Committee as appropriate. The Board, at its regular monthly meetings, receives a regular risk report.
One of the responsibilities of the Chairman is to ensure that Board members receive sufficient and timely information regarding corporate and business issues to enable them to discharge their duties. The adequacy of this information is periodically reviewed.
All Directors have access to the advice and services of the Company Secretary and the Board has established a procedure whereby Directors, wishing to do so in the furtherance of their duties, may take independent professional advice at Abbey’s expense.
The Company Secretary is also charged with ensuring that all new Board members are equipped to fulfil their duties and responsibilities. As part of the early familiarisation programme, new non-executive Directors are encouraged to meet the executive Directors individually and engage in an induction programme of visits to different areas within the Company.The induction and personal development of both executive and non-executive Directors will be reviewed during 2004 in accordance with the provisions of the revised Combined Code.
Non-executive Directors are appointed for a three year term after which their appointment may be extended upon mutual agreement. It is envisaged that the maximum term for a non-executive Director under this regime is unlikely to exceed nine years. In accordance with the Company’s Articles of Association, one-third of the Board are required to retire by rotation each year but over a three year period all Directors must have retired from the Board and faced re-election. The Company’s Articles of Association also require that a Director must retire at the first Annual General Meeting after their 70th birthday.
During 2003, important changes were made to Abbey’s executive responsibility structure. Executive responsibilities are now structured with three main customer facing divisions, comprising: Customer Operations, Customer Propositions and Customer Sales, supported by three support divisions, namely Human Resources, Information Technology and Central. Key issues from these Divisions are reported to the Board on a monthly basis.
Committees of the Board
The Board maintains four standing committees, all of which operate within written terms of reference. Their minutes are circulated for review and consideration by the full complement of Directors, supplemented by oral reports from the committee chairmen, or other members.
Audit and Risk Committee
Keith Woodley(Chairman)
Leon Allen
Richard Hayden
The Audit and Risk Committee met five times in 2003. Membership of the Audit and Risk Committee is restricted to independent non-executive Directors. They have a wide variety of skills and experience including investment banking, commercial and senior management and accounting expertise. The Chairman is a chartered accountant and a previous President of the Institute of Chartered Accountants in England and Wales.
The Audit and Risk Committee’s primary tasks are to review the scope of external and internal audit, to receive regular reports from Deloitte & Touche and the Chief Internal Auditor, and to review the preliminary results, interim information and annual financial statements before they are presented to the Board, focusing in particular on accounting policies and compliance, and areas of management judgement and estimates. The Committee’s scope was extended during 2003 to include risk oversight. The Audit and Risk Committee more generally acts as a forum for discussion of internal control issues and contributes to the Board’s review of the effectiveness of the Company’s internal control and risk management systems and processes. The Audit and Risk Committee also conducts a review of the remit of the internal audit function, its authority, resources and scope of work. Abbey’s relationship with the external auditors is monitored by the Audit and Risk Committee and a framework for ensuring auditor independence has been adopted which defines unacceptable non audit assignments, pre-approval of acceptable non-audit assignments and procedures for approval of other non-audit assignments.
The Board has determined that Keith Woodley has the necessary qualifications and experience to qualify as an audit committee
| 96 | Abbey Annual Report and Accounts 2003 |
Back to Contents
Report of the Directors
Corporate Governance continued
financial expert as defined for the purposes of the US Sarbanes-Oxley Act of 2002.
Personnel and Remuneration Committee
Lord Shuttleworth (Chairman)
Peter Ogden (retired 31 December 2003)
Leon Allen
The Personnel and Remuneration Committee met eight times in 2003. Membership of the Personnel and Remuneration Committee is restricted to non-executive Directors. Its principal function is to monitor the human resource policies of the Company to ensure they are consistent with its business objectives and philosophy. It is charged with recommending to the full Board the Company’s policy on executive Director and executive management remuneration. The Personnel and Remuneration Committee determines the individual remuneration package of each executive Director. Peter Ogden retired as a Director and member of the Committee on 31 December 2003 and the vacancy on the Committee will be filled in 2004. The Remuneration report, including details of individual Directors’ remuneration packages, is to be found on pages 99 to 105.
Nomination Committee
Lord Burns (Chairman)
Lord Shuttleworth
Keith Woodley
Luqman Arnold
The Nomination Committee meets when necessary.The Nomination Committee’s primary function is to make recommendations to the Board on all new Board appointments and also to advise generally on issues relating to Board composition and balance.
Policyholder Review Committee
John Foden (Independent Chairman)
James Gallagher (Independent Member)
Richard Hayden
A new committee of the Board, the Policyholder Review Committee held its inaugural meeting in September 2003 and met a total of three times during the year. Its primary function is to consider and provide the Board with an independent assessment of Abbey life business compliance with the Principles and Practices of Financial Management, published from time to time in respect of each fund within the life business subsidiaries. The Committee’s role will become fully effective during 2004. By 2005, the Committee may provide an annual report to policyholders in the with-profit funds on the work of the Committee and any other issues it considers relevant, stating whether throughout the financial year to which the report relates, it believes the life business has complied with the principles and practices of financial management.
The number of full scheduled Board meetings and committee meetings attended by each Director during the year was as follows:
| | | | | | Personnel and | | Policy | |
| | Scheduled | | Audit | | Remuneration | | Holder | |
| | Board | | Committee | | Committee | | Review | |
| | meetings | | meetings | | meetings | | Committee | |
|
|
|
|
|
|
|
| |
| Luqman Arnold | 12 | | – | | – | | – | |
|
|
|
|
|
|
|
| |
| Leon Allen | 11 | | 5 | | 8 | | – | |
|
|
|
|
|
|
|
| |
| Lord Burns | 12 | | – | | – | | – | |
|
|
|
|
|
|
|
| |
| Richard Hayden | 12 | | 5 | | – | | 3 | |
|
|
|
|
|
|
|
| |
| Stephen Hester | 12 | | – | | – | | – | |
|
|
|
|
|
|
|
| |
| Yasmin Jetha | 12 | | – | | – | | – | |
|
|
|
|
|
|
|
| |
| Malcolm Millington | 8 | | – | | – | | – | |
|
|
|
|
|
|
|
| |
| Angus Porter | 5 | | – | | – | | – | |
|
|
|
|
|
|
|
| |
| Priscilla Vacassin | 6 | | – | | – | | – | |
|
|
|
|
|
|
|
| |
| Tony Wyatt | 4 | | – | | – | | – | |
|
|
|
|
|
|
|
| |
| Peter Ogden | 11 | | – | | 8 | | – | |
|
|
|
|
|
|
|
| |
| Mark Pain | 12 | | – | | – | | – | |
|
|
|
|
|
|
|
| |
| Vittorio Radice | 11 | | – | | – | | – | |
|
|
|
|
|
|
|
| |
| Lord Shuttleworth | – | | – | | 8 | | – | |
|
|
|
|
|
|
|
| |
| James Gallagher | – | | – | | – | | 3 | |
|
|
|
|
|
|
|
| |
| John Foden | – | | – | | – | | 3 | |
|
|
|
|
|
|
|
| |
| Keith Woodley | 12 | | 5 | | – | | – | |
|
|
|
|
|
|
|
| |
Relations with shareholders
Abbey values its dialogue with both institutional and private investors. Effective two-way communication with fund managers, institutional investors and analysts is actively pursued and this encompasses issues such as performance, policy and strategy. During 2003, Abbey Directors held meetings with 93 institutional investors whose combined shareholdings represented over 43% of the total issued ordinary share capital of the Company.
Private investors are encouraged to participate in the Annual General Meeting at which the Chairman presents a review of the results and comments on current business activity.The Chairmen of the Audit and Risk, Personnel and Remuneration and Nomination Committees will be available at the Annual General Meeting to answer any shareholder questions.
This year’s Annual General Meeting will be held on 22 April 2004. The Notice of the Annual General Meeting, which is in plain English, is circulated more than 20 working days before the Meeting and Abbey will continue its practice of proposing only unbundled individual resolutions.
Pension funds
The assets of the main pension schemes are held separately from those of the Company and are under the control of the Trustees of each scheme. The four Abbey pension schemes have a common corporate trustee which, at 31 December 2003, had nine Directors, comprising six Company appointed Directors (three of whom are Directors of Abbey) together with three member-nominated Directors.
The National and Provincial Pension Fund has a different corporate trustee, the Board of which at 31 December 2003 comprised three Company appointed Directors, two of whom are Directors of Abbey, and three member-elected Directors. As at 31 December 2003, the Scottish Mutual Assurance plc Staff Pension Scheme provides for a maximum of six trustees, of whom four trustees are selected by Scottish Mutual Assurance plc (two of whom are members) and two trustees are elected by the members. In the case of the Scottish Provident Institution Staff Pension Fund, there is a maximum of eight trustees, of whom five (at least one of whom is a member) are selected by Scottish Provident Limited, as principal employer of the Fund: the remaining three trustees are elected by the active members from their number.
| Abbey Annual Report and Accounts 2003 | 97 |
Back to Contents
Report of the Directors
Corporate Governance continued
Asset management of the schemes is delegated to a number of fund managers and the trustees receive independent professional advice on the performance of the managers. Asset management of the Scottish Mutual Assurance Staff Pension Scheme is through a Trustee Investment Account invested in units of Scottish Mutual Assurance’s Pooled Managed Fund. Assets (other than petty cash) of the Scottish Provident Institution Staff Pension Fund are invested in a Managed Fund policy held with Scottish Provident Limited.
Legal advice to the trustees of the various schemes is provided by external firms of solicitors. The audits of the Pension Schemes are separate from that of Abbey.The audits of the Abbey pension schemes and the National and Provincial Pension Fund are undertaken by Grant Thornton. The audits of the Scottish Mutual Assurance Staff Pension Scheme and SPI Staff Pension Fund are undertaken by KPMG Audit Plc.
Going concern
The Directors confirm that they are satisfied that the Abbey group of companies has adequate resources to continue in business for the foreseeable future. For this reason, they continue to adopt a going concern basis in preparing the financial statements.
Internal control
The Board of Directors has overall responsibility for the system of internal control covering all controls including financial, operational and compliance controls and risk management and for reviewing its effectiveness throughout Abbey. Such a control system can only provide reasonable and not absolute assurance against material misstatement or loss, and is designed not to eliminate risk, but to enable Abbey to achieve its corporate objectives within a managed risk profile. The Board is responsible for determining strategies and policies for risk and control, whilst management is responsible for designing, operating and monitoring risk management and control processes to implement Board policies effectively.
The Board confirms that an ongoing process for identifying, evaluating and managing Abbey’s significant risks has operated throughout the year and up to the date of approval of the Annual Report and Accounts. This process has been subject to regular review by the Board and accords with the guidance contained in the “Guidance on Internal Control” contained in the Combined Code. During the year, steps have been taken to embed internal control and risk management further into the operations of the business and to deal with areas of improvement which come to the Board’s and management’s attention. The key elements of the process are as follows: |
| > | Strategic risks are considered by both the Board and the Executive Committee in the context of an agreed strategic framework, which is revised during the year through one or more meetings devoted specifically to the long term strategic direction of Abbey. Annually, Abbey produces a three year plan to reflect and respond to the strategic challenges facing Abbey, which is approved by the Board. Detailed financial and operating plans are developed for the year ahead and monthly reports are provided to the Board covering actual performance against plan, analysis of significant variances, and scrutiny of key performance indicators. |
| > | Financial risks (credit, market, liquidity, insurance and residual value) and operational risks are considered on behalf of the Board by the Risk Committee and its sub committees as described in ‘The Board’ section above. The Board receives quarterly reports from the Chief Risk Officer, and considers financial risk scenarios. |
| > | In addition there are a series of specific reports produced for the Board covering various aspects of operational risks and reporting on compliance with legal and regulatory requirements. |
| > | The Executive Committee manages the business on a day to day basis and the Divisional Directors are responsible for embedding risk management and control in accordance with the corporate governance framework. |
| > | A key feature of the risk management framework is the segregation of duties between the customer facing Divisions and Abbey’s support Divisions. Together with other responsibilities, Abbey’s support Divisions define standards and guidelines which enable Board policies to be translated into operational practice and also measure and monitor the overall risk exposures. |
The Board has established a process for reviewing the effectiveness of the system of internal control through reports it, and the Board committees, receive from the executive and risk committees and various independent monitoring functions including Risk, Internal Audit and Compliance. The Audit and Risk Committee of the Board, as described above, makes an important contribution to this assurance process. Internal Audit provides independent and objective assurance that the processes by which significant risks are identified, assessed and managed are appropriate and effectively applied. Internal and External Audit utilise common protocols to report and escalate significant exceptions and Internal Audit follow up all significant exceptions until satisfactory resolution by management.
The Board undertook a formal annual assessment of the overall risk management and internal control arrangements in January 2004 in order to form a view on the effectiveness of the system of internal controls.
In December 2003, the Financial Services Authority fined Abbey Companies a total of £2.3m for breaches of the Financial Services Authority’s Money Laundering Rules, and for systems and control breaches in Abbey National Asset Managers Ltd. The Financial Services Authority stated that in their opinion both cases reflected wider compliance control failings, that are in the process of being addressed by Abbey through a programme of review and enhancement of its control environment.
Evaluation of disclosure controls and procedures (Sarbanes-Oxley Act 2002)
Abbey has carried out an evaluation under the supervision and with the participation of Abbey’s management, including the Chief Executive Officer and Chief Operating Officer, of the effectiveness of the design and operation of Abbey’s disclosure controls and procedures. There are inherent limitations to the effectiveness of any system of disclosure controls and procedures, including the possibility of human error and the circumvention or overriding of the controls and procedures. Accordingly, even effective disclosure controls and procedures can only provide reasonable assurance of achieving their control objectives. Based upon Abbey’s evaluation, the Chief Executive Officer and the Chief Operating Officer have concluded that, as of 31 December 2003, the disclosure controls and procedures are effective to provide reasonable assurance that information required to be disclosed in the reports that Abbey files and submits under the Exchange Act is recorded, processed, summarised and reported as and when required.
There has been no change in Abbey’s internal control over financial reporting during Abbey’s 2003 fiscal year that has materially affected, or is reasonably likely to materially affect Abbey’s internal control over financial reporting.
| 98 | Abbey Annual Report and Accounts 2003 |
Back to Contents
Report of the Directors
Remuneration Report
This report explains to shareholders Abbey’s policy on our executive directors’ pay and benefits. It also covers the fees paid to our Chairman and non-executive directors.
Our Personnel and Remuneration Committee develops this policy and the Board approves it.
The Personnel and Remuneration Committee
This committee makes certain that we give our people the rewards they deserve. In particular it makes the decisions on executive directors’ pay, pension rights and compensation payments.
The members of the Committee are independent non-executive directors. Lord Shuttleworth chairs the Committee and the other members in 2003 were Peter Ogden and Leon Allen. Peter Ogden retired from the Board at the end of the year. Lord Burns, who is Abbey’s Chairman, Luqman Arnold the Chief Executive and Priscilla Vacassin the Executive Director Human Resources, are regularly invited to the meetings but they are not members of the Committee.
The Personnel and Remuneration Committee appointed Towers Perrin as their advisers after an appropriate review. They also give us general advice on rewarding our employees. In the first half of the year the Committee were advised by New Bridge Street consultants who also advise Abbey on general employee share schemes. They were also appointed by the Committee.
Executive Directors’ reward policy
In last year’s remuneration report we said that we would be reviewing the policy on executive directors’ rewards to make sure that it was right for Abbey’s new strategy. We’ve now finished this review. As part of this we talked to several of our major shareholders so that we could understand their views. As a result of this review the Personnel and Remuneration Committee has decided to make some changes to the way we reward our directors. This report describes the new policy that will apply from 2004 onwards. It then gives details of what the directors have received in 2003 and any entitlements they have from awards made in previous years.
The aim of the policy
The overall aim of the policy is to reward our people in a way that’s right for our market and in line with our performance in delivering value to our shareholders. When deciding pay levels the Personnel and Remuneration Committee looks mainly at the companies that make up the FTSE 50. It also looks at a smaller group of companies selected from the FTSE 50 but restricted to UK customer service, retail and financial businesses. The Personnel and Remuneration Committee thinks that it’s right for a large part of the directors’ rewards to depend on performance. Over half the expected value of their pay (excluding pensions) comes from bonus and Long Term Incentive Schemes in which the size of the payment depends on performance.
Basic Salary
The Personnel and Remuneration Committee reviews basic salaries every year. They look at the pay of other people in similar jobs in the groups just described. The main reference point is the salaries at the median of this group but sometimes we are prepared to pay more to get and keep the right people to deliver what the business needs.
Annual Bonus
At the moment we think it’s right to put the emphasis on delivering the annual business plan. So for 2004 the maximum payment under the annual bonus scheme will be 120% of basic salary for the Chief Executive and 100% for the other executive directors. We may consider making payments above these limits in exceptional circumstances. One third of any bonus paid will be used to purchase shares which we won’t release to the director until the end of three years. We won’t be running the Share Matching Scheme any longer. We don’t have any intention at present to increase these levels, but we will do so if it becomes necessary because the market changes.
| | The Personnel and Remuneration Committee will still set the measures we use in the bonus scheme at the beginning of the year. They will base the bonuses on a combination of the performance of the Personal Financial Services business, the Portfolio Business Unit and each director’s specific objectives. |
| | |
| | Long Term Incentives
For 2003 executive directors were granted options under an Executive Share Option Scheme which Shareholders approved in 2001. We have decided to replace the Executive Share Option Scheme with a new scheme which is simpler and gives a better link with shareholders interests. Shareholders will be asked to approve the new scheme at the Annual General Meeting and full details about it are given in the separate circular to shareholders. Brief details are given below. If it is approved the new scheme will operate from 2004 onwards. Under the new plan we’ll give executive Directors a conditional award of shares each year. The Chief Executive’s award in 2004 will give him the opportunity to earn shares worth up to 175% of his salary and the other executive directors’ awards will give them the opportunity to earn shares worth up to 150% of salary. We won’t release any of the shares to the directors until the end of three years. The proportion of shares we give them at the end of three years will depend on how well the Company does during these three years. We’ll measure this in two ways: |
| Half the award will depend on the real growth in the earnings per share of the Personal Financial Services business. If the growth in the Earnings Per Share on average each year is 3% more than the increase in the Retail Price Index, then 25% of the shares will be released. If the growth in the Earnings Per Share on average each year is 8% more than the increase in the Retail Price Index, then all of the shares will be released and in proportion between those two points. Growth in the Earnings Per Share of the Personal Financial Services business has been chosen as a test of our ability to transform and grow our continuing business. |
| Half the award will be based on the growth in total shareholder returns over the three year period, compared with a group of 16 other UK financial services companies. If the total shareholder returns are at the median of this group, 25% of the shares will be released; if the Company’s performance is in the top quarter of the group all the shares will be released, and in proportion between these two points. Relative Total Shareholder Return has been chosen because it reflects shareholders’ interests. The comparator companies are Alliance and Leicester plc, Barclays PLC, Bradford & Bingley plc, Egg plc, HBOS plc, HSBC Holdings plc, Lloyds TSB Group plc, Northern Rock plc, Royal Bank of Scotland Group plc, Standard Chartered plc, Jardine Lloyd Thompson plc, Royal and Sun Alliance Insurance Group, Aviva plc, Friends Provident plc, Legal & General Group plc and Prudential plc.
Because of the changes in Abbey’s business, we will review what performance tests are appropriate for the awards in 2005 and later years.
The expected value of this scheme has been set at a level so that, when it is added to the value of the annual bonus, it means that the total incentive payments are around the middle of the group of companies that we compare ourselves with. The size of the awards may be varied in future years to keep the overall value of the incentives at this level. |
| Abbey Annual Report and Accounts 2003 | | 99 |
Back to Contents
Report of the Directors
Remuneration Report continued
Performance Graph
The graph below shows a comparison between Abbey’s total shareholderreturn performance compared with the companies in the FTSE 100 index. The graph looks at the value by the end of 2003 of £100 invested in Abbey shares on the 31 December 1998 compared with the value of £100 invested in the FTSE 100 index. The FTSE 100 index has been chosen to give a comparison with the average return that shareholders could have received by investing in a range of other major UK companies.
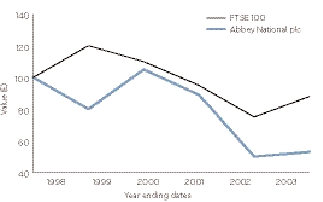
Pensions
Executive directors are eligible to join one of Abbey’s pension schemes. Mark Pain and Yasmin Jetha are members of the Abbey National Amalgamated Pension Scheme on the same basis as other employees with a similar length of service. This is a defined benefit scheme providing a pension of 1/50th of final salary for each year of pensionable service. The other executive directors get an allowance of 35% of salary to make their own pension arrangements. As part of those arrangements they can join the Abbey National Staff Stakeholder Pension Scheme if they want to.
Other Benefits
Some of the executive directors are eligible for a Company subsidy on their membership of Abbey Private Medical Insurance Scheme and a concessionary mortgage rate on the same basis as other employees with the same starting date. New directors do not get these benefits.
The executive directors can take part in the Company’s Sharesave Scheme and the Partnership Share Scheme on the same terms as other employees.
Service Contracts
When they were appointed, Priscilla Vacassin, Angus Porter and Tony Wyatt were granted contracts that entitle them initially to 24 months notice of termination of their employment. The notice required reduces by one month for each month of service to 12 months notice after 12 months service. The Personnel and Remuneration Committee decided that it was appropriate to offer this extra notice period, on a short-term basis, to attract suitable candidates. At the end of 2003 Priscilla Vacassin was entitled to 17 months notice, Angus Porter to 18 months notice and Tony Wyatt to 20 months notice. All of the other directors have a contractual notice period of 12 months. All of the notice periods will have reduced to 12 months by the end of August 2004. The Company may pay an executive director instead of allowing them to work their notice period. The directors have to give the Company six months notice of termination of their employment.
Mark Pain and Yasmin Jetha have contracts that entitle them to receive an additional payment if they are made redundant. The payment is 3.25 weeks pay for each year of service. The maximum payment is two years salary. If they are over 50 years old when they are made redundant they may also be entitled to an addition to their pension. These enhanced redundancy terms are a long standing term
of the contracts and are the same as offered to most other employees in the Company.They are not offered to new directors. None of the other directors are entitled to any additional payments on redundancy over and above their normal entitlement of notice.
The Chairman’s contract is renewable every year at the first Board meeting following each Annual General Meeting.
Non-executive directors’ fees
The Board decides the pay arrangements for the Chairman based on recommendations from the Personnel and Remuneration Committee.
The Chairman receives fees, benefits and expenses for services. He can’t take part in any bonus or profit-sharing arrangements or the Executive Share Matching or Executive Share Options Schemes. The Chairman’s appointment is non-pensionable.
Fees are paid to non-executive directors. The basic fee for non-executive directors is reviewed every two years and the last review was in 2002. The basic fee is £40,000 a year. An extra fee of £10,000 is paid for service on the Audit and Risk Committee and £7,500 for the Personnel and Remuneration Committee. There is an extra fee of £2,500 a year for chairing the Personnel and Remuneration Committee. An extra fee of £5,000 is paid for service on the Customer Board. Lord Shuttleworth receives an extra fee of £10,000 as a director of Abbey National Group Pension Fund Trustees Limited and the National and Provincial Building Society Pension Fund Trustees Limited. Keith Woodley’s fee includes payments for services as Deputy Chairman of Abbey National plc and Chairman of the Audit and Risk Committee. Richard Hayden receives an extra fee of £30,000 for service on the Policyholder Review Committee.
From July 2002 the non-executive directors decided that a minimum of £10,000 each year from their fees should be used to buy Abbey shares. The directors have said that they won’t sell these shares while they are still directors of Abbey.
Taxable benefits for non-executive directors include travel and other expenses for attending Board meetings. Non-executive directors do not have contracts with Abbey and are not entitled to any termination payments.
2003 Bonus
For 2003 the Board decided to make exceptional bonus awards to a number of directors to recognise their contribution to reducing the high risk profile of the company as well as putting in place the foundation for its future transformation. These awards were made in shares that we won’t release to the directors until the end of three years.
| 100 | | Abbey Annual Report and Accounts 2003 |
Back to Contents
Report of the Directors
Remuneration Report continued
Directors’ emoluments
The following table shows an analysis of Directors’ emoluments, excluding pensions, details of which are provided below:
| | Performance related yearly bonus | |
|
|
|
|
|
|
|
|
|
|
|
|
|
| |
| | Salary/fee
£ | | Cash
£ | | Shares
£ | (3) | Other
payments
£ | (1,2) | Taxable
benefits
£ | | 2003
Total
£ | | 2002
Total
£ | |
|
|
|
|
|
|
|
|
|
|
|
|
|
| |
| Chairman | | | | | | | | | | | | | | |
|
|
|
|
|
|
|
|
|
|
|
|
|
| |
| | | | | | | | | | �� | | | | | |
| Lord Burns | 450,000 | | – | | – | | – | | 6,488 | | 456,488 | | 482,677 | |
|
|
|
|
|
|
|
|
|
|
|
|
|
| |
| Executive Directors | | | | | | | | | | | | | | |
|
|
|
|
|
|
|
|
|
|
|
|
|
| |
| L Arnold | 675,000 | | 608,000 | | 405,000 | | – | | – | | 1,688,000 | | 231,865 | |
|
|
|
|
|
|
|
|
|
|
|
|
|
| |
| S A M Hester | 520,000 | | 455,000 | | 221,000 | | – | | – | | 1,196 ,000 | | 623,077 | |
|
|
|
|
|
|
|
|
|
|
|
|
|
| |
| Y Jetha | 330,000 | | 215,000 | | – | | – | | 591 | | 545,591 | | 317,864 | |
|
|
|
|
|
|
|
|
|
|
|
|
|
| |
| M J Millington (Retired 30 September 2003) | 280,469 | | 135,375 | | – | | – | | 497 | | 416,341 | | 386,900 | |
|
|
|
|
|
|
|
|
|
|
|
|
|
| |
| M A Pain | 397,000 | | 278,000 | | 20,000 | | – | | 822 | | 695,822 | | 432,739 | |
|
|
|
|
|
|
|
|
|
|
|
|
|
| |
| A J Porter (Appointed 1 July 2003) | 225,000 | | 175,000 | | 28,000 | | 150,000 | | – | | 578,000 | | – | |
|
|
|
|
|
|
|
|
|
|
|
|
|
| |
| P A Vacassin (Appointed 1 June 2003) | 160,417 | | 136,000 | | 24,000 | | 35,000 | | – | | 355,417 | | – | |
|
|
|
|
|
|
|
|
|
|
|
|
|
| |
| A S A Wyatt (Appointed 1 September 2003) | 133,333 | | 103,333 | | 16,670 | | 95,671 | | – | | 349,007 | | – | |
|
|
|
|
|
|
|
|
|
|
|
|
|
| |
| Non-Executive Directors | | | | | | | | | | | | | | |
|
|
|
|
|
|
|
|
|
|
|
|
|
| |
| L R Allen | 62,500 | | – | | – | | – | | 636 | | 63,136 | | 51,667 | |
|
|
|
|
|
|
|
|
|
|
|
|
|
| |
| R M Hayden | 58,750 | | – | | – | | – | | 47 | | 58,797 | | 44,792 | |
|
|
|
|
|
|
|
|
|
|
|
|
|
| |
| P J Ogden (Retired 31 December 2003) | 47,500 | | – | | – | | – | | – | | 47,500 | | 43,333 | |
|
|
|
|
|
|
|
|
|
|
|
|
|
| |
| V Radice | 45,000 | | – | | – | | – | | – | | 45,000 | | 40,833 | |
|
|
|
|
|
|
|
|
|
|
|
|
|
| |
| Lord Shuttleworth | 60,000 | | – | | – | | – | | 1,806 | | 61,806 | | 56,702 | |
|
|
|
|
|
|
|
|
|
|
|
|
|
| |
| K S Woodley | 120,833 | | – | | – | | – | | 5,160 | | 125,993 | | 108,908 | |
|
|
|
|
|
|
|
|
|
|
|
|
|
| |
| | 3,565,802 | | 2,105,708 | | 714,670 | | 280,671 | | 16,047 | | 6,682,898 | | 2,821,357 | |
|
|
|
|
|
|
|
|
|
|
|
|
|
| |
| (1) | Other payments represent relocation and bonus on joining. Increases in pensions benefits are shown in the Directors pensions table. |
| | |
| (2) | Pension related payments to L Arnold, S A M Hester, A J Porter, P A Vacassin and A S A Wyatt are set out in the Directors pensions below. |
| | |
| (3) | 2003 Bonus: For 2003 the Board decided to make exceptional bonus awards to a number of directors to recognise their contribution to transforming the business. These awards were made in shares which we won’t give to the directors until the end of three years. |
Directors’ pensions
Executive directors are eligible to join one of Abbey’s pension schemes.
The following table shows an analysis of the accrued pension benefits at 31 December 2003 for executive directors participating in Abbey’s defined benefits pension schemes during the period. Further information concerning Abbey’s pension schemes is set out in Note 53 to the financial statements.
| Executive Directors | Transfer valueof accrued
pension at
31 December
2002
£ | | Transfer
value of the increase in
accrued
pension (net
of inflation)
£ | | Transfer
value
of accrued
pension at
31 December
2003
£ | | Contributions
from
director
£ | (5)
| Increase in
transfer
value
over
the year,
net of
directors’
contribution
£ | (2)
| Total
accrued
pensions at
31 December
2002£ | | Increase in
accrued
pensions
during
2003 (net
of inflation)
£ | (1,4)
| Total
accrued
pensions at
31 December
2003
£ | (3)
|
|
|
|
|
|
|
|
|
|
|
|
|
|
|
|
| |
| L Arnold | – | | – | | – | | – | | – | | – | | – | | – | |
|
|
|
|
|
|
|
|
|
|
|
|
|
|
|
| |
| S A M Hester | – | | – | | – | | – | | – | | – | | – | | – | |
|
|
|
|
|
|
|
|
|
|
|
|
|
|
|
| |
| Y Jetha | 1,720,685 | | 303,161 | | 2,281,775 | | 49,500 | | 511,590 | | 146,467 | | 22,823 | | 171,780 | |
|
|
|
|
|
|
|
|
|
|
|
|
|
|
|
| |
| M J Millington | 2,233 ,239 | | 1,380,340 | | 3,857,975 | | 2,708 | | 1,622,028 | | 180,442 | | (2,738 | ) | 177,705 | |
|
|
|
|
|
|
|
|
|
|
|
|
|
|
|
| |
| M A Pain | 762,256 | | 71,165 | | 946,318 | | 3,950 | | 180,112 | | 107,158 | | 8,862 | | 117,842 | |
|
|
|
|
|
|
|
|
|
|
|
|
|
|
|
| |
| A J Porter | – | | – | | – | | – | | – | | – | | – | | – | |
|
|
|
|
|
|
|
|
|
|
|
|
|
|
|
| |
| P A Vacassin | – | | – | | – | | – | | – | | – | | – | | – | |
|
|
|
|
|
|
|
|
|
|
|
|
|
|
|
| |
| A S A Wyatt | – | | – | | – | | – | | – | | – | | – | | – | |
|
|
|
|
|
|
|
|
|
|
|
|
|
|
|
| |
| | 4,716,180 | | 1,754,666 | | 7,086,068 | | 56,158 | | 2,313,730 | | 434,067 | | 28,947 | | 467,327 | |
|
|
|
|
|
|
|
|
|
|
|
|
|
|
|
| |
Payments of an allowance calculated as a percentage of basic salary from which Directors can make their own pension arrangements were made to L Arnold £236,250, S A M Hester £182,000, A J Porter £78,750, P A Vacassin £56,146 and A S A Wyatt £46,667.
| (1) | The increase in accrued pension during 2003 represents the increase in the annual pension which each Director would be entitled to receive from normal retirement age (less the statutory inflationary increase of 1.7%, where relevant), if he/she had left service voluntarily at 31 December 2003 or at his actual retirement date if earlier. |
| | |
| (2) | The transfer value of the increase in accrued pension represents the current capital sum which would be required, using demographic and financial assumptions, to produce an equivalent increase in accrued pension and ancillary benefits, excluding the statutory inflationary increase, and after deducting members’ contributions (including Additional Voluntary Contributions). Although the transfer value represents a liability to the pension fund, it is not a sum paid or due to be paid to the individual director and cannot therefore meaningfully be added to the annual remuneration. |
| | |
| (3) | The accrued pension at 31 December 2003 represents the annual pension which each Director would be entitled to receive from normal retirement age if he/she had left service voluntarily at 31 December2003 or at his/her actual retirement date if earlier. |
| Abbey Annual Report and Accounts 2003 | | 101 |
Back to Contents
Report of the Directors
Remuneration Report continued
| (4) | In most cases the figure for the increase in accrued pension during 2003 which appears in the table does not equal the difference between the total accrued pension at 31 December 2003 and the total accrued pension at 31 December 2002. The difference arises where the increase in accrued pension is stated afterdeducting the statutory inflationary increase which would have been applied to the deferred pension entitlement had the director left at the start of the year. This deduction had been made where directors have been in service for the whole year, and is made in order to present a figure showing that element ofthe increase which results from an extra full year of service and from changes in remuneration. |
| (5) | Additional Voluntary Contributions made have been included in the above table where these payments result in an increase in the value of the Directors’ pensions entitlements. |
| (6) | As a result of his early retirement, the 2003 increase in the transfer value of accrued pension for M J Millington is £1,380,340.This arises partly from the pensions payments above, partly from normal contributions during the year, with the remainder of the increase due to the transfer value calculated at 31 December having been calculated in the usual way using actuarial assumptions including normal retirement age. If early retirement in 2003 had been assumed in calculating the transfer value at 31 December 2002, the transfer value at that date would have been significantly higher. |
Interests of directors and officers
In 2003, loans were made by Abbey to directors, executive officers and connected persons and of these loans, principal amounts of £1,075,134 were outstanding at 31 December 2003. See Note 54 to the consolidated financial statements included elsewhere in this Annual Report for disclosures of deposits and investments made and insurance policies entered into by directors, executive officers and connected persons with Abbey at 31 December 2003.
In 2003 there were no other transactions, arrangements or agreements with Abbey or its subsidiaries in which directors or executive officers or persons connected with them had a material interest, other than options to subscribe for ordinary shares under the Abbey National Executive Share Option scheme, the Employee Sharesave scheme and the Employee Share Option scheme. No director had a material interest in any contract of significance other than a service contract with Abbey, or any of its subsidiaries, at any time during the year.
The following table sets forth the aggregate shareholdings, at 31 December 2003, of the directors and executive officers of Abbey National plc as a group. No director or executive officer held more than one per cent of the Ordinary shares of Abbey during the year ended 31 December 2003.
| Title of Class | | Number | | | |
| Owner | Owned | % of Class |
|
|
|
|
| |
| Ordinary shares of | Directors and executive | | | | |
| nominal value 10p each | officers of Abbey | 462,846 | | 0.03 | |
|
|
|
|
| |
Directors’ share interests
The beneficial interests of directors and their immediate families in the ordinary shares of 10 pence each in the Company are shown below:
| | Number of shares |
|
|
| Ordinary shares | At
31 December
2003 | | At
1 January 2003
or date of
appointment |
|
|
|
|
| L R Allen | 5,740 | | 4,509 |
|
|
|
|
| L Arnold | 209,856 | | 108,870 |
|
|
|
|
| Lord Burns | 18,063 | | 5,684 |
|
|
|
|
| R M Hayden | 55,754 | | 4,509 |
|
|
|
|
| S A M Hester | 50,000 | | 50,000 |
|
|
|
|
| Y Jetha | 49,325 | | 41,065 |
|
|
|
|
| M J Millington | – | | 92,439 |
|
|
|
|
| P J Ogden | 5,740 | | 4,509 |
|
|
|
|
| M A Pain | 52,736 | | 47,082 |
|
|
|
|
| A J Porter | – | | – |
|
|
|
|
| V Radice | 3,740 | | 2,509 |
|
|
|
|
| Lord Shuttleworth | 2,699 | | 1,428 |
|
|
|
|
| P A Vacassin | – | | – |
|
|
|
|
| K S Woodley | 9,193 | | 6,184 |
|
|
|
|
| A S A Wyatt | – | | – |
|
|
|
|
There have been no changes to the beneficial and other interests of the Directors in the ordinary shares of the Company as shown up to 25 January 2004.
| 102 | | Abbey Annual Report and Accounts 2003 |
Back to Contents
Report of the Directors
Remuneration Report continued
| Share options | At
1 January
2003 or
date of
appointment | | Number of options: | | At 31 December2003 | | Exercise price
£ | | Market
price at date of exercise
£ | | Gain on exercise
£ | | Date from
which
exercisable | | Expiry date | Scheme |
|
|
|
| granted | | exercised | | lapsed/ cancelled |
|
|
|
|
|
|
|
|
|
|
|
|
|
|
|
|
|
|
|
|
|
| L Arnold | 434,083 | | – | | – | | – | | 434,083 | | 6.22 | | – | | – | | 24/10/05 | | 23/10/12 | Executive |
|
|
|
|
|
|
|
|
|
|
|
|
|
|
|
|
|
|
|
|
|
| | – | | 542,895 | | – | | – | | 542,895 | | 3.73 | | – | | – | | 25/03/06 | | 24/03/13 | Executive |
|
|
|
|
|
|
|
|
|
|
|
|
|
|
|
|
|
|
|
|
|
| | 434,083 | | 542,895 | | – | | – | | 976,978 | | | | – | | – | | | | | |
|
|
|
|
|
|
|
|
|
|
|
|
|
|
|
|
|
|
|
|
|
| S A M Hester | 171,745 | | – | | – | | – | | 171,745 | | 10.83 | | – | | – | | 13/05/05 | | 12/05/12 | Executive |
|
|
|
|
|
|
|
|
|
|
|
|
|
|
|
|
|
|
|
|
|
| | – | | 557,640 | | – | | – | | 557,640 | | 3.73 | | – | | – | | 25/03/06 | | 24/03/13 | Executive |
|
|
|
|
|
|
|
|
|
|
|
|
|
|
|
|
|
|
|
|
|
| | 171,745 | | 557,640 | | – | | – | | 729,385 | | | | – | | – | | | | | |
|
|
|
|
|
|
|
|
|
|
|
|
|
|
|
|
|
|
|
|
|
| Y Jetha | 342 | | – | | – | | 342 | | – | | 5.65 | | – | | – | | 01/04/03 | | 30/09/03 | Sharesave |
|
|
|
|
|
|
|
|
|
|
|
|
|
|
|
|
|
|
|
|
|
| | 16,991 | | – | | – | | – | | 16,991 | | 5.65 | | – | | – | | 25/03/99 | | 24/03/06 | Executive |
|
|
|
|
|
|
|
|
|
|
|
|
|
|
|
|
|
|
|
|
|
| | 150 | | – | | – | | – | | 150 | | 5.91 | | – | | – | | 09/09/99 | | 08/09/06 | Employee |
|
|
|
|
|
|
|
|
|
|
|
|
|
|
|
|
|
|
|
|
|
| | 16,620 | | – | | – | | – | | 16,620 | | 7.22 | | – | | – | | 24/03/00 | | 23/03/07 | Executive |
|
|
|
|
|
|
|
|
|
|
|
|
|
|
|
|
|
|
|
|
|
| | 11,342 | | – | | – | | – | | 11,342 | | 11.70 | . | – | | – | | 13/03/01 | | 12/03/08 | Executive |
|
|
|
|
|
|
|
|
|
|
|
|
|
|
|
|
|
|
|
|
|
| | 7,198 | | – | | – | | – | | 7,198 | | 13.06 | | – | | – | | 12/03/02 | | 11/03/09 | Executive |
|
|
|
|
|
|
|
|
|
|
|
|
|
|
|
|
|
|
|
|
|
| | 4,179 | | – | | – | | – | | 4,179 | | 6.46 | | – | | – | | 10/03/03 | | 09/03/10 | Executive |
|
|
|
|
|
|
|
|
|
|
|
|
|
|
|
|
|
|
|
|
|
| | 12,521 | | – | | – | | – | | 12,521 | | 6.46 | | – | | – | | 10/03/03 | | 09/03/10 | Executive |
|
|
|
|
|
|
|
|
|
|
|
|
|
|
|
|
|
|
|
|
|
| | 7,235 | | – | | – | | – | | 7,235 | | 7.48 | | – | | – | | 11/08/03 | | 10/08/10 | Executive |
|
|
|
|
|
|
|
|
|
|
|
|
|
|
|
|
|
|
|
|
|
| | 777 | | – | | – | | – | | 777 | | 9.97 | | – | | – | | 01/04/04 | | 30/09/04 | Sharesave |
|
|
|
|
|
|
|
|
|
|
|
|
|
|
|
|
|
|
|
|
|
| | 56,584 | | – | | – | | – | | 56,584 | | 9.72 | | – | | – | | 26/03/05 | | 25/03/12 | Executive |
|
|
|
|
|
|
|
|
|
|
|
|
|
|
|
|
|
|
|
|
|
| | – | | 176,943 | | – | | – | | 176,943 | | 3.73 | | – | | – | | 25/03/06 | | 24/03/13 | Executive |
|
|
|
|
|
|
|
|
|
|
|
|
|
|
|
|
|
|
|
|
|
| | – | | 560 | | – | | – | | 560 | | 3.37 | | – | | – | | 01/04/06 | | 30/09/06 | Sharesave |
|
|
|
|
|
|
|
|
|
|
|
|
|
|
|
|
|
|
|
|
|
| | 133,939 | | 177,503 | | – | | 342 | | 311,100 | | | | – | | – | | | | | |
|
|
|
|
|
|
|
|
|
|
|
|
|
|
|
|
|
|
|
|
|
| M A Pain | 1,285 | | – | | – | | – | | 1,285 | | 6.07 | | – | | – | | 01/04/04 | | 30/09/04 | Sharesave |
|
|
|
|
|
|
|
|
|
|
|
|
|
|
|
|
|
|
|
|
|
| | 1,973 | | – | | – | | – | | 1,973 | | 5.13 | | – | | – | | 01/04/05 | | 30/09/05 | Sharesave |
|
|
|
|
|
|
|
|
|
|
|
|
|
|
|
|
|
|
|
|
|
| | 3,086 | | – | | – | | – | | 3,086 | | 9.72 | | – | | – | | 26/03/05 | | 25/03/12 | Executive |
|
|
|
|
|
|
|
|
|
|
|
|
|
|
|
|
|
|
|
|
|
| | 76,132 | | – | | – | | – | | 76,132 | | 9.72 | | – | | – | | 26/03/05 | | 25/03/12 | Executive |
|
|
|
|
|
|
|
|
|
|
|
|
|
|
|
|
|
|
|
|
|
| | – | | 212,868 | | – | | – | | 212,868 | | 3.73 | | – | | – | | 25/03/06 | | 24/03/13 | Executive |
|
|
|
|
|
|
|
|
|
|
|
|
|
|
|
|
|
|
|
|
|
| | – | | 1,121 | | – | | – | | 1,121 | | 3.37 | | – | | – | | 01/04/06 | | 30/09/06 | Sharesave |
|
|
|
|
|
|
|
|
|
|
|
|
|
|
|
|
|
|
|
|
|
| | 82,476 | | 213,989 | | – | | – | | 296,465 | | | | – | | – | | | | | |
|
|
|
|
|
|
|
|
|
|
|
|
|
|
|
|
|
|
|
|
|
| A J Porter | – | | 5,524 | | – | | – | | 5,524 | | 5.43 | | – | | – | | 05/08/06 | | 04/08/13 | Executive |
|
|
|
|
|
|
|
|
|
|
|
|
|
|
|
|
|
|
|
|
|
| | – | | 160,221 | | – | | – | | 160,221 | | 5.43 | | – | | – | | 05/08/06 | | 04/08/13 | Executive |
|
|
|
|
|
|
|
|
|
|
|
|
|
|
|
|
|
|
|
|
|
| | – | | 165,745 | | – | | – | | 165,745 | | | | – | | – | | | | | |
|
|
|
|
|
|
|
|
|
|
|
|
|
|
|
|
|
|
|
|
|
| A S A Wyatt | – | | 5,545 | | – | | – | | 5,545 | | 5.41 | | – | | – | | 09/09/06 | | 08/09/13 | Executive |
|
|
|
|
|
|
|
|
|
|
|
|
|
|
|
|
|
|
|
|
|
| | – | | 142,329 | | – | | – | | 142,329 | | 5.41 | | – | | – | | 09/09/06 | | 08/09/13 | Executive |
|
|
|
|
|
|
|
|
|
|
|
|
|
|
|
|
|
|
|
|
|
| | – | | 147,874 | | – | | – | | 147,874 | | | | – | | – | | | | | |
|
|
|
|
|
|
|
|
|
|
|
|
|
|
|
|
|
|
|
|
|
| P A Vacassin | – | | 5,524 | | – | | – | | 5,524 | | 5.43 | | – | | – | | 05/08/06 | | 04/08/13 | Executive |
|
|
|
|
|
|
|
|
|
|
|
|
|
|
|
|
|
|
|
|
|
| | – | | 95,765 | | – | | – | | 95,765 | | 5.43 | | – | | – | | 05/08/06 | | 04/08/13 | Executive |
|
|
|
|
|
|
|
|
|
|
|
|
|
|
|
|
|
|
|
|
|
| | – | | 101,289 | | – | | – | | 101,289 | | | | – | | – | | | | | |
|
|
|
|
|
|
|
|
|
|
|
|
|
|
|
|
|
|
|
|
|
| | | | | | | | | | | | | | | | | | | | | |
| Former directors | | | | | | | | | | | | | | | | | | | | |
|
|
|
|
|
|
|
|
|
|
|
|
|
|
|
|
|
|
|
|
|
| M J Millington | 150 | | – | | – | | 150 | | – | | 5.91 | | – | | – | | 09/09/99 | | 30/09/03 | Employee |
|
|
|
|
|
|
|
|
|
|
|
|
|
|
|
|
|
|
|
|
|
| | 17,451 | | – | | – | | – | | 17,451 | | 7.22 | | – | | – | | 24/03/00 | | 30/03/04 | Executive |
|
|
|
|
|
|
|
|
|
|
|
|
|
|
|
|
|
|
|
|
|
| | 10,769 | | – | | – | | – | | 10,769 | | 11.70 | | – | | – | | 13/03/01 | | 30/03/04 | Executive |
|
|
|
|
|
|
|
|
|
|
|
|
|
|
|
|
|
|
|
|
|
| | 1,315 | | – | | – | | – | | 1,315 | | 5.13 | | – | | – | | 01/10/03 | | 30/03/04 | Sharesave |
|
|
|
|
|
|
|
|
|
|
|
|
|
|
|
|
|
|
|
|
|
| | 3,086 | | – | | – | | 3,086 | | – | | 9.72 | | – | | – | | 30/09/03 | | 30/09/03 | Executive |
|
|
|
|
|
|
|
|
|
|
|
|
|
|
|
|
|
|
|
|
|
| | 61,091 | | – | | – | | 61,091 | | – | | 9.72 | | – | | – | | 30/09/03 | | 30/09/03 | Executive |
|
|
|
|
|
|
|
|
|
|
|
|
|
|
|
|
|
|
|
|
|
| | – | | 193,565 | | – | | 193,565 | | – | | 3.73 | | – | | – | | 30/09/03 | | 30/09/03 | Executive |
|
|
|
|
|
|
|
|
|
|
|
|
|
|
|
|
|
|
|
|
|
| | 93,862 | | 193,565 | | – | | 257,892 | | 29,535 | | | | – | | – | | | | | |
|
|
|
|
|
|
|
|
|
|
|
|
|
|
|
|
|
|
|
|
|
| Abbey Annual Report and Accounts 2003 | | 103 |
Back to Contents
Report of the Directors
Remuneration Report continued
| General notes: |
| (1) | The executive share options detailed above are subject to performance conditions based on the average growth of earnings per ordinary share relative to the average increase in the retail price index in any three years prior to exercise. |
| | | |
| (2) | Executive share options granted since 1996 become exercisable if the average growth in earnings per ordinary share exceeds the average increase in the retail price index by 2%. Executive share options granted since 1997 become exercisable if the growth in earnings per ordinary share over a three year period exceeds the average increase in inflation by an average of at least 2% per annum, and the Company’s total shareholder return at least matches the median performing company in a group of specified financial institutions. For the options granted in 2003 there were two performance targets that operate separately. |
| | | |
| | | 50% of the options granted depend on Abbey’s total shareholder return performance compared with other companies in the FTSE 100. All of these options can be exercised if the company’s total shareholder return performance is ranked in the top quarter in relation to the other companies. Half of the options can be exercised if the Company’s total shareholder return performance is ranked at the middle of the group and in proportion between these two points. |
| | | |
| | | Half of the options granted depend on the growth of the Company’s total shareholder return compared with a group of UK Financial Services Companies. For 2003 the companies were Alliance and Leicester, Aviva, Barclays plc, Bradford & Bingley plc, Friends Provident, HBOS plc, HSBC plc, Legal & General plc, Lloyds TSB Group plc, Northern Rock plc, Old Mutual, Prudential plc and Royal Bank of Scotland Group plc. All of these options can be exercised if the Company’s total shareholder return performance is ranked in the top quarter in relation to the other companies. Half of the options can be exercised if the Company’s total shareholder return performance is ranked in the median of the group and in proportion in between these two points. |
| | | |
| | Performance is measured initially over three years. If the conditions have not been met in full after three years, performance is re-tested over four and five years. Any options that have not met the performance test after five years run out and cannot be exercised. |
| | | |
| (3) | The options refer to those granted under the Company’s Executive Share Option, Employee Share Option and Sharesave schemes,as set out in Note 55 to the financial statements. |
| | | |
| (4) | Options shown under the headings ‘Number of options: granted, exercised or lapsed/cancelled’ refer to options granted, exercised or cancelled during the year. |
| | | |
| (5) | Market price at the date of exercise is the Middle Market Quotation, as derived from the London Stock Exchange Daily Official List.The market price of the shares on 31 December 2003 was 531p (31 December 2002: 518p) and the range during 2003 was 317p to 596p. |
| | | |
| (6) | There have been no changes to the beneficial and other interests of the directors in the ordinary shares of the Company as shown above up to 25 February 2004. |
| | | |
| (7) | The gains made upon the exercise of options during the year are based on the amount by which the market value of shares on the date of exercise exceeded the option price irrespective of whether the shares were sold or retained. |
All employee share ownership scheme (partnership shares)
During 2003 Y Jetha and M A Pain participated in the Abbey employee share ownership scheme (partnership shares) which is available to all eligible employees. Under this scheme participants may make monthly contributions up to a maximum of £1,500 each year to acquire shares in Abbey National plc. The price of the shares was the market price at the beginning or end of the one year savings period whichever, was lower. In June 2003 Y Jetha and M A Pain each acquired 290 shares under the scheme at a price of £5.195 per share.
| 104 | | Abbey Annual Report and Accounts 2003 |
Back to Contents
Report of the Directors
Remuneration Report continued
Share matching scheme
Details of the Company’s ordinary shares over which the directors have conditional rights under the share matching scheme are as follows:
| | | | | | | | | | Conditional | |
| Conditional | | | | rights to |
| rights to | | Shares | Conditional | matching |
| matching shares | Conditional | awarded | rights | shares at |
| at 1 January | rights granted | during | lapsed | 31 December |
| Conditional rights | 2003 | during 2003 | 2003 | during 2003 | 2003 |
|
|
|
|
|
|
|
|
|
| |
| L Arnold | – | | 26,592 | | – | | – | | 26,592 | |
|
|
|
|
|
|
|
|
|
| |
| Y Jetha | 11,735 | | 9,418 | | – | | – | | 21,153 | |
|
|
|
|
|
|
|
|
|
| |
| M A Pain | 18,054 | | 6,509 | | – | | – | | 24,563 | |
|
|
|
|
|
|
|
|
|
| |
| | 29,789 | | 42,519 | | – | | – | | 72,308 | |
|
|
|
|
|
|
|
|
|
| |
Executive directors can take part in a Share Matching Scheme. Under the Scheme, directors can invest some or all of their bonus in the Company’s shares (“the purchased shares”). After three years, as long as the director is still employed and hasn’t sold the shares they’ve bought, they will get a matching award (“the matching shares”) with a value at the start of the three years equal to the value of the pre-tax bonus invested in the purchased shares.
For 2003 half of the matching award is based on the Company’s total shareholder returns compared with the FTSE 100 companies and half is based on total shareholder return compared with the group of 13 UK financial services companies used for the Executive Share Option Scheme (see above). Performance against each of these groups will be assessed separately.The matching shares will be available in full only if the Company’s Total Shareholder Returns is at the upper quartile of the group; half of the award will be available if the Company’s Total Shareholder Returns is at the median of the group and in proportion between these two points. The performance target applies over a fixed three-year period. This scheme is to be discontinued as part of the changes in remuneration policy.
Long Term Incentive Plan
Details of the Company’s ordinary shares over which the directors have conditional rights under the Long Term Incentive Plan are as follows:
| | Conditional | | | | | | Value | | | | Conditional | |
| rights held | | Shares | of shares | Conditional | rights held |
| under LTIP | Conditional | awarded | awarded | rights | under LTIP at |
| at 1 January | rights granted | during | during 2003 | lapsed | 31 December |
| Conditional rights | 2003 | during 2003 | 2003 | £ | during 2003 | 2003 |
|
|
|
|
|
|
|
|
|
|
|
| |
| D G Jones(4) | 8,196 | | – | | – | | – | | – | | 8,196 | |
|
|
|
|
|
|
|
|
|
|
|
| |
| M J Millington | 18,617 | | – | | 2,196 | | 11,364 | | 16,421 | | – | |
|
|
|
|
|
|
|
|
|
|
|
| |
| M A Pain | 22,481 | | – | | – | | – | | – | | 22,481 | |
|
|
|
|
|
|
|
|
|
|
|
| |
| Y Jetha | 15,456 | | – | | – | | – | | – | | 15,456 | |
|
|
|
|
|
|
|
|
|
|
|
| |
| | 64,750 | | – | | 2,196 | | 11,364 | | 16,421 | | 46,133 | |
|
|
|
|
|
|
|
|
|
|
|
| |
| | Shares held
in trust at
1 January
2003 | | Shares
awarded
during 2003 | | Shares
transferred
during 2003 | | Shares held
in trust at
31 December
2003 | | These shares are | |
| receivable in: |
|
|
| |
| Shares held in trust | 2004 | | 2005 | |
|
|
|
|
|
|
|
|
|
|
|
| |
| M J Millington | 4,326 | | 2,196 | | 6,522 | | – | | – | | – | |
|
|
|
|
|
|
|
|
|
|
|
| |
| M A Pain | 4,867 | | – | | – | | 4,867 | | 4,867 | | – | |
|
|
|
|
|
|
|
|
|
|
|
| |
| | 9,193 | | 2,196 | | 6,522 | | 4,867 | | 4,867 | | – | |
|
|
|
|
|
|
|
|
|
|
|
| |
| (1) | Shares sufficient to satisfy the conditional rights granted under the long term incentive plan during the year were bought in the market and are held by the Abbey Employee Trust (the Trust), which is administered by an independent professional trustee. The cost of these conditional rights, net of write back of amortisation of lapsed rights, is being credited/(charged) to the profit and loss account over the three year performance period to which they relate. In 2003, £1,086,472 (2002: (£573,617)) was credited/(charged) to the profit and loss account. |
| | |
| (2) | Shares are awarded to directors upon the relevant performance criteria being met. Directors receive 50% of the shares awarded to them three years from the date the conditional rights are granted and the remainder five years from the same date. The shares awarded form part of directors’ emoluments in the year in which they are received and are disclosed at the value of the shares on the date of receipt by the directors. |
| | |
| (3) | The aggregate maximum value of the conditional rights and shares held in trust shown above, based on the maximum number of shares that are receivable by the directors if Abbey is ranked in the top quartile of both the relevant comparator groups, and on the market price of the Company’s ordinary shares at 31 December 2003, the last day of trading in 2003, 531p (2002:518p), would have been £270,810 (2002: £383,025). As stated above, all conditional rights are subject to performance criteria. The directors do not receive any of the shares if Abbey is ranked below the median of both the relevant comparator groups. Shares held in trust are not subject to any further performance criteria. |
| | |
| (4) | The entitlement of D G Jones over the conditional rights held at 31 December 2003 are subject to the relevant performance criteria being met. Such entitlement to the conditional rights has been determined pro-rata to the period of service completed within the three year performance period to which those rights relate. |
| | |
| (5) | By virtue of their being potential beneficiaries of the Trust, each executive director is deemed, for the purpose of the Companies Act 1985, to have an interest in the shares held in the Trust. At 31 December 2003, the Trust held 1,580,736 ordinary shares (2002: 1,559,738 ordinary shares) for the above-named directors. |
| | |
By Order of the Board
Karen M Fortunato
Company Secretary
25 February 2004
| Abbey Annual Report and Accounts 2003 | | 105 |
Report of the Directors
Supervision and Regulation
European Union directives
General
The framework for supervision of banking and financial services in the United Kingdom is largely formed by European Union Directives which are required to be implemented in member states through national legislation. Directives aim to harmonise banking and financial services regulation and supervision throughout the European Union by laying down minimum standards in key areas, and requiring member states to give mutual recognition to each other’s standards of prudential supervision. This has led to the “passport” concept enshrined in the Banking Consolidation Directive and the Investment Services Directive (which is currently being revised): that is, freedom to establish branches in, and freedom to provide cross-border services into, other European Union member states once a bank or investment firm is authorised in its “home” state.
Prudential supervision and capital adequacy
The Banking Consolidation Directive sets out minimum conditions for authorisation and the ongoing prudential supervision of banks. Minimum conditions for the authorisation and prudential supervision of investment firms are set out in the Investment Services Directive. The overall responsibility for prudential supervision fals on the home country regulator of a bank or investment firm. The Banking Consolidation Directive and the Capital Adequacy Directive govern supervision of capital adequacy for both banks and investment firms in the European Union. The Capital Adequacy Directive contains detailed rules for the regulatory capital treatment of risks arising in the trading book, that is broadly, positions and securities that a United Kingdom bank or investment firm holds for proprietary trading purposes. For other (non-trading) risks, the Capital Adequacy Directive refers to the Banking Consolidation Directive, which regulates the quality and proportions of different types of capital to be held by an institution, the amount of capital to be held for counterparty exposures arising outside the trading book and restrictions on exposures to an individual counterparty or group of connected counterparties. In addition, the Capital Adequacy Directive and the Banking Consolidation Directive require consolidated supervision of financial groups.
The Basel Committee on Banking Supervision has been working with industry groups and regulators to reform the 1988 Capital Accord and has proposed a more risk sensitive framework for determining minimum regulatory capital requirements. The new Capital Accord under consideration, known as Basel II, requires regulatory capital to be held against specific credit, market and operational risk exposures. Banks will be able to choose between three levels of sophistication calculating regulatory capital for credit and operational risk. The consultation period on the latest proposals (Consultation Paper 3) ended in July 2003 and the Committee was due to publish the final version of the new Accord in mid 2004, but this has been delayed. Under the current timetable, the new Accord will become effective at the end of 2006.
The New Basel Capital Accord will need to be implemented into European Union law through amendments to existing European Commission directives. A working document on capital requirements for European Union banks (and investment firms) was published in July 2003. It is anticipated that following finalisation of the New Basel Capital Accord the Commission will adopt a formal proposal for a directive, which will then need approval by the Council of Ministers and the European Parliament. It is the intention that the new directive will enter into force at year-end 2006.
United Kingdom regulations
General
The Financial Services Authority is the single statutory regulator responsible for regulating deposit taking, insurance and investment business pursuant to the Financial Services and Markets Act 2000. It is a criminal offence for any person to carry on any of the activities regulated under the Financial Services and Markets Act in the United Kingdom unless that person is authorised by the Financial Services Authority or falls under an exemption.
The Financial Services Authority has authorised Abbey, as well as some of its subsidiaries, to carry on certain regulated activities. The regulated activities they are authorised to engage in depends upon permissions granted by the Financial Services Authority. The main permitted activities of Abbey and its subsidiaries are listed below.
Banking
Deposit taking is a regulated activity that requires a firm to be authorised and supervised by the Financial Services Authority. Abbey has permission to carry on deposit taking as do several of its subsidiaries, for example Abbey National Treasury Services plc and Cater Allen Limited.
Insurance
United Kingdom banking groups may provide insurance services through other group companies. Insurance business is authorised and supervised by the Financial Services Authority. Insurance business in the United Kingdom is divided between two main categories: long term assurance (e.g whole life, endowments, life insurance investment bonds) and general insurance (e.g. building and contents cover and motor insurance). Under the Financial Services and Markets Act, effecting or carrying out any contract of insurance, whether general or long term, is or will be, a regulated activity requiring authorisation. Dealing in, arranging deals in, managing or advising on a contract of insurance is at present, only regulated where the contract of insurance is long term insurance (see “Investment business” and “Current and future developments, Regulation of mortgage lending and general insurance” below).
Abbey has a number of subsidiaries which are authorised by the Financial Services Authority to effect contracts of insurance. Abbey also acts as a broker,receiving commissions for the policies arranged.
Investment business
Investment business such as dealing in, arranging deals in, managing and giving investment advice in respect of most types of securities and other investments, including options, futures and contracts for differences (which would include interest rate and currency swaps) and long term assurance contracts are all regulated activities under the Financial Services and Markets Act and require authorisation by the Financial Services Authority.
Abbey and a number of its subsidiaries have permission to engage in a wide range of wholesale and retail investment businesses including selling certain life assurance and pension products, unit trust products and Individual Savings Accounts (tax exempt saving products) and providing certain retail equity products and services.
Financial Services Authority conduct of business rules
The Financial Services Authority conduct of business rules also apply to every authorised person carrying on regulated activities and regulate the day-to-day conduct of business standards to be observed by authorised persons in carrying on those activities.
The conduct of business rules prescribe stringent rules relating to the circumstances and manner in which authorised persons may communicate and approve financial promotions, which are communications in the course of business or which are invitations or inducements to engage in investment activity.
| 106 | Abbey Annual Report and Accounts 2003 |
Back to Contents
Report of the Directors
Supervision and Regulation continued
The Financial Services Compensation Scheme
The Financial Services Compensation Scheme covers claims against authorised firms (or any participating European Economic Area firms) where they are unable, or likely to be unable, to pay claims against them. The Financial Services Compensation Scheme covers insurance companies, deposit takers and investment firms and is funded by imposing levies on authorised persons to meet its expenses.
Deposit taking: The Financial Services Compensation Scheme provides protection for customers of deposit taking companies when such companies default. The maximum level of compensation for a deposit claim is £31,700, 100% of the first £2,000 and 90% of the next £33,000.
Investments: Financial Services Compensation Scheme provides cover when an authorised investment firm defaults and cannot return customers’ money or investment assets; or meet claims for losses arising from poor advice or investment management. The maximum level of compensation claim related to the above is £48,000, i.e 100% of the first £30,000 and 90% of the next £20,000.
Insurance: Policy holders are protected if they are insured by authorised insurance companies under contracts of insurance issued in the United Kingdom, or in some cases in the European Economic Area. The Financial Services Compensation Scheme covers compulsory, general and life insurance when an insurance company defaults. For claims against insurance firms, the first £2,000 of an insurance claim or policy is covered in full, plus 90% of the balance. Compulsory insurance claims are covered in full.
Data protection
The United Kingdom Data Protection Act 1998 limits the ability of a United Kingdom company to hold and use personal information relating to its customers. The law requires that United Kingdom companies notify the Information Commissioner of their activities concerning the processing of personal data prior to commencing those activities. The Information Commissioner maintains a public register of data controllers. In addition, companies regulated by the Data Protection Act 1998 must comply with the eight enforceable principles of good conduct, the “data protection principles” and must submit to requests from the individual who is the subject of the data concerning matters such as giving access to their data and the right to object to incorrect data being held or to direct marketing.
Other main relevant legislation
The Consumer Credit Act 1974 regulates certain loans to consumers both secured (unless for housing related purposes) and unsecured and associated credit broking. The Unfair Terms in Consumer Contracts Regulations 1999, apply to certain contracts for goods and services entered into with consumers. The main effect of the Regulations is that a contractual term covered by the Regulations which is “unfair” will not be enforceable against a consumer as the Regulations contain an indicative list of unfair terms. These Regulations apply, inter alia, to mortgages, savings accounts and related products and services. The Financial Services Authority has gained new powers under the Unfair Terms in Consumer Contracts Regulations 1999.
Current and future developments
Regulation of mortgage lending and general insurance
Residential mortgage lending will be brought within the scope of Financial Services Authority regulation with effect from 31 October 2004 and general insurance from 14 January 2005. The new rules for mortgage lenders and administrators will cover such matters as: the fitness, propriety, and solvency oflenders; the suitability of their controllers and managers; the advertising and other promotion of mortgages; the disclosure of the essential features of a mortgage loan; and the ongoing relationship between lender and borrower.
In the meantime, until Financial Services Authority regulation of mortgages is introduced, the voluntary Mortgage Code will continue to apply.
General insurance intermediaries will be regulated by the Financial Services Authority following the adoption of the European Union Insurance Mediation Directive in August 2002. The Treasury have consulted on draft legislation and the Financial Service Authority have consulted on the rules which they propose to introduce.
Payment Systems
The Office of Fair Trading undertook a further review of payment systems in 2003 and will take on an enhanced role in relation to payment systems for a period off our years. The Government will then review competition in the industry and may consider legislation. Measures have already been taken by the industry to improve the efficiency and competitiveness of the system, for example the changes to the governance of the bank’s automated clearing system which took effect on 1 December 2003. The Office of Fair Trading is currently investigating the transparency of cheque clearing cycles.
Future governance of insurance companies
The Financial Services Authority are consulting on many issues which will affect the way insurers carry on business, ranging from such matters such as how past performance is presented to the regulation of distance sales and long term care insurance.
Savings review
The Sandler Report into long term savings was published in July 2002. It hopes to encourage the take up of long term savings and proposes a suite of simple, low cost products, with fixed charges for with-profits, pensions and unit trust’s and proposals to establish a lower tier of authorisation for advisers selling only stakeholder products. The Report also contemplated simplification of the Individual Savings Account regime. The HM Treasury Response to the consultation on Sandler Stakeholder Products, was published in July 2003. The suite of stakeholder products will incorporate the CAT standard cash Individual Savings Account, new Child Trust Fund and existing stakeholder pension.
Polarisation
The polarisation rules control the way certain savings and investment products can be sold. Advisers on life assurance, personal pension policies, collective investment schemes (unit trusts and OEICS) and investment trust savings schemes have to be either: an Independent Financial Adviser and advise across all products and companies in the market; or tied and represent just one company or group and sell only its products. The Financial Services Authority has confirmed that it plans to end the polarisation regime, subject to certain consumer protection safeguards. Final rules and implementation are expected during 2004.
| Abbey Annual Report and Accounts 2003 | 107 |
Back to Contents
Report of the Directors
Supervision and Regulation continued
Consumer Credit Act 1974
The Consumer Credit Act at present applies to loans of up to £25,000.The Department of Trade and Industry are consulting on changes to the Act which will include the removal of this financial limit, alterations to the form and content of agreements, the licensing regime and advertising.
European Union developments
There are a number of proposals emanating from the European Union, which will affect the UK financial services industry in due course. Work continues on the Financial Services Action Plan. Of the 42 proposals most have now been finalised. The intention is to create a single market for financial services by 2005.
There is also a proposal to create a Single European Payments Area and the Commission has published a consultation paper.The Regulation on Cross Border Payments in Euros has been fully in force since 1 July 2003. In addition, there are proposals for a new Consumer Credit Directive, and a directive on Unfair Commercial Practices. There have also been a number of measures which are aimed at facilitating the provision of financial services across borders by use of e-commerce. The revised Investment Services Directive is continuing its progress through the European Union legislative process.
Non-statutory practice recommendation
Codes of practice
The United Kingdom Council of Mortgage Lenders introduced a voluntary Code of Mortgage Lending Practice in 1997, which is designed to be followed by lenders in their relations with personal customers in the UK, and to which Abbey subscribes. Abbey also subscribes to the Banking Code, and the revised Banking and Business Codes took effect from March 2003, sponsored by the British Bankers’ Association, which sets minimum standards for the provision of banking services to personal customers.
| 108 | Abbey Annual Report and Accounts 2003 |
Financial Statements
Contents to Financial Statements
| Abbey Annual Report and Accounts 2003 | 109 |
Back to Contents
Financial Statements
Independent Auditors’ Report to the Members of Abbey National plc
We have audited the consolidated financial statements of Abbey National plc for the year ended 31 December 2003, which comprise the consolidated and company balance sheets at 31 December 2003 and 2002, the consolidated profit and loss accounts, the consolidated cash flow statements, the consolidated statements of total recognised gains and losses for the three years ended 31 December 2003, the statement of accounting policies and the related notes 1 to 65. These financial statements have been prepared under the accounting policies set out therein. We have also audited the information in the part of the directors’ remuneration report that is described in note 54 as having been audited.
Accounting principles generally accepted in the United Kingdom vary in significant respects from accounting principles generallyaccepted in the United States of America. The application of the latter would have affected the determination of net loss or income for each of the three years in the period ended 31 December 2003 and the determination of shareholders’ funds at 31 December 2003 and 2002, to the extent summarised in note 61 to the financial statements.
The reported net loss and income for the years ended 31 December 2002 and 2001 respectively and shareholders’ funds at 31 December 2002, as determined in accordance with accounting principles generally accepted in the United States of America, have been restated for the items described in Note 62(s).
Respective responsibilities of directors and auditors
As described in the statement of directors’ responsibilities, the company’s directors are responsible for the preparation of the financial statements in accordance with applicable United Kingdom law and accounting standards. They are also responsible for the preparation of the other information contained in the annual report including the directors’ remuneration report. Our responsibility is to audit the financial statements and the part of the directors’ remuneration report described as having been audited in accordance with relevant United Kingdom legal and regulatory requirements and auditing standards.
We report to you our opinion as to whether the financial statements give a true and fair view and whether the financial statements and the part of the directors’ remuneration report described as having been audited have been properly prepared in accordance with the Companies Act 1985. We also report to you if, in our opinion, the directors’ report is not consistent with the financial statements, if the company has not kept proper accounting records, if we have not received all the information and explanations we require for our audit, or if information specified by law regarding directors’ remuneration and transactions with the company and other members of the company is not disclosed.
We review whether the corporate governance statement reflects the company’s compliance with the seven provisions of the Combined Code specified for our review by the Listing Rules of the Financial Services Authority, and we report if it does not. We are not required to consider whether the board’s statements on internal control cover all risks and controls, or form an opinion on the effectiveness of Abbey’s corporate governance procedures or its risk and control procedures.
We read the directors’ report and the other information contained in the Annual Report for the year ended 31 December 2003 as described in the contents section, including the unaudited part of the directors’ remuneration report, and consider the implications for our report if we become aware of any apparent mis-statements or material inconsistencies with the financial statements.
Basis of audit opinion
We conducted our audit in accordance with United Kingdom auditing standards issued by the Auditing Practices Board and with generally accepted auditing standards in the United States of America. An audit includes examination, on a test basis, of evidence relevant to the amounts and disclosures in the financial statements and the part of the directors’ remuneration report described as having been audited. It also includes an assessment of the significant estimates and judgements made by the directors in the preparation of the financial statements and of whether the accounting policies are appropriate to the circumstances of the Company and the Group, consistently applied and adequately disclosed.
We planned and performed our audit so as to obtain all the information and explanations which we considered necessary in order to provide us with sufficient evidence to give reasonable assurance that the financial statements and the part of the directors’ remuneration report described as having been audited are free from material mis-statement, whether caused by fraud or other irregularity or error. In forming our opinion, we also evaluated the overall adequacy of the presentation of information in the financial statements and the part of the directors’ remuneration report described as having been audited.
UK opinion
In our opinion:
| the financial statements give a true and fair view of the state of affairs of the company and the Group at 31 December 2003 and of the loss of the Group for the year then ended; and
|
| the financial statements and part of the directors’ remuneration report described as having been audited have been properly prepared in accordance with the Companies Act 1985. |
US opinion
In our opinion the financial statements present fairly, in all material respects, the consolidated financial position of the Group at 31 December 2003 and 2002, and the consolidated results of its operations and cash flows for each of the three years in the period ended 31 December 2003, in conformity with accounting principles generally accepted in the United Kingdom.

Deloitte & Touche LLP
Chartered Accountants and Registered Auditors
London, England
25 February 2004
| 110 | Abbey Annual Report and Accounts 2003 |
Back to Contents
Financial Statements
Consolidated Profit and Loss Account
For the years ended 31 December 2003, 2002 and 2001
| | | | | | 2002 | | | |
| | | | 2003 | | (restated | ) | 2001 | |
| | Notes | | £m | | £m | | £m | |
|
|
|
|
|
|
|
| |
| Interest receivable: | | | | | | | | |
|
|
|
|
|
|
|
| |
| Interest receivable and similar income arising from debt securities | | | 922 | | 2,252 | | 3,543 | |
|
|
|
|
|
|
|
| |
| Other interest receivable and similar income | 3 | | 5,300 | | 5,876 | | 6,698 | |
|
|
|
|
|
|
|
| |
| Interest payable | 4 | | (4,074 | ) | (5,439 | ) | (7,549 | ) |
|
|
|
|
|
|
|
| |
| Net interest income | | | 2,148 | | 2,689 | | 2,692 | |
|
|
|
|
|
|
|
| |
| Dividend income | 5 | | 1 | | 1 | | 3 | |
|
|
|
|
|
|
|
| | |
| Fees and commissions receivable | | | 767 | | 786 | | 806 | |
|
|
|
|
|
|
|
| |
| Fees and commissions payable | | | (248 | ) | (275 | ) | (275 | ) |
|
|
|
|
|
|
|
| |
| Dealing profits | 6 | | 131 | | 100 | | 176 | |
|
|
|
|
|
|
|
| |
| Income from long term assurance business (smoothed) | 21 | | 176 | | 321 | | 345 | |
|
|
|
|
|
|
|
| |
| Embedded value charges and rebasing | 21 | | (378 | ) | (632 | ) | (443 | ) |
|
|
|
|
|
|
|
| |
| Income from long term assurance business | 21 | | (202 | ) | (311 | ) | (98 | ) |
|
|
|
|
|
|
|
| |
| Other operating (expense) income | 7 | | (165 | ) | 510 | | 707 | |
|
|
|
|
|
|
|
| |
| Total operating income – continuing operations | | | 2,791 | | 3,189 | | 3,564 | |
|
|
|
|
|
|
|
| |
| Total operating income – discontinued operations | | | (359 | ) | 311 | | 447 | |
|
|
|
|
|
|
|
| |
| Total operating income | | | 2,432 | | 3,500 | | 4,011 | |
|
|
|
|
|
|
|
| |
| Administrative expenses | 8 | | (2,014 | ) | (1,852 | ) | (1,709 | ) |
|
|
|
|
|
|
|
| |
| Depreciation of fixed assets excluding operating lease assets | 26 | | (12 | ) | (103 | ) | (111 | ) |
|
|
|
|
|
|
|
| |
| Depreciation and impairment on operating lease assets | 27 | | (251 | ) | (280 | ) | (256 | ) |
|
|
|
|
|
|
|
| |
| Amortisation of goodwill | 25 | | (20 | ) | (64 | ) | (36 | ) |
|
|
|
|
|
|
|
| |
| Impairment of goodwill | 25 | | (18 | ) | ( ,138 | ) | – | |
|
|
|
|
|
|
|
| |
| Depreciation, amortisation and impairment | | | (401 | ) | (1,585 | ) | (403 | ) |
|
|
|
|
|
|
|
| |
| Provisions for bad and doubtful debts | 9 | | (474 | ) | (514 | ) | (263 | ) |
|
|
|
|
|
|
|
| |
| Provisions for contingent liabilities and commitments | 38 | | (104 | ) | (50 | ) | 9 | |
|
|
|
|
|
|
|
| |
| Amounts written off fixed asset investments – debt securities | 19 | | (45 | ) | (388 | ) | (246 | ) |
|
|
|
|
|
|
|
| |
| – equity shares and similar investments | 20 | | (148 | ) | (123 | ) | (10 | ) |
|
|
|
|
|
|
|
| |
| Provisions and amounts written off fixed asset investments | | | (771 | ) | (1,075 | ) | (510 | ) |
|
|
|
|
|
|
|
| |
| Operating (loss) profit | | | (754 | ) | (1 ,012 | ) | 1,389 | |
|
|
|
|
|
|
|
| |
| Income from associated undertakings | | | 12 | | 17 | | 14 | |
|
|
|
|
|
|
|
| |
| Profit on disposal of Group undertakings | | | 89 | | 48 | | 67 | |
|
|
|
|
|
|
|
| |
| Profit (Loss) on the sale or termination of an operation | 57 | | (33 | ) | – | | – | |
|
|
|
|
|
|
|
| |
| Continuing operations | | | (183 | ) | (338 | ) | 1,408 | |
|
|
|
|
|
|
|
| |
| Discontinued operations | | | (503 | ) | (609 | ) | 62 | |
|
|
|
|
|
|
|
| |
| (Loss) profit on ordinary activities before tax | | | (686 | ) | (947 | ) | 1,470 | |
|
|
|
|
|
|
|
| |
| Tax on profit(loss) on ordinary activities | 10 | | 42 | | (152 | ) | (464 | ) |
|
|
|
|
|
|
|
| |
| (Loss) profit on ordinary activities after tax | | | (644 | ) | (1,099 | ) | 1,006 | |
|
|
|
|
|
|
|
| |
| Minority interests – non-equity | 41 | | (55 | ) | (62 | ) | (59 | ) |
|
|
|
|
|
|
|
| |
| (Loss) profit for the financial year attributable to the shareholders of Abbey National plc | | | (699 | ) | ( 1,1 61 | ) | 947 | |
|
|
|
|
|
|
|
| |
| Transferfrom (to) non-distributable reserve | 43 | | (200 | ) | 263 | | 161 | |
|
|
|
|
|
|
|
| |
| Dividends including amounts attributable to non-equity interests | 12 | | (424 | ) | (424 | ) | (762 | ) |
|
|
|
|
|
|
|
| |
| Retained (loss) profit for the financial year | | | (1,323 | ) | (1,322 | ) | 346 | |
|
|
|
|
|
|
|
| |
| Profit(loss) on ordinary activities before tax includes for acquired operations | | | – | | 4 | | 25 | |
|
|
|
|
|
|
|
| |
| (Loss) earnings per ordinary share – basic | 13 | | (52.4 | )p | (84.8 | )p | 63.2 | p |
|
|
|
|
|
|
|
| |
| (Loss) earnings per ordinary share – diluted | 13 | | (52.4 | )p | (84.3 | )p | 62.8 | p |
|
|
|
|
|
|
|
| |
The Group’s results as reported are on an historical cost basis, except where, as described in Accounting policies, special provisions of the Companies Act 1985 or industry standards apply. Accordingly, no note of historical cost profits and losses has been presented.
The 2002 comparative balance has been restated to reflect the reversal of impairments of Abbey shares held within ESOP Trusts following the adoption of UITF 38.
| Abbey Annual Report and Accounts 2003 | 111 |
Back to Contents
Financial Statements
Consolidated Balance Sheet
As at 31 December 2003 and 2002
| | | | | | | | 2002 | | 2002 | |
| | | | 2003 | | 2003 | | (restated | ) | (restated | ) |
| | Notes | | £m | | £m | | £m | | £m | |
|
|
|
|
|
|
|
|
|
| |
| Assets | | | | | | | | | | |
|
|
|
|
|
|
|
|
|
| |
| Cash and balances at central banks | | | | | 439 | | | | 396 | |
|
|
|
|
|
|
|
|
|
| |
| Treasury bills and other eligible bills | 14 | | | | 1,631 | | | | 1,483 | |
|
|
|
|
|
|
|
|
|
| |
| Loans and advances to banks | 15 | | | | 7,155 | | | | 6,601 | |
|
|
|
|
|
|
|
|
|
| |
| Loans and advances to customers not subject to securitisation | | | 84,488 | | | | 81,427 | | | |
|
|
|
|
|
|
|
|
|
| |
| Loans and advances to customers subject to securitisation | 17 | | 23,833 | | | | 24,156 | | | |
|
|
|
|
|
|
|
|
|
| |
| Less: non-recourse finance | | | (14,482 | ) | | | (15,160 | ) | | |
|
|
|
|
|
|
|
|
|
| |
| Loans and advances to customers | 16 | | | | 93,839 | | | | 90,423 | |
|
|
|
|
|
|
|
|
|
| |
| Net investment in finance leases | 18 | | | | 2,573 | | | | 3,447 | |
|
|
|
|
|
|
|
|
|
| |
| Debt securities | 19 | | | | 30,328 | | | | 59,807 | |
|
|
|
|
|
|
|
|
|
| |
| Equity shares and other similar interests | 20 | | | | 1,633 | | | | 963 | |
|
|
|
|
|
|
|
|
|
| |
| Long-term assurance business | 21 | | | | 2,272 | | | | 2,316 | |
|
|
|
|
|
|
|
|
|
| |
| Interests in associated undertakings | 22 | | | | 39 | | | | 51 | |
|
|
|
|
|
|
|
|
|
| |
| Intangible fixed assets | 25 | | | | 341 | | | | 376 | |
|
|
|
|
|
|
|
|
|
| |
| Tangible fixed assets excluding operating lease assets | 26 | | 268 | | | | 371 | | | |
|
|
|
|
|
|
|
|
|
| |
| Operating lease assets | 27 | | 2,529 | | | | 2,573 | | | |
|
|
|
|
|
|
|
|
|
| |
| Tangible fixed assets | | | | | 2,797 | | | | 2,944 | |
|
|
|
|
|
|
|
|
|
| |
| Other assets | 28 | | | | 4,162 | | | | 5,085 | |
|
|
|
|
|
|
|
|
|
| |
| Prepayments and accrued income | 29 | | | | 1,230 | | | | 1,891 | |
|
|
|
|
|
|
|
|
|
| |
| Assets of long-term assurance funds | 21 | | | | 28,336 | | | | 29,411 | |
|
|
|
|
|
|
|
|
|
| |
| Total assets | | | | | 176,775 | | | | 205,194 | |
|
|
|
|
|
|
|
|
|
| |
| Liabilities | | | | | | | | | | |
|
|
|
|
|
|
|
|
|
| |
| Deposits by banks | 31 | | | | 22,125 | | | | 24,174 | |
|
|
|
|
|
|
|
|
|
| |
| Customer accounts | 32 | | | | 74,401 | | | | 76,766 | |
|
|
|
|
|
|
|
|
|
| |
| Debt securities in issue | 33 | | | | 24,834 | | | | 48,079 | |
|
|
|
|
|
|
|
|
|
| |
| Dividend proposed | | | | | 245 | | | | 113 | |
|
|
|
|
|
|
|
|
|
| |
| Other liabilities | 34 | | | | 11 ,452 | | | | 9,125 | |
|
|
|
|
|
|
|
|
|
| |
| Accruals and deferred income | 35 | | | | 1,582 | | | | 2,218 | |
|
|
|
|
|
|
|
|
|
| |
| Provisions for liabilities and charges | 36 | | | | 836 | | | | 1,028 | |
|
|
|
|
|
|
|
|
|
| |
| Subordinated liabilities including convertible debt | 39 | | | | 6,337 | | | | 6,532 | |
|
|
|
|
|
|
|
|
|
| |
| Otherlong-term capital instruments | 40 | | | | 742 | | | | 771 | |
|
|
|
|
|
|
|
|
|
| |
| Liabilities of long-term assurance funds | 21 | | | | 28,336 | | | | 29,411 | |
|
|
|
|
|
|
|
|
|
| |
| Minority interests – non-equity | 41 | | | | 554 | | | | 627 | |
|
|
|
|
|
|
|
|
|
| |
| | | | | | 171,444 | | | | 198,844 | |
|
|
|
|
|
|
|
|
|
| |
| Called up share capital – ordinary shares | 42 | | 146 | | | | 146 | | | |
|
|
|
|
|
|
|
|
|
| |
| – preference shares | 42 | | 325 | | | | 325 | | | |
|
|
|
|
|
|
|
|
|
| |
| Share premium account | 42 | | 2,059 | | | | 2,155 | | | |
|
|
|
|
|
|
|
|
|
| |
| Reserves | 43 | | 274 | | | | 74 | | | |
|
|
|
|
|
|
|
|
|
| |
| Profit and loss account | 43 | | 2,527 | | | | 3,650 | | | |
|
|
|
|
|
|
|
|
|
| |
| Shareholders’ funds including non-equity interests | 44 | | | | 5,331 | | | | 6,350 | |
|
|
|
|
|
|
|
|
|
| |
| Total liabilities | | | | | 176,775 | | | | 205,194 | |
|
|
|
|
|
|
|
|
|
| |
| Memorandum items | | | | | | | | | | |
|
|
|
|
|
|
|
|
|
| |
| Contingent liabilities | | | | | | | | | | |
|
|
|
|
|
|
|
|
|
| |
| Guarantees and assets pledged as collateral security | 46 | | | | 2,148 | | | | 1,902 | |
|
|
|
|
|
|
|
|
|
| |
| Other contingent liabilities | 47 | | | | 159 | | | | 157 | |
|
|
|
|
|
|
|
|
|
| |
| | | | | | 2,307 | | | | 2,059 | |
|
|
|
|
|
|
|
|
|
| |
| Commitments | | | | | | | | | | |
|
|
|
|
|
|
|
|
|
| |
| Obligations under stock borrowing and lending agreements | 48 | | | | 25,649 | | | | 19,137 | |
|
|
|
|
|
|
|
|
|
| |
| Other commitments | 48 | | | | 3,018 | | | | 4,742 | |
|
|
|
|
|
|
|
|
|
| |
| | | | | | 28,667 | | | | 23,879 | |
|
|
|
|
|
|
|
|
|
| |
The 2002 comparative balances has been restated to reflect the reversal of impairments of Abbey shares held in ESOP Trusts together with their reclassification from other assets to shareholders equity on the adoption of UITF 38 and the adoption of value date accounting for purchase and resale agreements with non-standard setlement.
The Financial Statements on pages 111 to 189 were approved by the board on 25 February 2004 and signed on its behalf by:
 |  |  |
Lord Burns
Chairman | Luqman Arnold
Chief Executive | Stephen Hester
Chief Operating Officer |
| 112 | Abbey Annual Report and Accounts 2003 |
Back to Contents
Financial Statements
Company Balance Sheet
As at 31 December 2003 and 2002
| | | 2003 | | 2003 | | 2002 | | 2002 | |
| | Notes | £m | | £m | | £m | | £m | |
|
|
|
|
|
|
|
|
| |
| Assets | | | | | | | | | |
|
|
|
|
|
|
|
|
| |
| Cash and balances at central banks | | | | 417 | | | | 356 | |
|
|
|
|
|
|
|
|
| |
| Loans and advances to banks | 15 | | | 4,218 | | | | 4,716 | |
|
|
|
|
|
|
|
|
| |
| Loans and advances to customers not subject to securitisation | | 66,048 | | | | 59,628 | | | |
|
|
|
|
|
|
|
|
| |
| Loans and advances to customers subject to securitisation | 17 | 23,835 | | | | 24,035 | | | |
|
|
|
|
|
|
|
|
| |
| Less: non-recourse finance | | (13,813 | ) | | | (14,491 | ) | | |
|
|
|
|
|
|
|
|
| |
| Loans and advances to customers | 16 | | | 76,070 | | | | 69,172 | |
|
|
|
|
|
|
|
|
| |
| Net investment in finance leases | 18 | | | 18 | | | | 13 | |
|
|
|
|
|
|
|
|
| |
| Debt securities | 19 | | | 480 | | | | 1,394 | |
|
|
|
|
|
|
|
|
| |
| Equity shares and other similar interests | 20 | | | 2 | | | | 2 | |
|
|
|
|
|
|
|
|
| |
| Shares in Associate undertakings | 22 | | | 32 | | | | – | |
|
|
|
|
|
|
|
|
| |
| Shares in Group undertakings | 23 | | | 8,171 | | | | 7,545 | |
|
|
|
|
|
|
|
|
| |
| Tangible fixed assets | 26 | | | 239 | | | | 304 | |
|
|
|
|
|
|
|
|
| |
| Other assets | 28 | | | 1,001 | | | | 794 | |
|
|
|
|
|
|
|
|
| |
| Prepayments and accrued income | 29 | | | 501 | | | | 566 | |
|
|
|
|
|
|
|
|
| |
| Total assets | | | | 91,149 | | | | 84,862 | |
|
|
|
|
|
|
|
|
| |
| Liabilities | | | | | | | | | |
|
|
|
|
|
|
|
|
| |
| Deposits by banks | 31 | | | 18,780 | | | | 14,307 | |
|
|
|
|
|
|
|
|
| |
| Customer accounts | 32 | | | 57,900 | | | | 55,444 | |
|
|
|
|
|
|
|
|
| |
| Debt securities in issue | 33 | | | 4 | | | | 4 | |
|
|
|
|
|
|
|
|
| |
| Dividend proposed | | | | 245 | | | | 113 | |
|
|
|
|
|
|
|
|
| |
| Other liabilities | 34 | | | 1,030 | | | | 759 | |
|
|
|
|
|
|
|
|
| |
| Accruals and deferred income | 35 | | | 823 | | | | 941 | |
|
|
|
|
|
|
|
|
| |
| Provisions for liabilities and charges | 36 | | | 100 | | | | 43 | |
|
|
|
|
|
|
|
|
| |
| Subordinated liabilities including convertible debt | 39 | | | 6,689 | | | | 6,959 | |
|
|
|
|
|
|
|
|
| |
| Other long-term capital instruments | 40 | | | 742 | | | | 771 | |
|
|
|
|
|
|
|
|
| |
| | | | | 86,313 | | | | 79,341 | |
|
|
|
|
|
|
|
|
| |
| Called up share capital – ordinary shares | 42 | 146 | | | | 146 | | | |
|
|
|
|
|
|
|
|
| |
| – preference shares | 42 | 325 | | | | 325 | | | |
|
|
|
|
|
|
|
|
| |
| Share premium account | 42 | 2,059 | | | | 2,155 | | | |
|
|
|
|
|
|
|
|
| |
| Profit and loss account | 43 | 2,306 | | | | 2,895 | | | |
|
|
|
|
|
|
|
|
| |
| Shareholders’ funds including non-equity interests | 44 | | | 4,836 | | | | 5,521 | |
|
|
|
|
|
|
|
|
| |
| Total liabilities | | | | 91,149 | | | | 84,862 | |
|
|
|
|
|
|
|
|
| |
| Memorandum items | | | | | | | | | |
|
|
|
|
|
|
|
|
| |
| Contingent liabilities | | | | | | | | | |
|
|
|
|
|
|
|
|
| |
| Guarantees and assets pledged as collateral security | 46 | | | 69,487 | | | | 110,882 | |
|
|
|
|
|
|
|
|
| |
| Other contingent liabilities | 47 | | | 8 | | | | 23 | |
|
|
|
|
|
|
|
|
| |
| | | | | 69,495 | | | | 110,905 | |
|
|
|
|
|
|
|
|
| |
| Commitments | 48 | | | 1,627 | | | | 1,303 | |
|
|
|
|
|
|
|
|
| |
| | | | | |
The Financial Statements on pages 111 to 189 were approved by the board on 25 February 2004 and signed on its behalf by:
| | |
Lord Burns
Chairman | Luqman Arnold
Chief Executive | Stephen Hester
Chief Operating Officer |
| Abbey Annual Report and Accounts 2003 | 113 |
Back to Contents
Financial Statements
Consolidated Statement of Total Recognised Gains and Losses
For the years ended 31 December 2003, 2002 and 2001
| | | | | 2002 | | | |
| | | 2003 | | (restated | ) | 2001 | |
| | Notes | £m | | £m | | £m | |
|
|
|
|
|
|
| |
| (Loss) profit attributable to the shareholders of Abbey National plc | | (699) | | ( 1,161 | ) | 947 | |
|
|
|
|
|
|
| |
| Translation differences on foreign currency net investment | 43 | (1) | | (2) | | – | |
|
|
|
|
|
|
| |
| Total recognised (losses) gains relating to the year | | (700) | | ( 1,163 | ) | 947 | |
|
|
|
|
|
|
| |
| Prior period adjustments | | 37 | | | | | |
|
|
| | | | | |
| Total losses recognised since the prior year | | (663) | | | | | |
|
|
| | | | | |
The 2002 comparative balance has been restated to reflect the reversal of impairments of ESOP Trusts following the adoption of UITF 38.
Consolidated Cash Flow Statement
For the years ended 31 December 2003, 2002 and 2001
| | | 2003 | | 2002 | | 2001 | |
| | Notes | £m | | £m | | £m | |
|
|
|
|
|
|
| |
| Net cash (outflow) inflow from operating activities | 52a | (32,678 | ) | (10,952 | ) | 1,740 | |
|
|
|
|
|
|
| |
| Returns on investments and servicing of finance: | | | | | | | |
|
|
|
|
|
|
| |
| Interest paid on subordinated liabilities | | (262 | ) | (337 | ) | (323 | ) |
|
|
|
|
|
|
| |
| Preference dividends paid | | (55 | ) | (63 | ) | (42 | ) |
|
|
|
|
|
|
| |
| Payments to non-equity minority interests | | (55 | ) | (62 | ) | (59 | ) |
|
|
|
|
|
|
| |
| Net cash outflow from returns on investments and servicing of finance | | (372 | ) | (462 | ) | (424 | ) |
|
|
|
|
|
|
| |
| Taxation: | | | | | | | |
|
|
|
|
|
|
| |
| UK corporation tax paid | | (93 | ) | (481 | ) | (438 | ) |
|
|
|
|
|
|
| |
| Overseas tax paid | | (6 | ) | (15 | ) | (8 | ) |
|
|
|
|
|
|
| |
| Total taxation paid | | (99 | ) | (496 | ) | (446 | ) |
|
|
|
|
|
|
| |
| Capital expenditure and financial investment: | | | | | | | |
|
|
|
|
|
|
| |
| Purchases of investment securities | | (3,895 | ) | (16,636 | ) | (17,781 | ) |
|
|
|
|
|
|
| |
| Sales of investment securities | | 26,462 | | 12,926 | | 3,282 | |
|
|
|
|
|
|
| |
| Redemptions and maturities of investment securities | | 3,175 | | 14,977 | | 13,993 | |
|
|
|
|
|
|
| |
| Purchases of tangible fixed assets | | (532 | ) | (909 | ) | ( 1,001 | ) |
|
|
|
|
|
|
| |
| Sales of tangible fixed assets | | 194 | | 79 | | 197 | |
|
|
|
|
|
|
| |
| Transfers (to) from life assurance funds | | (215 | ) | (882 | ) | 43 | |
|
|
|
|
|
|
| |
| Net cash inflow (outflow)from capital expenditure and financial investment | | 25,189 | | 9,555 | | (1,267 | ) |
|
|
|
|
|
|
| |
| Acquisitions and disposals | 52e-g | 8,803 | | (536 | ) | (371 | ) |
|
|
|
|
|
|
| |
| Equity dividends paid | | (216 | ) | (648 | ) | (570 | ) |
|
|
|
|
|
|
| |
| Net cash inflow (outflow) before financing | | 627 | | (3,539 | ) | (1,338 | ) |
|
|
|
|
|
|
| |
| Financing: | | | | | | | |
|
|
|
|
|
|
| |
| Issue of ordinary share capital | | 2 | | 17 | | 27 | |
|
|
|
|
|
|
| |
| Issue of preference share capital | | – | | – | | 298 | |
|
|
|
|
|
|
| |
| Issue of loan capital | | – | | 392 | | 686 | |
|
|
|
|
|
|
| |
| Issue of other long term capital instruments | | – | | 485 | | 297 | |
|
|
|
|
|
|
| |
| Issue of preferred securities and minority interests | | – | | 15 | | – | |
|
|
|
|
|
|
| |
| Redemption of preference share capital | | (124 | ) | – | | – | |
|
|
|
|
|
|
| |
| Redemption of preferred securities | | (15 | ) | – | | – | |
|
|
|
|
|
|
| |
| Repayments ofloan capital | | (56 | ) | (222 | ) | – | |
|
|
|
|
|
|
| |
| Net cash (outflow) inflow from financing | 52c | (193 | ) | 687 | | 1,308 | |
|
|
|
|
|
|
| |
| Increase (decrease) in cash | 52b | 434 | | (2,852 | ) | (30 | ) |
|
|
|
|
|
|
| |
For the purposes of the consolidated cash flow statement, cash includes all cash at bank and in hand and loans and advances to banks repayable on demand without notice or penalty, including amounts denominated in foreign currencies.
| 114 | Abbey Annual Report and Accounts 2003 |
Back to Contents
Financial Statements
Accounting Policies
Basis of presentation
The consolidated financial statements are prepared in accordance with the special provisions of Part VII Schedule 9 of the Companies Act 1985 applicable to banking companies and banking groups.
Accounting convention
Abbey prepares its financial statements under the historical cost convention, modified by the revaluation of certain assets and liabilities. They are prepared in accordance with applicable accounting standards of the Accounting Standards Board and pronouncements of its Urgent Issues Task Force and with the Statements of Recommended Accounting Practice issued by the British Bankers’ Association, the Irish Bankers’ Federation and the Finance and Leasing Association. Accounting policies are reviewed regularly to ensure they are the most appropriate to the circumstances of Abbey for the purposes of giving a true and fair view.
Consistent with other banking groups, in preparing consolidated financial statements, the Long-Term Assurance business is valued using the embedded value method, with adjustments made for the impact of investment variances to Long-Term Assumptions. Disclosures consistent with the guidance provided by the Association of British Insurers in December 2001 is provided in either the Financial Statements or the Operating and Financial Review, wherever practical.
Basis of consolidation
The Group Financial Statements incorporate the Financial Statements of the company and all its subsidiary undertakings. The accounting reference date of the company and its subsidiary undertakings is 31 December, with the exception of those leasing, investment, insurance and funding companies, which, because of commercial considerations, have various accounting reference dates. The financial statements of these subsidiaries have been consolidated on the basis of interim Financial Statements for the period to 31 December 2003.
The assets and liabilities of the Long-Term Assurance funds are presented separately from those of other businesses in order to reflect the different nature of the shareholders’ interests therein.
Interest in subsidiary undertakings and associated undertakings
The company’s interests in subsidiary undertakings and associated undertakings are stated at cost less any provisions for impairment. The Group’s interests in associated undertakings are stated at Abbey’s share of the book value of the net assets of the associated undertakings.
Goodwill
Goodwill arising on consolidation as a result of the acquisitions of subsidiary undertakings and the purchase of businesses after 1 January 1998 is capitalised under the heading Intangible fixed assets and amortised on a straight-line basis over its expected useful economic life. The useful economic life is calculated using a valuation model which determines the period of time over which returns are expected to exceed the cost of capital, subjectto a maximum period of 20 years.
Goodwill arising on consolidation as a result of the acquisitions of subsidiary undertakings, and the purchase of businesses prior to 1 January 1998, has previously been written off directly to reserves. On disposal of subsidiary undertakings and businesses, such goodwill is charged to the Profit and Loss Account balanced by an equal credit to reserves. Where such goodwill in continuing businesses has suffered an impairment, a similar charge to the Profit and Loss Account and credit to reserves is made.
Impairment of fixed assets and goodwill
Tangible fixed assets, other than investment properties, and goodwill are subject to review for impairment in accordance with FRS 11 Impairment of Fixed Assets and Goodwill. The carrying values of tangible fixed assets and goodwill are written down by the amount of any impairment, and the loss is recognised in the Profit and Loss Account in the period in which this occurs. Should an event reverse the effects of a previous impairment, the carrying value of the tangible fixed assets and goodwill may be written up to a value no higher than the original depreciated or amortised cost which would have been recognised had the original impairment not occurred.
Depreciation
Tangible fixed assets excluding operating lease assets and investment properties are depreciated on a straight-line basis over their estimated useful lives, as follows:
|
| Freehold buildings: | 100 years |
|
| Long and short leasehold premises: | Over the remainder of the lease, |
| | with a maximum of 100 years. |
| | Acquisition premiums are depreciated |
| | over the period to the next rent review. |
|
| Freehold land: | Not depreciated |
|
| Office fixtures, equipment and furniture: | 5 to 8 years |
|
| Computer equipment: | 3 to 5 years |
|
For a description of depreciation on operating lease assets, see “Assets leased to customers” below.
Interest receivable and payable
Interest receivable and payable is recognised in the Profit and Loss Account as it accrues. Interest is suspended where due but not received on loans and advances in arrears where recovery is doubtful. The amounts suspended are excluded from interest receivable on loans and advances until recovered.
Fees, commissions and dividends receivable
Fees and commissions receivable in respect of services provided are taken to the Profit and Loss Account when the related services are performed. Where fees, commissions and dividends are in the nature of interest, these are taken to the Profit and Loss Account on a systematic basis over the expected life of the transaction to which they relate, and are included under the heading Interest receivable. Income on investments in equity shares and other similar interests is recognised as and when dividends are declared, and included within dividend income. Fees received on loans with high loan-to-value ratios are accounted for as described under the heading “Deferred income”.
| Abbey Annual Report and Accounts 2003 | 115 |
Back to Contents
Financial Statements
Accounting Policies continued
Lending-related fees and commissions payable and discounts
Under certain schemes, payments and discounts may be made to customers as incentives to take out loans. It is usually a condition of such schemes that incentive payments are recoverable by way of early redemption penalty charges in the event of redemption within a specified period, “the penalty period”, and it is Abbey’s policy and normal practice to make such charges. Such incentive payments are charged to the Profit and Loss Account over the penalty period where their cost is recoverable from the net interest income earned from the related loans over the penalty period. If the loan is redeemed within the penalty period the incentive payments are offset against the penalty charge. When the related loan is redeemed, sold or becomes impaired any amounts previously unamortised are charged to the Profit and Loss Account. The Profit and Loss Account charge for such amounts is included under the heading Interest receivable.
Commissions payable to introducers in respect of obtaining certain lending business, where this is the primary form of distribution, are charged to the Profit and Loss Account over the anticipated life of the loans. The Profit and Loss Account charge for such commissions is included under the heading Fees and commissions payable.
Dealing profits
Dealing profits include movements in prices on a mark-to-market basis, including accrued interest, on trading derivatives. Dealing profits also include movements in prices, on a mark-to-market basis excluding accrued interest, on trading security positions, trading treasury and other bills and related funding.
Deferred income
The arrangement of certain United kingdom loans and advances secured on residential properties with high loan-to-value ratios may result in a fee being charged.
In Abbey’s accounts, such fees are deferred and are included in the balance sheet under the heading Accruals and deferred income. The deferred income balance is taken to the Profit and Loss Account over the average anticipated life of the loan and is included under the heading Other operating income.
Pensions
W here pensions are provided by means of a funded defined benefits scheme, annual contributions are based on actuarial advice. The expected cost of providing pensions is recognised on a systematic basis over the expected average remaining service lives of members of the scheme.
For defined contribution schemes the amount charged to the Profit and Loss Account in respect of pensions costs and other post retirement benefits is the contributions payable in the year. Differences between contributions payable in the year and contributions actually paid are shown as either accruals or prepayments on the balance sheet.
Provisions for bad and doubtful debts
A specific provision is established for all impaired loans where it is likely that some of the capital will not be repaid or, where the loan is secured, recovered through enforcement of security. No provision is made where the security is in excess of the secured advance. Default is taken to be likely after a specified period of repayment default.
Loans that are part of a homogeneous pool of similar loans are placed on default status based on the number of months in arrears, which is determined through historical experience. Loans that are not part of a homogeneous pool of similar loans are analysed based on the number of months in arrears on a case by case basis and are placed on default status when the probability of default is likely.
Generally, the length of time before a loan is placed on default status after a repayment default depends on the nature of the collateral that secures the advance. On advances secured by residential property, the default period is three months. On advances secured by commercial property, the default period is five months, based on historical experience with business customers. For advances secured by consumer goods such as cars or computers, the default period is less than three months, the exact period being dependent on the particular type of loan in this category.
On unsecured advances, such as personal term loans, the default period is often less than three months. Exceptions to the general rule exist with respect to revolving facilities, such as bank overdrafts, which are placed on default upon a breach of the contractual terms governing the applicable account, and on credit card accounts where the default period is three months.
Wholesale lending and investment securities are placed on default status immediately upon default on a payment due date or following any event specified in the loan documentation as a default event. Securities are also placed on default status if the counterparty goes into voluntary or forced administration or liquidation or makes an announcement that it would not meet its commitments on the next payment due date.
Once a loan is considered impaired, an assessment of the likelihood of collecting the principal is made. This assessment includes, where appropriate, the use of statistical techniques developed based on previous experience and on management judgment of economic conditions. These techniques estimate the propensity of loans to result in losses net of any recovery where applicable.
A general provision is made against loans and advances to cover bad and doubtful debts which have not been separately identified, but which are known from experience to be present in portfolios of loans and advances. The general provision is determined using management judgment given past loss experience, lending quality and economic conditions, and is supplemented by statistical based calculations.
The specific and general provisions are deducted from loans and advances. Provisions made during the year, less amounts released and recoveries of amounts written off in previous years, are charged to the Profit and Loss Account. Write offs are determined on a case by case basis for different products and portfolios, at times ranging typically from 30 to 365 days.
| 116 | Abbey Annual Report and Accounts 2003 |
Back to Contents
Financial Statements
Accounting Policies continued
Share-based payments
The costs of share-based instruments are accounted for on a fair value basis, computed by reference to the grant date; such costs are expensed over the performance period to which the award relates. The amount charged to the Profit and Loss Account is credited to reserves. Prior to 2002, the costs of equity-based instruments issued to employees under compensation schemes were generally accounted for under the intrinsic value method but this was changed to a fair value basis after a review of then recent accounting pronouncements.
In accordance with UITF 38 Accounting for ESOP Trusts, shares purchased through Employee Share Option Trusts (ESOPs) are held at cost and treated as Treasury Shares and are taken as a deduction from Shareholders’ Equity. Previously these were held within other assets at the lower of cost less provision for impairments with any impairments being taken to the Profit and Loss Account. The 2002 Profit and Loss Account and balance sheet for 2002 and 2001 have been restated accordingly as well as the reversal of a £37m impairment charge taken in 2002 against the value of shares held within Employee Share Option Trusts.
Foreign currency translation
Income and expenses arising in foreign currencies are translated into sterling at the average rates of exchange over the accounting period unless they are hedged, in which case the relevant hedge rate is applied. Dividends are translated at the rate prevailing on the date the dividend is receivable. Monetary assets and liabilities denominated in foreign currencies are translated into sterling at the rates of exchange current at the balance sheet date. In Abbey’s Financial Statements, exchange differences on the translation of the opening net assets of foreign undertakings to the closing rate of exchange are taken to reserves, as are those differences resulting from the restatement of the profits and losses of foreign undertakings from average to closing rates. Exchange differences arising on the translation offoreign currency borrowings used to hedge investments in overseas undertakings are taken directly to reserves and offset against the corresponding exchange differences arising on the translation of the investments. Other translation differences are dealt with through the Profit and Loss Account.
Securities
Debt securities, equity shares and other similar interests (“securities”) held for investment purposes are stated at cost, adjusted for any amortisation of premium or discount on an appropriate basis over their estimated remaining lives. Provision is made for any impairment.
In accordance with industry practice, securities which are not held for the purpose of investment and the associated funding of these assets are stated at market value and profits and losses arising from this revaluation are taken directly to the Profit and Loss Account. The net return on these assets, excluding interest, appears in Dealing profits in the Profit and Loss Account. This net return comprises the revaluation profit and loss referred to above, plus profits and losses on disposal of these assets. The difference between the cost and market value of securities not held for investment is not disclosed as its determination is not practicable.
Securities’ market values are primarily derived using publicly quoted prices, direct broker quotes or recognised market models. Where such prices are unavailable, market values for those securities have been derived using in-house pricing models.
Where securities are transferred between portfolios held for investment purposes and portfolios held for other purposes, the securities are transferred at market value. Gains and losses on these transfers are taken directly to the Profit and Loss Account, and are included within Other operating income.
Securities are recognised as assets or, in the case of short positions, liabilities, at the date at which the commitment to purchase or sell is considered to be binding.
Securities sold subject to sale and repurchase agreements are retained on the balance sheet where the risks and rewards of ownership of the securities remain with Abbey. Similarly, securities purchased subject to purchase and resale agreements are treated as collateralised lending transactions where Abbey does not acquire the risks and rewards of ownership.
Repurchase and resale agreements
Securities sold subject to sale and repurchase agreement (“repurchase” agreement) are retained on the balance sheet where substantially all of the risk and rewards of ownership remain within Abbey. Similarly, securities purchased subject to a purchase and resale agreement (“resale” agreement) are treated as collateralised lending transactions where Abbey does not acquire substantially all of the risks and rewards of ownership.
Repurchase and resale agreements are included within Loans and advances to banks, Loans and advances to customers, Deposit by banks and Customer accounts. The difference between sale and repurchase and purchase and resale prices for such transactions is charged to the Profit and Loss Account over the life of the relevant transaction and reported within Interest receivable and Interest payable. Repurchase and resale agreements transacted on standard settlement terms are recognised on the balance sheet on a trade date basis while all non-standard settlement terms agreements are recognised on a value date basis.
Outright sale and purchase of securities combined with the total return swaps which remove the risk inherent in those securities are accounted for as effectively repurchase and resale agreements.
During the year, Abbey has adopted a value date accounting treatment for repurchase and resale agreements which fall outside the standard terms of settlement. It is considered that the new policy is more appropriate for balance sheet presentation as it betterreflects the economic risks and rewards of these instruments. A change to value date policy has no impact on the consolidated Profit and Loss Account of Abbey.
For the current year, the change in accounting policy has resulted in a decrease of £1,786 million to loans and advances to customers, a decrease of £1,366 million to loans and advances to banks, a decrease of £3,512 million to other liabilities, a decrease of £1,352 million to other assets, a decrease of £852 million to deposits by banks and a decrease of £500 million to customer accounts.
Due to the change in accounting policy, the prior year comparatives were restated to show a reduction of £485 million on loans and advances to customers and other liabilities.
| Abbey Annual Report and Accounts 2003 | 117 |
Back to Contents
Financial Statements
Accounting Policies continued
Customer accounts/deposits
Contracts involving the receipt of cash on which customers receive an index-linked return are accounted for in substance as equity index-linked deposits. The current market value of the contract is reported within Customer accounts.
Equity index-linked deposits are managed within the equity derivatives trading book as an integral part of the equity derivatives portfolio. Equity index-linked deposits are remeasured at fair value at each reporting date with changes in fair values recognised in the consolidated Profit and Loss Account. The equity index-linked deposits contain embedded derivatives. These embedded derivatives, in combination with the principal cash deposit element, are designed to replicate the investment performance profile tailored to the return agreed in the contracts with customers. Such embedded derivatives are not separated from the host instrument and are not separately accounted for as a derivative instrument, as the entire contract embodies both the embedded derivative instrument and the host instrument and is remeasured at fair value at each reporting date.
Stock borrowing and lending agreements
Obligations taken on pursuant to entering into such agreements are reported as commitments. Income earned and expense paid on stock borrowing and lending agreements is reported as fees and commissions receivable and fees and commissions payable, except when in the nature of interest, in which case they are reported as interest receivable and interest payable.
Deferred taxation
Deferred taxation is provided on all timing differences that have not reversed before the balance sheet date at the rate of tax expected to apply when those timing differences will reverse. Deferred tax assets are recognised to the extent that they are regarded as recoverable.
Subordinated liabilities (including convertible debt) and debt securities in issue
Bonds and notes issued are stated at net issue proceeds adjusted for amortisation. Premiums, discounts and expenses relating to bonds and notes issued are amortised over the life of the underlying transaction. Where premiums, discounts and expenses are matched by swap fees, the respective balances have been netted.
Derivatives
Transactions are undertaken in derivative financial instruments, (derivatives), which include interest rate swaps, cross currency and foreign exchange swaps, futures, equity and credit derivatives, options and similar instruments for both trading and non-trading purposes.
Derivatives classified as trading are held for market-making or portfolio management purposes within Abbey’s trading books. Trading book activity is the buying and selling of financial instruments in order to take advantage of short-term changes in market prices or for market-making purposes in order to facilitate customer requirements. Trading derivatives are carried at fair value in the balance sheet within other assets and other liabilities. Valuation adjustments to cover credit and market liquidity risks and future administration costs are made. Positive and negative market values of trading derivatives are offset where the contracts have been entered into under master netting agreements or other arrangements that represent a legally enforceable right of set off which will survive the liquidation of either party. Gains and losses are taken directly to the Profit and Loss Account and reported within dealing profits.
Derivatives classified as non-trading are those entered into for the purpose of matching or eliminating risk from potential movements in foreign exchange rates, interest rates, and equity prices inherent in Abbey’s non-trading assets, liabilities and positions. Non-trading derivatives are accounted for in a manner consistent with the assets, liabilities, or positions being hedged. Income and expense on non-trading derivatives are recognised as they accrue over the life of the instruments as an adjustment to interest receivable or interest payable. Credit derivatives, designated as non-trading and through which credit risk is taken on, are reported as guarantees which best reflect the economic substance of those transactions.
Where a non-trading derivative no longer represents a hedge because either the underlying non-trading asset, liability or position has been derecognised, or transferred into a trading portfolio, or the effectiveness of the hedge has been undermined, it is restated at fair value and any change in value is taken directly to the Profit and Loss Account and reported within other operating income. Thereafter the derivative is classified as trading or redesignated as a hedge of another non-trading item and accounted for accordingly. In other circumstances where non-trading derivatives are reclassified as trading or where non-trading derivatives are terminated, any resulting gains and losses are amortised over the remaining life of the hedged asset, liability or position. Unamortised gains and losses are reported within prepayments and accrued income and accruals and deferred income on the balance sheet.
Derivatives hedging anticipatory transactions are accounted for on a basis consistent with the relevant type oftransaction. Where anticipatory transactions do not actually occur, related derivatives are restated at fair value and changes in value are taken directly to the Profit and Loss Account and reported within other operating income. Where retained, such derivatives are reclassified as trading or redesignated as a hedge of a non-trading item and accounted for accordingly.
| 118 | Abbey Annual Report and Accounts 2003 |
Back to Contents
Financial Statements
Accounting Policies continued
Assets leased to customers
Assets leased to customers under agreements which transfer substantially all the risks and rewards associated with ownership, other than legal title, are classified as finance leases. All other assets leased to customers are classified as operating lease assets.
The net investment in finance leases represents total minimum lease payments less gross earnings allocated to future periods. Income from finance leases is credited to the Profit and Loss Account using the actuarial after-tax method to give a constant periodic rate of return on the net cash investment.
Operating lease assets are reported at cost less depreciation. They are shown as a separate class of tangible fixed asset because they are held for a different purpose to tangible fixed assets used in administrative functions. In the Profit and Loss Account, income in respect of operating lease assets is reported within other operating income, and depreciation on operating lease assets is reported within depreciation and amortisation. Provision is made for any impairment in value, any such amount being included in depreciation and amortisation.
Abbey selects the most appropriate method for recognition of income and depreciation according to the nature of the operating lease. This is determined by various factors including the length of the lease in proportion to the total economic life of the asset, any terms providing protection against early cancellation, and the amount of income retained in the lease to coverfuture uncertainties in respect of the realisation ofresidual values. For a large proportion of Abbey’s operating leases, the most appropriate method of accounting for income and depreciation is the actuarial after-tax method. Other operating leases are accounted for on a straight-line basis.
Leases
Assets held under finance leases and other similar contracts, which confer rights and obligations similar to those attached to owned assets, are capitalised as tangible fixed assets and are depreciated over the shorter of the lease terms and their useful lives. The capital elements of future lease obligations are recorded as liabilities, while the interest elements are charged to the Profit and Loss Account over the period of the leases to produce a constant rate of charge on the balance of capital repayments outstanding. Hire purchase transactions are dealt with similarly except that assets are depreciated over their useful lives.
Rentals under operating leases are charged on a straight-line basis over the lease term, even if the payments are not made on such a basis. Benefits received and receivable as an incentive to sign an operating lease are similarly spread on a straight-line basis over the lease term, except where the period to the review date on which the rent is first expected to be adjusted to the prevailing market rate is shorter than the full lease term, in which case the shorter period is used. Property rentals under operating leases are generally subject to annual escalation clauses or regular rent reviews; increased costs are charged from the increase date.
Securitisations
Certain Group undertakings have issued debt securities, or have entered into funding arrangements with lenders, in order to refinance existing assets or to finance the purchase of certain portfolios of loan and investment assets. These obligations are secured on the assets of the undertakings through non-recourse finance arrangements. Where the conditions for linked presentation, as stipulated in FRS 5, are met, the proceeds of the note issues, to the extent that there is no recourse to Abbey, are presented as “non-recourse finance” in Abbey’s balance sheet and shown deducted from the securitised assets, which are presented as “Loans and advances to customers subject to securitisation” in Abbey’s balance sheet.
Long-term assurance business
The value of the long-term assurance business represents the value of the shareholders’ interest in the long-term assurance funds, which consists of the present value of the surplus expected to emerge in the future from business currently in force, together with Abbey’s interest in the surplus retained within the long-term assurance funds.
In determining this value, assumptions relating to investment returns, future mortality, persistency and levels of expenses are based on experience of the business concerned. The surplus expected to emerge in the future is discounted at a risk-adjusted discount rate after provision has been made for taxation.
For 2003, a change has been made to the method for setting the assumptions used in determining the value offuture profits from a passive basis, whereby assumptions are based on management’s assessment oflong-term investment trends and intentions for asset mix, to an active basis, whereby assumptions are based on actual period-end market conditions and asset mix. The effects of this change on the current year have been included in embedded value rebasing and other adjustments. No adjustment has been made to prior year comparatives.
To demonstrate the impact of the actual investment return compared to the expected return over a year, an adjustment is made (shown as embedded value charges and rebasing on long-term assurance business, in the Profit and Loss Account) to identify separately the value generated from the normal operations of the business, from that relating to market conditions. With the exception of products with material explicit investment guarantees, assumptions as to future investment returns (rather than forward market rates) are used to assess the future value of both assets and liabilities, in all cases projecting from the current market values. Where material investment guarantees are given, the market forward rate is used to assess the value of the liability.
Changes in the value, which is determined on a post-tax basis, are included in the Profit and Loss Account grossed up at the effective rate of tax. The post-tax increase in the value is treated as non-distributable until it emerges as part of the surplus arising during the year.
The values of the assets and liabilities of the long-term assurance funds are based on the amounts included in the financial statements of the Life Assurance companies. The values are determined in accordance with the terms of the Companies Act 1985 (Insurance Companies Accounts) Regulations 1993, adjusted for the purposes of inclusion in Abbey Financial Statements in order to be consistent with Abbey’s accounting policies and presentation, where a separate asset is established to account for the value oflong-term assurance business.
Reserve capital instruments
Reserve capital instruments, included within otherlong-term capital instruments, are unsecured securities, subordinated to the claims of unsubordinated and subordinated creditors. Reserve capital instruments are treated as subordinated liabilities. Interest payable on the reserve capital instruments is included within interest payable.
| Abbey Annual Report and Accounts 2003 | 119 |
Back to Contents
Financial Statements
Notes to the Financial Statements
| 1. | Segmental analysis |
| a) | By class of business |
| | |
| Banking and Savings | (1) | Investment and Protection | (1) | Treasury Services | (1) | General Insurance | (1) | Group Infra- structure | (1) | Wholesale | (2) | First National | (2) | Other | (2) | Group Total | |
| | £m | | £m | | £m | | £m | | £m | | £m | | £m | | £m | | £m | |
|
|
|
|
|
|
|
|
|
|
|
|
|
|
|
|
|
|
|
| 2003 | | | | | | | | | | | | | | | | | | |
|
|
|
|
|
|
|
|
|
|
|
|
|
|
|
|
|
|
|
| Net interest income | 1,720 | | 83 | | 112 | | (5 | ) | (115 | ) | 22 | | 245 | | 86 | | 2,148 | |
|
|
|
|
|
|
|
|
|
|
|
|
|
|
|
|
|
|
|
| Other income and charges | 427 | | (165 | ) | 137 | | 126 | | 90 | | (197 | ) | (58 | ) | 25 | | 385 | |
|
|
|
|
|
|
|
|
|
|
|
|
|
|
|
|
|
|
|
| Total operating income (loss) | 2,147 | | (82 | ) | 249 | | 121 | | (25 | ) | (175 | ) | 187 | | 111 | | 2,533 | |
|
|
|
|
|
|
|
|
|
|
|
|
|
|
|
|
|
|
|
| Operating expenses excluding depreciation | | | | | | | | | | | | | | | | | | |
| on operating lease assets | (1,286 | ) | (58 | ) | (128 | ) | (89 | ) | (309 | ) | (107 | ) | (137 | ) | (83 | ) | (2,197 | ) |
|
|
|
|
|
|
|
|
|
|
|
|
|
|
|
|
|
|
|
| Depreciation and impairment on operating | | | | | | | | | | | | | | | | | | |
| lease assets | – | | – | | – | | – | | – | | (250 | ) | (1 | ) | – | | (251 | ) |
|
|
|
|
|
|
|
|
|
|
|
|
|
|
|
|
|
|
|
| Provisions for bad and doubtful debts | (130 | ) | (80 | ) | – | | – | | – | | (154 | ) | (99 | ) | (11 | ) | (474 | ) |
|
|
|
|
|
|
|
|
|
|
|
|
|
|
|
|
|
|
|
| Provisions for contingent liabilities and commitments | (14 | ) | – | | – | | – | | (71 | ) | (2 | ) | – | | (17 | ) | (104 | ) |
|
|
|
|
|
|
|
|
|
|
|
|
|
|
|
|
|
|
|
| Amounts written off fixed asset investments | (10 | ) | – | | – | | – | | – | | (183 | ) | – | | – | | (193 | ) |
|
|
|
|
|
|
|
|
|
|
|
|
|
|
|
|
|
|
|
| Profit/(loss) before taxation | 707 | | (220 | ) | 121 | | 32 | | (405 | ) | (871 | ) | (50 | ) | – | | (686 | ) |
|
|
|
|
|
|
|
|
|
|
|
|
|
|
|
|
|
|
|
| Total assets | 77,183 | | 28,790 | | 54,459 | | 165 | | 564 | | 7,426 | | 2,160 | | 6,028 | | 176,775 | |
|
|
|
|
|
|
|
|
|
|
|
|
|
|
|
|
|
|
|
| Net assets | 2,325 | | 1,846 | | 425 | | 8 | | 8 | | 362 | | 127 | | 230 | | 5,331 | |
|
|
|
|
|
|
|
|
|
|
|
|
|
|
|
|
|
|
|
| The average number of staff employed | | | | | | | | | | | | | | | | | | |
| by the Group during the year was as follows: | | | | | | | | | | | | | | | | | | |
|
|
|
|
|
|
|
|
|
|
|
|
|
|
|
|
|
|
|
| Employees | 16,378 | | 3,708 | | 511 | | 139 | | 3,999 | | 374 | | 1,170 | | 759 | | 27,038 | |
|
|
|
|
|
|
|
|
|
|
|
|
|
|
|
|
|
|
|
| | | | | | | | | | | | | | | | | | | |
| 2002 | | | | | | | | | | | | | | | | | | |
|
|
|
|
|
|
|
|
|
|
|
|
|
|
|
|
|
|
|
| Net interest income | 1,799 | | 90 | | 132 | | (3 | ) | (175 | ) | 327 | | 464 | | 55 | | 2,689 | |
|
|
|
|
|
|
|
|
|
|
|
|
|
|
|
|
|
|
|
| Other income and charges | 454 | | (218 | ) | 126 | | 149 | | 106 | | 378 | | (48 | ) | (71 | ) | 876 | |
|
|
|
|
|
|
|
|
|
|
|
|
|
|
|
|
|
|
|
| Total operating income | 2,253 | | (128 | ) | 258 | | 146 | | (69 | ) | 705 | | 416 | | (16 | ) | 3,565 | |
|
|
|
|
|
|
|
|
|
|
|
|
|
|
|
|
|
|
|
| Operating expenses excluding depreciation | | | | | | | | | | | | | | | | | | |
| on operating lease assets | (1,131 | ) | (53 | ) | (110 | ) | (54 | ) | (1,074 | ) | (123 | ) | (546 | ) | (66 | ) | (3,157 | ) |
|
|
|
|
|
|
|
|
|
|
|
|
|
|
|
|
|
|
|
| Depreciation and impairment on operating | | | | | | | | | | | | | | | | | | |
| lease assets | (23 | ) | – | | – | | – | | – | | (252 | ) | (5 | ) | – | | (280 | ) |
|
|
|
|
|
|
|
|
|
|
|
|
|
|
|
|
|
|
|
| Provisions for bad and doubtful debts | (151 | ) | – | | – | | – | | 1 | | (247 | ) | (115 | ) | (2 | ) | (514 | ) |
|
|
|
|
|
|
|
|
|
|
|
|
|
|
|
|
|
|
|
| Provisions for contingent liabilities and commitments | (11 | ) | – | | – | | – | | (35 | ) | – | | (4 | ) | – | | (50 | ) |
|
|
|
|
|
|
|
|
|
|
|
|
|
|
|
|
|
|
|
| Amounts written off fixed asset investments | 2 | | – | | – | | – | | – | | (513 | ) | – | | – | | (511 | ) |
|
|
|
|
|
|
|
|
|
|
|
|
|
|
|
|
|
|
|
| Profit/(loss) before taxation | 939 | | (181 | ) | 148 | | 92 | | (1,177 | ) | (430 | ) | (254 | ) | (84 | ) | (947 | ) |
|
|
|
|
|
|
|
|
|
|
|
|
|
|
|
|
|
|
|
| Total assets | 67,264 | | 30,404 | | 43,603 | | 199 | | 837 | | 48,401 | | 7,751 | | 6,735 | | 205,194 | |
|
|
|
|
|
|
|
|
|
|
|
|
|
|
|
|
|
|
|
| Net assets | 2,060 | | 1,764 | | 386 | | 9 | | 14 | | 1,387 | | 393 | | 337 | | 6,350 | |
|
|
|
|
|
|
|
|
|
|
|
|
|
|
|
|
|
|
|
| The average number of staff employed | | | | | | | | | | | | | | | | | | |
| by the Group during the year was as follows: | | | | | | | | | | | | | | | | | | |
|
|
|
|
|
|
|
|
|
|
|
|
|
|
|
|
|
|
|
| Employees | 15,882 | | 3,486 | | 539 | | 206 | | 4,788 | | 495 | | 1,503 | | 1,284 | | 28,183 | |
|
|
|
|
|
|
|
|
|
|
|
|
|
|
|
|
|
|
|
| | | | | | | | | | | | | | | | | | | |
| 2001 | | | | | | | | | | | | | | | | | | |
|
|
|
|
|
|
|
|
|
|
|
|
|
|
|
|
|
|
|
| Net interest income | 1,680 | | 54 | | 132 | | (4 | ) | (43 | ) | 376 | | 461 | | 36 | | 2,692 | |
|
|
|
|
|
|
|
|
|
|
|
|
|
|
|
|
|
|
|
| Other income and charges | 620 | | (44 | ) | 177 | | 134 | | 147 | | 413 | | (33 | ) | (14 | ) | 1,400 | |
|
|
|
|
|
|
|
|
|
|
|
|
|
|
|
|
|
|
|
| Total operating income | 2,300 | | 10 | | 309 | | 130 | | 104 | | 789 | | 428 | | 22 | | 4,092 | |
|
|
|
|
|
|
|
|
|
|
|
|
|
|
|
|
|
|
|
| Operating expenses excluding depreciation | | | | | | | | | | | | | | | | | | |
| on operating lease assets | (1,069 | ) | (46 | ) | (98 | ) | (42 | ) | (262 | ) | (88 | ) | (214 | ) | (37 | ) | (1,856 | ) |
|
|
|
|
|
|
|
|
|
|
|
|
|
|
|
|
|
|
|
| Depreciation and impairment on operating | | | | | | | | | | | | | | | | | | |
| lease assets | (97 | ) | – | | – | | – | | – | | (152 | ) | (7 | ) | – | | (256 | ) |
|
|
|
|
|
|
|
|
|
|
|
|
|
|
|
|
|
|
|
| Provisions for bad and doubtful debts | (149 | ) | – | | – | | – | | – | | – | | (113 | ) | (1 | ) | (263 | ) |
|
|
|
|
|
|
|
|
|
|
|
|
|
|
|
|
|
|
|
| Provisions for contingent liabilities and commitments | (5 | ) | (3 | ) | – | | – | | 17 | | – | | ��� | | – | | 9 | |
|
|
|
|
|
|
|
|
|
|
|
|
|
|
|
|
|
|
|
| Amounts written off fixed asset investments | – | | – | | (24 | ) | – | | – | | (232 | ) | – | | – | | (256 | ) |
|
|
|
|
|
|
|
|
|
|
|
|
|
|
|
|
|
|
|
| Profit/(loss) before taxation | 980 | | (39 | ) | 187 | | 88 | | (141 | ) | 317 | | 94 | | (16 | ) | 1,470 | |
|
|
|
|
|
|
|
|
|
|
|
|
|
|
|
|
|
|
|
| Total assets | 70,906 | | 32,458 | | 47,910 | | 179 | | 460 | | 53,181 | | 8,874 | | 399 | | 214,367 | |
|
|
|
|
|
|
|
|
|
|
|
|
|
|
|
|
|
|
|
| Net assets | 2,301 | | 1,936 | | 12 | | 535 | | 17 | | 1,813 | | 477 | | 351 | | 7,442 | |
|
|
|
|
|
|
|
|
|
|
|
|
|
|
|
|
|
|
|
| The average number of staff employed | | | | | | | | | | | | | | | | | | |
| by the Group during the year was as follows: | | | | | | | | | | | | | | | | | | |
|
|
|
|
|
|
|
|
|
|
|
|
|
|
|
|
|
|
|
| Employees | 15,887 | | 3,487 | | 539 | | 206 | | 4,790 | | 448 | | 1,470 | | 1,417 | | 28,244 | |
|
|
|
|
|
|
|
|
|
|
|
|
|
|
|
|
|
|
|
The average number of staff employed in the year is calculated on a full-time equivalent basis.
| 120 | Abbey Annual Report and Accounts 2003 |
Back to Contents
Financial Statements
Notes to the Financial Statementscontinued
The comparative segmental results for the years ended 31 December 2002 and 2001 have been restated as follows:
| | Banking | | Investment | | | | | | Group | | | | | | | | | |
| | and | | and | | Treasury | | General | | Infra- | | | | First | | | | Group | |
| | Savings | (1) | Protection | (1) | Services | (1) | Insurance | (1) | structure | (1) | Wholesale | (2) | National | (2) | Other | (2) | Total | |
| | £m | | £m | | £m | | £m | | £m | | £m | | £m | | £m | | £m | |
|
|
|
|
|
|
|
|
|
|
|
|
|
|
|
|
|
|
|
| 2002 | | | | | | | | | | | | | | | | | | |
|
|
|
|
|
|
|
|
|
|
|
|
|
|
|
|
|
|
|
| Profit before taxation | | | | | | | | | | | | | | | | | | |
|
|
|
|
|
|
|
|
|
|
|
|
|
|
|
|
|
|
|
| Retail Banking | 914 | | 173 | | – | | 92 | | – | | – | | – | | – | | 1,179 | |
|
|
|
|
|
|
|
|
|
|
|
|
|
|
|
|
|
|
|
| Wholesale Banking | – | | – | | 148 | | – | | – | | (430 | ) | – | | – | | (282 | ) |
|
|
|
|
|
|
|
|
|
|
|
|
|
|
|
|
|
|
|
| WMLTS | 25 | | (354 | ) | – | | – | | – | | – | | 103 | | (66 | ) | (292 | ) |
|
|
|
|
|
|
|
|
|
|
|
|
|
|
|
|
|
|
|
| Group Infrastructure | – | | – | | – | | – | | (1,214 | ) | – | | (357 | ) | (18 | ) | (1,589 | ) |
|
|
|
|
|
|
|
|
|
|
|
|
|
|
|
|
|
|
|
| | 939 | | (181 | ) | 148 | | 92 | | (1,214 | ) | (430 | ) | (254 | ) | (84 | ) | (984 | ) |
|
|
|
|
|
|
|
|
|
|
|
|
|
|
|
|
|
|
|
| Accounting policy changes: | | | | | | | | | | | | | | | | | | |
|
|
|
|
|
|
|
|
|
|
|
|
|
|
|
|
|
|
|
| ESOP Trusts | – | | – | | – | | – | | 37 | | – | | – | | – | | 37 | |
|
|
|
|
|
|
|
|
|
|
|
|
|
|
|
|
|
|
|
| 2002 revised profit/(loss) before taxation | 939 | | (181 | ) | 148 | | 92 | | (1,177 | ) | (430 | ) | (254 | ) | (84 | ) | (947 | ) |
|
|
|
|
|
|
|
|
|
|
|
|
|
|
|
|
|
|
|
| | | | | | | | | | | | | | | | | | | |
| 2001 | | | | | | | | | | | | | | | | | | |
|
|
|
|
|
|
|
|
|
|
|
|
|
|
|
|
|
|
|
| Profit before taxation | | | | | | | | | | | | | | | | | | |
|
|
|
|
|
|
|
|
|
|
|
|
|
|
|
|
|
|
|
| Retail Banking | 985 | | 168 | | – | | 88 | | – | | – | | – | | – | | 1,241 | |
|
|
|
|
|
|
|
|
|
|
|
|
|
|
|
|
|
|
|
| Wholesale Banking | (5 | ) | (207 | ) | – | | – | | – | | – | | 94 | | (16 | ) | (134 | ) |
|
|
|
|
|
|
|
|
|
|
|
|
|
|
|
|
|
|
|
| WMLTS | – | | – | | 187 | | – | | – | | 317 | | – | | – | | 504 | |
|
|
|
|
|
|
|
|
|
|
|
|
|
|
|
|
|
|
|
| Group Infrastructure | – | | – | | – | | – | | (141 | ) | – | | – | | – | | (141 | ) |
|
|
|
|
|
|
|
|
|
|
|
|
|
|
|
|
|
|
|
| | 980 | | (39 | ) | 187 | | 88 | | (141 | ) | 317 | | 94 | | (16 | ) | 1,470 | |
|
|
|
|
|
|
|
|
|
|
|
|
|
|
|
|
|
|
|
Consistent with previous years, when arriving at the segmental analysis, certain adjustments have been made. They include an adjustment to reflect the capital notionally absorbed by each segment, based on the Group's Financial Services Authority regulatory requirements, and an allocation across the segments of the earnings on Group reserves.
| (1) | Collectively the Personal Financial Services group of reportable segments. |
| | |
| (2) | Collectively the Portfolio Business Unit group of reportable segments. |
| | |
| b) | By geographical region |
| | | | Europe | | United | | Rest of | | Group | |
| | UK | | (excluding UK) | | States | | World | | Total | |
| | £m | | £m | | £m | | £m | | £m | |
|
|
|
|
|
|
|
|
|
|
|
| 2003 | | | | | | | | | | |
|
|
|
|
|
|
|
|
|
|
|
| Net interest income | 2,063 | | 76 | | 12 | | (3 | ) | 2,148 | |
|
|
|
|
|
|
|
|
|
|
|
| Dividend income | – | | – | | – | | – | | – | |
|
|
|
|
|
|
|
|
|
|
|
| Net fees and commissions receivable | 501 | | 5 | | – | | – | | 506 | |
|
|
|
|
|
|
|
|
|
|
|
| Dealing profits | 129 | | – | | 2 | | – | | 131 | |
|
|
|
|
|
|
|
|
|
|
|
| Other operating income | (294 | ) | 42 | | – | | – | | (252 | ) |
|
|
|
|
|
|
|
|
|
|
|
| Total operating income | 2,399 | | 123 | | 14 | | (3 | ) | 2,533 | |
|
|
|
|
|
|
|
|
|
|
|
| Operating expenses excluding depreciation on operating lease assets | (2,138) | | (55 | ) | (4 | ) | – | | (2,197 | ) |
|
|
|
|
|
|
|
|
|
|
|
| Depreciation and impairment on operating lease assets | (251 | ) | – | | – | | – | | (251 | ) |
|
|
|
|
|
|
|
|
|
|
|
| Provisions for bad and doubtful debts | (467 | ) | (7 | ) | – | | – | | (474 | ) |
|
|
|
|
|
|
|
|
|
|
|
| Provisions for contingent liabilities and commitments | (104 | ) | – | | – | | – | | (104 | ) |
|
|
|
|
|
|
|
|
|
|
|
| Amounts written off fixed asset investments | (193 | ) | – | | – | | – | | (193 | ) |
|
|
|
|
|
|
|
|
|
|
|
| (Loss)/profit before taxation | (754 | ) | 61 | | 10 | | (3 | ) | (686 | ) |
|
|
|
|
|
|
|
|
|
|
|
| Total assets | 174,027 | | 1,867 | | 881 | | – | | 176,775 | |
|
|
|
|
|
|
|
|
|
|
|
| Net assets | 5,229 | | 102 | | – | | – | | 5,331 | |
|
|
|
|
|
|
|
|
|
|
|
| Abbey Annual Report and Accounts 2003 | 121 |
Back to Contents
Financial Statements
Notes to the Financial Statementscontinued
| | | | Europe | | | | Rest of | | Group | |
| | UK | | (excluding UK) | | United States | | World | | Total | |
| | £m | | £m | | £m | | £m | | £m | |
|
|
|
|
|
|
|
|
|
|
|
| 2002 | | | | | | | | | | |
|
|
|
|
|
|
|
|
|
|
|
| Net interest income | 2,527 | | 109 | | 52 | | 1 | | 2,689 | |
|
|
|
|
|
|
|
|
|
|
|
| Dividend income | 1 | | – | | – | | – | | 1 | |
|
|
|
|
|
|
|
|
|
|
|
| Net fees and commissions receivable | 508 | | 3 | | – | | – | | 511 | |
|
|
|
|
|
|
|
|
|
|
|
| Dealing profits | 98 | | (2 | ) | 4 | | – | | 100 | |
|
|
|
|
|
|
|
|
|
|
|
| Other operating income | 218 | | 46 | | – | | – | | 264 | |
|
|
|
|
|
|
|
|
|
|
|
| Total operating income | 3,352 | | 156 | | 56 | | 1 | | 3,565 | |
|
|
|
|
|
|
|
|
|
|
|
| Operating expenses excluding depreciation | | | | | | | | | | |
| on operating lease assets | (3,013 | ) | (135 | ) | (8 | ) | (1 | ) | (3,157 | ) |
|
|
|
|
|
|
|
|
|
|
|
| Depreciation and impairment on operating lease assets | (280 | ) | – | | – | | – | | (280 | ) |
|
|
|
|
|
|
|
|
|
|
|
| Provisions for bad and doubtful debts | (517 | ) | 3 | | – | | – | | (514 | ) |
|
|
|
|
|
|
|
|
|
|
|
| Provisions for contingent liabilities and commitments | (50 | ) | – | | – | | – | | (50 | ) |
|
|
|
|
|
|
|
|
|
|
|
| Amounts written off fixed asset investments | (513 | ) | 2 | | – | | – | | (511 | ) |
|
|
|
|
|
|
|
|
|
|
|
| (Loss)/profit before taxation | (1,021 | ) | 26 | | 48 | | – | | (947 | ) |
|
|
|
|
|
|
|
|
|
|
|
| Total assets | 188,888 | | 8,705 | | 7,465 | | 136 | | 205,194 | |
|
|
|
|
|
|
|
|
|
|
|
| Net assets | 5,525 | | 336 | | 478 | | 11 | | 6,350 | |
|
|
|
|
|
|
|
|
|
|
|
| | | | | | | | | | | |
| 2001 | | | | | | | | | | |
|
|
|
|
|
|
|
|
|
|
|
| Net interest income | 2,530 | | 134 | | 28 | | – | | 2,692 | |
|
|
|
|
|
|
|
|
|
|
|
| Dividend income | 1 | | 2 | | – | | – | | 3 | |
|
|
|
|
|
|
|
|
|
|
|
| Net fees and commissions receivable/(payable) | 551 | | (20 | ) | – | | – | | 531 | |
|
|
|
|
|
|
|
|
|
|
|
| Dealing profits | 180 | | – | | (4 | ) | – | | 176 | |
|
|
|
|
|
|
|
|
|
|
|
| Other operating income | 686 | | 4 | | – | | – | | 690 | |
|
|
|
|
|
|
|
|
|
|
|
| Total operating income | 3,948 | | 120 | | 24 | | – | | 4,092 | |
|
|
|
|
|
|
|
|
|
|
|
| Operating expenses excluding depreciation on operating lease assets | (1,771) | | (82 | ) | (2 | ) | (1 | ) | (1,856 | ) |
|
|
|
|
|
|
|
|
|
|
|
| Depreciation on impairment and operating lease assets | (243 | ) | (13 | ) | – | | – | | (256 | ) |
|
|
|
|
|
|
|
|
|
|
|
| Provisions for bad and doubtful debts | (263 | ) | – | | – | | – | | (263 | ) |
|
|
|
|
|
|
|
|
|
|
|
| Provisions for contingent liabilities and commitments | 9 | | – | | – | | – | | 9 | |
|
|
|
|
|
|
|
|
|
|
|
| Amounts written off fixed asset investments | (256 | ) | – | | – | | – | | (256 | ) |
|
|
|
|
|
|
|
|
|
|
|
| Profit/(loss) before taxation | 1,424 | | 25 | | 22 | | (1 | ) | 1,470 | |
|
|
|
|
|
|
|
|
|
|
|
| Total assets | 193,560 | | 11,648 | | 9,043 | | 116 | | 214,367 | |
|
|
|
|
|
|
|
|
|
|
|
| Net assets | 6,780 | | 375 | | 283 | | 4 | | 7,442 | |
|
|
|
|
|
|
|
|
|
|
|
| 122 | Abbey Annual Report and Accounts 2003 |
Back to Contents
Financial Statements
Notes to the Financial Statements continued
| 2. | Discontinued Operations |
| | | | | | | | | | Dis- | | | | | | Dis- | | | |
| | Dis- | | Continuing | continued | | Continuing | continued | |
| Continuing | continued | | operations | operations | Total | operations | operations | |
| operations | operations | Total | 2002 | 2002 | 2002 | 2001 | 2001 | Total |
| 2003 | 2003 | 2003 | (restated) | (restated) | (restated) | (restated) | (restated) | 2001 |
| £m | £m | £m | £m | £m | £m | £m | £m | £m |
|
|
|
|
|
|
|
|
|
|
|
|
|
|
|
|
|
| |
| Net interest income | 2,046 | | 102 | | 2,148 | | 2,203 | | 486 | | 2,689 | | 2,150 | | 542 | | 2,692 | |
|
|
|
|
|
|
|
|
|
|
|
|
|
|
|
|
|
| |
| Other income and charges | 745 | | (461 | ) | 284 | | 986 | | (175 | ) | 811 | | 1,414 | | (95 | ) | 1,319 | |
|
|
|
|
|
|
|
|
|
|
|
|
|
|
|
|
|
| |
| Total Income | 2,791 | | (359 | ) | 2,432 | | 3,189 | | 311 | | 3,500 | | 3,564 | | 447 | | 4,011 | |
|
|
|
|
|
|
|
|
|
|
|
|
|
|
|
|
|
| |
| Total administrative expenses | (1,979 | ) | (35 | ) | (2,014 | ) | (1,714 | ) | (138 | ) | (1,852 | ) | (1,653 | ) | (56 | ) | (1,709 | ) |
|
|
|
|
|
|
|
|
|
|
|
|
|
|
|
|
|
| |
| Depreciation of tangible fixed assets | | | | | | | | | | | | | | | | | | |
| excluding operating lease assets | (111 | ) | (1 | ) | (112 | ) | (98 | ) | (5 | ) | (103 | ) | (106 | ) | (5 | ) | (111 | ) |
|
|
|
|
|
|
|
|
|
|
|
|
|
|
|
|
|
| |
| Amortisation – Goodwill | (20 | ) | – | | (20 | ) | (53 | ) | (11 | ) | (64 | ) | (23 | ) | (13 | ) | (36 | ) |
|
|
|
|
|
|
|
|
|
|
|
|
|
|
|
|
|
| |
| Impairment loss on tangible & | | | | | | | | | | | | | | | | | | |
| intangible fixed assets | (18 | ) | – | | (18 | ) | (781 | ) | – | | (781 | ) | – | | – | | – | |
|
|
|
|
|
|
|
|
|
|
|
|
|
|
|
|
|
| |
| Operating expenses excluding | | | | | | | | | | | | | | | | | | |
| depreciation on operating lease assets | (2,128 | ) | (36 | ) | (2,164 | ) | (2,646 | ) | (154 | ) | (2,800 | ) | (1,782 | ) | (74 | ) | (1,856 | ) |
|
|
|
|
|
|
|
|
|
|
|
|
|
|
|
|
|
| |
| Depreciation and impairment on | | | | | | | | | | | | | | | | | | |
| operating lease assets | (251 | ) | – | | (251 | ) | (278 | ) | (2 | ) | (280 | ) | (255 | ) | (1 | ) | (256 | ) |
|
|
|
|
|
|
|
|
|
|
|
|
|
|
|
|
|
| |
| Provisions for bad and doubtful debts | (453 | ) | (21 | ) | (474 | ) | (434 | ) | (80 | ) | (514 | ) | (185 | ) | (78 | ) | (263 | ) |
|
|
|
|
|
|
|
|
|
|
|
|
|
|
|
|
|
| |
| Provisions for contingent liabilities | | | | | | | | | | | | | | | | | | |
| and commitments | (104 | ) | – | | (104 | ) | (46 | ) | (4 | ) | (50 | ) | 9 | | – | | 9 | |
|
|
|
|
|
|
|
|
|
|
|
|
|
|
|
|
|
|
|
| Amounts written off fixed assets | | | | | | | | | | | | | | | | | | |
| investments | (140 | ) | (53 | ) | (193 | ) | (186 | ) | (325 | ) | (511 | ) | (10 | ) | (246 | ) | (256 | ) |
|
|
|
|
|
|
|
|
|
|
|
|
|
|
|
|
|
| |
| Operating (loss)/profit | (285 | ) | (569 | ) | (754 | ) | (401 | ) | (254 | ) | (655 | ) | 1,341 | | 48 | | 1,389 | |
|
|
|
|
|
|
|
|
|
|
|
|
|
|
|
|
|
| |
| Income from associated undertakings | 12 | | – | | 12 | | 17 | | – | | 17 | | – | | 14 | | 14 | |
|
|
|
|
|
|
|
|
|
|
|
|
|
|
|
|
|
| |
| Profit/loss on sale of subsidiary undertakings | 90 | | (358 | ) | (268 | ) | 46 | | 2 | | 48 | | 67 | | – | | 67 | |
|
|
|
|
|
|
|
|
|
|
|
|
|
|
|
|
|
| |
| Less: 2002 provision | – | | 357 | | 357 | | – | | (357 | ) | (357 | ) | – | | – | | – | |
|
|
|
|
|
|
|
|
|
|
|
|
|
|
|
|
|
| |
| Profit/(loss) on sale or termination | – | | (33 | ) | (33 | ) | – | | – | | – | | – | | – | | – | |
| of a business | | | | | | | | | | | | | | | | | | |
|
|
|
|
|
|
|
|
|
|
|
|
|
|
|
|
|
| |
| (Loss)/profit before taxation | (183 | ) | (503 | ) | (686 | ) | (338 | ) | (609 | ) | (947 | ) | 1,408 | | 62 | | 1,470 | |
|
|
|
|
|
|
|
|
|
|
|
|
|
|
|
|
|
| |
Discontinued activities includes the following:
During 2003, Abbey discontinued the business which managed its debt securities portfolios in its Asset Management and Risk Transfer businesses in the Wholesale segment. Total charges and operating losses in 2003 consisted of £(500)m (2002: £(302)m).
On 10 April 2003, Abbey sold First National’s secured and unsecured lending businesses (with the exceptions of the motor finance and litigation funding operations). Total income and operating losses in 2003 consisted of £74m and £(3)m (2002: £232m and £(307)m). These businesses were included within the First National segment.
| 3. | Other interest receivable and similar income |
| | 2003 | | 2002 | | 2001 | |
| £m | £m | £m |
|
|
|
|
|
|
|
| On secured advances | 3,726 | | 3,805 | | 4,260 | |
|
|
|
|
|
|
|
| On unsecured advances | 458 | | 707 | | 666 | |
|
|
|
|
|
|
|
| On wholesale lending | 511 | | 615 | | 638 | |
|
|
|
|
|
|
|
| On finance leases | 142 | | 202 | | 276 | |
|
|
|
|
|
|
|
| On other interest earning assets | | | | | | |
| and investments | 463 | | 547 | | 858 | |
|
|
|
|
|
|
|
| | 5,300 | | 5,876 | | 6,698 | |
|
|
|
|
|
|
|
Interest receivable on secured advances is net of £284m (2002: £401m, 2001: £556m) in respect of the charge for lending-related fees and discounts payable, which are charged against interest income over the period of time in which Abbey has the right to recover the incentives in the event of early redemption and it is normal practice to do so. The movements on such incentives are as follows:
| | | | | | | Group | | | | | | Company | |
|
|
|
|
|
|
|
|
|
|
|
|
|
|
| | | Interest | | | | | | Interest | | | | | |
| rate | Cash- | | rate | Cash- | |
| discounts | backs | Total | discounts | backs | Total |
| £m | £m | £m | £m | £m | £m |
|
|
|
|
|
|
|
|
|
|
|
|
|
|
| At 1 January 2003 | 22 | | 181 | | 203 | | 22 | | 180 | | 202 | |
|
|
|
|
|
|
|
|
|
|
|
|
|
|
| Expenditure incurred in the | | | | | | | | | | | | |
| year | 187 | | 19 | | 206 | | 187 | | 20 | | 207 | |
|
|
|
|
|
|
|
|
|
|
|
|
|
|
| Transfer to profit and loss | | | | | | | | | | | | |
| account | (191 | ) | (93 | ) | (284 | ) | (191 | ) | (93 | ) | (284 | ) |
|
|
|
|
|
|
|
|
|
|
|
|
|
|
| At 31 December 2003 | 18 | | 107 | | 125 | | 18 | | 107 | | 125 | |
|
|
|
|
|
|
|
|
|
|
|
|
|
|
Interest due but not received on loans and advances in arrears has not been recognised in interest receivable where collectability is in doubt, but has been suspended. A table showing the movements on suspended interest is included in note 9.
| Abbey Annual Report and Accounts 2003 | | 123 |
Back to Contents
Financial Statements
Notes to the Financial Statements continued
| | | | | | | | |
| | 2003 | | 2002 | | 2001 | |
| £m | £m | £m |
|
|
|
|
|
|
| |
| On retail customer accounts | 1,648 | | 1,699 | | 2,091 | |
|
|
|
|
|
|
| |
| On sale and repurchase agreements | 30 | | 16 | | 42 | |
|
|
|
|
|
|
| |
| On other deposits and debt securities | | | | | | |
| in issue | 2,078 | | 3,359 | | 5,061 | |
|
|
|
|
|
|
| |
| On subordinated liabilities including | | | | | | |
| convertible debt | 318 | | 365 | | 355 | |
|
|
|
|
|
|
| |
| | | 4,074 | | 5,439 | | 7,549 | |
|
|
|
|
|
|
| |
| | | | | | | | |
| 5. | Dividend income | | | | | | |
| | 2003 | | 2002 | | 2001 | |
| £m | £m | £m |
|
|
|
|
|
|
| |
| Income from equity shares | 1 | | 1 | | 3 | |
|
|
|
|
|
|
| |
| | | | | | | | |
| 6. | Dealing profits | | | | | | |
| | 2003 | | 2002 | | 2001 | |
| £m | £m | £m |
|
|
|
|
|
|
| |
| Securities | 34 | | 12 | | 45 | |
|
|
|
|
|
|
| |
| Interest rate, equity and credit derivatives | 97 | | 88 | | 131 | |
|
|
|
|
|
|
| |
| | | 131 | | 100 | | 176 | |
|
|
|
|
|
|
| |
| | | | | | | | |
| 7. | Other operating (expenses)/income | | | | | | |
| | 2003 | | 2002 | | 2001 | |
| £m | £m | £m |
|
|
|
|
|
|
| |
| Fee income from high LTV lending | | | | | | |
| (see note 35) | 45 | | 85 | | 100 | |
|
|
|
|
|
|
| |
| Profit/(loss) on disposal | | | | | | |
| of investment securities | (474 | ) | (88 | ) | 5 | |
|
|
|
|
|
|
| |
| Profit/(loss)on disposal of equity shares | (34) | | 34 | | 46 | |
|
|
|
|
|
|
| |
| Profit/(loss)on disposal of fixed assets | 2 | | 3 | | 6 | |
|
|
|
|
|
|
| |
| Income from operating leases | 325 | | 400 | | 441 | |
|
|
|
|
|
|
| |
| Other | (29 | ) | 76 | | 109 | |
|
|
|
|
|
|
| |
| | | (165 | ) | 510 | | 707 | |
|
|
|
|
|
|
| |
| | | | | | | | |
| 8. | Administrative expenses | | | | | | |
| | | | 2002 | | | |
| 2003 | | (restated) | 2001 |
| £m | £m | £m |
|
|
|
|
|
|
| |
| Staff costs(1): | | | | | | |
|
|
|
|
|
|
| |
| Wages and salaries | 782 | | 769 | | 682 | |
|
|
|
|
|
|
| |
| Social security costs | 64 | | 62 | | 58 | |
|
|
|
|
|
|
| |
| Other pension costs | 128 | | 101 | | 75 | |
|
|
|
|
|
|
| |
| | | 974 | | 932 | | 815 | |
|
|
|
|
|
|
| |
| Property and equipment expenses: | | | | | | |
|
|
|
|
|
|
| |
| Rents payable | 115 | | 121 | | 108 | |
|
|
|
|
|
|
| |
| Rates payable | 28 | | 28 | | 23 | |
|
|
|
|
|
|
| |
| Hire of equipment | 3 | | 4 | | 4 | |
|
|
|
|
|
|
| |
| Other property and equipment expenses | 75 | | 63 | | 46 | |
|
|
|
|
|
|
| |
| | | 221 | | 216 | | 181 | |
|
|
|
|
|
|
| |
| Other administrative expenses | 819 | | 704 | | 713 | |
|
|
|
|
|
|
| |
| | | 2,014 | | 1,852 | | 1,709 | |
|
|
|
|
|
|
| |
| | | | | | | | |
| (1) | Excludes the following staff costs incurred by the Life Assurance businesses, which are charged to Income from Long Term Assurance business: |
| | 2003 | | 2002 | | 2001 | |
| £m | £m | £m |
|
|
|
|
|
| |
| Staff costs: | | | | | | |
|
|
|
|
|
| |
| Wages and salaries | 89 | | 82 | | 66 | |
|
|
|
|
|
| |
| Social security costs | 6 | | 6 | | 5 | |
|
|
|
|
|
| |
| Other pension costs | 13 | | 10 | | 8 | |
|
|
|
|
|
| |
| | 108 | | 98 | | 79 | |
|
|
|
|
|
| |
The aggregate remuneration for audit and other services payable to the auditors is analysed below:
| | 2003 | | 2002 | |
| £m | £m |
|
|
|
|
| |
| Audit services | | | | |
|
|
|
|
| |
| – | statutory audit | 4.1 | | 4.2 | |
|
|
|
|
| |
| – | audit related regulatory reporting | 0.9 | | 0.9 | |
|
|
|
|
| |
| | | 5.0 | | 5.1 | |
|
|
|
|
| |
| Further assurance services | 1.3 | | 0.9 | |
|
|
|
|
| |
| Tax services | | | | |
|
|
|
|
| |
| – | compliance services | 0.1 | | 0.1 | |
|
|
|
|
| |
| – | advisory services | 0.1 | | – | |
|
|
|
|
| |
| | | 1.5 | | 1.0 | |
|
|
|
|
| |
| Other services | | | | |
|
|
|
| |
| – | financial information technology | – | | 0.3 | |
|
|
|
|
| |
| – | other services | 3.5 | | 3.5 | |
|
|
|
|
| |
| | | 3.5 | | 3.8 | |
|
|
|
|
| |
| | | 10.0 | | 9.9 | |
|
|
|
|
| |
| % Non-Audit: Audit Services | 100 | | 94 | |
|
|
|
|
| |
No internal audit, valuation, litigation or recruitment services were provided by the external auditors during these years.
Further assurance relates primarily to advice on accounting matters and accords with the definition of “audit related fees” per Securities Exchange Commission guidance.
Tax services relate principally to advice on Abbey’s tax affairs.
The other service expenditure of £3.5m in 2003 primarily relates to consulting services, which were subject to pre-approval by the Audit & Risk Committee. The bulk of the expenditure was in connection with a Cost Reduction Review, Implementation of new telecoms networks, and Activity-Based Costing approaches. These services provided by the external auditors, are not considered to give rise to a self interest threat.
The pre-approval of services provided by the external auditors is explained on page 97.
The audit fees for the Canjam and Fullbeck entities, amounting to £0.1m, in 2003, have been excluded from the above analysis as these entities are not consolidated.
Included within the remuneration for audit services is the audit fee for Abbey National plc of £0.9m (2002: £0.9m).
Of the fees payable to the Group’s auditors for audit services, £3.7m (2002: £3.8m; 2001: £3.8m) related to the United Kingdom.
| 124 | | Abbey Annual Report and Accounts 2003 |
Back to Contents
Financial Statements
Notes to the Financial Statements continued
| 9. | Provisions for bad and doubtful debts |
| Group | On advances | | | | | | | | | |
| secured on | On other | On | On | |
| residential | secured | unsecured | wholesale | |
| properties | advances | advances | advances | Total |
| £m | £m | £m | £m | £m |
|
|
|
|
|
|
|
|
|
| |
| At 1 January 2003 | | | | | | | | | | |
|
|
|
|
|
|
|
|
|
| |
| General | 174 | | 23 | | 35 | | 56 | | 288 | |
|
|
|
|
|
|
|
|
|
| |
| Specific | 50 | | 76 | | 128 | | 204 | | 458 | |
|
|
|
|
|
|
|
|
|
| |
| Disposals of subsidiary undertakings | (20 | ) | (13 | ) | (61 | ) | – | | (94 | ) |
|
|
|
|
|
|
|
|
|
| |
| Exchange adjustments | 3 | | 3 | | – | | – | | 6 | |
|
|
|
|
|
|
|
|
|
| |
| Transfer from profit and loss account | 17 | | 90 | | 214 | | 153 | | 474 | |
|
|
|
|
|
|
|
|
|
| |
| Irrecoverable amounts written off | (26 | ) | (55 | ) | (148 | ) | (80 | ) | (309 | ) |
|
|
|
|
|
|
|
|
|
| |
| Recoveries | 4 | | – | | 38 | | – | | 42 | |
|
|
|
|
|
|
|
|
|
| |
| At 31 December 2003 | 202 | | 124 | | 206 | | 333 | | 865 | |
|
|
|
|
|
|
|
|
|
| |
| Being for the Group: | | | | | | | | | | |
|
|
|
|
|
|
|
|
|
| |
| General | 177 | | 61 | | 32 | | 172 | | 442 | |
|
|
|
|
|
|
|
|
|
| |
| Specific | 25 | | 63 | | 174 | | 161 | | 423 | |
|
|
|
|
|
|
|
|
|
| |
| At 1 January 2002 | | | | | | | | | | |
|
|
|
|
|
|
|
|
|
| |
| General | 150 | | 22 | | 36 | | – | | 208 | |
|
|
|
|
|
|
|
|
|
| |
| Specific | 62 | | 72 | | 156 | | – | | 290 | |
|
|
|
|
|
|
|
|
|
| |
| Acquisition of subsidiary undertakings | 6 | | 1 | | 1 | | – | | 8 | |
|
|
|
|
|
|
|
|
|
| |
| Disposal of subsidiary undertakings | – | | – | | (1 | ) | – | | (1 | ) |
|
|
|
|
|
|
|
|
|
| |
| Transfer from investment security provisions | – | | – | | – | | 16 | | 16 | |
|
|
|
|
|
|
|
|
|
| |
| Exchange adjustments | 1 | | 2 | | – | | (3 | ) | – | |
|
|
|
|
|
|
|
|
|
| |
| Transfer from profit and loss account | 23 | | 26 | | 218 | | 247 | | 514 | |
|
|
|
|
|
|
|
|
|
| |
| Irrecoverable amounts written off | (27 | ) | (33 | ) | (336 | ) | – | | (396 | ) |
|
|
|
|
|
|
|
|
|
| |
| Recoveries | 9 | | 9 | | 89 | | – | | 107 | |
|
|
|
|
|
|
|
|
|
| |
| At 31 December 2002 | 224 | | 99 | | 163 | | 260 | | 746 | |
|
|
|
|
|
|
|
|
|
| |
| Being for the Group: | | | | | | | | | | |
|
|
|
|
|
|
|
|
|
| |
| General | 174 | | 23 | | 35 | | 56 | | 288 | |
|
|
|
|
|
|
|
|
|
| |
| Specific | 50 | | 76 | | 128 | | 204 | | 458 | |
|
|
|
|
|
|
|
|
|
| |
| At 1 January 2001 | | | | | | | | | | |
|
|
|
|
|
|
|
|
|
| |
| General | 142 | | 20 | | 32 | | – | | 194 | |
|
|
|
|
|
|
|
|
|
| |
| Specific | 61 | | 98 | | 174 | | – | | 333 | |
|
|
|
|
|
|
|
|
|
| |
| Exchange adjustments | – | | (1 | ) | – | | – | | (1 | ) |
|
|
|
|
|
|
|
|
|
| |
| Transfer from profit and loss account | 42 | | 23 | | 198 | | – | | 263 | |
|
|
|
|
|
|
|
|
|
| |
| Irrecoverable amounts written off | (42 | ) | (54 | ) | (297 | ) | – | | (393 | ) |
|
|
|
|
|
|
|
|
|
| |
| Recoveries | 9 | | 8 | | 85 | | – | | 102 | |
|
|
|
|
|
|
|
|
|
| |
| At 31 December 2001 | 212 | | 94 | | 192 | | – | | 498 | |
|
|
|
|
|
|
|
|
|
| |
| Being for the Group: | | | | | | | | | | |
|
|
|
|
|
|
|
|
|
| |
| General | 150 | | 22 | | 36 | | – | | 208 | |
|
|
|
|
|
|
|
|
|
| |
| Specific | 62 | | 72 | | 156 | | – | | 290 | |
|
|
|
|
|
|
|
|
|
| |
| Abbey Annual Report and Accounts 2003 | | 125 |
Back to Contents
Financial Statements
Notes to the Financial Statements continued
| | On advances | | | | | | | | | |
| | secured on | | On other | | On | | On | | | |
| | residential | | secured | | unsecured | | wholesale | | | |
| Company | properties | | advances | | advances | | advances | | Total | |
| £m | | £m | | £m | | £m | | £m | |
|
|
|
|
|
|
|
|
|
| |
| At 31 December 2003 | | | | | | | | | | |
|
|
|
|
|
|
|
|
|
| |
| General | 142 | | 3 | | 32 | | – | | 177 | |
|
|
|
|
|
|
|
|
|
| |
| Specific | 5 | | 8 | | 87 | | – | | 100 | |
|
|
|
|
|
|
|
|
|
| |
| At 31 December 2002 | | | | | | | | | | |
|
|
|
|
|
|
|
|
|
| |
| General | 119 | | – | | 24 | | – | | 143 | |
|
|
|
|
|
|
|
|
|
| |
| Specific | 11 | | 6 | | 76 | | – | | 93 | |
|
|
|
|
|
|
|
|
|
| |
| At 31 December 2001 | | | | | | | | | | |
|
|
|
|
|
|
|
|
|
| |
| General | 97 | | – | | 17 | | – | | 114 | |
|
|
|
|
|
|
|
|
|
| |
| Specific | 20 | | 1 | | 96 | | – | | 117 | |
|
|
|
|
|
|
|
|
|
| |
| Total Group provisions at: | | | | | | | | | | |
|
|
|
|
|
|
|
|
|
| |
| At 31 December 2003 | | | | | | | | | | |
|
|
|
|
|
|
|
|
|
| |
| UK | 173 | | 96 | | 202 | | 333 | | 804 | |
|
|
|
|
|
|
|
|
|
| |
| Non-UK | 29 | | 28 | | 4 | | – | | 61 | |
|
|
|
|
|
|
|
|
|
| |
| At 31 December 2002 | | | | | | | | | | |
|
|
|
|
|
|
|
|
|
| |
| UK | 189 | | 61 | | 156 | | 260 | | 666 | |
|
|
|
|
|
|
|
|
|
| |
| Non-UK | 35 | | 38 | | 7 | | – | | 80 | |
|
|
|
|
|
|
|
|
|
| |
| At 31 December 2001 | | | | | | | | | | |
|
|
|
|
|
|
|
|
|
| |
| UK | 191 | | 63 | | 187 | | – | | 441 | |
|
|
|
|
|
|
|
|
|
| |
| Non-UK | 21 | | 31 | | 5 | | – | | 57 | |
|
|
|
|
|
|
|
|
|
| |
| | | | | | | | | | | |
| Capital provisions as a percentage of loans and advances to customers: | |
| | | | | | | | | | | |
| | On advances | | | | | | | | | |
| | secured on | | On other | | On | | On | | | |
| | residential | | secured | | unsecured | | wholesale | | | |
| Group | properties | | advances | | advances | | advances | | Total | |
| % | | % | | % | | % | | % | |
|
|
|
|
|
|
|
|
|
| |
| At 31 December 2003 | | | | | | | | | | |
|
|
|
|
|
|
|
|
|
| |
| UK | 0.3 | | 3.4 | | 4.2 | | 13.4 | | 1.0 | |
|
|
|
|
|
|
|
|
|
| |
| Non-UK | 1.6 | | 58.5 | | 2.7 | | – | | 3.1 | |
|
|
|
|
|
|
|
|
|
| |
| At 31 December 2002 | | | | | | | | | | |
|
|
|
|
|
|
|
|
|
| |
| UK | 0.3 | | 1.6 | | 2.3 | | 3.0 | | 0.8 | |
|
|
|
|
|
|
|
|
|
| |
| Non-UK | 1.1 | | 59.9 | | 5.9 | | – | | 2.4 | |
|
|
|
|
|
|
|
|
|
| |
| At 31 December 2001 | | | | | | | | | | |
|
|
|
|
|
|
|
|
|
| |
| UK | 0.3 | | 2.0 | | 2.8 | | – | | 0.6 | |
|
|
|
|
|
|
|
|
|
| |
| Non-UK | 1.0 | | 53.9 | | 5.2 | | – | | 2.5 | |
|
|
|
|
|
|
|
|
|
| |
| Company | | | | | | | | | | |
|
|
|
|
|
|
|
|
|
| |
| At 31 December 2003 | 0.2 | | 0.8 | | 3.7 | | – | | 0.4 | |
|
|
|
|
|
|
|
|
|
| |
| At 31 December 2002 | 0.2 | | 0.6 | | 3.5 | | – | | 0.4 | |
|
|
|
|
|
|
|
|
|
| |
| At 31 December 2001 | 0.2 | | 1.0 | | 4.9 | | – | | 0.4 | |
|
|
|
|
|
|
|
|
|
| |
| 126 | Abbey Annual Report and Accounts 2003 |
Back to Contents
Financial Statements
Notes to the Financial Statements continued
Analysis of movements on suspended interest:
| Group | On advances secured on residential properties | | On other secured advances | | On unsecured advances | | Total | |
| £m | | £m | | £m | | £m | |
|
|
|
|
|
|
|
| |
| At 1 January 2003 | 31 | | 37 | | 8 | | 76 | |
|
|
|
|
|
|
|
| |
| Disposal of subsidiary | | | | | | | | |
| undertakings | (12 | ) | – | | (3 | ) | (15 | ) |
|
|
|
|
|
|
|
| |
| Exchange adjustments | 2 | | 2 | | – | | 4 | |
|
|
|
|
|
|
|
| |
| Amounts suspended in | | | | | | | | |
| the period | 2 | | 2 | | 5 | | 9 | |
|
|
|
|
|
|
|
| |
| Irrecoverable amounts | | | | | | | | |
| written off | (9 | ) | (9 | ) | (6 | ) | (24 | ) |
|
|
|
|
|
|
|
| |
| At 31 December 2003 | 14 | | 32 | | 4 | | 50 | |
|
|
|
|
|
|
|
| |
| At 1 January 2002 | 39 | | 47 | | 10 | | 96 | |
|
|
|
|
|
|
|
| |
| Exchange adjustments | 2 | | 3 | | – | | 5 | |
|
|
|
|
|
|
|
| |
| Acquisitions of | | | | | | | | |
| subsidiary undertakings | 3 | | – | | – | | 3 | |
|
|
|
|
|
|
|
| |
| Amounts suspended | | | | | | | | |
| in the period | – | | 2 | | 8 | | 10 | |
|
|
|
|
|
|
|
| |
| Irrecoverable amounts | | | | | | | | |
| written off | (13 | ) | (15 | ) | (10 | ) | (38 | ) |
|
|
|
|
|
|
|
| |
| At 31 December 2002 | 31 | | 37 | | 8 | | 76 | |
|
|
|
|
|
|
|
| |
| At 1 January 2001 | 36 | | 54 | | 10 | | 100 | |
|
|
|
|
|
|
|
| |
| Amounts suspended | | | | | | | | |
| in the period | 17 | | (5 | ) | 10 | | 22 | |
|
|
|
|
|
|
|
| |
| Irrecoverable amounts | | | | | | | | |
| written off | (14 | ) | (2 | ) | (10 | ) | (26 | ) |
|
|
|
|
|
|
|
| |
| At 31 December 2001 | 39 | | 47 | | 10 | | 96 | |
|
|
|
|
|
|
|
| |
| | | | | | | | | |
| Company | | | | | | | | |
|
|
|
|
|
|
|
| |
| At 31 December 2003 | 1 | | 2 | | 3 | | 6 | |
|
|
|
|
|
|
|
| |
| At 31 December 2002 | 13 | | 2 | | 4 | | 19 | |
|
|
|
|
|
|
|
| |
| At 31 December 2001 | 16 | | 1 | | 6 | | 23 | |
|
|
|
|
|
|
|
| |
| | | | | | | | | |
| The value of loans and advances on which interest has been suspended is as follows: | |
| | | | | | | | | |
| Group | On advances secured on residentia lproperties | | On other secured advances | | On unsecured advances | | Total | |
| £m | | £m | | £m | | £m | |
|
|
|
|
|
|
|
| |
| At 31 December 2003 | | | | | | | | |
|
|
|
|
|
|
|
| |
| Loans and advances | | | | | | | | |
| to customers | 90 | | 117 | | 111 | | 318 | |
|
|
|
|
|
|
|
| |
| Provisions on these amounts | (21 | ) | (27 | ) | (72 | ) | (120 | ) |
|
|
|
|
|
|
|
| |
| At 31 December 2002 | | | | | | | | |
|
|
|
|
|
|
|
| |
| Loans and advances | | | | | | | | |
| to customers | 228 | | 146 | | 229 | | 603 | |
|
|
|
|
|
|
|
| |
| Provisions on these amounts | (54 | ) | (60 | ) | (118 | ) | (232 | ) |
|
|
|
|
|
|
|
| |
| Company | | | | | | | | |
|
|
|
|
|
|
|
| |
| At 31 December 2003 | | | | | | | | |
|
|
|
|
|
|
|
| |
| Loans and advances | | | | | | | | |
| to customers | 38 | | 6 | | 95 | | 139 | |
|
|
|
|
|
|
|
| |
| Provisions on these amounts | (4 | ) | (1 | ) | (69 | ) | (74 | ) |
|
|
|
|
|
|
|
| |
| At 31 December 2002 | | | | | | | | |
|
|
|
|
|
|
|
| |
| Loans and advances | | | | | | | | |
| to customers | 100 | | 2 | | 90 | | 192 | |
|
|
|
|
|
|
|
| |
| Provisions on these amounts | (7 | ) | – | | (63 | ) | (70 | ) |
|
|
|
|
|
|
|
| |
Analysis of Group non-performing loans and advances
The following table presents loans and advances which are classified as ‘non-performing’. No interest is suspended or provisions made in respect of such cases where the Group does not expect to incur losses.
| | 2003 | | 2002 | | 2001 | |
| | £m | | £m | | £m | |
|
|
|
|
|
| |
| Loans and advances on which a | | | | | | |
| proportion of interest has been | | | | | | |
| suspended and/or on which specific | | | | | | |
| provision has been made | 1,632 | | 669 | | 848 | |
|
|
|
|
|
| |
| | | | | | | |
| Loans and advances 90 days overdue | | | | | | |
| on which no interest has been | | | | | | |
| suspended and on which no specific | | | | | | |
| provision has been made | 1,114 | | 1,386 | | 917 | |
|
|
|
|
|
| |
| | | | | | | |
| Non-accruing loans and advances | 30 | | 22 | | 28 | |
|
|
|
|
|
| |
| | 2,776 | | 2,077 | | 1,793 | |
|
|
|
|
|
| |
| Non-performing loans and advances | | | | | | |
| as a percentage of total loans | | | | | | |
| and advances to customers | 3.25 | % | 2.36 | % | 2.22 | % |
|
|
|
|
|
| |
| Provisions as a percentage of total | | | | | | |
| non-performing loans and advances | 31.14 | % | 35.95 | % | 27.76 | % |
|
|
|
|
|
| |
| | | | | | | |
| 10. Tax on (loss)/profit on ordinary activities | |
| The charge or credit for taxation comprises: | | | | | |
| | | | | | | |
| | 2003 | | 2002 | | 2001 | |
| | £m | | £m | | £m | |
|
|
|
|
|
| |
| UK Corporation tax: | | | | | | |
|
|
|
|
|
| |
| Current year | 57 | | 252 | | 401 | |
|
|
|
|
|
| |
| Prior years | (112 | ) | (31 | ) | (1 | ) |
|
|
|
|
|
| |
| Double tax relief | (7 | ) | – | | (3 | ) |
|
|
|
|
|
| |
| Share of associated undertakings taxation | 5 | | 5 | | 4 | |
|
|
|
|
|
| |
| Overseas taxation | 11 | | 8 | | 10 | |
|
|
|
|
|
| |
| Total current tax (credit)/charge | (46 | ) | 234 | | 411 | |
|
|
|
|
|
| |
| Deferred tax: | | | | | | |
|
|
|
|
|
| |
| Timing differences, origination and reversal | 4 | | (82 | ) | 53 | |
|
|
|
|
|
| |
| | (42 | ) | 152 | | 464 | |
|
|
|
|
|
| |
| | | | | | | |
| Factors affecting the charge for taxation for the year: | |
| | | | | | | |
| | 2003 | | 2002 | | 2001 | |
| | £m | | £m | | £m | |
|
|
|
|
|
| |
| (Loss)/profit on ordinary | | | | | | |
| activities before tax | (686 | ) | (947 | ) | 1,470 | |
|
|
|
|
|
| |
| Taxation at UK corporation tax rate | | | | | | |
| of 30% of (2002: 30%, 2001: 30%) | (206 | ) | (284 | ) | 441 | |
|
|
|
|
|
| |
| Effect of non-allowable provisions | | | | | | |
| and other non-equalised items | 218 | | 38 | | 8 | |
|
|
|
|
|
| |
| Impairment of goodwill | 11 | | 360 | | 10 | |
|
|
|
|
|
| |
| Capital allowances for the period | | | | | | |
| in excess of depreciation | (61 | ) | 42 | | (46 | ) |
|
|
|
|
|
| |
| Provisions and short term | | | | | | |
| timing differences | 98 | | 74 | | 2 | |
|
|
|
|
|
| |
| Effect of non-UK profits and losses | 6 | | 36 | | (1 | ) |
|
|
|
|
|
| |
| Adjustment to prior year provisions | (112 | ) | (31 | ) | (1 | ) |
|
|
|
|
|
| |
| Effect of loss utilisation | – | | (1 | ) | (2 | ) |
|
|
|
|
|
| |
| Current tax charge for the year | (46 | ) | 234 | | 411 | |
|
|
|
|
|
| |
| Abbey Annual Report and Accounts 2003 | 127 |
Back to Contents
Financial Statements
Notes to the Financial Statements continued
Factors that may affect future period’s tax charges:
Future profits in offshore subsidiaries where rates of tax are lower than the standard UK corporation tax rate will continue to reduce the Group tax charges. However any dividends received from these offshore subsidiaries will increase future Group tax charges.
Future profits or losses on the sale of trading subsidiaries should not be subject to taxation in the UK under the substantial shareholding exemption and this will have a corresponding impact on the future Group tax charges.
Any future non-allowable provisions and other non-equalised items will increase the future Group tax charges.
11. Loss/profit on ordinary activities after tax
The loss after tax of the Company attributable to the shareholders is £167m (2002: loss £497m ; 2001: profit £1,348m). As permitted by Section 230 of the Companies Act 1985, the Company’s profit and loss account has not been presented in these financial statements. Certain US required disclosure relating to the Company is shown in Consolidating financial information (see note 65).
| 12. Dividends | | | | | | | | | | | | |
| | 2003 | | 2002 | | 2001 | | | | | | | |
| | Pence | | Pence | | Pence | | | | | | | |
| | per | | per | | per | | 2003 | | 2002 | | 2001 | |
| | share | | share | | share | | £m | | £m | | £m | |
|
|
|
|
|
|
|
|
|
|
|
| |
| Ordinary shares | | | | | | | | | | | | |
| (equity): | | | | | | | | | | | | |
|
|
|
|
|
|
|
|
|
|
|
| |
| Interim (paid) | 8.33 | | 17.65 | | 16.80 | | 120 | | 255 | | 242 | |
|
|
|
|
|
|
|
|
|
|
|
| |
| Final (proposed) | 16.67 | | 7.35 | | 33.20 | | 244 | | 107 | | 478 | |
|
|
|
|
|
|
|
|
|
|
|
| |
| | 25.00 | | 25.00 | | 50.00 | | 364 | | 362 | | 720 | |
|
|
|
|
|
|
|
|
|
|
|
| |
| Preference shares | | | | | | | | | | | | |
| (non-equity) | | | | | | | 60 | | 62 | | 42 | |
|
|
|
|
|
|
|
|
|
|
|
| |
| | | | | | | | 424 | | 424 | | 762 | |
|
|
|
|
|
|
|
|
|
|
|
| |
| | | | | | | |
| 13. (Loss) /Earnings per ordinary share | | | | | |
| | 2003 | | 2002 | | 2001 | |
|
|
|
|
|
| |
| (Loss)/profit attributable to the | | | | | | |
| shareholders of Abbey National plc (£m) | (699 | ) | (1,161 | ) | 947 | |
|
|
|
|
|
| |
| Preference dividends (£m) | (60 | ) | (62 | ) | (42 | ) |
|
|
|
|
|
| |
| (Loss)/profit attributable to the ordinary | | | | | | |
| shareholders of Abbey National plc (£m) | (759 | ) | (1,223 | ) | 905 | |
|
|
|
|
|
| |
| Weighted average number of ordinary | |
| shares in issue during the year – | | | | | | |
| basic (million) | 1,448 | | 1,442 | | 1,431 | |
|
|
|
|
|
| |
| Dilutive effect of share options | | | | | | |
| outstanding (million) | 9 | | 8 | | 11 | |
|
|
|
|
|
| |
| Weighted average number of ordinary | | | | | | |
| shares in issue during the year – | | | | | | |
| diluted (million) | 1,457 | | 1,450 | | 1,442 | |
|
|
|
|
|
| |
| Basic (loss)/earnings per ordinary | | | | | | |
| share (pence) | (52.4 | )p | (84.8 | )p | 63.2 | p |
|
|
|
|
|
| |
| Diluted (loss)/earnings per ordinary | | | | | | |
| share (pence) | (52.4 | )p | (84.3 | )p | 62.8 | p |
|
|
|
|
|
| |
In accordance with UITF 13, "Accounting for ESOP Trusts", shares held in trust in respect of certain incentive schemes have been excluded from the calculation of earnings per ordinary share as the trustees have waived dividend and voting rights.
| 14. Treasury bills and other eligible bills | | | |
| | | | | | | | Group | |
|
|
|
|
|
|
|
| |
| | 2003 | | 2003 | | 2002 | | 2002 | |
| | Book | | Market | | Book | | Market | |
| | value | | value | | value | | value | |
| | £m | | £m | | £m | | £m | |
|
|
|
|
|
|
|
| |
| Treasury bills | 1,560 | | 1,560 | | 1,159 | | 1,159 | |
|
|
|
|
|
|
|
| |
| Other eligible bills | 71 | | 71 | | 324 | | 324 | |
|
|
|
|
|
|
|
| |
| | 1,631 | | 1,631 | | 1,483 | | 1,483 | |
|
|
|
|
|
|
|
| |
| | | | | | | | | |
| Treasury bills and other eligible bills are held for trading and liquidity | | | |
| management purposes. | | | | | | | | |
| | | | | | | | | |
| 15. Loans and advances to banks | |
| | | | Group | | | | Company | |
|
|
|
|
|
|
|
| |
| | 2003 | | 2002 | | 2003 | | 2002 | |
| | £m | | £m | | £m | | £m | |
|
|
|
|
|
|
|
| |
| Items in the course | | | | | | | | |
| of collection | 171 | | 176 | | 164 | | 167 | |
|
|
|
|
|
|
|
| |
| Amounts due from | | | | | | | | |
| subsidiaries | – | | – | | 3,925 | | 4,411 | |
|
|
|
|
|
|
|
| |
| Purchase and resale | | | | | | | | |
| agreements | 5,034 | | 3,461 | | – | | – | |
|
|
|
|
|
|
|
| |
| Other loans and advances | 1,950 | | 2,964 | | 129 | | 138 | |
|
|
|
|
|
|
|
| |
| | 7,155 | | 6,601 | | 4,218 | | 4,716 | |
|
|
|
|
|
|
|
| |
| Repayable: | | | | | | | | |
|
|
|
|
|
|
|
| |
| On demand | 3,089 | | 2,703 | | 142 | | 476 | |
|
|
|
|
|
|
|
| |
| In not more than 3 months | 4,022 | | 3,319 | | 232 | | 167 | |
|
|
|
|
|
|
|
| |
| In more than 3 months but | | | | | | | | |
| not more than 1 year | 11 | | 440 | | 546 | | 261 | |
|
|
|
|
|
|
|
| |
| In more than 1 year but | | | | | | | | |
| not more than 5 years | 33 | | 132 | | 1,337 | | 871 | |
|
|
|
|
|
|
|
| |
| In more than 5 years | – | | 7 | | 1,961 | | 2,941 | |
|
|
|
|
|
|
|
| |
| | 7,155 | | 6,601 | | 4,218 | | 4,716 | |
|
|
|
|
|
|
|
| |
| Banking business | 1,031 | | 3,127 | | 4,218 | | 4,716 | |
|
|
|
|
|
|
|
| |
| Trading business | 6,124 | | 3,474 | | – | | – | |
|
|
|
|
|
|
|
| |
| | 7,155 | | 6,601 | | 4,218 | | 4,716 | |
|
|
|
|
|
|
|
| |
Included within Other loans and advances is £695m (2002: £811m) held by the securitisation companies that has been accumulated to redeem securities issued by the securitisation companies (see note 17).
Fair value disclosures, are included in note 64, Fair values of financial instruments.
The loans and advances to banks in the above table have the following interest rate structures:
| | | | Group | | | | Company | |
|
|
|
|
|
|
|
| |
| | 2003 | | 2002 | | 2003 | | 2002 | |
| | £m | | £m | | £m | | £m | |
|
|
|
|
|
|
|
| |
| Fixed rate | 5,225 | | 3,863 | | 115 | | 135 | |
|
|
|
|
|
|
|
| |
| Variable rate | 1,754 | | 2,562 | | 3,939 | | 4,414 | |
|
|
|
|
|
|
|
| |
| Items in the course | | | | | | | | |
| of collection | | | | | | | | |
| (non-interest bearing) | 176 | | 176 | | 164 | | 167 | |
|
|
|
|
|
|
|
| |
| | 7,155 | | 6,601 | | 4,218 | | 4,716 | |
|
|
|
|
|
|
|
| |
The Group’s policy is to hedge fixed rate loans and advances to banks to floating rates using derivative instruments, or by matching with other on-balance sheet interest rate exposures. See note 51, Derivatives – Non-trading derivatives, for further information.
| 128 | Abbey Annual Report and Accounts 2003 |
Back to Contents
Financial Statements
Notes to the Financial Statements continued
16. Loans and advances to customers
| | Group | | Company | |
|
|
|
|
|
|
|
| |
| | 2003 | | 2002 | | 2003 | | 2002 | |
| | £m | | £m | | £m | | £m | |
|
|
|
|
|
|
|
| |
| Advances secured on residential properties | 75,014 | | 68,929 | | 71,208 | | 63,224 | |
|
|
|
|
|
|
|
| |
| Purchase and resale agreements | 9,372 | | 3,100 | | – | | – | |
|
|
|
|
|
|
|
| |
| Other secured advances | 2,849 | | 3,479 | | 1,300 | | 956 | |
|
|
|
|
|
|
|
| |
| Unsecured advances | 4,441 | | 6,111 | | 2,797 | | 2,529 | |
|
|
|
|
|
|
|
| |
| Wholesale lending | 2,115 | | 8,674 | | – | | – | |
|
|
|
|
|
|
|
| |
| Collateralised and guaranteed mortgage loans | 48 | | 130 | | – | | – | |
|
|
|
|
|
|
|
| |
| Amounts due from subsidiaries | – | | – | | 765 | | 2,463 | |
|
|
|
|
|
|
|
| |
| | 93,839 | | 90,423 | | 76,070 | | 69,172 | |
|
|
|
|
|
|
|
| |
| Repayable: | | | | | | | | |
|
|
|
|
|
|
|
| |
| On demand or at short notice | 10,844 | | 4,747 | | 1,648 | | 1,876 | |
|
|
|
|
|
|
|
| |
| In not more than 3 months | 3,971 | | 8,318 | | 946 | | 762 | |
|
|
|
|
|
|
|
| |
| In more than 3 months but not more than 1 year | 4,513 | | 4,003 | | 2,083 | | 1,504 | |
|
|
|
|
|
|
|
| |
| In more than 1 year but not more than 5 years | 12,899 | | 13,044 | | 10,720 | | 7,525 | |
|
|
|
|
|
|
|
| |
| In more than 5 years | 62,477 | | 61,057 | | 60,950 | | 57,741 | |
|
|
|
|
|
|
|
| |
| Less: provisions (see note 9) | (865 | ) | (746 | ) | (277 | ) | (236 | ) |
|
|
|
|
|
|
|
| |
| | 93,839 | | 90,423 | | 76,070 | | 69,172 | |
|
|
|
|
|
|
|
| |
| Banking business | 84,234 | | 87,134 | | 76,070 | | 69,172 | |
|
|
|
|
|
|
|
| |
| Trading business | 9,605 | | 3,289 | | – | | – | |
|
|
|
|
|
|
|
| |
| | 93,839 | | 90,423 | | 76,070 | | 69,172 | |
|
|
|
|
|
|
|
| |
Purchase and resale agreements have been restated from £3,585m to £3,100m due to Abbey adopting value date accounting for purchase and resale agreements with non standard settlement.
Included within Group unsecured advances are two contingent loans owed by the with-profit sub funds of the Long Term Business funds of Scottish Mutual Assurance plc and Scottish Provident Limited to Abbey National Scottish Mutual Assurance Holdings Limited of £571m and £623m respectively. These loans include accrued interest of £75m and £80m and are subject to provisions of £76m and £4m, respectively. See note 21, Long Term Assurance business, for further information.
Fair value disclosures, to the extent practicable, are included in note 64, Fair values of financial instruments.
The loans and advances to customers included in the above table have the following interest rate structures:
| | Group | | Company | |
|
|
|
|
|
|
|
| |
| | 2003 | | 2002 | | 2003 | | 2002 | |
| | £m | | £m | | £m | | £m | |
|
|
|
|
|
|
|
| |
| Fixed rate | 30,877 | | 25,539 | | 16,590 | | 13,584 | |
|
|
|
|
|
|
|
| |
| Variable rate | 63,827 | | 65,630 | | 59,757 | | 55,824 | |
|
|
|
|
|
|
|
| |
| Provisions | (865 | ) | (746 | ) | (277 | ) | (236 | ) |
|
|
|
|
|
|
|
| |
| | 93,839 | | 90,423 | | 76,070 | | 69,172 | |
|
|
|
|
|
|
|
| |
The 2002 interest rate structure table has been restated from £26,024m to £25,539m due to Abbey adopting value date accounting for purchase and resale agreements with non standard settlement. The Group’s policy is to hedge fixed rate loans and advances to customers to floating rates using derivative instruments, or by matching with other on-balance sheet interest rate exposures. See note 51, Derivatives – Non-trading derivatives for further information.
17. Loans and advances to customers subject to securitisation
Loans and advances to customers include portfolios of residential mortgage loans which are subject to non-recourse finance arrangements. These loans have been purchased by, or assigned to, special purpose securitisation companies (“Securitisation Companies”), and have been funded primarily through the issue of mortgage-backed securities (“Securities”). No gain or loss has been recognised as a result of these sales. These Securitisation Companies are consolidated and included in the Group financial statements as quasi-subsidiaries.
Abbey National plc and its subsidiaries are under no obligation to support any losses that may be incurred by the Securitisation Companies or holders of the Securities except as described below, and do not intend to provide such further support. Carfax Insurance Limited, a wholly owned subsidiary of Abbey National plc, provides mortgage indemnity guarantee insurance to Abbey National plc. Abbey National plc has assigned its interest under each mortgage indemnity guarantee policy to the Securitisation Companies, to the extent that it relates to loans comprised in the current portfolio. Since 1 January 2002 Abbey National plc has not taken out mortgage indemnity guarantee insurance in relation to new mortgage loans. Existing cover remains in force. Holders of the Securities are only entitled to obtain payment of principal and interest to the extent that the resources of the Securitisation Companies are sufficient to support such payments, and the holders of the Securities have agreed in writing not to seek recourse in any other form.
Abbey National plc receives payments from the Securitisation Companies in respect of fees for administering the loans, and payment of deferred consideration for the sale of the loans. In addition, Abbey National plc has made interest bearing subordinated loans to Holmes Financing (No.3) plc, Holmes Financing (No.4) plc, Holmes Financing (No.5) plc and Holmes Financing (No.6) plc. In addition on the 15 January 2003 subordinated loans to Holmes Financing (No.1) plc and Holmes Financing (No.2) plc originally provided by Citibank were novated to Abbey National plc. Abbey National plc does not guarantee the liabilities of the subsidiary which provides mortgage indemnity guarantee insurance. Abbey National plc is contingently liable to pay to the subsidiary any unpaid amounts in respect of share capital. At a Group level, a separate presentation of assets and liabilities is adopted to the extent of the amount of insurance cover provided by the subsidiary.
Abbey National Treasury Services plc has entered into a number of interest rate swaps with the following Securitisation Companies: Holmes Funding (No.1) plc, Holmes Funding (No.2) plc and Holmes Funding Limited. These swaps in effect convert a proportion of the fixed and variable interest flows receivable from customers into LIBOR based flows to match the interest payable on the Securities.
Abbey National plc has no right or obligation to repurchase the benefit of any securitised loan, except if certain representations and warranties given by Abbey National plc at the time of transfer are breached.
In March 2003 Holmes Funding Limited acquired, at book value, a beneficial interest in the trust property vested in Holmes Trustees Limited. This further beneficial interest of £2.4bn was acquired through borrowing from Holmes Financing (No.7) plc, which funded its advance to Holmes Funding Limited, principally through the issue of mortgage backed securities. The remaining share of the beneficial interest in residential mortgage loans held by Holmes Trustees Limited belongs to Abbey National plc, and amounts to £9.8bn at 31 December 2003.
| Abbey Annual Report and Accounts 2003 | 129 |
Back to Contents
Financial Statements
Notes to the Financial Statements continued
The balances of assets securitised and non-recourse finance at 31 December 2003 were as follows:
| Securitisation company | Date of
securitisation | | Gross assets
securitised
£m | | Non-
recourse
finance
£m | | Subordinated
loans made
by the Group
£m | |
|
|
|
|
|
|
|
| |
| Holmes Funding (No 1) plc | 25 February 1999 | | 116 | | 122 | | 15 | |
|
|
|
|
|
|
|
| |
| Holmes Funding (No 2) plc | 25 October 1999 | | 596 | | 631 | | 14 | |
|
|
|
|
|
|
|
| |
| Holmes Financing (No.1) plc | 19 July 2000 | | * 1,599 | | 1,564 | | – | |
|
|
|
|
|
|
|
| |
| Holmes Financing (No.2) plc | 29 November 2000 | | * 1,282 | | 1,426 | | – | |
|
|
|
|
|
|
|
| |
| Holmes Financing (No.3) plc | 23 May 2001 | | * 1,350 | | 1,320 | | 18 | |
|
|
|
|
|
|
|
| |
| Holmes Financing (No.4) plc | 5 July 2001 | | * 2,321 | | 2,458 | | 8 | |
|
|
|
|
|
|
|
| |
| Holmes Financing (No.5) plc | 8 November 2001 | | * 1,705 | | 1,668 | | 5 | |
|
|
|
|
|
|
|
| |
| Holmes Financing (No.6) plc | 7 November 2002 | | * 2,935 | | 2,955 | | 6 | |
|
|
|
|
|
|
|
| |
| Holmes Financing (No.7) plc | 20 March 2003 | | * 2,150 | | 2,338 | | 4 | |
|
|
|
|
|
|
|
| |
| Retained interest in Holmes Trustees Limited | | | 9,779 | | – | | – | |
|
|
|
|
|
|
|
| |
| | | 23,833 | | 14,482 | | 70 | |
|
|
|
|
|
|
|
| |
| • | Represents the interest in the trust property at book value held by Holmes Funding Limited related to the debt issued by these securitisation companies. | |
Included within Loans and advances to banks is £695m (2002: £811m) of cash which has been accumulated to finance the redemption of a number of securities issued by the securitisation companies.
Abbey National plc does not own directly, or indirectly, any of the share capital of any of the above securitisation companies or their parents.
A summarised profit and loss account for the years ended 31 December 2003, 2002 and 2001 and an aggregated balance sheet at 31 December 2003 and 2002 for the above companies is set out below:
Profit and loss account for the year ended 31 December
| | 2003 | | 2002 | | 2001 | |
| | £m | | £m | | £m | |
|
|
|
|
|
| |
| Net interest income | 3 | | 7 | | 8 | |
|
|
|
|
|
| |
| Other operating income | 11 | | 8 | | 6 | |
|
|
|
|
|
| |
| Administrative expenses | (19 | ) | (16 | ) | (13 | ) |
|
|
|
|
|
| |
| Provisions | (6 | ) | (7 | ) | (1 | ) |
|
|
|
|
|
| |
| Loss for the financial period | (11 | ) | (8 | ) | – | |
|
|
|
|
|
| |
| | |
| Cash flow statement for period ended 31 December | |
| | | | | | | |
| | 2003 | | 2002 | | 2001 | |
| | £m | | £m | | £m | |
|
|
|
|
|
| |
| Net cash outflow from operating activities | – | | (5 | ) | 4 | |
|
|
|
|
|
| |
| Net cash outflow from returns on investment and servicing of finance | – | | – | | – | |
|
|
|
|
|
| |
| Total taxation paid | – | | – | | – | |
|
|
|
|
|
| |
| Net cash inflow (outflow) from capital expenditure and financing investment | – | | – | | – | |
|
|
|
|
|
| |
| Net cash outflow before financing | – | | – | | – | |
|
|
|
|
|
| |
| Net cash inflow from financing | – | | – | | – | |
|
|
|
|
|
| |
| Net (Decrease) increase in cash | – | | (5 | ) | 4 | |
|
|
|
|
|
| |
| | | | | |
| Balance sheet as at 31 December | |
| | | | | |
| | 2003 | | 2002 | |
| | £m | | £m | |
|
|
|
| |
| Loans and advances to banks | 1,504 | | 2,113 | |
|
|
|
| |
| Loans and advances to customers | 14,053 | | 14,636 | |
|
|
|
| |
| Prepayments | 72 | | 67 | |
|
|
|
| |
| Total assets | 15,629 | | 16,816 | |
|
|
|
| |
| Deposits by banks | 547 | | 1,050 | |
|
|
|
| |
| Debt securities in issue | 14,895 | | 15,595 | |
|
|
|
| |
| Accruals and deferred income | 210 | | 188 | |
|
|
|
| |
| Profit and loss account | (23 | ) | (17 | ) |
|
|
|
| |
| Total liabilities | 15,629 | | 16,816 | |
|
|
|
| |
| | | | | |
| 18. Net investment in finance leases | |
| | | | | |
| | Group | | Company | |
|
|
|
|
|
|
|
| |
| | 2003 | | 2002 | | 2003 | | 2002 | |
| | £m | | £m | | £m | | £m | |
|
|
|
|
|
|
|
| |
| Amounts receivable | 4,241 | | 6,073 | | 21 | | 15 | |
|
|
|
|
|
|
|
| |
| Less: deferred income | (1,668 | ) | (2,626 | ) | (3 | ) | (2 | ) |
|
|
|
|
|
|
|
| |
| | 2,573 | | 3,447 | | 18 | | 13 | |
|
|
|
|
|
|
|
| |
| Repayable: | | | | | | | | |
|
|
|
|
|
|
|
| |
| In not more than 3 months | 31 | | 72 | | 1 | | – | |
|
|
|
|
|
|
|
| |
| In more than 3 months but not more than 1 year | 66 | | 75 | | 4 | | – | |
|
|
|
|
|
|
|
| |
| In more than 1 year but not more than 5 years | 537 | | 596 | | 13 | | 12 | |
|
|
|
|
|
|
|
| |
| In more than 5 years | 1,939 | | 2,704 | | – | | 1 | |
|
|
|
|
|
|
|
| |
| | 2,573 | | 3,447 | | 18 | | 13 | |
|
|
|
|
|
|
|
| |
| Cost of assets acquired for the purpose of letting under finance leases in the year | 176 | | 68 | | 11 | | – | |
|
|
|
|
|
|
|
| |
| Gross rentals receivable | 611 | | 451 | | 21 | | – | |
|
|
|
|
|
|
|
| |
| Commitments as lessor for the purchase of equipment for use in finance leases | – | | 41 | | – | | – | |
|
|
|
|
|
|
|
| |
| Amounts outstanding subject to a sub-participation | – | | 14 | | – | | – | |
|
|
|
|
|
|
|
| |
| | | | | | | | | |
| Provisions for impairment relate to small ticket leasing assets. | |
| 130 | Abbey Annual Report and Accounts 2003 |
Back to Contents
Financial Statements
Notes to the Financial Statements continued
19. Debt securities
| | | | | | | | Group | |
|
|
|
|
|
|
|
| |
| | 2003 | | 2003 | | 2002 | | 2002 | |
| | Book | | Market | | Book | | Market | |
| | value | | value | | value | | value | |
| Investment securities | £m | | £m | | £m | | £m | |
|
|
|
|
|
|
|
| |
| Issued by public bodies: | | | | | | | | |
|
|
|
|
|
|
|
| |
| Government securities | 125 | | 125 | | 1,457 | | 1,638 | |
|
|
|
|
|
|
|
| |
| Other public sector securities | 28 | | 28 | | 966 | | 983 | |
|
|
|
|
|
|
|
| |
| | 153 | | 153 | | 2,423 | | 2,621 | |
|
|
|
|
|
|
|
| |
| Issued by other issuers: | | | | | | | | |
|
|
|
|
|
|
|
| |
| Bank and building society | | | | | | | | |
| certificates of deposit | 204 | | 203 | | 1,011 | | 1,022 | |
|
|
|
|
|
|
|
| |
| Other debt securities | 1,574 | | 1,484 | | 30,042 | | 29,460 | |
|
|
|
|
|
|
|
| |
| | 1,778 | | 1,687 | | 31,053 | | 30,482 | |
|
|
|
|
|
|
|
| |
| Less: provisions | (178 | ) | – | | (501 | ) | – | |
|
|
|
|
|
|
|
| |
| Sub-total – | | | | | | | | |
| Non-trading book | 1,753 | | 1,841 | | 32,975 | | 33,103 | |
|
|
|
|
|
|
|
| |
| Other securities | | | | | | | | |
|
|
|
|
|
|
|
| |
| Issued by public bodies: | | | | | | | | |
|
|
|
|
|
|
|
| |
| Government securities | 4,374 | | 4,374 | | 5,875 | | 5,875 | |
|
|
|
|
|
|
|
| |
| Issued by other issuers: | | | | | | | | |
|
|
|
|
|
|
|
| |
| Bank and building society | | | | | | | | |
| certificates of deposit | 15,811 | | 15,811 | | 14,322 | | 14,322 | |
|
|
|
|
|
|
|
| |
| Other debt securities | 8,390 | | 8,390 | | 6,635 | | 6,635 | |
|
|
|
|
|
|
|
| |
| | 24,201 | | 24,201 | | 20,957 | | 20,957 | |
|
|
|
|
|
|
|
| |
| Sub-total – Trading book | 28,575 | | 28,575 | | 26,832 | | 26,832 | |
|
|
|
|
|
|
|
| |
| Total | 30,328 | | 30,416 | | 59,807 | | 59,935 | |
|
|
|
|
|
|
|
| |
| | | | | | | | | |
| | | | | | | | Company | |
|
|
|
|
|
|
|
| |
| | 2003 | | 2003 | | 2002 | | 2002 | |
| | Book | | Market | | Book | | Market | |
| | value | | value | | value | | value | |
| Investment securities | £m | | £m | | £m | | £m | |
|
|
|
|
|
|
|
| |
| Issued by public bodies: | | | | | | | | |
|
|
|
|
|
|
|
| |
| Other public sector securities | 28 | | 28 | | 28 | | 28 | |
|
|
|
|
|
|
|
| |
| Issued by other issuers: | | | | | | | | |
|
|
|
|
|
|
|
| |
| Other debt securities | 452 | | 452 | | 1,366 | | 1,366 | |
|
|
|
|
|
|
|
| |
| | 480 | | 480 | | 1,394 | | 1,394 | |
|
|
|
|
|
|
|
| |
The Company held no securities for purposes other than investment. The investment securities held by the Company include subordinated investments in subsidiaries of £432m (2002: £1,337m) and are included within Other debt securities. Investment securities held by the Group include £20m (2002: £20m) of subordinated investments in associates and are included within Other debt securities.
All of the securities held by the Company are unlisted.
Analysed by listing status:
| | | | | | | | Group | |
|
|
|
|
|
|
|
| |
| | 2003 | | 2003 | | 2002 | | 2002 | |
| | Book | | Market | | Book | | Market | |
| | value | | value | | value | | value | |
| Investment securities | £m | | £m | | £m | | £m | |
|
|
|
|
|
|
|
| |
| Listed in the UK | 701 | | 673 | | 4,836 | | 4,901 | |
|
|
|
|
|
|
|
| |
| Listed or registered | | | | | | | | |
| elsewhere | 161 | | 222 | | 24,414 | | 24,505 | |
|
|
|
|
|
|
|
| |
| Unlisted | 891 | | 945 | | 3,725 | | 3,697 | |
|
|
|
|
|
|
|
| |
| Sub-total – | | | | | | | | |
| Non-trading book | 1,753 | | 1,841 | | 32,975 | | 33,103 | |
|
|
|
|
|
|
|
| |
| Other securities | | | | | | | | |
|
|
|
|
|
|
|
| |
| Listed in the UK | 2,015 | | 2,015 | | 1,264 | | 1,264 | |
|
|
|
|
|
|
|
| |
| Listed or registered | | | | | | | | |
| elsewhere | 7,644 | | 7,644 | | 4,982 | | 4,982 | |
|
|
|
|
|
|
|
| |
| Unlisted | 18,916 | | 18,916 | | 20,586 | | 20,586 | |
|
|
|
|
|
|
|
| |
| Sub-total – | | | | | | | | |
| Trading book | 28,575 | | 28,575 | | 26,832 | | 26,832 | |
|
|
|
|
|
|
|
| |
| Total | 30,328 | | 30,416 | | 59,807 | | 59,935 | |
|
|
|
|
|
|
|
| |
| | | | | | | | | |
| Book value of debt securities analysed by maturity: | | | | | |
| | | | | | |
| | | | Group | | | | Company | |
|
|
|
|
|
|
|
| |
| | 2003 | | 2002 | | 2003 | | 2002 | |
| | £m | | £m | | £m | | £m | |
|
|
|
|
|
|
|
| |
| Due within 1 year | 20,644 | | 21,169 | | 150 | | 28 | |
|
|
|
|
|
|
|
| |
| Due in more than 1 year | | | | | | | | |
| but not more than 5 years | 3,712 | | 12,675 | | – | | 10 | |
|
|
|
|
|
|
|
| |
| Due in more than 5 years | | | | | | | | |
| but not more than 10 years | 4,427 | | 13,164 | | 32 | | 575 | |
|
|
|
|
|
|
|
| |
| Due in more than 10 years | 1,723 | | 13,300 | | 298 | | 781 | |
|
|
|
|
|
|
|
| |
| Less: provisions | (178 | ) | (501 | ) | – | | – | |
|
|
|
|
|
|
|
| |
| | 30,328 | | 59,807 | | 480 | | 1,394 | |
|
|
|
|
|
|
|
| |
The movement on debt securities held for investment purposes was as follows:
| | | | | | Group | |
|
|
|
|
|
| |
| | | | | | Net book | |
| | Cost | | Provisions | | value | |
| | £m | | £m | | £m | |
|
|
|
|
|
| |
| At 1 January 2003 | 33,476 | | (501 | ) | 32,975 | |
|
|
|
|
|
| |
| Exchange adjustments | (1,469 | ) | 22 | | (1,447 | ) |
|
|
|
|
|
| |
| Additions | 1,436 | | – | | 1,436 | |
|
|
|
|
|
| |
| Disposals | (24,188 | ) | 346 | | (23,842 | ) |
|
|
|
|
|
| |
| Redemptions and maturities | (3,175 | ) | – | | (3,175 | ) |
|
|
|
|
|
| |
| Transfers to other securities (net) | (4,141 | ) | – | | (4,141 | ) |
|
|
|
|
|
| |
| Transfer from profit and loss account | – | | (45 | ) | (45 | ) |
|
|
|
|
|
| |
| Net of amortisation | | | | | | |
| of discounts (premiums) | (8 | ) | – | | (8 | ) |
|
|
|
|
|
| |
| At 31 December 2003 | 1,931 | | (178 | ) | 1,753 | |
|
|
|
|
|
| |
| | | | | | | |
| | | | | | Company | |
|
|
|
|
|
| |
| | | | | | Net book | |
| | Cost | | Provisions | | value | |
| | £m | | £m | | £m | |
|
|
|
|
|
| |
| At 1 January 2003 | 1,394 | | – | | 1,394 | |
|
|
|
|
|
| |
| Additions | 20 | | – | | 20 | |
|
|
|
|
|
| |
| Disposals | (934 | ) | – | | (934 | ) |
|
|
|
|
|
| |
| At 31 December 2003 | 480 | | – | | 480 | |
|
|
|
|
|
| |
| Abbey Annual Report and Accounts 2003 | 131 |
Back to Contents
Financial Statements
Notes to the Financial Statements continued
The total net book value of debt securities held for investment purposes at 31 December 2003 includes net unamortised premiums/discounts of £39m (2002: £171m).
Included within debt securities are £5m (2002: £217m) of subordinated amounts due from third parties, which comprise debt securities issued by financial services companies which qualify as regulatory capital for the issuing company. There are hedges in place in respect of the majority of fixed rate investment securities whereby the rise or fall in their market value, due to interest rate movements, will be offset by a substantially equivalent reduction or increase in the value of the hedges. The Group also purchases credit protection by entering into credit derivative transactions such as credit default swaps and total return swaps with highly rated banks. The book value of investment debt securities issued by other issuers covered by these transactions is £707m (2002: £10,673m). The Group has purchased protection on a £707m portfolio of high yield assets. Protection has been purchased from a third party bank, which has in turn purchased protection from Newark (a synthetic Collateral Debt Obligation) and super senior protection from a super senior Monoline insurer. The Group’s exposure under the structure is £91m. This consists of a junior note exposure (net of provisions) of £31m to Newark and a potential exposure with respect to credit spread of £60m.
An aggregated summary profit and loss account for the years ended 31 December 2003, 2002 and 2001, and an aggregated balance sheet as at 31 December 2003 and 2002 for these entities are shown below.
| Profit and loss account for the year ended 31 December | |
| | 2003
£ m | | 2002
£m | | 2001
£m | |
|
|
|
|
|
| |
| Interest receivable | 33 | | 137 | | 282 | |
|
|
|
|
|
| |
| Interest payable | (29 | ) | (115 | ) | (255 | ) |
|
|
|
|
|
| |
| Net interest income | 4 | | 22 | | 27 | |
|
|
|
|
|
| |
| Profit on disposal of investment | | | | | | |
| debt securities | 4 | | 2 | | 2 | |
|
|
|
|
|
| |
| Profit for the financial year | 8 | | 24 | | 29 | |
|
|
|
|
|
| |
| Amounts charged to entities | | | | | | |
| of the Group | (8 | ) | (24 | ) | (29 | ) |
|
|
|
|
|
| |
| Retained profits | – | | – | | – | |
|
|
|
|
|
| |
| Balance sheet as at 31 December | | | |
| | 2003 | | 2002 |
| | £m | | £m |
|
|
|
|
| Investment debt securities | – | | 3,547 |
|
|
|
|
| Prepayments and accrued income | – | | 20 |
|
|
|
|
| Total assets | – | | 3,567 |
|
|
|
|
| Debt securities in issue | – | | 3,556 |
|
|
|
|
| Accruals and deferred income | – | | 11 |
|
|
|
|
| Total liabilities | – | | 3,567 |
|
|
|
|
| | | | |
20. Equity shares and other similar interests
| | | | | | | | Group | |
|
|
|
|
|
|
|
| |
| | 2003 | | 2003 | | 2002 | | 2002 | |
| | Book | | Market | | Book | | Market | |
| | value | | value | | value | | value | |
| | £m | | £m | | £m | | £m | |
|
|
|
|
|
|
|
| |
| Listed in the UK | 1,164 | | 1,164 | | 123 | | 112 | |
|
|
|
|
|
|
|
| |
| Listed elsewhere | 93 | | 93 | | 41 | | 48 | |
|
|
|
|
|
|
|
| |
| Unlisted | 376 | | 376 | | 799 | | 811 | |
|
|
|
|
|
|
|
| |
| | 1,633 | | 1,633 | | 963 | | 971 | |
|
|
|
|
|
|
|
| |
| Banking business | 394 | | 394 | | 893 | | 901 | |
|
|
|
|
|
|
|
| |
| Trading business | 1,239 | | 1,239 | | 70 | | 70 | |
|
|
|
|
|
|
|
| |
| | 1,633 | | 1,633 | | 963 | | 971 | |
|
|
|
|
|
|
|
| |
| | | | | | | | | |
| | | | | | | | Company | |
|
|
|
|
|
|
|
| |
| | 2003 | | 2003 | | 2002 | | 2002 | |
| | Book | | Market | | Book | | Market | |
| | value | | value | | value | | value | |
| | £m | | £m | | £m | | £m | |
|
|
|
|
|
|
|
| |
| Unlisted | 2 | | 2 | | 2 | | 2 | |
|
|
|
|
|
|
|
| |
| | | | | | | | | |
| The movement on equity shares and other similar interests held for | | | |
| investment purposes was as follows: | | | | | | | |
| | | | | | | | Group | |
|
|
|
|
|
|
|
| |
| | | | | | | | Net book | |
| | | | Cost | | Provisions | | value | |
| | | | £m | | £m | | £m | |
|
|
|
|
|
|
|
| |
| At 1 January 2003 | | | 1,021 | | (128 | ) | 893 | |
|
|
|
|
|
|
|
| |
| Exchange adjustments | | | (12 | ) | 5 | | (7 | ) |
|
|
|
|
|
|
|
| |
| Additions | | | 638 | | – | | 638 | |
|
|
|
|
|
|
|
| |
| Disposals | | | (992 | ) | 10 | | (982 | ) |
|
|
|
|
|
|
|
| |
| Transfer from profit and loss account | | – | | (148 | ) | (148 | ) |
|
|
|
|
|
|
|
| |
| At 31 December 2003 | | | 655 | | (261 | ) | 394 | |
|
|
|
|
|
|
|
| |
There were no movements on Company equity shares and other similar interests held for investment purposes during the year. The total amount held was £2m (2002: £2m). There were no provisions. These amounts exclude investment in subsidiary undertakings.
21. Long Term Assurance business
The value of the Long Term Assurance business is as follows:
| Gross of tax basis: | 2003 | | 2002 | | 2001 | |
| £m | | £m | | £m | |
|
|
|
|
|
| |
| Income from Long Term Assurance | | | | | | |
| business before embedded value | | | | | | |
| changes and rebasing | 176 | | 321 | | 345 | |
|
|
|
|
|
| |
| Embedded value charges | | | | | | |
| and rebasing | (378 | ) | (632 | ) | (443 | ) |
|
|
|
|
|
| |
| Income from Long Term | | | | | | |
| Assurance business | (202 | ) | (311 | ) | (98 | ) |
|
|
|
|
|
| |
| Net of tax basis: | | | | | | |
|
|
|
|
|
| |
| Income from Long Term Assurance | | | | | | |
| business (smoothed) | 110 | | 252 | | 249 | |
|
|
|
|
|
| |
| Embedded value charges | | | | | | |
| and rebasing | (369 | ) | (480 | ) | (328 | ) |
|
|
|
|
|
| |
| Income from Long Term Assurance | | | | | | |
| business (unsmoothed) | (259 | ) | (228 | ) | (79 | ) |
|
|
|
|
|
| |
The assets and liabilities of the Long Term Assurance Funds are presented separately from those of other businesses in order to reflect the different nature of the shareholders interest in them.
The value of the Long Term Assurance business is calculated by discounting the proportion of surplus which is projected to accrue to shareholders in future years from business currently in force, and adding the shareholders’ interest in the surplus retained within the Long Term Assurance Funds. The basis on which this value is determined is reviewed regularly in the light of the experience of the
| 132 | Abbey Annual Report and Accounts 2003 |
Back to Contents
Financial Statements
Notes to the Financial Statements continued
business and expectations regarding future economic conditions. The principal long term economic assumptions used are as follows:
| | 2003 | | 2002 |
| | % | | % |
|
|
|
|
| Risk adjusted discount rate (net of tax) | 7.5 | | 8.5 |
|
|
|
|
| Return on equities (gross of tax – pension business) | 7.25 | | 7.0 |
|
|
|
|
| Return on equities (gross of tax – life business) | 7.25 | | 7.5 |
|
|
|
|
| Return on gilts (gross of tax) | 4.75 | | 5.0 |
|
|
|
|
| Return on corporate bonds (gross of tax) | 5.25 | | 5.75 |
|
|
|
|
| Inflation (indexation) | 2.75 | | 2.5 |
|
|
|
|
| Inflation (expenses) | 3.75 | | 3.5 |
|
|
|
|
Embedded Value rebasing and other adjustments
The embedded value rebasing is made up of four components:
Investment assumptions and variances
This consists of the adjustment to period end market values and the results of the move to an active basis. Approximately one half of the Scottish Mutual charge of £122m arises out of the move from assumed asset mix to actual asset mix under the new active basis of modelling described in the basis of results presentation. The adjustment to period-end market values in 2002 was driven by the significant falls in equity markets. While equity markets have improved in 2003, which has benefited Abbey National Life in particular, the fall in fixed interest prices particularly at the end of 2003 has had a more significant effect on Scottish Mutual and Scottish Provident.
As set out above, investment assumptions have now been set on an active basis for 2003. 2002 figures have not been restated for the new treatment. Overall, the reduction in the discounted value of future profits arising from lower assumed investment returns going forward is offset by the lower risk discount rate used.
Guaranteed liability/market value adjustments
Significant provisions were made in 2002 with respect to guaranteed annuity and market value adjustment free liabilities. Hedges were also taken out to reduce the volatility of these liabilities. The credit in Scottish Mutual in 2003 represents the benefit of lower assumed bonuses (and consequently guarantee liabilities) partly offset by the effect of lower market levels when the hedges were finalised as compared to the 2002 year end position. Having made significant progress in 2002 to address the shortfall in value in relation to guaranteed annuity options and market value adjustments, the £(60)m charge in Scottish Provident relates in part to other products not captured by 2002 review, together with the effect of lower market levels when the hedges were transacted.
Change in equity backing assumption
The charge of £61m in 2002 relates to the effect on the discounted value of future profits of the reduction in the assumed equity backing ratio from 70% to 30%. The move to an active investment assumption base in 2003 means that the actual equity backing ratio is used with the effect from moving to this basis included within the investment assumptions and variances commented on above.
Provision required with respect to the shareholders liability for realistic balance sheet position
Provisions of £273m and £100m have been made with respect to potential shareholder support for the Scottish Mutual and Scottish Provident with-profit funds respectively based on the position, prior to existing capital support, expected to be shown in the “realistic” balance sheets to be prepared by 31 March 2004 as part of the new forthcoming Financial Services Authority regulations with respect to the solvency of Life companies. These balance sheets are not yet finalised and their method of calculation remains subject to change as the Financial Services Authority and the Life industry evolve its practices under the new regimes.
Early analysis of the “realistic” balance sheet position of Scottish Mutual indicates that the “realistic” position is likely to be better than shown on the statutory basis. With respect to the current assessment of Scottish Provident, there is likely to be a “realistic” balance sheet higher than the statutory position due to a higher assessment of guarantee costs. The provision now being made represents an initial assessment of the potential cost to Abbey’s life companies of supporting the realistic liabilities. The extent of the support will depend on the final Financial Services Authority position on these matters.
There remains considerable uncertainty as to the effect on the shareholder of the new regime and a significant project is underway to establish ongoing arrangements including finalising the “realistic” balance sheets and assessing how much of the cost of both supporting liabilities and any additional capital needed under the Financial Services Authority’s new requirements will be borne by the shareholder and policyholder respectively. Until this project is complete and agreement reached with all parties including the Financial Services Authorities, it is not possible to confirm the quantum of this provision. The amount being provided represents management’s current estimate of the potential cost to the shareholder though it remains possible that the final cost to Abbey is higher or lower than the amount provided by a significant margin.
Abbey's specific exposure reflects its expansion into the “with-profits” arena between 1997 and 2001, with a large proportion of new business written with guarantees for customers at a time when market values were significantly higher than they are today. In addition, Abbey does not have a large “orphan estate” to cushion subsequent falls in asset values.
In addition to the provision, there remains a possibility that additional capital will need to be injected, though preliminary estimates indicate that any such amount will be modest in the context of the injections made in the past two years.
It is our current intention to publish more information concerning the “realistic” balance sheets and related requirements for action once the outcome of the project mentioned above is completed.
Movement in the embedded value asset is calculated as follows:
| | 2003 | | 2002 | |
| | £m | | £m | |
|
|
|
| |
| At 1 January | 2,316 | | 1,662 | |
|
|
|
| |
| Increase in value of long term business after tax | 110 | | 252 | |
|
|
|
| |
| Embedded value rebasing and other adjustments | (369 | ) | (480 | ) |
|
|
|
| |
| Capital injections | 272 | | 913 | |
|
|
|
| |
| Surplus transferred from Long Term Business Funds | (57 | ) | (31 | ) |
|
|
|
| |
| At 31 December | 2,272 | | 2,316 | |
|
|
|
| |
The amounts of these assets, which are valued at market value, and liabilities of the Long Term Assurance Funds included in the consolidated balance sheet are based upon the life assurance balance sheets prepared in compliance with the special provisions relating to insurance groups of section 255A and Schedule 9A to the Companies Act 1985.
| Abbey Annual Report and Accounts 2003 | 133 |
Back to Contents
Financial StatementsNotes to the Financial Statements continued
The assets and liabilities of the Long Term Assurance Funds are:
| | 2003
£m | | 2002
£m | |
|
|
|
| |
| Investments | 19,570 | | 19,990 | |
|
|
|
| |
| Assets held to cover linked liabilities | 7,041 | | 6,628 | |
|
|
|
| |
| Debtors and prepayments | 3,465 | | 3,814 | |
|
|
|
| |
| Other assets | 1,564 | | 1,592 | |
|
|
|
| |
| Total assets | 31,640 | | 32,024 | |
|
|
|
| |
| Less: Attributable to shareholders | 3,304 | | 2,613 | |
|
|
|
| |
| Total assets attributable to policyholders | 28,336 | | 29,411 | |
|
|
|
| |
| Technical provisions | 18,729 | | 20,069 | |
|
|
|
| |
| Technical provisions for linked liabilities | 7,142 | | 6,699 | |
|
|
|
| |
| Fund for future appropriations | (769 | ) | (995 | ) |
|
|
|
| |
| Other creditors | 3,234 | | 3,638 | |
|
|
|
| |
| Total liabilities attributable to policyholders | 28,336 | | 29,411 | |
|
|
|
| |
Included within other creditors above are two contingent loans owed by the with-profit sub funds of the Long Term Business Funds of Scottish Mutual Assurance plc and Scottish Provident Limited to Abbey National Scottish Mutual Assurance Holdings Limited of £500m and £619m, respectively. Accrued interest on these loans amounted to £75m and £80m, respectively.
The payment of interest and capital repayments of these loans are contingent on the solvency of the respective funds as determined by the appointed actuary. In addition, the loan to the with-profit sub-fund of the Long Term Business Fund of Scottish Provident Limited is a loan where recourse is limited to the surpluses emerging from the non-profit sub fund of the Long Term Business fund of Scottish Provident.
Scottish Provident contingent loan provision
As reported at the half year, provisions of £76m and £4m have been made with respect to tax law changes affecting the Scottish Provident and Scottish Mutual contingent loans.
Other one-off adjustments
The credit in 2003 represents the grossed up value of a one-off group relief adjustment relating to the prior year.
The credit in 2002 represents the benefit of the reduced asset management costs arising from the move of responsibility for asset management of the Scottish Provident funds from Aberdeen Asset Managers to Abbey National Asset Managers. No adjustment arises from the temporary transfer of asset management responsibility to State Street Global Advisors announced early in 2004 pending the move to a multi-manager approach later this year.
22. Interests and shares in associated undertakings
The movement in interests in associated undertakings for 2003 and 2002 was as follows:
| | Group | | Company | |
| | £m | | £m | |
|
|
|
| |
| At 1 January 2003 | 51 | | – | |
|
|
|
| |
| Additions | – | | 51 | |
|
|
|
| |
| Dividend Received | – | | (19 | ) |
|
|
|
| |
| Share of current year net assets | (12 | ) | – | |
|
|
|
| |
| At 31 December 2003 | 39 | | 32 | |
|
|
|
| |
| At 1 January 2002 | 59 | | – | |
|
|
|
| |
| Disposals | (1 | ) | – | |
|
|
|
| |
| Share of current year net assets | (7 | ) | – | |
|
|
|
| |
| At 31 December 2002 | 51 | | – | |
|
|
|
| |
The principal associated undertakings at 31 December 2003 are:
| | | Group |
| | | Interest |
| Name and nature of business | Issued share capital | % |
|
|
|
EDS Credit Services Ltd,
Information technology services | 5,000 A ordinary shares of £0.01each and 1,000 B ordinary shares of £0.01 each | 25 |
| |
| |
|
|
|
| PSA Finance plc, Personal finance | 40,000,000 £1 ordinary shares | 50 |
|
|
|
IF Online Group Limited,
Information technology services | 5,393,191 A ordinary shares of £1 each | |
| | 1,000,000 B ordinary shares of £1 each | |
| | 930,120 Class Aordinary shares of £1 each | |
| | 38,317 Class C preference shares of £1 each | |
| | 1 Founder share of £1 each, and | |
| | 1 Abbey special share of £1 each | |
|
|
|
Abbey National plc acquired PSA Finance plc from First National Bank plc on 1 February 2003.
The United Kingdom is the principal area of operation of the principal associated undertakings and all are registered in England & Wales.
All associated undertakings are unlisted. EDS Credit Services Limited and PSA Finance plc have a year end of 31 December. IF Online Group Limited has a year end of 30 November.
23. Shares in Group undertakings
| | | | 2003 | | 2002 | |
| | | | Net | | Cost and | |
| | | | book | | book | |
| | | | value | | value | |
| | | | £m | | £m | |
|
|
|
|
|
| |
| Subsidiary undertakings | | | | | | |
|
|
|
|
|
| |
| Banks | | | 2,264 | | 3,157 | |
|
|
|
|
|
| |
| Others | | | 5,907 | | 4,388 | |
|
|
|
|
|
| |
| | | | 8,171 | | 7,545 | |
|
|
|
|
|
| |
| | | | | | | |
| | | | | | | |
| The movement in shares in Group undertakings was as follows: | | | |
| | | | | | | |
| | Cost | | Impairment | | Company | |
| | £m | | £m | | £m | |
|
|
|
|
|
| |
| At 1 January 2003 | 8,802 | | (1,257 | ) | 7,545 | |
|
|
|
|
|
| |
| Exchange adjustments | 6 | | – | | 6 | |
|
|
|
|
|
| |
| Additions | 361 | | – | | 361 | |
|
|
|
|
|
| |
| Disposals | (25 | ) | 9 | | (16 | ) |
|
|
|
|
|
| |
| Other Movements | 927 | | – | | 927 | |
|
|
|
|
|
| |
| Impairments | – | | (652 | ) | (652 | ) |
|
|
|
|
|
| |
| At 31 December 2003 | 10,071 | | (1,900 | ) | 8,171 | |
|
|
|
|
|
| |
Subscriptions for additional share capital in existing subsidiary undertakings during the year amounted to £361m, including £250m in Abbey National SMA Holdings Limited and £90m in Abbey National Life plc.
The impairments of shares in group undertakings in the year included: Abbey National Treasury Services plc (£237m), Abbey National SMA Holdings Limited (£270m), Cater Tyndall Ltd (£65m), Abbey National France S.A (£45m) and AN 123 Limited (£25m). These impairments are only in the Abbey National plc accounts and do not affect the consolidated accounts.
| 134 | Abbey Annual Report and Accounts 2003 |
| | |
Back to Contents
Financial Statements
Notes to the Financial Statementscontinued
The following table details group undertakings sold in the year and the consideration received.
| Date | Company/Business disposed of | Consideration |
|
| | | |
| 31 January | Abbey National December Leasing | £60m cash |
|
| | | |
| 10 April | First National Bank plc | £4,692m cash |
|
| | | |
| 10 April | Abbey National Mortgages plc | £159m cash |
|
| | | |
| 10 April | Carfax Personal Lines Insurance PCC Limited | £9m cash |
|
| | | |
| 30 June | Abbey National March Leasing(1) | £5m cash |
|
| | | |
| 30 June | Abbey National September Leasing(4) | £48m cash |
|
| | | |
| 1 July | Abbey National Capital Limited | £50m cash |
|
| | | |
| 1 July | Abbey National December Leasing | £56m cash |
|
| | | |
| 1 July | Abbey National March Leasing(2) | £58m cash |
|
| | | |
| 29 October | State Securities plc | £71m cash |
|
| | | |
| 31 October | HMC Mortgages Notes 101 Limited | £43m cash |
|
| | | |
| 19 November | Business of Abbey National Cashflow Finance | £37m cash |
|
| | | |
| 10 December | Abbey National Treasury Services Ltd | £185m cash |
|
| | | |
| 19 December | Abbey National June Leasing(3) | £215m cash |
|
| | | |
| 31 December | Abbey National Italy | £3,319m cash |
|
The principal subsidiaries of Abbey National plc at 31 December 2003 are shown below, all of which are directly held and unlisted except where indicated.
| | | Country of Incorporation |
| | Nature of business | or registration |
|
| Abbey National Leasing Companies* (16 companies) | Finance leasing | England & Wales |
|
| Abbey National Treasury Services plc | Treasury operations | England & Wales |
|
| Abbey National Unit Trust Managers* | Unit trust management | Scotland |
|
| Abbey National Treasury International Ltd* | Personal finance | Jersey |
|
| Cater Allen International Ltd* | Money market and stockbroking | England & Wales |
|
| Scottish Mutual Investment | Investment managers | Scotland |
| Managers Ltd* | | |
|
| Carfax Insurance Ltd | Insurance | Guernsey |
|
| Abbey National Life plc | Insurance | England & Wales |
|
| Abbey National PEP and | PEP and ISA | Scotland |
| ISA Managers Ltd* | management | |
|
| Scottish Mutual Assurance plc* | Insurance | Scotland |
|
| Scottish Provident Ltd* | Insurance | Scotland |
|
| Scottish Mutual Pension | Investment | Scotland |
| Funds Investment Ltd | | |
|
| Abbey National North | Funding | United States |
| America Corporation | | |
|
* Held indirectly through subsidiary companies.
All of the above entities have accounting reference dates of31 December with the exception of the following: Abbey National March Leasing (1) and (2) Limited (both 31 March); Abbey National June Leasing (3), Limited (30 June); and Abbey National September Leasing Limited (30 September).
All the above companies are included in the consolidated financial statements. The Company holds directly or indirectly 100% of the issued ordinary share capital of its principal subsidiaries. All companies operate principally in their country of incorporation or registration. Abbey National Treasury Services plc also has a branch office in the US. Abbey National plc has branches in France and the Isle of Man and a representative office in Dubai.
24. Sale of Subsidiary Undertaking
On 10 April 2003 the Group sold its 100% interest in the ordinary share capital of First National Bank plc. The profit of First National Bank plc up to the date of disposal was £11m, and for its last financial year £94m. Net Assets disposed of and the related sales proceeds were as follows.
| | £m | |
|
| |
| Loans and Advances to Customers | 4,450 | |
|
| |
| Other Assets | 178 | |
|
| |
| Deposits by Banks | (56 | ) |
|
| |
| Other Liabilities | (70 | ) |
|
| |
| Net Assets | 4,502 | |
|
| |
| Goodwill Written Back | 190 | |
|
| |
| Profit on Sale | – | |
|
| |
| Sales Proceeds | 4,692 | |
|
| |
| At 31 December 2003 | | |
|
| |
| Satisfied by | | |
|
| |
| Cash | 4,692 | |
|
| |
| Net Cash Inflows in respect of sale comprise | | |
|
| |
| Cash Consideration | 4,692 | |
|
| |
| Cash at Bank and in Hand Sold | (11 | ) |
|
| |
| | 4,681 | |
|
| |
25. Intangible fixed assets
|
| |
| | Purchased | |
| | goodwill | |
| | Group | |
| | £m | |
|
| |
| Cost | | |
|
| |
| At 1 January 2003 | 1,257 | |
|
| |
| Additions | – | |
|
| |
| Disposals | (184 | ) |
|
| |
| At 31 December 2003 | 1,073 | |
|
| |
| Amortisation and impairment | | |
|
| |
| At 1 January 2003 | 881 | |
|
| |
| Charge for the year | 20 | |
|
| |
| Disposals | (182 | ) |
|
| |
| Impairments | 13 | |
|
| |
| At 31 December 2003 | 732 | |
|
| |
| Net book value | | |
|
| |
| At 31 December 2003 | 341 | |
|
| |
| At 31 December 2002 | 376 | |
|
| |
Intangible fixed assets comprise positive purchased goodwill arising on acquisitions of subsidiary undertakings and purchases of businesses made since 1 January 1998.
Goodwill included above in respect of all material acquisitions is currently being amortised over a period of 20 years. Previously, goodwill arising on acquisitions of subsidiary undertakings and purchases of businesses was taken directly to reserves.
In accordance with FRS 11, ‘Impairment of fixed assets and goodwill’, the carrying value of goodwill has been reviewed for impairment if there is some indication that impairment has occurred.
The impairment reviews have resulted in the following impairment charges; £9m in respect of Abbey National Business Equipment Leasing companies, £4m in respect of Abbey National Business Cashflow Finance business and £5m in respect of Abbey National Business Factors Limited.This latter amount had previously been written off to reserves (see note 44).
The cumulative amount of goodwill taken to the Profit and Loss Account reserve in previous periods by the Group and not subsequently recognised in the Profit and Loss Account is £620m (2002: £815m), and by the Company £528m (2002: £528m).
| Abbey Annual Report and Accounts 2003 | 135 |
Back to Contents
Financial Statements
Notes to the Financial Statementscontinued
26. Tangible fixed assets excluding operating lease assets
| | | | | | | | Group | |
|
|
|
|
|
|
|
| |
| | Investment | | Other | | | | | |
| | properties | | premises | | Equipment | | Total | |
| | £m | | £m | | £m | | £m | |
|
|
|
|
|
|
|
| |
| Cost or valuation | | | | | | | | |
|
|
|
|
|
|
|
| |
| At 1 January 2003 | 1 | | 47 | | 1,234 | | 1,282 | |
|
|
|
|
|
|
|
| |
| Disposals of subsidiary | | | | | | | | |
| undertakings | – | | (3 | ) | (43 | ) | (46 | ) |
|
|
|
|
|
|
|
| |
| Additions | – | | 12 | | 37 | | 49 | |
|
|
|
|
|
|
|
| |
| Disposals | (1 | ) | (13 | ) | (296 | ) | (310 | ) |
|
|
|
|
|
|
|
| |
| At 31 December 2003 | – | | 43 | | 932 | | 975 | |
|
|
|
|
|
|
|
| |
| Depreciation | | | | | | | | |
|
|
|
|
|
|
|
| |
| At 1 January 2003 | – | | 10 | | 901 | | 911 | |
|
|
|
|
|
|
|
| |
| Disposals of subsidiary | | | | | | | | |
| undertakings | – | | (2 | ) | (30 | ) | (32 | ) |
|
|
|
|
|
|
|
| |
| Charge for the year | – | | 6 | | 106 | | 112 | |
|
|
|
|
|
|
|
| |
| Disposals | – | | (5 | ) | (279 | ) | (284 | ) |
|
|
|
|
|
|
|
| |
| At 31 December 2003 | – | | 9 | | 698 | | 707 | |
|
|
|
|
|
|
|
| |
| Net book value | | | | | | | | |
|
|
|
|
|
|
|
| |
| At 31 December 2003 | – | | 34 | | 234 | | 268 | |
|
|
|
|
|
|
|
| |
| At 31 December 2002 | 1 | | 37 | | 333 | | 371 | |
|
|
|
|
|
|
|
| |
| | | | | | | | | |
| | | | | | | | Company | |
|
|
|
|
|
|
|
| |
| | | | Other | | | | | |
| | | | premises | | Equipment | | Total | |
| | | | £m | | £m | | £m | |
|
|
|
|
|
|
|
| |
| Cost | | | | | | | | |
|
|
|
|
|
|
|
| |
| 1 January 2003 | | | 26 | | 1,109 | | 1,135 | |
|
|
|
|
|
|
|
| |
| Disposal of businesses | | | (3 | ) | – | | (3 | ) |
|
|
|
|
|
|
|
| |
| Additions | | | 4 | | 54 | | 58 | |
|
|
|
|
|
|
|
| |
| Disposals | | | (3 | ) | (218 | ) | (221 | ) |
|
|
|
|
|
|
|
| |
| At 31 December 2003 | | | 24 | | 945 | | 969 | |
|
|
|
|
|
|
|
| |
| Depreciation | | | | | | | | |
|
|
|
|
|
|
|
| |
| At 1 January 2003 | | | 6 | | 825 | | 831 | |
|
|
|
|
|
|
|
| |
| Disposal of businesses | | | (2 | ) | – | | (2 | ) |
|
|
|
|
|
|
|
| |
| Charge for the year | | | 6 | | 85 | | 91 | |
|
|
|
|
|
|
|
| |
| Disposals | | | (6 | ) | (184 | ) | (190 | ) |
|
|
|
|
|
|
|
| |
| At 31 December 2003 | | | 4 | | 726 | | 730 | |
|
|
|
|
|
|
|
| |
| Net book value | | | | | | | | |
|
|
|
|
|
|
|
| |
| At 31 December 2003 | | | 20 | | 219 | | 239 | |
|
|
|
|
|
|
|
| |
| At 31 December 2002 | | | 20 | | 284 | | 304 | |
|
|
|
|
|
|
|
| |
The net book value of Other premises comprises:
| | | | Group | | | | Company | |
|
|
|
|
|
|
|
| |
| | 2003 | | 2002 | | 2003 | | 2002 | |
| | £m | | £m | | £m | | £m | |
|
|
|
|
|
|
|
| |
| Freeholds | 9 | | 15 | | 1 | | 2 | |
|
|
|
|
|
|
|
| |
| Long leaseholds | 5 | | 4 | | 1 | | – | |
|
|
|
|
|
|
|
| |
| Short leaseholds | 20 | | 18 | | 17 | | 17 | |
|
|
|
|
|
|
|
| |
| Net book value at 31 December | 34 | | 37 | | 19 | | 19 | |
|
|
|
|
|
|
|
| |
| Of which occupied for own use | 32 | | 37 | | 19 | | 19 | |
|
|
|
|
|
|
|
| |
| The net book value of Other | | | | | | | | |
| premises includes: | | | | | | | | |
|
|
|
|
|
|
|
| |
| Assets held under finance leases | 1 | | 4 | | 1 | | 4 | |
|
|
|
|
|
|
|
| |
| Depreciation charge | | | | | | | | |
| for the year on these assets | 3 | | 5 | | 3 | | 6 | |
|
|
|
|
|
|
|
| |
| Capital expenditure which | | | | | | | | |
| has been contracted, but not | | | | | | | | |
| provided for in the financial | | | | | | | | |
| statements | 38 | | 23 | | 38 | | 23 | |
|
|
|
|
|
|
|
| |
| | | | | | | | | |
| 27. Operating lease assets | | | | | | | | |
| | | | | | | | Group | |
| | | | | | | | £m | |
|
|
|
|
|
|
|
| |
| Cost | | | | | | | | |
|
|
|
|
|
|
|
| |
| At 1 January 2003 | | | | | | | 3,587 | |
|
|
|
|
|
|
|
| |
| Exchange adjustments | | | | | | | (48 | ) |
|
|
|
|
|
|
|
| |
| Disposal of subsidiary undertakings | | | | | | | (92 | ) |
|
|
|
|
|
|
|
| |
| Additions | | | | | | | 491 | |
|
|
|
|
|
|
|
| |
| Disposals | | | | | | | (175 | ) |
|
|
|
|
|
|
|
| |
| At 31 December 2003 | | | | | | | 3,763 | |
|
|
|
|
|
|
|
| |
| Depreciation and impairment | | | | | | | | |
|
|
|
|
|
|
|
| |
| At 1 January 2003 | | | | | | | 1,014 | |
|
|
|
|
|
|
|
| |
| Exchange adjustments | | | | | | | (5 | ) |
|
|
|
|
|
|
|
| |
| Disposal of subsidiary undertakings | | | | | | | (17 | ) |
|
|
|
|
|
|
|
| |
| Impairment | | | | | | | 64 | |
|
|
|
|
|
|
|
| |
| Charge for the year | | | | | | | 187 | |
|
|
|
|
|
|
|
| |
| Disposals | | | | | | | (9 | ) |
|
|
|
|
|
|
|
| |
| At 31 December 2003 | | | | | | | 1,234 | |
|
|
|
|
|
|
|
| |
| Net book value | | | | | | | | |
|
|
|
|
|
|
|
| |
| At 31 December 2003 | | | | | | | 2,529 | |
|
|
|
|
|
|
|
| |
| At 31 December 2002 | | | | | | | 2,573 | |
|
|
|
|
|
|
|
| |
The net book value of operating lease assets includes residual values at the end of current lease terms, which will be recovered through re-letting or disposal in the following periods:
| | 2003 | | 2002 | |
| | £m | | £m | |
|
|
|
| |
| In not more than 1 year | 493 | | 384 | |
|
|
|
| |
| In more than 1 year but not more than 2 years | 102 | | 685 | |
|
|
|
| |
| In more than 2 years but not more than 5 years | 432 | | 225 | |
|
|
|
| |
| In more than 5 years | 1,223 | | 882 | |
|
|
|
| |
| | 2,250 | | 2,176 | |
|
|
|
| |
| Capital expenditure which has been contracted, | | | | |
| but not provided for in the financial statements | 324 | | 457 | |
|
|
|
| |
| 136 | Abbey Annual Report and Accounts 2003 |
Back to Contents
Financial Statements
Notes to the Financial Statements continued
28. Other assets
| | | | Group | | | | Company | |
|
|
|
|
|
|
|
| |
| | 2003 | | 2002 | | 2003 | | 2002 | |
| | £m | | £m | | £m | | £m | |
|
|
|
|
|
|
|
| |
| Foreign exchange, interest rate, equity & credit contracts: | | | | | | | | |
|
|
|
|
|
|
|
| |
| Positive market value of trading derivative contracts (note 51) | 1,643 | | 1,842 | | – | | – | |
|
|
|
|
|
|
|
| |
| Translation differences on foreign exchange derivatives used for hedging purposes | 209 | | 162 | | – | | 5 | |
|
|
|
|
|
|
|
| |
| Debtors and other settlement balances | 909 | | 1,698 | | 213 | | 210 | |
|
|
|
|
|
|
|
| |
| Introducer fees | 80 | | 314 | | 8 | | 24 | |
|
|
|
|
|
|
|
| |
| Deferred tax asset (note 37) | – | | – | | 122 | | 80 | |
|
|
|
|
|
|
|
| |
| Other | 1,321 | | 1,069 | | 658 | | 475 | |
|
|
|
|
|
|
|
| |
| | 4,162 | | 5,085 | | 1,001 | | 794 | |
|
|
|
|
|
|
|
| |
Holdings of Abbey’s own shares were previously disclosed as
"Own Shares Held" within Other Assets. These have now been reclassified as Treasury Shares and deducted from Shareholder Funds in accordance with UITF Abstract 38.
29. Prepayments and accrued income
| | | | Group | | | | Company | |
|
|
|
|
|
|
|
| |
| | 2003 | | 2002 | | 2003 | | 2002 | |
| | £m | | £m | | £m | | £m | |
|
|
|
|
|
|
|
| |
| Accrued interest due | | | | | | | | |
| from subsidiaries | – | | – | | 88 | | 98 | |
|
|
|
|
|
|
|
| |
| Unamortised lending- | | | | | | | | |
| related fees (see note 3) | 125 | | 203 | | 125 | | 202 | |
|
|
|
|
|
|
|
| |
| Other accrued interest | 831 | | 1,284 | | 197 | | 116 | |
|
|
|
|
|
|
|
| |
| Prepayments and | | | | | | | | |
| other accruals | 274 | | 404 | | 91 | | 150 | |
|
|
|
|
|
|
|
| |
| | 1,230 | | 1,891 | | 501 | | 566 | |
|
|
|
|
|
|
|
| |
30. Assets subject to sale and repurchase transactions
| | | | Group | | | | Company | |
|
|
|
|
|
|
|
| |
| | 2003 | | 2002 | | 2003 | | 2002 | |
| | £m | | £m | | £m | | £m | |
|
|
|
|
|
|
|
| |
| Debt securities | 1,968 | | 3,470 | | – | | – | |
|
|
|
|
|
|
|
| |
The above amounts are the assets held under sale and repurchase transactions included within the amounts disclosed in note 19, Debt securities.
31. Deposits by banks
| | | | Group | | | | Company | |
|
|
|
|
|
|
|
| |
| | 2003 | | 2002 | | 2003 | | 2002 | |
| | £m | | £m | | £m | | £m | |
|
|
|
|
|
|
|
| |
| Items in the course | | | | | | | | |
| of transmission | 204 | | 221 | | 191 | | 214 | |
|
|
|
|
|
|
|
| |
| Amounts due to subsidiaries | – | | – | | 18,589 | | 14,015 | |
|
|
|
|
|
|
|
| |
| Sale and repurchase | | | | | | | | |
| agreements | 9,390 | | 7,300 | | – | | – | |
|
|
|
|
|
|
|
| |
| Other deposits | 12,531 | | 16,653 | | – | | 78 | |
|
|
|
|
|
|
|
| |
| | 22,125 | | 24,174 | | 18,780 | | 14,307 | |
|
|
|
|
|
|
|
| |
| Repayable: | | | | | | | | |
|
|
|
|
|
|
|
| |
| On demand | 5,422 | | 6,882 | | 372 | | 202 | |
|
|
|
|
|
|
|
| |
| In not more than 3 months | 14,766 | | 15,108 | | 17,480 | | 11,919 | |
|
|
|
|
|
|
|
| |
| In more than 3 months | | | | | | | | |
| but not more than 1 year | 1,502 | | 1,651 | | 58 | | 214 | |
|
|
|
|
|
|
|
| |
| In more than 1 year but | | | | | | | | |
| not more than 5 years | 18 | | 50 | | – | | 84 | |
|
|
|
|
|
|
|
| |
| In more than 5 years | 417 | | 483 | | 870 | | 1,888 | |
|
|
|
|
|
|
|
| |
| | 22,125 | | 24,174 | | 18,780 | | 14,307 | |
|
|
|
|
|
|
|
| |
| Banking business | 1,178 | | 2,454 | | 18,780 | | 14,307 | |
|
|
|
|
|
|
|
| |
| Trading business | 20,947 | | 21,720 | | – | | – | |
|
|
|
|
|
|
|
| |
| | 22,125 | | 24,174 | | 18,780 | | 14,307 | |
|
|
|
|
|
|
|
| |
| | |
| Fair value disclosures, to the extent practicable, are included in note 64, Fair | |
| values of financial instruments. | | | | | | | |
| | | | | | | | | |
| 32. Customer accounts | | | | | | | | |
| | | | Group | | | | Company | |
|
|
|
|
|
|
|
| |
| | 2003 | | 2002 | | 2003 | | 2002 | |
| | £m | | £m | | £m | | £m | |
|
|
|
|
|
|
|
| |
| Retail deposits | 60,534 | | 59,275 | | 51,469 | | 50,631 | |
|
|
|
|
|
|
|
| |
| Amounts due to subsidiaries | – | | – | | 3,886 | | 3,260 | |
|
|
|
|
|
|
|
| |
| Sale and repurchase | | | | | | | | |
| agreements | 4,602 | | 6,047 | | – | | – | |
|
|
|
|
|
|
|
| |
| Other customer accounts | 9,265 | | 11,444 | | 2,545 | | 1,553 | |
|
|
|
|
|
|
|
| |
| | 74,401 | | 76,766 | | 57,900 | | 55,444 | |
|
|
|
|
|
|
|
| |
| Repayable: | | | | | | | | |
|
|
|
|
|
|
|
| |
| On demand | 46,847 | | 51,161 | | 43,404 | | 45,847 | |
|
|
|
|
|
|
|
| |
| In not more than 3 months | 21,900 | | 19,325 | | 13,526 | | 8,538 | |
|
|
|
|
|
|
|
| |
| In more than 3 months | | | | | | | | |
| but not more than 1 year | 2,820 | | 1,951 | | 77 | | 85 | |
|
|
|
|
|
|
|
| |
| In more than 1 year but | | | | | | | | |
| not more than 5 years | 641 | | 1,853 | | 27 | | 103 | |
|
|
|
|
|
|
|
| |
| In more than 5 years | 2,193 | | 2,476 | | 866 | | 871 | |
|
|
|
|
|
|
|
| |
| | 74,401 | | 76,766 | | 57,900 | | 55,444 | |
|
|
|
|
|
|
|
| |
| Banking business | 63,638 | | 67,934 | | 57,900 | | 55,444 | |
|
|
|
|
|
|
|
| |
| Trading business | 10,763 | | 8,832 | | – | | – | |
|
|
|
|
|
|
|
| |
| | 74,401 | | 76,766 | | 57,900 | | 55,444 | |
|
|
|
|
|
|
|
| |
Included in Group and Company customer accounts are amounts due to associated undertakings of £15m (2002: £5m) and £15m (2002: £5m), respectively
Contracts involving the receipt of cash on which customers receive an index-linked return are accounted for in substance as equity index-linked deposits. The current market value of the contract is reported within Other customer accounts.
Fair value disclosures, to the extent practicable, are included in note 64, Fair values of financial instruments.
| Abbey Annual Report and Accounts 2003 | 137 |
Back to Contents
Financial Statements
Notes to the Financial Statements continue
| 33. | Debt securities in issue |
| | |
| | | | | | | | Group | |
|
|
|
|
|
|
|
| |
| | 2003 | | 2003 | | 2002 | | 2002 | |
| | Book | | Market | | Book | | Market | |
| | value | | value | | value | | value | |
| | £m | | £m | | £m | | £m | |
|
|
|
|
|
|
|
| |
| Bonds and medium term | | | | | | | | |
| notes | 14,939 | | 14,996 | | 17,449 | | 17,709 | |
|
|
|
|
|
|
|
| |
| Other debt securities | | | | | | | | |
| in issue | 9,895 | | 9,897 | | 30,630 | | 30,631 | |
|
|
|
|
|
|
|
| |
| | 24,834 | | 24,893 | | 48,079 | | 48,340 | |
|
|
|
|
|
|
|
| |
The market values for medium and long term debt securities in issue have been determined using quoted market prices where reliable prices are available. In other cases, market values have been determined using in-house pricing models, or stated at amortised cost.
| | | | Company | |
|
|
|
| |
| | 2003 | | 2002 | |
| | £m | | £m | |
|
|
|
| |
| Bonds and medium term notes | – | | – | |
|
|
|
| |
| Other debt securities in issue | 4 | | 4 | |
|
|
|
| |
| | 4 | | 4 | |
|
|
|
| |
Bonds and medium term notes are repayable:
| | | | Group | | | | Company | |
|
|
|
|
|
|
|
| |
| | 2003 | | 2002 | | 2003 | | 2002 | |
| | £m | | £m | | £m | | £m | |
|
|
|
|
|
|
|
| |
| In not more than 3 months | 4,295 | | 2,523 | | – | | – | |
|
|
|
|
|
|
|
| |
| In more than 3 months | | | | | | | | |
| but not more than 1 year | 1,742 | | 3,307 | | – | | – | |
|
|
|
|
|
|
|
| |
| In more than 1 year but | | | | | | | | |
| not more than 2 years | 2,095 | | 5,575 | | – | | – | |
|
|
|
|
|
|
|
| |
| In more than 2 years but | | | | | | | | |
| not more than 5 years | 4,391 | | 2,800 | | – | | – | |
|
|
|
|
|
|
|
| |
| In more than 5 years | 2,416 | | 3,244 | | – | | – | |
|
|
|
|
|
|
|
| |
| | 14,939 | | 17,449 | | – | | – | |
|
|
|
|
|
|
|
| |
Other debt securities in issue are repayable:
| | | | Group | | | | Company | |
|
|
|
|
|
|
|
| |
| | 2003 | | 2002 | | 2003 | | 2002 | |
| | £m | | £m | | £m | | £m | |
|
|
|
|
|
|
|
| |
| In not more than 3 months | 5,114 | | 19,933 | | – | | – | |
|
|
|
|
|
|
|
| |
| In more than 3 months but | | | | | | | | |
| not more than 1 year | 3,573 | | 9,513 | | – | | – | |
|
|
|
|
|
|
|
| |
| In more than 1 year but | | | | | | | | |
| not more than 2 years | 789 | | 609 | | – | | – | |
|
|
|
|
|
|
|
| |
| In more than 2 years but | | | | | | | | |
| not more than 5 years | 21 | | 110 | | 4 | | 4 | |
|
|
|
|
|
|
|
| |
| In more than 5 years | 398 | | 465 | | – | | – | |
|
|
|
|
|
|
|
| |
| | 9,895 | | 30,630 | | 4 | | 4 | |
|
|
|
|
|
|
|
| |
| | | | Group | | | | Company | |
|
|
|
|
|
|
|
| |
| | 2003 | | 2002 | | 2003 | | 2002 | |
| | £m | | £m | | £m | | £m | |
|
|
|
|
|
|
|
| |
| Creditors and | | | | | | | | |
| accrued expenses | 2,122 | | 1,623 | | 1,051 | | 803 | |
|
|
|
|
|
|
|
| |
| Short positions in | | | | | | | | |
| government debt | | | | | | | | |
| securities and equity shares | 4,303 | | 3,456 | | – | | – | |
|
|
|
|
|
|
|
| |
| Taxation | (5 | ) | 104 | | (137 | ) | (48 | ) |
|
|
|
|
|
|
|
| |
| Foreign exchange, interest | | | | | | | | |
| rate, equity & credit contracts: | | | | | | | | |
|
|
|
|
|
|
|
| |
| Negative market value of | | | | | | | | |
| trading derivative contracts | | | | | | | | |
| (see note 51) | 4,762 | | 3,467 | | – | | – | |
|
|
|
|
|
|
|
| |
| Translation differences on | | | | | | | | |
| foreign exchange derivatives | | | | | | | | |
| used for hedging purposes | 269 | | 471 | | 115 | | – | |
|
|
|
|
|
|
|
| |
| Obligations under finance | | | | | | | | |
| leases all payable in: | | | | | | | | |
|
|
|
|
|
|
|
| |
| Less than 1 year | 1 | | 3 | | 1 | | 3 | |
|
|
|
|
|
|
|
| |
| 1 year to 5 years | – | | 1 | | – | | 1 | |
|
|
|
|
|
|
|
| |
| | 11,452 | | 9,125 | | 1,030 | | 759 | |
|
|
|
|
|
|
|
| |
Creditors and accrued expenses have been restated from £2,108m to £1,623m due to Abbey adopting value date accounting for sale and repurchase agreements with non standard settlement.
Short positions in government debt securities are mainly held for trading liquidity and hedging purposes. The market value of short positions in debt securities and equity shares is £4,303m (2002: £3,459m).
| 35. | Accruals and deferred income |
| | | | Group | | | | Company | |
|
|
|
|
|
|
|
| |
| | 2003 | | 2002 | | 2003 | | 2002 | |
| | £m | | £m | | £m | | £m | |
|
|
|
|
|
|
|
| |
| Interest due to subsidiaries | – | | – | | 89 | | 187 | |
|
|
|
|
|
|
|
| |
| Other accrued interest | 1,284 | | 1,840 | | 700 | | 724 | |
|
|
|
|
|
|
|
| |
| Deferred income from | | | | | | | | |
| residential mortgage lending | 79 | | 131 | | – | | – | |
|
|
|
|
|
|
|
| |
| Other deferred income | 219 | | 247 | | 34 | | 30 | |
|
|
|
|
|
|
|
| |
| | 1,582 | | 2,218 | | 823 | | 941 | |
|
|
|
|
|
|
|
| |
During the year, £45m (2002: £85m) of deferred income relating to high loan to value lending was taken to the profit and loss account.
| 36. | Provisions for liabilities and charges |
| | | | Group | | | | Company | |
|
|
|
|
|
|
|
| |
| | 2003 | | 2002 | | 2003 | | 2002 | |
| | £m | | £m | | £m | | £m | |
|
|
|
|
|
|
|
| |
| Deferred taxation | | | | | | | | |
| (see note 37) | 690 | | 952 | | – | | – | |
|
|
|
|
|
|
|
| |
| Other provisions for liabilities | | | | | | | | |
| and charges (see note 38) | 146 | | 76 | | 100 | | 43 | |
|
|
|
|
|
|
|
| |
| | | | | | | | | |
| | 836 | | 1,028 | | 100 | | 43 | |
|
|
|
|
|
|
|
| |
| | |
| 138 | Abbey Annual Report and Accounts 2003 |
Back to Contents
Financial Statements
Notes to the Financial Statements continued
| 37. | Deferred taxation | | | | | | | | |
| | | | | | | | | |
| | | | Group | | | | Company | |
|
|
|
|
|
|
|
| |
| | 2003 | | 2002 | | 2003 | | 2002 | |
| £m | £m | £m | £m |
|
|
|
|
|
|
|
| |
| Tax effect of timing | | | | | | | | |
| differences due to: | | | | | | | | |
|
|
|
|
|
|
|
| |
| Excess of capital allowances | | | | | | | | |
| over depreciation | (64 | ) | (39 | ) | (54 | ) | (27 | ) |
|
|
|
|
|
|
|
| |
| Other | (98 | ) | (26 | ) | (68 | ) | (53 | ) |
|
|
|
|
|
|
|
| |
| Capital allowances on | | | | | | | | |
| finance lease receivables | 852 | | 1,017 | | – | | – | |
|
|
|
|
|
|
|
| |
| | 690 | | 952 | | (122 | ) | (80 | ) |
|
|
|
|
|
|
|
| |
| | | | | |
| | Group | | Company | |
| £m | | £m | |
|
|
|
| |
| At 1 January 2003 | 952 | | (80 | ) |
|
|
|
| |
| Transfer from profit and loss account | 4 | | (42 | ) |
|
|
|
| |
| Disposals of subsidiary undertakings | (266 | ) | – | |
|
|
|
| |
| At 31 December 2003 | 690 | | (122 | ) |
|
|
|
| |
| Deferred tax asset (see note 28) | – | | (122 | ) |
|
|
|
| |
| Deferred tax liabilities | 690 | | – | |
|
|
|
| |
| | | | | | |
| 38. | Other provisions for liabilities and charges | | | | | | | |
| | | | | | | | | | Group | |
|
|
|
|
|
|
|
|
|
| |
| | Pension | | Provisions | | Pension | | | | | |
| | and other | | for | | misselling | | | | |
| | similar | | commit- | | compen- | | Other | | |
| | obligations | (1) | ments | (2) | sation | (3) | provisions | (4) | Total |
| | £m | | £m | | £m | | £m | | £m |
|
|
|
|
|
|
|
|
|
| |
| At 1 January 2003 | 7 | | 14 | | 8 | | 47 | | 76 | |
|
|
|
|
|
|
|
|
|
| |
| Transfer from profit | | | | | | | | | | |
| and loss account | 128 | | 26 | | 4 | | 74 | | 232 | |
|
|
|
|
|
|
|
|
|
| |
| Pension contributions/ | | | | | | | | | | |
| provisions utilised | (128 | ) | (16 | ) | (8 | ) | (10 | ) | (162 | ) |
|
|
|
|
|
|
|
|
|
| |
| At 31 December 2003 | 7 | | 24 | | 4 | | 111 | | 146 | |
|
|
|
|
|
|
|
|
|
| |
| | | | | | | | | | | |
| | | | | | | | | | Company | |
|
|
|
|
|
|
|
|
|
| |
| | Pension | | Provisions | | Pension | | | | | |
| | and other | | for | | misselling | | | | |
| | similar | | commit- | | compen- | | Other | | |
| | obligations | (1) | ments | (2) | sation | (3) | provisions | (4) | Total |
| | £m | | £m | | £m | | £m | | £m |
|
|
|
|
|
|
|
|
|
| |
| At 1 January 2003 | (10 | ) | 1 | | 5 | | 47 | | 43 | |
|
|
|
|
|
|
|
|
|
| |
| Transfer from profit | | | | | | | | | | |
| and loss account | 111 | | 25 | | – | | 68 | | 204 | |
|
|
|
|
|
|
|
|
|
| |
| Pension contributions/ | | | | | | | | | | |
| provisions utilised | (129 | ) | (6 | ) | (3 | ) | (9 | ) | (147 | ) |
|
|
|
|
|
|
|
|
|
| |
| At 31 December 2003 | (28 | ) | 20 | | 2 | | 106 | | 100 | |
|
|
|
|
|
|
|
|
|
| |
The £104m charge shown in the profit and loss account in respect of provisions for contingent liabilities and commitments comprises the amounts transferred from the profit and loss account and unutilised provisions reversed for provisions for commitments, pension misselling compensation and other provisions.
| (1) | Pension and other similar obligations |
| The above balance represents the difference between amounts paid to the respective pension schemes of the Group and amounts charged to the profit and loss account in accordance with SSAP 24, Accounting for pension costs. |
| In addition to Pension and other similar obligations included in the above table, a balance in respect of the pension surplus acquired with the purchase of the business of National and Provincial Building Society (N&P) is included within Other assets. This balance, which was £15m (2002: £17m) at 31 December 2003, is being amortised over the remaining service lives of employees contributing to the scheme, and £2m (2002: £2m) was charged to the profit and loss account in the year ended 31 December 2003. See also note 53, ‘Retirement benefits’. |
| (2) | Provisions for commitments |
| This comprises amounts in respect of committed expenditure, including amounts in respect of vacant premises and provisions for loyalty bonuses payable in certain unit trusts managed within the Life Assurance businesses. |
| (3) | Pension misselling compensation |
| This comprises amounts in respect of compensation payable as a result of the ongoing review of business involving the transfers from occupational to personal pension schemes and the opting-out of and the non-joining of occupational pension schemes. |
| (4) | Other provisions |
| Other provisions principally comprise amounts in respect of litigation and related expenses and various other claims with respect to product misselling exposures. |
| 39. | Subordinated liabilities including convertible debt |
| | | | | |
| | | | Group | |
|
|
|
| |
| | 2003 | | 2002 | |
| £m | £m |
|
|
|
| |
| Dated subordinated liabilities: | | | | |
|
|
|
| |
| Subordinated guaranteed floating rate | | | | |
| notes 2003 (US $100m) | – | | 62 | |
|
|
|
| |
| Subordinated collared floating rate | | | | |
| notes 2004 (CAN $100m) | 43 | | 39 | |
|
|
|
| |
| 8.75% Subordinated guaranteed bond 2004 | 150 | | 150 | |
|
|
|
| |
| 8.2% Subordinated bond 2004 (US $500m) | 280 | | 310 | |
|
|
|
| |
| 6.69% Subordinated bond 2005 (US $750m) | 420 | | 464 | |
|
|
|
| |
| 10.75% Subordinated bond 2006 | 100 | | 101 | |
|
|
|
| |
| Subordinated guaranteed floating rate step-up | | | | |
| notes 2009 (Swiss Fr 130m) | 59 | | 58 | |
|
|
|
| |
| 5.00% Subordinated bond 2009 (511.3m) | 359 | | 331 | |
|
|
|
| |
| 4.625% Subordinated notes 2011 (500m) | 352 | | 324 | |
|
|
|
| |
| 11.50% Subordinated guaranteed bond 2017 | 149 | | 149 | |
|
|
|
| |
| 10.125% Subordinated guaranteed bond 2023 | 149 | | 149 | |
|
|
|
| |
| 7.57% Subordinated notes 2029 (US $1,000m) | 554 | | 613 | |
|
|
|
| |
| 6.50% Subordinated notes 2030 | 149 | | 149 | |
|
|
|
| |
| 7.25% Subordinated notes 2021 | 200 | | 200 | |
|
|
|
| |
| Callable capped subordinated floating | | | | |
| rate notes 2012 (US $50m) | 28 | | 31 | |
|
|
|
| |
| Callable subordinated floating rate | | | | |
| notes 2012 (US $50m) | 28 | | 31 | |
|
|
|
| |
| Callable subordinated floating | | | | |
| rate notes 2012 (500m) | 352 | | 324 | |
|
|
|
| |
| | |
| Abbey Annual Report and Accounts 2003 | 139 |
Back to Contents
Financial Statements
Notes to the Financial Statements continued
| | | | Group | |
|
|
|
| |
| | 2003 | | 2002 | |
| £m | | £m | |
|
|
|
| |
| Undated subordinated liabilities: | | | | |
|
|
|
| |
| 10.0625% Exchangeable subordinated capital securities | 199 | | 199 | |
|
|
|
| |
| 7.35% Perpetual subordinated reset capital | | | | |
| securities (US $500m) | 279 | | 309 | |
|
|
|
| |
| 7.25% Perpetual subordinated capital | | | | |
| securities (US $150m) | 84 | | 92 | |
|
|
|
| |
| 7.10% Perpetual callable subordinated notes (US $150m) | 84 | | 93 | |
|
|
|
| |
| 7.00% Perpetual subordinated capital securities | | | | |
| (US $250m) | 140 | | 154 | |
|
|
|
| |
| 6.70% Perpetual subordinated reset capital | | | | |
| securities (US $500m) | 279 | | 308 | |
|
|
|
| |
| 6.00% Step-down Perpetual callable subordinated | | | | |
| notes (100m) | 71 | | 65 | |
|
|
|
| |
| 5.56% Subordinated guaranteed notes (YEN 15,000m) | 79 | | 78 | |
|
|
|
| |
| 5.50% Subordinated guaranteed notes (YEN 5,000m) | 26 | | 26 | |
|
|
|
| |
| Fixed/Floating rate subordinated notes (YEN 5,000m) | 26 | | 26 | |
|
|
|
| |
| 7.50% 10 Year step-up perpetual subordinated notes | 321 | | 320 | |
|
|
|
| |
| 7.50% 15 Year step-up perpetual subordinated notes | 425 | | 425 | |
|
|
|
| |
| 7.38% 20 Year step-up perpetual subordinated notes | 173 | | 173 | |
|
|
|
| |
| 7.13% 30 Year step-up perpetual subordinated notes | 279 | | 279 | |
|
|
|
| |
| 7.13% Fixed to floating rate perpetual | | | | |
| subordinated notes (400m) | 280 | | 258 | |
|
|
|
| |
| 7.25% Perpetual callable subordinated | | | | |
| notes (US $400m) | 220 | | 242 | |
|
|
|
| |
| | 6,337 | | 6,532 | |
|
|
|
| |
| | | | | |
| | | | Company | |
|
|
|
| |
| | 2003 | | 2002 | |
| £m | £m |
|
|
|
|
|
| Dated subordinated liabilities: | | | | |
|
|
|
|
|
| Subordinated floating rate notes 2003 (US $75m)* | – | | 62 | |
|
|
|
|
|
| Subordinated floating rate notes 2004 (US $74m)* | 41 | | 46 | |
|
|
|
|
|
| Subordinated floating rate notes 2004* | 150 | | 150 | |
|
|
|
|
|
| Subordinated floating rate notes 2004 (US $500m)* | 280 | | 310 | |
|
|
|
|
|
| 6.69% Subordinated bond 2005 (US $750m) | 420 | | 464 | |
|
|
|
|
|
| 10.75% Subordinated bond 2006 | 100 | | 101 | |
|
|
|
|
|
| Subordinated floating rate notes 2009 (US $102m)* | 57 | | 63 | |
|
|
|
|
|
| Subordinated floating rate notes 2009 (511.3m) | 359 | | 331 | |
|
|
|
|
|
| 4.625% Subordinated notes 2011 (500m) | 352 | | 324 | |
|
|
|
|
|
| 11.59% Subordinated loan stock 2017* | 150 | | 150 | |
|
|
|
|
|
| 10.18% Subordinated loan stock 2023* | 150 | | 150 | |
|
|
|
|
|
| 7.57% Subordinated notes 2029 (US $1,000m) | 554 | | 613 | |
|
|
|
|
|
| 6.50% Subordinated notes 2030 | 149 | | 149 | |
|
|
|
|
|
| 8.96% Subordinated notes 2030 (US $1,000m)** | 554 | | 613 | |
|
|
|
|
|
| Callable capped subordinated floating rate | | | | |
| notes 2012 (US $50m) | 28 | | 31 | |
|
|
|
|
|
| Callable subordinated floating rate notes 2012 (US $50m) | 28 | | 31 | |
|
|
|
|
|
| Callable subordinated floating rate notes 2012 (500m) | 352 | | 324 | |
|
|
|
|
|
| | | | Company | |
|
|
|
| |
| | 2003 | | 2002 | |
| £m | £m |
|
|
|
| |
| Undated subordinated liabilities: | | | | |
|
|
|
| |
| 10.0625% Exchangeable subordinated capital securities | 199 | | 199 | |
|
|
|
| |
| 7.35% Perpetual subordinated reset capital securities | | | | |
| (US $500m) | 279 | | 309 | |
|
|
|
| |
| 7.25% Perpetual subordinated capital | | | | |
| securities (US $150m) | 84 | | 92 | |
|
|
|
| |
| 7.10% Perpetual callable subordinated notes (US $150m) | 84 | | 93 | |
|
|
|
| |
| 7.00% Perpetual subordinated capital securities | | | | |
| (US $250m) | 140 | | 154 | |
|
|
|
| |
| 6.70% Perpetual subordinated reset capital securities | | | | |
| (US $500m) | 279 | | 308 | |
|
|
|
| |
| 6.00% Step-down perpetual callable subordinated | | | | |
| notes (100m) | 71 | | 65 | |
|
|
|
| |
| 5.56% Subordinated guaranteed notes (YEN 15,000m) | 78 | | 79 | |
|
|
|
| |
| 5.50% Subordinated guaranteed notes (YEN 5,000m) | 26 | | 26 | |
|
|
|
| |
| Fixed/Floating rate subordinated notes (YEN 5,000m) | 26 | | 26 | |
|
|
|
| |
| 7.50% 10 Year step-up perpetual subordinated notes | 320 | | 321 | |
|
|
|
| |
| 7.50% 15 Year step-up perpetual subordinated notes | 425 | | 425 | |
|
|
|
| |
| 7.38% 20 Year step-up perpetual subordinated notes | 173 | | 173 | |
|
|
|
| |
| 7.13% 30 Year step-up perpetual subordinated notes | 279 | | 279 | |
|
|
|
| |
| 7.13% Fixed to floating rate perpetual subordinated | | | | |
| notes (400m) | 280 | | 258 | |
|
|
|
| |
| 7.25% Perpetual callable subordinated notes | | | | |
| (US $400m) | 220 | | 242 | |
|
|
|
| |
| | 6,689 | | 6,959 | |
|
|
|
| |
* These represent the on-lending to the Company, on a subordinated basis, of issues by subsidiary companies.
** This represents the on-lending to the Company, on a subordinated basis, of the issue of preferred securities (see note 41).
The subordinated floating rate notes pay a rate of interest related to the LIBOR of the currency of denomination.
The 10.0625% Exchangeable subordinated capital securities are exchangeable into fully paid 10.375% non-cumulative non-redeemable sterling preference shares of £1 each, at the option of Abbey. Exchange may take place on any interest payment date providing that between 30 and 60 days notice has been given to the holders. The holders will receive one new sterling preference share for each £1 principal amount of capital securities held. Note 42 details the rights attaching to these shares, as they are the same.
The 7.35% Perpetual subordinated reset capital securities are redeemable at par, at the option of Abbey, on 15 October 2006 and each fifth anniversary thereafter.
The 7.25% Perpetual subordinated capital securities are redeemable at par, at the option of Abbey, on or after 15 June 2004.
The 7.10% Perpetual callable subordinated notes are redeemable at par, at the option of Abbey, on 12 March 2004 and thereafter on each interest payment date.
The 7.00% Perpetual subordinated capital securities are redeemable at par, at the option of Abbey, on or after 29 April 2004.
The 6.70% Perpetual subordinated reset capital securities are redeemable at par, at the option of Abbey, on 15 June 2008 and each fifth anniversary thereafter.
The 6.00% Step-down perpetual callable subordinated notes are redeemable at par, at the option of Abbey, on 19 April 2004 and thereafter on each interest payment date.
The 5.56% Subordinated guaranteed notes are redeemable at par, at the option of Abbey, on 31 January 2015 and each fifth anniversary thereafter.
The 5.50% Subordinated guaranteed notes are redeemable at par, at the option of Abbey, on 27 June 2015 and each fifth anniversary thereafter.
| | |
| 140 | Abbey Annual Report and Accounts 2003 |
Back to Contents
Financial Statements
Notes to the Financial Statements continued
The Fixed/Floating rate subordinated notes are redeemable at par, at the option of Abbey, on 27 December 2016 and each interest payment date anniversary thereafter.
The 7.50% 10 Year step-up perpetual subordinated notes are redeemable at par, at the option of Abbey, on 28 September 2010 and each fifth anniversary thereafter.
The 7.50% 15 Year step-up perpetual subordinated notes are redeemable at par, at the option of Abbey, on 28 September 2015 and each fifth anniversary thereafter.
The 7.38% 20 Year step-up perpetual subordinated notes are redeemable at par, at the option of Abbey, on 28 September 2020 and each fifth anniversary thereafter.
The 7.13% 30 Year step-up perpetual subordinated notes are redeemable at par, at the option of Abbey, on 30 September 2030 and each fifth anniversary thereafter.
The 7.13% Fixed to Floating rate perpetual subordinated notes are redeemable at par, at the option of Abbey, on 28 September 2010 and each fifth anniversary thereafter.
The 7.25% perpetual callable subordinated notes are redeemable at par, at the option of Abbey, at any time on or after 15 August 2006.
In common with other debt securities issued by Group companies, the subordinated liabilities are redeemable in whole at the option of Abbey, on any interest payment date, in the event of certain tax changes affecting the treatment of payments of interest on the subordinated liabilities in the United Kingdom, at their principal amount together with any accrued interest.
Subordinated liabilities including convertible debt securities in issue are repayable:
| | Group | | Company | |
|
|
|
|
|
|
|
| |
| | 2003 | | 2002 | | 2003 | | 2002 | |
| £m | £m | £m | £m |
|
|
|
|
|
|
|
| |
| In 1 year or less | 473 | | 62 | | 472 | | 62 | |
|
|
|
|
|
|
|
| |
| In more than 1 year but | | | | | | | | |
| not more than 2 years | 420 | | 499 | | 420 | | 506 | |
|
|
|
|
|
|
|
| |
| In more than 2 years but | | | | | | | | |
| not more than 5 years | 100 | | 623 | | 100 | | 565 | |
|
|
|
|
|
|
|
| |
| In more than 5 years | 2,379 | | 2,301 | | 2,733 | | 2,779 | |
|
|
|
|
|
|
|
| |
| Undated | 2,965 | | 3,047 | | 2,964 | | 3,047 | |
|
|
|
|
|
|
|
| |
| | 6,337 | | 6,532 | | 6,689 | | 6,959 | |
|
|
|
|
|
|
|
| |
Subordinated liabilities including convertible debt issued by the Group have a market value, calculated using quoted market prices where available, of £7,068m (2002: £7,217m).
| 40. | Other long term capital instruments |
| | |
| | Group | | Company | |
|
|
|
|
|
|
| |
| | 2003 | 2002 | | 2003 | | 2002 | |
| | £m | £m | | £m | | £m | |
|
|
|
|
|
|
| |
| Other long term capital | | | | | | | |
| instruments | 742 | 771 | | 742 | | 771 | |
|
|
|
|
|
|
| |
Other long term capital instruments comprise £300m Step-up Callable Perpetual Reserve Capital Instruments (RCIs), $500m tier One Perpetual Subordinated Debt Securities (Securities) and £175m Fixed/Floating Rate Tier One Preferred Income Capital Securities (TOPICs).
£300m Step-up Callable Perpetual Reserve Capital Instruments
The Reserve Capital Instruments were issued in 2001 by Abbey National plc. Reserve Capital Instruments are redeemable by Abbey on 14 February 2026 or on each coupon payment date thereafter, subject to the prior approval of the Financial Services Authority and provided that the auditors have reported to the Trustee within the previous six months that the solvency condition is met.
The Reserve Capital Instruments bear interest at a rate of 7.037% per annum, payable annually in arrears, from 14 February 2001 to 14 February 2026. Thereafter, the reserve capital instruments will bear
interest at a rate, reset every five years, of 3.75% per annum above the gross redemption yield on the UK five year benchmark gilt rate.
$500m Tier One Perpetual Subordinated Debt Securities
The Securities were issued on 8 August 2002 by Abbey National plc. The Securities have no maturity date. However, Abbey National plc has the option to redeem the Securities in whole, but not in part on 15 September 2007 or on each coupon payment date thereafter.
The Securities bear interest at a rate of 7.375% per annum, payable in US dollars quarterly in arrears.
£175m Fixed/Floating Rate Tier One Preferred Income Capital Securities
The Tier One Preferred Income Capital Securities were issued on 9 August 2002 by Abbey National plc. The Tier One Preferred Income Capital Securities are redeemable by Abbey National plc in whole but not in part on 9 February 2018 or on each coupon payment date thereafter, subject to the prior approval of the Financial Services Authority.
The Tier One Preferred Income Capital Securities bear interest at a rate of 6.984% par annum, payable semi-annually in arrears. From (and including) 9 February 2018, the Tier One Preferred Income Capital Securities will bear interest, at a rate reset semi-annually of 1.86% per annum above the six-month sterling LIBOR rate, payable semi-annually in arrears.
The Reserve Capital Instruments, Securities and Tier One Preferred Income Capital Securities are not redeemable at the option of the holders and the holders do not have any rights against other Abbey Group companies. Upon the occurrence of certain tax or regulatory events, the Reserve Capital Instruments may be exchanged, their terms varied, or redeemed.
Interest payments may be deferred, but Abbey National plc may not declare or pay dividends on or redeem or repurchase any junior securities until Abbey National plc next make a scheduled payment on the Reserve Capital Instruments, Securities and Tier One Preferred Income Capital Securities.
The Reserve Capital Instruments, Securities and Tier One Preferred Income Capital Securities are unsecured securities of Abbey National plc and are subordinated to the claims of unsubordinated creditors and subordinated creditors holding Abbey National plc loan capital. Upon the winding up of Abbey National plc, the holder of each Reserve Capital Instruments, Securities and Tier One Preferred Income Capital will rank pari passu with the holders of the most senior class or classes of preference shares (if any) of Abbey National plc then in issue and in priority to all other Abbey shareholders.
| 41. | Minority interests – non-equity |
Abbey National First Capital BV, Abbey National Capital Trust I, Abbey National Capital Trust II, Abbey National Capital LPI and Abbey National Capital LP II are each 100% owned finance subsidiaries of Abbey National plc. Abbey National First Capital BV has registered with the SEC and issued to the public subordinated notes and medium-term notes that have been fully and unconditionally guaranteed by Abbey National plc. Abbey National Capital Trust I and Abbey National Capital Trust II have registered trust preferred securities, and Abbey National Capital LP I and Abbey National Capital LP II have registered partnership preferred securities, for issuance in the United States. Abbey National Capital Trust I and Abbey National Capital Trust II each serve solely as passive vehicles holding the partnership preferred securities issued by Abbey National Capital LP I and Abbey National Capital LP II, respectively, and each has passed all the rights relating to such partnership preferred securities to the holders of the issued trust preferred securities. All of the trust preferred securities and the partnership preferred securities have been fully and unconditionally guaranteed on a subordinated basis by Abbey National plc. Abbey National Capital Trust I has issued to the public US $1,000,000,000 of 8.963% Non-Cumulative Trust Preferred Securities. There are no significant restrictions on the ability of Abbey National plc to obtain |
| | | |
| Abbey Annual Report and Accounts 2003 | | 141 |
Back to Contents
Financial Statements
Notes to the Financial Statements continued
funds, by dividend or loan, from any subsidiary. After 30 June 2030, the distribution rate on the preferred securities will be at the rate of 2.825% per annum above the three-month US $ LIBOR rate for the relevant distribution period.
The preferred securities are not redeemable at the option of the holders and the holders do not have any rights against other Abbey Group companies. The partnership preferred securities may be redeemed by the partnership, in whole or in part, on 30 June 2030 and on each distribution payment date thereafter. Redemption by the partnership of the partnership preferred securities may also occur in the event of a tax or regulatory change. Generally, holders of the preferred securities will have no voting rights.
On a return of capital or on a distribution of assets on a winding up of the partnership, holders of the partnership preferred securities will be entitled to receive, for each partnership preferred security a liquidation preference of US $1,000, together with any due and accrued distributions and any additional amounts, out of the assets of the partnership available for distribution.
The preferred securities, the partnership preferred securities and the subordinated guarantees taken together will not entitle the holders to receive more than they would have been entitled to receive had they been the holders of directly issued non-cumulative, non-voting preference shares of Abbey National plc.
| 42. | Called up share capital and share premium account |
| | |
| | Ordinary
shares
of 10 pence
each
£m | | Preference
shares of
£1 each
£m | | Preference
shares of
US$ 0.01each
£m | | | | Total
£m | |
Preference
shares of
o0.01 each
£m |
|
|
|
|
|
|
|
|
|
| |
| Authorised share capital | | | | | | | | | | |
|
|
|
|
|
|
|
|
|
| |
| At 31 December 2002 | 175 | | 1,000 | | 6 | | 6 | | 1,187 | |
|
|
|
|
|
|
|
|
|
| |
| At 31 December 2003 | 175 | | 1,000 | | 6 | | 6 | | 1,187 | |
|
|
|
|
|
|
|
|
|
| |
| Issued and fully paid | | | | | | | | | | |
| share capital | | | | | | | | | | |
|
|
|
|
|
|
|
|
|
| |
| At 31 December 2002 | 146 | | 325 | | – | | – | | 471 | |
|
|
|
|
|
|
|
|
|
| |
| At 31 December 2003 | 146 | | 325 | | – | | – | | 471 | |
|
|
|
|
|
|
|
|
|
| |
| Share premium account | | | | | | | | | | |
|
|
|
|
|
|
|
|
|
| |
| At 1 January 2003 | 1,732 | | 9 | | 414 | | – | | 2,155 | |
|
|
|
|
|
|
|
|
|
| |
| Shares issued | 20 | | – | | – | | – | | 20 | |
|
|
|
|
|
|
|
|
|
| |
| Redemptions | – | | – | | (116 | ) | – | | (116 | ) |
|
|
|
|
|
|
|
|
|
| |
| Amortisation of | | | | | | | | | | |
| issue costs | – | | – | | (2 | ) | – | | (2 | ) |
|
|
|
|
|
|
|
|
|
| |
| Transfer from profit | | | | | | | | | | |
| and loss reserve | – | | – | | 2 | | – | | 2 | |
|
|
|
|
|
|
|
|
|
| |
| At 31 December 2003 | 1,752 | | 9 | | 298 | | – | | 2,059 | |
|
|
|
|
|
|
|
|
|
| |
| | Ordinary
shares of
10 pence
each
£m | | Preference
shares of
£1 each
£m | | Preference
shares of
US$ 0.01
each
£m | | Preference
shares of
of o0.01
each
£m | | Total
£m | |
|
|
|
|
|
|
|
|
|
| |
| Authorised share capital | | | | | | | | | | |
|
|
|
|
|
|
|
|
|
| |
| At 31 December 2001 | 175 | | 1,000 | | 6 | | 6 | | 1,187 | |
|
|
|
|
|
|
|
|
|
| |
| At 31 December 2002 | 175 | | 1,000 | | 6 | | 6 | | 1,187 | |
|
|
|
|
|
|
|
|
|
| |
| Issued and fully paid | | | | | | | | | | |
| share capital | | | | | | | | | | |
|
|
|
|
|
|
|
|
|
| |
| At 31 December 2001 | 145 | | 325 | | – | | – | | 470 | |
|
|
|
|
|
|
|
|
|
| |
| At 31 December 2002 | 146 | | 325 | | – | | – | | 471 | |
|
|
|
|
|
|
|
|
|
| |
| Share premium account | | | | | | | | | | |
|
|
|
|
|
|
|
|
|
| |
| At 1 January 2002 | 1,627 | | 9 | | 414 | | – | | 2,050 | |
|
|
|
|
|
|
|
|
|
| |
| Shares issued | 98 | | – | | – | | – | | 98 | |
|
|
|
|
|
|
|
|
|
| |
| Capitalisation of reserves | | | | | | | | | | |
| in respect of shares | | | | | | | | | | |
| issued via QUEST | 7 | | – | | – | | – | | 7 | |
|
|
|
|
|
|
|
|
|
| |
| Amortisation of | | | | | | | | | | |
| issue costs | – | | – | | 3 | | – | | 3 | |
|
|
|
|
|
|
|
|
|
| |
| Transfer to profit | | | | | | | | | | |
| and loss reserve | – | | – | | (3 | ) | – | | (3 | ) |
|
|
|
|
|
|
|
|
|
| |
| At 31 December 2002 | 1,732 | | 9 | | 414 | | – | | 2,155 | |
|
|
|
|
|
|
|
|
|
| |
| | | | | | | | | | | |
| | Ordinary
shares of
10 pence
each
£m | | Preference
shares of
£1 each
£m | | Preferenc
shares of
US$ 0.01
each
£m | | Preference
shares of
o0.01 each
£m | | Total
£m | |
|
|
|
|
|
|
|
|
|
| |
| Authorised share capital | | | | | | | | | | |
|
|
|
|
|
|
|
|
|
| |
| At 31 December 2000 | 175 | | 1,000 | | 6 | | 6 | | 1,187 | |
|
|
|
|
|
|
|
|
|
| |
| At 31 December 2001 | 175 | | 1,000 | | 6 | | 6 | | 1,187 | |
|
|
|
|
|
|
|
|
|
| |
| Issued and fully paid | | | | | | | | | | |
| share capital | | | | | | | | | | |
|
|
|
|
|
|
|
|
|
| |
| At 31 December 2000 | 143 | | 325 | | – | | – | | 468 | |
|
|
|
|
|
|
|
|
|
| |
| At 31 December 2001 | 145 | | 325 | | – | | – | | 470 | |
|
|
|
|
|
|
|
|
|
| |
| Share premium account | | | | | | | | | | |
|
|
|
|
|
|
|
|
|
| |
| At 1 January 2001 | 1,485 | | 9 | | 116 | | – | | 1,610 | |
|
|
|
|
|
|
|
|
|
| |
| Shares issued | 129 | | – | | 298 | | – | | 427 | |
|
|
|
|
|
|
|
|
|
| |
| Capitalisation of reserves | | | | | | | | | | |
| in respect of shares | | | | | | | | | | |
| issued via QUEST | 13 | | – | | – | | – | | 13 | |
|
|
|
|
|
|
|
|
|
| |
| At 31 December 2001 | 1,627 | | 9 | | 414 | | – | | 2,050 | |
|
|
|
|
|
|
|
|
|
| |
Under the Company’s Executive, All Employee and Sharesave Schemes, employees hold options to subscribe for 52,418,724 (2002: 36,931,259) ordinary shares at prices ranging from 317 to 596 pence per share, exercisable up to September 2013. During the year 223,531 (2002: 3,070,621) ordinary shares were issued on the exercise of options for a consideration of £1.4m (2002: £25m). In addition, 4,037,733 ordinary shares were issued in lieu of cash for dividends in 2003, in accordance with the terms of the Alternative Dividend Plan.
The Qualifying Employee Share Trust operates in conjunction with the Sharesave Scheme by acquiring shares in the Company and using them to satisfy Sharesave options, by delivering the shares to the employees on payment of the option price.
During the year the Qualifying Employee Share Trust has subscribed at market value for ordinary shares at a total cost of £nil (2002: £20m). The Company provided £nil (2002: £7m) to the Qualifying Employee Share Trust for this purpose and £nil (2002: £13m) was received from Sharesave participants. The shares were all transferred by the Qualifying Employee Share Trust to participants in Abbey's Sharesave Scheme in satisfaction of their options. The price paid by option holders, including executive Directors, was 565 pence per share (three year options), 513 pence per share (five year options) and 466 pence per share (seven year options). The Company's contribution has been included as a capitalisation of reserves.
| | | |
| 142 | | Abbey Annual Report and Accounts 2003 |
Back to Contents
Financial Statements
Notes to the Financial Statements continued
Abbey National plc sponsors the Abbey National ESOP Trust, a discretionary trust for the benefit of employees and former employees of the Abbey Group and the AN Employee Trust, a discretionary trust for the benefit of Directors and former Directors of Abbey National plc. The Company has provided £65m to the trustees of Abbey National ESOP Trust and £9m to the trustees of Abbey National Trust, interest free irrevocable loans and gifts of £31m and £6m respectively, to enable them to purchase Abbey National plc ordinary shares, which are used to satisfy options and share awards granted by the Company to meet its commitments arising under employee and Directors’ share schemes. Under the terms of the trusts, the trustees have waived all but a nominal dividend on the shares they hold. The cost of providing these shares, less any amounts paid by employees or Directors, is charged to the profit and loss account on a systematic basis over the relevant performance period for the employees and Directors. At 31 December 2003 and 2002 the number and value of shares held were:
| | AN ESOP Trust | | AN Employee Trust | |
|
|
|
|
| | 2003
£m | | 2002
(restated)
£m | | 2003
£m | | 2002
(restated)
£m | |
|
|
|
|
|
|
|
| |
| Number of shares held (’000) | 7,613 | | 8,589 | | 1,530 | | 1,532 | |
|
|
|
|
|
|
|
| |
| Book value of shares held | 67 | | 67 | | 13 | | 13 | |
|
|
|
|
|
|
|
| |
| Market value of shares held | 40 | | 44 | | 8 | | 8 | |
|
|
|
|
|
|
|
| |
Prior to 2003 such shares were held as an asset within other assets on the balance sheet at the lower of cost and net realisable value with any impairments being taken to the profit and loss account. With the issue of UITF 38 Accounting for ESOP Trusts such shares are now held at cost and treated as Treasury Shares and are taken as a deduction from Shareholders Equity. The 2002 profit and loss account and balance sheet have been restated accordingly.
As of 31 December 2003 there were 1,865,490 shareholders. The following tables show an analysis of their holdings:
| Size of shareholding | Shareholders | | Number of
ordinary shares
of 10 pence each | |
|
|
|
| |
| Shares | | | | |
|
|
|
| |
| 1-100 | 1,093,026 | | 104,447,212 | |
|
|
|
| |
| 101-1,000 | 725,782 | | 276,897,081 | |
|
|
|
| |
| 1,001+ | 44,451 | | 1,081,071,340 | |
|
|
|
| |
| | 1,863,259 | | 1,462,415,633 | |
|
|
|
| |
| | | | | |
| Size of shareholding | Shareholders | | Preference sharesof £1 each | |
|
|
|
| |
| 1-100 | 10 | | 100 | |
|
|
|
| |
| 101-1,000 | 467 | | 35,168 | |
|
|
|
| |
| 1,001+ | 1,716 | | 324,964,732 | |
|
|
|
| |
| | 2,193 | | 325,000,000 | |
|
|
|
| |
| | | | | |
| Size of shareholding | Shareholders | | Preference shares
of US$0.01 each | |
|
|
|
| |
| 1-100 | – | | – | |
|
|
|
| |
| 101-1,000 | 34 | | 16,510 | |
|
|
|
| |
| 1,001+ | 4 | | 17,983,490 | |
|
|
|
| |
| | 38 | | 18,000,000 | |
|
|
|
| |
Sterling preference shares
Holders of the sterling preference shares are entitled to receive a bi-annual non-cumulative preferential dividend payable in sterling out of the distributable profits of the Company. The rate per annum will ensure that the sum of the dividend payable on such date and the associated tax credit (as defined in the terms of the sterling preference shares) represents an annual rate of 85/8% per annum of the nominal amount of shares issued in 1997, and an annual rate of 103/8% for shares issued in 1995 and 1996. On a return of capital or on a distribution of assets on a winding up, the sterling preference shares
shall rank pari passu with any other shares that are expressed to rank pari passu therewith as regards participation in assets, and otherwise in priority to any other share capital of the Company.
On such a return of capital or winding up, each sterling preference share shall, out of the surplus assets of the Company available for distribution amongst the members after payment of the Company’s liabilities, carry the right to receive an amount equal to the amount paid up or credited as paid together with any premium paid on issue and the full amount of any dividend otherwise due for payment.
Other than as set out above, no sterling preference share confers any right to participate on a return of capital or a distribution of assets of the Company.
Holders of the sterling preference shares are not entitled to receive notice of or attend, speak and vote at general meetings of the Company unless the business of the meeting includes the consideration of a resolution to wind up the Company or any resolution varying, altering or abrogating any of the rights, privileges, limitations or restrictions attached to the sterling preference shares or if the dividend on the sterling preference shares has not been paid in full for the three consecutive dividend periods immediately prior to the relevant general meeting.
In any such case, the sterling preference shareholders are entitled to receive notice of and attend the general meeting at which such resolution is proposed and will be entitled to speak and vote on such a resolution but not on any other resolution.
US dollar preference shares
Holders of the US dollar preference shares issued on 8 November 2001 are entitled to receive a quarterly non-cumulative preferential dividend payable in US-dollars out of the distributable profits of the Company payable at the fixed rate of US$1.84375 per share annually (or 7.375% of the US$25 offer price).
The US dollar preference shares are redeemable, in whole or in part, at the option of Abbey at any time and from time to time after five years and one day after the date of original issue. For the 1996 issue, redemption may occur only if the sterling dollar exchange rate is at or above its level at the date of allotment, US$1.654: £1, or in the event of a tax or regulatory change. The conditions precedent being met the 1996 issue of US dollar preference shares were redeemed on the 11 July 2003. A redemption premium of $4m was paid on redemption.
On a return of capital or on a distribution of assets on a winding up, the US dollar preference shares shall rank pari passu with any other shares that are expressed to rank pari passu therewith as regards participation in assets, and otherwise in priority to any other share capital of the Company. On such a return of capital or winding up, each US dollar preference share shall, out of the surplus assets of the Company available for distribution amongst the members after payment of the Company’s liabilities, carry the right to receive an amount equal to $25, payable in US dollars together with any accrued and unpaid dividends at that time.
Other than as set out above, no US dollar preference share confers any right to participate in a return of capital or a distribution of assets of the Company.
Holders of the US dollar preference shares are not entitled to receive notice of or attend, speak and vote at general meetings of the Company unless the business of the meeting includes the consideration of a resolution to wind up the Company or any resolution varying, altering or abrogating any of the rights, privileges, limitations or restrictions attached to the US-dollar preference shares or if the dividend on the US-dollar preference shares has not been paid in full for the six consecutive quarters immediately prior to the relevant general meeting.
In any such case, the US dollar preference shareholders are entitled to receive notice of and attend the general meeting at which such resolution is proposed and will be entitled to speak and vote on such a resolution but not on any other resolution.
| | | |
| Abbey Annual Report and Accounts 2003 | | 143 |
Back to Contents
Financial Statements
Notes to the Financial Statementscontinued
| 43. | Reserves and profit and loss account |
| | | |
| | Profit and loss account | |
|
| |
| | Group | | Company | |
| | £m | | £m | |
|
|
|
| |
| At 1 January 2003 | 3,650 | | 2,895 | |
|
|
|
| |
| (Loss) retained for the financial year | (1,323 | ) | (591 | ) |
|
|
|
| |
| Write-off of goodwill previously taken to reserves | 5 | | – | |
|
|
|
| |
| Goodwill transferred to profit and loss | | | | |
| account during the year | 190 | | – | |
|
|
|
| |
| Exchange differences | (1 | ) | (4 | ) |
|
|
|
| |
| Transfer to share premium | (2 | ) | (2 | ) |
|
|
|
| |
| Share option compensation costs taken to reserves | 8 | | 8 | |
|
|
|
| |
| At 31 December 2003 | 2,527 | | 2,306 | |
|
|
|
| |
| | | |
| | Profit and loss account | |
|
|
|
| |
| | Group | | Company | |
| | £m | | £m | |
|
|
|
| |
| At 1 January 2002 | 4,585 | | 3,815 | |
|
|
|
| |
| (Loss) retained for the financial year | (1,322 | ) | (921 | ) |
|
|
|
| |
| Write-off of goodwill previously taken to reserves | 373 | | – | |
|
|
|
| |
| Goodwill transferred to profit and loss | | | | |
| account during the year | 13 | | – | |
|
|
|
| |
| Exchange differences | (2 | ) | (2 | ) |
|
|
|
| |
| Transfer from share premium | 3 | | 3 | |
|
|
|
| |
| Share option compensation costs taken to reserves | 7 | | 7 | |
|
|
|
| |
| Capitalised on exercise of share options | | | | |
| issued via QUEST | (7 | ) | (7 | ) |
|
|
|
| |
| At 31 December 2002 | 3,650 | | 2,895 | |
|
|
|
| |
| | | |
| | Profit and loss account | |
|
|
|
| |
| | Group | | Company | |
| £m | £m |
|
|
|
| |
| At 1 January 2001 | 4,233 | | 3,236 | |
|
|
|
| |
| Profit retained for the financial year | 346 | | 586 | |
|
|
|
| |
| Share option compensation costs taken to reserves | 6 | | 6 | |
|
|
|
| |
| Exchange Differences | (1 | ) | – | |
|
|
|
| |
| Capitalised on exercise of share options | | | | |
| issued via QUEST | (13 | ) | (13 | ) |
|
|
|
| |
| Revaluation transferred to the profit | | | | |
| and loss account during the year | 14 | | – | |
|
|
|
| |
| At 31 December 2001 | 4,585 | | 3,815 | |
|
|
|
| |
Exchange gains arising from foreign currency borrowings used to hedge investments in overseas Group undertakings of £1m (2002: £2m) have been taken to the reserves of the Group and Company. These exchange movements are matched by corresponding exchange movements on the net investments in the financial statements of the Company and exchange movements on the net assets of overseas Group undertakings in the Group financial statements.
| | | | | | | | | | (restated) | |
| Revaluation | Non-distributable | Treasury shares |
| reserve | reserve | reserve |
|
|
|
|
|
|
|
| |
| | Group | | Company | | Group | | Company | | Group | | Company | |
| £m | £m | £m | £m | £m | £m |
|
|
|
|
|
|
|
| |
| At 1 January 2003 | – | | – | | 153 | | – | | (79 | ) | – | |
|
|
|
|
|
|
|
|
|
|
|
| |
| Transfer from profit | | | | | | | | | | | | |
| and loss account | – | | – | | 200 | | – | | – | | – | |
|
|
|
|
|
|
|
| |
| At 31 December 2003 | – | | – | | 353 | | – | | (79 | ) | – | |
|
|
|
|
|
|
|
| |
| | | | | | | | | | (restated) | |
| Revaluation | Non-distributable | Treasury shares |
| reserve | reserve | reserve |
|
|
|
|
|
|
|
| |
| | Group | | Company | | Group | | Company | | Group | | Company | |
| £m | £m | £m | £m | £m | £m |
|
|
|
|
|
|
|
| |
| At 1 January 2002 | – | | – | | 416 | | – | | (43 | ) | – | |
|
|
|
|
|
|
|
|
|
|
|
| |
| Purchase of own shares | – | | – | | – | | – | | (36 | ) | – | |
|
|
|
|
|
|
|
|
|
|
|
| |
| Transfer to profit and | | | | | | | | | | | | |
| loss account | – | | – | | (263 | ) | – | | – | | – | |
|
|
|
|
|
|
|
|
|
|
|
| |
| At 31 December 2002 | – | | – | | 153 | | – | | (79 | ) | – | |
|
|
|
|
|
|
|
|
|
|
|
| |
| | | | | | | | | | | | | |
| | | | | | | | | | | | (restated) | |
| Revaluation | Non-distributable | Treasury shares |
| reserve | | | reserve | | | reserve |
|
|
|
|
|
|
|
|
|
|
|
| |
| | Group | | Company | | Group | | Company | | Group | | Company | |
| £m | £m | £m | £m | £m | £m |
|
|
|
|
|
|
|
|
|
|
|
| |
| At 1 January 2001 | 14 | | – | | 577 | | – | | (29 | ) | – | |
|
|
|
|
|
|
|
|
|
|
|
| |
| Purchase of own shares | – | | – | | – | | – | | (14 | ) | – | |
|
|
|
|
|
|
|
|
|
|
|
| |
| Transfer to profit and | | | | | | | | | | | | |
| loss account | (14 | ) | – | | (161 | ) | – | | – | | – | |
|
|
|
|
|
|
|
|
|
|
|
| |
| At 31 December 2001 | – | | – | | 416 | | – | | (43 | ) | – | |
|
|
|
|
|
|
|
|
|
|
|
| |
The non-distributable reserve represents the value of the Group’s shareholders’ interest in the Long Term Assurance Funds of the Life Assurance businesses. The revaluation reserve represents cumulative revaluation adjustments in respect of the Group’s portfolio of investment properties. The treasury shares reserve represents shares of Abbey National plc that are held by Employee Share Ownership Trusts and other entities within the Abbey group of companies.
| 144 | Abbey Annual Report and Accounts 2003 |
Back to Contents
Financial Statements
Notes to the Financial Statementscontinued
| 44. | Reconciliation of movements in shareholders’ funds |
| | | | | | | | | |
| | | | Group | | | | Company | |
|
|
|
|
|
|
|
| |
| | 2003 | | 2002 | | 2003 | | 2002 | |
| | £m | | £m | | £m | | £m | |
|
|
|
|
|
|
|
| |
| (Loss) attributable to | | | | | | | | |
| shareholders | (699 | ) | (1,198 | ) | (167 | ) | (497 | ) |
|
|
|
|
|
|
|
| |
| Prior Year Adjustment | – | | 37 | | – | | – | |
|
|
|
|
|
|
|
| |
| As restated | (699 | ) | (1,161 | ) | (167 | ) | (497 | ) |
|
|
|
|
|
|
|
| |
| Dividends | (424 | ) | (424 | ) | (424 | ) | (424 | ) |
|
|
|
|
|
|
|
| |
| | (1,123 | ) | (1,585 | ) | (591 | ) | (921 | ) |
|
|
|
|
|
|
|
| |
| Other recognised net | | | | | | | | |
| losses relating to the year | (3 | ) | (2 | ) | (6 | ) | (2 | ) |
|
|
|
|
|
|
|
| |
| Increases in ordinary share | | | | | | | | |
| capital including share premium | 20 | | 109 | | 20 | | 109 | |
|
|
|
|
|
|
|
| |
| Share option compensation | | | | | | | | |
| costs taken to reserves | 8 | | 7 | | 8 | | 7 | |
|
|
|
|
|
|
|
| |
| Redemptions of preference | | | | | | | | |
| share capital including | | | | | | | | |
| share premium | (116 | ) | – | | (116 | ) | – | |
|
|
|
|
|
|
|
| |
| Capitalised reserves on | | | | | | | | |
| exercise of share options | – | | (7 | ) | – | | (7 | ) |
|
|
|
|
|
|
|
| |
| Goodwill written off in period | 5 | | 373 | | – | | – | |
|
|
|
|
|
|
|
| |
| Goodwill transferred | | | | | | | | |
| from profit and loss account | 190 | | 13 | | – | | – | |
|
|
|
|
|
|
|
| |
| Purchase of own shares | – | | (36 | ) | – | | – | |
|
|
|
|
|
|
|
| |
| Net reduction to | | | | | | | | |
| shareholders’ funds | (1,019 | ) | (1,128 | ) | (685 | ) | (814 | ) |
|
|
|
|
|
|
|
| |
| Shareholders’ funds | | | | | | | | |
| at 1 January – as | | | | | | | | |
| previously reported | 6,392 | | 7,521 | | 5,521 | | 6,335 | |
|
|
|
|
|
|
|
| |
| Prior year adjustment | (42 | ) | (43 | ) | – | | – | |
|
|
|
|
|
|
|
| |
| Shareholder funds | | | | | | | | |
| at 1 January – as restated | 6,350 | | 7,478 | | 5,521 | | 6,335 | |
|
|
|
|
|
|
|
| |
| Shareholders’ funds | | | | | | | | |
| at 31 December – | | | | | | | | |
| as restated | 5,331 | | 6,350 | | 4,836 | | 5,521 | |
|
|
|
|
|
|
|
| |
| Equity shareholders’ funds | 4,699 | | 5,602 | | 3,204 | | 4,773 | |
|
|
|
|
|
|
|
| |
| Non-equity | | | | | | | | |
| shareholders’ funds | 632 | | 748 | | 632 | | 748 | |
|
|
|
|
|
|
|
| |
| At 31 December | 5,331 | | 6,350 | | 4,836 | | 5,521 | |
|
|
|
|
|
|
|
| |
Equity shareholders’ funds comprise called up ordinary share capital, ordinary share premium account, profit and loss account and reserves.
Non-equity shareholders’ funds comprise called-up preference share capital and preference share premium account.
| 45. | Assets and liabilities denominated in foreign currency |
The aggregate amounts of assets and liabilities denominated in currencies other than sterling were as follows:
| | | | | | Group | | Company | |
|
|
|
|
|
|
|
| |
| | 2003 | | 2002 | | 2003 | | 2002 | |
| | £m | | £m | | £m | | £m | |
|
|
|
|
|
|
|
| |
| Assets | 35,140 | | 56,539 | | 1,213 | | 3,366 | |
| Liabilities | 48,034 | | 69,580 | | 4,342 | | 4,678 | |
|
|
|
|
|
|
|
| |
The above assets and liabilities denominated in foreign currencies do not indicate Abbey's exposure to foreign exchange risk. The Group’s foreign currency positions are substantially hedged by off-balance sheet hedging instruments, or by on-balance sheet assets and liabilities denominated in the same currency.
| 46. | Guarantees and assets pledged as collateral security |
| | |
| | | | Group | | | | Company | |
|
|
|
|
|
|
|
| |
| | 2003 | | 2002 | | 2003 | | 2002 | |
| | £m | | £m | | £m | | £m | |
|
|
|
|
|
|
|
| |
| Guarantees given by | | | | | | | | |
| Abbey National plc of | | | | | | | | |
| subsidiaries liabilities | – | | – | | 69,487 | | 110,876 | |
|
|
|
|
|
|
|
| |
| Guarantees given | | | | | | | | |
| to third parties | 1,788 | | 1,349 | | – | | 6 | |
|
|
|
|
|
|
|
| |
| Mortgaged assets granted | 360 | | 553 | | – | | – | |
|
|
|
|
|
|
|
| |
| | 2,148 | | 1,902 | | 69,487 | | 110,882 | |
|
|
|
|
|
|
|
| |
Abbey gives guarantees on behalf of customers. These guarantees have been made in the normal course of business. A financial guarantee represents an undertaking that the Group will meet a customer's obligations to third parties if the customer fails to do so. The Group expects most of the guarantees it provides to expire unused.
The current carrying amount and the maximum undiscounted potential amount of future payments of third party guarantees is £1,788m of which £438m will be immediately recoverable in the event of liquidation.
Mortgaged assets granted are to secure future obligations to third parties who have provided security to the leasing subsidiaries.
Guarantees given to third parties include no amounts in respect of credit derivative contracts (2002: £360m). Non-trading credit derivatives include contracts such as credit default swaps, spread put options and credit linked notes, whereby credit risk is accepted in respect of reference assets. Trading credit derivatives are included in note 51.
| 47. | Other contingent liabilities |
| | |
| | | | Group | | | | Company | |
|
|
|
|
|
|
|
| |
| | 2003 | | 2002 | | 2003 | | 2002 | |
| | £m | | £m | | £m | | £m | |
|
|
|
|
|
|
|
| |
| Other contingent liabilities | 159 | | 157 | | 8 | | 23 | |
|
|
|
|
|
|
|
| |
The principal other contingent liabilities are as follows:
Overseas tax demand
Abbey National Treasury Services plc has received a demand from an overseas tax authority for an amount of £112m (at the balance sheet exchange rate) (2002: £105m) relating to the repayment of certain tax credits received and related charges. At 31 December 2003, additional interest in relation to the demand could amount to £36m (at the balance sheet exchange rate) (2002: £28m).
Abbey National Treasury Services plc has received legal advice that it has strong grounds to challenge the validity of the demand and accordingly no specific provision has been made.
| | |
| Abbey Annual Report and Accounts 2003 | 145 |
Back to Contents
Financial Statements
Notes to the Financial Statementscontinued
Commitments
Obligations under stock borrowing and lending agreements
Obligations under stock borrowing and lending agreements represent contractual commitments to return stock borrowed. These obligations totalling £25,649m at 31 December 2003 (2002: £19,137m) are offset by a contractual right to receive stock under other contractual agreements.
Other commitments
The table below shows the contract or principal amount of commitments other than those relating to derivatives (see note 51).
| | | | Group | | | | Company | |
|
|
|
|
|
|
|
| |
| | 2003 | | 2002 | | 2003 | | 2002 | |
| | £m | | £m | | £m | | £m | |
|
|
|
|
|
|
|
| |
| Formal standby facilities, | | | | | | | | |
| credit lines and other | | | | | | | | |
| commitments to lend: | | | | | | | | |
|
|
|
|
|
|
|
| |
| Less than one year | 1,634 | | 1,319 | | 1,627 | | 1,303 | |
|
|
|
|
|
|
|
| |
| One year and over | 1,384 | | 3,423 | | – | | – | |
|
|
|
|
|
|
|
| |
| Forward sale and | | | | | | | | |
| repurchase agreements | – | | – | | – | | – | |
|
|
|
|
|
|
|
| |
| Other commitments | – | | – | | – | | – | |
|
|
|
|
|
|
|
| |
| | 3,018 | | 4,742 | | 1,627 | | 1,303 | |
|
|
|
|
|
|
|
| |
| | | | | | | | | |
| | | | | | | | Group | |
|
|
|
|
|
|
|
| |
| | | | | | | | | |
| | 2003 | | 2003 | | 2002 | | 2002 | |
| | Property | | Equipment | | Property | | Equipment | |
| | £m | | £m | | £m | | £m | |
|
|
|
|
|
|
|
| |
| Further rental commitments | | | | | | | | |
| under operating leases expiring: | | | | | | | | |
|
|
|
|
|
|
|
| |
| In not more than 1 year | 22 | | 3 | | 18 | | 1 | |
|
|
|
|
|
|
|
| |
| In more than 1 year but | | | | | | | | |
| not more than 5 years | 19 | | 7 | | 35 | | 2 | |
|
|
|
|
|
|
|
| |
| In more than 5 years | 87 | | – | | 85 | | – | |
|
|
|
|
|
|
|
| |
| | 128 | | 10 | | 138 | | 3 | |
|
|
|
|
|
|
|
| |
| | | | | | | | | |
| | | | | | | | Company | |
|
|
|
|
|
|
|
| |
| | 2003 | | 2003 | | 2002 | | 2002 | |
| | Property | | Equipment | | Property | | Equipment | |
| | £m | | £m | | £m | | £m | |
|
|
|
|
|
|
|
| |
| Further rental commitments | | | | | | | | |
| under operating leases expiring: | | | | | | | | |
|
|
|
|
|
|
|
| |
| In not more than 1 year | 16 | | 3 | | 18 | | 1 | |
|
|
|
|
|
|
|
| |
| In more than 1 year but | | | | | | | | |
| not more than 5 years | 16 | | 7 | | 32 | | 2 | |
|
|
|
|
|
|
|
| |
| In more than 5 years | 78 | | – | | 71 | | – | |
|
|
|
|
|
|
|
| |
| | 110 | | 10 | | 121 | | 3 | |
|
|
|
|
|
|
|
| |
At 31 December 2003 Abbey held various leases on land and buildings, many for extended periods, and other leases for equipment, which require the following aggregate annual rental payments:
| | | | Group | | | | Company | |
|
|
|
|
|
|
|
| |
| | 2003 | | 2002 | | 2003 | | 2002 | |
| | £m | | £m | | £m | | £m | |
|
|
|
|
|
|
|
| |
| Year ended 31 December: | | | | | | | | |
|
|
|
|
|
|
|
| |
| 2004 | 145 | | 141 | | 118 | | 124 | |
|
|
|
|
|
|
|
| |
| 2005 | 118 | | 133 | | 105 | | 119 | |
|
|
|
|
|
|
|
| |
| 2006 | 112 | | 122 | | 100 | | 108 | |
|
|
|
|
|
|
|
| |
| 2007 | 112 | | 116 | | 99 | | 104 | |
|
|
|
|
|
|
|
| |
| 2008 | 112 | | 115 | | 100 | | 104 | |
|
|
|
|
|
|
|
| |
| Total thereafter | 992 | | 1,198 | | 957 | | 1,097 | |
|
|
|
|
|
|
|
| |
| | | | | | | | | |
| | | | 2003 | | 2002 | | 2001 | |
| | | | £m | | £m | | £m | |
|
|
|
|
|
|
|
| |
| Group rental expense comprises: | | | | | | | | |
|
|
|
|
|
|
|
| |
| In respect of minimum rentals | | | 118 | | 117 | | 112 | |
|
|
|
|
|
|
|
| |
| Less: sub-lease rentals | | | (3 | ) | (3 | ) | (1 | ) |
|
|
|
|
|
|
|
| |
| | | | 115 | | 114 | | 111 | |
|
|
|
|
|
|
|
| |
| | |
| 50. | Financial instruments |
| Interest rate risk |
In accordance with FRS 13, interest rate repricing gap information is shown in the table (the ‘gap table’) below, at 31 December 2003. It provides an estimate of the repricing profile of Abbey’s assets, liabilities and other off-balance sheet exposures for non-trading activities. For the major categories of assets and liabilities, the gap table shows the values of interest earning assets and interest bearing liabilities which reprice within selected time bands. Items are allocated to time bands by reference to the earlier of the next interest rate repricing date and the legal maturity date. This leads to an apparent timing mismatch where the anticipated maturity date is different from the legal maturity date and hedges have been structured accordingly.
The positions shown reflect both the repricing behaviour of the administered rates on mortgage and savings products (over which Abbey has control) and contracted wholesale on and off-balance sheet positions. The tables do not purport to measure market risk exposure.
| 146 | Abbey Annual Report and Accounts 2003 |
Back to Contents
Financial Statements
Notes to the Financial Statementscontinued
| Interest rate repricing gap at 31 December 2003 | | | | | | | | | | | | | |
| | | | | | | | | | | | | | Non-Trading | | Trading | | Total | |
|
|
|
|
|
|
|
|
|
|
|
|
|
|
|
|
|
| |
| | | | In more than | | In more than | | In more | | | | | | | | | | | |
| 3 months | 6 months | than 1 year |
| Not more | but not | but not | but not | Non-interest |
| than 3 | more than | more than | more than | In more than | bearing | Non-Trading |
| months | 6 months | 12 months | 5 years | 5 years | amounts | Total |
| £m | £m | £m | £m | £m | £m | £m | £m | £m |
|
|
|
|
|
|
|
|
|
|
|
|
|
|
|
|
|
| |
| Assets | | | | | | | | | | | | | | | | | | |
|
|
|
|
|
|
|
|
|
|
|
|
|
|
|
|
|
| |
| Treasury and other eligible bills | – | | – | | – | | – | | – | | – | | – | | 1,631 | | 1,631 | |
|
|
|
|
|
|
|
|
|
|
|
|
|
|
|
|
|
| |
| Cash and loans and advances to banks(1) | 449 | | – | | – | | – | | – | | 1,022 | | 1,471 | | 6,123 | | 7,594 | |
|
|
|
|
|
|
|
|
|
|
|
|
|
|
|
|
|
| |
| Loans and advances to customers(2) | 61,758 | | 1,343 | | 2,095 | | 13,847 | | 2,958 | | 2,234 | | 84,235 | | 9,604 | | 93,839 | |
|
|
|
|
|
|
|
|
|
|
|
|
|
|
|
|
|
| |
| Net investment in finance leases | 1,840 | | 48 | | 250 | | 300 | | 123 | | 3 | | 2,564 | | 9 | | 2,573 | |
|
|
|
|
|
|
|
|
|
|
|
|
|
|
|
|
|
| |
| Securities and investments | 625 | | 91 | | 108 | | 384 | | 704 | | 235 | | 2,147 | | 29,814 | | 31,961 | |
|
|
|
|
|
|
|
|
|
|
|
|
|
|
|
|
|
| |
| Other assets | – | | – | | – | | – | | – | | 9,198 | | 9,198 | | 1,643 | | 10,841 | |
|
|
|
|
|
|
|
|
|
|
|
|
|
|
|
|
|
| |
| Assets of Long Term Assurance Funds | – | | – | | – | | – | | – | | 28,336 | | 28,336 | | – | | 28,336 | |
|
|
|
|
|
|
|
|
|
|
|
|
|
|
|
|
|
| |
| Total assets | 64,672 | | 1,482 | | 2,453 | | 14,531 | | 3,785 | | 41,028 | | 127,951 | | 48,824 | | 176,775 | |
|
|
|
|
|
|
|
|
|
|
|
|
|
|
|
|
|
| |
| | | | | | | | | | | | | | | | | | | |
| Liabilities | | | | | | | | | | | | | | | | | | |
|
|
|
|
|
|
|
|
|
|
|
|
|
|
|
|
|
| |
| Deposits by banks(1) | (912 | ) | (38 | ) | (10 | ) | – | | (14 | ) | (204 | ) | (1,178 | ) | (20,947 | ) | (22,125 | ) |
|
|
|
|
|
|
|
|
|
|
|
|
|
|
|
|
|
| |
| Customer accounts | (57,515 | ) | (1,313 | ) | (1,612 | ) | (3,111 | ) | (88 | ) | – | | (63,639 | ) | (10,762 | ) | (74,401 | ) |
|
|
|
|
|
|
|
|
|
|
|
|
|
|
|
|
|
| |
| Debt securities in issue | (16,091 | ) | (1,969 | ) | (3,108 | ) | (2,757 | ) | (909 | ) | – | | (24,834 | ) | – | | (24,834 | ) |
|
|
|
|
|
|
|
|
|
|
|
|
|
|
|
|
|
| |
| Subordinated liabilities and other | | | | | | | | | | | | | | | | | | |
| long term capital instruments | (450 | ) | (208 | ) | (279 | ) | (1,067 | ) | (5,075 | ) | – | | (7,079 | ) | – | | (7,079 | ) |
|
|
|
|
|
|
|
|
|
|
|
|
|
|
|
|
|
| |
| Other liabilities | – | | – | | – | | – | | – | | (5,050 | ) | (5,050 | ) | (9,065 | ) | (14,115 | ) |
|
|
|
|
|
|
|
|
|
|
|
|
|
|
|
|
|
| |
| Funding of trading book | 8,050 | | – | | – | | – | | – | | – | | – | | (8,050 | ) | – | |
|
|
|
|
|
|
|
|
|
|
|
|
|
|
|
|
|
| |
| Liabilities of Long Term Assurance Funds | – | | – | | – | | – | | – | | (28,336 | ) | (28,336 | ) | – | | (28,336 | ) |
|
|
|
|
|
|
|
|
|
|
|
|
|
|
|
|
|
| |
| Minority interests – non-equity | – | | – | | – | | – | | – | | (554 | ) | (554 | ) | – | | (554 | ) |
|
|
|
|
|
|
|
|
|
|
|
|
|
|
|
|
|
| |
| Shareholders’ funds | | | | | | | | | | | | | | | | | | |
|
|
|
|
|
|
|
|
|
|
|
|
|
|
|
|
|
| |
| – non-equity | – | | – | | – | | – | | – | | (632 | ) | (632 | ) | – | | (632 | ) |
|
|
|
|
|
|
|
|
|
|
|
|
|
|
|
|
|
| |
| – equity | – | | – | | – | | – | | – | | (4,699 | ) | (4,699 | ) | – | | (4,699 | ) |
|
|
|
|
|
|
|
|
|
|
|
|
|
|
|
|
|
| |
| Total liabilities | (66,918 | ) | (3,528 | ) | (5,009 | ) | (6,935 | ) | (6,086 | ) | (39,475 | ) | (127,951 | ) | (48,824 | ) | (176,775 | ) |
|
|
|
|
|
|
|
|
|
|
|
|
|
|
|
|
|
| |
| | | | | | | | | | | | | | | | | | | |
| Off-balance sheet items(3) | (4,514 | ) | 1,450 | | 3,603 | | 1,224 | | 481 | | (2,244 | ) | – | | – | | – | |
|
|
|
|
|
|
|
|
|
|
|
|
|
|
|
|
|
| |
| Interest rate repricing gap | (6,760 | ) | (596 | ) | 1,047 | | 8,820 | | (1,820 | ) | (691 | ) | – | | – | | – | |
|
|
|
|
|
|
|
|
|
|
|
|
|
|
|
|
|
| |
| 2003 Cumulative gap | (6,760 | ) | (7,356 | ) | (6,309 | ) | 2,511 | | 691 | | – | | – | | – | | – | |
|
|
|
|
|
|
|
|
|
|
|
|
|
|
|
|
|
| |
| 2002 Cumulative gap | (2,244 | ) | (3,398 | ) | (3,309 | ) | 3,181 | | (266 | ) | – | | | | | | | |
|
|
|
|
|
|
|
|
|
|
|
|
|
|
|
|
|
| |
| (1) | Non-interest bearing items within Loans and advances to banks and Deposits by banks include items in the course of collection and items in the course of transmission, respectively.These are short-term receipts and payments within the UK retail banking clearing system. The remaining non-interest bearing item within Loans and advances to banks relates to the interest free deposit maintained withthe Bank of England. |
| (2) | Non-interest bearing items within Loans and advances to customers relate to non-accruing lendings after deduction of associated provisions. |
| (3) | Off-balance sheet items are classified in the table above according to the interest terms contained in the contracts. |
| | | |
| Abbey Annual Report and Accounts 2003 | | 147 |
Back to Contents
Financial Statements
Notes to the Financial Statementscontinued
Negative gaps are liability sensitive and, all other things being equal, would indicate a benefit if interest rates decline. A positive gap is asset sensitive and, all other things being equal, would indicate a benefit if interest rates increase. Gap positions shown within the interest rate repricing table are attributable to the balance sheet management of the Abbey’s capital, low rate and non-interest bearing liabilities, aimed at reducing income volatility. Fixed rate assets and liabilities are hedged in line with a broadly risk neutral management objective. A notional allocation of liabilities has been made to the trading book for the purposes of the gap table. Such an allocation represents the proportion of general funding supporting the trading book.
A number of Abbey non-trading assets and liabilities are subject to more complex repricing than can be reflected in the above table or repriced with reference to indices other than interest rates. The market risk exposure is minimised through the use of matching derivatives. The risks associated with such instruments, and their hedges, are reflected in note 51 to the financial statements.
Foreign exchange risk
Abbey’s main overseas operations are in France, Netherlands and the US. The main operating (or functional) currencies of its operations are therefore sterling, euros and US dollar. As Abbey prepares its consolidated financial statements in sterling, these will be affected by movements in the euro/sterling and dollar/sterling exchange rates. The structural currency exposures contained in Abbey’s consolidated balance sheet is predominantly affected by movements in the exchange rates between the euros and sterling. This structural currency exposure is not the same as structural market risk which arises from a variety of exposures inherent in a product or portfolio. Translation gains and losses arising from these exposures are recognised in the Statements of total recognised gains and losses.
Abbey mitigates the effect of this exposure by financing a significant proportion of its net investments in its overseas operations with borrowings in the currency of the local operation.
Abbey’s structural currency exposures at 31 December 2003 were as follows:
| | | | Borrowings | | | | | |
| Net | hedging net | Net | Net |
| investments | investment | structural | structural |
| in overseas | in overseas | currency | currency |
| operations | operations | exposures | exposures |
| 2003 | 2003 | 2003 | 2002 |
| £m | £m | £m | £m |
|
|
|
|
|
|
|
| |
| Euros – Subsidiary | 61 | | (78 | ) | (17 | ) | 12 | |
|
|
|
|
|
|
|
| |
| – Branches | (29 | ) | – | | (29 | ) | (33 | ) |
|
|
|
|
|
|
|
| |
| Other non-sterling amounts | 1 | | – | | 1 | | 1 | |
|
|
|
|
|
|
|
| |
| | 33 | | (78 | ) | (45 | ) | (20 | ) |
|
|
|
|
|
|
|
| |
Abbey also has some transactional (or non-structural) currency exposures. Such exposures arise from the activities of Abbey where the operating unit undertakes activities in currencies other than the unit’s functional currency. Where such activities show currency mismatches between assets and liabilities, Abbey uses a variety of derivative products to eliminate some or all of the currency risk depending on the amount and nature of the transaction. Controls are in place to limit the size of Abbey’s open transactional foreign exchange positions.
Certain transactional currency exposures give rise to net currency gains and losses which are recognised in the profit and loss account. Such exposures comprise the monetary assets and monetary liabilities of Abbey that are not denominated in the functional currency of the operating unit involved, other than certain non-sterling borrowings treated as hedges of net investments in overseas operations (as shown in the above table). Transactional currency exposures are stated net of derivatives used to hedge currency risk.
Abbey’s transactional currency exposures at 31 December 2003 and 2002 were as follows:
| | 2003 – Net foreign currency monetary assets/(liabilities) | |
|
|
|
| |
| | Sterling | | US Dollar | | Euros | | Other | | Total | |
| £m | £m | £m | £m | £m |
|
|
|
|
|
|
|
|
|
| |
| Sterling | n/a | | (19 | ) | (79 | ) | 1 | | (97 | ) |
|
|
|
|
|
|
|
|
|
| |
| Euros | 81 | | – | | n/a | | – | | 81 | |
|
|
|
|
|
|
|
|
|
| |
| | 81 | | (19 | ) | (79 | ) | 1 | | 16 | |
|
|
|
|
|
|
|
|
|
| |
| | | | | |
| | 2002 – Net foreign currency monetary assets/(liabilities) | |
|
|
|
| |
| | Sterling | | US Dollar | | Euros | | Other | | Total | |
| £m | £m | £m | £m | £m |
|
|
|
|
|
|
|
|
|
| |
| Sterling | n/a | | 50 | | (7 | ) | 15 | | 58 | |
|
|
|
|
|
|
|
|
|
| |
| Euros | 113 | | – | | n/a | | – | | 113 | |
|
|
|
|
|
|
|
|
|
| |
| | 113 | | 50 | | (7 | ) | 15 | | 171 | |
|
|
|
|
|
|
|
|
|
| |
Certain areas of the business generate a significant proportion of their income in currencies other than the functional currency, and may use forward foreign exchange contracts to fix the functional currency equivalent of their forecast income. The outstanding nominal amount of such transactions at 31 December 2003 was £nil.
| 51. | Derivatives |
| Derivative financial instruments (derivatives) are contracts or agreements whose value is derived from one or more underlying indices or asset values inherent in the contract or agreement. They include interest rate, cross-currency, equity and other index swaps, forward rate agreements, futures, caps, floors, options, swaptions, credit default and total return swaps, equity index contracts and exchange traded interest rate futures and equity index options. Derivatives are used for trading and non-trading purposes. These terms are defined in Accounting policies – Derivatives. |
Non-trading derivatives
The main non-trading derivatives are interest rate and cross-currency swaps, and credit default swaps, which are used to hedge Abbey’s exposures to interest rates, credit spread movements and exchange rates inherent in non-trading assets, liabilities and positions, including fixed rate lending and structured savings products within banking and saving segments and medium term note issues, capital issues and fixed rate asset purchases within Abbey National Treasury Services.
The following table illustrates activities undertaken by Abbey, the related risks associated with such activities and the types of derivatives used in managing such risks. Such risks may also be managed using on-balance sheet instruments as part of an integrated approach to risk management.
| | | |
| 148 | | Abbey Annual Report and Accounts 2003 |
Back to Contents
Financial Statements
Notes to the Financial Statementscontinued
| Activity | | Risk | | Type of Hedge |
|
|
|
|
|
| Management of the return on variable rate assets financed by shareholders’ funds and net non-interest bearing liabilities. | | Reduced profitability due to falls in interest rates. | | Receive fixed interest rate swaps. |
|
|
|
|
|
| Fixed rate lending and investments. | | Sensitivity to increases in interest rates. | | Pay fixed interest rate swaps. |
|
|
|
|
|
| Fixed rate retail and wholesale funding. | | Sensitivity to falls in interest rates. | | Receive fixed interest rate swaps. |
|
|
|
|
|
| Equity-linked retail funding. | | Sensitivity to increases in equity market indices. | | Receive equity swaps. |
|
|
|
|
|
| Management of other net interest income on retail activities. | | Sensitivity of returns to changes in interest rates. | | Interest rate swaps and caps/floors according to the type of risk identified. |
|
|
|
|
|
| Profits earned in foreign currency. | | Sensitivity to strengthening of sterling against other currencies. | | Forward foreign-exchange contracts. |
|
|
|
|
|
| Investment in foreign currency assets. | | Sensitivity to strengthening of sterling against other currencies. | | Cross-currency and foreign-exchange swaps. Foreign currency funding. |
|
|
|
|
|
| Issuance of products with embedded equity options. | | Sensitivity to changes in underlying rate and rate volatility causing option exercise. | | Interest rate swaps combined with caps/floors and other matched options. |
|
|
|
|
|
| Lending and investments. | | Sensitivity to weakening credit quality. | | Purchase credit default and total return swaps. |
|
|
|
|
|
| Investment in, and issuance of, products with embedded interest rate options. | | Sensitivity to changes in underlying rate and rate volatility causing option exercise. | | Interest rate swaps plus caps/floors, and other matched options. |
|
|
|
|
|
| Investment in, and issuance of, bonds with put/call features. | | Sensitivity to changes in rates causing option exercise. | | Interest rate swaps combined with swaptions(1). |
|
|
|
|
|
| Firm commitments (e.g. asset purchases, issues arranged). | | Sensitivity to changes in rates between arranging a transaction and completion. | | Hedges are arranged at the time of commitments if there is exposure to rate movements. |
|
|
|
|
|
| (1) | A swaption is an option on a swap which gives the holder the right but not the obligation to buy or sell a swap. |
| | |
| (2) | Exchange-traded derivatives may additionally be used as hedges in any of the above activities in lieu of interest rate swaps. |
Derivative products which are combinations of more basic derivatives (such as swaps with embedded option features), or which have leverage features, may be used in circumstances where the underlying position being hedged contains the same risk features. In such cases the derivative used will be structured to match the risks of the underlying asset or liability. Exposure to market risk on such contracts is therefore hedged.
The following tables show the contract or underlying principal amounts, positive and negative market values and related book values of derivatives held for non-trading purposes at 31 December 2003 and 2002. Contract or underlying principal amounts indicate the volume of business outstanding at the balance sheet date and do not represent amounts at risk. The fair values represent the amount at which a contract could be exchanged in an arm’s length transaction, calculated at market rates current at the balance sheet date. The positive and negative market values of the derivatives should not be viewed in isolation because they are substantially matched by negative and positive market values, respectively, on the assets, liabilities and positions being hedged.
| | | | | | | | | | Group | |
|
|
|
|
|
|
|
|
|
| |
| | 2003 | | 2003 | | 2003 | | 2003 | | 2003 | |
| | Contract or | | Positive | | Related | | Negative | | Related | |
| | underlying | | market | | book | | market | | book | |
| | principal(1) | | values(2) | | value | | values(2) | | value | |
| | £m | | £m | | £m | | £m | | £m | |
|
|
|
|
|
|
|
|
|
| |
| Exchange rate contracts: | | | | | | | | | | |
|
|
|
|
|
|
|
|
|
| |
| Cross-currency swaps | 22,214 | | 928 | | 124 | | 1,380 | | 183 | |
|
|
|
|
|
|
|
|
|
| |
| Foreign exchange swaps and forwards | 1,630 | | – | | 8 | | – | | – | |
|
|
|
|
|
|
|
|
|
| |
| Foreign exchange options | – | | – | | – | | – | | – | |
|
|
|
|
|
|
|
|
|
| |
| | 23,844 | | 928 | | 132 | | 1,380 | | 183 | |
|
|
|
|
|
|
|
|
|
| |
| Interest rate contracts: | | | | | | | | | | |
|
|
|
|
|
|
|
|
|
| |
| Interest rate swaps | 69,433 | | 2,067 | | 650 | | 1,432 | | 362 | |
|
|
|
|
|
|
|
|
|
| |
| Caps, floors and swaptions | 2,484 | | 21 | | 37 | | 1 | | – | |
|
|
|
|
|
|
|
|
|
| |
| Futures (exchange traded) | 4,907 | | – | | – | | – | | – | |
|
|
|
|
|
|
|
|
|
| |
| Forward rate agreements | 2,213 | | – | | – | | – | | – | |
|
|
|
|
|
|
|
|
|
| |
| | 79,037 | | 2,088 | | 687 | | 1,433 | | 362 | |
|
|
|
|
|
|
|
|
|
| |
| Equity and commodity | | | | | | | | | | |
| contracts: | | | | | | | | | | |
|
|
|
|
|
|
|
|
|
| |
| Equity index options and | | | | | | | | | | |
| similar products | 257 | | – | | – | | 86 | | – | |
|
|
|
|
|
|
|
|
|
| |
| Equity and commodity | | | | | | | | | | |
| index swaps | 673 | | 22 | | 9 | | 20 | | 3 | |
|
|
|
|
|
|
|
|
|
| |
| | 930 | | 22 | | 9 | | 106 | | 3 | |
|
|
|
|
|
|
|
|
|
| |
| | 103,811 | | 3,038 | | 828 | | 2,919 | | 548 | |
|
|
|
|
|
|
|
|
|
| |
| | | |
| Abbey Annual Report and Accounts 2003 | | 149 |
Back to Contents
Financial Statements
Notes to the Financial Statementscontinued
| | Group | |
|
|
|
|
|
|
|
|
|
| |
| | 2002 |
(1) | 2002 |
(2) | 2002 | | 2002 |
(2) | 2002 | |
| Contract or | Positive | Related | Negative | Related |
| underlying | market | book | market | book |
| principal | values | value | values | value |
| £m | £m | £m | £m | £m |
|
|
|
|
|
|
|
|
|
| |
| Exchange rate contracts: | | | | | | | | | | |
|
|
|
|
|
|
|
|
|
| |
| Cross-currency swaps | 23,849 | | 835 | | 166 | | 1,236 | | 330 | |
|
|
|
|
|
|
|
|
|
| |
| Foreign exchange | | | | | | | | | | |
| swaps and forwards | 5,663 | | 22 | | 18 | | 82 | | 79 | |
|
|
|
|
|
|
|
|
|
| |
| Foreign exchange options | 29 | | 3 | | – | | – | | – | |
|
|
|
|
|
|
|
|
|
| |
| | 29,541 | | 860 | | 184 | | 1,318 | | 409 | |
|
|
|
|
|
|
|
|
|
| |
| Interest rate contracts: | | | | | | | | | | |
|
|
|
|
|
|
|
|
|
| |
| Interest rate swaps | 99,539 | | 2,421 | | 906 | | 2,306 | | 748 | |
|
|
|
|
|
|
|
|
|
| |
| Caps, floors and | | | | | | | | | | |
| swaptions | 6,278 | | 27 | | 70 | | 6 | | – | |
|
|
|
|
|
|
|
|
|
| |
| Futures (exchange | | | | | | | | | | |
| traded) | 3,745 | | – | | – | | – | | – | |
|
|
|
|
|
|
|
|
|
| |
| Forward rate | | | | | | | | | | |
| agreements | – | | – | | – | | – | | – | |
|
|
|
|
|
|
|
|
|
| |
| | 109,562 | | 2,448 | | 976 | | 2,312 | | 748 | |
|
|
|
|
|
|
|
|
|
| |
| Equity and commodity | | | | | | | | | | |
| contracts: | | | | | | | | | | |
|
|
|
|
|
|
|
|
|
| |
| Equity index options and | | | | | | | | | | |
| similar products | 234 | | 3 | | – | | 48 | | – | |
|
|
|
|
|
|
|
|
|
| |
| Equity and commodity | | | | | | | | | | |
| index swaps | 832 | | 44 | | 3 | | 62 | | 1 | |
|
|
|
|
|
|
|
|
|
| |
| | 1,066 | | 47 | | 3 | | 110 | | 1 | |
|
|
|
|
|
|
|
|
|
| |
| | 140,169 | | 3,355 | | 1,163 | | 3,740 | | 1,158 | |
|
|
|
|
|
|
|
|
|
| |
| | |
| (1) | Included in the above analysis of non-trading derivatives are exchange rate contracts, interest rate contracts and equity and commodity contracts, with underlying principal amounts of £1,574m, (2002: £1,955m), £47,685m (2002: £58,208m) and £363m (2002: £274m), respectively, which were undertaken by Group entities with Abbey National Financial Products. The total net positive market value of such contracts amounted to £1,425m (2002: net positive £132m). Associated contracts which Abbey National Financial Products transacted with external counterparties are included in the analysis of trading derivatives. Net positive market values of £1,425m (2002: net positive £132m) on all contracts held by Abbey National Financial Products with other Group entities are included within Other assets. |
| | |
| (2) | Positive market values arise where the present value of cash inflows exceeds the present value of cash outflows on a contract by contract basis. Negative market values arise where the present value of cash outflows exceeds the present value of cash inflows on a contract by contract basis. |
The following table analyses over-the-counter (OTC) and other non-exchange traded derivatives held for non-trading purposes by remaining maturity:
| | Group | |
|
|
|
|
|
|
|
| |
| | Contract or | | Replace- | | Contract or | | Replace- | |
| underlying | ment | underlying | ment |
| principal | cost | principal | cost |
| 2003 | 2003 | 2002 | 2002 |
| £m | £m | £m | £m |
|
|
|
|
|
|
|
| |
| Non-trading derivatives maturing: | | | | | | | | |
|
|
|
|
|
|
|
| |
| In not more than one year | 36,368 | | 806 | | 55,737 | | 647 | |
|
|
|
|
|
|
|
| |
| In more than one year but | | | | | | | | |
| not more than five years | 47,672 | | 1,257 | | 56,086 | | 1,365 | |
|
|
|
|
|
|
|
| |
| In more than five years | 14,864 | | 975 | | 24,601 | | 1,343 | |
|
|
|
|
|
|
|
| |
| | 98,904 | | 3,038 | | 136,424 | | 3,355 | |
|
|
|
|
|
|
|
| |
The following table shows, by nominal amount, the activity in interest rate and cross currency swaps entered into for hedging purposes, with third parties and Abbey National Financial Products (ANFP).
| | 2003 | | 2002 | |
|
|
|
|
|
|
|
|
|
|
|
| |
| | Interest | | Cross | | | | Interest | | Cross | | | |
| rate | currency | | | rate | currency | |
| swaps | swaps | Total | | swaps | swaps | Total |
| £m | £m | £m | | £m | £m | £m |
|
|
|
|
|
|
|
|
|
|
|
| |
| At 1 January (third | | | | | | | | | | | | |
| party contracts) | 46,219 | | 22,252 | | 68,471 | | 45,895 | | 23,157 | | 69,052 | |
|
|
|
|
|
|
|
|
|
|
|
| |
| At 1 January | | | | | | | | | | | | |
| (contracts with) | | | | | | | | | | | | |
| ANFP | 53,320 | | 1,597 | | 54,917 | | 56,627 | | 4,152 | | 60,779 | |
|
|
|
|
|
|
|
|
|
|
|
| |
| New contracts | 22,362 | | 5,483 | | 27,845 | | 29,649 | | 3,423 | | 33,072 | |
|
|
|
|
|
|
|
|
|
|
|
| |
| Acquisitions | | | | | | | | | | | | |
| of subsidiary | | | | | | | | | | | | |
| undertakings | – | | – | | – | | – | | – | | – | |
|
|
|
|
|
|
|
|
|
|
|
| |
| Matured and | | | | | | | | | | | | |
| amortised | | | | | | | | | | | | |
| contracts | (32,416 | ) | (2,636 | ) | (35,052 | ) | (23,930 | ) | (3,187 | ) | (27,117 | ) |
|
|
|
|
|
|
|
|
|
|
|
| |
| Terminated | | | | | | | | | | | | |
| contracts | (14,502 | ) | (4,430 | ) | (18,932 | ) | (3,125 | ) | (983 | ) | (4,108 | ) |
|
|
|
|
|
|
|
|
|
|
|
| |
| Effect of foreign | | | | | | | | | | | | |
| exchange rate and | | | | | | | | | | | | |
| other movements | (1,652 | ) | (28 | ) | (1,680 | ) | (2,270 | ) | (158 | ) | (2,428 | ) |
|
|
|
|
|
|
|
|
|
|
|
| |
| Net (decrease) | | | | | | | | | | | | |
| increase in | | | | | | | | | | | | |
| contracts | | | | | | | | | | | | |
| with ANFP | (3,898 | ) | (24 | ) | (3,922 | ) | (3,307 | ) | (2,555 | ) | (5,862 | ) |
|
|
|
|
|
|
|
|
|
|
|
| |
| At 31 December | 69,433 | | 22,214 | | 91,647 | | 99,539 | | 23,849 | | 123,388 | |
|
|
|
|
|
|
|
|
|
|
|
| |
Abbey uses interest rate swaps and cross-currency swaps predominantly for hedging fixed-rate assets and liabilities so that they become, in effect, floating rate assets and liabilities. For interest rate swaps and cross-currency swaps used for these purposes, the weighted average pay fixed rates, receive fixed rates, pay variable rates and receive variable rates by maturity and contract amount at 31 December 2003 were as follows:
| 150 | Abbey Annual Report and Accounts 2003 |
Back to Contents
Financial Statements
Notes to the Financial Statementscontinued
| | Pay fixed | | Receive fixed | | Pay variable | | Receive variable | |
|
|
|
|
|
|
|
|
|
|
|
|
|
| |
| | Nominal | | | | Nominal | | | | Nominal | | | | Nominal | | | |
| amount | Rate | amount | Rate | amount | Rate | amount | Rate |
| £m | % | £m | % | £m | % | £m | % |
|
|
|
|
|
|
|
|
|
|
|
|
|
|
|
| |
| Contracts maturing(1): | | | | | | | | | | | | | | | | |
|
|
|
|
|
|
|
|
|
|
|
|
|
|
|
| |
| Less than one year | 8,543 | | 4.30 | | 16,729 | | 4.38 | | 23,177 | | 2.67 | | 15,031 | | 2.50 | |
|
|
|
|
|
|
|
|
|
|
|
|
|
|
|
| |
| One to three years | 9,210 | | 4.70 | | 12,036 | | 4.51 | | 24,688 | | 2.27 | | 21,801 | | 2.23 | |
|
|
|
|
|
|
|
|
|
|
|
|
|
|
|
| |
| Three to five years | 2,481 | | 5.30 | | 3,292 | | 4.91 | | 9,353 | | 3.17 | | 8,535 | | 2.77 | |
|
|
|
|
|
|
|
|
|
|
|
|
|
|
|
| |
| Over five years | 5,182 | | 5.82 | | 7,198 | | 6.47 | | 9,240 | | 3.28 | | 7,097 | | 2.77 | |
|
|
|
|
|
|
|
|
|
|
|
|
|
|
|
| |
| | 25,416 | | | | 39,255 | | | | 66,458 | | | | 52,464 | | | |
|
|
|
|
|
|
|
|
|
|
|
|
|
|
|
| |
(1) For the purpose of this analysis, the maturity date has been taken to be the date when the contract expires.
The total pay fixed nominal amount comprises £25,368m in respect of interest rate swaps and £48m in respect of cross-currency swaps. The total receive fixed nominal amount comprises £34,711m in respect of interest rate swaps and £4,544m in respect of cross-currency swaps. The total pay variable nominal amount comprises £44,064m in respect of interest rate swaps and £22,394m in respect of cross-currency swaps. The total receive variable nominal amount comprises £34,721m in respect of interest rate swaps and £17,743m in respect of cross-currency swaps.
A difference arises when comparing nominal contract assets and nominal contract liabilities. Whereas with single currency swaps there are equal and opposite nominal balances on either side of the swap leg, this is not necessarily the case with cross-currency swaps. At contract date sterling equivalent nominal amounts should be equal and opposite, however, subsequent exchange rate movements will result in divergence in the nominal amounts. This exchange rate divergence explains the difference between nominal contract asset balances and nominal contract liability balances.
The weighted average interest rates presented in the tables above reflect interest rates in a range of currencies. These rates should not be analysed in isolation from the rates on the underlying instruments. The effect of hedges has been included in the average interest rates presented in the Average balance sheet included elsewhere in this Annual Report.
The contract amount of each type of end-use contract (excluding cross-currency swaps and interest rate swaps which are included in the swaps detailed above) at 31 December 2003 are set forth by currency in the table below. Of these contracts £9,677m mature within one year and £2,487m mature after one year.
| | Contract type by nominal amount | |
|
|
|
|
|
|
|
|
|
| |
| | Forward | | | | | | | | | |
| | foreign | | | | | | | | | |
| | exchange | | Forward | | Options | | | | | |
| | and foreign | | rate | | caps and | | Futures | | | |
| | exchange | | agree- | | floors | | (exchange | | Equity | |
| | swaps | | ments | | (OTC) | (1) | traded) | | contracts | |
| | £m | | £m | | £m | | £m | | £m | |
|
|
|
|
|
|
|
|
|
| |
| Sterling | – | | – | | 2,185 | | – | | 112 | |
|
|
|
|
|
|
|
|
|
| |
| US dollars | – | | 2,213 | | 209 | | 3,843 | | 453 | |
|
|
|
|
|
|
|
|
|
| |
| Euro | 1,540 | | – | | 87 | | 883 | | 357 | |
|
|
|
|
|
|
|
|
|
| |
| Hong Kong dollar | – | | – | | 3 | | – | | – | |
|
|
|
|
|
|
|
|
|
| |
| Switzerland franc | 90 | | – | | – | | 181 | | 8 | |
|
|
|
|
|
|
|
|
|
| |
| Total | 1,630 | | 2,213 | | 2,484 | | 4,907 | | 930 | |
|
|
|
|
|
|
|
|
|
| |
(1) All over-the-counter option contracts are in respect of interest related instruments.
Trading derivatives
The following table sets forth the contract or underlying principal (nominal) amounts, positive market values and negative market values of derivatives held for trading purposes at 31 December 2003 and 2002.
| | Group | |
|
|
|
|
|
|
|
|
|
|
|
| |
| | | | | | | | Contract | | | | Negative | |
| Contract or | Positive | Negative | or under- | Positive | | market | |
| underlying | market | market | lying | market | | values | |
| principal | values | values | principal | values | | (restated) | |
| 2003 | 2003 | 2003 | 2002 | 2002 | | 2002 | |
| £m | £m | £m | £m | £m | | £m | |
|
|
|
|
|
|
|
|
|
|
|
| |
| Exchange rate | | | | | | | | | | | | |
| contracts: | | | | | | | | | | | | |
|
|
|
|
|
|
|
|
|
|
|
| |
| Cross-currency | | | | | | | | | | | | |
| swaps | 10,572 | | 253 | | 428 | | 10,801 | | 173 | | 218 | |
|
|
|
|
|
|
|
|
|
|
|
| |
| Foreign exchange | | | | | | | | | | | | |
| swaps and | | | | | | | | | | | | |
| forwards | 19,399 | | 76 | | 72 | | 7,558 | | 60 | | 121 | |
|
|
|
|
|
|
|
|
|
|
|
| |
| | 29,971 | | 329 | | 500 | | 18,359 | | 233 | | 339 | |
|
|
|
|
|
|
|
|
|
|
|
| |
| Interest rate | | | | | | | | | | | | |
| contracts: | | | | | | | | | | | | |
|
|
|
|
|
|
|
|
|
|
|
| |
| Interest rate | | | | | | | | | | | | |
| swaps | 380,989 | | 8,254 | | 8,794 | | 329,834 | | 10,006 | | 10,432 | |
|
|
|
|
|
|
|
|
|
|
|
| |
| Caps, floors | | | | | | | | | | | | |
| and swaptions | 56,436 | | 771 | | 796 | | 74,462 | | 714 | | 904 | |
|
|
|
|
|
|
|
|
|
|
|
| |
| Futures | | | | | | | | | | | | |
| (exchange traded) | 5,348 | | 32 | | 28 | | 25,274 | | – | | 8 | |
|
|
|
|
|
|
|
|
|
|
|
| |
| Forward rate | | | | | | | | | | | | |
| agreements | 4,547 | | 2 | | 1 | | 1,722 | | – | | 7 | |
|
|
|
|
|
|
|
|
|
|
|
| |
| | 447,320 | | 9,059 | | 9,619 | | 431,292 | | 10,720 | | 11,351 | |
|
|
|
|
|
|
|
|
|
|
|
| |
| Equity and | | | | | | | | | | | | |
| credit contracts: | | | | | | | | | | | | |
|
|
|
|
|
|
|
|
|
|
|
| |
| Equity index and | | | | | | | | | | | | |
| similar products | 11,561 | | 538 | | 2,535 | | 13,639 | | 348 | | 1,233 | |
|
|
|
|
|
|
|
|
|
|
|
| |
| Equity index options | | | | | | | | | | | | |
| (exchange traded) | 8,363 | | 70 | | 301 | | 2,538 | | – | | 193 | |
|
|
|
|
|
|
|
|
|
|
|
| |
| Credit default | | | | | | | | | | | | |
| swaps and | | | | | | | | | | | | |
| similar products | 16,171 | | 103 | | 74 | | 11,412 | | 154 | | 96 | |
|
|
|
|
|
|
|
|
|
|
|
| |
| | 36,095 | | 711 | | 2,910 | | 27,589 | | 502 | | 1,522 | |
|
|
|
|
|
|
|
|
|
|
|
| |
| Total | 513,386 | | 10,099 | | 13,029 | | 477,240 | | 11,455 | | 13,212 | |
|
|
|
|
|
|
|
|
|
|
|
| |
| Effect of netting | | | (8,456 | ) | (8,456 | ) | | | (9,745 | ) | (9,745 | ) |
|
|
|
|
|
|
|
|
|
|
|
| |
| Fair values of contracts | | | | | | | | | | | |
| between ANFP and | | | | | | | | | | | |
| other Group entities | | | – | | 189 | | | | 132 | | – | |
|
|
|
|
|
|
|
|
|
|
|
| |
| Amount included | | | | | | | | | | | | |
| in Other assets/ | | | | | | | | | | | | |
| Other liabilities | | | 1,643 | | 4,762 | | | | 1,842 | | 3,467 | |
|
|
|
|
|
|
|
|
|
|
|
| |
| | |
| (1) | Associated contracts which Abbey National Financial Products has transacted with external counterparties are included in the analysis of trading derivatives. |
| Abbey Annual Report and Accounts 2003 | 151 |
Back to Contents
Financial Statements
Notes to the Financial Statementscontinued
Positive fair values arise where gross positive fair values exceed gross negative fair values on a contract by contract basis. This equates to net replacement cost. Negative fair values arise where gross negative fair values exceed gross positive fair values on a contract by contract basis. The totals of positive and negative fair values arising on trading derivatives at 31 December 2003 have been netted where the Group has a legal right of offset with the relevant counterparty.
All exchange traded instruments are subject to cash requirements under the standard margin arrangements applied by the individual exchanges. Such instruments are not subject to significant credit risk.
Abbey National Treasury Services has a mandate to deal in credit derivatives. Abbey National Treasury Services acts as principal under this mandate, and takes a fee for guaranteeing the counterparty against the default of the senior obligations of a third party. Amounts in respect of non-trading credit derivative contracts are included under note 46, Guarantees and assets pledged as collateral security.
Substantially all of Abbey’s over-the-counter derivatives activity is contracted with financial institutions.
The following table analyses over-the-counter and other non-exchange traded derivatives held for trading purposes by remaining maturity:
| | Group | |
|
|
|
|
|
|
|
| |
| | Contract or | | Replace- | | Contract or | | Replace- | |
| underlying | ment | underlying | ment |
| principal | cost | principal | cost |
| 2003 | 2003 | 2002 | 2002 |
| £m | £m | £m | £m |
|
|
|
|
|
|
|
| |
| Trading derivatives | | | | | | | | |
| maturing (before netting): | | | | | | | | |
|
|
|
|
|
|
|
| |
| In not more than one year | 105,884 | | 1,018 | | 122,334 | | 994 | |
|
|
|
|
|
|
|
| |
| In more than one | | | | | | | | |
| year but not more | | | | | | | | |
| than five years | 219,871 | | 3,914 | | 186,066 | | 4,585 | |
|
|
|
|
|
|
|
| |
| In more than five years | 173,920 | | 5,065 | | 141,028 | | 5,876 | |
|
|
|
|
|
|
|
| |
| | 499,675 | | 9,997 | | 449,428 | | 1,455 | |
|
|
|
|
|
|
|
| |
Unrecognised gains and losses on financial assets and financial liabilities resulting from hedge accounting
Gains and losses on financial instruments used for hedging are not recognised until the exposure that is being hedged is itself recognised. Unrecognised gains and losses on instruments used for hedging are as follows:
| | Group | |
|
|
|
|
|
| |
| | | | | | 2003 | |
| 2003 | 2003 | Net gains |
| Gains | Losses | (losses) |
| £m | £m | £m |
|
|
|
|
|
| |
| Gains and losses expected | | | | | | |
| to be recognised: | | | | | | |
|
|
|
|
|
| |
| In one year or less | 633 | | (423 | ) | 210 | |
|
|
|
|
|
| |
| After one year | 1,561 | | (2,071 | ) | (510 | ) |
|
|
|
|
|
| |
| | 2,194 | | (2,494 | ) | (300 | ) |
|
|
|
|
|
| |
| | | | | | | |
| | | | | | 2003 | |
| 2002 | 2002 | Net gains |
| Gains | Losses | (losses) |
| £m | £m | £m |
|
|
|
|
|
| |
| Gains and losses expected | | | | | | |
| to be recognised: | | | | | | |
|
|
|
|
|
| |
| In one year or less | 678 | | (549 | ) | 129 | |
|
|
|
|
|
| |
| After one year | 1,686 | | (2,205 | ) | (519 | ) |
|
|
|
|
|
| |
| | 2,364 | | (2,754 | ) | (390 | ) |
|
|
|
|
|
| |
The net gain unrecognised at 31 December 2002 and recognised during the year was £129m (2001: £157m).
Deferred gains and losses on financial assets and financial liabilities resulting from hedge accounting
Deferred balances relating to settled derivatives and other financial transactions previously used as hedges will be released to the profit and loss account in the same periods as the income and expense flows from the underlying hedged transactions. The movement in the period is as follows:
| | Group | |
|
|
|
|
|
| |
| | | | | | Total | |
| | | Net gains |
| Gains | Losses | (losses) |
| £m | £m | £m |
|
|
|
|
|
| |
| At 1 January 2003 | 64 | | (17 | ) | 47 | |
|
|
|
|
|
| |
| Previous year’s deferred gains | | | | | | |
| and losses recognised in the year | (9 | ) | (3 | ) | (12 | ) |
|
|
|
|
|
| |
| Gains and losses deferred in the year | (9 | ) | 9 | | – | |
|
|
|
|
|
| |
| At 31 December 2003 | 46 | | (11 | ) | 35 | |
|
|
|
|
|
| |
| Gains and losses expected | | | | | | |
| to be recognised: | | | | | | |
|
|
|
|
|
| |
| In one year or less | 10 | | (11 | ) | (1 | ) |
|
|
|
|
|
| |
| After one year | 36 | | – | | 36 | |
|
|
|
|
|
| |
| 152 | Abbey Annual Report and Accounts 2003 |
Back to Contents
Financial Statements
Notes to the Financial Statementscontinued
52. Consolidated cash flow statement
a) Reconciliation of (loss)/profit before tax to net cash inflow from operating activities
| | 2003 | | 2002 | | 2001 | |
| | £m | | £m | | £m | |
|
|
|
|
|
| |
| Profit/(loss) on ordinary | | | | | | |
| activities before tax | (686 | ) | (984 | ) | 1,470 | |
|
|
|
|
|
| |
| Decrease in interest | | | | | | |
| receivable and prepaid expenses | 531 | | 540 | | 441 | |
|
|
|
|
|
| |
| (Decrease)/increase in interest | | | | | | |
| payable and accrued expenses | 26 | | (25 | ) | 366 | |
|
|
|
|
|
| |
| Provisions for bad and doubtful debts | 474 | | 514 | | 263 | |
|
|
|
|
|
| |
| Provisions for contingent liabilities | | | | | | |
| and commitments | 104 | | 50 | | (9 | ) |
|
|
|
|
|
| |
| Net advances written off | (267 | ) | (289 | ) | (288 | ) |
|
|
|
|
|
| |
| Decrease before tax from | | | | | | |
| Long Term Assurance business | 202 | | 311 | | 98 | |
|
|
|
|
|
| |
| Depreciation and amortisation | 401 | | 1,585 | | 403 | |
|
|
|
|
|
| |
| Income from associated undertakings | (12 | ) | (17 | ) | (14 | ) |
|
|
|
|
|
| |
| Profit on sale of subsidiary and | | | | | | |
| associated undertakings | (89 | ) | (48 | ) | (67 | ) |
|
|
|
|
|
| |
| Profit/(loss) on sale of tangible | | | | | | |
| fixed assets and investments | 497 | | 55 | | (57 | ) |
|
|
|
|
|
| |
| Effect of other deferrals and accruals | | | | | | |
| of cash flows from operating activities | (278 | ) | 190 | | 191 | |
|
|
|
|
|
| |
| Net cash inflow from trading activities | 903 | | 1,882 | | 2,797 | |
|
|
|
|
|
| |
| Net (increase)/decrease in loans and | | | | | | |
| advances to banks and customers | (10,943 | ) | (5,104 | ) | 4,319 | |
|
|
|
|
|
| |
| Net (increase)/decrease in investment | | | | | | |
| in finance leases | (13 | ) | 404 | | 328 | |
|
|
|
|
|
| |
| Net (increase)/decrease in bills | | | | | | |
| and securities | 1,115 | | (5,643 | ) | 1,054 | |
|
|
|
|
|
| |
| Net (decrease) in deposits | | | | | | |
| and customer accounts | (3,291 | ) | (369 | ) | (4,090 | ) |
|
|
|
|
|
| |
| Net (decrease) in debt | | | | | | |
| securities in issue | (21,778 | ) | (4,432 | ) | (3,056 | ) |
|
|
|
|
|
| |
| Net increase in other liabilities | | | | | | |
| less assets | 1,947 | | 2,006 | | 362 | |
|
|
|
|
|
| |
| Exchange movements | (618 | ) | 304 | | 26 | |
|
|
|
|
|
| |
| Net cash (outflow)/inflow from | | | | | | |
| operating activities | (32,678 | ) | (10,952 | ) | 1,740 | |
|
|
|
|
|
| |
Exchange movements represent exchange movements on cash balances and investing and financing activities. The movements are not indicative of Abbey's exposure to foreign exchange risk on these items, because foreign currency positions in such balances are substantially hedged by other on-balance sheet and off-balance sheet foreign currency amounts. All other exchange movements, including movements on hedges, are included in the relevant captions in the above reconciliation.
b) Analysis of the balances of cash as shown in the balance sheet
Included in the balance sheet are the following amounts of cash:
| | | | Loans and | | | |
| | Cash and | | advances to | | | |
| | balances | | other banks | | | |
| | with central | | repayable | | | |
| | banks | | on demand | | Total | |
| | £m | | £m | | £m | |
|
|
|
|
|
| |
| At 1 January 2003 | 396 | | 2,698 | | 3,094 | |
|
|
|
|
|
| |
| Net cash inflow | 43 | | 391 | | 434 | |
|
|
|
|
|
| |
| At 31 December 2003 | 439 | | 3,089 | | 3,528 | |
|
|
|
|
|
| |
| At 1 January 2002 | 494 | | 5,452 | | 5,946 | |
|
|
|
|
|
| |
| Net cash (outflow) | (98 | ) | (2,754 | ) | (2,852 | ) |
|
|
|
|
|
| |
| At 31 December 2002 | 396 | | 2,698 | | 3,094 | |
|
|
|
|
|
| |
| At 1 January 2001 | 437 | | 5,539 | | 5,976 | |
|
|
|
|
|
| |
| Net cash inflow/(outflow) | 57 | | (87 | ) | (30 | ) |
|
|
|
|
|
| |
| At 31 December 2001 | 494 | | 5,452 | | 5,946 | |
|
|
|
|
|
| |
Abbey is required to maintain balances with the Bank of England which at 31 December 2003 amounted to £127m (2002: £131m, 2001: £124m). These are shown in Loans and advances to banks, and are not included in cash for the purposes of the cash flow statement.
c) Analysis of changes in financing during the year
| | Share | | Non- | | | | Other | | | |
| | capital inc. | | equity | | Sub- | | long term | | | |
| | share | | minority | | ordinated | | capital | | | |
| | premium | | interests | | liabilities | | instruments | | Total | |
| | £m | | £m | | £m | | £m | | £m | |
|
|
|
|
|
|
|
|
|
| |
| At 1 January 2003 | 2,626 | | 627 | | 6,532 | | 771 | | 10,556 | |
|
|
|
|
|
|
|
|
|
| |
| Net cash (outflow) | | | | | | | | | | |
| from financing | (122 | ) | (15 | ) | (56 | ) | – | | (193 | ) |
|
|
|
|
|
|
|
|
|
| |
| Shares issued for a | | | | | | | | | | |
| non-cash consideration | 18 | | – | | – | | – | | 18 | |
|
|
|
|
|
|
|
|
|
| |
| Effect offoreign exchange | | | | | | | | | | |
| rate changes | – | | (58 | ) | (139 | ) | (29 | ) | (226 | ) |
|
|
|
|
|
|
|
|
|
| |
| At 31 December 2003 | 2,522 | | 554 | | 6,337 | | 742 | | 10,155 | |
|
|
|
|
|
|
|
|
|
| |
| At 1 January 2002 | 2,520 | | 681 | | 6,590 | | 297 | | 10,088 | |
|
|
|
|
|
|
|
|
|
| |
| Net cash inflow | | | | | | | | | | |
| from financing | 17 | | 15 | | 170 | | 485 | | 687 | |
|
|
|
|
|
|
|
|
|
| |
| Shares issued for a | | | | | | | | | | |
| non-cash consideration | 82 | | – | | – | | – | | 82 | |
|
|
|
|
|
|
|
|
|
| |
| Capitalised on exercise | | | | | | | | | | |
| of share options | 7 | | – | | – | | – | | 7 | |
|
|
|
|
|
|
|
|
|
| |
| Effect of foreign exchange | | | | | | | | | | |
| rate changes | – | | (69 | ) | (228 | ) | (11 | ) | (308 | ) |
|
|
|
|
|
|
|
|
|
| |
| At 31 December 2002 | 2,626 | | 627 | | 6,532 | | 771 | | 10,556 | |
|
|
|
|
|
|
|
|
|
| |
| At 1 January 2001 | 2,078 | | 664 | | 5,871 | | – | | 8,613 | |
|
|
|
|
|
|
|
|
|
| |
| Net cash inflow from | | | | | | | | | | |
| financing | 325 | | – | | 686 | | 297 | | 1,308 | |
|
|
|
|
|
|
|
|
|
| |
| Shares issued for | | | | | | | | | | |
| a non-cash consideration | 104 | | – | | – | | – | | 104 | |
|
|
|
|
|
|
|
|
|
| |
| Capitalised on exercise | | | | | | | | | | |
| of share options | 13 | | – | | – | | – | | 13 | |
|
|
|
|
|
|
|
|
|
| |
| Effect offoreign exchange | | | | | | | | | | |
| rate changes | – | | 17 | | 33 | | – | | 50 | |
|
|
|
|
|
|
|
|
|
| |
| At 31 December 2001 | 2,520 | | 681 | | 6,590 | | 297 | | 10,088 | |
|
|
|
|
|
|
|
|
|
| |
| Abbey Annual Report and Accounts | 153 |
Back to Contents
Financial Statements
Notes to the Financial Statements continued
d) Acquisitions of subsidiary undertakings and purchase of businesses
| | 2003 | | 2002 | | 2001 | |
| | £m | | £m | | £m | |
|
|
|
|
|
| |
| Net assets acquired: | | | | | | |
|
|
|
|
|
| |
| Loans and advances to banks | – | | – | | 1,590 | |
|
|
|
|
|
| |
| Loans and advances to customers | – | | 281 | | 15 | |
|
|
|
|
|
| |
| Operating lease assets | – | | – | | 89 | |
|
|
|
|
|
| |
| Tangible fixed assets | – | | – | | 1 | |
|
|
|
|
|
| |
| Other assets | – | | 6 | | 21 | |
|
|
|
|
|
| |
| Debt securities | – | | – | | 634 | |
|
|
|
|
|
| |
| Long term assurance business | – | | – | | 271 | |
|
|
|
|
|
| |
| Assets oflong term assurance funds | – | | – | | 9,411 | |
|
|
|
|
|
| |
| Customer accounts | – | | – | | (1,507 | ) |
|
|
|
|
|
| |
| Deposits by banks | – | | (50 | ) | – | |
|
|
|
|
|
| |
| Debt securities in issue | – | | (31 | ) | – | |
|
|
|
|
|
| |
| Provisions for liabilities and charges | – | | (2 | ) | (16 | ) |
|
|
|
|
|
| |
| Other liabilities | – | | (8 | ) | (21 | ) |
|
|
|
|
|
| |
| Liabilities oflong term assurance funds | – | | – | | (9,411 | ) |
|
|
|
|
|
| |
| Goodwill on acquisitions | – | | 8 | | 1,0341 | |
|
|
|
|
|
| |
| | – | | 204 | | 2,111 | |
|
|
|
|
|
| |
| Satisfied by: | | | | | | |
|
|
|
|
|
| |
| Cash | – | | 1,597 | | 498 | |
|
|
|
|
|
| |
| Deferred cash/loan notes* | – | | (1,393 | ) | 1,613 | |
|
|
|
|
|
| |
| | – | | 204 | | 2,111 | |
|
|
|
|
|
| |
| * | Such items relate to the consideration for the settlement of Scottish Provident of £1,393m settled in cash and £220m in loan notes at the option of the members during 2002. |
e) Analysis of the net outflow of cash in respect of acquisitions of subsidiary undertakings and purchase of businesses
| | 2003 | | 2002 | | 2001 | |
| | £m | | £m | | £m | |
|
|
|
|
|
| |
| Cash consideration | – | | 1,597 | | 498 | |
|
|
|
|
|
| |
f) Sale of subsidiary, associated undertakings and businesses
| | 2003 | | 2002 | | 2001 | |
| | £m | | £m | | £m | |
|
|
|
|
|
| |
| Net assets disposed of: | | | | | | |
|
|
|
|
|
| |
| Cash at bank and in hand | 11 | | – | | 12 | |
|
|
|
|
|
| |
| Loans and advances to banks | 26 | | 10 | | 32 | |
|
|
|
|
|
| |
| Loans and advances to customers | 7,780 | | 21 | | – | |
|
|
|
|
|
| |
| Net investment in finance leases | 887 | | 887 | | 127 | |
|
|
|
|
|
| |
| Debt securities | 16 | | – | | – | |
|
|
|
|
|
| |
| Equity shares and other similar interests | – | | – | | 1 | |
|
|
|
|
|
| |
| Other assets | 144 | | 54 | | 115 | |
|
|
|
|
|
| |
| Tangible fixed assets | 14 | | 1 | | 49 | |
|
|
|
|
|
| |
| Operating lease assets | 75 | | 362 | | – | |
|
|
|
|
|
| |
| Interests in associated undertakings | – | | – | | 4 | |
|
|
|
|
|
| |
| Deposits by banks | (56 | ) | (12 | ) | (113 | ) |
|
|
|
|
|
| |
| Customer accounts | (1 | ) | – | | (16 | ) |
|
|
|
|
|
| |
| Debt Securities in Issue | (23 | ) | – | | – | |
|
|
|
|
|
| |
| Other liabilities | (74 | ) | (107 | ) | (108 | ) |
|
|
|
|
|
| |
| Provisions for liabilities and charges | (266 | ) | (262 | ) | (31 | ) |
|
|
|
|
|
| |
| Goodwill disposed of | 2 | | 46 | | – | |
|
|
|
|
|
| |
| Goodwill written back | 190 | | 13 | | – | |
|
|
|
|
|
| |
| Profit on disposal | 89 | | 48 | | 67 | |
|
|
|
|
|
| |
| | 8,814 | | 1,061 | | 139 | |
|
|
|
|
|
| |
| Satisfied by: | | | | | | |
|
|
|
|
|
| |
| Cash | 8,814 | | 1,061 | | 139 | |
|
|
|
|
|
| |
g) Analysis of the net inflow of cash in respect of the sale of subsidiary and associated undertakings
| | 2003 | | 2002 | | 2001 | |
| | £m | | £m | | £m | |
|
|
|
|
|
| |
| Cash received as consideration | 8,814 | | 1,061 | | 139 | |
|
|
|
|
|
| |
| Cash disposed of | (11 | ) | – | | (12 | ) |
|
|
|
|
|
| |
| Net cash inflow in respect of sale of | | | | | | |
| subsidiary and associated undertakings | 8,803 | | 1,061 | | 127 | |
|
|
|
|
|
| |
53. Retirement benefits
The Abbey National Amalgamated Pension Fund, Abbey National Group Pension Scheme, Abbey National Associated Bodies Pension Fund, Scottish Mutual Assurance Staff Pension Scheme, Scottish Provident Institutional Staff Pension Fund and National & Provincial Building Society Pension Fund are the principal pension schemes within Abbey, covering 70% (2002: 73%) of Abbey's employees, and are all funded defined benefits schemes. All are closed schemes, thus under the projected unit method the current service cost will increase as members of the schemes reach retirement.
Formal actuarial valuations of the assets and liabilities of the schemes are carried out on a triennial basis by an independent professionally qualified actuary. The latest formal actuarial valuation was made at 31 March 2002 for the Amalgamated Fund, Associated Bodies Fund and Group Pension Scheme, 31 December 2000 for the Scottish Provident Institution Staff Pension Fund, 31 March 2003 for the National & Provincial Building Society Pension Fund and 31 December 2002 for the Scottish Mutual Assurance Staff Pension Scheme. In addition, there is an annual review by the appointed actuary. The results of these reviews are included in the financial statements.
| | |
| 154 | Abbey Annual Report and Accounts 2003 |
Back to Contents
Financial Statements
Notes to the Financial Statements continued
The main long term financial assumptions, as stated in absolute terms, used in the 2003 annual review were:
| | 2003
Nominalper annum | | 2002
Nominalper annum | |
| | % | | % | |
|
|
|
| |
| Investment returns | 6.6 | | 6.1 | |
|
|
|
| |
| Pension increases | 2.5 | | 2.5 | |
|
|
|
| |
| General salary increase | 4.0 | | 4.0 | |
|
|
|
| |
| General price inflation | 2.5 | | 2.5 | |
|
|
|
| |
At the latest actuarial review date, the market value of the combined assets was £1,829m and the combined funding level was 76%. All of the pension fund liabilities are valued on an actuarial basis using the projected unit method. In the period ended 31 December 2003, the employer's contribution rates to the schemes ranged between 7.9% and 33.4%. In consultation with the actuary, the agreed contribution rates for future years range from 9.9% to 49.2%.
As shown in the table below, the pension cost reflects the regular contribution rate less amounts in respect of the surplus or deficit being recognised over the expected remaining service lives of the members of all Abbey's schemes in accordance with SSAP 24, Accounting for pension costs. Surpluses or deficits are amortised on the basis of a percentage of payroll to align with contribution rates. The pension cost charged to the Profit and Loss account for the year was as follows:
| | | | Group | |
|
|
|
| |
| | 2003 | | 2002 | |
| | £m | | £m | |
|
|
|
| |
| Regular cost | 75 | | 85 | |
|
|
|
| |
| Amortisation of surpluses arising on pension schemes | – | | (3 | ) |
|
|
|
| |
| Amortisation of deficits arising on pension schemes | 45 | | 16 | |
|
|
|
| |
| Amortisation of surplus arising from fair value | | | | |
| adjustment on acquisition of National & Provincial | 2 | | 2 | |
|
|
|
| |
| Charged to profit and loss account (note 38) | 122 | | 100 | |
|
|
|
| |
During 2003 an additional £15m (2002 £nil) was paid to the schemes in respect of contractual termination benefits arising from restructuring. In addition £6m (2002: £1m) was contributed to defined contribution and overseas pensions schemes.
Balances representing the difference between amounts paid to the respective pension schemes of Abbey and any amounts charged to the Profit and Loss account, in accordance with SSAP 24, are included in the balance sheet. At 31 December 2003, an asset of £23m (2002: £26m) and a liability of £38m (2002: £19m) have been included in the balance sheet accordingly. In addition, included in Other assets at 31 December 2003 was an amount of £15m (2002: £17m) in respect of the unamortised pension scheme surplus assessed at the date the business of National & Provincial was purchased. This was based on an actuarial assessment of the scheme at that date and is included in the balance sheet in accordance with FRS 17. This balance is being amortised over the average remaining service lives of employees in the scheme as shown above.
Additional disclosures required under the transition provisions of FRS 17:
Disclosures required under the transition provisions of FRS 17 are included below.
The main long term financial assumptions, as stated in absolute terms, under the provisions of FRS 17 are as follows:
| | 2003
Nominalper annum | | 2002
Nominal per annum | |
| | % | | % | |
|
|
|
| |
| Discount rate for scheme liabilities | 5.5 | | 5.75 | |
|
|
|
| |
| Pension and deferred pension increases | 2.7 | | 2.4 | |
|
|
|
| |
| General salary increase | 4.2 | | 3.9 | |
|
|
|
| |
| General price inflation | 2.7 | | 2.4 | |
|
|
|
| |
The fair value of the assets held by the pension schemes at 31 December 2003, and the expected rate of return for each class of assets for the current period, is as follows:
| | | | | | 2003 | | | | | | 2002 | |
|
|
|
|
|
|
|
|
|
|
|
| |
| | Expected rate ofreturn
% | | Fair value
£m | | % of thefair value to totalplan assets | | Expectedrate ofreturn
% | | Fair value
£m | | % of thefair valueto total plan assets | |
|
|
|
|
|
|
|
|
|
|
|
| |
| Equities | 7.25 | | 1,150 | | 52.1 | | 8.0 | | 1,477 | | 78.6 | |
|
|
|
|
|
|
|
|
|
|
|
| |
| Bonds | 5.2 | | 1,025 | | 46.5 | | 4.5 | | 326 | | 17.3 | |
|
|
|
|
|
|
|
|
|
|
|
| |
| Others | 4.4 | | 30 | | 1.4 | | 4.0 | | 77 | | 4.1 | |
|
|
|
|
|
|
|
|
|
|
|
| |
| | | | 2,205 | | 100 | | | | 1,880 | | 100 | |
|
|
|
|
|
|
|
|
|
|
|
| |
Pension fund liabilities are valued on an actuarial basis using the projected unit method and pension assets are stated at their fair value.
The net pension scheme deficit measured under FRS 17 at 31 December 2003 comprised the following:
| | 2003 | | 2002 | | 2001 | |
| | £m | | £m | | £m | |
|
|
|
|
|
| |
| Total market value of assets | 2,205 | | 1,880 | | 2,245 | |
|
|
|
|
|
| |
| Present value of scheme liabilities | (3,306 | ) | (2,722 | ) | (2,467 | ) |
|
|
|
|
|
| |
| FRS 17 scheme deficit | (1,101 | ) | (842 | ) | (222 | ) |
|
|
|
|
|
| |
| Related deferred tax asset | 330 | | 253 | | 67 | |
|
|
|
|
|
| |
| Net FRS 17 scheme deficit | (771 | ) | (589 | ) | (155 | ) |
|
|
|
|
|
| |
| | |
| Abbey Annual Report and Accounts 2003 | 155 |
Back to Contents
Financial Statements
Notes to the Financial Statementscontinued
The following amounts would be reflected in the Profit and Loss account and statement of total recognised gains and losses on implementation of FRS 17:
| | 2003 | | 2002 | |
| | £m | | £m | |
|
|
|
| |
| Amount that would be charged to operating profits: | | | | |
|
|
|
| |
| Current service cost | 118 | | 136 | |
|
|
|
| |
| Past service cost | 15 | | 6 | |
|
|
|
| |
| Gains on settlements | (13 | ) | (3 | ) |
|
|
|
| |
| Total operating charge | 120 | | 139 | |
|
|
|
| |
| Amount that would be credited to finance income: | | | | |
|
|
|
|
|
| Expected return on pension scheme assets | 140 | | (148 | ) |
|
|
|
| |
| Interest on pension scheme liabilities | (160 | ) | 145 | |
|
|
|
| |
| Net return | (20 | ) | (3 | ) |
|
|
|
| |
| | | | | |
| Amount that would be recognised in the statement of total recognised gains and losses: | | | | |
|
|
|
| |
| Actual return less expected return on pension scheme assets | 94 | | (547 | ) |
|
|
|
| |
| Experience gains and losses arising on | | | | |
| scheme liabilities | 31 | | (30 | ) |
|
|
|
| |
| Gains arising from changes in assumptions underlying the present value of scheme liabilities | (359 | ) | 9 | |
|
|
|
| |
| Actuarial (loss) | (234 | ) | (568 | ) |
|
|
|
| |
| | 2003 | | 2002 | |
| | £m | | £m | |
|
|
|
| |
| Movement on pension scheme deficits | | | | |
| during the year: | | | | |
|
|
|
| |
| Deficit at 1 January | (842 | ) | (222 | ) |
|
|
|
| |
| Current service cost | (118 | ) | (136 | ) |
|
|
|
| |
| Contributions | 115 | | 84 | |
|
|
|
| |
| Past service cost | (15 | ) | (6 | ) |
|
|
|
| |
| Gain on settlements | 13 | | 3 | |
|
|
|
| |
| Other finance income | (20 | ) | 3 | |
|
|
|
| |
| Actuarial (loss) | (234 | ) | (568 | ) |
|
|
|
| |
| Deficit at 31 December | (1,101 | ) | (842 | ) |
|
|
|
| |
| History of experience gains or losses | | | | |
|
|
|
| |
| Difference between expected and actual | | | | |
| return on scheme assets: | | | | |
|
|
|
| |
| Amount (£m) | (94 | ) | (547 | ) |
|
|
|
| |
| Percentage (%) of scheme assets | 4.3 | | 29 | |
|
|
|
| |
| Experience gains or losses on scheme liabilities: | | | | |
|
|
|
| |
| Amount (£m) | (31 | ) | (30 | ) |
|
|
|
| |
| Percentage (%) of the present value | | | | |
| of scheme liabilities | 0.9 | | 1 | |
|
|
|
| |
| Total gain/loss recognised: | | | | |
|
|
|
| |
| Gain on change of assumptions | 234 | | (9 | ) |
|
|
|
| |
| Percentage (%) of the present value | | | | |
| of scheme liabilities | 7.1 | | 0 | |
|
|
|
| |
| Amount (£m) | 41 | | (568 | ) |
|
|
|
| |
If the full provisions of FRS 17 were reflected in the financial statements, the Group Profit and Loss account reserve of £2,527m would be reduced by £787m (2002: £606m) to £1,740m (2002: £3,044m). This reduction reflects the FRS 17 position shown above and the reversal of the remaining unamortised asset relating to the surplus in the National & Provincial pension fund at acquisition.
54. Directors' emoluments and interests
Further details of Directors' emoluments and interests are included in the Remuneration report on pages 99 to 105. These details include, as specified for audit by the UK Listing Authority, an analysis, by Director, of salary and other payments and benefits on page 101, an analysis of Directors' share interests and share options on pages 102 to 104 and details of the Directors' conditional rights over the Company's shares under the Long Term Incentive Plan on page 105, all of which form part of these financial statements.
Ex gratia pensions paid to former Directors of Abbey National plc in 2003, which have been provided for previously, amounted to £74,199 (2002: £73,010). In 1992, the Board decided not to award any new such ex gratia pensions.
Details of loans, quasi loans and credit transactions entered into or agreed by the Company or its subsidiaries with persons who are or were Directors and connected persons and officers of the Company during the year were as follows:
| | | | Aggregate | |
| | | | amount | |
| | Number of | | outstanding | |
| | persons | | £000 | |
|
|
|
| |
| Directors | | | | |
|
|
|
|
|
| Loans | 1 | | 14 | |
|
|
|
|
|
| Quasi loans | 2 | | 2 | |
|
|
|
|
|
| Credit transactions | – | | – | |
|
|
|
| |
| Officers | | | | |
|
|
|
|
|
| Loans | 13 | | 1,038 | |
|
|
|
|
|
| Quasi loans | 11 | | 21 | |
|
|
|
|
|
| Credit transactions | – | | – | |
|
|
|
| |
No Director had a material interest in any contract of significance, other than a service contract, with the Company or any of its subsidiaries at any time during the year. The Directors did not have any interests in shares or debentures of subsidiaries. Further disclosures relating to these transactions, as required under FRS 8, Related party disclosures, are given in note 56.
55. Share-based payments
Abbey grants share options to executive officers and employees principally under the Executive Share Option scheme, Sharesave scheme and the Employee Share Option scheme.
Options granted under the Executive Share Option scheme are generally exercisable between the third and tenth anniversaries of the grant date, provided that certain performance criteria are met.
Under the Sharesave scheme, eligible employees can elect to exercise their options either three, five or seven years after the grant date. See note 42 to the consolidated financial statements for a description of the options granted under this scheme.
The number of options authorised to be granted is currently limited to 10% of the total number of shares issued since conversion.
The total compensation expense for equity-settled share based transactions recognised in the Profit and Loss account was £8m (2002: £7m, 2001: £6m).
The fair value of each option for 2003, 2002 and 2001 has been estimated as at the grant date using the Black-Scholes option pricing model using the following assumptions:
| | |
| 156 | Abbey Annual Report and Accounts 2003 |
Back to Contents
Financial Statements
Notes to the Financial Statementscontinued
| | 2003 | | 2002 | | 2001 | |
|
|
|
|
|
| |
| Risk free interest rate | 3.7%-7.3% | | 4.2% – 7.9% | | 4.5% – 8.0% | |
|
|
|
|
|
| |
| Dividend growth, based solely upon average growth since 1989 | 14% | | 14% | | 14% | |
|
|
|
|
|
| |
| Volatility of underlying shares based upon historical volatility over five years | 22.7%-42.3% | | 22.7% – 40.0% | | 23.4% – 36.4% | |
|
|
|
|
|
| |
| Expected lives of options granted under: | | | | | | |
|
|
|
|
|
| |
| Employee Sharesave scheme | 3, 5 and 7 years* | | 3, 5 and 7 years* | | 3, 5 and 7 years* | |
|
|
|
|
|
| |
| Executive Share Option scheme | 6 years | | 6 years | | 6 years | |
|
|
|
|
|
| |
| Employee Share Option scheme | 5 years | | 5 years | | 5 years | |
|
|
|
|
|
| |
| | | | | | | |
| * For three, five and seven year schemes respectively. | | | | | | |
The following table summarises the movement in the number of share options between those outstanding at the beginning and end of the year, together with the changes in weighted average exercise price over the same period.
| | Executive Share
Option scheme | | Employee Sharesave
scheme | | Employee Share
Option scheme | |
|
|
|
|
|
|
|
| |
| | Number of
options
granted | | Weighted
average
exercise
price
£ | | Number of
options
granted | | Weighted
average
exercise
price
£ | | Number of
options
granted | | Weighted
average
exercise
price
£ | |
|
|
|
|
|
|
|
|
|
|
|
| |
| 2003 | | | | | | | | | | | | |
|
|
|
|
|
|
|
|
|
|
|
| |
| Options outstanding at the beginning of the year | 8,005,206 | | 9.15 | | 18,173,482 | | 6.32 | | 10,507,253 | | 11.08 | |
|
|
|
|
|
|
|
|
|
|
|
| |
| Options granted during the year | 8,576,826 | | 3.80 | | 27,113,143 | | 3.20 | | – | | – | |
|
|
|
|
|
|
|
|
|
|
|
| |
| Options exercised during the year | (114,990 | ) | 3.98 | | (246,456 | ) | 4.06 | | (450 | ) | 5.91 | |
|
|
|
|
|
|
|
|
|
|
|
| |
| Options forfeited during the year | (522,772 | ) | 8.84 | | (6,574,266 | ) | 5.10 | | (1,597,660 | ) | 11.16 | |
|
|
|
|
|
|
|
|
|
|
|
| |
| Options expired during the year | (763,338 | ) | 7.13 | | (10,137,314 | ) | 6.39 | | – | | – | |
|
|
|
|
|
|
|
|
|
|
|
| |
| Options outstanding at the end of the year | 15,180,932 | | 6.27 | | 28,328,589 | | 3.61 | | 8,909,143 | | 11.07 | |
|
|
|
|
|
|
|
|
|
|
|
| |
| Options exercisable at the end of the year | 2,859,158 | | 8.39 | | – | | – | | 2,965,128 | | 10.59 | |
|
|
|
|
|
|
|
|
|
|
|
| |
| The weighted-average grant-date fair value | | | | | | | | | | | | |
| of options granted during the year | | | 0.52 | | | | 0.38 | | | | – | |
|
|
|
|
|
|
|
|
|
|
|
| |
| | | | | | | | | | | | | |
| 2002 | | | | | | | | | | | | |
|
|
|
|
|
|
|
|
|
|
|
| |
| Options outstanding at the beginning of the year | 5,366,178 | | 8.85 | | 18,919,108 | | 6.02 | | 11 ,335,103 | | 11.04 | |
|
|
|
|
|
|
|
|
|
|
|
| |
| Options granted during the year | 3,822,618 | | 9.37 | | 4,800,602 | | 7.95 | | – | | – | |
|
|
|
|
|
|
|
|
|
|
|
| |
| Options exercised during the year | (454,919 | ) | 6.43 | | (2,502,602 | ) | 5.76 | | (113,100 | ) | 5.91 | |
|
|
|
|
|
|
|
|
|
|
|
| |
| Options forfeited during the year | (622,983 | ) | 9.53 | | (2,142,906 | ) | 7.34 | | (396,500 | ) | 11.25 | |
|
|
|
|
|
|
|
|
|
|
|
| |
| Options expired during the year | (105,688 | ) | 11.91 | | (900,720 | ) | 7.81 | | (318,250 | ) | 11.25 | |
|
|
|
|
|
|
|
|
|
|
|
| |
| Options outstanding at the end of the year | 8,005,206 | | 9.15 | | 18,173,482 | | 6.32 | | 10,507,253 | | 11.08 | |
|
|
|
|
|
|
|
|
|
|
|
| |
| Options exercisable at the end of the year | 2,098,028 | | 9.52 | | 39,182 | | 4.82 | | 561,128 | | 5.91 | |
|
|
|
|
|
|
|
|
|
|
|
| |
| The weighted-average grant-date fair value | | | | | | | | | | | | |
| of options granted during the year | | | 0.99 | | | | 2.37 | | | | – | |
|
|
|
|
|
|
|
|
|
|
|
| |
| | | | | | | | | | | | | |
| 2001 | | | | | | | | | | | | |
|
|
|
|
|
|
|
|
|
|
|
| |
| Options outstanding at the beginning of the year | 4,975,250 | | 7.87 | | 21,611,647 | | 5.52 | | 4,891,275 | | 9.48 | |
|
|
|
|
|
|
|
|
|
|
|
| |
| Options granted during the year | 1,1 88,085 | | 11.02 | | 2,304,674 | | 9.29 | | 7,950,875 | | 11.31 | |
|
|
|
|
|
|
|
|
|
|
|
| |
| Options exercised during the year | (749,693 | ) | 5.46 | | (2,754,262 | ) | 4.78 | | (1,087,872 | ) | 5.96 | |
|
|
|
|
|
|
|
|
|
|
|
| |
| Options forfeited during the year | – | | – | | (2,242,257 | ) | 5.23 | | (419,175 | ) | 4.92 | |
|
|
|
|
|
|
|
|
|
|
|
| |
| | | | | | | | | | | | | |
| Options expired during the year | (47,464 | ) | 11.19 | | (694 | ) | 10.81 | | – | | – | |
|
|
|
|
|
|
|
|
|
|
|
| |
| Options outstanding at the end of the year | 5,366,178 | | 8.85 | | 18,919,108 | | 6.02 | | 11 ,335,103 | | 11.04 | |
|
|
|
|
|
|
|
|
|
|
|
| |
| Options exercisable at the end of the year | 2,089,442 | | 8.03 | | 23,512 | | 3.37 | | 687,653 | | 5.91 | |
|
|
|
|
|
|
|
|
|
|
|
| |
| The weighted-average grant-date fair value | | | | | | | | | | | | |
| of options granted during the year | | | 2.11 | | | | 4.11 | | | | 2.66 | |
|
|
|
|
|
|
|
|
|
|
|
| |
| | | | | | | | | | | | | |
| Abbey Annual Report and Accounts 2003 | 157 |
Back to Contents
Financial Statements
Notes to the Financial Statementscontinued
The following table summarises information about the options outstanding at 31 December 2003.
| Executive Share Option | | | Options outstanding | | Options exercisable | |
|
|
|
|
|
| |
| Range of exercise prices | | | Weighted | | | | | | | |
| Number | | average | | Weighted | | Number | | Weighted | |
| outstanding | | remaining | | average | | exercisable | | average | |
| at | | contractual | | exercise | | at | | exercise | |
| 31/12/2003 | | life (Years) | | prices (£) | | 31/12/2003 | | prices (£) | |
|
|
|
|
|
|
|
|
|
| |
| Between £3 and £4 | 7,838,398 | | 9.25 | | 3.73 | | – | | – | |
|
|
|
|
|
|
|
|
|
| |
| Between £4 and £5 | 65,000 | | 1.02 | | 4.80 | | 65,000 | | 4.80 | |
|
|
|
|
|
|
|
|
|
| |
| Between £5 and £6 | 194,383 | | 1.27 | | 5.87 | | 194,383 | | 5.67 | |
|
|
|
|
|
|
|
|
|
| |
| Between £6 and £7 | 1,847,289 | | 7.43 | | 6.22 | | 1,082,373 | | 6.46 | |
|
|
|
|
|
|
|
|
|
| |
| Between £7 and £8 | 617,817 | | 3.57 | | 7.25 | | 617,817 | | 7.25 | |
|
|
|
|
|
|
|
|
|
| |
| Between £9 and £10 | 2,627,063 | | 8.25 | | 9.72 | | – | | – | |
|
|
|
|
|
|
|
|
|
| |
| Between £10 and £12 | 1,540,800 | | 8.25 | | 11.18 | | 449,403 | | 11.63 | |
|
|
|
|
|
|
|
|
|
| |
| Between £13 and £14 | 450,182 | | 6.48 | | 13.06 | | 450,182 | | 13.06 | |
|
|
|
|
|
|
|
|
|
| |
| | 15,180,932 | | | | | | 2,859,158 | | | |
|
|
|
|
|
|
|
|
|
| |
| | | | | | | | | | | |
| Employee Sharesave Scheme | | | Options outstanding | | Options exercisable | |
|
|
|
|
|
| |
| | | | Weighted | | | | | | | |
| | Number | | average | | Weighted | | Number | | Weighted | |
| | outstanding | | remaining | | average | | exercisable | | average | |
| | at | | contractual | | exercise | | at | | exercise | |
| Range of exercise prices | 31/12/2003 | | life (Years) | | prices (£) | | 31/12/2003 | | prices (£) | |
|
|
|
|
|
|
|
|
|
| |
| Between £3 and £4 | 24,456,526 | | 3.92 | | 3.20 | | – | | – | |
|
|
|
|
|
|
|
|
|
| |
| Between £4 and £5 | 836 | | – | | 4.66 | | – | | – | |
|
|
|
|
|
|
|
|
|
| |
| Between £5 and £6 | 2,483,376 | | 1.81 | | 5.14 | | – | | – | |
|
|
|
|
|
|
|
|
|
| |
| Between £6 and £7 | 317,935 | | 0.75 | | 6.07 | | – | | – | |
|
|
|
|
|
|
|
|
|
| |
| Between £7 and £8 | 416,403 | | 3.92 | | 7.76 | | – | | – | |
|
|
|
|
|
|
|
|
|
| |
| Between £8 and £9 | 173,459 | | 1.75 | | 8.53 | | – | | – | |
|
|
|
|
|
|
|
|
|
| |
| Between £9 and £10 | 480,054 | | 1.66 | | 9.60 | | – | | – | |
|
|
|
|
|
|
|
|
|
| |
| | 28,328,589 | | | | | | | | | |
|
|
|
|
|
|
|
|
|
| |
Under the Employee Sharesave scheme, the weighted-average exercise prices of options are less than the market prices of the shares on the relevant grant dates.
| Employee Share Option Scheme | | | Options outstanding | | Options exercisable | |
|
|
|
|
|
| |
| | | | Weighted | | | | | | | |
| | Number | | average | | Weighted | | Number | | Weighted | |
| | outstanding | | remaining | | average | | exercisable | | average | |
| | at | | contractual | | exercise | | at | | exercise | |
| Range of exercise prices | 31/12/2003 | | life (Years) | | prices (£) | | 31/12/2003 | | prices (£) | |
|
|
|
|
|
|
|
|
|
| |
| Between £5 and £6 | 501,728 | | 2.66 | | 5.91 | | 501,728 | | 5.91 | |
|
|
|
|
|
|
|
|
|
| |
| Between £11 and £12 | 8,407,475 | | 6.67 | | 11.38 | | 2,463,400 | | 11.54 | |
|
|
|
|
|
|
|
|
|
| |
| | 8,909,203 | | | | | | 2,965,128 | | | |
|
|
|
|
|
|
|
|
|
| |
| | |
| 158 | Abbey Annual Report and Accounts 2003 |
Back to Contents
Financial Statements
Notes to the Financial Statements continued
56. Related party disclosures
a) Transactions with directors, executive officers and their close family members
Directors, executive officers and members of their close families have undertaken the following transactions with Abbey in the course of normal banking and life assurance business.
| | | | Amounts in | |
| | | | respect of | |
| | | | directors, | |
| | | | executive | |
| | | | officers(1) and | |
| | Number | | their close | |
| | of directors | | family | |
| | and executive | | members | |
| | officers | (1) | 2003 | |
| | 2003 | | £000 | |
|
|
|
| |
| Secured loans, unsecured loans | | | | |
| and overdrafts | | | | |
|
|
|
| |
| Net movements in the year | 1 | | (375 | ) |
|
|
|
| |
| Balances outstanding as at 31 December | 1 | | 14 | |
|
|
|
| |
| Deposit, bank and | | | | |
| instant access accounts and investments | | | | |
|
|
|
| |
| Net movements in the year | 9 | | (3,310 | ) |
|
|
|
| |
| Balances outstanding as at 31 December | 9 | | 1,165 | |
|
|
|
| |
| Life assurance policies | | | | |
|
|
|
| |
| Net movements in the year | 1 | | 7 | |
|
|
|
| |
| Total sum insured/value of investment | 2 | | 107 | |
|
|
|
| |
| | | | | |
| | | | Amounts in | |
| | | | respect of | |
| | | | directors, | |
| | | | executive | |
| | | | officers(1)and | |
| | Number | | their close | |
| | of directors | | family | |
| | and executive | | members | |
| | officers | (1) | 2002 | |
| | 2002 | | £000 | |
|
|
|
| |
| Secured loans, unsecured loans | | | | |
| and overdrafts | | | | |
|
|
|
| |
| Net movements in the year | 10 | | (1,024 | ) |
|
|
|
| |
| Balances outstanding as at 31 December | 4 | | 389 | |
|
|
|
| |
| Deposit, bank and | | | | |
| instant access accounts and investments | | | | |
|
|
|
| |
| Net movements in the year | 17 | | 74 | |
|
|
|
| |
| Balances outstanding as at 31 December | 1 | | 4,475 | |
|
|
|
| |
| Life assurance policies | | | | |
|
|
|
| |
| Net movements in the year | 3 | | (711 | ) |
|
|
|
| |
| Total sum insured/value of investment | 1 | | 100 | |
|
|
|
| |
| | |
| (1) | Executive officers are defined as those officers who report directly to Abbey's Chief Executive. |
Directors have also undertaken sharedealing transactions through an execution only stockbroker subsidiary company of an aggregate net value of £640,606. The transactions were on normal business terms and standard commission rates were payable.
Secured and unsecured loans are made to Directors, executive officers and their close family members on the same terms and conditions as applicable to other employees within Abbey.
Amounts deposited by Directors, executive officers and their close family members earn interest at the same rates as those offered to the market or on the same terms and conditions applicable to other employees within Abbey.
Life assurance policies and investments are entered into by Directors, executive officers and their close family members on normal market terms and conditions, or on the same terms and conditions as applicable to other employees within Abbey.
b) Transactions with associated undertakings
Abbey National plc holds a 50% share in PSA Finance plc (PSA), a subsidiary of Peugeot SA. PSA is a finance organisation providing financial services to the Peugeot-Citroen car dealership network.
The income receivable from Abbey's interest in PSA amounted to £12m (2002: £17m) in the year.
Abbey has a 25% interest in Electronic Data Systems Credit Services Ltd, a subsidiary of Electronic Data Systems Ltd. Electronic Data Systems Ltd is a professional services firm specialising in information technology. The income receivable from Abbey's interest in Electronic Data Systems Credit Services Ltd amounted to £nil (2002: nil) in the period.
Balances outstanding between Abbey and associated companies at 31 December 2003 are detailed in note 32. Further details of Abbey's interests in associated undertakings are shown in note 23.
c) Transactions with Long Term Assurance Funds
The Long Term Assurance Funds are related parties for the purposes of this disclosure because the assets and liabilities of the Long Term Assurance Funds are included in the balance sheet.
At 31 December 2003, Abbey entities owed £858m (2002: £571m) to, and were owed £411m (2002: £520m) by, the Long Term Assurance Funds. Of these respective amounts £852m (2002: £564m) relates to amounts deposited by the Long Term Assurance Funds with non life assurance entities, and £376m (2002: £443m) relates to amounts owed by the Long Term Assurance Funds to non life assurance entities. The remaining amounts represent balances between the Long Term Assurance Funds and the Shareholders' funds of the life assurance businesses. In addition, the Long Term Assurance Funds have lent £1,647m (2002: £2,142m) of investment assets to a subsidiary of Abbey National Treasury Services under stock lending agreements at 31 December 2003.
Included in Loans and advances to customers are two contingent loans to the Long Term Assurance Funds of Scottish Mutual Assurance and Scottish Provident of £571m and £623m respectively. See note 21 for further details.
Included in Fees and commissions receivable in the year is an amount of £27m (2002: £34m) receivable from the Long Term Assurance Fund of Abbey National Life plc in respect of life assurance products sold through the retail branch network, and an amount of £272m payable (2002: £49m receivable) to the Long Term Assurance Funds of Abbey National Life and Scottish Mutual Assurance in respect of option premiums paid from/to Abbey National Treasury Services.
During the year Abbey National Financial Investment Services plc incurred costs amounting to £223m (2002: £225m) on behalf of the Long Term Assurance Funds. All such costs were recharged to the Long Term Assurance Funds and included within the charge to income from Long Term Assurance business. Included within Fees and commissions receivable are management fees received by Abbey National Financial Investment Services totalling £0.2bn (2002: £0.2bn) from the Long Term Assurance Funds.
Details of transfers of funds between Shareholders' funds and Long Term Assurance Funds are provided in note 21. Included within Assets of Long Term Assurance Funds and Liabilities of Long Term Assurance Funds are amounts owing between the Long Term Assurance Funds of £15m (2002: £26m).
The value of the funds' holdings in internally managed unit trusts amounted to £4,604m (2002: £3,870m) at 31 December 2003. The unit trusts are managed by Abbey National Unit Trust Management Ltd, Scottish Mutual Investment Fund Managers Ltd, Scottish Mutual Investment Managers Ltd and Abbey National Asset Managers Ltd.
| Abbey Annual Report and Accounts 2003 | 159 |
Back to Contents
Financial Statements
Notes to the Financial Statements continued
57. Profit/(Loss) on sale or termination of a business
As a consequence of Abbey's reorganisation announced in February 2003, a loss of £33m on the termination of a business has been recognised during the year. This charge consists of £27m related to the run off of the First National Motor Finance business in the First National segment and £6m related to the wind down of the Structured Corporate Banking and Asset Management & Risk Transfer businesses in the Wholesale segment.
The total charge comprises £16m of employee redundancy costs, of which £6m related to Wholesale and £10m related to First National, and £17m of other First National costs including lost funding to dealers and lost advances commissions.
58. Differences between UK and US GAAP
The significant differences applicable to Abbey's financial statements are summarised below.
Goodwill
UK GAAP Goodwill arising on consolidation as a result of the acquisitions of subsidiary and associated undertakings after 1 January 1998, and goodwill arising on the purchase of businesses after 1 January 1998, is capitalised under the heading, Intangible fixed assets, and amortised over its expected useful economic life, subject to a maximum period of 20 years. Such goodwill is subject to review for impairment in accordance with FRS 11, Impairment of fixed assets and goodwill, which allows testing for impairment at the income generating unit level. The useful economic life is calculated using a valuation model which determines the period of time over which returns are expected to exceed the cost of capital. Goodwill arising on consolidation as a result of the acquisitions of subsidiary and associated undertakings prior to 1 January 1998, and goodwill which arose on the purchase of businesses prior to 1 January 1998, has previously been taken to Shareholders' funds as reserves.
US GAAP SFAS 142, Goodwill and Other Intangible Assets, requires that goodwill resulting from acquisitions be capitalised. Goodwill balances are not amortised, but are subject to an annual impairment test at a reporting unit level. Goodwill is written off to the extent that it is judged to be impaired. Prior to the adoption of SFAS 142, goodwill resulting from acquisitions was capitalised and amortised in the consolidated statement of net income over the period in which the benefits were estimated to accrue.
As described in note 25, in the course of 2002 Abbey recorded an impairment of £604m related to the goodwill on Scottish Provident Limited. UK GAAP requires impairment analysis at the income generating unit level. Under US GAAP, Abbey tested Scottish Provident Limited for impairment at the reporting unit level. As a result of this difference in analysis and the US GAAP book value of Scottish Provident Limited being approximately £1.4 bn less due to differences in accounting for Shareholders' interest in Long Term Assurance business, there is no similar impairment of goodwill under US GAAP.
Other intangible assets
UK GAAP An intangible asset is a non-financial asset that does not have physical substance but is identifiable and controlled by the entity through custody or legal rights. Under UK GAAP, in connection with acquisitions, the values of depositor relationships, distribution channels, trademarks and brands have not been considered separately identifiable assets and are included in Goodwill.
US GAAP An intangible asset shall be recognised if it arises from contracted or other legal rights or if it is capable of being separated or divided from the acquired entity and sold, transferred, licensed, rented or exchanged. Under US GAAP, in connection with acquisitions, the values of depositor relationships, distribution channels, trademarks and brands are considered separately identifiable assets. To the extent that such assets are recognised there are equivalent reductions in goodwill. The value ascribed to depositor relationships is amortised to net income over the average life of the depositor relationship in question. The values ascribed to distribution channels, trademarks and brands are amortised to net income over their estimated lives.
Computer software
UK GAAP Expenses on the purchase or development of computer software are charged to the profit and loss account as incurred.
US GAAP The American Institute of Certified Public Accountants (AICPA) Statement of Position 98-1 "Accounting for the costs of computer software developed or obtained for internal use" requires certain costs relating to software developed or obtained for internal use to be capitalised and amortised on a straight-line basis over the expected useful life of the software.
Pension costs
UK GAAP Where pensions are provided by means of a funded defined benefits scheme, annual contributions are based on actuarial advice. The expected cost of providing pensions is recognised on a systematic basis over the expected average remaining service lives of the members of the scheme. Variations from regular cost are spread over the average remaining service lives of current employees on a straight-line basis.
US GAAP SFAS 87, "Employers Accounting for Pensions", prescribes the method of actuarial valuation, which includes differences from certain assumptions used for the UK GAAP actuarial computation. In addition, assets are assessed at fair value and liabilities are assessed at current settlement rates. Certain variations from regular cost are allocated in equal amounts over the average remaining service lives of current employees.
| 160 | Abbey Annual Report and Accounts 2003 |
Back to Contents
Financial Statements
Notes to the Financial Statements continued
Leasing
UK GAAP For lessors, income from finance leases, including benefits from declining tax rates, is credited to the profit and loss account using the actuarial after tax method to give a constant periodic rate of return on the net cash investment. For lessees, leases are categorised as finance leases when the substance of the agreement is that of a financing transaction and the lessee assumes substantially all of the risks and benefits relating to the asset. All other leases are categorised as operating leases.
In connection with a sale and leaseback, for the seller/ lessee, a gain on sale is recognised where the leaseback is an operating lease. US GAAP For lessors, finance lease income is recognised so as to give a level rate of return on the investment in the lease, but without taking into account tax payments and receipts. For lessees, the general principles of UK GAAP and US GAAP are similar, however the latter has more stringent requirements to classify leases as finance leases. These requirements are outlined in SFAS 13, and include, among other things, an assessment of whether the lease contains a bargain purchase option and a minimum lease term of 75% of the leased asset's useful life. All other leases are classified as operating leases.
In connection with a sale and leaseback, for the seller/ lessee, US GAAP precludes the immediate recognition of a gain under certain conditions on a sale where the leaseback is an operating lease. Rather this gain is deferred and amortised over the life of the contract.
Shareholders' interest in Long Term Assurance business
UK GAAP Abbey accounts for its life assurance operations using the embedded value basis of accounting, under UK GAAP applicable to banking groups. An embedded value is an actuarially determined estimate of the economic value of a life assurance company, excluding any value which may be attributed to future new business. The embedded value is the sum of the shareholders' share of net assets of the life assurance company and the present value of the shareholders' share of emerging surplus from the existing business. The value of the existing business is calculated by projecting future net cash flows using appropriate economic and actuarial best estimate assumptions and the result discounted at a rate which reflects the shareholders' overall risk premium.
In Abbey's balance sheet, the shareholders' and policyholders' interests in the Long Term Assurance business are shown separately as one-line items in order to reflect their different nature. The value of the Long Term Assurance Business represents the embedded value described above. Assets of Long Term Assurance Funds mainly consist of investments held in the long-term assurance funds either on behalf of policyholders, or which have not yet been allocated to either the policyholders or the shareholder. Liabilities of Long Term Assurance Funds mainly comprise policyholder benefits provisions.
US GAAP Except as regards acquired blocks of business the net present value of the profits of the in-force business is not recognised under US GAAP. Contracts which cover with-profits pension (with minimal insurance risk), unitised with-profits, unit linked and annuity in payment policies are classified as universal life, investment or limited payment policies and accounted for in accordance with SFAS 97, "Accounting and Reporting by Insurance Enterprises for Certain Long-Duration Contracts and Realised Gains and Losses from the Sale of Investments." Contracts for all other policies with significant mortality and/or morbidity risk including endowment, term and whole of life policies are accounted for in accordance with SFAS 60, "Accounting and Reporting by Insurance Enterprises."
Revenue Recognition
UK GAAP The change in embedded value during any reported period adjusted for any dividends declared or capital injected, and grossed up at the underlying rate of corporation tax, is reflected in Abbey's profit and loss account as income from life assurance business.
US GAAP Premiums for SFAS 60 products are recognised as revenue when due from policyholders and the costs of claims are recognised when insured events occur. Acquisition costs are charged to the profit and loss account in proportion to premium revenue recognised.
Premiums for universal life and investment contracts are applied as increases to policyholder account balances when received. Revenues derived from these policies consist of mortality charges, policy administration charges, investment management fees and surrender charges that are deducted from the policyholder account balances.
Premiums and policy charges received from customers that relate to future periods are deferred until the period to which they relate and are recorded as a deferred income liability. For limited payment contracts, the excess of the gross premium over the US GAAP net benefit premium is deferred and amortised in relation to expected future benefit payments.
For investment and universal life contracts, policy charges that relate to future periods and related acquisition costs are deferred and amortised in relation to expected gross profits. Expected gross profits are projected on current best estimate assumptions with no provisions for adverse deviation. Costs of claims are recognised when insured events occur.
Deferred acquisition costs
UK GAAP The cost of acquiring new and renewal life assurance business is recognised in the embedded value calculation as incurred under UK GAAP applicable to banking groups.
US GAAP Under US GAAP the costs incurred by the insurer in the acquisition of new and renewal life insurance business are capitalised. These consist of the acquisition costs, principally, commissions and other variable sales costs.
Deferred acquisition costs for SFAS 60 products are amortised in relation to premium income using assumptions consistent with those used in computing policyholder benefits provisions. Deferred acquisition costs related to investment and universal life contracts are amortised in proportion to the estimated gross profits arising from the contracts.
Policyholder liabilities
UK GAAP Future policyholder benefit provisions included in Abbey's balance sheet are calculated, under UK GAAP applicable to banking groups, using approved actuarial methods (such as net and gross premium methods) for with-profit life insurance and other protection-type policies and are based on fund value for unitised with-profits insurance policies and investment-type policies. Net premiums are calculated using assumptions for interest, mortality, morbidity and expenses. These assumptions are determined as prudent best estimates at the date of valuation. Liabilities are not established for future annual and terminal bonus declarations.
US GAAP For SFAS 97 defined products, the liability is represented by the policyholder's account balance before any applicable surrender charges. Policyholder benefit liabilities for products defined by SFAS 60 are developed using the net level premiums method. Assumptions for interest, mortality, morbidity withdrawals and expenses are prepared using best estimates at date of policy issue (or date of company acquisition by Abbey, if later) plus a provision for adverse deviation based on the insurer's experience.
| Abbey Annual Report and Accounts 2003 | 161 |
Back to Contents
Financial Statements
Notes to the Financial Statementscontinued
With-profits business
With-profits policies entitle the policyholder to participate in the surplus within the with-profits life fund of the insurance company which issued the policy. Regular bonuses are determined and declared annually by the issuing company’s Board of Directors on the advice of the appointed actuary. Bonuses take the form of additional benefits which are only paid on termination of the policy. The bonuses that may be declared are highly correlated, over a period of time, to the overall performance of the underlying assets and liabilities of the fund in which the contract is invested over that same period of time. Bonuses are designed to provide policyholders with a share of the total performance of the issuing company during the period of the contract broadly consistent with the "asset share" of the individual contract.
The contract for with-profits business written into the with-profits fund provides that approximately 90 per cent of the surplus arising from the net assets of the fund which is distributed is allocated to policyholders in the form of annual bonuses. For unitised with-profits business written into the with-profits fund all of the surplus that is distributed is allocated to policyholders as bonus.
UK GAAP All amounts in the with-profits funds not yet allocated to policyholders or shareholders are recorded in the liabilities attributable to policyholders on Abbeys balance sheet.
US GAAP A liability is established for undistributed policyholder allocations. The excess of assets over liabilities in the with-profits fund is allocated to the policyholders and shareholders in accordance with the proportions prescribed by the contracts. The remaining liability comprises the obligation of the insurance company to the policyholders. Any remaining asset is provided for in full.
Guaranteed Annuity Options
Abbey has issued a number of with-profits pensions contracts, both regular and single premium, which have a guaranteed convertibility option on maturity, fixing a minimum rate at which conversion into an immediate annuity will be made.
UK GAAP An estimate of the fair value of the guarantee payable to the policyholders, on a net present value basis, is provided for in the liabilities of the with-profit fund.
US GAAP The guaranteed annuity option is considered to only give rise to a mortality risk when the right to purchase is exercised by the policyholder. If purchased, the annuity is a new contract and evaluated under SFAS 97 at that time. Consequently, the additional liability is not recognised except as part of a fair valuation of liabilities when a life company is acquired.
Investments in securities
UK GAAP Securities held for investment purposes are stated at cost adjusted for any amortisation of premium or discount. Provision is made for any impairment in value.
All securities not held for investment purposes are stated at fair value and profits and losses arising from this revaluation are taken to the profit and loss account.
Debt and Equity securities are periodically reviewed on a case by case basis to determine whether any decline in fair value below the carrying value is an indication of impairment. A review for impairment of a security includes, among other things, consideration of the credit risk associated with the security, including an assessment of the likelihood of collection of amounts due pursuant to the contractual terms of the security in excess of the cost of the security.
Should an event reverse the effects of a previous impairment, the carrying value of the security may be written up to a value no higher than the original cost which would have been recognised had the original impairment not occurred.
Providing a general allowance for unidentified impairment losses in a portfolio of securities is permitted.
US GAAP Investments in securities with readily determinable market values are classified as trading securities, available for sale securities, and held to maturity securities in accordance with SFAS 115. Debt securities classified as held to maturity represent securities that Abbey has both the ability and the intent to hold until maturity. Held to maturity securities are stated at cost and adjusted for any amortisation of premium or discount.
Securities classified as trading represent securities that Abbey bought and holds principally for the purpose of selling them in the near term. Trading securities are accounted for in the same way as securities not held for investment purposes under UK GAAP. Debt and Equity securities classified as available for sale represent securities not classified as either held to maturity or trading securities. Available for sale securities are reported at fair value. Where a security, or proportion of a security, is unhedged, the unrealised gains and losses are excluded from earnings and reported in a separate component of shareholders’ funds. Where a security, or a proportion of a security, is hedged by a fair value hedge, the unrealised gain or loss on both the security and the derivative financial instrument hedging the available for sale security will be taken to earnings.
Securities classified as either available-for-sale or held-to-maturity are required to be reviewed on an individual basis to identify whether their fair values have declined to a level below amortised cost and, if so, whether the decline is other-than-temporary. Provision is reflected in earnings as a realised loss for any impairment that is considered to be other-than-temporary. If it is probable that an investor will be unable to collect all amounts due according to the contractual terms of a debt security, an other-than-temporary impairment is considered to have occurred . Recognition of other-than-temporary impairment may be required as a result of a decline in a security's value due to a deterioration in the issuer's creditworthiness, an increase in market interest rates or a change in foreign exchange rates since acquisition. Other circumstances in which a decline in the fair value of a debt security may be other-than-temporary include situations where the security will be disposed of before it matures or the investment is not realisable.
Emerging Issues Task Force (EITF) pronouncement EITF 99-20 "Recognition of Interest Income and Impairment on Purchased and Retained Beneficial Interests in Securitised Financial Assets" (EITF 99-20) requires impairment testing on applicable asset backed securities to be performed using a discounted cash flow model on an individual security basis. If the present value of the security's original cash flows estimated at the initial transaction date (or the last date previously revised) is greater than the present value of the current estimated cash flows at the financial reporting date, an other-than-temporary impairment is usually considered to have occurred. The security is written down to fair value (i.e. the present value of the current estimated
| 162 | Abbey Annual Report and Accounts 2003 |
Back to Contents
Financial Statements
Notes to the Financial Statements continued
cash flows) with the resulting change being included in income. In 2003, Abbey reviewed its UK impairment testing procedures and adopted the specific impairment testing methodology required by EITF 99-20 for applicable asset backed securities for UK GAAP purposes.
If an impairment loss is recognised, the cost basis of the individual security is written down to fair value as a new cost basis. The new cost basis is not changed for subsequent recoveries in fair value.
Providing a general allowance for unidentified impairment losses in a portfolio of securities is not permitted.
Loan origination fees and costs
UK GAAP Loan origination fees received in respect of services provided are recognised in the profit and loss account as the services are performed. Where loan origination fees or costs are in the nature of interest or income, they are recognised in the profit and loss account over the period of time in which Abbey has the right to recover the incentives in the event of early redemption.
US GAAP To the extent that loan origination fees are not offset by related direct costs, they are deferred and amortised through the profit and loss account over the life of the loan, in accordance with SFAS 91, "Accounting for Non-refundable Fees and Costs Associated with Originating or Acquiring Loans and Initial Direct Costs of Losses". Abbey includes estimates of future prepayments in the calculation of constant yield. These estimates are based on detailed mortgage prepayment models.
Securitised assets
UK GAAP Under FRS 5, "Reporting the substance of transactions", where assets are financed in such a way that the maximum loss that Abbey can suffer is limited to a fixed monetary amount, whilst not changing in any significant way the entity's access to the benefits (including servicing fees) or risks of holding those asset's, then providing certain conditions are met the assets remain on balance sheet and any finance received is deducted from the assets. Specifically, paragraph D8(c) of Application Note D to FRS 5, stipulates that derecognition is not appropriate where the originator retains rights to further sums, including among other things, in the form of servicing fees. Such treatment is referred to as linked presentation. Special purpose vehicles are treated as quasi-subsidiaries and are consolidated where the risks and rewards from operations are similar to those which would be obtained for a subsidiary.
US GAAP SFAS 140, "Accounting for Transfers and Servicing of Financial Assets and Extinguishments of Liabilities", requires that after a transfer of financial assets, an entity recognises the financial and servicing assets it controls and the liabilities it has incurred, derecognises financial assets when control has been surrendered, and derecognises liabilities when extinguished. The statement contains rules for distinguishing transfers of financial assets that are sales from transfers that are secured borrowings. The only interests that Abbey retains in its securitisation transactions are interest-only securities and servicing assets. Contrary to UK GAAP, the retention of a servicing asset does not, of itself, preclude the transfer of financial assets to be treated as a sale. In accordance with SFAS 140, Abbey treats its securitisations of mortgage and debt securities portfolios as sales and, where appropriate, recognises a servicing asset and an interest receivable asset, and amortises them over the periods in which the benefits are expected to be received.
Derivatives and Hedging Activities
UK GAAP Derivatives classified as trading are carried at market value in the balance sheet. Gains and losses are taken directly to the profit and loss account and reported within dealing profits.
Derivatives classified as non-trading are those entered into for the purpose of hedging risk from potential movements in foreign exchange rates, interest rates, and equity prices inherent in Abbey's non-trading assets, liabilities and positions. Non-trading derivatives are accounted for in a manner consistent with the assets, liabilities or positions being hedged. Income and expense on non-trading derivatives are recognised on an accruals basis. Credit derivatives, designated as non-trading and through which credit risk is taken on, are reported as guarantees, which best reflects the economic substance of those transactions.
The majority of Abbey's hedging contracts are transacted with an in-house risk management and trading operation, Abbey National Financial Products, in order to manage financial risks with external markets efficiently. Abbey National Financial Products transfers substantially all such risks into external markets on a portfolio basis in order to benefit from economies of scale, managing risk within predetermined limits. In Abbeys accounts, derivatives held as non-trading instruments are accounted for on an accruals basis.
US GAAP SFAS 133, "Accounting for Derivatives Instruments and Hedging Activities", requires that all derivatives instruments be recorded on the balance sheet at their fair value. Changes in the fair value of derivatives are recorded each period in current earnings or Other comprehensive income, depending on whether a derivative is designated and effective as part of a hedge transaction and, if it is, the type of hedge transaction. For fair-value hedge transactions in which Abbey is hedging changes in the fair value of an asset, liability, or firm commitment, changes in the fair value of the derivative will generally be offset in the income statement by changes in the hedged items fair value.
For cash flow hedge transactions, in which Abbey is hedging the variability of cash flows related to a variable-rate asset, liability, or a forecasted transaction, changes in the fair value of the derivative instrument are reported in Other comprehensive income. The gains and losses on the derivative instrument that are reported in Other comprehensive income are reclassified as earnings in the periods in which earnings are impacted by the variability of the cash flows of the hedged item. The ineffective portion of all hedges are recognised in current-period earnings.
The majority of Abbey's hedges are undertaken with its in-house trading operation, Abbey National Financial Product. Abbey National Financial Products match internal hedges with third party derivatives on an aggregate rather than individual basis and hedges the net outstanding position where Abbey has assets and liabilities, which largely offset the overall risk to Abbey. These hedges do not qualify under SFAS 133 to be treated as a cash flow, fair value or foreign exchange hedges. For this reason, such contracts are restated at market value for the purposes of the US GAAP reconciliation.
| Abbey Annual Report and Accounts 2003 | 163 |
Back to Contents
Financial Statements
Notes to the Financial Statementscontinued
Dividend payable
UK GAAP Dividends declared are recorded in the period to which they relate.
US GAAP Dividends are recorded in the period in which they are declared.
Deferred Tax
UK GAAP Deferred tax is provided for all timing differences between the recognition of gains and losses in the financial statements and their recognition in a tax computation. Deferred tax assets are recognised to the extent that it is regarded as more likely than not that there will be suitable taxable profits from which the future reversal of the underlying timing differences can be deducted.
US GAAP Under SFAS 109 "Accounting for Income Taxes" deferred tax assets and liabilities are recorded for all temporary differences. A valuation allowance is recorded against a deferred tax asset where it is more likely than not that some portion of the deferred tax asset will not be realised.
59. Current developments in UK and US GAAP
UK GAAP In October 2003 the Urgent Issues Task Force in the United Kingdom issued UITF 37 "Purchases and Sales of Own Shares", which requires shares that an entity holds in itself to be classified as Treasury Shares and deducted from Shareholders' Equity. No gains or losses are to be recognised on the purchase, sale, issue or cancellation of an entitys own shares. The effect of UITF 37 has been to reduce the 2002 (loss)/profit attributable to the shareholders of Abbey National plc under UK GAAP by £37m and has reduced 2002 shareholders' funds including non-equity interests, under UK GAAP, by £42m. In addition the Urgent Issues Task Force also issued UITF 38 Accounting for ESOP Trusts. UITF 38 was adopted in 2003 and replaces UITF 13 "Accounting for ESOP Trusts" in that shares held by an ESOP Trust in its sponsoring entity should be treated as Treasury Shares and deducted from Shareholders equity rather than being held as an asset.
US GAAP In April 2003, the Financial Accounting Standards Board (FASB) issued Statement of Financial Accounting Standards (SFAS) No. 149, "Amendment of SFAS 133 on Derivative Instruments and Hedging Activities". SFAS 149 amends and clarifies financial accounting and reporting for derivative instruments, including derivative instruments embedded in other contracts and for hedging activities under SFAS 133, Accounting for Derivative Instruments and Hedging Activities. SFAS 149 is applied prospectively and is effective for contracts entered into or modified after 30 June 2003, and for hedging relationships designated after 30 June 2003. SFAS 149 had no material impact on Abbey's financial position or results of operations.
In May 2003, the Financial Accounting Standards Board issued SFAS 150, "Accounting for Certain Financial Instruments with Characteristics of both Liabilities and Equity". SFAS 150 addresses how an issuer classifies and measures certain financial instruments with characteristics of both liabilities and equity and requires an issuer to classify a financial instrument that is within its scope as a liability (or asset in some circumstances). SFAS 150 is effective for financial instruments entered into or modified after 31 May 2003, and otherwise is effective at the beginning of the first interim period beginning after 15 June 2003. Abbey did not enter into or modify any financial instruments after 31 May 2003 that would be affected by SFAS 150. Abbey have undated subordinated liabilities entered into prior to this date which may be impacted by SFAS 150 when adopted for these instruments in 2004.
In December 2003, the Financial Accounting Standards Board reissued SFAS No. 132, "Employers' Disclosures About Pensions and Other Post-retirement Benefits (revised)" (SFAS 132R). SFAS 132R retains the disclosure requirements contained in the original statement, which it replaces. It also requires additional disclosures about the assets, obligations, cash flows, and net periodic benefit cost of defined benefit pension plans and other defined benefit post-retirement plans. These additional disclosures are generally required for periods ending after 15 December 2003, and can be found in note 62 to the financial statements.
In May 2003, the Financial Accounting Standards Board ratified the Emerging Issues Task Force (EITF) pronouncement EITF 03-1, "The Meaning of Other-Than-Temporary Impairment and Its Application to Certain Investments". This EITF pronouncement requires certain additional disclosures in relation to other-than-temporary impairments for investments accounted for under the cost method, or the equity method, or investments classified as either available-for-sale or held-to-maturity under SFAS 115 (including individual securities and mutual funds) and investments accounted for under SFAS 124. These additional disclosures are required for periods ended after 15 December 2003, and can be found in note 62 to the financial statements.
| 164 | Abbey Annual Report and Accounts 2003 |
Back to Contents
Financial Statements
Notes to the Financial Statements continued
60. Future developments in US GAAP
In January 2003, the Financial Accounting Standards Board released Financial Accounting Standards Board Interpretation No. 46, "Consolidation of Variable Interest Entities" (FIN 46) which was revised by the Financial Accounting Standards Board in December 2003. The revised interpretation (FIN 46R) changes the method of determining whether certain entities, including securitisation entities, should be included in Abbey's Consolidated Financial Statements. An entity is subject to FIN 46R and is called a variable interest entity (VIE) if it has (1) equity that is insufficient to permit the entity to finance its activities without additional subordinated financial support from other parties, (2) equity investors that cannot make significant decisions about the entity's operations, or that do not absorb the expected losses or receive the expected returns of the entity or (3) equity investors that have voting rights that are not proportionate to their economic interests and substantially all the activities of the entity involve, or are conducted on behalf of, an investor with a disproportionately small voting interest. A variable interest entity is consolidated by its primary beneficiary, which is the party involved with the variable interest entity that has a majority of the expected losses or a majority of the expected residual returns or both.
The provisions of FIN 46R will apply for Abbey to all entities subject to this interpretation in 2004.
Abbey currently consolidates the trust preferred entities Abbey National Capital Trust I, Abbey National Capital Trust II, Abbey National Capital LP and Abbey National Capital LP II. Accordingly, the inter-company 8.96% Subordinated Notes 2030 issued by Abbey to the trust preferred entities are eliminated in consolidation and the 8.96% non-cumulative trust preferred securities issued by the trust preferred entities that are held by unaffiliated third parties are presented as minority interest in Abbey's consolidated balance sheet. Under the guidance of FIN 46R Abbey may have to deconsolidate the trust preferred entities. Accordingly, the £554m of trust preferred securities at 31 December 2003, reflected as minority interest would be replaced by the £554m of subordinated notes issued by Abbey to the trust preferred entities and classified as debt.
In May 2003, the Financial Accounting Standards Board ratified EITF 00-21, "Revenue Arrangements with Multiple Deliverables".EITF 00-21 requires companies to determine whether a multiple-deliverable revenue arrangement contains more than one unit of accounting and, if so, how to measure and allocate the arrangement consideration to the separate units of accounting. EITF 00-21 is to be applied prospectively to revenue arrangements entered into in fiscal periods beginning after 15 June, 2003. This accounting pronouncement is not expected to have a significant impact on Abbey's financial position or results of operations.
In August 2003, the Financial Accounting Standards Board ratified EITF 03-7, "Accounting for the Settlement of the Equity-Settled Portion of a Convertible Debt Instrument That Permits or Requires the Conversion Spread to be Settled in Stock (Instrument C in issue 90-19)". EITF 03-7 addresses how an issuer should account for the partial cash-based and partial stock-based settlement of a debt instrument that is structured in the form of an Instrument C of EITF 90-19. Upon the settlement of the debt by payment of the principal in cash and settlement of the conversion spread with stock, only the cash payment is to be included in the computation of the gain or loss on extinguishment of the debt. EITF 03-7 is to be applied prospectively for transactions or arrangements entered into by Abbey after 1 January 2004. This accounting pronouncement is not expected to have a significant impact on Abbey's financial position or results of operations.
In August 2003, the Financial Accounting Standards Board ratified EITF 03-11, "Reporting Gains and Losses on Derivative Instruments That Are Subject to FASB Statement No. 133, Accounting for Derivative Instruments and Hedging Activities", and "Not Held for Trading Purposes" as Defined in EITF Issue No. 02-3, "Issues Related to Accounting for Contracts Involved in Energy Trading and Risk Management Activities". EITF 03-11 requires companies, when
determining whether realised gains and losses on derivative contracts not held for trading purposes should be reported on a net or gross basis, to make suchdeterminations as a matter of judgement that depends on the relevant facts and circumstances. EITF 03-11 is to be applied prospectively for transactions or arrangements entered into by Abbey after 1 January 2004. The application of EITF 03-11 is not expected to have a significant impact on Abbey's financial position or results of operations.
In July 2003, the American Institute of Certified Public Accountants issued Statement of Position (SOP) 03-1, "Accounting and Reporting by Insurance Enterprises for Certain Non-traditional Long-Duration Contracts and for Separate Accounts". SOP 03-1 provides guidance related to the reporting and disclosure of certain insurance contracts and separate accounts, including the accounting for annuitisation options. SOP 03-1 also addresses the capitalisation and amortisation of sales inducements to contract holders. SOP 03-1 is effective for fiscal years beginning after 15 December 2003. Management is currently evaluating the requirements of SOP 03-1, including financial statement presentations and disclosures.
In December 2003, the American Institute of Certified Public Accountants issued SOP 03-3 "Accounting for Certain Loans or Debt Securities Acquired in a Transfer" ("SOP 03-3"). SOP 03-3 addresses accounting for differences between contractual cash flows and cash flows expected to be collected from an investor's initial investment in loans or debt securities (loans) acquired in a transfer if those differences are attributable, at least in part, to credit quality. It includes such loans acquired in purchase business combinations but does not apply to loans originated by the entity. SOP 03-3 limits the yield that may be accredited to the excess of the investor's estimate of undiscounted expected principal, interest, and other cash flows over the investor's initial investment in the loan. The SOP requires that the excess of contractual cash flows over cash flows expected to be collected not be recognized as an adjustment of yield, loss accrual, or valuation allowance. SOP 03-3 also prohibits investors from displaying acceptable yield and nonaccreditable difference in the balance sheet. Subsequent increases in cash flows expected to be collected generally should be recognized prospectively through adjustment of the loan's yield over its remaining life. Decreases in cash flows expected to be collected should be recognized as impairment. SOP 03-3 is effective for loans acquired in fiscal years beginning after 15 December 2004. Management is currently evaluating the requirements of SOP 03-3.
| | |
| Abbey Annual Report and Accounts 2003 | 165 |
Back to Contents
Financial Statements
Notes to the Financial Statements continued
61. US GAAP reconciliation
The following table summarises the significant adjustments to consolidated net income and shareholders' funds which would result from the application of US GAAP instead of UK GAAP. Where applicable, the adjustments are stated gross of tax with the cumulative tax effect of all adjustments included separately.
| | | | 2002 | | 2001 | |
| | 2003 | (restated) | (1) | (restated) | (1) |
| Income statement | £m | £m | | £m | |
|
|
|
|
|
| |
| (Loss) profit attributable to the | | | | | | |
| shareholders of Abbey National plc | | | | | | |
| – UK GAAP | (699 | ) | (1,161 | ) | 947 | |
|
|
|
|
|
| |
| Dividends on preference shares | (60 | ) | (62 | ) | (42 | ) |
|
|
|
|
|
| |
| | (759 | ) | (1,223 | ) | 905 | |
|
|
|
|
|
| |
| US GAAP adjustments: | | | | | | |
|
|
|
|
|
| |
| Goodwill | (168 | ) | 714 | | (26 | ) |
|
|
|
|
|
| |
| Other intangible assets | (53 | ) | (120 | ) | (51 | ) |
|
|
|
|
|
| |
| Computer software | 25 | | 51 | | 81 | |
|
|
|
|
|
| |
| Depreciation | (67 | ) | (75 | ) | (59 | ) |
|
|
|
|
|
| |
| Pensions cost | (7 | ) | (28 | ) | (37 | ) |
|
|
|
|
|
| |
| Securitisation | 49 | | 23 | | 144 | |
|
|
|
|
|
| |
| Shareholders’ interest in long term | | | | | | |
| assurance business | 343 | | (673 | ) | 10 | |
|
|
|
|
|
| |
| Loan origination fees | 143 | | 129 | | 165 | |
|
|
|
|
|
| |
| Other | 27 | | 28 | | 19 | |
|
|
|
|
|
| |
| Derivatives and hedging activities | 303 | | (138 | ) | (240 | ) |
|
|
|
|
|
| |
| Tax effects on above adjustments | 33 | | (81 | ) | 31 | |
|
|
|
|
|
| |
| (Loss) earnings before a change | | | | | | |
| in accounting principle | (131 | ) | (1,393 | ) | 947 | |
|
|
|
|
|
| |
| Cumulative effect of a change in | | | | | | |
| accounting principle | – | | – | | 5 | |
|
|
|
|
|
| |
| Net (loss) income available to ordinary | | | | | | |
| shareholders – US GAAP | (131 | ) | (1,353 | ) | 947 | |
|
|
|
|
|
| |
| Net income (loss) from continuing | | | | | | |
| operations – US GAAP | 275 | | (662 | ) | 908 | |
|
|
|
|
|
| |
| Net (loss) income of discontinued | | | | | | |
| operations – US GAAP | (406 | ) | (731 | ) | 34 | |
|
|
|
|
|
| |
| Cumulative effect of a change in | | | | | | |
| accounting principle | – | | – | | 5 | |
|
|
|
|
|
| |
| Net (loss) income available to | | | | | | |
| ordinary shareholders – US GAAP | (131 | ) | (1,393 | ) | 947 | |
|
|
|
|
|
| |
| (Loss) earnings per 10 pence | | | | | | |
| ordinary share: | | | | | | |
|
|
|
|
|
| |
| – from continuing operations | | | | | | |
|
|
|
|
|
| |
| – basic | 19.0 | p | (45.9 | )p | 63.4 | p |
|
|
|
|
|
| |
| – diluted | 18.9 | p | (45.9 | )p | 63.4 | p |
|
|
|
|
|
| |
| – from discontinued operations | | | | | | |
|
|
|
|
|
| |
| – basic | (28.0 | )p | (50.7 | )p | 2.4 | p |
|
|
|
|
|
| |
| – diluted | (27.9 | )p | (50.7 | )p | 2.4 | p |
|
|
|
|
|
| |
| – due to a change in | | | | | | |
| accounting principle | | | | | | |
|
|
|
|
|
| |
| – basic and diluted | – | | – | | 0.4 | p |
|
|
|
|
|
| |
| – from net (loss) income available | | | | | | |
| to ordinary shareholders | | | | | | |
|
|
|
|
|
| |
| – basic and diluted | (9.0 | )p | (96.6 | )p | 65.8 | p |
|
|
|
|
|
| |
| | | | 2002 | |
| | 2003 | (restated) | (1) |
| Shareholders' funds | £m | £m | |
|
|
|
| |
| Shareholders' funds including | | | | |
| non-equity interests – UK GAAP | 5,331 | | 6,350 | |
|
|
|
| |
| Goodwill | 673 | | 846 | |
|
|
|
| |
| Other intangible assets | 251 | | 304 | |
|
|
|
| |
| Computer software | 117 | | 159 | |
|
|
|
| |
| Pensions cost | (464 | ) | (439 | ) |
|
|
|
| |
| Securitisation | 364 | | 219 | |
|
|
|
| |
| Shareholders’ interest in long term | | | | |
| assurance business | (971 | ) | (1,284 | ) |
|
|
|
| |
| Other | (140 | ) | (194 | ) |
|
|
|
| |
| Derivatives and hedging activities | 152 | | (410 | ) |
|
|
|
| |
| Loan origination fees | 353 | | 210 | |
|
|
|
| |
| Securities and investments | 89 | | 137 | |
|
|
|
| |
| Dividend payable | 242 | | 107 | |
|
|
|
|
|
| Tax effect on the above adjustments | 101 | | 232 | |
|
|
|
| |
| Deferred tax | (66 | ) | (147 | ) |
|
|
|
| |
| Shareholders’ funds – US GAAP | 6,032 | | 6,090 | |
|
|
|
| |
(1) Restated for the matters described in note 62 (s) and in the UK Accounting policies note.
| | |
| 166 | Abbey Annual Report and Accounts 2003 |
Back to Contents
Financial Statements
Notes to the Financial Statements continued
62. Further note disclosures on differences between UK and US GAAP, and certain additional US disclosures
a) Goodwill and other intangible assets
The following tables provide analyses of goodwill and intangible assets included in the balance sheet under US GAAP for the two years ended 31 December 2003, and 2002.
The changes in the carrying amounts of goodwill, by segment, for the years ended 31 December 2003, and 2002 are as follows:
| Goodwill | Banking | | Investment | | | | | | | | | | | |
| and | and | General | Wholesale | First | | Group |
| Savings | Protection | Insurance | Banking | National | Other | Total |
| £m | £m | £m | £m | £m | £m | £m |
|
|
|
|
|
|
|
|
|
|
|
|
|
| |
| Carrying value at 1 January 2003 | 273 | | 674 | | 4 | | 70 | | 190 | | 11 | | 1,222 | |
|
|
|
|
|
|
|
|
|
|
|
|
|
| |
| Disposals | – | | – | | – | | – | | (190 | ) | (4 | ) | (194 | ) |
|
|
|
|
|
|
|
|
|
|
|
|
|
| |
| Other movements | (16 | ) | – | | – | | – | | – | | 2 | | (14 | ) |
|
|
|
|
|
|
|
|
|
|
|
|
|
| |
| Carrying value at 31 December 2003 | 257 | | 674 | | 4 | | 70 | | – | | 9 | | 1,014 | |
|
|
|
|
|
|
|
|
|
|
|
|
|
| |
| Total Goodwill capitalised per UK GAAP | 95 | | 240 | | – | | – | | – | | 6 | | 341 | |
|
|
|
|
|
|
|
|
|
|
|
|
|
| |
| US/UK GAAP adjustment to shareholders’ funds | 162 | | 434 | | 4 | | 70 | | – | | 3 | | 673 | |
|
|
|
|
|
|
|
|
|
|
|
|
|
| |
| | | | | | | | | | | | | | | |
| Banking | Investment | | | | | |
| and | and | General | Wholesale | First | | Group |
| Savings | Protection | Insurance | Banking | National | Other | Total |
| £m | £m | £m | £m | £m | £m | £m |
|
|
|
|
|
|
|
|
|
|
|
|
|
| |
| Carrying value at 1 January 2002 | 400 | | 969 | | 4 | | 191 | | 484 | | 3 | | 2,051 | |
|
|
|
|
|
|
|
|
|
|
|
|
|
| |
| Additions | – | | – | | – | | – | | – | | 8 | | 8 | |
|
|
|
|
|
|
|
|
|
|
|
|
|
| |
| Disposals | – | | – | | – | | – | | (55 | ) | – | | (55 | ) |
|
|
|
|
|
|
|
|
|
|
|
|
|
| |
| Transfers | – | | (277 | ) | – | | – | | – | | – | | (277 | ) |
|
|
|
|
|
|
|
|
|
|
|
|
|
| |
| Other movements | (9 | ) | (18 | ) | – | | – | | – | | – | | (27 | ) |
|
|
|
|
|
|
|
|
|
|
|
|
|
| |
| Impairments | (118 | ) | – | | – | | (121 | ) | (239 | ) | – | | (478 | ) |
|
|
|
|
|
|
|
|
|
|
|
|
|
| |
| Carrying value at 31 December 2002 | 273 | | 674 | | 4 | | 70 | | 190 | | 1 | | 1,222 | |
|
|
|
|
|
|
|
|
|
|
|
|
|
| |
| Total Goodwill capitalised per UK GAAP | 15 | | 253 | | – | | – | | – | | 8 | | 376 | |
|
|
|
|
|
|
|
|
|
|
|
|
|
| |
| US/UK GAAP adjustment to shareholders’ funds | 158 | | 421 | | 4 | | 70 | | 190 | | 3 | | 846 | |
|
|
|
|
|
|
|
|
|
|
|
|
|
| |
| | | | | | | | | | | | | | | |
| | | | | | | | | | | | | | | |
| Abbey Annual Report and Accounts 2003 | 167 |
Back to Contents
Financial Statements
Notes to the Financial Statements continued
Abbey's net income under US GAAP is stated after a goodwill amortisation charge of nil (2002: nil, 2001: £76m). Excluding goodwill amortisation the revised (loss) earnings per share under US GAAP is (9.0)p (2002: (96.6)p (restated), 2001: 71.5p (restated)).
| Other intangible assets | | | | |
Year ended 31 December | |
|
| |
| | 2003 | | 2002 | |
| £m | £m |
|
|
|
| |
| Arising on consolidation | | | | |
|
|
|
| |
| At 1 January | 675 | | 416 | |
|
|
|
| |
| Transfers from goodwill | – | | 259 | |
|
|
|
| |
| Additions | – | | – | |
|
|
|
| |
| At 31 December | 675 | | 675 | |
|
|
|
| |
| Amortisation | | | | |
|
|
|
| |
| At 1 January | 371 | | 251 | |
|
|
|
| |
| Impairments | – | | 42 | |
|
|
|
| |
| Charge for the year | 53 | | 78 | |
|
|
|
| |
| At 31 December | 424 | | 371 | |
|
|
|
| |
| Net book value | | | | |
|
|
|
| |
| Total capitalised per US GAAP | 251 | | 304 | |
|
|
|
| |
| Total capitalised per UK GAAP | – | | – | |
|
|
|
| |
| US GAAP adjustment to shareholders’ funds | 251 | | 304 | |
|
|
|
| |
| Total US GAAP adjustments to shareholders’ | | | | |
| funds for goodwill and other intangible assets | 924 | | 1,150 | |
|
|
|
| |
All intangible assets (excluding goodwill) are amortised over their estimated average life. The estimated future amortisation expense is as follows:
| | £m | |
|
| |
| Year ended 31 December: | | |
|
| |
| 2004 | 27 | |
|
| |
| 2005 | 27 | |
|
| |
| 2006 | 27 | |
|
| |
| 2007 | 27 | |
|
| |
| 2008 | 21 | |
|
| |
b) Tangible fixed assets
The following tables provide analyses of tangible fixed assets included in the balance sheet under US GAAP for the two years ended 31 December 2003 and 2002.
Year ended 31 December | |
|
| |
| | 2003 | | 2002 | |
| Computer software | £m | | £m | |
|
|
|
| |
| Cost or valuation | | | | |
|
|
|
| |
| At 1 January | 333 | | 254 | |
|
|
|
| |
| Additions | 34 | | 61 | |
|
|
|
| |
| Disposals | (10 | ) | – | |
|
|
|
| |
| Transfers from goodwill | – | | 18 | |
|
|
|
| |
| At 31 December | 357 | | 333 | |
|
|
|
| |
| Amortisation | | | | |
|
|
|
| |
| At 1 January | 173 | | 98 | |
|
|
|
| |
| Disposals | (4 | ) | – | |
|
|
|
| |
| Charge for the year | 71 | | 75 | |
|
|
|
| |
| At 31 December | 240 | | 173 | |
|
|
|
| |
| Net book value | | | | |
|
|
|
| |
| Total capitalised per US GAAP | 117 | | 160 | |
|
|
|
| |
| Total capitalised per UK GAAP | – | | 1 | |
|
|
|
| |
| US GAAP adjustment to shareholders’ funds | 117 | | 159 | |
|
|
|
| |
| | | |
| Year ended 31 December |
|
| |
| | 2003 | | 2002 | |
| Investment properties | £m | £m |
|
|
|
| |
| Cost or valuation | | | | |
|
|
|
| |
| At 1 January | 1,320 | | 1,218 | |
|
|
|
| |
| Additions | 120 | | 102 | |
|
|
|
| |
| Disposals | (131 | ) | – | |
|
|
|
| |
| At 31 December | 1,309 | | 1,320 | |
|
|
|
| |
| Amortisation | | | | |
|
|
|
| |
| At 1 January | 65 | | 31 | |
|
|
|
| |
| Disposals | (4 | ) | – | |
|
|
|
| |
| Charge for the year | 50 | | 34 | |
|
|
|
| |
| At 31 December | 111 | | 65 | |
|
|
|
| |
| Net book value | 1,198 | | 1,255 | |
|
|
|
| |
c) Pension costs
For the purposes of US GAAP, Abbey adopts the provisions of SFAS 87, Employers Accounting for Pensions, as amended by SFAS 132, Employers' Disclosures about Pensions and Other Post-retirement Benefits, in respect of its principal pension plans, The Abbey National Amalgamated Pension Fund, the Scottish Mutual Assurance plc Staff Pension Scheme, the National and Provincial Pension Fund, the Abbey National Group Pension Scheme, the Scottish Provident Institution Staff Pension Fund and the Abbey National Associated Bodies Pension Fund. The components of the estimated net periodic pension cost computed under SFAS 87 are as follows:
| Year ended 31 December |
|
|
|
| |
| | 2003 | | 2002 | | 2001 | |
| £m | £m | £m |
|
|
|
|
|
| |
| Service cost | 122 | | 145 | | 132 | |
|
|
|
|
|
| |
| Interest cost | 160 | | 145 | | 131 | |
|
|
|
|
|
| |
| Expected return on assets | (152 | ) | (155 | ) | (149 | ) |
|
|
|
|
|
| |
| Amortisation of initial transition amount | (10 | ) | (8 | ) | (7 | ) |
|
|
|
|
|
| |
| Special termination benefits | 15 | | – | | – | |
|
|
|
|
|
| |
| Recognised gain (loss) | 8 | | (1 | ) | (2 | ) |
|
|
|
|
|
| |
| Recognised prior service cost | 2 | | 2 | | 2 | |
|
|
|
|
|
| |
| Net periodic pension cost | 145 | | 128 | | 107 | |
|
|
|
|
|
| |
| 168 | Abbey Annual Report and Accounts 2003 |
Back to Contents
Financial Statements
Notes to the Financial Statements continued
The pensions costs calculated under UK and US GAAP are not directly comparable due to different treatment of amounts charged to life businesses.
The following table sets forth a reconciliation of beginning and ending balances of the projected benefit obligation:
Year ended 31 December | |
|
| |
| | 2003 | | 2002 | |
| £m | £m |
|
|
|
| |
| Benefit obligation at beginning of the year | 2,798 | | 2,543 | |
|
|
|
| |
| Service cost | 122 | | 145 | |
|
|
|
| |
| Interest cost | 160 | | 145 | |
|
|
|
| |
| Members’ contributions | 17 | | 19 | |
|
|
|
| |
| Business transfer | 50 | | (12 | ) |
|
|
|
| |
| Special termination benefits | 15 | | – | |
|
|
|
| |
| Actuarial loss | 276 | | 18 | |
|
|
|
| |
| Benefits paid | (81 | ) | (60 | ) |
|
|
|
| |
| Benefit obligation at end of year | 3,357 | | 2,798 | |
|
|
|
| |
The following table sets forth a reconciliation of the fair value of plan assets for the period 1 January to 31 December.
| | Year ended 31 December | |
|
| |
| | 2003 | | 2002 | |
| | £m | | £m | |
|
|
|
| |
| Fair value of plan assets at beginning of year | 1,880 | | 2,245 | |
|
|
|
| |
| Actual return on plan assets | 231 | | (399 | ) |
|
|
|
| |
| Business transfer | 42 | | (9 | ) |
|
|
|
| |
| Employer contributions | 115 | | 84 | |
|
|
|
| |
| Employee contributions | 17 | | 19 | |
|
|
|
| |
| Benefits paid | (81 | ) | (60 | ) |
|
|
|
| |
| Fair value of plan assets at end of year | 2,204 | | 1,880 | |
|
|
|
| |
The following table sets forth the funded status of the plans.
| Year ended 31 December | |
|
| |
| | 2003 | | 2002 | |
| | £m | | £m | |
|
|
|
| |
| Funded status | (1,153) | | (918 | ) |
|
|
|
| |
| Unrecognised prior service cost | 2 | | 4 | |
|
|
|
| |
| Unrecognised loss | 937 | | 739 | |
|
|
|
| |
| Initial transition asset | – | | (9 | ) |
|
|
|
| |
| Accrued liabilities | (214 | ) | (184 | ) |
|
|
|
| |
The estimated accumulated benefit obligation at 31 December 2003 amounted to £2,675m (2002: £2,293m). This requires a minimum additional liability of £255m to be recognised, of which £242m was recognised in 2002.
For the purposes of amortisating gains and losses the ''10% corridor'' has been adopted, and the market-related value of assets recognises realised and unrealised capital gains and losses over a rolling three-year period. The financial assumptions used to calculate the projected benefit obligations for the principal pension plans listed above were as follows:
Year ended 31 December | |
|
| |
| | 2003 | | 2002 | |
| | % | | % | |
|
|
|
| |
| Discount rate (Weighted Average) | 5.5 | | 5.75 | |
|
|
|
| |
| Rate of pay escalation | 4.2 | | 3.9 | |
|
|
|
| |
| Rate of Pay Increase | 2.7 | | 2.4 | |
|
|
|
| |
Abbey determined its expense measurements above based upon long term assumptions taking into account target asset allocations of equities and bonds set at the beginning of the year, offset by actual returns during the year. Year end obligation measurements are determined by reference to market conditions at the balance sheet date. Assumptions are set in consultation with third party advisors, and in house expertise.
The financial assumptions used to determine the net period benefit cost for the principal pension plans listed above were as follows.
Year ended 31 December | |
|
| |
| | 2003 | | 2002 | |
| | % | | % | |
|
|
|
| |
| Discount rate (Weighted Average) | 5.75 | | 5.75 | |
|
|
|
| |
| Rate of pension increase | 2.4 | | 2.5 | |
|
|
|
| |
| Rate ofreturn on assets | 6.5 | | 6.25 | |
|
|
|
| |
Abbey expects to contribute £134m to its defined benefit pension plans in 2004.
Abbey's pension scheme did not hold any equity securities of Abbey or any of its related parties at 31 December 2003 (2002: nil).
In addition, Abbey does not hold insurance policies over the plans, nor has Abbey entered into any significant transactions with the plans.
£15m of contractual termination benefits are included in net periodic pension costs. This additional charge was brought about due to the restructuring announcement in February 2003.
Abbey's contribution to defined contribution plans in 2003 was £96m (2002: £77m). Additionally, the sale of First National Bank plc in April, reduced the defined benefit scheme membership by 977 and led to a recognised curtailment gain of £12m.
The trustees of the Abbey National Pension schemes are required under the Pensions Act 1995 to prepare a statement of principles governing investment decisions. The principal duty of the trustees is to act in the best interest of the members of the schemes and have developed the following investment policies and strategies:
| > | To maintain a portfolio of suitable assets of appropriate liquidity which will generate income and capital growth to meet, together with new contributions from members and the employers, the cost of current and future benefits which the Fund provides, as set out in the Trust Deed and Rules. |
| > | To limit the risk of the assets failing to meet the liabilities, over the long term and on a shorter term basis as required by prevailing legislation. |
| > | To minimise the long term costs of the Fund by maximising the return on the assets whilst having regard to the objectives shown above. |
The statement of investment principles has set the target allocation of plan assets at 50% UK equities, 30% Bonds and 20% gilts. The year end allocation was 52% Equities, 26% Bonds, 20% Gilts, 2% Property and other assets.
The expected asset returns by class are equities 7.25%, Bonds 5.5% and Gilts 4.75%. The overall long-term rate of return on the assets employed has been determined after considering projected movements in asset indices.
d) Leasing
Under US GAAP, SFAS 13 requires the following disclosures relating to finance and operating leases at 31 December 2003 and 2002.
The net investment in direct finance leases at 31 December 2003 and 2002 are as follows:
| | 2003 | | 2002 | |
| | £m | | £m | |
|
|
|
| |
| Total minimum lease payments to be received | 4,122 | | 6,098 | |
|
|
|
| |
| Amounts representing estimated executory costs | (18 | ) | (25 | ) |
|
|
|
| |
| Minimum lease payments receivable | 4,104 | | 6,073 | |
|
|
|
| |
| Unearned income | (1,590 | ) | (2,695 | ) |
|
|
|
| |
| Net investment in direct financing leases | 2,514 | | 3,378 | |
|
|
|
| |
| Abbey Annual Report and Accounts 2003 | 169 |
Back to Contents
Financial Statements
Notes to the Financial Statementscontinued
At 31 December 2003, minimum lease sales-type sales-type and direct finance payments to be received for each for the next five years are as follows: £218m in 2004, £242m in 2005, £273m in 2006, £244m in 2007 and £275m in 2008.
At 31 December 2003, minimum operating lease payments to be received for each of the next five years are as follows: £10m in 2004; £10m in 2005; £10m in 2006; £8m in 2007 and £7m in 2008.
During the year £96m (2002: £149m, 2001: £133m) of sales-type and direct finance lease contingent rentals was charged to the profit and loss account.
During the year £1m (2002: £nil, 2001: £nil) of operating lease contingent rentals was charged to the profit and loss account.
| e) | Taxes |
| (i) | During 2003 £(97)m (2002: £122m, 2001: £28m) of tax (benefit) expense were attributable to discontinued operations. |
| (ii) | The significant components of tax expense attributable to continuing operations are shown in note 10. |
| (iii) | A reconciliation of taxes payable at the standard UK corporation tax rate and Abbey's effective tax rate for each of the three years ended 31 December 2003, 2002, and 2001 is shown as follows: |
| | | | | |
| Year ended 31 December |
|
|
|
| |
| | | | 2002 | | 2001 | |
| 2003 | (restated) | (restated) |
| £m | £m | £m |
|
|
|
|
|
| |
| Taxation at standard UK corporation | | | | | | |
| tax rate (2002: 30%, and 2001: 30%) | (62 | ) | (348 | ) | 416 | |
|
|
|
|
|
| |
| Effect of non-allowable provisions | | | | | | |
| and other non-equalised items | 52 | | 490 | | 11 | |
|
|
|
|
|
| |
| Effect of non-UK profits and losses | 6 | | 36 | | (12 | ) |
|
|
|
|
|
| |
| Adjustment to prior year tax provisions | (71 | ) | 56 | | 7 | |
|
|
|
|
|
| |
| Effect of loss utilisation | – | | (1 | ) | 3 | |
|
|
|
|
|
| |
| Taxes | (75 | ) | 233 | | 433 | |
|
|
|
|
|
| |
| Effective tax rate (US GAAP) | 36.4 | % | (20.1 | )% | 31.4 | % |
|
|
|
|
|
| |
| | |
| (iv) | The tax effects of the principal components of deferred tax liabilities and deferred tax assets at 31 December 2003 and 2002 were as follows: |
| | |
| | | | 2002 | |
| 2003 | (restated) |
| £m | £m |
|
|
|
| |
| Net current deferred tax assets/(liabilities): | | | | |
|
|
|
| |
| Provisions and short term timing differences | 163 | | 138 | |
|
|
|
| |
| Net non-current deferred tax assets/(liabilities): | | | | |
|
|
|
| |
| Excess of capital allowances over depreciation | 64 | | 39 | |
|
|
|
| |
| Capital allowances on finance lease receivables | (923 | ) | (1,166) | |
|
|
|
| |
| Undistributed earnings in overseas subsidiaries | (52 | ) | (96 | ) |
|
|
|
| |
| Long term assurance business | 318 | | 221 | |
|
|
|
| |
| Other | (225 | ) | (3 | ) |
|
|
|
| |
| | (818 | ) | (1,005 | ) |
|
|
|
| |
| Total | (655 | ) | (867 | ) |
|
|
|
| |
Included in the above table are total valuation allowances of £41m and £54m in 2003 and 2002, respectively. The valuation allowance decreased in 2003 primarily due to the disposal of subsidiary undertakings.
| f) | Earnings per share |
Under US GAAP, SFAS 128 requires certain disclosures relating to earnings per share in addition to the presentation of basic and diluted earnings per share on the face of the income statement.
The following tables provide reconciliations of the income and number of shares used in the calculation of basic and diluted earnings per share from continuing operations; discontinued operations; a change in accounting principle and net (loss) income available to shareholders in accordance with US GAAP for the years ended 31 December 2003, 2002 and 2001. |
| |
| | | | Year ended 31 December 2003 | |
|
|
|
| |
| | Income | | Shares | | EPS | |
| Continuing operations | £m | | m | | Pence | |
|
|
|
| |
| Basic EPS | | | | | | |
|
|
|
|
|
| |
| Income from continuing operations | | | | | | |
| available to ordinary shareholders | 275 | | 1,448 | | 19.0 | |
|
|
|
|
|
| |
| Effect of dilutive securities: | | | | | | |
|
|
|
|
|
| |
| Share options | – | | 6 | | (0.1 | ) |
|
|
|
|
|
| |
| Diluted EPS | 275 | | 1,454 | | 18.9 | |
|
|
|
|
|
| |
| | | | | |
| | | | Year ended 31 December 2002 | |
|
|
|
|
| | Income | | | | EPS |
| (restated) | Shares | (restated) |
| Continuing operations | £m | | m | | Pence | |
|
|
|
|
|
| |
| Basic and Diluted EPS | (662 | ) | 1,442 | | (45.9 | ) |
|
|
|
|
|
| |
| | | | | |
| | | | Year ended 31 December 2001 | |
|
|
|
| |
| | Income | | | | EPS | |
| (restated) | | Shares | | (restated) | |
| Continuing operations | £m | | m | | Pence | |
|
|
|
|
|
| |
| Basic EPS | | | | | | |
|
|
|
|
|
| |
| Income from continuing operations | | | | | | |
| available to shareholders | 908 | | 1,431 | | 63.4 | |
|
|
|
|
|
| |
| Effect of dilutive securities: | | | | | | |
|
|
|
|
|
| |
| Share options | – | | 1 | | – | |
|
|
|
|
|
| |
| Diluted EPS | 908 | | 1,432 | | 63.4 | |
|
|
|
|
|
| |
| | | | | |
| | | | Year ended 31 December 2003 | |
|
|
|
| |
| | Income | | Shares | | EPS | |
| Discontinued operations | £m | | m | | Pence | |
|
|
|
|
|
| |
| Basic EPS | | | | | | |
|
|
|
|
|
| |
| Loss from discontinued operations | | | | | | |
| available to ordinary shareholders | (406 | ) | 1,448 | | (28.0 | ) |
|
|
|
|
|
| |
| Effect of dilutive securities: | | | | | | |
|
|
|
|
|
| |
| Share options | – | | 6 | | 0.1 | |
|
|
|
|
|
| |
| Diluted EPS | (406 | ) | 1,454 | | (27.9 | ) |
|
|
|
|
|
| |
| | | | | |
| | | | Year ended 31 December 2002 | |
|
|
|
|
|
| |
| | Income | | | | EPS | |
| (restated) | | Shares | | (restated) | |
| Discontinued operations | £m | | m | | Pence | |
|
|
|
|
|
| |
| Basic and Diluted EPS | (731 | ) | 1,442 | | (50.7 | ) |
|
|
|
|
|
| |
| | | | | |
| | | | Year ended 31 December 2001 | |
|
|
|
|
|
| |
| | Income | | | | EPS | |
| (restated) | | Shares | | (restated) | |
| Discontinued operations | £m | | m | | Pence | |
|
|
|
|
|
| |
| Basic EPS | | | | | | |
|
|
|
|
|
| |
| Income from discontinued operations | | | | | | |
| available to ordinary shareholders | 34 | | 1,431 | | 2.4 | |
|
|
|
|
|
| |
| Effect of dilutive securities: | | | | | | |
|
|
|
|
|
| |
| Share options | – | | 1 | | – | |
|
|
|
|
|
| |
| Diluted EPS | 34 | | 1,432 | | 2.4 | |
|
|
|
|
|
| |
| | |
| 170 | Abbey Annual Report and Accounts 2003 |
Back to Contents
Financial Statements
Notes to the Financial Statementscontinued
| | | | Year ended 31 December 2001 | |
|
|
|
|
| | Income | | Shares | | EPS |
| Change in accounting principle | £m | | m | | Pence |
|
|
|
|
|
| |
| Basic EPS | | | | | | |
|
|
|
|
|
| |
| Cumulative effect of a change | | | | | | |
| in accounting principle | 5 | | 1,431 | | 0.4 | |
|
|
|
|
|
| |
| Effect of dilutive securities: | | | | | | |
|
|
|
|
|
| |
| Share options | – | | 1 | | – | |
|
|
|
|
|
| |
| Diluted EPS | 5 | | 1,432 | | 0.4 | |
|
|
|
|
|
| |
| | | | | |
| | | | Year ended 31 December 2003 | |
|
|
|
|
|
| |
| | Income | | Shares | | EPS | |
| Net loss | £m | | m | | Pence | |
|
|
|
|
|
| |
| Basis EPS | | | | | | |
|
|
|
|
|
| |
| Net loss available to | | | | | | |
| ordinary shareholders | (131 | ) | 1,448 | | (9.0 | ) |
|
|
|
|
|
| |
| Effect of dilutive securities: | | | | | | |
|
|
|
|
|
| |
| Share options | – | | 6 | | – | |
|
|
|
|
|
| |
| Diluted EPS | (131 | ) | 1,454 | | (9.0 | ) |
|
|
|
|
|
| |
| | | | | |
| | | | Year ended 31 December 2002 | |
|
|
|
|
|
| |
| | Income | | | | EPS | |
| | (restated) | | Shares | | (restated) | |
| Net loss | £m | | m | | Pence | |
|
|
|
|
|
| |
| Basic and Diluted EPS | (1,393 | ) | 1,442 | | (96.6 | ) |
|
|
|
|
|
| |
| | | | | |
| | | | Year ended 31 December 2001 | |
|
|
|
|
|
| |
| | Income | | | | EPS | |
| (restated) | | Shares | | (restated) | |
| Net income | £m | | m | | Pence | |
|
|
|
|
|
| |
| Basic EPS | | | | | | |
|
|
|
|
|
| |
| Net income availability | | | | | | |
| to ordinary shareholders | 947 | | 1,431 | | 66.2 | |
|
|
|
|
|
| |
| Effect of dilutive securities: | | | | | | |
|
|
|
|
|
| |
| Share options | – | | 1 | | (0.1 | ) |
|
|
|
|
|
| |
| Diluted EPS | 947 | | 1,432 | | 66.1 | |
|
|
|
|
|
| |
Options to purchase 19.9m ordinary shares (2002: 13.3m, 2001: 5.6m) at prices ranging from £5.13 to £13.06 (2002: £8.53 to £13.06, 2001: £9.88 to £13.06) were outstanding throughout the year ended 31 December 2003 but were not included in the computation of diluted earnings per share because the options' assumed proceeds were greater than the average market price of the common shares. These options expire at various dates ranging from September 2004 to September 2013. An option to purchase a further 32.3m ordinary shares (2002 19.2m, 2001 5.9m) were not included in the compilation of diluted earnings per share because to do so would have been antidilutive for the periods presented.
Earnings per share, assuming full dilution, is computed based on the average number of common shares outstanding during the period, plus the dilutive effect of stock options. The dilutive effect of stock options is computed using the average market price of the Company's stock for the period.
| g) | Securities and investments |
| Under US GAAP, SFAS 115 requires certain disclosures relating to investments in debt securities, and equity securities that have readily determinable fair values at 31 December 2003 and 2002. The following table provides an analysis of the balance sheet totals under US GAAP: |
| |
| | At 31 December | |
|
|
|
| 2003 | | 2002 |
| £ m | | £m |
|
|
|
| |
| Trading securities | 45,902 | | 42,875 | |
|
|
|
| |
| Available for sale securities(ii) | 1,840 | | 33,972 | |
|
|
|
| |
| Securities held to maturity (ii) | 20 | | 20 | |
|
|
|
| |
| | 47,762 | | 76,867 | |
|
|
|
| |
| | |
| Further disclosures required by SFAS 115 are as follows: |
| (ii) | Available for sale securities |
| | |
| | | | Gross | | Gross | | | |
| Amortised | unrealised | unrealised | |
| cost | gains | losses | Fair value |
| £m | £m | £m | £m |
|
|
|
|
|
|
|
| |
| At 31 December 2003 | | | | | | | | |
|
|
|
|
|
|
|
| |
| Equity securities | 19 | | – | | – | | 19 | |
|
|
|
|
|
|
|
| |
| Debt securities issued or | | | | | | | | |
| backed by US Treasury and | | | | | | | | |
| other US government | | | | | | | | |
| corporations and agencies | – | | – | | – | | – | |
|
|
|
|
|
|
|
| |
| Debt securities issued or | | | | | | | | |
| backed by foreign governments | – | | – | | – | | – | |
|
|
|
|
|
|
|
| |
| Asset backed and corporate | | | | | | | | |
| debt securities | 1,254 | | 93 | | (43 | ) | 1,304 | |
|
|
|
|
|
|
|
| |
| Mortgage backed securities | | | | | | | | |
| other than those issued or | | | | | | | | |
| backed by US government | | | | | | | | |
| agencies | 42 | | 4 | | (9 | ) | 37 | |
|
|
|
|
|
|
|
| |
| Other debt securities | 437 | | 43 | | – | | 480 | |
|
|
|
|
|
|
|
| |
| | 1,752 | | 140 | | (52 | ) | 1,840 | |
|
|
|
|
|
|
|
| |
In 2003, as a result of our restructuring, Abbey made decisions to dispose of certain securities previously classified as available for sale securities, as Abbey no longer had the intent to hold them for the long term. These disposals included securities in its Asset Management Risk Transfer business in the Wholesale segment which discontinued activities related to these securities in 2003. By 31 December 2003, Abbey had disposed of most of its securities. Most of the remaining available for sale securities were disposed of in January 2004.
At 31 December 2003, the book value of Abbey's available for sale securities exceeded their fair value by £88m. Due to Abbey's intent to sell the remaining securities at 31 December 2003, Abbey concluded that an other than temporary impairment of £40m had occurred at 31 December 2003. This impairment loss was also recognised for UK GAAP purposes.
| | |
| Abbey Annual Report and Accounts 2003 | 171 |
Back to Contents
Financial Statements
Notes to the Financial Statementscontinued
| | | | Gross | | Gross | | | |
| Amortised | | unrealised | | unrealised | | | |
| cost | | gains | | losses | | Fair value | |
| £m | | £m | | £m | | £m | |
|
|
|
|
|
|
|
| |
| At 31 December 2002 | | | | | | | | |
|
|
|
|
|
|
|
| |
| Equity securities | 98 | | 8 | | (12 | ) | 94 | |
|
|
|
|
|
|
|
| |
| Debt securities issued | | | | | | | | |
| or backed by US Treasury | | | | | | | | |
| and other US government | | | | | | | | |
| corporations and agencies | 785 | | 14 | | (3 | ) | 789 | |
|
|
|
|
|
|
|
| |
| Debt securities issued | | | | | | | | |
| or backed by foreign | | | | | | | | |
| governments | 2,060 | | 205 | | (5 | ) | 2,260 | |
|
|
|
|
|
|
|
| |
| Asset backed and | | | | | | | | |
| corporate debt securities | 25,660 | | 522 | | (584 | ) | 25,598 | |
|
|
|
|
|
|
|
| |
| Mortgage backed | | | | | | | | |
| securities other than those | | | | | | | | |
| issued or backed by US | | | | | | | | |
| government agencies | 4,023 | | 7 | | (15 | ) | 4,015 | |
|
|
|
|
|
|
|
| |
| Other debt securities | 1,199 | | 18 | | (1 | ) | 1,216 | |
|
|
|
|
|
|
|
| |
| | 33,818 | | 774 | | (620 | ) | 33,972 | |
|
|
|
|
|
|
|
| |
| | | | In more | | In more | | | | | |
| than 1 | than 5 |
| year but | years but |
| Not more | not more | not more | In more |
| than | than | than | than |
| 1 year | 5 years | 10 years | 10 years | Total |
| Maturity analysis | £m | | £m | | £m | | £m | | £m | |
|
|
|
|
|
|
|
|
|
| |
| At 31 December 2003 | | | | | | | | | | |
|
|
|
|
|
|
|
|
|
| |
| Book value | 421 | | 433 | | 333 | | 565 | | 1,752 | |
|
|
|
|
|
|
|
|
|
| |
| Fair value | 423 | | 500 | | 397 | | 520 | | 1,840 | |
|
|
|
|
|
|
|
|
|
| |
| | | | | | | | | | | |
| At 31 December 2002 | | | | | | | | | | |
|
|
|
|
|
|
|
|
|
| |
| Book value | 3,465 | | 9,268 | | 8,630 | | 12,455 | | 33,818 | |
|
|
|
|
|
|
|
|
|
| |
| Fair value | 3,455 | | 9,269 | | 8,745 | | 12,503 | | 33,972 | |
|
|
|
|
|
|
|
|
|
|
The following table shows our investments' gross unrealised losses and fair value, aggregated by investment category and length of time that individual securities have been in a continuous unrealised loss position, at 31 December 2003.
| | Less than 12 months | | 12 months or more | | | | Total | |
|
|
|
|
|
|
|
|
|
|
|
|
| | Fair | | Unrealised | | Fair | | Unrealised | | Fair | | Unrealised |
| value | losses | value | losses | value | losses |
| £m | £m | £m | £m | £m | £m |
|
|
|
|
|
|
|
|
|
|
|
| |
| Equity securities | – | | – | | – | | – | | – | | – | |
|
|
|
|
|
|
|
|
|
|
|
| |
| Debt securities issued or backed by US Treasury | | | | | | | | | | | | |
| and other US government corporations and agencies | – | | – | | – | | – | | – | | – | |
|
|
|
|
|
|
|
|
|
|
|
| |
| Debt securities issued or backed by foreign governments | – | | – | | – | | – | | – | | – | |
|
|
|
|
|
|
|
|
|
|
|
| |
| Asset backed and corporate debt securities | 172 | | 41 | | 37 | | 2 | | 209 | | 43 | |
|
|
|
|
|
|
|
|
|
|
|
| |
| Mortgage backed securities other than those issued | | | | | | | | | | | | |
| or backed by US government agencies | 29 | | 9 | | – | | – | | 29 | | 9 | |
|
|
|
|
|
|
|
|
|
|
|
| |
| Other debt securities | – | | – | | – | | – | | – | | – | |
|
|
|
|
|
|
|
|
|
|
|
| |
| Total temporarily impaired securities | 201 | | 50 | | 37 | | 2 | | 238 | | 52 | |
|
|
|
|
|
|
|
|
|
|
|
| |
The unrealised losses above arise on securities within Abbey's ongoing Personal Financial Services businesses. These are securities issued byUK housing associations. These losses are considered temporary as Abbey has the ability and intent to hold the securities to maturity and Abbey is satisfied that there has been no credit deterioration, particularly as to date Abbey has suffered no defaults on this type of issuer. The unrealised losses arise from changes in interest rates. This is evidenced by the fact that the related derivative hedges, which as they are with Financial Products, do not qualify for hedge accounting under FAS 133, have an equal and opposite fair value surplus.
| | |
| 172 | Abbey Annual Report and Accounts 2003 |
Back to Contents
Financial Statements
Notes to the Financial Statementscontinued
| (iii) | Held to maturity securities |
| | Amortised
cost
£m | | Gross
unrealised
gains
£m | | Gross
unrealised
losses
£m | | Fair value
£m | |
|
|
|
|
|
|
|
| |
| Corporate debt securities | | | | | | | | |
|
|
|
|
|
|
|
| |
| At 31 December 2003 | 20 | | – | | – | | 20 | |
|
|
|
|
|
|
|
| |
| At 31 December 2002 | 20 | | – | | – | | 20 | |
|
|
|
|
|
|
|
| |
| | | | | | | | | |
| Maturity analysis | | | In more | | In more | | | | | |
| | than 1 | than 5 | | |
| | year but | years but | | |
| Not more | not more | not more | In more | |
| than | than | than | than | |
| 1 year | 5 years | 10 years | 10 years | Total |
| £m | £m | £m | £m | £m |
|
|
|
|
|
|
|
|
|
| |
| At 31 December 2003 | | | | | | | | | | |
|
|
|
|
|
|
|
|
|
| |
| Book value | 20 | | – | | – | | – | | 20 | |
|
|
|
|
|
|
|
|
|
| |
| Fair value | 20 | | – | | – | | – | | 20 | |
|
|
|
|
|
|
|
|
|
| |
| | | | | | | | | | | |
| At 31 December 2002 | | | | | | | | | | |
|
|
|
|
|
|
|
|
|
| |
| Book value | – | | 20 | | – | | – | | 20 | |
|
|
|
|
|
|
|
|
|
| |
| Fair value | – | | 20 | | – | | – | | 20 | |
|
|
|
|
|
|
|
|
|
| |
| | | | | | | | | | | |
(iv)
| Sales of avaliable for sale securities during the year ended | |
| | 31 December 2003, 2002 and 2001. | |
| | 2003 | | 2002 | | 2001 | |
| £m | £m | £m |
|
|
|
|
|
| |
| Gross proceeds from sales | 26,611 | | 13,837 | | 3,282 | |
|
|
|
|
|
| |
| Gross realised losses on sales | 1,297 | | 166 | | 60 | |
|
|
|
|
|
| |
| Gross realised gains on sales | (795 | ) | (111 | ) | (30 | ) |
|
|
|
|
|
| |
| Amortised cost of sales | 27,113 | | 13,893 | | 3,312 | |
|
|
|
|
|
| |
The cost of available for sale securities is determined by using the weighted average cost basis, with premium/discount arising on purchase being amortised to profit and loss over the expected life of the security.
| (v) | Redemptions and purchases of held to maturity securities during the year ended 31 December: |
| | |
| | 2003 | | 2002 | |
| £m | £m |
|
|
|
| |
| Amortised cost b/f | 20 | | 20 | |
|
|
|
| |
| Acquisitions – cost | – | | – | |
|
|
|
| |
| Redemptions at maturity | – | | – | |
|
|
|
| |
| Exchange adjustments | – | | – | |
|
|
|
| |
| Amortised cost c/f | 20 | | 20 | |
|
|
|
| |
| | |
| (vi) | There were no realised gains and losses on transfers from available for sale securities during the years ended 31 December 2003, 2002 and 2001. |
| | |
| (vii) | The net change in unrealised holding gains (losses) on trading securities, before the effect of associated hedges, included in income for the year to 31 December 2003 is a gain of £86m (2002: gain of £216m, 2001: gain of £76m). |
| | |
| h) | Securitisations |
| In accordance with SFAS 140, the assets which have been transferred to special purpose entities (securitised) and meet the criteria required under SFAS 140 for a sale are no longer retained on-balance sheet. Details in relation to the mortgage asset securitisations are included in note 17 of the consolidated financial statements. |
| The assets were transferred to special purpose entities at book value, and gains of £34m, £60m and £144m have been recognised for the years ended 31 December 2003, 2002 and 2001 respectively. |
| The remuneration received by Abbey for servicing is considered to be adequate and therefore no servicing assets were recognised. |
| Additionally, as required by SFAS 140, an Interest only strip asset has been recognised which represents Abbey's retained interest in the securitised assets. The fair value of the Interest only strip is represented by the present value of the future income streams expected to be received from Abbey's retained interest in the securitised assets. Abbey determines the present value of future income streams by discounting future income by the weighted average cost of capital. Details in relation to Abbey's rights and obligations under the securitisations are detailed in note 17 of the consolidated financial statements. In compliance with SFAS 140, the receivable is treated as an available for sale security that is revalued at the end of each reporting period. Increases and decreases in value are taken to the Statement of comprehensive income. |
| |
| Mortgage asset securitisations |
| | 2003 | | 2002 | |
| £m | £m |
|
|
|
| |
| Value of interest only strip at inception(1) | 318 | | 283 | |
|
|
|
| |
| Increase/(decrease) in value of interest only strip | 26 | | (62 | ) |
|
|
|
| |
| Value of interest only strip at 31 December(1) | 344 | | 221 | |
|
|
|
| |
| | | | |
| (1) | | The valuation of the interest only strip asset is based on the following key assumptions: |
| | | – | Early repayments are based on actual experience at the valuation date. This was 65% at 31 December 2003 (2002: 43%) |
| | | – | A discount rate of 8.0% (2002: 7.6%) |
Summarised cash flows between the special purpose securitisation companies and Abbey are set out below:
| | Holmes | | | | | |
| | Financing | | Holmes | | Holmes | |
| | (No.1 to | | Funding | | Trustees | |
| | No.7) plc | | Limited | | Limited | |
| | £m | | £m | | £m | |
|
|
|
|
|
| |
| Inter-company receipts | 3,444 | | 5,886 | | – | |
|
|
|
|
|
| |
| Inter-company payments | (2,404 | ) | (3,444 | ) | (3,482 | ) |
|
|
|
|
|
| |
| | 1,040 | | 2,442 | | (3,482 | ) |
|
|
|
|
|
| |
| Other cash flows from (to) | | | | | | |
| Abbey National plc: | | | | | | |
|
|
|
|
|
| |
| Purchase of mortgages | – | | (2,404 | ) | – | |
|
|
|
|
|
| |
| Loan | – | | 10 | | – | |
|
|
|
|
|
| |
| Interest received | – | | 34 | | 17 | |
|
|
|
|
|
| |
| Revenue payments | – | | – | | (504 | ) |
|
|
|
|
|
| |
| Capital payments | – | | – | | (5,404 | ) |
|
|
|
|
|
| |
| Other payments | – | | – | | (122 | ) |
|
|
|
|
|
| |
| | – | | (2,360 | ) | (6,013 | ) |
|
|
|
|
|
| |
| Net cash flows | 1,040 | | 82 | | (9,495 | ) |
|
|
|
|
|
| |
The principal amount of loans held by the above special purpose securitisation companies 90 days or more past due at 31 December 2003 was £119m (2002: £99m). Net credit losses were £0.2m in the period ended 31 December 2003 (2002: £0.4m).
| | |
| Abbey Annual Report and Accounts 2003 | 173 |
Back to Contents
Financial Statements
Notes to the Financial Statementscontinued
Sensitivity analysis
The impact of adverse changes in the rate of repayments and discount rate on the value of interest only strip assets with a balance of £344m at 31 December 2003 is shown below:
| | £m | |
|
| |
| 10% adverse change in repayment rate | (1 | ) |
|
| |
| 20% adverse change in repayment rate | (2 | ) |
|
| |
| 10% adverse change in discount rate | (13 | ) |
|
| |
| 20% adverse change in discount rate | (25 | ) |
|
| |
These sensitivities are hypothetical and should be used with caution. Changes in fair value based on a variation in assumptions generally cannot be extrapolated because the relationship of the change in assumption to the change in fair value may not be linear. Also, in the above table, the effect of a variation in a particular assumption on the fair value of the retained interest is calculated without changing any other assumption; in reality, changes in one factor may result in changes in another which might magnify or counteract the sensitivities.
Actual and projected credit losses (%) as of:
| | Mortgages securitised in | |
|
|
|
| |
| | 2003 | | 2002 | | 2001 | |
| % | % | % |
|
|
|
|
|
| |
| At 31 December 2003 | 0.01 | | 0.01 | | 0.01 | |
|
|
|
|
|
| |
| At 31 December 2002 | – | | 0.01 | | 0.01 | |
|
|
|
|
|
| |
| At 31 December 2001 | – | | – | | 0.03 | |
|
|
|
|
|
| |
i) Consolidated cash flow statement
Under SFAS 95, "Statement of Cash Flows", Abbey experienced an inflow of cash and cash equivalents of £4,598m during the year ended 31 December 2003. Under FRS 1 (Revised), Abbey experienced an inflow of cash of £434m over the same period.
Under US GAAP cash equivalents are defined as short term, highly liquid investments which are readily convertible into known amounts of cash without notice and which were within three months of maturity when acquired.
The following table summarises the movement and composition of cash and cash equivalents under US GAAP for the years ended December 2003, 2002 and 2001.
| | 2003 | | 2002 | | 2001 | |
| £m | £m | £m |
|
|
|
|
|
| |
| Cash and cash equivalents at 1 January | 23,754 | | 20,058 | | 25,806 | |
|
|
|
|
|
| |
| Net cash inflow/(outflow) | 4,598 | | 3,696 | | (5,748 | ) |
|
|
|
|
|
| |
| Cash and cash equivalents at | | | | | | |
| 31 December | 28,352 | | 23,754 | | 20,058 | |
|
|
|
|
|
| |
| Consisting of: | | | | | | |
|
|
|
|
|
| |
| Cash and balances with central banks | 439 | | 396 | | 494 | |
|
|
|
|
|
| |
| Treasury and other eligible bills | 1,449 | | 1,346 | | 1,755 | |
|
|
|
|
|
| |
| Loans and advances to banks | 6,996 | | 5,279 | | 7,818 | |
|
|
|
|
|
| |
| Debt securities | 19,468 | | 16,733 | | 9,991 | |
|
|
|
|
|
| |
| | 28,352 | | 23,754 | | 20,058 | |
|
|
|
|
|
| |
Other principal differences between FRS 1 and SFAS 95 relate to the classification of cash flow transactions and are as follows:
| | Classification under |
| | Classification under FRS 1 | SFAS 95 |
|
| Dividends received | Returns on investment | Operating activities |
| | and servicing of finance | |
|
| Taxation paid | Taxation paid | Operating activities |
|
| Preference dividends paid | Returns on investment | Financing activities |
| | and servicing of finance | |
|
| Equity dividends paid | Equity dividends paid | Financing activities |
|
| Purchases/proceeds from | Capital expenditure and | Investing activities |
| disposal of investment | financial investment | |
| securities and fixed assets | | |
|
|
|
| Purchases/proceeds from | Acquisitions and | Investing activities |
| disposal of subsidiary and | disposals | |
| associated undertakings | | |
|
|
|
| Net change in loans | Operating activities | Investing activities |
| and advances | | |
|
|
|
| Net change in finance | Operating activities | Investing activities |
| lease receivables | | |
|
|
|
| Net change in deposits | Operating activities | Financing activities |
|
| Net change in debt | Operating activities | Financing activities |
| securities in issue | | |
|
|
|
Under FRS 1, transactions designated as hedges are reported under the same heading as the related assets or liabilities.
| j) | Presentation of the consolidated Profit and Loss account |
| The presentation of the profit and loss accounts for the years ended 31 December 2003, 2002 and 2001 as shown on page 111, would not be significantly different under US GAAP except provisions would be shown as a component of total operating income. |
| | |
| k) | Presentation of the consolidated balance sheet |
| The presentation of the balance sheet at 31 December 2003 and 2002 as shown on page 112, would not be significantly different under US GAAP except the assets and liabilities of Long Term Assurance Funds would not be included and stock borrowing and lending transactions would be recorded as set out below. |
| | |
| l) | Stock borrowing and lending against non-cash collateral |
| Abbey enters into transactions under which it lends and borrows stock using other stock as collateral, and these are accounted for as Commitments under UK GAAP. |
| Under SFAS 140, these transactions are grossed up on the balance sheet. At 31 December 2003, Abbey would record assets of £25,649m (2002: £19,137m) as collateral received and liabilities of £25,649m (2002: £19,137m) as an obligation to return collateral received. |
| | |
| m) | Collateralised loans and secured borrowings |
| Abbey enters into purchase and resale agreements (reverse repos and similar transactions), which are accounted for as collateralised loans under UK GAAP. Upon entering into such transactions Abbey receives collateral equal to 100% – 105% of the loan amount. The level of collateral held is monitored daily and, if required, further calls are made to ensure the market value of collateral remains equal to the loan balance. Net assets of such transactions totalling of £4,864m (2002: £3,461) and £9,372 (2002: £3,585m) are included in Loans and advances to banks and Loans and advances to customers respectively. |
| Under reverse repos and similar transactions, Abbey is permitted to sell or repledge the collateral held. At 31 December 2003, the fair value of such collateral was £14,234m (2002: £7,046m) of which £13,933m (2002: £5,921m) related to collateral that was sold or repledged. |
| Abbey enters into sale and repurchase (repo) agreements and similar transactions which are accounted for as secured borrowings under UK GAAP. Upon entering into such transactions Abbey pledges collateral equal to 100% – 105% of the borrowed amount. Net liabilities |
| |
| | |
| 174 | Abbey Annual Report and Accounts 2003 |
Back to Contents
Financial Statements
Notes to the Financial Statementscontinued
under repos, stock loans and similar transactions of £9,215m 2002: £7,300m) and £4,602m (2002: £6,047m) are included in Deposits by banks and Customer accounts respectively.
Under repos and similar transactions, Abbey sells or pledges collateral to counterparties. Under SFAS 140, where the counterparty has a right to sell or repledge the collateral, any such collateral would be reclassified within Abbey's balance sheet from securities to securities pledged. At 31 December 2003, the application of SFAS 140 would result in £17,340m (2002: £21,140m) of debt securities and £1,409m (2002: £1,254m) of treasury and eligible bills being reported as securities pledged. In addition, at 31 December 2003, Abbey has pledged £2,684m of debt securities as collateral under certain structured transactions. Under these transactions the counterparty does not have a right to sell or repledge the collateral, therefore the assets would not be reclassified as securities pledged under SFAS 140.
Abbey also enters into outright equity sales and purchases in combination with total return swaps which are accounted for as in substance reverse repos and repos under UK GAAP. These transactions are treated effectively as outright asset purchases and sales and separate derivative contracts under US GAAP. Under SFAS 140, Loans and advances to customers would be reduced by £3,583m (2002: £388m) and this amount would be reported within Equity shares, representing the equity purchase. Customer accounts would be reduced by £1,333m (2002: £2,346m) and this amount would be reported within Other liabilities, representing the short equity sale. The related return swaps would be marked to market. Any relevant value is paid or received as margin call. The £4,916m (2002: £2,734m) of nominal value of the return swaps would be included within the trading derivatives disclosures.
| n) | Derivatives and hedging activities |
| Abbey has designated certain of its cross-currency and interest rate swaps as fair value hedges of the interest and exchange rate risk arising from certain debt securities, debt securities in issue and subordinated liabilities including convertible debt. There were no gains or losses recognised in the period in respect of hedge ineffectiveness due to discontinuation of hedges no longer qualifying as fair value hedges. |
| Abbey has other non-trading derivatives which are not designated as either a fair value hedge, cash flow hedge or hedge of the net investment in a foreign operation in accordance with the criteria of SFAS 133. These represent derivatives undertaken with Abbey's in-house trading operation, Abbey National Financial Products. Abbey National Financial Products generally matches internal hedges with third party derivatives on an aggregate, rather than individual, basis and hedges the net outstanding position where Abbey has assets and liabilities, which largely offset the overall risk to Abbey. |
| All material derivative exposures are transacted with counterparties with whom Abbey have a Collateral Service Agreement. Under the Collateral Service Agreement, cash will be placed with or received from each counterparty according to the net mark-to-market of all derivative exposures to that counterparty. Amounts received or placed will be updated on a regular basis or if the net mark-to-market moves in excess of a predefined amount. In the event of a default of a given counterparty, Abbey will be able to gain recourse from any losses on derivative exposures by obtaining absolute right over cash received from the counterparty. |
Equity indexed-linked deposits
Contracts involving the receipt of cash on which customers receive an index-linked return are accounted for under UK GAAP in substance as equity indexed deposits. There are two principal product types.
Capital at Risk: These products are designed to replicate the investment performance of an equity index, subject to a floor. In the event the index falls under a certain predetermined level, customers forfeit a predetermined percentage of principal up to a predetermined amount.
Capital Guaranteed: These products give the customers a limited participation in the upside growth of an equity index. In the event the index falls in price, a cash principal element is guaranteed.
Under UK GAAP, Abbey's equity index-linked deposits are remeasured at fair value at each reporting date with changes in fair values recognised in the consolidated profit and loss account. The equity index-linked deposits contain embedded derivatives.These embedded derivatives, in combination with the principal cash deposit element, are designed to replicate the investment performance profile tailored to the return agreed in the contracts with customers.For US GAAP purposes, such embedded derivatives are not separated from the host instrument and are not separately accounted for as a derivative instrument, as the entire contract embodies both the embedded derivative and the host instrument and is remeasured at fair value at each reporting date. As such, Abbey does not bifurcate the embedded derivative in its equity index-linked deposits.
Abbey's equity index-linked deposits are managed within the equity derivatives trading book as an integral part of the equity derivatives portfolio. The total fair value of equity index-linked deposits was £836m at 31 December 2003 (2002: £2,197m).
| o) | Statement of comprehensive income |
| | | | 2002 | | 2001 | |
| | 2003 | | (restated) | | (restated) | |
| | £m | | £m | | £m | |
|
|
|
|
|
| |
| Consolidated net/(loss) income | (131 | ) | (1,393 | ) | 947 | |
|
|
|
|
|
| |
| Other comprehensive income: | | | | | | |
|
|
|
|
|
| |
| Unrealised (deficit)/surplus on | | | | | | |
| securities available for sale | (48 | ) | 70 | | (62 | ) |
|
|
|
|
|
| |
| Unrealised surplus on derivatives | | | | | | |
| hedging securities available for sale | – | | – | | 63 | |
|
|
|
|
|
| |
| Deferred tax | (88 | ) | 9 | | (7 | ) |
|
|
|
|
|
| |
| Minimum pension liability | (13 | ) | (169 | ) | – | |
|
|
|
|
|
| |
| Other comprehensive income | 323 | | (112 | ) | 113 | |
|
|
|
|
|
| |
| Translation differences on foreign | | | | | | |
| currency net investment | 3 | | (2 | ) | – | |
|
|
|
|
|
| |
| Comprehensive income/(loss) before | | | | | | |
| a change in accounting principle | 46 | | (1,597 | ) | 1,054 | |
|
|
|
|
|
| |
| Cumulative effect of a change | | | | | | |
| in accounting principle | – | | – | | (106 | ) |
|
|
|
|
|
| |
| Comprehensive income/(loss) | 46 | | (1,597 | ) | 948 | |
|
|
|
|
|
| |
Cumulative foreign currency translation adjustment
SFAS 52, Foreign Currency Translation, requires disclosure of the cumulative foreign currency translation adjustment taken directly to reserves, on the consolidation of Abbey's foreign undertakings and the translation of Abbey's US dollar preference shares. These cumulative adjustments were £nil, £(26)m and £(28)m at 31 December 2003, 2002 and 2001 respectively.
Cumulative revaluation adjustment
The cumulative revaluation adjustment taken directly to reserves was £1m, £2m and nil at 31 December 2003, 2002 and 2001 respectively.
| | |
| Abbey Annual Report and Accounts 2003 | 175 |
Back to Contents
Financial Statements
Notes to the Financial Statements continued
p) Loan impairment
For US GAAP purposes, Abbey applies SFAS 114, "Accounting by Creditors for Impairment of a Loan", and the subsequent amendment SFAS 118, "Accounting by Creditors for Impairment of a Loan – Income Recognition and Disclosures". SFAS 114 applies to impaired loans only. Under SFAS 114, a loan is considered impaired, based on current information and events, if it is probable that a creditor will be unable to collect the scheduled payments of principal or interest when due according to the contractual terms of the loan agreement. The measurement of impaired loans is primarily based on the present value of expected future cash flows discounted at the loan's effective interest rate, except for collateral dependent loans where impairment is based on the fair value of the collateral. Smaller balance homogeneous consumer loans, (credit card advances, residential mortgages, consumer installment loans, overdrafts), that are collectively evaluated for impairment, leases and debt securities are outside the scope of SFAS 114.
At 31 December 2003 and 2002, Abbey estimated that the difference between the carrying value of its loan portfolio under SFAS 114 and its value in Abbey's UK GAAP financial statements was such that no adjustment to net income or consolidated shareholders' equity was required. Loans and advances within the scope of SFAS 114 consist of wholesale advances. Other loans and advances, consisting of small, homogeneous secured and unsecured advances primarily to personal customers, are assessed for impairment within the scope of SFAS 5. Impaired loans within the scope of SFAS 114 amounted to £63m (2002: £147m). The impairment reserve in respect of these loans estimated in accordance with the provisions of SFAS 114 was £34m (2002: £67m). During the year ended 31 December 2003, impaired loans, including those excluded from SFAS 114, averaged £1,790m (2002: £1,935m) and interest income recognised on these loans was £6m (2002: £10m).
q) Financial guarantees
In the ordinary course Abbey enters into various financial guarantees. Abbey expects most of its financial guarantees to expire unused.
The majority of Abbey's financial guarantees are commercial letters of credit. Abbey's other financial guarantees are summarised as follows:
| | Maximum potential amount of future payments | |
| | As of 31 December | |
|
|
|
|
|
|
|
|
|
|
|
| |
| | | | | | Less | | | | | | | | No | |
| | | than 1 | | 1 to 3 | 3 to 5 | After | stated |
| 2002 | 2003 | year | | years | years | 5 years | maturity |
| £m | £m | £m | | £m | £m | £m | £m |
|
|
|
|
|
|
|
|
|
|
|
|
|
| |
| Guarantees: | | | | | | | | | | | | | | |
|
|
|
|
|
|
|
|
|
|
|
|
|
| |
| Guaranteed | | | | | | | | | | | | | | |
| cheques | 4,117 | | 4,304 | | – | | – | | – | | – | | 4,304 | |
|
|
|
|
|
|
|
|
|
|
|
|
|
| |
| Credit Derivatives | 360 | | – | | – | | – | | – | | – | | – | |
|
|
|
|
|
|
|
|
|
|
|
|
|
| |
| Stand-by letters | | | | | | | | | | | | | | |
| of credit | 664 | | 472 | | – | | 6 | | 34 | | 432 | | – | |
|
|
|
|
|
|
|
|
|
|
|
|
|
| |
| Guarantees on | | | | | | | | | | | | | | |
| sale of subsidiaries | 30 | | 1,564 | | 898 | | 325 | | – | | – | | 341 | |
|
|
|
|
|
|
|
|
|
|
|
|
|
| |
| | 5,171 | | 6,340 | | 898 | | 331 | | 34 | | 432 | | 4,645 | |
|
|
|
|
|
|
|
|
|
|
|
|
|
| |
The provision for guarantees which include the amortised fair value at 31 December 2003 was £29m and is included in Other Liabilities.
Guaranteed cheques are Abbey's commitment to guarantee the cheques of some of its customers up to a certain limit, typically £50-250. Stand-by letters of credit are our conditional commitments to guarantee the performance of a customer to a third party in borrowing arrangements. Guarantees on sale of subsidiaries are contingent consideration in a business combination.
The maximum potential amount of future payments represents the notional amounts that could be lost under the guarantees if the counterparty does not perform under the contract, without consideration of possible recoveries under recourse provisions or from collateral held or pledged. Such amounts greatly exceed the anticipated losses and, therefore, the contractual amounts are not indicative of the actual credit exposure or future cash flow requirements for such commitments.
Abbey also enters into contracts that contain indemnification provisions. Such indemnification agreements that function as financial guarantees are considered to have a remote risk of loss. Abbey's maximum exposure to loss and our actual loss experience is not significant. The indemnification clauses are often standard contractual terms and were entered into in the normal course of business based on an assessment that the risk of loss would be remote. In many cases, there are no stated or notional amounts included in the indemnification clauses and the contingencies triggering the obligation to indemnify have not occurred and are not expected to occur. There are no amounts reflected on the Consolidated Balance Sheet at 31 December 2003 a nd 2002, related to these indemnifications. These potential obligations are not included in the table above.
To mitigate credit risk, Abbey may require the counterparty to pledge collateral in the form of cash, securities or other assets. Cash collateral available to Abbey to reimburse losses realised under these guarantees amounted to £602m at 31 December 2003 (2002: £780m). Securities and other marketable assets held as collateral amounted to £854m (2002: £1,101m). Other property may also be available to Abbey to cover losses under certain guarantees and indemnifications. However, the value of such property has not been determined.
r) Segmental analysis
Under US GAAP, SFAS No. 131 "Disclosure about Segments of an Enterprise and Related Information" (SFAS 131) requires the disclosure of certain information about a Company's operating segments and related information. SFAS 131 defines an operating segment as a component of the business that engages in business activities from which it may earn income or incur expenses and whose operating results are regularly reviewed by the Company's chief operating decision maker to make decisions about resource allocation and to assess its performance.
SFAS 131 permits the aggregation of operating segments if the segments demonstrate similar economic characteristics and if the segments are similar in the following respects: the nature of the products and services offered; the nature of the production processes; the type or class of customer for their products or services; the distribution channels; and the nature of the regulatory environment.
Abbey has determined that its reportable segments identified in accordance with SFAS 131 also satisfy the requirements of SSAP 25. SSAP 25 requires that the amounts to be disclosed in the UK segmental analysis be presented on a statutory basis. Abbey's segmental analysis prepared in accordance with UK GAAP is shown in Note 1. SFAS 131 requires that the amounts to be disclosed in the US segmental analysis be presented on the basis used in the board report to evaluate performance. Abbey's management reviews discrete financial information for each of its segments that includes measures of operating results and assets. However, due to the differing natures of our ongoing Personal Financial Services group of reportable segments and our Portfolio Business Unit group of reportable segments, which are being managed for exit, the Personal Financial Services group of reportable segments and Portfolio Business Unit group of reportable segments are managed differently. The Personal Financial Services group of reportable segments are managed primarily on the basis of their results, which are measured on a trading basis. The Portfolio Business Unit group of reportable segments are managed both on the basis of their results, which are measured on a management basis, and on the basis of their net asset value. On a consolidated level the trading results of the Personal Financial Services group of reportable segments are aggregated with the management results of the Portfolio Business Unit group of reportable segments to give our summarised trading profit and loss account. The trading basis for our Personal Financial Services group of reportable segments and the management basis for our Portfolio Business Unit group of reportable segments are collectively known as the "trading" basis, as presented below.
| 176 | Abbey Annual Report and Accounts 2003 |
Back to Contents
Financial Statements
Notes to the Financial Statements continued
| Management considers that the trading basis provides the most appropriate way of reviewing the performance of the business. |
| This is because the adjustments are: |
| > | Embedded value charges and rebasing – these are unpredictable as they depend on both equity and debt market trends which do not affect the underlying performance of what is a very long-term business.The short-term market movements are, however, a very important factor in the management of the business but these are managed separately with a more risk-based focus. |
| > | Re-organisation costs – Abbey is going through a significant costs savings and re-organisation exercise and management needs to understand the underlying drivers of the cost base that will remain after the exercises complete and does not want this view to be clouded by the costs of the exercise. Those costs are managed independently. |
| > | Goodwill charges – these charges can vary significantly year on year, and hence can materially affect our profit or loss for that year. As a result we review these charges separately to avoid clouding the presentation of underlying results. |
| > | Depreciation on operating lease assets – The operating lease businesses are managed as financing businesses and therefore management needs to see the margin earned on the businesses. Residual value risk is separately managed. As a result we net the depreciation against the related income. |
| > | Income from associated undertakings is included within trading income because it is a regular source of income to our operations. Therefore management believes its inclusion at this level reflects our aggregate income from our activities. |
| > | Profit on disposal of Group undertakings is included within trading income for similar reasons to those noted above relating to our income from associated undertakings. |
| For a detailed explanation of these items, please refer to the “Other material items” section of the Operating and financial review. |
| The Personal Financial Services group of reportable segments adjustments are the deduction of: |
| > | Embedded value charges and rebasing |
| > | Re-organisation costs, and |
| > | Goodwill charges |
| There is also a single reclassification adjustment where: |
| > | Depreciation on operating lease assets is netted within trading income as opposed to being recorded as a part of operating expenses. |
| The Portfolio Business Unit group of reportable segments' adjustments are: |
| > | Depreciation on operating lease assets is netted within trading income as opposed to being recorded as a part of operating expenses |
| > | Income from associated undertakings is reported as part of non-interest income as opposed to being reported below the operating loss or profit line |
| > | Profit on disposal of Group undertakings is also reported as part of non-interest income as opposed to being reported below the operating loss or profit line. |
| Also included within trading interest income in 2003 is £2,063m (2002: £2,171m 2001: £2,459m) of inter-segment funding offset against interest expense. This adjustment results in statutory interest income in 2003 of £6,222m (2002 £8,128m ; 2001 £10,241m) and statutory interest expense in 2003 of £4,074m (2002: £5,439m; 2001 £7,549m). |
| Abbey's reportable segments are strategic business units that offer different products and services. They are managed separately because each business requires different technology and marketing strategies. Abbey has eight reportable segments. The Banking and Savings segment offers a range of personal banking, savings and mortgage products and services. The Investment and Protection segment offers a range of investment products such as pensions, investment bonds, with-profits bonds, structured products, unit trusts, Individual Savings Accounts, Wrap products and endowment |
| |
life insurance policies, as well as a range of protection products such as term life insurance, critical illness cover and disability cover.
The General Insurance segment offers a range of non-life insurance products, including property, motor, payment protection, accidental death, personal accident and travel insurance. The Treasury Services segment manages Abbey's liquidity, supports its funding and capital management activities, and provides risk management services to Abbey's other businesses. The Group Infrastructure segment comprises Central Services, Financial Holdings (which contains the earnings on the difference between Abbey's statutory capital and the target regulatory capital allocated to segments) and the results of certain small non-core businesses. The Wholesale segment earns interest and other similar returns on wholesale banking assets, including Abbey's debt securities portfolios, leasing and as well as structured corporate banking. The First National segment offers a comprehensive range of loans and insurance products for the purchase or leasing of motor vehicles, and litigation finance. The Other segment c on sists of Abbey's international operations, excluding Abbey Offshore and international treasury operations.
The accounting policies of the segments are the same as those described in the summary of significant accounting policies. Inter-segment transactions are accounted for as if the transactions were to third parties, that is, at current market prices.
| Abbey Annual Report and Accounts 2003 | 177 |
Back to Contents
Financial Statements
Notes to the Financial Statements continued
| | Banking | | Investment | | | | | | Group | | | | | | | | | | | | | |
| and | and | Treasury | General | Infra- | Wholesale | First | | | Adjust- | Group |
| Savings | Protection | Services | Insurance | structure | Banking | National | Other | Total | ments | Total |
| £m | £m | £m | £m | £m | £m | £m | £m | £m | £m | £m |
|
|
|
|
|
|
|
|
|
|
|
|
|
|
|
|
|
|
|
|
|
| |
| 2003 | | | | | | | | | | | | | | | | | | | | | | |
|
|
|
|
|
|
|
|
|
|
|
|
|
|
|
|
|
|
|
|
|
| |
| Interest income | 4,143 | | 132 | | 2,623 | | 3 | | 734 | | 66 | | 387 | | 197 | | 8,285 | | 2,063 | | 6,222 | |
|
|
|
|
|
|
|
|
|
|
|
|
|
|
|
|
|
|
|
|
|
|
|
| Interest expense | (2,423 | ) | (49 | ) | (2,511 | ) | (8 | ) | (849 | ) | (44 | ) | (142 | ) | (111 | ) | (6,137 | ) | 2,063 | | (4,074 | ) |
|
|
|
|
|
|
|
|
|
|
|
|
|
|
|
|
|
|
|
|
|
| |
| Net interest income | 1,720 | | 83 | | 112 | | (5 | ) | (115 | ) | 22 | | 245 | | 86 | | 2,148 | | – | | 2,148 | |
|
|
|
|
|
|
|
|
|
|
|
|
|
|
|
|
|
|
|
|
|
| |
| Non interest income | 427 | | 214 | | 137 | | 126 | | 90 | | (197 | ) | (58 | ) | 25 | | 764 | | (480 | ) | 284 | |
|
|
|
|
|
|
|
|
|
|
|
|
|
|
|
|
|
|
|
|
|
| |
| Depreciation of operating lease assets | – | | – | | – | | – | | – | | (250 | ) | (1 | ) | – | | (251 | ) | 251 | | – | |
|
|
|
|
|
|
|
|
|
|
|
|
|
|
|
|
|
|
|
|
|
| |
| Total trading income | 2,147 | | 297 | | 249 | | 121 | | (25 | ) | (425 | ) | 186 | | 111 | | 2,661 | | (229 | ) | 2,432 | |
|
|
|
|
|
|
|
|
|
|
|
|
|
|
|
|
|
|
|
|
|
| |
| Administrative and other expenses | (1,064 | ) | (57 | ) | (105 | ) | (48 | ) | (196 | ) | (96 | ) | (135 | ) | (73 | ) | (1,774 | ) | (511 | ) | (2,285 | ) |
|
|
|
|
|
|
|
|
|
|
|
|
|
|
|
|
|
|
|
|
|
| |
| Impairments | – | | – | | – | | – | | (10 | ) | – | | – | | (8 | ) | (18 | ) | – | | (13 | ) |
|
|
|
|
|
|
|
|
|
|
|
|
|
|
|
|
|
|
|
|
|
| |
| Depreciation of non-operating lease assets | (68 | ) | (1 | ) | (4 | ) | – | | (24 | ) | (11 | ) | (2 | ) | (2 | ) | (112 | ) | – | | (112 | ) |
|
|
|
|
|
|
|
|
|
|
|
|
|
|
|
|
|
|
|
|
|
| |
| Total trading expenses | (1,132 | ) | (58 | ) | (109 | ) | (48 | ) | (230 | ) | (107 | ) | (137 | ) | (83 | ) | (1,904 | ) | (511 | ) | (2,415 | ) |
|
|
|
|
|
|
|
|
|
|
|
|
|
|
|
|
|
|
|
|
|
| |
| Provisions for bad and doubtful debts | (130 | ) | – | | – | | – | | – | | (154 | ) | (99 | ) | (11 | ) | (394 | ) | (80 | ) | (474 | ) |
|
|
|
|
|
|
|
|
|
|
|
|
|
|
|
|
|
|
|
|
|
| |
| Provisions for contingent liabilities | | | | | | | | | | | | | | | | | | | | | | |
| and commitments | (9 | ) | – | | – | | – | | (52 | ) | (2 | ) | – | | (17 | ) | (80 | ) | (24 | ) | (104 | ) |
|
|
|
|
|
|
|
|
|
|
|
|
|
|
|
|
|
|
|
|
|
| |
| Amounts written off fixed | | | | | | | | | | | | | | | | | | | | | | |
| asset investments | – | | – | | – | | – | | – | | (183 | ) | – | | – | | (183 | ) | (10 | ) | (193 | ) |
|
|
|
|
|
|
|
|
|
|
|
|
|
|
|
|
|
|
|
|
|
| |
| Trading profit/(loss) before taxation | 876 | | 239 | | 140 | | 73 | | (307 | ) | (871 | ) | – | | – | | 100 | | (854 | ) | (754 | ) |
|
|
|
|
|
|
|
|
|
|
|
|
|
|
|
|
|
|
|
|
|
| |
| Adjust for: | | | | | | | | | | | | | | | | | | | | | | |
|
|
|
|
|
|
|
|
|
|
|
|
|
|
|
|
|
|
|
|
|
| |
| Embedded value charges and rebasing | – | | (443 | ) | – | | – | | – | | – | | – | | – | | (443 | ) | | | | |
|
|
|
|
|
|
|
|
|
|
|
|
|
|
|
|
|
|
|
|
|
| |
| Re-organisation expenses | (169 | ) | (16 | ) | (19 | ) | (41 | ) | (70 | ) | – | | – | | – | | (315 | ) | | | | |
|
|
|
|
|
|
|
|
|
|
|
|
|
|
|
|
|
|
|
|
|
| |
| Goodwill charges | – | | – | | – | | – | | (28 | ) | – | | – | | – | | (28 | ) | | | | |
|
|
|
|
|
|
|
|
|
|
|
|
|
|
|
|
|
|
|
|
|
| |
| Income from associated undertakings | – | | – | | – | | – | | – | | – | | (12 | ) | – | | (12 | ) | | | | |
|
|
|
|
|
|
|
|
|
|
|
|
|
|
|
|
|
|
|
|
|
| |
| Profit on disposal of group undertakings | – | | – | | – | | – | | – | | (50 | ) | 1 | | (40 | ) | (89 | ) | | | | |
|
|
|
|
|
|
|
|
|
|
|
|
|
|
|
|
|
|
|
|
|
| |
| Loss on the termination of an operation | – | | – | | – | | – | | – | | 6 | | 27 | | – | | 33 | | | | | |
|
|
|
|
|
|
|
|
|
|
|
|
|
|
|
|
|
|
|
|
|
| |
| Operating profit/(loss) | 707 | | (220 | ) | 121 | | 32 | | (405 | ) | (915 | ) | (34 | ) | (40 | ) | (754 | ) | | | | |
|
|
|
|
|
|
|
|
|
|
|
|
|
|
|
|
|
|
|
|
|
| |
| Total assets | 77,183 | | 28,790 | | 54,459 | | 165 | | 564 | | 7,426 | | 2,160 | | 6,027 | | 176,775 | | | | | |
|
|
|
|
|
|
|
|
|
|
|
|
|
|
|
|
|
|
|
|
|
| |
| Adjustments comprise: | | | | | Depreciation | | Depreciation | | Provisions | | Provisions | | Amounts | | | | Profit | |
| Non- | | of operating | of non- | for bad and | for | written off | | (loss) |
| interest | Impair- | lease | operating | doubtful | contingent | fixed asset | Other | before |
| income | ments | assets | lease assets | debts | liabilities | investments | expenses | taxation |
|
|
|
|
|
|
|
|
|
|
|
|
|
|
|
|
|
| |
| Embedded value charges and rebasing | (383 | ) | – | | – | | – | | (80 | ) | – | | – | | – | | (443 | ) |
|
|
|
|
|
|
|
|
|
|
|
|
|
|
|
|
|
| |
| Re-organisation expenses | (16 | ) | – | | – | | – | | – | | (24 | ) | (10 | ) | (265 | ) | (315 | ) |
|
|
|
|
|
|
|
|
|
|
|
|
|
|
|
|
|
| |
| Goodwill charges | – | | – | | – | | – | | – | | – | | – | | (28 | ) | (28 | ) |
|
|
|
|
|
|
|
|
|
|
|
|
|
|
|
|
|
| |
| Income from associated undertakings | (12 | ) | – | | – | | – | | – | | – | | – | | – | | (12 | ) |
|
|
|
|
|
|
|
|
|
|
|
|
|
|
|
|
|
| |
| Profit on disposal of group undertakings | (89 | ) | – | | – | | – | | – | | – | | – | | – | | (89 | ) |
|
|
|
|
|
|
|
|
|
|
|
|
|
|
|
|
|
| |
| Loss on the termination of an operation | – | | – | | – | | – | | – | | – | | – | | 33 | | 33 | |
|
|
|
|
|
|
|
|
|
|
|
|
|
|
|
|
|
| |
| Reclassification of depreciation on | | | | | | | | | | | | | | | | | | |
| operating lease assets | – | | – | | 251 | | – | | – | | – | | – | | (251 | ) | – | |
|
|
|
|
|
|
|
|
|
|
|
|
|
|
|
|
|
| |
| | (480 | ) | – | | 251 | | – | | (80 | ) | (24 | ) | (10 | ) | (511 | ) | (854 | ) |
|
|
|
|
|
|
|
|
|
|
|
|
|
|
|
|
|
| |
| 178 | Abbey Annual Report and Accounts 2003 |
Back to Contents
Financial Statements
Notes to the Financial Statements continued
| | Banking | | Investment | | | | | | Group | | | | | | | | | | | | | |
| | and | | and | | Treasury | | General | | Infra- | | Wholesale | | First | | | | | | Adjust- | | Group | |
| | Savings | | Protection | | Services | | Insurance | | structure | | Banking | | National | | Other | | Total | | ments | | Total | |
| | £m | | £m | | £m | | £m | | £m | | £m | | £m | | £m | | £m | | £m | | £m | |
|
|
|
|
|
|
|
|
|
|
|
|
|
|
|
|
|
|
|
|
|
| |
| 2002 | | | | | | | | | | | | | | | | | | | | | | |
|
|
|
|
|
|
|
|
|
|
|
|
|
|
|
|
|
|
|
|
|
| |
| Interest income | 4,255 | | 150 | | 3,843 | | 4 | | 759 | | 327 | | 801 | | 160 | | 10,299 | | (2,171 | ) | 8,128 | |
|
|
|
|
|
|
|
|
|
|
|
|
|
|
|
|
|
|
|
|
|
| |
| Interest expense | (2,456 | ) | (60 | ) | (3,711 | ) | (7 | ) | (934 | ) | – | | (337 | ) | (105 | ) | (7,610 | ) | 2,171 | | (5,439 | ) |
|
|
|
|
|
|
|
|
|
|
|
|
|
|
|
|
|
|
|
|
|
| |
| Net interest income | 1,799 | | 90 | | 132 | | (3 | ) | (175 | ) | 327 | | 464 | | 55 | | 2,689 | | – | | 2,689 | |
|
|
|
|
|
|
|
|
|
|
|
|
|
|
|
|
|
|
|
|
|
| |
| Non-interest income | 454 | | 335 | | 126 | | 149 | | 106 | | 378 | | (48 | ) | (71 | ) | 1,429 | | (618 | ) | 811 | |
|
|
|
|
|
|
|
|
|
|
|
|
|
|
|
|
|
|
|
|
|
| |
| Depreciation of operating lease assets | (23 | ) | – | | – | | – | | – | | (252 | ) | (5 | ) | – | | (280 | ) | 280 | | – | |
|
|
|
|
|
|
|
|
|
|
|
|
|
|
|
|
|
|
|
|
|
| |
| Total trading income | 2,230 | | 425 | | 258 | | 146 | | (69 | ) | 453 | | 411 | | (16 | ) | 3,838 | | (338 | ) | 3,500 | |
|
|
|
|
|
|
|
|
|
|
|
|
|
|
|
|
|
|
|
|
|
| |
| Administrative and other expenses | (1,042 | ) | (52 | ) | (103 | ) | (55 | ) | (230 | ) | (95 | ) | (183 | ) | (58 | ) | (1,818 | ) | (378 | ) | (2,196 | ) |
|
|
|
|
|
|
|
|
|
|
|
|
|
|
|
|
|
|
|
|
|
| |
| Impairments | – | | – | | – | | – | | – | | (28 | ) | (357 | ) | (6 | ) | (391 | ) | (747 | ) | (1,138 | ) |
|
|
|
|
|
|
|
|
|
|
|
|
|
|
|
|
|
|
|
|
|
| |
| Depreciation of non-operating lease assets | (66 | ) | (1 | ) | (7 | ) | 1 | | (22 | ) | – | | (6 | ) | (2 | ) | (103 | ) | – | | (103 | ) |
|
|
|
|
|
|
|
|
|
|
|
|
|
|
|
|
|
|
|
|
|
| |
| Total trading expenses | (1,108 | ) | (53 | ) | (110 | ) | (54 | ) | (252 | ) | (123 | ) | (546 | ) | (66 | ) | (2,312 | ) | (1,125 | ) | (3,437 | ) |
|
|
|
|
|
|
|
|
|
|
|
|
|
|
|
|
|
|
|
|
|
| |
| Provisions for bad and doubtful debts | (151 | ) | – | | – | | – | | 1 | | (247 | ) | (115 | ) | (2 | ) | (514 | ) | – | | (514 | ) |
|
|
|
|
|
|
|
|
|
|
|
|
|
|
|
|
|
|
|
|
|
| |
| Provisions for contingent liabilities | | | | | | | | | | | | | | | | | | | | | | |
| and commitments | (11 | ) | – | | – | | – | | (35 | ) | – | | (4 | ) | – | | (50 | ) | – | | (50 | ) |
|
|
|
|
|
|
|
|
|
|
|
|
|
|
|
|
|
|
|
|
|
| |
| Amounts written off fixed | | | | | | | | | | | | | | | | | | | | | | |
| asset investments | (2 | ) | – | | – | | – | | – | | (513 | ) | – | | – | | (511 | ) | – | | (511 | ) |
|
|
|
|
|
|
|
|
|
|
|
|
|
|
|
|
|
|
|
|
|
| |
| Trading profit/(loss) before taxation | 962 | | 372 | | 148 | | 92 | | (355 | ) | (430 | ) | (254 | ) | (84 | ) | 451 | | (1,463 | ) | (1,012 | ) |
|
|
|
|
|
|
|
|
|
|
|
|
|
|
|
|
|
|
|
|
|
| |
| Adjust for: | | | | | | | | | | | | | | | | | | | | | | |
|
|
|
|
|
|
|
|
|
|
|
|
|
|
|
|
|
|
|
|
|
| |
| Embedded value charges and rebasing | – | | (553 | ) | – | | – | | – | | – | | – | | – | | (553 | ) | | | | |
|
|
|
|
|
|
|
|
|
|
|
|
|
|
|
|
|
|
|
|
|
| |
| Re-organisation expenses | (23 | ) | – | | – | | – | | (11 | ) | – | | – | | – | | (34 | ) | | | | |
|
|
|
|
|
|
|
|
|
|
|
|
|
|
|
|
|
|
|
|
|
| |
| Goodwill charges | – | | – | | – | | – | | (811 | ) | – | | – | | – | | (811 | ) | | | | |
|
|
|
|
|
|
|
|
|
|
|
|
|
|
|
|
|
|
|
|
|
| |
| Income from associated undertakings | – | | – | | – | | – | | – | | – | | (17 | ) | – | | (17 | ) | | | | |
|
|
|
|
|
|
|
|
|
|
|
|
|
|
|
|
|
|
|
|
|
| |
| Profit on disposal of group undertakings | – | | – | | – | | – | | – | | (46 | ) | (2 | ) | – | | (48 | ) | | | | |
|
|
|
|
|
|
|
|
|
|
|
|
|
|
|
|
|
|
|
|
|
| |
| Operating profit/(loss) | 939 | | (181 | ) | 148 | | 92 | | (1,177 | ) | (476 | ) | (273 | ) | (84 | ) | (1,012 | ) | | | | |
|
|
|
|
|
|
|
|
|
|
|
|
|
|
|
|
|
|
|
|
|
| |
| Total assets | 67,264 | | 30,404 | | 43,603 | | 199 | | 837 | | 48,401 | | 7,751 | | 6,736 | | 205,194 | | | | | |
|
|
|
|
|
|
|
|
|
|
|
|
|
|
|
|
|
|
|
|
|
| |
| | | | | | | | | | | | | | | | | | | |
| | | | | | Depreciation | | Depreciation | | Provisions | | Provisions | | Amounts | | | | Profit | |
| | Non- | | | | of operating | | of non- | | for bad and | | for | | written off | | | | (loss) | |
| | interest | | Impair- | | lease | | operating | | doubtful | | contingent | | fixed asset | | Other | | before | |
| Adjustments comprise: | income | | ments | | assets | | lease assets | | debts | | liabilities | | investments | | expenses | | taxation | |
|
|
|
|
|
|
|
|
|
|
|
|
|
|
|
|
|
| |
| Embedded value charges and rebasing | (553 | ) | – | | – | | – | | – | | – | | – | | – | | (553 | ) |
|
|
|
|
|
|
|
|
|
|
|
|
|
|
|
|
|
| |
| Re-organisation expenses | – | | – | | – | | – | | – | | – | | – | | (34 | ) | (34 | ) |
|
|
|
|
|
|
|
|
|
|
|
|
|
|
|
|
|
| |
| Goodwill charges | – | | (747 | ) | – | | – | | – | | – | | – | | (64 | ) | (811 | ) |
|
|
|
|
|
|
|
|
|
|
|
|
|
|
|
|
|
| |
| Income from associated undertakings | (17 | ) | – | | – | | – | | – | | – | | – | | – | | (17 | ) |
|
|
|
|
|
|
|
|
|
|
|
|
|
|
|
|
|
| |
| Profit on disposal of group undertakings | (48 | ) | – | | – | | – | | – | | – | | – | | – | | (48 | ) |
|
|
|
|
|
|
|
|
|
|
|
|
|
|
|
|
|
| |
| Reclassification of depreciation | | | | | | | | | | | | | | | | | | |
| on operating lease assets | – | | – | | 280 | | – | | – | | – | | – | | (280 | ) | – | |
|
|
|
|
|
|
|
|
|
|
|
|
|
|
|
|
|
| |
| | (618 | ) | (747 | ) | 280 | | – | | – | | – | | – | | (378 | ) | (1,463 | ) |
|
|
|
|
|
|
|
|
|
|
|
|
|
|
|
|
|
| |
| Abbey Annual Report and Accounts 2003 | 179 |
Back to Contents
Financial Statements
Notes to the Financial Statements continued
| | Banking | | Investment | | | | | | Group | | | | | | | | | | | | | |
| | and | | and | | Treasury | | General | | Infra- | | Wholesale | | First | | | | | | Adjust- | | Group | |
| | Savings | | Protection | | Services | | Insurance | | structure | | Banking | | National | | Other | | Total | | ments | | Total | |
| | £m | | £m | | £m | | £m | | £m | | £m | | £m | | £m | | £m | | £m | | £m | |
|
|
|
|
|
|
|
|
|
|
|
|
|
|
|
|
|
|
|
|
|
| |
| 2001 | | | | | | | | | | | | | | | | | | | | | | |
|
|
|
|
|
|
|
|
|
|
|
|
|
|
|
|
|
|
|
|
|
| |
| Interest income | 4,730 | | 76 | | 1,472 | | 6 | | 1,287 | | 4,194 | | 805 | | 130 | | 12,700 | | (2,459 | ) | 10,241 | |
|
|
|
|
|
|
|
|
|
|
|
|
|
|
|
|
|
|
|
|
|
| |
| Interest expense | (3,050 | ) | (22 | ) | (1,340 | ) | (10 | ) | (1,330 | ) | (3,818 | ) | (344 | ) | (94 | ) | (10,008 | ) | 2,459 | | (7,549 | ) |
|
|
|
|
|
|
|
|
|
|
|
|
|
|
|
|
|
|
|
|
|
| |
| Net interest income | 1,680 | | 54 | | 132 | | (4 | ) | (43 | ) | 376 | | 461 | | 36 | | 2,692 | | – | | 2,692 | |
|
|
|
|
|
|
|
|
|
|
|
|
|
|
|
|
|
|
|
|
|
| |
| Non-interest income | 620 | | 363 | | 177 | | 134 | | 147 | | 413 | | (33 | ) | (14 | ) | 1,807 | | (488 | ) | 1,319 | |
|
|
|
|
|
|
|
|
|
|
|
|
|
|
|
|
|
|
|
|
|
| |
| Depreciation of operating lease assets | (97 | ) | – | | – | | – | | – | | (152 | ) | (7 | ) | – | | (256 | ) | 256 | | – | |
|
|
|
|
|
|
|
|
|
|
|
|
|
|
|
|
|
|
|
|
|
| |
| Total trading income | 2,203 | | 417 | | 309 | | 130 | | 104 | | 637 | | 421 | | 22 | | 4,243 | | (232 | ) | 4,011 | |
|
|
|
|
|
|
|
|
|
|
|
|
|
|
|
|
|
|
|
|
|
| |
| Administrative and other expenses | (1,000 | ) | (44 | ) | (95 | ) | (40 | ) | (201 | ) | (86 | ) | (208 | ) | (35 | ) | (1,709 | ) | (292 | ) | (2,001 | ) |
|
|
|
|
|
|
|
|
|
|
|
|
|
|
|
|
|
|
|
|
|
| |
| Impairments | – | | – | | – | | – | | – | | – | | – | | – | | – | | – | | – | |
|
|
|
|
|
|
|
|
|
|
|
|
|
|
|
|
|
|
|
|
|
| |
| Depreciation of operating lease assets | (69 | ) | (2 | ) | (3 | ) | (2 | ) | (25 | ) | (2 | ) | (6 | ) | (2 | ) | (111 | ) | – | | (111 | ) |
|
|
|
|
|
|
|
|
|
|
|
|
|
|
|
|
|
|
|
|
|
| |
| Total trading expenses | (1,069 | ) | (46 | ) | (98 | ) | (42 | ) | (226 | ) | (88 | ) | (214 | ) | (37 | ) | (1,820 | ) | (292 | ) | (2,112 | ) |
|
|
|
|
|
|
|
|
|
|
|
|
|
|
|
|
|
|
|
|
|
| |
| Provisions for bad and doubtful debts | (149 | ) | – | | – | | – | | – | | – | | (113 | ) | (1 | ) | (263 | ) | – | | (263 | ) |
|
|
|
|
|
|
|
|
|
|
|
|
|
|
|
|
|
|
|
|
|
| |
| Provisions for contingent liabilities | | | | | | | | | | | | | | | | | | | | | | |
| and commitments | (5 | ) | (3 | ) | – | | – | | 17 | | – | | – | | – | | 9 | | – | | 9 | |
|
|
|
|
|
|
|
|
|
|
|
|
|
|
|
|
|
|
|
|
|
| |
| Amounts written off fixed | | | | | | | | | | | | | | | | | | | | | | |
| asset investments | – | | – | | (24 | ) | – | | – | | (232 | ) | – | | – | | (256 | ) | – | | (256 | ) |
|
|
|
|
|
|
|
|
|
|
|
|
|
|
|
|
|
|
|
|
|
| |
| Trading profit/(loss) before taxation | 980 | | 368 | | 187 | | 88 | | (105 | ) | 317 | | 94 | | (16 | ) | 1,913 | | (524 | ) | 1,389 | |
|
|
|
|
|
|
|
|
|
|
|
|
|
|
|
|
|
|
|
|
|
| |
| Adjust for: | | | | | | | | | | | | | | | | | | | | | | |
|
|
|
|
|
|
|
|
|
|
|
|
|
|
|
|
|
|
|
|
|
| |
| Embedded value charges and rebasing | – | | (407 | ) | – | | – | | – | | – | | – | | – | | (407 | ) | | | | |
|
|
|
|
|
|
|
|
|
|
|
|
|
|
|
|
|
|
|
|
|
| |
| Re-organisation expenses | – | | – | | – | | – | | – | | – | | – | | – | | – | | | | | |
|
|
|
|
|
|
|
|
|
|
|
|
|
|
|
|
|
|
|
|
|
| |
| Goodwill charges | – | | – | | – | | – | | (36 | ) | – | | – | | – | | (36 | ) | | | | |
|
|
|
|
|
|
|
|
|
|
|
|
|
|
|
|
|
|
|
|
|
| |
| Income from associated undertakings | – | | – | | – | | – | | – | | – | | (14 | ) | – | | (14 | ) | | | | |
|
|
|
|
|
|
|
|
|
|
|
|
|
|
|
|
|
|
|
|
|
| |
| Profit on disposal of group | | | | | | | | | | | | | | | | | | | | | | |
| undertakings | – | | – | | – | | – | | (65 | ) | (2 | ) | – | | – | | (67 | ) | | | | |
|
|
|
|
|
|
|
|
|
|
|
|
|
|
|
|
|
|
|
|
|
| |
| Operating profit/(loss) | 980 | | (39 | ) | 187 | | 88 | | (206 | ) | 315 | | 80 | | (16 | ) | 1,389 | | | | | |
|
|
|
|
|
|
|
|
|
|
|
|
|
|
|
|
|
|
|
|
|
| |
| Total assets | 70,906 | | 32,458 | | 47,910 | | 179 | | 460 | | 53,181 | | 8,874 | | 399 | | 214,367 | | | | | |
|
|
|
|
|
|
|
|
|
|
|
|
|
|
|
|
|
|
|
|
|
| |
| | | | | | | | | | | | | | | | | | | |
| | | | | | Depreciation | | Depreciation | | Provisions | | Provisions | | Amounts | | | | Profit | |
| | Non- | | | | of operating | | of non- | | for bad and | | for | | written off | | | | (loss) | |
| | interest | | Impair- | | lease | | operating | | doubtful | | contingent | | fixed asset | | Other | | before | |
| Adjustments comprise: | income | | ments | | assets | | lease assets | | debts | | liabilities | | investments | | expenses | | taxation | |
|
|
|
|
|
|
|
|
|
|
|
|
|
|
|
|
|
| |
| Embedded value charges and rebasing | (407 | ) | – | | – | | – | | – | | – | | – | | – | | (407 | ) |
|
|
|
|
|
|
|
|
|
|
|
|
|
|
|
|
|
| |
| Re-organisation expenses | – | | – | | – | | – | | – | | – | | – | | – | | – | |
|
|
|
|
|
|
|
|
|
|
|
|
|
|
|
|
|
| |
| Goodwill charges | – | | – | | – | | – | | – | | – | | – | | (36 | ) | (36 | ) |
|
|
|
|
|
|
|
|
|
|
|
|
|
|
|
|
|
| |
| Income from associated undertakings | (14 | ) | – | | – | | – | | – | | – | | – | | – | | (14 | ) |
|
|
|
|
|
|
|
|
|
|
|
|
|
|
|
|
|
| |
| Profit on disposal of group undertakings | (67 | ) | – | | – | | – | | – | | – | | – | | – | | (67 | ) |
|
|
|
|
|
|
|
|
|
|
|
|
|
|
|
|
|
| |
| Reclassification of depreciation | | | | | | | | | | | | | | | | | | |
| on operating base assets | – | | – | | 256 | | – | | – | | – | | – | | (256 | ) | – | |
|
|
|
|
|
|
|
|
|
|
|
|
|
|
|
|
|
| |
| | (488 | ) | – | | 256 | | – | | – | | – | | – | | (292 | ) | (524 | ) |
|
|
|
|
|
|
|
|
|
|
|
|
|
|
|
|
|
| |
| 180 | Abbey Annual Report and Accounts 2003 |
Back to Contents
Financial Statements
Notes to the Financial Statements continued
s) Restatements
Restatements
Subsequent to the issuance of Abbey's 2002 consolidated financial statements, management identified certain errors in the amounts previously reported. As a result, Abbey's US GAAP net (loss) income and shareholders' funds for the year ended 31 December 2002 and 2001 have been restated from the amounts previously reported as follows:
Life assurance businesses restatements
Updated actuarial models were used in preparing the 2002 UK GAAP to US GAAP reconciliations for Abbey's life assurance businesses. As part of the preparation of the 2003 consolidated financial statements, Abbey integrated these models within the accounting system. As a result, errors were discovered in certain models that gave rise to a net overstatement of actuarial reserves, which also impacted previous purchase accounting adjustments on a US GAAP basis. In addition, errors were discovered in the calculations related to available-for-sale securities. Further, a tax allowance was recorded on the 2002 life assurance businesses net loss, which although substantially realised in 2003 following changes to UK tax laws in 2003, should not have been recognised under US GAAP at 31 December 2003.
Securitised assets
In preparing the 2003 consolidated financial statements, it was discovered that certain adjustments reported in 2002 and 2001 included in Abbey's UK to US GAAP reconciliations attributable to assets of the Holmes securitisation vehicles were incorrect. These adjustments were related to derivatives and loan origination fees. Although the Holmes securitisation vehicles are consolidated under UK GAAP, they are not consolidated under US GAAP (in accordance with SFAS 140 as described in the "Securitised assets" difference discussion in note 58). Accordingly, these UK GAAP to US GAAP differences should not have been included in Abbey's reconciliations of net (loss) income and shareholders' funds for the years ended 31 December 2002 and 2001.
These findings have resulted in restatements of the previously reported US GAAP adjustments in respect of "Derivatives and hedging activities", "Shareholders' interest in long term assurance business", "Loan origination fees and costs", "Securitisation" and "Deferred tax" with their related tax effects, where applicable, as follows:
| | | | 2001 | |
| | 2002 | | (restated) | |
| | £m | | £m | |
|
|
|
| |
| Net(loss) income: | | | | |
|
|
|
| |
| Net (loss) income under US GAAP, | | | | |
| as previously reported | (1,449) | (1) | 1,053 | |
|
|
|
| |
| Adjustment to "Derivatives and hedging activities" | 222 | | 99 | |
|
|
|
| |
| Adjustment to "Loan origination fees" | (55 | ) | (132 | ) |
|
|
|
| |
| Adjustment to "Shareholders' interest in long term assurance business" | 145 | | (108 | ) |
|
|
|
| |
| Deferred tax effect of adjustments | (256 | ) | 35 | |
|
|
|
| |
| Net (loss) income under US GAAP, as restated | (1,393 | ) | 947 | |
|
|
|
| |
| (Loss)/earnings per share: | | | | |
|
|
|
| |
| Basic (loss) earnings per share, | | | | |
| as previously reported | (103.0 | )p | 73.6 | p |
|
|
|
| |
| Effect of adjustments | 6.4 | p | (7.4 | )p |
|
|
|
| |
| Basic (loss) earnings per share, as restated | (96.6 | )p | 66.2 | p |
|
|
|
| |
| Diluted (loss) earnings per share, | | | | |
| as previously reported | (103.0 | )p | 73.6 | p |
|
|
|
| |
| Effect of adjustments | 6.4 | p | (7.5 | )p |
|
|
|
| |
| Diluted (loss) earnings per share, as restated | (96.6 | )p | 66.1 | p |
|
|
|
| |
| Shareholders’ funds: | | | | |
|
|
|
| |
| Shareholders' funds under US GAAP, as previously reported | 5,979 | (1) | | |
|
|
|
| |
| Adjustment to "Derivatives and hedging activities" | 452 | | | |
|
|
|
| |
| Adjustment to "Loan origination fees" | (187 | ) | | |
|
|
|
| |
| Adjustment to "Shareholders' interest in long term assurance business" | 129 | | | |
|
|
|
| |
| Deferred tax effect of adjustments | (283 | ) | | |
|
|
|
| |
| Shareholders’ funds under US GAAP, as restated | 6,090 | | | |
|
|
|
| |
| (1) | Restated for the matters described in the UK accounting policies note. |
| Abbey Annual Report and Accounts 2003 | 181 |
Back to Contents
Financial Statements
Notes to the Financial Statements continued
63. Significant concentrations of credit risk
Under SFAS 105, concentrations of credit risk exist if a number of counterparties are engaged in similar activities and have similar economic characteristics that would cause their ability to meet contractual obligations to be similarly affected by changes in economic or other conditions.
During 2003, Abbey's significant exposures to credit risk arose mainly in the residential mortgage portfolio and unsecured lending in Banking and Savings and in Treasury Services and Wholesale Banking. See "Risk management – Credit risk" for additional information regarding Abbey's approach to managing credit risk.
Residential mortgages represented 42% (2002: 34%) of total assets at 31 December 2003; 98% (2002: 95%) of the residential mortgage asset is located in the UK.
Although the Treasury Services operations are based mainly in the UK, it has built up exposures to various entities around the world. At 31 December 2003, 18% of Treasury Services credit exposures were to counterparties from the United States, and 50% were to counterparties from the UK. The remaining exposures were mainly to counterparties from Europe. Less than 3% of Treasury Services' exposures were to countries that are not members of the Organisation for Economic Cooperation and Development.
64. Fair values of financial instruments
The following disclosures are made in accordance with SFAS 107, Disclosures about Fair Value of Financial Instruments.
The fair values have been estimated using quoted market prices where available. Where no ready markets exist and hence quoted market prices are not available, appropriate techniques are used to estimate fair values which typically take account of the characteristics of the instruments, including the future cash flows, market interest rates and prices available for similar instruments. Unless otherwise specified, fair values of financial instruments have been estimated by discounting anticipated future cash flows using market interest rates offered at 31 December 2003 for similar instruments.
By its nature, the estimation of fair values is highly subjective and the results will depend largely upon the assumptions made. See "Operating review – highlights – Critical accounting policies" for additional information. Considerable caution should therefore be used in interpreting the fair values and particularly if comparing with fair values presented by other financial institutions. The concept of fair values assumes that the financial instruments will be realised by way of sale in the ordinary course of business with adjustments made for liquidity as appropriate.
SFAS 107 does not apply to non financial assets and liabilities. Accordingly, tangible fixed assets and balances relating to Long Term Assurance business are excluded.
The carrying values and estimated fair values of financial instruments are as follows:
| | |
| 182 | Abbey Annual Report and Accounts 2003 |
Back to Contents
Financial Statements
Notes to the Financial Statements continued
| | 2003 | | 2003 | | 2003 | | 2002 | | 2002 | | 2002 | |
| Carrying | Fair | Surplus/ | Carrying | Fair | Surplus/ |
| amount | value(1) | (deficit) | amount | value(1) | (deficit) |
| £m | £m | £m | £m | £m | £m |
|
|
|
|
|
|
|
|
|
|
|
| |
| Non-trading assets | | | | | | | | | | | | |
|
|
|
|
|
|
|
|
|
|
|
| |
| Cash and balances at central banks | 439 | | 439 | | – | | 396 | | 396 | | – | |
|
|
|
|
|
|
|
|
|
|
|
| |
| Loans and advances to banks | 2,271 | | 2,271 | | – | | 3,127 | | 3,129 | | 2 | |
|
|
|
|
|
|
|
|
|
|
|
| |
| Related derivatives | 26 | | 27 | | 1 | | 17 | | (17 | ) | (34 | ) |
|
|
|
|
|
|
|
|
|
|
|
| |
| Loans and advances to customers | 84,426 | | 84,688 | | 262 | | 87,314 | | 87,508 | | 194 | |
|
|
|
|
|
|
|
|
|
|
|
| |
| Related derivatives | (588 | ) | (1,061 | ) | (474 | ) | (244 | ) | (1,109 | ) | (865 | ) |
|
|
|
|
|
|
|
|
|
|
|
| |
| Debt securities | 1,753 | | 1,841 | | 88 | | 32,975 | | 33,104 | | 129 | |
|
|
|
|
|
|
|
|
|
|
|
| |
| Related derivatives | (58 | ) | (199 | ) | (140 | ) | (222 | ) | (992 | ) | (770 | ) |
|
|
|
|
|
|
|
|
|
|
|
| |
| Equity shares and other variable yield securities | 394 | | 394 | | – | | 893 | | 901 | | 8 | |
|
|
|
|
|
|
|
|
|
|
|
| |
| Non-trading liabilities | | | | | | | | | | | | |
|
|
|
|
|
|
|
|
|
|
|
| |
| Deposits by banks | (8,772 | ) | (8,793 | ) | (20 | ) | (11,481) | | (11,515 | ) | (34 | ) |
|
|
|
|
|
|
|
|
|
|
|
| |
| Related derivatives | (67 | ) | (52 | ) | 15 | | (36 | ) | 12 | | 48 | |
|
|
|
|
|
|
|
|
|
|
|
| |
| Customer accounts | (68,666 | ) | (68,882 | ) | (217 | ) | (67,934 | ) | (68,120 | ) | (186 | ) |
|
|
|
|
|
|
|
|
|
|
|
| |
| Related derivatives | 47 | | 187 | | 140 | | 176 | | 307 | | 131 | |
|
|
|
|
|
|
|
|
|
|
|
| |
| Debt securities in issue | (24,834 | ) | (24,893 | ) | (59 | ) | (48,079 | ) | (48,340 | ) | (261 | ) |
|
|
|
|
|
|
|
|
|
|
|
| |
| Related derivatives | 80 | | 259 | | 179 | | 205 | | 542 | | 337 | |
|
|
|
|
|
|
|
|
|
|
|
| |
| Short positions in debt securities and equity shares | – | | – | | – | | (106 | ) | (109 | ) | (3 | ) |
|
|
|
|
|
|
|
|
|
|
|
| |
| Subordinated liabilities including convertible debt | (6,337 | ) | (7,068 | ) | (731 | ) | (6,532 | ) | (7,217 | ) | (685 | ) |
|
|
|
|
|
|
|
|
|
|
|
| |
| Related derivatives | (99 | ) | 425 | | 524 | | 98 | | 790 | | 692 | |
|
|
|
|
|
|
|
|
|
|
|
| |
| Other long term capital instruments | (742 | ) | (896 | ) | (154 | ) | (771 | ) | (807 | ) | (36 | ) |
|
|
|
|
|
|
|
|
|
|
|
| |
| Related derivatives | 1 | | 208 | | 207 | | 6 | | 37 | | 31 | |
|
|
|
|
|
|
|
|
|
|
|
| |
| Other non-trading derivatives(2) | 10 | | (5 | ) | (15 | ) | 6 | | 45 | | 39 | |
|
|
|
|
|
|
|
|
|
|
|
| |
| Trading assets/liabilities | | | | | | | | | | | | |
|
|
|
|
|
|
|
|
|
|
|
| |
| Treasury bills & other eligible bills | 1,630 | | 1,630 | | – | | 1,483 | | 1,483 | | – | |
|
|
|
|
|
|
|
|
|
|
|
| |
| Loans and advances to banks | 4,884 | | 4,884 | | – | | 3,474 | | 3,474 | | – | |
|
|
|
|
|
|
|
|
|
|
|
| |
| Loans and advances to customers | 9,413 | | 9,413 | | – | | 3,289 | | 3,289 | | – | |
|
|
|
|
|
|
|
|
|
|
|
| |
| Debt securities | 28,575 | | 28,575 | | – | | 26,832 | | 26,832 | | – | |
|
|
|
|
|
|
|
|
|
|
|
| |
| Equity shares and other variable yield securities | 1,239 | | 1,239 | | – | | 70 | | 70 | | – | |
|
|
|
|
|
|
| |
|
|
|
| |
| Deposits by banks | (13,353 | ) | (13,353 | ) | – | | (12,693 | ) | (12,693 | ) | – | |
|
|
|
|
|
|
|
|
|
|
|
| |
| Customer accounts | (5,736 | ) | (5,736 | ) | – | | (8,832 | ) | (8,832 | ) | – | |
|
|
|
|
|
|
|
|
|
|
|
| |
| Short positions in government debt securities | (4,303 | ) | (4,303 | ) | – | | (3,350 | ) | (3,350 | ) | – | |
|
|
|
|
|
|
|
|
|
|
|
| |
| Derivative contracts with third parties | (3,169 | ) | (3,169 | ) | – | | (1,757 | ) | (1,757 | ) | – | |
|
|
|
|
|
|
|
|
|
|
|
| |
| Derivative contracts with ANFP | 50 | | 50 | | – | | 132 | | 132 | | – | |
|
|
|
|
|
|
|
|
|
|
|
| |
| (1) | Where quoted market prices are not available, fair values of on-balance sheet financial instruments incorporate the discounted value of the principal amounts, whereas, for associated hedges of the underlying interest flows, fair values of derivatives do not reflect principal amounts. Consequently, movements in the fair values of on-balance sheet financial instruments are not necessarily matched by equal and opposite movements in the fair values of related derivatives. |
| | |
| (2) | Other non-trading derivatives hedge finance, operating lease assets and non-equity minority interests. SFAS 107 does not require disclosure of the fair value of finance lease debtors. They are therefore excluded from the table. Non-equity minority interests are not classified as liabilities under UK GAAP and have been excluded from the table. |
| | |
| Abbey Annual Report and Accounts 2003 | 183 |
Back to Contents
Financial Statements
Notes to the Financial Statements continued
Fair values include the fair values of derivatives undertaken by Abbey entities for non-trading purposes with Abbey National Financial Products. As part of an integrated approach to risk management, Abbey uses both off– and on-balance sheet instruments to manage risk. On-balance sheet instruments which are used as hedges of other on-balance sheet instruments are shown in the relevant standard balance sheet headings on the fair value table, and are not offset.
Other assets, Prepayments and accrued income, Dividend proposed, Other liabilities, Accruals and deferred income and Provisions for liabilities and charges may contain financial instruments which fall within the scope of SFAS 107. Unless specifically included, these financial instruments have been excluded from the above analysis as their fair values approximate to carrying values.
The surplus/(deficit) in the table above represents the surplus/(deficit) of fair value compared to the carrying amount of those financial instruments for which fair values have been estimated under SFAS 107.
The approach to specific categories of financial instruments is described below.
Assets
Debt securities and equity shares and other variable yield securities
Where available, securities and investments have been valued using quoted market prices. Where quoted market prices are not available, as is the case with certain over-the-counter derivatives ("OTC derivatives"), fair value is determined using pricing models that use a mathematical methodology based on accepted financial theories. Depending on the product type and its components, the fair value of over-the-counter derivatives is modelled using one or a combination of pricing models that are widely accepted in the financial services industry.
Pricing models take into account the contract terms of the securities as well as market-based valuation parameters, such as interest rates, volatility, exchange rates and the credit rating of the counterparty. Valuation adjustments are an integral component of the fair value estimation process and are taken on individual positions where either the absolute size of the trade or other specific features of the trade or the particular market (such as counterparty credit risk, concentration or market liquidity) require more than the simple application of pricing models.
When valuation parameters are not observable in the market or cannot be derived from observable market prices, as is the case with certain over-the-counter derivatives, the fair value is derived either through historical analysis of other observable market data (such as spot prices) or through an estimation of a valuation adjustment appropriate for each product. Typically, historical benchmarks are combined with management judgement in this process.
Loans and advances to customers
Loans and advances to personal customers are made both at variable and at fixed rates. As there is no active secondary market in the UK for such loans and advances, there is no reliable market value available for such a significant portfolio.
However, if a market value could be ascertained, the Directors believe it would reflect the expectation of a long term and continuing relationship with a majority of the customers. Although substantial, this value is intangible and it cannot therefore be included in the fair value under SFAS 107. Consequently the Directors believe that, for the purposes of SFAS 107, the carrying value of the variable rate loans may be assumed to be their fair value.
Certain of the loans secured on residential properties are at a fixed rate for a limited period, typically two to five years from their commencement. At the end of this period these loans revert to the relevant variable rate. The excess of fair value over carrying value of each of these loans has been estimated by reference to the market rates available at 31 December 2003 for similar loans of maturity equal to the remaining fixed period. The fixed element of such loans is substantially hedged such that any movement in the value of the loan as a result of
market interest rate changes will be offset by an equivalent movement in the value of the instrument used as a hedge.
Liabilities
Deposits by banks and customers
SFAS 107 states that the fair value of deposit liabilities payable on demand is equal to the carrying value. However, given the long term and continuing nature of the relationships with Abbey's customers, the Directors believe there is significant value to Abbey in this source of funds.
Debt securities in issue and subordinated liabilities
Where reliable prices are available the fair value of debt securities in issue and subordinated liabilities has been calculated using quoted market prices. In other cases, market values have been determined using in-house pricing models, or stated at amortised cost.
Financial commitments and contingent liabilities
The Directors believe that, given the lack of an established market, the diversity of fee structures and the estimation required to separate the value of the instruments from the value of the overall transaction, it is generally difficult to estimate the fair value of financial commitments and contingent liabilities. These are therefore excluded from the above table. However, since the majority of these are at floating rates the book value may be a reasonable approximation to fair value.
Off-balance sheet derivative financial instruments
Abbey uses various market-related off-balance sheet financial instruments. The fair value of these instruments is measured as the sum of positive and negative fair values at the balance sheet date, which is estimated using market prices where available or pricing models consistent with standard market practice.
65. Consolidating financial information
Abbey National Treasury Services is a wholly owned subsidiary of Abbey National plc and is able to offer and sell certain securities in the US from time to time pursuant to a registration statement on Form F-3 filed with the SEC (the "Registration Statement"). Abbey National plc has fully and unconditionally guaranteed the obligations of Abbey National Treasury Services that have been, or will be incurred before 31 July 2004: this guarantee includes all securities issued by Abbey National Treasury Services pursuant to the Registration Statement.
The information below has been prepared in accordance with UK GAAP, based on the requirements of the SEC's Rule 3.10 of Regulation S-X. Cash flow information relates solely to third party cash flows; Abbey does not maintain accounting records of cash flows on an individual company basis as such information is not required to be presented under UK GAAP. Reconciliations to determine intercompany cash flows are not practicable.
This information is presented for: (i) Abbey National plc, on a stand-alone basis as guarantor ("The Company"); (ii) Abbey National Treasury Services plc, on a stand-alone basis; (iii) other non-guarantor subsidiaries of The Company and Abbey National Treasury Services on a combined basis ("Other"); (iv) consolidation adjustments ("Adjustments"); and (v) total consolidated amounts ("Consolidated"). The Company and Abbey National Treasury Services columns present investments in their subsidiaries under the equity method.
| | |
| 184 | Abbey Annual Report and Accounts 2003 |
Back to Contents
Financial Statements
Notes to the Financial Statementscontinued
UK GAAP
Profit and loss accounts
| | | | Abbey National | | | | | | | |
| | | | Treasury | | | | | | | |
| | The Company | | Services | | Other | | Adjustments | | Consolidated | |
| For the year ended 31 December 2003 | £m | | £m | | £m | | £m | | £m | |
|
|
|
|
|
|
|
|
|
| |
| Net interest income | 1,330 | | 104 | | 704 | | 10 | | 2,148 | |
|
|
|
|
|
|
|
|
|
| |
| Fees, commissions and other income | 1,109 | | 185 | | 68 | | (977 | ) | 385 | |
|
|
|
|
|
|
|
|
|
| |
| Total operating income | 2,439 | | 289 | | 772 | | (967 | ) | 2,533 | |
|
|
|
|
|
|
|
|
|
| |
| Operating expenses excluding operating lease depreciation | (1,677 | ) | (695 | ) | (42 | ) | 217 | | (2,197 | ) |
|
|
|
|
|
|
|
|
|
| |
| Depreciation on operating lease assets | – | | – | | (251 | ) | – | | (251 | ) |
|
|
|
|
|
|
|
|
|
| |
| Provisions | (886 | ) | (198 | ) | (364 | ) | 677 | | (771 | ) |
|
|
|
|
|
|
|
|
|
| |
| Operating (loss)/profit on ordinary activities before tax | (124 | ) | (604 | ) | 115 | | (73 | ) | (686 | ) |
|
|
|
|
|
|
|
|
|
| |
| Tax on (loss)/profit on ordinary activities | (43 | ) | 188 | | (83 | ) | (20 | ) | 42 | |
|
|
|
|
|
|
|
|
|
| |
| (Loss)/profit on ordinary activities after tax | (167 | ) | (416 | ) | 32 | | (93 | ) | (644 | ) |
|
|
|
|
|
|
|
|
|
| |
| Minority interests – non-equity | – | | – | | (55 | ) | – | | (55 | ) |
|
|
|
|
|
|
|
|
|
| |
| Loss for the financial year attributable to the shareholders of Abbey National plc | (167 | ) | (416 | ) | (23 | ) | (93 | ) | (699 | ) |
|
|
|
|
|
|
|
|
|
| |
| Transfer from non-distributable reserve | – | | – | | – | | (200 | ) | (200 | ) |
|
|
|
|
|
|
|
|
|
| |
| Dividends including amounts attributable to non-equity interests | (424 | ) | 91 | | (569 | ) | 478 | | (424 | ) |
|
|
|
|
|
|
|
|
|
| |
| Retained loss for the year | (591 | ) | (325 | ) | (592 | ) | 185 | | (1,323 | ) |
|
|
|
|
|
|
|
|
|
| |
| | | | | | | | | | | |
| For the year ended 31 December 2002 | | | | | | | | | | |
|
|
|
|
|
|
|
|
|
| |
| Net interest income | 1,242 | | 344 | | 1,095 | | 8 | | 2,689 | |
|
|
|
|
|
|
|
|
|
| |
| Fees, commissions and other income | 1,337 | | 245 | | 230 | | (936 | ) | 876 | |
|
|
|
|
|
|
|
|
|
| |
| Total operating income | 2,579 | | 589 | | 1,325 | | (928 | ) | 3,565 | |
|
|
|
|
|
|
|
|
|
| |
| Operating expenses excluding operating lease depreciation | (1,485 | ) | (171 | ) | (1,401 | ) | (100 | ) | (3,157 | ) |
|
|
|
|
|
|
|
|
|
| |
| Depreciation on operating lease assets | – | | – | | (280 | ) | – | | (280 | ) |
|
|
|
|
|
|
|
|
|
| |
| Provisions | (1,494 | ) | (656 | ) | (261 | ) | 1,336 | | (1,075 | ) |
|
|
|
|
|
|
|
|
|
| |
| Operating (loss)/profit on ordinary activities before tax | (400 | ) | (238 | ) | (617 | ) | 308 | | (947 | ) |
|
|
|
|
|
|
|
|
|
| |
| Tax on (loss)/profit on ordinary activities | (97 | ) | 101 | | (237 | ) | 81 | | (152 | ) |
|
|
|
|
|
|
|
|
|
| |
| (Loss)/profit on ordinary activities after tax | (497 | ) | (137 | ) | (854 | ) | 389 | | (1,099 | ) |
|
|
|
|
|
|
|
|
|
| |
| Minority interests – non-equity | – | | – | | (60 | ) | (2 | ) | (62 | ) |
|
|
|
|
|
|
|
|
|
| |
| (Loss)/profit for the financial year attributable to the shareholders of Abbey National plc | (497 | ) | (137 | ) | (914 | ) | 387 | | (1,161 | ) |
|
|
|
|
|
|
|
|
|
| |
| Transfer from non-distributable reserve | – | | – | | – | | 263 | | 263 | |
|
|
|
|
|
|
|
|
|
| |
| Dividends including amounts attributable to non-equity interests | (424 | ) | (449 | ) | (309 | ) | 758 | | (424 | ) |
|
|
|
|
|
|
|
|
|
| |
| Retained (loss)/profit for the year | (921 | ) | (586 | ) | (1,223 | ) | 1,408 | | (1,322 | ) |
|
|
|
|
|
|
|
|
|
| |
| | | | | | | | | | | |
| For the year ended 31 December 2001 | | | | | | | | | | |
|
|
|
|
|
|
|
|
|
| |
| Net interest income | 1,345 | | 312 | | 1,031 | | 4 | | 2,692 | |
|
|
|
|
|
|
|
|
|
| |
| Fees, commissions and other income | 1,583 | | 512 | | (24 | ) | (671 | ) | 1,400 | |
|
|
|
|
|
|
|
|
|
| |
| Total operating income | 2,928 | | 824 | | 1,007 | | (667 | ) | 4,092 | |
|
|
|
|
|
|
|
|
|
| |
| Operating expenses excluding operating lease depreciation | (1,277 | ) | (158 | ) | (586 | ) | 165 | | (1,856 | ) |
|
|
|
|
|
|
|
|
|
| |
| Depreciation on operating lease assets | – | | – | | (256 | ) | – | | (256 | ) |
|
|
|
|
|
|
|
|
|
| |
| Provisions | (121 | ) | (245 | ) | (173 | ) | 29 | | (510 | ) |
|
|
|
|
|
|
|
|
|
| |
| Operating profit/(loss) on ordinary activities before tax | 1,530 | | 421 | | (8 | ) | (473 | ) | 1,470 | |
|
|
|
|
|
|
|
|
|
| |
| Tax on (loss)/profit on ordinary activities | (182 | ) | (74 | ) | (91 | ) | (117 | ) | (464 | ) |
|
|
|
|
|
|
|
|
|
| |
| Profit/(loss) on ordinary activities after tax | 1,348 | | 347 | | (99 | ) | (590 | ) | 1,006 | |
|
|
|
|
|
|
|
|
|
| |
| Minority interests – non-equity | – | | – | | (62 | ) | 3 | | (59 | ) |
|
|
|
|
|
|
|
|
|
| |
| Profit for the financial year attributable to the shareholders of Abbey National plc | 1,348 | | 347 | | (161 | ) | (587 | ) | 947 | |
|
|
|
|
|
|
|
|
|
| |
| Transferfrom non-distributable reserve | – | | – | | 328 | | (167 | ) | 161 | |
|
|
|
|
|
|
|
|
|
| |
| Dividends including amounts attributable to non-equity interests | (762 | ) | (600 | ) | (376 | ) | 976 | | (762 | ) |
|
|
|
|
|
|
|
|
|
| |
| Retained profit/(loss) for the year | 586 | | (253 | ) | (209 | ) | 222 | | 346 | |
|
|
|
|
|
|
|
|
|
| |
| Abbey Annual Report and Accounts 2003 | 185 |
Back to Contents
Financial Statements
Notes to the Financial Statementscontinued
UK GAAP
Balance sheets
| | | | | | | | | | | |
| | | | Abbey National | | | | | | | |
| | | | Treasury | | | | | | | |
| | The Company | | Services | | Other | | Adjustments | | Consolidated | |
| At 31 December 2003 | £m | | £m | | £m | | £m | | £m | |
|
|
|
|
|
|
|
|
|
| |
| Assets | | | | | | | | | | |
|
|
|
|
|
|
|
|
|
| |
| Cash, treasury bills and other eligible bills | 417 | | 234 | | 1,419 | | – | | 2,070 | |
|
|
|
|
|
|
|
|
|
| |
| Loans and advances to banks | 4,218 | | 16,977 | | 19,386 | | (33,426 | ) | 7,155 | |
|
|
|
|
|
|
|
|
|
| |
| Loans and advances to customers | 76,070 | | 18,525 | | 15,732 | | (16,488 | ) | 93,839 | |
|
|
|
|
|
|
|
|
|
| |
| Net investment in finance leases | 18 | | – | | 2,535 | | 20 | | 2,573 | |
|
|
|
|
|
|
|
|
|
| |
| Securities and investments | 482 | | 14,399 | | 18,945 | | (1,865 | ) | 31,961 | |
|
|
|
|
|
|
|
|
|
| |
| Long Term Assurance business | – | | – | | – | | 2,272 | | 2,272 | |
|
|
|
|
|
|
|
|
|
| |
| Intangible fixed assets | – | | – | | 341 | | – | | 341 | |
|
|
|
|
|
|
|
|
|
| |
| Tangible fixed assets excluding operating lease assets | 239 | | 3 | | 157 | | (131 | ) | 268 | |
|
|
|
|
|
|
|
|
|
| |
| Operating lease assets | – | | – | | 2,529 | | – | | 2,529 | |
|
|
|
|
|
|
|
|
|
| |
| Other assets | 1,534 | | 3,631 | | 639 | | (373 | ) | 5,431 | |
|
|
|
|
|
|
|
|
|
| |
| Shares in group undertakings | 8,171 | | 2,704 | | 1,658 | | (12,533 | ) | – | |
|
|
|
|
|
|
|
|
|
| |
| Assets of Long Term Assurance Funds | – | | – | | 30,978 | | (2,642 | ) | 28,336 | |
|
|
|
|
|
|
|
|
|
| |
| Total assets | 91,149 | | 56,473 | | 94,319 | | (65,166 | ) | 176,775 | |
|
|
|
|
|
|
|
|
|
| |
| | | | | | | | | | | |
| Liabilities | | | | | | | | | | |
|
|
|
|
|
|
|
|
|
| |
| Deposits by banks | 18,780 | | 14,726 | | 18,667 | | (30,048 | ) | 22,125 | |
|
|
|
|
|
|
|
|
|
| |
| Customer accounts | 57,900 | | 9,782 | | 12,227 | | (5,508 | ) | 74,401 | |
|
|
|
|
|
|
|
|
|
| |
| Debt securities in issue | 4 | | 22,882 | | 16,430 | | (14,482 | ) | 24,834 | |
|
|
|
|
|
|
|
|
|
| |
| Other liabilities | 2,198 | | 6,635 | | 5,794 | | (512 | ) | 14,115 | |
|
|
|
|
|
|
|
|
|
| |
| Subordinated liabilities including convertible debt | 7,431 | | 332 | | 1,173 | | (1,857 | ) | 7,079 | |
|
|
|
|
|
|
|
|
|
| |
| Liabilities of Long Term Assurance Funds | – | | – | | 30,978 | | (2,642 | ) | 28,336 | |
|
|
|
|
|
|
|
|
|
| |
| | 86,313 | | 54,357 | | 85,269 | | (55,049 | ) | 170,890 | |
|
|
|
|
|
|
|
|
|
| |
| Minority interests – non-equity | – | | – | | 560 | | (6 | ) | 554 | |
|
|
|
|
|
|
|
|
|
| |
| Non-equity shareholders’ funds | 632 | | – | | (1,768 | ) | 1,768 | | 632 | |
|
|
|
|
|
|
|
|
|
| |
| Equity Shareholders’ Funds | 4,204 | | 2,116 | | 10,258 | | (11,879 | ) | 4,699 | |
|
|
|
|
|
|
|
|
|
| |
| Total liabilities | 91,149 | | 56,473 | | 94,319 | | (65,166 | ) | 176,775 | |
|
|
|
|
|
|
|
|
|
| |
| | | | | | | | | | | |
| At 31 December 2002 | | | | | | | | | | |
|
|
|
|
|
|
|
|
|
| |
| Assets | | | | | | | | | | |
|
|
|
|
|
|
|
|
|
| |
| Cash, treasury bills and other eligible bills | 356 | | 244 | | 1,279 | | – | | 1,879 | |
|
|
|
|
|
|
|
|
|
| |
| Loans and advances to banks | 4,716 | | 18,424 | | 13,816 | | (30,355 | ) | 6,601 | |
|
|
|
|
|
|
|
|
|
| |
| Loans and advances to customers | 69,172 | | 19,917 | | 17,641 | | (16,307 | ) | 90,423 | |
|
|
|
|
|
|
|
|
|
| |
| Net investment in finance leases | 13 | | – | | 3,499 | | (65 | ) | 3,447 | |
|
|
|
|
|
|
|
|
|
| |
| Securities and investments | 1,396 | | 38,694 | | 23,629 | | (2,949 | ) | 60,770 | |
|
|
|
|
|
|
|
|
|
| |
| Long Term Assurance business | – | | – | | 2,316 | | – | | 2,316 | |
|
|
|
|
|
|
|
|
|
| |
| Intangible fixed assets | – | | – | | 362 | | 14 | | 376 | |
|
|
|
|
|
|
|
|
|
| |
| Tangible fixed assets excluding operating lease assets | 304 | | 14 | | 192 | | (139 | ) | 371 | |
|
|
|
|
|
|
|
|
|
| |
| Operating lease assets | – | | – | | 2,573 | | – | | 2,573 | |
|
|
|
|
|
|
|
|
|
| |
| Other assets | 1,360 | | 5,912 | | 88 | | (333 | ) | 7,027 | |
|
|
|
|
|
|
|
|
|
| |
| Shares in group undertakings | 7,545 | | 2,712 | | 1,444 | | (1,701) | | – | |
|
|
|
|
|
|
|
|
|
| |
| Assets of Long Term Assurance Funds | – | | – | | 32,120 | | (2,709 | ) | 29,411 | |
|
|
|
|
|
|
|
|
|
| |
| Total assets | 84,862 | | 85,917 | | 98,959 | | (64,544 | ) | 205,194 | |
|
|
|
|
|
|
|
|
|
| |
| | | | | | | | | | | |
| Liabilities | | | | | | | | | | |
|
|
|
|
|
|
|
|
|
| |
| Deposits by banks | 14,307 | | 18,231 | | 20,287 | | (28,651 | ) | 24,174 | |
|
|
|
|
|
|
|
|
|
| |
| Customer accounts | 55,444 | | 17,768 | | 5,828 | | (2,274 | ) | 76,766 | |
|
|
|
|
|
|
|
|
|
| |
| Debt securities in issue | 4 | | 39,293 | | 23,852 | | (15,070 | ) | 48,079 | |
|
|
|
|
|
|
|
|
|
| |
| Other liabilities | 1,856 | | 6,958 | | 4,135 | | (465 | ) | 12,484 | |
|
|
|
|
|
|
|
|
|
| |
| Subordinated liabilities including convertible debt | 7,730 | | 1,227 | | 1,257 | | (2,911 | ) | 7,303 | |
|
|
|
|
|
|
|
|
|
| |
| Liabilities of Long Term Assurance Funds | – | | – | | 32,120 | | (2,709 | ) | 29,411 | |
|
|
|
|
|
|
|
|
|
| |
| | 79,341 | | 83,477 | | 87,479 | | (52,080 | ) | 198,217 | |
|
|
|
|
|
|
|
|
|
| |
| Minority interests – non-equity | – | | – | | 635 | | (8 | ) | 627 | |
|
|
|
|
|
|
|
|
|
| |
| Non-equity shareholders’ funds | 748 | | – | | (9 | ) | 9 | | 748 | |
|
|
|
|
|
|
|
|
|
| |
| Equity shareholders’ funds | 4,773 | | 2,440 | | 10,854 | | 12,465 | | 5,602 | |
|
|
|
|
|
|
|
|
|
| |
| Total liabilities | 84,862 | | 85,917 | | 98,959 | | 64,544 | | 205,194 | |
|
|
|
|
|
|
|
|
|
| |
| 186 | Abbey Annual Report and Accounts 2003 |
Back to Contents
Financial Statements
Notes to the Financial Statementscontinued
US GAAP reconciliations
| | | | Abbey | | | | | | | |
| | | | National | | | | | | | |
| | | | Treasury | | | | | | | |
| | The Company | | Services | | Other | | Adjustments | | Consolidated | |
| 2003 | £m | | £m | | £m | | £m | | £m | |
|
|
|
|
|
|
|
|
|
| |
| Income statement | | | | | | | | | | |
|
|
|
|
|
|
|
|
|
| |
| Loss attributable to the shareholders – UK GAAP | (167 | ) | (416 | ) | (116 | ) | – | | (699 | ) |
|
|
|
|
|
|
|
|
|
| |
| Dividends on preference shares | (60 | ) | – | | – | | – | | (60 | ) |
|
|
|
|
|
|
|
|
|
| |
| US GAAP adjustments: | (227 | ) | (416 | ) | (116 | ) | – | | (759 | ) |
|
|
|
|
|
|
|
|
|
| |
| Goodwill | – | | – | | (168 | ) | – | | (168 | ) |
|
|
|
|
|
|
|
|
|
| |
| Other intangible assets | – | | – | | (53 | ) | – | | (53 | ) |
|
|
|
|
|
|
|
|
|
| |
| Computer software | 29 | | 4 | | (8 | ) | – | | 25 | |
|
|
|
|
|
|
|
|
|
| |
| Depreciation | (44 | ) | (17 | ) | (6 | ) | – | | (67 | ) |
|
|
|
|
|
|
|
|
|
| |
| Pensions cost | (5 | ) | – | | (2 | ) | – | | (7 | ) |
|
|
|
|
|
|
|
|
|
| |
| Securitisation | 49 | | – | | – | | – | | 49 | |
|
|
|
|
|
|
|
|
|
| |
| Shareholders’ interest in Long Term Assurance business | – | | – | | 343 | | – | | 343 | |
|
|
|
|
|
|
|
|
|
| |
| Loan origination fees | 113 | | 30 | | – | | – | | 143 | |
|
|
|
|
|
|
|
|
|
| |
| Securities and investment | | | | | | | | | | |
|
|
|
|
|
|
|
|
|
| |
| Other | (2 | ) | 19 | | 10 | | – | | 27 | |
|
|
|
|
|
|
|
|
|
| |
| Derivatives and hedging activities | (25 | ) | 300 | | 28 | | – | | 303 | |
|
|
|
|
|
|
|
|
|
| |
| Tax effect on above adjustments | 110 | | (100 | ) | 23 | | – | | 33 | |
|
|
|
|
|
|
|
|
|
| |
| Net (loss) income available to ordinary | | | | | | | | | | |
| shareholders – US GAAP | (2 | ) | (180 | ) | 51 | | – | | (131 | ) |
|
|
|
|
|
|
|
|
|
| |
| | | | | | | | | | | |
| Shareholders’ funds | | | | | | | | | | |
|
|
|
|
|
|
|
|
|
| |
| Shareholders’ funds including non-equity interests – UK GAAP | 5,331 | | 2,116 | | (2,116 | ) | – | | 5,331 | |
|
|
|
|
|
|
|
|
|
| |
| Goodwill | 467 | | 69 | | 137 | | – | | 673 | |
|
|
|
|
|
|
|
|
|
| |
| Other intangible assets | – | | – | | 251 | | – | | 251 | |
|
|
|
|
|
|
|
|
|
| |
| Computer software | 67 | | 15 | | 35 | | – | | 117 | |
|
|
|
|
|
|
|
|
|
| |
| Pensions cost | (352 | ) | (15 | ) | (97 | ) | – | | (464 | ) |
|
|
|
|
|
|
|
|
|
| |
| Securitisation | 364 | | – | | – | | – | | 364 | |
|
|
|
|
|
|
|
|
|
| |
| Shareholders’ interest in Long Term Assurance business | – | | – | | (971 | ) | – | | (971 | ) |
|
|
|
|
|
|
|
|
|
| |
| Other | (83 | ) | (56 | ) | (1 | ) | – | | (140 | ) |
|
|
|
|
|
|
|
|
|
| |
| Derivatives and hedging activities | 382 | | (213 | ) | (17 | ) | – | | 152 | |
|
|
|
|
|
|
|
|
|
| |
| Loan origination fees | 473 | | (120 | ) | – | | – | | 353 | |
|
|
|
|
|
|
|
|
|
| |
| Securities and Investments | – | | 89 | | – | | – | | 89 | |
|
|
|
|
|
|
|
|
|
| |
| Dividend payable | 242 | | – | | – | | – | | 242 | |
|
|
|
|
|
|
|
|
|
| |
| Tax effect on the above adjustments | 56 | | – | | 45 | | – | | 101 | |
|
|
|
|
|
|
|
|
|
| |
| Deferred tax | – | | – | | (66 | ) | – | | (66 | ) |
|
|
|
|
|
|
|
|
|
| |
| Shareholders’ funds – US GAAP | 6,947 | | 1,885 | | (2,800 | ) | – | | 6,032 | |
|
|
|
|
|
|
|
|
|
| |
| | | | | | | | | | | |
| 2002 | | | | | | | | | | |
|
|
|
|
|
|
|
|
|
| |
| Income statement | | | | | | | | | | |
|
|
|
|
|
|
|
|
|
| |
| Loss attributable to the shareholders – UK GAAP | (497 | ) | (137 | ) | (527 | ) | – | | (1,161) | |
|
|
|
|
|
|
|
|
|
| |
| Dividends on preference shares | (62 | ) | – | | – | | – | | (62 | ) |
|
|
|
|
|
|
|
|
|
| |
| | (559 | ) | (137 | ) | (527 | ) | – | | (1,223 | ) |
|
|
|
|
|
|
|
|
|
| |
| US GAAP adjustments: | | | | | | | | | | |
|
|
|
|
|
|
|
|
|
| |
| Goodwill | – | | – | | 714 | | – | | 714 | |
|
|
|
|
|
|
|
|
|
| |
| Other intangible assets | (46 | ) | – | | (74 | ) | | | (120 | ) |
|
|
|
|
|
|
|
|
|
| |
| Computer software | 59 | | 8 | | (16 | ) | | | 51 | |
|
|
|
|
|
|
|
|
|
| |
| Depreciation | (30 | ) | (12 | ) | (33 | ) | – | | (75 | ) |
|
|
|
|
|
|
|
|
|
| |
| Pensions cost | (19 | ) | (1 | ) | (8 | ) | – | | (28 | ) |
|
|
|
|
|
|
|
|
|
| |
| Securitisation | 23 | | – | | – | | – | | 23 | |
|
|
|
|
|
|
|
|
|
| |
| Shareholders’ interest in Long Term Assurance business | – | | – | | (673 | ) | – | | (673 | ) |
|
|
|
|
|
|
|
|
|
| |
| Loan origination fees | 137 | | (10 | ) | 2 | | – | | 129 | |
|
|
|
|
|
|
|
|
|
| |
| Other | (106 | ) | 93 | | 41 | | – | | 28 | |
|
|
|
|
|
|
|
|
|
| |
| Derivatives and hedging activities | 108 | | (132 | ) | (114 | ) | – | | (138 | ) |
|
|
|
|
|
|
|
|
|
| |
| Tax effect on above adjustments | 55 | | 16 | | (152 | ) | – | | (81 | ) |
|
|
|
|
|
|
|
|
|
| |
| Earnings before a change in accounting | (378 | ) | (175 | ) | (840 | ) | — | | (1,393 | ) |
|
|
|
|
|
|
|
|
|
| |
| Cumulative effect of a change in accounting principle | – | | – | | – | | – | | – | |
|
|
|
|
|
|
|
|
|
| |
| Net (loss) income available to ordinary shareholders – US GAAP | (378 | ) | (175 | ) | (840 | ) | – | | (1,393 | ) |
|
|
|
|
|
|
|
|
|
| |
| Abbey Annual Report and Accounts 2003 | 187 |
Back to Contents
Financial Statements
Notes to the Financial Statements continued
| Shareholders' funds | | | Abbey National | | | | | | | |
| | Treasury | | | |
| The Company | Services | Other | Adjustments | Consolidated |
| £m | £m | £m | £m | £m |
|
|
|
|
|
|
|
|
|
| |
| Shareholders’ funds including non-equity interests – UK GAAP | 6,350 | | 2,626 | | (2,626 | ) | – | | 6,350 | |
|
|
|
|
|
|
|
|
|
| |
| Goodwill | 467 | | 70 | | 309 | | – | | 846 | |
|
|
|
|
|
|
|
|
|
| |
| Other intangible assets | 26 | | – | | 278 | | – | | 304 | |
|
|
|
|
|
|
|
|
|
| |
| Computer software | 39 | | 28 | | 92 | | – | | 159 | |
|
|
|
|
|
|
|
|
|
| |
| Pensions cost | (304 | ) | (12 | ) | (123 | ) | – | | (439 | ) |
|
|
|
|
|
|
|
|
|
| |
| Securitisation | 219 | | – | | – | | – | | 219 | |
|
|
|
|
|
|
|
|
|
| |
| Shareholders’ interest in Long Term Assurance business | – | | – | | (1,284 | ) | – | | (1,284 | ) |
|
|
|
|
|
|
|
|
|
| |
| Other | (92 | ) | (87 | ) | (15 | ) | – | | (194 | ) |
|
|
|
|
|
|
|
|
|
| |
| Derivatives and hedging activities | 232 | | (559 | ) | (83 | ) | – | | (410 | ) |
|
|
|
|
|
|
|
|
|
| |
| Loan origination fees | 360 | | (138 | ) | (12 | ) | – | | 210 | |
|
|
|
|
|
|
|
|
|
| |
| Securities and Investments | – | | – | | 137 | | – | | 137 | |
|
|
|
|
|
|
|
|
|
| |
| Dividend payable | 107 | | – | | – | | – | | 107 | |
|
|
|
|
|
|
|
|
|
| |
| Tax effect on the above adjustments | 35 | | 263 | | (66 | ) | – | | 232 | |
|
|
|
|
|
|
|
|
|
| |
| Deferred tax | – | | – | | (147 | ) | – | | (147 | ) |
|
|
|
|
|
|
|
|
|
| |
| Shareholders’ funds – US GAAP | 7,439 | | 2,191 | | (3,540 | ) | – | | 6,090 | |
|
|
|
|
|
|
|
|
|
| |
| 2001 | | | | | | | | | | |
| | Abbey National | | | |
| | Treasury | | | |
| The Company | Services | Other | Adjustments | Consolidated |
| £m | £m | £m | £m | £m |
|
|
|
|
|
|
|
|
|
| |
| Income statement | | | | | | | | | | |
|
|
|
|
|
|
|
|
|
| |
| Profit attributable to the shareholders – UK GAAP | (1,348 | ) | (347 | ) | 2,642 | | – | | 947 | |
|
|
|
|
|
|
|
|
|
| |
| Dividends on preference shares | (42 | ) | – | | – | | – | | (42 | ) |
|
|
|
|
|
|
|
|
|
| |
| | (1,390 | ) | (347 | ) | 2,642 | | – | | 905 | |
|
|
|
|
|
|
|
|
|
| |
| US GAAP adjustments: | | | | | | | | | | |
|
|
|
|
|
|
|
|
|
| |
| Goodwill | (33 | ) | – | | 7 | | – | | (26 | ) |
|
|
|
|
|
|
|
|
|
| |
| Other intangible assets | (26 | ) | – | | (25 | ) | | | (51 | ) |
|
|
|
|
|
|
|
|
|
| |
| Computer software | 54 | | 11 | | 16 | | | | 81 | |
|
|
|
|
|
|
|
|
|
| |
| Depreciation | (39 | ) | (8 | ) | (12 | ) | – | | (59 | ) |
|
|
|
|
|
|
|
|
|
| |
| Pensions cost | (26 | ) | (1 | ) | (10 | ) | – | | (37 | ) |
|
|
|
|
|
|
|
|
|
| |
| Securitisation | 144 | | – | | – | | – | | 144 | |
|
|
|
|
|
|
|
|
|
| |
| Shareholders’ interest in Long Term Assurance business | – | | – | | 10 | | – | | 10 | |
|
|
|
|
|
|
|
|
|
| |
| Derivatives and hedging activities | (5 | ) | (90 | ) | (145 | ) | – | | (240 | ) |
|
|
|
|
|
|
|
|
|
| |
| Loan origination fees | 223 | | (58 | ) | – | | – | | 165 | |
|
|
|
|
|
|
|
|
|
| |
| Other | 8 | | (1 | ) | 12 | | – | | 19 | |
|
|
|
|
|
|
|
|
|
| |
| Tax effect on above adjustments | (84 | ) | 44 | | 71 | | – | | 31 | |
|
|
|
|
|
|
|
|
|
| |
| Earnings before a change in accounting principle | (1,174 | ) | (450 | ) | 2,566 | | – | | 942 | |
|
|
|
|
|
|
|
|
|
| |
| Cumulative effect of a change in | | | | | | | | | | |
| accounting principle | – | | 5 | | – | | – | | 5 | |
|
|
|
|
|
|
|
|
|
| |
| Net (loss) income available to ordinary | | | | | | | | | | |
| shareholders – US GAAP | (1,174 | ) | (445 | ) | 2,566 | | – | | 947 | |
|
|
|
|
|
|
|
|
|
| |
| | | | | | | | | | | |
| Shareholders’ funds | | | | | | | | | | |
|
|
|
|
|
|
|
|
|
| |
| Shareholders’ funds including non-equity interests – UK GAAP | 7,521 | | 2,902 | | (2,945 | ) | – | | 7,478 | |
|
|
|
|
|
|
|
|
|
| |
| Goodwill | 289 | | – | | 519 | | – | | 808 | |
|
|
|
|
|
|
|
|
|
| |
| Other intangible assets | 72 | | – | | 93 | | – | | 165 | |
|
|
|
|
|
|
|
|
|
| |
| Computer software | 111 | | 25 | | 19 | | – | | 155 | |
|
|
|
|
|
|
|
|
|
| |
| Pensions cost | (117 | ) | (4 | ) | (48 | ) | – | | (169 | ) |
|
|
|
|
|
|
|
|
|
| |
| Securitisation | 273 | | – | | – | | – | | 273 | |
|
|
|
|
|
|
|
|
|
| |
| Shareholders’ interest in Long Term Assurance Business | – | | – | | (592 | ) | – | | (592 | ) |
|
|
|
|
|
|
|
|
|
| |
| Other | (26 | ) | (175 | ) | (21 | ) | – | | (222 | ) |
|
|
|
|
|
|
|
|
|
| |
| Derivatives and hedging activities | 156 | | (422 | ) | (6 | ) | – | | (272 | ) |
|
|
|
|
|
|
|
|
|
| |
| Loan origination fees | 223 | | (142 | ) | – | | – | | 81 | |
|
|
|
|
|
|
|
|
|
| |
| Securities and investments | – | | – | | 67 | | – | | 67 | |
|
|
|
|
|
|
|
|
|
| |
| Dividend payable | 478 | | – | | – | | – | | 478 | |
|
|
|
|
|
|
|
|
|
| |
| Tax effect on the above adjustments | (117 | ) | 285 | | 62 | | – | | 230 | |
|
|
|
|
|
|
|
|
|
| |
| Deferred tax | – | | – | | (152 | ) | – | | (152 | ) |
|
|
|
|
|
|
|
|
|
| |
| Shareholders' funds – US GAAP | 8,863 | | 2,469 | | (3,004 | ) | – | | 8,328 | |
|
|
|
|
|
|
|
|
|
| |
| | | |
| 188 | Abbey Annual Report and Accounts 2003 |
Back to Contents
Financial Statements
Notes to the Financial Statements continued
UK GAAP
Cash flow statements | | | | | | | | | | |
| For the year ended 31 December 2003 | | | | | | | | | | |
| | Abbey National | | | |
| | Treasury | | | |
| The Company | Services | Other | Adjustments | Consolidated |
| £m | £m | £m | £m | £m |
|
|
|
|
|
|
|
|
|
| |
| Net cash inflow from operating activities | (2,993 | ) | (21,547 | ) | (8,138 | ) | – | | (32,678 | ) |
|
|
|
|
|
|
|
|
|
| |
| Net cash outflow from returns on investment and servicing of finance | (284 | ) | – | | (88 | ) | – | | (372 | ) |
|
|
|
|
|
|
|
|
|
| |
| Total taxation paid | (145 | ) | 54 | | (8 | ) | – | | (99 | ) |
|
|
|
|
|
|
|
|
|
| |
| Net cash outflow from capital expenditure and financial investment | 499 | | (408 | ) | 25,098 | | – | | 25,189 | |
|
|
|
|
|
|
|
|
|
| |
| Acquisitions and disposals | 3,320 | | 22,570 | | (17,087 | ) | – | | 8,803 | |
|
|
|
|
|
|
|
|
|
| |
| Equity dividends paid | (216 | ) | 91 | | (91 | ) | – | | (216 | ) |
|
|
|
|
|
|
|
|
|
| |
| Net cash (outflow) inflow before financing | 181 | | 760 | | (314 | ) | – | | 627 | |
|
|
|
|
|
|
|
|
|
| |
| Net cash inflow from financing | (122 | ) | (760 | ) | 689 | | – | | (193 | ) |
|
|
|
|
|
|
|
|
|
| |
| (Decrease)/increase in cash | 59 | | – | | 375 | | – | | 434 | |
|
|
|
|
|
|
|
|
|
| |
| | | | | | | | | | | |
| For the year ended 31 December 2002 | | | | | | | | | | |
|
|
|
|
|
|
|
|
|
| |
| Net cash inflow from operating activities | 1,298 | | (2,024 | ) | (10,226 | ) | – | | (10,952 | ) |
|
|
|
|
|
|
|
|
|
| |
| Net cash outflow from returns on investment and servicing of finance | (292 | ) | (86 | ) | (84 | ) | – | | (462 | ) |
|
|
|
|
|
|
|
|
|
| |
| Total taxation paid | (143 | ) | (43 | ) | (310 | ) | – | | (496 | ) |
|
|
|
|
|
|
|
|
|
| |
| Net cash outflow from capital expenditure and financial investment | (900 | ) | 4,895 | | 5,560 | | – | | 9,555 | |
|
|
|
|
|
|
|
|
|
| |
| Acquisitions and disposals | (48 | ) | – | | (488 | ) | – | | (536 | ) |
|
|
|
|
|
|
|
|
|
| |
| Equity dividends paid | (648 | ) | (449 | ) | 449 | | – | | (648 | ) |
|
|
|
|
|
|
|
|
|
| |
| Net cash (outflow) inflow before financing | (733 | ) | 2,293 | | (5,099 | ) | – | | (3,539 | ) |
|
|
|
|
|
|
|
|
|
| |
| Net cash inflow from financing | 626 | | 110 | | (49 | ) | – | | 687 | |
|
|
|
|
|
|
|
|
|
| |
| (Decrease)/increase in cash | (107 | ) | 2,403 | | (5,148 | ) | – | | (2,852 | ) |
|
|
|
|
|
|
|
|
|
| |
| | | | | | | | | | | |
| For the year ended 31 December 2001 | | | | | | | | | | |
|
|
|
|
|
|
|
|
|
| |
| Net cash inflow from operating activities | 3,029 | | 234 | | (1,523 | ) | – | | 1,740 | |
|
|
|
|
|
|
|
|
|
| |
| Net cash outflow from returns on investment and servicing of finance | (289 | ) | (72 | ) | (63 | ) | – | | (424 | ) |
|
|
|
|
|
|
|
|
|
| |
| Total taxation paid | (229 | ) | (235 | ) | 18 | | – | | (446 | ) |
|
|
|
|
|
|
|
|
|
| |
| Net cash outflow from capital expenditure and financial investment | (3,031 | ) | (334 | ) | 2,098 | | – | | (1,267 | ) |
|
|
|
|
|
|
|
|
|
| |
| Acquisitions and disposals | (16 | ) | – | | (355 | ) | – | | (371 | ) |
|
|
|
|
|
|
|
|
|
| |
| Equity dividends paid | (570 | ) | (600 | ) | 600 | | – | | (570 | ) |
|
|
|
|
|
|
|
|
|
| |
| Net cash (outflow) inflow before financing | (1,106) | | (1,007 | ) | 775 | | – | | (1,338 | ) |
|
|
|
|
|
|
|
|
|
| |
| Net cash inflow from financing | 1,042 | | 1,016 | | (750 | ) | – | | 1,308 | |
|
|
|
|
|
|
|
|
|
| |
| (Decrease)/increase in cash | (64 | ) | 9 | | 25 | | – | | (30 | ) |
|
|
|
|
|
|
|
|
|
| |
| | | |
| Abbey Annual Report and Accounts 2003 | 189 |
Back to Contents
Financial Statements
Five Year Record
The financial information set forth below for the twelve month periods ended 31 December 2003, 2002 and 2001, and as at 31 December 2003 and 2002 has been derived from the consolidated financial statements of the Group included elsewhere in this Annual Report. The information should be read in connection with, and is qualified in its entirety by reference to, the Group’s consolidated financial statements and the notes thereto. Financial information set forth below for the twelve month periods ended 31 December 2000 and 1999, and as at 31 December 2001, 2000 and 1999, has been derived from the audited consolidated financial statements of the Group for 2001, 2000 and 1999. The financial information in this selected consolidated financial and statistical data does not constitute statutory accounts within the meaning of the Companies Act 1985. The auditors’ report in the financial statements for each of the five years ended 31 December 2003 was unqualified and did not include a statement under sections 237(2) and 237(3) of the Companies Act 1985. The consolidated financial statements of the Group, for the years ended 31 December 2003, 2002, 2001, 2000 and 1999, were audited by Deloitte & Touche, independent accountants. The Group’s consolidated financial statements included elsewhere in this Annual Report have been prepared in accordance with UK GAAP, which differ in certain significant respects from US GAAP. Certain significant differences between UK GAAP and US GAAP are discussed in note 58 to the consolidated financial statements, and notes 61 and 62 to the consolidated financial statements includes reconciliations of certain amounts calculated in accordance with UK GAAP to US GAAP.
Profit and loss accounts
| | | | | | 2002 | ) | | | | | | |
| 2003 | 2003 | (restated | 2001 | 2000 | 1999 |
| $m | £m | £m | £m | £m | £m |
|
|
|
|
|
|
|
|
|
|
|
| |
| Net interest income (3, 7) | 3,832 | | 2,148 | | 2,689 | | 2,692 | | 2,680 | | 2,661 | |
|
|
|
|
|
|
|
|
|
|
|
| |
| Fees, commissions and other income (3, 4) | 687 | | 385 | | 876 | | 1,400 | | 1,512 | | 1,147 | |
|
|
|
|
|
|
|
|
|
|
|
| |
| Total operating income | 4,519 | | 2,533 | | 3,565 | | 4,092 | | 4,192 | | 3,808 | |
|
|
|
|
|
|
|
|
|
|
|
| |
| Operating expenses excluding impairment of goodwill and | | | | | | | | | | | | |
| operating lease depreciation(10) | (3,888 | ) | (2,179 | ) | (2,019 | ) | (1,856 | ) | (1,819 | ) | (1,597 | ) |
|
|
|
|
|
|
|
|
|
|
|
| |
| Impairment of goodwill | (32 | ) | (18 | ) | (1,138) | | – | | – | | – | |
|
|
|
|
|
|
|
|
|
|
|
| |
| Depreciation on operating lease assets(4) | (448 | ) | (251 | ) | (280 | ) | (256 | ) | (178 | ) | (52 | ) |
|
|
|
|
|
|
|
|
|
|
|
| |
| Provisions | (1,376 | ) | (771 | ) | (1,075 | ) | (510 | ) | (326 | ) | (352 | ) |
|
|
|
|
|
|
|
|
|
|
|
| |
| Operating (loss) profit and (loss) profit on ordinary activities | | | | | | | | | | | | |
| before tax and exceptional items | (1,225 | ) | (686 | ) | (947 | ) | 1,470 | | 1,869 | | 1,807 | |
|
|
|
|
|
|
|
|
|
|
|
| |
| Exceptional items(1) | – | | – | | – | | – | | – | | (27 | ) |
|
|
|
|
|
|
|
|
|
|
|
| |
| (Loss) profit on ordinary activities before tax | (1,225 | ) | (686 | ) | (947 | ) | 1,470 | | 1,869 | | 1,780 | |
|
|
|
|
|
|
|
|
|
|
|
| |
| Tax on (loss) profit on ordinary activities(8) | 75 | | 42 | | (152 | ) | (464 | ) | (513 | ) | (505 | ) |
|
|
|
|
|
|
|
|
|
|
|
| |
| (Loss) profit on ordinary activities after tax | (1,150 | ) | (644 | ) | (1,099 | ) | 1,006 | | 1,356 | | 1,275 | |
|
|
|
|
|
|
|
|
|
|
|
| |
| Minority interests – non-equity | (98 | ) | (55 | ) | (62 | ) | (59 | ) | (51 | ) | – | |
|
|
|
|
|
|
|
|
|
|
|
| |
| (Loss) profit for the financial year attributable to the | | | | | | | | | | | | |
| shareholders of Abbey National plc | (1,248 | ) | (699 | ) | (1,161 | ) | 947 | | 1,305 | | 1,275 | |
|
|
|
|
|
|
|
|
|
|
|
| |
| Transfer(to)from non-distributable reserve | (357 | ) | (200 | ) | 263 | | 161 | | (134 | ) | (13 | ) |
|
|
|
|
|
|
|
|
|
|
|
| |
| Dividends including amounts attributable to non-equity interests | (757 | ) | (424 | ) | (424 | ) | (762 | ) | (687 | ) | (610 | ) |
|
|
|
|
|
|
|
|
|
|
|
| |
| Retained (loss) profit for the year | (2,362 | ) | (1,323 | ) | (1,322 | ) | 346 | | 484 | | 652 | |
|
|
|
|
|
|
|
|
|
|
|
| |
| | | | | | | | | | | | | |
| Selected UK GAAP profit and loss account data | | | | | | | | | | | | |
|
|
|
|
|
|
|
|
|
|
|
| |
| (Loss) earnings per ordinary share (pence and cents) | | | | | | | | | | | | |
|
|
|
|
|
|
|
|
|
|
|
| |
| – basic | (93.5)c | | (54.2 | )p | (84.8 | )p | 63.2 | p | 89.2 | p | 87.2 | p |
|
|
|
|
|
|
|
|
|
|
|
| |
| – diluted | (93.5)c | | (54.2 | )p | (84.3 | )p | 62.8 | p | 88.6 | p | 86.5 | p |
|
|
|
|
|
|
|
|
|
|
|
| |
| Dividends per ordinary share (pence and cents) | | | | | | | | | | | | |
|
|
|
|
|
|
|
|
|
|
|
| |
| – net(5) | 44.60c | | 25.00 | p | 25.00 | p | 50.00 | p | 45.50 | p | 40.25 | p |
|
|
|
|
|
|
|
|
|
|
|
| |
| – gross equivalent(6) | 49.60c | | 27.78 | p | 27.78 | p | 55.56 | p | 50.56 | p | 44.72 | p |
|
|
|
|
|
|
|
|
|
|
|
| |
| Dividend cover (times) | (1.60) | | (1.60 | ) | (2.70 | ) | 1.20 | | 1.90 | | 2.10 | |
|
|
|
|
|
|
|
|
|
|
|
| |
| | | | | | | | | | | | | |
| Selected US GAAP profit and loss account data | | | | | | | | | | | | |
|
|
|
|
|
|
|
|
|
|
|
| |
| (Loss) income from continuing operations(11) | 491 | | 275 | | (662 | ) | 905 | | – | | – | |
|
|
|
|
|
|
|
|
|
|
|
| |
| Net(loss) income available to ordinary shareholders | (234 | ) | (131 | ) | (1,393 | ) | 947 | | 1,175 | | 1,013 | |
|
|
|
|
|
|
|
|
|
|
|
| |
| (Loss) earnings per ordinary share (pence) | | | | | | | | | | | | |
|
|
|
|
|
|
|
|
|
|
|
| |
| – from continuing operations(11) | | | | | | | | | | | | |
|
|
|
|
|
|
|
|
|
|
|
| |
| – basic | 33.9 | c | 19.0 | p | (45.9 | )p | 63.4 | p | – | | – | |
|
|
|
|
|
|
|
|
|
|
|
| |
| – diluted | 33.7 | c | 18.9 | p | (45.9 | )p | 63.4 | p | – | | – | |
|
|
|
|
|
|
|
|
|
|
|
| |
| – from net (loss) income available to ordinary shareholders | | | | | | | | | | | | |
|
|
|
|
|
|
|
|
|
|
|
| |
| – basic | (16.0 | )c | (9.0 | )p | (96.6 | )p | 66.2 | p | 83.2 | p | 71.4 | p |
|
|
|
|
|
|
|
|
|
|
|
| |
| – diluted | (16.0 | )c | (9.0 | )p | (96.6 | )p | 66.1 | p | 82.8 | p | 70.8 | p |
|
|
|
|
|
|
|
|
|
|
|
| |
| | | |
| 190 | | Abbey Annual Report and Accounts 2003 |
Back to Contents
Financial Statements
Five Year Record continued
Balance sheets
| Assets | | | 2002 | ) | 2001 | ) | 2000 | ) | | |
| 2003 | (restated | (restated | (restated | 1999 |
| £m | £m | £m | £m | £m |
|
|
|
|
|
|
|
|
|
| |
| Cash, treasury bills and other eligible bills | 2,070 | | 1,879 | | 2,983 | | 1,596 | | 1,815 | |
|
|
|
|
|
|
|
|
|
| |
| Loans and advances to banks | 7,155 | | 6,601 | | 9,874 | | 12,168 | | 11,472 | |
|
|
|
|
|
|
|
|
|
| |
| Loans and advances to customers before non-recourse finance | 84,488 | | 81,427 | | 78,650 | | 81,752 | | 75,221 | |
|
|
|
|
|
|
|
|
|
| |
| Loans and advances subject to securitisation | 23,833 | | 24,156 | | 18,883 | | 7,927 | | 1,930 | |
|
|
|
|
|
|
|
|
|
| |
| Less: non-returnable finance | (14,482 | ) | (15,160 | ) | (12,952 | ) | (4,629 | ) | (1,379 | ) |
|
|
|
|
|
|
|
|
|
| |
| Loans and advances to customers | 93,839 | | 90,423 | | 84,581 | | 85,050 | | 75,772 | |
|
|
|
|
|
|
|
|
|
| |
| Net investment in finance leases | 2,573 | | 3,447 | | 4,738 | | 5,192 | | 5,441 | |
|
|
|
|
|
|
|
|
|
| |
| Securities and investments | 31,961 | | 60,770 | | 68,673 | | 69,573 | | 59,740 | |
|
|
|
|
|
|
|
|
|
| |
| Long term assurance business(11) | 2,272 | | 2,316 | | 1,662 | | 1,513 | | 1,089 | |
|
|
|
|
|
|
|
|
|
| |
| Intangible fixed assets | 341 | | 376 | | 1,243 | | 245 | | 203 | |
|
|
|
|
|
|
|
|
|
| |
| Tangible fixed assets excluding operating lease assets | 268 | | 371 | | 336 | | 389 | | 759 | |
|
|
|
|
|
|
|
|
|
| |
| Operating lease assets | 2,529 | | 2,573 | | 2,522 | | 1,963 | | 358 | |
|
|
|
|
|
|
|
|
|
| |
| Tangible fixed assets | 2,797 | | 2,944 | | 2,858 | | 2,352 | | 1,117 | |
|
|
|
|
|
|
|
|
|
| |
| Other assets | 5,431 | | 7,027 | | 7,340 | | 7,565 | | 6,703 | |
|
|
|
|
|
|
|
|
|
| |
| Assets of long term assurance funds | 28,336 | | 29,411 | | 30,415 | | 19,083 | | 17,439 | |
|
|
|
|
|
|
|
|
|
| |
| Total assets (2) | 176,775 | | 205,194 | | 214,367 | | 204,337 | | 180,791 | |
|
|
|
|
|
|
|
|
|
| |
| | | | | | | | | | | |
| Liabilities | | | | | | | | | | |
|
|
|
|
|
|
|
|
|
| |
| Deposits by banks | 22,125 | | 24,174 | | 24,945 | | 34,996 | | 29,824 | |
|
|
|
|
|
|
|
|
|
| |
| Customer accounts | 74,401 | | 76,766 | | 75,809 | | 66,795 | | 59,911 | |
|
|
|
|
|
|
|
|
|
| |
| Debt securities in issue | 24,834 | | 48,079 | | 54,413 | | 57,078 | | 51,407 | |
|
|
|
|
|
|
|
|
|
| |
| Other liabilities | 14,115 | | 12,484 | | 13,739 | | 12,978 | | 11,364 | |
|
|
|
|
|
|
|
|
|
| |
| Subordinated liabilities including convertible debt(7) | 7,079 | | 7,303 | | 6,887 | | 5,871 | | 4,641 | |
|
|
|
|
|
|
|
|
|
| |
| Liabilities of long term assurance funds | 28,336 | | 29,411 | | 30,415 | | 19,083 | | 17,439 | |
|
|
|
|
|
|
|
|
|
| |
| | 170,890 | | 198,217 | | 206,208 | | 196,801 | | 174,586 | |
|
|
|
|
|
|
|
|
|
| |
| Minority interests – non-equity | 554 | | 627 | | 681 | | 664 | | – | |
|
|
|
|
|
|
|
|
|
| |
| Non-equity shareholders’ funds(7) | 632 | | 748 | | 748 | | 450 | | 450 | |
|
|
|
|
|
|
|
|
|
| |
| Equity shareholders’ funds | 4,699 | | 5,602 | | 6,730 | | 6,422 | | 5,755 | |
|
|
|
|
|
|
|
|
|
| |
| Total liabilities | 176,775 | | 205,194 | | 214,367 | | 204,337 | | 180,791 | |
|
|
|
|
|
|
|
|
|
| |
| | | | | | | | | | | |
| Selected UK GAAP balance sheet data | | | | | | | | | | |
|
|
|
|
|
|
|
|
|
| |
| Shareholders’ funds | 5,331 | | 6,350 | | 7,478 | | 6,872 | | 6,205 | |
|
|
|
|
|
|
|
|
|
| |
| Book value of equity shareholders’ funds per ordinary share | 321.3 | p | 384.2 | p | 468.3 | p | 450.6 | p | 404.7 | p |
|
|
|
|
|
|
|
|
|
| |
| | | | | | | | | | | |
| Selected US GAAP balance sheet data | | | | | | | | | | |
|
|
|
|
|
|
|
|
|
| |
| Shareholders’ funds | 6,032 | | 6,090 | | 8,328 | | 7,634 | | 6,947 | |
|
|
|
|
|
|
|
|
|
| |
| Book value of equity shareholders’ funds per ordinary share | 369.3 | p | 366.4 | p | 524.1 | p | 501.8 | p | 456.9 | p |
|
|
|
|
|
|
|
|
|
| |
| Number of shares in issue, adjusted for changes in capital (m) | 1,453 | | 1,450 | | 1,440 | | 1,428 | | 1,422 | |
|
|
|
|
|
|
|
|
|
| |
| Total assets | 185,458 | | 188,161 | | 188,689 | | 177,773 | | 158,354 | |
|
|
|
|
|
|
|
|
|
| |
| | |
| (1) | In 1999, costs incurred in preparing Abbey for Year 2000 and Economic and Monetary Union have been treated as exceptional items. |
| | |
(2)
| Prior to 2000, Depreciation on operating lease assets was reported as a charge against income on operating lease assets (within Commissions, fees and other income). Such income continues to be reported within Commissions, fees and other income, however, following an accounting presentation change, Depreciation on operating lease assets is now reported within Operating expenses, but shown as a separate item within that heading because such assets are used for a different purpose to fixed assets used in administrative functions. |
| | |
| | The prior year comparative for the year ended 1999, was restated with the effect being a £52m increase in Commissions, fees and other income. This change results from the application of FRS 15, Tangible fixed assets, which first applied to the financial statements for the year ended 31 December 2000. |
| | |
| (3) | Equivalent US dollar amounts are shown in “Shareholder information – Dividends on ordinary shares”, included elsewhere in this Annual Report. |
| | |
| (4) | The calculation of the gross equivalent dividend per ordinary share applies a tax rate of 10% for grossing-up purposes for dividends. |
| | |
| (5) | Prior to 2002, Reserve capital instruments were reported as a component of non-equity shareholders’ funds, with coupon payments treated as a non-equity appropriation of profit. Following an accounting presentation change, Reserve capital instruments are now reported within Subordinated liabilities, with coupon payments recorded as Interest payable, within Net interest income. |
| | |
| | The 2001 comparative amounts have been restated to reflect this accounting policy change and as a consequence profit before tax has been reduced by £19m, with profits attributable to shareholders remaining unchanged. Shareholders’ funds including non-equity interests have been reduced by £297m in 2001. Comparative amounts for years prior to 2001 are unaffected. This change results from the application of UITF 33, Obligations in capital instruments, which first applies to the financial statements for the year ended 31 December 2002. |
| | |
| (6) | The application of FRS 19, Deferred tax, for the year ended 31 December 2002 has resulted in deferred taxation being provided on all timing differences that have not reversed before the balance sheet date at the rate of tax expected to apply when those timing differences will reverse. Deferred tax assets are now recognised to the extent that they are regarded as recoverable. Previously, deferred taxation was accounted for where it was probable that a liability or asset would arise. The 2001 and 2000 comparative amounts have been restated to reflect this accounting policy change and as a consequence the tax charge has been reduced by £24m (2001), £16m (2000) and £17m (1999), respectively. Shareholders' funds including non-equity interests have been increased by £120m (2001), £96m (2000) and £80m (1999) respectively. |
| | |
| (7) | Amounts stated in dollars have been translated from sterling at the rate of £1.00 – $1.7842, the noon buying rate on 31 December 2003. |
| | | |
| Abbey Annual Report and Accounts 2003 | | 191 |
Back to Contents
Financial Statements
Five Year Record continued
| (8) | Prior to 2002, the costs of equity-based instruments issued to employees under compensation schemes were generally accounted for under the intrinsic value method. Abbey now accounts for the costs of share-based instruments on a fair value basis. The costs of share-based payments are computed by reference to the grant date; such costs are expensed over the vesting period of the instrument. The 2001 and 2000 Profit and Loss accounts and statements of total recognised gains and losses comparative amounts have been restated to reflect this accounting policy change and as a consequence profit before tax has been reduced by £6m (2001) £4m (2000), and £3m (1999), respectively, with a corresponding credit to the statement of total recognised gains and losses. No prior period adjustment to shareholders’ funds is required. |
| | |
| (9) | In 2002 certain adjustments were made to period end market values in reporting long term assurance business. The 2001 and 2000 comparative amounts have been restated to reflect this change in accounting policy. The reported earnings in these periods have been reduced by £443m and £102m, respectively. See note 21 “Long term assurance business” for further information. Determination of the impact on reported earnings in 1999 is not practicable. |
| | |
| (10) | Prior to 2003, the holding of Abbey’s own shares was reported as “Own Shares Held” and reported within Other Assets. These have now been reclassified as Treasury Shares and are now deducted from Shareholders Funds in accordance with UITF Abstract 38, Accounting for ESOP Trusts. Prior year comparatives have been restated accordingly. |
| | |
| (11) | Determination of the split of net income between continuing operations and discontinued operations, and the related earnings per share amounts for 2000 and 1999 is not practicable. |
Selected statistical information
| | Year ended/as at 31 December | |
|
|
|
|
|
|
|
|
|
| |
| | | | 2002 | ) | | | | | | |
| 2003 | (restated | 2001 | 2000 | 1999 |
| % | % | % | % | % |
|
|
|
|
|
|
|
|
|
| |
| Selected UK GAAP financial statistics | | | | | | | | | | |
|
|
|
|
|
|
|
|
|
| |
| Profitability ratios: | | | | | | | | | | |
|
|
|
|
|
|
|
|
|
| |
| Return on average total assets (1, 9) | (0.39 | ) | (0.56 | ) | 0.43 | | 0.66 | | 0.70 | |
|
|
|
|
|
|
|
|
|
| |
| Return on average ordinary shareholders’ funds (2) | (13.54 | ) | (20.01 | ) | 13.01 | | 20.56 | | 22.73 | |
|
|
|
|
|
|
|
|
|
| |
| Return on average risk weighted assets(3) | (1.10 | ) | (1.47 | ) | 1.07 | | 1.59 | | 1.67 | |
|
|
|
|
|
|
|
|
|
| |
| Net interest margin (excluding exceptional items)(4, 9) | 1.32 | | 1.40 | | 1.47 | | 1.61 | | 1.75 | |
|
|
|
|
|
|
|
|
|
| |
| Cost: income ratio (including exceptional items) (5) | 95.49 | | 61.46 | | 48.38 | | 45.32 | | 43.15 | |
|
|
|
|
|
|
|
|
|
| |
| Cost: income ratio (excluding exceptional items)(5) | 95.49 | | 61.46 | | 48.38 | | 45.32 | | 42.52 | |
|
|
|
|
|
|
|
|
|
| |
| Capital ratios: | | | | | | | | | | |
|
|
|
|
|
|
|
|
|
| |
| Ordinary dividends as a percentage of net income | (47.96 | ) | (29.60 | ) | 79.56 | | 51.22 | | 46.24 | |
|
|
|
|
|
|
|
|
|
| |
| Average ordinary shareholders’ funds as a percentage of average total assets(9) | 2.89 | | 2.80 | | 3.33 | | 3.21 | | 3.09 | |
|
|
|
|
|
|
|
|
|
| |
| Risk asset ratios: | | | | | | | | | | |
|
|
|
|
|
|
|
|
|
| |
| Total | 13.3 | | 11.6 | | 11.6 | | 13.5 | | 11.6 | |
|
|
|
|
|
|
|
|
|
| |
| Tier1 | 10.1 | | 9.2 | | 8.4 | | 8.8 | | 7.7 | |
|
|
|
|
|
|
|
|
|
| |
| Credit quality data: (6) | | | | | | | | | | |
|
|
|
|
|
|
|
|
|
| |
| Non-performing loans as a percentage of loans and advances | | | | | | | | | | |
| to customers excluding finance leases(6, 7) | 3.25 | | 2.36 | | 2.22 | | 2.60 | | 2.90 | |
|
|
|
|
|
|
|
|
|
| |
| Provisions as a percentage ofloans and advances to customers excluding finance leases(6) | 1.01 | | 0.78 | | 0.62 | | 0.70 | | 0.70 | |
|
|
|
|
|
|
|
|
|
| |
| Provisions as a percentage of non-performing loans(6, 7) | 31.14 | | 35.95 | | 27.76 | | 26.87 | | 24.11 | |
|
|
|
|
|
|
|
|
|
| |
| Provisions charge for bad and doubtful debts as a percentage | | | | | | | | | | |
| of average loans and advances to customers excluding finance leases(6) | 0.54 | | 0.60 | | 0.33 | | 0.35 | | 0.41 | |
|
|
|
|
|
|
|
|
|
| |
| Ratio of earnings to fixed charges:(8) | | | | | | | | | | |
|
|
|
|
|
|
|
|
|
| |
| Excluding interest on retail deposits | 0.72 | | 0.75 | | 1.27 | | 1.30 | | 1.38 | |
|
|
|
|
|
|
|
|
|
| |
| Including interest on retail deposits | 0.83 | | 0.83 | | 1.19 | | 1.22 | | 1.27 | |
|
|
|
|
|
|
|
|
|
| |
| | | | | | | | | | | |
| Selected US GAAP financial statistics | | | | | | | | | | |
|
|
|
|
|
|
|
|
|
| |
| Return on average total assets(1, 10) | (0.10 | ) | (0.76 | ) | 0.56 | | 0.70 | | 0.64 | |
|
|
|
|
|
|
|
|
|
| |
| Return on average ordinary shareholders’ funds(2) | (1.73 | ) | (22.15 | ) | 13.93 | | 17.18 | | 16.31 | |
|
|
|
|
|
|
|
|
|
| |
| Dividends as a percentage of net income | (246.24 | ) | (51.22 | ) | 65.16 | | 50.89 | | 51.73 | |
|
|
|
|
|
|
|
|
|
| |
| Average ordinary shareholders’ funds as a percentage of average total assets(10) | 2.88 | | 3.43 | | 4.03 | | 4.07 | | 3.92 | |
|
|
|
|
|
|
|
|
|
| |
| | | | | | | | | | | |
| | Number | | Number | | Number | | Number | | Number | |
|
|
|
|
|
|
|
|
|
| |
| Ratio of earnings to fixed charges: (8) | | | | | | | | | | |
|
|
|
|
|
|
|
|
|
| |
| Excluding interest on retail deposits | 0.94 | | 0.63 | | 1.28 | | 1.26 | | 1.32 | |
|
|
|
|
|
|
|
|
|
| |
| Including interest on retail deposits | 0.96 | | 0.77 | | 1.20 | | 1.20 | | 1.22 | |
|
|
|
|
|
|
|
|
|
| |
| | | | | | | | | | | |
| (1) | Profit after tax divided by average total assets. |
| | |
| (2) | Profit after tax divided by average equity shareholders’ funds. |
| | |
| (3) | Profit after tax divided by average risk weighted assets. |
| | |
| (4) | Net interest margin represents net interest income as a percentage of average interest-earning assets. |
| | |
| (5) | Cost: income ratio equals operating expenses excluding depreciation on operating lease assets divided by total operating income less depreciation on operating lease assets. |
| | |
| (6) | All credit quality data is calculated using period-end balances, except for provisions for bad and doubtful debts as a percentage of average loans and advances to customers, excluding assets held under purchase and resale agreements. |
| | | |
| 192 | | Abbey Annual Report and Accounts 2003 |
Back to Contents
Financial Statements
Five Year Record continued
| (7) | The non-performing loans used in these statistics are calculated in accordance with conventional US definitions. The value of non-performing loans represents the aggregate outstanding balance of all loans and advances 90 days or more overdue or, for unsecured loans less than 90 days overdue, the balance of loans where a provision has been made or interest suspended. Interest continues to be debited to substantially all of these loans and advances for collection purposes. The proportion of this interest whose collectability is in doubt is then suspended and excluded from the profit and loss account. Accordingly, the interest income figures included in the profit and loss account are the same as would be reported in the United States. However, the value of non-performing loans is higher by the cumulative amount of this suspended interest. |
| | |
| | In cases where borrowers have made arrangements to pay off their arrears over a period of time, the arrears remain on the loan accounts until cleared and as a result the loans are included in non-performing loans even though the customers are currently performing and many will ultimately discharge their loans fully. |
| | |
| | Abbey generally holds a first mortgage over the properties securing the UK residential mortgage loans. The value of the security will in many cases completely cover the value of the loan and the arrears and in the remainder will considerably reduce the size of the loss incurred. |
| | |
| | Non-performing loans also include the full value of loans for which Abbey has enforced its security by taking into possession the borrowers’ properties. In many such cases the value of the losses expected to result on sale of the security is known with some certainty and is included in the specific provisions. However, the value of the losses is not charged off until the properties are sold and the losses have thus been determined precisely. Other banks, including those in the United States, may charge off losses more rapidly. Although Abbey’s practice does not affect net income or the carrying value of loans and advances to customers, it does increase the reported value of non-performing loans. |
| | |
| | For these reasons, the value of the non-performing loans is not necessarily indicative of the value of losses which Abbey is likely to suffer. Management believes that it is important to consider the quality of Abbey’s UK residential mortgage portfolio compared with those of its competitors. Over the reporting periods covered by this table, the number of mortgage loans which are six months or more in arrears as a percentage of the total number of outstanding mortgage loans has been broadly comparable with the UK Council of Mortgage Lenders’ (CML) industry average. At 31 December 2003, Abbey’s percentage was 0.19% compared with a Council of Mortgage Lenders percentage of 0.36%. The value of these Abbey non-performing loans as a percentage of its total UK residential mortgage loan assets was 0.16%. Non-performing loans in this table also include the value of arrears cases between three and six months in arrears and the value of properties in possession. On this basis, the non-performing UK residential mortgage loans are 0.1% of its total UK residential loans and advances. If the remainder of Abbey’s loans and advances (excluding finance leases) are included, this ratio increases to 3.25%. |
| | |
| (8) | For the purpose of calculating the ratios of earnings to fixed charges, earnings consists of income before taxes plus fixed charges. Fixed charges consists of interest payable, which includes the amortisation of discounts and premiums on debt securities in issue and interest payable on finance lease obligations. |
| | |
| (9) | These ratios have been restated for each of the comparative periods due to the US GAAP total assets being restated. |
Exchange rates
The following tables set forth, for the periods indicated, certain information concerning the exchange rate for pounds sterling based on the noon buying rate in New York City for cable transfers in foreign currencies, as certified for customs purposes by the Federal Reserve Bank of New York, expressed in US dollars per £1.00. No representation is made that amounts in pounds sterling have been, could have been or could be converted into US dollars at the noon buying rate or at any other rate. The noon buying rate for US dollars on 10 February was $1.8697.
| Calendar period | High | | Low | | Average | (1) | Period end | |
| $ Rate | $ Rate | $ Rate | $ Rate |
|
|
|
|
|
|
|
| |
| Years ended 31 December: 2003 | 1.78 | | 1.55 | | 1.63 | | 1.78 | |
|
|
|
|
|
|
|
| |
| 2002 | 1.61 | | 1.41 | | 1.50 | | 1.61 | |
|
|
|
|
|
|
|
| |
| 2001 | 1.50 | | 1.37 | | 1.44 | | 1.45 | |
|
|
|
|
|
|
|
| |
| 2000 | 1.65 | | 1.40 | | 1.51 | | 1.50 | |
|
|
|
|
|
|
|
| |
| 1999 | 1.68 | | 1.56 | | 1.61 | | 1.62 | |
|
|
|
|
|
|
|
| |
| Months ended: February 2004(2) | 1.87 | | 1.82 | | | | | |
|
|
|
|
|
|
|
| |
| January | 1.85 | | 1.79 | | | | | |
|
|
|
|
|
|
|
| |
| December 2003 | 1.78 | | 1.72 | | | | | |
|
|
|
|
|
|
|
| |
| November | 1.72 | | 1.67 | | | | | |
|
|
|
|
|
|
|
| |
| October | 1.70 | | 1.66 | | | | | |
|
|
|
|
|
|
|
| |
| September | 1.66 | | 1.57 | | | | | |
|
|
|
|
|
|
|
| |
| August | 1.62 | | 1.57 | | | | | |
|
|
|
|
|
|
|
| |
| | |
| (1) | The average of the noon buying rates on the last business day of each month during the relevant period. |
| | |
| (2) | With respect to February 2004, for the period from February 1 to February 10. |
| | | |
| Abbey Annual Report and Accounts 2003 | | 193 |
Back to Contents
Shareholder Information
Dividend and Share Information
Dividends on ordinary shares
Abbey National plc has paid dividends on its ordinary shares every year without interruption since its incorporation in 1989. The Board is proposing a final dividend of 16.67 pence, to give a full year dividend in respect of 2003 of 25 pence per share, the same as the 2002 payment. The flat payment in 2003 takes into account the pressure on earnings in the current year, as well as the early stage of the transformation process. The level of future payments will depend upon the cash earnings of the Personal Financial Services business, and the need to maintain a robust credit standing.
The dividends (including interim dividends) declared for each of the last five years were as follows:
| Pence per 10 pence ordinary share | | | | | | | |
| | | | | | | | | | | |
| | 2003 | | 2002 | | 2001 | | 2000 | | 1999 | |
|
|
|
|
|
|
|
|
|
| |
| Interim | 8.33 | | 17.65 | | 16.80 | | 15.15 | | 13.40 | |
|
|
|
|
|
|
|
|
|
| |
| Final | 16.67 | | 7.35 | | 33.20 | | 30.35 | | 26.85 | |
|
|
|
|
|
|
|
|
|
| |
| Total | 25.00 | | 25.00 | | 50.00 | | 45.50 | | 40.25 | |
|
|
|
|
|
|
|
|
|
| |
| | | | | | | | | | | |
| Cents per 10 pence ordinary share | | | | | | | |
| | | | | | | | | | | |
| | 2003 | | 2002 | | 2001 | | 2000 | | 1999 | |
|
|
|
|
|
|
|
|
|
| |
| Interim | 14.82 | | 28.41 | | 24.36 | | 22.66 | | 21.64 | |
|
|
|
|
|
|
|
|
|
| |
| Final | 29.67 | | 11.83 | | 48.14 | | 45.39 | | 43.36 | |
|
|
|
|
|
|
|
|
|
| |
| Total | 44.49 | | 40.24 | | 72.50 | | 68.05 | | 65.00 | |
|
|
|
|
|
|
|
|
|
| |
Dividends expressed in cents are translated from sterling at the non buying rate on 31 December of the year to which they relate (or the last business day in December if 31 December was not a business day that particular year). No representation is made that pounds sterling amounts have been, or could have been, or could be, converted into dollars at these rates.
Dividends on dollar-denominated preference shares
Dividends on the non-cumulative dollar-denominated preference shares, are paid quarterly at such rates as will, including the UK associated tax credit and before deduction of UK withholding tax (see "Taxation for US investors" below), result in annual dividends to holders amounting to 7 3/8% of the $25.00 issue price, respectively.
Nature of trading market
Ordinary shares and American Depository Shares
The authorised ordinary share capital of Abbey National plc consists of 1,750,000,000 ordinary shares of nominal value 10 pence each. At the close of business on 31 December 2003, 1,462,415,633 ordinary shares were issued and outstanding.
There were 3,199 recorded holders of ordinary shares with US addresses at 31 December 2003 whose shareholdings represented approximately 0.04% of total issued and outstanding ordinary shares on that date.
The sole trading market for Abbey National plc ordinary shares is the London Stock Exchange. American Depositary Shares (ADSs), each representing two ordinary shares, may be traded in the US over-the-counter market. At close of business on 31 December 2003, there were 11,580,366 ADSs outstanding for which four holders were registered.
Dollar-denominated preference shares and American Depository Shares
The call feature on the Series A non-cumulative dollar-denominated preference shares was triggered in June 2003 with the US dollar rate exceeding 1.6545, and these shares were called on July 7.
At 31 December 2003, Abbey National plc had outstanding 18,000,000 Series B non-cumulative dollar-denominated preference shares, nominal value $0.01 each. The Series B preference shares were issued in November 2001. Currently, the only trading market for these shares is the New York Stock Exchange where they are traded in the form of Series B American Depositary Shares, each representing one preference share.
At 31 December 2003, the Series B American Depositary Shares were held by 38 holders of record, all with US addresses. The Series B American Depositary Shares traded on the New York Stock Exchange at prices ranging from a high of $27.89 to a low of $25.61 during 2003.
| | |
| 194 | Abbey Annual Report and Accounts 2003 |
Back to Contents
Shareholder Information
Dividend and Share Information continued
Share price history
The following tables show the high and low sale prices for the ordinary shares during the periods indicated, based on mid-market prices at the close of business on the London Stock Exchange for the following periods:
| (i) | The five most recent financial years; |
| (ii) | Each financial quarter for the two most recent financial years; and |
| (iii) | Each of the six most recent months. |
| | |
| (i) | Five most recent financial years |
| | |
| | Ordinary Shares | |
|
| |
| | High | | Low | |
| | pence | | pence | |
|
|
|
| |
| 2003 | 596 | | 317 | |
|
|
|
| |
| 2002 | 1,132 | | 487 | |
|
|
|
| |
| 2001 | 1,305 | | 885 | |
|
|
|
| |
| 2000 | 1,219 | | 622 | |
|
|
|
| |
| 1999 | 1,435 | | 939 | |
|
|
|
| |
| | | | | |
| (ii) | Quarterly for the two most recent financial years |
| | |
|
|
|
|
| |
| 2003: | Fourth quarter | | 596 | | 518 | |
|
|
|
|
|
| |
| | Third quarter | | 577 | | 470 | |
|
|
|
|
|
| |
| | Second quarter | | 538 | | 337 | |
|
|
|
|
|
| |
| | First quarter | | 539 | | 317 | |
|
|
|
|
|
| |
| 2002: | Fourth quarter | | 697 | | 487 | |
|
|
|
|
|
| |
| | Third quarter | | 826 | | 515 | |
|
|
|
|
|
| |
| | Second quarter | | 1,132 | | 737 | |
|
|
|
|
|
| |
| | First quarter | | 1,088 | | 953 | |
|
|
|
|
|
| |
| | | | | | | |
| (iii) | The six most recent months |
| | |
|
|
|
| |
| up to 12 February 2004 | 571 | | 552 | |
|
|
|
| |
| January | 587 | | 537 | |
|
|
|
| |
| December 2003 | 591 | | 519 | |
|
|
|
| |
| November | 561 | | 528 | |
|
|
|
| |
| October | 596 | | 517 | |
|
|
|
| |
| September | 556 | | 494 | |
|
|
|
| |
Note: Past performance of the ordinary shares, preference shares and related American Depositary Shares cannot be relied upon as a guide to future performance.
Major shareholders
At 31 December 2003, Abbey National plc did not know, and had not been notified of any interest in the register maintained under Section 211 of the Companies Act, of any corporation, foreign government or other person that directly or indirectly owned a controlling interest in it.
At 31 December 2003, Abbey National plc had no major shareholders, defined as owning 5% or more of the outstanding ordinary share capital. There have been no significant changes in the percentage ownership of major shareholders in the past three years.
There were 1,835,339 recorded holders of ordinary shares with UK addresses at 31 December 2003 whose shareholdings represented approximately 98.86% of total issued and outstanding ordinary shares on that date.
Exchange controls
There are no United Kingdom laws, decrees or regulations that restrict Abbey's export or import of capital, including the availability of cash and cash equivalents for use by Abbey, or that affect the remittance of dividends or other shareholder payments to non UK Holders of Abbey Shares, except as outlined in the section on "Taxation".
| | |
| .Abbey Annual Report and Accounts 2003 | 195 |
Back to Contents
Shareholder Information
Risk Factors
An investment in Abbey's ordinary shares involves a number of risks, certain of which are set forth below. The factors discussed below should not be regarded as a complete and comprehensive statement of all potential risks and uncertainties.
Risks concerning borrower credit quality and general economic conditions are inherent in Abbey's business
Risks arising from changes in credit quality and the recoverability of loans and amounts due from counterparties are inherent in a wide range of Abbey's businesses. Adverse changes in the credit quality of Abbey's borrowers and counterparties or a general deterioration in UK or global economic conditions, or arising from systemic risks in the financial systems, could reduce the recoverability and value of Abbey's assets and require an increase in Abbey's level of provisions for bad and doubtful debts. Deterioration in the UK economy could reduce the profit margins for Abbey's banking and financial services businesses. See "Risk management" for a discussion of these items.
Market risks associated with fluctuations in interest rates, foreign exchange rates, bond and equity prices and other market factors are inherent in Abbey's business
The most significant market risks Abbey faces are interest rate, foreign exchange and bond and equity price risks.
Changes in interest rate levels, yield curves and spreads may affect the interest rate margin realised between lending and borrowing costs. Over the last year we experienced a reduction in our interest rate spread. Should interest rate spreads continue to decrease this could adversely affect our profit from banking operations.
Changes in currency rates, particularly in the sterling-dollar and sterling-euro exchange rates, affect the value of assets and liabilities denominated in foreign currencies and affect earnings reported by Abbey's non-UK businesses.
The performance of financial markets may cause changes in the value of Abbey's investment and trading portfolios. In addition Abbey is exposed to changes in the equity markets through its final salary pension scheme (closed to new entrants in 2002) and its life assurance funds including the requirement to maintain a minimum solvency margin.
Abbey has implemented risk management methods to mitigate and control these and other market risks to which Abbey is exposed. However, it is difficult to predict with accuracy changes in economic or market conditions and to anticipate the effects that such changes could have on Abbey's financial performance and business operations. See "Risk management" for a discussion of these risks.
Operational risks are inherent in Abbey's business
Abbey's businesses depend on the ability to process a large number of transactions efficiently and accurately. Losses can result from inadequate or failed internal control processes, people and systems, or from external events that interrupt normal business operations. See "Risk management – Operational risk".
Abbey's businesses are subject to substantial legislation, regulatory and governmental oversight.
Abbey is subject to financial services laws, regulations, administrative actions and policies in each location in which Abbey operates. Changes in supervision and regulation, in particular in the UK, could materially affect Abbey's business, the products and services offered or the value of assets. Although Abbey works closely with its regulators and continually monitors the situation, future changes in regulation, fiscal or other policies can be unpredictable and are beyond the control of Abbey. See "Supervision and regulation" for additional information.
The resolution of a number of issues affecting the UK financial services industry, including Abbey, could have a negative impact on Abbey's results of operations or on its relations with some of its customers and potential customers.
These issues involve the possible misselling of endowment policies and other products. There is a risk that further provisions may be required as a result of these issues. See Note 38 to the Consolidated Financial Statements.
Risks associated with strategic decisions regarding organic growth, the competitive environment and potential acquisitions and disposals
Abbey devotes substantial management and planning resources developing strategic plans for organic growth and identifying possible acquisitions and disposals including the restructuring of Abbey's businesses into ongoing Personal Financial Services businesses and Portfolio Business Unit businesses being managed for value and exit. If the outcome of these plans do not match expectations, Abbey's earnings may not develop as forecast. In addition, the market for UK financial services and the other markets within which Abbey operates are highly competitive; Abbey's ability to generate an appropriate return for its shareholders depends significantly upon management's response to the competitive environment. See "Business overview – Competition" for additional information.
Abbey's insurance businesses are subject to inherent risks regarding claims provisions
Claims in Abbey's life assurance businesses may be higher than expected as a result of changing trends in claims experience arising from changes in demographic developments, mortality and morbidity rates and other factors outside Abbey's control. Such changes could affect the profitability of current and future insurance products and services.
Risks associated with the disposal of our assets and/or businesses
As previously announced, we are managing the Portfolio Business Unit businesses for exit. In some cases this involves the sale of assets and/or businesses. Based on information currently available to us, the value of these assets or businesses shown in our financial statements reflect management's best estimate of their current value. We believe these values will be close to ultimate disposal values. However there is an inherent uncertainty in predicting the ultimate sales value. As a result we may incur losses on disposal or further amounts to be written off fixed asset investments and/or increases in provisions, therefore reducing our profitability. See "Risk management"– Life Business.
| | |
| 196 | Abbey Annual Report and Accounts 2003 |
Back to Contents
Shareholder Information
Taxation for US Investors
| The following is a summary, under current law, of the principal UK and US federal income tax considerations relating to an investment by a US taxpayer in the Ordinary Shares, the Series A or B Non-cumulative Dollar-denominated Preference Shares, or the American Depositary Shares (ADSs) representing an interest in such shares (collectively, the "Shares"). This summary applies to you only if: |
| > | you are an individual US citizen or resident, a US corporation, or otherwise subject to US federal income tax on a net income basis in respect of the Shares; |
| > | you hold the Shares as a capital asset for tax purposes; and |
| > | you are not resident or ordinarily resident in the United Kingdom for UK tax purposes, and do not hold the Shares for the purposes of a trade, profession, or vocation that you carry on in the United Kingdom through a branch or agency. |
This summary does not purport to be a comprehensive description of all of the tax considerations that may be relevant to any particular investor, and does not address the tax treatment of investors that are subject to special rules. We have assumed that you are familiar with the tax rules applicable to investments in securities generally and with any special rules to which you may be subject. You should consult your own tax advisers regarding the tax consequences of the acquisition, ownership, and disposition of the Shares in the light of your own particular circumstances.
The discussion is based on laws, treaties, judicial decisions, and regulatory interpretations in effect on the date hereof, all of which are subject to change. On March 31, 2003, representatives of the United Kingdom and United States exchanged instruments of notification for a new income tax convention (the "New Treaty"). The New Treaty has the force and effect of law in respect of withholding taxes on dividends from May 1, 2003. As discussed below, you will no longer be entitled to claim a special foreign tax credit in respect of dividends that was available under the terms of the Prior Treaty between the United States and the United Kingdom from December 31, 1975 ("the Prior Treaty"), except for a limited period of time during which you may elect to apply the entirety of the Prior Treaty in preference to the New Treaty.
In general, the UK and US federal income tax considerations relevant to an investment in the Shares will be similar to the considerations relevant to investments in equity securities issued by other UK corporations. With regard to UK taxation: |
| > | dividends that you receive on the Shares will not be subject to any UK withholding tax; |
| > | dispositions of Shares that you make will not give rise to any UK tax on chargeable gains; |
| > | no UK stamp duty or stamp duty reserve tax will be payable on a transfer of Shares in ADS form, provided, in the case of stamp duty, that the ADSs and any instrument of transfer are executed and remain at all times outside the United Kingdom; and |
| > | UK stamp duty or stamp duty reserve tax will generally be payable on a transfer of registered Shares in non-ADS form, and you should consult your own tax advisers with respect to this possibility. |
| With regard to US federal income taxation |
| > | if you hold Shares in ADS form, you will be treated as holding the underlying shares for US federal income tax purposes, and deposits and withdrawals of shares in exchange for ADSs will not be taxable events; |
| > | you must include cash dividends paid on the Shares in ordinary income on the date that you or the ADS depositary receive them, translating dividends paid in UK pounds sterling into US dollars using the exchange rate in effect on the date of receipt; |
| > | subject to certain exceptions for positions that are hedged or held for less than 60 days, an individual holder of Shares generally should be subject to US taxation at a maximum rate of 15% in respect of dividends received in 2003.The US Treasury and the Internal Revenue Service have announced that they intend to develop a certification procedure for 2004 and future years under which a foreign corporation may certify that it satisfies certain of there requirements for the rate of 15% in respect of dividends received before 2009 by individual shareholders of such foreign corporations. |
| > | dispositions of Shares that you make will generally give rise to capital gain or loss, which will be long-term capital gain or loss, subject to taxation at reduced rates for non-corporate taxpayers, if the Shares were held for more than one year; and |
| > | if you qualify for benefits under the Prior Treaty, you may be eligible, subject to generally applicable limitations, to receive a special US foreign tax credit equal to one-ninth of the amount of certain cash dividends that you receive on the Shares, so long as you make an election to include in your income, as an additional notional dividend, an amount equal to the tax credit. This foreign tax credit benefit is generally only available with respect to dividends paid before May 1, 2003, unless you elect to apply the Prior Treaty convention in its entirety for an optional 12 month extension period. You should consult your own tax advisers regarding your potential eligibility for this foreign tax credit benefit. |
| | |
| .Abbey Annual Report and Accounts 2003 | 197 |
Back to Contents
Shareholder Information
Contact Information
Addresses and phone numbers
Abbey National plc registered and principal office
Abbey House,
2 Triton Square,
Regent's Place
London
NW1 3AN
Registered Number 2294747
Registered in England and Wales
Shareholder Services
Abbey National plc
Carbrook House
5 Carbrook Hall Road
Sheffield
S9 2EG
Phone numbers:
Shareholder Services
0870 532 9430*
Share Price Information Line
0870 577 5525*
Abbey Share Dealing Service
0845 602 3040†
| * | Calls are charged at the national rate |
| † | Calls are charged at the local rate. |
To help us improve our service, we may record or monitor all calls.
Alternative Dividend Plan
The Alternative Dividend Plan (ADP) allows shareholders to receive their dividend as new shares in Abbey rather than as a cash payment. The ADP means that shareholders in Abbey can expand their holdings by acquiring new shares without incurring any share dealing costs normally associated with buying shares. For further information on the ADP and an application form, please contact Shareholder Services.
Amalgamating your shares
If you were mailed more than one copy of this Annual Report, it may be because Abbey has more than one record of shareholdings in your name. To ensure that you do not receive duplicate mailings in future, you can have all your shares amalgamated into one account by contacting Shareholder Services.
Documents on display
Abbey is subject to the information requirements of the US Securities and Exchange Act 1934. In accordance with these requirements, Abbey files its Annual Report and other related documents with the SEC. These documents may be inspected by US investors at the SEC's public reference rooms, which are located at Judiciary Plaza, 450 Fifth Street, NW Washington, DC 20549. Information on the operation of the public reference rooms can be obtained by calling the SEC on 1-800-SEC-0330.
Memorandum and Articles of Association
Shareholders can obtain copies of Abbey's Memorandum and Articles of Association from Abbey's registered office.
Web site
The Annual Report and Accounts is available on the Internet at www.abbey.com. You can register with Shareholder Services at www.abbey.com to stop receiving statutory communications through the post and we will send you notification, by e-mail, each time we put up a new shareholder report, Notice of Meeting or other investor communication on our web site.
| Financial calendar |
|
| 17 March 2004 | Ex-dividend date |
|
| 19 March 2004 | Record date for final dividend |
|
| 22 April 2004 | Annual General Meeting, Barbican Centre, London |
|
| 04 May 2004 | Final dividend payment |
|
| 29 July 2004 | Interim results announced |
|
| 18 August 2004 | Ex-dividend date |
|
| 20 August 2004 | Record date for interim dividend |
|
| 04 October 2004 | Interim dividend payment |
|
| | |
| 198 | Abbey Annual Report and Accounts 2003 |
Back to Contents
Glossary and Definitions
Glossary and Definitions
| Terms used | US equivalent or brief description of meaning |
|
|
| Accounts | Financial statements |
|
|
| Allotted | Issued |
|
|
| Articles of Association | Bylaws |
|
|
| Attributable profit | Net income |
|
|
| Balance sheet | Statement of financial position |
|
|
| Bills | Notes |
|
|
| Called up share capital | Ordinary shares and preferred stock, issued and fully paid |
|
|
| Capital allowances | Tax depreciation allowances |
|
|
| Combined Code | UK-derived principles of good corporate governance and code of best practice |
|
|
| Creditors | Payables |
|
|
| Current account | Checking account |
|
|
| Dealing | Trading |
|
|
| Debtors | Receivables |
|
|
| Deferred tax | Deferred income tax |
|
|
| Depreciation | Write-down of tangible fixed assets over their estimated useful lives |
|
|
| Fees and commissions payable | Fees and commissions expense |
|
|
| Fees and commissions receivable | Fees and commissions income |
|
|
| Finance lease | Capital lease |
|
|
| Freehold | Ownership with absolute rights in perpetuity |
|
|
| Interest payable | Interest expense |
|
|
| Interest receivable | Interest income |
|
|
| Loans and advances | Lendings |
|
|
| Loan capital | Long-term debt |
|
|
| Long term assurance fund | Long term insurance fund |
|
|
| Members | Shareholders |
|
|
| Net asset value | Book value |
|
|
| Nominal value | Par value |
|
|
| One-off | Non-recurring |
|
|
| Ordinary shares | Common stock |
|
|
| Overdraft | A line of credit established through a customer’s current account and contractualy |
| | repayable on demand |
|
|
| Preference shares | Preferred stock |
|
|
| Premises | Real estate |
|
|
| Profit | Income |
|
|
| Profit and loss account | Income statement |
|
|
| Profit and loss account reserves | Retained earnings |
|
|
| Provisions | Allowances |
|
|
| Share capital | Ordinary shares, or common stock, and preferred stock |
|
|
| Shareholders’ funds | Stockholders’ equity |
|
|
| Share premium account | Additional paid-in capital |
|
|
| Shares in issue | Shares outstanding |
|
|
| Tangible fixed assets | Property, plant and equipment |
|
|
| Undistributable reserves | Restricted surplus |
|
|
| Write-offs | Charge-offs |
|
|
| | |
| Abbey Annual Report and Accounts 2003 | 199 |
Back to Contents
Cross-reference to form 20-F
Cross-reference to form 20-F
| | Part I | |
|
|
|
| 1 | Identity of Directors, Senior Management and Advisers | * |
|
|
|
| | | |
| 2 | Offer Statistics and Expected Timetable | * |
|
|
|
| | | |
| 3 | Key Information | |
|
|
|
| | Selected Financial Data | 192 |
|
|
|
| | Capitalisation and Indebtedness | * |
|
|
|
| | Reasons for the Offer and use of Proceeds | * |
|
|
|
| | Exchange Rates | 193 |
|
|
|
| | Risk Factors | 196 |
|
|
|
| | | |
| 4 | Information on the Company | |
|
|
|
| | History and Development of the Company | 8 |
|
|
|
| | Business Overview | 8 |
|
|
|
| | Supervision and Regulation | 106 |
|
|
|
| | Organisational Structure | 8 |
|
|
|
| | Property, Plant and Equipment | 65 |
|
|
|
| | | |
| 5 | Operating and Financial Review and Prospects | |
|
|
|
| | Operating Results | 12 |
|
|
|
| | Liquidity and Capital Resources | 66 |
|
|
|
| | Research and Development, Patents and Licenses, etc | Not applicable |
| |
|
|
|
| | Trend Information | 8 |
|
|
|
| | Off-Balance Sheet Arrangements | 68 |
|
|
|
| | Contractual Obligations | 70 |
|
|
|
| | | |
| 6 | Directors, Senior Management and Employees | |
|
|
|
| | Directors and Senior Management | 87 |
|
|
|
| | Compensation | 99 |
|
|
|
| | Board Practices | 96 |
|
|
|
| | Employees | 91 |
|
|
|
| | Share Ownership | 102 |
|
|
|
| | | |
| 7 | Major Shareholders and Related Party Transactions | |
|
|
|
| | Major Shareholders | 195 |
|
|
|
| | Related Party Transactions | 102 and 159 |
|
|
|
| | Interests of Experts and Counsel | * |
|
|
|
| | | |
| 8 | Financial Information | |
|
|
|
| | Consolidated Statements and Other Financial Information | 111 |
|
|
|
| | Significant Changes | 12 |
|
|
|
| | | |
| 9 | The Offer and Listing | |
|
|
|
| | Offer Listing and Details | * |
|
|
|
| | Plan of Distribution | * |
|
|
|
| | Selling shareholders | * |
|
|
|
| | Share Price History | 195 |
|
|
|
| | Trading Markets | 194 |
|
|
|
| | Dilution | * |
|
|
|
| | Expenses of the Issue | * |
|
|
|
| 10 | Additional Information | |
|
|
|
| | Share Capital | * |
|
| | Memorandum and Articles of Association | * |
|
| | Material Contracts | 53 |
|
| | Exchange Controls | 195 |
|
| | Taxation | 197 |
|
| | Dividends and Paying Agents | * |
|
| | Statements by Experts | * |
|
| | Documents on Display | 198 |
|
| | Subsidiary Information | Not applicable |
|
| 11 | Quantitative and Qualitative Disclosures about Market Risk | 77 |
|
| | | |
| 12 | Description of Securities Other Than Equity Securities | |
|
| | Debt Securities | * |
|
| | Warrants and Rights | * |
|
| | Other Securities | * |
|
| | American Depositary Shares | * |
|
| | | |
| | Part II | |
|
| 13 | Defaults, Dividend Arrearages and Delinquencies | Not applicable |
|
| 14 | Material Modifications to the Rights | Not applicable |
| | of Security Holders and Use of Proceeds | |
|
| | | |
| 15 | Controls and Procedures | |
|
| | Disclosure Controls and Procedures | 98 |
|
| | Changes in Internal Control Over Financial Reporting | 98 |
|
| | | |
| 16 | Internal Control over Financial Reporting | |
|
| | Audit Committee Financial Expert | 96 |
|
| | Code of Ethics | 91 |
|
| | Principal Accountant Fees and Services | 124 |
|
| | Exemptions from the Listing Standards for Audit Committees | • |
|
| | | |
| | Part III | |
|
| 17 | Financial Statements | Not applicable |
|
| | | |
| 18 | Financial Statements | 111 |
|
| | | |
| 19 | Exhibits | Filed with the SEC |
|
| * Not required for an Annual Report. | |
| 200 | Abbey Annual Report and Accounts 2003 |
Back to Contents
| | | | |
| | | | |
| | | | |
| | | | |
| | | | |
| | | | |
| | | | |
| | Information about these results can be obtained
from the Abbey website at www.abbey.com For more information contact Investor Relations
on 020 7756 4184 / 4181. | | |
| | | | |
| | | | |
| | | | |
| | | | |
| | | | |
| | | | |
| | | | |
| | | | |
| | | | |
| | | Abbey National plc
Registered office:
Abbey National House
2 Triton Square
Regent’s Place
London NW1 3AN | |
| | | | |
| | | Registered in England
Registered number: 2294747 | |
| | | | |
| | ‘Abbey’ is a registered trademark of Abbey National plc | |
| | | | |
Back to Contents
SIGNATURE
The registrant hereby certifies that it meets all of the requirements for filing on Form 20-F and that it has duly caused and authorized the undersigned to sign this annual report on its behalf.
ABBEY NATIONAL plc
By
/s/ STEPHEN HESTER
Stephen Hester, Group Finance Director
Date: 10 March 2004
Back to Contents
EXHIBIT INDEX
| | |
| * | Documents concerning Abbey National plc referred to within the Annual Report on Form 20-F 2003 may be inspected at Abbey National House, 2 Triton Square, Regent's Place, London NW1 3AN, the principal executive offices and registered office of Abbey National plc. |
| | |
| ** | Incorporated by reference to the Registration Statements on Form F-3 (No. 333-13146). |