UNITED STATES
SECURITIES AND EXCHANGE COMMISSION
WASHINGTON, D.C. 20549
FORM 20-F
(Mark One)
| ¨ | REGISTRATION STATEMENT PURSUANT TO SECTION 12(b) OR (g) OF THE SECURITIES EXCHANGE ACT OF 1934 |
OR
| x | ANNUAL REPORT PURSUANT TO SECTION 13 OR 15(d) OF THE SECURITIES EXCHANGE ACT OF 1934 |
For the fiscal year endedDecember 31, 2013
OR
| ¨ | TRANSITION REPORT PURSUANT TO SECTION 13 OR 15(d) OF THE SECURITIES EXCHANGE ACT OF 1934 |
For the transition period from to
OR
| ¨ | SHELL COMPANY REPORT PURSUANT TO SECTION 13 OR 15(d) OF THE SECURITIES EXCHANGE ACT OF 1934 |
Date of event requiring this shell company report to
Commission file number 001-14928
Santander UK plc
(Exact name of Registrant as specified in its charter)
England
(Jurisdiction of incorporation or organization)
2 Triton Square, Regent’s Place, London NW1 3AN, England
(Address of principal executive offices)
Julian Curtis
2 Triton Square, Regent’s Place, London NW1 3AN, England
Tel +44 (0) 870 607 6000
Fax +44 (0) 20 7756 5628
(Name, Telephone, Email and/or Facsimile number and Address of Company Contact Person)
Securities registered or to be registered pursuant to Section 12(b) of the Act.
| | |
3.050% Notes due 2018, issued by Abbey National Treasury Services plc * 4.000% Notes due 2016, issued by Abbey National Treasury Services plc * | | New York Stock Exchange New York Stock Exchange |
| 2.875% Notes due 2014, issued by Abbey National Treasury Services plc * | | New York Stock Exchange |
| Floating Rate Notes due 2014, issued by Abbey National Treasury Services plc * | | New York Stock Exchange |
| * | Guaranteed by Santander UK plc |
Securities registered or to be registered pursuant to Section 12 (g) of the Act.
None
Securities registered or to be registered pursuant to Section 15 (d) of the Act.
7.95% Term Subordinated Securities due October 26, 2029
Subordinated Guarantee by Santander UK plc (as successor in interest to Abbey National plc) of the 8.963% Non-Cumulative Perpetual Preferred Limited Partnership Interests issued by Abbey National Capital LP I
Subordinated Guarantee by Santander UK plc (as successor in interest to Abbey National plc) of the 8.963% Non-Cumulative Trust Preferred Securities issued by Abbey National Capital Trust I
Indicate the number of outstanding shares of each of the issuer’s classes of capital or common stock as of the close of the period covered by the annual report.
| | |
| Ordinary shares of nominal value of £0.10 each* | | 31,051,768,866 |
| 10 3/8% Non-cumulative Preference Shares of nominal value of £1 each | | 200,000,000 |
| 8 5/8% Non-cumulative Preference Shares of nominal value of £1 each | | 125,000,000 |
| Series A Fixed/Floating Rate Non-cumulative Preference Shares of nominal value of £1 each | | 300,002 |
| * | All of the issued and outstanding ordinary shares of Santander UK plc are held by Santander UK Group Holdings Limited, which is a wholly-owned subsidiary of Banco Santander S.A. |
Indicate by check mark if the registrant is a well-known seasoned issuer, as defined in Rule 405 of the Securities Act. Yes x No ¨
If this report is an annual or transition report, indicate by check mark if the registrant is not required to file reports pursuant to Section 13 or 15(d) of the Securities Exchange Act of 1934. Yes ¨ No x
Indicate by check mark whether the registrant: (1) has filed all reports required to be filed by Section 13 or 15(d) of the Securities Exchange Act of 1934 during the preceding 12 months (or for such shorter period that the registrant was required to file such reports), and (2) has been subject to such filing requirements for the past 90 days. Yes x No ¨
Indicate by check mark whether the registrant has submitted electronically and posted on its corporate Web site, if any, every Interactive Data File required to be submitted and posted pursuant to Rule 405 of Regulation S-T (§232.405 of this chapter) during the preceding 12 months (or for such shorter period that the registrant was required to submit and post such files). Yes ¨ No ¨
Indicate by check mark whether the registrant is a large accelerated filer, an accelerated filer, or a non-accelerated filer. See definition of “accelerated filer and large accelerated filer” in Rule 12b-2 of the Exchange Act. (Check one):
| | | | |
| Large accelerated filer ¨ | | Accelerated filer ¨ | | Non-accelerated filer x |
Indicate by check mark which basis of accounting the registrant has used to prepare the financial statements included in this filing:
| | | | |
| ¨ U.S. GAAP | | x International Financial Reporting Standards as issued by the International Accounting Standards Board | | ¨ Other |
If “Other” has been checked in response to the previous question, indicate by check mark which financial statement item the registrant has elected to follow. Item 17 ¨ Item 18 ¨
If this is an annual report, indicate by check mark whether the registrant is a shell company (as defined in Rule 12b-2 of the Exchange Act). Yes ¨ No x
| | | | | | | | | | | | |
| | 2013 Results highlights | | |
| | Net interest income | | | | Profit after tax | | | | Banking net interest margin | | |
| | | | | | |
| | £2,963m | | | | £921m | | | | 1.55%(1) | | |
| | | | | | |
| | Up 8% on 2012, largely due to an | | | | Profit after tax from continuing operations up | | | | Up 19 basis points from 1.36% in 2012, | | |
| | improved mortgage stock interest | | | | 5% on 2012 (up 13% excluding significant | | | | reflecting improving mortgage stock | | |
| | margin, lower cost of retail liabilities and | | | | items), maintaining a record of consistent | | | | margins and lower customer deposit | | |
| | increased Commercial Banking lending. | | | | profitability through the economic cycle. | | | | and wholesale funding costs. | | |
| | | | | | | | | | | | |
| | | | | | | | | | (1) Non-IFRS measure. See page 345. | | |
| | | | | | | | | | | | |
| | Cost-to-income ratio | | | | CET 1 Capital ratio | | | | Loan-to-deposit ratio | | |
| | | | | | |
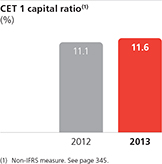
| | 54% | | | | 11.6%(1) | | | | 126% | | |
| | | | | | |
| | Costs remained tightly controlled, | | | | Further strengthened our capital position | | | | Improved three percentage points | | |
| | with our focus on business as usual | | | | with estimated CRD IV end point Common | | | | from 129% in 2012 as we continued | | |
| | expenses maintained. | | | | Equity Tier 1 (‘CET 1’) capital ratio at | | | | to manage the balance sheet. | | |
| | | | | | 31 December 2013, up from 11.1% in 2012. | | | | | | |
| | | | | | (1) Non-IFRS measure. See page 345. | | | | | | |
| | | | | | | | | | | | |
| | | | | | | | | | | | |
| | Gross mortgage lending | | | | 1I2I3 World customers | | | | Commercial Banking lending | | |
| | | | | | |
| | £18.4bn | | | | 2.4 million | | | | £22.1bn | | |
| | | | | | |
| | Up from £14.4bn in 2012, and | | | | 1.1 million customers joined the 1I2I3 | | | | Commercial Banking loan growth of 13% | | |
| | including £3.4bn of loans extended | | | | World in 2013, including 232,000 new | | | | continues to be subject to prudent risk | | |
| | to first-time buyers. | | | | customers who moved their current accounts | | | | management criteria, as demonstrated by the | | |
| | | | | | to Santander UK from other providers. | | | | good credit quality in newer loan vintages. | | |
| | | | | | | | | | | | |
| | | | | | | | | | | | |
| | | | | | |
| | | | | | | | | | | | |
Annual Report
| | | | | | |
Annual Report | | | | | | In line with the UK’s new reporting regulation, we have improved the 2013 Annual Report in order to give readers a more complete picture of our business model and strategy, the performance and strength of our governance model, and the effectiveness of our risk management. In our Strategic report (pages 2 to 24), we bring together the most relevant information for all our stakeholders. |
| | | | | | |
| | | |
| | | | | | Strategic report |
| | | | | | |
| | 2 | | | | Our heritage |
| | | | | | |
| | 3 | | | | Santander UK today |
| | | | | | |
| | 4 | | | | Our strategy and business model |
| | | | | | |
| | 6 | | | | Key performance indicators |
| | | | | | |
| | 8 | | | | Chief Executive Officer’s review |
| | | | | | |
| | | | | | Ana Botín gives an overview of Santander UK’s three strategic priorities and the overall business performance in 2013, as we work to build a simple, personal and fair Santander UK for all our stakeholders. |
| | | | | | |
| | | |
| | | | | | |
| | | | | | |
| | 12 | | | | Chief Financial Officer’s review |
| | | | | | |
| | | | | | Stephen Jones reports on our financial progress, profitability and the further strengthening of our balance sheet in 2013. |
| | | | | | |
| | | |
| | | | | | |
| | | | | | |
| | 15 | | | | Summary risk report |
| | | | | | |
| | 19 | | | | Chair’s statement and Corporate Governance review |
| | | | | | |
| | | | | | Lord Burns sets out our commitment to the highest standards of corporate governance in line with UK best practice, our approach to remuneration, our people, our culture, our communities and the environment. |
| | | | | | |
| | | |
| | | | | | |
| | | | | | Detailed business review |
| | | | | | |
| | 25 | | | | Group and divisional results |
| | | | | | |
| | 39 | | | | Balance sheet review |
| | | | | | |
| | 61 | | | | Risk management report |
| | | | | | |
| | | | | | |
| | | | | | |
| | | | | | Governance |
| | | | | | |
| | 165 | | | | Directors |
| | | | | | |
| | 169 | | | | Corporate Governance report |
| | | | | | |
| | 178 | | | | Directors’ Remuneration report |
| | | | | | |
| | 188 | | | | Directors’ Report |
| | | | | | |
| | 196 | | | | Directors’ Responsibilities statement |
| | | | | | |
| | 197 | | | | Further remuneration disclosures |
| | | | | | |
| | | | | | |
| | | | | | |
| | | | | | Financial statements |
| | | | | | |
| | 202 | | | | Report of Independent Registered Public Accounting Firm |
| | | | | | |
| | 205 | | | | Primary Financial statements |
| | | | | | |
| | 212 | | | | Notes to the financial statements |
| | | | | | |
| | | | | | |
| | | | | | |
| | | | | | Shareholder information |
| | | | | | |
| | 317 | | | | Risk factors |
| | | | | | |
| | 335 | | | | Contact and other information |
| | | | | | |
| | | | | | |
| | | | | | |
| | 336 | | | | Glossary of financial services industry terms |
| | | | | | |
| | 342 | | | | Forward-looking statements |
| | | | | | |
| | 343 | | | | Other information for US investors |
| | | | | | |
| | | |
| | | | | | This Annual Report contains forward-looking statements that involve inherent risks and uncertainties. Actual results may differ materially from those contained in such forward-looking statements. See ‘Forward-looking statements’ on page 342. |
| | |
| Santander UK plc Annual Report 2013 | | 1 |
Strategic report
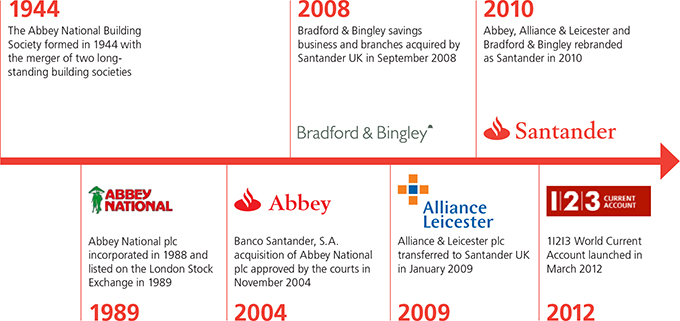
Our heritage
| | | | |
| | | |
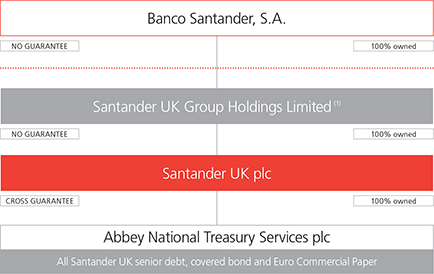
Strong foundations | | Our relationship with the Banco Santander group The Banco Santander group operates a subsidiary model. This model involves autonomous units, such as Santander UK, operating in core markets, with each unit being responsible for its own liquidity, funding and capital management on an ongoing basis. The model is designed to minimise the risk to individual Banco Santander group units from problems arising elsewhere in the Banco Santander group. The subsidiary model also gives Santander UK considerable financial flexibility, yet enables it to continue to take advantage of the | | significant synergies that come from being part of a global group; in brand, products, systems, platforms, development and management capability. In the model the Banco Santander group facilitates the sharing of best practice and provides common technology, operations and support services to all of its subsidiaries via independent operating entities, themselves established by the Banco Santander group so as to be able to continue operating as viable standalone businesses.  For more information see the Directors’ Report on page 188. For more information see the Directors’ Report on page 188.
|
| |
| | 
|
(1) With effect from 10 January 2014
| | |
| 2 | | Santander UK plc Annual Report 2013 |
Strategic report
Santander UK plc (the ‘Company’) and its subsidiaries collectively (‘Santander UK’ or the ‘Santander UK group’) operate primarily in the UK, are regulated by the UK Prudential Regulation Authority (‘PRA’) and the Financial Conduct Authority (‘FCA’) and are part of the Banco Santander, S.A. group (the ‘Banco Santander group’). Santander UK is a major financial services provider in the United Kingdom, offering a wide range of personal financial products and services, and is a growing participant in the corporate and commercial banking market. Santander UK is well positioned to continue to grow, with a distribution capability across an extensive branch and regional Corporate Business Centre (‘CBC’) network.
| | | | | | | | | | | | |
Established UK market player | | | | | | | | | | | | |
| | | | | | | | | | | | |
Employees | | | | Branches | | | | Corporate Business Centres | | | | Active customers |
| | | | | | | | | | | | |
| | | | | | | | | | | | |
19,643 | | | | 1,010 | | | | 50 | | | | 14m |
| | | | | | | | | | | | |
Our businesses | | | | | | | | | | | | |

| | | | 
| | | | 
| | | | 
|
| | | | | | |
| Retail Banking | | | | Commercial Banking | | | | Markets | | | | Corporate Centre |
| Offers a wide range of products and financial services to individuals and small businesses (with a turnover of less than £250,000 per annum) through a network of branches and ATMs, as well as through telephony, e-commerce and intermediary channels. | | | | Provides a wide range of products and financial services to customers through a network of regional corporate business centres and through telephony and e-commerce channels across SME, mid-cap corporates and large-cap corporates. | | | | Delivers risk management and other services to financial institutions, as well as to other Santander UK divisions. Its main product areas are fixed income and foreign exchange, equities, capital markets and institutional sales. | | | | Principally comprises Financial Management & Investor Relations (‘FMIR’), responsible for managing capital and funding, balance sheet composition, structural market risk and strategic liquidity risk for the Santander UK group. Also includes the non-core corporate and legacy portfolios. |
| | | | | | | | | | | | |
Income | | | | Income | | | | Income | | | | Short-term funding |
| | | | | | |
| £3,673m | | | | £705m | | | | £108m | | | | £21.2bn |
Profit before tax | | | | Profit before tax | | | | Profit before tax | | | | Total wholesale funding |
| | | | | | |
| £1,598m | | | | £273m | | | | £4m | | | | £65.7bn |
Residential mortgages | | | | Customer loans | | | | Total assets | | | | Total liquid assets |
| | | | | | |
| £148.1bn | | | | £22.1bn | | | | £19.3bn | | | | £73.0bn |
Loyal customers | | | | Customers | | | | | | | | |
| | | | | | |
| 2.7m | | | | 71,000 | | | | | | | | |
(1) Data at 31 December 2013 and the year ended 31 December 2013
| | |
| Santander UK plc Annual Report 2013 | | 3 |
Strategic report
| | | | |
Our strategy and business model | | Our purpose is to help people and businesses prosper throughout the United Kingdom |

| | |
| 4 | | Santander UK plc Annual Report 2013 |
Strategic report
| | |
| Santander UK plc Annual Report 2013 | | 5 |
Strategic report
| | | | |
Key performance indicators | | Key performance indicators (‘KPI’s) help measure our progress against our strategic priorities, and represent the set of measures that management reviews and tracks on a regular basis. In 2013, business performance improved and we remain focused on delivering our key commitments for the end of 2015. |
| | | | | | |
Strategic Priority | | Performance indicator | | Why is it monitored? | | |
| | | |

Loyal and satisfied retail customers | | Loyal customers | | | | |
| | Defined as primary current account customers who hold a debit card and at least one additional product. Primary current account customers have a minimum credit turnover of at least £500 per month and at least two direct debits set up on the account. | | As part of the transformation to a more customer- focused organisation, we seek to develop and build deeper customer relationships through increased current account primacy and customer segmentation. | | |
| | |
| | Number of 1I2I3 World customers | | | | |
| | 1I2I3 World products provide cashback for customers who bank with us and increase utilisation of their accounts. Since their introduction in late 2011, we track the number of single and joint account holders of our range of 1I2I3 World products. | | The 1I2I3 World products are a key to our strategy of building deeper customer relationships and delivering value to our customers. | | |
| | |
| | | |
| | Customer satisfaction (‘Financial Research Survey’) | | | | |
| | An independent monthly survey of approximately 5,000 consumers covering the personal finance sector, run by GfK. The ‘Overall Satisfaction’ score refers to the proportion of extremely satisfied and very satisfied customers for the three month rolling average. See footnote on page 11. | | We continue to place significant focus on improving the customer experience and put it at the heart of our customer engagement model. | | |
|
| | | |

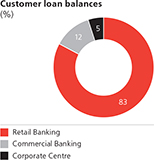
‘Bank of Choice’ for UK companies | | Commercial Banking percentage of customer loans | | | | |
| | Commercial Banking is defined as lending to corporate customers with a turnover in excess of £250,000 per annum, and includes SME, mid-cap corporates, large-cap corporates and multinationals. This ratio is defined as gross customer balances as a percentage of total gross customer loan balances. | | A key element of our strategy is to diversify the business mix, in terms of income and customer base, and thus provide a better strategic balance to capitalise on key business opportunities and to manage the risk cycles. | | |
|
| | | |

Consistent profitability and a strong balance sheet | | Return on tangible equity (‘RoTE’)(2) | | | | |
| | Defined as profit attributable to ordinary shareholders divided by average shareholders’ equity, less preference shares and intangible assets (including goodwill). Formerly known as return on tangible book value. | | We monitor RoTE as a measure of how much profit has been generated by the equity invested by ordinary shareholders, thus measuring overall profitability and the sustainability of the business. | | |
| | |
| | Cost-to-income ratio | | | | |
| | Defined as total operating expenses, excluding provisions and charges, divided by total operating income. | | We review the cost-to-income ratio in order to measure our operating efficiency. | | |
| | |
| | | |
| | Common Equity Tier 1 (‘CET 1’) capital ratio(2) | | | | |
| | Defined on the basis of the Capital Requirements Directive IV (‘CRD IV’) rules (which implement Basel III in the EU from 1 January 2014) due to apply at the end of the transitional period. | | We monitor the CET 1 capital ratio to support economic capital requirements and the capacity to grow while maintaining sufficient capital resources to meet the minimum regulatory requirements. | | |
| | |
| | | |
| | Loan-to-deposit ratio | | | | |
| | Defined as loans and advances to customers (excluding reverse repos) divided by deposits by customers (excluding repos). | | We monitor the loan-to-deposit ratio to assess our ability to fund commercial operations with commercial borrowings, reducing reliance on wholesale markets. | | |
| | |
| | | |
| | Non-performing loan (‘NPL’) ratio | | | | |
| | Defined as the non-performing loans as a percentage of loans and advances to customers. | | We review the NPL ratio as an important measure of risk in our business to ensure it remains consistent with our low-to-moderate risk appetite. | | |
| | |
| | | |
(1) Income for 2012 included a gain from the capital management exercise. The cost-to- income ratio for the year ended 31 December 2012 of 53% excludes this gain. Including this gain, the 2012 cost-to-income ratio was 45%.The cost-to-income also in 2012 is a non-IFRS measure due to the exclusion of the gain on the capital management exercise. (2) Non-IFRS measure. See page 345. | | Dividend payout ratio | | | | |
| | Defined as the dividend paid and declared in the period on our ordinary shares as a percentage of retained earnings. | | We monitor the dividend payout ratio to ensure we are able to grow the business while maintaining an appropriate return to our shareholder. | | |
| | |
| 6 | | Santander UK plc Annual Report 2013 |
Strategic report
| | | | | | | | | | |
Target for 2015 | | Actual performance | | Performance in 2013 | | |
| | 2013 | | 2012 | | 2011 | | | | |
4 million | | 2.7 million | | 2.2 million | | 1.6 million | | Our loyal customer base continued to grow strongly helped by the success of the 1I2I3 World Current Account. | | |
4 million | | 2.4 million | | 1.3 million | | 0.1 million | | We maintained strong growth, with over one million new 1I2I3 World customers in 2013. This was accompanied by further growth in current account balances, which reached £27.9bn, a 75% increase in the year. | | |
Top 3 | | 58% | | 55% | | 51% | | We made a significant improvement in customer satisfaction since December 2011, reducing the gap between us and the top 3 peers. | | |
(Average of top 3 peers) | | (60%) | | (60%) | | (61%) | | | | |
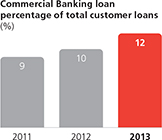
20% | | 12% | | 10% | | 9% | | We continued to make good progress, with customer loans increasing by £2.5bn to £22.1bn in 2013. We will not compromise our prudent risk management to meet the 20% target and if we are not satisfied with the credit quality of the opportunities available to us we would choose to slow the pace of corporate loan growth. | | |
13%-15% | | 8.9% | | 9.1% | | 9.0% | | RoTE of 8.9% increased from an annualised 8.3% for the first half, driven by a continued improvement in net interest income. RoTE is affected by the amount of capital we hold; at a 10.5% CET 1 capital ratio, RoTE would have been c. 9.5% for full year 2013. | | |
<50% | | 54% | | 53%(1) | | 47% | | Up from 53% in 2012, excluding the gain from the capital management exercise. Our focus on cost discipline remains, as we manage business-as-usual and secure further efficiencies in order to maintain the capacity to invest further. | | |
>10.5% | | 11.6% | | 11.1% | | n/a | | We strengthened our estimated CET 1 capital ratio to 11.6% with a CRD IV end point leverage ratio of 3.3% and 3.0% on a post-PRA adjustment basis. Issuance of Additional Tier 1 capital, planned for 2014, as well as retained profits, are expected to result in a gradual improvement in leverage ratios in 2014. | | |
<130% | | 126% | | 129% | | 135% | | We continued to strengthen our balance sheet with selective deleveraging in mortgages and growing our current account and savings balances. We remain comfortable with the current position, given that it is underpinned by prime UK residential mortgages. | | |
ratio maintained | | 2.04% | | 2.16% | | 1.93% | | The improvement in 2013 largely reflected disciplined risk management, notwithstanding the increased share of Commercial Banking lending in the business mix. | | |
50% | | 47% | | 48% | | 47% | | Our dividend payout ratio was maintained in line with that for the Banco Santander group. All dividends are paid subject to the approval of the regulator and in 2013 we declared dividends totalling £425m. | | |
| | |
| Santander UK plc Annual Report 2013 | | 7 |
Strategic report
| | | | |
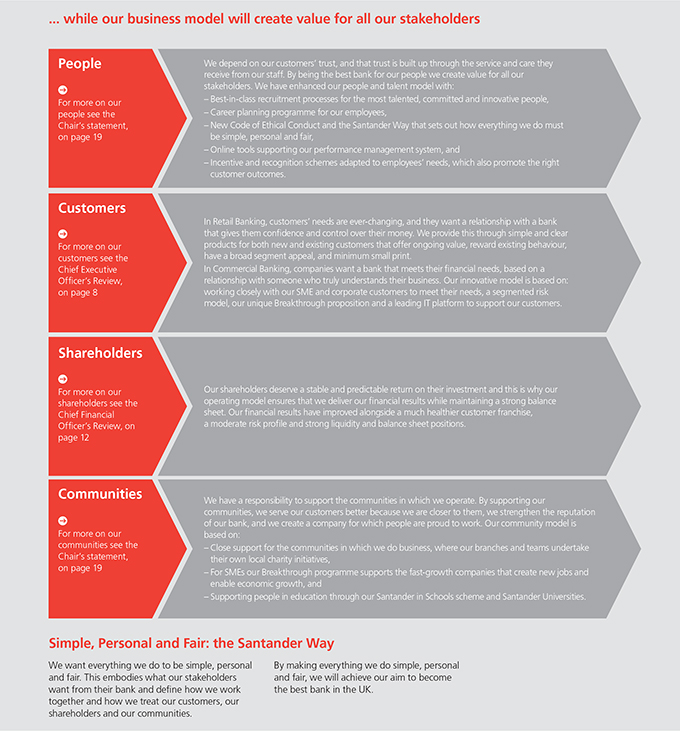
Chief Executive Officer’s review | | Our purpose at Santander UK is to help individuals and businesses prosper. To do this, we have set ourselves an ambitious aim:to be the best bank for our people, our customers, our shareholders and our communities. We believe we need to serve all of these groups in a balanced way because this is how we will build a sustainable business. |
| | | | |

Ana Botín Chief Executive Officer 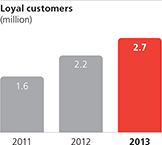
| | To become the best bank, we need to continue to innovate and challenge the status quo. We are doing this by building a bank that issimple, personal and fair in how it treats its people, cares for its customers, serves its shareholders and supports its communities. Our aim is to be the best bank to work at for ourpeople. We are committed to creating an inclusive culture in which all our people feel valued and able to fulfil their potential. This means providing excellent opportunities for career progression and encouraging accountability and teamwork. We are also focused on creating a safe and healthy environment for our employees and providing training, coaching and advice. To become the best bank for ourcustomers, we are listening to them and building a new proposition around the things they value. In Retail Banking, we have developed simple and clear products that reward both new and existing customers with ongoing value. In Commercial Banking, we build partnerships with our customers by tailoring our products to meet their needs. Only by delivering what customers want, and anticipating their needs, will we earn their trust and loyalty, which are the foundations upon which all long-lasting customer relationships are built. | | As a result, a new customer joined our 1I2I3 World every 30 seconds, our customer experience performance continued to improve, and we welcomed more current account switchers than any other bank, making a net gain of 11% of accounts transferred. By delivering better results for our people and our customers, we have delivered better quality results for ourshareholders. We increased our profits, excluding significant items, by 13%, while continuing to strengthen our balance sheet and capital position at the same time. We achieved all this while continuing to support thecommunities in which we operate. Last year we lent £18.4bn of mortgages to UK households, including £3.4bn to first-time buyers. Our unique Universities programme also continued to deliver a very significant impact, with more than 70 institutions already among our partners. Our strategic priorities 1. Loyal and satisfied retail customers Our 1I2I3 World is driving our success with innovative, personal products that put the customer at the heart of everything we do. Our Retail Banking business model is based on simple and clear products for new and existing customers, that offer ongoing value, reward existing behaviour, have a broad segment appeal and minimum small print. |
| | |
| 8 | | Santander UK plc Annual Report 2013 |
Strategic report
By applying these principles, we have grown our loyal customer base to 2.7 million. We now have 2.4 million 1I2I3 World customers, an increase of 1.1 million over 2012, and during the year more than 232,000 customers switched their bank account to us from other providers.
As a result, 1I2I3 Current Account balances are up by 75% and total deposits held by primary banking customers increased by 43%.
We continued to improve our customer experience rankings. The Financial Research Survey (‘FRS’) reported that since December 2011 the gap between our satisfaction score and the average for the top 3 peers had narrowed.
Furthermore, independent market research from MoneySavingExpert.com has suggested that this improvement in satisfaction has been even more marked among our 1I2I3 World customers.
We made significant investments in our distribution channels. We refurbished almost 10% of our branch network and improved our processes and customer self-service capabilities.
In addition, we developed our Select proposition for wealthier customers and enhanced our digital and mobile services.
2. ‘Bank of Choice’ for UK companies
Our innovative Commercial Banking business model is based on four pillars: working closely with our SME and corporate customers to meet their needs, a segmented risk model, our unique Breakthrough proposition, and a leading IT platform to support our customers.
Our lending to UK companies grew by 13% in 2013, increasing the weight of our Commercial Banking business from 10% to 12% of our total UK customer loans.
We continue to invest in this business, opening 16 new Corporate Business Centres and hiring almost 150 new Relationship Managers.
We also improved our corporate banking capabilities, products and systems including the launch of a cash management tool, an online SME corporate banking platform, and our international trade finance portal. We developed our range of ancillary business services for large corporate customers, drawing on the experience and capabilities of the Banco Santander group.
Our unique Breakthrough programme directly benefited more than 390 fast-growth SMEs throughout the UK, helping to create over 600 new jobs and funded over 500 internships in SMEs.

The Breakthrough programme has already delivered:
| | — | £14m of growth capital and over £15m of other lending to 14 businesses, with more than 300 SMEs in the pipeline for future lending |
| | — | The creation of more than 600 new jobs in SMEs |
| | — | 50 SMEs participating in 6 trade missions to New York, Boston and Brazil |
| | — | Over 90 SMEs participating in Breakthrough MasterClasses with Google, LoveFilm, Innocent, McLaren and Saatchi & Saatchi |
| | — | Working with Santander Universities, 550 graduate interns placed with SMEs in 2012-13 and a further 1,500 allocated for 2013-14 |
| | — | Face-to-face engagement with over 2,500 SMEs via Breakthrough events all over the country |
| | |
| Santander UK plc Annual Report 2013 | | 9 |
Strategic report
Chief Executive Officer’s review
continued
While our goal for Commercial Banking is still a 20% share of customer loans, we will not compromise our prudent risk management to meet it. If we are not satisfied with the credit quality of the opportunities available to us, we will slow the pace of our corporate loan growth.
3. Consistent profitability and a strong balance sheet
We delivered strong results that reflect our diversified retail and growing commercial banking businesses and our prudent risk management. Our profit after tax from continuing operations was £921m, up 13% excluding the impact of significant items in 2012.
Our banking net interest margin (‘Banking
NIM’)(1) of 1.55% for the full year rose steadily over the course of the year, from 1.46% in the first half of 2013 to 1.65% in the second half of the year and reaching 1.71% in the fourth quarter. This rise was driven by an improved mortgage stock margin, reduced cost of retail liabilities and increased lending in Commercial Banking, offset by the continued impact of the low interest rate environment.
We remained focused on cost discipline as we managed higher operational, technological and regulatory costs while continuing to invest significantly in the business. Our increase in costs was limited and we remain confident of achieving our cost-to-income target of 50% by 2015.
We strengthened our capital position even further, with an estimated end point CET 1(1)capital ratio of 11.6%, and maintained a conservative liquidity position.
| (1) | Non-IFRS measure. See page 345. |
Our annualised RoTE(1) in the second half of the year increased to 8.9% from 8.3% in the first half of the year, driven by the steady improvement in our net interest income. RoTE is affected by the amount of capital we hold, and had our CET 1 capital ratio been 10.5%, our RoTE in 2013 would have been approximately 9.5%.
Looking ahead
In 2013, we laid many of the foundations of a bank that is simple, personal and fair. I would like to thank our people for their dedication and hard work and our customers for their trust and loyalty.
I would also like to extend my appreciation to the Santander Group and to our Santander UK Board for their continued confidence in our strategy to become a customer-focused, diversified, retail and commercial bank.
With the UK economy strengthening, we remain on target to deliver our 2015 goals. For the year ahead, we have a clear plan to deliver sustainable and balanced growth: we will continue to innovate and challenge our competitors by deliveringsimple, personal and fair products and services to our customers.

Ana Botín
Chief Executive Officer
26 February 2014
| | |
| 10 | | Santander UK plc Annual Report 2013 |
Strategic report
| | | | |
Operating environment | | The UK economic environment has strengthened and has provided a more positive backdrop to 2013, while indications of increased confidence lead us to be cautiously optimistic regarding the outlook for 2014 and beyond. |
| | |
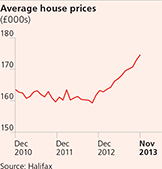
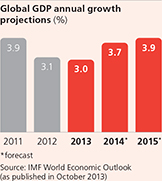
| | The macroeconomic environment Economic activity in the UK showed a clear improvement during 2013, with GDP growth of 1.9% in the year, a marked improvement on the 0.3% recorded in 2012 and the strongest performance since 2007. The overall level of output is, however, still 1.3% lower than in 2008 before recession took hold. As 2013 progressed, there were signs of improved consumer and business confidence as well as stronger activity in the housing market, and a steady growth in consumer spending provided the most significant support for the increase in activity. The improvements in confidence and housing market activity were, however, from relatively low levels, and the economy continued to face headwinds, especially from the squeeze on households’ real average earnings and a relatively high rate of unemployment. With households slowly increasing their level of debt (mortgage debt grew by 0.9% in 2013) there continued to be some rebalancing of finances as retail deposits grew more strongly than borrowing (by 5%). One major change in 2013 was the Bank of England’s introduction of forward guidance for monetary policy. In setting a threshold for the unemployment rate at 7%, the Monetary Policy Committee (‘MPC’) also reaffirmed the commitment to the 2% inflation target. At the end of the year, the Bank of England Base Rate had been held at its all-time low of 0.5% since March 2009 and quantitative easing (‘QE’) had been held at £375bn, with the last decision to increase QE taken in July 2012. The Bank of England’s forward guidance policy was subsequently updated in February 2014. | | Outlook Information published by the UK Office for National Statistics showed increased GDP in the fourth quarter of 2013 while survey indicators of economic activity for the same period published by Markit also indicated that the economy entered 2014 with some momentum for growth. Monetary policy remains supportive, with a forward guidance approach in place. The recovery is expected to be sustained in 2014, with growth of about 2.5% expected in the year, which would be the strongest annual performance since 2007. Continued growth in output should support a further reduction in the unemployment rate, although the extent to which the rate could fall is highly uncertain and is related to the extent to which productivity growth picks up as the economic recovery continues. The housing market recovery, too, is anticipated to continue. After increasing by 7.5% in 2013 (on the Halifax house price index), we expect a further rise in house prices of around 6% in 2014, although any such predictions are subject to considerable uncertainty. Regulation Significant uncertainty still remains and a number of key regulatory changes will have an impact on the market in which we operate. In 2014 we require further clarity on regulation, including in respect of minimum capital levels, leverage and the implementation of ICB ring-fencing, where there remain considerable uncertainties. |
| | The Financial Research Survey (‘FRS’) is a monthly personal finance survey of around 5,000 consumers prepared by the independent market research agency, GfK NOP. The ‘Overall Satisfaction’ score refers to a proportion of extremely and very satisfied customers across mortgages, savings, main current accounts, home insurance, UPLs and credit cards, based on a weighting of those products calculated to reflect the average product distribution across Santander UK and competitor brands. Data shown is for the three months ending 31 December 2013, three months ending 31 December 2012 and three months ending 31 December 2011. The competitor set included in this analysis is Barclays, Halifax, HSBC, Lloyds TSB and NatWest. |
| | |
| Santander UK plc Annual Report 2013 | | 11 |
Strategic report
Chief Financial
Officer’s review

Stephen Jones
Chief Financial Officer
This year we delivered profit before tax from continuing operations of £1,139m and profit after tax of £921m, with a continued recovery in net interest income, strong cost discipline and satisfactory credit quality.
Overview
Banking NIM(4) improved to 1.55% (2012: 1.36%), with strong recovery in the second half of the year, reflecting lower deposit and wholesale funding costs and stronger customer asset margins.
Operating expenses continue to be well-controlled with broadly flat business-as-usual costs. The cost-to-income ratio of 54% (2012: 53%(3)) reflects our ongoing investment in business growth and income pressures from structural market conditions experienced in 2012 that carried through into the first half of 2013. We maintained good credit quality across our Retail Banking and Commercial Banking portfolios. RoTE(4) of 8.9% for the year increased from an annualised 8.3% for the first half of 2013, driven by a continued improvement in net interest income.
In 2013, Santander UK declared dividends totalling £425m, in line with its dividend policy to pay 50% of retained earnings with the approval of the UK regulator. The first half dividend of £215m was paid in September 2013 and the second half dividend of £210m will be paid in March 2014.
Income statement highlights(A)
Net interest income in the year ended 31 December 2013 was 8% higher at £2,963m (2012: £2,734m), primarily due to an improved mortgage stock interest margin, an increased contribution from Commercial Banking loans and lower customer deposit funding costs, particularly in the second half of 2013. Net interest income in the last quarter was the highest for the last two years, driving a strong recovery in Banking NIM(4) from 1.46% in the first half to 1.65% in the second half and to 1.71% in the last quarter.
Non-interest income decreased by 45% or £883m, to £1,066m (2012: £1,949m), largely due to the non-repetition of the gain of £705m on the capital management exercise in 2012. Excluding this gain, non-interest income decreased by £178m in 2013, with lower retail investment and protection fee income and lower demand for interest rate and foreign exchange risk management products from corporate customers.
Costs remained tightly controlled, with total operating expenses up 4% to £2,195m (2012: £2,114m). This was despite our ongoing investment in business growth and increased regulatory compliance and control costs. Investment in systems continued to support the business transformation and underpin future efficiency.
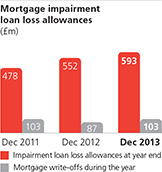
Impairment losses on loans and advances decreased by 52% or £513m to £475m (2012: £988m), mainly due to the non-repetition in 2013 of a £335m credit provision included for the non-core corporate and legacy portfolios arising in 2012. Credit quality in the Retail Banking and Commercial Banking loan books continued to be satisfactory.
Provisions for other liabilities and charges decreased by £214m to £220m, largely due to the non-repetition in 2013 of a £232m conduct remediation provision as well as a £55m provision for termination costs that arose in 2012. Further conduct remediation provisions were not required in 2013.
The volume of PPI activity decreased and the number of complaints we received fell 29% in 2013, although the high proportion of invalid complaints continued. Monthly PPI redress costs decreased through the year to an average in the fourth quarter of the year of £11m per month, compared to a monthly average of £18m for the full year 2013 and £26m in 2012. A provision balance of £165m was held at the end of the year.
| (A) | Income statement highlights |
| | | | | | | | |
| Year ended 31 December | | 2013
£m | | | 2012
£m | |
Profit before tax from continuing operations | | | 1,139 | | | | 1,147 | |
Profit after tax from continuing operations | | | 921 | | | | 877 | |
Profit for the year | | | 913 | | | | 939 | |
Banking net interest margin (‘NIM’)(2)(4) | | | 1.55% | | | | 1.36% | |
Cost-to-income ratio(3) | | | 54% | | | | 53% | |
Return on tangible equity (‘RoTE’)(4) | | | 8.9% | | | | 9.1% | |
| | (1) | Income Statement highlights statistics reflect continuing operations, and therefore exclude the results and loss on sale of discontinued operations. See Note 12 to the Consolidated Financial Statements. |
| | (2) | Banking NIM comprises net interest income divided by average customer loans. |
| | (3) | The cost-to-income ratio for the year ended 31 December 2012 of 53% excludes the gain from the capital management exercise (45% including this gain). The cost-to-income also in 2012 is a non-IFRS measure due to the exclusion of the gain on the capital management exercise. |
| | (4) | Non-IFRS measure. See page 345. |
| | |
| 12 | | Santander UK plc Annual Report 2013 |
Strategic report
Following a reassessment of the provision required to cover non-PPI related conduct remediation and enforcement actions in relation to interest rate hedging, Card Protection Plan and retail investments, there was a release during the year. Together with modest utilisation, the combined total was £54m. A provision balance of £222m was held at the end of 2013.
The taxation charge was 19% lower, largely attributable to the impact of the continued reduction in the main corporation tax rate affecting current and deferred tax.
Total UK taxes paid in 2013 were £467m (2012: £563m). In addition amounts totalling £595m (2012: £541m) were collected and remitted to HM Revenue and Customs on behalf of customers and employees.
Customer balances(B)
We continued to focus on improving the strength of our balance sheet. Customer loans decreased £7.6bn in 2013 to £187.1bn, reflecting a managed reduction in selected higher risk segments of the residential mortgage portfolio, partially offset by increased corporate loans. Interest-only mortgage loan balances reduced by £6.4bn, following the targeted deleveraging of the portfolio that began in early 2012. Commercial Banking customer loans increased 13% with lending subject to continued prudent risk management criteria. Total customer deposits decreased £2.2bn in 2013 to £146.4bn. The success of the 1I2I3 World proposition increased current account balances by 75% since 31 December 2012 to £27.9bn while we continued to reduce short-term, rate sensitive retail deposits and executed a smaller cross tax year ISA campaign in line with the overall funding plan.
The loan-to-deposit ratio improved three percentage points to 126%. We remain comfortable with the current position, given that it is underpinned by UK residential mortgages.
Credit quality(C)
During 2013, the total NPL ratio decreased to 2.04%. The increase in the mortgage NPL ratio, to 1.88%, was partially offset by a reduction in the Commercial Banking and Corporate Centre NPL ratios to 3.02% and 2.36% respectively. The rise in the mortgage NPL ratio was largely due to regulatory-driven policy and reporting changes, as well as the impact of lower mortgage balances. These policy and reporting changes are not expected to result in significant additional write-offs. Overall mortgage NPL balances were broadly unchanged during 2013 and notwithstanding the increase in balances attributable to policy and reporting changes, the NPL ratio stabilised in the second half of the year. The Commercial Banking NPL ratio decreased, largely from the exit of a small number of older vintage loans that were acquired with Alliance & Leicester.
Commercial Banking lending in the last four years has performed well with a much lower NPL ratio in these vintages. The Corporate Centre NPL ratio decreased, reflecting the successful ongoing sale and run-off of the non-core corporate and legacy portfolios.
Liquidity and funding
From late 2012 and through 2013, we undertook a modest reduction in our liquidity position, given improved stability in capital markets, a stronger balance sheet and a reduced reliance on short-term funding markets. During 2013, total liquid assets decreased by £3.0bn to £73.0bn and PRA-eligible liquid assets decreased by £7.4bn to £29.5bn. Both total and PRA-eligible liquid assets significantly exceeded short-term wholesale funding requirements. At 31 December 2013, PRA-eligible liquid assets amounted to 139% of wholesale funding with a residual maturity of less than one year. At the end of 2013 the Liquidity Coverage Ratio (‘LCR’) was in excess of 100%.
Our overall funding strategy is to develop and maintain a diversified funding base, which allows us access to a variety of funding sources and in 2013, we raised £7bn (sterling equivalent) of medium-term funding, largely through unsecured issuances.
| | | | | | | | |
| 31 December | | 2013
£bn | | | 2012
£bn | |
Total customer loans | | | 187.1 | | | | 194.7 | |
Total customer deposits | | | 146.4 | | | | 148.6 | |
Loan-to-deposit ratio(1) | | | 126% | | | | 129% | |
| | (1) | Calculated as loans and advances to customers (excluding reverse repos) divided by deposits by customers (excluding repos). |
| | | | | | | | |
| Year ended 31 December | | 2013
% | | | 2012
% | |
Retail Banking NPL ratio | | | 1.89 | | | | 1.76 | |
– of which mortgage NPL ratio(1) | | | 1.88 | | | | 1.74 | |
Commercial Banking NPL ratio(1) | | | 3.02 | | | | 4.26 | |
Corporate Centre NPL ratio(1) | | | 2.36 | | | | 4.49 | |
Total NPL ratio(1) | | | 2.04 | | | | 2.16 | |
| | (1) | NPL balance as a percentage of the asset balance. |
| | |
| Santander UK plc Annual Report 2013 | | 13 |
Strategic report
Chief Financial Officer’s review
continued
Capital(D)
Our Core Tier 1 capital ratio rose to 12.9%, from 12.2% at the end of 2012, driven by retained profits and lower RWAs. RWAs decreased to £75.3bn, with a reduction in retail mortgage loans partly offset by the increased proportion of the loan book represented by corporate lending. Our estimated CRD IV end point CET 1(1) capital ratio at 31 December 2013 was 11.6% (2012: 11.1%). We expect that the strength of our Core Tier 1 and CET 1 capital ratios, our ability to generate capital organically and rebalancing of our business mix will enable us to meet our targeted capital ratios even once the capital requirements of CRD IV are phased in.
Our CRD IV end point-based Tier 1 leverage ratio as defined by the PRA was 3.3%, without the benefit of Tier 1 instruments that will become ineligible over the CRD IV transition period, or 3.7% if these instruments are added back. The equivalent end point-based CET 1 leverage ratio is equal to the end point-based Tier 1 leverage ratio as all current Other Tier 1 instruments are assumed to be ineligible under CRD IV rules. We are fully compliant with CRD IV LCR requirement at end 2013, three years ahead of the transitional timetable deadline for compliance.
On 30 July 2013, we undertook a capital management exercise, buying back approximately £500m equivalent of certain US dollar and sterling-denominated Tier 1 and Tier 2 capital instruments, with a view to optimising our capital position. The transaction impacted the total capital ratio by approximately 60 basis points and generated a small profit.
Outlook
We expect the developments in the business and investment made in 2013 to result in improved performance in 2014. A further reduction in overall cost of deposits is expected to compensate for any further asset margin declines. Our disciplined management of business-as-usual costs will be maintained, while investing in the growth of our corporate and retail propositions. Furthermore, liquidity balances will be managed down, but at a more modest pace.
We believe that our performance over time should continue to demonstrate the underlying stability of our business.

Stephen Jones
Chief Financial Officer
26 February 2014
| | | | | | | | |
| 31 December | | 2013
£bn | | | 2012
£bn | |
Core Tier 1 capital | | | 9.7 | | | | 9.3 | |
Core Tier 1 capital ratio | | | 12.9% | | | | 12.2% | |
CET 1 capital ratio(1) | | | 11.6% | | | | 11.1% | |
Risk Weighted Assets (‘RWAs’) | | | 75.3 | | | | 76.5 | |
CRD IV end point CET 1 leverage ratio | | | 3.3% | | | | 3.3% | |
CRD IV end point CET 1 leverage ratio post PRA adjustments | | | 3.0% | | | | 3.0% | |
| | (1) | Non-IFRS measure. See page 345. |
| | |
| 14 | | Santander UK plc Annual Report 2013 |
Strategic report
Summary risk report
As a significant financial services provider, managing risk is at the core of Santander UK’s day-to-day activities. The understanding and control of risk is critical for the effective management of the business.
Risk management
In managing risk, Santander UK aims to:
| – | Maintain a predictable medium-low risk profile in our business; |
| – | Employ effective and advanced risk management techniques; and |
| – | Deliver robust financial performance, and ultimately build sustainable value for all our stakeholders. |
Risk framework
Santander UK manages and controls risk through its Risk Framework, which:
| – | Defines risk, enterprise-wide risk and key risk types; |
| – | Sets out the required risk culture, the overriding principles and minimum standards; |
| – | Summarises key roles and responsibilities and how Santander UK is organised for risk; |
| – | Defines the terms of reference for risk committees and how and where decisions are made, reviewed and challenged; and |
| – | Lists and explains the key internal risk regulation documents. |
The Risk Framework supports the implementation of Santander UK’s strategic business objectives and business plan via the risk culture statement, guiding overriding principles and minimum standards to manage and control risks, and thus reduces the uncertainty around Santander meeting its objectives.
Separate risk frameworks are in place for each key risk type and core risk activities such as those relating to risk appetite, stress testing and policy. These specific risk frameworks establish the principles, standards, rules and governance requirements for the management and control of each risk type. In support of these frameworks, each specific risk type has its own suite of policies and limits. These set out the rules and risk limits for the management of risk at a more granular level.
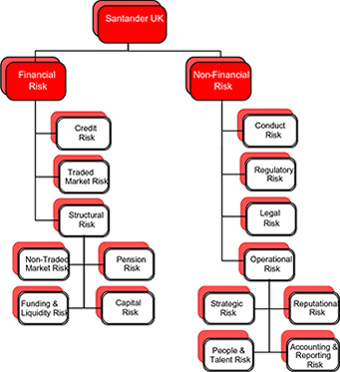
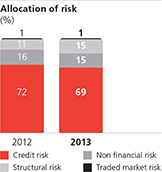
Allocation of risk
A main facet of Santander UK’s business model is focused on retail and commercial lending. Santander UK’s largest source of risk is credit risk. This is illustrated in the chart opposite, which sets out the allocation of risk across Santander UK based on the economic capital requirement at 31 December 2013 and 2012 by key risk type. This allocation is limited to risks for which capital is considered a mitigant, and does not make allowance for the effects of diversification across risks or assets.
At 31 December 2013, structural risk included a pension risk allocation of 5% and a non-traded market risk allocation of 10%. Non-financial risk included an operational risk allocation of 9%.
| | |
| Santander UK plc Annual Report 2013 | | 15 |
Strategic report
| | | | |
Summary risk reportcontinued Top risks | | All of our activities involve, to varying degrees, identification, assessment, management and reporting of risk or combinations of risks. During 2013, senior management focused on certain top and emerging risks and their causes. These are described in the following section, including how they link to our strategic business priorities which are described in more detail on page 4, as well as the change in importance for each of them in 2013. |
| | | | | | |
Risk description | | Strategic priorities | | Risk features and impact | | |
| | | |
Capital Capital risk is the risk that Santander UK does not have an adequate amount, or quality, of capital to meet its internal business objectives, market expectations and regulatory requirements. | | | | Capital risk has the potential to disrupt our business model and stop the normal functions of Santander UK. It could also cause Santander UK to fail to meet the supervisory requirements of regulators. Capital risk is significantly driven by credit risk, pension risk and the effects of regulatory change.  See ‘Capital risk’ on page 144. See ‘Capital risk’ on page 144.
| | |
| | | | |
Conduct Conduct risk is the risk that the business and operational decisions we take and the behaviours displayed lead to poor outcomes for our customers. | | 


| | Conduct risk is a key risk to Santander UK in view of the evolving regulatory environment and the requirement to make significant conduct remediation provisions. Specific conduct risks to which we are exposed include: products and services not meeting customer needs; failing to deal with complaints effectively; and the risk that customers are sold unsuitable products or not provided adequate information to make informed decisions.  See ‘Conduct risk’ on page 147. See ‘Conduct risk’ on page 147.
| | |
| | | |
Credit Credit risk is the risk of financial loss arising from the default or credit quality deterioration of a customer or counterparty to which we have directly provided credit, or for which we have assumed a financial obligation. | |
| | Deterioration in the credit quality of our loans to customers and counterparties could reduce the value of our assets, and increase our write-downs and allowances for impairment losses. Credit risk can be affected by a range of macroeconomic environment and other factors, including increased unemployment, house prices, increased corporate insolvency levels, reduced corporate profits, increased personal insolvency levels, increased interest rates and/or higher tenant defaults. See ‘Credit risk – Retail Banking’ and ‘Credit risk – Commercial Banking’ and ‘Credit risk – Corporate Centre’ on pages 91, 105 and 116. | | |
| | | | |
Liquidity Liquidity risk is the risk that Santander UK, although solvent, either does not have sufficient financial resources available to meet its obligations as they fall due, or can secure them only at excessive cost. | | | | Like all major banks, Santander UK can be impacted by confidence in the wholesale funding markets. Should Santander UK be unable to continue to source sustainable funding due to exceptional circumstances, our ability to fund our financial obligations could be adversely affected. See ‘Liquidity risk’ on page 133. | | |
| | | |
Pension Pension risk is the risk to Santander UK caused by its contractual or other liabilities to or with respect to its defined benefit pension schemes. | | | | The funding position of Santander UK’s pension schemes can be volatile due to the uncertainty of future investment returns and the projected value of scheme liabilities. Key risk factors include long-term interest rates, inflation expectations, salary growth, longevity of the scheme members, investment performance as well as changes in the regulatory environment. These factors may cause additional contributions to be required. They can also directly impact our capital position. See ‘Pension risk’ on page 132. | | |
| | | | |
Operational Operational risk is the direct, or indirect, risk of loss to Santander UK resulting from inadequate or failed internal processes, people and systems, or from external events. | |
| | Operational risk is inherent in the processes Santander UK operates. Examples of operational risks include fraud, process failures, system downtime, and damage to assets due to fire or floods. See ‘Operational Risk’ on page 148. | | |
| | |
| 16 | | Santander UK plc Annual Report 2013 |
Strategic report
Strategic priority key:
| | |

| | Loyal and satisfied retail customers |
| |

| | ‘Bank of Choice’ for UK companies |
| |

| | Consistent profitability and a strong balance sheet |
Top risks
A top risk is defined as being a current risk within our business that could potentially have a material impact on our financial results, reputation and the sustainability of our business model.
| | | | |
| Developments in 2013 | | | | Change in 2013 |
During 2013, regulatory developments had the potential to impact Santander UK’s capital plans materially and were mitigated through close monitoring, scenario analysis and capital issuance during the second half of the year. The finalisation of CRD IV and the PRA’s policy statement on implementation, has removed some of the uncertainties surrounding capital forecasting. | | | | |
As part of a test of the UK banking system, the FPC introduced an effective leverage ratio minimum level ahead of international standards being finalised. Santander UK passed the test on both the risk-based and leverage measures. Both metrics continue to receive close scrutiny. | | | | 
|
The Core Tier 1 ratio improved to 12.9% (2012: 12.2%), reflecting retained profits. The reported CRD IV end point CET 1 leverage ratio was 3.3% (2012: 3.3%). | | | | |
Santander UK commenced a strategic review of conduct risk within the business in the year to identify and address key risk drivers. An enhanced Conduct Risk Framework has been developed to further improve the governance and management of conduct risk. Improvements have been made to specific business processes, such as product governance, as well as to the way the business identifies, manages and reports current, and potential future, conduct risks. | | | |  |
During 2013, there was a decrease in both the volume of PPI activity and the number of complaints we received resulting in lower monthly redress costs, including related costs, throughout the year. Following a reassessment of the provision required to cover non-PPI related conduct remediation and enforcement actions in relation to interest rate hedging, Card Protection Plan and retail investments, there was a release during the year. | | | |
During 2013, the overall Santander UK NPL ratio improved to 2.04% (2012: 2.16%), with the performance across the business units as follows: | | | | |
The Retail Banking NPL ratio increased to 1.89% (2012: 1.76%), partly driven by a planned reduction in the portfolio size, and also due to regulatory-driven policy and reporting changes related to mortgage lending. Credit quality on other Retail Banking lending was also satisfactory, with a particular improvement evident in unsecured personal lending. | | | |
The Commercial Banking NPL ratio decreased to 3.02% (2012: 4.26%) as the credit quality in newer loan vintages remained satisfactory. We continued to adhere to our prudent lending criteria and will maintain this as we further deliver on our business plan and expand Commercial Banking lending. | | | |
The Corporate Centre NPL ratio decreased to 2.36% (2012: 4.49%) reflecting the ongoing sale and run-off of the non-core corporate and legacy assets. | | | |
During 2013, Santander UK enjoyed continued stability in its external credit ratings with both Fitch and Standard & Poors affirming Santander UK’s ‘A’ credit rating. Eligible liquid assets decreased £7.4bn to £29.5bn (2012: £36.9bn). Balances have been managed down in response to regulatory guidance, initially received in the second half of 2012, as well as greater stability in the capital markets and as a consequence of the actions taken to strengthen the balance sheet liquidity over the last three years. | | | |  |
Eligible liquid assets continued to significantly exceed wholesale funding of less than one year, with a coverage ratio of 139% (2012: 152%). | | | |
Further clarity on the implementation of the Basel Liquidity Coverage Ratio (‘LCR’) and Net Stable Funding Ratio (‘NSFR’) has helped to reduce the degree of uncertainty in this area. | | | |
During 2013, the governance framework and responsibilities for managing pension risk were enhanced. This included a dedicated function to oversee the management of pension risk. The pension scheme investment and hedging strategy was also reviewed during the year. Additional controls, triggers and metrics have been introduced to reduce or control inherent risk, while allowing improved monitoring to anticipate any management actions required. | | | | |
The accounting deficit of the scheme deteriorated by £503m during 2013. However, the pension scheme was managed to within the risk triggers over the year, and so from a risk perspective while this deterioration was material it was consistent with the current risk appetite. The deterioration was equivalent to approximately a 1-in-10 year event. | | | |
The full breadth of operational risks in Santander UK has always been closely managed. During 2013, our approach was further developed through more extensive use of industry tools, such as major risk scenario analysis, to help management identify and control risks as our risk profile evolves. | | | |  |
During 2013, there was a significant increase in the attempts at external cyber crime targeted at UK banks. In response to this, and combined with the growth in the volume of automated and online services and transactions, we increased our protection of our systems and data. | | | |
| | |
| Santander UK plc Annual Report 2013 | | 17 |
Strategic report
Summary risk reportcontinued
Emerging and
future risks
Emerging and future risks
An emerging and future risk is defined as being a risk with largely uncertain outcomes which may develop or crystallise in the future. Crystallisation of an emerging risk could have a material effect on long-term strategy.
| | | | |
Timeframe | | Strategic priorities | | Risk description and mitigation |
| | |
Less than 1 year | |
| | UK economic and political environment The financial performance of Santander UK is intrinsically linked to the UK economy. Whilst some evidence of nascent recovery may be apparent, the possibility of economic downturn, along with its concomitant impact on profitability, remains a risk. Equally, the balance of UK economic performance may swing to the up-side, bringing with it the possibility of a higher interest rate environment. In such a scenario, the reaction of our customers and other market participants might result in different patterns of behaviour. These could include increased customer attrition and more competitive product pricing and/or higher loan impairment. In addition, any significant changes in UK Government policies or structure could have an impact on our business. We continue to monitor the potential consequences such changes may have with action to be taken as appropriate. The impacts of this risk may also be seen over more than a one-year period. |
| | |
1-3 years | |
| | Emerging regulation The aftermath of the financial crisis has seen the emergence of a significant volume of additional regulation. In some cases, the impacts this regulation has on Santander UK have become clearer and more precisely quantified. On the other hand, there remains a significant body of new regulation where the impact and timing, remains uncertain. |
| | |
| |
| | IT and business change Santander UK continues to invest in the roll-out of new IT platforms and systems to support its strategic growth plans. As with any significant programme of this nature, there is a need to ensure that the risks associated with the pace of change are properly monitored and controlled. |
| | | |
More than 3 years | |
| | New competitors and technology Innovations in technology applied to the delivery of financial services continued to develop at a rapid pace. We have also seen the advent of new financial services providers. These factors bring with them the potential for increased levels of competition in the medium term. |
Key:
| | |
| | Loyal and satisfied retail customers |
| |
| | ‘Bank of Choice’ for UK companies |
| |
| | Consistent profitability and a strong balance sheet |
| | |
| 18 | | Santander UK plc Annual Report 2013 |
Strategic report
Chair’s statement

Lord Burns
Chair
2013 was an important year for Santander UK in our transition to becoming a better diversified full-service retail and commercial bank. We ended the year in a good position to accelerate the execution of our strategic plan, encouraged by the strengthening UK economic recovery.
2013 review
The Board has continued to consider what Santander UK stands for, its role in society and how to meet its customers’ needs. Our strategy is focused on our clear purpose of helping individuals and businesses prosper. Providing simple, personal and fair solutions will inform how we conduct the business in 2014 and beyond, and will be the underlying guideline for all our people.
We made considerable progress in 2013. Our 1I2I3 World continues to attract new loyal customers as we offer innovative ways for individuals and families to save money, while our focus on the needs of business customers has seen us expand the range of services we can offer too, in our efforts to become the ‘Bank of Choice’ for UK companies.
Our strategy in the UK is not just about the products we offer or how much we can lend; giving back to the community is also very important and I am extremely proud of what we achieved in 2013. Santander Universities expanded its reach, with 72 institutions now in our partnership network, and the Santander UK Foundation made over 2,000 donations to charities in 2013, supporting projects for disadvantaged people. In total, Santander UK’s community-based support programmes saw over £21m provided to help address our priority areas of education, enterprise and employment.
The banking sector continues to face challenges in demonstrating that culture, standards and training are aligned to the expectations of customers and other stakeholders. We are fully engaged with the industry to put in place proposals to meet the challenges. We also continue to work closely with our regulators to ensure that banks have appropriate risk systems and adequate capital to meet unexpected events.
Our Board
As a Board we are committed to continuous improvement and achieving standards of governance in line with UK best practice. During the year, we remained focused on this objective and further strengthened the Board through the appointment of four new Non-Executive Directors: Mike Amato,
Alain Dromer, and Scott Wheway (all of whom are independent in accordance with the UK Corporate Governance Code) and Manuel Soto, who joined the Board after 14 years on the Board of Banco Santander, S.A. Each of our new Directors is working through a tailored induction and development plan to support them in taking up their role.
We also announced that we welcome back Nathan Bostock, who will join the Board as Deputy CEO during 2014. José María Nus, who for the past three years served as Chief Risk Officer, successfully leading the development of a world-class risk management team, will leave the Board later in the year and return to a senior role at our parent company. On behalf of the Board, I thank José María for his dedication and invaluable counsel during this important time.
Our people
I would like to thank all of my colleagues, who have responded admirably to the challenges and opportunities in the past 12 months. We have achieved much, thanks to their pride, commitment and loyalty to doing the right thing for our customers and delivering sustainable value for all our stakeholders.
Governance, remuneration and corporate social responsibility summary
What follows on the next five pages is a summary of our full Corporate Governance and Directors’ Remuneration Reports, as well as a summary of our full Corporate Social Responsibility Report to be published in June 2014 which will also be available on our website at www.aboutsantander.co.uk. This reflects the importance we place on our culture, our people, our communities and the environment in which we operate.

Lord Burns
Chair
26 February 2014
| | |
| Santander UK plc Annual Report 2013 | | 19 |
Strategic report
Corporate
Governance review
Corporate governance framework
Santander UK, as a subsidiary of Banco Santander, S.A., has its own autonomous operating framework and is regulated in the UK by the PRA and the FCA in the UK.
Our ordinary shares are not listed on the London Stock Exchange (‘LSE’) but we do have LSE-listed preference shares. As a result, we are subject to the Listing Rules and the Disclosure & Transparency Rules of the FCA. In addition, although we are not obliged to comply with the UK Corporate Governance Code, we have chosen to follow it in a manner appropriate to our ownership structure. This enables us to implement high standards of corporate governance and other best practice guidance, wherever it is appropriate to do so.
The Board
At 31 December 2013 and the date of this report, the Board comprised the Chair, four Executive Directors, and eleven Non-Executive Directors, six of whom are independent.
The Board has four committees: Board Risk Committee; Board Audit Committee; Board Nomination Committee and Board Remuneration Oversight Committee, the work of which is detailed in the reports from the Chair of each Committee in the Governance Report on pages 172 to 179.
The roles of Chair and Chief Executive Officer are separated and clearly defined. The CEO has delegated authority from the Board for the day-to-day operation of the business and implementation of the Board’s strategy and business plan, and in turn the CEO delegates a number of duties to the Executive Team. The CEO and Executive Team are supported by a number of Executive Level Committees.
The Board is collectively responsible to the shareholders for the long-term success of Santander UK and operates through a formal schedule of matters reserved for its decision, which includes setting corporate strategy, agreeing risk appetite and policies, approving major capital expenditure, acquisitions and disposals, and agreeing the annual budget and business plans.
The Executive and Non-Executive Directors also have different responsibilities that complement each other to provide efficient oversight of Santander UK’s activities as outlined below.
| | |
Executive Directors | | |
| |
| Ana Botín | | José María Nus |
| Chief Executive Officer | | Chief Risk Officer |
| |
| Stephen Jones | | Steve Pateman |
Chief Financial Officer | | Head of UK Banking |
| | |
Key responsibilities of Executive Directors | | |
| — | Deliver the strategy approved by the Board whilst managing the day-to-day operations of Santander UK with due skill, care and diligence, in line with agreed business plans. |
| — | Report regularly to the Board, providing adequate and timely information about each business division to enable the Board to carry out its own responsibilities. |
| — | Provide business direction, aligned to the Santander UK strategy, as members of the Executive Committee. |
| — | Represent Santander UK externally, ensuring that stakeholders are clearly and accurately informed of the business performance and corporate stance on relevant issues. |
| | |
| 20 | | Santander UK plc Annual Report 2013 |
Strategic report
How the Board spent its time in 2013
During 2013, the Board devoted a significant amount of time and focus on driving Santander UK’s strategic transformation. In May 2013, we held the Board Strategy Day where we reviewed the trends in UK banking and considered key initiatives and developments in light of Santander UK’s three strategic themes of loyal and satisfied retail customers, ‘Bank of Choice’ for UK companies and consistent profitability and a strong balance sheet.
During 2013, the Board also devoted time to reviewing its own effectiveness and to complement its own annual review process we commissioned Bvalco Limited, an external consultant, to conduct an external effectiveness review (see below).
Another significant area of focus for the Board in 2013 was recruitment of new Non-Executive Directors, whose knowledge, insight and objectivity complete the existing skills at Board. This recruitment also positions the Board well for the future.
The Board also focused on improving the customer experience and further developing our culture. The Board believes that the right culture is paramount, and that it has a significant role to play in shaping culture and setting the principles and values to deliver long-term success.
As seen in recent times, the UK banking industry has to regain the trust of the public, and in order to support this, the Board approved a new Code of Conduct, applicable to everyone at Santander UK, in order to continue to promote the right culture within the organisation.
Lastly, the Board closely monitored regulatory developments, including the impact from the Financial Services (Banking Reform) Act, the key developments from the Parliamentary Commission on Banking Standards, and the implementation of CRD IV in the UK.
2013 external effectiveness review
In the first half of 2013, the Board Nomination Committee commissioned an external Board Effectiveness review by Bvalco Limited. The review was helpful in identifying potential areas for the Board to examine in order to continue to enhance its effectiveness. While the Board strives for continuous improvement, the review represented a significant positive move to ensure that it continues to improve throughout 2014 and beyond. Details of the review’s findings, together with the associated action plan, were discussed by the Board, and progress against the plan is being monitored through the Board Nomination Committee.
Priorities for 2014
For 2014, the Board will continue to drive forward Santander UK’s strategic transformation. This will ensure that we continue to remain focused on our three business priorities of loyal and satisfied customers, ‘Bank of Choice’ for UK companies and consistent profitability and a strong balance sheet. We will do this whilst striving for continuous improvement as a Board.
| | |
Non-Executive Directors | | |
| |
| José María Carballo | | Juan Rodríguez Inciarte |
| Antonio Escámez | | Manuel Soto |
José María Fuster | | |
| | |
Independent Non-Executive Directors | | |
| |
| Mike Amato | | Alain Dromer |
| Roy Brown | | Rosemary Thorne |
| Bruce Carnegie-Brown | | Scott Wheway |
| | |
Key responsibilities of Non-Executive Directors | | |
| — | Provide an independent perspective on how Santander UK is run. |
| — | Bring balance and a broader perspective through wider knowledge and experience. |
| — | Challenge, and if necessary, seek additional information and explanation from the Executive Directors about decisions, policies, proposals or any aspect regarding the running of Santander UK. |
| — | Carry out the role of Non-Executive Director with integrity, due skill, care and diligence, observing proper standards of market conduct, complying with all statutory and regulatory duties and dealing with regulators in an open and co-operative way. |
| | |
| Santander UK plc Annual Report 2013 | | 21 |
Strategic report
Corporate Governance review
continued
Remuneration reporting
Throughout 2013, Santander UK continued its commitment to transparency and positively engaged with the enhanced legislative requirements for quoted companies in respect of executive remuneration reporting. Despite not being directly subject to those new legislative requirements, both this year’s and last year’s Annual Reports include additional disclosures to ensure the continued transparency on remuneration.
The full Directors’ Remuneration Report in which we outline remuneration and fees paid to the Executive and Non-Executive Directors for 2013 is shown on pages 178 to 187.
Directors’ remuneration(E)
As in 2012, the Board through its Board Remuneration Oversight Committee (the ‘Committee’) monitored closely developments in respect of executive remuneration, particularly in respect of the financial services industry generally and paid special attention to the pronouncements from our lead regulators and the UK Government in this regard. The Board continues to support remuneration practices that encourage financial stability as well as, strong risk management processes and behaviours. The Committee considered a number of key changes to remuneration structures in 2013. In order to better meet the challenges posed to Santander UK, the Committee reviewed the operation of the annual bonus scheme applicable to the senior management group, including the Executive Directors. The Committee approved a number of changes to the metrics used to assess performance including the use of Return on Risk Weighted Assets (‘RORWA’) as a more appropriate measure of capital consumption and the use of a Customer Service Gateway (‘CSG’) to ensure conduct risk is appropriately addressed.
The Board continued to take a considerable interest in ensuring that our remuneration policies and practices are aligned to its risk appetite. In 2012, we introduced an Enterprise-wide Risk Review as part of the bonus pool calculations for all schemes. Such a review was continued into 2013 and is a holistic review of all financial and non-financial risks considered by the Committee after the initial bonus pool calculations had taken place, with the ability for the Committee to reduce all bonus pools by up to 100%.
The Directors’ Remuneration Report on pages 178 to 187 sets out the details of what we paid our Directors in 2013 and why. In summary, our remuneration policies for our Executive Directors are designed to attract, retain and motivate executives of the calibre needed to successfully deliver our business strategy. Remuneration packages are structured to align individual rewards with the performance of Santander UK and the interests of our stakeholders. Furthermore, our remuneration arrangements incorporate performance measures which link remuneration to Santander UK’s key performance indicators, which are directed towards building sustainable value for all our stakeholders. Lastly, the remuneration fees for our Non-Executive Directors, including the Chair, are determined by the Board within the limits set by the Articles of Association and are based on the skills and expected time commitment of the individual concerned, taking account of fees paid in similar companies.
| (E) | Directors’ remuneration |
| | | | | | | | |
| Aggregate Directors’ remuneration | | 2013 £ | | | 2012 £ | |
Salaries and fees | | | 6,185,456 | | | | 5,799,704 | |
Performance-related payments(1) | | | 4,800,051 | | | | 4,265,082 | |
Other taxable benefits | | | – | | | | – | |
Total remuneration excluding pension contributions | | | 10,985,507 | | | | 10,064,786 | |
Pension contributions | | | – | | | | – | |
Compensation for loss of office | | | – | | | | – | |
| | | | 10,985,507 | | | | 10,064,786 | |
| | (1) | In line with the FCA Remuneration Code, a proportion of the performance-related payment was deferred. Further details can be found in ‘Further Remuneration Disclosures’ and in Note 44 to the Consolidated Financial Statements |
| | |
| 22 | | Santander UK plc Annual Report 2013 |
Strategic report
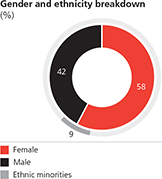
Our culture
In 2013, we launched Simple, Personal, Fair: the Santander Way, setting out how everyone is expected to think, act and conduct themselves. We are committed to building a bank that is simple to deal with; has personal understanding of its customers; and treats everyone fairly and, to achieve this, everything we do must be simple, personal and fair for our people, customers, shareholders and communities. Following the Santander Way will help us achieve our purpose; to help people and businesses prosper.
Santander UK is committed to maintaining high ethical standards, adhering to laws and regulations, conducting business in a responsible way and treating all stakeholders with honesty and integrity. These principles are further reflected in our new Code of Ethical Conduct, which was communicated to all staff in December 2013. The new Code sets out clearly the standards expected of all employees, in line with the Santander Way and our commitment to being simple, personal and fair.
Our people
Our goal to be the best bank for our customers is only achievable if we reach our aspiration to become the best bank to work at for our employees. Key to achieving this goal is to have a workplace that provides excellent opportunities for career progression and that encourages accountability and teamwork.
Santander UK is committed to ensuring compliance with the FCA Remuneration Code and salary ranges are benchmarked against the median levels for the industry. We look to provide employees with pension arrangements that are fair, competitive and sustainable and with a range of other benefits that aim to reflect the diverse nature of our workforce.
We also focus on creating a safe and healthy environment for our people and provide training, coaching and advice, including quarterly health and lifestyle updates which feature a broad range of informative and seasonal articles about health, safety and wellbeing. We also provide employees and immediate members of their family with an Employee Assistance Programme offering free, confidential telephone advice and support, including face-to-face counselling.
Santander UK has a successful history of working in partnership with its recognised trade unions, Advance and the Communication Workers Union (‘CWU’). Both trade unions are affiliated to the Trades Union Congress. We consult Advance and the CWU on significant proposals and change initiatives within the business at both national and local levels.
Diversity and inclusion(F)
We are committed to supporting diversity and creating an inclusive culture where all our people feel valued and able to fulfil their potential. We celebrate diversity through regular internal communications focusing on important cultural events and faith festivals to raise awareness of different cultures and improve inclusivity. Our Embrace, Enable, Women in Business and Cultural Awareness networks encourage colleagues to connect on issues related to sexuality, disability, gender and culture.
In 2013, we continued to review our strategy and related policies and processes that support gender diversity and are mindful of Lord Davies’ report ‘Women on Boards’ published in 2011 which set an aspirational target of 25% female representation on the Boards of FTSE 100 companies by 2015. While the percentage of female Directors on the Board decreased during the year, due to our new appointments to the Board in 2013, the number of female Directors remained constant.
We have a strong commitment to gender diversity within the workplace and recognise the need and importance of inclusion and balance at all levels in order to ensure there are sufficient senior female candidates to succeed into senior roles. The table below sets out the details of the female and male employees who were Directors, senior managers or employees during the year:
| (F) | Diversity and inclusion |
| | | | | | | | | | | | | | | | |
| Gender statistics 2013 | | Female No. | | | Female % | | | Male No. | | | Male % | |
Directors | | | 2 | | | | 13 | | | | 14 | | | | 87 | |
Senior managers(1) | | | 34 | | | | 15 | | | | 188 | | | | 85 | |
Employees | | | 11,393 | | | | 58 | | | | 8,250 | | | | 42 | |
| | (1) | In accordance with sections 414C(9) and 414C(10) of the Companies Act 2006, a senior manager is defined as an employee of the Company with responsibility for planning, directing or controlling the activities of the Company, or a strategically significant part of the Company, including directors of significant subsidiaries. |
| | |
| Santander UK plc Annual Report 2013 | | 23 |
Strategic report
Corporate Governance reviewcontinued
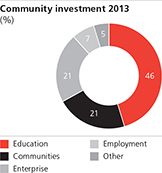
|
Santander Universities 2013 |
| — | 980 scholarships for international students to study in the UK |
| — | 918 Mobility Awards for UK students and academics to study abroad |
| — | 148 entrepreneurship and enterprise awards |
| — | 273 special projects, including support for business incubators and international symposiums |
| — | 1,460 internship awards given for students and graduates to work in SMEs |
Communities
Our business is predominantly focused on retail banking and small businesses and so our community investments support local organisations. The Santander UK Foundation provides grants to local charities, support for students is co-ordinated via Santander Universities, and Breakthrough assists small businesses. Together these three flagship programmes provided over £15m of funding in 2013 and are key to meeting our objective to focus our support to society on education, enterprise and employment. In total, Santander UK contributed £21m in 2013 to society, primarily through cash donations to good causes.
The Santander UK Foundation provides grants to UK registered charities that help disadvantaged people, usually in communities where Santander branches and business centres are based and locations where the bank has a significant presence, such as a main office or call centre. Its three grant programmes focus on funding for education, training and financial capability projects and over 2,000 charities benefited in the year.
Santander Universities continued to grow with six more partner universities signing agreements with us, bringing the total number of UK partners to 72 and more students and staff becoming beneficiaries of our long-term commitment to higher education. 2013 saw £8.45m contributed to the sector in the UK.
Breakthrough is aimed at helping fast-growing SMEs, to boost economic recovery and local employment. Alongside specialist finance for high-growth SMEs we provide fast-growth companies with the resources and knowledge they need to achieve their growth potential. During 2013, more than 390 businesses benefited from the Breakthrough programme through overseas trade missions, roundtable events, masterclasses and internships.
Lastly, Santander UK is committed to protecting and respecting human rights our Human Rights Policy applies to employees, customers and suppliers as well as the communities in which we operate. We continue to operate in accordance with the highest international standards and the Human Rights Policy is aligned with international standards and regulations regarding labour, social and environmental affairs.
The environment(G)
Santander UK is committed to creating a strong business that is not achieved at the expense of the environment. We aim to reduce our impact on climate change. The predominant greenhouse gas generated as a result of running our business is carbon dioxide, generated from our use of fuels in heating, cooling and lighting for our offices and branches, and through employee business travel. Our electricity was sourced solely from green supplies in 2013 which has zero-rated carbon dioxide emissions. As a result this dramatically reduced our environmental impact compared to 2012.
2013 saw an increase in overall travel, in line with the growth of the business. We are committed to reducing carbon dioxide emissions through employee travel. In February 2013 we implemented the ‘Change the way we work’ programme which prioritises video and telephone conferencing, and we invested in additional video conference rooms in our main offices.
We recycle 98% of the paper, plastic, aluminium and general waste produced at our offices and branches.
| | | | | | | | |
| Emissions data | | 2013 Tonnes CO2e(1) | | | 2012
Tonnes CO2e(1) | |
CO2from fuel | | | 8,016 | | | | 37,385 | |
CO2from business travel | | | 10,517 | | | | 9,323 | |
Total | | | 18,533 | | | | 46,708 | |
CO2released per FTE | | | 0.76 | | | | 1.87 | |
| | (1) | DEFRA conversion factors for greenhouse gas reporting. DEFRA Standard Set 2013 |
|
The Strategic report, outlined on pages 2 to 24, incorporates our heritage, Santander UK today, our strategy and business model, key performance indicators, the Chief Executive Officer’s review, the Chief Financial Officer’s review, the Summary Risk report and the Chair’s statement and Summary Corporate Governance review. By order of the Board 
Ana Botín Chief Executive Officer 26 February 2014 |
| | |
| 24 | | Santander UK plc Annual Report 2013 |
Detailed Business Review
Group and Divisional Results
GROUP SUMMARY
SUMMARISED CONSOLIDATED INCOME STATEMENT
| | | | | | | | | | | | |
| | | Year ended
31 December
2013
£m | | | Year ended
31 December
2012(1)
£m | | | Year ended
31 December
2011(1)
£m | |
Net interest income | | | 2,963 | | | | 2,734 | | | | 3,633 | |
Non-interest income | | | 1,066 | | | | 1,949 | | | | 1,303 | |
| | | | | | | | | | | | |
Total operating income | | | 4,029 | | | | 4,683 | | | | 4,936 | |
| | | | | | | | | | | | |
Administrative expenses | | | (1,947 | ) | | | (1,873 | ) | | | (1,876 | ) |
Depreciation, amortisation and impairment | | | (248 | ) | | | (241 | ) | | | (438 | ) |
| | | | | | | | | | | | |
Total operating expenses excluding impairment losses, provisions and charges | | | (2,195 | ) | | | (2,114 | ) | | | (2,314 | ) |
| | | | | | | | | | | | |
Impairment losses on loans and advances | | | (475 | ) | | | (988 | ) | | | (501 | ) |
Provisions for other liabilities and charges | | | (220 | ) | | | (434 | ) | | | (907 | ) |
| | | | | | | | | | | | |
Total operating impairment losses, provisions and charges | | | (695 | ) | | | (1,422 | ) | | | (1,408 | ) |
| | | | | | | | | | | | |
Profit on continuing operations before tax | | | 1,139 | | | | 1,147 | | | | 1,214 | |
Tax on profit on continuing operations | | | (218 | ) | | | (270 | ) | | | (345 | ) |
| | | | | | | | | | | | |
Profit on continuing operations after tax | | | 921 | | | | 877 | | | | 869 | |
(Loss)/profit from discontinued operations after tax | | | (8 | ) | | | 62 | | | | 34 | |
| | | | | | | | | | | | |
Profit after tax for the year | | | 913 | | | | 939 | | | | 903 | |
| | | | | | | | | | | | |
| | | |
Attributable to: | | | | | | | | | | | | |
Equity holders of the parent | | | 913 | | | | 939 | | | | 903 | |
| | | | | | | | | | | | |
| (1) | Adjusted to reflect the presentation of discontinued operations, as set out in Note 12 to the Consolidated Financial Statements. |
2013 compared to 2012
Profit on continuing operations before tax decreased by £8m to £1,139m (2012: £1,147m). Profit after tax from continuing operations increased 5% to £921m (2012: £877m). In 2012, a number of significant items resulted in a net gain of £84m, including a gain on a capital management exercise and provisions relating to the non-core corporate and legacy portfolios, conduct remediation and costs arising from the termination of the acquisition of businesses from RBS. Without the impact of these significant items, profit after tax from continuing operations increased 13%.
By income statement line, the movements were:
| | • | | Net interest income increased by £229m to £2,963m in 2013 (2012: £2,734m) primarily due to improved mortgage stock interest margins and continued growth in Commercial Banking customer loans. The pressure from increased customer deposit funding costs, evident earlier in 2013, eased noticeably in the second half of the year. |
In Retail Banking, net interest income increased by £348m. The key drivers of the increase were improved mortgage margins, as a greater proportion of customers remained on the Standard Variable Rate (‘SVR’), combined with reduced retail funding costs and better stock margins. The increase was also driven by the benefit from the lower cost of deposit acquisition in 2013. The success of the 1|2|3 World enabled us to attract less price sensitive deposits from our growing primary banking customer base and reduce the pricing of our less relationship-focused savings products. These increases were partly offset by the impact of the managed reduction in selected higher risk elements of the residential mortgage portfolio.
In Commercial Banking, net interest income increased by £88m, principally as a result of continued growth in customer loans. Much of this growth was generated through the network of regional CBCs which serve our SME clients. Growth in customer loans was also generated through our trade finance business (invoice discounting programmes) and credit business with Large Corporates. Net interest income also benefitted from the impact of improving new business margins.
In Markets, net interest income increased by £8m, primarily due to a decrease in funding costs.
In Corporate Centre, net interest expense increased by £215m as a consequence of the continued low interest rate environment. This reflected the increased drag from the run-off of the structural hedge put in place in previous years.
| | • | | Non-interest income decreased by £883m to £1,066m in 2013 (2012: £1,949m), largely due to a gain of £705m on a capital management exercise in the third quarter of 2012, and not repeated in 2013, in Corporate Centre. |
In Commercial Banking, non-interest income decreased due to lower income from Large Corporates, notably as a result of lower demand for interest rate and foreign exchange risk management products. Furthermore, fixed income sales and money market transactions decreased reflecting reduced market activity. In addition, non-interest income decreased reflecting a reduced volume of interest rate hedging services, driven by the continued low interest rate environment; and the planned reduction in transactions from certain legacy cash transmission businesses.
In Retail Banking, non-interest income decreased by £32m, reflecting lower investment and protection fees as we operated under new regulatory rules, which limited new business volumes. This was partially offset by a change to the pricing structure for current accounts.
In Markets, non-interest income decreased by £78m compared to a particularly strong 2012. This reflected a return to more normalised levels of market making activity with reduced customer activity in a relatively stable, low interest rate environment. Market making businesses (particularly in Equity markets) also suffered lower levels of activity.
In Corporate Centre, these decreases were partially offset by the £38m credit arising from the debit valuation adjustment on derivatives written by Santander UK. This debit valuation adjustment was introduced in accordance with the requirements of IFRS 13.
| | • | | Administrative expenses increased by £74m to £1,947m in 2013 (2012: £1,873m) principally due to continued investment in the growth of the SME business and investment in growth opportunities for Large Corporates. We further developed our capacity to support our SME customers, with more customer-facing staff in our growing regional CBC network, as we expand into new financial centres across the UK. We also completed the rollout of and customer migration to the new transactional platform in 2013. |
| | |
| Santander UK plc Annual Report 2013 | | 25 |
Detailed Business Review
Group and Divisional Resultscontinued
The increase was also driven by ongoing investment in business growth in Retail Banking focused on improving customer experience, and developing interest rate and foreign exchange product capabilities in Markets, as well as increased regulatory compliance and control costs. These increases were in part offset by tight cost control, the consolidation of multi-branch locations, and the effects of deleveraging of the non-core corporate and legacy portfolios.
| | • | | Depreciation, amortisation and impairment costs increased by £7m to £248m in 2013 (2012: £241m). Investment programmes continued to support the business transformation and underpin future efficiency improvements. Investment focused on systems in the branch network, digital channels, and new transactional capabilities for our commercial customers. This increase was partially offset by the effects of deleveraging of the non-core corporate and legacy portfolios. |
| | • | | Impairment losses on loans and advances decreased by £513m to £475m in 2013 (2012: £988m). The decrease was mainly due to the £335m provision made in 2012, not repeated in 2013, following the review and full re-assessment of the assets held in the non-core corporate and legacy portfolios in run-off. The provision related to assets acquired from Alliance & Leicester plc (especially the shipping and property portfolios) as well as certain assets taken on as part of the old Abbey Commercial Mortgages book. The provision raised reflected the increased losses experienced in these portfolios. No further significant provisions were required in 2013 as disposals of assets across the portfolios were consistent with provisioned levels. |
Credit quality in the Retail Banking and Commercial Banking loan portfolios continued to be satisfactory. Impairment losses on loans and advances in Retail Banking decreased by £60m largely due to the reduction in impairment loss charges on secured portfolios with lower impacts from regulatory-driven policy and reporting changes, combined with improving underlying performance, and on unsecured portfolios due to better credit quality business.
| | • | | Provisions for other liabilities and charges decreased by £214m to £220m in 2013 (2012: £434m). In 2012, provisions for other liabilities and charges included a net provision for conduct remediation of £232m, relating to retail products and to interest rate derivatives sold to corporate customers. In addition, in 2012 there was a £55m write off of costs arising from the termination of the acquisition of the RBS businesses. |
No additional provisions were made for PPI in the year. The volume of PPI activity decreased and the number of complaints we received fell 29% in 2013, although the high proportion of invalid complaints continued. Monthly PPI redress costs decreased through the year to an average in the fourth quarter of the year of £11m per month, compared to a monthly average of £18m for the full year 2013 and £26m in 2012. Following a reassessment of the provision required to cover non-PPI related conduct remediation and enforcement actions in relation to interest rate hedging, Card Protection Plan and retail investments, there was a release during the year. Together with modest utilisation, the combined total was £54m.
The UK Bank Levy and Financial Services Compensation Scheme (‘FSCS’) fees increased by £20m to £118m in 2013 (2012: £98m).
| | • | | The effective tax rate for 2013, based on profit on continuing operations before tax was 19.1% (2012: 23.5%). The reduction in the year was largely attributable to the continued reduction in the main corporation tax rate affecting current and deferred tax. |
(Loss)/profit from discontinued operations after tax of £(8)m in 2013 (2012: £62m) comprised the profit before tax of the discontinued operations of £nil (2012: £84m), a loss on sale before tax of £10m, and a tax credit of £2m (2012: tax charge of £22m). The decrease in profit before tax of the discontinued operations principally reflected the reduction in the size of the co-brand credit cards business prior to the completion of its sale in 2013.
2012 compared to 2011
Profit on continuing operations before tax decreased by £67m to £1,147m in 2012 (2011: £1,214m), whilst profit on continuing operations after tax increased 1% to £877m (2011: £869m). Profit on continuing operations before tax continued to be adversely impacted by structural market conditions, primarily low interest rates and increased term funding costs. 2012 benefitted from the non-recurrence of the significant customer remediation provision, principally in relation to payment protection insurance ('PPI'), of £751m before tax made in 2011. There were a number of significant items in 2012 resulting in a net gain of £84m profit before tax, including a gain on a capital management exercise and provisions relating to the non-core corporate and legacy portfolios, conduct remediation and costs arising from the termination of the acquisition of businesses from RBS.
By income statement line, the movements were:
| | • | | Net interest income decreased by £899m to £2,734m in 2012 (2011: £3,633m). The key drivers of the decrease were sustained lower interest rates which reduced income earned on the structural hedges put in place in previous years and now maturing in a much lower, static interest rate environment, and the higher cost of funding (both retail deposits and wholesale term funding). In addition, lower mortgage business volumes, as we selectively reduced parts of our mortgage book, negatively impacted net interest income. |
These decreases were partly offset by the favourable impact of improved lending margins as more customers reverted to standard variable rate mortgages in the current low interest rate environment, and improved margins on new business in both the mortgage and corporate loan portfolios, even though the launch of the Funding for Lending Scheme in the last quarter of 2012 reduced funding costs and had a negative impact on asset pricing.
In addition, net interest income increased as a result of growth in corporate customer loans, with much of this growth generated through the network of 35 regional CBCs which serve our SME clients. SME lending balances increased by 18% compared to 31 December 2011.
| | • | | Non-interest income increased by £646m to £1,949m in 2012 (2011: £1,303m), principally due to the significant gain earned on the repurchase of certain debt capital instruments completed on 16 July 2012. The net impact of the purchase and crystallisation of mark-to-market positions on associated derivatives resulted in a gain of £705m. |
The remaining decrease of £59m was principally due to increased repo costs relating to the management of the liquid asset portfolio being reported in net trading and other income, lower non-interest income reflecting reduced assets in the non-core corporate and legacy portfolios in run-off.
| | |
| 26 | | Santander UK plc Annual Report 2013 |
Detailed Business Review
Group and Divisional Resultscontinued
In addition, the replacement of overdraft net interest income with daily fees as a result of the new pricing structure for current accounts resulted in higher fees, but these were more than offset by a decrease in monthly overdraft fees charged to customers and a higher volume of fees waived as we promoted our 1|2|3 credit card. Fees from unsecured lending and mortgages were also lower driven by reduced customer volumes.
Volume growth in the SME business resulted in increases in income from treasury services, banking and cash transmission services, invoice discounting and asset finance. This was partially offset by lower income in retail structured products and money markets.
Markets delivered a solid performance, with a much improved performance in the fixed income and equity businesses, partly offset by lower market volumes principally affecting the financial institutions business.
| | • | | Administrative expenses decreased by £3m to £1,873m in 2012 (2011: £1,876m). Reduced costs were driven by further efficiencies, reduced variable staff remuneration in Markets and lower technology costs relating to regulatory projects in Corporate Centre. These were in part offset by investment in new Retail Banking products, including the 1|2|3 World product range and the continued investment in the growth of the SME, Large Corporates and Markets (relating to new products, markets and customer segments) businesses. During 2012, we increased our regional CBCs by seven (net) and significantly increased our capacity to serve SMEs by recruiting 113 customer-facing staff into our business. |
| | • | | Depreciation, amortisation and impairment costs decreased by £197m to £241m in 2012 (2011: £438m). The decrease reflected the write-off of certain intangible assets in December 2011 and lower software depreciation costs following the impairment of these intangible assets in December 2011. In addition, lower operating lease depreciation resulted from lower balances in the legacy portfolios in run-off following the continued deleveraging process. This was partially offset by the continued investment in the IT systems to support growth in Commercial Banking. |
| | • | | Impairment losses on loans and advances increased by £487m to £988m in 2012 (2011: £501m). The increase was mainly due to the £335m provision made following the review and full re-assessment of the assets held in the non-core corporate and legacy portfolios in run-off. The provision related to assets acquired from Alliance & Leicester plc (particularly the shipping portfolio) as well as certain assets within the old Abbey Commercial Mortgages book. The provision raised reflects the increasing losses experienced in these portfolios. |
The remaining increase largely reflects the increase in the level of non-performing mortgage loans affected by the regulatory collection process changes. The underlying performance on mortgages remains broadly stable due to the continued low interest rate environment and the high quality of the book. In addition, provisions increased as a result of provisions raised in the first half of 2012 relating to the non-core portfolio. The increase was partly offset by lower losses experienced in the commercial real estate portfolio as transactions that originated at the peak of the market have begun to work their way out of the book.
| | • | | Provisions for other liabilities and charges reduced by £473m to £434m in 2012 (2011: £907m). 2012 included a net provision for conduct remediation of £232m, relating to retail products and to interest rate derivatives sold to corporate customers. In addition, there was a £55m write off of costs arising from the termination of the acquisition of the RBS businesses. In 2011, Santander UK made a customer remediation provision relating principally to PPI of £751m. No additional provision relating to PPI was required in 2012. |
The UK Bank Levy and FSCS fees decreased by £58m to £98m in 2012 (2011: £156m), largely reflecting the impact of ongoing deleveraging on the balance sheet. This was partially offset by restructuring costs of £45m incurred in 2012 in relation to the closure of certain properties and redundancies
| | • | | The effective tax rate for 2012, based on profit on continuing operations before tax was 23.5% (2011: 28.4%) which was broadly in line with the UK standard corporation tax rate of 24.5% (2011: 26.5%). |
Profit from discontinued operations after tax of £62m in 2012 (2011: £34m) comprised the profit before tax of the discontinued operations of £84m (2011: £47m), and a tax charge of £22m (2011: £13m). The increase in profit before tax of the discontinued operations principally reflected a decrease in the impairment loss allowance charge of £43m.
Critical factors affecting results
The preparation of our Consolidated Financial Statements requires management to make estimates and judgements that affect the reported amount of assets and liabilities at the balance sheet date and the reported amount of income and expenses during the reporting period. Management evaluates its estimates and judgements on an ongoing basis. Management bases its estimates and judgements on historical experience and other factors believed to be reasonable under the circumstances. Actual results may differ from these estimates under different assumptions or conditions. Estimates and judgements that are considered important to the portrayal of our financial condition including, where applicable, quantification of the effects of reasonably possible ranges of such estimates are set out in “Critical Accounting Policies” in Note 1 to the Consolidated Financial Statements.
The rest of this section contains a summary of the results, and commentary thereon, by Income Statement line item for each segment.
Basis of results presentation
The segmental information in this Annual Report reflects the reporting structure in place at the reporting date in accordance with which the segmental information in Note 2 to the Consolidated Financial Statements has been presented. The Company’s board of directors (the ‘Board’) is the chief operating decision maker for Santander UK. The segmental information below is presented on the basis used by the Board to evaluate performance and allocate resources. The Board reviews discrete financial information for each segment of the business which follows Santander UK’s normal accounting policies and principles, including measures of operating results, assets and liabilities.
As described in Note 2 to the Consolidated Financial Statements, in early 2013, once it was determined to sell the co-brand credit cards business, the business was managed and reported for segmental reporting purposes as part of Corporate Centre, rather than Retail Banking as in 2012. In addition, the co-brand credit cards business qualified as a discontinued operation, as set out in Note 12 to the Consolidated Financial Statements. The segmental analyses for prior years have been adjusted to reflect these changes.
| | |
| Santander UK plc Annual Report 2013 | | 27 |
Detailed Business Review
Group and Divisional Results continued
PROFIT BEFORE TAX BY SEGMENT
| | | | | | | | | | | | | | | | | | | | |
31 December 2013 | | Retail
Banking
£m | | | Commercial
Banking
£m | | | Markets
£m | | | Corporate
Centre
£m | | | Total
£m | |
Net interest income/(expense) | | | 3,022 | | | | 415 | | | | 2 | | | | (476 | ) | | | 2,963 | |
Non-interest income | | | 651 | | | | 290 | | | | 106 | | | | 19 | | | | 1,066 | |
| | | | | | | | | | | | | | | | | | | | |
Total operating income | | | 3,673 | | | | 705 | | | | 108 | | | | (457 | ) | | | 4,029 | |
| | | | | | | | | | | | | | | | | | | | |
Administration expenses | | | (1,520 | ) | | | (301 | ) | | | (98 | ) | | | (28 | ) | | | (1,947 | ) |
Depreciation, amortisation and impairment | | | (196 | ) | | | (17 | ) | | | (2 | ) | | | (33 | ) | | | (248 | ) |
| | | | | | | | | | | | | | | | | | | | |
Total operating expenses excluding impairment losses, provisions and charges | | | (1,716 | ) | | | (318 | ) | | | (100 | ) | | | (61 | ) | | | (2,195 | ) |
| | | | | | | | | | | | | | | | | | | | |
Impairment losses on loans and advances | | | (359 | ) | | | (108 | ) | | | — | | | | (8 | ) | | | (475 | ) |
Provisions for other liabilities and charges | | | — | | | | (6 | ) | | | (4 | ) | | | (210 | ) | | | (220 | ) |
| | | | | | | | | | | | | | | | | | | | |
Total operating impairment losses, provisions and charges | | | (359 | ) | | | (114 | ) | | | (4 | ) | | | (218 | ) | | | (695 | ) |
| | | | | | | | | | | | | | | | | | | | |
Profit/(loss) on continuing operations before tax | | | 1,598 | | | | 273 | | | | 4 | | | | (736 | ) | | | 1,139 | |
| | | | | | | | | | | | | | | | | | | | |
Loss from discontinued operations after tax | | | — | | | | — | | | | — | | | | (8 | ) | | | (8 | ) |
| | | | | | | | | | | | | | | | | | | | |
| | | | | | | | | | | | | | | | | | | | |
31 December 2012 | | Retail
Banking(1)
£m | | | Commercial
Banking
£m | | | Markets
£m | | | Corporate
Centre(1)
£m | | | Total
£m | |
Net interest income/(expense) | | | 2,674 | | | | 327 | | | | (6 | ) | | | (261 | ) | | | 2,734 | |
Non-interest income | | | 683 | | | | 381 | | | | 184 | | | | 701 | | | | 1,949 | |
| | | | | | | | | | | | | | | | | | | | |
Total operating income | | | 3,357 | | | | 708 | | | | 178 | | | | 440 | | | | 4,683 | |
| | | | | | | | | | | | | | | | | | | | |
Administration expenses | | | (1,501 | ) | | | (255 | ) | | | (98 | ) | | | (19 | ) | | | (1,873 | ) |
Depreciation, amortisation and impairment | | | (181 | ) | | | (15 | ) | | | (2 | ) | | | (43 | ) | | | (241 | ) |
| | | | | | | | | | | | | | | | | | | | |
Total operating expenses excluding impairment losses, provisions and charges | | | (1,682 | ) | | | (270 | ) | | | (100 | ) | | | (62 | ) | | | (2,114 | ) |
| | | | | | | | | | | | | | | | | | | | |
Impairment losses on loans and advances | | | (419 | ) | | | (109 | ) | | | — | | | | (460 | ) | | | (988 | ) |
Provisions for other liabilities and charges | | | — | | | | (2 | ) | | | (2 | ) | | | (430 | ) | | | (434 | ) |
| | | | | | | | | | | | | | | | | | | | |
Total operating impairment losses, provisions and charges | | | (419 | ) | | | (111 | ) | | | (2 | ) | | | (890 | ) | | | (1,422 | ) |
| | | | | | | | | | | | | | | | | | | | |
Profit/(loss) on continuing operations before tax | | | 1,256 | | | | 327 | | | | 76 | | | | (512 | ) | | | 1,147 | |
| | | | | | | | | | | | | | | | | | | | |
Profit from discontinued operations after tax | | | — | | | | — | | | | — | | | | 62 | | | | 62 | |
| | | | | | | | | | | | | | | | | | | | |
| (1) | Adjusted to reflect the presentation of discontinued operations, as set out in Note 12 to the Consolidated Financial Statements. |
| | | | | | | | | | | | | | | | | | | | |
31 December 2011 | | Retail
Banking(1)
£m | | | Commercial
Banking
£m | | | Markets
£m | | | Corporate
Centre(1)
£m | | | Total
£m | |
Net interest income/(expense) | | | 2,995 | | | | 296 | | | | (3 | ) | | | 345 | | | | 3,633 | |
Non-interest income | | | 724 | | | | 358 | | | | 162 | | | | 59 | | | | 1,303 | |
| | | | | | | | | | | | | | | | | | | | |
Total operating income | | | 3,719 | | | | 654 | | | | 159 | | | | 404 | | | | 4,936 | |
| | | | | | | | | | | | | | | | | | | | |
Administration expenses | | | (1,496 | ) | | | (212 | ) | | | (109 | ) | | | (59 | ) | | | (1,876 | ) |
Depreciation, amortisation and impairment | | | (199 | ) | | | (11 | ) | | | (2 | ) | | | (226 | ) | | | (438 | ) |
| | | | | | | | | | | | | | | | | | | | |
Total operating expenses excluding impairment losses, provisions and charges | | | (1,695 | ) | | | (223 | ) | | | (111 | ) | | | (285 | ) | | | (2,314 | ) |
| | | | | | | | | | | | | | | | | | | | |
Impairment losses on loans and advances | | | (281 | ) | | | (120 | ) | | | — | | | | (100 | ) | | | (501 | ) |
Provisions for other liabilities and charges | | | — | | | | (3 | ) | | | (3 | ) | | | (901 | ) | | | (907 | ) |
| | | | | | | | | | | | | | | | | | | | |
Total operating impairment losses, provisions and charges | | | (281 | ) | | | (123 | ) | | | (3 | ) | | | (1,001 | ) | | | (1,408 | ) |
| | | | | | | | | | | | | | | | | | | | |
Profit/(loss) on continuing operations before tax | | | 1,743 | | | | 308 | | | | 45 | | | | (882 | ) | | | 1,214 | |
| | | | | | | | | | | | | | | | | | | | |
Profit from discontinued operations after tax | | | — | | | | — | | | | — | | | | 34 | | | | 34 | |
| | | | | | | | | | | | | | | | | | | | |
| (1) | Adjusted to reflect the presentation of discontinued operations, as set out in Note 12 to the Consolidated Financial Statements. |
| | |
| 28 | | Santander UK plc Annual Report 2013 |
Detailed Business Review
Group and Divisional Resultscontinued
RETAIL BANKING
Retail Banking offers a wide range of products and financial services to customers through a network of branches and ATMs, as well as through telephony, e-commerce and intermediary channels. It principally serves personal banking customers, but also services small businesses with a turnover of less than £250,000 per annum. Retail Banking products include residential mortgage loans, savings and current accounts, credit cards and personal loans as well as a range of insurance policies.
Summarised income statement
| | | | | | | | | | | | |
| | | Year ended
31 December 2013
£m | | | Year ended
31 December 2012(1)
£m | | | Year ended
31 December 2011(1)
£m | |
Net interest income | | | 3,022 | | | | 2,674 | | | | 2,995 | |
Non-interest income | | | 651 | | | | 683 | | | | 724 | |
| | | | | | | | | | | | |
Total operating income | | | 3,673 | | | | 3,357 | | | | 3,719 | |
| | | | | | | | | | | | |
Administration expenses | | | (1,520 | ) | | | (1,501 | ) | | | (1,496 | ) |
Depreciation, amortisation and impairment | | | (196 | ) | | | (181 | ) | | | (199 | ) |
| | | | | | | | | | | | |
Total operating expenses excluding impairment losses, provisions and charges | | | (1,716 | ) | | | (1,682 | ) | | | (1,695 | ) |
| | | | | | | | | | | | |
Impairment losses on loans and advances | | | (359 | ) | | | (419 | ) | | | (281 | ) |
| | | | | | | | | | | | |
Total operating impairment losses, provisions and charges | | | (359 | ) | | | (419 | ) | | | (281 | ) |
| | | | | | | | | | | | |
Profit on continuing operations before tax | | | 1,598 | | | | 1,256 | | | | 1,743 | |
| | | | | | | | | | | | |
| (1) | Adjusted to reflect the presentation of discontinued operations, as set out in Note 12 to the Consolidated Financial Statements. |
2013 compared to 2012
Profit on continuing operations before tax increased by £342m to £1,598m in 2013 (2012: £1,256m). By income statement line, the movements were:
| | • | | Net interest income increased by £348m to £3,022m in 2013 (2012: £2,674m). The key drivers of the increase were improved mortgage stock interest margins, as a greater proportion of customers remained on the Standard Variable Rate (‘SVR’), combined with reduced retail funding costs and better stock margins. The increase was also driven by the benefit from the lower cost of deposit acquisition in 2013. The success of the 1|2|3 World enabled us to attract less price sensitive deposits from our growing primary banking customer base and reduce the pricing of our less relationship-focused savings products. |
These increases were partly offset by the impact of the managed reduction in selected higher risk elements of the residential mortgage portfolio.
| | • | | Non-interest income decreased by £32m to £651m in 2013 (2012: £683m). The decrease reflected lower investment and protection fees as we operated under new regulatory rules, which limited new business volumes. This was partially offset by a change to the pricing structure for current accounts made in 2012. |
| | • | | Administration expenses increased by £19m to £1,520m in 2013 (2012: £1,501m). The increase was driven by ongoing investment in business growth focused on improving customer experience, partially offset by the consolidation of multi-branch locations. |
| | • | | Depreciation and amortisation increased by £15m to £196m in 2013 (2012: £181m). The increase reflected continued investment in systems in the branch network and digital channels. An ongoing programme to transform the branch network continued with optimisation of the geographic footprint of the network, spend on refurbishment and further investment in our channel capability and self-service terminals to increase productivity and improve efficiency. |
| | • | | Impairment losses on loans and advances decreased by £60m to £359m in 2013 (2012: £419m). This was largely due to the high quality of the book and the supportive economic environment for UK households, with low interest rates and decreasing unemployment. There was a reduction in impairment loss charges on secured portfolios with lower impacts from regulatory-driven policy and reporting changes, combined with improving underlying performance, and on unsecured portfolios due to better credit quality business. |
2012 compared to 2011
Profit on continuing operations before tax decreased by £487m to £1,256m in 2012 (2011: £1,743m). By income statement line, the movements were:
| | • | | Net interest income decreased by £321m to £2,674m in 2012 (2011: £2,995m). The key driver of the decrease in net interest income was the higher cost of funding (both retail deposits and wholesale term funding). In addition, lower mortgage new business volumes, as we selectively reduced parts of our mortgage book, negatively impacted net interest income, as did interest on overdraft accounts being lower with interest charges being replaced by daily fees, which are included within non-interest income. |
These decreases were partly offset by the favourable impact of improved lending margins as more customers remained on SVR mortgages in the current low interest rate environment, and improved margins on new business in both the mortgage and unsecured loan portfolios.
| | • | | Non-interest income decreased by £41m to £683m in 2012 (2011: £724m). The replacement of overdraft net interest income with daily fees as a result of the new pricing structure for current accounts resulted in higher fees, but these were more than offset by a decrease in monthly overdraft fees charged to customers and a higher volume of fees waived as we promoted our 1|2|3 credit card. Fees from unsecured lending and mortgages were also lower driven by reduced customer volumes. |
| | |
| Santander UK plc Annual Report 2013 | | 29 |
Detailed Business Review
Group and Divisional Resultscontinued
| | • | | Administration expenses increased by £5m to £1,501m in 2012 (2011: £1,496m). The increase was driven by investment in new products, including the 1|2|3 World product range, in part offset by further efficiencies. |
| | • | | Depreciation and amortisation expenses decreased by £18m to £181m in 2012 (2011: £199m). The decrease reflected lower software depreciation costs following the impairment of certain intangible assets in December 2011. |
| | • | | Impairment losses on loans and advances increased by £138m to £419m in 2012 (2011: £281m). This was largely due to the increase in the level of non-performing mortgage loans affected by regulatory-driven policy and reporting changes. The underlying performance on mortgages remained broadly stable due to the continued low interest rate environment and the high quality of the book. |
Balances and ratios
| | | | | | | | | | | | |
| | | 31 December
2013
£bn | | | 31 December
2012(1)
£bn | | | 31 December
2011
£bn | |
Total assets | | | 160.5 | | | | 168.3 | | | | 179.0 | |
Customer loans | | | 155.6 | | | | 164.1 | | | | 174.1 | |
- of which mortgages | | | 148.1 | | | | 156.6 | | | | 166.2 | |
Risk-weighted assets | | | 36.5 | | | | 37.6 | | | | 38.3 | |
Customer deposits | | | 123.2 | | | | 127.2 | | | | 121.4 | |
- of which current accounts | | | 27.9 | | | | 15.9 | | | | 12.0 | |
| | | |
Mortgage NPLs ratio(2)(3) | | | 1.88 | % | | | 1.74 | % | | | 1.46 | % |
Mortgage coverage ratio(2)(4) | | | 21 | % | | | 20 | % | | | 20 | % |
| (1) | Adjusted to reflect the presentation of the assets held for sale prior to the completion of the sale as set out in Note 12 to the Consolidated Financial Statements. |
| (2) | The balances include interest charged to the customer’s account, but exclude interest accrued but not yet charged to the account. |
| (3) | Mortgage NPL’s as a percentage of mortgage assets. |
| (4) | Mortgage impairment loss allowance as a percentage of mortgage NPL’s. |
2013 compared to 2012
| | • | | Total assets decreased by 5% to £160.5bn in 2013 (2012: £168.3bn) driven by the decrease in customer loans described below. |
| | • | | Customer loans decreased by 5% to £155.6bn in 2013 (2012: £164.1bn), due to management actions to tighten the lending criteria associated with higher risk elements of the mortgage portfolio, particularly higher loan-to-value and interest-only mortgages, initiated in early 2012. Interest-only mortgage loan balances decreased by £6bn. Unsecured and vehicle finance, which includes bank overdrafts, unsecured personal loans, credit cards and consumer finance, was stable in the year. |
| | • | | Risk-weighted assets decreased by 3% to £36.5bn in 2013 (2012: £37.6bn), reflecting the managed reduction in selected higher risk elements of the mortgage portfolio. |
| | • | | Customer deposits decreased by 3% to £123.2bn in 2013 (2012: £127.2bn). There was an acceleration in the reduction of retail savings balances without a broader customer relationship as we focused on retaining and originating accounts held by more loyal customers. The 1|2|3 Current Account remains central to our retail customer relationship model and was the main driver of the 75% increase in current account balances during the year. |
| | • | | The mortgage NPL ratio increased to 1.88% in 2013 (2012: 1.74%) largely due to the impact of regulatory-driven policy and reporting changes implemented in early 2012, although lower than in 2012, as well as the impact of lower mortgage balances. These policy and reporting changes are not expected to result in significant additional write-offs. Mortgage NPL balances were broadly stable over the last year excluding the impact of the policy and reporting changes. The more recent performance over the last six months shows that the NPL ratio has stabilised, as expected. |
| | • | | The mortgage coverage ratio increased to 21% in 2013 (2012: 20%), as a result of higher impairment loss allowance balances. |
The stock of properties in possession ('PIP') decreased to 672 cases in 2013 (2012: 924), reflecting the improving housing market. This level represented only 0.05% (2012: 0.06%) of the portfolio.
2012 compared to 2011
| | • | | Total assets decreased by 6% to £168.3bn in 2012 (2011: £179.0bn) driven by the decrease in customer loans described below. |
| | • | | Customer loans decreased by 6% to £164.1bn in 2012 (2011: £174.1bn), largely due to management actions taken to tighten the lending criteria associated with higher loan-to-value and interest-only mortgages. |
| | • | | Risk-weighted assets decreased by 2% to £37.6bn in 2012 (2011: £38.3bn), reflecting the managed reduction in selected higher risk elements of the mortgage portfolio, partially offset by an increase due to a change to a higher risk-weighted model. |
| | |
| 30 | | Santander UK plc Annual Report 2013 |
Detailed Business Review
Group and Divisional Resultscontinued
| | • | | Customer deposits increased by 5% to £127.2bn in 2012 (2011: £121.4bn). 2012 benefited from a strong cross tax year ISA campaign where we attracted £9.1bn (net) of deposits, and £3.8bn of current account balance growth following the launch in March 2012 of the new 1|2|3 account. This was partially offset by a reduction in short-term and rate-sensitive deposits that offered limited long-term relationship opportunities. |
| | • | | The mortgage NPL ratio increased to 1.74% in 2012 (2011: 1.46%). The rise in the mortgage NPL ratio was largely attributable to several collection policy and reporting changes, which meant more cases remained classified as NPLs for longer. The calculation of the NPL ratio was also adversely affected by the impact of the managed reduction of the mortgage portfolio over the year, which decreased to £156.6bn from £166.2bn. Excluding the policy and definitional changes, mortgage NPLs balances decreased slightly over the year. |
| | • | | The mortgage coverage ratio was unchanged at 20% in 2012 (2011: 20%), with the increase in NPLs offset by a corresponding increase in the impairment loss allowance balance. |
The stock of PIP reduced to 924 cases in 2012 (2011: 965). This level represented only 0.06% of the portfolio and remained well below the industry average.
Business volumes
| | | | | | | | | | | | |
| | | 31 December
2013
£bn | | | 31 December
2012
£bn | | | 31 December
2011
£bn | |
Mortgage gross lending | | | 18.4 | | | | 14.4 | | | | 23.0 | |
Mortgage net lending | | | (8.5) | | | | (9.6 | ) | | | 0.4 | |
Retail deposit flows | | | (4.0 | ) | | | 5.8 | | | | (5.0 | ) |
| | | |
Number of 1I2I3 World customers | | | 2.4 million | | | | 1.3 million | | | | 0.1 million | |
Number of loyal customers | | | 2.7 million | | | | 2.2 million | | | | 1.6 million | |
2013 compared to 2012
| | • | | Mortgage gross lending in 2013 was £18.4bn, with £8.5bn negative net lending due to the managed reduction in selected elements of the residential mortgage portfolio. The ‘Freedom’ mortgage range was launched in the third quarter of 2013 as part of a range of measures to provide customers with products offering greater flexibility and value. The ‘Freedom’ mortgage range promotes competitive and value-for-money mortgages that are flexible, easy to understand and suited to customers’ needs and changing circumstances. |
The average LTV on new business completions in 2013 decreased slightly to 62% (2012: 63%).
| | • | | Customer deposit balances were £4bn lower in 2013, reflecting a managed reduction in rate-sensitive deposits without a broader customer relationship and a smaller cross tax year ISA campaign, reflecting our lower funding requirement. This was partially offset by growth in current account balances as a result of the continued development of the 1|2|3 Current Account launched in March 2012. |
| | • | | The number of 1|2|3 World customers increased 85% to 2.4 million in 2013, with a growing transactional primary customer base. 1|2|3 World customers tend to have higher balances, more products with us, transact more frequently and with a higher average credit card spend than other customers. |
2012 compared to 2011
| | • | | Mortgage gross lending in 2012 was £14.4bn, with £9.6bn negative net lending due to a managed reduction in the mortgage stock. A 50% LTV cap placed on new interest-only mortgages limited the amount of lending in 2012 and as a result interest only mortgage balances decreased £6.2bn in the year. |
The average LTV on new business completions in 2012 decreased slightly to 63% (2011: 64%).
| | • | | Customer net deposit flows were £5.8bn in 2012 resulting from a successful cross tax year ISA campaign and a material growth in current accounts following the launch of the 1|2|3 Current Account. This provided flexibility to reduce our short-term and rate-sensitive deposits which offer limited opportunities to build further relationships with our customers. |
| | • | | The number of 1|2|3 World customers increased by 1.2 million to 1.3 million in 2012, primarily due to the new 1|2|3 Current Account launched in March 2012. |
| | |
| Santander UK plc Annual Report 2013 | | 31 |
Detailed Business Review
Group and Divisional Resultscontinued
COMMERCIAL BANKING
Commercial Banking offers a wide range of products and financial services to customers through a network of regional CBCs and through telephony and e-commerce channels. Commercial Banking products and services include loans, bank accounts, deposits, treasury services, invoice discounting, cash transmission and asset finance. The management of our customers is organised according to the annual turnover of their business, enabling us to offer a differentiated service to small and medium enterprises (‘SMEs’), mid and large corporate customers.
The SME and mid corporate business principally serves SMEs with an annual turnover of more than £250,000 up to £50m, and other corporate customers with an annual turnover of up to £500m. This also includes real estate lending.
The Large Corporates business offers specialist treasury services in fixed income and foreign exchange, lending, transactional banking services, capital markets and money markets to large multinational corporate customers with an annual turnover of more than £500m. Lending includes syndicated loans and structured finance. Transactional banking includes trade finance and cash management. Money market activities include securities lending/borrowing and repos.
Summarised income statement
| | | | | | | | | | | | |
| | | Year ended
31 December 2013
£m | | | Year ended
31 December 2012
£m | | | Year ended
31 December 2011
£m | |
Net interest income | | | 415 | | | | 327 | | | | 296 | |
Non-interest income | | | 290 | | | | 381 | | | | 358 | |
| | | | | | | | | | | | |
Total operating income | | | 705 | | | | 708 | | | | 654 | |
| | | | | | | | | | | | |
Administration expenses | | | (301 | ) | | | (255 | ) | | | (212 | ) |
Depreciation, amortisation and impairment | | | (17 | ) | | | (15 | ) | | | (11 | ) |
| | | | | | | | | | | | |
Total operating expenses excluding impairment losses, provisions and charges | | | (318 | ) | | | (270 | ) | | | (223 | ) |
| | | | | | | | | | | | |
Impairment losses on loans and advances | | | (108 | ) | | | (109 | ) | | | (120 | ) |
Provisions for other liabilities and charges | | | (6 | ) | | | (2 | ) | | | (3 | ) |
| | | | | | | | | | | | |
Total operating impairment losses, provisions and charges | | | (114 | ) | | | (111 | ) | | | (123 | ) |
| | | | | | | | | | | | |
Profit on continuing operations before tax | | | 273 | | | | 327 | | | | 308 | |
| | | | | | | | | | | | |
2013 compared to 2012
Profit on continuing operations before tax decreased by £54m to £273m in 2013 (2012: £327m). By income statement line, the movements were:
| | • | | Net interest income increased by £88m to £415m in 2013 (2012: £327m), principally as a result of continued growth in customer loans. Much of this growth was generated through the network of regional CBCs which serve our SME clients. Growth in customer loans was also generated through our trade finance business (invoice discounting programmes) and credit business with Large Corporates. Net interest income also benefitted from the impact of improving new business margins. |
| | • | | Non-interest income decreased by £91m to £290m in 2013 (2012: £381m) reflecting lower income from Large Corporates, notably as a result of lower demand for interest rate and foreign exchange risk management products. Furthermore, fixed income sales and money market transactions decreased reflecting reduced market activity. In addition, non-interest income decreased reflecting a reduced volume of interest rate hedging services, driven by the continued low interest rate environment; and the planned reduction in transactions from certain legacy cash transmission businesses. |
We continue to develop our range of ancillary services in our Large Corporates business. Our link with the wider Banco Santander group allows us to provide these new and existing customers with access to international expertise and foreign exchange services. We expect to grow this segment further in 2014.
| | • | | Administration expenses increased by £46m to £301m in 2013 (2012: £255m). The increase reflected the continued investment in the growth of the SME business and investment in growth opportunities for Large Corporates. We further developed our capacity to support our SME customers, with more customer-facing staff in our growing regional CBC network, as we expand into new financial centres across the UK. We also completed the rollout of and customer migration to the new transactional platform in 2013. |
| | • | | Depreciation and amortisation increased by £2m to £17m in 2013 (2012: £15m) due to the continued investment in systems to support new transactional capabilities for our customers. |
| | • | | Impairment losses on loans and advances were broadly unchanged at £108m in 2013 (2012: £109m) with the credit quality of business written from 2009 onwards continuing to perform well, and provisions in 2013 largely related to business written before 2009. |
| | • | | Provisions for other liabilities and charges of £6m remained at a low level in 2013 (2012: £2m). |
2012 compared to 2011
Profit on continuing operations before tax increased by £19m to £327m in 2012 (2011: £308m). By income statement line, the movements were:
| | • | | Net interest income increased by £31m to £327m in 2012 (2011: £296m) as a result of growth in customer loans, with much of this growth generated through the network of 35 regional CBCs which serve our SME clients. SME lending balances increased by 18% compared to 31 December 2011. Interest margins on loans continued to improve as market pricing better reflected incremental higher funding and liquidity costs, even though the launch of the Funding for Lending Scheme in the last quarter of 2012 reduced funding costs and had a negative impact on asset pricing. |
| | |
| 32 | | Santander UK plc Annual Report 2013 |
Detailed Business Review
Group and Divisional Resultscontinued
| | • | | Non-interest income increased by £23m to £381m in 2012 (2011: £358m). Volume growth in both the SME and Large Corporates business resulted in increases in income from treasury services, banking and cash transmission services, invoice discounting and asset finance. This was partially offset by lower income in retail structured products and money markets. |
| | • | | Administration expenses increased by £43m to £255m in 2012 (2011: £212m). The increase reflected the continued investment in the growth of both the SME and Large Corporates business. During 2012 we increased our regional CBCs by seven and significantly increased our capacity to serve SMEs by recruiting 113 customer-facing staff into our business. |
| | • | | Depreciation and amortisation increased by £4m to £15m in 2012 (2011: £11m) due to the continued investment in the IT systems to support growth. |
| | • | | Impairment losses on loans and advances decreased by £11m to £109m in 2012 (2011: £120m), due to lower losses experienced in the commercial real estate portfolio as transactions that originated at the peak of the market have begun to work their way out of the book. This was partially offset by ongoing stresses within the commercial mortgage portfolio especially care home and leisure sectors where the prolonged weak economic conditions proved challenging for operators with a consequent impact on refinancing options and asset values. |
| | • | | Provisions for other liabilities and charges of £2m remained at a very low level in 2012 (2011: £3m). |
Balances
| | | | | | | | | | | | |
| | | 31 December
2013
£bn | | | 31 December
2012
£bn | | | 31 December
2011
£bn | |
Total assets | | | 35.5 | | | | 35.7 | | | | 38.1 | |
Total customer loans | | | 22.1 | | | | 19.6 | | | | 18.9 | |
- of which corporate SMEs | | | 11.7 | | | | 10.6 | | | | 9.0 | |
Risk-weighted assets | | | 26.6 | | | | 24.1 | | | | 22.5 | |
Customer deposits | | | 12.6 | | | | 12.8 | | | | 12.1 | |
2013 compared to 2012
| | • | | Total assets comprise customer loans and assets relating to short-term markets activities including repos and derivatives. Total assets decreased by 1% to £35.5bn in 2013 (2012: £35.7bn) driven by with an increase in customer loans (described below) more than offset by lower balances within our short-term markets business reflecting reductions in repo activity. |
| | • | | Customer loans increased by 13% to £22.1bn in 2013 (2012: £19.6bn) principally as a result of continued growth in customer loans. Corporate lending growth continues to be subject to prudent risk management criteria, as demonstrated by the good credit quality in newer vintage loans. Much of this growth was generated through the network of regional CBCs which support our SME customers. We continued to build our SME franchise following the growth of our regional CBC network and increased numbers of relationship managers. Increased customer loans to Large Corporate clients were also generated through our trade finance business (invoice discounting programmes) in our global transactional banking services unit where we continued to develop product capabilities. Growth was also seen in credit markets acquisition finance deals with large corporate clients. |
| | • | | Risk-weighted assets of increased by 10% to £26.6bn in 2013 (2012: £24.1bn) due to higher lending to customers (described above). The increase in RWAs was lower than the increase in customer loans which includes the drawdown of facilities arranged in 2012. |
| | • | | Customer deposits decreased by 2% to £12.6bn in 2013 (2012: £12.8bn) principally reflecting the transfer of £2.1bn of deposits to Corporate Centre, partially offset by strong inflows during the year as we continued to develop deeper relationships with our clients, following the expansion of our customer base, and to build on our new enhanced corporate cash management and liability capabilities. |
2012 compared to 2011
| | • | | Total assets comprise customer loans and assets relating to short-term markets activities including repos and derivatives. Total assets decreased by 6% to £35.7bn in 2012 (2011: £38.1bn) with an increase in customer loans (described below) more than offset by lower balances within our short-term markets business reflecting weaker markets. |
| | • | | Customer loans increased by 4% to £19.6bn in 2012 (2011: £18.9bn) driven by a strong performance via our 35 regional CBCs and a broader product offering. We continued to build our growing Corporate SME franchise, with lending to this group totalling £10.6bn, an increase of 18% compared to 31 December 2011. This was largely offset by the early repayment of a significant Large Corporate loan in 2012. |
| | • | | Risk-weighted assets increased by 7% to £24.1bn in 2012 (2011: £22.5bn) due to higher lending to customers described above and includes undrawn facilities not on the balance sheet. |
| | • | | Customer deposits increased by 6% to £12.8bn in 2012 (2011: £12.1bn) with strong inflows in the second half of the year recovering significant outflows from the first half, following ratings agency downgrades and eurozone economic uncertainty. This net increase provided confidence in the resilience of the deposit customer base. We continued to focus on maintaining strong relationships with our core clients. |
| | |
| Santander UK plc Annual Report 2013 | | 33 |
Detailed Business Review
Group and Divisional Resultscontinued
MARKETS
Markets offers risk management and other services to financial institutions, as well as to other Santander UK divisions. Its main business areas are fixed income and foreign exchange, equity, capital markets and institutional sales.
Summarised income statement
| | | | | | | | | | | | |
| | | Year ended
31 December 2013
£m | | | Year ended
31 December 2012
£m | | | Year ended
31 December 2011
£m | |
Net interest income/(expense) | | | 2 | | | | (6 | ) | | | (3 | ) |
Non-interest income | | | 106 | | | | 184 | | | | 162 | |
| | | | | | | | | | | | |
Total operating income | | | 108 | | | | 178 | | | | 159 | |
| | | | | | | | | | | | |
Administration expenses | | | (98 | ) | | | (98 | ) | | | (109 | ) |
Depreciation, amortisation and impairment | | | (2 | ) | | | (2 | ) | | | (2 | ) |
| | | | | | | | | | | | |
Total operating expenses excluding impairment losses, provisions and charges | | | (100 | ) | | | (100 | ) | | | (111 | ) |
| | | | | | | | | | | | |
Provisions for other liabilities and charges | | | (4 | ) | | | (2 | ) | | | (3 | ) |
| | | | | | | | | | | | |
Total operating impairment losses, provisions and charges | | | (4 | ) | | | (2 | ) | | | (3 | ) |
| | | | | | | | | | | | |
Profit on continuing operations before tax | | | 4 | | | | 76 | | | | 45 | |
| | | | | | | | | | | | |
2013 compared to 2012
Profit on continuing operations before tax decreased by £72m to £4m in 2013 (2012: £76m). By income statement line, the movements were:
| | • | | Net interest income/(expense) increased by £8m to income of £2m in 2013 (2012: expense of £6m), primarily due to a decrease in funding costs. |
| | • | | Non-interest income decreased by £78m to £106m in 2013 (2012: £184m), compared to a particularly strong performance in 2012. This reflected a return to more normalised levels of market-making activity with reduced customer activity in a relatively stable, low interest rate environment. Market-making businesses (particularly in equity markets) also suffered lower levels of activity. |
| | • | | Administration expenses were unchanged at £98m in 2013 (2012: £98m), reflecting investment in developing interest rate and foreign exchange product capabilities offset by tight cost control and reduced variable remuneration. |
| | • | | Depreciation and amortisation was unchanged at £2m (2012: £2m). |
| | • | | Provisions for other liabilities and charges remained at a low level at £4m in 2013 (2012: £2m). |
2012 compared to 2011
Profit on continuing operations before tax increased by £31m to £76m in 2012 (2011: £45m). By income statement line, the movements were:
| | • | | Net interest expense increased by £3m to £6m in 2012 (2011: £3m) primarily due to a small increase in funding costs. |
| | • | | Non-interest income increased by £22m to £184m in 2012 (2011: £162m), largely due to a solid performance in market making businesses. There was a much improved performance from the fixed income and equity businesses which was partly offset by lower market volumes principally affecting the financial institutions businesses. |
| | • | | Administration expenses decreased by £11m to £98m in 2012 (2011: £109m). The decrease was largely due to reduced variable staff remuneration costs. |
| | • | | Depreciation and amortisation was unchanged at £2m (2011: £2m). |
| | • | | Provisions for other liabilities and charges remained at a very low level at £2m in 2012 (2011: £3m). |
| | |
| 34 | | Santander UK plc Annual Report 2013 |
Detailed Business Review
Group and Divisional Resultscontinued
Balances
| | | | | | | | | | | | |
| | | 31 December
2013
£bn | | | 31 December
2012
£bn | | | 31 December
2011
£bn | |
Total assets(1) | | | 19.3 | | | | 28.2 | | | | 28.7 | |
Risk-weighted assets | | | 5.4 | | | | 4.9 | | | | 3.8 | |
| (1) | Primarily comprises derivative assets |
2013 compared to 2012
| | • | | Total assets comprise derivatives for fixed income and equity products. Total assets decreased by 32% to £19.3bn in 2013 (2012: £28.2bn) primarily reflecting a decrease in the fair values of interest rate derivative assets. There was a corresponding decrease in derivative liabilities. |
| | • | | Risk-weighted assets increased by 10% to £5.4bn in 2013 (2012: £4.9bn) due to changes in market risk capital requirements. |
2012 compared to 2011
| | • | | Total assets decreased by 2% to £28.2bn in 2012 (2011: £28.7bn), primarily reflecting a decrease in fair values of interest rate derivatives as a result of upward shifts in yield curves. |
| | • | | Risk-weighted assets increased by 29% to £4.9bn in 2012 (2011: £3.8bn) due to higher levels of trading activity increasing the stressed VaR combined with the enhancement of dataset inputs to the VaR model. |
| | |
| Santander UK plc Annual Report 2013 | | 35 |
Detailed Business Review
Group and Divisional Resultscontinued
CORPORATE CENTRE
Corporate Centre includes Financial Management & Investor Relations (‘FMIR’) and the non-core corporate and legacy portfolios, as well as the co-brand credit cards business which has been presented as discontinued operations. FMIR is responsible for managing capital and funding, balance sheet composition, structural market risk and strategic liquidity risk for the Santander UK group. The non-core corporate and legacy portfolios include aviation, shipping, infrastructure, commercial mortgages, Social Housing loans and structured credit assets, all of which are being run-down and/or managed for value. The sale of the co-brand credit cards business was completed in 2013.
Summarised income statement
| | | | | | | | | | | | |
| | | Year ended
31 December 2013
£m | | | Year ended
31 December 2012(1)
£m | | | Year ended
31 December 2011(1)
£m | |
Net interest (expense)/income | | | (476 | ) | | | (261 | ) | | | 345 | |
Non-interest income | | | 19 | | | | 701 | | | | 59 | |
| | | | | | | | | | | | |
Total operating (expense)/income | | | (457 | ) | | | 440 | | | | 404 | |
| | | | | | | | | | | | |
Administration expenses | | | (28 | ) | | | (19 | ) | | | (59 | ) |
Depreciation, amortisation and impairment | | | (33 | ) | | | (43 | ) | | | (226 | ) |
| | | | | | | | | | | | |
Total operating expenses excluding impairment losses, provisions and charges | | | (61 | ) | | | (62 | ) | | | (285 | ) |
| | | | | | | | | | | | |
Impairment losses on loans and advances | | | (8 | ) | | | (460 | ) | | | (100 | ) |
Provisions for other liabilities and charges | | | (210 | ) | | | (430 | ) | | | (901 | ) |
| | | | | | | | | | | | |
Total operating impairment losses, provisions and charges | | | (218 | ) | | | (890 | ) | | | (1,001 | ) |
| | | | | | | | | | | | |
Loss on continuing operations before tax | | | (736 | ) | | | (512 | ) | | | (882 | ) |
| | | | | | | | | | | | |
(Loss)/profit on discontinued operations after tax | | | (8 | ) | | | 62 | | | | 34 | |
| | | | | | | | | | | | |
| (1) | Adjusted to reflect the presentation of discontinued operations, as set out in Note 12 to the Consolidated Financial Statements. |
2013 compared to 2012
Loss on continuing operations before tax increased by £224m to £(736)m in 2013 (2012: £(512)m). By income statement line, the movements were:
| | • | | Net interest expense increased by £215m to £476m in 2013 (2012: £261m) as a consequence of the continued low interest rate environment. This reflected the increased drag from the run-off of the structural hedge put in place in previous years, whilst the benefit of lower funding and liquidity costs was passed to the businesses. |
| | • | | Non-interest income decreased by £682m to £19m in 2013 (2012: £701m) largely due to a gain of £705m on a capital management exercise in the third quarter of 2012 not repeated in 2013. This was partially offset by the £38m credit arising from the debit valuation adjustment on derivatives written by Santander UK. This debit valuation adjustment was introduced in accordance with the requirements of IFRS 13. |
| | • | | Administration expenses increased by £9m to £28m in 2013 (2012: £19m), reflecting increased regulatory compliance and control costs, partially offset by the effects of deleveraging of the non-core corporate and legacy portfolios. |
| | • | | Depreciation and amortisation decreased by £10m to £33m in 2013 (2012: £43m), due to the effects of deleveraging of the non-core corporate and legacy portfolios. |
| | • | | Impairment losses on loans and advances in the non-core corporate and legacy portfolios decreased by £452m to £8m in 2013 (2012: £460m). In 2012, provisions of £335m were made following the review and full re-assessment of the assets held in the non-core corporate and legacy portfolios in run-off. The provision related to assets acquired from Alliance & Leicester plc (especially the shipping and property portfolios) as well as certain assets taken on as part of the old Abbey Commercial Mortgages book. The provision raised reflected the increased losses experienced in these portfolios. No further significant provisions were required in 2013 as disposals of assets across the portfolios were consistent with provisioned levels. |
| | • | | Provisions for other liabilities and charges decreased by £220m to £210m in 2013 (2012: £430m). In 2012, provisions for other liabilities and charges included a net provision for conduct remediation of £232m, relating to retail products and to interest rate derivatives sold to corporate customers. In addition, in 2012 there was a £55m write off of costs arising from the termination of the acquisition of the RBS businesses. |
No additional provisions were made for PPI in the year. The volume of PPI activity decreased and the number of complaints we received fell 29% in 2013, although the high proportion of invalid complaints continued. Monthly PPI redress costs decreased through the year to an average in the fourth quarter of the year of £11m per month, compared to a monthly average of £18m for the full year 2013 and £26m in 2012. Following a reassessment of the provision required to cover non-PPI related conduct remediation and enforcement actions in relation to interest rate hedging, Card Protection Plan and retail investments, there was a release during the year. Together with modest utilisation, the combined total was £54m.
The UK Bank Levy and FSCS fees increased by £20m to £118m in 2013 (2012: £98m).
(Loss)/profit from discontinued operations after tax of £(8)m in 2013 (2012: £62m) comprised the profit before tax of the discontinued operations of £nil (2012: £85m), a loss on sale before tax of £10m, and a tax credit of £2m (2012: tax charge of £22m). The decrease in profit before tax of the discontinued operations principally reflected the reduction in the size of the co-brand credit cards business prior to the completion of its sale in 2013.
| | |
| 36 | | Santander UK plc Annual Report 2013 |
Detailed Business Review
Group and Divisional Resultscontinued
2012 compared to 2011
Loss on continuing operations before tax decreased by £370m to £(512)m in 2012 (2011: £(882)m). By income statement line, the movements were:
| | • | | Net interest income decreased by £606m to an expense of £(261)m in 2012 (2011: £345m). The key drivers of the decrease were sustained lower interest rates which reduced income earned on the structural hedges put in place in previous years and now maturing in a much lower, static interest rate environment and the increased cost of term funding both via higher issuance volumes and higher costs. The latter was partially offset by the allocation of funding and liquidity costs to the other business units in line with their funding and liquidity requirements. |
| | • | | Non-interest income increased by £642m to £701m in 2012 (2011: £59m), principally due to the gain earned on the repurchase of certain debt capital instruments as part of a capital management exercise in July 2012. The net impact of the purchase and crystallisation of mark-to-market positions on associated derivatives was a gain of £705m. |
This increase was partially offset by a decrease of £63m that was principally due to increased repo costs relating to the management of the portfolio of liquid assets, lower non-interest income reflecting reduced assets in the non-core and legacy portfolios in run-off.
| | • | | Administration expenses decreased by £40m to £19m in 2012 (2011: £59m) due to 2011 including technology costs relating to regulatory projects and the delivery of efficiency savings. |
| | • | | Depreciation and amortisation decreased by £183m to £43m in 2012 (2011: £226m), due to the write-off of certain intangible assets in December 2011 and lower operating lease depreciation resulting from lower balances in the legacy portfolios in run-off following the continued deleveraging process. |
| | • | | Impairment losses on loans and advances increased by £360m to £460m in 2012 (2011: £100m). The increase was mainly due to the £335m provision made following the review and full re-assessment of the assets held in the non-core corporate and legacy portfolios in run-off. The provision relates to assets acquired from Alliance & Leicester plc (especially the shipping and property portfolios) as well as certain assets taken on as part of the old Abbey Commercial Mortgages book. The provision raised reflects the increased losses experienced in these portfolios. The remaining £25m increase reflects provisions raised in the first half of 2012 relating to the non-core portfolio. |
| | • | | Provisions for other liabilities and charges reduced by £471m to £430m in 2012 (2011: £901m). In 2012, provisions for other liabilities and charges included a net provision for conduct remediation of £232m, relating to retail products and to interest rate derivatives sold to corporate customers. In addition, there was a £55m write off of costs arising from the termination of the acquisition of the RBS businesses. In 2011, Santander UK made a customer remediation provision relating principally to PPI of £751m. No additional provision relating to PPI was required in 2012. |
The UK Bank Levy and FSCS fees decreased by £58m to £98m (2011: £156m), largely reflecting the impact of ongoing deleveraging on the balance sheet. This was partially offset by restructuring costs of £45m incurred in 2012.
Profit from discontinued operations after tax of £62m in 2012 (2011: £34m) comprised the profit before tax of the discontinued operations of £84m (2011: £47m), and a tax charge of £22m (2011: £13m). The increase in profit before tax of the discontinued operations principally reflected a decrease in the impairment loss allowance charge of £43m.
| | |
| Santander UK plc Annual Report 2013 | | 37 |
Detailed Business Review
Group and Divisional Resultscontinued
Balances
| | | | | | | | | | | | |
| | | 31 December
2013
£bn | | | 31 December
2012(1)
£bn | | | 31 December
2011
£bn | |
Total assets | | | 55.0 | | | | 60.8 | | | | 51.8 | |
Eligible liquid assets(2) | | | 29.5 | | | | 36.9 | | | | 28.4 | |
Total customer loans (non-core) | | | 9.4 | | | | 11.0 | | | | 13.4 | |
Risk-weighted assets | | | 6.8 | | | | 9.9 | | | | 12.9 | |
Customer deposits | | | 10.6 | | | | 8.6 | | | | 15.7 | |
| (1) | Adjusted to reflect the presentation of the assets held for sale prior to the completion of the sale as set out in Note 12 to the Consolidated Financial Statements. |
| (2) | Includes off balance sheet items per liquid assets table on page 137. |
Non-core assets
| | | | | | | | | | | | |
| | | 31 December
2013
£bn | | | 31 December
2012
£bn | | | 31 December
2011
£bn | |
Social housing | | | 7.1 | | | | 7.5 | | | | 7.5 | |
Commercial mortgages | | | 1.2 | | | | 1.4 | | | | 1.7 | |
Shipping | | | 0.4 | | | | 0.7 | | | | 0.9 | |
Aviation | | | 0.4 | | | | 0.6 | | | | 0.8 | |
Other | | | 0.3 | | | | 0.8 | | | | 1.0 | |
| | | | | | | | | | | | |
Non-core customer loans | | | 9.4 | | | | 11.0 | | | | 11.9 | |
Legacy Treasury asset portfolio | | | 2.0 | | | | 1.9 | | | | 2.6 | |
| | | | | | | | | | | | |
Total non-core assets | | | 11.4 | | | | 12.9 | | | | 14.5 | |
| | | | | | | | | | | | |
2013 compared to 2012
| | • | | Total assets decreased by 10% to £55.0bn in 2013 (2012: £60.8bn) driven by the reduction in customer loans described below, and a decrease in eligible liquid assets, partially offset by an increase in the portfolio of high quality liquid bonds that are eligible for inclusion in the new Liquidity Coverage Ratio (the ‘ALCO portfolio’) , as part of liquidity management activities. |
Eligible liquid assets decreased by £7.4bn to £29.5bn in 2013 (2012: £36.9bn). Balances were managed more efficiently, given stability in capital markets and as a consequence of the actions taken to strengthen the balance sheet by reducing short-term wholesale funding over the last three years. Surplus liquidity was also utilised to fund maturing medium term funding and to invest in the ALCO portfolio. Eligible liquid assets significantly exceeded short-term (i.e. of less than one year) wholesale funding, with a coverage ratio of 138%.
| | • | | Customer loans decreased by 15% to £9.4bn in 2013 (2012: £11.0bn) due to the run down of the non-core portfolios as we successfully implemented our ongoing exit strategy from individual loans and leases. Disposals of assets continued across the portfolios within provisioned levels. The Social Housing portfolio was stable, reflecting its long-term, low risk nature. |
| | • | | Risk-weighted assets decreased by 31% to £6.8bn in 2013 (2012: £9.9bn) due to the reduction in non-core customer loans, the continued run down of the Treasury asset portfolio and the sale of the co-brand credit cards business. |
| | • | | Customer deposits increased by 23% to £10.6bn in 2013 (2012: £8.6bn), principally reflecting the transfer of £2.1bn of deposits from Commercial Banking. |
2012 compared to 2011
| | • | | Total assets increased by 15% to £60.8bn in 2012 (2011: £51.8bn) largely driven by increases of £2.9bn of cash at central banks, £5.1bn of new government securities held as available-for-sale and £1.8bn of derivatives. This was partially offset by the decrease in customer loans described below. |
Eligible liquid assets increased by 32% to £36.9bn in 2012 (2011: £28.4bn), driven primarily by a reduction in the customer funding gap (customer liabilities less customer assets) as a result of deleveraging and increased debt issuance.
| | • | | Customer loans decreased by 18% to £11.0bn in 2012 (2011: £13.4bn) due to the run down of the non-core portfolios. |
| | • | | Risk-weighted assets decreased by 23% to £9.9bn in 2012 (2011: £12.9bn) due to the reduction in customer loans combined with the continued run down of the Treasury asset portfolio. |
| | • | | Customer deposits decreased by 45% to £8.6bn in 2012 (2011: £15.7bn), as we reduced reliance on rate sensitive deposits and achieved a better mix of wholesale funding. |
| | |
| 38 | | Santander UK plc Annual Report 2013 |
Detailed Business Review
Balance Sheet Review
| | |
| Santander UK plc Annual Report 2013 | | 39 |
Detailed Business Review
Balance Sheet Reviewcontinued
This Balance Sheet Review describes Santander UK’s significant assets and liabilities and its strategy and reasons for entering into such transactions. Throughout this section, references to UK and non-UK, in the geographic analysis, refer to the location of the office where the transaction is recorded.
SUMMARISED CONSOLIDATED BALANCE SHEET
| | | | | | | | | | | | |
| | | 2013
£m | | | 2012(1)
£m | | | 2011
£m | |
Assets | | | | | | | | | | | | |
Cash and balances at central banks | | | 26,374 | | | | 29,282 | | | | 25,980 | |
Trading assets | | | 22,294 | | | | 22,498 | | | | 21,891 | |
Derivative financial instruments | | | 20,049 | | | | 30,146 | | | | 30,780 | |
Financial assets designated at fair value | | | 2,747 | | | | 3,811 | | | | 5,005 | |
Loans and advances to banks | | | 2,347 | | | | 2,438 | | | | 4,487 | |
Loans and advances to customers | | | 184,587 | | | | 190,782 | | | | 201,069 | |
Loans and receivables securities | | | 1,101 | | | | 1,259 | | | | 1,771 | |
Available for sale securities | | | 5,005 | | | | 5,483 | | | | 46 | |
Macro hedge of interest rate risk | | | 769 | | | | 1,222 | | | | 1,221 | |
Interest in other entities | | | 27 | | | | 8 | | | | 2 | |
Property, plant and equipment | | | 1,521 | | | | 1,541 | | | | 1,596 | |
Retirement benefit assets | | | 118 | | | | 254 | | | | 241 | |
Tax, intangibles and other assets | | | 3,366 | | | | 4,320 | | | | 3,485 | |
| | | | | | | | | | | | |
Total assets | | | 270,305 | | | | 293,044 | | | | 297,574 | |
| | | | | | | | | | | | |
Liabilities | | | | | | | | | | | | |
Deposits by banks | | | 8,696 | | | | 9,935 | | | | 11,626 | |
Deposits by customers | | | 147,167 | | | | 149,037 | | | | 148,342 | |
Trading liabilities | | | 21,278 | | | | 21,109 | | | | 25,745 | |
Derivative financial instruments | | | 18,863 | | | | 28,861 | | | | 29,180 | |
Financial liabilities designated at fair value | | | 3,407 | | | | 4,002 | | | | 6,837 | |
Debt securities in issue | | | 50,870 | | | | 59,621 | | | | 52,651 | |
Subordinated liabilities | | | 4,306 | | | | 3,781 | | | | 6,499 | |
Retirement benefit obligations | | | 672 | | | | 305 | | | | 216 | |
Tax, other liabilities and provisions | | | 2,526 | | | | 3,444 | | | | 3,812 | |
| | | | | | | | | | | | |
Total liabilities | | | 257,785 | | | | 280,095 | | | | 284,908 | |
| | | | | | | | | | | | |
Equity | | | | | | | | | | | | |
Total shareholders’ equity | | | 12,520 | | | | 12,949 | | | | 12,666 | |
| | | | | | | | | | | | |
Total equity | | | 12,520 | | | | 12,949 | | | | 12,666 | |
| | | | | | | | | | | | |
Total liabilities and equity | | | 270,305 | | | | 293,044 | | | | 297,574 | |
| | | | | | | | | | | | |
| (1) | Adjusted to reflect the presentation of the assets held for sale prior to the completion of the sale as set out in Note 12 to the Consolidated Financial Statements. |
A more detailed consolidated balance sheet is contained in the Consolidated Financial Statements.
31 December 2013 compared to 31 December 2012
Assets
Cash and balances at central banks
Cash and balances held at central banks decreased by 10% to £26,374m at 31 December 2013 (2012: £29,282m). We undertook a modest reduction in our liquidity position, given improved stability in capital markets, a stronger balance sheet and a reduced reliance on short-term funding markets.
Trading assets
Trading assets decreased by 1% to £22,294m at 31 December 2013 (2012: £22,498m), reflecting lower levels of activity relating to securities purchased under resale agreements to both banks and customers offset by increased holdings of debt securities as part of short-term markets trading activity.
Derivative assets
Derivative assets decreased by 33% to £20,049m at 31 December 2013 (2012: £30,146m). The decrease was attributable to a reduction in the fair values of interest rate derivative assets. This was due to increased netting of assets and liabilities as a result of greater use of central counterparties, together with movements in yield curves causing a reduction in gross derivative assets. There was a corresponding decrease in derivative liabilities.
Financial assets designated at fair value through profit and loss
Financial assets designated at fair value through profit and loss decreased by 28% to £2,747m at 31 December 2013 (2012: £3,811m). The decrease was primarily attributable to the maturity of loans to UK Social Housing associations and new loans no longer being designated at fair value, in accordance with Santander UK’s policy.
Loans and advances to customers
Loans and advances to customers decreased by 3% to £184,587m at 31 December 2013 (2012: £190,782m) principally due to a managed reduction in selected higher risk segments of the mortgage portfolio partially offset by increased Commercial Banking loans.
Available for sale securities
Available for sale securities decreased by 9% to £5,005m at 31 December 2013 (2012: £5,483m) as part of normal liquid asset portfolio management activity.
| | |
| 40 | | Santander UK plc Annual Report 2013 |
Detailed Business Review
Balance Sheet Reviewcontinued
Property, plant and equipment
Property, plant and equipment decreased by 1% to £1,521m at 31 December 2013 (2012: £1,541m). The decrease was attributable to the depreciation charge for the year, partially offset by additions during the year.
Retirement benefit assets
Retirement benefit assets decreased by 54% to £118m at 31 December 2013 (2012: £254m). For Santander UK’s defined benefit pension schemes which had surpluses, the key driver of the decrease was actuarial losses on liabilities as a result of an increase in RPI inflation market levels. This followed a decision by the Office of National Statistics, in early 2013, not to rebase RPI. In addition, actuarial losses on liabilities increased due to decreased corporate bond yields reducing the discount rate.
Tax, intangibles and other assets
Tax, intangibles and other assets decreased by 22% to £3,366m at 31 December 2013 (2012: £4,328m). The decrease primarily reflected the sale of the assets of the co-brand credit cards business in the first half of 2013.
Liabilities
Deposits by banks
Deposits by banks decreased by 12% to £8,696m at 31 December 2013 (2012: £9,935m). The decrease was driven by lower repurchase agreement activity.
Deposits by customers
Deposits by customers decreased by 1% to £147,167m at 31 December 2013 (2012: £149,037m) as we focused on retaining and originating accounts held by more loyal Retail Banking customers.
Derivative liabilities
Derivative liabilities decreased by 35% to £18,863m at 31 December 2013 (2012: £28,861m). The decrease was attributable to a reduction in the fair values of interest rate derivative liabilities. This was due to increased netting of assets and liabilities as a result of greater use of central counterparties, together with movements in yield curves causing a reduction in gross derivative liabilities. There was a corresponding decrease in derivative assets.
Trading liabilities
Trading liabilities were relatively stable at £21,278m at 31 December 2013 (2012: £21,109m). An increase in securities sold under repurchase activities was offset by a reduction in short-term deposits, short positions in securities and unsettled trades as part of normal trading activity.
Financial liabilities designated at fair value
Financial liabilities designated at fair value decreased by 15% to £3,407m at 31 December 2013 (2012: £4,002m). The decrease principally reflected reduced issuances under the US$10bn Euro Commercial Paper Programme which were replaced by increased issuance under the US$20bn Commercial Paper Programme which is included in Debt securities in issue.
Debt securities in issue
Debt securities in issue decreased by 15% to £50,870m at 31 December 2013 (2012: £59,621m) as surplus liquidity was utilised to fund maturing medium term funding.
Subordinated liabilities
Subordinated liabilities increased by 14% to £4,306m at 31 December 2013 (2012: £3,781m). The increase was attributable to new issuances during the year, partly offset by a capital management exercise undertaken during the year.
Retirement benefit obligations
Retirement benefit obligations increased by 120% to £672m at 31 December 2013 (2012: £305m). For Santander UK’s defined benefit pension schemes which had deficits, the key driver of the increase was actuarial losses on liabilities as a result of an increase in RPI inflation market levels. This followed a decision by the Office of National Statistics, in early 2013, not to rebase RPI. In addition, actuarial losses on liabilities increased due to decreased corporate bond yields reducing the discount rate.
Tax, other liabilities and provisions
Tax, other liabilities and provisions decreased by 27% to £2,526m at 31 December 2012 (2012: £3,444m). The decrease principally reflected a decrease in other liabilities and provisions as amounts outstanding to the parent company for dividend payments were settled, and lower outstanding trade payables.
Equity
Total shareholders equity decreased by 3% to £12,520m at 31 December 2013 (2012: £12,949m). The decrease was principally attributable to actuarial losses and a further capital management exercise in August 2013, partially offset by the retained profit for the year, net of dividends declared.
| | |
| Santander UK plc Annual Report 2013 | | 41 |
Detailed Business Review
Balance Sheet Review continued
31 December 2012 compared to 31 December 2011
Assets
Cash and balances at central banks
Cash and balances held at central banks increased by 13% to £29,282m at 31 December 2012 (2011: £25,980m), principally reflecting an increase in Santander UK’s holding of liquid assets.
Trading assets
Trading assets increased by 3% to £22,498m at 31 December 2012 (2011: £21,891m). The increase was attributable to higher activity relating to securities purchased under resale agreements to both banks and customers offsetting lower debt security positions as new liquid assets are held as available-for-sale.
Derivative assets
Derivative assets were relatively stable at £30,146m at 31 December 2012 (2011: £30,780m).
Financial assets designated at fair value through profit and loss
Financial assets designated at fair value through profit and loss decreased by 24% to £3,811m at 31 December 2012 (2011: £5,005m). The decrease was primarily attributable to the maturity of loans to UK Social Housing associations and new loans no longer being designated at fair value in accordance with Santander UK’s policy.
Loans and advances to banks
Loans and advances to banks decreased by 46% to £2,438m at 31 December 2012 (2011: £4,487m). The decrease was due to lower reverse repurchase agreement activity with Banco Santander, S.A. as disclosed in Note 18 to the Consolidated Financial Statements.
Loans and advances to customers
Loans and advances to customers decreased by 5% to £190,782m (2011: £201,069m) principally due to managed reductions across the retail, non-core corporate and legacy portfolios. These reductions were partially offset by increases in SME lending.
Available for sale securities
Available for sale securities increased to £5,483m at 31 December 2012 (2011: £46m), reflecting the acquisition of debt securities as part of its liquidity management activities.
Loans and receivable securities
Loans and receivable securities decreased by 29% to £1,259m at 31 December 2012 (2011: £1,771m). The decrease principally reflected the continuing run-down of the Treasury asset portfolio.
Property, plant and equipment
Property, plant and equipment decreased by 3% to £1,541m at 31 December 2012 (2011: £1,596m). The decrease was attributable to the depreciation charge for the year, partially offset by additions during the year.
Retirement benefit assets
Retirement benefit assets increased to £254m at 31 December 2012 (2011: £241m). For Santander UK’s defined benefit pension schemes which had surpluses, the key drivers of the increase were contributions by Santander UK during the year together with some improvements in asset values, partly offset by a reduction in the net discount rate which generated an actuarial loss on liabilities.
Tax, intangibles and other assets
Tax, intangibles and other assets increased by 24% to £4,320m at 31 December 2012 (2011: £3,485m). The increase was primarily driven by the classification of the assets of the co-brand credit cards business held for sale in other assets, and an increase in capitalised software development costs. This was partially offset by a decrease in tax assets due to the realisation of deferred tax assets.
| | |
| 42 | | Santander UK plc Annual Report 2013 |
Detailed Business Review
Balance Sheet Reviewcontinued
Liabilities
Deposits by banks
Deposits by banks decreased by 15% to £9,935m at 31 December 2012 (2011: £11,626m). The decrease was driven by lower repurchase agreement activity with Banco Santander, S.A. as disclosed in Note 29 to the Consolidated Financial Statements.
Deposits by customers
Deposits by customers increased to £149,037m at 31 December 2012 (2011: £148,342m). The increase reflected strong retail deposit inflows as a result of the successful cross tax year ISA campaign and continued development of the 1|2|3 Current Account.
Derivatives
Derivative liabilities were relatively stable at £28,861m at 31 December 2012 (2011: £29,180m).
Trading liabilities
Trading liabilities decreased by 18% to £21,109m at 31 December 2012 (2011: £25,745m). The decrease was attributable to lower activity relating to securities sold under resale agreements to both banks and customers and lower short-term deposits.
Financial liabilities designated at fair value
Financial liabilities designated at fair value decreased to £4,002m at 31 December 2012 (2011: £6,837m). The decrease reflected new issuances in the US$20bn Medium Term Note Programme being accounted for at amortised cost.
Debt securities in issue
Debt securities in issue increased by 13% to £59,621m at 31 December 2012 (2011: £52,651m). The increase reflected Santander UK’s strategy of increasing the level of medium-term funding through the issuance of debt in the Fosse securitisation and Covered Bond programme. These increases were partially offset by decreases in short term funding in the US$20bn Commercial Paper Programme. In addition, there were further maturities of debt outstanding under the US$40bn EMTN programme.
Subordinated liabilities
Subordinated liabilities decreased by 42% to £3,781m at 31 December 2012 (2011: £6,499m). The decrease was attributable to the capital management exercise undertaken during the year.
Retirement benefit obligations
Retirement benefit obligations increased by 41% to £305m at 31 December 2012 (2011: £216m). For Santander UK’s defined benefit pension schemes which had deficits, the key driver of the increase was a reduction in the net discount rate which generated an actuarial loss on liabilities, partially offset by Santander UK contributions during the year and some improvements in asset values.
Tax, other liabilities and provisions
Tax, other liabilities and provisions decreased by 10% to £3,444m at 31 December 2012 (2011: £3,812m). The decrease principally reflected the decrease in tax liabilities due to the settlement of prior year tax liabilities.
Equity
Total shareholders equity, including non-controlling interests, increased by 2% to £12,949m at 31 December 2012 (2011: £12,666m). The increase was principally attributable to the retained profit for the year of £939m, partially offset by dividends declared of £508m.
| | |
| Santander UK plc Annual Report 2013 | | 43 |
Detailed Business Review
Balance Sheet Reviewcontinued
RECONCILIATION TO CLASSIFICATIONS IN THE CONSOLIDATED BALANCE SHEET
In the remaining sections of the Balance Sheet Review, the principal assets and liabilities are summarised by their nature, rather than by their classification in the Consolidated Balance Sheet. The classifications of assets and liabilities in Santander UK’s consolidated balance sheet, including the note reference, and in the balance sheet review may be reconciled as follows:
| | | | | | | | | | | | | | | | | | | | | | | | | | | | | | | | | | | | |
| 31 December 2013 | | | | | Balance sheet review section | | | | | | | |
Balance sheet line item | | Note | | | Securities
£m | | | Loans and
advances
to banks
£m | | | Loans and
advances to
customers
£m | | | Derivatives
£m | | | Tangible
fixed
assets
£m | | | Retirement
benefit
assets
£m | | | Other
£m | | | Balance
sheet total
£m | |
Assets | | | | | | | | | | | | | | | | | | | | | | | | | | | | | | | | | | | | |
Cash and balances at central banks | | | 13 | | | | — | | | | — | | | | — | | | | — | | | | — | | | | — | | | | 26,374 | | | | 26,374 | |
Trading assets | | | 15 | | | | 8,564 | | | | 9,326 | | | | 4,404 | | | | — | | | | — | | | | — | | | | — | | | | 22,294 | |
Derivative financial instruments | | | 16 | | | | — | | | | — | | | | — | | | | 20,049 | | | | — | | | | — | | | | — | | | | 20,049 | |
Financial assets designated at fair value | | | 17 | | | | 528 | | | | — | | | | 2,219 | | | | — | | | | — | | | | — | | | | — | | | | 2,747 | |
Loans and advances to banks | | | 18 | | | | — | | | | 2,347 | | | | — | | | | — | | | | — | | | | — | | | | — | | | | 2,347 | |
Loans and advances to customers | | | 19 | | | | — | | | | — | | | | 184,587 | | | | — | | | | — | | | | — | | | | — | | | | 184,587 | |
Loans and receivables securities | | | 22 | | | | — | | | | 246 | | | | 855 | | | | — | | | | — | | | | — | | | | — | | | | 1,101 | |
Available for sale securities | | | 23 | | | | 5,005 | | | | — | | | | — | | | | — | | | | — | | | | — | | | | — | | | | 5,005 | |
Macro hedge of interest rate risk | | | | | | | — | | | | — | | | | — | | | | — | | | | — | | | | — | | | | 769 | | | | 769 | |
Interests in other entities | | | 24 | | | | — | | | | — | | | | — | | | | — | | | | — | | | | — | | | | 27 | | | | 27 | |
Property, plant and equipment | | | 26 | | | | — | | | | — | | | | — | | | | — | | | | 1,521 | | | | — | | | | — | | | | 1,521 | |
Retirement benefit assets | | | 37 | | | | — | | | | — | | | | — | | | | — | | | | — | | | | 118 | | | | — | | | | 118 | |
Tax, intangibles and other assets | | | | | | | — | | | | — | | | | — | | | | — | | | | — | | | | — | | | | 3,366 | | | | 3,366 | |
| | | | | | | | | | | | | | | | | | | | | | | | | | | | | | | | | | | | |
Total assets | | | | | | | 14,097 | | | | 11,919 | | | | 192,065 | | | | 20,049 | | | | 1,521 | | | | 118 | | | | 30,536 | | | | 270,305 | |
| | | | | | | | | | | | | | | | | | | | | | | | | | | | | | | | | | | | |
| | | | | | | | | |
| | | | | | | | | Deposits by
banks
£m | | | Deposits by
customers
£m | | | Debt
securities
in issue
£m | | | Derivatives
£m | | | Retirement
benefit
obligations
£m | | | Other
£m | | | Balance
sheet total
£m | |
Liabilities | | | | | | | | | | | | | | | | | | | | | | | | | | | | | | | | | | | | |
Deposits by banks | | | 29 | | | | | | | | 8,696 | | | | — | | | | — | | | | — | | | | — | | | | — | | | | 8,696 | |
Deposits by customers | | | 30 | | | | | | | | — | | | | 147,167 | | | | — | | | | — | | | | — | | | | — | | | | 147,167 | |
Trading liabilities | | | 31 | | | | | | | | 11,291 | | | | 7,069 | | | | 2,918 | | | | — | | | | — | | | | — | | | | 21,278 | |
Derivative financial instruments | | | 16 | | | | | | | | — | | | | — | | | | — | | | | 18,863 | | | | — | | | | — | | | | 18,863 | |
Financial liabilities designated at fair value | | | 32 | | | | | | | | — | | | | — | | | | 3,407 | | | | — | | | | — | | | | — | | | | 3,407 | |
Debt securities in issue | | | 33 | | | | | | | | — | | | | — | | | | 50,870 | | | | — | | | | — | | | | — | | | | 50,870 | |
Subordinated liabilities | | | 34 | | | | | | | | — | | | | — | | | | 4,306 | | | | — | | | | — | | | | — | | | | 4,306 | |
Retirement benefit obligations | | | 37 | | | | | | | | — | | | | — | | | | — | | | | — | | | | 672 | | | | — | | | | 672 | |
Tax, other liabilities and provisions | | | | | | | | | | | — | | | | — | | | | — | | | | — | | | | — | | | | 2,526 | | | | 2,526 | |
| | | | | | | | | | | | | | | | | | | | | | | | | | | | | | | | | | | | |
Total liabilities | | | | | | | | | | | 19,987 | | | | 154,236 | | | | 61,501 | | | | 18,863 | | | | 672 | | | | 2,526 | | | | 257,785 | |
| | | | | | | | | | | | | | | | | | | | | | | | | | | | | | | | | | | | |
| | | | |
| 31 December 2012(1) | | | | | Balance sheet review section | | | | | | | |
Balance sheet line item | | Note | | | Securities
£m | | | Loans and
advances
to banks
£m | | | Loans and
advances to
customers
£m | | | Derivatives
£m | | | Tangible
fixed
assets
£m | | | Retirement
benefit
assets
£m | | | Other
£m | | | Balance
sheet total
£m | |
Assets | | | | | | | | | | | | | | | | | | | | | | | | | | | | | | | | | | | | |
Cash and balances at central banks | | | 13 | | | | — | | | | — | | | | — | | | | — | | | | — | | | | — | | | | 29,282 | | | | 29,282 | |
Trading assets | | | 15 | | | | 4,958 | | | | 9,988 | | | | 7,552 | | | | — | | | | — | | | | — | | | | — | | | | 22,498 | |
Derivative financial instruments | | | 16 | | | | — | | | | — | | | | — | | | | 30,146 | | | | — | | | | — | | | | — | | | | 30,146 | |
Financial assets designated at fair value | | | 17 | | | | 563 | | | | — | | | | 3,248 | | | | — | | | | — | | | | — | | | | — | | | | 3,811 | |
Loans and advances to banks | | | 18 | | | | — | | | | 2,438 | | | | — | | | | — | | | | — | | | | — | | | | — | | | | 2,438 | |
Loans and advances to customers | | | 19 | | | | — | | | | — | | | | 190,782 | | | | — | | | | — | | | | — | | | | — | | | | 190,782 | |
Loans and receivables securities | | | 22 | | | | — | | | | 490 | | | | 769 | | | | — | | | | — | | | | — | | | | — | | | | 1,259 | |
Available for sale securities | | | 23 | | | | 5,483 | | | | — | | | | — | | | | — | | | | — | | | | — | | | | — | | | | 5,483 | |
Macro hedge of interest rate risk | | | | | | | — | | | | — | | | | — | | | | — | | | | — | | | | — | | | | 1,222 | | | | 1,222 | |
Interests in other entities | | | 24 | | | | — | | | | — | | | | — | | | | — | | | | — | | | | — | | | | 8 | | | | 8 | |
Property, plant and equipment | | | 26 | | | | — | | | | — | | | | — | | | | — | | | | 1,541 | | | | — | | | | — | | | | 1,541 | |
Retirement benefit assets | | | 37 | | | | — | | | | — | | | | — | | | | — | | | | — | | | | 254 | | | | — | | | | 254 | |
Tax, intangibles and other assets | | | | | | | — | | | | — | | | | 1,125 | | | | — | | | | — | | | | — | | | | 3,195 | | | | 4,320 | |
| | | | | | | | | | | | | | | | | | | | | | | | | | | | | | | | | | | | |
Total assets | | | | | | | 11,004 | | | | 12,916 | | | | 203,476 | | | | 30,146 | | | | 1,541 | | | | 254 | | | | 33,707 | | | | 293,044 | |
| | | | | | | | | | | | | | | | | | | | | | | | | | | | | | | | | | | | |
| | | | | | | | | |
| | | | | | | | | Deposits by
banks
£m | | | Deposits by
customers
£m | | | Debt
securities
in issue
£m | | | Derivatives
£m | | | Retirement
benefit
obligations
£m | | | Other
£m | | | Balance
sheet total
£m | |
Liabilities | | | | | | | | | | | | | | | | | | | | | | | | | | | | | | | | | | | | |
Deposits by banks | | | 29 | | | | | | | | 9,935 | | | | — | | | | — | | | | — | | | | — | | | | — | | | | 9,935 | |
Deposits by customers | | | 30 | | | | | | | | — | | | | 149,037 | | | | — | | | | — | | | | — | | | | — | | | | 149,037 | |
Trading liabilities | | | 31 | | | | | | | | 9,742 | | | | 7,248 | | | | 4,119 | | | | — | | | | — | | | | — | | | | 21,109 | |
Derivative financial instruments | | | 16 | | | | | | | | — | | | | — | | | | — | | | | 28,861 | | | | — | | | | — | | | | 28,861 | |
Financial liabilities designated at fair value | | | 32 | | | | | | | | — | | | | — | | | | 4,002 | | | | — | | | | — | | | | — | | | | 4,002 | |
Debt securities in issue | | | 33 | | | | | | | | — | | | | — | | | | 59,621 | | | | — | | | | — | | | | — | | | | 59,621 | |
Subordinated liabilities | | | 34 | | | | | | | | — | | | | — | | | | 3,781 | | | | — | | | | — | | | | — | | | | 3,781 | |
Retirement benefit obligations | | | 37 | | | | | | | | — | | | | — | | | | — | | | | — | | | | 305 | | | | — | | | | 305 | |
Tax, other liabilities and provisions | | | | | | | | | | | — | | | | — | | | | — | | | | — | | | | — | | | | 3,444 | | | | 3,444 | |
| | | | | | | | | | | | | | | | | | | | | | | | | | | | | | | | | | | | |
Total liabilities | | | | | | | | | | | 19,677 | | | | 156,285 | | | | 71,523 | | | | 28,861 | | | | 305 | | | | 3,444 | | | | 280,095 | |
| | | | | | | | | | | | | | | | | | | | | | | | | | | | | | | | | | | | |
| (1) | Adjusted to reflect the presentation of the assets held for sale prior to the completion of the sale as set out in Note 12 to the Consolidated Financial Statements. |
| | |
| 44 | | Santander UK plc Annual Report 2013 |
Detailed Business Review
Balance Sheet Reviewcontinued
SECURITIES
Santander UK’s holdings of securities only represent a small proportion of its total assets. Santander UK holds securities principally in its trading portfolio or classified as available-for-sale.
Securities analysis by type of issuer
The following table sets out the book and market values of securities at 31 December 2013, 2012 and 2011. For further information, see the Notes to the Consolidated Financial Statements.
| | | | | | | | | | | | |
| | | 2013
£m | | | 2012
£m | | | 2011
£m | |
Trading portfolio | | | | | | | | | | | | |
Debt securities: | | | | | | | | | | | | |
UK Government | | | 989 | | | | 1,817 | | | | 1,078 | |
US Treasury and other US Government agencies and corporations | | | 399 | | | | 31 | | | | 65 | |
Other OECD governments | | | 5,243 | | | | 2,069 | | | | 1,800 | |
Bank and building society: | | | | | | | | | | | | |
- Certificates of deposit and bonds | | | — | | | | 13 | | | | — | |
Other issuers: | | | | | | | | | | | | |
- Fixed and floating rate notes – Government guaranteed | | | 1,081 | | | | 426 | | | | 5,754 | |
- Fixed and floating rate notes - Other | | | 147 | | | | 138 | | | | 14 | |
Ordinary shares and similar securities | | | 705 | | | | 464 | | | | 349 | |
| | | | | | | | | | | | |
| | | 8,564 | | | | 4,958 | | | | 9,060 | |
| | | | | | | | | | | | |
Available for sale securities | | | | | | | | | | | | |
Debt securities: | | | | | | | | | | | | |
UK Government | | | 2,912 | | | | 3,844 | | | | — | |
US Treasury and other US Government agencies and corporations | | | — | | | | 363 | | | | — | |
Other OECD governments | | | — | | | | 906 | | | | — | |
Bank and building society: | | | | | | | | | | | | |
- Certificates of deposit and covered bonds | | | 2,069 | | | | 346 | | | | — | |
Ordinary shares and similar securities | | | 24 | | | | 24 | | | | 46 | |
| | | | | | | | | | | | |
| | | 5,005 | | | | 5,483 | | | | 46 | |
| | | | | | | | | | | | |
Financial assets designated at fair value through profit and loss | | | | | | | | | | | | |
Debt securities: | | | | | | | | | | | | |
Other issuers: | | | | | | | | | | | | |
- Mortgage-backed securities | | | 229 | | | | 250 | | | | 279 | |
- Other asset-backed securities | | | 87 | | | | 78 | | | | 100 | |
- Other securities | | | 212 | | | | 235 | | | | 250 | |
| | | | | | | | | | | | |
| | | 528 | | | | 563 | | | | 629 | |
| | | | | | | | | | | | |
Total | | | 14,097 | | | | 11,004 | | | | 9,735 | |
| | | | | | | | | | | | |
UK Government
UK Government securities represent Treasury Bills and UK Government guaranteed issues by other UK banks. These securities are held for trading and liquidity purposes. For further information, see “Country Risk Exposure” in the Risk Management Report.
US Treasury and other US Government agencies and corporations
US Treasury and other US Government agencies’ and corporations’ securities represent US Treasury Bills, including cash management bills. These securities are held for trading and liquidity purposes. For further information, see “Country Risk Exposure” in the Risk Management Report.
Other OECD governments
Other OECD government securities represent issues by OECD governments, other than the US and UK Governments, principally Japan, Italy and Switzerland (2012: principally Switzerland, Germany and Japan). These securities are held for trading and liquidity management purposes. For further information, see “Country Risk Exposure” in the Risk Management Report.
Bank and building society certificates of deposit and bonds
Bank and building society certificates of deposit were fixed-rate securities with relatively short maturities issued by banks (2012: the UK, France, Switzerland and the Netherlands). These were managed within the overall position for the relevant book. In addition, covered bonds were purchased in 2013 as part of the ALCO portfolio. These securities were held for liquidity purposes.
| | |
| Santander UK plc Annual Report 2013 | | 45 |
Detailed Business Review
Balance Sheet Reviewcontinued
Fixed and floating rate notes
Fixed and floating rate notes have regular interest rate profiles and are either managed within the overall position for the relevant book or are hedged into one of the main currencies. Government-guaranteed fixed and floating rate notes relate to the UK, French and Belgian Governments (2012: almost all related to the UK Government). These securities are held for trading and yield purposes. For further information on Government-guaranteed fixed and floating rate notes, see “Country Risk Exposure” in the Risk Management Report.
Mortgage-backed securities
This category principally comprises UK residential mortgage-backed securities. These securities are of good quality and contain no sub-prime element. These securities are held as part of the FMIR portfolio. See Note 17 to the Consolidated Financial Statements.
Other asset-backed securities
This category comprises a range of mostly floating-rate asset-backed securities. See Note 17 to the Consolidated Financial Statements.
Other securities
This category comprises reversionary UK property securities. See Note 17 to the Consolidated Financial Statements.
Contractual maturities of securities
Contractual maturities for available-for-sale debt securities and contractual maturities of investments held for trading or classified as fair value through profit or loss are set out in Notes 23 and 45 to the Consolidated Financial Statements, respectively.
Significant exposures
The following table sets forth the book value (which equals market value) of securities of individual counterparties where the aggregate amount of those securities exceeded 10% of Santander UK’s shareholders’ funds at 31 December 2013 as set out in the Consolidated Balance Sheet on page 206. The table also sets forth the classification of the securities in the Consolidated Balance Sheet.
| | | | | | | | | | | | |
| | | Trading assets
£m | | | Available-for-sale
£m | | | Total
£m | |
UK Government and UK Government guaranteed | | | 1,404 | | | | 2,664 | | | | 4,068 | |
Japanese Government | | | 3,802 | | | | — | | | | 3,802 | |
LOANS AND ADVANCES TO BANKS
Loans and advances to banks include loans to banks and building societies and balances with central banks (excluding those central bank balances which can be withdrawn on demand).
Loans and advances to banks geographical analysis
The geographical analysis of loans and advances presented in the following table is based on the location of the office from which the loans and advances are made, rather than the domicile of the borrower. The balances below include loans and advances to banks that are classified in the balance sheet as trading assets, financial assets designated at fair value, or loans and receivables securities.
| | | | | | | | | | | | | | | | | | | | |
| | | 2013
£m | | | 2012
£m | | | 2011
£m | | | 2010
£m | | | 2009
£m | |
UK | | | 8,966 | | | | 11,763 | | | | 10,727 | | | | 13,561 | | | | 21,606 | |
Non-UK | | | 2,953 | | | | 1,153 | | | | 861 | | | | 118 | | | | 87 | |
| | | | | | | | | | | | | | | | | | | | |
| | | 11,919 | | | | 12,916 | | | | 11,588 | | | | 13,679 | | | | 21,693 | |
| | | | | | | | | | | | | | | | | | | | |
Further geographical analysis of loans and advances to banks based on the country of domicile of the borrower rather than the office of lending is contained in “Country Risk Exposure” in the Risk Management Report, including details of balances with other Banco Santander group companies.
| | |
| 46 | | Santander UK plc Annual Report 2013 |
Detailed Business Review
Balance Sheet Reviewcontinued
Loans and advances to banks maturity analysis
The following table sets forth loans and advances to banks by maturity at 31 December 2013.
| | | | | | | | | | | | | | | | | | | | | | | | | | | | |
| | | On
demand
£m | | | In not more
than three
months
£m | | | In more than
three months
but not more
than one year
£m | | | In more than
one year but
not more than
five years
£m | | | In more than
five years but
not more than
ten years
£m | | | In more
than ten
years
£m | | | Total
£m | |
UK | | | 3,391 | | | | 4,382 | | | | 11 | | | | 51 | | | | 108 | | | | 1,023 | | | | 8,966 | |
Non-UK | | | 2,953 | | | | — | | | | — | | | | — | | | | — | | | | — | | | | 2,953 | |
| | | | | | | | | | | | | | | | | | | | | | | | | | | | |
Total | | | 6,344 | | | | 4,382 | | | | 11 | | | | 51 | | | | 108 | | | | 1,023 | | | | 11,919 | |
| | | | | | | | | | | | | | | | | | | | | | | | | | | | |
Of which: | | | | | | | | | | | | | | | | | | | | | | | | | | | | |
- Fixed interest rate | | | 3,186 | | | | 4,269 | | | | — | | | | 34 | | | | — | | | | 598 | | | | 8,087 | |
- Variable interest rate | | | 2,809 | | | | 99 | | | | 11 | | | | 17 | | | | 108 | | | | 425 | | | | 3,469 | |
- Non interest-bearing | | | 349 | | | | 14 | | | | — | | | | — | | | | — | | | | — | | | | 363 | |
| | | | | | | | | | | | | | | | | | | | | | | | | | | | |
Total | | | 6,344 | | | | 4,382 | | | | 11 | | | | 51 | | | | 108 | | | | 1,023 | | | | 11,919 | |
| | | | | | | | | | | | | | | | | | | | | | | | | | | | |
LOANS AND ADVANCES TO CUSTOMERS
Santander UK provides lending facilities primarily to personal customers in the form of mortgages secured on residential properties and lending facilities to corporate customers. Purchase and resale agreements represent sale and repurchase activity with professional non-bank customers by the short term markets business.
Loans and advances to customers geographical analysis
The geographical analysis of loans and advances presented in the following table is based on the location of the office from which the loans and advances are made. Further geographical analysis of loans and advances to customers based on the country of domicile of the borrower rather than the office of lending is contained in “Country Risk Exposure” in the Risk Management Report, including details of balances with other Banco Santander group companies.
The balances below are stated before the deduction for impairment loss allowances and include loans and advances to customers that are classified in the balance sheet as trading assets, financial assets designated at fair value, or loans and receivables securities.
| | | | | | | | | | | | | | | | | | | | |
| | | 2013
£m | | | 2012
£m | | | 2011
£m | | | 2010
£m | | | 2009
£m | |
UK | | | | | | | | | | | | | | | | | | | | |
Advances secured on residential property | | | 149,017 | | | | 157,304 | | | | 166,841 | | | | 166,065 | | | | 160,457 | |
Corporate loans | | | 27,089 | | | | 26,559 | | | | 26,278 | | | | 21,796 | | | | 18,886 | |
Finance leases | | | 3,158 | | | | 3,062 | | | | 2,944 | | | | 2,653 | | | | 1,602 | |
Other secured advances | | | 2,710 | | | | 3,011 | | | | 3,710 | | | | 3,941 | | | | 4,079 | |
Other unsecured advances | | | 5,732 | | | | 6,733 | | | | 7,545 | | | | 7,734 | | | | 5,249 | |
Purchase and resale agreements | | | 4,210 | | | | 2,512 | | | | 6,150 | | | | 8,641 | | | | 8,827 | |
Loans and receivables securities | | | 855 | | | | 769 | | | | 814 | | | | 2,075 | | | | 4,147 | |
Amounts due from fellow subsidiaries, associates and joint ventures | | | 813 | | | | 347 | | | | 32 | | | | 57 | | | | 4,457 | |
| | | | | | | | | | | | | | | | | | | | |
Total UK | | | 193,584 | | | | 200,297 | | | | 214,314 | | | | 212,962 | | | | 207,704 | |
| | | | | | | | | | | | | | | | | | | | |
Non-UK | | | | | | | | | | | | | | | | | | | | |
Advances secured on residential property | | | 5 | | | | 6 | | | | 6 | | | | 8 | | | | 9 | |
Corporate loans | | | — | | | | — | | | | — | | | | — | | | | 2 | |
Other secured advances | | | — | | | | — | | | | 1 | | | | 1 | | | | 2 | |
Other unsecured advances | | | 31 | | | | 25 | | | | — | | | | — | | | | 1 | |
Purchase and resale agreements | | | — | | | | 4,950 | | | | 188 | | | | 18 | | | | — | |
| | | | | | | | | | | | | | | | | | | | |
Total non-UK | | | 36 | | | | 4,981 | | | | 195 | | | | 27 | | | | 14 | |
| | | | | | | | | | | | | | | | | | | | |
Total | | | 193,620 | | | | 205,278 | | | | 214,509 | | | | 212,989 | | | | 207,718 | |
Less: impairment loss allowances | | | (1,555 | ) | | | (1,802 | ) | | | (1,563 | ) | | | (1,655 | ) | | | (1,299 | ) |
| | | | | | | | | | | | | | | | | | | | |
Total, net of impairment loss allowances | | | 192,065 | | | | 203,476 | | | | 212,946 | | | | 211,334 | | | | 206,419 | |
| | | | | | | | | | | | | | | | | | | | |
Detailed analysis of the loans and receivables securities included in the table above is set out in Note 22 to the Consolidated Financial Statements. Further analysis of the impairment loss allowance is set out in Note 19 to the Consolidated Financial Statements.
No single concentration of loans and advances, with the exception of advances secured on residential properties and corporate loans, as disclosed above, accounts for more than 10% of total loans and advances and no individual country, other than the UK accounts for more than 5% of total loans and advances.
| | |
| Santander UK plc Annual Report 2013 | | 47 |
Detailed Business Review
Balance Sheet Reviewcontinued
Loans and advances to customers maturity analysis
The following table sets forth loans and advances to customers by maturity at 31 December 2013. Overdrafts are included in the “on-demand” category. Loans and advances are included at their contractual maturity; no account is taken of a customer’s ability to repay early where it exists.
| | | | | | | | | | | | | | | | | | | | | | | | | | | | |
| | | On
demand
£m | | | In not
more than
three
months
£m | | | In more than
three months
but not more
than one year
£m | | | In more than
one year but
not more than
five years
£m | | | In more than
five years but
not more than
ten years
£m | | | In more
than ten
years
£m | | | Total
£m | |
UK | | | | | | | | | | | | | | | | | | | | | | | | | | | | |
Advances secured on residential property | | | 41 | | | | 1,433 | | | | 3,195 | | | | 18,012 | | | | 20,569 | | | | 105,767 | | | | 149,017 | |
Corporate loans | | | 6 | | | | 1,609 | | | | 2,085 | | | | 12,494 | | | | 5,131 | | | | 5,764 | | | | 27,089 | |
Finance leases | | | — | | | | 376 | | | | 882 | | | | 1,651 | | | | 115 | | | | 134 | | | | 3,158 | |
Other secured advances | | | 305 | | | | 71 | | | | 462 | | | | 387 | | | | 479 | | | | 1,006 | | | | 2,710 | |
Other unsecured advances | | | 1,022 | | | | 472 | | | | 966 | | | | 2,236 | | | | 420 | | | | 616 | | | | 5,732 | |
Purchase and resale agreements | | | — | | | | 4,210 | | | | — | | | | — | | | | — | | | | — | | | | 4,210 | |
Loans and receivables securities | | | 33 | | | | — | | | | 2 | | | | 46 | | | | 180 | | | | 594 | | | | 855 | |
Amounts due from fellow subsidiaries, associates and joint ventures | | | 2 | | | | 687 | | | | — | | | | 111 | | | | 13 | | | | — | | | | 813 | |
| | | | | | | | | | | | | | | | | | | | | | | | | | | | |
Total UK | | | 1,409 | | | | 8,858 | | | | 7,592 | | | | 34,937 | | | | 26,907 | | | | 113,881 | | | | 193,584 | |
| | | | | | | | | | | | | | | | | | | | | | | | | | | | |
Non-UK | | | | | | | | | | | | | | | | | | | | | | | | | | | | |
Advances secured on residential property | | | — | | | | — | | | | — | | | | 1 | | | | 1 | | | | 3 | | | | 5 | |
Other unsecured advances | | | 31 | | | | — | | | | — | | | | — | | | | — | | | | — | | | | 31 | |
| | | | | | | | | | | | | | | | | | | | | | | | | | | | |
Total non-UK | | | 31 | | | | — | | | | — | | | | 1 | | | | 1 | | | | 3 | | | | 36 | |
| | | | | | | | | | | | | | | | | | | | | | | | | | | | |
Total | | | 1,440 | | | | 8,858 | | | | 7,592 | | | | 34,938 | | | | 26,908 | | | | 113,884 | | | | 193,620 | |
| | | | | | | | | | | | | | | | | | | | | | | | | | | | |
Of which: | | | | | | | | | | | | | | | | | | | | | | | | | | | | |
- Fixed interest rate | | | 422 | | | | 5,354 | | | | 3,030 | | | | 11,455 | | | | 9,451 | | | | 46,805 | | | | 76,517 | |
- Variable interest rate | | | 1,018 | | | | 3,504 | | | | 4,562 | | | | 23,483 | | | | 17,457 | | | | 67,079 | | | | 117,103 | |
| | | | | | | | | | | | | | | | | | | | | | | | | | | | |
Total | | | 1,440 | | | | 8,858 | | | | 7,592 | | | | 34,938 | | | | 26,908 | | | | 113,884 | | | | 193,620 | |
Of which: | | | | | | | | | | | | | | | | | | | | | | | | | | | | |
- Interest-only advances secured on residential
property(1) | | | 43 | | | | 104 | | | | 646 | | | | 4,909 | | | | 9,451 | | | | 43,827 | | | | 58,980 | |
| | | | | | | | | | | | | | | | | | | | | | | | | | | | |
| (1) | Comprises both full interest-only mortgage loans of £49,416m and the interest only element of £9,564m of part interest-only, part repayment loans. |
Santander UK’s policy is to hedge all fixed-rate loans and advances to customers using derivative instruments, or by matching with other on-balance sheet interest rate exposures.
The balance sheet is managed on a behavioural basis, rather than on the basis of contractual maturity, with many loans being prepaid prior to their legal maturity. This applies in particular to advances secured on residential property.
Impairment loss allowances on loans and advances to customers
Details of Santander UK’s impairment loss allowances policy are set out in Note 1 to the Consolidated Financial Statements. An analysis of impairment loss allowances on loans and advances to customers, including movements in impairment loss allowances, is set out in Note 19 to the Consolidated Financial Statements.
DERIVATIVE ASSETS AND LIABILITIES
| | | | | | | | | | | | |
| | | 2013
£m | | | 2012
£m | | | 2011
£m | |
Assets | | | | | | | | | | | | |
- held for trading | | | 17,433 | | | | 28,064 | | | | 27,394 | |
- held for hedging | | | 2,616 | | | | 2,082 | | | | 3,386 | |
| | | | | | | | | | | | |
| | | 20,049 | | | | 30,146 | | | | 30,780 | |
| | | | | | | | | | | | |
Liabilities | | | | | | | | | | | | |
- held for trading | | | 17,297 | | | | 27,415 | | | | 27,787 | |
- held for hedging | | | 1,566 | | | | 1,446 | | | | 1,393 | |
| | | | | | | | | | | | |
| | | 18,863 | | | | 28,861 | | | | 29,180 | |
| | | | | | | | | | | | |
Derivatives are held for trading or for risk management purposes. All derivatives are classified as held at fair value through profit or loss. For accounting purposes, Santander UK chooses to designate certain derivatives as in a hedging relationship if they meet specific criteria. The main hedging derivatives are interest rate and cross-currency swaps, which are used to hedge fixed-rate lending and structured savings products and medium-term note issuances, capital issuances and other capital markets funding.
Commercial Banking deals with commercial customers who wish to enter into derivative contracts. Any market risk arising from such transactions is hedged by Markets. Markets is responsible for implementing Santander UK derivative hedging with the external market together with its own trading activities. Further details about market risk are set out in the Risk Management Report.
A summary of Santander UK’s derivative activities, the related risks associated with such activities and the types of hedging derivatives used in managing such risks, as well as notional amounts and assets and liabilities analysed by contract type are contained in Note 16 of the Consolidated Financial Statements.
| | |
| 48 | | Santander UK plc Annual Report 2013 |
Detailed Business Review
Balance Sheet Reviewcontinued
TANGIBLE FIXED ASSETS
| | | | | | | | | | | | |
| | | 2013
£m | | | 2012
£m | | | 2011
£m | |
Property, plant and equipment | | | 1,521 | | | | 1,541 | | | | 1,596 | |
| | | | | | | | | | | | |
Capital expenditure incurred during the year | | | 258 | | | | 230 | | | | 205 | |
| | | | | | | | | | | | |
Details of capital expenditure contracted but not provided for in respect of tangible fixed assets are set out in Note 26 to the Consolidated Financial Statements. Santander UK had 1,502 property interests at 31 December 2013 (2012: 1,557). The total consisted of 349 freeholds (2012: 400) and 1,153 operating lease interests (2012: 1,157), occupying a total floor space of 510,671 square metres (2012: 513,437 square metres).
The number of property interests is more than the number of individual properties as Santander UK has more than one interest in some properties. The majority of Santander UK’s property interests are retail branches. Included in the above total are 208 properties (2012: 161 properties) that were not occupied by Santander UK at 31 December 2013. Of Santander UK’s individual properties, 1,056 are located in the UK (2012: 1,070), 1 in Europe (2012: 1) and 2 in the US (2012: 2). There are no material environmental issues associated with the use of the above properties.
At 31 December 2013, Santander UK had 16 principal sites including its headquarters (2012: 14). They are used for its significant business operations, including Manufacturing; Human Resources; Retail Banking; Commercial Banking; Markets; Telephone Sales and Servicing; Complaints handling; Credit Card operations; Debt management; Finance; Compliance; Marketing; and IT operations including Data Centres.
Management believes its existing properties and those under construction, together with those it leases, are adequate and suitable for its business as presently conducted and to meet future business needs. All properties are adequately maintained.
RETIREMENT BENEFIT PLANS
| | | | | | | | | | | | |
| | | 2013
£m | | | 2012
£m | | | 2011
£m | |
Retirement benefit assets | | | 118 | | | | 254 | | | | 241 | |
Retirement benefit obligations | | | (672 | ) | | | (305 | ) | | | (216 | ) |
Santander UK operates a number of defined contribution and defined benefit pension schemes, and post retirement medical benefit plans. Detailed disclosures of Santander UK’s retirement benefit assets and obligations are contained in Note 37 to the Consolidated Financial Statements.
DEPOSITS BY BANKS(1)
The balances below include deposits by banks that are classified in the balance sheet as trading liabilities and financial liabilities designated at fair value.
| | | | | | | | | | | | |
| | | 2013
£m | | | 2012
£m | | | 2011
£m | |
Year-end balance(1) | | | 19,987 | | | | 19,677 | | | | 26,134 | |
Average balance(2) | | | 27,395 | | | | 26,714 | | | | 33,628 | |
Average interest rate(2) | | | 1.53 | % | | | 1.27 | % | | | 0.79 | % |
| (1) | The year-end deposits by banks balance includes non-interest bearing items in the course of transmission of £614m (2012: £340m, 2011: £1,045m). |
| (2) | Calculated using monthly data. |
At 31 December 2013, deposits by foreign banks amounted to £14,186m (2012: £12,280m, 2011: £7,912m). The following tables set forth the average balances of deposits by banks by geography.
| | | | | | | | | | | | |
| | | Average: year ended 31 December | |
| | | 2013
£m | | | 2012
£m | | | 2011
£m | |
UK | | | 27,307 | | | | 26,592 | | | | 32,553 | |
Non-UK | | | 88 | | | | 122 | | | | 1,075 | |
| | | | | | | | | | | | |
| | | 27,395 | | | | 26,714 | | | | 33,628 | |
| | | | | | | | | | | | |
| | |
| Santander UK plc Annual Report 2013 | | 49 |
Detailed Business Review
Balance Sheet Reviewcontinued
DEPOSITS BY CUSTOMERS
The balances below include deposits by customers that are classified in the balance sheet as trading liabilities and financial liabilities designated at fair value.
| | | | | | | | | | | | |
| | | 2013
£m | | | 2012
£m | | | 2011
£m | |
Year-end balance | | | 154,236 | | | | 156,285 | | | | 158,824 | |
Average balance(1) | | | 154,881 | | | | 159,611 | | | | 165,871 | |
Average interest rate(1) | | | 1.74 | % | | | 1.93 | % | | | 1.68 | % |
| (1) | Calculated using monthly data. |
The following tables set forth the average balances of deposits by geography and customer type.
| | | | | | | | | | | | |
| | | Average: year ended 31 December | |
| | | 2013
£m | | | 2012
£m | | | 2011
£m | |
UK | | | | | | | | | | | | |
Retail demand deposits | | | 72,566 | | | | 73,832 | | | | 70,887 | |
Retail time deposits | | | 51,608 | | | | 46,256 | | | | 50,581 | |
Wholesale deposits | | | 23,840 | | | | 31,118 | | | | 33,241 | |
| | | | | | | | | | | | |
| | | 148,014 | | | | 151,206 | | | | 154,709 | |
| | | | | | | | | | | | |
Non-UK | | | | | | | | | | | | |
Retail demand deposits | | | 964 | | | | 1,375 | | | | 2,104 | |
Retail time deposits | | | 2,703 | | | | 5,818 | | | | 6,566 | |
Wholesale deposits | | | 3,200 | | | | 1,212 | | | | 2,492 | |
| | | | | | | | | | | | |
| | | 6,867 | | | | 8,405 | | | | 11,162 | |
| | | | | | | | | | | | |
| | | 154,881 | | | | 159,611 | | | | 165,871 | |
| | | | | | | | | | | | |
Retail demand and time deposits are obtained either through the branch network, cahoot or remotely (such as postal accounts). Retail demand and time deposits are also obtained outside the UK, principally through Abbey National International Limited and through the Isle of Man branch of Santander UK plc (formerly through Alliance & Leicester International Limited). They are all interest bearing and interest rates are varied from time to time in response to competitive conditions.
Demand deposits
Demand deposits consist of savings and current accounts. Savings products comprise Individual Savings Accounts, instant saver accounts, remote access accounts, such as those serviced by post, and a number of other accounts which allow the customer a limited number of notice-free withdrawals per year depending on the balance remaining in the account. These accounts are treated as demand deposits because the entire account balance may be withdrawn on demand without penalty as one of the notice-free withdrawals.
Time deposits
Time deposits consist of notice accounts, which require customers to give notice of an intention to make a withdrawal, and bond accounts, which have a minimum deposit requirement. In each of these accounts early withdrawal incurs an interest penalty.
Wholesale deposits
Wholesale deposits are those which either are obtained through the money markets or for which interest rates are quoted on request rather than being publicly advertised. These deposits are of fixed maturity and bear interest rates that reflect the inter-bank money market rates.
| | |
| 50 | | Santander UK plc Annual Report 2013 |
Detailed Business Review
Balance Sheet Reviewcontinued
SHORT-TERM BORROWINGS
Santander UK includes short-term borrowings within deposits by banks, trading liabilities, financial liabilities designated at fair value and debt securities in issue and does not show short-term borrowings separately on the balance sheet. Short-term borrowings are defined by the US Securities and Exchange Commission (the ‘SEC’) as amounts payable for short-term obligations that are US Federal funds purchased and securities sold under repurchase agreements, commercial paper, borrowings from banks, borrowings from factors or other financial institutions and any other short-term borrowings reflected on Santander UK’s balance sheet. Santander UK’s only significant short-term borrowings are securities sold under repurchase agreements, commercial paper, borrowings from banks, negotiable certificates of deposit, and certain other debt securities in issue. Additional information on short-term borrowings is provided in the table below for each of the years ended 31 December 2013, 2012 and 2011.
| | | | | | | | | | | | |
| | | 2013
£m | | | 2012
£m | | | 2011
£m | |
Securities sold under repurchase agreements | | | | | | | | | | | | |
- Year-end balance | | | 14,844 | | | | 24,583 | | | | 17,490 | |
- Year-end interest rate | | | 0.49 | % | | | 0.40 | % | | | 0.49 | % |
- Average balance(1) | | | 20,573 | | | | 30,336 | | | | 30,551 | |
- Average interest rate(1) | | | 0.54 | % | | | 0.39 | % | | | 0.97 | % |
- Maximum balance(1) | | | 26,215 | | | | 37,621 | | | | 36,842 | |
Commercial paper | | | | | | | | | | | | |
- Year-end balance | | | 3,996 | | | | 3,697 | | | | 3,500 | |
- Year-end interest rate | | | 0.27 | % | | | 0.37 | % | | | 0.31 | % |
- Average balance(1) | | | 4,453 | | | | 3,742 | | | | 4,787 | |
- Average interest rate(1) | | | 0.28 | % | | | 0.61 | % | | | 0.22 | % |
- Maximum balance(1) | | | 5,291 | | | | 3,921 | | | | 6,908 | |
Borrowings from banks (Deposits by banks)(2) | | | | | | | | | | | | |
- Year-end balance | | | 3,057 | | | | 2,372 | | | | 3,141 | |
- Year-end interest rate | | | 0.02 | % | | | 0.29 | % | | | 0.31 | % |
- Average balance(1) | | | 2,721 | | | | 2,923 | | | | 3,368 | |
- Average interest rate(1) | | | 0.03 | % | | | 0.31 | % | | | 0.29 | % |
- Maximum balance(1) | | | 3,401 | | | | 4,606 | | | | 4,177 | |
Negotiable certificates of deposit | | | | | | | | | | | | |
- Year-end balance | | | 2,646 | | | | 4,499 | | | | 2,671 | |
- Year-end interest rate | | | 1.56 | % | | | 1.97 | % | | | 1.38 | % |
- Average balance(1) | | | 2,529 | | | | 2,208 | | | | 5,222 | |
- Average interest rate(1) | | | 1.51 | % | | | 1.39 | % | | | 1.36 | % |
- Maximum balance(1) | | | 3,173 | | | | 4,499 | | | | 8,083 | |
Other debt securities in issue | | | | | | | | | | | | |
- Year-end balance | | | 5,434 | | | | 2,789 | | | | 3,722 | |
- Year-end interest rate | | | 3.37 | % | | | 2.99 | % | | | 2.14 | % |
- Average balance(1) | | | 4,919 | | | | 5,644 | | | | 5,754 | |
- Average interest rate(1) | | | 3.00 | % | | | 2.70 | % | | | 1.91 | % |
- Maximum balance(1) | | | 7,245 | | | | 7,049 | | | | 7,517 | |
| (1) | Calculated using monthly data. |
| (2) | The year-end deposits by banks balance includes non-interest bearing items in the course of transmission of £614m (2012: £340m, 2011: £1,045m). |
Santander UK issues commercial paper generally in denominations of not less than US$50,000, with maturities of up to 365 days. Commercial paper is issued by Abbey National Treasury Services plc and Abbey National North America LLC.
Certificates of deposit and certain time deposits
The following table sets forth the maturities of Santander UK’s certificates of deposit and other large wholesale time deposits from non-bank counterparties in excess of £50,000 (or the non-sterling equivalent of £50,000) at 31 December 2013. A proportion of Santander UK’s retail time deposits also exceeds £50,000 at any given date; however, the ease of access and other terms of these accounts means that they may not have been in excess of £50,000 throughout 2013.
Furthermore, the customers may withdraw their funds on demand upon payment of an interest penalty. For these reasons, no maturity analysis is presented for such deposits.
| | | | | | | | | | | | | | | | | | | | |
| | | Not more than
three months
£m | | | In more than three
months but not more
than six months
£m | | | In more than six
months but not more
than one year
£m | | | In more than
one year
£m | | | Total
£m | |
Certificates of deposit: | | | | | | | | | | | | | | | | | | | | |
- UK | | | 583 | | | | 665 | | | | 599 | | | | — | | | | 1,847 | |
- Non-UK | | | 781 | | | | 17 | | | | — | | | | — | | | | 798 | |
Wholesale time deposits: | | | | | | | | | | | | | | | | | | | | |
- UK | | | 2,505 | | | | 355 | | | | 218 | | | | 222 | | | | 3,300 | |
| | | | | | | | | | | | | | | | | | | | |
| | | 3,869 | | | | 1,037 | | | | 817 | | | | 222 | | | | 5,945 | |
| | | | | | | | | | | | | | | | | | | | |
At 31 December 2013, an additional £14m (2012: £12m) of wholesale deposits were repayable on demand.
| | |
| Santander UK plc Annual Report 2013 | | 51 |
Detailed Business Review
Balance Sheet Reviewcontinued
DEBT SECURITIES IN ISSUE
Santander UK has issued debt securities in a range of maturities, interest rate structures and currencies, for purposes of meeting liquidity, funding and capital needs.
| | | | | | | | | | | | | | |
| | | Note | | 2013
£m | | | 2012
£m | | | 2011
£m | |
Trading liabilities | | 31 | | | 2,918 | | | | 4,119 | | | | 755 | |
Financial liabilities designated at fair value | | 32 | | | 3,407 | | | | 4,002 | | | | 6,837 | |
Debt securities in issue | | 33 | | | 50,870 | | | | 59,621 | | | | 52,651 | |
Subordinated liabilities | | 34 | | | 4,306 | | | | 3,781 | | | | 6,499 | |
| | | | | | | | | | | | | | |
| | | | | 61,501 | | | | 71,523 | | | | 66,742 | |
| | | | | | | | | | | | | | |
Most of the debt securities that Santander UK has issued are classified as “Debt securities in issue” in the balance sheet. The remaining debt securities issued by Santander UK are classified separately in the balance sheet, either because they qualify as “Trading liabilities” or were designated upon initial recognition as “Financial liabilities designated at fair value”, or there are key differences in the legal terms of the securities, such as liquidation preferences, or subordination of the rights of holders to the rights of holders of certain other liabilities (‘Subordinated liabilities’). Further information is set out in Notes 31 to 34 to the Consolidated Financial Statements.
Santander UK enters into cross-currency derivatives in connection with all funding raised through the issuance of debt securities in currencies other than sterling (principally euro, US dollars and Japanese yen) which swap foreign currency liabilities back into sterling as Santander UK’s commercial balance sheet is almost entirely denominated in sterling.
CONTRACTUAL OBLIGATIONS
The amounts and maturities of contractual obligations in respect of guarantees are described in Note 38 to the Consolidated Financial Statements. Other contractual obligations, including payments of principal and interest where applicable, are set out in the table below. Interest payments are included in the maturity column of the interest payments themselves, and are calculated using current interest rates.
| | | | | | | | | | | | | | | | | | | | |
| | | Payments due by period | |
| | | Total
£m | | | Less than 1 year
£m | | | 1-3 years
£m | | | 3-5 years
£m | | | Over 5 years
£m | |
Deposits by banks(1) (2) | | | 19,987 | | | | 14,661 | | | | 3,924 | | | | 744 | | | | 658 | |
Deposits by customers - repos(1) | | | 6,329 | | | | 6,329 | | | | — | | | | — | | | | — | |
Deposits by customers - other(2) | | | 147,907 | | | | 140,398 | | | | 6,140 | | | | 723 | | | | 646 | |
Derivative financial instruments | | | 18,863 | | | | 2,497 | | | | 3,451 | | | | 1,911 | | | | 11,004 | |
Debt securities in issue(3) | | | 57,195 | | | | 14,178 | | | | 8,974 | | | | 6,067 | | | | 27,976 | |
Subordinated liabilities | | | 4,306 | | | | 275 | | | | 541 | | | | 584 | | | | 2,906 | |
Retirement benefit obligations | | | 8,432 | | | | 214 | | | | 471 | | | | 535 | | | | 7,212 | |
Operating lease obligations | | | 563 | | | | 80 | | | | 140 | | | | 120 | | | | 223 | |
Purchase obligations | | | 488 | | | | 488 | | | | — | | | | — | | | | — | |
| | | | | | | | | | | | | | | | | | | | |
Total | | | 264,070 | | | | 179,120 | | | | 23,641 | | | | 10,684 | | | | 50,625 | |
| | | | | | | | | | | | | | | | | | | | |
| (1) | Securities sold under repurchase agreements. |
| (2) | Includes deposits by banks and deposits by customers that are classified in the balance sheet as trading liabilities. |
| (3) | Includes debt securities in issue that are classified in the balance sheet as trading liabilities and financial liabilities designated at fair value. |
As the above table is based on contractual maturities, no account is taken of call features related to Subordinated liabilities. The repayment terms of the debt securities may be accelerated in line with the covenants contained within the individual loan agreements. Details of deposits by banks and deposits by customers can be found in Notes 29 and 30 to the Consolidated Financial Statements. Santander UK has entered into outsourcing contracts where, in some circumstances, there is no minimum specified spending requirement. In these cases, anticipated spending volumes have been included within purchase obligations.
Under current conditions, Santander UK’s working capital is expected to be sufficient for its present requirements and to pursue its planned business strategies.
OFF-BALANCE SHEET ARRANGEMENTS
In the ordinary course of business, Santander UK issues guarantees on behalf of customers. The significant types of guarantees are standby letters of credit which represent the taking on of credit on behalf of customers when actual funding is not required, normally because a third party is not prepared to accept the credit risk of the ANTS group’s customer. These are included in the normal impairment loss allowance assessment alongside other forms of credit exposure
In addition, Santander UK, as is normal in such activity, gives representations, indemnities and warranties on the sale of subsidiaries, businesses and other assets. The maximum potential amount of any claims made against these is usually significantly higher than actual settlements. Provisions are made with respect to management’s best estimate of the likely outcome, either at the time of sale, or subsequently if additional information becomes available.
See Note 24 to the Consolidated Financial Statements for further information regarding off-balance sheet arrangements. See Note 38 to the Consolidated Financial Statements for additional information regarding Santander UK’s guarantees, commitments and contingencies. In the ordinary course of business, Santander UK also enters into securitisation transactions as described in Note 20 to the Consolidated Financial Statements. The securitisation companies are consolidated and the assets continue to be administered by Santander UK. The securitisation companies provide Santander UK with an important source of long-term funding.
| | |
| 52 | | Santander UK plc Annual Report 2013 |
Detailed Business Review
Balance Sheet Reviewcontinued
CAPITAL MANAGEMENT AND RESOURCES
Capital management and capital allocation
Santander UK adopts a centralised capital management approach, based on an assessment of both regulatory requirements and the economic capital impacts of our businesses. Details of Santander UK’s objectives, policies and processes for managing capital, including the capital table, can be found in Note 47 to the Consolidated Financial Statements.
Capital and risk management disclosures required by Pillar 3
Banco Santander, S.A. is supervised by the Banco de España (the Bank of Spain) on a consolidated basis. Santander UK has applied Banco Santander, S.A.’s approach to capital measurement and risk management in its implementation of Basel II. As a result, Santander UK has been classified as a significant subsidiary of Banco Santander, S.A. at 31 December 2013. The relevant Pillar 3 disclosure requirements for Santander UK are set out below. Further information on the Basel II risk measurement of Santander UK’s exposures is included in Banco Santander, S.A.’s Pillar 3 report.
Additional capital disclosures
In addition, further disclosures on capital can be found in Santander UK’s “Additional Capital and Risk Management Disclosures” on www.aboutsantander.co.uk.
Scope of Santander UK’s capital adequacy
Santander UK is a UK banking group effectively subject to two tiers of supervision. Santander UK is subject to prudential supervision by both the PRA as one of the successors to the Financial Services Authority (‘FSA’) (as a UK authorised bank) and the Banco de España (as a member of the Banco Santander group). As a PRA regulated entity, Santander UK is expected to satisfy the PRA capital requirements on a standalone basis. Similarly, Santander UK must demonstrate to the PRA that it can withstand capital stress tests without parental support. Reinforcing the corporate governance framework adopted by Santander UK, the PRA exercises oversight through its rules and regulations on the Santander UK plc Board and senior management appointments.
The basis of consolidation for prudential purposes is the same as the basis of consolidation for financial statement purposes. Consequently, the results of significant subsidiaries regulated by the PRA are included in Santander UK’s capital adequacy disclosures. Capital transferability between Santander UK’s subsidiaries is managed in accordance with Santander UK’s corporate purpose and strategy, its risk and capital management policies and with regard to UK legal and regulatory requirements. There are no other current or foreseen material practical or legal impediments to the prompt transfer of capital resources or repayment of liabilities when due between the Company and its subsidiaries.
Regulatory capital resources
The table below analyses the composition of Santander UK’s regulatory capital resources. The calculations reflect the amounts prepared on a basis consistent with Santander UK’s regulatory filings.
| | | | | | | | | | | | |
| | | Note | | | 2013
£m | | | 2012
£m | |
Shareholders’ equity: | | | | | | | | | | | | |
Shareholders equity per consolidated balance sheet | | | | | | | 12,520 | | | | 12,949 | |
Preference shares | | | 39 | | | | (307 | ) | | | (597 | ) |
Other equity instruments | | | 39 | | | | (297 | ) | | | (297 | ) |
| | | | | | | | | | | | |
| | | | | | | 11,916 | | | | 12,055 | |
| | | | | | | | | | | | |
Regulatory adjustments (after tax): | | | | | | | | | | | | |
Own credit | | | | | | | 4 | | | | (6 | ) |
Debit valuation adjustment | | | | | | | (29 | ) | | | — | |
Defined benefit pension adjustment | | | | | | | 218 | | | | (164 | ) |
Cash flow hedging | | | | | | | 110 | | | | — | |
Unrealised losses/(profits) on available-for-sale securities | | | | | | | 23 | | | | (1 | ) |
Other | | | | | | | 19 | | | | 6 | |
| | | | | | | | | | | | |
| | | | | | | 345 | | | | (165 | ) |
| | | | | | | | | | | | |
Core Tier 1 deductions: | | | | | | | | | | | | |
Goodwill and intangible assets | | | | | | | (2,335 | ) | | | (2,325 | ) |
50% excess of regulatory expected losses over impairment (net of tax) (1) | | | | | | | (209 | ) | | | (224 | ) |
50% of securitisation positions | | | | | | | (37 | ) | | | (39 | ) |
| | | | | | | | | | | | |
| | | | | | | (2,581 | ) | | | (2,588 | ) |
| | | | | | | | | | | | |
Core Tier 1 capital | | | | | | | 9,680 | | | | 9,302 | |
| | | | | | | | | | | | |
Other Tier 1 capital: | | | | | | | | | | | | |
Preference shares | | | | | | | 853 | | | | 859 | |
Innovative/hybrid Tier 1 securities | | | | | | | 463 | | | | 969 | |
50% tax benefit on excess of regulatory expected losses over impairment(1) | | | | | | | 63 | | | | 73 | |
| | | | | | | | | | | | |
| | | | | | | 1,379 | | | | 1,901 | |
| | | | | | | | | | | | |
Total Tier 1 capital | | | | | | | 11,059 | | | | 11,203 | |
| | | | | | | | | | | | |
Qualifying Tier 2 capital: | | | | | | | | | | | | |
Undated subordinated debt | | | 34 | | | | 2,104 | | | | 2,199 | |
Dated subordinated debt | | | | | | | 1,462 | | | | 632 | |
Collective provisions on standardised portfolios in accordance with regulatory requirements | | | | | | | 256 | | | | 261 | |
| | | | | | | | | | | | |
| | | | | | | 3,822 | | | | 3,092 | |
| | | | | | | | | | | | |
Tier 2 deductions: | | | | | | | | | | | | |
50% of securitisation positions | | | | | | | (37 | ) | | | (39 | ) |
50% excess of regulatory expected losses over impairment (gross of tax) (1) | | | | | | | (272 | ) | | | (297 | ) |
| | | | | | | | | | | | |
| | | | | | | (309 | ) | | | (336 | ) |
| | | | | | | | | | | | |
Total regulatory capital | | | | | | | 14,572 | | | | 13,959 | |
| | | | | | | | | | | | |
| (1) | The excess of regulatory expected losses over impairment losses and the related tax effect are treated for capital purposes as follows: At 31 December 2013, 50% of regulatory expected losses over impairment net of tax of £209m (2012: £224m) is treated as a Core Tier 1 deduction, 50% of the tax effect of regulatory expected losses over impairment of £63m (2012: £73m) is treated as other Tier 1 capital and 50% of regulatory expected losses over impairment gross of tax of £272m (2012:£297m) is treated as a Tier 2 deduction. |
| | |
| Santander UK plc Annual Report 2013 | | 53 |
Detailed Business Review
Balance Sheet Reviewcontinued
Santander UK’s Core Tier 1 capital consists of shareholders’ equity at 31 December 2013 and 2012 after adjustment to comply with the PRA’s rules. For capital management purposes and in accordance with the PRA’s rules, Innovative Tier 1 capital instruments are treated as Tier 1 capital. The PRA’s capital gearing rules restrict the amount of Innovative Tier 1 capital included in Tier 1 capital to 15% of Core Tier 1 capital after deductions. The excess is classified as Tier 2.
Total regulatory capital consists of:
Shareholders’ equity
Santander UK’s shareholders’ equity at 31 December 2013 was £12,520m (2012: £12,949m) as per the Consolidated Balance Sheet. Preference Shares of £307m (2012: £597m) deducted from shareholders’ equity consist of the £300m Fixed/Floating Rate Non-Cumulative Callable Preference Shares and the £300m Step-up Callable Perpetual Preferred Securities. These are included within Other Tier 1 capital preference shares and Innovative/hybrid Tier 1 Instruments, respectively, as described below. Other equity instruments of £297m (2012: £297m) deducted from shareholders’ equity consist of the £300m Step-up Callable Perpetual Reserve Capital Instruments.
Regulatory adjustments
Santander UK’s own credit adjustment of £4m (2012: £6m deduction) relates to changes in liabilities designated at fair value through profit or loss resulting from changes in Santander UK’s own credit risk. Valuation adjustments relating to liabilities designated at fair value through profit or loss which are not attributable to changes in benchmark interest rates are excluded from regulatory capital resources. The debit valuation adjustment of £29m (2012: £nil) relates to changes in OTC derivatives arising from changes in Santander UK’s own credit risk and consequently are excluded from regulatory capital resources. The defined benefit pension adjustment of £218m (2012: £164m) removes the pension surpluses and deficits calculated in accordance with IFRS and replaces them (in the case of schemes in deficit), in Santander UK’s regulatory filings, with the next five years’ contributions.
Core Tier 1 deductions
Goodwill and intangible assets of £2,335m (2012: £2,325m) deducted from Core Tier 1 capital represent goodwill arising on the acquisition of businesses and certain capitalised computer software costs. Santander UK has elected to deduct certain securitisation positions of £37m (2012: £39m) from Tier 1 capital and of £37m (2012: £39m) from Tier 2 capital rather than treat these exposures as a risk-weighted asset. The excess expected losses deduction of £209m (2012: £224m) net of tax from Tier 1 capital and of £272m (2012: £297m) gross of tax from Tier 2 capital represents the difference between expected loss calculated in accordance with Santander UK’s Basel II Retail Internal Rating-Based (‘IRB’) and Advanced Internal Rating-Based (‘AIRB’) models, and the impairment loss allowances calculated in accordance with IFRS. Santander UK’s accounting policy for impairment loss allowances is set out in Note 1 to the Consolidated Financial Statements. Regulatory expected losses are calculated using risk parameters based on either through-the-cycle, or economic downturn estimates, and are subject to conservatism due to the imposition of regulatory floors. They are therefore currently higher than the impairment loss allowances under IFRS which only reflect losses incurred at the balance sheet date.
Other Tier 1 capital
Preference Shares of £853m (2012: £859m) within Other Tier 1 capital consist of the £325m Sterling Preference Shares, the £175m Fixed/Floating Rate Tier One Preferred Income Capital and the £300m Fixed/Floating Rate Non-Cumulative Callable Preference Shares. Details of these instruments are set out in Notes 34 and 39 to the Consolidated Financial Statements.
Innovative/hybrid Tier 1 Instruments of £463m (2012: £969m) within Other Tier 1 capital consist of the US$1,000m Non-Cumulative Trust Preferred Securities which are no longer consolidated for accounting purposes (as set out in Note 34 to the Consolidated Financial Statements) however remain consolidated for regulatory capital purposes, the £300m Step-up Callable Perpetual Reserve Capital Instruments and the £300m Step Up Callable Perpetual Preferred Securities. Details of these instruments are set out in Notes 34 and 39 to the Consolidated Financial Statements.
Qualifying Tier 2 capital
Details of the undated subordinated debt of £2,104m (2012: £2,199m) and the dated subordinated debt of £1,462m (2011: £632m) that meet the PRA’s definition of Tier 2 capital are set out in Note 34 to the Consolidated Financial Statements. In accordance with the PRA’s rules, in the last five years to maturity, dated subordinated debt is amortised on a straight-line basis. During 2013 and 2012, accounting valuation adjustments to Tier 1 and Tier 2 instruments were also included in capital as permitted in accordance with PRA rules. In addition, collective provisions on standardised portfolios of £256m (2012: £261m) have been included.
The increase in dated subordinated debt in 2013 was due to a Tier 2 capital issuance in November 2013 of US$1,500m, as described in Note 34 to the Consolidated Financial Statements.
Tier 2 deductions
Santander UK has elected to deduct certain securitisation positions as described in “Core Tier 1 deductions” above. In addition expected losses gross of tax of £272m (2012: £297m) have been deducted from Tier 2 capital.
| | |
| 54 | | Santander UK plc Annual Report 2013 |
Detailed Business Review
Balance Sheet Reviewcontinued
Risk-weighted assets
The tables below analyse the composition of Santander UK’s risk-weighted assets. The calculations reflect the amounts prepared on a basis consistent with Santander UK’s regulatory filings.
| | | | | | | | |
Risk-weighted assets by risk | | 2013
£bn | | | 2012
£bn | |
Credit risk | | | 60.6 | | | | 62.0 | |
Counterparty risk | | | 2.4 | | | | 2.2 | |
Market risk | | | 4.8 | | | | 4.1 | |
Operational risk | | | 7.5 | | | | 8.2 | |
| | | | | | | | |
Total risk-weighted assets | | | 75.3 | | | | 76.5 | |
| | | | | | | | |
| | |
Risk-weighted assets by division | | 2013
£bn | | | 2012
£bn | |
Retail Banking | | | 36.5 | | | | 37.6 | |
Commercial Banking | | | 26.6 | | | | 24.1 | |
Markets | | | 5.4 | | | | 4.9 | |
Corporate Centre | | | 6.8 | | | | 9.9 | |
| | | | | | | | |
Total risk-weighted assets | | | 75.3 | | | | 76.5 | |
| | | | | | | | |
Risk-weighted assets by division may be further analysed as follows:
| | | | | | | | | | | | | | | | | | | | | | | | | | | | | | | | |
| | | 2013 | | | 2012 | |
| | | Balance
sheet
amount
£bn | | | Regulatory
exposure
£bn | | | Risk
weighting
% | | | Risk
weighted
assets
£bn | | | Balance
sheet
amount
£bn | | | Regulatory
exposure
£bn | | | Risk
weighting
% | | | Risk
weighted
assets
£bn | |
Retail Banking | | | | | | | | | | | | | | | | | | | | | | | | | | | | | | | | |
- Secured lending | | | 148.1 | | | | 157.5 | | | | 14.5 | | | | 22.9 | | | | 156.6 | | | | 164.4 | | | | 14.4 | | | | 23.6 | |
- Unsecured lending | | | 7.5 | | | | 11.6 | | | | 70.5 | | | | 8.2 | | | | 7.5 | | | | 10.7 | | | | 82.2 | | | | 8.8 | |
- Operational risk | | | | | | | | | | | | | | | 5.4 | | | | | | | | | | | | | | | | 5.2 | |
| | | | | | | | |
Commercial Banking | | | | | | | | | | | | | | | | | | | | | | | | | | | | | | | | |
- Customer loans | | | 22.1 | | | | 28.0 | | | | 82.7 | | | | 23.2 | | | | 19.6 | | | | 24.6 | | | | 85.8 | | | | 21.1 | |
- Non-customer assets(1) | | | 13.4 | | | | 2.3 | | | | 25.8 | | | | 0.6 | | | | 16.0 | | | | 1.3 | | | | 33.8 | | | | 0.4 | |
- Market risk | | | | | | | | | | | | | | | 1.4 | | | | | | | | | | | | | | | | 1.3 | |
- Operational risk | | | | | | | | | | | | | | | 1.4 | | | | | | | | | | | | | | | | 1.3 | |
| | | | | | | | |
Markets | | | | | | | | | | | | | | | | | | | | | | | | | | | | | | | | |
- Credit risk | | | 0.1 | | | | 0.1 | | | | 35.6 | | | | — | | | | 0.1 | | | | 0.1 | | | | 39.8 | | | | — | |
- Counterparty risk | | | 19.2 | | | | 5.9 | | | | 30.4 | | | | 1.8 | | | | 28.1 | | | | 6.2 | | | | 29.5 | | | | 1.8 | |
- Market risk | | | | | | | | | | | | | | | 3.3 | | | | | | | | | | | | | | | | 2.7 | |
- Operational risk | | | | | | | | | | | | | | | 0.3 | | | | | | | | | | | | | | | | 0.4 | |
| | | | | | | | |
Corporate Centre | | | | | | | | | | | | | | | | | | | | | | | | | | | | | | | | |
- Customer loans(2) | | | 9.6 | | | | 11.0 | | | | 23.2 | | | | 2.5 | | | | 11.0 | | | | 13.3 | | | | 29.3 | | | | 3.9 | |
- Eligible liquid assets(3) | | | 31.5 | | | | 28.1 | | | | — | | | | — | | | | 33.0 | | | | 34.8 | | | | — | | | | — | |
- Operational risk | | | | | | | | | | | | | | | 0.4 | | | | | | | | | | | | | | | | 1.0 | |
| | | | | | | | |
Intangible assets & securitisation deductions | | | 2.3 | | | | | | | | | | | | | | | | 2.4 | | | | | | | | | | | | | |
| | | | | | | | |
Other assets(4) | | | 16.5 | | | | 10.6 | | | | 36.6 | | | | 3.9 | | | | 18.7 | | | | 9.8 | | | | 51.0 | | | | 5.0 | |
| | | | | | | | | | | | | | | | | | | | | | | | | | | | | | | | |
| | | 270.3 | | | | 255.1 | | | | | | | | 75.3 | | | | 293.0 | | | | 265.2 | | | | | | | | 76.5 | |
| | | | | | | | | | | | | | | | | | | | | | | | | | | | | | | | |
| (1) | Non-customer assets principally consist of the securities lending/borrowing and repo businesses of the money markets product area. |
| (2) | Customer loans in Corporate Centre largely comprise social housing. |
| (3) | Eligible liquid assets includes reverse repurchase agreements collateralised by UK Government securities. |
| (4) | The balance sheet amounts of other assets have not been allocated to the business segments, although the RWA’s have been allocated to Corporate Centre. |
Regulatory exposure represents the Exposure at Default (‘EAD’) calculated in accordance with the PRA Prudential sourcebook for Banks, Building Societies and Investment Firms (known as ‘BIPRU’). EAD for customer loans includes unutilised credit facilities and is adjusted for a credit conversion factor (‘CCF’). EAD for repurchase, reverse repurchase, securities financing and derivative transactions are calculated net of any associated collateral and are adjusted for regulatory changes and potential future exposure adjustments (‘PFE’) where applicable.
Santander UK applies Basel II to the calculation of its capital requirement. In addition, Santander UK applies the Retail IRB and AIRB approaches to its credit portfolios. Residential lending capital resources requirements include securitised residential mortgages. During 2013, RWAs remained reasonably consistent reflecting a fall in credit risk RWAs as a result of managed reductions in the retail mortgage and unsecured personal loan portfolios, legacy/non core portfolios and the sale of co-brand credit cards business. This was partially offset by an increase in market risk RWAs and credit risk RWAs in Commercial Banking.
| | |
| Santander UK plc Annual Report 2013 | | 55 |
Detailed Business Review
Balance Sheet Reviewcontinued
Key capital ratios
The calculations of capital are prepared on a basis consistent with Santander UK’s regulatory filings. Ratios are calculated by taking the relevant capital resources as a percentage of risk-weighted assets.
The table below summarises Santander UK’s capital ratios under Basel II:
| | | | | | | | |
| | | 2013
% | | | 2012
% | |
Core Tier 1 | | | 12.9 | | | | 12.2 | |
Total capital | | | 19.4 | | | | 18.2 | |
Movements in regulatory capital
Movements in regulatory capital during 2013 and 2012 were as follows:
| | | | | | | | |
| | | 2013
£m | | | 2012
£m | |
Core Tier 1 capital | | | | | | | | |
Opening amount | | | 9,302 | | | | 8,861 | |
| | |
Contribution to Core Tier 1 capital from profit for the year: | | | | | | | | |
- Consolidated profits attributable to shareholders of the Company | | | 913 | | | | 939 | |
- Other comprehensive income for the year | | | (736 | ) | | | (183 | ) |
- Tax on comprehensive income | | | 151 | | | | 42 | |
- Redemption of capital | | | 15 | | | | — | |
- Removal of own credit spread (net of tax) | | | 10 | | | | 64 | |
- DVA | | | (29 | ) | | | — | |
- Removal of comprehensive income available-for-sale reserves and cash flow hedging | | | 134 | | | | — | |
| | |
Net dividends | | | (482 | ) | | | (507 | ) |
| | |
Increase in goodwill and intangible assets deducted | | | (10 | ) | | | (100 | ) |
| | |
Pensions | | | 382 | | | | 52 | |
| | |
Other: | | | | | | | | |
- Decrease/(increase) in securitisation positions | | | 2 | | | | (1 | ) |
- Decrease in regulatory expected losses | | | 15 | | | | 129 | |
- Other | | | 13 | | | | 6 | |
| | | | | | | | |
Closing amount | | | 9,680 | | | | 9,302 | |
| | | | | | | | |
| | |
Other Tier 1 capital | | | | | | | | |
Opening amount | | | 1,901 | | | | 2,637 | |
Other: | | | | | | | | |
- Decrease in preference shares | | | (6 | ) | | | (1 | ) |
- Decrease in innovative/hybrid Tier 1 securities | | | (506 | ) | | | (690 | ) |
- Decrease in tax benefit on regulatory expected losses | | | (10 | ) | | | (45 | ) |
| | | | | | | | |
Closing amount | | | 1,379 | | | | 1,901 | |
| | | | | | | | |
| | |
Tier 2 capital | | | | | | | | |
Opening amount | | | 2,756 | | | | 4,489 | |
Other: | | | | | | | | |
- Decrease in undated subordinated debt | | | (95 | ) | | | (51 | ) |
- Increase/(decrease) in dated subordinated debt | | | 830 | | | | (2,106 | ) |
- Decrease in unrealised gains and losses on available-for-sale equity securities | | | — | | | | (9 | ) |
- Increase in collective provisions on standardised portfolios | | | (5 | ) | | | 261 | |
| | |
Tier 2 deductions: | | | | | | | | |
- Decrease/(increase) in securitisation positions | | | 2 | | | | (1 | ) |
- Decrease in regulatory expected losses | | | 25 | | | | 173 | |
| | | | | | | | |
Closing amount | | | 3,513 | | | | 2,756 | |
| | | | | | | | |
| | | | | | | | |
| | | | | | | | |
Total regulatory capital | | | 14,572 | | | | 13,959 | |
| | | | | | | | |
The changes in Santander UK’s Core Tier 1 capital reflect movements in ordinary share capital, share premium and audited profits for the years ended 31 December 2013 and 2012 after adjustment to comply with the PRA’s rules. Santander UK complied with the PRA’s capital adequacy requirements during 2013 and 2012.
During 2013, Core Tier 1 capital increased by £378m to £9,672m (2012: £9,302m). This was largely due to audited profits for the year of £913m, less dividends declared of £482m. During 2012, Core Tier 1 capital increased by £441m to £9,302m (2011: £8,861m). This was again largely due to audited profits for the year less dividends declared.
The significant reduction in Santander UK’s Other Tier 1 capital during 2013 principally reflected the capital management exercise undertaken in August 2013. The Tier 2 capital increase was the result of a Tier 2 capital issuance in November 2013 of US$1,500m. The significant reduction in Santander UK’s Other Tier 1 and Tier 2 capital during 2012 principally reflected the capital management exercise undertaken in July 2012.
| | |
| 56 | | Santander UK plc Annual Report 2013 |
Detailed Business Review
Balance Sheet Reviewcontinued
LIQUIDITY AND FUNDING
The Board’s risk objective is to be a risk resilient institution at all times, and to be perceived as such by stakeholders, preserving the short and long-term viability of Santander UK. While recognising that a bank engaging in maturity transformation cannot hold sufficient liquidity to cover all possible stress scenarios, the Board requires Santander UK to hold sufficient liquidity to cover extreme situations. The requirements arising from the PRA’s regulatory liquidity regime are reflected in the Board’s Liquidity Risk Appetite. Liquidity risk is the risk that Santander UK, although solvent, either does not have available sufficient financial resources to enable it to meet its obligations as they fall due, or can secure them only at excessive cost. In Santander UK’s opinion, working capital is sufficient for its present requirements.
Santander UK primarily generates funding and liquidity through UK retail and corporate deposits, as well as in the financial markets through its own debt programmes and facilities to support its business activities and liquidity requirements. It does this with reliance on the strength of its balance sheet and profitability and its own network of investors. It does not rely on a guarantee from Banco Santander, S.A. or any other member of the Banco Santander group to generate this funding or liquidity. Santander UK does not raise funds to finance other members of the Banco Santander group or guarantee the debts of other members of the Banco Santander group (other than certain of Santander UK plc’s own subsidiaries). As a PRA regulated group, Santander UK is expected to satisfy the PRA liquidity and capital requirements on a standalone basis. Similarly, Santander UK must demonstrate to the PRA that it can withstand liquidity and capital stress tests without parental support.
See the “Liquidity and Funding Risk” section of the Risk Management Report for more information.
Sources of liquidity and funding
Santander UK is primarily funded by retail deposits. This, together with corporate deposits, forms its commercial bank franchise, which attracts deposits through a variety of entities. More than three quarters of Santander UK’s customer lending is financed by customer deposits. The retail sources primarily originate from the Retail Banking savings business. Although largely callable, these funds provide a stable and predictable core of funding due to the nature of the retail accounts and the breadth of personal customer relationships. Additionally, Santander UK has a strong wholesale funding base, which is diversified across product types and geography.
Through the wholesale markets, Santander UK has active relationships with many counterparties across a range of sectors, including banks, other financial institutions, corporates and investment funds. Other sources of funding include collateralised borrowings, mortgage securitisations and long-term debt issuance. Short-term funding is accessed through money market instruments, including time deposits, certificates of deposit and commercial paper. Medium to long-term funding is accessed primarily through asset securitisation and covered bond arrangements and Santander UK’s euro medium-term note programmes. The major debt issuance programmes are managed by, and in the name of, Abbey National Treasury Services plc on its own behalf (except for the US commercial paper programme, which is managed by, and in the name of, Abbey National North America LLC, a guaranteed subsidiary of Santander UK plc) and are set out in Note 33 to the Consolidated Financial Statements.
The ability to sell assets quickly is also an important source of liquidity for Santander UK. Santander UK holds marketable investment securities, such as central bank, eligible government and other debt securities, which could be disposed of either by entering into sale and repurchase agreements or by being sold to provide additional funding should the need arise.
Within the framework of prudent funding and liquidity management, Santander UK manages its commercial banking activities to minimise liquidity risk.
UK Government schemes
i) Funding for Lending Scheme (‘FLS’)
The Bank of England and HM Treasury launched the FLS in July 2012. The FLS is designed to boost lending to UK households and non-financial companies, by providing funding to banks and building societies for an extended period, with both the price and quantity of funding provided linked to the net lending to the UK non-financial sector over the 18-month period. The FLS will allow participants to borrow UK Treasury bills in exchange for eligible collateral during a drawdown window spanning the 18-month period from 1 August 2012 to 31 January 2014. Eligible collateral consists of all collateral eligible in the Bank of England’s Discount Window Facility.
ii) Extended Collateral Term Repo Facility (‘ECTR’)
The ECTR was announced in June 2012, in order to provide short-term liquidity to the market. This is provided through monthly auctions and using eligible collateral as security. Eligible collateral consists of all collateral eligible in the Bank of England’s Discount Window Facility.
iii) Bank of England Special Liquidity Scheme (‘SLS’)
Along with other major UK banks and building societies, Santander UK participated in the SLS whereby it exchanged self-subscribed for asset-backed security issuances for highly liquid Treasury Bills. All major UK banks and building societies were required to participate as part of the measures designed to improve the liquidity position of the UK banking system in general. Under the terms of the scheme, the extent of usage was confidential. Santander UK’s balances outstanding under the SLS were repaid in January 2012.
| | |
| Santander UK plc Annual Report 2013 | | 57 |
Detailed Business Review
Balance Sheet Reviewcontinued
Encumbrance - securitisation of assets and covered bonds
Santander UK has provided prime retail mortgage-backed securitised products to a diverse investor base through its mortgage- backed funding programmes, as described in Note 20 to the Consolidated Financial Statements. Funding has historically been raised via mortgage-backed notes, both issued to third parties and retained (the latter being central bank eligible collateral for funding purposes in other Bank of England, Swiss National Bank, and US Federal Reserve facilities). Santander UK has an established a covered bond programme, whereby securities are issued to investors and are guaranteed by a pool of ring-fenced residential mortgages.
Santander UK’s level of encumbrance arising from external issuance of securitisations and covered bonds decreased in 2013 as planned, reflecting both the overall reduction in wholesale funding and the desire to shift new wholesale funding issuance away from the secured markets where possible.
At 31 December 2013, total notes issued externally from secured programmes (securitisations and covered bonds) decreased to £36,307m (2012: £43,322m), reflecting gross issuance of £3.1bn in 2013 (2012: £10.9bn). At 31 December 2013, a total of £14,599m (2012: £17,634m) of notes issued under securitisation and covered bond programmes had also been retained internally, a proportion of which had been used as collateral for raising funds via third party bilateral secured funding transactions, which totalled £7.56bn at 31 December 2013 (2012: £11.0bn).
It is expected that the overall level of encumbrance will continue to decrease in 2014, albeit at a slower pace than in 2013. In January 2014, Santander UK issued a £750m 3-year floating rate covered bond from the ANTS covered bond programme.
Uses of liquidity and funding
The principal uses of liquidity for Santander UK are the funding of the lending of Retail Banking and Commercial Banking, payment of interest expenses, dividends paid to shareholders, the repayment of debt and consideration for business combinations. Santander UK’s ability to pay dividends depends on a number of factors, including Santander UK’s regulatory capital requirements, distributable reserves and financial performance.
Cash flows
| | | | | | | | | | | | |
| | | 2013
£m | | | 2012
£m | | | 2011
£m | |
Net cash inflow/(outflow) from operating activities | | | 4,752 | | | | 4,024 | | | | (7,052 | ) |
Net cash inflow/(outflow) from investing activities | | | 182 | | | | (5,808 | ) | | | (104 | ) |
Net cash (outflow)/inflow from financing activities | | | (8,423 | ) | | | 1,101 | | | | 4,947 | |
| | | | | | | | | | | | |
Decrease in cash and cash equivalents | | | (3,489 | ) | | | (683 | ) | | | (2,209 | ) |
| | | | | | | | | | | | |
The major activities and transactions that affected Santander UK’s cash flows during 2013, 2012 and 2011 were as follows:
In 2013, the net cash inflow from operating activities of £4,752m resulted from the continued reduction in Santander UK’s lending portfolios, partially offset by a reduction in customer savings and deposits from other banks. In 2013, the net cash inflow from investing activities of £182m was in principal derived from the purchase and sale of UK Treasury bills, partially offset by the purchase of property, plant and equipment. In 2013, the net cash outflow from financing activities of £8,423m reflected the repayment of loan capital maturing in the year of £33,170m offset by new issues of loan capital of £25,469m. Further outflows of cash occurred in the payment of £665m dividends on ordinary shares. In 2013, cash and cash equivalents decreased by £3,489m principally from the repayment of matured loan capital offset by reduced customer lending.
In 2012, the net cash inflow from operating activities of £4,024m resulted from Santander UK’s continued de-leveraging process of legacy portfolios in run-off, partially offset by a reduction in trading liabilities. In 2012, the net cash outflow from investing activities of £5,808m resulted primarily from the acquisition of UK Treasury bills and the purchase of property, plant and equipment. In 2012, the net cash inflow from financing activities of £1,101m reflected new issues of loan capital of £37,219m offset by repayments of loan capital maturing in the year of £35,636m and payment of £425m dividends on ordinary shares. In 2012, cash and cash equivalents decreased by £683m principally from the continued de-leveraging process of legacy portfolios in run-off offset by the purchase of Treasury bills.
In 2011, the net cash outflow from operating activities of £7,052m resulted from Santander UK’s lending activities, principally corporate lending (particularly SMEs), offset by the continued de-leveraging process of legacy portfolios in run-off. In 2011, the net cash outflow from investing activities of £104m resulted from a net outflow of £304m from the purchase and sale of property, plant and equipment and intangible assets, offset by an inflow of £76m from the disposal of subsidiaries and £124m from the redemption of debt securities. In 2011, the net cash inflow from financing activities of £4,947m reflected new issues of loan capital of £48,449m offset by repayments of loan capital maturing in the year of £43,070m. In 2011, cash and cash equivalents decreased by £2,209m, principally due to the increase from Santander UK’s lending activities offset by the continued de-leveraging process of legacy portfolios in run-off and issuing of new loan capital.
| | |
| 58 | | Santander UK plc Annual Report 2013 |
Detailed Business Review
Balance Sheet Reviewcontinued
INTEREST RATE SENSITIVITY
Interest rate sensitivity refers to the relationship between interest rates and net interest income resulting from the periodic repricing of assets and liabilities. The largest administered rate items in Santander UK’s balance sheet are residential mortgages and retail deposits, the majority of which bear interest at variable rates. Santander UK is able to mitigate the impact of interest rate movements on net interest income in Retail Banking by repricing separately the variable rate mortgages and variable rate retail deposits, subject to competitive pressures.
Santander UK also offers fixed-rate mortgages and savings products on which the interest rate paid by or to the customer is fixed for an agreed period of time at the start of the contract. Santander UK manages the margin on fixed-rate products by the use of derivatives matching the fixed-rate profiles. The risk of prepayment is reduced by imposing early termination charges if the customers terminate their contracts early.
Santander UK seeks to manage the risks associated with movements in interest rates as part of its management of the overall non-trading position. This is done within limits as described in the Risk Management Report beginning on page 62.
Changes in net interest income - volume and rate analysis
The following table allocates changes in interest income, interest expense and net interest income (including amounts classified in discontinued operations) between changes in volume and changes in rate for Santander UK for the years ended 31 December 2013, 2012 and 2011. Volume and rate variances have been calculated on the movement in the average balances and the change in the interest rates on average interest-earning assets and average interest-bearing liabilities. The variance caused by changes in both volume and rate has been allocated to rate changes.
| | | | | | | | | | | | | | | | | | | | | | | | |
| | | 2013/2012 | | | 2012/2011 | |
| | | Total change | | | Changes due to
increase/(decrease) in | | | Total change | | | Changes due to
increase/(decrease) in | |
| | | £m | | | Volume
£m | | | Rate
£m | | | £m | | | Volume
£m | | | Rate
£m | |
Interest income | | | | | | | | | | | | | | | | | | | | | | | | |
Loans and advances to banks: | | | | | | | | | | | | | | | | | | | | | | | | |
- UK | | | (45 | ) | | | (14 | ) | | | (31 | ) | | | 67 | | | | 47 | | | | 20 | |
- Non-UK | | | 10 | | | | 20 | | | | (10 | ) | | | (20 | ) | | | (23 | ) | | | 3 | |
Loans and advances to customers: | | | | | | | | | | | | | | | | | | | | | | | | |
- UK | | | (418 | ) | | | (357 | ) | | | (61 | ) | | | (49 | ) | | | 9 | | | | (58 | ) |
Other interest earning financial assets: | | | | | | | | | | | | | | | | | | | | | | | | |
- UK | | | — | | | | 14 | | | | (14 | ) | | | 4 | | | | 102 | | | | (98 | ) |
- Non UK | | | 2 | | | | 1 | | | | 1 | | | | 1 | | | | — | | | | 1 | |
| | | | | | | | | | | | | | | | | | | | | | | | |
Total interest income | | | | | | | | | | | | | | | | | | | | | | | | |
- UK | | | (463 | ) | | | (357 | ) | | | (106 | ) | | | 22 | | | | 158 | | | | (136 | ) |
- Non-UK | | | 12 | | | | 21 | | | | (9 | ) | | | (19 | ) | | | (23 | ) | | | 4 | |
| | | | | | | | | | | | | | | | | | | | | | | | |
| | | (451 | ) | | | (336 | ) | | | (115 | ) | | | 3 | | | | 135 | | | | (132 | ) |
| | | | | | | | | | | | | | | | | | | | | | | | |
Interest expense | | | | | | | | | | | | | | | | | | | | | | | | |
Deposits by banks: | | | | | | | | | | | | | | | | | | | | | | | | |
- UK | | | (7 | ) | | | (54 | ) | | | 47 | | | | 31 | | | | 46 | | | | (15 | ) |
- Non-UK | | | — | | | | — | | | | — | | | | (4 | ) | | | (4 | ) | | | — | |
Deposits by customers - retail demand deposits: | | | | | | | | | | | | | | | | | | | | | | | | |
- UK | | | 52 | | | | (29 | ) | | | 81 | | | | 452 | | | | 52 | | | | 400 | |
- Non-UK | | | (27 | ) | | | (12 | ) | | | (15 | ) | | | (14 | ) | | | (19 | ) | | | 5 | |
Deposits by customers - retail time deposits: | | | | | | | | | | | | | | | | | | | | | | | | |
- UK | | | (167 | ) | | | 82 | | | | (249 | ) | | | (240 | ) | | | (81 | ) | | | (159 | ) |
- Non-UK | | | (88 | ) | | | (82 | ) | | | (6 | ) | | | (7 | ) | | | (18 | ) | | | 11 | |
Deposits by customers - wholesale deposits: | | | | | | | | | | | | | | | | | | | | | | | | |
- UK | | | (37 | ) | | | (16 | ) | | | (21 | ) | | | 22 | | | | 30 | | | | (8 | ) |
- Non-UK | | | 1 | | | | — | | | | 1 | | | | — | | | | — | | | | — | |
Subordinated debt: | | | | | | | | | | | | | | | | | | | | | | | | |
- UK | | | (68 | ) | | | (44 | ) | | | (24 | ) | | | 18 | | | | (11 | ) | | | 29 | |
- Non-UK | | | — | | | | — | | | | — | | | | (58 | ) | | | (58 | ) | | | — | |
Debt securities in issue: | | | | | | | | | | | | | | | | | | | | | | | | |
- UK | | | (161 | ) | | | (155 | ) | | | (6 | ) | | | 718 | | | | 143 | | | | 575 | |
- Non-UK | | | (8 | ) | | | 12 | | | | (20 | ) | | | (13 | ) | | | (22 | ) | | | 9 | |
Other interest-bearing financial liabilities: | | | | | | | | | | | | | | | | | | | | | | | | |
- UK | | | 11 | | | | 30 | | | | (19 | ) | | | 13 | | | | 4 | | | | 9 | |
| | | | | | | | | | | | | | | | | | | | | | | | |
Total interest expense | | | | | | | | | | | | | | | | | | | | | | | | |
- UK | | | (377 | ) | | | (186 | ) | | | (191 | ) | | | 1,014 | | | | 183 | | | | 831 | |
- Non-UK | | | (122 | ) | | | (82 | ) | | | (40 | ) | | | (96 | ) | | | (121 | ) | | | 25 | |
| | | | | | | | | | | | | | | | | | | | | | | | |
| | | (499 | ) | | | (268 | ) | | | (231 | ) | | | 918 | | | | 62 | | | | 856 | |
| | | | | | | | | | | | | | | | | | | | | | | | |
Net interest income | | | 48 | | | | (68 | ) | | | 116 | | | | (915 | ) | | | 73 | | | | (988 | ) |
| | | | | | | | | | | | | | | | | | | | | | | | |
| | |
| Santander UK plc Annual Report 2013 | | 59 |
Detailed Business Review
Balance Sheet Reviewcontinued
AVERAGE BALANCE SHEET
As year-end statements may not be representative of Santander UK’s activity throughout the year, average balance sheets for Santander UK are presented below. The average balance sheets summarise the significant categories of assets and liabilities, together with average interest rates.
| | | | | | | | | | | | | | | | | | | | | | | | | | | | | | | | | | | | |
| | | 2013 | | | 2012 | | | 2011 | |
| | | Average
Balance(1)
£m | | | Interest(4,5)
£m | | | Average
rate
% | | | Average
balance(1)
£m | | | Interest
£m | | | Average
rate
% | | | Average
balance(1)
£m | | | Interest
£m | | | Average
rate
% | |
Assets | | | | | | | | | | | | | | | | | | | | | | | | | | | | | | | | | | | | |
Loans and advances to banks: | | | | | | | | | | | | | | | | | | | | | | | | | | | | | | | | | | | | |
- UK | | | 26,432 | | | | 113 | | | | 0.43 | | | | 28,941 | | | | 158 | | | | 0.55 | | | | 19,144 | | | | 91 | | | | 0.48 | |
- Non-UK | | | 7,453 | | | | 19 | | | | 0.25 | | | | 2,339 | | | | 9 | | | | 0.38 | | | | 10,791 | | | | 29 | | | | 0.27 | |
Loans and advances to customers:(3) | | | | | | | | | | | | | | | | | | | | | | | | | | | | | | | | | | | | |
- UK | | | 189,048 | | | | 6,958 | | | | 3.68 | | | | 198,657 | | | | 7,376 | | | | 3.71 | | | | 198,416 | | | | 7,425 | | | | 3.74 | |
- Non-UK | | | 6 | | | | — | | | | — | | | | 7 | | | | — | | | | — | | | | 10 | | | | — | | | | — | |
Debt securities: | | | | | | | | | | | | | | | | | | | | | | | | | | | | | | | | | | | | |
- UK | | | 6,009 | | | | 77 | | | | 1.28 | | | | 5,093 | | | | 77 | | | | 1.51 | | | | 2,129 | | | | 73 | | | | 3.43 | |
- Non-UK | | | 166 | | | | 3 | | | | 1.81 | | | | 92 | | | | 1 | | | | 1.09 | | | | — | | | | — | | | | — | |
| | | | | | | | | | | | | | | | | | | | | | | | | | | | | | | | | | | | |
Total average interest-earning assets, interest income(2) | | | 229,114 | | | | 7,170 | | | | 3.13 | | | | 235,129 | | | | 7,621 | | | | 3.24 | | | | 230,490 | | | | 7,618 | | | | 3.31 | |
| | | | | | | | | | | | | | | | | | | | | | | | | | | | | | | | | | | | |
Impairment loss allowances | | | (1,704 | ) | | | — | | | | — | | | | (1,707 | ) | | | — | | | | — | | | | (1,639 | ) | | | — | | | | — | |
Trading business | | | 25,032 | | | | — | | | | — | | | | 26,445 | | | | — | | | | — | | | | 36,205 | | | | — | | | | — | |
Assets designated at FVTPL | | | 3,140 | | | | — | | | | — | | | | 4,439 | | | | — | | | | — | | | | 5,801 | | | | — | | | | — | |
Other non-interest-earning assets | | | 38,414 | | | | — | | | | — | | | | 42,624 | | | | — | | | | — | | | | 37,763 | | | | — | | | | — | |
| | | | | | | | | | | | | | | | | | | | | | | | | | | | | | | | | | | | |
Total average assets | | | 293,996 | | | | — | | | | — | | | | 306,930 | | | | — | | | | — | | | | 308,620 | | | | — | | | | — | |
| | | | | | | | | | | | | | | | | | | | | | | | | | | | | | | | | | | | |
Non-UK assets as a % of total | | | 2.59 | % | | | — | | | | — | | | | 0.79 | % | | | — | | | | — | | | | 3.50 | % | | | — | | | | — | |
| | | | | | | | | | | | | | | | | | | | | | | | | | | | | | | | | | | | |
Liabilities | | | | | | | | | | | | | | | | | | | | | | | | | | | | | | | | | | | | |
Deposits by banks: | | | | | | | | | | | | | | | | | | | | | | | | | | | | | | | | | | | | |
- UK | | | (8,624 | ) | | | (188 | ) | | | 2.18 | | | | (11,945 | ) | | | (195 | ) | | | 1.63 | | | | (9,347 | ) | | | (164 | ) | | | 1.75 | |
- Non-UK | | | (13 | ) | | | — | | | | — | | | | (65 | ) | | | — | | | | — | | | | (153 | ) | | | (4 | ) | | | 2.61 | |
Deposits by customers - retail demand: | | | | | | | | | | | | | | | | | | | | | | | | | | | | | | | | | | | | |
- UK | | | (72,566 | ) | | | (1,767 | ) | | | 2.44 | | | | (73,832 | ) | | | (1,715 | ) | | | 2.32 | | | | (70,887 | ) | | | (1,263 | ) | | | 1.78 | |
- Non-UK | | | (964 | ) | | | (13 | ) | | | 1.35 | | | | (1,375 | ) | | | (40 | ) | | | 2.91 | | | | (2,104 | ) | | | (54 | ) | | | 2.57 | |
Deposits by customers - retail time: | | | | | | | | | | | | | | | | | | | | | | | | | | | | | | | | | | | | |
- UK | | | (51,608 | ) | | | (541 | ) | | | 1.05 | | | | (46,256 | ) | | | (708 | ) | | | 1.53 | | | | (50,581 | ) | | | (948 | ) | | | 1.87 | |
- Non-UK | | | (2,703 | ) | | | (66 | ) | | | 2.44 | | | | (5,818 | ) | | | (154 | ) | | | 2.65 | | | | (6,566 | ) | | | (161 | ) | | | 2.45 | |
Deposits by customers – wholesale: | | | | | | | | | | | | | | | | | | | | | | | | | | | | | | | | | | | | |
- UK | | | (21,298 | ) | | | (270 | ) | | | 1.27 | | | | (22,506 | ) | | | (307 | ) | | | 1.36 | | | | (20,349 | ) | | | (285 | ) | | | 1.40 | |
- Non-UK | | | (628 | ) | | | (1 | ) | | | 0.16 | | | | (52 | ) | | | — | | | | — | | | | — | | | | — | | | | — | |
Bonds and medium-term notes: | | | | | | | | | | | | | | | | | | | | | | | | | | | | | | | | | | | | |
- UK | | | (49,292 | ) | | | (1,213 | ) | | | 2.46 | | | | (55,567 | ) | | | (1,374 | ) | | | 2.47 | | | | (45,641 | ) | | | (656 | ) | | | 1.44 | |
- Non-UK | | | (4,512 | ) | | | (17 | ) | | | 0.38 | | | | (3,043 | ) | | | (25 | ) | | | 0.82 | | | | (7,019 | ) | | | (38 | ) | | | 0.54 | |
Dated and undated loan capital and other subordinated liabilities: | | | | | | | | | | | | | | | | | | | | | | | | | | | | | | | | | | | | |
- UK | | | (3,860 | ) | | | (106 | ) | | | 2.75 | | | | (5,159 | ) | | | (174 | ) | | | 3.37 | | | | (5,557 | ) | | | (156 | ) | | | 2.81 | |
- Non-UK | | | — | | | | — | | | | — | | | | — | | | | — | | | | — | | | | (633 | ) | | | (58 | ) | | | 9.16 | |
Other interest-bearing liabilities: | | | | | | | | | | | | | | | | | | | | | | | | | | | | | | | | | | | | |
- UK | | | (406 | ) | | | (25 | ) | | | 6.16 | | | | (129 | ) | | | (14 | ) | | | 10.85 | | | | (24 | ) | | | (1 | ) | | | 4.17 | |
| | | | | | | | | | | | | | | | | | | | | | | | | | | | | | | | | | | | |
Total average interest-bearing liabilities, interest expense(2) | | | (216,474 | ) | | | (4,207 | ) | | | 1.94 | | | | (225,747 | ) | | | (4,706 | ) | | | 2.08 | | | | (218,861 | ) | | | (3,788 | ) | | | 1.73 | |
| | | | | | | | | | | | | | | | | | | | | | | | | | | | | | | | | | | | |
Trading business | | | (30,546 | ) | | | — | | | | — | | | | (28,962 | ) | | | — | | | | — | | | | (41,615 | ) | | | — | | | | — | |
Liabilities designated at FVTPL | | | (4,997 | ) | | | — | | | | — | | | | (5,152 | ) | | | — | | | | — | | | | (6,307 | ) | | | — | | | | — | |
Non-interest-bearing liabilities: | | | | | | | — | | | | — | | | | | | | | | | | | | | | | | | | | | | | | | |
- Other | | | (29,003 | ) | | | — | | | | — | | | | (33,770 | ) | | | — | | | | — | | | | (29,373 | ) | | | — | | | | — | |
Shareholders’ funds | | | (12,976 | ) | | | — | | | | — | | | | (13,299 | ) | | | — | | | | — | | | | (12,464 | ) | | | — | | | | — | |
| | | | | | | | | | | | | | | | | | | | | | | | | | | | | | | | | | | | |
Total average liabilities and shareholders’ funds | | | (293,996 | ) | | | — | | | | — | | | | (306,930 | ) | | | — | | | | — | | | | (308,620 | ) | | | — | | | | — | |
| | | | | | | | | | | | | | | | | | | | | | | | | | | | | | | | | | | | |
Non-UK liabilities as a % of total | | | 3.00 | % | | | — | | | | — | | | | 3.37 | % | | | — | | | | — | | | | 5.34 | % | | | — | | | | — | |
| | | | | | | | | | | | | | | | | | | | | | | | | | | | | | | | | | | | |
| (1) | Average balances are based upon monthly data. |
| (2) | The ratio of average interest-earning assets to interest-bearing liabilities for the year ended 31 December 2013 was 105.84% (2012: 104.16%, 2011: 105.31%). |
| (3) | Loans and advances to customers include non-performing loans. See the “Credit Risk” section of the Risk Management Report. |
| (4) | The net interest margin for the year ended 31 December 2013 was 1.29% (2012: 1.24%, 2011: 1.66%). Net interest margin is calculated as net interest income divided by average interest earning assets. This differs from the Banking Net Interest Margin, discussed on page 12, which is calculated as net interest income divided by average customer loans. |
| (5) | The interest spread for the year ended 31 December 2013 was 1.19% (2012: 1.16%, 2011: 1.57%). Interest spread is the difference between the rate of interest earned on average interest-earning assets and the rate of interest paid on average interest-bearing liabilities. |
| | |
| 60 | | Santander UK plc Annual Report 2013 |
Detailed Business Review
Risk Management Report
This Risk Management Report contains audited financial information and forms an integral part of the Consolidated Financial Statements, except as otherwise marked as unaudited.
| | |
| Santander UK plc Annual Report 2013 | | 61 |
Detailed Business Review
Risk Management Reportcontinued
This Risk Management Report contains audited financial information and forms an integral part of the Consolidated Financial Statements, except as otherwise marked as unaudited. This Risk Management Report should be read in conjunction with the Summary Risk Report on pages 15 to 18, which forms part of this Risk Management Report.
RISK MANAGEMENT
INTRODUCTION(unaudited)
As a significant financial services provider, risk is at the core of Santander UK’s day-to-day activities. The understanding and control of risk is critical for the effective management of the business. Santander UK aims to employ a prudent approach and advanced risk management techniques to facilitate the delivery of robust financial performance, and ultimately build sustainable value for all our stakeholders, including our staff, customers, fixed income investors, shareholders and the communities in which we operate.
Santander UK aims to maintain a predictable medium-low risk profile, consistent with its business model, which is key to the successful achievement of our strategic objectives set out in “Our Strategy and Business Model” on page 4.
RISK FRAMEWORK
The Risk Framework in place at 31 December 2013, as set out below, was employed throughout 2013, and was not significantly changed from the framework set out in the 2012 Annual Report. The key components of this framework include:
| • | | Risk definition and structure; |
| • | | Overriding principles and minimum standards; |
| • | | Governance, roles and responsibilities; and |
| • | | System of internal control for risk. |
In December 2013, the Board approved an updated Risk Framework, which will be implemented and embedded during 2014. The key changes to be introduced as part of this new framework include a simplification of the key risk types and a streamlining of the lines of defence model. There is no change to the overriding principles. The main changes that will be introduced during 2014 as part of this updated framework are:
| • | | Reducing the number of Key Risk Types to: Credit, Market, Balance Sheet Management (currently known as Structural), Operational, Conduct, Regulatory and Legal; |
| • | | Removing the additional classification of financial / non-financial risks; |
| • | | Creation of a new Conduct & Regulatory Risk Committee which reports to the Executive Risk Committee; and |
| • | | Inclusion of a Risk Culture statement. |
Risk definition and structure
Risk is defined as the uncertainty around Santander UK’s ability to achieve its business objectives. It specifically equates to a number of risk factors that have the potential to adversely impact Santander UK’s financial resources.
The key risk types for the Santander UK group are defined in the next section. As set out in the diagram opposite, the key risk types are classified as:
| | |
| 62 | | Santander UK plc Annual Report 2013 |
Detailed Business Review
Risk Management Reportcontinued
| | |
Financial Risks | | Definition |
| Credit Risk | | Credit Risk is the risk of financial loss arising from the default or credit quality deterioration of a customer or counterparty to which Santander UK has directly provided credit, or for which Santander UK has assumed a financial obligation. |
| |
| Traded Market Risk | | Traded Market Risk is the risk of losses in on- and off-balance sheet positions within Santander UK’s trading books, arising from movements in market prices. |
| |
| Structural Risks | | Non-Traded Market Risk is Santander UK’s risk of loss of income or economic value arising from changes to interest rates in the banking book or to changes in exchange rates, where such changes would affect Santander UK’s net worth through an adjustment to revenues, assets, liabilities and off-balance sheet exposures in the banking book. Pension Risk is both the risk of the change in the accounting position and the risk of an unplanned increase in funding required by Santander UK’s defined benefit pension schemes, either because of a loss of net asset value or because of changes in legislation or regulatory action. Liquidity and Funding Riskis the risk that Santander UK, although solvent, either does not have available sufficient liquid financial resources to enable it to meet its obligations as they fall due, or can secure them only at excessive cost or that Santander UK does not have sufficiently stable and diverse sources of funding or the funding structure is inefficient or a funding programme such as debt issuance subsequently fails. Capital Risk is defined as the risk of Santander UK not having an adequate amount or quality of capital to meet its internal business objectives, regulatory requirements and market expectations. |
Non Financial Risks | | Definition |
| Conduct Risk | | The risk that Santander UK’s decisions and behaviours lead to detrimental or poor outcomes for our customers. |
| |
| Operational Risk | | The risk of loss resulting from inadequate or failed internal processes, people and systems, or from external events. Additionally certain key risk types are managed as integral subsets of Santander UK’s overall operational risk management: |
| |
| Strategic Risk | | The risk of material deviations in expected/target shareholder value as a result of poor definition or implementation of Santander UK’s strategy. |
| |
| Reputational Risk | | The risk that the reputation of Santander UK prevents the achievement of its strategic objectives. |
| |
| People and Talent Risk | | The risk of not having the sufficient number and quality of people to deliver Santander UK’s strategy or comply with legislative requirements. |
| |
| Accounting and Reporting Risk | | The failure to comply with regulatory and legal requirements for accounting and reporting of financial disclosures, which may lead to fines and/or restrictions and/or reputational damage. |
| |
| Regulatory Risk | | The risk of reductions in earnings and/or value, through financial or reputational loss, from failing to comply with applicable codes and regulatory rules. |
| |
| Legal Risk | | The risk of loss arising from a: |
| |
| | • defective transaction; |
| |
| | • failure to take appropriate measures to protect assets; |
| |
| | • claim being made or some other event occurring which results in a liability for Santander UK or other loss; or |
| |
| | • change in law. |
| | |
| Santander UK plc Annual Report 2013 | | 63 |
Detailed Business Review
Risk Management Reportcontinued
Overriding principles and minimum standards
The following statements are the overriding principles and minimum standards which underpin the Risk Framework:
| • | | Each business area is held accountable for the management of the risks arising from its activities; |
| • | | Risk should be considered as part of the governance around every business decision; |
| • | | All material risk exposures must be identified, assessed, managed and reported in a timely and accurate manner; |
| • | | An internal control system should be in place to ensure that risk management and controls are executed in accordance with the guiding principles, minimum standards, risk appetite, limits and mandates; and |
| • | | Risk management should be included within objective setting, performance management and remuneration to ensure a balanced approach to risk taking at all levels and in all parts of Santander UK. |
Governance, roles and responsibilities
Committee structure
The diagram below sets out the main Board and management committees which underpin the Risk Framework.
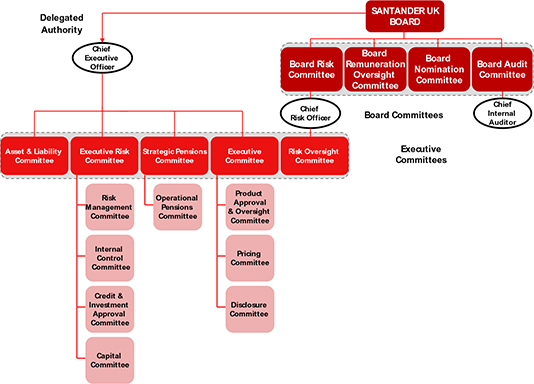
To the extent that a Committee considers matters of relevance to other Committees within the framework, such matters are shared with that Committee as appropriate. This is discharged through information reporting and / or common membership. In addition, for larger value credit transactions and other significant risk exposures, reference is made to the “Comisión Delegada de Riesgos” (‘CDR’ or “Delegated Risk Committee”) of the Banco Santander group.
| | |
| 64 | | Santander UK plc Annual Report 2013 |
Detailed Business Review
Risk Management Reportcontinued
Key responsibilities
The key risk responsibilities of the Board and its committees include:
| | | | |
Board/Board Committees | | Main risk responsibilities (within overall responsibilities) |
| | |
| The Board | | • | | Overall responsibility for business execution and risk management. |
| | • | | Approval of the Risk Framework and Risk Appetite. |
| | |
| Board Risk Committee | | • | | Advise the Board on overall Risk Appetite, tolerance and strategy, taking account of the current and prospective macroeconomic and financial environment. |
| | |
| | • | | Oversee and advise the Board on current risk exposure and future risk strategy. |
| | |
| | • | | Review Risk Appetite for submission to the Board. |
| | |
| | • | | Review and recommend the Risk Framework for the Board’s approval. |
| | |
| | • | | Review and approve specific risk frameworks. |
| | |
| | • | | Consider and recommend actions in respect of all risk issues escalated by the Chief Risk Officer. |
| | |
| | • | | Review the effectiveness of risk management systems and internal controls. |
| | |
| | • | | Review significant transactions from a risk perspective. |
| | |
| Board Remuneration Oversight Committee | | • | | Oversee and supervise policies and frameworks covering remuneration and reward. |
| | |
| | • | | Review new or changed short-term or long-term incentive plans. |
| | |
| | • | | Ensure that measurement of performance includes adjustments for all types of current and future risks. |
| | |
| Board Nomination Committee | | • | | Identify and nominate candidates to fill Board vacancies. |
| | |
| | • | | Recommend membership of the Board Risk Committee, Board Audit Committee and Board Remuneration Oversight Committee to the Board. |
| | |
| | • | | Consider succession planning for Directors and other senior executives. |
| | |
| Board Audit Committee | | • | | Monitor and review the integrity of Santander UK’s financial statements, and any formal announcements relating to Santander UK's financial performance, including significant financial reporting judgements contained in them. |
| | |
| | • | | Review internal financial controls. |
| | |
| | • | | Assess the external auditor's independence and objectivity and monitor the effectiveness of the audit process. |
| | |
| | • | | Monitor and review the effectiveness of the internal audit function. |
| | |
| | • | | Review whistle-blowing arrangements. |
| | |
| Santander UK plc Annual Report 2013 | | 65 |
Detailed Business Review
Risk Management Reportcontinued
The key risk responsibilities of the executive committees include:
| | | | |
Executive Committees | | Main risk responsibilities |
| | |
| Asset and Liability Committee | | • | | Recommend non-traded market risk exposure of Santander UK’s balance sheet, composition of Santander UK’s capital structure and assess the management of funding and liquidity. |
| | |
| Executive Risk Committee | | • | | Review Santander UK’s Risk Appetite proposal prior to submission to the Board. |
| | • | | Monitor compliance with Risk Framework, Risk Appetite and risk policies. |
| | • | | Review and monitor risk exposures and approve any corrective action required. |
| | • | | Approve credit and market risk transactions for exposures above the authorities delegated to the Credit and Investment Approvals Committee. |
| | • | | Review and monitor FMIR and ensure any exposures in excess of appetite are appropriately dealt with. |
| | |
| Strategic Pensions Committee (‘SPC’) | | • | | Review pension risk appetite proposals. |
| | • | | Review and monitor actuarial valuations and related impacts on Santander UK’s contributions, capital and funding arrangements. |
| | • | | Consult with the pension scheme trustees on scheme investment strategy. |
| | |
| Executive Committee | | • | | Consider and approve business plans aligned with Risk Framework and Risk Appetite prior to submission to the Board for approval. |
| | • | | Receive updates from CEO-level committees on key risk issues and monitor actions taken. |
| | |
| Risk Oversight Committee | | • | | Challenge and monitor usage of Risk Appetite. |
| | • | | Review Risk Appetite framework, prior to submission to the Board. |
| | • | | Review and challenge risk frameworks from an oversight perspective. |
| | • | | Provide advice on risk management, risk strategy and risk policy matters. |
Other committees with key risk responsibilities include:
| | |
Other committees | | Main risk responsibilities |
| |
| Risk Management Committee | | Establish adequate and effective risk control processes, policies and reporting systems to ensure all financial risks are managed within the Risk Framework approved by the Board. |
| |
| Internal Control Committee | | Establish adequate and effective risk control processes, policies and reporting systems to ensure all non-financial risks are managed within the Risk Framework approved by the Board. |
| |
| Credit and Investment Approvals Committee | | Approve corporate and wholesale credit and investment transactions over and above the levels delegated to individuals and below levels required to be submitted to Executive Risk Committee. |
| |
| Capital Committee | | Establish adequate and effective risk control processes, reporting systems and processes to ensure that all material capital risks are managed within the Risk Framework approved by the Board. |
| |
| Operational Pensions Committee | | Support the SPC by recommending significant changes to pension arrangements and funding strategies. Approve forward-looking plans, projects and initiatives, referring material matters to the SPC. |
| |
| Product Approval and Oversight Committee | | Approve customer, conduct, governance, operational, reputational, risk and control aspects relating to the external launch of new products and campaigns across all businesses and to material changes in existing products. |
| |
| Pricing Committee | | Approve pricing decisions for retail and corporate products. Understand the financial risks inherent in these products, ensuring they are adequately mitigated. This committee was established in January 2013. |
| |
| Disclosure Committee | | Ensure the adequacy and effectiveness of Santander UK’s disclosure controls and procedures and review and evaluate material financial information and announcements to be disclosed to the London Stock Exchange, US Securities and Exchange Commission and other recognised bodies. |
| | |
| 66 | | Santander UK plc Annual Report 2013 |
Detailed Business Review
Risk Management Reportcontinued
The Chief Executive Officer
The Board delegates responsibility to the Chief Executive Officer (‘CEO’) for the execution of business activities and the management of risk on a day-to-day basis. The key responsibilities of the CEO relating to risk are to:
| | • | | Propose and execute Santander UK’s business plan and strategy, and manage the risks that arise in the execution of this strategy with a delegated authority from the Board for this purpose. |
| | • | | Propose to the Board the Risk Appetite in order to agree on the maximum level and type of risk Santander UK is willing and able to accept to achieve its strategic objectives and business plan. |
| | • | | Delegate authority to executives to enable the discharge of responsibilities for the management and control of risk. |
| | • | | Oversee the establishment and maintenance of appropriate risk management systems and controls. |
| | • | | Report on a regular basis to the Board on the management of the key risks to achieving Santander UK’s strategic objectives and business plan. |
| | • | | Promote a corporate culture ensuring ethical practices and social responsibility are fostered, and that the policies and corporate values approved by the Board are effectively communicated throughout Santander UK. |
The Chief Risk Officer
As the leader of the risk function for Santander UK, the Chief Risk Officer (‘CRO’) provides oversight and challenge. The CRO reports to the Board and also has a reporting line to the CEO for operational purposes. The key responsibilities of the CRO are to:
| | • | | Propose to the Board (via the Board Risk Committee) a Risk Framework, which sets out how the risks arising from Santander UK’s activities are managed within Board-approved Risk Appetite and limits. |
| | • | | Provide assurance to the Board that all material risks incurred by Santander UK are appropriately identified measured and reported and that the systems, controls and delegated authorities for the management of these risks are both adequate and effective. |
| | • | | Provide assessment on key risks to the CEO, Board Risk Committee and Board, escalating any issue or breach of appetite or limit as necessary. |
The Chief Internal Auditor
The Chief Internal Auditor reports to the Board Audit Committee and also has a reporting line to the CEO for operational purposes. The Chief Internal Auditor also has a direct reporting line to the Chief Internal Auditor of Banco Santander, S.A.. The main responsibilities of the Chief Internal Auditor are to:
| | • | | Ensure that every significant activity and entity is within the scope of Internal Audit. |
| | • | | Design and implement a suitable methodology that embraces all aspects of audit work, identifies key risks and evaluates controls. |
| | • | | Develop an Audit Plan based upon evaluation of existing risks and to deliver that Audit Plan through the issuance of audit and other assurance and monitoring reports. |
| | • | | Undertake all audits, special reviews, reports and commissions requested by the Board Audit Committee. |
| | • | | Undertake regular business monitoring through engagement with internal control functions and external audit. |
| | • | | Develop and implement an internal auditor training plan with regular skills assessment. |
| | |
| Santander UK plc Annual Report 2013 | | 67 |
Detailed Business Review
Risk Management Reportcontinued
Risk organisational structure
Santander UK is structured into three lines of defence with clearly defined and segregated responsibilities with respect to risk:
| | | | |

| | Business Units which, through the execution of their business activities, originate risk. The head of each business unit is responsible for these risks and their primary management including: |
| | • | | Their identification, assessment, measurement and reporting; and |
| | • | | Management in line with Risk Appetite statements, policies and controls. |
| | Specialised Risk Unitswhich support the business in the management of complex and specialised risk. |

| | Risk Control Units are independent from risk origination functions. They are under the executive responsibility of the CEO and also report to the CRO. They comprise theChief Risk Management Officer (‘CRMO’) Unit, theInternal Control Unit, andLegal and Secretariat. The risk control units are responsible for effectively controlling risks and ensuring they are managed within the risk limits and mandates approved by the Board and CEO for which they: |
| | • | | Define and propose Risk Appetite and policies, ensuring an adequate link between them; |
| | • | | Use stress tests and scenario analysis to inform and assess Santander UK’s resilience with respect to its business objectives and risk statements and limits; |
| | • | | Measure and monitor risk exposures and profiles, and generate risk management information for senior management and committees; |
| | • | | Identify, assess and report risks including limit/threshold breaches and ensuring remedial actions are in place; |
| | • | | Define comprehensive but appropriate controls and ensure these are embedded; and |
| | • | | Maintain appropriate management information and risk reporting systems. |
| | TheRisk Oversight Unitassists the CRO in ensuring that risk management and control operates under the risk mandates and limits defined by the Board and: |
| | • | | Provides independent risk assessment and advice to the CRO, CEO, Board Risk Committee and Board; |
| | • | | Defines and proposes the Risk Frameworks for Board and Board Risk Committee approval; |
| | • | | Oversees and challenges risk management and risk control, including the oversight of the Risk Appetite proposed, and the associated business plan; |
| | • | | Conducts and co-ordinates Risk Appetite stress testing; |
| | • | | Verifies the adequacy and completeness of the systems of controls; |
| | • | | Identifies and assesses key enterprise-wide risks and potential emerging and future risks; and |
| | • | | Validates models and methodologies used for risk management. |
| |

| | The third line of defence is carried out byInternal Audit, which reports to the Board Audit Committee. Its main functions are: |
| | • | | Independently assess the fulfilment, effectiveness and efficiency of internal control systems, as well as the reliability and quality of the accounting; |
| | • | | Verify that the units responsible for exercising control over risks fulfil their purpose and respect the policies set by senior management, the procedures and the relevant internal and external regulations; and |
| | • | | Independently assure the adequacy and effectiveness of implementation of risk policies. |
| | |
| 68 | | Santander UK plc Annual Report 2013 |
Detailed Business Review
Risk Management Reportcontinued
The reporting lines of these units with respect to the management of risk are set out below:
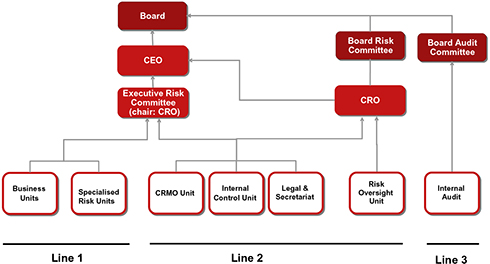
System of Internal Control for Risk
Santander UK’s system of internal control for risk comprises a hierarchy of risk frameworks, policies and limits for each specific risk type. Specific risk frameworks establish the principles, standards, rules and governance requirements for the management and control of each risk type. In support of these frameworks, each specific risk type has its own suite of policies and limits. These set out the rules and risk limits for the management of risk at a more granular level (e.g. credit portfolios). The risk limits employed in the management of each specific risk type are linked to Santander UK’s overall Risk Appetite, as set out in the next section.
| | |
| Santander UK plc Annual Report 2013 | | 69 |
Detailed Business Review
Risk Management Reportcontinued
RISK APPETITE(unaudited)
The Risk Appetite defines the type and the level of risk that Santander UK is willing and able to accept in pursuit of its strategic objectives under a severe but plausible stress scenario. The Risk Appetite and the Santander UK strategy are inter-related. The strategy must be achievable within the agreed boundaries determined by the Risk Appetite.
The Board approves and oversees the annual formulation of the Risk Appetite statement, ensuring that it continues to be relevant to Santander UK’s current and planned activities, the external environment, and that regulatory developments are reflected. It is senior management’s responsibility to establish the risk profile, reflected in the annual budget and medium term strategy, consistent with the Risk Appetite statement.
In order to ensure that the Santander UK risk profile is within appetite, two types of monitoring are performed. On a monthly basis, actual values against the Risk Appetite statement are monitored. At least semi-annually, the performance of the business plan against the Risk Appetite under stressed conditions is assessed to detect potential breaches.
The Risk Appetite is expressed through principles and metrics, as follows:
| | |
Principles | | These are statements which are based on Santander UK’s strategic and governing financial objectives and risk management principles. |
| |
Primary metrics | | These metrics are the primary articulation of the Risk Appetite of Santander UK and are expressed under severe but plausible scenarios. The primary metrics cover Losses, Capital and Liquidity. |
| |
Complementary metrics | | These metrics support the primary metrics and are aligned to the Risk Appetite principles. The main objective of these metrics is to control risk concentrations. |
For aspects of risks that do not lend themselves to expression through metrics, qualitative statements are employed. These also cover specific exclusions and restrictions in respect of the types of customers or activities that Santander UK will not engage in business with.
Principles
The principles that govern the Risk Appetite statements which are based on Santander UK’s strategic and governing financial objectives and risk management principles are as follows.
| | • | | Maintain a predictable, medium-low risk profile; |
| | • | | Maintain a moderate market risk appetite; |
| | • | | Maintain a risk-averse approach to Conduct, Operational, Regulatory and Legal Risks. |
| | • | | Maintain a stable policy of profit generation and dividend payments and ensure adequate capital returns; |
| | • | | Preserve strong capital and liquidity ratios as an autonomous subsidiary; |
| | • | | Employ a funding strategy that: |
| | • | | Avoids excessive reliance on wholesale funding; |
| | • | | Provides effective diversification in the sources and tenor of funding. |
| | • | | Control large concentrations to single obligors and industry sectors; |
| | • | | Comply with all regulatory requirements; |
| | • | | Maintain the trust of its customers, shareholders, employees and business counterparties; and |
| | • | | Ensure that remuneration and incentives support the wider risk management and risk culture objectives. |
Primary Metrics
| | |
Losses | | The Risk Appetite for losses is expressed as the maximum amount of loss that Santander UK is willing to accept, in any one year, under a plausible but severe stress scenario. |
Capital | | The Risk Appetite for capital is expressed as the minimum level of capital that Santander UK wishes to maintain under a severe but plausible stress scenario, expressed both in economic capital and regulatory capital terms. |
Liquidity | | The Liquidity Risk Appetite is expressed in terms of the structural balance sheet profile combined with a requirement for full coverage of a pre-defined internal stress. The internal stress is based upon the currently assessed most plausible scenario. |
Complementary Metrics
| | |
Single Name | | The total amount of exposure that Santander UK has to a single name corporate, financial institution or supranational counterparty. |
Sector | | The maximum exposure that Santander UK wishes to maintain with a single industry sector. |
Top 20 Exposures | | The cumulative amount of the top 20 largest exposures that Santander UK has with Corporate and Financial Institution counterparties expressed as a percentage of the capital base. |
Sovereign/country | | The maximum amount that Santander UK wishes to maintain with a sovereign, country or geographic area. |
Product | | The maximum amount that Santander UK wishes to maintain with a certain product set, e.g. Leverage Finance, Project Finance. |
| | |
| 70 | | Santander UK plc Annual Report 2013 |
Detailed Business Review
Risk Management Reportcontinued
KEY TOOLS AND TECHNIQUES(unaudited)
In managing risk, Santander UK employs a number of tools and techniques. These are described in further detail in the later sections of this report. In summary, they comprise the following:
Measurement Tools
| | • | | Internal rating and scoring models which, by assessing the qualitative and quantitative risk components by customer and transaction or product, make it possible to measure risk and therefore set lending and account management strategies. |
| | • | | Self-assessment techniques employed, for example, in operational risk and supplemented by use of loss data. |
| | • | | Market risk models, including Value at Risk (‘VaR’), used for managing market risk and setting the market risk limits for the trading portfolios. |
Economic Capital
The Santander UK Economic Capital model is used to manage risk by calculating the internal capital requirement: the minimum amount of capital Santander UK needs, at a given confidence level, to absorb unexpected losses taking into account all the significant risks of its activity. The Economic Capital model considers risks beyond those envisaged in the regulatory capital Pillar 1 approach. Critically, the Economic Capital model considers portfolio concentration and diversification between businesses. Further risks captured in the Economic Capital model which are not considered in the Pillar 1 regulatory framework are structural interest rate risk and business risk.
Exposure is broken down by the risk type (e.g. credit, market, operational), and the business unit. Credit risk is modelled using a Monte Carlo simulation to produce a Value-at-Risk (‘VaR’), with a 1 year time horizon. Adjustments are made outside the Monte Carlo process to account for volatility in Loss Given Default (‘LGD’), and also correlations between LGD and the Probability of Default (‘PD’). Market risk is also calculated using a VaR approach, using historical simulation. The results are adjusted to match the time horizon employed in credit risk. Similar approaches are adopted for other risks, such as operational risk. The consequent economic requirement is aggregated across the risk types and business units, taking account of the correlations which exist between them, and sensitivities to the various risk drivers.
Risk and Reward Measurement
Santander UK employs a return on risk-adjusted capital (‘RORAC’) methodology with the following activities and objectives:
| | • | | Calculation of economic capital requirements and of the return thereon for business units and products in order to facilitate an optimal allocation of economic capital; |
| | • | | Budgeting of capital requirement and RORAC of business units; and |
| | • | | Analysis and setting of prices in the decision-making process for transactions or products, such as loan approval. |
RORAC facilitates the comparison of the performance of transactions, customers, portfolios and businesses. It also identifies those which achieve a risk-adjusted return higher than the cost of capital, aligning risk management and business management with the aim of maximising value creation.
During 2013 Santander UK also employed Return on Risk Weighted Assets (‘RORWA’) in order to provide greater insight into relative business performance and to inform decisions around remuneration.
Stress Testing
The main objective of stress testing is to enhance senior management’s understanding of the sensitivity of Santander UK’s business plan, earnings and risk profile to stress scenarios of both a systemic and idiosyncratic nature. Stress testing outputs form the basis for designing appropriate action plans aimed at mitigating potentially damaging effects.
The Board considers stress testing outputs as part of risk governance, with the Board Risk Committee providing oversight and challenge. The Executive Risk Committee is responsible for ensuring the integrity of the stress testing approaches, processes and results as well as the overall adherence to the Stress Testing Framework.
The Stress Testing Framework has been designed with the objective of ensuring that consistent and comprehensive stress testing is undertaken throughout Santander UK, and that stress testing is an integral part of:
| | • | | The setting and review of Santander UK’s Risk Appetite; |
| | • | | The three year planning process; |
| | • | | The capital planning process; |
| | • | | Liquidity and contingency planning; and |
| | • | | Santander UK’s compliance with prevailing regulatory requirements. |
Santander UK uses stress-testing as a risk management tool in order to improve business planning and risk management. A multi-layered approach has been designed in order to capture risks at various levels, from simple portfolio / risk type sensitivity analyses to comprehensive Santander UK wide scenario studies.
| | |
| Santander UK plc Annual Report 2013 | | 71 |
Detailed Business Review
Risk Management Reportcontinued
Santander UK routinely develops forward-looking hypothetical scenarios which are mainly used for capital planning purposes and risk appetite setting. This analysis considers a range of scenarios featuring different macro-economic dynamics, events and degrees of severity. The scenarios are designed to address all material risk types as well as vulnerabilities deemed relevant to Santander UK. The scenarios contain projections for key variables such as GDP, house prices index, unemployment and interest rates. By way of example, the range of severities considered includes scenarios featuring an economic recession in which GDP suffers an overall contraction of approximately 10% with unemployment reaching rates as high as 14% and housing prices falling up to 40% from their peak level.
The links between underlying economic factors and internal losses or stressed risk parameters are primarily based on Santander UK stress testing models, experience and analysis, which may be supplemented by external research and at times supervisory guidance.
Santander UK also conducts reverse stress tests. These are tests in which Santander UK is required to identify and assess scenarios that are most likely to cause the failure of its current business model. The results of the reverse stress test are reviewed and approved by senior management and ultimately by the Board.
Model Validation
Santander UK uses models for the granting of credit, pricing, risk appetite setting, regulatory capital calculations, economic capital calculations, stress testing and provisioning across the various types. Given the importance of models across the Santander UK group, an independent validation team provides assurance with respect to their appropriateness and reliability. The principal characteristics of the independent validation team are:
| | • | | The validation is conducted independently of the teams responsible for the development of the models, and has a separate reporting line. The validation team is organised on a global basis across the Banco Santander group, with teams in London, Madrid, Sao Paulo and New York. This structure ensures consistency of validations and associated standards, knowledge sharing including best practices and a consistent approach to validation of global models; |
| | • | | It is specialised and expert, and reviews not just the methodological aspects of the models, but also the technical environment and data employed; |
| | • | | Validation is undertaken to ensure all our regulatory obligations are met; |
| | • | | Key assumptions and parameters are identified within the model and analysis is performed to ensure their adequacy including checks related to the justification documented by developers; |
| | • | | Sensitivity analysis and stress testing is performed on models as appropriate; |
| | • | | Adequacy of relevant documentation is examined; |
| | • | | The use of the model within the business is examined; |
| | • | | The validation unit checks controls surrounding the model including details of monitoring; and |
| | • | | Strengths and weaknesses of the model are summarised for presentation to appropriate governance committees. |
RISK CULTURE(unaudited)
Our risk culture is embedded into all business units through the implementation of the Santander UK Risk Framework and initiatives aligned to the Risk Culture statement.
| | • | | The CEO, CRO and senior Executives are responsible for promoting a corporate culture across the Santander UK group. ‘The Santander Way’, launched during 2013, aligns the Santander UK group’s vision and corporate values with its ethical practices and social responsibility. |
| | • | | The Santander UK Risk Framework, implemented in 2012, provides a common acceptance throughout the organisation of the importance of continuous identification, assessment, management and reporting of risks including clear accountability and ownership of risk areas. Minimum standards apply to each of the five core principles within the Risk Framework and are monitored through a documented attestation process. |
| | • | | The Santander UK Risk Culture statement confirms that “Santander UK will only take risks that it understands and will always remain prudent in identifying, assessing, managing and reporting all risks. We proactively encourage our people to take personal responsibility for doing the right thing and to challenge without fear. We ensure decisions are taken in the best interests of all our stakeholders and are in line with ‘The Santander Way’.” |
| | • | | A risk awareness communication and training campaign was delivered during 2013 to help strengthen and embed a risk management culture highlighting personal accountability for managing risk, aligned to ‘The Santander Way’, the Risk Framework Core Principles and the Risk Culture statement. |
| | |
| 72 | | Santander UK plc Annual Report 2013 |
Detailed Business Review
Risk Management Reportcontinued
RISK TYPES
ALLOCATION OF RISK ACROSS SANTANDER UK(unaudited)
As a homogenous measure of risk, economic capital can be used to illustrate the distribution of risk across those risk types for which capital is considered an effective mitigant.
The table below sets out the distribution of economic capital requirements across the Santander UK group at 31 December 2013 and 2012 by key risk type and by business segment. This allocation does not make allowance for the effects of diversification across risks or assets.
| | | | | | | | | | | | | | | | | | | | |
2013 | | Retail
Banking
% | | | Commercial
Banking
% | | | Markets
% | | | Corporate
Centre
% | | | Total
% | |
Risk Type | | | | | | | | | | | | | | | | | | | | |
Credit Risk | | | 26 | | | | 32 | | | | 4 | | | | 7 | | | | 69 | |
Traded Market Risk | | | — | | | | — | | | | 1 | | | | — | | | | 1 | |
Structural Risk | | | 5 | | | | — | | | | — | | | | 10 | | | | 15 | |
Non Financial Risk | | | 12 | | | | 2 | | | | 1 | | | | — | | | | 15 | |
| | | | | | | | | | | | | | | | | | | | |
Total | | | 43 | | | | 34 | | | | 6 | | | | 17 | | | | 100 | |
| | | | | | | | | | | | | | | | | | | | |
| | | | | |
2012 | | Retail
Banking
% | | | Commercial
Banking
% | | | Markets
% | | | Corporate
Centre(1)
% | | | Total
% | |
Risk Type | | | | | | | | | | | | | | | | | | | | |
Credit Risk(1) | | | 31 | | | | 31 | | | | 2 | | | | 8 | | | | 72 | |
Traded Market Risk | | | — | | | | — | | | | 1 | | | | — | | | | 1 | |
Structural Risk | | | 3 | | | | — | | | | — | | | | 8 | | | | 11 | |
Non Financial Risk | | | 13 | | | | 2 | | | | 1 | | | | — | | | | 16 | |
| | | | | | | | | | | | | | | | | | | | |
Total | | | 47 | | | | 33 | | | | 4 | | | | 16 | | | | 100 | |
| | | | | | | | | | | | | | | | | | | | |
| (1) | Credit risk in Corporate Centre at 31 December 2012 included capital allocated to the co-brand credit cards business. |
2013 compared to 2012 (unaudited)
During 2013, the economic capital methodology for the modelling of the profile of derivative exposure over time was enhanced, resulting in an increase in the allocation of economic capital to credit risk in Markets. The reduction seen in Retail Banking credit risk was predominantly due to the reduction in mortgage asset across the year, coupled with the transfer of the co-brand credit cards portfolio to Corporate Centre. The increased economic capital requirement for structural risk in Retail Banking was mainly due to the change in the component of pension risk allocated to that business unit.
CREDIT RISK
CREDIT RISK MANAGEMENT
Credit risk is the risk of financial loss arising from the default or credit quality deterioration of a customer or counterparty to which Santander UK has directly provided credit, or for which Santander UK has assumed a financial obligation.
Santander UK’s exposures to credit risk arise in the following businesses:
| | | | | | | | | | | | | | |
RETAIL BANKING | | COMMERCIAL BANKING | | MARKETS | | CORPORATE CENTRE |
• | | Exposures consist of residential mortgages, banking, and other personal financial services products. | | • | | Exposures consist of loans, bank accounts, treasury instruments, asset finance, cash transmission, trade finance and invoice discounting. These services are provided to large corporates, UK SMEs and specialist businesses. | | • | | Exposures arise from financial services and treasury products provided to financial institutions and large corporates. | | • | | Exposures result from asset and liability management of the balance sheet. This area is also responsible for managing credit risk on the non-core and legacy portfolios being run down. |
The credit risk arising in each of these businesses is covered in further detail in subsequent sections. Across these business segments, the management of credit risk is tailored according to the type of customer. These are typically classified as either non-standardised or standardised customers as follows:
| | |
STANDARDISED CUSTOMERS |
• | | Consist primarily of individuals and small businesses. Risk management is based on internal risk assessment and automatic decision-making models, supported by teams of analysts specialising in this type of risk. |
| |
• | | As a general rule, the following businesses deal with standardised customers: Retail Banking, Commercial Banking, and Corporate Centre (for certain non-core portfolios). |
| | |
NON-STANDARDISED CUSTOMERS |
• | | Consist mostly of medium and large corporate customers and financial institutions where risk management is performed through expert analysis supplemented by decision-making support tools based on internal risk assessment models. |
| |
• | | As a general rule, the following businesses deal with non-standardised customers: Commercial Banking, Markets and Corporate Centre. |
| | |
| Santander UK plc Annual Report 2013 | | 73 |
Detailed Business Review
Risk Management Reportcontinued
THE CREDIT CYCLE
The credit cycle comprises the following elements. Each element is described in further detail below:

1. Risk limit planning and setting
This phase involves setting risk limits which:
| | • | | Align to Santander UK’s business plan and strategic aims; |
| | • | | Ensure adherence to Santander UK’s Risk Appetite; and |
| | • | | Control the risk associated with any new product proposals. |
Risk limit planning and setting is a dynamic process involving the discussion of business proposals and the attitude to risk. This process is defined in the risk limit plan, a comprehensive document for the integrated management of the balance sheet and its inherent risks. The way in which risk limits are set is tailored to each risk classification as follows:
| | |
STANDARDISED CUSTOMERS |
• | | The risk limits are planned and set on a portfolio basis. |
| | |
| |
• | | For each portfolio, a credit management programme is produced. These documents contain the expected results of the portfolio in terms of risk and return, as well as the limits applicable to various activities and the related risk management. |
| | |
NON-STANDARDISED CUSTOMERS |
• | | A high-level risk limit is approved to support the customer’s overall financing needs. |
| |
• | | This limit covers a variety of products (such as lending, trade finance or derivatives) enabling Santander UK to define a total risk tolerance with the customer based on current and expected financial requirements. |
| |
• | | For global corporate groups, a system of pre-agreed limits (pre-classification) is used, based on an economic capital measurement and monitoring system. For large corporate customers, a simplified pre-classification model is applied. |
| | |
| 74 | | Santander UK plc Annual Report 2013 |
Detailed Business Review
Risk Management Reportcontinued
2. Risk analysis and credit rating process
Risk analysis is performed to establish the customer’s ability to meet its obligations. The analysis includes a review of customer credit quality, associated operational risk, and risk adjusted returns. To aid this analysis, Santander UK uses a number of proprietary internal measurement tools including statistical models and rating systems. These are used for internal credit risk assessments, informing lending decisions, and for calculating regulatory and economic capital requirements. These are tailored to each risk classification as follows:
| | |
STANDARDISED CUSTOMERS |
• | | Santander UK typically employs statistical models that automatically assign a score to the proposed transaction or customer. Such scorecards typically work in conjunction with other policy rules. |
| |
• | | Most decisions are made via an automated route. There are cases however where additional qualification and manual intervention is necessary. Risk assessment is not constrained to decisions at origination, as often scorecards exist across the customer lifecycle. |
| |
• | | Scorecards and policies are monitored frequently, with both quantitative and qualitative triggers embedded. |
| | |
NON-STANDARDISED CUSTOMERS |
• | | Ratings for non-standardised customers and financial institutions employ specific proprietary rating systems. For many non-standardised counterparties with a global footprint, Santander UK employs rating tools, co-ordinated on a global basis by the Banco Santander group. Portfolios of this nature include sovereigns, large corporate and certain financial institutions. |
| |
• | | The rating tools are also reviewed in order to progressively fine-tune the ratings they provide. |
| |
• | | The tools utilised contain both quantitative and qualitative components. The quantitative stage involves the analysis of the relative financial performance of the customer, together with macro-economic data. This is supplemented in the qualitative stage with an analyst’s expert judgement. |
| |
• | | The ratings are reviewed at least annually and more frequently in cases where monitoring indicates this is appropriate. |
Credit risk parameters
The Santander UK group uses a number of measures and measurement tools for the purposes of making internal credit risk assessments and lending decisions and for calculating regulatory capital in accordance with Basel II requirements but these are not used in the calculation of impairment loss allowances for accounting purposes under IFRS. For the remainder of the Risk Management Report, impairments, impairment losses and impairment loss allowances refer to calculations in accordance with IFRS unless specified as relating to Basel II. For details of the accounting policies for impairment calculated in accordance with IFRS refer to pages 222 to 226.
The Basel II assessment of customers or transactions using rating or scoring systems constitutes a judgement of their credit quality, which is quantified through the probability of default (‘PD’). In addition to PD, the quantification of credit risk requires the estimation of other parameters, such as exposure at default (‘EAD’) and the percentage of EAD that will not be recovered (loss given default or ‘LGD’). PD, EAD and LGD are all calculated in accordance with the requirements of Basel II and include direct and indirect costs. In estimating the risk involved in transactions, other factors such as any off-balance sheet exposure and collateral valuations are also taken into account. The combination of these risk parameters (i.e. PD, LGD and EAD) enables calculation of the expected loss (‘EL’). The risk parameters are used to calculate the Basel II regulatory capital.
For portfolios with limited internal default experience (e.g. banks) parameter estimates are based on alternative sources, such as market prices or studies conducted by external agencies. These portfolios are known as “low default portfolios”. For all other portfolios, parameter estimates are based on internal risk models.
| | • | | PD is calculated by observing the cases of new defaults in relation to the final rating assigned to customers or to the scoring assigned to the related transactions. |
| | • | | EAD is calculated by comparing the use of committed facilities at the time of default and their use under normal (i.e. performing) circumstances, so as to estimate the eventual extent of use of the facilities in the event of default. |
| | • | | LGD is calculated by observing the recoveries of defaulted loans, taking into account not only the income and expenses associated with the recovery process, but also the timing and the indirect costs arising from the recovery process. |
The parameters estimated for global portfolios (e.g. banks) are the same throughout the Banco Santander group. Therefore, a financial institution will have the same PD for a specific rating, regardless of the Banco Santander group entity in which the exposure is booked. By contrast, local portfolios (e.g. residential mortgages) have specific score and rating systems. PDs are assessed specifically for each borrower within the portfolio. When evaluating the credit risk of a specific subsidiary of a global institution, Santander UK makes an assessment and develops the appropriate rating for the subsidiary to be used in the evaluation of the credit risk in the transactions with this subsidiary.
| | |
| Santander UK plc Annual Report 2013 | | 75 |
Detailed Business Review
Risk Management Reportcontinued
3. Transaction decision-making
Having analysed a credit transaction and rated the customer, a decision is then made about whether or not to approve the transaction. This decision-making process takes account of:
| | • | | The credit quality of the customer, the underlying risk of the transaction and the extent of any risk mitigation (e.g. collateral); |
| | • | | Associated risk policy, limits and appetite; and |
| | • | | Achievement of the correct balance between risk and associated return. |
All decisions to approve credit transactions are made under authority delegated by the Board. The approach to the decision-making process differs according to risk classification as follows:
| | |
STANDARDISED CUSTOMERS |
• | | Automated decision models are used to facilitate the management of large volumes of credit transactions. |
| | |
| |
• | | In certain cases this is supplemented by the use of manual underwriting to ensure adherence to risk policy and that the appropriate decision is made for both the customer and Santander UK. |
| | |
NON-STANDARDISED CUSTOMERS |
• | | Credit approval decisions are made under a system of delegated authorities to individuals. Larger transactions above pre-defined limits are referred to governance committees. These include the Credit & Investment Approvals Committee and, for higher value transactions, the Executive Risk Committee. |
| |
• | | This decision-making process is followed both for transactions under pre-classified limits and those which receive specific approval. |
4. Risk monitoring
Monitoring is conducted at a portfolio, segment, customer and transactional level. Mitigating actions are proposed if deterioration is detected. Credit concentrations are also monitored. Concentration limits as defined by the Risk Appetite are reviewed and approved as necessary.
A specialised approach to monitoring is adopted for each risk classification:
| | |
STANDARDISED CUSTOMERS |
• | | Key indicators are monitored in order to detect any variance in the performance of portfolio compared to the forecasts contained in the credit management programmes. |
| |
• | | The scorecards, rating systems (including those necessary for Basel II), and associated policy are also monitored to check for stability and performance. |
| | |
NON-STANDARDISED CUSTOMERS |
• | | For corporate and some other specific lines of business, a watchlist is employed for companies under special watch. This is referred to by its internal Spanish acronym ‘FEVE’. |
The four stages in the watchlist process are:
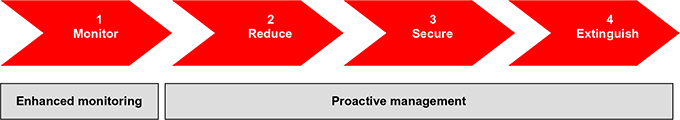
A customer can be classified as Watchlist as a result of the monitoring process itself, a decision made by the manager responsible for that customer or the triggering of the automatic warning system (highlighting actions registered against the company by third parties). There are a range of indicators that may trigger a case being added to the Watchlist, including downturn in trade, covenant breaches, major contract loss, early arrears or persistent excesses and resignation of key management etc. Such cases are assessed to determine the potential financial implications of these trigger events. Once a case becomes NPL it is no longer categorised as Watchlist. Inclusion on the Watchlist indicates that a potential impairment event has been observed but it does not automatically mean there has been a default, but will result in the following actions:
| | • | | A specific and time-bound action plan will be put in place for this customer, together with the assignment of specific individuals for management; and |
| | • | | Customers are reviewed monthly and the assigned rating is reviewed at least every six months. |
| | |
| 76 | | Santander UK plc Annual Report 2013 |
Detailed Business Review
Risk Management Reportcontinued
5. Risk measurement and control
Changes in Santander UK’s credit risk position are measured and controlled on an ongoing and systematic basis against budgets, limits and benchmarks. The potential future impact of these changes, both of an external nature and those arising from strategic decisions, is assessed in order to establish the required mitigating action needed.
Several metrics are used to measure and control credit risk during this phase. The two key metrics are:
| | | | |
KEY METRICS |
• | | Expected loss (‘EL’) | | Defined as the product of the three parameters: PD, EAD and LGD. It is an indication of the likely future costs of credit risk. |
| | |
• | | Net movement in non-performing loans (‘NPLs’) | | Defined as net movement in NPL stock over a period (closing balance less opening balance) plus write-offs, minus assets recovered during the same period. This metric and its components play a decisive role as tracking variables used to detect early changes in the behaviour of portfolios. |
Risks are assessed from various complementary perspectives, including geographical location, business area, management model and product and process, in order to facilitate the detection of specific areas of action requiring remediation. Stress testing techniques are also employed to establish vulnerabilities to economic deterioration.
6. Recovery management
Recovery management is critical to the success of our business, and is deployed through special recovery units. Recovery management is a strategic, integrated business activity. The Banco Santander group has a global model which is applied and implemented by Santander UK. The objectives of the recovery process are as follows:
| | | | |
OBJECTIVES |
• | | Customer relationship | | To maintain and strengthen the relationship with customers, paying attention to customer payment behaviour and financial performance. Specifically to ensure that the individual circumstances and reasons for deterioration are carefully considered when agreeing solutions with customers to ensure that arrangements are affordable and sustainable. |
| | |
• | | Loss minimisation | | To minimise losses whilst not adversely affecting brand, customer loyalty, or compliance with relevant legal and regulatory standards. |
Effective recovery management is dependent on:
| | | | |
ACTION | | DESCRIPTION |
• | | Supporting the customer | | Effective collections management is focussed on assisting customers in finding affordable and sustainable repayment solutions based on their individual circumstances. |
| | |
• | | Predicting customer behaviours and treating customers fairly | | By monitoring and modelling customer profiles and financial performance, and designing and implementing appropriate customer communication and debt management strategies, to enable effective support of customers in financial difficulty. |
| | |
• | | Negotiation | | Ongoing dialogue and negotiation with the customer to return the account to normal status in the shortest affordable and sustainable period. |
| | |
• | | Monitoring customer performance | | It is essential that agreements are monitored and evaluated to ensure they are producing the desired outcomes. |
| | |
| Santander UK plc Annual Report 2013 | | 77 |
Detailed Business Review
Risk Management Reportcontinued
CREDIT RISK MANAGEMENT – RETAIL BANKING
| | |
APPROACH TO CREDIT RISK |
• | | Santander UK is principally a retail prime lender and has no appetite or product offering for any type of sub-prime business. Our credit policy explicitly prohibits such lending and is specifically designed to ensure that any business written is responsible, affordable (both initially and on an on-going basis) and of a good credit quality. |
| |
• | | Credit risk in Retail Banking is managed through the use of a set of Board-approved risk appetite limits. |
| |
• | | Within these limits, credit mandates and policies are approved with respect to products sold by Santander UK. |
| |
• | | The largest area of exposure to credit risk in Retail Banking is in residential lending on mortgages. Residential lending is subject to lending policy and lending authority levels. |
| |
• | | Criteria for assessment include credit references, credit score, borrower status, affordability and, where applicable, Loan-to-Value (‘LTV’) ratio. Santander UK also employs quantitative limits that relate to internal approval levels. |
CREDIT RISK MANAGEMENT – MORTGAGES
Credit risk mitigation
Finance is provided subject to a rigorous credit risk assessment of the borrower, including affordability modelling (i.e. an assessment of the customer’s capacity to repay) and an assessment of the property. The quality of the mortgage assets are monitored to ensure that they are within agreed portfolio limits. The approval process uses credit scorecards, supported by manual underwriting, which involves a review of the applicant’s credit history using information sourced from credit reference agencies. Affordability of the customer’s borrowings is also assessed under stressed scenarios, including increased interest rates. Additional controls are used, such as product limits, loan to income and loan to value ratios.
Prior to granting any first mortgage loan on a property, Santander UK has the property valued by an approved and qualified surveyor. The valuation is based on internal guidelines, which build upon the Royal Institution of Chartered Surveyors (‘RICS’) guidance on valuation methods. In the case of re-mortgages, where the LTV is 75% or lower, the risk determined using the credit score is judged to be medium to low, and an accurate, reputable automated valuation is available, this may substitute for a surveyor’s valuation.
For existing mortgages, the current values of the properties on which individual mortgages are secured are assessed quarterly. For each individual property, details such as address, type of property and number of bedrooms are supplied to an independent agency that estimates current property valuations using information from recent property transactions and valuations in that local area. All additional loans require an automated valuation or surveyor’s valuation. The use of an automated valuation depends upon the availability of an accurate and reputable automated valuation, and the level of credit risk posed by the additional borrowing.
Arrears management
Problem debt management activity in Retail Banking on the secured loan portfolio is performed by the Collections & Recoveries Department. The overall objective is to minimise losses by helping customers repay their debts in a timely but affordable and sustainable manner whilst not adversely affecting brand, customer loyalty, or compliance with relevant legal and regulatory standards.
Debt management strategies, which include affordability assessment, use of collection tools, negotiating forbearance arrangements and debt counselling, can start prior to actual payment default or as early as the day after a repayment is past due and can continue until legal action. Different collection strategies are applied to different segments of the portfolio subject to the perceived levels of risk and the individual circumstances of each case.
The general principles are:
| | • | | Wherever possible, rehabilitation tools are used to encourage customers to find their own way out of difficulties with a solution agreeable to Santander UK; |
| | • | | Santander UK will be sympathetic and not make unreasonable demands of the customer; |
| | • | | Customer retention, where appropriate, is important and helping customers through difficult times can improve loyalty; |
| | • | | Guarantors are pursued only after it is established that the borrower is unable or unwilling to fulfil their contractual arrangements or if contact with the borrower cannot be made; and |
| | • | | Litigation and repossession is the last resort. |
Santander UK sells the repossessed property in a reasonable time frame for the best possible price based on fair market value and uses the sale proceeds, net of costs, to pay off the outstanding value of the mortgage. The stock of repossessed properties held by Santander UK varies according to the number of new possessions and the buoyancy of the housing market.
| | |
| 78 | | Santander UK plc Annual Report 2013 |
Detailed Business Review
Risk Management Reportcontinued
Forbearance
Forbearance on mortgage accounts occurs where the business grants a temporary or permanent concession of contractually agreed terms and conditions to a borrower who has been identified as being in financial difficulty.
The aim of such concessions is to bring the account back on to sustainable terms where the mortgage can be fully serviced over its lifetime. Santander UK’s policies and practices are based on criteria which, in the judgment of management, indicate that repayment is likely to continue and that after the initial period of financial difficulties the customer can revert to the previous terms, with appropriate support where necessary. These agreements may be initiated by the customer, Santander UK or by a third party. In certain limited circumstances, it may be possible for a customer to have their loan forborne more than once.
The factors considered when concluding whether a borrower is experiencing financial difficulties can include significant changes in economic circumstances such as the loss of income or employment, and significant changes in personal circumstances such as divorce or bereavement.
A range of forbearance strategies are employed in order to improve the management of customer relationships, maximise collection opportunities and, if possible, avoid foreclosure or repossession. Santander UK may offer a term extension or interest-only concession provided that the affordability assessments indicate that the borrower will be able to meet the revised payment arrangements. Outstanding arrears can be added to the loan balance to be repaid over the remaining loan term. This is known as capitalisation. Accounts subject to capitalisations, term extensions, and temporary interest-only conversions granted due to financial difficulties are subsequently reported as forborne. Many of these accounts remain in the performing portfolio but are identified and reported separately from the other performing accounts, and are subject to higher provisioning rates. The effectiveness of our forbearance approach is kept under review.
Santander UK may offer the following forbearance solutions:
| | | | |
ACTION | | DESCRIPTION |
• | | Capitalisation | | The customer’s arrears may be capitalised and added to the mortgage balance where the customer is consistently repaying the agreed monthly amounts (typically for a minimum period of 6 months) but where they are unable to increase repayments to repay these arrears over a reasonable period. Capitalisation is often combined with term extensions and interest-only concessions. |
| | |
• | | Term extension | | The repayment period/program may be extended to reduce monthly repayments. Customers may be offered a term extension where they are up-to-date but showing evidence of financial difficulties, or are already in the Collections & Recoveries process. The customer must be no more than 75 years old at the end of the revised term of the mortgage. |
| | |
• | | Interest-only | | The monthly repayment may be reduced to interest payment only with capital repayment deferred if all other collections tools have been exhausted and a term extension is either not possible or affordable. Customers may be offered an interest only concession where they are up-to-date but showing evidence of financial difficulties, or are already in the Collections & Recoveries process. Interest only concessions are offered up to a 12 month maximum period, after which a review is carried out and if appropriate a further period taking the total concession length up to 18 months can be granted. The expectation is that the customer will return to repayment on a capital and interest basis after the expiry of this concession. Agreements are made through the use of a data driven tool including such factors as affordability and customer indebtedness. Periodic reviews of the customer financial situation are undertaken to assess when the customer can afford to return to the repayment method. |
Where a case which is subject to forbearance is already in NPLs at the point the forbearance is agreed, the case is initially retained in the ‘non-performing’ loan category, until evidence of consistent compliance with the new terms is demonstrated (typically a minimum of three months) before being reclassified out of NPLs.
Under Santander UK’s forbearance methodology, a case will remain classified as forborne until full repayment is achieved. Loan loss allowances are assessed on a case-by-case basis taking into account amongst other factors, the value of collateral held as confirmed by third party professional valuations as well as the cash flow available to service debt over the period of the forbearance. These loan loss allowances are assessed regularly and are independently reviewed.
Other changes in contractual terms
In addition to the forbearance arrangements described above, there are other changes in contractual terms that have been carried out historically, due to commercial reasons, for borrowers who are not exhibiting signs of being in financial difficulty. These changes are not classified as forbearance as no financial difficulty was evident at the time of the change in contractual terms and the majority of those modified subsequently continue to perform satisfactorily. The aim of the change in contractual terms is to retain the customer relationship.
Litigation and Recovery
The account is escalated to the litigation and recovery phase when a customer is unwilling or unable to adhere to an acceptable agreement regarding arrears. Santander UK will consider delaying referral to litigation, or delaying action once in litigation under certain circumstances, such as where the customer presents evidence that the mortgage will be redeemed or the arrears cleared, or where the mortgage has a very low balance and arrears, or where the customer is making a regular payment of at least the instalment amount. These policies exist to ensure that repossession is only used as a last resort.
Repossessed properties (collateral)
Two independent valuations are requested on all repossessed properties and form the basis for the calculation of the impairment loss allowance. There are defined set of process and policies followed to ensure that appropriate valuation and marketing are undertaken. Where the valuations are still pending, the latest losses experienced are used to assess the impairment loss allowance. This, together with the additional disposal costs considered, ensures that estimated losses inherent in the stock of repossessed properties are realistic in relation to the current economic conditions.
| | |
| Santander UK plc Annual Report 2013 | | 79 |
Detailed Business Review
Risk Management Reportcontinued
Higher risk loans and other segments of particular interest
Santander UK is principally a retail prime lender and does not originate sub-prime or second charge mortgages, or lend on original LTV of over 90% (except in a small amount of lending in support of UK Government mortgage schemes to a maximum LTV of 95%). Nonetheless, there are some mortgage types that may present higher risks than others, or which may be of particular interest. These consist of:
| | • | | Loans with loan-to-value >100%, and |
| | |
PRODUCT | | DESCRIPTION |
• Interest-only | | Interest-only mortgages require monthly interest payments and the repayment of principal only at maturity. Santander UK requires that the customer has made arrangements to repay the principal at maturity. It is the customer’s responsibility to ensure that they have sufficient funds to repay the principal in full at maturity. Since 2009, additional policies aimed at reducing the risk associated with interest-only mortgages have been implemented including, in 2010, reducing the maximum LTV on new interest-only mortgages from 90% to 75% and increasing the minimum credit score acceptable, resulting in higher quality loans. In 2012, the maximum LTV on new interest-only mortgages was further reduced to 50%. In addition, restrictions were added so that sale of the property is now only an acceptable repayment plan where the amount of equity exceeds a predefined minimum. |
| |
• Flexible loans | | A flexible mortgage permits customers to “drawdown” additional funds at any time up to a predefined credit limit. By utilising the drawdown on their available funds customers are able to vary their monthly payments, or take payment holidays. A customer’s ability to drawdown is subject to certain predetermined conditions. These include: |
| |
| | • The drawdown must not exceed the available limit. |
| |
| | • The total number of drawdowns made in any month must not exceed the limit (if any) specified in the current tariff of charges. |
| |
| | • The customer must not be more than two payments in arrears. |
| |
| | • The customer must not have had any insolvency events, which can include county court judgments, bankruptcies, individual voluntary arrangements, administration orders and debt relief orders. |
| |
| | Customers are allowed to request credit limit reviews, but any increase request will be subject to the standard full credit approval process. Additionally, Santander UK can lower the credit limit at any time to ensure that the total of the mortgage balance and the headroom within the credit limit does not exceed 90% of the current market value of the property. |
| |
• Loans with loan-to- value >100% | | Where loans have loan-to-value ratios greater than 100%, liquidation of the collateral will not yield sufficient funds to cover the loan advanced, arrears and the costs of liquidation. Prior to 2009, in limited circumstances, customers were able to borrow more than 100% of the value of the property against which the loan was secured. Additionally, decreases in house prices have resulted in the current LTV of some loans increasing to over 100%. |
| |
• Buy-to-let | | In December 2011, Santander UK re-entered the buy-to-let market, targeting new or small volume investor landlords. The general principle behind the buy-to-let proposition is that it is self-financing. The proposition has its own suite of policies against which every application is manually assessed by an underwriter unless declined by an automated system decision. |
| | |
| 80 | | Santander UK plc Annual Report 2013 |
Detailed Business Review
Risk Management Reportcontinued
CREDIT RISK MANAGEMENT – BANKING AND CONSUMER CREDIT
Santander UK provides a range of unsecured finance products to Personal and Business Banking customers of the Retail Bank. These include bank accounts, with and without lending facilities, personal loans and credit cards. The quality and performance of new business and unsecured portfolios are monitored on a regular basis to ensure that they are within agreed portfolio limits and risk profiles.
Credit risk mitigation
The provision of unsecured lending facilities is subject to an initial affordability and credit risk assessment process together with ongoing monitoring and control. This assessment process encompasses the use of a range of decisioning systems and models that utilise a range of information sources, these typically include details provided by the customer, information concerning existing product holdings that a customer may have with Santander UK together with use of credit reference agency data relating to a customers broader financial position.
Forbearance
Unsecured lending
Forbearance arrangements for unsecured debts follow a similar set of principles to those applied to mortgages. Arrangements are managed on an individual basis taking into consideration the circumstances of each customer to ensure that arrangements are appropriate and sustainable. A range of potential solutions are in place that include:
| | | | |
ACTION | | DESCRIPTION |
• | | Reduced repayments via a debt management plan | | Where customers experience financial difficulty, collection activities and fees and interest can be frozen for up to 60 days while a reduced payment plan is agreed. Longer term suspension of interest and fees may also be considered as part of a repayment programme |
| | |
• | | Informal reduced payment arrangements | | The same flexibility as noted above is offered where a customer does not have a formal debt management plan in place but is experiencing financial difficulties. |
| | |
• | | Reduced settlement | | A reduced lump sum payment may be accepted with the remaining balance written off. |
Credit cards
Forbearance arrangements for credit card customers are consistent with other unsecured products. In addition to these forbearance strategies, Santander UK complies with insolvency solutions which are governed by relevant regulations and codes of practice. Insolvency solutions are not considered forbearance as they are not at the discretion of Santander UK but rather are complied with when applicable.
Finance leases
There is no significant forbearance activity within the finance lease business.
| | |
| Santander UK plc Annual Report 2013 | | 81 |
Detailed Business Review
Risk Management Reportcontinued
CREDIT RISK MANAGEMENT – COMMERCIAL BANKING
| | • | | Commercial Banking aims to grow principally through the expansion of a regional CBC network. It supports lending to the Mid-Corporate, SME, Real Estate and Large Corporate sectors. Based on robust credit policies, risk appetite models and a strong risk culture, Commercial Banking focuses on the management and control of credit risks within its portfolio. |
| | • | | All transactions are considered using credit limits approved by the appropriate credit authority. The most senior risk committee in Santander UK in this respect is the Executive Risk Committee which reviews the highest value transactions. Beyond this, it delegates authority to the Credit and Investment Approvals Committee. Santander UK has a delegated authority framework which defines transaction submission levels at individual level and escalation through the local risk committees and forums, as well as, in certain circumstances, to Banco Santander group global committees. However, final sign-off is derived from either the Executive Risk Committee or the Credit and Investment Approvals Committee. |
| | • | | A set of risk appetite limits covering different types of risk (e.g. credit risk arising in Commercial Banking) are used to measure and control economic capital value. Santander UK’s credit risk appetite is measured and controlled by a maximum level of unexpected loss that Santander UK is willing to sustain over a one-year period. In addition, specific limits are set by the Board and the Executive Risk Committee in relation to single counterparty risk and sector risk. |
| | • | | Individual credit risks are measured on a regular basis across the entire business. A detailed analysis of credit exposures and credit risk trends is reported on a monthly basis to the Executive Risk Committee, covering categories such as exposures to groups of connected counterparties, exposure by industries, economic sectors and geographical areas. Larger exposures are reported monthly to the Board Risk Committee. |
Portfolios and credit risk
| | |
PORTFOLIO | | DESCRIPTION |
• Sovereign | | The portfolio includes assets issued by local and central governments, and government guaranteed counterparties. It is normal market practice that there is no collateral associated with these assets. |
| |
• Large Corporate | | The Large Corporate portfolio consists of multinational companies and large UK national counterparties. The credit risk is primarily concentrated on financial products of up to 5 years maturity to support the working capital and liquidity needs. The majority of the portfolio consists of unsecured exposure, but credit agreements are underpinned by both financial and non-financial covenants. Typically for this type of business the initial, and ongoing, lending decision is based upon factors relating to the financial strength of the client, its position within its industry, its management strengths and other factors as evaluated by the specialised analyst assigned to each customer. |
| |
• Structured Finance | | The portfolio includes transactions where the exposure is held with a structured entity with non-recourse to the parent companies. Structured Finance exposures include but are not limited to Leverage Finance, Project Finance, Infrastructure Acquisition and Asset and Capital Structuring. Collateral is held in the form of a charge over the assets being acquired. This is combined with other covenants to provide security to the lenders. |
| |
• Mid-Corporate and SME | | Typically incorporates guarantee structures underpinned by both financial and non-financial covenants and debenture security. Guarantees are not classified as collateral and value is not attributed to them unless supported by tangible security. Lending decisions are assessed against trading cash flows and in the event of a default Santander UK does not typically take possession of the assets of the business, although an administrator may be appointed in more severe cases. The portfolio includes commercial mortgage lending to owner occupier business where collateral is taken in the form of a first legal charge over the property being mortgaged. A professional valuation of the real estate security is undertaken at the point of lending but no contractual right of revaluation exists. Revaluations may be undertaken in the event that cases become distressed. Collateral is rarely taken into possession. Where it is concluded that the business is not viable Santander UK seeks to ensure the disposal of the collateral, either consensually or via an insolvency process, as early as practical in order to optimise the outcome for Santander UK and where possible other stakeholders. Santander UK provides asset finance as well as invoice finance to certain UK corporate clients secured by way of a first ranking charge over the assets and debtor book being financed. Financed assets (typically vehicles and equipment) are reviewed prior to lending and their value assessed. For invoice finance, companies’ ledgers are subject to periodic reviews with funding provided against eligible debtors meeting pre-agreed criteria. In the event of a default, assets and debtors will be repossessed and sold, or collected out respectively. |
| |
• Real Estate | | Collateral is in the form of a first legal charge over commercial real estate assets. Lending to commercial real estate is undertaken against a policy setting minimum criteria including the quality (e.g. condition and age) and location of the property, the quality of the tenant, the terms and length of the lease, and the experience and creditworthiness of the sponsors. Properties are viewed by Santander UK prior to lending and annually thereafter. An independent professional valuation is obtained prior to lending, providing both a value and an assessment of the property, the tenant and future demand for the property (e.g. market rent compared to the current rent). Loan agreements typically permit bi-annual valuations thereafter or more frequently if it is likely that the covenants may be breached. However for the commercial mortgage element of the portfolio no rights of revaluation exist. When a commercial real estate loan is transferred to Watchlist (described in the section “Risk monitoring” in “The credit cycle” on page 76), Santander UK typically undertakes a revaluation of the collateral as part of the process for determining the strategy to be pursued (e.g. whether to forbear the loan or to realise the collateral). An assessment is made of the need to establish an impairment loss allowance based on the valuation in relation to the loan amount outstanding while also taking into consideration any forbearance solution to be adopted (e.g. whether provision of additional security or guarantees is available, the prospects of additional equity and the ability to enhance value through asset management initiatives). Collateral is rarely taken into possession. Where collateral has been taken into possession, Santander UK seeks to dispose of the collateral as early as practical in order to achieve the best possible outcome for all parties. |
| | |
| 82 | | Santander UK plc Annual Report 2013 |
Detailed Business Review
Risk Management Reportcontinued
Arrears management
Problem debt management activity in Commercial Banking is performed:
| | • | | Initially by the relationship manager and, for non-standardised cases, the Credit Partner (whose main responsibility is to manage credit risk whilst supporting the business); and |
| | • | | Subsequently by the Restructuring & Recoveries team when the circumstances of the case become more acute or specialist expertise is required and where the case becomes non-performing. |
The overall objective is to minimise losses by helping customers repay their debts in a timely but affordable and sustainable manner whilst not adversely affecting brand, customer loyalty, or compliance with relevant legal and regulatory standards.
Debt management strategies, which include negotiating forbearance arrangements, can start prior to actual payment default. Different collection strategies are applied to different segments of the portfolio in accordance with the perceived levels of risk and the individual circumstances of each case.
Santander UK seeks to detect weakening financial performance early through close monitoring of regular financial and trading information, periodic testing to ensure compliance with both financial and non-financial covenants and regular dialogue with corporate clients.
The Watchlist process is used proactively on cases which need enhanced management activity ranging from increased frequency and intensity of monitoring through to more specific activities to reduce Santander UK’s exposure, enhance Santander UK’s security or in some cases seek to exit the position altogether. This includes a more frequent review of the credit rating of these cases to ensure it remains appropriately up to date.
Once categorised as Watchlist, a strategy is agreed with Credit Risk and this is monitored through monthly Watchlist meetings for each portfolio. The Restructuring & Recoveries team attend the monthly Watchlist reviews and provide advice to the relationship manager and Credit Partner on cases. Where the issues identified are perceived to have become more acute or longer term, a recommendation may be made for the case to be transferred to Restructuring & Recoveries. Once a case enters NPL status, it is removed from Watchlist and transferred to Restructuring & Recoveries.
Forbearance
Forbearance occurs where the business grants a temporary or permanent concession of contractually agreed terms and conditions to a borrower who has been identified as being in financial difficulty.
The aim of such concessions is to bring the account back on to sustainable terms where the loan can be fully serviced over its lifetime. Santander UK’s policies and practices are based on criteria which, in the judgment of management, indicate that repayment is likely to continue and that after the initial period of financial difficulties the customer can revert to the previous terms, with appropriate support where necessary. These agreements may be initiated by the customer, Santander UK or by a third party. In certain limited circumstances, it may be possible for a customer to have their loan forborne more than once.
The factors considered when concluding whether a borrower is experiencing financial difficulties can include the results of covenant testing, reviews of trading and management information provided under the loan terms or directly from the customer as part of the Santander UK’s ongoing relationship dialogue.
A range of forbearance strategies are employed in order to improve the management of customer relationships, maximise collection opportunities and, if possible where the loan is secured, avoid foreclosure or repossession. Santander UK may offer a term extension, interest-only concession or covenant reset provided that the forecasts indicate that the borrower will be able to meet the revised payment arrangements. Accounts subject to term extensions and temporary interest-only conversions granted due to financial difficulties are subsequently reported as forborne. Many of these accounts remain in the performing portfolio but are identified and reported separately from the other performing accounts, and are subject to higher provisioning rates. The effectiveness of our forbearance approach is kept under review.
Santander UK may offer the following forbearance solutions:
| | |
ACTION | | DESCRIPTION |
• Term extension | | The term of the credit facility may be extended to reduce the regular periodic repayments, and where as a minimum, the interest can be serviced and there is a realistic prospect of full or improved recoveries in the foreseeable future. Customers may be offered a term extension where they are up-to-date but showing evidence of financial difficulties, or where the maturity of the loan is about to fall due and near term refinancing is not possible on current market terms. |
| |
• Interest-only | | Regular periodic repayment may be reduced to interest payment only for a limited period with capital repayment deferred where other options are not available and the issues are viewed as temporary. Customers may be offered an interest only concession where they are up-to-date but showing evidence of financial difficulties, or where they are in arrears. Regular reviews of the customer’s financial situation are undertaken to assess when the customer can afford to return to the repayment method. |
| |
• Covenant resets | | Financial covenants may be reset at levels which more accurately reflect the current and forecast trading position of the borrower. This may also be accompanied by a requirement for all surplus cash after operating costs to be trapped and used in reduction of Santander UK’s lending. |
Where a case which is subject to forbearance is already in NPLs at the point the forbearance is agreed, the case is initially retained in the ‘non-performing’ loan category, until evidence of consistent compliance with the new terms is demonstrated (typically a minimum of three months) before being reclassified out of NPLs.
Other forborne loans (i.e. those performing at the time of forbearance), are typically classified as sub standard for an initial period and once the case has demonstrated continued compliance with the new terms and the risk profile is deemed to have improved, it may be reclassified as fully performing.
Under Santander UK’s forbearance methodology, a case will remain classified as forborne until full repayment is achieved. Loan loss allowances are assessed on a case-by-case basis taking into account amongst other factors, the value of collateral held as confirmed by third party professional valuations as well as the cash flow available to service debt over the period of the forbearance. These loan loss allowances are assessed regularly and are independently reviewed. The level of multiple forbearance remain modest as a percentage of forbearance stock.
| | |
| Santander UK plc Annual Report 2013 | | 83 |
Detailed Business Review
Risk Management Reportcontinued
Other forms of debt management
In addition to forbearance, Santander UK uses other forms of debt management which can include:
| | |
ACTION | | DESCRIPTION |
• Payment arrangements | | Payments from a borrower may on rare occasions be varied such that an element of the debt and or interest is forgiven. For example this may involve debt-for-equity swaps for larger companies. Other forms of debt forgiveness would include reduction in the interest rate, interest or capital forgiveness. |
| |
• Obtaining additional security or guarantees | | Where a borrower has unencumbered assets, these may be charged as new or additional security in return for Santander UK changing contractual terms to existing facilities. Alternatively, Santander UK may take a guarantee from other companies within the borrower’s group and/or major shareholders provided it can be established the proposed guarantor has the resources to support such a commitment. |
| |
• Seeking additional equity | | Where a business is over-leveraged, fresh equity capital will be sought from existing or new investors to adjust the capital structure in conjunction with Santander UK agreeing to forbear the residual debt. |
Only a very limited number of debt-for-equity swaps have been undertaken. Under these arrangements, the converted debt is written off against the existing loan loss allowance upon completion of the debt conversion. The value of the equity acquired is initially held at nil value and reassessed periodically in light of subsequent performance of the borrower.
Exit the position consensually
Where it is not possible to agree a forbearance arrangement, Santander UK may seek to exit the position consensually by:
| | • | | Agreeing with the borrower an orderly sale of assets outside insolvency to pay down Santander UK’s debt; or |
| | • | | Arranging for the refinance of the debt with another lender. |
Enforcement and recovery
Where it is not possible to agree a forbearance arrangement or to exit the position consensually, Santander UK will pursue recovery by:
| | • | | Pursuing its rights through an insolvency process; |
| | • | | Optimising the sale proceeds of any collateral held; and |
| | • | | Sale of the debt where a secondary market exists (either individual loans or on occasion as a portfolio sale). |
Where Santander UK has to pursue recovery through the appointment of an administrator (or a receiver under the Law of Property Act in the case of real estate security), Santander UK’s shortfall is assessed against the administrator’s estimate of the outcome and an appropriate loan loss allowance is raised. In cases where a sale of the debt is deemed to offer the optimum recovery outcome, the shortfall, if the debt is sold below its par value, is written off upon sale.
Higher risk loans and other segments of particular interest
The Commercial Real Estate market has experienced a particularly challenging environment over recent years following the financial crisis. Further analysis is provided on this element of the Commercial Banking portfolio.
| | |
| 84 | | Santander UK plc Annual Report 2013 |
Detailed Business Review
Risk Management Reportcontinued
CREDIT RISK MANAGEMENT – MARKETS
| | • | | Credit risk on derivative instruments is taken under specific limits approved for each counterparty, and is controlled, managed and reported on a counterparty basis, regardless of whether the exposure is incurred by Markets or by Corporate Centre. |
| | • | | Credit risk on derivative instruments is calculated using the potential future mark-to-market exposure (‘PFE’) of the instruments at a 97.5% statistical confidence level and adding this value to the current mark-to-market value. The resulting PFE or credit risk is then included against the credit limits approved for individual counterparties along with other non-derivative exposures. |
| | • | | All exposures are accommodated under credit limits approved by the appropriate credit authority. The relevant senior approving authorities are the Executive Risk Committee and the Credit and Investment Approvals Committee. Exposures which exceed a pre-defined limit are also referred to Banco Santander S.A., although the ultimate approval remains within Santander UK. Exposures and credit risk trends are analysed regularly, with key issues escalated to the Executive Risk Committee or to the Board Risk Committee, as required. Key developments in large exposures are also reported to these committees. |
Portfolio and credit risk
Markets focuses on derivative products, supported by the use of collateralisation and central counterparties.
| | |
PORTFOLIO | | DESCRIPTION |
• Derivatives | | Derivatives are governed by standard legal agreements provided by the International Swaps and Derivatives Association Inc. (‘ISDA’), which mitigate the credit risk derived from this type of instruments. Netting arrangements Santander UK restricts its credit risk by entering into transactions under industry standard agreements which facilitate netting of transactions in the jurisdictions where netting agreements are recognised and have legal force. The netting arrangements do not generally result in an offset of balance sheet assets and liabilities for accounting purposes, as transactions are usually settled on a gross basis. However, there is scope for the credit risk associated with contracts to be reduced by netting arrangements embodied in the agreements to the extent that if an event of default occurs, all amounts with the counterparty under the specific agreement can be terminated and settled on a net basis. In line with industry practice, Santander UK executes the standard documentation according to the type of contract being entered into. For example, derivatives will be contracted under the ISDA Master Agreements, repurchase and reverse repurchase transactions will be governed by Global Master Repurchase Agreement (‘GMRA’), stock borrowing/lending transactions and other securities financing transactions are covered by Global Master Securities Lending Agreement (‘GMSLA’). |
| |
| | CollateralisationSantander UK also mitigates its credit risk to counterparties with which it primarily transacts financial instruments through collateralisation, using industry standard collateral agreements (i.e. the Credit Support Annex (‘CSA’)) in conjunction with the ISDA Master Agreement. This is applied consistently among different counterparties and products. Under these agreements, net exposures with counterparties are collateralised with cash, securities or equities. Exposures and collateral are generally re-valued daily and collateral is adjusted accordingly to reflect deficits/surpluses. Collateral taken must comply with Santander UK’s collateral parameters policy. This policy is designed to control the quality and concentration risk of collateral taken such that collateral held can be liquidated when a counterparty defaults. Collateral obtained during the year in respect of purchase and resale agreements (including securities financing) is equal to at least 100% of the amount of the exposure. |
| |
| | Use of Central Counterparties (‘CCPs’)Santander UK continues to use CCPs as an additional means to mitigate counterparty credit risk in derivative transactions. |
Arrears management
Cases exhibiting potentially higher risk characteristics are subject to risk monitoring under the Watchlist process described on page 76 in “Risk monitoring” within “The Credit Cycle”.
Forbearance
At 31 December 2013, there was no forbearance activity in Markets.
| | |
| Santander UK plc Annual Report 2013 | | 85 |
Detailed Business Review
Risk Management Reportcontinued
CREDIT RISK MANAGEMENT – CORPORATE CENTRE
| | • | | Credit risk is actively controlled in accordance with the relevant policies, limits, asset quality plans and aspects of Board-approved risk appetite. All exposures, including intra-group items, are captured in the risk management systems and fall within limits approved by the appropriate credit authority. For Corporate Centre exposures, the relevant senior approving authorities are the Executive Risk Committee and the Credit and Investment Approvals Committee. All transactions above the authorities delegated to the Credit and Investment Approvals Committee are approved by the Executive Risk Committee. Exposures which exceed a pre-defined limit are also referred to Banco Santander, S.A., although the ultimate approval remains within Santander UK. |
| | • | | The non-core corporate and legacy portfolios include older social housing assets and commercial mortgage loans together with the residual legacy assets from the acquisition of Alliance & Leicester plc which were not consistent with Santander UK’s business strategy. These assets are managed in a manner consistent with the Commercial Banking assets as described in the section “Credit Risk - Commercial Banking”. In addition, once it was determined to be sold, the co-brand credit cards business was managed as part of Corporate Centre prior to its sale in 2013. |
Portfolios and credit risk
The specialist businesses in Corporate Centre service customers in various business sectors including Commercial Mortgages and social housing. Corporate Centre is also responsible for certain legacy portfolios in run-off, including aviation and shipping.
| | |
PORTFOLIO | | DESCRIPTION |
• Sovereign | | The portfolio includes assets issued by local and central governments, and government guaranteed counterparties. It is normal market practice that there is no collateral associated with these assets. |
| |
• Structured products | | The portfolio contains the legacy Treasury asset portfolio that is being managed out for value over time, and an ongoing ALCO portfolio. The ALCO portfolio aims to manage Santander UK’s liquidity reserves by investing in high quality assets, which are selected to achieve diversification whilst also meeting prevailing regulatory liquidity regulations. The Treasury asset portfolio principally comprises floating rate notes and asset-backed securities, including mortgage-backed securities. The instruments held are unsecured but benefit from senior positions in the creditor cascade and, in the case of structured products, their rating reflects the over-collateralisation inherent in the structure and the assets that underpin the cashflows and repayment schedules. The Treasury asset portfolio is monitored for potential impairment through a detailed expected cashflow analysis taking into account the structure and underlying assets of each individual security. Once specific events give rise to a reasonable expectation that future anticipated cash flows may not be received, the asset originating these doubtful cash flows is deemed to be impaired. Objective evidence of loss events includes significant financial difficulties of the issuer and default or delinquency in interest and principal payments (breach of contractual terms). |
| |
• Derivatives | | Credit risk in derivatives is mitigated by netting agreements, collateralisation and the use of Central Counterparties. For more details, see “Credit Risk Management - Markets” on page 85. |
| |
• Legacy portfolios in run-off | | These portfolios comprise assets inconsistent with Santander UK’s future strategy and are being managed out for value over time. Collateral is regularly held through a first legal charge over the underlying asset and in some circumstances in the form of cash. For commercial mortgage lending, a professional valuation of the real estate security is undertaken at the point of lending but no contractual right of revaluation exists although in the event of a default a revaluation may be undertaken. There are also a small number of Private Finance Initiative (‘PFI’) transactions where collateral is held in the form of a charge over the underlying concession contract. Santander UK obtains independent third party valuations on fixed charge security such as aircraft or shipping assets. These valuations are undertaken in accordance with industry guidelines. An assessment is made of the need to establish an impairment loss allowance based on the valuation in relation to the loan balance outstanding (i.e. the LTV). This takes into account a range of factors including the future cashflow generation capability and the age of the assets as well as whether the loan in question continues to perform satisfactorily, whether or not the reduction in value is assessed to be temporary and whether other forms of recourse exist. Where a borrower gets into difficulty Santander UK would seek to ensure the disposal of the collateral, either consensually or via an insolvency process, as early as practical in order to minimise the loss to Santander UK. Collateral is rarely taken into possession. |
| |
• Social Housing | | The Social Housing portfolio is secured by a first legal charge on portfolios of residential real estate owned and let by UK Housing Associations. This collateral is re-valued at least every five years (in line with industry norms) and the valuation is based on standard housing methodologies, which generally involve the properties’ continued use as social housing. If the valuation were based upon normal residential use the value would be considerably higher. To date, Santander UK has suffered no defaults or losses on this type of lending and has not had to take possession of any collateral. The value of the collateral is in all cases in excess of the loan balance. Typically, the loan balance represents 25% to 50% of the implied market value of collateral using Santander UK’s LGD methodology. |
Arrears management
Cases exhibiting potentially higher risk characteristics are subject to risk monitoring under the Watchlist process (described in the section “Risk monitoring” in “The Credit Cycle” on page 76).
Forbearance
To support customers that encounter actual or apparent financial difficulties, Santander UK may enter into forbearance arrangements. The approach to forbearance in the Corporate Centre is the same as it is in Commercial Banking, as described above on page 83.
| | |
| 86 | | Santander UK plc Annual Report 2013 |
Detailed Business Review
Risk Management Reportcontinued
CREDIT RISK REVIEW
SANTANDER UK GROUP EXPOSURE
Maximum exposure and net exposure to credit risk
The tables below set out the main differences between the Santander UK group’s maximum exposure and net exposure to credit risk. They show the effects of collateral, netting, and risk transfer to mitigate the Santander UK group’s exposure.
For balance sheet assets, the maximum exposure to credit risk represents the carrying value after allowance for impairment. Off-balance sheet exposures comprise guarantees, formal standby facilities, credit lines and other commitments. For off-balance sheet guarantees, the maximum exposure is the maximum amount that Santander UK would have to pay if the guarantees were to be called upon. For formal standby facilities, credit lines and other commitments that are irrevocable over the life of the respective facilities, the maximum exposure is the full amount of the committed facilities.
The tables presented below include only those financial assets subject to credit risk. Subsequent analyses of credit risk in this section cover loans and advances to customers and banks, at carrying value.
| | | | | | | | | | | | | | | | | | | | | | | | |
| | | Maximum exposure | | | | | | | | | | | | | |
31 December 2013 | | Balance
sheet asset
£bn | | | Off-balance
sheet
£bn | | | Collateral(1)
£bn | | | Netting(2)
£bn | | | Risk
Transfer(3)
£bn | | | Net
Exposure
£bn | |
Cash and balances at central banks | | | 26.4 | | | | — | | | | — | | | | — | | | | — | | | | 26.4 | |
| | | | | | | | | | | | | | | | | | | | | | | | |
Trading assets: | | | | | | | | | | | | | | | | | | | | | | | | |
- Loans and advances to banks | | | 9.3 | | | | — | | | | (0.8 | ) | | | (3.4 | ) | | | — | | | | 5.1 | |
- Loans and advances to customers | | | 4.4 | | | | — | | | | (1.1 | ) | | | — | | | | — | | | | 3.3 | |
- Debt securities | | | 7.9 | | | | — | | | | (3.1 | ) | | | — | | | | — | | | | 4.8 | |
| | | | | | | | | | | | | | | | | | | | | | | | |
Total trading assets | | | 21.6 | | | | — | | | | (5.0 | ) | | | (3.4 | ) | | | — | | | | 13.2 | |
| | | | | | | | | | | | | | | | | | | | | | | | |
Financial assets designated at fair value: | | | | | | | | | | | | | | | | | | | | | | | | |
- Loans and advances to customers | | | 2.2 | | | | 0.2 | | | | (2.3 | ) | | | — | | | | — | | | | 0.1 | |
- Debt securities | | | 0.5 | | | | — | | | | — | | | | — | | | | — | | | | 0.5 | |
| | | | | | | | | | | | | | | | | | | | | | | | |
Financial assets designated at fair value | | | 2.7 | | | | 0.2 | | | | (2.3 | ) | | | — | | | | — | | | | 0.6 | |
| | | | | | | | | | | | | | | | | | | | | | | | |
Available-for-sale debt securities | | | 5.0 | | | | — | | | | — | | | | — | | | | — | | | | 5 | |
| | | | | | | | | | | | | | | | | | | | | | | | |
Derivative financial instruments | | | 20.0 | | | | — | | | | (1.7 | ) | | | (15.4 | ) | | | — | | | | 2.9 | |
| | | | | | | | | | | | | | | | | | | | | | | | |
Loans and advances to banks | | | 2.3 | | | | — | | | | (0.3 | ) | | | — | | | | (0.1 | ) | | | 1.9 | |
| | | | | | | | | | | | | | | | | | | | | | | | |
Loans and advances to customers: | | | | | | | | | | | | | | | | | | | | | | | | |
- Advances secured on residential property | | | 148.4 | | | | 6.8 | | | | (154.3 | ) | | | — | | | | — | | | | 0.9 | |
- Corporate loans | | | 24.5 | | | | 13.2 | | | | (18.6 | ) | | | — | | | | — | | | | 19.1 | |
- Finance leases | | | 3.1 | | | | — | | | | (2.2 | ) | | | — | | | | — | | | | 0.9 | |
- Other secured advances | | | 2.5 | | | | 0.2 | | | | (2.4 | ) | | | — | | | | — | | | | 0.3 | |
- Other unsecured advances | | | 5.3 | | | | 9.6 | | | | — | | | | — | | | | — | | | | 14.9 | |
- Amounts due from fellow subsidiaries, associates and joint ventures | | | 0.8 | | | | — | | | | — | | | | — | | | | — | | | | 0.8 | |
| | | | | | | | | | | | | | | | | | | | | | | | |
Total loans and advances to customers | | | 184.6 | | | | 29.8 | | | | (177.5 | ) | | | — | | | | — | | | | 36.9 | |
| | | | | | | | | | | | | | | | | | | | | | | | |
Loans and receivables securities | | | 1.1 | | | | — | | | | — | | | | — | | | | — | | | | 1.1 | |
| | | | | | | | | | | | | | | | | | | | | | | | |
Total | | | 263.7 | | | | 30.0 | | | | (186.8 | ) | | | (18.8 | ) | | | (0.1 | ) | | | 88.0 | |
| | | | | | | | | | | | | | | | | | | | | | | | |
| | | | | |
| | | Maximum exposure | | | | | | | | | | | | | |
31 December 2012 | | Balance
sheet asset
£bn | | | Off-balance
sheet
£bn | | | Collateral(1)
£bn | | | Netting(2)
£bn | | | Risk
Transfer(3)
£bn | | | Net
Exposure
£bn | |
Cash and balances at central banks | | | 29.3 | | | | — | | | | — | | | | — | | | | — | | | | 29.3 | |
| | | | | | | | | | | | | | | | | | | | | | | | |
Trading assets: | | | | | | | | | | | | | | | | | | | | | | | | |
- Loans and advances to banks | | | 10.0 | | | | — | | | | (1.7 | ) | | | (5.2 | ) | | | — | | | | 3.1 | |
- Loans and advances to customers | | | 7.6 | | | | — | | | | (3.4 | ) | | | — | | | | — | | | | 4.2 | |
- Debt securities | | | 4.5 | | | | — | | | | (4.1 | ) | | | — | | | | — | | | | 0.4 | |
| | | | | | | | | | | | | | | | | | | | | | | | |
Total trading assets | | | 22.1 | | | | — | | | | (9.2 | ) | | | (5.2 | ) | | | — | | | | 7.7 | |
| | | | | | | | | | | | | | | | | | | | | | | | |
Financial assets designated at fair value: | | | | | | | | | | | | | | | | | | | | | | | | |
- Loans and advances to customers | | | 3.2 | | | | 0.4 | | | | (3.4 | ) | | | — | | | | — | | | | 0.2 | |
- Debt securities | | | 0.6 | | | | — | | | | — | | | | — | | | | — | | | | 0.6 | |
| | | | | | | | | | | | | | | | | | | | | | | | |
Financial assets designated at fair value | | | 3.8 | | | | 0.4 | | | | (3.4 | ) | | | — | | | �� | — | | | | 0.8 | |
| | | | | | | | | | | | | | | | | | | | | | | | |
Available-for-sale debt securities | | | 5.5 | | | | — | | | | — | | | | — | | | | — | | | | 5.5 | |
| | | | | | | | | | | | | | | | | | | | | | | | |
Derivative financial instruments | | | 30.1 | | | | — | | | | (2.4 | ) | | | (25.7 | ) | | | — | | | | 2.0 | |
| | | | | | | | | | | | | | | | | | | | | | | | |
Loans and advances to banks | | | 2.4 | | | | — | | | | (0.2 | ) | | | — | | | | (0.1 | ) | | | 2.1 | |
| | | | | | | | | | | | | | | | | | | | | | | | |
Loans and advances to customers: | | | | | | | | | | | | | | | | | | | | | | | | |
- Advances secured on residential property | | | 156.8 | | | | 6.1 | | | | (162.0 | ) | | | — | | | | — | | | | 0.9 | |
- Corporate loans | | | 22.6 | | | | 12.3 | | | | (16.6 | ) | | | — | | | | — | | | | 18.3 | |
- Finance leases | | | 3.0 | | | | — | | | | (2.2 | ) | | | — | | | | — | | | | 0.8 | |
- Other secured advances | | | 2.8 | | | | 0.3 | | | | (2.9 | ) | | | — | | | | — | | | | 0.2 | |
- Other unsecured advances | | | 5.3 | | | | 8.7 | | | | — | | | | — | | | | — | | | | 14.0 | |
- Amounts due from fellow subsidiaries, associates and joint ventures | | | 0.3 | | | | — | | | | — | | | | — | | | | — | | | | 0.3 | |
| | | | | | | | | | | | | | | | | | | | | | | | |
Total loans and advances to customers | | | 190.8 | | | | 27.4 | | | | (183.7 | ) | | | — | | | | — | | | | 34.5 | |
| | | | | | | | | | | | | | | | | | | | | | | | |
Loans and receivables securities | | | 1.3 | | | | — | | | | — | | | | — | | | | — | | | | 1.3 | |
| | | | | | | | | | | | | | | | | | | | | | | | |
Other assets(4) | | | 1.2 | | | | 10.0 | | | | — | | | | — | | | | — | | | | 11.2 | |
| | | | | | | | | | | | | | | | | | | | | | | | |
Total | | | 286.5 | | | | 37.8 | | | | (198.9 | ) | | | (30.9 | ) | | | (0.1 | ) | | | 94.4 | |
| | | | | | | | | | | | | | | | | | | | | | | | |
| (1) | The forms of collateral which Santander UK takes to mitigate credit risk include: residential and commercial property; other physical assets, including motor vehicles; liquid securities, including those transferred under reverse repurchase agreements; cash, including that which is used to collateralise derivative transactions; and receivables. In terms of exposure, charges on residential property represent the majority of collateral taken. |
| (2) | Credit risk exposures can be reduced by applying netting and set-off. Santander UK uses this approach mainly for derivative and repurchase transactions with financial institutions. For derivatives transactions, Santander UK uses standard master netting agreements (e.g. ISDA). These agreements allow for netting of credit risk exposure to a counterparty resulting from a derivative transaction against Santander UK’s obligations to the counterparty in the event of default, to produce a lower net credit exposure. They may also reduce settlement exposure. |
| (3) | Certain financial instruments can be used to transfer credit risk from one counterparty to another. The main form of risk transfer employed by Santander UK is through the use of credit default swaps. |
| (4) | Other assets represent loans and advances to customers made by the co-brand credit cards business prior to its sale in 2013 (See Note 12 to the Consolidated Financial Statements). |
| | |
| Santander UK plc Annual Report 2013 | | 87 |
Detailed Business Review
Risk Management Reportcontinued
Credit rating
Santander UK uses a single rating scale to provide a consistent approach for reporting default risk across all the credit risk portfolios. The scale is comprised of eight grades for non-defaulted exposures numbered from 9 (lowest risk) to 2 (highest risk). Each grade is defined by an upper and lower probability of default (‘PD’) value and is scaled so that the default risk increases by a factor of 10 for every 2 step reduction in the grade number. For example, risk grade 9 equates to an average PD of 0.01%, and risk grade 7 equates to an average PD of 0.1%. Defaulted exposures are assigned to grade 1 and a PD value of 100%. An approximation to the equivalent credit rating grade used by Standard and Poor’s Rating Services (‘S&P’) is shown in the final column of the table.
| | | | | | | | | | | | | | | | |
| | | PD range | | | | |
Santander UK risk grade | | Mid
% | | | Lower
% | | | Upper
% | | | S&P equivalent | |
9 | | | 0.010 | | | | 0.000 | | | | 0.021 | | | | AAA to AA- | |
8 | | | 0.032 | | | | 0.021 | | | | 0.066 | | | | A+ to A | |
7 | | | 0.100 | | | | 0.066 | | | | 0.208 | | | | A- to BBB+ | |
6 | | | 0.316 | | | | 0.208 | | | | 0.658 | | | | BBB to BBB- | |
5 | | | 1.000 | | | | 0.658 | | | | 2.081 | | | | BB+ to BB- | |
4 | | | 3.162 | | | | 2.081 | | | | 6.581 | | | | B+ to B | |
3 | | | 10.000 | | | | 6.581 | | | | 20.811 | | | | B- to CCC | |
2 | | | 31.623 | | | | 20.811 | | | | 99.999 | | | | CC TO C | |
1 Default | | | 100.000 | | | | 100.000 | | | | 100.000 | | | | D | |
For further information on how the Santander UK group measures the credit quality of its loan portfolios, see pages 157 to 163.
The tables below set out the distribution across the credit rating master scale for loans and advances to banks and customers. For further detail and commentary on the credit rating profiles of key portfolios, see pages 94, 106 and 117 for Retail Banking (i.e. residential mortgages), Commercial Banking, and Corporate Centre, respectively.
| | | | | | | | | | | | | | | | | | | | | | | | | | | | | | | | | | | | |
| | | Santander UK rating guide | |
| | | 9 | | | 8 | | | 7 | | | 6 | | | 5 | | | 4 | | | 1 to 3 | | | Other(1) | | | Total | |
31 December 2013 | | £m | | | £m | | | £m | | | £m | | | £m | | | £m | | | £m | | | £m | | | £m | |
Loans and advances to banks | | | 600 | | | | 571 | | | | 1,024 | | | | — | | | | 152 | | | | — | | | | — | | | | — | | | | 2,347 | |
Loans and advances to customers: | | | | | | | | | | | | | | | | | | | | | | | | | | | | | | | | | | | | |
- Advances secured on residential property | | | 3,376 | | | | 15,229 | | | | 61,014 | | | | 43,209 | | | | 8,724 | | | | 8,816 | | | | 8,040 | | | | 21 | | | | 148,429 | |
- Corporate loans | | | 1,824 | | | | 3,050 | | | | 3,658 | | | | 8,056 | | | | 4,597 | | | | 2,435 | | | | 623 | | | | 223 | | | | 24,466 | |
- Finance leases | | | 2 | | | | 13 | | | | 410 | | | | 747 | | | | 726 | | | | 805 | | | | 371 | | | | 40 | | | | 3,114 | |
- Other secured advances | | | 7 | | | | 12 | | | | 41 | | | | 163 | | | | 361 | | | | 218 | | | | 51 | | | | 1,628 | | | | 2,481 | |
- Other unsecured advances | | | — | | | | 40 | | | | 120 | | | | 709 | | | | 1,907 | | | | 963 | | | | 516 | | | | 1029 | | | | 5,284 | |
- Amounts due from fellow subsidiaries, associates & joint ventures | | | 648 | | | | — | | | | — | | | | — | | | | 153 | | | | — | | | | — | | | | 12 | | | | 813 | |
| | | | | | | | | | | | | | | | | | | | | | | | | | | | | | | | | | | | |
Loans and advances to customers | | | 5,857 | | | | 18,344 | | | | 65,243 | | | | 52,884 | | | | 16,468 | | | | 13,237 | | | | 9,601 | | | | 2,953 | | | | 184,587 | |
| | | | | | | | | | | | | | | | | | | | | | | | | | | | | | | | | | | | |
Total | | | 6,457 | | | | 18,915 | | | | 66,267 | | | | 52,884 | | | | 16,620 | | | | 13,237 | | | | 9,601 | | | | 2,953 | | | | 186,934 | |
| | | | | | | | | | | | | | | | | | | | | | | | | | | | | | | | | | | | |
| |
| | | Santander UK rating guide | |
| | | 9 | | | 8 | | | 7 | | | 6 | | | 5 | | | 4 | | | 1 to 3 | | | Other(1) | | | Total | |
31 December 2012 | | £m | | | £m | | | £m | | | £m | | | £m | | | £m | | | £m | | | £m | | | £m | |
Loans and advances to banks | | | 276 | | | | 912 | | | | 1,004 | | | | — | | | | 237 | | | | — | | | | 9 | | | | — | | | | 2,438 | |
Loans and advances to customers: | | | | | | | | | | | | | | | | | | | | | | | | | | | | | | | | | | | | |
- Advances secured on residential property | | | 2,128 | | | | 14,043 | | | | 64,208 | | | | 48,733 | | | | 9,347 | | | | 9,696 | | | | 8,579 | | | | 24 | | | | 156,758 | |
- Corporate loans | | | 1,421 | | | | 2,865 | | | | 3,960 | | | | 8,197 | | | | 2,354 | | | | 2,359 | | | | 1,214 | | | | 214 | | | | 22,584 | |
- Finance leases | | | 5 | | | | 38 | | | | 512 | | | | 714 | | | | 652 | | | | 673 | | | | 327 | | | | 101 | | | | 3,022 | |
- Other secured advances | | | 5 | | | | 12 | | | | 33 | | | | 116 | | | | 260 | | | | 202 | | | | 51 | | | | 2,161 | | | | 2,840 | |
- Other unsecured advances | | | — | | | | 26 | | | | 120 | | | | 712 | | | | 1,615 | | | | 979 | | | | 593 | | | | 1,186 | | | | 5,231 | |
- Amounts due from fellow subsidiaries, associates & joint ventures | | | — | | | | — | | | | — | | | | — | | | | — | | | | — | | | | — | | | | 347 | | | | 347 | |
| | | | | | | | | | | | | | | | | | | | | | | | | | | | | | | | | | | | |
Loans and advances to customers | | | 3,559 | | | | 16,984 | | | | 68,833 | | | | 58,472 | | | | 14,228 | | | | 13,909 | | | | 10,764 | | | | 4,033 | | | | 190,782 | |
| | | | | | | | | | | | | | | | | | | | | | | | | | | | | | | | | | | | |
Total | | | 3,835 | | | | 17,896 | | | | 69,837 | | | | 58,472 | | | | 14,465 | | | | 13,909 | | | | 10,773 | | | | 4,033 | | | | 193,220 | |
| | | | | | | | | | | | | | | | | | | | | | | | | | | | | | | | | | | | |
| (1) | Represents smaller cases predominantly within the commercial mortgages portfolio which are subject to scorecards rather than a rating model. |
| | |
| 88 | | Santander UK plc Annual Report 2013 |
Detailed Business Review
Risk Management Reportcontinued
Concentrations of credit risk exposures
The management of risk concentration is a key part of risk management. Santander UK tracks the degree of concentration of its credit risk portfolios using various criteria, including geographic areas and countries, economic sectors, products and groups of customers. Although Santander UK’s operations are based mainly in the UK, it has built up exposures to various entities around the world and is therefore exposed to concentrations of risk related to geographic area. These are further analysed below:
Geographic concentrations
As part of its approach credit risk management and risk appetite, Santander UK sets exposure limits to countries and certain geographic areas. These limits are set by Santander UK with reference to the country limits set by Banco Santander, S.A. These are determined according to the classification of the country (whether it is a developed OECD country or not), the rating of the country, its gross domestic product and the type of business activities and products the Banco Santander group wishes to engage in within that country.
The tables below set out the distribution, by geographic area, of loans and advances to banks and customers.
| | | | | | | | | | | | | | | | | | | | | | | | | | | | |
31 December 2013 | | UK
£m | | | Peripheral
Eurozone(1)
£m | | | Rest of
Eurozone
£m | | | Rest of
Europe
£m | | | US
£m | | | Rest of
world
£m | | | Total
£m | |
Loans and advances to banks | | | 1,528 | | | | 68 | | | | 62 | | | | 222 | | | | 415 | | | | 52 | | | | 2,347 | |
Loans and advances to customers: | | | | | | | | | | | | | | | | | | | | | | | | | | | | |
- Advances secured on residential property | | | 148,429 | | | | — | | | | — | | | | — | | | | — | | | | — | | | | 148,429 | |
- Corporate loans | | | 22,336 | | | | 263 | | | | 157 | | | | 734 | | | | 159 | | | | 817 | | | | 24,466 | |
- Finance leases | | | 3,106 | | | | 4 | | | | — | | | | 4 | | | | — | | | | — | | | | 3,114 | |
- Other secured advances | | | 2,481 | | | | — | | | | — | | | | — | | | | — | | | | — | | | | 2,481 | |
- Other unsecured advances | | | 5,284 | | | | — | | | | — | | | | — | | | | — | | | | — | | | | 5,284 | |
- Amounts due from fellow subsidiaries, associates and joint ventures | | | 813 | | | | — | | | | — | | | | — | | | | — | | | | — | | | | 813 | |
| | | | | | | | | | | | | | | | | | | | | | | | | | | | |
Loans and advances to customers | | | 182,449 | | | | 267 | | | | 157 | | | | 738 | | | | 159 | | | | 817 | | | | 184,587 | |
| | | | | | | | | | | | | | | | | | | | | | | | | | | | |
Total | | | 183,977 | | | | 335 | | | | 219 | | | | 960 | | | | 574 | | | | 869 | | | | 186,934 | |
| | | | | | | | | | | | | | | | | | | | | | | | | | | | |
| | | | | | | |
31 December 2012 | | UK
£m | | | Peripheral
Eurozone(1)
£m | | | Rest of
Eurozone
£m | | | Rest of
Europe
£m | | | US
£m | | | Rest of
world
£m | | | Total
£m | |
Loans and advances to banks | | | 686 | | | | 237 | | | | 13 | | | | 149 | | | | 1,273 | | | | 80 | | | | 2,438 | |
Loans and advances to customers: | | | | | | | | | | | | | | | | | | | | | | | | | | | | |
- Advances secured on residential property | | | 156,758 | | | | — | | | | — | | | | — | | | | — | | | | — | | | | 156,758 | |
- Corporate loans | | | 20,376 | | | | 164 | | | | 363 | | | | 727 | | | | 268 | | | | 686 | | | | 22,584 | |
- Finance leases | | | 3,010 | | | | 4 | | | | — | | | | 8 | | | | — | | | | — | | | | 3,022 | |
- Other secured advances | | | 2,840 | | | | — | | | | — | | | | — | | | | — | | | | — | | | | 2,840 | |
- Other unsecured advances | | | 5,231 | | | | — | | | | — | | | | — | | | | — | | | | — | | | | 5,231 | |
- Amounts due from fellow subsidiaries, associates and joint ventures | | | 347 | | | | — | | | | — | | | | — | | | | — | | | | — | | | | 347 | |
| | | | | | | | | | | | | | | | | | | | | | | | | | | | |
Loans and advances to customers | | | 188,562 | | | | 168 | | | | 363 | | | | 735 | | | | 268 | | | | 686 | | | | 190,782 | |
| | | | | | | | | | | | | | | | | | | | | | | | | | | | |
Total | | | 189,248 | | | | 405 | | | | 376 | | | | 884 | | | | 1,541 | | | | 766 | | | | 193,220 | |
| | | | | | | | | | | | | | | | | | | | | | | | | | | | |
| (1) | Peripheral Eurozone comprises Cyprus, Greece, Ireland, Italy, Portugal and Spain. |
For additional geographic information and commentary, see “Country Risk Exposures” on pages 151 to 156.
| | |
| Santander UK plc Annual Report 2013 | | 89 |
Detailed Business Review
Risk Management Reportcontinued
Credit risk exposures by industry
As part of its approach to credit risk management and risk appetite, Santander UK sets exposure limits to certain key industry sectors. The tables below set out the distribution, by industry sector, of loans and advances to banks and customers.
| | | | | | | | | | | | | | | | | | | | | | | | | | | | | | | | | | | | |
31 December 2013 | | Social
Housing
£m | | | Banks
£m | | | SME
£m | | | Real estate
£m | | | Transport
£m | | | Residential
£m | | | Cards and
personal
unsecured
lending
£m | | | Other
£m | | | Total
£m | |
Loans and advances to banks | | | — | | | | 2,347 | | | | — | | | | — | | | | — | | | | — | | | | — | | | | — | | | | 2,347 | |
| | | | | | | | | | | | | | | | | | | | | | | | | | | | | | | | | | | | |
Loans and advances to customers: | | | | | | | | | | | | | | | | | | | | | | | | | | | | | | | | | | | | |
- Advances secured on residential property | | | — | | | | — | | | | — | | | | — | | | | — | | | | 149,022 | | | | — | | | | — | | | | 149,022 | |
- Corporate loans | | | 5,763 | | | | — | | | | 10,372 | | | | 3,363 | | | | 746 | | | | — | | | | — | | | | 4,626 | | | | 24,870 | |
- Finance leases | | | — | | | | — | | | | — | | | | — | | | | 1,110 | | | | — | | | | — | | | | 2,048 | | | | 3,158 | |
- Other secured advances | | | — | | | | — | | | | 1,001 | | | | — | | | | — | | | | — | | | | — | | | | 1,709 | | | | 2,710 | |
- Other unsecured advances | | | — | | | | — | | | | — | | | | — | | | | — | | | | — | | | | 5,569 | | | | — | | | | 5,569 | |
- Amounts due from fellow subsidiaries, associates & joint ventures | | | — | | | | — | | | | — | | | | — | | | | — | | | | — | | | | — | | | | 813 | | | | 813 | |
| | | | | | | | | | | | | | | | | | | | | | | | | | | | | | | | | | | | |
Loans and advances to customers (gross) | | | 5,763 | | | | — | | | | 11,373 | | | | 3,363 | | | | 1,856 | | | | 149,022 | | | | 5,569 | | | | 9,196 | | | | 186,142 | |
| | | | | | | | | | | | | | | | | | | | | | | | | | | | | | | | | | | | |
Less: impairment loss allowance | | | | | | | | | | | | | | | | | | | | | | | | | | | | | | | | | | | (1,555 | ) |
| | | | | | | | | | | | | | | | | | | | | | | | | | | | | | | | | | | | |
Loans and advances to customers, net of impairment loss allowance | | | | | | | | | | | | | | | | | | | | | | | | | | | | | | | | | | | 184,587 | |
| | | | | | | | | | | | | | | | | | | | | | | | | | | | | | | | | | | | |
Total | | | | | | | | | | | | | | | | | | | | | | | | | | | | | | | | | | | 186,934 | |
| | | | | | | | | | | | | | | | | | | | | | | | | | | | | | | | | | | | |
| | | | | | | | | |
31 December 2012 | | Social
Housing
£m | | | Banks
£m | | | SME
£m | | | Real estate
£m | | | Transport
£m | | | Residential
£m | | | Cards and
personal
unsecured
lending
£m | | | Other
£m | | | Total
£m | |
Loans and advances to banks | | | — | | | | 2,438 | | | | — | | | | — | | | | — | | | | — | | | | — | | | | — | | | | 2,438 | |
| | | | | | | | | | | | | | | | | | | | | | | | | | | | | | | | | | | | |
Loans and advances to customers: | | | | | | | | | | | | | | | | | | | | | | | | | | | | | | | | | | | | |
- Advances secured on residential property | | | — | | | | — | | | | — | | | | — | | | | — | | | | 157,310 | | | | — | | | | — | | | | 157,310 | |
- Corporate loans | | | 4,738 | | | | — | | | | 9,282 | | | | 3,732 | | | | 1,297 | | | | — | | | | — | | | | 4,262 | | | | 23,311 | |
- Finance leases | | | — | | | | — | | | | — | | | | — | | | | 1,148 | | | | — | | | | — | | | | 1,914 | | | | 3,062 | |
- Other secured advances | | | — | | | | — | | | | 1,299 | | | | — | | | | — | | | | — | | | | — | | | | 1,710 | | | | 3,009 | |
- Other unsecured advances | | | — | | | | — | | | | — | | | | — | | | | — | | | | — | | | | 5,545 | | | | — | | | | 5,545 | |
- Amounts due from fellow subsidiaries, associates & joint ventures | | | — | | | | — | | | | — | | | | — | | | | — | | | | — | | | | — | | | | 347 | | | | 347 | |
| | | | | | | | | | | | | | | | | | | | | | | | | | | | | | | | | | | | |
Loans and advances to customers (gross) | | | 4,738 | | | | — | | | | 10,581 | | | | 3,732 | | | | 2,445 | | | | 157,310 | | | | 5,545 | | | | 8,233 | | | | 192,584 | |
| | | | | | | | | | | | | | | | | | | | | | | | | | | | | | | | | | | | |
Less: impairment loss allowance | | | | | | | | | | | | | | | | | | | | | | | | | | | | | | | | | | | (1,802 | ) |
| | | | | | | | | | | | | | | | | | | | | | | | | | | | | | | | | | | | |
Loans and advances to customers, net of impairment loss allowance | | | | | | | | | | | | | | | | | | | | | | | | | | | | | | | | | | | 190,782 | |
| | | | | | | | | | | | | | | | | | | | | | | | | | | | | | | | | | | | |
Total | | | 4,738 | | | | 2,438 | | | | 10,581 | | | | 3,732 | | | | 2,445 | | | | 157,310 | | | | 5,545 | | | | 8,233 | | | | 193,220 | |
| | | | | | | | | | | | | | | | | | | | | | | | | | | | | | | | | | | | |
For additional industry information, see “Country Risk Exposures” on pages 151 to 156.
Forbearance summary
The following tables provide a summary of the population of loans and advances to customers which have been subject to forbearance programmes and are included in the previous tables. Discussion and analysis of forbearance activities for mortgages in Retail Banking are set out on page 100. Discussion and analysis of forbearance activities in Commercial Banking and Corporate Centre are set out on pages 110 and 121 respectively.
| | | | | | | | | | | | |
31 December 2013 | | Forbearance of NPL
£m | | | Forbearance of non-NPL
£m | | | Total
£m | |
Retail Banking: | | | | | | | | | | | | |
- Mortgages | | | 691 | | | | 3,396 | | | | 4,087 | |
- Unsecured loans | | | 2 | | | | 7 | | | | 9 | |
- Credit cards | | | 33 | | | | — | | | | 33 | |
- Bank accounts | | | 2 | | | | 15 | | | | 17 | |
Commercial Banking | | | 196 | | | | 728 | | | | 924 | |
Corporate Centre | | | 58 | | | | 322 | | | | 380 | |
| | | | | | | | | | | | |
Total | | | 982 | | | | 4,468 | | | | 5,450 | |
| | | | | | | | | | | | |
| | | |
31 December 2012 | | Forbearance of NPL
£m | | | Forbearance of non-NPL
£m | | | Total
£m | |
Retail Banking: | | | | | | | | | | | | |
- Mortgages | | | 699 | | | | 3,550 | | | | 4,249 | |
- Unsecured loans | | | 5 | | | | 17 | | | | 22 | |
- Credit cards | | | 55 | | | | — | | | | 55 | |
- Bank accounts | | | 2 | | | | 18 | | | | 20 | |
Commercial Banking | | | 144 | | | | 956 | | | | 1,100 | |
Corporate Centre | | | 63 | | | | 551 | | | | 614 | |
| | | | | | | | | | | | |
Total | | | 968 | | | | 5,092 | | | | 6,060 | |
| | | | | | | | | | | | |
| | |
| 90 | | Santander UK plc Annual Report 2013 |
Detailed Business Review
Risk Management Reportcontinued
CREDIT RISK – RETAIL BANKING
INTRODUCTION
Retail Banking offers a wide range of products and financial services to customers through a network of branches and ATMs, as well as through telephony, e-commerce and intermediary channels. It principally serves personal banking customers, but also services small businesses with a turnover of less than £250,000 per annum. Retail Banking products include residential mortgage loans, savings and current accounts, credit cards (excluding the co-brand credit cards business) and personal loans as well as a range of insurance policies. Credit risk is the risk of financial loss arising from the default of a customer or counterparty to which Santander UK has directly provided credit, or for which Santander UK has assumed a financial obligation, after realising collateral held.
Data for 2012 and earlier years within this section have been adjusted, where appropriate, to remove the co-brand credit cards business which was transferred to Corporate Centre prior to the completion of its sale in 2013, as set out in Note 12 to the Consolidated Financial Statements.
RETAIL BANKING – CUSTOMER ASSETS
An analysis of Retail Banking customer assets is presented below.
| | | | | | | | |
| | | 2013
£bn | | | 2012
£bn | |
Advances secured on residential properties(1) | | | 148.1 | | | | 156.6 | |
Unsecured loans(2): | | | | | | | | |
- Overdrafts | | | 0.5 | | | | 0.5 | |
- Unsecured personal loans | | | 2.0 | | | | 2.3 | |
- Credit cards(3) | | | 1.7 | | | | 1.4 | |
Consumer finance(4) | | | 3.1 | | | | 3.1 | |
Business Banking | | | 0.2 | | | | 0.2 | |
| | | | | | | | |
Total | | | 155.6 | | | | 164.1 | |
| | | | | | | | |
| (1) | Gross mortgage lending in the year of £18.4bn (2012:£14.4bn) and redemptions and repayments in the year of £26.9bn (2012: £24.0bn). Excludes accrued interest and loans to UK social housing associations (which are managed within Commercial Banking). |
| (2) | Overdrafts, unsecured personal loans (‘UPLs’) and other loans relating to cards are disclosed within unsecured loans and other loans in Note 19 to the Consolidated Financial Statements. |
| (3) | Adjusted to reflect the reclassification of the assets presented as held for sale prior to the completion of the sale as set out in Note 12 to the Consolidated Financial Statements. |
| (4) | Includes finance leases of £2.1bn (2012: £1.9bn). Additional finance leases of £0.9bn (2012: £0.8bn) are managed and classified within Commercial Banking and £0.2bn (2012: £0.3bn) are managed and classified within Corporate Centre. |
RESIDENTIAL MORTGAGES
Retail Banking grants mortgage loans for house purchases as well as granting further advances to existing mortgage customers. The property on which the mortgage is secured must always be located within the UK, with the exception of a small amount of lending in the Isle of Man.
In the following chart, gross lending includes both new business and, shown separately, further advances and any flexible mortgage drawdown against available limits. The redemptions and paydowns refer to customer payments, over-payments, clearing mortgage balances or re-financing away from Santander UK.
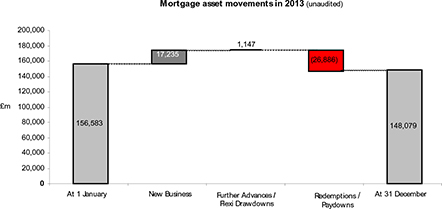
| | |
| Santander UK plc Annual Report 2013 | | 91 |
Detailed Business Review
Risk Management Reportcontinued
BORROWER AND PRODUCT PROFILE
In the following chart, the category home movers includes both existing customers moving house and taking out a new mortgage with us, and customers who move their mortgage to us at the point they move home. The category re-mortgagers comprises external customers re-mortgaging to Santander UK only. Internal re-mortgages, further advances and any flexible mortgages drawdowns are not included in the new business figures below.
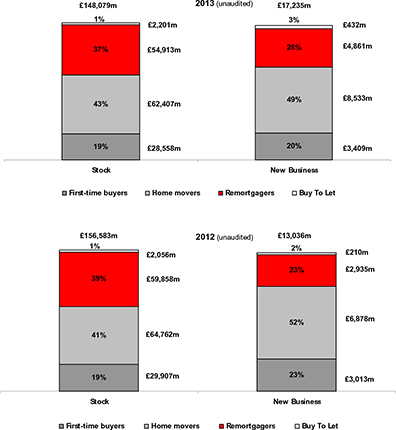
2013 compared to 2012(unaudited)
During 2013, the proportion of new business arising from re-mortgagers increased from 23% to 28%, balanced by a corresponding decrease in the proportion of first-time buyers and home movers. This was due to a larger weighting of first-time buyer business at the beginning of 2012 due to the imminent removal of favourable stamp duty concessions, and competitive re-mortgage products available during 2013. The average earnings multiple of new business (at inception) decreased marginally during 2013 from 3.1 to 3.0.
There were smaller movements in the mix of buyer type in the stock figures, which was also influenced by redemptions and repayments. Overall, the mix was relatively stable, with only a slight decrease in the re-mortgage proportion, and corresponding increase in home movers.
Product and interest rate profile
| | | | | | | | | | | | | | | | |
| | | 2013 | | | 2012 | |
| | | £m | | | % | | | £m | | | % | |
Term Product – Fixed Rate | | | 56,672 | | | | 39 | | | | 52,583 | | | | 34 | |
Term Product – Tracker | | | 5,956 | | | | 4 | | | | 17,390 | | | | 11 | |
Standard Variable Rate (SVR) | | | 51,490 | | | | 35 | | | | 51,419 | | | | 33 | |
Base Rate Linked | | | 15,260 | | | | 10 | | | | 15,957 | | | | 10 | |
Flexi(1) | | | 16,245 | | | | 11 | | | | 16,894 | | | | 11 | |
Buy-To-Let | | | 2,201 | | | | 1 | | | | 2,056 | | | | 1 | |
Other | | | 255 | | | | — | | | | 284 | | | | — | |
| | | | | | | | | | | | | | | | |
Total | | | 148,079 | | | | 100 | | | | 156,583 | | | | 100 | |
| | | | | | | | | | | | | | | | |
| (1) | In addition, there were £7,469m (2012: £9,348m) of legacy Alliance & Leicester flexible loan products included in other categories as the product functionality is more limited than the current Santander UK flexi loan product. |
2013 compared to 2012(unaudited)
During 2013, there was a migration away from tracker mortgages to fixed rate products. This is in line with potential borrowers’ concerns over future interest rate movements, and the increased availability of competitively priced fixed rate products. The proportion of customers paying the standard variable rate increased by 2% to 35% in 2013 (2012: 33%), reflecting the reduction in total stock during the year.
| | |
| 92 | | Santander UK plc Annual Report 2013 |
Detailed Business Review
Risk Management Reportcontinued
GEOGRAPHIC DISTRIBUTION
The Council of Mortgage Lenders (‘CML’) data in the following tables corresponds to new business originated during each of the reported years. For 2013, the CML data only covers the nine months ended 30 September 2013, due to timing of data availability. The percentage shown is on a value weighted basis.
| | | | | | | | | | | | |
| 2013 | | | | | | | | | |
UK Region | | Stock
% | | | New Business
% | | | (unaudited)
CML New Business
% | |
North East | | | 3 | | | | 2 | | | | 3 | |
North West | | | 8 | | | | 7 | | | | 7 | |
Yorkshire and the Humber | | | 5 | | | | 5 | | | | 6 | |
East Midlands | | | 4 | | | | 4 | | | | 5 | |
West Midlands | | | 6 | | | | 5 | | | | 6 | |
East of England | | | 4 | | | | 4 | | | | 4 | |
South East including London | | | 51 | | | | 57 | | | | 50 | |
South West | | | 8 | | | | 9 | | | | 8 | |
Wales | | | 3 | | | | 2 | | | | 3 | |
Scotland | | | 5 | | | | 4 | | | | 7 | |
Northern Ireland | | | 3 | | | | 1 | | | | 1 | |
| | | | | | | | | | | | |
| | | 100 | | | | 100 | | | | 100 | |
| | | | | | | | | | | | |
| | | |
| 2012 | | | | | | | | | |
UK Region | | Stock
% | | | New Business
% | | | (unaudited)
CML New Business
% | |
North East | | | 3 | | | | 3 | | | | 3 | |
North West | | | 9 | | | | 7 | | | | 7 | |
Yorkshire and the Humber | | | 5 | | | | 5 | | | | 5 | |
East Midlands | | | 4 | | | | 5 | | | | 5 | |
West Midlands | | | 6 | | | | 5 | | | | 6 | |
East of England | | | 4 | | | | 4 | | | | 4 | |
South East including London | | | 50 | | | | 53 | | | | 50 | |
South West | | | 8 | | | | 9 | | | | 9 | |
Wales | | | 3 | | | | 3 | | | | 3 | |
Scotland | | | 5 | | | | 5 | | | | 7 | |
Northern Ireland | | | 3 | | | | 1 | | | | 1 | |
| | | | | | | | | | | | |
| | | 100 | | | | 100 | | | | 100 | |
| | | | | | | | | | | | |
2013 compared to 2012(unaudited)
Geographically, whilst Santander UK has a diverse footprint across the UK, our mortgage exposure reflects a concentration around the South East including London, representing approximately half the value of the total portfolio. The concentration is a result of both the natural effect of a greater housing density and higher than average house prices in this area, coupled with a new business market share around 14% higher than the industry as a whole. Regional house price indices continue to show robust property values in this area.
In 2013, the stock distribution by region was broadly unchanged, whilst for new business there was an increase in the proportion of lending in the South East including London. This broadly reflected the relative movement in house prices seen in these regions compared with the rest of the country. On a proportional basis, there was a corresponding small decrease in all other regions.
| | |
| Santander UK plc Annual Report 2013 | | 93 |
Detailed Business Review
Risk Management Reportcontinued
RATING DISTRIBUTION(unaudited)
The following chart analyses the credit quality of the mortgage stock by Santander UK’s internal rating scale (see page 88). The 2012 ratings shown below are based on a 2013 rating calibration and are therefore presented on a consistent basis with the 2013 ratings.
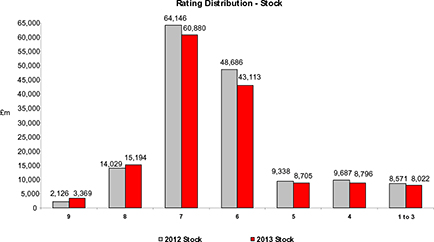
2013 compared to 2012(unaudited)
In 2013, there was a shift to better quality stock as the proportion of the portfolio with a rating of 7-9 increased to 53.6% (2012: 51.3%). This is as a result of comparatively better quality 2013 new business and improving economic conditions. The proportion of the portfolio of lower quality, with a rating of 1-3, decreased slightly to 5.4% (2012: 5.5%). See “Credit Performance” on page 98 for additional information on the proportion of assets in NPLs and arrears.
| | |
| 94 | | Santander UK plc Annual Report 2013 |
Detailed Business Review
Risk Management Reportcontinued
MATURITY PROFILE(unaudited)
The following tables set out mortgage loans and advances by contractual maturity period for new business (term at inception), and the residual maturity of stock (contractual term remaining). Customer behaviour shows that many loans are pre-paid prior to their legal (i.e. contractual) maturity, either through overpayments or redemptions.
| | | | | | | | |
2013 | | Stock
% | | | New Business
% | |
3 Years or less | | | 2 | | | | — | |
>3 - 6 Years | | | 5 | | | | 1 | |
>6 - 10 Years | | | 9 | | | | 5 | |
>10 - 15 Years | | | 20 | | | | 10 | |
>15 - 20 Years | | | 29 | | | | 17 | |
>20 - 25 Years | | | 20 | | | | 36 | |
>25 - 30 Years | | | 9 | | | | 17 | |
>30 Years | | | 6 | | | | 14 | |
| | | | | | | | |
| | | 100 | | | | 100 | |
| | | | | | | | |
| | | | | | | | |
2012 | | Stock
% | | | New Business
% | |
3 Years or less | | | 2 | | | | — | |
>3 - 6 Years | | | 4 | | | | 2 | |
>6 - 10 Years | | | 9 | | | | 5 | |
>10 - 15 Years | | | 18 | | | | 10 | |
>15 - 20 Years | | | 31 | | | | 16 | |
>20 - 25 Years | | | 22 | | | | 34 | |
>25 - 30 Years | | | 8 | | | | 17 | |
>30 Years | | | 6 | | | | 16 | |
| | | | | | | | |
| | | 100 | | | | 100 | |
| | | | | | | | |

2013 compared to 2012(unaudited)
In 2013, there was a small migration in the residual maturity profile towards shorter terms. The stock remaining term profiles have shifted to lower remaining terms. For new business, the proportion with terms greater than 25 years decreased. This was consistent with an increase in the proportion of re-mortgage business, which is generally written with comparatively shorter terms.
| | |
| Santander UK plc Annual Report 2013 | | 95 |
Detailed Business Review
Risk Management Reportcontinued
LOAN-TO-VALUE ANALYSIS
The following table sets out the Loan-to-Value distribution for stock, non-performing stock and new business. The LTV calculation includes fees added to the loan, and, where the product is on flexible terms, only includes the drawn loan amount, not undrawn limits. The valuation is based on the results of an automated valuation modelling or HPI indexed values, as appropriate. This re-valuation of the book is undertaken on a quarterly basis.
Of the loans in negative equity, the total which is effectively uncollateralised was £838m at 31 December 2013 (2012: £846m). The collateral value shown excludes this impact of over-collateralisation – where the collateral held is of a higher value than the loan balance outstanding.
| | | | | | | | | | | | |
| | | Stock | | | of which: | |
2013 | | % | | | NPL Stock
% | | | New Business
% | |
<=50% | | | 29 | | | | 18 | | | | 19 | |
>50 - 55% | | | 7 | | | | 4 | | | | 6 | |
>55 - 60% | | | 7 | | | | 5 | | | | 6 | |
>60 - 65% | | | 9 | | | | 6 | | | | 8 | |
>65 - 70% | | | 10 | | | | 6 | | | | 12 | |
>70 - 75% | | | 9 | | | | 8 | | | | 14 | |
>75 - 80% | | | 8 | | | | 8 | | | | 13 | |
>80 - 85% | | | 7 | | | | 8 | | | | 10 | |
>85 - 90% | | | 5 | | | | 8 | | | | 12 | |
>90 - 95% | | | 3 | | | | 6 | | | | — | |
>95 - 100% | | | 2 | | | | 6 | | | | — | |
> 100% i.e. negative equity | | | 4 | | | | 17 | | | | — | |
| | | | | | | | | | | | |
| | | 100 | | | | 100 | | | | 100 | |
| | | | | | | | | | | | |
Collateral value of residential properties(1) | | £ | 147,241m | | | £ | 2,678m | | | £ | 17,234m | |
| | | | | | | | | | | | |
| | | |
| | | % | | | % | | | % | |
Simple average(2) loan-to-value (indexed) | | | 51 | | | | 61 | | | | 62 | |
Value weighted average(3) loan-to-value (indexed) | | | 47 | | | | 57 | | | | 58 | |
| | | | | | | | | | | | |
| | |
| | | Stock | | | of which: | |
2012 | | % | | | NPL Stock
% | | | New Business
% | |
<=50% | | | 26 | | | | 15 | | | | 17 | |
>50 - 55% | | | 6 | | | | 4 | | | | 5 | |
>55 - 60% | | | 7 | | | | 4 | | | | 6 | |
>60 - 65% | | | 8 | | | | 5 | | | | 6 | |
>65 - 70% | | | 9 | | | | 6 | | | | 9 | |
>70 - 75% | | | 10 | | | | 7 | | | | 14 | |
>75 - 80% | | | 9 | | | | 7 | | | | 14 | |
>80 - 85% | | | 7 | | | | 9 | | | | 9 | |
>85 - 90% | | | 6 | | | | 8 | | | | 20 | |
>90 - 95% | | | 4 | | | | 8 | | | | — | |
>95 - 100% | | | 3 | | | | 7 | | | | — | |
> 100% i.e. negative equity | | | 5 | | | | 20 | | | | — | |
| | | | | | | | | | | | |
| | | 100 | | | | 100 | | | | 100 | |
| | | | | | | | | | | | |
Collateral value of residential properties(1) | | £ | 155,737m | | | £ | 2,625m | | | £ | 13,035m | |
| | | | | | | | | | | | |
| | | |
| | | % | | | % | | | % | |
Simple average(2) loan-to-value (indexed) | | | 52 | | | | 64 | | | | 63 | |
Value weighted average(3) loan-to-value (indexed) | | | 49 | | | | 62 | | | | 59 | |
| | | | | | | | | | | | |
| (1) | Includes collateral against loans in negative equity of £5,394m at 31 December 2013 (2012:£6,767m). |
| (2) | Unweighted average of loan-to-value of all accounts. |
| (3) | Sum of all loan values divided by sum of all valuations. |
| | |
| 96 | | Santander UK plc Annual Report 2013 |
Detailed Business Review
Risk Management Reportcontinued
The following chart sets out the LTV distribution for new business for 2013 and 2012. The LTV calculation is on the same basis as the figures shown in the table above.
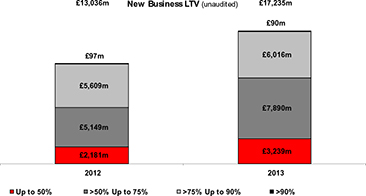
2013 compared to 2012(unaudited)
In 2013, the LTV profile of new business improved primarily as a consequence of the increase in proportion of re-mortgages, generally written at lower LTVs. The LTV profile of stock improved primarily as a result of house price increases during 2013. The 2013 new business flows did not have a significant impact on the stock LTV profile.
During 2013 a change has been made to the definition of the LTV ratio used for reporting purposes to align with that used for regulatory submissions. This change involves the inclusion of capitalised fees within the loan amount. The impact of this change is most noticeable for loans written at the boundary of an LTV pricing band. For example, a 75% LTV loan under the previously reported ratios would typically increase to around 75.7% under this revised approach. Consequently, the loan would move into a higher reported LTV banding. Figures for 2012 have been adjusted to reflect this change. There have been no material changes to LTV lending policy across 2013.
| | |
| Santander UK plc Annual Report 2013 | | 97 |
Detailed Business Review
Risk Management Reportcontinued
CREDIT PERFORMANCE
| | | | | | | | |
| | | 2013
£m | | | 2012
£m | |
Mortgage loans and advances to customers | | | 148,079 | | | | 156,583 | |
Performing(1) | | | 142,823 | | | | 151,084 | |
In arrears: | | | | | | | | |
- 31 to 60 days | | | 1,461 | | | | 1,686 | |
- 61 to 90 days | | | 1,000 | | | | 1,047 | |
| | | | | | | | |
Performing loans that are impaired(2) | | | 354 | | | | 481 | |
Loans in arrears that are impaired excluding NPLs(2) | | | 149 | | | | 282 | |
Non-performing loans:(3) (4) | | | 2,788 | | | | 2,719 | |
- By Arrears | | | 2,558 | | | | 2,620 | |
- By Bankruptcy | | | 55 | | | | 81 | |
- By Maturity default | | | 146 | | | | 18 | |
- By Forbearance | | | 29 | | | | — | |
| | | | | | | | |
Properties In Possession (‘PIP’)(2) | | | 91 | | | | 128 | |
| | | | | | | | |
| (1) | Includes £5,040m of mortgages (2012: £6,033m) where the counterparty failed to make a payment when contractually due for 30 days or less. |
| (2) | Retail loans are generally collectively assessed for impairment. Assets reported as impaired represent, for collective assessment, that portion of the loan portfolio where it is estimated that a loss will occur, plus those assets individually impaired (PIP). |
| (3) | Mortgages are classified as non-performing when the counterparty fails to make a payment when contractually due for typically three months or longer, or where the account is in early arrears (31 – 90 days) and has a bankruptcy indicator, or if the account is a maturity default where the loan or part thereof contractually matured over three months ago and a balance remains. Additionally, the NPL definition was expanded in 2013 to include those accounts that have been forborne whilst in a non-performing state but which have yet to make sufficient payments to merit exit from NPL, or certain multiple forbearance. |
| (4) | All Mortgage balances are UK and continue accruing interest. The balances include interest charged to the customer’s account, but exclude interest accrued but not yet charged to the account. |
Non-performing loans and advances(1) (2)
An analysis of mortgage NPLs is presented below.
| | | | | | | | |
| | | 2013
£m | | | 2012
£m | |
Mortgage loans and advances to customers of which:(2) | | | 148,079 | | | | 156,583 | |
Customers in Arrears(3) | | | 2,461 | | | | 2,733 | |
Mortgage NPLs - impaired(3)(4) | | | 468 | | | | 727 | |
Mortgage NPLs - not impaired(3) | | | 2,320 | | | | 1,992 | |
| | | | | | | | |
Mortgage NPLs | | | 2,788 | | | | 2,719 | |
| | | | | | | | |
Impairment loan loss allowances | | | 593 | | | | 552 | |
| | | | | | | | |
| | |
| | | % | | | % | |
Arrears ratio(5) | | | 1.66 | | | | 1.75 | |
NPLs ratio(6) | | | 1.88 | | | | 1.74 | |
Coverage ratio(7) | | | 21 | | | | 20 | |
| | | | | | | | |
| (1) | Mortgages are classified as non-performing when the counterparty fails to make a payment when contractually due for typically three months or longer, or where the account is in early arrears (31 – 90 days) and has a bankruptcy indicator, or if the account is a maturity default where the loan or part thereof contractually matured over three months ago and a balance remains. Additionally, the NPL definition was expanded in 2013 to include those accounts that have been forborne whilst in a non-performing state but which have yet to make sufficient payments to merit exit from NPL, or certain multiple forbearance. |
| (2) | Mortgage loans and advances to customers include Social Housing loans and finance leases. |
| (3) | All Mortgage balances are UK and continue accruing interest. For the data presented, the balances include interest charged to the customer’s account, but exclude interest accrued but not yet charged to the account. |
| (4) | NPLs against which an impairment loss allowance has been established. |
| (5) | Mortgage loans and advances to customers in arrears as a percentage of mortgage loans and advances to customers. |
| (6) | Mortgage NPLs as a percentage of mortgage loans and advances to customers. |
| (7) | Impairment loan loss allowances as a percentage of NPLs. |
| | |
| 98 | | Santander UK plc Annual Report 2013 |
Detailed Business Review
Risk Management Reportcontinued
Movements in NPLs during the year are set out in the graph below.
| | • | | ‘Transfers in’ represent loans which have become classified as NPLs during the year, comprising: |
| | • | | Entries: cases where the arrears increased to 91 days or more past due, specific types of maturity default, bankruptcy or forbearance; and |
| | • | | Policy entries: cases that entered the NPL classification due to a change in policy in the year. |
| | • | | ‘Transfers out’ represent loans which have left the NPL classification during the year, comprising: |
| | • | | Exits: cases where the arrears reduced to less than 91 days past due, as well as loan repayments/redemptions; and |
| | • | | PIP exits: cases that moved from non-performing and into possession, including any written-off portion. Write-offs represent the unrecovered element of a loan where recovery options, including realisation of any collateral, have been exhausted. |
Forbearance activity does not result in a change in the NPL status.
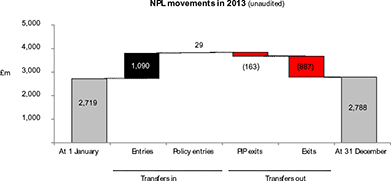
2013 compared to 2012(unaudited)
During 2013, the mortgage NPL stock increased to £2,788m (2012: £2,719m), with an increase in the first half of the year being partially offset by reductions in the second half of the year. This increase resulted largely from regulatory-driven policy and reporting changes which began to take effect from early 2012, including from cases where the mortgage remained outstanding after contractual maturity. Although these effects also contributed to the increase in the NPL ratio to 1.88% (2012: 1.74%), the reduction in the stock of mortgage loans and advances during the year also had a significant impact on this ratio.
Whilst the impact from regulatory-driven policy and reporting changes continued in 2013, it did so at a level somewhat lower than in 2012. The change in mortgage collections policy was driven by a regulatory review of our processes, which resulted in it taking longer to finalise collections arrangements with customers, thereby slowing the rate of improvement and cures, resulting in cases remaining longer as NPL. These policy and reporting changes are not expected to result in significant additional write-offs. At 31 December 2013, the mortgage NPL balances arising from regulatory-driven policy and reporting increased by £57m to £413m (2012: £356m).
In the second half of 2013, an improved economic environment and prolonged low interest rates, coupled with increases in collections efficiency, helped to stabilise the NPL ratio. The improving economy also helped to contribute to a reduction in the level of early arrears (<=90 days), as well as in the proportion of impaired loans. However, the balance of the economic recovery remains fragile, and a conservative stance was therefore maintained in our provisioning policy. This included allowances made for losses which could stem from factors including regional variation in the risk profile, changes to regulation and contractual maturity defaults.
In 2013, interest income recognised on impaired loans amounted to £88m (2012: £90m, 2011: £71m).
| | |
| Santander UK plc Annual Report 2013 | | 99 |
Detailed Business Review
Risk Management Reportcontinued
FORBEARANCE
Forbearance commenced during the year(1) (2) (3)
The balances that entered forbearance during the years ended 31 December 2013 and 2012 analysed by type of forbearance applied, were:
| | | | | | | | | | | | | | | | |
| | | 2013 | | | 2013 | | | 2012 | | | 2012 | |
| | | £m | | | % | | | £m | | | % | |
Capitalisation | | | 130 | | | | 31 | | | | 147 | | | | 21 | |
Term extensions | | | 168 | | | | 39 | | | | 355 | | | | 49 | |
Interest-only | | | 128 | | | | 30 | | | | 219 | | | | 30 | |
| | | | | | | | | | | | | | | | |
| | | 426 | | | | 100 | | | | 721 | | | | 100 | |
| | | | | | | | | | | | | | | | |
| (1) | All mortgages originated by Santander UK are first charge. |
| (2) | Mortgages are included within the year that they were forborne. |
| (3) | The figures by year reflect the amount of forbearance activity undertaken during the year irrespective of whether any forbearance activity has previously been undertaken on the forborne accounts. |
Forbearance cumulative position
a) Payment status when entering forbearance
The forborne balances at 31 December 2013 and 2012 when they originally entered forbearance, analysed by type of forbearance applied, was:
| | | | | | | | | | | | | | | | |
2013(1) | | Capitalisation
£m | | | Term extension
£m | | | Interest-only
£m | | | Total
£m | |
Forbearance of NPL | | | 290 | | | | 77 | | | | 324 | | | | 691 | |
Forbearance of Non-NPL | | | 1,426 | | | | 892 | | | | 1,078 | | | | 3,396 | |
| | | | | | | | | | | | | | | | |
Total | | | 1,716 | | | | 969 | | | | 1,402 | | | | 4,087 | |
| | | | | | | | | | | | | | | | |
| | | | |
2012(1) | | Capitalisation
£m | | | Term extension
£m | | | Interest-only
£m | | | Total
£m | |
Forbearance of NPL(2) | | | 280 | | | | 78 | | | | 341 | | | | 699 | |
Forbearance of Non-NPL(3) | | | 1,466 | | | | 953 | | | | 1,131 | | | | 3,550 | |
| | | | | | | | | | | | | | | | |
Total | | | 1,746 | | | | 1,031 | | | | 1,472 | | | | 4,249 | |
| | | | | | | | | | | | | | | | |
| (1) | Forbearance type categorisation is based on the first forbearance activity undertaken on the accounts. Tables contain only open accounts at the end of the year. |
| (2) | Previously described as Restructuring/refinancing in NPL. This is where the account was greater than 90 days past due at the time of forbearance. |
| (3) | Previously described as Other restructuring/refinancing. This is where the account was less than or equal to 90 days past due at the time of forbearance. |
b) Payment status at the year-end
The forborne balances analysed by type of forbearance applied at 31 December 2013 and 2012 was:
| | | | | | | | | | | | | | | | | | | | |
2013(1) | | Capitalisation
£m | | | Term extension
£m | | | Interest-only
£m | | | Total
£m | | | Impairment
allowance
£m | |
In arrears | | | 499 | | | | 181 | | | | 495 | | | | 1,175 | | | | 68 | |
Performing(2) | | | 1,217 | | | | 788 | | | | 907 | | | | 2,912 | | | | 62 | |
| | | | | | | | | | | | | | | | | | | | |
Total | | | 1,716 | | | | 969 | | | | 1,402 | | | | 4,087 | | | | 130 | |
| | | | | | | | | | | | | | | | | | | | |
Proportion of portfolio | | | 1.2 | % | | | 0.7 | % | | | 0.9 | % | | | 2.8 | % | | | — | |
| | | | | | | | | | | | | | | | | | | | |
| | | | | | | | | | | | | | | | | | | | |
2012(1) | | Capitalisation
£m | | | Term extension
£m | | | Interest-only
£m | | | Total
£m | | | Impairment
allowance
£m | |
In arrears | | | 514 | | | | 206 | | | | 555 | | | | 1,275 | | | | 68 | |
Performing(2) | | | 1,232 | | | | 825 | | | | 917 | | | | 2,974 | | | | 51 | |
| | | | | | | | | | | | | | | | | | | | |
Total | | | 1,746 | | | | 1,031 | | | | 1,472 | | | | 4,249 | | | | 119 | |
| | | | | | | | | | | | | | | | | | | | |
Proportion of portfolio | | | 1.1 | % | | | 0.7 | % | | | 0.9 | % | | | 2.7 | % | | | — | |
| | | | | | | | | | | | | | | | | | | | |
| (1) | Forbearance type categorisation is based on the first forbearance activity undertaken on the accounts. Tables contain only open accounts at the end of the year. |
| (2) | Where a loan has been classed as performing it will be continue to be classed as forborne for the duration of the life of the account. |
| | |
| 100 | | Santander UK plc Annual Report 2013 |
Detailed Business Review
Risk Management Reportcontinued
2013 compared to 2012(unaudited)
The level of forbearance applied in 2013 reduced markedly compared to 2012, with a tightening of forbearance policies, particularly for capitalisations, in line with prevailing regulatory guidance and fewer reporting definition changes than those implemented in 2012.
At 31 December 2013, the stock of mortgage accounts that had their term extended or converted to interest-only was relatively stable, amounting to 1.6% of all mortgage accounts by value (2012: 1.6%).
Levels of adherence to revised payment terms agreed under Santander UK’s forbearance arrangements improved during 2013 to approximately 75% by value (2012: 67%) and 77% by volume (2012: 75%) of the accounts in forbearance. The high percentage of these accounts performing supports Santander UK’s view that its forbearance arrangements provide an important tool to improve the prospects of recovery of amounts owed. In addition, it is likely that some of the accounts which were in early arrears at the time of the initial forbearance would have otherwise deteriorated into a non-performing state.
At 31 December 2013, the proportion of accounts that had been in forbearance for more than six months that had made their last six months’ contractual payments improved to 82% (2012: 77%). Furthermore, the accounts in forbearance classified as performing remained stable at just over £2.9bn or 71% by value (2012: £3.0bn or 70% by value). The weighted average LTV of all accounts in forbearance was 42.0% (2012: 43.5%) compared to the weighted average portfolio LTV of 46.7% (2012: 48.5%). Those accounts that reach the end of the concessionary forbearance period continue to show a good propensity to return to full repayments in accordance with the original contractual terms after the period of financial difficulty has passed.
At 31 December 2013, impairment loss allowances as a percentage of the balance of accounts for the overall mortgage portfolio was 0.40% (2012: 0.35%). The equivalent ratio for accounts in forbearance which were performing was 2.13% (2012: 1.71%), and for accounts in forbearance which were in arrears was 5.79% (2012: 5.33%). The higher ratios for accounts in forbearance reflected the higher levels of impairment loss allowances held, as a result of the higher risk characteristics inherent in such accounts.
During 2013 Santander has conducted an analysis of customers where the management of financial difficulty has required multiple instances of forbearance. Multiple forbearance is intended to recognise when an agreed plan to mitigate the customers financial difficulty has failed and an alternative plan is required. Customers that have more than one forbearance event in a given year or more than three events in any rolling 5 year period are classified as multiple forbearance. At 31 December 2013, the carrying value of mortgage loans classified as multiple forbearance was unchanged at £67m (2012: £67m).
c) Performing accounts by duration of forbearance activities(unaudited)
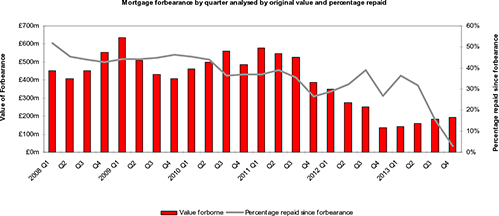
The chart above shows that four years after forbearance has been applied, between 40% to 50% of the outstanding balances have been repaid either by subsequent capital repayments or redemption. The graph line naturally reduces over time as accounts that have entered forbearance more recently have had less opportunity to make repayments. During each month in 2013 the forbearance stock continued to reduce as the pay-downs outweighed the inflows.
Other changes in contractual terms
Since January 2008, a further £7.3bn of loans have been modified in addition to the accounts subject to forbearance for borrowers who are not exhibiting signs of being in financial difficulty, in order to retain the customer relationship. The performance and profile of the additional modifications is kept under review. At 31 December 2013:
| | • | | The average LTV was 49%, and 93% of accounts had paid their contractual monthly payment during the previous six months. |
| | • | | The proportion of accounts three or more monthly payments in arrears was 1.68%, which was consistent with the rest of the portfolio. |
Financial assets that would otherwise be past due or impaired
At 31 December 2013, the carrying amount of financial assets that would otherwise be past due or impaired whose terms have been forborne was £2,930m (2012: £3,007m).
| | |
| Santander UK plc Annual Report 2013 | | 101 |
Detailed Business Review
Risk Management Reportcontinued
HIGHER RISK LOANS AND OTHER SEGMENTS OF PARTICULAR INTEREST
There are some mortgage types of particular interest or which present higher risks than others. These mortgages consist of:
| | • | | Loans with loan-to-value >100%; and |
The arrears performance of these mortgages has continued to be relatively stable with arrears and loss rates remaining low.
Borrower profile(1)
| | | | | | | | |
2013 | | Stock
£m | | | New Business
£m | |
Full interest-only loans | | | 49,318 | | | | 2,151 | |
Part interest-only, part repayment loans(2) | | | 15,534 | | | | 1,693 | |
Flexi loans | | | 16,245 | | | | 1,172 | |
Other flexible loans(3) | | | 7.469 | | | | — | |
Loans with current LTV > 100% | | | 6,202 | | | | 1 | |
Buy-to-let | | | 2,201 | | | | 432 | |
Interest-only and >100% current LTV | | | 4,336 | | | | — | |
| | | | | | | | |
| | |
2012 | | Stock
£m | | | New Business
£m | |
Full interest-only loans | | | 55,422 | | | | 2,435 | |
Part interest-only, part repayment loans(2) | | | 16,783 | | | | 274 | |
Flexi loans | | | 16,894 | | | | 1,778 | |
Other flexible loans(3) | | | 9,348 | | | | — | |
Loans with current LTV > 100% | | | 7,635 | | | | — | |
Buy-to-let | | | 2,056 | | | | 210 | |
Interest-only and >100% current LTV | | | 5,295 | | | | — | |
| | | | | | | | |
| (1) | Where a loan exhibits more than one of the criteria, it is included in all the applicable categories. |
| (2) | Mortgage balance includes both the interest only element of £9,564m (2012: £9,970m) and the non-interest only element of the loan. |
| (3) | Legacy Alliance & Leicester flexible loan products with more limited functionality than the current Santander UK flexi loan product. |
2013 compared to 2012(unaudited)
The proportion of new business in 2013 that was pure interest-only decreased to 12% (2012: 19%). Lending with a mixture of interest-only and capital and interest repayment increased from 2% to 10% as the maximum allowable LTV for this type of lending was increased to 75% towards the end of 2012 whilst maintaining the maximum allowable LTV for the interest-only element of the mortgage at 50%.
The proportion of flexible loans new business decreased to 7% (2012: 14%), whilst buy-to-let lending in 2013 increased slightly to 2.5% (2012: 1.6%) in line with the strategy to expand this line of business in a controlled manner.
From a stock perspective, loans with a current LTV greater than 100% decreased to 4% (2012: 5%) consistent with improving house prices.
| | |
| 102 | | Santander UK plc Annual Report 2013 |
Detailed Business Review
Risk Management Reportcontinued
Credit performance
| | | | | | | | | | | | | | | | | | | | | | | | |
| | | | | | Segment of particular interest(1) | | | | |
2013 | | Total
£m | | | Interest
-only(2)
£m | | | Flexible
Loans (3)
£m | | | Loan to Value
> 100%
£m | | | Buy to Let
£m | | | Other
Portfolio (4)
£m | |
Mortgage portfolio | | | 148,079 | | | | 64,852 | | | | 23,714 | | | | 6,202 | | | | 2,201 | | | | 71,554 | |
Performing of which: | | | 142,823 | | | | 61,636 | | | | 23,253 | | | | 5,443 | | | | 2,160 | | | | 69,853 | |
- In arrears 31 to 60 days | | | 1,461 | | | | 839 | | | | 111 | | | | 140 | | | | 11 | | | | 540 | |
- In arrears 61 to 90 days | | | 1,000 | | | | 587 | | | | 69 | | | | 107 | | | | 7 | | | | 356 | |
| | | | | | | | | | | | | | | | | | | | | | | | |
Non-performing loans | | | 2,788 | | | | 1,791 | | | | 279 | | | | 489 | | | | 22 | | | | 803 | |
| | | | | | | | | | | | | | | | | | | | | | | | |
NPL ratio | | | 1.88 | % | | | 2.76 | % | | | 1.18 | % | | | 7.88 | % | | | 1.01 | % | | | 1.12 | % |
| | | | | | | | | | | | | | | | | | | | | | | | |
Properties In possession | | | 91 | | | | 63 | | | | 5 | | | | 42 | | | | 1 | | | | 16 | |
| | | | | | | | | | | | | | | | | | | | | | | | |
| | | |
| | | | | | Segment of particular interest(1) | | | | |
2012 | | Total
£m | | | Interest
-only(2)
£m | | | Flexible
Loans
£m | | | Loan to Value
> 100%
£m | | | Buy to Let
£m | | | Other
Portfolio(3)
£m | |
Mortgage portfolio | | | 156,583 | | | | 72,076 | | | | 26,242 | | | | 7,635 | | | | 2,056 | | | | 71,413 | |
Performing of which: | | | 151,084 | | | | 68,734 | | | | 25,810 | | | | 6,717 | | | | 2,009 | | | | 69,646 | |
- In arrears 31 to 60 days | | | 1,686 | | | | 973 | | | | 116 | | | | 182 | | | | 15 | | | | 618 | |
- In arrears 61 to 90 days | | | 1,047 | | | | 613 | | | | 75 | | | | 137 | | | | 8 | | | | 366 | |
| | | | | | | | | | | | | | | | | | | | | | | | |
Non-performing loans | | | 2,719 | | | | 1,737 | | | | 231 | | | | 553 | | | | 23 | | | | 772 | |
| | | | | | | | | | | | | | | | | | | | | | | | |
NPL ratio | | | 1.74 | % | | | 2.41 | % | | | 0.88 | % | | | 7.25 | % | | | 1.11 | % | | | 1.08 | % |
| | | | | | | | | | | | | | | | | | | | | | | | |
Properties In possession | | | 128 | | | | 83 | | | | 9 | | | | 69 | | | | 2 | | | | 26 | |
| | | | | | | | | | | | | | | | | | | | | | | | |
| (1) | Where a loan exhibits more than one segment of particular interest, it is included in all applicable categories. As a result, the sum of the mortgage arrears in the segments of particular interest will not agree to the total mortgage arrears. |
| (2) | Interest-only loan segment contains both full interest-only and part-interest-only loans. |
| (3) | Includes legacy Alliance & Leicester flexible loan products with more limited functionality than the current Santander UK flexi loan product. |
| (4) | Includes other loans that are not in any segment of particular interest. |
2013 compared to 2012(unaudited)
In 2013, the NPL ratio increased from 1.74% to 1.88%, although the rate of increase slowed, compared to 2012. Interest-only and loans with a current LTV over 100% have a higher than average NPL ratio. The increase in the NPL ratio for interest-only loans in 2013 was due to loans that are not in payment arrears but matured over 90 days ago and have a balance remaining. Flexible loans and the Buy to Let portfolios remained better than average quality. Only 1.18% (2012: 0.88%) of flexible loan customers and 1.01% (2012: 1.11%) of Buy to Let customers are categorised as NPL.
Properties in possession decreased in 2013 across all risk segments of the portfolio as a result of favourable market conditions.
Forbearance (1) (2) (3) (4)
The incidence of the main types of higher risk loans forbearance arrangements which commenced during the year ended 31 December 2013 and 2012 was:
| | | | | | | | | | | | | | | | |
2013 | | Interest-only loans(4) | | | Flexible loans | | | Loans with current
LTV>100% | | | Buy-to-Let | |
Total value | | £ | 242m | | | £ | 61m | | | | — | | | £ | 3m | |
| | | | | | | | | | | | | | | | |
Proportion of portfolio(5) | | | 57 | % | | | 14 | % | | | — | | | | 1 | % |
| | | | | | | | | | | | | | | | |
| | | | |
2012 | | Interest-only loans(4) | | | Flexible loans | | | Loans with current
LTV>100% | | | Buy-to-Let | |
Total value | | £ | 416m | | | £ | 132m | | | | — | | | £ | 5m | |
| | | | | | | | | | | | | | | | |
Proportion of portfolio(5) | | | 58 | % | | | 18 | % | | | — | | | | 1 | % |
| | | | | | | | | | | | | | | | |
| (1) | Mortgages are included within the year that they were forborne. |
| (2) | The figures by year reflect the amount of forbearance activity undertaken during the year irrespective of whether any forbearance activity has previously been undertaken on the forborne accounts. |
| (3) | Where a loan exhibits more than one of the higher risk criteria, it is included in all the applicable categories. |
| (4) | Loans which are either full interest only or partial interest only are included. |
| (5) | Portfolio of total forbearance arrangements which commenced during the year. |
2013 compared to 2012(unaudited)
The values of higher risk loan entering forbearance arrangements in 2013 compared to 2012 has decreased in line with overall reductions seen in flows to forbearance in 2013.
| | |
| Santander UK plc Annual Report 2013 | | 103 |
Detailed Business Review
Risk Management Reportcontinued
BANKING AND CONSUMER CREDIT
Santander UK also provides overdrafts as part of bank accounts facilities, together with business banking, unsecured personal loans, credit cards (excluding the co-brand credit cards business) and consumer finance, including finance leases and other forms of consumer finance.
LENDING
An analysis of movements in banking and consumer credit loans and advances is presented below.
| | | | | | | | | | | | | | | | | | | | | | | | |
2013 | | Bank
Accounts
£m | | | Unsecured
Personal
Loans
£m | | | Credit
Cards
£m | | | Consumer
Finance
£m | | | Business
Banking
£m | | | Total
£m | |
At 1 January | | | 536 | | | | 2,344 | | | | 1,420 | | | | 3,109 | | | | 133 | | | | 7,542 | |
Net lending in the year | | | 7 | | | | (328 | ) | | | 259 | | | | 36 | | | | 18 | | | | (8 | ) |
| | | | | | | | | | | | | | | | | | | | | | | | |
At 31 December | | | 543 | | | | 2,016 | | | | 1,679 | | | | 3,145 | | | | 151 | | | | 7,534 | |
| | | | | | | | | | | | | | | | | | | | | | | | |
| | | | | | |
2012 | | Bank
Accounts
£m | | | Unsecured
personal
loans
£m | | | Credit
Cards(1)
£m | | | Consumer
Finance
£m | | | Business
Banking
£m | | | Total
£m | |
At 1 January | | | 548 | | | | 2,793 | | | | 1,298 | | | | 3,050 | | | | 93 | | | | 7,782 | |
Net lending in the year | | | (12 | ) | | | (449 | ) | | | 122 | | | | 59 | | | | 40 | | | | (240 | ) |
| | | | | | | | | | | | | | | | | | | | | | | | |
At 31 December | | | 536 | | | | 2,344 | | | | 1,420 | | | | 3,109 | | | | 133 | | | | 7,542 | |
| | | | | | | | | | | | | | | | | | | | | | | | |
| (1) | Adjusted to remove the co-brand credit cards business which was transferred to Corporate Centre prior to the completion of its sale in 2013 as set out in Note 12 to the Consolidated Financial Statements. |
2013 compared to 2012(unaudited)
Total net lending was stable at £7,534m in 2013, driven by a reduction in the unsecured personal loan portfolio, offset by increased lending in the credit card business.
CREDIT PERFORMANCE
| | | | | | | | | | | | | | | | | | | | | | | | |
2013 | | Bank
Accounts
£m | | | Unsecured
Personal
Loans
£m | | | Credit
Cards
£m | | | Consumer
Finance
£m | | | Business
Banking
£m | | | Total
£m | |
Loans and Advances | | | 543 | | | | 2,016 | | | | 1,679 | | | | 3,145 | | | | 151 | | | | 7,534 | |
Performing | | | 472 | | | | 1,940 | | | | 1,622 | | | | 3,130 | | | | 140 | | | | 7,304 | |
In arrears | | | 71 | | | | 76 | | | | 57 | | | | 15 | | | | 11 | | | | 230 | |
| | | | | | | | | | | | | | | | | | | | | | | | |
Non-performing loans(1) (2) | | | 44 | | | | 33 | | | | 41 | | | | 15 | | | | 15 | | | | 148 | |
| | | | | | | | | | | | | | | | | | | | | | | | |
NPLs that are impaired | | | 26 | | | | 29 | | | | 38 | | | | 11 | | | | 8 | | | | 112 | |
NPLs that are not impaired | | | 18 | | | | 4 | | | | 3 | | | | 4 | | | | 7 | | | | 36 | |
| | | | | | | | | | | | | | | | | | | | | | | | |
Impairment loss allowance | | | 51 | | | | 90 | | | | 86 | | | | 85 | | | | 16 | | | | 328 | |
| | | | | | | | | | | | | | | | | | | | | | | | |
NPL ratio(2) | | | | | | | | | | | | | | | | | | | | | | | 1.96 | % |
Coverage ratio(3) | | | | | | | | | | | | | | | | | | | | | | | 222 | % |
| | | | | | | | | | | | | | | | | | | | | | | | |
| | | | | | |
2012 | | Bank
Accounts
£m | | | Unsecured
Personal
Loans
£m | | | Credit
Cards(4)
£m | | | Consumer
Finance
£m | | | Business
Banking
£m | | | Total
£m | |
Loans and Advances | | | 536 | | | | 2,345 | | | | 1,420 | | | | 3,108 | | | | 133 | | | | 7,542 | |
Performing | | | 474 | | | | 2,237 | | | | 1,354 | | | | 3,094 | | | | 100 | | | | 7,259 | |
In arrears | | | 62 | | | | 108 | | | | 66 | | | | 14 | | �� | | 33 | | | | 283 | |
| | | | | | | | | | | | | | | | | | | | | | | | |
Non-performing loans(1) (2) | | | 41 | | | | 55 | | | | 42 | | | | 15 | | | | 10 | | | | 163 | |
| | | | | | | | | | | | | | | | | | | | | | | | |
NPLs that are impaired | | | 29 | | | | 53 | | | | 30 | | | | 12 | | | | 7 | | | | 131 | |
NPLs that are not impaired | | | 12 | | | | 2 | | | | 12 | | | | 3 | | | | 3 | | | | 32 | |
| | | | | | | | | | | | | | | | | | | | | | | | |
Impairment loss allowance | | | 50 | | | | 121 | | | | 86 | | | | 86 | | | | 13 | | | | 356 | |
| | | | | | | | | | | | | | | | | | | | | | | | |
NPL ratio(2) | | | | | | | | | | | | | | | | | | | | | | | 2.16 | % |
Coverage ratio(3) | | | | | | | | | | | | | | | | | | | | | | | 218 | % |
| | | | | | | | | | | | | | | | | | | | | | | | |
| (1) | Banking and consumer credit lending is classified as non-performing when the customer fails to make a payment when contractually due for three months or longer, or where it is deemed probable that this will occur in the near future or for accounts where fees and interest have been suspended. |
| (2) | NPL ratio is the NPL stock as a % of total loans and advances. |
| (3) | The coverage ratio is the total impairment loan loss allowances, as a % of NPL stock. Total loan loss allowances relate to early arrears and performing assets as well as accounts classified as NPL and hence the ratio exceeds 100%. |
| (4) | Adjusted to remove the co-brand credit cards business which was transferred to Corporate Centre prior to the completion of its sale in 2013 as set out in Note 12 to the Consolidated Financial Statements. |
2013 compared to 2012(unaudited)
In 2013, credit quality remained good. The value of NPLs reduced to £148m (2012: £163m) mainly due to the reduction in unsecured personal loans, as the older vintages with higher loss levels have almost matured, with most of the current asset base consisting of recent vintages, with higher credit quality. The NPL ratio reduced to 1.96% (2012: 2.16%), and the coverage ratio remained broadly stable at 222% (2012: 218%).
| | |
| 104 | | Santander UK plc Annual Report 2013 |
Detailed Business Review
Risk Management Reportcontinued
CREDIT RISK – COMMERCIAL BANKING
INTRODUCTION
Commercial Banking offers a wide range of products and financial services to customers through a network of regional Corporate Business Centres (‘CBCs’) and through telephony and e-commerce channels. It principally serves companies with annual turnover of more than £250,000 including Small and Medium Enterprises (‘SMEs’). Its products and services include loans, bank accounts, deposits, treasury services, invoice discounting, cash transmission and asset finance. The Large Corporates business offers specialist treasury services in fixed income and foreign exchange, lending, transactional banking services, capital markets and money markets to large multinational corporate customers. Lending includes syndicated loans and structured finance. Transactional banking services include trade finance and cash management. Money market activities include securities lending/borrowing and repos. Credit risk arises by Commercial Banking making loans, investing in other financial instruments or entering into financing transactions or derivatives.
COMMERCIAL BANKING – ASSETS
| | | | | | | | |
| | | 2013
£bn | | | 2012
£bn | |
Large Corporate – repos | | | 3.9 | | | | 9.9 | |
Sovereign | | | 1.8 | | | | 3.8 | |
Structured Finance | | | — | | | | 0.4 | |
Other Assets | | | 7.7 | | | | 2.0 | |
Customer Assets: | | | | | | | | |
- Large Corporate loans (excluding repos) | | | 3.1 | | | | 2.2 | |
- Mid Corporate & SME(1) | | | 14.9 | | | | 13.2 | |
- Social Housing(2) | | | 0.5 | | | | 0.2 | |
- Commercial Real Estate(1) | | | 3.3 | | | | 3.7 | |
Other(1)(3) | | | 0.3 | | | | 0.3 | |
| | | | | | | | |
Total(4) | | | 35.5 | | | | 35.7 | |
| | | | | | | | |
| (1) | Includes corporate loans classified as Loans and advances to customers in Note 19 to the Consolidated Financial Statements. |
| (2) | Consists of new loans and excludes historic Social Housing exposures managed in Corporate Centre. |
| (3) | Includes finance leases classified as Loans and advances to customers in Note 19 to the Consolidated Financial Statements. |
| (4) | Includes Operating lease assets in Note 26 to the Consolidated Financial Statements. |
In Commercial Banking, credit risk arises on asset balances and off-balance sheet transactions such as committed and undrawn credit facilities or guarantees. Consequently, committed exposures are typically higher than asset balances. However, in the following committed exposures tables, Sovereigns are presented net of short positions and include Sovereign exposures established for liquidity management purposes managed by Short Term Markets on behalf of Corporate Centre. Large Corporate reverse repos are presented net of repo liabilities and include OTC derivatives. As a result, the committed exposures are smaller than the asset balances above. In addition, in the committed exposures tables, commercial mortgages are included within Commercial Real Estate, which reflects the type of risk being monitored, whereas in the asset table above they are classified as SME to reflect the status of the borrower.
| | |
| Santander UK plc Annual Report 2013 | | 105 |
Detailed Business Review
Risk Management Reportcontinued
COMMERCIAL BANKING – COMMITTED EXPOSURES
Rating distribution
The rating distribution tables show the credit risk exposure by Santander UK’s internal rating scale (see page 88) for each portfolio within Commercial Banking. Within this scale, the higher the rating, the better the quality of the counterparty.
| | | | | | | | | | | | | | | | | | | | | | | | | | | | |
2013 | | Sovereign
£m | | | Large
Corporate
£m | | | Structured
Finance
£m | | | Mid Corporate
and SME
£m | | | Commercial
Real Estate
£m | | | Social Housing
£m | | | Total
£m | |
9 | | | 1,296 | | | | 24 | | | | — | | | | 200 | | | | 127 | | | | 263 | | | | 1,910 | |
8 | | | 3,893 | | | | 1,450 | | | | — | | | | 531 | | | | 320 | | | | 359 | | | | 6,553 | |
7 | | | 860 | | | | 4,083 | | | | 30 | | | | 2,248 | | | | 1,447 | | | | 231 | | | | 8,899 | |
6 | | | — | | | | 4,382 | | | | 6 | | | | 5,292 | | | | 4,263 | | | | 115 | | | | 14,058 | |
5 | | | — | | | | 1,722 | | | | 40 | | | | 2,633 | | | | 2,737 | | | | — | | | | 7,132 | |
4 | | | — | | | | 22 | | | | 72 | | | | 2,410 | | | | 683 | | | | — | | | | 3,187 | |
1 to 3 | | | — | | | | 1 | | | | 136 | | | | 247 | | | | 324 | | | | — | | | | 708 | |
Other(1) | | | — | | | | — | | | | 24 | | | | 518 | | | | 144 | | | | — | | | | 686 | |
| | | | | | | | | | | | | | | | | | | | | | | | | | | | |
Total | | | 6,049 | | | | 11,684 | | | | 308 | | | | 14,079 | | | | 10,045 | | | | 968 | | | | 43,133 | |
| | | | | | | | | | | | | | | | | | | | | | | | | | | | |
| | | | | | | |
2012 | | Sovereign
£m | | | Large
Corporate
£m | | | Structured
Finance
£m | | | Mid Corporate
and SME
£m | | | Commercial
Real Estate
£m | | | Social Housing
£m | | | Total
£m | |
9 | | | 1,132 | | | | 25 | | | | — | | | | 263 | | | | 236 | | | | 40 | | | | 1,696 | |
8 | | | 960 | | | | 361 | | | | — | | | | 697 | | | | 539 | | | | 112 | | | | 2,669 | |
7 | | | 66 | | | | 3,324 | | | | 32 | | | | 2,073 | | | | 2,117 | | | | 148 | | | | 7,760 | |
6 | | | — | | | | 5,244 | | | | 32 | | | | 4,786 | | | | 3,979 | | | | 115 | | | | 14,156 | |
5 | | | — | | | | — | | | | 35 | | | | 1,824 | | | | 1,339 | | | | — | | | | 3,198 | |
4 | | | — | | | | 471 | | | | 139 | | | | 1,751 | | | | 610 | | | | — | | | | 2,971 | |
1 to 3 | | | — | | | | 1 | | | | 101 | | | | 295 | | | | 661 | | | | — | | | | 1,058 | |
Other(1) | | | — | | | | — | | | | 24 | | | | 661 | | | | 319 | | | | — | | | | 1,004 | |
| | | | | | | | | | | | | | | | | | | | | | | | | | | | |
Total | | | 2,158 | | | | 9,426 | | | | 363 | | | | 12,350 | | | | 9,800 | | | | 415 | | | | 34,512 | |
| | | | | | | | | | | | | | | | | | | | | | | | | | | | |
| (1) | Represents smaller exposures predominantly within the commercial mortgages portfolio which are subject to scorecards rather than a rating model. |
Geographical distribution
The geographic location is classified by country of risk, being the country where each counterparty’s main business activity or assets are located. For clients whose operations are more geographically dispersed, the country of incorporation is applied.
| | | | | | | | | | | | | | | | | | | | | | | | | | | | |
2013 | | Sovereign
£m | | | Large
Corporate
£m | | | Structured
Finance
£m | | | Mid Corporate
and SME
£m | | | Commercial
Real Estate
£m | | | Social Housing
£m | | | Total
£m | |
UK | | | — | | | | 8,685 | | | | 108 | | | | 13,836 | | | | 10,045 | | | | 968 | | | | 33,642 | |
Peripheral eurozone | | | 860 | | | | 411 | | | | 20 | | | | 18 | | | | — | | | | — | | | | 1,309 | |
Rest of Europe | | | 1,029 | | | | 1,736 | | | | 75 | | | | 87 | | | | — | | | | — | | | | 2,927 | |
US | | | — | | | | 320 | | | | 105 | | | | — | | | | — | | | | — | | | | 425 | |
Rest of world | | | 4,160 | | | | 532 | | | | — | | | | 138 | | | | — | | | | — | | | | 4,830 | |
| | | | | | | | | | | | | | | | | | | | | | | | | | | | |
Total | | | 6,049 | | | | 11,684 | | | | 308 | | | | 14,079 | | | | 10,045 | | | | 968 | | | | 43,133 | |
| | | | | | | | | | | | | | | | | | | | | | | | | | | | |
| | | | | | | |
2012 | | Sovereign
£m | | | Large
Corporate
£m | | | Structured
Finance
£m | | | Mid Corporate
and SME
£m | | | Commercial
Real Estate
£m | | | Social Housing
£m | | | Total
£m | |
UK | | | — | | | | 7,519 | | | | 153 | | | | 11,948 | | | | 9,800 | | | | 415 | | | | 29,835 | |
Peripheral eurozone | | | — | | | | 263 | | | | 22 | | | | 78 | | | | — | | | | — | | | | 363 | |
Rest of Europe | | | 1,132 | | | | 1,269 | | | | 82 | | | | 96 | | | | — | | | | — | | | | 2,579 | |
US | | | — | | | | 266 | | | | 106 | | | | — | | | | — | | | | — | | | | 372 | |
Rest of world | | | 1,026 | | | | 109 | | | | — | | | | 228 | | | | — | | | | — | | | | 1,363 | |
| | | | | | | | | | | | | | | | | | | | | | | | | | | | |
Total | | | 2,158 | | | | 9,426 | | | | 363 | | | | 12,350 | | | | 9,800 | | | | 415 | | | | 34,512 | |
| | | | | | | | | | | | | | | | | | | | | | | | | | | | |
| | |
| 106 | | Santander UK plc Annual Report 2013 |
Detailed Business Review
Risk Management Reportcontinued
Maturity profile(unaudited)
The table below shows the residual maturity for each portfolio.
| | | | | | | | | | | | | | | | | | | | | | | | | | | | |
2013 | | Sovereign
£m | | | Large
Corporate
£m | | | Structured
Finance
£m | | | Mid Corporate
and SME
£m | | | Commercial
Real Estate
£m | | | Social Housing
£m | | | Total
£m | |
<=1 year | | | 5,174 | | | | 3,712 | | | | 110 | | | | 1,892 | | | | 1,360 | | | | — | | | | 12,248 | |
>1 to 5 years | | | 874 | | | | 5,742 | | | | 152 | | | | 7,679 | | | | 7,383 | | | | 296 | | | | 22,126 | |
>5 to 8 years | | | — | | | | 623 | | | | — | | | | 1,418 | | | | 369 | | | | 4 | | | | 2,414 | |
>8 to 10 years | | | — | | | | 82 | | | | — | | | | 635 | | | | 159 | | | | 255 | | | | 1,131 | |
>10 to 15 years | | | 1 | | | | 1,042 | | | | 46 | | | | 432 | | | | 266 | | | | 27 | | | | 1,814 | |
>15 years | | | — | | | | 483 | | | | — | | | | 2,023 | | | | 508 | | | | 386 | | | | 3,400 | |
| | | | | | | | | | | | | | | | | | | | | | | | | | | | |
Total | | | 6,049 | | | | 11,684 | | | | 308 | | | | 14,079 | | | | 10,045 | | | | 968 | | | | 43,133 | |
| | | | | | | | | | | | | | | | | | | | | | | | | | | | |
| | | | | | | |
2012 | | Sovereign
£m | | | Large
Corporate
£m | | | Structured
Finance
£m | | | Mid Corporate
and SME
£m | | | Commercial
Real Estate
£m | | | Social Housing
£m | | | Total
£m | |
<=1 year | | | 2,150 | | | | 3,526 | | | | 137 | | | | 2,463 | | | | 2,236 | | | | 20 | | | | 10,532 | |
>1 to 5 years | | | 8 | | | | 4,260 | | | | 173 | | | | 5,705 | | | | 6,412 | | | | 71 | | | | 16,629 | |
>5 to 8 years | | | — | | | | 210 | | | | — | | | | 1,179 | | | | 209 | | | | — | | | | 1,598 | |
>8 to 10 years | | | — | | | | 87 | | | | — | | | | 571 | | | | 158 | | | | 106 | | | | 922 | |
>10 to 15 years | | | — | | | | 790 | | | | 53 | | | | 412 | | | | 283 | | | | — | | | | 1,538 | |
>15 years | | | — | | | | 553 | | | | — | | | | 2,020 | | | | 502 | | | | 218 | | | | 3,293 | |
| | | | | | | | | | | | | | | | | | | | | | | | | | | | |
Total | | | 2,158 | | | | 9,426 | | | | 363 | | | | 12,350 | | | | 9,800 | | | | 415 | | | | 34,512 | |
| | | | | | | | | | | | | | | | | | | | | | | | | | | | |
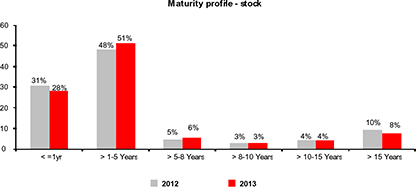
2013 compared to 2012(unaudited)
During 2013, total committed exposures increased by £8.6bn or 25% to £43bn principally within the Sovereign, Large Corporate, and Mid Corporate and SME portfolios.
The increase in Sovereign holdings reflected the development of the business in this area. The increased exposures were mainly in the rating 8 category, most of which were in Japan Sovereign, as part of normal liquid asset portfolio management. The increase in rating 7 exposures reflected the purchase of Italian Government bonds with less than one year maturity as part of short-term markets trading activity. The portfolio profile remained primarily short-term (up to 1 year), reflecting the purpose of the holdings as part of normal liquid asset portfolio management and short-term markets trading activity. As a consequence, this band increased in line with the portfolio growth.
Large Corporate exposures increased by 24% as a result of the development of the franchise focused in high-rated multinational companies. Growth was focused on the UK, with some diversification in other European and non-European countries with counterparties with good credit quality and is primarily short to medium term up to 5 years, providing financial products to support the working capital and liquidity needs of our clients. The maturity profile of the portfolio remained broadly unchanged during 2013.
No new positions were taken in the Structured Finance portfolio. The reduction in exposure reflected the exit from transactions on maturity or through debt sales. As a consequence the maturity profile remained unchanged.
The Mid Corporate and SME portfolio grew by 14%, reflecting the continued development of the franchise especially in the SME segment. This was reflected in the rise in the mid range rating bands as this is where counterparties in this segment typically rate. The portfolio profile is predominantly short to medium-term (up to 5 years) reflecting the type of finance provided to these clients to fund working capital and asset purchases. As a consequence, these bands increased in line with the portfolio growth.
Commercial Real Estate portfolio remained broadly stable with new business largely in the 5 rating band being offset by repayments of maturing loans which saw a greater proportion of higher-rated exposure repaid as investors sought to realise gains on higher performing assets rather than extend their loans. Funding in the Commercial Real Estate market continues to be undertaken over medium-term time horizons, where maturing facilities are being replaced by loans typically over a 5 year term. This was reflected in the increase in the >1 to 5 year banding offsetting a similar decrease in deals nearing maturity (<=1 year).
The Social Housing portfolio grew through selective opportunities to write new business with highly rated counterparties.
Funding in the Social Housing market continued to see a shift away from longer term loans to medium term advances, although an element of longer-dated exposure have on occasion still featured as part of an overall package offered to clients seeking new funds.
COMMERCIAL BANKING – CREDIT RISK MITIGATION
At 31 December 2013, collateral held against impaired loans amounted to 47% (2012: 55%) of the carrying amount of impaired loan balances.
| | |
| Santander UK plc Annual Report 2013 | | 107 |
Detailed Business Review
Risk Management Reportcontinued
COMMERCIAL BANKING – CREDIT PERFORMANCE
Exposures exhibiting potentially higher risk characteristics are subject to risk monitoring under the Watchlist process (described in “The Credit Cycle” section under “Risk monitoring” on page 76). The table below sets out the portfolio showing exposures subject to risk monitoring under the Watchlist process and those classified as non-performing by portfolio at 31 December 2013 and 2012:
| | | | | | | | | | | | | | | | | | | | | | | | | | | | |
2013 | | Sovereign
£m | | | Large
Corporate
£m | | | Structured
Finance
£m | | | Mid Corporate
and SME
£m | | | Commercial
Real Estate
£m | | | Social
Housing
£m | | | Total
£m | |
Total Committed Exposure of which:(1) | | | 6,049 | | | | 11,684 | | | | 308 | | | | 14,079 | | | | 10,045 | | | | 968 | | | | 43,133 | |
-Watchlist: Enhanced Monitoring | | | — | | | | 231 | | | | 52 | | | | 629 | | | | 295 | | | | 35 | | | | 1,242 | |
-Watchlist: Proactive Management | | | — | | | | — | | | | 132 | | | | 288 | | | | 357 | | | | — | | | | 777 | |
-Remaining Performing Exposure | | | 6,049 | | | | 11,453 | | | | 105 | | | | 12,821 | | | | 9,074 | | | | 933 | | | | 40,435 | |
Subtotal Performing Exposure | | | 6,049 | | | | 11,684 | | | | 289 | | | | 13,738 | | | | 9,726 | | | | 968 | | | | 42,454 | |
Non-Performing Exposure(2) | | | — | | | | — | | | | 19 | | | | 341 | | | | 319 | | | | — | | | | 679 | |
| | | | | | | | | | | | | | | | | | | | | | | | | | | | |
Total Impaired Exposure of which: (3) | | | — | | | | — | | | | 203 | | | | 1,259 | | | | 970 | | | | 35 | | | | 2,467 | |
-Performing – Watchlist | | | — | | | | — | | | | 184 | | | | 918 | | | | 651 | | | | 35 | | | | 1,788 | |
-Non Performing Exposure(2) | | | — | | | | — | | | | 19 | | | | 341 | | | | 319 | | | | — | | | | 679 | |
| | | | | | | | | | | | | | | | | | | | | | | | | | | | |
Total Observed impairment loss allowances of which:(4) | | | — | | | | — | | | | 72 | | | | 148 | | | | 119 | | | | — | | | | 339 | |
-Performing – Watchlist | | | — | | | | — | | | | 64 | | | | 24 | | | | 12 | | | | — | | | | 100 | |
-Non-Performing Exposure(2) | | | — | | | | — | | | | 8 | | | | 124 | | | | 107 | | | | — | | | | 239 | |
| | | | | | | | | | | | | | | | | | | | | | | | | | | | |
IBNO(5)(6) | | | | | | | | | | | | | | | | | | | | | | | | | | | 17 | |
Total Impairment loss allowance | | | | | | | | | | | | | | | | | | | | | | | | | | | 356 | |
| | | | | | | | | | | | | | | | | | | | | | | | | | | | |
| | | | | | | |
2012 | | Sovereign
£m | | | Large
Corporate
£m | | | Structured
Finance
£m | | | Mid Corporate
and SME
£m | | | Commercial
Real Estate
£m | | | Social
Housing
£m | | | Total
£m | |
Total Committed Exposure of which:(1) | | | 2,158 | | | | 9,426 | | | | 363 | | | | 12,350 | | | | 9,800 | | | | 415 | | | | 34,512 | |
-Watchlist: Enhanced Monitoring | | | — | | | | 163 | | | | 72 | | | | 798 | | | | 376 | | | | — | | | | 1,409 | |
-Watchlist: Proactive Management | | | — | | | | — | | | | 161 | | | | 397 | | | | 397 | | | | — | | | | 955 | |
-Remaining Performing Exposure | | | 2,158 | | | | 9,263 | | | | 112 | | | | 10,808 | | | | 8,531 | | | | 415 | | | | 31,287 | |
Subtotal Performing Exposure | | | 2,158 | | | | 9,426 | | | | 345 | | | | 12,003 | | | | 9,304 | | | | 415 | | | | 33,651 | |
Non-Performing Exposure(2) | | | — | | | | — | | | | 18 | | | | 347 | | | | 496 | | | | — | | | | 861 | |
| | | | | | | | | | | | | | | | | | | | | | | | | | | | |
Total Impaired Exposure of which: (3) | | | — | | | | — | | | | 234 | | | | 1,542 | | | | 1,269 | | | | — | | | | 3,045 | |
-Performing – Watchlist | | | — | | | | — | | | | 216 | | | | 1,195 | | | | 773 | | | | — | | | | 2,184 | |
-Non-Performing Exposure(2) | | | — | | | | — | | | | 18 | | | | 347 | | | | 496 | | | | — | | | | 861 | |
| | | | | | | | | | | | | | | | | | | | | | | | | | | | |
Total Observed impairment loss allowances of which:(4) | | | — | | | | — | | | | 77 | | | | 151 | | | | 159 | | | | — | | | | 387 | |
-Performing – Watchlist | | | — | | | | — | | | | 73 | | | | 22 | | | | 29 | | | | — | | | | 124 | |
-Non-Performing Exposure(2) | | | — | | | | — | | | | 4 | | | | 129 | | | | 130 | | | | — | | | | 263 | |
| | | | | | | | | | | | | | | | | | | | | | | | | | | | |
IBNO(5)(6) | | | | | | | | | | | | | | | | | | | | | | | | | | | 20 | |
Total Impairment loss allowance | | | | | | | | | | | | | | | | | | | | | | | | | | | 407 | |
| | | | | | | | | | | | | | | | | | | | | | | | | | | | |
| (1) | Includes committed facilities and swaps. |
| (2) | Non Performing Exposure in the table above include committed facilities and derivative exposures and therefore are larger than the NPLs in the table below which only include drawn balances. All the Non Performing Loans are impaired following a change in provision approach in 2012. |
| (3) | Corporate loans are assessed individually or collectively assessed for impairment. Assets reported as impaired represent, for collective assessment, that portion of the loan portfolio where it is estimated that a loss will occur, plus those assets individually impaired. |
| (4) | Excludes IBNO provision. |
| (5) | Allowance for incurred inherent losses (i.e. incurred but not observed (‘IBNO’)) as described in Note 1 to the Consolidated Financial Statements. |
| (6) | There is no impairment allowance attributable to Sovereign and to Large Corporate. |
Non-performing loans and advances(1) (2)
An analysis of Commercial Banking NPLs is presented below.
| | | | | | | | |
| | | 2013
£m | | | 2012
£m | |
Loans and advances to customers of which:(2) | | | 22,075 | | | | 19,605 | |
Customers in Arrears(3) | | | 663 | | | | 795 | |
Commercial Banking NPLs - impaired(3)(4)(5) | | | 666 | | | | 835 | |
Commercial Banking NPLs - not impaired(3)(4) | | | — | | | | — | |
| | | | | | | | |
Commercial Banking NPLs | | | 666 | | | | 835 | |
| | | | | | | | |
Impairment loan loss allowances | | | 356 | | | | 407 | |
| | | | | | | | |
| | |
| | | % | | | % | |
Arrears ratio(6) | | | 3.00 | | | | 4.06 | |
NPLs ratio(7) | | | 3.02 | | | | 4.26 | |
Coverage ratio(8) | | | 53 | | | | 49 | |
| | | | | | | | |
| (1) | Loans and advances are classified as non-performing typically when the counterparty fails to make payments when contractually due for three months or where it is deemed probable that this will occur in the near future. |
| (2) | Commercial Banking loans and advances to customers include finance leases. |
| (3) | All Commercial Banking balances are UK and continue accruing interest. For the data presented, the balances include interest charged to the customer’s account, but exclude interest accrued but not yet charged to the account. |
| (4) | All the Non Performing Loans are impaired following a change in provision approach in 2012. |
| (5) | NPLs against which an impairment loss allowance has been established. |
| (6) | Commercial Banking loans and advances to customers in arrears as a percentage of Commercial Banking loans and advances to customers. |
| (7) | Commercial Banking NPLs as a percentage of Commercial Banking loans and advances to customers. |
| (8) | Impairment loan loss allowances as a percentage of NPLs. |
| | |
| 108 | | Santander UK plc Annual Report 2013 |
Detailed Business Review
Risk Management Reportcontinued
Movements in NPLs during the year are set out in the graphs below. Transfers in represent loans which have become classified as NPLs during the year. Exits (including loan repayments) represent that element of loans to customers that have been repaid (in full or in part) plus those returned to performing status. Write-offs represent the unrecovered element of a loan where recovery options, including realisation of any collateral, have been exhausted. Forbearance activity does not result in a change in the NPL status.
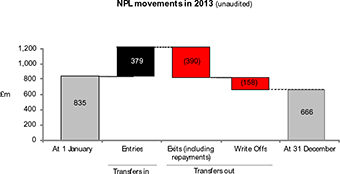
2013 compared to 2012(unaudited)
During 2013, Watchlist and NPLs exposures decreased across all portfolios, as older cases were either successfully returned to performing status or were forborne, in some cases through to an exit. In the Sovereign, Large Corporate and Social Housing portfolios, there were no exposures subject to proactive management with only 1.4% (2012: 1.4%) of exposure subject to enhanced monitoring. In the Commercial Real Estate portfolio, the overall level of Watchlist exposure decreased, particularly in enhanced monitoring, as older cases continued to be worked out. In the Mid Corporate and SME portfolio, the overall level of Watchlist exposure decreased, driven by a 27% fall in proactive management as cases were successfully managed through the process.
Loans and advances to customers in arrears decreased to £663m (2012: £795m) as older NPL cases were either successfully returned to performing status or were forborne, in some cases through to an exit. Early arrears levels remained at a consistent level. Consequently, loans and advances to customers in arrears as a percentage of loans and advances to customers decreased to 3.00% (2012: 4.06%).
During 2013, the NPLs ratio decreased to 3.02% (2012: 4.26%) as the credit quality in newer loan vintages remained strong. The decrease reflected lower levels of NPLs entries as well as higher exits and write offs as a number of older vintage exposure within the Mid Corporate and SME, and Commercial Real Estate portfolios continued to be worked out, combined with the overall growth in the portfolio.
In 2013, interest income recognised on impaired loans amounted to £15m (2012: £14m, 2011: £13m).
| | |
| Santander UK plc Annual Report 2013 | | 109 |
Detailed Business Review
Risk Management Reportcontinued
COMMERCIAL BANKING LOANS – FORBEARANCE
Forbearance commenced during the year (1)
No arrangements have been entered into with respect to Sovereign, Large Corporate, Structured Finance or Social Housing counterparties. The exposures that entered forbearance during the years ended 31 December 2013 and 2012 were:
| | | | | | | | | | | | |
2013 | | Mid Corporate
and SME
£m | | | Commercial
Real Estate
£m | | | Total
£m | |
Forbearance of NPL | | | 30 | | | | 33 | | | | 63 | |
Forbearance of Non-NPL | | | 60 | | | | 105 | | | | 165 | |
| | | | | | | | | | | | |
| | | 90 | | | | 138 | | | | 228 | |
| | | | | | | | | | | | |
| | | |
2012 | | Mid Corporate
and SME
£m | | | Commercial
Real Estate
£m | | | Total
£m | |
Forbearance of NPL | | | 46 | | | | 21 | | | | 67 | |
Forbearance of Non-NPL | | | 94 | | | | 161 | | | | 255 | |
| | | | | | | | | | | | |
| | | 140 | | | | 182 | | | | 322 | |
| | | | | | | | | | | | |
| (1) | The figures by year reflect the amount of forbearance activity undertaken during the year irrespective of whether any forbearance activity has previously been undertaken on the forborne accounts. |
Forbearance cumulative position
a) Performance status when entering forbearance
The status of forborne exposures at 31 December 2013 and 2012 when they originally entered forbearance, analysed by their payment status, was:
| | | | | | | | | | | | | | | | |
2013 | | Forbearance of NPL
£m | | | Forbearance of Non-NPL
£m | | | Total
£m | | | Impairment allowance
£m | |
Performing | | | — | | | | 728 | | | | 728 | | | | 84 | |
In arrears | | | 196 | | | | — | | | | 196 | | | | 50 | |
| | | | | | | | | | | | | | | | |
Total | | | 196 | | | | 728 | | | | 924 | | | | 134 | |
| | | | | | | | | | | | | | | | |
| | | | |
2012 | | Forbearance of NPL
£m | | | Forbearance of Non-NPL
£m | | | Total
£m | | | Impairment allowance
£m | |
Performing | | | — | | | | 956 | | | | 956 | | | | 89 | |
In arrears | | | 144 | | | | — | | | | 144 | | | | 32 | |
| | | | | | | | | | | | | | | | |
Total | | | 144 | | | | 956 | | | | 1,100 | | | | 121 | |
| | | | | | | | | | | | | | | | |
b) Performance status at the year-end
The current status of forborne exposures analysed by their payment status, at 31 December 2013 and 2012 was:
| | | | | | | | | | | | | | | | |
2013 | | Forbearance of NPL
£m | | | Forbearance of Non-NPL
£m | | | Total
£m | | | Impairment allowance
£m | |
Performing | | | 70 | | | | 516 | | | | 586 | | | | 21 | |
In arrears | | | 126 | | | | 212 | | | | 338 | | | | 113 | |
| | | | | | | | | | | | | | | | |
Total | | | 196 | | | | 728 | | | | 924 | | | | 134 | |
| | | | | | | | | | | | | | | | |
| | | | |
2012 | | Forbearance of NPL
£m | | | Forbearance of Non-NPL
£m | | | Total
£m | | | Impairment allowance
£m | |
Performing | | | 76 | | | | 644 | | | | 720 | | | | 13 | |
In arrears | | | 68 | | | | 312 | | | | 380 | | | | 108 | |
| | | | | | | | | | | | | | | | |
Total | | | 144 | | | | 956 | | | | 1,100 | | | | 121 | |
| | | | | | | | | | | | | | | | |
| | |
| 110 | | Santander UK plc Annual Report 2013 |
Detailed Business Review
Risk Management Reportcontinued
This data may be further analysed by portfolio, as follows:
Mid Corporate and SMEs
| | | | | | | | | | | | | | | | |
2013 | | Forbearance of NPL
£m | | | Forbearance of Non-NPL
£m | | | Total
£m | | | Impairment allowance
£m | |
Performing | | | 45 | | | | 150 | | | | 195 | | | | 6 | |
In arrears | | | 61 | | | | 82 | | | | 143 | | | | 55 | |
| | | | | | | | | | | | | | | | |
Total | | | 106 | | | | 232 | | | | 338 | | | | 61 | |
| | | | | | | | | | | | | | | | |
| | | | |
2012 | | Forbearance of NPL
£m | | | Forbearance of Non-NPL
£m | | | Total
£m | | | Impairment allowance
£m | |
Performing | | | 40 | | | | 228 | | | | 268 | | | | 7 | |
In arrears | | | 42 | | | | 98 | | | | 140 | | | | 38 | |
| | | | | | | | | | | | | | | | |
Total | | | 82 | | | | 326 | | | | 408 | | | | 45 | |
| | | | | | | | | | | | | | | | |
Commercial Real Estate
| | | | | | | | | | | | | | | | |
2013 | | Forbearance of NPL
£m | | | Forbearance of Non-NPL
£m | | | Total
£m | | | Impairment allowance
£m | |
Performing | | | 25 | | | | 367 | | | | 392 | | | | 15 | |
In arrears | | | 65 | | | | 130 | | | | 195 | | | | 58 | |
| | | | | | | | | | | | | | | | |
Total | | | 90 | | | | 497 | | | | 587 | | | | 73 | |
| | | | | | | | | | | | | | | | |
| | | | |
2012 | | Forbearance of NPL
£m | | | Forbearance of Non-NPL
£m | | | Total
£m | | | Impairment allowance
£m | |
Performing | | | 36 | | | | 416 | | | | 452 | | | | 7 | |
In arrears | | | 26 | | | | 214 | | | | 240 | | | | 69 | |
| | | | | | | | | | | | | | | | |
Total | | | 62 | | | | 630 | | | | 692 | | | | 76 | |
| | | | | | | | | | | | | | | | |
2013 compared to 2012(unaudited)
The incidence of forbearance that commenced in the year, which principally related to exposure originated in the pre-2009 vintage, decreased as businesses became more effective at adapting to the challenging trading environment without the need to seek forbearance. This was consistent with the trend in Watchlist exposure which also exhibited reduced volumes during the year.
The volume of forbearance decreased both in the Commercial Real Estate and Mid Corporate and SME portfolios as a number of pre-2009 cases continued to work their way through the process.
Accounts that are in forbearance continue to be closely monitored, to ensure that the forbearance arrangements are sustainable. Not all forbearance will prove effective, and in certain circumstances, market conditions may lead either to a case remaining in NPL even post-forbearance or to the need for a second forbearance action as, for example, in the case of Commercial Real Estate where it remains difficult to sell or refinance certain properties.
At 31 December 2013, 63% (2012: 65%) of forborne exposure was performing in accordance with the revised terms agreed under the forbearance arrangements. At 31 December 2013, 36% (2012: 53%) of forborne exposures that were in NPL at the time of forbearance were performing in accordance with the revised terms agreed under the forbearance arrangements.
The level of compliance with revised terms agreed under forbearance arrangements is influenced by market conditions and, as a consequence of the current economic environment, it is taking longer for cases to return to performing status after forbearance. Those cases where forbearance occurs prior to default, which at 31 December 2013 represented 79% (2012: 87%) of exposure, are generally more effective as highlighted in the tables above. A higher proportion of pre-NPL forbearance is now performing than is the case for post-NPL forbearance, demonstrating that early action is effective in reducing exposure moving into NPL.
Forborne exposures are assessed for observed impairment loss allowances. The greater probability of a loss when compared to the performing book is reflected in the calculation of impairment loss allowances.
A customer’s ability to adhere to any revised terms agreed is an indicator of the sustainability of Santander UK’s forbearance arrangements, although the forbearance is unlikely to be successful in all cases.
Debt-for-equity swaps(unaudited)
In addition to the forbearance activities shown above, Santander UK has on occasion entered into a small number of transactions where, Santander UK agreed to exchange a proportion of the amount owed by the borrower for equity in that borrower. This arises in circumstances where a borrower’s balance sheet is materially over-leveraged but the underlying business is viewed as capable of being turned around. This will typically only be done alongside new cash equity being raised, the implementation of a detailed business plan to effect a turnaround in the prospects of the business, and satisfaction with management’s ability to deliver the strategy.
These debt-for-equity swaps amounted to £46m at 31 December 2013 (2012: £46m) and in view of their small size are not included in these analyses.
Financial assets that would otherwise be past due or impaired
At 31 December 2013, the carrying amount of financial assets that would otherwise be past due or impaired whose terms have been forborne was £70m (2012: £76m).
| | |
| Santander UK plc Annual Report 2013 | | 111 |
Detailed Business Review
Risk Management Reportcontinued
HIGHER RISK LOANS AND OTHER SEGMENTS OF PARTICULAR INTEREST
The Commercial Real Estate market has experienced a particularly challenging environment over recent years following the financial crisis. Within this sector, Commercial Real Estate loans originated prior to 2009 represent a segment of relatively higher risk.
Credit performance
Commercial Real Estate non-performing exposures and weighted average LTVs at 31 December 2013 and 2012 may be further analysed between loans originated pre-2009 and thereafter as follows:
| | | | | | | | | | | | |
| | | Original vintage | | | | |
2013 | | Pre-2009 | | | 2009-2013 | | | Total | |
Total committed exposure | | £ | 1,569m | | | £ | 8,476m | | | £ | 10,045m | |
Non-performing exposure ratio | | | 18.8 | % | | | 0.3 | % | | | 3.2 | % |
Weighted average LTV | | | 74 | % | | | 53 | % | | | 56 | % |
| | | | | | | | | | | | |
| | | Original vintage | | | | |
2012 | | Pre-2009 | | | 2009-2012 | | | Total | |
Total committed exposure | | £ | 2,463m | | | £ | 7,337m | | | £ | 9,800m | |
Non-performing exposure ratio | | | 19.5 | % | | | 0.2 | % | | | 5.0 | % |
Weighted average LTV | | | 64 | % | | | 49 | % | | | 52 | % |
| | | | | | | | | | | | |
2013 compared to 2012(unaudited)
At 31 December 2013, 92% (2012: 97%) of the non-performing exposures related to deals originated pre-2009. The pre-2009 vintage loans were written on terms prevailing in the market at that time which, compared to more recent times, included higher original LTVs, lower interest coverage and exposure to development or letting risk. Following the significant downturn in the commercial real estate market in 2008 and 2009, some of these customers suffered financial stresses resulting in their inability to meet the contractual payment terms or to comply with covenants or to achieve refinancing/repayment at maturity. As a result, the pre-2009 sub-portfolio has experienced higher NPL rates in recent years.
In light of the market deterioration, Santander UK’s lending criteria were significantly tightened from 2009 onwards, with lower LTVs and the avoidance of transactions with material letting or development risks (at 31 December 2013, this element of the portfolio represented only 4% of the total Commercial Real Estate portfolio). In addition, while the market remains challenging, prices have not declined significantly further since Santander UK’s lending criteria were tightened. As a result, the sub-portfolio representing loans originating from 2009 onwards continues to perform significantly better than the pre-2009 sub-portfolio which continues to decline both in absolute terms and as a proportion of the total Commercial Real Estate portfolio. At 31 December 2013, the pre-2009 sub-portfolio represented 15% (2012: 25%) of the total Commercial Real Estate portfolio.
Further detail on the entire Commercial Real Estate portfolio is contained in the following section.
| | |
| 112 | | Santander UK plc Annual Report 2013 |
Detailed Business Review
Risk Management Reportcontinued
Commercial Real Estate loans
The Commercial Real Estate portfolio remained well diversified by sector at 31 December 2013 and 2012, as set out below.
| | | | | | | | |
Sector | | 2013
% | | | 2012
% | |
Office | | | 26 | | | | 27 | |
Retail | | | 23 | | | | 23 | |
Industrial | | | 13 | | | | 9 | |
Residential | | | 10 | | | | 7 | |
Mixed Use | | | 9 | | | | 9 | |
Student Accommodation | | | 6 | | | | 7 | |
Hotels & Leisure | | | 6 | | | | 7 | |
Other | | | 7 | | | | 11 | |
| | | | | | | | |
| | | 100 | | | | 100 | |
| | | | | | | | |
Loan-to-value analysis
In Commercial Real Estate lending, the main form of credit mitigation is collateral. The table below analyses the loan to value ratios of loans within the Commercial Real Estate portfolio at 31 December 2013 and 2012. The LTV distribution is presented for the Non-Standardised portfolio, which at £8.4bn represented 84% of the total Commercial Real Estate portfolio at 31 December 2013. The residual element of the portfolio consists of smaller value transactions largely in the form of commercial mortgages for which valuations are only available at the point of origination. These loans have therefore been excluded from the analysis below.
| | | | | | | | |
2013 | | Stock
% | | | New Business
% | |
Up to 50% | | | 33 | | | | 26 | |
50% to 60% | | | 36 | | | | 47 | |
60% to 70% | | | 18 | | | | 22 | |
70% to 80% | | | 6 | | | | 5 | |
80% to 90% | | | 3 | | | | — | |
90% to 100% | | | — | | | | — | |
> 100% i.e. negative equity(1) | | | 4 | | | | — | |
| | | | | | | | |
Total | | | 100 | | | | 100 | |
| | | | | | | | |
| (1) | NPL exposure predominantly (95%) fall into the > 100% band in the table. |
| | | | | | | | |
2012 | | Stock
% | | | New Business
% | |
Up to 50% | | | 30 | | | | 23 | |
50% to 60% | | | 36 | | | | 54 | |
60% to 70% | | | 20 | | | | 19 | |
70% to 80% | | | 5 | | | | 1 | |
80% to 90% | | | 3 | | | | 3 | |
90% 100% | | | 1 | | | | — | |
> 100% i.e. negative equity | | | 5 | | | | — | |
| | | | | | | | |
Total | | | 100 | | | | 100 | |
| | | | | | | | |
2013 compared to 2012(unaudited)
At 31 December 2013, the profile of the portfolio remained conservative in terms of LTV with 69% (2012: 66%) of the portfolio at or below 60% LTV. This reflected the more recent vintage of the portfolio with 84% (2012: 75%) originated in 2009 or subsequent years. The majority of higher LTV deals represent older deals which remain in the portfolio.
New business is rarely written above 70% LTV and the increase within the 70% to 80% band in the year represented a change in contractual terms of two legacy deals onto more conservative terms, including the provision of additional collateral, albeit at the higher end of preferred risk appetite. The majority of the cases with negative equity form part of the forborne element of the portfolio and are managed by the Restructuring & Recoveries team.
At 31 December 2013 the average LTV, weighted by exposure, was 56% (2012: 52%). The weighted average LTV of new deals written in 2013 was 54% (2012: 51%).
Refinancing risk
As part of the annual review process, for commercial real estate loans that are approaching maturity, consideration is given to the prospects of refinancing the loan at prevailing market terms and applicable credit policy. The review will consider this and other aspects (e.g. covenant compliance) which could result in the case being placed on the Watchlist. Additionally, where an acceptable refinancing proposal has not been received within six months prior to maturity, the case will be placed on the Watchlist.
At 31 December 2013, there was £852m of commercial real estate loans due to mature within 12 months. Of these, £320m (38%) have an LTV ratio above that which would be considered acceptable under current credit policy, of which £313m has been placed on the Watchlist or recorded as NPL and has an impairment loss allowance of £62m associated with it.
| | |
| Santander UK plc Annual Report 2013 | | 113 |
Detailed Business Review
Risk Management Reportcontinued
CREDIT RISK – MARKETS
INTRODUCTION
Markets offers risk management and other services to financial institutions, as well as other Santander UK divisions. Its main product areas are fixed income and foreign exchange, equity, capital markets and institutional sales. Credit risk arises by Markets entering into derivatives or financing transactions, or investing in other financial instruments.
MARKETS – ASSETS
| | | | | | | | |
| | | 2013
£bn | | | 2012
£bn | |
Derivatives | | | 16.8 | | | | 26.3 | |
UK Treasury bills, equities and other | | | 2.5 | | | | 1.9 | |
| | | | | | | | |
Total | | | 19.3 | | | | 28.2 | |
| | | | | | | | |
Derivative risk exposures are set out in the tables below. Derivatives in the asset table above relate to the derivative assets held on the balance sheet, where only netting permitted by IAS 32 can be applied. The derivative risk exposures in the tables below are lower than the balance sheet position because the overall risk exposure is monitored and therefore consideration is taken of margin posted, Credit Support Annexes within ISDA Master Agreements, and master netting agreements and instruments such as reverse repos which reduce the Santander UK group’s exposures.
MARKETS – COMMITTED EXPOSURES
Rating and geographical distribution
The tables below reflect the total credit risk exposures of Markets by internal rating scale (see page 88) and by geographical areas. The exposures include committed facilities as well as the uncommitted drawn facilities. The geographic location is defined as the counterparty’s country of domicile except where a full risk transfer guarantee is in place, in which case the country of domicile of the guarantor is used.
| | | | | | | | | | | | | | | | | | | | | | | | |
2013 | | UK
£m | | | Peripheral eurozone
£m | | | Rest of Europe
£m | | | US
£m | | | Rest of world
£m | | | Total
£m | |
9 | | | — | | | | — | | | | 2 | | | | — | | | | 56 | | | | 58 | |
8 | | | 1,410 | | | | 10 | | | | 897 | | | | 746 | | | | 87 | | | | 3,150 | |
7 | | | 1,064 | | | | 582 | | | | 169 | | | | 227 | | | | — | | | | 2,042 | |
6 | | | 76 | | | | 3 | | | | — | | | | 23 | | | | — | | | | 102 | |
5 | | | 1 | | | | 5 | | | | 11 | | | | — | | | | 1 | | | | 18 | |
4 | | | — | | | | — | | | | — | | | | — | | | | — | | | | — | |
1 to 3 | | | 28 | | | | — | | | | — | | | | — | | | | — | | | | 28 | |
| | | | | | | | | | | | | | | | | | | | | | | | |
Total | | | 2,579 | | | | 600 | | | | 1,079 | | | | 996 | | | | 144 | | | | 5,398 | |
| | | | | | | | | | | | | | | | | | | | | | | | |
| | | | | | |
2012 | | UK
£m | | | Peripheral eurozone
£m | | | Rest of Europe
£m | | | US
£m | | | Rest of world
£m | | | Total
£m | |
9 | | | — | | | | — | | | | 18 | | | | — | | | | 20 | | | | 38 | |
8 | | | 2 | | | | — | | | | 20 | | | | — | | | | 199 | | | | 221 | |
7 | | | 1,401 | | | | 550 | | | | 1,132 | | | | 992 | | | | 60 | | | | 4,135 | |
6 | | | 232 | | | | 21 | | | | 32 | | | | 20 | | | | 53 | | | | 358 | |
5 | | | — | | | | — | | | | — | | | | — | | | | — | | | | — | |
4 | | | — | | | | — | | | | — | | | | — | | | | — | | | | — | |
1 to 3 | | | — | | | | — | | | | — | | | | — | | | | — | | | | — | |
| | | | | | | | | | | | | | | | | | | | | | | | |
Total | | | 1,635 | | | | 571 | | | | 1,202 | | | | 1,012 | | | | 332 | | | | 4,752 | |
| | | | | | | | | | | | | | | | | | | | | | | | |
2013 compared to 2012(unaudited)
As a continued effort to mitigate counterparty credit risk in derivative transactions, Santander UK increased the use of CCPs during 2013. This was reflected by the increased exposure in rating category 8 in the UK resulting in an overall improved credit rating profile.
| | |
| 114 | | Santander UK plc Annual Report 2013 |
Detailed Business Review
Risk Management Reportcontinued
MARKETS – CREDIT RISK MITIGATION
Market focuses on derivative products and mitigates its credit risk to counterparties through netting arrangements, collateralisation and the use of CCPs. For details of the approach to credit risk mitigation, see “Credit Risk Management – Markets” on page 85.
The top 20 clients with which Santander UK had the biggest derivative exposures were Banks and CCPs. These top 20 clients’ derivative exposure accounted for 90% of the total derivative exposure in Markets at 31 December 2013 (2012: 82%). Cash collateral related to the Top 20 at 31 December 2013 was £2.3bn (2012: £2.7bn) and the risk exposure weighted average credit rating was 7.6 (2012: 7.5).
The total notional amount of Santander UK’s OTC derivatives at 31 December 2013 was £916.5bn (2012: £913.4bn) and 34% (2012: 9%) was cleared through CCPs. By mark-to-market terms (i.e. the credit risk exposure including mark-to-market value plus a volatility add-on that reflects the future volatility of the derivatives), CCPs were used in connection with 18% (2012: 6%) of Santander UK’s OTC derivatives. The percentage of CCPs reduced in mark-to-market terms because of the higher collateralisation of CCP-related transactions and generally lower volatility of these transactions.
MARKETS – CREDIT PERFORMANCE
At 31 December 2013, there were no impaired or non-performing loans or exposures (2012: none) and the assets in the Watchlist Proactive Management category amounted to only £36m (2012: £33m).
MARKETS – FORBEARANCE
At 31 December 2013, there was no forbearance activity in Markets.
Financial assets that would otherwise be past due or impaired
At 31 December 2013 and 2012, there were no financial assets that would otherwise be past due or impaired whose terms have been forborne.
| | |
| Santander UK plc Annual Report 2013 | | 115 |
Detailed Business Review
Risk Management Reportcontinued
CREDIT RISK – CORPORATE CENTRE
INTRODUCTION
Corporate Centre includes FMIR and the non-core corporate and legacy portfolios, as well as the co-brand credit cards business which has been presented as discontinued operations. FMIR is responsible for managing capital and funding, balance sheet composition, structural market risk and strategic liquidity risk for the Santander UK group. The non-core corporate and legacy portfolios include aviation, shipping, infrastructure, commercial mortgages, Social Housing loans and structured credit assets, all of which are being run-down and/or managed for value. The sale of the co-brand credit cards business was completed in 2013.
Credit risk arises by Corporate Centre making loans (including to other businesses within Santander UK) and investing in debt securities. Credit risk also arises by Corporate Centre investing in other financial instruments (including assets held for liquidity purposes) or entering into financing transactions or derivative contracts.
CORPORATE CENTRE – ASSETS
| | | | | | | | |
| | | 2013
£bn | | | 2012(5)
£bn | |
Sovereign: | | | | | | | | |
-Balances at Central Banks | | | 25.1 | | | | 27.9 | |
-Other | | | 4.4 | | | | 5.1 | |
ALCO portfolio(1) | | | 2.0 | | | | — | |
Legacy Treasury asset portfolio(1) | | | 2.0 | | | | 1.9 | |
Derivatives | | | 2.2 | | | | 3.2 | |
Collateral(2) | | | 2.5 | | | | 4.5 | |
Other Assets(3) | | | 7.4 | | | | 7.2 | |
Customer Assets: | | | | | | | | |
-Social Housing(4) | | | 7.1 | | | | 7.5 | |
-Commercial Mortgages | | | 1.2 | | | | 1.4 | |
-Aviation | | | 0.4 | | | | 0.6 | |
-Shipping | | | 0.4 | | | | 0.7 | |
-Others | | | 0.3 | | | | 0.8 | |
| | | | | | | | |
Total | | | 55.0 | | | | 60.8 | |
| | | | | | | | |
| (1) | Comprises the Treasury Asset Portfolio including legacy Treasury asset portfolio and an ongoing ALCO portfolio. The legacy assets were acquired as part of the transfer of Alliance & Leicester plc to Santander UK in 2008 and as part of an alignment of portfolios across the Banco Santander group in 2010 and are being run down. The ongoing ALCO portfolio aims to manage Santander UK’s liquidity reserves by investing in high quality assets which are selected to achieve diversification whilst also meeting prevailing regulatory liquidity regulations. The assets in the Treasury Asset Portfolio are principally classified as loans and receivable securities, as set out in Note 22 to the Consolidated Financial Statements, and debt securities designated at fair value through profit or loss, as set out in Note 17 to the Consolidated Financial Statements. |
| (2) | Includes inter-segmental collateral balances. This balance represents collateral held and therefore is not included in the tables of exposures below. |
| (3) | Other assets consist primarily of cash, trading assets and the assets of the co-brand credit cards business classified as assets held for sale. |
| (4) | Social Housing includes loans held at amortised cost and loans designated at fair value through profit or loss. Includes social housing bonds of £0.2bn (2012: £0.2bn) designated at fair value through profit or loss. |
| (5) | Adjusted to reflect the presentation of the assets held for sale prior to the completion of the sale as set out in Note 12 to the Consolidated Financial Statements. |
In 2013, Santander UK sold its co-brand credit cards business, as described in Note 12 to the Consolidated Financial Statements. The co-brand credit cards business is accounted for as discontinued operations in Corporate Centre, and was classified in Corporate Centre in 2012 as held for sale prior to its sale and included in other assets in the Consolidated Balance Sheet.
The Corporate Centre assets tables above comprise gross asset balances. The committed exposure tables below shows the exposures in Corporate Centre after taking into account credit mitigation procedures. In addition, on lending to customers, credit risk arises on assets and off-balance sheet transactions. Consequently, the committed exposure below arises from on balance sheet assets including OTC derivatives, and off-balance sheet transactions such as committed and undrawn credit facilities or guarantees. It also excludes Sovereign exposures managed by Short Term Markets within Commercial Banking.
| | |
| 116 | | Santander UK plc Annual Report 2013 |
Detailed Business Review
Risk Management Reportcontinued
CORPORATE CENTRE – COMMITTED EXPOSURES
Rating distribution
The rating distribution tables below show the credit risk exposure by Santander UK’s internal rating scale (see page 88) for each portfolio. Within this scale the higher the rating the better the quality of the counterparty.
| | | | | | | | | | | | | | | | | | | | | | | | |
2013 | | Sovereign
£m | | | Structured
Products
£m | | | Derivatives
£m | | | Legacy Portfolios
in run-off
£m | | | Social
Housing
£m | | | Total
£m | |
9 | | | 29,688 | | | | 694 | | | | — | | | | 2 | | | | 2,654 | | | | 33,038 | |
8 | | | — | | | | 707 | | | | 1,061 | | | | 2 | | | | 4,382 | | | | 6,152 | |
7 | | | — | | | | 1,091 | | | | 453 | | | | 790 | | | | 1,713 | | | | 4,047 | |
6 | | | — | | | | 54 | | | | — | | | | 464 | | | | 238 | | | | 756 | |
5 | | | — | | | | 90 | | | | — | | | | 170 | | | | — | | | | 260 | |
4 | | | — | | | | 72 | | | | — | | | | 291 | | | | — | | | | 363 | |
1 to 3 | | | — | | | | 131 | | | | — | | | | 137 | | | | — | | | | 268 | |
Other(1) | | | — | | | | 27 | | | | — | | | | 1,007 | | | | — | | | | 1,034 | |
| | | | | | | | | | | | | | | | | | | | | | | | |
Total | | | 29,688 | | | | 2,866 | | | | 1,514 | | | | 2,863 | | | | 8,987 | | | | 45,918 | |
| | | | | | | | | | | | | | | | | | | | | | | | |
| | | | | | |
2012 | | Sovereign
£m | | | Structured
Products
£m | | | Derivatives
£m | | | Legacy Portfolios
in run-off
£m | | | Social
Housing
£m | | | Total
£m | |
9 | | | 32,740 | | | | 257 | | | | — | | | | 1 | | | | 2,305 | | | | 35,303 | |
8 | | | 283 | | | | 305 | | | | — | | | | 27 | | | | 4,948 | | | | 5,563 | |
7 | | | — | | | | 599 | | | | 1,443 | | | | 826 | | | | 1,767 | | | | 4,635 | |
6 | | | — | | | | 412 | | | | 126 | | | | 715 | | | | 592 | | | | 1,845 | |
5 | | | — | | | | — | | | | — | | | | 293 | | | | — | | | | 293 | |
4 | | | — | | | | — | | | | — | | | | 490 | | | | — | | | | 490 | |
1 to 3 | | | — | | | | — | | | | — | | | | 379 | | | | — | | | | 379 | |
Other(1) | | | — | | | | — | | | | — | | | | 1,442 | | | | — | | | | 1,442 | |
| | | | | | | | | | | | | | | | | | | | | | | | |
Total | | | 33,023 | | | | 1,573 | | | | 1,569 | | | | 4,173 | | | | 9,612 | | | | 49,950 | |
| | | | | | | | | | | | | | | | | | | | | | | | |
| (1) | Represents smaller exposure predominantly within the commercial mortgages portfolio which are subject to scorecards rather than a rating model. |
Geographical distribution
The geographic location is classified by country of risk being the country where each counterparty’s main business activity or assets are located. For clients whose operations are more geographically dispersed the country of incorporation is applied.
| | | | | | | | | | | | | | | | | | | | | | | | |
2013 | | Sovereign
£m | | | Structured
Products
£m | | | Derivatives
£m | | | Legacy Portfolios
in run-off
£m | | | Social
Housing
£m | | | Total
£m | |
UK | | | 24,036 | | | | 880 | | | | 453 | | | | 2,241 | | | | 8,987 | | | | 36,597 | |
Peripheral eurozone | | | — | | | | 329 | | | | — | | | | 59 | | | | — | | | | 388 | |
Rest of Europe | | | 53 | | | | 1,207 | | | | 600 | | | | 63 | | | | — | | | | 1,923 | |
US | | | 5,230 | | | | 422 | | | | 461 | | | | 80 | | | | — | | | | 6,193 | |
Rest of world | | | 369 | | | | 28 | | | | — | | | | 420 | | | | — | | | | 817 | |
| | | | | | | | | | | | | | | | | | | | | | | | |
Total | | | 29,688 | | | | 2,866 | | | | 1,514 | | | | 2,863 | | | | 8,987 | | | | 45,918 | |
| | | | | | | | | | | | | | | | | | | | | | | | |
| | | | | | |
2012 | | Sovereign
£m | | | Structured
Products
£m | | | Derivatives
£m | | | Legacy Portfolios
in run-off
£m | | | Social
Housing
£m | | | Total
£m | |
UK | | | 31,350 | | | | 426 | | | | 437 | | | | 2,991 | | | | 9,612 | | | | 44,816 | |
Peripheral eurozone | | | — | | | | 352 | | | | — | | | | 90 | | | | — | | | | 442 | |
Rest of Europe | | | 627 | | | | 376 | | | | 676 | | | | 292 | | | | — | | | | 1,971 | |
US | | | 763 | | | | 382 | | | | 456 | | | | 193 | | | | — | | | | 1,794 | |
Rest of world | | | 283 | | | | 37 | | | | — | | | | 607 | | | | — | | | | 927 | |
| | | | | | | | | | | | | | | | | | | | | | | | |
Total | | | 33,023 | | | | 1,573 | | | | 1,569 | | | | 4,173 | | | | 9,612 | | | | 49,950 | |
| | | | | | | | | | | | | | | | | | | | | | | | |
| | |
| Santander UK plc Annual Report 2013 | | 117 |
Detailed Business Review
Risk Management Reportcontinued
Maturity profile (unaudited)
The table below shows the residual maturity for each portfolio.
| | | | | | | | | | | | | | | | | | | | | | | | |
2013 | | Sovereign
£m | | | Structured
Products
£m | | | Derivatives
£m | | | Legacy Portfolios
in run-off
£m | | | Social
Housing
£m | | | Total
£m | |
<=1year | | | 25,867 | | | | 140 | | | | 286 | | | | 166 | | | | 4 | | | | 26,463 | |
>1 to 5 years | | | 2,798 | | | | 1,047 | | | | 1,228 | | | | 704 | | | | 410 | | | | 6,187 | |
>5 to 8 years | | | 834 | | | | 145 | | | | — | | | | 550 | | | | 114 | | | | 1,643 | |
>8 to 10 years | | | 189 | | | | 574 | | | | — | | | | 177 | | | | 199 | | | | 1,139 | |
>10 to 15 years | | | — | | | | 60 | | | | — | | | | 282 | | | | 364 | | | | 706 | |
>15 years | | | — | | | | 900 | | | | — | | | | 984 | | | | 7,896 | | | | 9,780 | |
| | | | | | | | | | | | | | | | | | | | | | | | |
Total | | | 29,688 | | | | 2,866 | | | | 1,514 | | | | 2,863 | | | | 8,987 | | | | 45,918 | |
| | | | | | | | | | | | | | | | | | | | | | | | |
| | | | | | |
2012 | | Sovereign
£m | | | Structured
Products
£m | | | Derivatives
£m | | | Legacy Portfolios
in run-off
£m | | | Social
Housing
£m | | | Total
£m | |
<=1year | | | 30,192 | | | | 16 | | | | 140 | | | | 550 | | | | 74 | | | | 30,972 | |
>1 to 5 years | | | 2,286 | | | | 618 | | | | 1,424 | | | | 1,088 | | | | 420 | | | | 5,836 | |
>5 to 8 years | | | — | | | | 41 | | | | 5 | | | | 659 | | | | 78 | | | | 783 | |
>8 to 10 years | | | — | | | | 112 | | | | — | | | | 129 | | | | 173 | | | | 414 | |
>10 to 15 years | | | — | | | | 134 | | | | — | | | | 395 | | | | 354 | | | | 883 | |
>15 years | | | 545 | | | | 652 | | | | — | | | | 1,352 | | | | 8,513 | | | | 11,062 | |
| | | | | | | | | | | | | | | | | | | | | | | | |
Total | | | 33,023 | | | | 1,573 | | | | 1,569 | | | | 4,173 | | | | 9,612 | | | | 49,950 | |
| | | | | | | | | | | | | | | | | | | | | | | | |
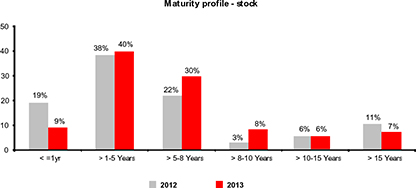
2013 compared to 2012(unaudited)
Committed exposures to Sovereigns principally reflect cash at central banks and holdings of highly rated liquid assets as part of normal liquid asset portfolio management. At 31 December 2013, these exposures were concentrated in the UK and US reflecting a diversification from an almost exclusively UK-only exposure at 31 December 2012. These exposures remained concentrated in the <= 1 year maturity range. This is mainly due to the holdings of liquid assets in UK and US.
Exposures to Structured Products reflect holdings of highly rated covered bonds, floating rate notes and RMBS as part of normal liquid asset portfolio management. The increased exposures reflect the purchase of covered bonds and floating rate notes to optimise the composition of the liquid asset portfolio. The major increase in 2013 was with European banks with good credit quality and was primarily in instruments with maturities of less than 5 years.
Derivatives remained broadly unchanged in both exposure level and maturity profile.
The Legacy Portfolios in run-off continued to reduce in line with the strategy to exit these exposures where the opportunity arises. Committed exposures reduced by £1.3bn during the year, reflecting decreases across all geographies, rating and maturity bands as the strategy to run-off the portfolios continues to be pursued.
The Social Housing portfolio reduced as a result of successful refinancing of longer-dated loans onto shorter maturities and on current market terms. The portfolio remains concentrated in the longer maturity range which reflects historic market terms prevalent at the time the portfolio was built up. Opportunities are being taken to refinance exposure onto shorter maturities when they arise.
| | |
| 118 | | Santander UK plc Annual Report 2013 |
Detailed Business Review
Risk Management Reportcontinued
CORPORATE CENTRE – CREDIT RISK MITIGATION
At 31 December 2013, collateral held against impaired loans amounted to 65% (2012: 42%) of the carrying amount of impaired loan balances. Structured Products are unsecured but benefit from senior positions in the creditor cascade. Credit risk in derivatives is mitigated by netting agreements, collateralisation and the use of Central Counterparties. For details of the approach to credit risk mitigation, see “Credit Risk Management – Markets” on page 85.
In the Legacy portfolios in run-off, at 31 December 2013, cash collateral of £752m (2012: £741m) was held. At 31 December 2013, of the aviation portfolio of £406m (2012: £681m), £335m (2012: £625m) was asset-backed and £71m (2012: £56m) was receivables-backed. Of the asset-backed loans, 92% (2012: 86%) had a collateral value in excess of the loan value.
At 31 December 2012, of the shipping portfolio of £417m (2012: £744m), £324m (2012: £647m) was asset-backed and £93m (2012: £97m) was backed by cash or bank guaranteed. Of the asset-backed loans, 55% (2012: 37%) had a collateral value in excess of the loan value. Collateral is rarely taken into possession, (2013: £23m, 2012: £28m) and Santander UK seeks to ensure the disposal of any collateral, either consensually or via an insolvency process, as early as practical in order to minimise its loss.
CORPORATE CENTRE – CREDIT PERFORMANCE
Exposures exhibiting potentially higher risk characteristics are subject to risk monitoring under the Watchlist process (described in “The Credit Cycle” section under “Risk monitoring” on page 76). The table below sets out the portfolio showing exposures subject to risk monitoring under the Watchlist process and those classified as non-performing by portfolio at 31 December 2013 and 2012:
| | | | | | | | | | | | | | | | | | | | | | | | |
2013 | | Sovereign
£m | | | Structured
Products
£m | | | Derivatives
£m | | | Legacy Portfolios
in run-off
£m | | | Social
Housing
£m | | | Total
£m | |
Total Committed Exposure of which:(1) | | | 29,688 | | | | 2,866 | | | | 1,514 | | | | 2,863 | | | | 8,987 | | | | 45,918 | |
-Watchlist: Enhanced Monitoring | | | — | | | | 37 | | | | — | | | | 173 | | | | 118 | | | | 328 | |
-Watchlist: Proactive Management | | | — | | | | — | | | | — | | | | 72 | | | | — | | | | 72 | |
-Remaining Performing Exposure | | | 29,688 | | | | 2,829 | | | | 1,514 | | | | 2,389 | | | | 8,869 | | | | 45,289 | |
Subtotal Performing Exposure | | | 29,688 | | | | 2,866 | | | | 1,514 | | | | 2,634 | | | | 8,987 | | | | 45,689 | |
Non-Performing Exposure(2) | | | — | | | | — | | | | — | | | | 229 | | | | — | | | | 229 | |
| | | | | | | | | | | | | | | | | | | | | | | | |
Total Impaired Exposure of which:(3) | | | — | | | | — | | | | — | | | | 485 | | | | 118 | | | | 603 | |
-Performing – Watchlist | | | — | | | | — | | | | — | | | | 256 | | | | 118 | | | | 374 | |
-Non Performing Exposure(2) | | | — | | | | — | | | | — | | | | 229 | | | | — | | | | 229 | |
| | | | | | | | | | | | | | | | | | | | | | | | |
Total Observed impairment loss allowances of which:(4) | | | — | | | | — | | | | — | | | | 162 | | | | — | | | | 162 | |
-Performing – Watchlist | | | — | | | | — | | | | — | | | | 55 | | | | — | | | | 55 | |
-Non-Performing Exposure(2) | | | — | | | | — | | | | — | | | | 107 | | | | — | | | | 107 | |
| | | | | | | | | | | | | | | | | | | | | | | | |
IBNO(5)(6) | | | | | | | | | | | | | | | | | | | | | | | 114 | |
Total Impairment loss allowance | | | | | | | | | | | | | | | | | | | | | | | 277 | |
| | | | | | | | | | | | | | | | | | | | | | | | |
| | | | | | |
2012 | | Sovereign
£m | | | Structured
Products
£m | | | Derivatives
£m | | | Legacy Portfolios
in run-off
£m | | | Social
Housing
£m | | | Total
£m | |
Total Committed Exposure of which:(1) | | | 33,023 | | | | 1,573 | | | | 1,569 | | | | 4,173 | | | | 9,612 | | | | 49,950 | |
-Watchlist: Enhanced Monitoring | | | — | | | | 188 | | | | — | | | | 283 | | | | 632 | | | | 1,103 | |
-Watchlist: Proactive Management | | | — | | | | — | | | | — | | | | 207 | | | | — | | | | 207 | |
-Remaining Performing Exposure | | | 33,023 | | | | 1,385 | | | | 1,569 | | | | 3,165 | | | | 8,980 | | | | 48,122 | |
Subtotal Performing Exposure | | | 33,023 | | | | 1,573 | | | | 1,569 | | | | 3,655 | | | | 9,612 | | | | 49,432 | |
Non-Performing Exposure(2) | | | — | | | | — | | | | — | | | | 518 | | | | — | | | | 518 | |
| | | | | | | | | | | | | | | | | | | | | | | | |
Total Impaired Exposure of which:(3) | | | — | | | | — | | | | — | | | | 1,289 | | | | — | | | | 1,289 | |
-Performing – Watchlist | | | — | | | | — | | | | — | | | | 771 | | | | — | | | | 771 | |
-Non-Performing Exposure(2) | | | — | | | | — | | | | — | | | | 518 | | | | — | | | | 518 | |
| | | | | | | | | | | | | | | | | | | | | | | | |
Total Observed impairment loss allowances of which:(4) | | | — | | | | — | | | | — | | | | 370 | | | | — | | | | 370 | |
-Performing – Watchlist | | | — | | | | — | | | | — | | | | 152 | | | | — | | | | 152 | |
-Non-Performing Exposure(2) | | | — | | | | — | | | | — | | | | 218 | | | | — | | | | 218 | |
| | | | | | | | | | | | | | | | | | | | | | | | |
IBNO(5)(6) | | | | | | | | | | | | | | | | | | | | | | | 118 | |
Total Impairment loss allowance | | | | | | | | | | | | | | | | | | | | | | | 488 | |
| | | | | | | | | | | | | | | | | | | | | | | | |
| (1) | Includes committed facilities and swaps. |
| (2) | Non Performing Exposure in the table above include committed facilities and derivative exposures and therefore are larger than the NPLs in the tables on page 120 which only include drawn balances. All the Non Performing Loans are impaired following a change in provision approach in 2012. |
| (3) | Corporate loans are assessed individually or collectively assessed for impairment. Assets reported as impaired represent, for collective assessment, that portion of the loan portfolio where it is estimated that a loss will occur, plus those assets individually impaired. |
| (4) | Excludes IBNO provision. |
| (5) | Allowance for incurred inherent losses (i.e. incurred but not observed (‘IBNO’)) as described in Note 1 to the Consolidated Financial Statements. |
| (6) | There is no impairment allowance attributable to Sovereign or Structured Products. |
| | |
| Santander UK plc Annual Report 2013 | | 119 |
Detailed Business Review
Risk Management Reportcontinued
Non-performing loans and advances(1) (2)
An analysis of Corporate Centre NPLs is presented below.
| | | | | | | | |
| | | 2013
£m | | | 2012
£m | |
Loans and advances to customers of which:(2) | | | 9,360 | | | | 11,002 | |
Customers in Arrears(3) | | | 256 | | | | 490 | |
Corporate Centre NPLs - impaired(3)(4)(5) | | | 221 | | | | 494 | |
Corporate Centre NPLs - not impaired(3)(4) | | | — | | | | — | |
| | | | | | | | |
Corporate Centre NPLs | | | 221 | | | | 494 | |
| | | | | | | | |
Impairment loan loss allowances | | | 277 | | | | 488 | |
| | | | | | | | |
| | |
| | | % | | | % | |
Arrears ratio(6) | | | 2.74 | | | | 4.45 | |
NPLs ratio(7) | | | 2.36 | | | | 4.49 | |
Coverage ratio(8) | | | 125 | | | | 99 | |
| | | | | | | | |
| (1) | Loans and advances are classified as non-performing typically when the counterparty fails to make payments when contractually due for three months or where it is deemed probable that this will occur in the near future. |
| (2) | Corporate Centre loans and advances to customers include Social Housing loans and finance leases. |
| (3) | All Corporate Centre balances are UK and continue accruing interest. For the data presented, the balances include interest charged to the customer’s account, but exclude interest accrued but not yet charged to the account. |
| (4) | All the Non Performing Loans are impaired following a change in provision approach in 2012. |
| (5) | NPLs against which an impairment loss allowance has been established. |
| (6) | Corporate Centre loans and advances to customers in arrears as a percentage of Corporate Centre loans and advances to customers. |
| (7) | Corporate Centre NPLs as a percentage of Corporate Centre loans and advances to customers. |
| (8) | Impairment loan loss allowances as a percentage of NPLs. |
Movements in NPLs during the year are set out in the graphs below. Transfers in represent loans which have become classified as NPLs during the year. Exits (including loan repayments) represent that element of loans that have been repaid (in full or in part) plus those returned to performing status. Write-offs represent the unrecovered element of a loan where recovery options, including realisation of any collateral, have been exhausted. Forbearance activity does not result in a change in the NPL status.
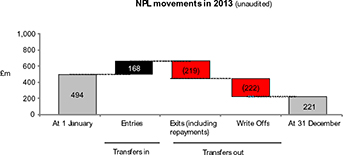
2013 compared to 2012(unaudited)
During 2013, the value of Structured Products exposures subject to watchlist decreased across all portfolios reflecting the improvement of the credit quality of the portfolio. The value of exposures in the Legacy portfolios in run-off subject to Watchlist and NPLs reduced as a consequence of the strategy to exit these exposures. Similarly, the level of provision decreased during the year reflecting disposal of assets. Social Housing exposure subject to enhanced monitoring decreased as a result of a small number of large value cases returning to performing status following resolution of governance issues as anticipated. There was no exposure subject to Watchlist monitoring in Sovereign and Derivatives.
In 2013, loans and advances to customers in arrears decreased to £256m (2012: £490m) as Santander UK continued to execute the strategy of exiting problem exposures through sale of the debt or through the realisation of the collateral. Loans and advances to customers in arrears as a percentage of loans and advances to customers decreased to 2.74% (2012: 4.45%) as a result of the decrease in arrears described above which was achieved at a faster rate than the run-off of the loans and advances.
At 31 December 2013, the NPLs ratio decreased to 2.36% (2012: 4.49%). This decrease reflected the continuing strategy to exit exposures where possible for this portfolio. This was in part through debt sales or realisation of collateral but also involved an increased level of write-offs in the year to date. In 2013, coverage increased to 125% (2012: 99%) reflecting the successful disposal programme without incurring further losses.
In 2013, interest income recognised on impaired loans amounted to £9m (2012: £13m, 2011: £7m).
| | |
| 120 | | Santander UK plc Annual Report 2013 |
Detailed Business Review
Risk Management Reportcontinued
CORPORATE CENTRE – FORBEARANCE
Forbearance arrangements have only been entered into with respect to the Legacy portfolios in run-off. No forbearance arrangements have been entered into with respect to Sovereign, Structured Products, Derivatives or Social Housing counterparties.
Forbearance commenced during the year
The forborne exposure that entered forbearance during the years ended 31 December 2013 and 2012 were:
| | | | | | | | |
| | | 2013
£m | | | 2012
£m | |
Forbearance of NPL | | | 23 | | | | 4 | |
Forbearance of Non-NPL | | | 26 | | | | 160 | |
| | | | | | | | |
| | | 49 | | | | 164 | |
| | | | | | | | |
Forbearance cumulative position
a) Performance status when entering forbearance
The status of the forborne exposures at 31 December 2013 and 2012 when they originally entered forbearance, analysed by their payment status, was:
| | | | | | | | | | | | | | | | |
2013 | | Forbearance of NPL
£m | | | Forbearance of Non-NPL
£m | | | Total
£m | | | Impairment allowance
£m | |
Performing | | | — | | | | 322 | | | | 322 | | | | 32 | |
In arrears | | | 58 | | | | — | | | | 58 | | | | 18 | |
| | | | | | | | | | | | | | | | |
Total | | | 58 | | | | 322 | | | | 380 | | | | 50 | |
| | | | | | | | | | | | | | | | |
| | | | |
2012 | | Forbearance of NPL
£m | | | Forbearance of Non-NPL
£m | | | Total
£m | | | Impairment allowance
£m | |
Performing | | | — | | | | 551 | | | | 551 | | | | 71 | |
In arrears | | | 63 | | | | — | | | | 63 | | | | 28 | |
| | | | | | | | | | | | | | | | |
Total | | | 63 | | | | 551 | | | | 614 | | | | 99 | |
| | | | | | | | | | | | | | | | |
b) Performance status at the year-end
The current status of forborne exposures analysed by their payment status at 31 December 2013 and 2012 was:
| | | | | | | | | | | | | | | | |
2013 | | Forbearance of NPL
£m | | | Forbearance of Non-NPL
£m | | | Total
£m | | | Impairment allowance
£m | |
Performing | | | 32 | | | | 274 | | | | 306 | | | | 13 | |
In arrears | | | 26 | | | | 48 | | | | 74 | | | | 37 | |
| | | | | | | | | | | | | | | | |
Total | | | 58 | | | | 322 | | | | 380 | | | | 50 | |
| | | | | | | | | | | | | | | | |
| | | | |
2012 | | Forbearance of NPL
£m | | | Forbearance of Non-NPL
£m | | | Total
£m | | | Impairment allowance
£m | |
Performing | | | 10 | | | | 410 | | | | 420 | | | | 8 | |
In arrears | | | 53 | | | | 141 | | | | 194 | | | | 91 | |
| | | | | | | | | | | | | | | | |
Total | | | 63 | | | | 551 | | | | 614 | | | | 99 | |
| | | | | | | | | | | | | | | | |
2013 compared to 2012(unaudited)
In 2013, the level of new forbearance undertaken during the year reduced significantly as actions taken to exit potential problem exposures continued to be successfully executed, consistent with the non-core nature of the Legacy portfolios in run-off. Opportunities to achieve an orderly exit from these exposures are being taken. The balance of forborne exposure also reduced during the year as the strategy to exit these exposures continued to be executed where the opportunity arose. An element of the residual forborne exposure is expected to take longer to exit given their profile and the more limited market appetite for the purchase or refinancing of certain assets.
Accounts that are in forbearance continue to be closely monitored, to ensure that the forbearance arrangements are sustainable. At 31 December 2013, 80% (2012: 86%) of forborne exposures was performing in accordance with the revised terms agreed under Santander UK’s forbearance arrangements. A customer’s ability to adhere to any revised terms agreed is an indicator of the sustainability of Santander UK’s forbearance arrangements.
Financial assets that would otherwise be past due or impaired
At 31 December 2013, the carrying amount of financial assets that would otherwise be past due or impaired whose terms have been forborne was £32m (2012: £10m).
| | |
| Santander UK plc Annual Report 2013 | | 121 |
Detailed Business Review
Risk Management Reportcontinued
MARKET RISK
INTRODUCTION
Market risk, which comprises traded market risk and non-traded market risk, is the risk of a variation of capital, economic value or reported income resulting from changes in the variables of financial instruments including interest rates, inflation, equities, credit spreads, property prices and foreign currencies. Traded market risk is the risk of losses in balance sheet and off-balance sheet positions arising from movements in market prices. Non-traded market risk includes exposures arising as a result of the structure of portfolios of assets and liabilities. Non-traded market risk is classified as a structural risk. This section sets out further detail on traded market risk, and non-traded market risk (which is classified as a structural risk and presented in the Structural Risks section).
Santander UK’s exposure to market risk arises in the following business segments:
| | | | | | | | | | | | | | | | |
| | | | | RETAIL BANKING | | | | COMMERCIAL BANKING | | | | MARKETS | | | | CORPORATE CENTRE |
| Traded Market Risk | | | | No exposure. | | | | Exposures arise as a result of: • Interest rate risk; • Equity risk; and • Spread risk. | | | | Exposures arise from trading activity and the creation and risk management of structured products for the personal financial services market by exposure to: • Interest rate risks; • Equity risks; • Property risks; • Spread risks; and • Foreign exchange risks. | | | | No exposure. |
| | | | | | | | | | | | | | | | |
| Non-Traded Market Risk | | | | Exposures arise as a by-product of providing banking products and services to personal customers as a result of: • Interest rate (yield and basis) risks; • Behavioural risks; • Prepayment risks; and • Launch risks. | | | | Exposures arise as a by-product of providing banking products and services to corporate/ business customers as a result of: • Interest rate (yield and basis) risks; • Behavioural risks; • Prepayment risks; and • Launch risks. | | | | No exposure. | | | | All material non-traded market risks arising from Retail and Commercial Banking are substantially transferred to, and managed by, Corporate Centre. In addition, structural exposures arising in the balance sheet are managed by Corporate Centre (e.g. foreign exchange risk and available for sale accounting risks). |
Balance sheet allocation by market risk classification
Santander UK’s assets and liabilities that are subject to market risk may be analysed between traded and non-traded market risk classification as follows:
| | | | | | | | | | | | | | | | | | | | | | | | | | |
| | | 2013 | | | 2012 | | | |
| | | Market risk (measure) | | | Market risk (measure) | | | |
| | | Balance
sheet
£m | | | Traded
risk
£m | | | Non-traded
risk
£m | | | Balance
sheet(1)
£m | | | Traded
risk
£m | | | Non-traded
risk
£m | | | Key Risk Factors(2) |
Assets subject to market risk | | | | | | | | | | | | | | | | | | | | | | | | | | |
Cash and balances at central banks | | | 25,160 | | | | — | | | | 25,160 | | | | 28,161 | | | | — | | | | 28,161 | | | Interest rate |
Trading assets | | | 22,294 | | | | 22,294 | | | | — | | | | 22,498 | | | | 22,498 | | | | — | | | Equity, foreign exchange, interest rate |
Derivatives | | | 20,049 | | | | 17,433 | | | | 2,616 | | | | 30,146 | | | | 28,064 | | | | 2,082 | | | Equity, foreign exchange, interest rate |
Financial assets designated at FV | | | 2,747 | | | | 470 | | | | 2,277 | | | | 3,811 | | | | 516 | | | | 3,295 | | | Interest rate, credit spread |
Loans and advances to banks | | | 2,347 | | | | — | | | | 2,347 | | | | 2,438 | | | | — | | | | 2,438 | | | Foreign exchange, interest rate |
Loans and advances to customers | | | 184,587 | | | | — | | | | 184,587 | | | | 190,782 | | | | — | | | | 190,782 | | | Interest rate |
Available-for-sale securities | | | 5,005 | | | | — | | | | 5,005 | | | | 5,483 | | | | — | | | | 5,483 | | | Foreign exchange, interest rate, inflation, credit spread |
Loans and receivables securities | | | 1,101 | | | | — | | | | 1,101 | | | | 1,259 | | | | — | | | | 1,259 | | | Foreign exchange, interest rate |
Macro hedge of interest rate risk | | | 769 | | | | — | | | | 769 | | | | 1,222 | | | | — | | | | 1,222 | | | Interest rate |
Retirement benefit assets | | | 118 | | | | — | | | | 118 | | | | 254 | | | | — | | | | 254 | | | Equity, foreign exchange, interest rate, inflation, credit spread |
| | | | | | | | | | | | | | | | | | | | | | | | | | |
| | | 264,177 | | | | 40,197 | | | | 223,980 | | | | 286,054 | | | | 51,078 | | | | 234,976 | | | |
| | | | | | | | | | | | | | | | | | | | | | | | | | |
Liabilities subject to market risk | | | | | | | | | | | | | | | | | | | | | | | | | | |
Deposits by banks | | | 8,696 | | | | — | | | | 8,696 | | | | 9,935 | | | | — | | | | 9,935 | | | Foreign exchange, interest rate |
Deposits by customers | | | 147,167 | | | | — | | | | 147,167 | | | | 149,037 | | | | — | | | | 149,037 | | | Interest rate |
Derivatives | | | 18,863 | | | | 17,297 | | | | 1,566 | | | | 28,861 | | | | 27,415 | | | | 1,446 | | | Equity, foreign exchange, interest rate |
Trading liabilities | | | 21,278 | | | | 21,278 | | | | — | | | | 21,109 | | | | 21,109 | | | | — | | | Equity, foreign exchange, interest rate |
Financial liabilities designated at FV | | | 3,407 | | | | — | | | | 3,407 | | | | 4,002 | | | | — | | | | 4,002 | | | Interest rate, credit spread |
Debt securities in issue | | | 50,870 | | | | — | | | | 50,870 | | | | 59,621 | | | | — | | | | 59,621 | | | Foreign exchange, interest rate |
Subordinated liabilities | | | 4,306 | | | | — | | | | 4,306 | | | | 3,781 | | | | — | | | | 3,781 | | | Foreign exchange, interest rate |
Retirement benefit liabilities | | | 672 | | | | — | | | | 672 | | | | 305 | | | | — | | | | 305 | | | Interest rate, inflation, longevity, credit spread |
| | | | | | | | | | | | | | | | | | | | | | | | | | |
| | | 255,259 | | | | 38,575 | | | | 216,684 | | | | 276,651 | | | | 48,524 | | | | 228,127 | | | |
| | | | | | | | | | | | | | | | | | | | | | | | | | |
| (1) | Adjusted to reflect the presentation of the assets held for sale prior to the completion of the sale as set out in Note 12 to the Consolidated Financial Statements. |
| (2) | Primary metrics for controlling and measuring key risk factors for non-traded market risk are NIM and EVE and for traded market risk is VaR. |
| | |
| 122 | | Santander UK plc Annual Report 2013 |
Detailed Business Review
Risk Management Reportcontinued
| | • | | Market Risk operates within the Santander UK Risk Appetite Framework, which clearly defines the overall Risk Appetite of Santander UK. Specific Risk Appetite limits, controls and management are in place for traded and non-traded market risk. |
| | • | | Santander UK actively manages and controls market risk within clearly defined parameters by limiting the impact of adverse market movements whilst seeking to enhance earnings. The organisational structure ensures a segregation of responsibilities between the functions responsible for market risk origination, risk management and control, and risk oversight. |
| | • | | A comprehensive set of Santander UK-wide policies, procedures and processes has been developed and implemented to identify, monitor and manage market risk. |
| | • | | All material risk exposures must be measured and subject to monitoring against limits and triggers for management action and/or escalation. Market risk limits are approved under Board-delegated authority, and within the market risk appetite. |
TRADED MARKET RISK
Traded market risk arises in connection with the provision of financial services for customers and the buying, selling and positioning mainly in fixed income, equities, foreign exchange and property markets. This trading activity may lead to a potential decline in net income due to variations in market factors including interest rates, inflation rates, equity indices, exchange rates, credit spreads, bond prices and property indices. Traded market risk is principally linked to potential variability in the ‘Net trading and funding of other items by the trading book’ element of the ‘Net trading and other income’ line in the Consolidated Income Statement. The most significant risk exposures in traded market risk are sensitivities to moves in interest rates, interest rate basis and the equities market.
The key business segments where traded market risk is generated, controlled and managed are:
| | • | | Commercial Banking (including the short-term markets business); and |
Market risks arising from structured products, including exposure to changes in the levels of equity markets, are managed within Markets.
| | |
Risk management and control |
| | • | | The Santander UK Market Risk Framework cascades down from the Santander UK Risk Framework and defines the high level arrangements and minimum standards for the management, control and oversight specific to traded market risk. |
| | • | | The Santander UK Risk Appetite is cascaded down and embedded into the controls, risk limits and key risk metrics of traded market risk division. Key metrics, which include the utilisation of a stress economic loss limit and risk factor stress scenarios, are reported to the Board on a monthly basis. |
| | • | | A suite of key risk metrics are regularly reported to the Board, Executive Risk Committee and Wholesale Management Risk Committee. |
Risk measures
| | • | | One of the primary tools to measure and control market risk is a statistical risk measure, VaR. VaR estimates the potential loss arising from unfavourable market moves and is calculated using a historical simulation method with two-years of daily price history, equally weighted. In accordance with the standard used throughout the Banco Santander group, the Santander UK Internal VaR calculation uses a one day time horizon and a 99% confidence level. This means that conditional on today’s positions, Santander UK would expect to incur losses exceeding the predicted VaR estimate one in every 100 trading days, or about two to three times a year. |
| | • | | The main risk exposures are monitored against Internal VaR limits at different levels: aggregated Santander UK, business, asset class and individual desk levels. All limit breaches are reported and escalated in accordance with the Risk Framework. |
| | • | | Among the benefits of the VaR model is that it incorporates the majority of material market risk factors and provides a framework for assessing the risk using a consistent approach across these risk factors and portfolios. |
| | • | | A Regulatory VaR model and associated Stressed VaR model (‘SVaR’) has been approved by the PRA for the use of calculating trading market risk capital requirements. The Regulatory VaR and SVaR models do not cover all Santander UK’s trading book risk factors and businesses. Regulatory VaR and SVaR use a ten day time horizon in accordance with the PRA’s requirements in BIPRU, compared to the one day time horizon used for Internal VaR. However, market data, sensitivities and all other aspects of the methodology are the same as those used in the Internal VaR for businesses and risk factors captured by both models. |
| | • | | Internal VaR, Regulatory VaR and SVaR are calculated daily and include all major risk exposures including interest rates and equities, and are subject to governance, controls, regular reviews and internal assessments. Regulatory VaR and SVaR are also subject to external assessments by the PRA. |
| | |
| Santander UK plc Annual Report 2013 | | 123 |
Detailed Business Review
Risk Management Reportcontinued
| | • | | General limitations of VaR arise from the use of historical changes and the assumption that these historical changes are an indicator of the future distribution of potential market moves. |
| | • | | VaR does not capture intra-day risk taking as it is based on positions as at close of business. |
| | • | | It does not indicate the potential loss beyond the 99th percentile. This risk is addressed by monitoring stress testing measures across the different business areas. |
| | • | | A one day time horizon does not fully capture the profit and loss implications of exposures that cannot be liquidated or hedged within one day. These exposures are monitored using Structural Risk metrics (see additional risk measures) and Stress Testing. |
| | • | | Specific limitations of the Santander UK group’s VaR model are that the use of a 2 year equally weighted dataset can lead to inflated VaR levels driven by historical events that are no longer representative of current market conditions. This can mask actual levels of short-term risk. |
| | • | | Proxy market data is used in the calculation when there is a new product traded where sufficient market data history is not available. Proxies are useful and allow new risk factors to be incorporated into VaR measurement for completeness. However use of proxies can reduce accuracy of VaR measures. Santander UK monitors the impact of proxy data on VaR measurement and has specific controls around its usage within the VaR model. |
| | • | | Although Santander UK VaR models aim to capture the principal relationships between different risk factors and the full valuation impact across a wide range of market level movements, some potential inaccuracy can result particularly for complex products and where there have been large market movements. |
| | • | | Backtesting is one of the approaches used for assessing Internal and Regulatory VaR model performance. |
| | • | | Daily back-testing is performed of Internal and Regulatory VaR against market risk related revenue (as prescribed by the PRA). The inclusion of intra day P&L within the back-testing goes someway towards mitigating the absence of intra day trading limits and non capture in VaR. A 1 day time horizon variant of Regulatory VaR is used for backtesting purposes. |
| | • | | Back-testing compares the daily VaR estimates of the last 250 days compared to the actual profit and loss (‘P&L’) outcomes of the following day. |
| | • | | As the VaR confidence level is 99% (for both Internal VaR and Regulatory VaR) and a 1 day time horizon is used, the expectation is that on 99% of days, the following day’s actual P&L outcome will either be a gain or a loss of smaller magnitude than the VaR level. Hence we would expect that for 1% of days, which is equal to 2 - 3 times a year, the actual reported P&L loss will exceed the VaR level from the previous day. For Regulatory VaR, the PRA BIPRU classification for P&L outcomes not exceeding the acceptable level is green and Santander UK has maintained a green status for 2013. |
| | • | | There has been no trending in the backtesting model exceptions. Any exception that occurred has been isolated. |
| | • | | Stress testing is a fundamental risk requirement under the Basel Capital Accords and is seen as a major component of Risk Management within Santander UK to increase transparency, and measure and control risk of losses in stressed markets. |
| | • | | Stress scenarios and reverse stress scenarios are important tools for Santander UK to increase transparency, and measure and control risk of losses in stressed markets. |
| | • | | Stress scenarios are used in the Traded Market Risk Risk Appetite setting process and monthly analysis for Risk Appetite Reporting. These stress scenarios are also embedded within the core Risk Management limits setting and monitoring daily processes. |
| | • | | Bespoke scenarios are considered in order to replicate past events but also to create plausible abnormal market conditions from changes in financial prices including interest rates, equity, exchange rates and credit spreads. Various degrees of severity are considered which, together with VaR, make it possible to obtain a more complete spectrum of the risk profile. Scenario shocks assuming different holding periods are used to illustrate stress exposures to various degrees of market liquidity. |
| | • | | Limits are used to manage Santander UK’s exposure to stress events and restrict the impact of stressed market conditions. Stress testing is employed in cross-business risk management at desk level. The results of the stress calculations, trends and explanations based on current market risk positions are communicated to Santander UK’s senior management on a regular basis. |
| | |
| 124 | | Santander UK plc Annual Report 2013 |
Detailed Business Review
Risk Management Reportcontinued
| | • | | The value of instruments held as a result of trading activities can change daily and is reported daily in the Profit and Loss statements/reports. To calculate the current value, the instruments (both assets and liabilities) are measured at their fair value. |
| | • | | Non-statistical risk measures include sensitivity to variables used to value positions. A comprehensive framework captures all traded market risk exposures with limits applied to all sensitivities. |
| | • | | All new derivatives pricing models or amendments to the existing derivatives pricing models are validated in accordance with formalised validation standards with Models Committee UK (reporting into Risk Management Committee) giving final approval. All models are subject to annual review by the Quantitative Risk Group (‘QRG’). |
| | • | | Illiquid risks within traded market risk are those risks factors whereby it is recognised that exposures cannot be liquidated or hedged within 1 day. These risks are monitored and measured based on the estimated time horizon it would take to hedge or exit or the exposure. There are three categories: <1 month horizon, 1 to 6 months horizon, and >6 months horizon. Each category is monitored daily against limits. |
| | • | | Expected Shortfall (‘ES’) analysis is an additional metric that has been introduced this year for analysis purposes, ahead of the Basel Committee’s Fundamental Review of the Trading Book (‘FRTB’) requirements. ES is currently being calculated using VaR vectors and measures the size of the tail risk above 95% confidence level. The confidence level used for ES analysis will be changed to 97.5% during 2014, in line with the recent publication of FRTB consultation paper 2. |
| | • | | A time weighted VaR is calculated using the Banco Santander group methodology. The time weighted VaR model applies a greater weighting to the most recent days within the 2 year historical series and so the VaR level responds more quickly to current market volatility and provides a greater indication of changes in market behaviour to senior management. |
| | • | | For Regulatory VaR and SVaR, risk factors that are not captured or are regarded as not captured appropriately for capital assessment purposes are assessed under the Risks Not In VaR Framework (‘RNIV’) for the purpose of ensuring adequate capitalisation. A risk factor would be covered by the RNIV Framework if there was a lack of historical market data or the quality of the data was not deemed sufficient. These risk factors are generally included under the Structural Risk metrics for internal risk reporting and monitoring purposes as described above. The RNIV Framework is part of the approved internal model for traded market risk capital requirements. See “Capital requirement measures” below for additional information on RNIV. |
|
| Capital requirement measures (unaudited) |
| | • | | Traded market risk uses the Regulatory VaR and SVaR approach for the calculation of capital requirements for those risk factors and businesses with Internal Models permission from the PRA. |
| | • | | Regulatory VaR is calculated on a 10 day holding period and 99% confidence level using the last 2 years of historical data shifts. SVaR is also calculated on a 10 day 99% confidence level basis, but uses a continuous 1 year period of historical data shifts in a time of stress that is relevant to the Santander UK’s portfolio. This stress period is reviewed regularly using a maximiser approach (as prescribed by the PRA) to ensure the most penal period of stress since 2007 is used, relevant to Santander UK’s portfolio. |
| | • | | SVaR is the largest component of traded market risk capital requirements and is typically 2 – 3 times larger than the Regulatory VaR component. The largest drivers of SVaR are currently interest rate delta, interest rate basis and equity volatility risks. This is in line with the historical market data shifts seen during the selected SVaR dataset period. |
| | • | | RNIV risk factors make up less than 10% of the current traded market risk capital requirements. The largest driver within the RNIV capital requirement calculation comes from implied dividends exposure. This risk factor is not captured well under a VaR model approach due to the structure of the underlying market data. |
| | • | | New RNIVs can be identified through P&L analysis and from new product analysis. All RNIVs identified will be included within the capital requirement calculation, regardless of materiality. |
| | • | | Two approaches are used to calculate RNIV capital levels, depending on market data availability and characteristics: A VaR type approach (which would require a Regulatory VaR and SVaR type calculation) and a stress based approach. The VaR approach is also subject to a multiplication factor as prescribed by the PRA. Stress based RNIVs use sensitivities and plausible stressed market data moves. |
| | • | | Each individual RNIV value is standalone and does not benefit from diversification in the capital requirements final calculation. |
| | • | | Any changes made to the models will be assessed for the capital requirement impact. The outcome of that testing will indicate whether the PRA will need pre-notification and need to give approval before the change can be implemented. |
| | • | | For those risk factors and businesses outside the internal models permission scope the standardised approach (as prescribed by the PRA in BIPRU) is used to calculate capital requirements. |
| | • | | As part of the approval for using internal models to calculate the traded market risk capital requirements, Santander UK is subject to a quarterly review by the PRA. |
| | |
| Santander UK plc Annual Report 2013 | | 125 |
Detailed Business Review
Risk Management Reportcontinued
TRADED MARKET RISK – COMMERCIAL BANKING
For trading activities (including those within the Short-Term Markets business), market risk is measured using VaR as well as complementary sensitivity and stress testing metrics. Risks not captured in the VaR model are reported and monitored within the illiquid risk measures as described in “Additional risk measures”. The following table shows the one day 99% VaR-based consolidated exposures for the major risk classes at 31 December 2013, 2012 and 2011, together with the highest, lowest and average exposures for the year. Exposures within each risk class reflect a range of exposures associated with movements in that financial market. The main exposure is due to interest rate risks, e.g. the impact of absolute rate movements and movements between interest rate bases.
The amounts below represent the potential change in market values of trading instruments. Since trading instruments are recorded at market value, these amounts also represent the potential effect on income.
| | | | | | | | | | | | |
| | | Actual exposure at 31 December | |
Trading instruments | | 2013
£m | | | 2012
£m | | | 2011
£m | |
Interest rate risks(1) | | | 1.7 | | | | 2.3 | | | | 1.9 | |
Equity risks(2) | | | 0.5 | | | | 0.9 | | | | 0.5 | |
Spread risks(3) | | | — | | | | — | | | | 0.3 | |
| | | | | | | | | | | | |
Correlation offsets(4) | | | (0.5 | ) | | | (0.6 | ) | | | (0.7 | ) |
| | | | | | | | | | | | |
Total correlated one-day VaR | | | 1.7 | | | | 2.6 | | | | 2.0 | |
| | | | | | | | | | | | |
| | | | | | | | | | | | | | | | | | | | | | | | | | | | | | | | | | | | |
| | | Exposure for the year ended 31 December | |
| | | Average exposure | | | Highest exposure | | | Lowest exposure | |
Trading instruments | | 2013
£m | | | 2012
£m | | | 2011
£m | | | 2013
£m | | | 2012
£m | | | 2011
£m | | | 2013
£m | | | 2012
£m | | | 2011
£m | |
Interest rate risks(1) | | | 3.1 | | | | 2.3 | | | | 1.9 | | | | 4.6 | | | | 3.8 | | | | 2.6 | | | | 1.6 | | | | 1.7 | | | | 1.4 | |
Equity risks(2) | | | 0.8 | | | | 1.0 | | | | 0.5 | | | | 1.2 | | | | 1.4 | | | | 0.7 | | | | 0.5 | | | | 0.6 | | | | 0.2 | |
Spread risks(3) | | | 0.0 | | | | 0.2 | | | | 0.6 | | | | 1.1 | | | | 0.8 | | | | 0.9 | | | | 0.0 | | | | — | | | | 0.2 | |
| | | | | | | | | | | | | | | | | | | | | | | | | | | | | | | | | | | | |
Correlation offsets(4) | | | (0.8 | ) | | | (0.9 | ) | | | (0.6 | ) | | | — | | | | — | | | | — | | | | — | | | | — | | | | — | |
| | | | | | | | | | | | | | | | | | | | | | | | | | | | | | | | | | | | |
Total correlated one-day VaR | | | 3.1 | | | | 2.6 | | | | 2.4 | | | | 5.0 | | | | 3.9 | | | | 3.6 | | | | 1.7 | | | | 1.9 | | | | 1.6 | |
| | | | | | | | | | | | | | | | | | | | | | | | | | | | | | | | | | | | |
| (1) | Interest Rate Risk measures the impact of interest rate and volatility changes on cash instruments, securities and derivatives. This includes swap spread risk (the difference between swap rates and the government bond rates), basis risk (changes in interest rate tenor basis) and inflation risk (changes in inflation rates). |
| (2) | Equity Risk measures the impact on equity stocks and derivatives from changes in equity prices, volatilities and dividends. |
| (3) | Spread risk measures the impact of changes in the credit spread of corporate bonds or credit derivatives. |
| (4) | The highest and lowest exposure figures reported for each risk type did not necessarily occur on the same day as the highest and lowest total correlated one-day VaR. A corresponding correlation offset effect cannot be calculated and is therefore omitted from the above table. |
Commercial Banking daily total correlated one day VaR 2013 (short-term markets business)(unaudited)
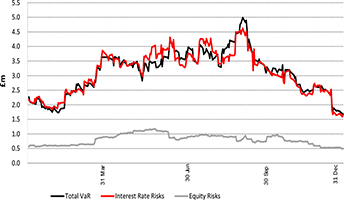
The principal component of VaR in Commercial Banking is interest rate risk. There were no significant changes in Total VaR in 2013, although risk was slightly lower in the year in line with lower floor-wide VaR limits.
| | |
| 126 | | Santander UK plc Annual Report 2013 |
Detailed Business Review
Risk Management Reportcontinued
TRADED MARKET RISK – MARKETS
For trading activities, market risk is measured using VaR as well as complementary sensitivity and stress testing metrics. Risks not captured in the VaR model are reported and monitored within the illiquid risk measures as described in “Additional risk measures”. The following table shows the one day 99% VaR-based consolidated exposures for the major risk classes at 31 December 2013, 2012 and 2011, together with the highest, lowest and average exposures for the year. Exposures within each risk class reflect a range of exposures associated with movements in that financial market.
The main exposures are due to interest rate risks, e.g. the impact of absolute rate movements and movements between interest rate bases, and equity risks. Interest rate exposure is generated through trading activities. The main equity exposures are generated by the creation and risk management of structured products by Markets for the personal financial services market. Spread exposure arises indirectly from trading activities within Markets.
The amounts below represent the potential change in market values of trading instruments. Since trading instruments are recorded at market value, these amounts also represent the potential effect on income.
| | | | | | | | | | | | |
| | | Actual Exposure at 31 December | |
Trading instruments | | 2013
£m | | | 2012
£m | | | 2011
£m | |
Interest rate risks(1) | | | 2.3 | | | | 3.2 | | | | 1.6 | |
Equity risks(2) | | | 1.4 | | | | 4.4 | | | | 5.3 | |
Property risks(3) | | | 0.1 | | | | 2.3 | | | | 2.1 | |
Spread risks(4) | | | 0.3 | | | | 0.2 | | | | — | |
Other risks(5) | | | 0.0 | | | | 0.5 | | | | 1.9 | |
| | | | | | | | | | | | |
Correlation offsets(6) | | | (1.6 | ) | | | (1.9 | ) | | | (2.4 | ) |
| | | | | | | | | | | | |
Total correlated one-day VaR | | | 2.5 | | | | 8.7 | | | | 8.5 | |
| | | | | | | | | | | | |
| | | | | | | | | | | | | | | | | | | | | | | | | | | | | | | | | | | | |
| | | Exposure for the year ended 31 December | |
| | | Average exposure | | | Highest exposure | | | Lowest exposure | |
Trading instruments | | 2013
£m | | | 2012
£m | | | 2011
£m | | | 2013
£m | | | 2012
£m | | | 2011
£m | | | 2013
£m | | | 2012
£m | | | 2011
£m | |
Interest rate risks(1) | | | 2.6 | | | | 3.0 | | | | 2.3 | | | | 4.4 | | | | 5.2 | | | | 3.8 | | | | 1.7 | | | | 1.7 | | | | 1.2 | |
Equity risks(2) | | | 1.9 | | | | 5.0 | | | | 2.6 | | | | 4.6 | | | | 8.0 | | | | 6.9 | | | | 0.7 | | | | 3.5 | | | | 0.6 | |
Property risks(3) | | | 0.1 | | | | 2.1 | | | | 2.2 | | | | 0.2 | | | | 2.5 | | | | 2.9 | | | | 0.0 | | | | 1.3 | | | | 1.9 | |
Spread risks(4) | | | 0.4 | | | | 0.1 | | | | — | | | | 1.0 | | | | 0.4 | | | | — | | | | 0.2 | | | | — | | | | — | |
Other risks(5) | | | 0.1 | | | | 1.0 | | | | 0.4 | | | | 0.5 | | | | 2.3 | | | | 1.9 | | | | — | | | | 0.4 | | | | 0.2 | |
| | | | | | | | | | | | | | | | | | | | | | | | | | | | | | | | | | | | |
Correlation offsets(6) | | | (1.9 | ) | | | (2.4 | ) | | | (1.1 | ) | | | — | | | | — | | | | — | | | | — | | | | — | | | | — | |
| | | | | | | | | | | | | | | | | | | | | | | | | | | | | | | | | | | | |
Total correlated one-day VaR | | | 3.2 | | | | 8.8 | | | | 6.4 | | | | 6.5 | | | | 12.9 | | | | 10.0 | | | | 1.9 | | | | 6.9 | | | | 3.9 | |
| | | | | | | | | | | | | | | | | | | | | | | | | | | | | | | | | | | | |
| (1) | Interest Rate Risk measures the impact of interest rate and volatility changes on cash instruments, securities and derivatives. This includes swap spread risk (the difference between swap rates and the government bond rates), basis risk (changes in interest rate tenor basis) and inflation risk (changes in inflation rates). |
| (2) | Equity Risk measures the impact on equity stocks and derivatives from changes in equity prices, volatilities and dividends. |
| (3) | Property risk measures the impact of changes in the property indices. |
| (4) | Spread risk measures the impact of changes in the credit spread of corporate bonds or credit derivatives. |
| (5) | Other risks include foreign exchange risk. FX Risk measures the impact of changes in foreign exchange rates and volatilities. |
| (6) | The highest and lowest exposure figures reported for each risk type did not necessarily occur on the same day as the highest and lowest total correlated one-day VaR. A corresponding correlation offset effect cannot be calculated and is therefore omitted from the above table. |
With effect from 1 January 2013, the tables above consist of VaR-based metrics only. For 2012 and 2011, the tables include results of both VaR and non-VaR-based metrics. If the 2013 presentation were applied to the 2012 data, the total correlated average one-day VaR would decrease by £5.1m to £3.6m.
Markets daily total correlated one day VaR 2013(unaudited)
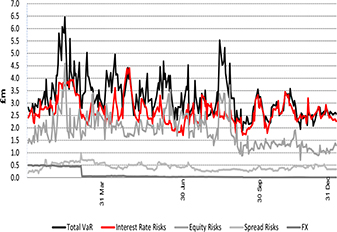
The principal components of the movements in Total VaR were changes in Interest Rate risks and Equity risks.
| | |
| Santander UK plc Annual Report 2013 | | 127 |
Detailed Business Review
Risk Management Reportcontinued
STRUCTURAL RISK
INTRODUCTION
Structural risk includes exposures arising as a result of the structure of portfolios of assets and liabilities, or where the liquidity of the market is such that the exposure could not be closed out over a short-time horizon. The risk exposure is generated by features inherent in either a product or portfolio and normally presented over the life of the product or portfolio. Such exposures are a result of the decision to undertake specific business activities, can take a number of different forms, and are generally managed over a longer-time horizon. Through the internal transfer pricing mechanism, material structural risks arising from divisions are transferred from the originating business to FMIR in Corporate Centre where they are monitored, controlled and managed holistically in conjunction with exposures arising from the funding, liquidity or capital management activities of FMIR.
There are four key areas of structural risk within Santander UK, which are discussed in the sections that follow. These are:
| | • | | Non-traded market risk; |
| | • | | Liquidity and funding risk; and |
NON-TRADED MARKET RISK
Non-traded market risk mainly arises through the provision of banking products and services to personal and corporate/business customers, as well as structural exposures arising in Santander UK’s balance sheet.
There are three business segments where non-traded market risk is permitted, controlled and managed:
All non-traded market risks arising from Retail Banking and Commercial Banking business segments are substantially transferred from the originating business to Corporate Centre.
Non-traded market risks are originated in Retail Banking and Commercial Banking only as a by-product of writing customer business and are typically transferred from the originating business to the Corporate Centre. Funds received with respect to deposits taken are lent on to Corporate Centre on matching terms as regards interest rate re-pricing and maturity; in a similar manner loans are funded through matching borrowings. Market risks arising from structured products, including exposure to changes in the levels of equity markets, are hedged with Markets. Only short-term mismatches due to forecasting variances in prepayment and launch risk exposures are retained within Retail Banking and Commercial Banking.
As a consequence of the transfer processes described above, all material non-traded market risk exposures are substantially transferred to and reside in Corporate Centre.
| | |
| Risk management and control |
| | • | | Non-traded market risk is controlled in line with the Structural Risk Framework. Risk Appetite is articulated by both the income and value sensitivity limits set in accordance with the Santander UK Board Risk Appetite and by the limits for Net Interest Margin (‘NIM’) and Economic Value of Equity (‘EVE’) sensitivities set by the Banco Santander group. |
| | • | | ALCO is responsible for managing the risk exposure of Santander UK within limits. In addition, a series of lower level risk limits and triggers are used to highlight when exposures are nearing limits and to control other material risk types, such as Basis Risk. |
| | • | | To manage interest rate risk within the banking book balance sheet a combination of derivatives (typically interest rate swaps) and natural offsets between asset and liability positions are used. Monthly reporting of positions is provided to Balance Sheet Management Risk Forum which reports into, ALCO and Risk Management Committee. |
| | |
| 128 | | Santander UK plc Annual Report 2013 |
Detailed Business Review
Risk Management Reportcontinued
Risk measures
| | • | | For business as usual risk measurement, sensitivities are a key risk measure. Sensitivities measure the impact of standard instantaneous parallel shifts in relevant yield curves (subject to a 0% interest rate floor where applicable). The advantage of using standard parallel shocks are that generally they provide a constant measure of the size of market risk exposure in the balance sheet, with a simple and consistent stress. This compares to specific scenarios such as ‘flat rates’, the magnitude of which will depend on the shape of the current curve and hence shift required to reach the flat rate scenario. An exception to the relative simplicity of parallel yield curve shocks can be when the yield curve is ‘floored’ at 0%, which can then result in non parallel down shocks. For income sensitivity measures, the period measured is typically twelve months, while for value sensitivity measures the period measured typically covers the life of the current balance sheet. |
| | • | | The disadvantages of using material parallel shocks are that the shocks may not be perceived as realistic, or necessarily test the scenarios that have the most impact on the Santander UK group. As a result, non-parallel stress tests are also run to calculate the impact of a range of plausible non-parallel scenarios, and over a range of time periods for income stresses (typically either 1 year or 3 years). |
| | • | | Stress testing of market risk factors is used to complement the risk measurement provided by standard sensitivities. Simple stress tests, such as parallel shifts in relevant curves, serve to provide transparent measures of risk control and provide a consistent starting point for limit setting. More complex, multi-factor and multi-time period stress tests can give management information about specific potential events, and test a range of outcomes that may not be captured through parallel stresses, or VaR-type measures due to limitations of historical data or specific models. Stress tests can also be used to assess the magnitude of losses in extreme market events beyond the confidence level used in VaR models. |
| | • | | Stress testing results are discussed at senior level management committees. They influence decision making by Corporate Centre by highlighting potential risks in the banking book and the impact of remedial actions that could be taken to mitigate positions. The stress test results are contrasted against stress limits and triggers set by Santander UK internal committees, or against metrics set by the regulator. If results are to be found in excess of the limits or triggers, remedial management actions and a relevant escalation process is followed. Stress tests can be adapted to reflect current concerns or market conditions more rapidly than other risk measures such as VaR. Stress testing can include both individual business area stresses and Santander UK-wide scenarios |
| | • | | Within Santander UK, stress tests are either: a) specific, deterministic stress tests not referenced to market history or expectations (e.g. parallel stresses of a given size), b) historic deterministic stress tests, with changes in market risk factors either based on specific events in the past (e.g. the situation in the fourth quarter of 2008) or based on a statistical analysis of changes in the past, or c) hypothetical deterministic stress tests, with the change in market risk factors based on a judgement of potential future rates in a given scenario. |
| | • | | Stress tests can be produced using either income or value measures. They may cover one or more category of exposures accounted for on an accruals basis or at fair value (either through the income statement or through other comprehensive income). Expert judgement is used both in defining appropriate hypothetical stress tests and as appropriate adjusting assumptions regarding the balance sheet, management actions and customer behaviour. |
| | • | | In addition to sensitivities and stress tests, non traded market risk can be measured using net notional positions. This can have the advantage of providing a simple expression of exposure, although typically needs to be combined with other risk measures to reflect all aspects of a risk profile such as projected changes over time. |
| | • | | The main remaining metric to quantify market risk is a statistical risk measure, VaR. VaR estimates the potential loss of economic value arising from unfavourable market moves and is calculated using a historical simulation method with two-years of daily market data history, equally weighted. In accordance with the standard used throughout the Banco Santander group, the Santander UK Internal VaR calculation uses a one day time horizon and a 99% confidence level. This means that conditional on today’s positions, Santander UK would expect to incur losses of economic value exceeding the predicted VaR estimate one in every 100 working days, or about two to three times a year. Whilst VaR measures can be a useful risk metric as they capture changes in economic values, VaR won’t reflect the actual impact on the Income Statement of the majority of the assets and liabilities on the banking book balance sheet as they are accrual accounted. |
| | |
| Santander UK plc Annual Report 2013 | | 129 |
Detailed Business Review
Risk Management Reportcontinued
Types of non-traded market risk
Yield Curve Risk
Yield curve risk arises from the timing mismatch in the re-pricing of fixed and variable rate assets, liabilities and off-balance sheet instruments, as well as the investment of non-interest-bearing liabilities in interest-bearing assets.
For yield curve risk, Santander UK predominantly measures its market risk exposures with both NIM and EVE sensitivity analysis supplemented by the other risk measures, such as stress testing, and VaR. NIM and EVE measures are commonly used throughout the financial services industry as measures for managing market risk across non-traded portfolios. The NIM and EVE measures in Santander UK cover all material yield curve risk within the Santander UK banking book balance sheet.
NIM sensitivity measures the change in net interest income over a given period. It is calculated by simulating the net interest margin using current yield curve and net interest margin following a change in yield curves. The difference between the two net interest margin totals is the NIM sensitivity. The main model assumptions are:
| | • | | The balance sheet is dynamic (it includes the run-off of current assets and liabilities as well as retained and new volumes); and |
| | • | | Behavioural rather than contractual balance sheet is used (balances are adjusted for behavioural or assumed profile for most retail products where the behavioural maturity of products is less than the contractual maturity due to customers exercising the option for early withdrawal or prepayment, or where there is no contractual maturity). |
The time horizon for business as usual NIM metrics used for risk control is 12 months.
EVE is calculated as the change in the net present value of all of the interest rate sensitive items in the banking book balance sheet for a defined set of instantaneous parallel shifts in the yield curve. A static balance sheet is used, i.e. all balance sheet items at the reporting date run off according to their contractual, behavioural or assumed run-off behaviour as appropriate and there is no explicit retained or new volume.
The behavioural assumptions involved in the NIM and EVE sensitivity calculation, including the above-mentioned prepayment risk, form a key part of the overall control framework and are updated and reviewed on an ongoing basis.
The NIM and EVE metrics include the interest rate risk from all material Santander UK banking book positions as shown in the table on page 122 analysing balance sheet positions between banking book and trading book. The banking book positions generate almost all the reported net interest income in Santander UK.
For business as usual risk management, control and reporting, the impact of instantaneous +/-25, 50, 75, 100 and 200 basis point parallel shifts in all yield curves are calculated (subject to 0% interest rate floor and measured against limits).
To assist in the management of the balance sheet exposures, these NIM and EVE sensitivities are supplemented with additional management information including details of net notional positions and net re-pricing profiles.
The table below reflects how base case income and valuation across the Santander UK group would be affected by a 100 basis point parallel shift (both upwards and downwards) applied instantaneously to the yield curve. Sensitivity to 100bps shifts are shown as they are simple, easily scaleable, and this is typically the size of shift focussed on most across the Santander UK group (although sensitivities to other parallel shifts are also monitored monthly). For comparison purposes these measures are shown at 31 December 2013 and 2012:
| | | | | | | | | | | | | | | | |
| | | 31 December 2013 | | | 31 December 2012 | |
| | | +100bps
£m | | | -100bps
£m | | | +100bps
£m | | | -100bps
£m | |
NIM sensitivity | | | 181 | | | | 87 | | | | 343 | | | | 13 | |
EVE sensitivity | | | 49 | | | | (16 | ) | | | 405 | | | | (203 | ) |
| | | | | | | | | | | | | | | | |
The change in the sensitivities between 2012 and 2013 was largely attributable to the hedging strategy implemented over the middle of 2013 with the aim of hedging the risk of interest rates being lower for longer, and to the changes in balance sheet positions following the rise in the yield curve later in 2013.
Basis Risk
Basis risk exists when assets are priced using a different rate index than the liabilities funding them. In particular, Santander UK has a potential exposure to basis risk arising from the divergence between base rate linked rates earned on customer assets and wholesale (LIBOR-linked) rates paid on liabilities funding the customer assets. Santander UK is also exposed to basis risks associated with reserve rate linked assets deposited with central banks and funded at LIBOR rates. Other basis risks that Santander UK is exposed to include between the Bank of England Base Rate and the Sterling Overnight Index Average (‘SONIA’) rate, where SONIA linked swaps are used to hedge base rate exposures, and between LIBOR rates of different terms.
Basis risk is measured using a variety of risk measures. The net administered / base linked position is measured against notional position triggers. The basis risk between the Bank of England Base Rate and LIBOR is also captured through a VaR measure. The VaR measure uses the same Historical Simulation VaR methodology as that for the trading book, i.e. expected loss with a confidence level of 99% with one day time horizon, using 520-day historical market data.
The Santander UK Basis Risk VaR (99% confidence level 1 day) at 31 December 2013 was £7.7m (2012: £10.5m). It reflects the basis risk exposure between Bank of England Base Rate and LIBOR. The decrease during 2013 was due to greater diversification of exposures.
| | |
| 130 | | Santander UK plc Annual Report 2013 |
Detailed Business Review
Risk Management Reportcontinued
Behavioural Risks
Behavioural risks arise from features in retail products that give customers the right to alter the expected cash flows of a financial contract. For example, prepayment risk, where customers may prepay loans before their contractual maturity. Santander UK is also exposed to product launch risk, where the customers may not take the expected volume of new mortgages or other products. Behavioural risks are monitored and controlled through both risk measures such as VaR, and through product design.
Inflation and Spread Risks
Inflation and swap spread and credit spread risk exist where the value of, or income from, assets or liabilities can change due to changes in the market levels of inflation and spreads. Santander UK holds a portfolio of securities in the banking book balance sheet for liquidity and investment purposes (the Liquid Asset Portfolio and the ALCO portfolio) which are exposed to these risk types. These portfolios are accounted for as available-for-sale securities, and volatility in the value of the assets continuing to be held in these portfolios is recognised in Other Comprehensive Income, unless it reflects impairment in the fair value of the securities, at which point it is recognised in the income statement.
The market risks of these portfolios are monitored through daily reporting of sensitivities, VaR and stress tests which are reported against limits and triggers daily to senior management and monthly to ALCO and Risk Management Committee. The VaR measures reported capture all key sources of volatility, including interest rate risk as well as inflation and spread risks, to fully reflect the potential available-for-sale volatility.
The available-for-sale volatility from the Santander UK ALCO Portfolio and Liquid Asset Portfolio positions VaR (95% confidence level, 1 day) at 31 December 2013 was £4.7m (2012: £7.6m). This includes the inflation and spread risk exposures of these positions. VaR for the individual risk types is not reported separately. The decrease in VaR over the year was due to a change in the composition of the government bond portfolio.
The portfolio of securities held for liquidity and investment purposes is regularly stress tested against a variety of historical and hypothetical scenarios. There are limits established against the potential losses estimated by the stress tests that complement the VaR-based limits discussed in the inflation and spread risk section above.
At 31 December 2013, the worst 1 month stressed loss for the Santander UK available-for-sale accounted portfolios was estimated to be £139m using historic deterministic stress tests (2012: £143m).
Foreign exchange risk
Santander UK’s non-trading businesses operate mainly in sterling markets and therefore, with the exception of funding raised in foreign currencies (see Wholesale Funding on page 142), do not originate significant foreign exchange exposures. Foreign currency funding positions are hedged back to sterling. Any foreign exchange positions Santander UK does have (either for instance to ‘spot’ foreign exchange rates or to cross currency basis) are typically residual exposures remaining after hedging. Foreign exchange risk is monitored against absolute net exposures and VaR-based limits and triggers.
Income statement volatility arising from different accounting treatments
The majority of the assets and liabilities in the Santander UK banking book balance sheet are accrual accounted. The risk profile from these assets and liabilities is in some cases managed with the use of derivatives. As all derivatives are accounted for at fair value, this difference in accounting treatment can lead to reported volatility in the income statement, even where the derivative is an economic hedge of the asset or liability.
This volatility is largely mitigated through the use of hedge accounting. Any hedge accounting ineffectiveness which may lead to income statement volatility is monitored using a VaR measure and trigger, reported monthly. Details of Santander UK’s accounting policies for derivatives and hedge accounting can be found in Note 1 to the Consolidated Financial Statements.
Regulatory and Economic Capital(unaudited)
Capital is held for market risks in the banking book to protect against future changes in value as a result of movements in non-traded market risk factors such as interest rates and basis risk.
Regulatory Capital (‘RC’) held in Pillar 2 for interest rate risk in the banking book is measured as the amount of capital required to absorb losses in the event of an adverse shock equivalent to a 1 in 200 event (99.5% confidence level) over a given time horizon. RC is measured using the current, static balance sheet, with no new volume assumptions.
In line with Banco Santander group policy, Economic Capital (‘EC’) is measured as the amount of capital required to absorb losses in the event of an adverse shock equivalent to a 1 in 2,000 event (99.95% confidence level) over a given time horizon. This confidence level is reviewed periodically. EC is measured using the current, static balance sheet, with no new volume assumptions. There are no significant differences between the approach used for calculating EC and the approach used for calculating EVE sensitivities used for business as usual risk monitoring and control.
For both Regulatory and Economic Capital, an overall diversified capital figure for all risk factors combined is calculated using Historical Simulation VaR. This VaR measure uses a combination of relative shifts, for risk factors such as interest rates, and absolute shifts, for risk factors such as swap spread, as appropriate.
| | |
| Santander UK plc Annual Report 2013 | | 131 |
Detailed Business Review
Risk Management Reportcontinued
PENSION RISK(unaudited)
Pension risk is the risk to the company caused by its contractual or other liabilities to or with respect to a pension scheme (whether established for its employees or those of a related company or otherwise). It also refers to the risk that a company will make payments or other contributions to or with respect to a pension scheme because of a moral obligation or because the company considers that it needs to do so for some other reason.
Pension risk arises from the defined benefit schemes to the extent that the assets of the schemes do not fully match the timing and amount of the schemes’ liabilities due to the uncertainty of future investment returns and the projected value of schemes’ liabilities. This introduces volatility into the accounting position and the funding level of the schemes, which in turn may require additional contributions to be made to the schemes by Santander UK. Key risk factors that affect pension risk include long term interest rates, inflation expectations, salary growth, longevity of the scheme members, investment performance as well as changes in the regulatory environment.
Pension risk is a key risk that Santander UK faces. For instance, deterioration in the funding valuation position can result in a requirement to make material contributions to eliminate deficits, as mentioned above. Alternatively, changes in the accounting position can impact on capital ratios (when schemes are in deficit). Santander UK manages the risk it faces as a sponsor of the Santander (UK) Group Pension Scheme (the “Scheme”) using a framework covering risk appetite articulation, risk reporting, monitoring and stress testing within the agreed governance structure.
| | • | | Within the wider Risk Framework, Santander UK has articulated a risk appetite for pensions. Pension risk is monitored on a monthly basis by the CRMO and reported against the appetite on a regular basis to the Risk Management Committee, Executive Risk Committee, Operational Pensions Committee and the SPC. The SPC and Operational Pensions Committee are established to help the CEO and Chief Financial Officer (‘CFO’), respectively, to discharge their primary executive responsibility and delegated responsibility for pensions. |
| | • | | The assets of the Scheme are held separately from the assets of Santander UK. The trustees of the pension scheme have the ultimate responsibility for the investment strategy of the Scheme’s assets and maintain a Statement of Investment Principles that is agreed with Santander UK. |
Responsibility for investment and hedging decisions within the scheme has been delegated to the Santander UK Common Investment Fund that is managed by the Santander (CF Trustee) Board (jointly referred to as the “Common Fund”).The Common Fund has two independent trustees, one member-nominated trustee and four directors selected by Santander UK. The Santander (CF Trustee) Board meets on a monthly basis and is the primary forum for Santander UK and the trustees to propose, discuss, analyse and agree investment and risk management strategies within the pension scheme, taking into account amongst other things the Statement of Investment Principles, the key risk factors and the risk appetite mentioned. In these discussions, the Santander UK group’s views from the Operational Pensions Committee and SPC are represented principally by the Director of Pensions.
| | • | | Reporting takes the form of a number of different risk metrics, including forward-looking and historic stress test scenarios, risk factor sensitivities and a stochastic VaR measure. The primary VaR measurement is carried out at a 95% confidence level over a one-year time horizon, calibrated to 10 years of historic data and uses industry standard modelling techniques. Risk measures are calculated on both an accounting valuation basis and a technical provisions (funding) valuation basis. The funding valuation basis has been the primary focus in pension risk management decision making, although the impact on the accounting valuation basis is also considered. Both the funding valuation basis and the accounting valuation basis are key inputs into capital calculations. |
During 2013, investment and hedging strategies were reviewed, updated and the risk profile of the Scheme reduced. This was achieved mainly through increasing the hedging of the scheme liabilities through the transaction of derivatives to hedge interest rates and inflation, and the purchase of long dated bonds. Over the year, VaR on a funding valuation basis decreased from £1,020m to £950m, driven by the actions above, partially offset by an increase in the absolute size of the value of the liabilities due to market moves. The focus remains on positive performance of the assets relative to liabilities, whilst managing volatility through hedging a proportion of the liabilities with bond assets and derivatives.
The accounting deficit of the Scheme deteriorated by £503m during 2013. However, the Scheme was managed to within the risk triggers over the year, and so from a risk perspective whilst this deterioration was material it was consistent with the current risk appetite. The deterioration was equivalent to approximately a 1-in-10 year event.
Further information on Santander UK’s pension obligations, including the current asset allocation and sensitivity to key risk factors can be found in ‘Critical Accounting Policies’ in Note 1 and in Note 37 to the Consolidated Financial Statements.
| | |
| 132 | | Santander UK plc Annual Report 2013 |
Detailed Business Review
Risk Management Reportcontinued
LIQUIDITY AND FUNDING RISK
INTRODUCTION
Liquidity and funding risk is managed on a Santander UK group basis. In addition, under the PRA’s regulatory liquidity regime, Santander UK and its subsidiaries Abbey National Treasury Services plc and Cater Allen Limited form the Santander UK Defined Liquidity Group (‘DLG’). Under these arrangements, each member of the DLG is liable to support each other in terms of transferring or receiving surplus liquidity in times of stress.
Santander UK views liquidity and funding risk management as maintaining prudent levels of highly liquid assets, managing potential cash outflows and ensuring that access to funding is available from a diverse range of sources. The Board targets a funding strategy that avoids excessive reliance on short term markets and attracts enduring commercial deposits, avoiding an over reliance on less stable commercial funds. The strategy also ensures effective diversification in the sources, products and tenor of funding, as well as maintaining the capacity to raise additional unplanned funding from those sources quickly.
Santander UK primarily generates funding and liquidity through UK retail and corporate deposits, as well as in the financial markets through its own debt programmes and facilities supporting its business activities and liquidity requirements. It does this based on the strength of its balance sheet, its profitability and its own network of investors. It does not rely on a guarantee from Banco Santander, S.A. or any other member of the Banco Santander group to generate this funding or liquidity. Santander UK does not raise funds to finance other members of the Banco Santander group or guarantee the debts of other members of the Banco Santander group (other than certain of Santander UK plc’s own subsidiaries).
Whilst Santander UK manages its funding and maintains adequate liquidity on a stand-alone basis, Santander UK coordinates issuance plans with the Banco Santander group where appropriate. In addition to Santander UK’s liquidity risk being consolidated and centrally controlled, liquidity risk is also measured, monitored and controlled within the specific business area or the subsidiary where it arises.
Liquidity and funding risks are identified and encompassed within Santander UK’s Risk Framework and subject to Santander UK’s three lines of defence risk governance framework. The Board delegates day-to-day responsibility for liquidity risk to the CEO. The CEO has in turn delegated the responsibilities for liquidity and funding risk management to the CFO (who in turn delegates to the Finance Director). Delegated authority is given to the CRMO for liquidity and funding risk control.
Adherence to Santander UK’s liquidity and funding risk appetite is monitored on a daily, weekly and monthly basis through different committees and levels of management including ALCO, the Risk Management Committee, and the Board Risk Committee. ALCO is responsible for overseeing the management of Santander UK’s balance sheet in accordance with the Board-approved funding plan and for ensuring that the adequacy of liquidity and appropriateness of funding are consistent with risk appetite. This includes consideration of relevant macro-economic factors and conditions in the financial markets.
DEFINITIONS
| | • | | Liquidity risk is the risk that Santander UK, although solvent, either does not have available sufficient financial resources to enable it to meet its obligations as they fall due, or can secure them only at excessive cost. |
| | • | | Funding risk is the risk that Santander UK does not have sufficiently stable and diverse sources of funding or the funding structure is inefficient. Risks arising from the encumbrance of assets are also included within this definition. |
LIQUIDITY RISK
Santander UK’s key ongoing liquidity risks are:
| | |
KEY LIQUIDITY RISK | | DEFINITION |
| |
• Retail funding risk | | Risk of loss of retail deposits. |
| |
• Corporate funding risk | | Risk of loss of corporate deposits. |
| |
• Wholesale secured and unsecured funding risk | | Risk of wholesale unsecured and secured deposits failing to roll over. |
| |
• Derivatives and contingent liquidity risks | | Risk of ratings downgrades that could trigger events leading to increased outflows of financial resources, for example, to cover additional margin or collateral requirements. Collateral calls on derivatives may also arise at times of market stress and when asset liquidity may be tightening. |
| | |
| Santander UK plc Annual Report 2013 | | 133 |
Detailed Business Review
Risk Management Reportcontinued
LIQUIDITY RISK APPETITE(unaudited)
The Board’s risk objective is to be a risk resilient institution at all times, and to be perceived as such by stakeholders, preserving the short and long-term viability of Santander UK. The Board recognises that a bank engaging in maturity transformation cannot hold sufficient liquidity to cover all possible stress scenarios but requires Santander UK to hold sufficient liquidity to ensure that it will survive the current most plausible stress scenario through a prudent balance sheet structure and the maintenance of approved liquid resources. The scenario is regularly reviewed to ensure that it reflects the current economic and market environment.
The Liquidity Risk Appetite statement is set in the context of principles of liquidity management, by which Santander UK chooses to manage its balance sheet, and the desire to meet or exceed regulatory requirements. The liquidity management principles include:
| | • | | Implementation of a funding structure that is consistent with the composition of the asset base; |
| | • | | Maintenance of an appropriate mix of ‘sticky’ and ‘non-sticky’ retail deposit balances avoiding over reliance on the latter; |
| | • | | Well-balanced growth of assets and liabilities; |
| | • | | Implementation of a funding strategy that: |
| | • | | avoids excessive reliance on short-term wholesale funding, attracts sustainable commercial deposits; |
| | • | | provides effective diversification in the sources, products and tenor of funding; and |
| | • | | complies with internal encumbrance policy; |
| | • | | Use of long-term funding to provide diversification, manage the liquidity structure of the balance sheet and support liquid resources. |
The principles set by the Board are underpinned by Santander UK Risk Management Framework.
A stress test framework is in place and run independently by the Risk function on a daily basis. The stress under the Santander UK Liquidity Risk Appetite must be fully covered with high quality liquid assets whilst the outcome of other stress tests must be covered with a combination of high quality liquid assets, other assets and management actions as sanctioned by the Executive Risk Committee.
| | • | | The Santander UK Liquidity Risk Appetite has been recommended by the CEO and approved by the Board, under advice from the Board Risk Committee. The Liquidity Risk Appetite, within the context of the overall Risk Appetite, is reviewed and approved by the Board at least annually or more frequently if necessary (e.g. in the case of significant methodological or business change). This is designed to ensure that the Liquidity Risk Appetite will continue to be consistent with Santander UK’s current and planned business activities. |
| | • | | The CEO, under advice from the Board Risk Committee, approves more detailed allocation of liquidity risk limits. The CRO, supported by the Risk Division (including the Deputy CRO, CRMO, and the Director of Liquidity and Banking Market Risk), is responsible for monitoring the ongoing compliance with the liquidity risk appetite. |
In addition to the Liquidity Risk Appetite, Santander UK also complies with regulatory requirements set by the PRA, other regulatory bodies and Banco Santander group standards. New requirements such as Liquidity Coverage Ratio (‘LCR’) and Net Stable Funding Ratio (‘NSFR’) which will be introduced under the Basel III regime are being actively monitored at a Santander UK group level. Reporting processes are being developed to ensure compliance with these ratios when they are formally adopted. At 31 December 2013, both the LCR and NSFR were in excess of 100%. The LCR is tracked at key governance committees including ALCO.
The tables below show the basis of liquidity ratios that are tracked and also the current level of LCR and LRA. Santander UK reviewed and revised its liquidity risk appetite in 2013 and it was updated to represent the coverage of the current most plausible stress by qualifying liquid resources. The LRA for 2012 is restated on the same basis as that of 2013. The restated figure can therefore provide a general comparison but changes in the economic and market environment, which improved markedly in 2013, provide an additional context for the two sets of figures.
Compliance with internal and regulatory stress tests
| | | | | | | | | | | | | | | | |
| | | 2013 | | | 2013 | | | 2012 | | | 2012 | |
| | | Bank LRA
(two month
Bank specific
requirement)
£bn | | | Estimated
Basel III LCR
(revised text
January 2013)
£bn | | | Bank LRA
(two month
Bank restated
specific
requirement)
£bn | | | Estimated
Basel III LCR
(revised text
January 2013)
£bn | |
Eligible liquidity pool | | | 27.2 | | | | 31.8 | | | | 38.1 | | | | 40.5 | |
| | | | | | | | | | | | | | | | |
Asset inflows | | | 0.6 | | | | 0.9 | | | | 1.5 | | | | 1.3 | |
Stress outflows: | | | | | | | | | | | | | | | | |
Retail and commercial deposit outflows | | | (4.7 | ) | | | (6.2 | ) | | | (4.7 | ) | | | (5.9 | ) |
Wholesale funding and derivatives | | | (2.1 | ) | | | (13.8 | ) | | | (5.5 | ) | | | (18.1 | ) |
Contractual credit rating downgrade exposure | | | (6.6 | ) | | | (9.2 | ) | | | (8.6 | ) | | | (11.7 | ) |
Drawdowns of loan commitments | | | (2.2 | ) | | | (2.6 | ) | | | (1.5 | ) | | | (1.8 | ) |
Other | | | (1.6 | ) | | | — | | | | (2.6 | ) | | | — | |
| | | | | | | | | | | | | | | | |
Total stress net cash outflows | | | (16.6 | ) | | | (30.9 | ) | | | (21.4 | ) | | | (36.2 | ) |
| | | | | | | | | | | | | | | | |
Surplus | | | 10.6 | | | | 0.9 | | | | 16.7 | | | | 4.3 | |
| | | | | | | | | | | | | | | | |
Liquidity pool as a percentage of anticipated net cash flows | | | 164 | % | | | 103 | % | | | 178 | % | | | 112 | % |
| | | | | | | | | | | | | | | | |
| | |
| 134 | | Santander UK plc Annual Report 2013 |
Detailed Business Review
Risk Management Reportcontinued
LIQUIDITY RISK MANAGEMENT
|
| APPROACH TO LIQUIDITY RISK |
| | • | | Liquidity risk is managed under a comprehensive and prudent liquidity risk management framework. |
| | • | | The primary objective of the framework is to ensure that Santander UK is liquidity risk resilient by holding sufficient financial resources and planned liquidity enhancing actions to comply with internal Liquidity Risk Appetite and regulatory requirements. |
| | • | | Liquidity management is the responsibility of the CFO, who delegates day-to-day responsibility to the Finance Director. |
| | • | | Liquidity risk control and oversight are provided by the CRO, supported by the Deputy CRO and the Risk Division. |
The key element of Santander UK’s liquidity risk management is focused on holding sufficient liquidity to withstand a series of stress tests. Within the framework of prudent funding and liquidity management, Santander UK manages its activities to minimise liquidity risk, differentiating between short-term and strategic activities.
| | |
| Short-term tactical liquidity management |
| |
• Liquid resources | | Liquid assets, contingent liquidity and defined management actions to source liquidity are maintained to cover unexpected demands on cash in a most likely plausible stress scenario and other more distant and severe but less probable scenarios. In Santander UK’s case, the most significant stress events include large and unexpected deposit withdrawals by retail customers and a loss of unsecured wholesale funding. |
| |
• Funding profile | | Metrics to help control the level of outflow within different maturity buckets. |
| |
• Intra-day collateral management | | To ensure that adequate collateral is available to support Santander UK’s participation in various payment and settlement systems. |
| Strategic funding management |
| |
• Structural balance sheet shape | | To manage the extent of maturity transformation (investment of shorter term funding in longer term assets), the funding of non-marketable assets with wholesale funding and the extent to which non-marketable assets can be used to generate liquidity. |
| |
• Wholesale funding strategy | | To avoid over-reliance on any individual counterparty, currency, market or product, or group of counterparties, currencies, markets or products that may become highly correlated in a stress scenario; and to avoid excessive concentrations in the maturity of wholesale funding. |
| |
• Wholesale funding capacity | | To maintain and promote counterparty relationships, monitor line availability and ensure funding capacity is maintained through ongoing use of lines and markets. |
Collateral calls on derivatives positions can pose a liquidity risk. Collateral calls may arise at times of market stress and when asset liquidity may be tightening. The timing of the cash flows on a derivative hedging an asset may be different to the timing of the cash flows of the asset being hedged, even if they are similar in all other respects. Collateral calls may be triggered by a credit downgrading. Santander UK manages these risks by including collateral calls in stress tests on liquidity, and by maintaining a portfolio of assets held for managing liquidity risk.
Risk limits and triggers are set for the key tactical and strategic liquidity risk drivers. These are monitored by the Risk Division and reported monthly to ALCO, the Risk Management Committee and the Board.
Santander UK manages liquidity internally on a consolidated basis and creates governance, oversight arrangements, its Liquidity Risk Appetite and associated control framework on this basis. By doing this, the funding requirements and liquidity risks of all subsidiaries of the Santander UK group are managed effectively as part of ongoing operations. Within this model, Santander UK accommodates its DLG which does not include all subsidiaries and is the basis of the oversight regime of the PRA as UK regulator. Santander UK ensures that liquidity flows between the DLG and other business within the Santander UK group are managed efficiently.
| | |
| Santander UK plc Annual Report 2013 | | 135 |
Detailed Business Review
Risk Management Reportcontinued
Operational management of liquidity risk(unaudited)
Santander UK maintains, as part of its overall liquidity and funding risk management framework, strong operational and management governance that seeks to make the Santander UK strategy as resilient as possible to potential liquidity stresses by structuring the balance sheet in a prudent and sensible way. The Board’s Liquidity Risk Appetite defines the balance sheet principles that operational management is tasked to deliver through a set of key structural metrics. It also defines the stress scenarios that Santander UK models and ensures are covered with appropriate liquidity resource and liquidity enhancing management actions.
The CFO has delegated responsibility for day-to-day management of liquidity risk to the Finance Director, and his Deputy, who in turn delegates to the Director, ALM; the Director, Funding; and the Head of Short Term Markets. These management processes are reviewed and challenged by the independent Risk function and overseen by ALCO and the Risk Management Committee.
The Director, ALM is responsible for strategic liquidity management to ensure that the business remains within appetite. His responsibilities include:
| | • | | The proposition of the Liquidity Risk Appetite; |
| | • | | Internal liquidity transfer pricing; |
| | • | | The design and maintenance of the Recovery Framework; and |
| | • | | The management of specific liquid resources. |
The Director, Funding and Collateral Risk Management is responsible for short and term funding in both secured and unsecured markets. The Head of Short Term Markets is in charge of day-to-day operational liquidity management. This encompasses collateral management of highly liquid resources, including central bank reserves, and intra-day liquidity.
STRESS TESTING(unaudited)
In addition to regulatory requirements, Santander UK runs stress tests on a regular basis to ensure it is holding sufficient financial resources. These stress tests consist of:
| | |
ACTIVITY | | DESCRIPTION |
| |
• Santander UK Liquidity Risk Appetite stress and other holistic liquidity stresses | | Comprehensive stress tests considering all risk drivers applicable to Santander UK during an idiosyncratic shock experienced during a protracted market-wide stress. |
| |
• US stress | | Stress tests designed to examine the impact of a loss of US investor confidence materially affecting Santander UK’s ability to access US funding markets. |
| |
• Acute retail stress | | Stress tests examining the impact of a loss of retail depositor confidence, leading to significant and acute deposit outflows. |
| |
• Slow bleed stress | | Stress tests designed to examine the impact of a protracted leakage of deposits. |
| |
• Wholesale stress | | A stress test where a loss of corporate and wholesale customer confidence in Santander UK results in a protracted leakage of deposits. |
| |
• Eurozone stress | | Santander UK also stress tests a more extreme scenario where a significant deterioration in the Eurozone economies has a knock-on (or contagion) effect to Santander UK, leading to severe liability outflows and rating agency action. |
These stress tests are supplemented with sensitivity analysis and reverse stress testing for instantaneous liquidity shocks by each major liquidity risk driver to understand the impact on internal Liquidity Risk Appetite and regulatory liquidity metrics.
| | |
| 136 | | Santander UK plc Annual Report 2013 |
Detailed Business Review
Risk Management Reportcontinued
LIQUID ASSETS
Santander UK holds, at all times, a portfolio of unencumbered liquid assets to mitigate liquidity risk. The size and composition of this portfolio is determined by Santander UK’s Liquidity Risk Appetite and regulatory requirements.
The table below shows the carrying value and liquidity value of liquid assets held by Santander UK at 31 December 2013 and 2012 and the weighted average carrying value during the year:
| | | | | | | | | | | | | | | | | | | | | | | | |
| | | Carrying value | | | Liquidity value | | | Weighted average carrying
value during the year | |
| | | 2013 | | | 2012 | | | 2013 | | | 2012 | | | 2013 | | | 2012 | |
| | | £bn | | | £bn | | | £bn | | | £bn | | | £bn | | | £bn | |
Cash at central banks | | | 25 | | | | 28 | | | | 25 | | | | 28 | | | | 29 | | | | 28 | |
Government bonds | | | 4 | | | | 9 | | | | 4 | | | | 9 | | | | 4 | | | | 7 | |
| | | | | | | | | | | | | | | | | | | | | | | | |
Eligible liquid assets(1) | | | 29 | | | | 37 | | | | 29 | | | | 37 | | | | 33 | | | | 35 | |
High quality liquid assets | | | 3 | | | | 2 | | | | 2 | | | | 2 | | | | 3 | | | | 2 | |
Other liquid assets: | | | | | | | | | | | | | | | | | | | | | | | | |
- Whole loans and own debt securities(2)(3) | | | 39 | | | | 36 | | | | 25 | | | | 21 | | | | 38 | | | | 25 | |
- Other securities | | | 2 | | | | 1 | | | | 1 | | | | — | | | | 2 | | | | 2 | |
| | | | | | | | | | | | | | | | | | | | | | | | |
Total liquid assets | | | 73 | | | | 76 | | | | 57 | | | | 60 | | | | 76 | | | | 64 | |
| | | | | | | | | | | | | | | | | | | | | | | | |
| (1) | Eligible liquid assets consist of those assets which meet the PRA requirements for liquid asset portfolio in accordance with BIPRU 12.7 |
| (2) | Whole loans are loans acceptable on an unsecuritised basis to the Bank of England as collateral for its various funding arrangements. |
| (3) | Includes own debt securities (i.e. retained issuances) held by Santander UK of £1bn at 31 December 2013 (2012: £1bn). |
Composition of the liquidity pool
| | | | | | | | | | | | | | | | | | | | | | | | |
| | | | | | Liquidity pool of which | | | | |
| | | Liquidity pool 31 December 2013 | | | PRA eligible | | | Basel III Liquidity Coverage Ratio-eligible | | | Liquidity pool 31 December 2012 | |
| | | | | | | Level 1 | | | Level 2A | | | Level 2B | | |
| | | £bn | | | £bn | | | £bn | | | £bn | | | £bn | | | £bn | |
Cash in hand and cash with central banks | | | 26 | | | | 25 | | | | 26 | | | | — | | | | — | | | | 29 | |
| | | | | | | | | | | | | | | | | | | | | | | | |
Government bonds: | | | | | | | | | | | | | | | | | | | | | | | | |
AAA rated | | | 2 | | | | 2 | | | | 2 | | | | — | | | | — | | | | 9 | |
AA+ to AA- rated | | | 2 | | | | 2 | | | | 2 | | | | — | | | | — | | | | — | |
A+ to A- rated | | | — | | | | — | | | | — | | | | — | | | | — | | | | — | |
| | | | | | | | | | | | | | | | | | | | | | | | |
Total Government bonds | | | 4 | | | | 4 | | | | 4 | | | | — | | | | — | | | | 9 | |
| | | | | | | | | | | | | | | | | | | | | | | | |
Other: | | | | | | | | | | | | | | | | | | | | | | | | |
Covered bonds (rated AA- and above) | | | 1 | | | | — | | | | — | | | | 1 | | | | — | | | | — | |
RMBS bonds (rated AA- and above) | | | — | | | | — | | | | — | | | | — | | | | — | | | | 1 | |
Corporate bonds (rated A- and above) | | | 1 | | | | — | | | | — �� | | | | — | | | | 1 | | | | 1 | |
Other | | | 42 | | | | — | | | | — | | | | — | | | | — | | | | 37 | |
| | | | | | | | | | | | | | | | | | | | | | | | |
Total Other | | | 44 | | | | — | | | | — | | | | 1 | | | | 1 | | | | 39 | |
| | | | | | | | | | | | | | | | | | | | | | | | |
Total at 31 December 2013 | | | 74 | | | | 29 | | | | 30 | | | | 1 | | | | 1 | | | | — | |
| | | | | | | | | | | | | | | | | | | | | | | | |
Total at 31 December 2012 | | | — | | | | 37 | | | | 39 | | | | — | | | | 1 | | | | 77 | |
| | | | | | | | | | | | | | | | | | | | | | | | |
| | | | | | | | | | | | | | | | | | | | |
Liquidity pool by currency | | US Dollar
£bn | | | Euro
£bn | | | Sterling
£bn | | | Other
£bn | | | Total
£bn | |
At 31 December 2013 | | | 8 | | | | 2 | | | | 63 | | | | 1 | | | | 74 | |
| | | | | | | | | | | | | | | | | | | | |
At 31 December 2012 | | | 5 | | | | 2 | | | | 69 | | | | 1 | | | | 77 | |
The classification of the assets in the liquid asset portfolio in the Consolidated Balance Sheet, or their treatment as off-balance sheet at 31 December 2013 and 2012 was as follows:
| | | | | | | | | | | | | | | | | | | | | | | | | | | | | | | | | | | | |
| | | | | | On balance sheet | | | Off balance sheet | |
31 December 2013 | | Total
liquid
assets
£bn | | | Cash
£bn | | | Financial
assets
designated at
fair value
£bn | | | Loans and
advances
to
customers
£bn | | | Trading
Assets
£bn | | | Available-
for-sale
securities
£bn | | | Loans and
receivables
securities
£bn | | | Collateral
received/
(pledged)
£bn | | | Retained
issuances of own
debt securities
£bn | |
Cash at central banks | | | 25 | | | | 25 | | | | — | | | | — | | | | — | | | | — | | | | — | | | | — | | | | — | |
Government bonds | | | 4 | | | | — | | | | — | | | | — | | | | 3 | | | | 3 | | | | — | | | | (2 | ) | | | — | |
| | | | | | | | | | | | | | | | | | | | | | | | | | | | | | | | | | | | |
Eligible liquid assets | | | 29 | | | | 25 | | | | — | | | | — | | | | 3 | | | | 3 | | | | — | | | | (2 | ) | | | — | |
High quality bonds | | | 3 | | | | — | | | | — | | | | — | | | | 1 | | | | 2 | | | | — | | | | — | | | | — | |
Other liquid assets: | | | | | | | | | | | | | | | | | | | | | | | | | | | | | | | | | | | | |
- Whole loans and own debt securities | | | 39 | | | | — | | | | 1 | | | | 37 | | | | — | | | | — | | | | — | | | | — | | | | 1 | |
- Other securities | | | 2 | | | | — | | | | — | | | | — | | | | 1 | | | | — | | | | 1 | | | | — | | | | — | |
| | | | | | | | | | | | | | | | | | | | | | | | | | | | | | | | | | | | |
Total liquid assets | | | 73 | | | | 25 | | | | 1 | | | | 37 | | | | 5 | | | | 5 | | | | 1 | | | | (2 | ) | | | 1 | |
| | | | | | | | | | | | | | | | | | | | | | | | | | | | | | | | | | | | |
| | | |
| | | | | | On balance sheet | | | Off balance sheet | |
| | | Total
liquid
assets | | | Cash | | | Financial
assets
designated at
fair value | | | Loans and
advances to
customers | | | Trading
Assets | | | Available- for-sale
securities | | | Loans and
receivables
securities | | | Collateral
received/
(pledged) | | | Retained
issuances of own
debt securities | |
31 December 2012 | | £bn | | | £bn | | | £bn | | | £bn | | | £bn | | | £bn | | | £bn | | | £bn | | | £bn | |
Cash at central banks | | | 28 | | | | 28 | | | | — | | | | — | | | | — | | | | — | | | | — | | | | — | | | | — | |
Government bonds | | | 9 | | | | — | | | | — | | | | — | | | | — | | | | 5 | | | | — | | | | 4 | | | | — | |
| | | | | | | | | | | | | | | | | | | | | | | | | | | | | | | | | | | | |
Eligible liquid assets | | | 37 | | | | 28 | | | | — | | | | — | | | | — | | | | 5 | | | | — | | | | 4 | | | | — | |
High quality bonds | | | 2 | | | | — | | | | — | | | | — | | | | — | | | | 1 | | | | 1 | | | | — | | | | — | |
Other liquid assets: | | | | | | | | | | | | | | | | | | | | | | | | | | | | | | | | | | | | |
- Whole loans and own debt securities | | | 36 | | | | — | | | | — | | | | 35 | | | | — | | | | — | | | | — | | | | — | | | | 1 | |
- Other securities | | | 1 | | | | — | | | | — | | | | — | | | | — | | | | — | | | | 1 | | | | — | | | | — | |
| | | | | | | | | | | | | | | | | | | | | | | | | | | | | | | | | | | | |
Total liquid assets | | | 76 | | | | 28 | | | | — | | | | 35 | | | | — | | | | 6 | | | | 2 | | | | 4 | | | | 1 | |
| | | | | | | | | | | | | | | | | | | | | | | | | | | | | | | | | | | | |
| | |
| Santander UK plc Annual Report 2013 | | 137 |
Detailed Business Review
Risk Management Reportcontinued
The following tables set out liquid assets by the geographic location of the issuer or counterparty at 31 December 2013 and 2012:
| | | | | | | | |
| | | 31 December
2013
£bn | | | 31 December
2012
£bn | |
Eligible liquid assets: | | | | | | | | |
Cash at central banks: | | | | | | | | |
- UK | | | 20 | | | | 28 | |
- US | | | 5 | | | | — | |
| | | | | | | | |
| | | 25 | | | | 28 | |
| | | | | | | | |
Government bonds: | | | | | | | | |
- UK | | | 2 | | | | 4 | |
- US | | | 2 | | | | 3 | |
- Japan | | | — | | | | 1 | |
- Germany | | | — | | | | 1 | |
| | | | | | | | |
| | | 4 | | | | 9 | |
| | | | | | | | |
Total Eligible liquid assets | | | 29 | | | | 37 | |
| | | | | | | | |
High quality(1) corporate bonds and asset-backed securities: | | | | | | | | |
- UK | | | 1 | | | | 1 | |
- US | | | 1 | | | | 1 | |
- Other countries, each less than £1bn(2) | | | 1 | | | | — | |
| | | | | | | | |
| | | 3 | | | | 2 | |
| | | | | | | | |
Other liquid assets: | | | | | | | | |
- UK – Whole loans and own debt securities | | | 39 | | | | 36 | |
- UK – Other debt securities, bonds, and equities included in major indices | | | 1 | | | | 1 | |
- Other countries, each less than £1bn(3) | | | 1 | | | | — | |
| | | | | | | | |
| | | 41 | | | | 37 | |
| | | | | | | | |
Total liquid assets | | | 73 | | | | 76 | |
| | | | | | | | |
| (2) | Consists of Belgium, Switzerland, Germany, France, Norway, Sweden, Ireland, Luxembourg and Netherlands. |
| (3) | Consists of Canada, Spain, Italy and Portugal. |
Liquid assets are convertible into cash on demand. High quality bonds are convertible into cash through normal market channels. Whole loans and own debt securities are convertible into cash via discount at central banks. The process of pre-positioning assets for discounts at central banks, while it varies by asset class, typically takes four weeks.
Eligible liquid assets consist of those assets which meet the PRA requirements for inclusion in a liquid asset portfolio in accordance with BIPRU 12.7. Such assets comprise cash at central banks and government bonds, but only the central government or central bank of a highly-rated European Economic Area state, Canada, Australia, Japan, Switzerland or the United States of America, subject to minimum credit ratings.
Santander UK periodically tests the liquidity of the liquid assets portfolio it holds, in accordance with the PRA requirement to realise a proportion of these assets through repo or outright sale to the market. In accordance with the PRA’s regulations, Santander UK ensures that the cumulative effect of its periodic realisation over any twelve month period is that a significant proportion of the assets in its eligible liquid assets portfolio is realised.
In deciding on the precise composition of its liquid asset portfolio, Santander UK ensures that it tailors the contents of the portfolio to the needs of its business and the liquidity risk that it potentially faces. In particular, Santander UK ensures that it holds assets in its liquid asset portfolio which can be realised with the speed necessary to meet its liabilities as they fall due.
Liquidity developments in 2013(unaudited)
2013 saw a steady improvement in market confidence and funding rates, a trend observed in the second half of 2012. During the second half of 2013, speculation that the US Federal Reserve might reduce the level of such stimulus it had been providing to the market had an impact on forward interest rates, but had little impact on investor sentiment in the core funding markets in which Santander UK operates. When the US Federal Reserve then formally announced in December 2013 that it would start to reduce the level of stimulus, the news was received positively by investors as a sign of an improving macro-economic environment.
In 2013, Santander UK benefited from market-wide reduced wholesale, unsecured medium-term and secured medium-term funding rates and, as with other UK banks, increased confidence in its own current credit ratings. Throughout 2012, Santander UK continued to strengthen its liquidity position. Following the beneficial conditions prevailing in late 2012, Santander UK reduced its liquidity position in 2013 whilst maintaining a conservative balance sheet structure (i.e. maintaining high levels of high quality liquid assets) and risk management controls to monitor and manage the levels of the liquid asset portfolio and encumbrance.
Eligible liquid assets continued to significantly exceed wholesale funding of less than one year, with a coverage ratio of 138% (2012: 152%).
In addition, during 2013, Santander UK:
| | • | | Continued pursuing selected de-leverage; |
| | • | | Continued to enhance the retail deposit base by attracting ‘stickier’ deposits whilst reducing balances for products that have shown a propensity in the past to instability at times of stress; |
| | • | | Built the commercial banking deposit base, creating relationships to enhance their ‘stickiness’ wherever possible; |
| | • | | Increased the level of transactional accounts (including retail banking current accounts) held, especially through the growth of the 1|2|3 Current Account retail product; |
| | • | | Maintained a balanced wholesale funding mix between medium and short term funds, whilst looking to extend the maturity profile of the short term book as market conditions permit; |
| | • | | Maintained an appropriate level of liquid resource diversification in line with the current assessment of key liquidity risks, whilst avoiding the holding of excessive levels of liquid assets that could be better utilised in support of the core franchise; and |
| | • | | Focused on becoming more active in the unsecured medium-term funding markets. The level of medium term funding issuance is assessed on an ongoing basis and actively managed through ALCO. |
| | |
| 138 | | Santander UK plc Annual Report 2013 |
Detailed Business Review
Risk Management Reportcontinued
FUNDING RISK
Santander UK’s primary sources of funding include:
| | • | | Secured and unsecured money-market funding (including unsecured cash, repo, certificates of deposit and commercial paper issuance); |
| | • | | Senior debt issuance (including discrete bond issues and medium term notes); |
| | • | | Asset-backed funding (including securitisation and covered bond issuance); and |
| | • | | Subordinated debt and capital issuance (although the primary purpose is not funding). |
The Santander UK Liquidity Risk Appetite statement is set in the context of principles by which Santander UK chooses to manage its balance sheet and these define the context within which funding risk is managed. The principles include the following specific funding discipline:
| | • | | Implementation of a funding structure that is consistent with the composition of the asset base; |
| | • | | Implementation of a funding strategy that: |
| | • | | avoids excessive reliance on short-term wholesale funding, attracts sustainable commercial deposits; |
| | • | | provides effective diversification in the sources, products and tenor of funding; and |
| | • | | complies with internal encumbrance policy; and |
| | • | | Use of long-term funding to provide diversification, manage the liquidity structure of the balance sheet and support liquid resources. |
The principles set by the Board are underpinned by key structural liquidity metrics that form part of the Santander UK Risk Management Framework. Retail Banking and Commercial Banking funding primarily comprises deposits by customers.
| | • | | Funding risk is managed by the Finance Director, who is responsible for the production of strategic and tactical funding plans as part of Santander UK’s planning process. |
| | • | | Funding plans are approved by the Board and ALCO and are controlled on a day-to-day basis by the Finance Director and within the framework of the Liquidity Risk Manual. |
| | • | | The plans are challenged by the Risk function to ensure adverse conditions can be accommodated via a range of management levers. |
| | |
| Santander UK plc Annual Report 2013 | | 139 |
Detailed Business Review
Risk Management Reportcontinued
FUNDING RISK MANAGEMENT
Operational management of funding risk(unaudited)
Santander UK maintains, as part of its overall liquidity and funding risk management framework, strong operational and management governance that seeks to make Santander UK’s strategy as resilient as possible to potential funding stresses by structuring the balance sheet in a prudent and sensible way. The framework applies to all aspects of both funding and liquidity risk to ensure that the two are managed in a consistent and complimentary way - in line with the Board’s Liquidity Risk Appetite. As with liquidity risk, operational management is tasked to deliver Santander UK’s strategy in line with the following principles that define the desired conservative balance sheet structure:
| | • | | Implementation of a funding structure that is consistent with the composition of assets; |
| | • | | Well-balanced growth of assets and liabilities; |
| | • | | Implementation of a funding strategy that: |
| | • | | Avoids excessive reliance on short-term wholesale funding and attracts sustainable commercial deposits; and |
| | • | | Provides effective diversification in the sources, products and tenor of funding. |
| | • | | Maintenance of an appropriate mix of ‘sticky’ and ‘non-sticky’ retail deposit balances; |
| | • | | Use of short-term funding to manage short-term fluctuations in funding and the funding of short-term wholesale assets; and |
| | • | | Use of long-term funding to provide diversification of stable funding as well as an aid to help manage the liquidity structure of the balance sheet. |
Within Santander UK, the same operational management structure that manages funding risks is responsible for liquidity risk management because of the very close affinity of the two areas. The CFO has delegated responsibility for day-to-day management of Funding Risk to the Finance Director who in turn delegates to the Director, ALM, the Director, Funding and Collateral Management and the Head of Short Term Markets. These management processes are reviewed and challenged by the independent risk function and overseen by ALCO and Risk Management Committee.
The Director, Funding and Collateral Management and the Head of Short Term Markets together cover all aspects of short and term funding in both secured and unsecured markets, delivering Santander UK’s strategic funding requirements in line with its detailed funding plan and risk appetite principles. The Director, Funding and Collateral Management ensures that Santander UK has active involvement in a range of wholesale funding markets ensuring that sources of funding can be maximised and so a conservative level of diversification of the balance sheet across product and average maturity maintained.
Financial adaptability(unaudited)
Santander UK also considers its ability to take effective action to alter the amounts and timing of cash flows so that it can respond to unexpected needs or opportunities. In determining its financial adaptability, Santander UK has considered its ability to:
| | • | | Obtain new sources of finance; |
| | • | | Obtain financial support from other Banco Santander group companies; and |
| | • | | Continue business by making limited reductions in operations or using alternative resources. |
| | |
| 140 | | Santander UK plc Annual Report 2013 |
Detailed Business Review
Risk Management Reportcontinued
FUNDING STRATEGY AND STRUCTURE(unaudited)
Santander UK’s funding strategy continues to be based upon the maintenance of a conservatively structured balance sheet. The majority of Santander UK’s funding is sourced from customer deposits; the balance is sourced from wholesale markets. This strategy avoids an over-reliance on wholesale funds, both medium and short-term, whilst at the same time ensures that sources of funding are not overly concentrated in relation to one particular product. Santander UK maintains checks and controls to limit the level of asset encumbrance from their secured funding operations.
The quality of retail, commercial and wholesale deposits continues to be enhanced with Santander UK focused on increasing the average maturity of deposits whilst de-emphasising transient balances. Across all customer segments, Santander UK looks to deepen customer relationships and so lengthen the contractual and behavioural profile of the liability base. In Retail Banking, this has been complemented by the successful introduction of such market leading products as the 1|2|3 Current Account.
A key source of funding for Santander UK is its significant base of stable retail and corporate deposits. Santander UK leverages its large and diverse customer base to offer products that provide a long term sustainable source of funding through an emphasis on the building of long term relationships. Of the total retail customer liabilities, in excess of 90% are covered by the FSCS.
Behavioural maturities
The contractual maturity of balance sheet assets and liabilities highlights the maturity transformation which underpins the role of banks to lend long-term, but to fund themselves predominantly through short-term liabilities such as customer deposits. This is achieved through the diversified funding franchise of the Santander UK group across an extensive customer base, both numerically and by depositor type. In practice, the behavioural profiles of many liabilities exhibit greater stability and longer maturity than the contractual maturity. This is particularly true of many types of retail and corporate deposits which whilst they may be repayable on demand or at short notice, have demonstrated very stable characteristics even in periods of stress.
Santander UK models behaviour profiles using our experience of historical customer behaviour. These behavioural maturities are used to determine funds transfer pricing interest rates at which businesses are rewarded and charged for sources and uses of funds in connection with newly originated business prior to a customer contracting to an alternate product or service offered by Santander UK or by a competitor.
DEPOSIT FUNDING
The table below shows customer loans, customer deposits and the loan-to-deposit ratio for the Retail Banking, Commercial Banking and Corporate Centre business divisions at 31 December 2013 and 2012. Retail Banking and Commercial Banking activities are largely funded by customer deposits with the remaining funded with long-term debt and equity (including funding secured against customer loans and advances). The Markets business division has no customer loans or customer deposits.
The data presented in the table below for the business divisions excludes accrued interest. The table also shows loans and advances to customers, customer deposits and the loan-to-deposit ratio for the Santander UK group at 31 December 2013 and 2012. The data presented for the Santander UK group includes accrued interest but excludes repurchase agreements and reverse repurchase agreements, as described in “Key Performance Indicators” on page 6.
| | | | | | | | | | | | |
2013 | | Customer loans | | | Customer deposits | | | Loan-to-Deposit ratio | |
| | | £m | | | £m | | | % | |
Retail Banking | | | 155.6 | | | | 123.2 | | | | 126 | |
Commercial Banking | | | 22.1 | | | | 12.6 | | | | 175 | |
Corporate Centre | | | 9.4 | | | | 10.6 | | | | 89 | |
| | | | | | | | | | | | |
Total Customer Assets and Deposits | | | 187.1 | | | | 146.4 | | | | | |
Adjust for: Fair value loans, loan loss reserves, accrued interest and other | | | (2.7 | ) | | | 0.8 | | | | | |
| | | | | | | | | | | | |
Statutory customer loans and advances / deposits | | | 184.4 | | | | 147.2 | | | | | |
Less repurchase agreements and reverse repurchase agreements | | | — | | | | (0.9 | ) | | | | |
| | | | | | | | | | | | |
Total(1) | | | 184.4 | | | | 146.3 | | | | 126 | |
| | | | | | | | | | | | |
| | | | | | | | | | | | |
2012 | | Customer loans | | | Customer deposits | | | Loan-to-Deposit ratio | |
| | | £m | | | £m | | | % | |
Retail Banking | | | 164.1 | | | | 127.2 | | | | 129 | |
Commercial Banking | | | 19.6 | | | | 12.8 | | | | 153 | |
Corporate Centre | | | 11.0 | | | | 8.6 | | | | 128 | |
| | | | | | | | | | | | |
Total Customer Assets and Deposits | | | 194.7 | | | | 148.6 | | | | | |
Adjust for: Fair value loans, loan loss reserves, accrued interest and other | | | (3.9 | ) | | | 0.4 | | | | | |
| | | | | | | | | | | | |
Statutory customer loans and advances / deposits | | | 190.8 | | | | 149.0 | | | | | |
Less repurchase agreements and reverse repurchase agreements | | | — | | | | (0.9 | ) | | | | |
| | | | | | | | | | | | |
Total(1) | | | 190.8 | | | | 148.1 | | | | 129 | |
| | | | | | | | | | | | |
| (1) | Total Loan to Deposit ratio calculated as loans and advances to customers (excluding reverse repurchase agreements) divided by deposits by customers (excluding repurchase agreements). |
| | |
| Santander UK plc Annual Report 2013 | | 141 |
Detailed Business Review
Risk Management Reportcontinued
WHOLESALE FUNDING
Composition of wholesale funding
Santander UK continues to have access to a variety of sources of wholesale funding in a range of currencies, including those available from money markets, repo markets, medium term and subordinated debt investors, across a variety of distribution channels. Santander UK is an active participant in the wholesale markets and has direct access to both money market and long-term investors through its range of funding programmes. As a result, wholesale funding is well diversified by product, maturity, geography and currency.
Maturity profile of wholesale funding
The table below shows Santander UK’s primary wholesale funding sources, excluding short-term repurchase agreements. The tables are prepared taking into account scheduled repayments, and do not reflect the final contractual maturity of the funding.
| | | | | | | | | | | | | | | | | | | | | | | | | | | | | | | | | | | | | | | | |
| | | Not more
than 1
month | | | Over 1 but
not more
than 3
months | | | Over 3 but
not more
than 6
months | | | Over 6 but
not more
than 9
months | | | Over 9 but
not more
than 12
months | | | Sub-total
less than 1 year | | | Over 1 but
not more
than 2
years | | | Over 2 but
not more
than 5
years | | | Over 5
years | | | Total | |
2013 | | £bn | | | £bn | | | £bn | | | £bn | | | £bn | | | £bn | | | £bn | | | £bn | | | £bn | | | £bn | |
Deposits by bank (non-customer deposits) | | | 0.1 | | | | 1.2 | | | | — | | | | — | | | | — | | | | 1.3 | | | | — | | | | — | | | | — | | | | 1.3 | |
CDs and Commercial Paper | | | 1.9 | | | | 2.2 | | | | 1.6 | | | | 0.4 | | | | 0.5 | | | | 6.6 | | | | — | | | | — | | | | — | | | | 6.6 | |
Senior unsecured - public benchmark | | | — | | | | 0.8 | | | | 1.5 | | | | — | | | | 1.0 | | | | 3.3 | | | | 1.1 | | | | 2.4 | | | | 0.7 | | | | 7.5 | |
- privately placed | | | 0.1 | | | | 0.2 | | | | 0.2 | | | | 0.1 | | | | 0.3 | | | | 0.9 | | | | 0.6 | | | | 0.7 | | | | 0.7 | | | | 2.9 | |
Covered bonds | | | — | | | | — | | | | 1.3 | | | | 0.1 | | | | — | | | | 1.4 | | | | 2.8 | | | | 6.0 | | | | 6.8 | | | | 17.0 | |
Securitisation and Structured Issuance | | | 1.2 | | | | 0.3 | | | | 1.7 | | | | 3.2 | | | | 1.3 | | | | 7.7 | | | | 7.1 | | | | 9.7 | | | | 1.4 | | | | 25.9 | |
Subordinated liabilities | | | — | | | | — | | | | — | | | | — | | | | — | | | | — | | | | — | | | | 0.1 | | | | 4.4 | | | | 4.5 | |
| | | | | | | | | | | | | | | | | | | | | | | | | | | | | | | | | | | | | | | | |
Total at 31 December 2013 | | | 3.3 | | | | 4.7 | | | | 6.3 | | | | 3.8 | | | | 3.1 | | | | 21.2 | | | | 11.6 | | | | 18.9 | | | | 14.0 | | | | 65.7 | |
Of which secured | | | 1.2 | | | | 0.3 | | | | 3.0 | | | | 3.3 | | | | 1.3 | | | | 9.1 | | | | 9.9 | | | | 15.7 | | | | 8.2 | | | | 42.9 | |
Of which unsecured | | | 2.1 | | | | 4.4 | | | | 3.3 | | | | 0.5 | | | | 1.8 | | | | 12.1 | | | | 1.7 | | | | 3.2 | | | | 5.8 | | | | 22.8 | |
| | | | | | | | | | | | | | | | | | | | | | | | | | | | | | | | | | | | | | | | |
Total at 31 December 2012 | | | 8.0 | | | | 3.5 | | | | 6.4 | | | | 2.7 | | | | 3.7 | | | | 24.3 | | | | 12.4 | | | | 27.2 | | | | 13.0 | | | | 76.9 | |
| | | | | | | | | | | | | | | | | | | | | | | | | | | | | | | | | | | | | | | | |
Of which secured | | | 1.9 | | | | 2.2 | | | | 4.7 | | | | 1.4 | | | | 3.4 | | | | 13.6 | | | | 8.4 | | | | 22.7 | | | | 9.5 | | | | 54.2 | |
Of which unsecured | | | 6.1 | | | | 1.3 | | | | 1.7 | | | | 1.3 | | | | 0.3 | | | | 10.7 | | | | 4.0 | | | | 4.5 | | | | 3.5 | | | | 22.7 | |
| | | | | | | | | | | | | | | | | | | | | | | | | | | | | | | | | | | | | | | | |
Currency composition of wholesale funds
At 31 December 2013, the proportion of wholesale funding by major currencies was as follows:
| | | | | | | | | | | | | | | | |
| | | Sterling | | | US Dollar | | | Euro | | | Other Currencies | |
| | | % | | | % | | | % | | | % | |
Deposits by banks (non-customer deposits) | | | 9 | | | | 90 | | | | 1 | | | | — | |
CDs and Commercial Paper | | | 17 | | | | 65 | | | | 16 | | | | 2 | |
Senior unsecured - public benchmark | | | 13 | | | | 41 | | | | 43 | | | | 3 | |
- privately placed | | | 40 | | | | 16 | | | | 34 | | | | 10 | |
Covered bonds | | | 29 | | | | — | | | | 70 | | | | 1 | |
Securitisation and Structured Issuance | | | 35 | | | | 33 | | | | 31 | | | | 1 | |
Subordinated liabilities | | | 62 | | | | 27 | | | | 8 | | | | 3 | |
| | | | | | | | | | | | | | | | |
Total at 31 December 2013 | | | 31 | | | | 28 | | | | 39 | | | | 2 | |
| | | | | | | | | | | | | | | | |
Total at 31 December 2012 | | | 34 | | | | 23 | | | | 41 | | | | 2 | |
| | | | | | | | | | | | | | | | |
Reconciliation of wholesale funding to the balance sheet
The table below presents a reconciliation of wholesale funding to the balance sheet at 31 December 2013.
| | | | | | | | | | | | | | | | | | | | | | | | | | | | | | | | |
| | | | | | Balance sheet line item | | | | | | | | | | | | | |
| | | | | | | | |
| | | Funding analysis | | | Deposits by
banks | | | Deposits by
customers(2) | | | Debt securities in issue | | | Financial
liabilities at fair value | | | Trading liabilities | | | Subordinated
liabilities | | | Share capital
and other equity
instruments(4) | |
31 December 2013 | | £bn | | | £bn | | | £bn | | | £bn | | | £bn | | | £bn | | | £bn | | | £bn | |
Deposits by banks (non-customer deposits) | | | 1.3 | | | | — | | | | — | | | | — | | | | — | | | | 1.3 | | | | — | | | | — | |
CDs and Commercial Paper | | | 6.6 | | | | — | | | | — | | | | 5.8 | | | | 0.8 | | | | — | | | | — | | | | — | |
Senior unsecured - public benchmark | | | 7.5 | | | | — | | | | — | | | | 7.5 | | | | — | | | | — | | | | — | | | | — | |
- privately placed | | | 2.9 | | | | — | | | | — | | | | 0.3 | | | | 2.6 | | | | — | | | | — | | | | — | |
Covered bonds/ABS | | | 17.0 | | | | — | | | | — | | | | 17.0 | | | | — | | | | — | | | | — | | | | — | |
Securitisation and Structured Issuance | | | 25.9 | | | | 5.5 | | | | 0.9 | | | | 19.5 | | | | — | | | | — | | | | — | | | | — | |
Subordinated liabilities | | | 4.5 | | | | — | | | | — | | | | — | | | | — | | | | — | | | | 4.2 | | | | 0.3 | |
| | | | | | | | | | | | | | | | | | | | | | | | | | | | | | | | |
Total wholesale funding | | | 65.7 | | | | 5.5 | | | | 0.9 | | | | 50.1 | | | | 3.4 | | | | 1.3 | | | | 4.2 | | | | 0.3 | |
Repos | | | 12.8 | | | | — | | | | — | | | | — | | | | — | | | | 12.8 | | | | — | | | | — | |
Foreign exchange and hedge accounting | | | 0.9 | | | | — | | | | — | | | | 0.8 | | | | — | | | | — | | | | 0.1 | | | | — | |
Other | | | 10.4 | | | | 3.2 | (1) | | | — | | | | — | | | | — | | | | 7.2 | (3) | | | — | | | | — | |
| | | | | | | | | | | | | | | | | | | | | | | | | | | | | | | | |
Balance sheet total | | | 89.8 | | | | 8.7 | | | | 0.9 | | | | 50.9 | | | | 3.4 | | | | 21.3 | | | | 4.3 | | | | 0.3 | |
| | | | | | | | | | | | | | | | | | | | | | | | | | | | | | | | |
| (1) | Principally consists of items in the course of transmission and other deposits. See Note 29 to the Consolidated Financial Statements. |
| (2) | Included in the balance sheet total of £147,167m (2012: £149,037m). |
| (3) | Consists of short positions in securities and unsettled trades, cash collateral and short-term deposits. See Note 31 to the Consolidated Financial Statements. |
| (4) | Consists of £300m fixed/floating rate non-cumulative callable preference shares. See Note 39 to the Consolidated Financial Statements. |
| | |
| 142 | | Santander UK plc Annual Report 2013 |
Detailed Business Review
Risk Management Reportcontinued
Funding developments in 2013(unaudited)
Our overall funding strategy is to develop and maintain a diversified funding base, which allows us access to a variety of funding sources. In 2013, we primarily focused on unsecured issuance. This included a return to the subordinated debt markets with a Tier 2 subordinated debt issuance. Including the subordinated debt issuance, in total we issued four public unsecured transactions. This was considerably more than in the preceding year. In addition to the unsecured issuance, we issued residential mortgage-backed securities and a benchmark euro covered bond, two forms of financing that permit us to benefit from our prime UK mortgage assets. The improvement in market sentiment over the past eighteen months has meant that the main wholesale funding markets that we operate in have been stable and have offered economically viable sources of funding. This allowed us to have a more balanced mix of wholesale unsecured and secured funding than in recent years. In 2013 our medium-term funding issuance was £6.6bn (2012: £13.9bn) against maturities of approximately £16.3bn (2012: £10bn). At 31 December 2013, 68% (2012: 67%) of wholesale funding had a maturity of greater than one year with an overall residual duration for wholesale funding of 1,090 days (2012: 1,039 days).
In addition, during 2013 a strategy of building closer customer relationships through the growing of the 1|2|3 World retail offering created additional current account and behaviourally long-term deposits that further strengthened this stable funding source. At the same time, the level of less stable instant access accounts reduced as a constituent of the funding mix.
In the short-term funding markets, the emphasis was on attracting funds with a maturity of greater than 30 days.
Term issuance(audited)
In 2013, the majority of Santander UK’s term issuance was in unsecured format, this represents a marked shift from the secured and unsecured new issuance split in 2012. During the year, Santander UK’s term issuance (sterling equivalent) comprised:
| | | | | | | | | | | | | | | | | | | | |
| | | Sterling | | | US Dollar | | | Euro | | | Total 2013 | | | Total 2012 | |
| | | £bn | | | £bn | | | £bn | | | £bn | | | £bn | |
Securitisations | | | 0.9 | | | | 0.8 | | | | — | | | | 1.7 | | | | 7.2 | |
Covered bonds - privately placed | | | — | | | | — | | | | 0.8 | | | | 0.8 | | | | 3.1 | |
- publicly placed | | | 0.2 | | | | — | | | | 0.3 | | | | 0.5 | | | | 0.6 | |
Structured notes | | | 0.2 | | | | 0.2 | | | | — | | | | 0.4 | | | | 0.9 | |
Senior unsecured - privately placed | | | 0.1 | | | | — | | | | 0.1 | | | | 0.2 | | | | — | |
- public benchmark | | | — | | | | 0.6 | | | | 1.5 | | | | 2.1 | | | | 0.6 | |
Structured issuance | | | — | | | | — | | | | — | | | | — | | | | 1.5 | |
Subordinated debt | | | — | | | | 0.9 | | | | — | | | | 0.9 | | | | — | |
| | | | | | | | | | | | | | | | | | | | |
Total gross issuances | | | 1.4 | | | | 2.5 | | | | 2.7 | | | | 6.6 | | | | 13.9 | |
| | | | | | | | | | | | | | | | | | | | |
CREDIT RATINGS(unaudited)
Contractual credit rating downgrade exposure (cumulative cash flow)
| | | | | | | | |
| | | Cumulative cash outflow | |
| | | One-notch downgrade | | | Two-notch downgrade | |
At 31 December 2013 | | £bn | | | £bn | |
Securitisation derivatives | | | 2.5 | | | | 3.1 | |
Contingent liabilities | | | 2.7 | | | | 3.0 | |
Derivatives margining | | | 2.4 | | | | 3.4 | |
Liquidity facilities | | | — | | | | — | |
| | | | | | | | |
Total contractual funding or margin requirements | | | 7.6 | | | | 9.5 | |
| | | | | | | | |
| | |
| Santander UK plc Annual Report 2013 | | 143 |
Detailed Business Review
Risk Management Reportcontinued
CAPITAL RISK(unaudited)
Capital risk is defined as the risk that Santander UK does not have an adequate amount, or quality of, capital to:
| | • | | Adhere to the Board’s Risk Appetite and support its internal business objectives; |
| | • | | Support market expectations and its credit rating; and |
| | • | | Meet regulatory requirements in the UK and other jurisdictions (such as the United States) where regulated activities are undertaken. |
Whilst Santander UK is part of the wider Banco Santander group, Santander UK plc is incorporated in the UK, regulated by the PRA and does not benefit from parental guarantees and operates as an autonomous subsidiary. As such, responsibility for the management, control and assurance of capital risk lies with the Santander UK plc Board and, when applicable, certain subsidiary boards. The Board delegates day-to-day responsibility for Capital risk to the CEO. The CEO has in turn delegated the responsibilities for Capital Risk management to the CFO.
The Capital Risk Framework, reviewed by the Board annually, describes the high level arrangements for the management, control and assurance of Santander UK capital risk. Santander UK adopts a centralised capital management approach that is driven by its strategy and delivers the Board approved Risk Appetite. This approach takes into account the regulatory and commercial environment in which Santander UK operates the management strategy for each of its material risks and the impact of appropriate adverse scenarios and stresses on its capital position.
The key elements of Santander UK’s capital management are:
| | • | | Strategic capital risk managementwhere, in the form of an annual capital plan (contained within the Internal Capital Adequacy Assessment Process (‘ICAAP’)), the regulatory and internal capital requirements and capital resources are forecasted based on the medium term business plan. Alongside this capital plan, Santander UK stresses the capital requirements and resources using a suite of macroeconomic scenarios. |
| | • | | Short term, tactical capital risk management, where frequent monitoring and reporting against the capital plan is performed to detect where any deterioration or change in the planned business performance may impact the capital levels. Additionally, monthly monitoring of the economic assumptions used to create and stress the capital plan against economic reality is undertaken to detect potential deterioration in the capital levels. |
| | • | | Decisions on the allocation of capital resources are conducted as part of Santander UK’s strategic planning process based on the relative returns on capital using both economic and regulatory capital measures. |
| | • | | Santander UK also defines management actions in the event that an extremely severe period of stress threatens its viability and solvency. |
During 2013, Santander UK managed its capital on a Basel II basis and also in anticipation of the adoption of the CRD IV rules, which implement Basel III in the EU and came into force from 1 January 2014. Capital demand is quantified for credit, traded market, non-traded market, operational, pension obligation and securitisation risk in accordance with PRA requirements. Santander UK produces and shares with the PRA its Internal Capital Adequacy Assessment Process document, which informs the supervisory and evaluation process by the PRA which can result in additional capital requirements.
| | |
| 144 | | Santander UK plc Annual Report 2013 |
Detailed Business Review
Risk Management Reportcontinued
Reconciliation of accounting capital to regulatory capital(unaudited)
The table below analyses the composition of the Santander UK Consolidated Balance Sheet compared to the equivalent regulatory exposure. The regulatory exposure represents the exposure at default (“EAD”) calculated in accordance with regulatory requirements.
The main differences between Santander UK’s balance sheet amounts and its regulatory exposures are as follows:
| | • | | For Retail Banking and for Commercial Banking and Corporate Centre customer assets, the regulatory exposure is larger than the balance sheet amount as the regulatory exposure includes unutilised credit facilities, which are adjusted for using a credit conversion factor (‘CCF’). |
| | • | | For counterparty risk, the regulatory exposure is smaller than the balance sheet amount as regulatory exposures for repurchase, reverse repurchase, securities financing and derivative transactions are calculated net of any associated collateral and netting agreements. |
| | • | | For liquid assets, the regulatory exposure is smaller than the balance sheet amount as the regulatory exposure for reverse repurchase transactions are calculated net of collateral received. |
| | • | | For other assets, the regulatory exposure is smaller than the balance sheet amount as the regulatory exposure for derivatives hedging debt issuances is calculated net of any associated collateral and netting agreements. |
| | • | | Intangible assets are deducted from capital resources and therefore no regulatory exposure is recognised. |
| | | | | | | | |
2013 | | Balance sheet
amount
£bn | | | Regulatory exposure
(unaudited)
£bn | |
Retail Banking | | | | | | | | |
Secured lending | | | 148.1 | | | | 157.5 | |
Unsecured lending | | | 7.5 | | | | 11.6 | |
| | | | | | | | |
Total | | | 155.6 | | | | 169.1 | |
| | | | | | | | |
Commercial Banking | | | | | | | | |
Customer assets | | | 22.1 | | | | 28.0 | |
Counterparty risk | | | 16.8 | | | | 2.3 | |
| | | | | | | | |
Total | | | 38.9 | | | | 30.3 | |
| | | | | | | | |
Markets | | | | | | | | |
Credit risk | | | 0.1 | | | | 0.1 | |
Counterparty risk | | | 15.9 | | | | 5.9 | |
| | | | | | | | |
Total | | | 16.0 | | | | 6.0 | |
| | | | | | | | |
Corporate Centre | | | | | | | | |
Customer assets | | | 9.4 | | | | 11.0 | |
Liquid assets | | | 31.5 | | | | 28.1 | |
| | | | | | | | |
Total | | | 40.9 | | | | 39.1 | |
| | | | | | | | |
Intangible and other assets | | | 18.9 | | | | 10.6 | |
| | | | | | | | |
Total | | | 270.3 | | | | 255.1 | |
| | | | | | | | |
| | |
| Santander UK plc Annual Report 2013 | | 145 |
Detailed Business Review
Risk Management Reportcontinued
CONDUCT RISK(unaudited)
Conduct risk is the risk that Santander UK’s decisions and behaviours lead to a detriment or poor outcome for our customers. As part of this risk definition, the following sub-types have been identified:
| | |
KEY RISKS | | DEFINITION |
| |
• Product Risk | | The risk that Santander UK puts on sale products and services that do not meet customer needs. |
| |
• Sales Risk | | The risk that Santander UK sells unsuitable products and services to customers or provides insufficient information to allow customers to make an informed decision. |
| |
• Post Sales & Servicing Risk | | The risk that Santander UK does not: • have robust processes and systems, resulting in poor customer outcomes; • communicate properly with its customers after-sale and creates unreasonable barriers for customers; or • work appropriately with customers in financial difficulty resulting in poor and/or unsustainable outcomes. |
| |
• Culture Risk | | The risk that Santander UK does not sustain a culture where success is achieved by being fair, open, and honest. |
Santander UK also aligns these sub-types under the operational risk category “Clients, Product & Business Practices”.
Conduct risk is a key risk to Santander UK both in view of the evolving regulatory environment and as a component of our customer centric business model. Santander UK engages in discussion, and co-operates, with the FCA in its supervision of the Santander UK group, including reviews exercised under statutory powers, regarding its interaction with past and present customers and policyholders, both as part of the FCA's general thematic work and in relation to specific products and services. The position is monitored with particular reference to those reviews currently in progress where it is not yet possible to reliably determine their outcome.
During 2013, Santander UK commenced a strategic review of conduct risk within the business to identify and address key risk drivers. An enhanced Conduct Risk Framework has been developed to further improve the governance and management of conduct risk.
The three lines of defence model places the accountability for the first line of defence with the business units which originate, own, and have responsibility for the identification, management, and reporting of conduct risk. The following business units have specific responsibilities for managing, or supporting the management of, conduct risks:
| | | | |
BUSINESS UNIT | | RESPONSIBILITY |
| | |
• Product Office | | • | | Define and operate the policies, procedures, and methodologies for managing new product approval and product monitoring in line with the conduct risk appetite and policies. |
| | |
| | • | | Review and challenge new products and services submitted for approval to ensure the appropriate identification of conduct risks and assessment against the conduct risk appetite. |
| | |
| | • | | Review, monitor, challenge, and assess product performance in relation to conduct risk throughout their lifecycle. |
| | |
| | • | | Produce regular reporting to senior management and committees, outlining key conduct issues and product concerns, and escalating risks and issues in line with the conduct risk appetite and tolerances. |
| | |
• People & Talent | | • | | Ensure that conduct risks arising from cultural programmes and incentive/remuneration schemes are identified, assessed, managed, and reported effectively in line with this framework and the Conduct Risk Appetite and Tolerances. |
| | |
| | • | | Provide appropriate support to Line 1 Business Units to define training and competence schemes to manage Conduct Risks. |
| | |
• Strategy & CEO Office | | • | | Ensure that conduct risks arising from business plans and the Santander UK strategy are identified, assessed, managed, and reported effectively in line with this framework and the conduct risk appetite and tolerances. |
| | |
| | • | | Ensure that conduct risks arising from the Santander UK business model are identified, assessed, managed, and reported effectively in line with this framework and the conduct risk appetite and tolerances. |
| | |
• UK Banking | | • | | Define and operate the policies, procedures, and methodologies for managing product sales in line with the Conduct Risk Appetite and policies defined by the second line of defence, with particular reference to customer suitability and affordability. |
| | |
| | • | | Ensure that conduct risks arising from product sales in relation to customer suitability and affordability are identified, assessed, managed, and reported effectively in line with this framework and the conduct risk appetite and tolerances. |
| | |
• Investigations & Change | | • | | Define the policies, principles and methodologies for managing the rectification of crystallised conduct risks. |
| | |
| 146 | | Santander UK plc Annual Report 2013 |
Detailed Business Review
Risk Management Reportcontinued
The second line of defence is provided by the Compliance Department, and is independent from the business units. It is responsible for the oversight of the management of conduct risk by the first line of defence teams, and ensuring that conduct risks are managed within the risk appetite, limits and triggers approved by the Board. In addition, the Operational Risk Control Unit is responsible for the provision of certain methodologies and procedures for the management of conduct risk.
The third line of defence is provided by Internal Audit.
| | | | | | |
APPROACH TO CONDUCT RISK |
| |
• | | Santander UK takes a robust approach to managing conduct risk in accordance with the Conduct Risk Framework. |
| |
• | | Santander UK has noted the significant change in the regulatory environment in recent years. Furthermore, with the transition to the FCA from the FSA there is a further increase in the attention of the regulators on conduct risk to ensure firms demonstrate that they are providing appropriate outcomes for customers. Specific focus is being seen on how firms evidence that they actually deliver the right outcomes for customers and that this is in line with expectations, moving away from a focus on processes and procedures. |
| |
• | | In line with all other banks, Santander UK initiated a series of activities to enhance the management of its conduct risks, which culminated in the Conduct Risk Programme. This has focused on the development of four key elements: Risk Policy, Products, Governance and Reporting and Culture. Changes have been made to specific business processes, as well as to the way the business considers, manages and reports conduct risks. In particular, all new products have to be approved by the Product Approval and Oversight Committee which seeks to ensure that new products are appropriately designed. |
| |
• | | Santander UK will continue to place significant attention and resource on seeking to ensure that customers receive the right outcome in every instance and that the necessary controls are in place to mitigate the associated risks and this has been embodied in Santander UK’s approach of ensuring that its products and its dealings with customers are simple, personal and fair. |
| |
• | | The Santander UK conduct risk appetite defines the type and level of: |
| | |
| | • | | Inherent conduct risk (Low – Medium) that Santander UK is willing and able to accept in the pursuit of its strategic objectives, as expressed in business plans; |
| | |
| | • | | Residual conduct risk (Minimal) that Santander UK is willing to tolerate in the pursuit of its strategic objectives; and |
| | |
| | • | | The principles of business that Santander UK will adopt in order to manage it’s business to a minimal tolerance for the residual risk. |
| |
| | The Conduct Risk Appetite is accompanied by an inherent conduct risk matrix, which articulates the business model features associated to different level of Inherent Conduct Risk. |
| |
• | | The Santander UK conduct risk policies set out what action must be taken (or not) to ensure Santander UK adheres to the principles of business articulated in the Risk Appetite and, therefore, remains within agreed conduct risk appetite. |
| | |
| | | | There are four primary Conduct Risk Policies: |
| | |
| | • | | Product Design Policy; |
| | |
| | • | | Sales Policy; |
| | |
| | • | | After Sales & Servicing Policy; and |
| | |
| | • | | The Santander UK Code of Conduct. |
| |
• | | Regular conduct risk reporting is undertaken by the business units, covering: |
| | |
| | • | | End to End Product Monitoring, including: |
| | | |
| | | | • | | Product Reviews; |
| | | |
| | | | • | | Conduct Risk Management Dashboards; and |
| | | |
| | | | • | | Watchlist. |
| | |
| | • | | Risk Mitigation and Remediation |
| | |
| | • | | New Business Initiative Reporting, including: |
| | | |
| | | | • | | New Product Proposals; |
| | | |
| | | | • | | Post Implementation Reviews; and |
| | | |
| | | | • | | Change Initiatives. |
| | |
| | • | | Incidents and Loss Reporting |
| |
| | Conduct risk reporting includes commentary on trends or root cause issues, where identified, to enable effective management action. |
| |
| | The Compliance department provides an independent review and challenge of these reports. It also escalates material issues to the Internal Control Committee Reporting and Product Approval & Oversight Committee. |
Details of Santander UK’s provision for conduct remediation are set out in Note 36 to the Consolidated Financial Statements. Further information on conduct remediation provision sensitivities is set out in “Critical accounting policies and Areas of Significant Management Judgement” in Note 1 to the Consolidated Financial Statements.
| | |
| Santander UK plc Annual Report 2013 | | 147 |
Detailed Business Review
Risk Management Reportcontinued
OPERATIONAL RISK(unaudited)
Operational risk is the direct, or indirect, risk of loss to Santander UK resulting from inadequate or failed internal processes, people and systems, or from external events. As operational risk is inherent in the processes Santander UK operates, in order to provide services to customers and generate profit for investors, an objective of operational risk management is not to remove operational risk altogether, but to manage the risk to an acceptable level, taking into account the cost/benefits of minimisation as opposed to the inherent risk levels. When such risks materialise, they can have not only immediate financial consequences for Santander UK, but also an effect on its business objectives, customer service and regulatory responsibilities. Examples of operational risks include fraud, process failures, system downtime or damage to assets due to fire or flood.
The Operational Risk Framework
Operational risk exposures arise across Santander UK’s business divisions and operating units. The Operational Risk Framework creates the consistent approach to how Santander UK controls and manages its operational risks and helps everyone understand their responsibilities within this approach. It is a core component of the overall Risk Framework and facilitates the ongoing identification, assessment, management and reporting of operational risk, in order to ensure that Santander UK manages its risks at all times in line with its business objectives and within its risk appetite. Santander UK’s priority is to identify and minimise the risk of loss wherever appropriate, irrespective of whether losses have occurred. Measurement of the risk contributes to the establishment of priorities in operational risk management.
The Internal Control Committee has responsibility for establishing adequate and effective risk control processes, policies and reporting systems to ensure operational risk is managed in accordance with the Risk Framework approved by the Santander UK Board.
Operational risk management and tools
The management and oversight of Operational Risk is also covered by the “three lines of defence” model as described in the Risk Framework section. As the first line of defence, all business areas and their management teams are accountable for managing the operational risks inherent in their products, activities, processes and systems, and from external events, and for delegating responsibility for managing individual risks to specific persons. Within the second line, the Operational Risk Control Unit is independent from the business areas which typically originate risks. It has responsibility for the effective control of operational risk and ensuring that it is managed in line with the Operational Risk Framework, and within risk appetite. The third line of defence is carried out by the Internal Audit function.
The following table sets out the key operational risk management tools:
| | | | |
KEY TOOLS | | DESCRIPTION |
| |
• Scenario Analysis | | Santander UK performs simulations of control failures that may cause the most extreme loss events. During 2013 Santander UK enhanced the range of scenarios considered as part of this process. Simulations are developed around high impact risks likely to exceed Santander UK’s operational risk appetite. The analysis allows management to better understand the potential impacts and remediate issues by: |
| | |
| | • | | identifying the high impact events that would cause most damage to Santander UK, both from a financial and reputational perspective; |
| | |
| | • | | ensuring that the business is focused on its most critical risks; and |
| | |
| | • | | facilitating the assessment of capital adequacy. |
| |
• Risk and Control Self Assessments | | Business units identify and assess their operational risks to ensure they are being effectively managed and controlled, and actions prioritised and aligned to Santander UK’s risk appetite. |
| |
• Key Risk Indicators | | Key Risk Indicator performance is monitored against tolerances and trigger points that prompt an early warning to potential exposures, whilst the creation of mitigation strategies help address potential concerns. Indicator metrics are used to provide insight into the changing risk profile of the organisation and are also used to assess the performance of key controls. |
| |
• Loss Data and Event Management | | Loss data capture and analysis processes exist to capture all operational risk loss events. The data is used to identify and correct control weaknesses using events as opportunities to prevent or reduce the impacts of recurrence, identify emerging themes, inform risk and control assessments, scenario analysis and risk reporting. Escalation of single or aggregated events to senior management and appropriate committees is determined by threshold breaches. |
| |
• Reporting | | Reporting forms an integral part of operational risk management ensuring that issues are identified, escalated and managed on a timely basis. Exposures for each business area are reported through monthly risk and control reports which include details on risk exposures and mitigating plans. Events that have a material impact on Santander UK’s finances, reputation, or customers are prioritised and reported immediately to key executives. |
Where appropriate, insurance products are utilised to complement existing risk mitigation measures.
| | |
| 148 | | Santander UK plc Annual Report 2013 |
Detailed Business Review
Risk Management Reportcontinued
Key Risks
During 2013, Santander UK continued to manage its key operational risks in the interests of all its stakeholders, responding to critical developments both within Santander UK and in the environment in which it operates. Risk events and any required changes to management controls are reported through the governance structure. These key risks are set out in the table below:
| | |
KEY RISKS | | DESCRIPTION |
| |
• Operations and Technology Risk | | Santander UK continues to invest in electronic information systems to protect customer, employee and other information to manage effectively the evolving risks associated with the loss of confidentiality, integrity and availability of this information. Appropriate security is applied to protect all customer, employee and other data. Measures taken to reduce the risks include staff education, data encryption and the deployment of specialist software which identifies when customers are at risk of disclosing information to unauthorised parties. During 2013, the PRA conducted an industry-wide review of the risk associated with ‘Critical Infrastructure & Banking Processes’. In response to this review Santander UK is making a number of further enhancements to its associated risk appetite, risk management and reporting. Santander UK has also undertaken a review of its legacy IT systems. |
| |
• Fraud Risk | | Santander UK has continued to invest in staff education and improved external and internal fraud detection and prevention systems, in order to counter the increasing threat of financial crime. The introduction of sophisticated internet fraud prevention solutions and use of mandatory identification numbers for payments has reduced the risk of fraudulent account takeovers by organised criminals, enhancing our customer identification protocols in a customer-friendly manner. The fraud prevention functions continually monitor emerging fraud trends and losses on a case-by-case basis. Action plans are formulated and tracked to ensure root causes have been identified and effective remediation conducted. |
| |
• Supplier Risk | | Supplier risk is the risk of reductions in earnings and/or value, through financial or reputational loss associated with the failure of a service or goods provision by a third party organisation. Santander UK has arrangements with both Banco Santander group companies (including the provision of IT infrastructure, software development and banking operations) and external outsourced service providers. A comprehensive supplier risk management and control framework applies to the management of all suppliers contracted by Santander UK to provide services or goods. Santander UK uses written service level agreements with these entities that include key service performance metrics. Santander UK works closely with outsourced service providers via the application of appropriate processes and procedures designed to ensure continuity of critical services. |
| |
• Cyber attack | | Cyber attack is an increasing emerging risk which is perpetrated in a variety of ways including e-fraud, denial of service attacks and intrusion. We work with industry-wide fora and the security services to ensure intelligence and methods can be shared and preventative measures installed as quickly as possible. |
Additionally certain key risk types are managed as integral subsets of Santander UK’s overall operational risk management. The Line 1 activities surrounding these fall under the relevant business areas, with the independent Lines 2 and 3 providing control and assurance respectively.
| | |
KEY RISKS TYPES | | DESCRIPTION |
| |
• Strategic Risk | | Strategic risk is the risk of material deviations in expected/target shareholder value as a result of poor definition or implementation of Santander UK’s strategy. Santander UK takes a robust approach to managing strategic risk in full alignment with the Strategic Risk Framework. In setting the business’s strategy, risk policies are taken into consideration at all times and the strategy is stress tested against risk appetite statements. Both the strategy and Risk Appetite are approved by the Board. Strategic risk is managed on a regular basis through the risk governance structure including the Asset & Liability Committee, the Executive Committee and the Board. Management assessment takes into consideration any relevant information across the whole business which may highlight either risks to the implementation of Santander UK’s strategy or where risks are being created due to poor definition of the strategy in order to inform the Executive Committee and Board of what further actions may be required. |
| |
• Reputational Risk | | Santander UK rigorously manages risks that may affect its reputation and which may in turn detract from its ability to achieve its strategic objectives, or otherwise negatively impact customers, shareholders, staff or any other stakeholder. Reputational considerations are built into all the key risk and issue assessment tools, and the governance structure provides the vehicle through which these considerations are addressed. |
| |
• People and Talent Risk | | People and Talent risk is defined as the risk of not having the sufficient number and quality of people to deliver Santander UK’s strategy, whilst complying with legislative and regulatory requirements. In managing people and talent risk, Santander UK has established a set of policies which outline its minimum standards in relation to the management of people issues. In 2013, as in previous years, pay levels and bonuses have continued to be a significant issue for the financial services sector and Santander UK has ensured that all policies, processes, governance and practices are compliant with the FCA Remuneration Code |
| |
• Accounting and Reporting Risk | | Accounting and reporting risk is defined as the failure to comply with regulatory and legal requirements for accounting and reporting of financial disclosures, which may lead to fines, restrictions or reputational damage. In order to facilitate the identification, measurement, monitoring and reporting of accounting and reporting risks, a comprehensive business-wide framework of controls has been established, supported by a programme of regular assessment and reporting designed to identify and remedy any deficiencies in process or practice. This includes the systems and controls designed and developed to support management’s attestation on the effectiveness of disclosure controls and controls over financial reporting. |
| | |
| Santander UK plc Annual Report 2013 | | 149 |
Detailed Business Review
Risk Management Reportcontinued
Capital and modelling
Santander UK currently adopts the standardised approach for Pillar 1 operational risk capital requirments. During 2013, we continued to enhance our approach to the statistical modelling of operational risk losses. The approach being developed will align with the Basel II advanced measurement approach (‘AMA’).
Operational loss profile
The following table sets out the major categories of Santander UK’s non-financial risk loss profile in 2013. The operational loss classifications in the chart replicate the Basel II categories of loss, although within the Santander UK Risk Framework the responsibility for management of some of these risks may fall within other risk types (for example, Conduct, Regulatory and Legal Risk). The figures and volumes quoted reflect the loss data collection and categorisation policies in place within Santander UK at 31 December 2013. A revised Operational Risk Framework was approved in January 2014, which should enhance the degree of comparability with the range of different categorisations employed across the financial services industry.
During 2013, the majority of Santander UK’s £220m (2012: £341m) of non-financial risk losses arose within the clients, products and business practices category. These principally represented redress payouts (excluding related costs) on the sales of payment protection insurance (‘PPI’) products. See Note 36 to the Consolidated Financial Statements for more information on PPI.
| | | | | | | | | | | | | | | | |
| | | £m | | | 2013
Volume | | | £m | | | 2012
Volume | |
Internal Fraud | | | 3 | | | | 1,318 | | | | 6 | | | | 2,005 | |
External Fraud | | | 24 | | | | 163,272 | | | | 35 | | | | 124,924 | |
Employment Practices and Workplace Safety | | | 1 | | | | 183 | | | | 1 | | | | 161 | |
Clients, Products, and Business Practices | | | 170 | | | | 121,363 | | | | 280 | | | | 145,278 | |
Damage to Physical Assets | | | 1 | | | | 66 | | | | — | | | | 9 | |
Business Disruption and Systems Failures | | | — | | | | 1,892 | | | | — | | | | 6,275 | |
Execution, Delivery, and Process Management | | | 21 | | | | 614,610 | | | | 19 | | | | 636,544 | |
| | | | | | | | | | | | | | | | |
Total | | | 220 | | | | 902,704 | | | | 341 | | | | 915,196 | |
| | | | | | | | | | | | | | | | |
REGULATORY RISK(unaudited)
Regulatory risk is the risk of reductions in earnings and/or value, through financial or reputational loss, from failing to comply with applicable codes and regulatory rules.
Santander UK seeks to ensure it fully meets all of its regulatory obligations. There are a number of legislative and regulatory developments both in the UK and abroad, going through a consultation and implementation process, which may have some effect on Santander UK’s approach to regulatory risk. Key developments that are expected to have the greatest impact on the Santander UK group’s operations include the change to rules following the Mortgage Market Review, which come into force in April 2014, the transfer of consumer credit regulation (which includes new and existing second charge mortgages) from the OFT to the FCA in April 2014 and the implementation of the European Mortgage Credit Directive. More details are set out in the Risk Factors section on page 317.
There has been continued regulatory change following the financial crisis and the regulatory landscape continues to evolve. During 2013, responsibility for financial services supervision transferred from the FSA to two new organisations, the PRA (a subsidiary of the Bank of England) and the FCA. Both organisations implemented new supervisory approaches and included new regulatory powers under the Financial Services Act 2012. The FCA has new objectives to promote competition in financial markets in the interests of consumers. The PRA is responsible for prudential regulation and implementing key EU directives such as CRD IV. Santander UK maintains a proactive approach to regulation and aims to provide constructive feedback on policy consultations and engage across the banking sector. Santander UK takes compliance with regulatory requirements seriously and manages its arrangements accordingly in alignment with the Regulatory Risk Framework. This framework has been developed through Santander UK’s overall Risk Framework and Operational Risk Framework, which include the core principles of risk management and control activities.
The Regulatory Risk Framework defines the overriding principles and responsibilities for the identification, management, measurement, monitoring, control, reporting and oversight of regulatory risk. It is the operation of, and outputs from, these risk management activities that enables Santander UK to manage regulatory risk exposures. It is expected that all Business Units will manage their team activities and processes to follow the principles and guidelines set out in the Regulatory Risk Framework, and with those detailed in the Santander UK Risk and Operational Risk Frameworks.
Key regulatory developments are monitored and assessed against Santander UK group business and reported through formal governance committees. Reporting captures all material regulatory reviews and investigations and upstream regulatory developments, as well as tracking status and trends in key regulatory relationships.
LEGAL RISK(unaudited)
Santander UK takes a robust approach to managing legal risk in full alignment with the Legal Risk Framework. This framework has been developed through Santander UK’s overall Risk Framework, which includes the core principles of risk management and control activities.
The Legal Risk Framework defines the overriding principles and responsibilities for the identification, management, measurement, monitoring, control, reporting and oversight of legal risk. It is the operation of, and outputs from, these risk management activities that enables Santander UK to manage legal risk exposures within the tolerances outlined in the Santander UK Risk Appetite, Limits and Triggers Statement. It is expected that all Business Units will manage their team activities and processes to follow the principles and guidelines set out in the Legal Risk Framework, and with those detailed in the Santander UK Risk Framework.
Santander UK continues to monitor, assess and respond to developments concerning legal requirements intended to prevent future financial crises or otherwise assure the stability of financial institutions.
| | |
| 150 | | Santander UK plc Annual Report 2013 |
Detailed Business Review
Risk Management Reportcontinued
AREAS OF FOCUS AND OTHER ITEMS
1. COUNTRY RISK EXPOSURE
Santander UK manages its country risk exposure under its global limits framework. Within this framework, Santander UK sets its individual risk appetite for each country, taking into account any factors that may influence the risk profile of each country, including political events, the macro-economic situation and the nature of the risk incurred. Exposures are actively managed if it is considered appropriate. Accordingly, and over recent years, Santander UK has intensified its monitoring of exposures to sovereigns and counterparties in eurozone countries, and has proceeded to selectively divest assets directly or indirectly affected by events in those countries.Banco Santander group-related risk is considered separately.
The country risk tables below show Santander UK’s exposures to central and local governments, government guaranteed counterparties, banks, other financial institutions, retail customers and corporate customers at 31 December 2013 and 2012. Total exposures consist of the total of balance sheet values and off-balance sheet values. Balance sheet values are calculated in accordance with IFRS (i.e. after the effect of netting agreements recognised in accordance with the requirements of IFRS) except for credit provisions which have been added back. Off balance sheet values consist of undrawn facilities and letters of credit.
The country of exposure has been assigned based on the counterparty’s country of incorporation except where Santander UK is aware that a guarantee is in place, in which case the country of incorporation of the guarantor has been used. The exposures are presented by type of counterparty other than where the specific exposures have been guaranteed by a sovereign counterparty in which case they are presented within the “Government guaranteed” category.
Given the ongoing interest in eurozone economies, disclosures relating to those economies are presented first and highlighted separately.
The tables exclude credit risk exposures to other Banco Santander group companies, which are presented separately on pages 155 to 156.
| | | | | | | | | | | | | | | | | | | | | | | | | | | | |
31 December 2013 | | Central and local
governments
£bn | | | Government
guaranteed
£bn | | | Banks (2)
£bn | | | Other financial
institutions
£bn | | | Retail
£bn | | | Corporate
£bn | | | Total(1)
£bn | |
Eurozone: | | | | | | | | | | | | | | | | | | | | | | | | | | | | |
Peripheral eurozone countries: | | | | | | | | | | | | | | | | | | | | | | | | | | | | |
Ireland | | | — | | | | — | | | | — | | | | — | | | | — | | | | 0.1 | | | | 0.1 | |
Spain (excluding Banco Santander) | | | — | | | | — | | | | 0.2 | | | | — | | | | — | | | | 0.1 | | | | 0.3 | |
Italy | | | 0.8 | | | | — | | | | 0.1 | | | | — | | | | — | | | | 0.1 | | | | 1.0 | |
Portugal | | | — | | | | — | | | | — | | | | — | | | | — | | | | 0.1 | | | | 0.1 | |
Other eurozone countries: | | | | | | | | | | | | | | | | | | | | | | | | | | | | |
Germany | | | — | | | | — | | | | 1.6 | | | | — | | | | — | | | | 0.2 | | | | 1.8 | |
France | | | — | | | | 0.4 | | | | 1.9 | | | | — | | | | — | | | | 0.1 | | | | 2.4 | |
All other eurozone(3) | | | — | | | | 0.2 | | | | 1.4 | | | | — | | | | — | | | | 1.3 | | | | 2.9 | |
| | | | | | | | | | | | | | | | | | | | | | | | | | | | |
| | | 0.8 | | | | 0.6 | | | | 5.2 | | | | — | | | | — | | | | 2.0 | | | | 8.6 | |
| | | | | | | | | | | | | | | | | | | | | | | | | | | | |
All other countries: | | | | | | | | | | | | | | | | | | | | | | | | | | | | |
UK | | | 24.2 | | | | 0.4 | | | | 12.4 | | | | 5.1 | | | | 172.7 | | | | 41.6 | | | | 256.4 | |
US | | | 5.3 | | | | — | | | | 8.2 | | | | 0.1 | | | | 0.1 | | | | 0.5 | | | | 14.2 | |
Switzerland | | | 0.5 | | | | — | | | | 1.3 | | | | — | | | | — | | | | 0.5 | | | | 2.3 | |
Denmark | | | — | | | | — | | | | 1.4 | | | | — | | | | — | | | | 0.1 | | | | 1.5 | |
Japan | | | 3.8 | | | | — | | | | 0.1 | | | | — | | | | — | | | | 0.1 | | | | 4.0 | |
All others | | | — | | | | — | | | | 0.8 | | | | 0.1 | | | | 0.5 | | | | 3.0 | | | | 4.4 | |
| | | | | | | | | | | | | | | | | | | | | | | | | | | | |
| | | 33.8 | | | | 0.4 | | | | 24.2 | | | | 5.3 | | | | 173.3 | | | | 45.8 | | | | 282.8 | |
| | | | | | | | | | | | | | | | | | | | | | | | | | | | |
| (1) | Credit exposures exclude cash at hand, the macro hedge of interest rate risk, intangible assets, property, plant and equipment, current and deferred tax assets, retirement benefit assets and other assets. Loans and advances to customers are included gross of loan loss allowances. |
| (2) | Excludes balances with central banks. |
| (3) | Includes Luxembourg, Netherlands, Belgium and Finland, as well as Greece of £3m and Cyprus of £nil. |
| | |
| Santander UK plc Annual Report 2013 | | 151 |
Detailed Business Review
Risk Management Reportcontinued
| | | | | | | | | | | | | | | | | | | | | | | | | | | | |
31 December 2012 | | Central and local
governments
£bn | | | Government
guaranteed
£bn | | | Banks (2)
£bn | | | Other financial
institutions
£bn | | | Retail
£bn | | | Corporate
£bn | | | Total(1)
£bn | |
Eurozone: | | | | | | | | | | | | | | | | | | | | | | | | | | | | |
Peripheral eurozone countries: | | | | | | | | | | | | | | | | | | | | | | | | | | | | |
Ireland | | | — | | | | — | | | | — | | | | — | | | | — | | | | 0.3 | | | | 0.3 | |
Spain (excluding Banco Santander) | | | — | | | | — | | | | 0.2 | | | | — | | | | — | | | | 0.1 | | | | 0.3 | |
Italy | | | — | | | | — | | | | 0.2 | | | | — | | | | — | | | | — | | | | 0.2 | |
Portugal | | | — | | | | — | | | | — | | | | — | | | | — | | | | 0.1 | | | | 0.1 | |
Other eurozone countries: | | | | | | | | | | | | | | | | | | | | | | | | | | | | |
Germany | | | 1.3 | | | | — | | | | 3.5 | | | | — | | | | — | | | | 0.2 | | | | 5.0 | |
France | | | — | | | | — | | | | 2.2 | | | | — | | | | — | | | | 0.2 | | | | 2.4 | |
All other eurozone(3) | | | — | | | | — | | | | 0.8 | | | | 0.2 | | | | — | | | | 1.6 | | | | 2.6 | |
| | | | | | | | | | | | | | | | | | | | | | | | | | | | |
| | | 1.3 | | | | — | | | | 6.9 | | | | 0.2 | | | | — | | | | 2.5 | | | | 10.9 | |
| | | | | | | | | | | | | | | | | | | | | | | | | | | | |
All other countries: | | | | | | | | | | | | | | | | | | | | | | | | | | | | |
UK | | | 33.5 | | | | 0.4 | | | | 14.5 | | | | 11.8 | | | | 181.0 | | | | 43.8 | | | | 285.0 | |
US | | | 0.8 | | | | — | | | | 15.2 | | | | — | | | | 0.1 | | | | 0.7 | | | | 16.8 | |
Switzerland | | | 0.5 | | | | — | | | | 1.8 | | | | 0.5 | | | | — | | | | 0.5 | | | | 3.3 | |
Denmark | | | — | | | | — | | | | 2.3 | | | | — | | | | — | | | | — | | | | 2.3 | |
Japan | | | 1.2 | | | | — | | | | 0.2 | | | | — | | | | — | | | | 0.2 | | | | 1.6 | |
All others | | | — | | | | — | | | | 0.7 | | | | — | | | | 0.4 | | | | 1.5 | | | | 2.6 | |
| | | | | | | | | | | | | | | | | | | | | | | | | | | | |
| | | 36.0 | | | | 0.4 | | | | 34.7 | | | | 12.3 | | | | 181.5 | | | | 46.7 | | | | 311.6 | |
| | | | | | | | | | | | | | | | | | | | | | | | | | | | |
| (1) | Credit exposures exclude cash at hand, the macro hedge of interest rate risk, intangible assets, property, plant and equipment, current and deferred tax assets, retirement benefit assets and other assets. Loans and advances to customers are included gross of loan loss allowances. |
| (2) | Excludes balances with central banks. |
| (3) | Includes Luxembourg, The Netherlands, Belgium and Finland, as well as Greece of £3m and Cyprus of £nil. |
2013 compared to 2012(unaudited)
Key changes in sovereign and other country risk exposures during the year ended 31 December 2013 were as follows:
| • | A decrease of £28.4bn in exposure to the UK to £256.4bn (2012: £285.0bn). This was due to a reduction in deposits with the Bank of England as deposits were placed instead at the US Federal Reserve as part of liquid asset portfolio management activity, as well as lower securities purchased under resale activity and lower retail mortgage lending. |
| • | A decrease of £2.6bn in exposure to the US to £14.2bn (2012: £16.8bn). This was primarily due to reduced securities purchased under resale activity partially offset by an increase in deposits at the US Federal Reserve as part of normal liquid asset portfolio management activity. |
| • | A decrease of £1.0bn in exposure to Switzerland to £2.3bn (2012: £3.3bn). This was due to reduced securities purchased under resale activity and lower gross derivative exposures. |
| • | A decrease of £3.2bn in exposures to Germany to £1.8bn (2012: £5.0bn). This was primarily due to reduced securities purchased under resale activity and lower gross derivative exposures. |
| • | An increase of £2.4bn in exposures to Japan to £4.0bn (2012: £1.6bn). This was primarily due to new holdings of government securities as part of normal liquid asset portfolio management activity. |
| • | An increase of £0.8bn in exposures to Italy to £1.0bn (2012: £0.2bn). This principally reflected the purchase of Italian Government bonds with less than one year maturity as part of short-term markets trading activity. |
| • | Movements in the remaining country risk exposures were minimal and exposures to these countries remained at low levels. |
Further analysis of sovereign debt and other country risk exposures, including peripheral eurozone exposures
Presented overleaf separately for sovereign debt and other country risk exposures is additional analysis of exposures into those that are accounted for on-balance sheet (further analysed into those measured at amortised cost and those measured at fair value) and those that are off-balance sheet.
The assets held at amortised cost are principally classified as loans and advances to banks, loans and advances to customers and loans and receivables securities. Santander UK has no held-to-maturity securities.
The assets held at fair value are classified as either trading assets or have been designated as held at fair value through profit or loss, with the exception of government debt held for liquidity purposes, which are classified as available-for-sale securities.
Santander UK has made no reclassifications to/from the assets which are held at fair value from/to any other category.
| | |
| 152 | | Santander UK plc Annual Report 2013 |
Detailed Business Review
Risk Management Reportcontinued
Sovereign debt
| | | | | | | | | | | | | | | | | | | | | | | | | | | | | | | | | | | | |
| 31 December 2013 | | Assets held at Amortised Cost | | | Assets held at Fair Value | | �� | | | | | | | | |
| | | Central and
local
governments
£bn | | | Government
guaranteed
£bn | | | Total
£bn | | | Central and
local
government
£bn | | | Government
guaranteed
£bn | | | Total
£bn | | | Total
Balance
Sheet Asset
£bn | | | Commitments
and undrawn
facilities
£bn | | | Total
£bn | |
Eurozone countries: | | | | | | | | | | | | | | | | | | | | | | | | | | | | | | | | | |
France | | | — | | | | — | | | | — | | | | — | | | | 0.4 | | | | 0.4 | | | | 0.4 | | | | — | | | | 0.4 | |
Italy | | | — | | | | — | | | | — | | | | 0.8 | | | | — | | | | 0.8 | | | | 0.8 | | | | — | | | | 0.8 | |
| | | | | | | | | | | | | | | | | | | | | | | | | | | | | | | | | | | | |
| | | — | | | | — | | | | — | | | | 0.8 | | | | 0.4 | | | | 1.2 | | | | 1.2 | | | | — | | | | 1.2 | |
| | | | | | | | | | | | | | | | | | | | | | | | | | | | | | | | | | | | |
All other countries: | | | | | | | | | | | | | | | | | | | | | | | | | | | | | | | | | | | | |
UK | | | 20.3 | | | | — | | | | 20.3 | | | | 3.9 | | | | 0.4 | | | | 4.3 | | | | 24.6 | | | | — | | | | 24.6 | |
US | | | 4.9 | | | | — | | | | 4.9 | | | | 0.4 | | | | — | | | | 0.4 | | | | 5.3 | | | | — | | | | 5.3 | |
Japan | | | — | | | | — | | | | — | | | | 3.8 | | | | — | | | | 3.8 | | | | 3.8 | | | | — | | | | 3.8 | |
Switzerland | | | — | | | | — | | | | — | | | | 0.5 | | | | — | | | | 0.5 | | | | 0.5 | | | | — | | | | 0.5 | |
| | | | | | | | | | | | | | | | | | | | | | | | | | | | | | | | | | | | |
| | | 25.2 | | | | — | | | | 25.2 | | | | 8.6 | | | | 0.4 | | | | 9.0 | | | | 34.2 | | | | — | | | | 34.2 | |
| | | | | | | | | | | | | | | | | | | | | | | | | | | | | | | | | | | | |
| | | | | |
| 31 December 2012 | | Assets held at Amortised Cost | | | Assets held at Fair Value | | | | | | | | | | |
| | | Central and
local
governments
£bn | | | Government
guaranteed
£bn | | | Total
£bn | | | Central and
local
governments
£bn | | | Government
guaranteed
£bn | | | Total
£bn | | | Total
Balance
Sheet Asset
£bn | | | Commitments
and undrawn
facilities
£bn | | | Total
£bn | |
Eurozone countries: | | | | | | | | | | | | | | | | | | | | | | | | | | | | | | | | | | | | |
Germany | | | — | | | | — | | | | — | | | | 1.3 | | | | — | | | | 1.3 | | | | 1.3 | | | | — | | | | 1.3 | |
| | | | | | | | | | | | | | | | | | | | | | | | | | | | | | | | | | | | |
| | | — | | | | — | | | | — | | | | 1.3 | | | | — | | | | 1.3 | | | | 1.3 | | | | — | | | | 1.3 | |
| | | | | | | | | | | | | | | | | | | | | | | | | | | | | | | | | | | | |
All other countries: | | | | | | | | | | | | | | | | | | | | | | | | | | | | | | | | | | | | |
UK | | | 27.8 | | | | — | | | | 27.8 | | | | 5.7 | | | | 0.4 | | | | 6.1 | | | | 33.9 | | | | — | | | | 33.9 | |
Japan | | | — | | | | — | | | | — | | | | 1.2 | | | | — | | | | 1.2 | | | | 1.2 | | | | — | | | | 1.2 | |
US | | | 0.4 | | | | — | | | | 0.4 | | | | 0.4 | | | | — | | | | 0.4 | | | | 0.8 | | | | — | | | | 0.8 | |
Switzerland | | | — | | | | — | | | | — | | | | 0.5 | | | | — | | | | 0.5 | | | | 0.5 | | | | — | | | | 0.5 | |
| | | | | | | | | | | | | | | | | | | | | | | | | | | | | | | | | | | | |
| | | 28.2 | | | | — | | | | 28.2 | | | | 7.8 | | | | 0.4 | | | | 8.2 | | | | 36.4 | | | | — | | | | 36.4 | |
| | | | | | | | | | | | | | | | | | | | | | | | | | | | | | | | | | | | |
Santander UK has no direct sovereign exposures to any other countries. Santander UK has not recognised any impairment losses against sovereign debt which is held at amortised cost. Santander UK has no exposures to credit default swaps (either written or purchased) which are directly referenced to sovereign debt or other instruments that are directly referenced to sovereign debt.
Other country risk exposures(1)
| | | | | | | | | | | | | | | | | | | | | | | | | | | | | | | | | | | | | | | | | | | | | | | | |
| 31 December 2013 | | Assets held at Amortised Cost | | | Assets held at Fair Value(2) | | | | | | | | | | |
| | | Banks
£bn | | | Other
financial
institutions
£bn | | | Retail
£bn | | | Corporate
£bn | | | Total
£bn | | | Banks
£bn | | | Other
financial
institutions
£bn | | | Corporate
£bn | | | Total
£bn | | | Total
Balance
Sheet
Asset
£bn | | | Commitments
and undrawn
facilities(3)
£bn | | | Total
£bn | |
Eurozone: | | | | | | | | | | | | | | | | | | | | | | | | | | | | | | | | | | | | | | | | | | | | | | | | |
Peripheral eurozone countries: | | | | | | | | | | | | | | | | | | | | | | | | | | | | | | | | | | | | | | | | | | | | | | | | |
Ireland | | | — | | | | — | | | | — | | | | 0.1 | | | | 0.1 | | | | — | | | | — | | | | — | | | | — | | | | 0.1 | | | | — | | | | 0.1 | |
Spain | | | 0.1 | | | | — | | | | — | | | | — | | | | 0.1 | | | | 0.1 | | | | — | | | | — | | | | 0.1 | | | | 0.2 | | | | 0.1 | | | | 0.3 | |
Italy | | | 0.1 | | | | — | | | | — | | | | 0.1 | | | | 0.2 | | | | — | | | | — | | | | — | | | | — | | | | 0.2 | | | | — | | | | 0.2 | |
Portugal | | | — | | | | — | | | | — | | | | 0.1 | | | | 0.1 | | | | — | | | | — | | | | — | | | | — | | | | 0.1 | | | | — | | | | 0.1 | |
Other eurozone countries: | | | | | | | | | | | | | | | | | | | | | | | | | | | | | | | | | | | | | | | | | | | | | | | | |
Germany | | | 0.1 | | | | — | | | | — | | | | 0.2 | | | | 0.3 | | | | 1.5 | | | | — | | | | — | | | | 1.5 | | | | 1.8 | | | | — | | | | 1.8 | |
France | | | 0.1 | | | | — | | | | — | | | | 0.1 | | | | 0.2 | | | | 1.8 | | | | — | | | | — | | | | 1.8 | | | | 2.0 | | | | — | | | | 2.0 | |
Other | | | — | | | | — | | | | — | | | | 0.6 | | | | 0.6 | | | | 1.4 | | | | — | | | | — | | | | 1.4 | | | | 2.0 | | | | 0.7 | | | | 2.7 | |
| | | | | | | | | | | | | | | | | | | | | | | | | | | | | | | | | | | | | | | | | | | | | | | | |
| | | 0.4 | | | | — | | | | — | | | | 1.2 | | | | 1.6 | | | | 4.8 | | | | — | | | | — | | | | 4.8 | | | | 6.4 | | | | 0.8 | | | | 7.2 | |
| | | | | | | | | | | | | | | | | | | | | | | | | | | | | | | | | | | | | | | | | | | | | | | | |
All other countries: | | | | | | | | | | | | | | | | | | | | | | | | | | | | | | | | | | | | | | | | | | | | | | | | |
UK | | | 1.5 | | | | — | | | | 155.2 | | | | 26.1 | | | | 182.8 | | | | 10.8 | | | | 4.9 | | | | 4.9 | | | | 20.6 | | | | 203.4 | | | | 28.1 | | | | 231.5 | |
US | | | 0.5 | | | | — | | | | 0.1 | | | | 0.4 | | | | 1.0 | | | | 7.7 | | | | 0.1 | | | | 0.1 | | | | 7.9 | | | | 8.9 | | | | — | | | | 8.9 | |
Switzerland | | | — | | | | — | | | | — | | | | 0.4 | | | | 0.4 | | | | 1.3 | | | | — | | | | — | | | | 1.3 | | | | 1.7 | | | | 0.1 | | | | 1.8 | |
Denmark | | | — | | | | — | | | | — | | | | — | | | | — | | | | 1.4 | | | | — | | | | — | | | | 1.4 | | | | 1.4 | | | | 0.1 | | | | 1.5 | |
Japan | | | — | | | | — | | | | — | | | | — | | | | — | | | | 0.1 | | | | — | | | | 0.1 | | | | 0.2 | | | | 0.2 | | | | — | | | | 0.2 | |
Other | | | — | | | | — | | | | 0.5 | | | | 2.2 | | | | 2.7 | | | | 0.8 | | | | 0.1 | | | | — | | | | 0.9 | | | | 3.6 | | | | 0.8 | | | | 4.4 | |
| | | | | | | | | | | | | | | | | | | | | | | | | | | | | | | | | | | | | | | | | | | | | | | | |
| | | 2.0 | | | | — | | | | 155.8 | | | | 29.1 | | | | 186.9 | | | | 22.1 | | | | 5.1 | | | | 5.1 | | | | 32.3 | | | | 219.2 | | | | 29.1 | | | | 248.3 | |
| | | | | | | | | | | | | | | | | | | | | | | | | | | | | | | | | | | | | | | | | | | | | | | | |
| (1) | Excluding other Banco Santander group companies. |
| (2) | The assets held at fair value were presented as either trading assets or designated as held at fair value through profit or loss. Santander UK did not hold any significant available-for-sale securities, with the exception of government debt held for liquidity purposes, as described on the previous page. |
| (3) | Of which £19.1bn is presented in Retail Banking and the remainder is presented in Commercial Banking. |
| | |
| Santander UK plc Annual Report 2013 | | 153 |
Detailed Business Review
Risk Management Reportcontinued
| | | | | | | | | | | | | | | | | | | | | | | | | | | | | | | | | | | | | | | | | | | | | | | | |
| 31 December 2012 | | Assets held at Amortised Cost | | | Assets held at Fair Value(2) | | | | | | | | | | |
| | | Banks
£bn | | | Other
financial
institutions
£bn | | | Retail
£bn | | | Corporate
£bn | | | Total
£bn | | | Banks
£bn | | | Other
financial
institutions
£bn | | | Corporate
£bn | | | Total
£bn | | | Total
Balance
Sheet
Asset
£bn | | | Commitments
and undrawn
facilities(3)
£bn | | | Total
£bn | |
Eurozone: | | | | | | | | | | | | | | | | | | | | | | | | | | | | | | | | | | | | | | | | | | | | | | | | |
Peripheral eurozone countries: | | | | | | | | | | | | | | | | | | | | | | | | | | | | | | | | | | | | | | | | | | | | | | | | |
Ireland | | | — | | | | — | | | | — | | | | 0.2 | | | | 0.2 | | | | — | | | | — | | | | — | | | | — | | | | 0.2 | | | | 0.1 | | | | 0.3 | |
Spain | | | 0.2 | | | | — | | | | — | | | | 0.1 | | | | 0.3 | | | | — | | | | — | | | | — | | | | — | | | | 0.3 | | | | — | | | | 0.3 | |
Italy | | | 0.1 | | | | — | | | | — | | | | — | | | | 0.1 | | | | 0.1 | | | | — | | | | — | | | | 0.1 | | | | 0.2 | | | | — | | | | 0.2 | |
Portugal | | | — | | | | — | | | | — | | | | 0.1 | | | | 0.1 | | | | — | | | | — | | | | — | | | | — | | | | 0.1 | | | | — | | | | 0.1 | |
Other eurozone countries: | | | | | | | | | | | | | | | | | | | | | | | | | | | | | | | | | | | | | | | | | | | | | | | | |
Germany | | | — | | | | — | | | | — | | | | 0.2 | | | | 0.2 | | | | 3.5 | | | | — | | | | — | | | | 3.5 | | | | 3.7 | | | | — | | | | 3.7 | |
France | | | — | | | | — | | | | — | | | | 0.1 | | | | 0.1 | | | | 2.2 | | | | — | | | | 0.1 | | | | 2.3 | | | | 2.4 | | | | — | | | | 2.4 | |
Other | | | — | | | | 0.2 | | | | — | | | | 1.0 | | | | 1.2 | | | | 0.8 | | | | — | | | | — | | | | 0.8 | | | | 2.0 | | | | 0.6 | | | | 2.6 | |
| | | | | | | | | | | | | | | | | | | | | | | | | | | | | | | | | | | | | | | | | | | | | | | | |
| | | 0.3 | | | | 0.2 | | | | — | | | | 1.7 | | | | 2.2 | | | | 6.6 | | | | — | | | | 0.1 | | | | 6.7 | | | | 8.9 | | | | 0.7 | | | | 9.6 | |
| | | | | | | | | | | | | | | | | | | | | | | | | | | | | | | | | | | | | | | | | | | | | | | | |
All other countries: | | | | | | | | | | | | | | | | | | | | | | | | | | | | | | | | | | | | | | | | | | | | | | | | |
UK | | | 0.8 | | | | 4.8 | | | | 154.5 | | | | 30.7 | | | | 190.8 | | | | 13.4 | | | | 7.0 | | | | 3.4 | | | | 23.8 | | | | 214.6 | | | | 36.1 | | | | 250.7 | |
US | | | 1.3 | | | | — | | | | 0.1 | | | | 0.6 | | | | 2.0 | | | | 13.9 | | | | — | | | | 0.1 | | | | 14.0 | | | | 16.0 | | | | — | | | | 16.0 | |
Switzerland | | | — | | | | — | | | | — | | | | 0.3 | | | | 0.3 | | | | 1.8 | | | | 0.5 | | | | — | | | | 2.3 | | | | 2.6 | | | | 0.2 | | | | 2.8 | |
Denmark | | | — | | | | — | | | | — | | | | — | | | | — | | | | 2.3 | | | | — | | | | — | | | | 2.3 | | | | 2.3 | | | | — | | | | 2.3 | |
Japan | | | — | | | | — | | | | — | | | | — | | | | — | | | | 0.2 | | | | — | | | | 0.2 | | | | 0.4 | | | | 0.4 | | | | — | | | | 0.4 | |
Other | | | 0.1 | | | | — | | | | 0.4 | | | | 1.1 | | | | 1.6 | | | | 0.5 | | | | — | | | | 0.1 | | | | 0.6 | | | | 2.2 | | | | 0.4 | | | | 2.6 | |
| | | | | | | | | | | | | | | | | | | | | | | | | | | | | | | | | | | | | | | | | | | | | | | | |
| | | 2.2 | | | | 4.8 | | | | 155.0 | | | | 32.7 | | | | 194.7 | | | | 32.1 | | | | 7.5 | | | | 3.8 | | | | 43.4 | | | | 238.1 | | | | 36.7 | | | | 274.8 | |
| | | | | | | | | | | | | | | | | | | | | | | | | | | | | | | | | | | | | | | | | | | | | | | | |
| (1) | Excluding other Banco Santander group companies. |
| (2) | The assets held at fair value were presented as either trading assets or designated as held at fair value through profit or loss. Santander UK did not hold any significant available-for-sale securities, with the exception of government debt held for liquidity purposes, as described on the previous page. |
| (3) | Of which £21.9bn is presented in Retail Banking and the remainder is presented in Commercial Banking. |
Commitments and undrawn facilities principally consist of formal standby facilities and credit lines in Santander UK’s Retail Banking and Commercial Banking operations. Within Retail Banking, these represent credit cards (excluding co-brand credit cards), mortgage and overdraft facilities. Within Commercial Banking, these represent standby loan facilities. A summary of the key terms and a maturity analysis of formal standby facilities, credit lines and other commitments are set out in Note 38 to the Consolidated Financial Statements.
Maturity analyses of Santander UK’s assets held at amortised cost are set out in Note 45 to the Consolidated Financial Statements.
Peripheral eurozone countries
This section discusses Santander UK's direct exposure to peripheral eurozone countries at 31 December 2013 and 2012 by type of financial instrument.It excludes balances with other Banco Santander group companies which are presented separately on pages 155 to 156.This section also discusses our indirect exposures to peripheral eurozone countries
Direct and indirect risk exposures to peripheral eurozone countries arise primarily in the large corporate element of the portfolio via large multinational companies and financial institutions, which are monitored on a regular basis by the Wholesale Credit Risk Department as part of the overall risk management process. The corporate portfolio is mainly comprised of multinational UK companies which are considered to be geographically well diversified in terms of their assets, operations and profits. The remainder of the Commercial Banking portfolio is predominately UK based with no material peripheral eurozone exposure. In addition, the risk is further mitigated by the fact that credit agreements are underpinned by both financial and non-financial covenants.
The risk arising from indirect exposures from our transactions with financial institutions is mitigated by the short-term tenor of the transactions, and by the fact that many such transactions contain margin calls and/or collateral requirements, and are subject to standard ISDA Master Agreements permitting offsetting.
The risk arising from indirect exposures from our transactions with other corporates is mitigated by standard financial and non-financial guarantees and the fact that the companies are geographically well diversified in terms of their assets, operations and profits.
Direct exposures to peripheral eurozone countries
Balances with respect to Italy at 31 December 2013 comprised Trading assets issued by central and local governments of £0.8bn (2012: £nil); Loans and receivables securities issued by banks of £0.1bn (2012: £0.1bn); Loans and advances to corporate customers of £0.1bn (2012: nil); derivative assets issued by banks of £0.1bn (2012: £0.1bn) net of derivative liabilities held by banks of £0.1bn (2012: £0.1bn).
Balances with respect to Spain at 31 December 2013 comprised Loans and receivables securities issued by banks of £0.1bn (2012: £0.2bn), derivative assets issued by banks of £0.1bn (2012: £nil) loans and advances to corporate customers of £nil (2012: £0.1bn) and commitments and undrawn facilities with corporate customers of £0.1bn (2012: £nil).
Balances with respect to Ireland at 31 December 2013 comprised Loans and advances to corporate customers of £0.1bn (2012: £0.1bn). In addition, there were loans and receivable securities issued by corporates of £nil (2012: £0.1bn) commitments and undrawn facilities with corporate customers of £nil (2012: 0.1bn).
Balances with respect to Portugal at 31 December 2013 comprised Loans and advances to corporate customers of £0.1bn (2012: £0.1bn).
Indirect exposures to peripheral eurozone countries
Indirect exposures to peripheral eurozone countries are considered to exist where our direct counterparties outside the peripheral eurozone countries themselves have a direct exposure to one or more peripheral eurozone countries. Indirect exposures are identified as part of our ongoing credit analysis and monitoring of our counterparty base by the review of available financial information to determine the countries where the material parts of a counterparty’s assets, operations or profits arise. Our indirect exposures to peripheral eurozone countries consist of a small number of corporate loans to large multinational companies based in the UK that derive a proportion of their profits from one or more peripheral eurozone countries; trading transactions and hedging transactions with financial institutions based in the UK and Europe that derive a proportion of their profits from or have a proportion of their assets in one or more peripheral eurozone countries; and a small number of loans to other corporate entities which have either a proportion of their operations within, or profits from, one or more peripheral eurozone countries. We have no significant indirect exposure to peripheral eurozone countries in our retail business.
| | |
| 154 | | Santander UK plc Annual Report 2013 |
Detailed Business Review
Risk Management Reportcontinued
Balances with other Banco Santander group companies
Santander UK enters into transactions with other Banco Santander group companies in the ordinary course of business. Such transactions are undertaken in areas of business where Santander UK has a particular advantage or expertise and where other Banco Santander group companies can offer commercial opportunities, substantially on the same terms as for comparable transactions with third party counterparties. These transactions also arise in support of the activities of, or with, larger multinational corporate clients and financial institutions which may have relationships with a number of entities in the Banco Santander group.
At 31 December 2013 and 2012, Santander UK had gross balances with other Banco Santander group companies as follows:
| | | | | | | | | | | | | | | | |
31 December 2013 | | Banks
£bn | | | Other financial
institutions
£bn | | | Corporate
£bn | | | Total
£bn | |
Assets: | | | | | | | | | | | | | | | | |
- Spain | | | 2.2 | | | | 0.1 | | | | — | | | | 2.3 | |
- UK | | | — | | | | 0.7 | | | | 0.2 | | | | 0.9 | |
- Other < £100m | | | 0.2 | | | | — | | | | — | | | | 0.2 | |
| | | | | | | | | | | | | | | | |
| | | 2.4 | | | | 0.8 | | | | 0.2 | | | | 3.4 | |
| | | | | | | | | | | | | | | | |
Liabilities: | | | | | | | | | | | | | | | | |
- Spain | | | (3.7 | ) | | | (0.8 | ) | | | — | | | | (4.5 | ) |
- UK | | | — | | | | (1.8 | ) | | | (0.1 | ) | | | (1.9 | ) |
- Italy | | | — | | | | (0.2 | ) | | | — | | | | (0.2 | ) |
- Germany | | | — | | | | (0.1 | ) | | | — | | | | (0.1 | ) |
- Other < £100m | | | (0.2 | ) | | | (0.5 | ) | | | (0.1 | ) | | | (0.8 | ) |
| | | | | | | | | | | | | | | | |
| | | (3.9 | ) | | | (3.4 | ) | | | (0.2 | ) | | | (7.5 | ) |
| | | | | | | | | | | | | | | | |
| | | | |
31 December 2012 | | Banks
£bn | | | Other financial
institutions
£bn | | | Corporate
£bn | | | Total
£bn | |
Assets: | | | | | | | | | | | | | | | | |
- Spain | | | 2.5 | | | | 0.1 | | | | — | | | | 2.6 | |
- UK | | | — | | | | 0.3 | | | | — | | | | 0.3 | |
- Other < £100m | | | 0.1 | | | | 0.1 | | | | — | | | | 0.2 | |
| | | | | | | | | | | | | | | | |
| | | 2.6 | | | | 0.5 | | | | — | | | | 3.1 | |
| | | | | | | | | | | | | | | | |
Liabilities: | | | | | | | | | | | | | | | | |
- Spain | | | (4.9 | ) | | | (1.0 | ) | | | (0.1 | ) | | | (6.0 | ) |
- UK | | | — | | | | (1.7 | ) | | | (0.1 | ) | | | (1.8 | ) |
- Ireland | | | — | | | | (0.2 | ) | | | — | | | | (0.2 | ) |
- Italy | | | — | | | | (0.6 | ) | | | — | | | | (0.6 | ) |
- Germany | | | — | | | | (0.8 | ) | | | — | | | | (0.8 | ) |
- Other < £100m | | | (0.3 | ) | | | (0.1 | ) | | | — | | | | (0.4 | ) |
| | | | | | | | | | | | | | | | |
| | | (5.2 | ) | | | (4.4 | ) | | | (0.2 | ) | | | (9.8 | ) |
| | | | | | | | | | | | | | | | |
The above activities are conducted in a manner that appropriately manages the credit risk arising against such other Banco Santander group companies within limits acceptable to the PRA.
2013 compared to 2012(unaudited)
The above balances with other Banco Santander group companies at 31 December 2013 principally consisted of:
| • | Reverse repos of £50m (2012: £233m), all of which were collateralised by OECD Government (but not peripheral eurozone) securities. The reverse repos were classified as “Loans and Advances to banks” in the balance sheet. This was offset by repo liabilities of £49m (2012: £140m), which were classified as “Deposits by banks”. See Notes 18 and 29 to the Consolidated Financial Statements. |
| • | Derivative assets of £2,222m (2012: £2,197m) subject to International Swaps and Derivatives Association (‘ISDA’) Master Agreements including the Credit Support Annex. These balances were partially offset by derivative liabilities of £2,142m (2012: £2,033m) and cash collateral received, as described below. These derivatives are included in Note 16 to the Consolidated Financial Statements. |
| • | Cash collateral of £112m (2012: £206m) given in relation to derivatives futures contracts. The cash collateral was classified as “Trading assets” in the balance sheet. This was more than offset by cash collateral received in relation to other derivatives of £829m (2012: £225m) classified as “Trading liabilities”. See Notes 15 and 31 to the Consolidated Financial Statements. |
| • | Floating rate notes of £23m (2012: £23m), which were classified as “Trading assets” and “Loans and receivables securities” in the balance sheet. See Notes 15 and 22 to the Consolidated Financial Statements. |
| • | Asset-backed securities of £56m (2012: £47m), which were classified as “Financial assets designated at fair value” in the balance sheet. See Note 17 to the Consolidated Financial Statements. |
| • | Deposits by customers of £1,014m (2012: £1,520m). See Note 30 to the Consolidated Financial Statements. |
| • | Debt securities in issue of £843m (2012: £3,290m). These balances represent holdings of debt securities by the wider Banco Santander group as a result of market purchases and for liability management purposes. The decrease in the year reflected contractual maturities. See Note 33 to the Consolidated Financial Statements. |
| • | Other liabilities of £247m (2012: £459m) principally dividends payable. See Note 35 to the Consolidated Financial Statements. |
| • | Subordinated liabilities of £2,229m (2012: £1,879m). These balances represent holdings of debt securities by the wider Banco Santander group as a result of market purchases and for liability management purposes. See Note 34 to the Consolidated Financial Statements. |
| | |
| Santander UK plc Annual Report 2013 | | 155 |
Detailed Business Review
Risk Management Reportcontinued
The next section further analyses the balances with other Banco Santander group companies at 31 December 2013 and 2012 by type of financial instrument and country of the counterparty, including the additional mitigating impact of repo collateral arrangements which are accounted for off-balance sheet.
Spain
| | | | | | | | | | | | | | | | |
31 December 2013 | | Banks
£bn | | | Other financial institutions
£bn | | | Corporate
£bn | | | Total
£bn | |
Repurchase agreements | | | | | | | | | | | | | | | | |
- Asset balance - reverse repo | | | 0.1 | | | | — | | | | — | | | | 0.1 | |
| | | | | | | | | | | | | | | | |
Net repurchase agreement position | | | 0.1 | | | | — | | | | — | | | | 0.1 | |
| | | | | | | | | | | | | | | | |
Derivatives | | | | | | | | | | | | | | | | |
- Derivative assets | | | 2.0 | | | | — | | | | — | | | | 2.0 | |
- Derivative liabilities | | | (1.9 | ) | | | — | | | | — | | | | (1.9 | ) |
Cash collateral in relation to derivatives:- placed | | | 0.1 | | | | — | | | | — | | | | 0.1 | |
- held | | | (0.8 | ) | | | — | | | | — | | | | (0.8 | ) |
| | | | | | | | | | | | | | | | |
Net derivatives position | | | (0.6 | ) | | | — | | | | — | | | | (0.6 | ) |
| | | | | | | | | | | | | | | | |
Asset-backed securities | | | — | | | | 0.1 | | | | — | | | | 0.1 | |
| | | | | | | | | | | | | | | | |
Total assets, after the impact of collateral | | | (0.5 | ) | | | 0.1 | | | | — | | | | (0.4 | ) |
| | | | | | | | | | | | | | | | |
Deposits by customers | | | — | | | | (0.6 | ) | | | — | | | | (0.6 | ) |
Debt securities in issue | | | (0.1 | ) | | | (0.1 | ) | | | — | | | | (0.2 | ) |
Other liabilities | | | (0.2 | ) | | | (0.1 | ) | | | — | | | | (0.3 | ) |
Subordinated liabilities | | | (0.7 | ) | | | — | | | | — | | | | (0.7 | ) |
| | | | | | | | | | | | | | | | |
Total liabilities | | | (1.0 | ) | | | (0.8 | ) | | | — | | | | (1.8 | ) |
| | | | | | | | | | | | | | | | |
Net balance | | | (1.5 | ) | | | (0.7 | ) | | | — | | | | (2.2 | ) |
| | | | | | | | | | | | | | | | |
| | | | |
31 December 2012 | | Banks
£bn | | | Other financial institutions
£bn | | | Corporate
£bn | | | Total
£bn | |
Repurchase agreements | | | | | | | | | | | | | | | | |
- Asset balance - reverse repo | | | 0.3 | | | | — | | | | — | | | | 0.3 | |
- Impact of collateral held (off balance sheet) | | | (0.2 | ) | | | — | | | | — | | | | (0.2 | ) |
| | | | | | | | | | | | | | | | |
- Net repo asset | | | 0.1 | | | | — | | | | — | | | | 0.1 | |
| | | | | | | | | | | | | | | | |
- Liability balance - repo | | | (0.1 | ) | | | — | | | | — | | | | (0.1 | ) |
- Impact of collateral placed (off balance sheet) | | | 0.1 | | | | — | | | | — | | | | 0.1 | |
| | | | | | | | | | | | | | | | |
- Net repo liability | | | — | | | | — | | | | — | | | | — | |
| | | | | | | | | | | | | | | | |
Net repurchase agreement position | | | 0.1 | | | | — | | | | — | | | | 0.1 | |
| | | | | | | | | | | | | | | | |
Derivatives | | | | | | | | | | | | | | | | |
- Derivative assets | | | 2.0 | | | | — | | | | — | | | | 2.0 | |
- Derivative liabilities | | | (1.9 | ) | | | — | | | | — | | | | (1.9 | ) |
Cash collateral in relation to derivatives: - placed | | | 0.2 | | | | — | | | | — | | | | 0.2 | |
- held | | | (0.2 | ) | | | — | | | | — | | | | (0.2 | ) |
| | | | | | | | | | | | | | | | |
Net derivatives position | | | 0.1 | | | | — | | | | — | | | | 0.1 | |
| | | | | | | | | | | | | | | | |
Asset-backed securities | | | — | | | | 0.1 | | | | — | | | | 0.1 | |
| | | | | | | | | | | | | | | | |
Total assets, after the impact of collateral | | | 0.2 | | | | 0.1 | | | | — | | | | 0.3 | |
| | | | | | | | | | | | | | | | |
Deposits by customers | | | — | | | | (0.8 | ) | | | (0.1 | ) | | | (0.9 | ) |
Debt securities in issue | | | (2.1 | ) | | | (0.1 | ) | | | — | | | | (2.2 | ) |
Other liabilities | | | (0.3 | ) | | | (0.1 | ) | | | — | | | | (0.4 | ) |
Subordinated liabilities | | | (0.3 | ) | | | — | | | | — | | | | (0.3 | ) |
| | | | | | | | | | | | | | | | |
Total liabilities | | | (2.7 | ) | | | (1.0 | ) | | | (0.1 | ) | | | (3.8 | ) |
| | | | | | | | | | | | | | | | |
Net balance | | | (2.5 | ) | | | (0.9 | ) | | | (0.1 | ) | | | (3.5 | ) |
| | | | | | | | | | | | | | | | |
Other countries
Balances with Belgium at 31 December 2013 comprised debt securities in issue of £0.5bn (2012: £nil). Balances with Ireland at 31 December 2013 comprised deposits by customers of £nil (2012: £0.2bn). Balances with the UK at 31 December 2013 comprised other assets of £0.9bn (2012: £0.3bn), deposits by customers of £0.3bn (2012: £0.2bn) and subordinated liabilities of £1.6bn (2012: £1.6bn). Balances with Italy at 31 December 2013 comprised debt securities in issue (purchased in the secondary market) of £0.2bn (2012: £0.6bn). Balances with Germany at 31 December 2013 comprised deposits by customers of £0.1bn (2012: £0.3bn) and debt securities in issue of £nil (2012: £0.5bn).
Redenomination risk(unaudited)
Santander UK considers the total dissolution of the eurozone to be extremely unlikely and therefore believes widespread redenomination of its euro-denominated assets and liabilities to be highly improbable. However, for contingency planning purposes Santander UK has analysed the redenomination risk that might arise from an exit of a member state from the euro or a total dissolution of the euro and how that exit or dissolution would be implemented. It is not possible to predict what the total financial impact on Santander UK might be of a eurozone member state exit or the dissolution of the euro. The determination of which assets and liabilities would be legally redenominated is complex and depends on a numbers of factors, including the precise exit scenario, as the consequences on external contracts of a disorderly exit or one sanctioned under EU law may be different. Santander UK has already identified and is monitoring these risks and has taken steps to mitigate them and/or reduce Santander UK’s overall exposure to losses that might arise in the event of a redenomination by reducing its balances and funding mismatches. As part of its objective of maintaining a diversified funding base, Santander UK raises funding in a number of currencies, including euro, and converts these back into sterling to fund its commercial assets which are largely sterling denominated. Santander UK’s net asset position denominated in euro, reflecting assets and liabilities and associated swaps (which primarily comprise cross-currency derivatives entered into to swap funding raised in euro back into sterling for reasons set out above) arising in connection with contracts denominated in euro, amounted to £0.1bn at 31 December 2013 (2012: net assets of £0.1bn). This comprised debt securities (covered bonds and securitisations) of £21.9bn (2012: £26.1bn) issued by Santander UK as part of its medium term funding activities, net loans and advances of £0.1bn (2012: £nil) to other Banco Santander group companies, medium-term repo liabilities of £4.0bn (2012: £3.0bn), other deposit liabilities of £1.8bn (2012: £0.9bn), other loans and securities of £3.0bn (2012: £2.8bn), net trading repo assets of £0.5bn (2012: assets of £2.2bn) and related cross-currency swap assets of £24.3bn (2012: £25.1bn) which swap the resultant euro exposures back into sterling in order to ensure that assets and liabilities are currency matched in sterling. Disclosures of Santander UK’s exposure to individual eurozone countries and total exposures to counterparties in those countries, including any euro-denominated contracts, are set out on pages 151 to 156.
| | |
| 156 | | Santander UK plc Annual Report 2013 |
Detailed Business Review
Risk Management Reportcontinued
2. LOANS AND ADVANCES
The following tables categorise Santander UK’s loans and advances at 31 December 2013 and 2012 into three categories as:
| • | neither past due nor impaired; |
| • | past due but not impaired; or |
| | | | | | | | | | | | | | | | | | | | | | | | |
| | | Group | |
2013 | | Neither past
due nor
impaired | | | Past due but
not impaired | | | Impaired | | | Total | | | Impairment
loss
allowances | | | Total
carrying
value | |
Balance sheet line items | | £m | | | £m | | | £m | | | £m | | | £m | | | £m | |
Trading assets | | | | | | | | | | | | | | | | | | | | | | | | |
- Loans and advances to banks | | | 9,326 | | | | — | | | | — | | | | 9,326 | | | | — | | | | 9,326 | |
- Loans and advances to customers | | | 4,404 | | | | — | | | | — | | | | 4,404 | | | | — | | | | 4,404 | |
Financial assets designated at fair value through profit and loss | | | | | | | | | | | | | | | | | | | | | | | | |
- Loans and advances to customers | | | 2,219 | | | | — | | | | — | | | | 2,219 | | | | — | | | | 2,219 | |
Loans and advances to banks | | | | | | | | | | | | | | | | | | | | | | | | |
- Placements with other banks | | | 2,286 | | | | — | | | | — | | | | 2,286 | | | | — | | | | 2,286 | |
- Amounts due from parent | | | 61 | | | | — | | | | — | | | | 61 | | | | — | | | | 61 | |
Loans and advances to customers | | | | | | | | | | | | | | | | | | | | | | | | |
- Advances secured on residential property | | | 143,737 | | | | 4,557 | | | | 728 | | | | 149,022 | | | | (593 | ) | | | 148,429 | |
- Corporate loans | | | 22,362 | | | | — | | | | 2,508 | | | | 24,870 | | | | (404 | ) | | | 24,466 | |
- Finance leases | | | 3,132 | | | | — | | | | 26 | | | | 3,158 | | | | (44 | ) | | | 3,114 | |
- Other secured advances | | | 2,304 | | | | — | | | | 406 | | | | 2,710 | | | | (229 | ) | | | 2,481 | |
- Other unsecured advances | | | 5,295 | | | | 114 | | | | 160 | | | | 5,569 | | | | (285 | ) | | | 5,284 | |
- Amounts due from fellow subsidiaries, associate & joint ventures | | | 813 | | | | — | | | | — | | | | 813 | | | | — | | | | 813 | |
Loans and receivables securities | | | 1,082 | | | | — | | | | 25 | | | | 1,107 | | | | (6 | ) | | | 1,101 | |
| | | | | | | | | | | | | | | | | | | | | | | | |
Total loans and advances | | | 197,021 | | | | 4,671 | | | | 3,853 | | | | 205,545 | | | | (1,561 | ) | | | 203,984 | |
| | | | | | | | | | | | | | | | | | | | | | | | |
| |
| | | Group | |
| | | | |
2012 | | Neither past
due nor
impaired | | | Past due but
not impaired | | | Impaired | | | Total | | | Impairment
loss
allowances | | | Total
carrying
value | |
Balance sheet line items | | £m | | | £m | | | £m | | | £m | | | £m | | | £m | |
Trading assets | | | | | | | | | | | | | | | | | | | | | | | | |
- Loans and advances to banks | | | 9,988 | | | | — | | | | — | | | | 9,988 | | | | — | | | | 9,988 | |
- Loans and advances to customers | | | 7,552 | | | | — | | | | — | | | | 7,552 | | | | — | | | | 7,552 | |
Financial assets designated at fair value through profit and loss | | | | | | | | | | | | | | | | | | | | | | | | |
- Loans and advances to customers | | | 3,248 | | | | — | | | | — | | | | 3,248 | | | | — | | | | 3,248 | |
Loans and advances to banks | | | | | | | | | | | | | | | | | | | | | | | | |
- Placements with other banks | | | 2,201 | | | | — | | | | — | | | | 2,201 | | | | — | | | | 2,201 | |
- Amounts due from parent | | | 237 | | | | — | | | | — | | | | 237 | | | | — | | | | 237 | |
Loans and advances to customers | | | | | | | | | | | | | | | | | | | | | | | | |
- Advances secured on residential property | | | 151,784 | | | | 4,384 | | | | 1,142 | | | | 157,310 | | | | (552 | ) | | | 156,758 | |
- Corporate loans | | | 19,801 | | | | — | | | | 3,510 | | | | 23,311 | | | | (727 | ) | | | 22,584 | |
- Finance leases | | | 3,053 | | | | — | | | | 9 | | | | 3,062 | | | | (40 | ) | | | 3,022 | |
- Other secured advances | | | 2,527 | | | | — | | | | 482 | | | | 3,009 | | | | (169 | ) | | | 2,840 | |
- Other unsecured advances | | | 5,222 | | | | 127 | | | | 196 | | | | 5,545 | | | | (314 | ) | | | 5,231 | |
- Amounts due from fellow subsidiaries, associate & joint ventures | | | 347 | | | | — | | | | — | | | | 347 | | | | — | | | | 347 | |
Loans and receivables securities | | | 1,240 | | | | — | | | | 25 | | | | 1,265 | | | | (6 | ) | | | 1,259 | |
| | | | | | | | | | | | | | | | | | | | | | | | |
Total loans and advances | | | 207,200 | | | | 4,511 | | | | 5,364 | | | | 217,075 | | | | (1,808 | ) | | | 215,267 | |
| | | | | | | | | | | | | | | | | | | | | | | | |
| | |
| Santander UK plc Annual Report 2013 | | 157 |
Detailed Business Review
Risk Management Reportcontinued
| | | | | | | | | | | | | | | | | | | | | | | | |
| | | Company | |
| | | | |
2013 | | Neither past
due nor
impaired | | | Past due but
not impaired | | | Impaired | | | Total | | | Impairment
loss
allowances | | | Total
carrying
value | |
Balance sheet line items | | £m | | | £m | | | £m | | | £m | | | £m | | | £m | |
Financial assets designated at fair value through profit and loss | | | | | | | | | | | | | | | | | | | | | | | | |
- Loans and advances to customers | | | 1 | | | | — | | | | — | | | | 1 | | | | — | | | | 1 | |
Loans and advances to banks | | | | | | | | | | | | | | | | | | | | | | | | |
- Placements with other banks | | | 510 | | | | — | | | | — | | | | 510 | | | | — | | | | 510 | |
- Amounts due from subsidiaries | | | 108,757 | | | | — | | | | — | | | | 108,757 | | | | — | | | | 108,757 | |
Loans and advances to customers | | | | | | | | | | | | | | | | | | | | | | | | |
- Advances secured on residential property | | | 143,727 | | | | 4,557 | | | | 728 | | | | 149,012 | | | | (593 | ) | | | 148,419 | |
- Corporate loans | | | 8,996 | | | | — | | | | 1,457 | | | | 10,453 | | | | (173 | ) | | | 10,280 | |
- Other secured advances | | | 1,961 | | | | — | | | | 406 | | | | 2,367 | | | | (229 | ) | | | 2,138 | |
- Other unsecured advances | | | 2,954 | | | | 63 | | | | 90 | | | | 3,107 | | | | (162 | ) | | | 2,945 | |
- Amounts due from fellow subsidiaries, associate & joint ventures | | | 11 | | | | — | | | | — | | | | 11 | | | | — | | | | 11 | |
- Amounts due from subsidiaries | | | 832 | | | | — | | | | — | | | | 832 | | | | (232 | ) | | | 600 | |
Loans and receivables securities | | | 5,455 | | | | — | | | | 25 | | | | 5,480 | | | | (6 | ) | | | 5,474 | |
| | | | | | | | | | | | | | | | | | | | | | | | |
Total loans and advances | | | 273,204 | | | | 4,620 | | | | 2,706 | | | | 280,530 | | | | (1,395 | ) | | | 279,135 | |
| | | | | | | | | | | | | | | | | | | | | | | | |
| |
| | | Company | |
| | | | |
2012 | | Neither past
due nor
impaired | | | Past due but
not impaired | | | Impaired | | | Total | | | Impairment
loss
allowances | | | Total
carrying
value | |
Balance sheet line items | | £m | | | £m | | | £m | | | £m | | | £m | | | £m | |
Financial assets designated at fair value through profit and loss | | | | | | | | | | | | | | | | | | | | | | | | |
- Loans and advances to customers | | | 44 | | | | — | | | | — | | | | 44 | | | | — | | | | 44 | |
Loans and advances to banks | | | | | | | | | | | | | | | | | | | | | | | | |
- Placements with other banks | | | 707 | | | | — | | | | — | | | | 707 | | | | — | | | | 707 | |
- Amounts due from subsidiaries | | | 97,139 | | | | — | | | | — | | | | 97,139 | | | | — | | | | 97,139 | |
Loans and advances to customers | | | | | | | | | | | | | | | | | | | | | | | | |
- Advances secured on residential property | | | 151,779 | | | | 4,384 | | | | 1,142 | | | | 157,305 | | | | (551 | ) | | | 156,754 | |
- Corporate loans | | | 7,644 | | | | — | | | | 1,663 | | | | 9,307 | | | | (178 | ) | | | 9,129 | |
- Other secured advances | | | 2,098 | | | | — | | | | 482 | | | | 2,580 | | | | (169 | ) | | | 2,411 | |
- Other unsecured advances | | | 3,150 | | | | 77 | | | | 118 | | | | 3,345 | | | | (185 | ) | | | 3,160 | |
- Amounts due from fellow subsidiaries, associate & joint ventures | | | 13 | | | | — | | | | — | | | | 13 | | | | — | | | | 13 | |
- Amounts due from subsidiaries | | | 462 | | | | — | | | | — | | | | 462 | | | | (232 | ) | | | 230 | |
Loans and receivables securities | | | 5,922 | | | | — | | | | 25 | | | | 5,947 | | | | (6 | ) | | | 5,941 | |
| | | | | | | | | | | | | | | | | | | | | | | | |
Total loans and advances | | | 268,958 | | | | 4,461 | | | | 3,430 | | | | 276,849 | | | | (1,321 | ) | | | 275,528 | |
| | | | | | | | | | | | | | | | | | | | | | | | |
Further discussion and analysis of the preceding tables, including cross references to more granular disclosures on a segmental basis elsewhere in the financial statements, including this Risk Management Report, are set out on the following pages.
| | |
| 158 | | Santander UK plc Annual Report 2013 |
Detailed Business Review
Risk Management Reportcontinued
Credit quality of loans and advances that are neither past due nor impaired
The credit quality of loans and advances that are neither past due nor impaired as set out in the tables on pages 157 to 158 are as described in the tables below.
| | | | | | | | | | | | | | | | |
| | | Group | |
2013 | | Good
£m | | | Satisfactory
£m | | | Higher Risk
£m | | | Total
£m | |
Trading assets | | | | | | | | | | | | | | | | |
- Loans and advances to banks | | | 9,159 | | | | 151 | | | | 16 | | | | 9,326 | |
- Loans and advances to customers | | | 4,404 | | | | — | | | | — | | | | 4,404 | |
Financial assets designated at fair value through profit and loss | | | | | | | | | | | | | | | | |
- Loans and advances to customers | | | 2,219 | | | | — | | | | — | | | | 2,219 | |
Loans and advances to banks | | | | | | | | | | | | | | | | |
- Placements with other banks | | | 2,286 | | | | — | | | | — | | | | 2,286 | |
- Amounts due from parent | | | 61 | | | | — | | | | — | | | | 61 | |
Loans and advances to customers | | | | | | | | | | | | | | | | |
- Advances secured on residential property | | | 129,666 | | | | 13,736 | | | | 335 | | | | 143,737 | |
- Corporate loans | | | 16,405 | | | | 5,637 | | | | 320 | | | | 22,362 | |
- Finance leases | | | 2,810 | | | | 263 | | | | 59 | | | | 3,132 | |
- Other secured advances | | | 638 | | | | 1,594 | | | | 72 | | | | 2,304 | |
- Other unsecured advances | | | 908 | | | | 4,302 | | | | 85 | | | | 5,295 | |
- Amounts due from fellow subsidiaries, associate & joint ventures | | | 813 | | | | — | | | | — | | | | 813 | |
Loans and receivables securities | | | 838 | | | | 19 | | | | 225 | | | | 1,082 | |
| | | | | | | | | | | | | | | | |
Total loans and advances | | | 170,207 | | | | 24,556 | | | | 2,258 | | | | 197,021 | |
| | | | | | | | | | | | | | | | |
| |
| | | Group | |
2012 | | Good
£m | | | Satisfactory
£m | | | Higher Risk
£m | | | Total
£m | |
Trading assets | | | | | | | | | | | | | | | | |
- Loans and advances to banks | | | 9,781 | | | | 190 | | | | 17 | | | | 9,988 | |
- Loans and advances to customers | | | 7,552 | | | | — | | | | — | | | | 7,552 | |
Financial assets designated at fair value through profit and loss | | | | | | | | | | | | | | | | |
- Loans and advances to customers | | | 3,248 | | | | — | | | | — | | | | 3,248 | |
Loans and advances to banks | | | | | | | | | | | | | | | | |
- Placements with other banks | | | 2,201 | | | | — | | | | — | | | | 2,201 | |
- Amounts due from parent | | | 237 | | | | — | | | | — | | | | 237 | |
Loans and advances to customers | | | | | | | | | | | | | | | | |
- Advances secured on residential property | | | 130,768 | | | | 20,515 | | | | 501 | | | | 151,784 | |
- Corporate loans | | | 15,972 | | | | 3,374 | | | | 455 | | | | 19,801 | |
- Finance leases | | | 2,787 | | | | 184 | | | | 82 | | | | 3,053 | |
- Other secured advances | | | 540 | | | | 1,897 | | | | 90 | | | | 2,527 | |
- Other unsecured advances | | | 666 | | | | 4,449 | | | | 107 | | | | 5,222 | |
- Amounts due from fellow subsidiaries, associate & joint ventures | | | 347 | | | | — | | | | — | | | | 347 | |
Loans and receivables securities | | | 995 | | | | 70 | | | | 175 | | | | 1,240 | |
| | | | | | | | | | | | | | | | |
Total loans and advances | | | 175,094 | | | | 30,679 | | | | 1,427 | | | | 207,200 | |
| | | | | | | | | | | | | | | | |
During 2013, there was an increase in corporate loan assets in the “satisfactory” category. This was due to a combination of factors including the increase due to new lending to SMEs in accordance with our strategy and risk appetite, the adoption of an enhanced mapping from our internal ratings to the external equivalent used to determine “good” or “satisfactory” with the balance related to rating migrations undertaken in the normal course of business.
| | |
| Santander UK plc Annual Report 2013 | | 159 |
Detailed Business Review
Risk Management Reportcontinued
| | | | | | | | | | | | | | | | |
| | | Company | |
| | | | |
2013 | | Good
£m | | | Satisfactory
£m | | | Higher Risk
£m | | | Total
£m | |
Financial assets designated at fair value through profit and loss | | | | | | | | | | | | | | | | |
- Loans and advances to customers | | | 1 | | | | — | | | | — | | | | 1 | |
Loans and advances to banks | | | | | | | | | | | | | | | | |
- Placements with other banks | | | 510 | | | | — | | | | — | | | | 510 | |
- Amounts due from subsidiaries | | | 108,757 | | | | — | | | | — | | | | 108,757 | |
Loans and advances to customers | | | | | | | | | | | | | | | | |
- Advances secured on residential property | | | 129,657 | | | | 13,735 | | | | 335 | | | | 143,727 | |
- Corporate loans | | | 4,731 | | | | 3,943 | | | | 322 | | | | 8,996 | |
- Other secured advances | | | 295 | | | | 448 | | | | 1,218 | | | | 1,961 | |
- Other unsecured advances | | | 507 | | | | 2,400 | | | | 47 | | | | 2,954 | |
- Amounts due from fellow subsidiaries | | | 11 | | | | — | | | | — | | | | 11 | |
- Amounts due from fellow subsidiaries, associate & joint ventures | | | 832 | | | | — | | | | — | | | | 832 | |
Loans and receivables securities | | | 5,211 | | | | 19 | | | | 225 | | | | 5,455 | |
| | | | | | | | | | | | | | | | |
Total loans and advances | | | 250,512 | | | | 20,545 | | | | 2,147 | | | | 273,204 | |
| | | | | | | | | | | | | | | | |
| |
| | | Company | |
| | | | |
2012 | | Good
£m | | | Satisfactory
£m | | | Higher Risk
£m | | | Total
£m | |
Financial assets designated at fair value through profit and loss | | | | | | | | | | | | | | | | |
- Loans and advances to customers | | | 44 | | | | — | | | | — | | | | 44 | |
Loans and advances to banks | | | | | | | | | | | | | | | | |
- Placements with other banks | | | 707 | | | | — | | | | — | | | | 707 | |
- Amounts due from subsidiaries | | | 97,139 | | | | — | | | | — | | | | 97,139 | |
Loans and advances to customers | | | | | | | | | | | | | | | | |
- Advances secured on residential property | | | 130,764 | | | | 20,514 | | | | 501 | | | | 151,779 | |
- Corporate loans | | | 4,805 | | | | 2,599 | | | | 240 | | | | 7,644 | |
- Other secured advances | | | 111 | | | | 1,897 | | | | 90 | | | | 2,098 | |
- Other unsecured advances | | | 402 | | | | 2,684 | | | | 64 | | | | 3,150 | |
- Amounts due from fellow subsidiaries | | | 13 | | | | — | | | | — | | | | 13 | |
- Amounts due from fellow subsidiaries, associate & joint ventures | | | 462 | | | | — | | | | — | | | | 462 | |
Loans and receivables securities | | | 5,677 | | | | 70 | | | | 175 | | | | 5,922 | |
| | | | | | | | | | | | | | | | |
Total loans and advances | | | 240,124 | | | | 27,764 | | | | 1,070 | | | | 268,958 | |
| | | | | | | | | | | | | | | | |
Internal measures of credit quality have been used in the table analysing credit quality, above. Different measures are applied to retail and corporate lending, as follows:
| | | | | | |
| | | Retail Lending | | Corporate Lending |
| | | | |
| | | EL | | PD | | PD |
Description | | Unsecured(1) | | Secured(2) | | |
Good | | 0.0 - 0.5% | | 0.0 - 0.5%(3) | | 0.0 - 0.5% |
Satisfactory | | 0.5 - 12.5% | | 0.5 - 12.5% | | 0.5 - 6.5% |
Higher Risk | | 12.5%+ | | 12.5%+ | | 6.5%+ |
| (1) | Unsecured consists of other unsecured advances to individuals. |
| (2) | Secured consists of advances to individuals secured on residential property. |
| (3) | Or a loan-to-value (‘LTV’) ratio of less than 75%. |
Loans and advance are classified as Good, Satisfactory or Higher Risk on the basis of their PD, EL or (for residential mortgages) their LTVs. For loans and advances classified on the basis of their PD, these can be equated to the Santander UK internal rating scale on page 88 as described below:
| | |
Good |
| |
• | | These loans and advances are generally in grade 6 and above. |
| |
• | | There is a very high likelihood that the asset will not default, or will be recovered in full. |
| |
• | | Such exposure also exhibits a strong capacity to meet financial commitments and only exceptionally shows any period of delinquency. |
| | |
Satisfactory |
| |
• | | These loans and advances are generally in grades 4, 5 and with grade 6 having an upper bound of 6.581%. |
| |
• | | There is a high likelihood that the asset will be recovered and is therefore of no cause for concern to Santander UK. |
| |
• | | The asset has low to moderate probability of default, strong recovery rates and may typically show only short periods of delinquency. |
| |
• | | Moderate to high credit ratings, application scores, credit bureau scores or behavioural scores characterise this credit quality. |
| | |
Higher Risk |
| |
• | | All rated accounts that are not viewed as Good or Satisfactory are rated as Higher Risk. |
| |
• | | The large majority of these loans and advances are contained in grades 1 to 3, with grade 3 having a lower bound of 6.581%. |
| |
• | | The assets are characterised by some concern over the obligor’s ability to make payments when due. |
| |
• | | There may also be doubts over the value of collateral or security provided. |
| |
• | | However, the borrower or counterparty is continuing to make payments when due i.e. the assets have not yet converted to actual delinquency and are expected to settle all outstanding amounts of principal and interest. |
| | |
| 160 | | Santander UK plc Annual Report 2013 |
Detailed Business Review
Risk Management Reportcontinued
Maturity analysis of loans and advances that are past due but not impaired
A maturity analysis of loans and advances that are past due but not impaired as set out in the tables on pages 157 to 158 is set out below.
| | | | | | | | | | | | | | | | | | | | | | | | |
| | | Group | |
2013 | | Past due up
to 1 month
£m | | | Past due 1-2
months
£m | | | Past due 2-3
months
£m | | | Past due 3-6
months
£m | | | Past due 6
months and over
£m | | | Total
£m | |
Loans and advances to customers | | | | | | | | | | | | | | | | | | | | | | | | |
- Advances secured on residential property | | | — | | | | 1,387 | | | | 945 | | | | 1,236 | | | | 989 | | | | 4,557 | |
- Other unsecured advances | | | 50 | | | | 35 | | | | 9 | | | | 11 | | | | 9 | | | | 114 | |
| | | | | | | | | | | | | | | | | | | | | | | | |
Total loans and advances | | | 50 | | | | 1,422 | | | | 954 | | | | 1,247 | | | | 998 | | | | 4,671 | |
| | | | | | | | | | | | | | | | | | | | | | | | |
| |
| | | Group | |
2012 | | Past due up
to 1 month
£m | | | Past due 1-2
months
£m | | | Past due 2-3
months
£m | | | Past due 3-6
months
£m | | | Past due 6
months and over
£m | | | Total
£m | |
Loans and advances to customers | | | | | | | | | | | | | | | | | | | | | | | | |
- Advances secured on residential property | | | — | | | | 1,545 | | | | 908 | | | | 1,141 | | | | 790 | | | | 4,384 | |
- Other unsecured advances | | | 33 | | | | 66 | | | | 10 | | | | 11 | | | | 7 | | | | 127 | |
| | | | | | | | | | | | | | | | | | | | | | | | |
Total loans and advances | | | 33 | | | | 1,611 | | | | 918 | | | | 1,152 | | | | 797 | | | | 4,511 | |
| | | | | | | | | | | | | | | | | | | | | | | | |
| |
| | | Company | |
2013 | | Past due up
to 1 month
£m | | | Past due 1-2
months
£m | | | Past due 2-3
months
£m | | | Past due 3-6
months
£m | | | Past due 6
months and over
£m | | | Total
£m | |
Loans and advances to customers | | | | | | | | | | | | | | | | | | | | | | | | |
- Advances secured on residential property | | | — | | | | 1,387 | | | | 945 | | | | 1,236 | | | | 989 | | | | 4,557 | |
- Other unsecured advances | | | 38 | | | | 8 | | | | 5 | | | | 7 | | | | 5 | | | | 63 | |
| | | | | | | | | | | | | | | | | | | | | | | | |
Total loans and advances | | | 38 | | | | 1,395 | | | | 950 | | | | 1,243 | | | | 994 | | | | 4,620 | |
| | | | | | | | | | | | | | | | | | | | | | | | |
| |
| | | Company | |
2012 | | Past due up
to 1 month
£m | | | Past due 1-2
months
£m | | | Past due 2-3
months
£m | | | Past due 3-6
months
£m | | | Past due 6
months and over
£m | | | Total
£m | |
Loans and advances to customers | | | | | | | | | | | | | | | | | | | | | | | | |
- Advances secured on residential property | | | — | | | | 1,545 | | | | 908 | | | | 1,141 | | | | 790 | | | | 4,384 | |
- Other unsecured advances | | | 41 | | | | 17 | | | | 7 | | | | 7 | | | | 5 | | | | 77 | |
| | | | | | | | | | | | | | | | | | | | | | | | |
Total loans and advances | | | 41 | | | | 1,562 | | | | 915 | | | | 1,148 | | | | 795 | | | | 4,461 | |
| | | | | | | | | | | | | | | | | | | | | | | | |
Impaired loans(unaudited)
Santander UK’s impairment loss allowances policy is set out in Note 1 of the Consolidated Financial Statements.
Advances secured on residential property, Finance leases and Other unsecured advances
Advances secured on residential property, Finance leases, and Other unsecured advances are managed in Retail Banking.
During the year ended 31 December 2013, the total impaired loans decreased to £914m (2012: £1,347m) primarily as a result of the improving economy as described on page 99.
Corporate loans and Other secured advances
Corporate loans and Other secured advances are managed in Commercial Banking and Corporate Centre. These balances consist of loans classified as NPLs and loans that have experienced a loss event and have been transferred to risk monitoring under the Watchlist process. As a result, the balance of impaired Corporate loans and Other secured advances of £2,914m (2012: £3,992m) represents a sub-set of the NPL and Watchlist data presented in the Commercial Banking and Corporate Centre tables on pages 108 and 119, respectively, totalling £3,070m (2012: £4,334m) which also include undrawn commitments and off balance sheet exposures.
During the year ended 31 December 2013, the total ‘individually impaired’ loans decreased principally reflecting the decrease in balances in the legacy portfolio in run-off, especially shipping, aviation and infrastructure, which continued to reduce in line with the strategy to exit these exposures where the opportunity arises as well as a reduction in the level of Watchlist exposure as cases return to fully performing status.
Further information on Commercial Banking NPLs is set out in the section “Commercial Banking – Non-performing loans and advances” on page 108. Further information on Commercial Banking cases subject to risk monitoring under the Watchlist process by portfolio is set out in the section “Commercial Banking – Credit Performance” on page 108.
Further information on Corporate Centre NPLs is set out in the section “Corporate Centre – Non-performing loans and advances” on page 120. Further information on Corporate Centre cases subject to risk monitoring under the Watchlist system by portfolio is set out in the section “Corporate Centre – Credit Performance” on page 119.
| | |
| Santander UK plc Annual Report 2013 | | 161 |
Detailed Business Review
Risk Management Reportcontinued
Forbearance loans and advances to customers
The following tables provide a summary of the population of loans and advances to customers which have been subject to forbearance programmes and are included in the previous tables. For further detail regarding these programmes, see pages 79, 83 and 86.
| | | | | | | | | | | | | | | | | | | | | | | | |
2013 | | Neither past
due nor
impaired
£m | | | Past due but
not impaired
£m | | | Impaired
£m | | | Total
£m | | | Impairment loss
allowances
£m | | | Total
carrying
value
£m | |
Loans and advances to customers | | | | | | | | | | | | | | | | | | | | | | | | |
- Advances secured on residential property | | | 2,912 | | | | 977 | | | | 198 | | | | 4,087 | | | | (130 | ) | | | 3,957 | |
- Corporate loans | | | 326 | | | | — | | | | 701 | | | | 1,027 | | | | (142 | ) | | | 885 | |
- Finance leases | | | 5 | | | | — | | | | — | | | | 5 | | | | — | | | | 5 | |
- Other secured advances | | | 125 | | | | — | | | | 146 | | | | 271 | | | | (42 | ) | | | 229 | |
- Other unsecured advances | | | 16 | | | | 10 | | | | 21 | | | | 47 | | | | (33 | ) | | | 14 | |
| | | | | | | | | | | | | | | | | | | | | | | | |
Total forbearance loans and advances to customers | | | 3,384 | | | | 987 | | | | 1,066 | | | | 5,437 | | | | (347 | ) | | | 5,090 | |
| | | | | | | | | | | | | | | | | | | | | | | | |
| | | | | | |
2012 | | Neither past
due nor
impaired
£m | | | Past due but
not impaired
£m | | | Impaired
£m | | | Total
£m | | | Impairment loss
allowances
£m | | | Total
carrying
Value
£m | |
Loans and advances to customers | | | | | | | | | | | | | | | | | | | | | | | | |
- Advances secured on residential property | | | 2,974 | | | | 1,108 | | | | 167 | | | | 4,249 | | | | (119 | ) | | | 4,130 | |
- Corporate loans | | | 548 | | | | — | | | | 807 | | | | 1,355 | | | | (188 | ) | | | 1,167 | |
- Finance leases | | | 11 | | | | — | | | | — | | | | 11 | | | | — | | | | 11 | |
- Other secured advances | | | 218 | | | | 66 | | | | 64 | | | | 348 | | | | (32 | ) | | | 316 | |
- Other unsecured advances | | | 25 | | | | 21 | | | | 41 | | | | 87 | | | | (32 | ) | | | 55 | |
| | | | | | | | | | | | | | | | | | | | | | | | |
Total forbearance loans and advances to customers | | | 3,776 | | | | 1,195 | | | | 1,079 | | | | 6,050 | | | | (371 | ) | | | 5,679 | |
| | | | | | | | | | | | | | | | | | | | | | | | |
| | |
| 162 | | Santander UK plc Annual Report 2013 |
Detailed Business Review
Risk Management Reportcontinued
NON-PERFORMING LOANS AND ADVANCES(1)(2)
An analysis of Santander UK’s NPLs is presented below.
| | | | | | | | | | | | | | | | | | | | |
| | | 2013
£m | | | 2012(8)
£m | | | 2011
£m | | | 2010
£m | | | 2009
£m | |
Loans and advances to customers of which:(2) | | | 187,048 | | | | 194,733 | | | | 206,311 | | | | 202,090 | | | | 190,067 | |
Customers in Arrears(3) | | | 3,484 | | | | 4,149 | | | | 3,913 | | | | 3,648 | | | | 3,551 | |
NPLs - impaired(3)(4) | | | 1,467 | | | | 2,186 | | | | 1,725 | | | | 1,843 | | | | 1,613 | |
NPLs - not impaired(3) | | | 2,355 | | | | 2,024 | | | | 2,254 | | | | 1,874 | | | | 2,000 | |
| | | | | | | | | | | | | | | | | | | | |
Total NPLs | | | 3,822 | | | | 4,210 | | | | 3,979 | | | | 3,717 | | | | 3,613 | |
| | | | | | | | | | | | | | | | | | | | |
Total impairment loan loss allowances | | | 1,555 | | | | 1,803 | | | | 1,563 | | | | 1,655 | | | | 1,299 | |
| | | | | | | | | | | | | | | | | | | | |
| | | | | |
| | | % | | | % | | | % | | | % | | | % | |
Arrears ratio(5) | | | 1.86 | | | | 2.13 | | | | 1.90 | | | | 1.81 | | | | 1.87 | |
NPLs ratio(6) | | | 2.04 | | | | 2.16 | | | | 1.93 | | | | 1.84 | | | | 1.90 | |
Coverage ratio(7) | | | 41 | | | | 43 | | | | 39 | | | | 45 | | | | 36 | |
| (1) | Loans and advances are classified as non-performing as described in the footnotes to the tables on pages 98, 108 and 120 for Mortgage loans, Commercial Banking loans and Corporate Centre loans, respectively. |
| (2) | Loans and advances to customers include social housing loans and finance leases, and exclude trading assets. |
| (3) | All balances are UK and continue accruing interest. For the data presented, the balances include interest charged to the customer’s account, but exclude interest accrued but not yet charged to the account. |
| (4) | NPLs against which an impairment loss allowance has been established. |
| (5) | Loans and advances to customers in arrears as a percentage of loans and advances to customers. |
| (6) | NPLs as a percentage of loans and advances to customers. |
| (7) | Impairment loan loss allowances as a percentage of NPLs. |
| (8) | Adjusted to reflect the presentation of the assets held for sale prior to the completion of the sale as set out in Note 12 to the Consolidated Financial Statements. |
2013 compared to 2012(unaudited)
During 2013, the NPL stock as well as the NPLs ratio decreased to £3,823m (2012: £4,210m) and 2.04 (2012: 2.16), respectively. The reduction was mainly due to an improved economic environment in the second half of 2013 and prolonged low interest rates, coupled with increases in collections efficiencies, reduction in the stock of mortgage loans and advanced during the year, strong credit quality in the newer corporate loans vintages, reductions in the number of older vintage exposure within the Mid Corporate and SME, and the continuing strategy to exit exposures where possible for the Commercial Real Estate and Corporate Centre portfolios. This decreased was partially offset by the impact of the mortgage portfolio regulatory-driven policy and reporting changes which began to take effect from early 2012, including from cases where the mortgage remained outstanding after contractual maturity.
Loans and advances to customers in arrears and the arrears ratio decreased to £3,484m (2012: £4,149m) and 1.86% (2012: 2.13%), respectively, as a result of the improving economy, due to older NPL cases in Commercial Banking being either successfully returned to performing status or forborne, and as Santander UK continued to execute the strategy of exiting problem exposures through sale of the debt or through the realisation of the collateral.
The coverage ratio also decreased to 41% (2012: 43%) as a result of the overall decrease in NPLs combined with a successful disposal programme without incurring further losses.
Forbearance loans
At 31 December 2013, the carrying amount of financial assets that would otherwise be past due or impaired whose terms have been forborne was £3,032m (2012: £3,093m).
Ratio of write-offs to average loans
| | | | | | | | | | | | | | | | | | | | |
| | | 2013
% | | | 2012(1)
% | | | 2011
% | | | 2010
% | | | 2009
% | |
Ratio of write-offs to average loans during the year | | | 0.43 | | | | 0.34 | | | | 0.36 | | | | 0.31 | | | | 0.27 | |
| (1) | Adjusted to reflect the presentation of the assets held for sale prior to the completion of the sale as set out in Note 12 to the Consolidated Financial Statements. |
| | |
| Santander UK plc Annual Report 2013 | | 163 |
Governance
| | |
| 164 | | Santander UK plc Annual Report 2013 |
Governance
Further Remuneration Disclosures
BOARD OF DIRECTORS
| | | | |
| | * | | Part of the Banco Santander group |
| | ** | | From 1 January 2014 |
| | *** | | Until 1 January 2014 |
| | **** | | Until 25 February 2014 |
CHAIR
| | | | |

| | Lord Burns Appointed Independent Non-Executive Director and Joint Deputy Chair on 1 December 2001 and Chair on 1 February 2002. Skills and experience Lord Burns (age 69) is an experienced economist and has extensive board experience having held a number of Non-Executive appointments for a range of institutions, including British Land plc (2000-2005), Pearson plc (1999-2010) and Legal & General Group plc (1991-2001). He is a life peer of the House of Lords and held a number of governmental positions during his career in the civil service, including Permanent Secretary to the Treasury (1991-1998) and Chair of the Parliamentary Financial Services and Markets Bill Joint Committee in 1999. Until the end of 2013, he served as a Non-Executive Director of Banco Santander, S.A..* |
| | Other principal appointments Member of the Banco Santander, S.A. International Advisory Board*/** Chairman of the Channel 4 Television Corporation Non-Executive Member of the Office for Budget Responsibility Member of the Whistleblowing Commission | | Board committee membership Board Nomination Committee (Chair) |
| |
| EXECUTIVE DIRECTORS | | |
| |
 | | Ana Botín Chief Executive Officer Appointed Chief Executive Officer on 1 December 2010. Skills and experience Ana Botín (age 53) joined the Banco Santander group in 1988 and has extensive financial services experience. She directed Banco Santander, S.A.’s* Latin American expansion in the 1990’s and was responsible for the Latin American Corporate Banking, Asset Management and Treasury divisions. Ana has been a member of Banco Santander, S.A.’s Board and Executive Committee since 1989 and its Management Committee since 1994. Ana is also Founder and Vice-Chair of the Empresa y Crecimiento Foundation, which finances small and medium companies in Latin America. |
| | Other principal appointments Executive Director of Banco Santander, S.A.* Member of the International Advisory Board of the New York Stock Exchange Non-Executive Director of The Coca-Cola Company | | Board committee membership Board Nomination Committee**** |
| |
 | | Stephen Jones Chief Financial Officer Appointed Executive Director and Chief Financial Officer on 6 March 2012. Skills and experience Stephen Jones (age 49) joined Santander UK in 2011 as Head of Strategy, Corporate Development & Regulatory Affairs and was subsequently appointed Chief Financial Officer. He has extensive financial services experience focussed on senior roles in Finance and Investor Relations. Previously he held a number of senior management positions at Barclays Bank plc including Head of Investor Relations, Head of Corporate Debt Capital Markets and Equity Capital Markets and Co-Head of Corporate Investment Banking, Barclays Capital EMEA. |
| | Other principal appointments Member of the Board of the British Bankers Association Member of the FCA Practitioner Panel Member of the Advisory Council of The City UK | | |
| |
 | | José María Nus Chief Risk Officer Appointed Executive Director and Chief Risk Officer on 17 March 2011. Skills and experience José María Nus (age 63) has extensive financial services and risk experience and is responsible for the Risk Division. Previously, José María was Chief Risk Officer at Banco Español de Credito, S.A.*where he was a member of the Board and the Executive Committee. Prior to joining Banco Español de Credito, S.A., he held senior positions at Bankinter, S.A. and Argentaria, S.A. where he was Managing Director of Risk. |
| | Other principal appointments Member of the Board of Societat Catalana D’Economia Member of the Spanish Governmental Observatory for Multinationals | | |
| | |
| Santander UK plc Annual Report 2013 | | 165 |
Governance
Further Remuneration Disclosurescontinued
EXECUTIVE DIRECTORScontinued
| | | | |

| | Steve Pateman Head of UK Banking Appointed Executive Director on 1 June 2011. Skills and experience Steve Pateman (age 50) is responsible for UK Banking and has extensive financial services experience. Steve joined the Company in June 2008 as Head of UK Corporate and Commercial Banking and an Executive Committee member. Previously he worked at National Westminster Bank plc and The Royal Bank of Scotland plc where he had responsibility for Business Banking, Commercial Banking and Corporate Banking. Steve also worked on a variety of financings, restructurings, capital market and equity issues during his time in NatWest Markets, where he specialised in the leisure and retail sectors. |
| | Other principal appointments Member of the Chartered Banker Professional Standards Board | | |
|
| NON-EXECUTIVE DIRECTORS |
| |

| | Juan Rodríguez Inciarte Deputy Chair Appointed Non-Executive Director on 1 December 2004. Skills and experience Juan Rodríguez Inciarte (age 61) is currently Head of Strategy for Banco Santander, S.A..* Since joining Banco Santander, S.A. in 1985 he has held a number of senior management positions across various areas of the business, including Retail Banking, Wholesale, Commercial Banking, Treasury and Markets and Risk Management. Juan has been deeply involved in Banco Santander’s global expansion and has a strong financial services background, having formerly been a Director of The Royal Bank of Scotland plc and National Westminster Bank plc as part of a co-shareholding arrangement with the group. |
| | Other principal appointments Director of Banco Banif, S.A.* Executive Director of Banco Santander, S.A.* Director of Santander Consumer Finance, S.A.* | | Board committee membership Board Nomination Committee |
| |

| | José María Carballo Appointed Independent Non-Executive Director on 1 December 2004 (no longer considered independent from 30 November 2013). Skills and experience José María Carballo (age 69) has extensive financial services and board experience and was Executive Vice President of Banco Santander, S.A.* (1989-2001), Chief Executive Officer of Banco Santander de Negocios* (1989-1993) and Star Capital Partners Limited (2001-2005). Until 1989, he was Executive Vice President responsible for Europe at Banco Bilbao Vizcaya. He was also Executive Vice President of Banco de Bilbao in New York until 1983. |
| | Other principal appointments Chairman of La Unión Resinera Española, S.A.* Director of Santander Banif Inmobiliario, F.I.I.* Chairman of Vista Desarrollo, S.A. S.C.R.* Director of Vista Capital de Expansión, S.A. S.G.E.C.R.* | | Board committee membership Board Audit Committee*** Board Remuneration Oversight Committee*** Board Risk Committee |
| |

| | Antonio Escámez Appointed Non-Executive Director on 1 October 2012. Skills and experience Antonio Escámez (age 62) has extensive board-level experience with a strong financial services background having worked in the sector since 1973. He has held a variety of Executive and Non-Executive Director-level roles across a number of international jurisdictions including Latin America, Europe and the US. Antonio was formerly a Non-Executive Director of Banco Santander, S.A.* and a member of the Group Risk Committee and Group Technology Committee. |
| | Other principal appointments Chairman of Arena Media Communications España, S.A. Vice Chairman of Attijariwafa Bank Société Anonyme* Member of the Banco Santander International Advisory Board* Chairman of Fundación Banco Santander* Vice Chairman of Grupo Konnectanet, S.L. Chairman of Openbank, S.A.* Chairman of Santander Consumer Finance, S.A.* | | Board committee membership Board Risk Committee |
| | |
| 166 | | Santander UK plc Annual Report 2013 |
Governance
Further Remuneration Disclosurescontinued
NON-EXECUTIVE DIRECTORScontinued
| | | | |
 | | José María Fuster Appointed Non-Executive Director on 1 December 2004. Skills and experience José María Fuster (age 55) is the Banco Santander Group Technology and Operations Managing Director and Executive Committee member. He was appointed Chief Information Officer of Banco Santander, S.A.* in 2003 and is responsible for providing the technological and operational systems that support the Banco Santander group’s accounting and risk functions. He started his professional career with International Business Machines, S.A. and Arthur Andersen as a consultant and has also worked for Citibank España, S.A. and National Westminster Bank plc. |
| | Other principal appointments Director of Ingeniería de Software Bancario, S.L. (‘ISBAN’)* Director of Openbank, S.A.* Director of Santander Consumer Bank AG* Director of Santander Holding USA Inc.* Director of Santander Consumer Holding GmbH* | | |
| |

| | Manuel Soto Appointed Non-Executive Director on 1 November 2013. Skills and experience Manuel Soto (age 73) has significant experience in financial services gained during a 38 year career. At Arthur Andersen he held various roles, including EMEIA Area Managing Partner and Chairman of the Worldwide Board. Manuel has also held various Non-Executive roles including serving as a board member of Banco Santander, S.A.* for 14 years, where he was Chair of the Audit and Compliance Committee. |
| | Other principal appointments Member of the Advisory Board of Befesa Medio Ambiente, S.A. Director of Cartera Industrial Rea, S.A. Member of the Advisory Board of Grupo Barceló Member of the Board of Grupo Lar Inversiones Inmobiliarias, S.A. Director of Santander Bank, NA* | | Board committee membership Board Audit Committee** |
|
| INDEPENDENT NON-EXECUTIVE DIRECTORS |
| |

| | Mike Amato Appointed Independent Non-Executive Director on 1 August 2013. Skills and experience Mike Amato (age 57) is an experienced financial services executive. His core experience has been within retail banking where he has in excess of 30 years experience in the US, UK and other international locations. Prior to co-founding Cimarron, Inc. Mike was at Barclays Bank plc which he joined in 2006 and was appointed Global Chief Distribution and Product Management Director in 2010. Before joining Barclays, Mike was at Washington Mutual Bank in a number of senior positions, including Co-President of the retail bank in 2005. |
| | Other principal appointments President and Chief Executive Officer of Cimarron, Inc. Chief Executive Officer of MAX451 | | Board committee membership Board Nomination Committee** Board Remuneration Oversight Committee** Board Risk Committee |
| |

| | Roy Brown Appointed Independent Non-Executive Director on 21 October 2008. Skills and experience Roy Brown (age 67) has extensive experience as a Non-Executive Director across various sectors. He was previously Chairman of GKN plc and a Non-Executive Director of Brambles Industries plc, the British United Provident Association Limited (‘BUPA’) and the Franchise Board of Lloyd’s of London. Formerly, he was an Executive Director of Unilever plc and Unilever NV where he held a variety of executive roles, managing businesses in Europe, Africa, and the Middle East. Roy was previously a Non-Executive Director and Deputy Chairman (2007–2008) and subsequently acting Chairman (2008) of Alliance & Leicester plc, prior to its acquisition by the Banco Santander group. |
| | | | Board committee membership Board Audit Committee*** Board Nomination Committee Board Remuneration Oversight Committee (Chair) Board Risk Committee |
| | |
| Santander UK plc Annual Report 2013 | | 167 |
Governance
Further Remuneration Disclosurescontinued
INDEPENDENT NON-EXECUTIVE DIRECTORScontinued
| | | | |

| | Bruce Carnegie-Brown Appointed Independent Non-Executive Director on 1 October 2012. Skills and experience Bruce Carnegie-Brown (age 54) has performed a wide variety of risk-related roles within the financial services sector, primarily in insurance and investment banking. He was Managing Director of JP Morgan (1985-2003), performing roles including Senior Credit Officer EMEA (1995-1997), Chairman and CEO of JP Morgan Securities Asia (1998-2000) and Head of European and Asian Debt Capital Markets (2000-2003). Following this, Bruce was CEO of Marsh Limited and President and CEO of Marsh Europe (2003-2006) and Managing Partner of 3i Group (2007-2009). |
| | Other principal appointments Chairman of Aon UK Limited Senior Independent Director of Catlin Group Limited Senior Independent Director of Close Brothers Group plc Non-Executive Director of Moneysupermarket.com Group plc | | Board committee membership Board Audit Committee Board Nomination Committee Board Remuneration Oversight Committee Board Risk Committee (Chair) |
| |

| | Alain Dromer Appointed Independent Non-Executive Director on 1 October 2013. Skills and experience Alain Dromer (age 59) has over 20 years experience in asset management following previous roles as CEO of Aviva Investors, when he was also Chair of the ABI’s Investment Committee, Global Head of Group Investment Business at HSBC Investments and Head of Asset Management at CCF Credit Commercial de France. Prior to that, Alain gained regulatory experience through holding various roles in the Government of France, French Treasury including Section Head, World Monetary Affairs & IMF and Deputy Head, Office of Financial Markets. |
| | Other principal appointments Non-Executive Director of Majid Al Futtaim Trust LLC Member of the Board of Moody’s Deutschland GmbH Member of the Board of Moody’s France SA Member of the Board of Moody’s Investors Service Limited | | Board committee membership Board Audit Committee** Board Nomination Committee** Board Remuneration Oversight Committee** |
| |

| | Rosemary Thorne Appointed Independent Non-Executive Director on 1 July 2006. Skills and experience Rosemary Thorne (age 62) brings to the Board considerable financial experience in the retail and financial services sector, having served as Group Finance Director of Ladbrokes plc, J Sainsbury plc and Bradford & Bingley plc, where she worked on the company’s demutualisation and flotation, resulting in a place in the FTSE 100 Index. Rosemary was also a member of the Financial Reporting Council and Financial Reporting Review Panel for nine years and a member of the Main Committee of The Hundred Group of Finance Directors for 15 years. |
| | Other principal appointments Non-Executive Director of Smurfit Kappa Group plc | | Board committee membership Board Audit Committee (Chair) Board Nomination Committee Board Remuneration Oversight Committee*** Board Risk Committee |
| |

| | Scott Wheway Appointed Independent Non-Executive Director on 1 October 2013. Skills and experience Scott Wheway (age 47) has extensive experience in the retail sector, having formerly held various senior roles within Tesco plc, including Operations Director and CEO, Tesco Japan. Following this, he was CEO of Best Buy Europe and Managing Director of Boots Company plc (now known as The Boots Company Ltd) and Managing Director and Retail Director of Boots the Chemist at Alliance Boots plc. Scott also has experience of the financial services sector through his Non-Executive directorship of Aviva plc, where he was Chairman of the Remuneration Committee and is now Chair of the Governance Committee and a member of their Audit and Remuneration Committees. |
| | Other principal appointments Non-Executive Director of Aviva plc | | Board committee membership Board Nomination Committee** Board Remuneration Oversight Committee** Board Risk Committee** |
| | |
| 168 | | Santander UK plc Annual Report 2013 |
Governance
Corporate Governance Report
BOARD GOVERNANCE STRUCTURE
| | |
The Board is collectively responsible to the shareholders for the long-term success of the Company. The Board has delegated certain responsibilities to Board Committees to assist it with discharging its duties. The Board Committees play an essential role in supporting the Board to implement its vision and strategy and provide focussed oversight of key aspects of the business. The key responsibilities that have been delegated by the Board to its Board Committees are set out below. The full Terms of Reference for each Committee are available on the Company’s website www.aboutsantander.co.uk and are available from the Company Secretary and General Counsel upon request. | | 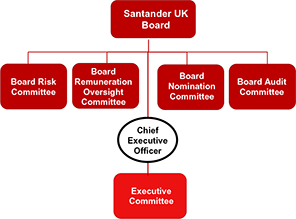 |
Summary of Board, Board Committee and Executive Committee Responsibilities
| | | | |
Committee | | Key Responsibilities as set out in the Terms of Reference |
| | |
| Board | | • | | Review, approve and guide corporate strategy, major plans of action, risk appetite and policies, annual budgets and business plans; set performance objectives; monitor implementation and corporate performance; and oversee major capital expenditures, acquisitions and disposals; |
| | |
| | • | | Monitor the effectiveness of the Company’s governance practices and make changes as needed to ensure alignment with current best practices; |
| | |
| | • | | Oversee the process of external disclosure and communications; and |
| | |
| | • | | All other matters of such importance as to be of significance to Santander UK as a whole because of their strategic, financial or reputational implications or consequences. |
| | |
| Board Nomination Committee | | • | | Lead the process for Board appointments, including the identification, nomination and recommendation of candidates for appointment to the Board through regularly reviewing the structure, size and composition; |
| | |
| | • | | Consider succession planning for Directors and other senior executives; |
| | |
| | • | | Review the results of the Board performance evaluation process that relate to its composition; |
| | |
| | • | | Review annually the time commitment required from Non-Executive Directors; and |
| | |
| | • | | Keep up to date and fully informed about strategic issues, regulatory developments and commercial changes affecting the Santander UK group and the market in which it operates. |
| | |
| Board Audit Committee | | • | | Monitor and review the integrity of the financial reporting: ensure the appropriate resolution of significant financial reporting issues and the clarity of disclosures in the narrative reporting; |
| | |
| | • | | Monitor and review the effectiveness of the Internal Audit function; |
| | |
| | • | | Monitor and review the External Auditors’ performance and ensure objectivity and independence is safeguarded in relation to non-audit services; and |
| | |
| | • | | Ensure the adequacy of the Company’s Whistleblowing arrangements. |
| | |
| Board Risk Committee | | • | | Review the risk management framework and recommend it to the Board for approval; |
| | |
| | • | | Advise the Board on the Company’s overall risk appetite, tolerance and strategy; |
| | |
| | • | | Oversee and advise the Board on the current risk exposures of the Company and future risk strategy; and |
| | |
| | • | | Review the effectiveness of the risk management systems and internal controls. |
| | |
| Board Remuneration Oversight Committee | | • | | Oversee and supervise the Banco Santander group’s policies and frameworks covering remuneration and reward as applied in, or devolved to the UK; |
| | |
| | • | | Provide governance and strategic input into the Company’s executive and employee remuneration and reward activities; and |
| | |
| | • | | Ensure the UK remuneration and reward strategy attracts and retains talent, motivates performance and ensures the demonstration of appropriate behaviours. |
| | |
| Executive Committee | | • | | Monitor and review financial, trading and operating results; |
| | |
| | • | | Review, consider and approve budgets and operating plans prior to submission to the Company’s Board for approval; |
| | |
| | • | | Monitor and manage the Company’s activities to ensure the achievement of budgets and plans; |
| | |
| | • | | Review material strategic transactions including acquisitions and disposals and joint ventures; |
| | |
| | • | | Consider operational matters and cross divisional issues and agree any appropriate action; and |
| | |
| | • | | Receive updates from other CEO level committees and propose matters for consideration by the Board. |
| | |
| Santander UK plc Annual Report 2013 | | 169 |
Governance
Corporate Governance Reportcontinued
CORPORATE GOVERNANCE STATEMENT
The narrative reporting in these financial statements continues to be enhanced from prior years to bring its disclosures more in line with those required of a premium listed company. Santander UK plc is a subsidiary of Banco Santander, S.A., a Spanish company which has its registered office at Paseo de Pereda 9-12, Santander, Spain. Although the Company’s ordinary shares are not listed on the London Stock Exchange (‘LSE’) the Company is subject to the Listing Rules and the Disclosure & Transparency Rules because it has preference shares listed on the LSE. As a result of having only preference shares listed, the Company is not required to make certain disclosures that are normally part of the continuing obligations of premium listed companies in the UK. However, the Company is committed to achieving high standards of corporate governance and, whilst not obliged to do so, seeks to comply with the UK Corporate Governance Code as issued by the Financial Reporting Council (the ‘Code’) in a manner appropriate for its ownership structure.
Whilst the Company is a subsidiary of Banco Santander, S.A., the Company’s corporate governance model ensures that the Board and the management of the Company make their own decisions on liquidity, funding and capital, having regard to what is appropriate for the Company’s business and strategy.
Statement of compliance with the UK Corporate Governance Code
The Board confirms that, for the financial year ended 31 December 2013, the Company has applied the majority of the main principles and relevant provisions of the Code where appropriate to do so given its ownership structure. This Report together with the reports of the Board Committees on pages 172 to 179 describes how the Company has applied its corporate governance model during the year.
The Board
On 26 February 2014, the Board comprised the Chair, four Executive Directors, six Independent Non-Executive Directors and five other Non-Executive Directors. Mike Amato was appointed to the Board on 1 August 2013. Alain Dromer and Scott Wheway were appointed to the Board on 1 October 2013, and Manuel Soto was appointed to the Board on 1 November 2013. All appointments were as Non-Executive Directors. Short biographies of each Director, which illustrate the range of their skills and experience, are set out on pages 165 to 168. The Board is satisfied that the Chair and those Directors who have external directorships have sufficient time available to discharge their responsibilities and to be effective members of the Board.
The Board has determined that Roy Brown, Bruce Carnegie-Brown and Rosemary Thorne, who served as Non-Executive Directors throughout the year and up to the date of this report, together with Mike Amato, Alain Dromer and Scott Wheway, from their appointment dates, meet the independence criteria set out in the Code.
The role of the Board
The Board is collectively responsible to the shareholders for the long-term success of the Company. The Board considers strategic issues and risk, has overall responsibility for the management of the business and affairs of Santander UK, is responsible for the establishment of strategy, and capital raising and allocation. The Board also monitors and oversees Santander UK’s operations, ensuring competent and prudent management, sound planning, proper procedures for the maintenance of adequate accounting and other records and systems of internal control, and for compliance with statutory and regulatory obligations. A formal schedule of matters reserved to the Board is in place.
The Board considers that, at the current time, it is of an appropriate size to oversee the Company’s business, with a structure that ensures that no individual or group dominates the decision-making process.
The role of the Chair
Lord Burns, who was independent upon appointment, leads the Board. The division of responsibilities between the Chair and Chief Executive Officer has been set out in writing and agreed by the Board. His key responsibilities are to maintain, develop and lead an effective Board and to plan and manage the Board’s business, acting as its figurehead.
The role of the Chief Executive Officer
Ana Botín is responsible for developing and delivering the Company’s strategy and financial results within the policies and values established by the Board and striving consistently to optimise resources and achieve financial and operating objectives; and ensuring the appropriate management of day-to-day business affairs. The Board maintains a schedule of matters delegated to the Chief Executive Officer. Such matters include the implementation of risk appetite, product development, approval of new business in accordance with the overall strategy, approval of capital expenditure, capital management and approval of contracts and agreements.
The role of the Company Secretary
Karen Fortunato (Company Secretary and General Counsel) advises the Chair, CEO and Board on constitutional and corporate governance issues and provides direction and leadership to maintain and enhance sound standards of Corporate Governance throughout Santander UK. She works closely with the Chair, the CEO’s Office and the Board Committee Chairs to shape an appropriate schedule of topics for consideration for the year ahead and to ensure the timely delivery of accurate and clear information to the Board.
Directors
All Directors have access to the advice and services of the Company Secretary and General Counsel and may take independent professional advice at the Company’s expense where necessary. The Company does not require the Directors to offer themselves for re-election every year or that new Directors appointed by the Board offer themselves for election at the next Annual General Meeting following their appointment.
| | |
| 170 | | Santander UK plc Annual Report 2013 |
Governance
Corporate Governance Reportcontinued
Directors’ induction and ongoing professional development
All Directors receive a comprehensive induction programme tailored to their skills and experience. The responsibility for designing the individual inductions and for the ongoing professional development of all Directors resides with the Chair assisted by the Company Secretary and General Counsel. The induction programme includes an introduction to the Board and the business, including strategy, key risks and topical issues, and the legal and regulatory landscape in order to further their understanding and knowledge of Santander UK’s business, operations and practices.
The Board also receives regular training and briefing sessions for ongoing professional development both internally and externally in order to update and refresh their skills and knowledge. The Directors also make recommendations for development sessions to inform the ongoing training programme.
Attendance at Board meetings
The Board had 11 scheduled meetings during the year, one of which focussed on strategy. The Directors’ attendance at Board meetings is set out in the table below. The attendance of Directors at meetings of committees of which they are members is shown within the relevant committee report below.
| | | | | | | | |
Director | | Meetings eligible to attend | | | Meetings attended | |
Lord Burns (Chair) | | | 11 | | | | 11 | |
Mike Amato (appointed on 1 August 2013) | | | 4 | | | | 4 | |
Ana Botín | | | 11 | | | | 11 | |
Roy Brown | | | 11 | | | | 11 | |
José María Carballo | | | 11 | | | | 11 | |
Bruce Carnegie-Brown | | | 11 | | | | 10 | |
Alain Dromer (appointed on 1 October 2013) | | | 3 | | | | 3 | |
Antonio Escámez | | | 11 | | | | 11 | |
José María Fuster | | | 11 | | | | 10 | |
Juan Rodríguez Inciarte | | | 11 | | | | 10 | |
Stephen Jones | | | 11 | | | | 11 | |
José María Nus | | | 11 | | | | 11 | |
Steve Pateman | | | 11 | | | | 10 | |
Manuel Soto (appointed on 1 November 2013) | | | 2 | | | | 2 | |
Rosemary Thorne | | | 11 | | | | 11 | |
Scott Wheway (appointed on 1 October 2013) | | | 3 | | | | 3 | |
Directors’ conflicts of interest
The Companies Act 2006 provides that a Director must avoid situations where he/she can have a direct or indirect interest that conflicts or might conflict with the interests of the Company (‘Situational Conflicts’). The Company’s Articles of Association contain provisions that allow the Board to consider and, if it sees fit, to authorise Situational Conflicts.
The Board confirms that such powers have been operated effectively and that a formal system for Directors to declare their interests and for the non-conflicted Directors to authorise Situational Conflicts continues to be in place. Any authorisations given are recorded by the Secretariat Department.
Board Committees
The Board delegates specific responsibilities to Board Committees, the activities of which are set out on page 169. The role and responsibilities of each Board Committee are set out in formal Terms of Reference, which are reviewed at least annually. The Board Committees make recommendations to the Board as they see fit, as contemplated by their Terms of Reference. The Chair of each Committee reports to the Board after each meeting on the matters discussed and the minutes of each meeting, other than the Board Nomination Committee, are provided to the Board for information. Each Committee has a formal schedule of topics that set out the matters to be discussed during the year. The schedules are reviewed and updated regularly which allows the inclusion of matters as they arise and require attention.
Board effectiveness and evaluation
The Board composition and the experience of the Directors contribute greatly to the overall effectiveness of the Board. In order to maintain its effectiveness, the composition of the Board and its committees, together with succession planning arrangements, are kept under review.
In the first half of 2013, the Board Nomination Committee commissioned an external Board Effectiveness review by Bvalco Limited, who undertook a review to provide the Board with a level of assurance as to its current effectiveness. The review concluded that the Board was operating effectively. However, the review recognised the Board’s commitment to continuous improvement and an action plan has been developed to support this. It is the intention of the Board to continue to undertake regular evaluations of its performance and that of its Committees. A legal firm which is engaged from time to time by the Company to provide legal services holds a 20% shareholding in Bvalco Limited.
| | |
| Santander UK plc Annual Report 2013 | | 171 |
Governance
Corporate Governance Reportcontinued
BOARD NOMINATION COMMITTEE CHAIR’S REPORT
| | | | | | | | | | |
 | | Membership, attendance and skills | | | | | | | | |
| | Member | | Meetings eligible to attend | | | Meetings attended | |
| | Lord Burns (Chair) | | | 8 | | | | 8 | |
| | Ana Botín | | | 8 | | | | 8 | |
| | Roy Brown | | | 8 | | | | 8 | |
| | Bruce Carnegie-Brown (from 19 March 2013) | | | 6 | | | | 6 | |
| | Juan Rodríguez Inciarte | | | 8 | | | | 7 | |
| | Rosemary Thorne | | | 8 | | | | 8 | |
| | | | | | | | | | |
| | | | | | | | | | |
| | | | | | | | | | |
The members and attendance at meetings held during the year are shown in the table above. With effect from 1 January 2014, the membership of the Committee was refined to include Mike Amato, Alain Dromer and Scott Wheway. This enables all Independent Non-Executive Directors to contribute to the important business covered by this Committee. The Code recommends that a majority of members of the Board Nomination Committee are independent. As a result of the membership refinements referred to above, the Committee satisfies this membership criterion.
Key responsibilities
The key responsibilities delegated to the Board Nomination Committee are set out on page 169. Following approval by the Board on 17 December 2013, the key responsibilities of the Committee were formally expanded to include certain corporate governance related matters including overseeing the evaluation of the performance and effectiveness of the Board and Board Committees, recommending actions for addressing any findings and overseeing the implementation of any resulting action plan. In practice, the Committee discharged these responsibilities throughout 2013 particularly given the external review of Board effectiveness conducted in the first half of 2013; details of this review are shown on page 171.
Overview of 2013 activities
Throughout the year, we remained focussed on the continuous improvement of the Board and Board Committees. This included the ongoing review of the Board’s structure, size and composition. In particular, we considered the importance of refreshing the Board and Board Committees, the balance of membership, diversity of skills and experience and succession planning arrangements in place at both a Board and senior management level.
In 2013, we were successful in securing the appointment of four new Non-Executive Directors which further enhanced the range of skills and experience of the Board as a whole. We were delighted to secure the appointment of three new Independent Non-Executive Directors, namely Mike Amato (with effect from 1 August 2013), Alain Dromer and Scott Wheway (with effect from 1 October 2013). In addition, Manuel Soto was appointed as a Non-Executive Director on 1 November 2013 having served on the Board of Banco Santander, S.A. for 14 years. In order to ensure that our recruitment activity met the needs of the Board, we utilised the services of external search consultancies, (Stonehaven, Egon Zehnder International and Ridgeway Partners) in relation to the appointments of the Independent Non-Executive Directors. These search firms have no other connection with the Company. In addition to the above, the appointment of Nathan Bostock as Deputy CEO, which is a Board position, was overseen by the Committee. Nathan previously worked at Santander UK and represents an excellent addition to the Board. The recruitment activity throughout 2013 enabled us to achieve a better balanced Board with a greater level of skills, experience and independence. We also reviewed the membership of the Board Committees to ensure that their composition remained appropriate and that members could devote appropriate time to their role. As a result, we recommended a number of Committee membership changes, which were subsequently approved by the Board, effective from 1 January 2014. The details of these changes are shown in the report of each Committee.
An important role of the Committee is to ensure that robust succession plans are in place for the Board and senior management team. We spent a great deal of time throughout 2013 reviewing succession plans and ensuring that the succession methodology being followed remained robust. Given the work conducted by the Committee in 2013, we are comfortable that robust succession plans remain in place which will enable us to continue to take a forward-looking and proactive approach to future Board and senior management appointments aligned to the needs of the Company. We remain acutely aware of the importance of gender diversity on the Board and throughout the Santander UK group. This will remain a key area of focus for the Committee in 2014 and beyond. At 31 December 2013 (and at the date of this report), 12% of the Board was female. Gender diversity statistics for the Santander UK group can be found on page 23.
Planned activities for 2014
For 2014, we will continue to review and monitor the composition of the Board and Board Committees against the skills and experience requirements of Santander UK and its overall strategic direction. Ensuring that robust succession plans are in place and kept under regular review will remain an important part of our work for 2014. We remain fully aware of the emerging developments in Corporate Governance arrangements applicable to banking institutions and will continue to take these into account throughout 2014.
We will continue to monitor progress against the actions arising from the 2013 externally facilitated Board effectiveness review to ensure that continuous improvement is achieved. We will further consider Board and senior management diversity, including implementing the Company’s Board Diversity Policy. Any future Board appointments will continue to be made on merit, having due regard for the benefits of diversity, including gender, on the Board. We will also continue to develop measurable objectives to implement the Board Diversity Policy which will be aligned with our ambitions in this important area.
Lord Burns
Chair of Board Nomination Committee
| | |
| 172 | | Santander UK plc Annual Report 2013 |
Governance
Corporate Governance Reportcontinued
BOARD RISK COMMITTEE CHAIR’S REPORT
| | | | | | | | | | |
 | | Membership, attendance and skills | | | | | | | | |
| | Member | | Meetings eligible to attend | | | Meetings attended | |
| | Bruce Carnegie-Brown (Chair) | | | 14 | | | | 14 | |
| | Mike Amato (from 1 October 2013) | | | 3 | | | | 3 | |
| | Roy Brown | | | 14 | | | | 13 | |
| | José María Carballo | | | 14 | | | | 14 | |
| | Antonio Escámez (from 21 May 2013) | | | 7 | | | | 6 | |
| | Rosemary Thorne | | | 14 | | | | 14 | |
| | | | | | | | | | |
| | | | | | | | | | |
During the year, we held 11 scheduled meetings and three additional meetings. The members of the Committee and attendance at meetings held during the year are shown in the table above. Scott Wheway was appointed to the Committee with effect from 1 January 2014. The Terms of Reference require the majority of the members to be Independent Non-Executive Directors. With the exception of Antonio Escámez, who was appointed during the year, and José María Carballo (who ceased to be independent on 1 December 2013), all members are Independent Non-Executive Directors. During the year, Roy Brown, José María Carballo, Rosemary Thorne and I also were also members of the Board Audit Committee. This common membership provided an ongoing exchange of information on internal controls and risk management between the two committees given the overlap in responsibilities. Since the year-end, Rosemary Thorne and I are common members of the Board Risk Committee and the Board Audit Committee.
Key responsibilities
The key responsibilities delegated to the Board Risk Committee are set out on page 169.
Overview of 2013 activities
Throughout the year, on a monthly basis, the Committee received comprehensive reports from the Risk Department to enable us to oversee the performance of the Company’s financial and non-financial risks with a particular focus on top and emerging risks, which are outlined in the Summary Risk Report on page 15 and set out in detail in the Risk Management Report on pages 61 to 163. We reviewed the Risk Appetite and Risk Framework.
Credit risk remained our most significant focus as it is the largest source of risk to Santander UK. Other matters reviewed included the capital and liquidity position of Santander UK including stress scenarios, significant internal control matters and other specific risks such as conduct and pensions.
Risk Oversight
The reports from the Risk Department enabled us to:
| | • | | Oversee the performance of the Company’s financial and non-financial risks as compared to our risk appetite; |
| | • | | Monitor top and emerging risk issues; and |
| | • | | Keep under review emerging themes, including regulatory, macro economic and global risks, which could affect the Company’s ability to achieve its strategic goals. |
We reviewed and challenged the risk management information provided to us, seeking further reports, analysis and explanations from the Risk Department, other units responsible for the control of risk and business functions, as appropriate, to ensure a full understanding of the risks facing the Company.
Risk Framework and Risk Appetite
Following the approval by the Board of an enhanced Risk Framework in 2012, we worked to ensure that the Risk Framework was rolled out comprehensively across the Company in 2013. Regular updates on progress were provided by management which were considered and challenged to ensure that they were proceeding to plan.
At our meeting in December, we approved further enhancements to the Risk Framework, which were aimed at improving the effectiveness of our Risk Framework for 2014, including:
| | • | | Simplifying the key risk types; |
| | • | | Streamlining the three lines of defence model; |
| | • | | Creating a new Conduct & Regulatory Risk Committee which reports to the Executive Risk Committee; and |
| | • | | Including a Risk Culture statement. |
In the second half of the year, we conducted our annual review of the Company’s Risk Appetite to ensure that it remained appropriate for the business.
| | |
| Santander UK plc Annual Report 2013 | | 173 |
Governance
Corporate Governance Reportcontinued
Credit Risk
As a principally retail and commercial bank, credit risk remains the largest source of risk for Santander UK, and remained a key area of interest for the Committee. We focused on the overall credit quality of the retail and commercial loan portfolios and noted the prudent lending criteria adopted by the business. Where material transactions were considered, we assessed and challenged the risk aspects and reported to the Board on our findings. The Committee also reviewed more specific risks during the year such as real estate concentrations.
Capital and liquidity risk
Both capital and liquidity are among the top risks facing Santander UK. During the year, the Committee reviewed adverse stress assumptions and received regular updates from management on liquidity and funding. We also reviewed the Company’s Individual Liquidity Adequacy Assessment and ICAAP regulatory submissions, which we then recommended to the Board for approval. The ICAAP also includes severe stress scenarios. We were therefore able to satisfy ourselves that these risks were being effectively mitigated by management.
Conduct Risk
Conduct risk has been significant for Santander UK with material provisions made in prior years with respect to PPI and other conduct issues. Santander UK commenced a strategic review of conduct risk within the business in 2013 to identify and address key risk drivers. An enhanced Conduct Risk Framework has been developed to further improve the governance and management of conduct risk. Improvements have also been made to specific business processes, such as product governance, as well as to the way the business identifies, assesses, manages and reports current, and potential future, conduct risks.
Other matters
We considered the Corporate Bonus scheme for 2013 and provided advice to the Board Remuneration Oversight Committee on the structure and risk-weightings proposed for the performance objectives. Where major change programmes were considered, we assessed and challenged the risk aspects and reported to the Board on our findings.
The Committee also reviewed more specific risks during the year such as pension risk, simplification of the Retail product suite and the branch training model; and considered the results of a number of mystery shopping reviews, including investment advice and the 1|2|3 World. We kept under review the effectiveness of the Company’s internal controls and risk management systems and considered and approved the statements included in the Annual Report concerning internal controls and risk management.
Planned activities for 2014
2013 was the year in which we rolled out a comprehensive Risk Framework across the Company, and 2014 will be the year in which we seek to embed the best practices endorsed by the Risk Framework. This Risk Framework will continue to drive the culture of risk awareness amongst all staff. It represents a major project for the Company which will take time to implement. The Committee will spend time to ensure that the Company makes significant progress on this objective in 2014 and that the Risk Framework is operating effectively.
In order to ensure that the risk management arrangements deliver outcomes that are consistent with the fair treatment of our customers, we will closely monitor financial and non-financial risk performance against risk appetite; challenge management on risk-related issues; and keep a focus on emerging risks including the UK political, economic and regulatory environment, and IT developments. This will enable us to develop our forward looking picture of the risks across the Santander UK group.
Bruce Carnegie-Brown
Chair of Board Risk Committee
| | |
| 174 | | Santander UK plc Annual Report 2013 |
Governance
Corporate Governance Reportcontinued
BOARD AUDIT COMMITTEE CHAIR’S REPORT
| | | | | | | | | | |

| | Membership, attendance and skills | | | | | | | | |
| | Member | | Meetings eligible to attend | | | Meetings attended | |
| | Rosemary Thorne (Chair) | | | 15 | | | | 15 | |
| | Roy Brown | | | 15 | | | | 15 | |
| | José María Carballo | | | 15 | | | | 15 | |
| | Bruce Carnegie-Brown | | | 15 | | | | 13 | |
| | | | | | | | | | |
| | | | | | | | | | |
| | | | | | | | | | |
| | | | | | | | | | |
During the year, we held 12 scheduled meetings and three additional meetings. The members of the Committee and attendance at meetings held during the year are shown in the table above. On 1 January 2014, Roy Brown and José María Carballo stepped down and Alain Dromer and Manuel Soto were appointed. The new members bring considerable financial experience to the Committee. The Code recommends that at least three members of the Board Audit Committee are independent and the Committee satisfied this requirement throughout the year and continues to do so.
Financial Expert
The Board has determined that I have the necessary qualifications and experience to qualify as a Board Audit Committee financial expert. This determination is based in part on my 15 years experience as a Finance Director of FTSE 350 Index companies, and my membership on the Financial Reporting Review Panel and the Hundred Group of Finance Directors Main Committee.
During the year Roy Brown, José María Carballo, Bruce Carnegie-Brown and I also were members of the Board Risk Committee. This common membership provided an ongoing exchange of information on internal controls and risk management between the two committees given the overlap in responsibilities. Since the year-end, Bruce Carnegie-Brown and I are common members of the Board Risk Committee.
Key responsibilities
The key responsibilities delegated to the Board Audit Committee are set out on page 169.
Overview of 2013 activities
We receive regular reports throughout the year from Finance, the External Auditors, Internal Audit, Compliance and Legal & Secretariat and also meet with management regularly. In my capacity as Board Audit Committee Chair, I meet in private sessions with key members of the management team and the External Auditors ahead of each meeting. I also attend meetings with the Prudential Regulation Authority (“PRA”), the Financial Conduct Authority and the Financial Reporting Council, both on an individual basis and together with the Chairs of other major UK banks.
Financial reporting and policy
Our main area of activity in 2013 surrounded the Company’s financial reporting cycle, primarily the annual report, the half-yearly financial report, and the quarterly management statements. As part of this, we considered all material changes to accounting treatment and areas of significant management judgements to ensure that they were appropriate.
A comprehensive report setting out the details of the management judgements and accounting policies used for the preparation of the financial statements was presented by management as part of each reporting cycle. Detailed reports were also presented by the External Auditors. This allowed a robust challenge of management’s proposals and we were therefore able to satisfy ourselves that both the judgements themselves and any disclosure thereof were appropriate and transparent. During 2013 and as part of our approval of the 2013 Annual Report, we focused in particular on:
| • | | Impairment loss allowances for loans and advances |
The size of the retail and commercial loan books mean that this is one of the most significant areas of management judgement. During the year, detailed reports were prepared for us by management (including a comprehensive paper on the mortgage provision methodology) and the focus of our discussion was particularly on potentially higher risk areas of the portfolio such as interest-only loans in the mortgage portfolio, commercial real estate in the corporate sector and forbearance across all portfolios. We noted that the disposals from the non-core portfolios in 2013 were being carried out without incurring additional losses, which provided support for the reasonableness of management’s judgements in the past.
We discussed the reports alongside the findings of the work of the External Auditors. These discussions allowed us to satisfy ourselves of the robustness of the processes in place and the key assumptions made by management.
| • | | Conduct remediation provision |
This is another one of the most significant areas of management judgement and covers the provision for conduct remediation activities for PPI and sales of interest rate swaps and other retail products. When considering whether the assumptions underlying the provision calculation were appropriate, we were mindful of the uncertainty around complaint volumes, uphold rates and redress costs. In particular, we noted that other UK banks were increasing their level of remediation provisions in 2013. We therefore challenged management on the appropriateness of their assumptions and, with respect to PPI in particular, we reviewed the monthly trend of remediation payments. We also reviewed the level of disclosure in the financial statements.
Taking into account these matters, we agreed with management’s judgement on the level of conduct provisions and management’s approach to conduct disclosures.
| | |
| Santander UK plc Annual Report 2013 | | 175 |
Governance
Corporate Governance Reportcontinued
| • | | Valuation of financial instruments held at fair value and the disclosure of the fair value of instruments carried at amortised cost |
The valuation of financial instruments held at fair value is a complex area and significant judgement is required with respect to those financial instruments where there was no observable market data. We noted however that the volume of such financial instruments held at fair value remained small. We remained satisfied with management’s valuation approach and also the relevant disclosures.
We also considered management’s approach towards the disclosure of the fair value of financial instruments carried at amortised cost, particularly as there was often little or no observable market data on which to base their fair values, and were satisfied with management’s approach.
| • | | Hedge accounting policies |
Due to the complexity of the application of these policies and their potential impact on the Company’s financial results, hedge accounting policies remain a significant area of focus. We noted that management had commenced the use of cash flow hedging during the year. We reviewed management’s approach and satisfied ourselves that it was in compliance with IFRS.
We also discussed with the External Auditors the findings of their audit work in this area, including the sampling conducted, and were satisfied that this confirmed the appropriateness of management’s approach.
A significant level of goodwill from past acquisitions is held on the balance sheet. As part of its general update on management judgements at our November meeting, management recommended changes to two key assumptions used in their goodwill impairment review calculation. These changes related to the discount rate, based on current market data, and terminal growth rates, based on the latest UK economic forecasts.
We challenged management’s overall proposal, including these assumptions, that no impairment was required. Detailed discussion of this proposal, together with a review of the report from the External Auditors satisfied us that management’s approach remained appropriate.
| • | | Retirement benefit obligations |
Management reported on their key assumptions used to calculate the value of the retirement benefit obligations and regular reports were received on the matter generally. We noted that the calculations were prepared with the assistance of the Company’s actuarial advisers. When assessing the retirement benefit obligation, we recognised that, although some of the assumptions were based on observable market data, there remained others that require significant management judgement such as mortality, discount rates, and pension and salary increases. These can have a significant impact on the pension assets and liabilities recognised in the balance sheet. Following challenge and a review of the report of the External Auditors, we were satisfied with management’s approach.
Other significant areas of focus particularly relating to the Annual Report included:
| • | | Disclosures in the Annual Report and Accounts |
We reviewed reports from management on the level of disclosure in the Annual Report and the Half Yearly Financial Report covering matters such as requirements arising from the adoption of new or revised accounting standards, benchmarking against peer banks, compliance with the recommendations on risk disclosures by the Enhanced Disclosure Task Force, and recommendations on new disclosures by the British Bankers’ Association Disclosure Working Party, of which Santander UK plc is a member, which takes account of the views of the PRA.
We also received reports from the Disclosure Committee, a committee chaired by the Chief Financial Officer and with membership of senior executives from across the Company and responsible for ensuring the completeness and accuracy of disclosure by the Company in its external reporting. Our work related to the new requirements of the “Fair, balanced and understandable opinion” is set out below.
| • | | Related party transactions |
We consider the internal controls over transactions with the Banco Santander group. Santander UK is subject to PRA limits on exposures to, and on liquidity provided to, other members of the Banco Santander group. In this regard, we noted the Internal Audit report over these arrangements and note that no significant control issues arose. We also note that these arrangements, including significant transactions, are also considered on a regular basis by the Board Risk Committee and where appropriate, the Board. On this basis we were able to satisfy ourselves, as part of our review of the Annual Report, on the appropriateness of related party disclosures.
| • | | The Directors’ going concern disclosures |
As part of our ongoing review of the Company’s financial performance, we satisfy ourselves that there are sufficient financial resources available to continue the operations of the Company. We also considered the Company’s resilience in the face of stress and adaptability in the face of changing circumstances. As part of our review of the financial statements, we also consider the going concern statement and were satisfied with the level of disclosure.
| • | | Fair, balanced and understandable opinion |
In addition to the process established by management to provide assurance that the business review is fair, balanced and understandable, we reviewed the contents of the review and advised the Board that, in our view, the report met this requirement and provided the information necessary for Santander UK’s performance, business model and strategy to be assessed.
| | |
| 176 | | Santander UK plc Annual Report 2013 |
Governance
Corporate Governance Reportcontinued
Internal Control
Robust systems of internal control are essential for a bank operating in a complex and changing business environment. We receive reports from management, Internal Audit and the External Auditors and review the effectiveness of both audit functions. Matters we concentrated on during the year included IT controls, controls over our wholesale banking operations, and compliance matters, particularly given the level of conduct remediation that has been required.
We oversaw the Internal Audit function and its activities to ensure its independence and effectiveness in the context of the Company’s overall risk management framework including, in particular, internal control. We discharged our responsibilities by reviewing and challenging the Internal Audit Plan and Audit Reports provided to us. We oversaw the implementation of the actions identified by the independent review of the effectiveness of the Internal Audit function having supported the recommendations made as part of the review. We received regular reports on progress towards their implementation.
We discussed with management the potential impact of the Chartered Institute of Internal Auditors Code on Effective Internal Audit in the Financial Services Sector and provided input into the Company’s response to the earlier consultation. We support the changes identified by management to implement the Code.
In the latter half of the year, the Committee discussed with management the methodology adopted to resolve open audit points. This included receiving regular reports from Internal Audit, including a focus on the most significant audits and the progress made on issues identified. Where deemed appropriate, it was agreed the responsible executive would attend to provide an update on progress.
We oversaw the work and re-appointment of the Company’s External Auditors, Deloitte LLP, who have been the external auditors since 1999.
We reviewed the External Auditors’ effectiveness and were satisfied with the rigour of the audit and service. This was done through a detailed assessment covering all areas of the external audit process. We were satisfied it was appropriate to continue to support their reappointment as auditors.
We pre-approved the payment of fees for all audit-related work. We ensured the independence of the External Auditors through maintaining and keeping under review a robust non-audit services policy to limit the scope of services they may provide. In addition, we satisfy ourselves there is no potential for a conflict of interest when considering their suitability for non-audit work.
We consider the audit plan and receive regular written and verbal reports from the External Auditors as part of the financial reporting cycle. Their work related to management judgements is set out above. We reviewed the summary of misstatements which had not been corrected by management and satisfied ourselves that they were quantitatively and qualitatively immaterial, both individually and in aggregate. We also discussed with the External Auditors the level of disclosures in the Annual Report and Half Yearly Financial Report to satisfy ourselves that the level of disclosure was appropriate. We regularly discuss developments in financial reporting, including changes to accounting standards, statute and best practice.
We received reports from the External Auditors on internal control matters identified as part of their audit and ensured that management were taking appropriate action with respect to their recommendations.
I meet with the External Auditors ahead of each Committee meeting and at other times, where appropriate. We also met as a Committee in private session frequently throughout the year to allow the External Auditors to raise any matters without management being present.
| • | | Management’s reporting on internal control |
In addition to receiving reports from the Internal and External Auditors on internal control matters and ensuring that appropriate action was being taken by management, we receive regular reports from Compliance on such matters as internal fraud and key conduct and non-financial regulatory risks. We receive reports from Finance on internal controls over financial reporting and review the level of deficiencies identified in management’s testing.
As part of our approval of the 2013 Annual Report, we also received a report from executives responsible for IT and received updates throughout 2013 on wholesale banking given their importance to the Company. Again, we ensured that appropriate action was being taken by management on matters identified. In addition, Legal & Secretariat provide reports on any material litigation cases.
Legal & Secretariat provide reports on whistleblowing. During the year, we oversaw the launch of an enhanced Whistleblowing Policy, which included the re-launch of our confidential Whistleblowing Line through a new service provider. The new line has been a great success in that it has continued to raise the profile of the Whistleblowing Policy across the business.
Planned activities for 2014
For 2014, we will continue to focus on ensuring the robustness of the financial reporting process. We will consider the impact of new accounting requirements, the regulatory environment and general industry conditions. We will also continue to assist the Internal Audit function with the development of their reporting processes including the implementation of the changes required by the new Internal Auditors Code.
Rosemary Thorne
Chair of Board Audit Committee
| | |
| Santander UK plc Annual Report 2013 | | 177 |
Governance
Directors’ Remuneration Report
REPORT OF THE BOARD REMUNERATION OVERSIGHT COMMITTEE
| | | | | | | | | | |
 | | Membership, attendance and skills | | | | | | | | |
| | Member | | Meetings eligible to attend | | | Meetings attended | |
| | Roy Brown (Chair) | | | 10 | | | | 10 | |
| | José María Carballo | | | 10 | | | | 10 | |
| | Rosemary Thorne | | | 10 | | | | 10 | |
| | Bruce Carnegie-Brown | | | 10 | | | | 8 | |
| | | | | | | | | | |
| | | | | | | | | | |
| | | | | | | | | | |
| | | | | | | | | | |
During the year, we held 10 scheduled meetings. The members of the Committee and attendance at meetings held during the year are shown in the table above. With effect from 1 January 2014, Mike Amato, Alain Dromer and Scott Wheway joined the Committee and José María Carballo and Rosemary Thorne stepped down as Committee members. Collectively, the members of the Committee have a wealth of experience including chairing a Remuneration Committee of a FTSE 100 company and being involved in the design and implementation of reward schemes in other organisations.
The members of the Committee are all considered by the Company to be independent, as defined in the Code, and free from any business or other relationship that could materially affect the independence of their judgement. None of the Committee members have any personal financial interest in the Company (other than as shareholders of Banco Santander, S.A.), conflicts of interests arising from cross-directorships or day-to-day involvement in running the business.
The Chair, the Chief Executive Officer, the Chief Financial Officer, the Financial Controller, the Chief Risk Officer, the Company Secretary & General Counsel and the People & Talent Director are able to attend meetings upon request except in instances where their own remuneration and/or reward arrangements are discussed, or in other circumstances where their attendance would not be appropriate.
Summary Statement
On behalf of the Board, I am pleased to present the Remuneration Report for the year ended 31 December 2013, for which we will be seeking approval at our AGM in March 2014. In 2013, the Company’s approach to remuneration, as during 2012, was set against its performance (encouraging divisions to achieve strong results) and took into account the qualitative assessments of results and an Enterprise Risk Review. During 2013, our transformation into a market-leading retail and corporate bank continued, with progress evident in all key areas. Once again, the Company delivered a sound financial and business performance in the context of the economic and regulatory backdrop of the UK and we believe Santander UK is well positioned for the year ahead.
Transparency
Throughout 2013, the Company again sought to continue its commitment to transparency in its remuneration reporting and positively engaged with the revised legislative requirements for quoted companies in respect of executive remuneration reporting. Despite not being directly affected by those new legislative requirements, as with our reporting for 2012, this report includes certain additional disclosures to ensure the continued transparency of the Company’s approach to remuneration.
Highlights
The Committee, together with input from the Board, continued to focus on ensuring that Santander UK’s remuneration policies were consistent with prudent risk management as well as remaining compliant with applicable regulation, aligned to best-practice and competitive with our peers.
Throughout 2013, the Committee was engaged in constructive debate and discussion with the Executive team to challenge the Company’s senior management to provide assurance and comfort that the Company was delivering on its stated remuneration policies and practices whilst meeting the expectations and challenges of its stakeholders, including its lead regulator. In particular, the Committee:
| • | | received regular updates on regulatory and industry developments including understanding the anticipated impacts of expected remuneration requirements under CRD IV and other emerging regulation; |
| • | | together with its independent adviser, established and approved a policy to address performance adjustment in variable remuneration together with proposed revisions to the Company’s bonus deferral scheme; |
| • | | approved the Company’s bonus proposals for its Executive Directors, senior management and those employees who have been identified as meeting the FCA’s criteria for Code Staff and therefore subject to the mandatory requirements of the Remuneration Code; |
| • | | reviewed the Company’s risk-adjustment metrics in the light of regulatory requirements, resulting in approval of the Company’s Bonus Pool Risk Adjustment Framework. We also received advice from the Board Risk Committee on the structure and risk-weightings proposed for the performance objectives; |
| • | | undertook its annual review of remuneration philosophy and practice to ensure that the overall remuneration structure continues to promote the Company’s business strategy; |
| • | | approved the proposal for the Company to operate a cash-based Incentive Plan; |
| • | | approved the proposal for the Company to operate a Sharesave Scheme; |
| • | | approved remuneration proposals in respect of recruitment of senior employees; |
| • | | considered the results from a review of Executive Director and senior management benefits packages in comparison to the market; |
| • | | approved the Company’s annual process and criteria for Code Staff identification; |
| • | | reviewed the Company’s remuneration governance, including the approval of updated framework documentation; and |
| • | | considered and approved the remuneration disclosures proposed in the Company’s Annual Report as well the Company’s annual Remuneration Policy Statement provided to the FCA. |
At the AGM of the Company held on 24 April 2013, the Directors’ Remuneration Report for 2012 was approved unanimously.
| | |
| 178 | | Santander UK plc Annual Report 2013 |
Governance
Directors’ Remuneration Reportcontinued
Overview of 2013 activities
Throughout 2013, the Committee was mindful of the regulatory environment and the context in which the Company conducts its business. As in 2012, we monitored closely the pronouncements from the Company’s lead regulators and the UK Government in respect of remuneration, particularly those applicable to the financial services industry and those relevant to executive pay more generally. We continued to support remuneration practices that encourage financial stability as well as strong risk management processes and behaviours. We also met the more extensive disclosure requirements imposed by the European Union, the Bank of Spain and the UK’s PRA and FCA. In this regard, the Committee received regular updates from its independent adviser, PricewaterhouseCoopers LLP (’PwC’) on the domestic and international regulatory agenda applicable to remuneration related matters and particular regulatory areas of focus.
The Committee considered a number of key changes to remuneration structures in 2013. In order to better meet the challenges posed to the Company’s business, the Committee reviewed the operation of the annual bonus scheme applicable to the Company’s senior management, which includes the Executive Directors. The management and control of risk is a key focus for the Committee and it is cognisant that conduct risk, in respect of the outcomes for our customers, is a priority risk where remuneration policies and practices can have a material impact. The Committee approved a number of changes to the metrics used to assess performance including the use of Return on Risk Weighted Assets (‘RORWA’) as a more appropriate measure of capital consumption and the use of a Customer Service Gateway to ensure conduct risk is appropriately addressed. Additionally, as Banco Santander, S.A. has been reviewing its use of a global group long-term incentive plan (‘LTIP’), instead, for the Company’s senior management, the Committee considered and approved the proposal for the Company to operate a cash-based Incentive Plan. Otherwise, for all other senior management group bonus and incentive schemes in operation in the UK, there were no material changes to the basic operation of any schemes.
In 2012, we introduced an Enterprise-wide Risk Review to take place as part of the bonus pool calculations for all schemes. Such a review was continued into 2013 and is a holistic review of all financial and non-financial risks considered by the Committee after the initial bonus pool calculations had taken place, with the ability for the Committee to reduce all bonus pools by up to 100%. As part of the Corporate Governance Framework, the Committee does not have the ability to make upside adjustments to the bonus pools.
The Committee established a Performance Adjustment Policy to guide it, where appropriate circumstances dictate, in the exercise of its discretion to apply malus when reviewing variable, performance-related remuneration. The Committee continued to scrutinise individual bonus awards and deferred remuneration against the robust performance adjustments standards of this policy, in line with our regulators’ rules and expectations.
There were no changes to the composition of the Board as regards Executive Directors in 2013.
Priorities for 2014
As in 2013, the regulators are expected to continue to introduce more detailed and prescriptive rules on remuneration, and so it is key that the Committee devotes appropriate time to ensuring that these regulations are met and that it has the relevant understanding of the business to ensure that this is done in a way that continues to support the Company’s objectives. In addition, the Committee expects important remuneration issues to continue to be brought before it for approval. The Committee looks forward to continuing to:
| • | | engage with the Company as to how it will meet the challenges and opportunities presented by the requirements of CRD IV on both the Company’s remuneration practices as well as those of the industry generally; |
| • | | support the Company’s strategy, ensuring compliance with the dynamic regulatory environment; |
| • | | review remuneration policy in line with any movement in the approach of the Company’s peers; |
| • | | participate in the national debate on what future remuneration structures and reporting should look like; |
| • | | differentiate for performance through pay and not rewarding failure or over-rewarding mediocrity; and |
| • | | engage constructively with the Company on suitable arrangements for future long-term share incentive plans. |
Delivering on our strategic priorities will mean our people are proud to work for Santander UK, our customers are loyal and satisfied, and we deliver consistent profitability and a strong balance sheet, enabling us to make an increased contribution to the economic growth of the UK. We strongly believe that all our staff should share in the success of the business.
We are not proposing any changes to Executive Director remuneration arrangements in 2014. However, we will continue to monitor our approach to pay against the backdrop of evolving regulation and the wider climate on executive pay, to ensure that remuneration remains simple, and aligned with our strategy.
I hope you will find this summary clear and informative.
Roy Brown
Chair of Board Remuneration Oversight Committee
| | |
| Santander UK plc Annual Report 2013 | | 179 |
Governance
Directors’ Remuneration Reportcontinued
REMUNERATION REPORT
This Report has been prepared on behalf of the Board by the Board Remuneration Oversight Committee (‘the Committee’) in accordance with the Large and Medium-sized Companies and Groups (Accounts and Reports) (Amendment) Regulations 2013, to the extent practicable. Because the Company is not fully quoted (as defined by the Companies Act 2006), some of the requirements have no practical relevance or benefit to increasing pay transparency and have not been included.
Furthermore, as a result of only having preference shares listed on the LSE, the Company is not required to make certain disclosures that are normally part of the continuing obligations of a premium listed company in the UK. However, a number of voluntary disclosures relating to remuneration have been presented in this Report. In addition, in 2013 the Company complied with the remuneration disclosure requirements in the Prudential Sourcebook for Banks, Building Societies and Investment Firms (see pages 197 to 200).
As required by the Companies Act 2006, a resolution to approve the Report will be proposed at the Annual General Meeting of the Company at which the financial statements will also be approved.
Membership of the Board Remuneration Oversight Committee
During the year, the Committee comprised the members set out in the table on page 178.
External consultants
In carrying out their responsibilities, the Committee seeks independent external advice as necessary and continued to retain the services of PwC during the year. The Committee appointed PwC as independent advisors in 2012, following a competitive tender process. PwC attended the majority of Committee meetings during 2013, providing independent commentary on matters under consideration by the Committee, supporting the approach to compliance with remuneration regulations, and providing updates on legislative requirements, best practice and market practice, appropriate to the remit of the Committee. PwC charge fees based on a time and materials basis and during 2013, the services provided during the financial year were limited to fees not exceeding £250,000 inclusive of VAT.
The Committee is comfortable that the PwC engagement partner and team provide objective and independent remuneration advice to the Committee and do not have any connections with the Company that may impair their independence. In addition to providing advice on executive remuneration, PwC provided advice in relation to various tax matters. However, the Committee was not involved in the recommendation of their appointment and is satisfied there is no conflict with their role as independent adviser to the Committee. PwC is a founding member of the Remuneration Consultants Group and voluntarily operates under the code of conduct in relation to executive remuneration consulting in the UK. The code of conduct can be found at www.remunerationconsultinggroup.com. In addition to the use of PwC as independent consultants, the Committee is also supported by the People & Talent Director, Head of Reward, Chief Risk Management Officer, Director of Compliance, and Deputy Company Secretary who provide support and advice to the Committee, as required.
REMUNERATION POLICY
Role of the Board Remuneration Oversight Committee
The Committee operates according to formal Terms of Reference which are reviewed regularly in light of best practice and to take into account legal, regulatory and corporate governance developments.
The Committee is primarily responsible for overseeing and supervising the Banco Santander group’s policies and frameworks covering remuneration and reward as applied in, or devolved to, the UK. It provides governance and strategic input into the Company’s executive and employee remuneration and reward activities. No Director plays a part in any discussion about his or her own remuneration. The Committee’s full Terms of Reference are available on the Company’s website www.aboutsantander.co.uk.
Remuneration principles
The Company’s success depends upon the performance and commitment of talented employees. Our remuneration policies are designed to attract, retain and motivate high calibre individuals to deliver our business strategy and reinforce our values in the context of a clearly articulated risk appetite and a Company-wide framework, under which we apply a consistent approach to reward for all employees. The Committee will ensure that individual remuneration packages are structured to align rewards with the performance of the Company.
| | |
| 180 | | Santander UK plc Annual Report 2013 |
Governance
Directors’ Remuneration Reportcontinued
In this regard, our approach:
| • | | supports a strong performance-oriented culture, ensuring that individual reward and incentives are aligned with: |
| | (i) | the performance and behaviour of the individual; |
| | (ii) | the performance of the business; and |
| | (iii) | the interests of our stakeholders; |
| • | | ensures a competitive reward package that enables us to attract, retain and motivate our employees; |
| • | | encourages an appropriate mix of fixed and variable compensation based on a consideration of accountability and risk and to align remuneration with the Company’s overall risk framework and risk appetite. In addition, deferred remuneration is a significant part of the overall remuneration for the Company’s senior management and is subject to performance adjustment and application of malus in appropriate circumstances; and |
| • | | takes into account the pay and employment conditions of all our employees and we receive regular updates as to such matters as salary increases for the general employee population, Company-wide benefit provisions and overall spend on annual incentives. |
We set base salaries benchmarked to the median for our comparator group, while setting stretching goals for the annual bonus. A significant proportion of the total remuneration package is therefore variable and linked to corporate, business unit and individual performance as well as the Company’s risk appetite. The Committee reviews the performance targets regularly to ensure that they are both challenging and closely linked to the Company’s strategic priorities.
The Company operates remuneration principles that ensure:
| • | | all employees are paid by reference to the market rate; |
| • | | performance is measured and rewarded through a number of performance-related bonus and incentive schemes; |
| • | | Business unit performance measures are cascaded down through the organisation; |
| • | | the Company’s employment conditions reflect our values and are commensurate with a large company, including high standards of health and safety and equal opportunities; |
| • | | the Company operates share plans which are open to all employees including Executive Directors; and |
| • | | the Company offers benefits which are available to everyone. |
The Committee continues to keep under review the relationship of risk to remuneration. When determining remuneration practices, the Committee ensures that the value and elements of remuneration are aligned to the Company’s risk appetite. In 2013, the performance of the Company (for variable remuneration purposes) was measured by its Return on Risk Weighted Assets (‘RORWA’) in preference to the Return on Risk Adjusted Capital (‘RORAC’) metric used in 2012. This risk-adjusted measure was used in order to give preference to the RORWA and associated capital consumption. Further to this, and as in the previous year, for 2013 the Committee considered outcomes of the Company’s Enterprise-wide Risk Review.
Remuneration strategy
We seek to provide incentives for improving the underlying drivers of performance, delivering sustainable value for all our stakeholders, including our staff, customers, fixed income investors, shareholders and the communities in which we serve. We operate in a very competitive and dynamic environment. Our success is highly dependent on the talents of all our employees, but particularly the senior management team, to deliver our ambitious objectives.
Our success is predicated on the abilities of a strong management team across all levels and locations of the business. Motivating and incentivising this team to deliver sustainable long-term performance is fundamental to our ongoing success. During 2013, we continued to make significant investments in our business to ensure a strong platform for future sustained growth. We continued our efforts to build a corporate culture based around the customer and customer service. Investments in recruitment and training programmes as well as our complaints handling model in branches and contact centres, were reflected in improvements in both external and internal measures of customer satisfaction.
We strongly believe that our incentives should support the continued growth and strengthening of our returns from across our customer-facing businesses and that all our staff should share in the success of the business.
Remuneration structure
The Company’s remuneration policies are designed to encourage a high-performance culture where people are rewarded and recognised for their performance and ability and the impact they have on the Company’s success. Our reward package is made up of a number of elements, built around fixed and variable pay as well as a comprehensive benefits package. Reward processes are underpinned by a robust performance management system which drives appropriate behaviours in line with the Company’s values: Commitment, Innovation, Teamwork and Excellence. The Company’s performance management process forms the basis of measuring the performance of individuals, which impacts in turn the extent to which variable pay awards are made. The size and weighting of the various reward elements will differ, dependent upon the nature of an individual’s role to ensure that the package is competitive, relevant and performance enhancing.
| | |
| Santander UK plc Annual Report 2013 | | 181 |
Governance
Directors’ Remuneration Reportcontinued
Remuneration for the Executive Directors
Remuneration policy
Executive Director remuneration is designed to attract, retain and motivate executives of the calibre needed to deliver the Company’s business strategy. Individual remuneration packages are structured to align rewards with the performance of the Company and the interests of the stakeholders. The remuneration arrangements incorporate performance measures which link to the business strategy and the key performance indicators (as described in the Business Review), which are directed towards building sustainable value for all our stakeholders. The Committee considers pay and employment conditions of employees of the Company when determining directors’ remuneration for the relevant financial year. The Committee also reviews the pay policy and levels for executives below the Board which are considered when determining Executive Directors’ remuneration. No Director is involved in setting his/her own remuneration.
Executive Director remuneration is based on our remuneration principles generally and particularly:
| • | | salaries are set at a market median level by benchmarking against appropriate external comparators, taking into account the external business environment and the general level of increases applied across the Company; |
| • | | maintaining an appropriate balance of fixed and performance related pay which delivers over the short, medium and longer term, with the balance becoming more long-term and more highly performance-related with seniority; |
| • | | incentive plans are linked to stretching performance targets, covering a mix of financial and non-financial measures. The measures are reviewed to ensure that they do not drive unacceptable behaviours or encourage excessive risk taking; and |
| • | | the overall package should reflect market practice and take account of levels of remuneration elsewhere in Santander UK. |
Elements of package
The individual elements of the Executive Directors’ remuneration packages comprise fixed pay (base salary, pension and other benefits) and performance-related pay (consisting of annual incentives, deferred awards and long-term incentives).
The key elements of the remuneration package are summarised below. For 2014 year to date, the current policy remains unchanged.
Base salary
| | | | |
Purpose | | • | | The provision of a competitive core remuneration package of base salary and other benefits enables the Company to attract and retain skilled, high calibre executives to deliver its strategy. |
| | |
| | • | | The level of fixed pay aims to be sufficient so that inappropriate risk-taking is not encouraged. |
| | |
Operation | | • | | Base salaries of the Chief Executive Officer and the Executive Directors are reviewed annually, appropriately benchmarked against the top half of the FTSE 100 and with particular reference to the other major UK banks and reflect the role, job size and responsibility as well as performance and effectiveness of the individual. |
| | |
| | • | | Pay awards for the Executive Directors take account of prevailing market and economic conditions, governance trends and the approach to employee pay throughout the organisation. |
| | |
| | • | | The Committee will consider the results of the annual reviews and make its recommendations to the Company in advance of any change in base salaries taking effect. |
| | |
| | • | | Increases may be made to salary levels in certain circumstances as required, for example, to reflect an increase in scope of role or responsibility or performance in role. Ordinarily, salary increases will not exceed the average increase awarded to other employees in Santander UK. |
Annual bonus
| | | | |
Purpose | | • | | The annual bonus rewards good financial and non-financial performance, which supports the Company and relevant business area’s business strategy, and takes into account the Company’s risk appetite and personal contribution in a clear and transparent way. |
| | |
| | • | | To ensure the interests of the Company and its employees are aligned with those of the shareholders of Banco Santander, S.A., and all stakeholders, the vesting of deferred annual bonus awards is subject to continued employment (which may be terminated in the event of gross or serious misconduct) and Banco Santander, S.A. and the Company’s rules on performance adjustment. |
| | |
| | • | | The Remuneration Code requires at least 50% of variable remuneration of Code Staff to be paid in shares or other specific instruments. This requirement applies to both deferred and non-deferred variable remuneration, such that no more than 30% of non-deferred variable remuneration can be awarded up front in cash. |
| | |
Operation | | • | | For Executive Directors, participation is in the Banco Santander group’s annual bonus scheme for the global management population. |
| | |
| | • | | The bonus pool is calculated using performance metrics with a weighting of 30% for the Banco Santander group’s performance and 70% for local, i.e. Santander UK performance. Of the 30% for Banco Santander group, this comprises 20% for Banco Santander group net income and 10% for the Banco Santander group’s return on RORWA. Of the 70% for Santander UK, this comprises 55% for Santander UK’s net income and 15% for Santander UK’s RORWA. |
| | |
| | • | | At Banco Santander group level, the performance metrics are subject to adjustment on two counts: i) benchmarking against appropriate external comparators (-15% to +10%); and ii) quantitative and qualitative measures as regards risk, balance sheet and other quality standards (-15% to +10%). |
| | |
| | • | | At Company level, the performance metrics are subject to adjustment on three counts: i) benchmarking against appropriate external comparators (-15% to +10%); ii) quantitative and qualitative measures as regards risk, balance sheet and other quality standards (-15% to +10%); as well as iii) contribution to Banco Santander group performance (-10% to +15%). |
| | |
| | • | | We have risk adjustment through RORWA at both a Banco Santander group and Company level and the proportion of variable pay ‘at risk’ of adjustment for this key metric in 2013 was 25% (2012: 25%, 2011: 15%). |
| | |
| 182 | | Santander UK plc Annual Report 2013 |
Governance
Directors’ Remuneration Reportcontinued
| | | | | | |
Operation | | • | | The bonus pool for awards related to 2013 was, for the first time, subject to a Customer Service ‘Gateway’ using the Financial Research Survey (‘FRS’) as a measure. The bonus pool would have been reduced by up to 50% if the FRS threshold was not met. However, the target was met resulting in no downward adjustment. |
| | |
| | • | | Once the pool has been calculated, the Committee considers the Enterprise-Wide Risk Review which includes an assessment of all financial and non-financial risks taken in the UK, and performance against risk targets. Based upon this review, the Committee will then have the ability to apply a downwards adjustment of up to 100% of the calculated bonus pool. There can be no upside adjustment. For the 2013 performance year, there was no further adjustment to the bonus pool as a result of the Enterprise Wide Risk Review. |
| | |
| | • | | Other adjustments are designed to take into account current and future market risk in relation to profit/loss calculations. The ICAAP considers stress tests across various types of risk. Additionally, the Economic Capital Budget set for RORWA purposes takes into account future levels of risk that may arise out of either business growth or deterioration in risk quality. The forecasts used here are aligned to the Company’s ICAAP and stress testing. Additionally, individual performance metrics take account of all risk types. |
| | |
| | • | | Once the bonus pool has been agreed, individual awards are then assessed against individual performance. In terms of the Executive Directors, behaviour metrics are used as part of the performance assessment process to ensure that the individual is focused on both short and long term strategy. |
| | |
| | • | | The Company ensures that it is compliant in its mandatory deferral requirements for its employees classified as Code Staff (which includes all Executive Directors). The amount of bonus to be deferred is based on the total variable pay received. The Remuneration Code prescribes that at least 40% of variable pay must be made over a period of at least three years and, for staff earning more than £500,000 in variable remuneration, at least 60% of a bonus must be deferred over the same period. Santander UK meets these requirements. However, all UK bonus awards are subject to deferral principles that have been set at the Banco Santander group level. Such principles, as applied to the Company, are subject to ratification by the Committee and can be overridden by UK national requirements to meet any criteria set by the FCA or other regulator/law. However, the general deferral principles are as follows: |
| | | |
| | | | • | | a proportion of an individual’s bonus (on a sliding scale) will become subject to deferral if the bonus exceeds certain levels depending on the nature of the role; |
| | | |
| | | | • | | any deferred amount will be issued in shares over a three year period (in three equal deferral tranches); and |
| | | |
| | | | • | | deferrals are subject to continued employment with the Banco Santander group in the UK and on the condition that none of the prescribed circumstances of forfeiture occur. |
| | |
| | • | | Under Banco Santander group-wide rules, any individual annual bonus award over euro 300,000, is subject to mandatory deferral of part of the award on an incremental sliding scale with the balance paid in shares. These shares are released in equal tranches over a three year period. The shares are subject to potential further adjustment (‘malus’) conditions and executives are normally required to remain in employment during the three year vesting period. |
| | |
| | • | | The Company will prevent vesting of all or part of the amount of deferred remuneration in any of the following circumstances: |
| | |
| | • | | evidence of employee misbehaviour or material error; |
| | |
| | • | | material downturn in the Company or relevant business unit’s performance; |
| | |
| | • | | the Company or relevant business unit suffers a material failure of risk management; |
| | |
| | • | | significant changes in the Banco Santander group’s or the Company’s economic or regulatory capital base and the qualitative assessment of risks; or |
| | |
| | • | | a material restatement of the Banco Santander group’s or the Company’s financial statements (except when required due to modification of the accounting rules). |
| | |
| | • | | In such circumstances, the Committee will have final discretion to determine the amount of deferred remuneration that will not vest or extinguish an award altogether, following recommendations from Banco Santander, S.A.’s Committee for Evaluation of Risk & Remuneration. |
| | |
| | • | | The Committee is satisfied that the performance targets continue to be sufficiently stretching and promote the Company’s business strategy. It is also satisfied that the arrangements for deferring a proportion of variable pay and ensuring unvested awards are subject to performance adjustment and are appropriate to support a performance culture where employees recognise the importance of sustainable performance. |
| | |
| | • | | In 2013, the Company complied in full with the Remuneration Code requirements for paying at least 50% of variable remuneration of Code Staff in shares or other specific instruments and pays the non-deferred element of annual bonus as 50% in cash and 50% in shares or share-linked instruments. The necessary approvals from Banco Santander S.A. shareholders having been obtained. |
| | |
| | • | | The bonus structure will remain the same for the coming year. |
Long-term incentives
| | | | |
Purpose | | • | | Banco Santander, S.A. has previously operated a Long-Term Incentive Plan (‘LTIP’) for its senior executives and other nominated employees not classified as Code Staff across the Banco Santander group, including participants from Santander UK. The LTIP aligns the interests of the Banco Santander group’s senior management and shareholders through building a long-term shareholding in the Banco Santander group. The LTIP reinforces the alignment of Santander UK’s employees in achieving the common objectives of the Banco Santander group and the creation of value over the long term. The LTIP also acts as a retention tool. |
| | |
| | • | | In 2013, the Company introduced a UK-only cash-based incentive plan for senior management and other nominated employees not classified as Code Staff: the Santander UK Cash Incentive Plan (“the UK Incentive Plan”). The UK Incentive Plan focuses on delivering the Company’s growth aligned to its strategic objectives. The UK Incentive Plan also helps to ensure the Company retains a competitive reward proposition as well as retaining key employees vital to the Company’s success. The Executive Directors, as they are classified as Code Staff, will not participate in the UK Incentive Plan. |
| | |
| Santander UK plc Annual Report 2013 | | 183 |
Governance
Directors’ Remuneration Reportcontinued
| | | | |
Operation | | • | | The LTIP has been the primary form of equity-based incentive for the past six years. No new awards were granted under the LTIP in 2013 or in 2012 as a result of a review by Banco Santander, S.A. as to how it rewards and retains the senior management across all its operating companies globally. Awards granted prior to 2012 are conditional on certain performance criteria. From 1 July 2011, the eligibility criteria of the LTIP changed. Under the LTIP granted on 1 July 2011, only Key Management Personnel (as defined in Note 43) and other nominated individuals who were not Code Staff were granted conditional awards of shares in Banco Santander, S.A.. Instead, for Code Staff, an amount equivalent to the target value of the LTIP for 2010 was included in the cash bonus target level for 2011 and as such is subject to financial, non-financial and risk-based performance measures and deferral as determined by the Remuneration Code. This arrangement was devised in response to discussions between Banco Santander, S.A. and the Bank of Spain. |
| | |
| | • | | The performance measures and rules of the LTIP have been reviewed on an annual basis and approved at Banco Santander, S.A.’s Annual General Meeting. Participants in each annual cycle of the LTIP are granted conditional awards of shares in Banco Santander, S.A. based on performance measured against stretching targets over a three year period. The number of unconditional shares a participant actually receives depends on the performance of Banco Santander, S.A. against the performance criteria measured after the completion of the performance period. Awards are settled in shares for the Company’s Executive Directors. |
| | |
| | • | | For LTIP awards that could have vested in the year ended 31 December 2013, 100% of the award was measured against Banco Santander, S.A.’s Total Shareholder Return (‘TSR’) over the same period relative to the companies comprising the TSR comparator group at the start of the period. TSR is the aggregate of share price growth and dividends paid (assuming reinvestment of those dividends in Banco Santander, S.A.’s shares during the three-year performance period). |
| | |
| | • | | For the UK Incentive Plan, the following three performance measures, equally weighted, will be used based on the Company’s future growth and business plans: i) Return on Tangible Equity (‘RoTE’): 20% vesting if RoTE hits threshold with 100% vesting at stretch target; vesting on a straight-line sliding scale for performance between these levels; ii) Cost-to-income ratio: 20% vesting if the cost-to-income ratio hits threshold with 100% vesting at stretch target; vesting on a straight-line sliding scale for performance between these levels; and iii) Customer satisfaction: 20% vesting if the level hits threshold with 100% vesting at stretch target; vesting on a straight line sliding scale for performance between these levels. |
| | |
| | • | | For each performance measure for the UK Incentive Plan a minimum, target and maximum performance target will be established. Actual performance against the targets that are set will then determine the amount of the award an individual will actually receive at the end of the performance period. |
Pension or cash allowance
| | | | |
Purpose | | • | | Pension arrangements reward sustained contribution and encourage retention as well as encouraging savings for retirement. |
| | |
Operation | | • | | Incoming Executive Directors are invited to participate in the Company’s defined contribution pension scheme and are given a fixed salary supplement (calculated as a percentage of base salary, which is excluded from any bonus calculation), in lieu of any other level of employer pension contributions. |
| | |
| | • | | The Company’s policy is not to offer defined benefit arrangements to new employees at any level (save where required by applicable legislation). |
| | |
| | • | | Ana Botín and José María Nus do not receive any pension benefits from the Company. Both are accruing entitlement to benefits under arrangements with Banco Santander, S.A. that existed prior to their appointment as Executive Directors of the Company. |
| | |
| | • | | Steve Pateman and Stephen Jones each receive a supplement equal to 35% of their basic salaries in lieu of pension. |
Benefits
| | | | |
Purpose | | • | | Benefits are offered to Executive Directors as part of a competitive remuneration package. |
| | |
Operation | | • | | These comprise private medical insurance for Executive Directors and their dependants, life assurance and health screening. Executive Directors are also eligible to participate in the Company’s all-employee share schemes on the same terms as all UK employees. |
| | |
| | • | | The benefit structure will remain the same for the coming year. |
The Company recognises that Executive Directors may be invited to become Non-Executive Directors of other companies and that this can help broaden the skills and experience of a Director. Executive Directors are permitted to accept external appointments with the approval of the Board. On 18 July 2013, Ana Botín was appointed a Non-Executive Director of The Coca-Cola Company and she retained fees for the year of US$30,000. In addition to the retained fees in respect of the 2013 financial year, Ana Botín also received deferred stock units in The Coca-Cola Company valued at US$120,000, which are required to be retained until after she retires from the Board of The Coca-Cola Company.
Executive Directors’ remuneration packages
No Executive Director received a salary increase in 2013.
Executive Directors’ service terms
The Executive Directors have served on the Board for the periods shown below at 31 December 2013:
| | | | |
Name of Director | | Date of appointment | | Length of Board service |
Ana Botín | | 1 December 2010 | | 3 years 1 month |
José María Nus | | 17 March 2011 | | 2 years 9 months |
Steve Pateman | | 1 June 2011 | | 2 years 7 months |
Stephen Jones | | 6 March 2012 | | 1 year 10 months |
| | | | |
| | |
| 184 | | Santander UK plc Annual Report 2013 |
Governance
Directors’ Remuneration Reportcontinued
Shareholding requirements
The Company’s Executive Directors and other senior managers are not required to build a significant shareholding in the shares of Banco Santander, S.A. as a result of their employment by the Company.
Employee Engagement
In considering matters relating to Executive Director/senior manager remuneration, the Company, through the Committee, will continue to be mindful of the interests of the Company’s stakeholders. In particular, the Committee pays close attention to the pay and conditions of all our employees. The Committee is kept informed on a regular basis on:
| • | | Salary increases for the general employee population; |
| • | | Santander UK group -wide benefit provisions; and |
| • | | Overall spend on annual incentives. |
Whilst the Company does not directly consult with employees as part of the process of reviewing executive pay, the Committee does receive updates and feedback from the Company’s engagement with its recognised trade unions on matters relating to pay and benefits for all employees across the Company and takes that into account. In addition, the Company has an established framework for consultation and dialogue with its recognised trade unions. The Company holds regular Joint Consultative and Negotiating Committee meetings to enable collaborative working and ensure that communication is open and two-way, particularly as regards terms as to remuneration and benefits across the Company.
The pay agreement reached in the first quarter of 2013 with the Company’s recognised trade unions included an award worth 2.4% for a successful performer at the mid-point of the relevant salary range. In addition, the 2013 pay matrix again reinforced the link between performance and reward and benefited colleagues who were lower in the salary range.
Risk and performance adjustment
In recent years, the Company has striven to ensure the correct alignment of its remuneration policies and procedures with the Company’s management and control of risk (in accordance with its risk framework and risk appetite). Following the approval by the Board of an enhanced Risk Framework in 2012, and the roll out of the Risk Framework across the Company in 2013, the Committee ensures that appropriate weight is placed on risk when considering remuneration matters. Particularly as conduct risk has been significant for Santander UK in prior years, it has been critical to ensure that variable remuneration practices, particularly incentive schemes, do not encourage or reward the wrong outcomes for the Company’s customers, shareholders and employees. The Committee reviews material risk events as part of its determination of variable pay. Consideration is given to whether adjustment should apply to unvested remuneration and whether malus should apply to any deferred remuneration.
In order to support a strong performance-oriented culture, variable remuneration awards are made after a risk-adjusted view of both financial and non-financial performance. Appropriate adjustment to variable pay can be made should conduct be identified in thematic, group or individual circumstances that are detrimental to the Company’s objectives and desired outcomes. Appropriate circumstances for adjustment can include (but are not limited to) employee misconduct, material downturn in performance, a material failure of risk management, significant changes in the economic or regulatory capital base and the qualitative assessment of risks or a material restatement of the financial statements.
REMUNERATION IMPLEMENTATION
Aggregate Directors’ remuneration
The total aggregate remuneration received by the Directors of the Company in 2013 and 2012 is detailed on page 191 of the Directors’ Report.
Executive Directors’ remuneration
The table below sets out the single total figure of remuneration of each Executive Director for the years ended 31 December 2013 and 2012.
| | | | | | | | | | | | | | | | | | | | | | | | | | | | | | | | | | | | | | | | |
| | | Salary and fees | | | Other Benefits(1) | | | Performance related
payments (Paid and
Deferred) (2) (3) | | | Pension
Allowance | | | Total | |
| | | 2013
£’000 | | | 2012
£’000 | | | 2013
£’000 | | | 2012
£’000 | | | 2013
£’000 | | | 2012
£’000 | | | 2013
£’000 | | | 2012
£’000 | | | 2013
£’000 | | | 2012
£’000 | |
Ana Botín | | | 1,978 | | | | 2,093 | | | | 52 | | | | 43 | | | | 1,878 | | | | 1,821 | | | | — | | | | — | | | | 3,908 | | | | 3,957 | |
José María Nus | | | 1,122 | | | | 1,137 | | | | 10 | | | | 8 | | | | 563 | | | | 650 | | | | — | | | | — | | | | 1,695 | | | | 1,795 | |
Steve Pateman | | | 625 | | | | 600 | | | | 1 | | | | 1 | | | | 1,324 | | | | 1,127 | | | | 219 | | | | 210 | | | | 2,169 | | | | 1,938 | |
Stephen Jones(4) | | | 525 | | | | 438 | | | | 1 | | | | 1 | | | | 1,034 | | | | 667 | | | | 184 | | | | 153 | | | | 1,744 | | | | 1,259 | |
| | | | | | | | | | | | | | | | | | | | | | | | | | | | | | | | | | | | | | | | |
Total | | | 4,250 | | | | 4,268 | | | | 64 | | | | 53 | | | | 4,799 | | | | 4,265 | | | | 403 | | | | 363 | | | | 9,516 | | | | 8,949 | |
| | | | | | | | | | | | | | | | | | | | | | | | | | | | | | | | | | | | | | | | |
| (1) | Other benefits comprise cash and non-cash benefits. |
| (2) | In line with the Remuneration Code, a proportion of the performance-related payment was deferred. Further details can be found in “Further Remuneration Disclosures” and in Note 44 to the Consolidated Financial Statements. |
| (3) | See the Remuneration Policy for details of how the Bonus outcomes were determined. |
| (4) | The remuneration figure for Stephen Jones does not include £1,333,842 related to a buy-out of deferred performance-related payments in respect of his previous employment as this is not in relation to his qualifying services as a director of the Company and has been excluded from the Executive Directors’ remuneration. |
These totals exclude emoluments received by Directors in respect of their primary duties as directors or officers of Banco Santander, S.A. in respect of which no apportionment has been made. No Directors participate in the Company’s Defined Benefit pension scheme.
| | |
| Santander UK plc Annual Report 2013 | | 185 |
Governance
Directors’ Remuneration Reportcontinued
Changes to the Board in 2014
Nathan Bostock
Nathan Bostock will join the Board as Executive Director and Deputy CEO to Ana Botín. His annual salary will be determined prior to his joining date, which is still to be confirmed. However, he will be entitled to participate in the same benefit and incentive schemes as the current Executive Directors.
Relative importance of spend on pay
The following table sets out the amounts and percentage change in profit on continuing operations before tax and total employee costs for the years ended 31 December 2013 and 2012. Profit on continuing operations before tax is shown as this is an important indicator of performance. The amounts have been extracted from the Santander UK group’s consolidated financial statements.
| | | | | | | | | | | | |
| | | 2013
£m | | | 2012
£m | | | Change
% | |
Profit on continuing operations before tax | | | 1,139 | | | | 1,147 | | | | (1 | ) |
Total employee costs | | | 978 | | | | 991 | | | | (1 | ) |
Consolidated profit before tax is shown as this is a key performance indicator for the Company. The figures shown in the table are extracted from the Company’s financial statements. The amounts for Company total employee costs include employer national insurance contributions.
CEO and employee remuneration
The average remuneration of all employees was +0.99% for the year ended 31 December 2013 compared to the previous year. This compares to -1.24% for CEO remuneration.
Exit payments
No Executive Directors left the Company during the year ended 31 December 2013 and therefore no payments for compensation for loss of office were paid to, or receivable by, any Director. Certain past directors receive ex-gratia pensions as set out in Note 43 to the Consolidated Financial Statements.
The Chair and Non-Executive Directors
The Chair and Non-Executive Directors’ remuneration
The table below sets out the single total amounts of remuneration for the Chair and each Non-Executive Director for the years ended 31 December 2013 and 2012.
| | | | | | | | |
| | | Total remuneration | |
| | | 2013
£’000 | | | 2012
£’000 | |
Chair | | | | | | | | |
Lord Burns | | | 625 | | | | 573 | |
Non-Executive Directors | | | | | | | | |
Roy Brown | | | 183 | | | | 166 | |
José María Carballo | | | 150 | | | | 133 | |
Antonio Escámez | | | — | | | | — | |
Bruce Carnegie-Brown | | | 190 | | | | 38 | |
José María Fuster | | | — | | | | — | |
Juan Rodríguez Inciarte | | | — | | | | — | |
Rosemary Thorne | | | 190 | | | | 206 | |
Mike Amato (appointed 1 August 2013) | | | 65 | | | | — | |
Alain Dromer (appointed 1 October 2013) | | | 23 | | | | — | |
Scott Wheway (appointed 1 October 2013) | | | 23 | | | | — | |
Manuel Soto (appointed 1 November 2013) | | | 18 | | | | — | |
| | | | | | | | |
Total | | | 1,467 | | | | 1,116 | |
| | | | | | | | |
| | |
| 186 | | Santander UK plc Annual Report 2013 |
Governance
Directors’ Remuneration Reportcontinued
These totals exclude emoluments received by Directors in respect of their primary duties as directors or officers of Banco Santander, S.A. in respect of which no apportionment has been made.
The Chair and all Non-Executive Directors serve under letters of appointment and either party can terminate on three months’ written notice, except in the case of the Chair where 12 months’ written notice is required. Their remuneration is determined by the Board within the limits set by the Articles of Association and is based on information on fees paid in similar companies, and the skills and expected time commitment of the individual concerned. Neither the Chair nor the Non-Executive Directors have the right to compensation on the early termination of their appointment beyond payment in lieu of notice at the option of the Company.
At 31 December 2013, the fee structure for Board and Board Committee members (other than Antonio Escámez, José María Fuster and Juan Rodríguez Inciarte, who do not receive any remuneration for their services to the Company) is shown in the table below:
| | | | | | | | | | | | | | | | | | | | |
Fees | | Board
£’000 | | | Board Audit
Committee
£’000 | | | Board Risk
Committee
£’000 | | | Board Remuneration
Oversight Committee
£’000 | | | Board Nomination
Committee
£’000 | |
Chair (inclusive of membership fee) | | | 625 | | | | 60 | | | | 60 | | | | 40 | | | | — | |
Member | | | 80 | | | | 25 | | | | 25 | | | | 20 | | | | 10 | |
These totals exclude emoluments received by Directors in respect of their primary duties as directors or officers of Banco Santander, S.A. in respect of which no apportionment has been made.
Chair
The fee for the Chair is reviewed by the Board Remuneration Oversight Committee. During 2013, the Chair’s fee was not increased. The Chair has a letter of engagement. Following his initial term of office, it was mutually agreed that his term of office be extended indefinitely. Instead, his appointment is terminable without compensation on twelve months’ notice from either side. The Chair is not eligible for pension scheme membership, bonus or incentive arrangements. He is entitled to the provision of an office, secretary and chauffeur-driven car.
Non-Executive Directors
The fees for the Non-Executive Directors are reviewed by the Board Nomination Committee and determined by the Board. The current level of fees were increased with effect from 1 October 2013 after a review of comparator benchmark data with appropriate changes made recognising the need to remunerate Non-Executive Directors serving on the Board Nomination Committee, in line with peers. Non-Executive Directors are not eligible for pension scheme membership, bonus or incentive arrangements.
Long-Term Incentive Plan
In 2013 and 2012, no Directors were granted conditional awards of shares in Banco Santander, S.A. under the LTIP. Under the LTIPs granted in previous years, certain Executive Directors, Key Management Personnel (as defined in Note 43 to the Consolidated Financial Statements) and other nominated individuals were granted conditional awards of shares in Banco Santander, S.A. Further details can be found in Note 44 to the Consolidated Financial Statements.
Other Remuneration Disclosures
The remuneration of the eight highest paid senior executive officers is detailed below. Senior executive officers are defined as members of the Company’s Executive Committee (excluding Executive Directors).
| | | | | | | | | | | | | | | | | | | | | | | | | | | | | | | | |
| | | Individuals | |
| | | 1
£’000 | | | 2
£’000 | | | 3
£’000 | | | 4
£’000 | | | 5
£’000 | | | 6
£’000 | | | 7
£’000 | | | 8
£’000 | |
Fixed remuneration (including any non-cash and taxable benefits) | | | 733 | | | | 987 | | | | 619 | | | | 816 | | | | 836 | | | | 446 | | | | 727 | | | | 407 | |
Buy-out award(1) | | | — | | | | — | | | | — | | | | — | | | | — | | | | — | | | | — | | | | 756 | |
Variable remuneration (cash – paid) | | | 467 | | | | 272 | | | | 360 | | | | 269 | | | | 254 | | | | 316 | | | | 271 | | | | — | |
Variable remuneration (cash – deferred) | | | 700 | | | | 408 | | | | 540 | | | | 180 | | | | 170 | | | | 475 | | | | 181 | | | | — | |
| | | | | | | | | | | | | | | | | | | | | | | | | | | | | | | | |
2013 remuneration | | | 1,900 | | | | 1,667 | | | | 1,519 | | | | 1,265 | | | | 1,260 | | | | 1,237 | | | | 1,179 | | | | 1,163 | |
| | | | | | | | | | | | | | | | | | | | | | | | | | | | | | | | |
Long-Term Incentive Plan | | | — | | | | — | | | | — | | | | — | | | | — | | | | — | | | | — | | | | — | |
Severance award | | | — | | | | — | | | | — | | | | — | | | | — | | | | — | | | | — | | | | — | |
| (1) | Buy-out of deferred performance related payments in connection with previous employment. |
By Order of the Board Remuneration Oversight Committee
Roy Brown
26 February 2014
| | |
| Santander UK plc Annual Report 2013 | | 187 |
Governance
Directors’ Report
INTRODUCTION
The Directors have pleasure in submitting their report together with the financial statements for the year ended 31 December 2013. The information in the Directors’ Report is unaudited, except where marked as audited.
CORPORATE STRUCTURE
Santander UK is a wholly owned subsidiary of Banco Santander, S.A. The ordinary shares of the Company are not traded on the London Stock Exchange. Note 24 to the Consolidated Financial Statements provides a list of the principal subsidiaries of the Company, the nature of each subsidiary’s business and details of branches. Note 39 to the Consolidated Financial Statements provides details of the Company’s share capital.
The structural relationship of Santander UK with the Banco Santander group – the ‘subsidiary model’
The Banco Santander group operates a ‘subsidiary model’. This model involves autonomous units, such as Santander UK, operating in core markets, with each unit being responsible for its own liquidity, funding and capital management on an ongoing basis. The model is designed to minimise the risk to the Banco Santander group and all its units from problems arising elsewhere in the Banco Santander group. The subsidiary model means that Banco Santander, S.A. has no obligation to provide any liquidity, funding or capital assistance, although it enables Banco Santander, S.A. to take advantage selectively of opportunities. As a PRA regulated entity, Santander UK is expected to satisfy the PRA liquidity and capital requirements on a standalone basis.
Under the subsidiary model, Santander UK primarily generates funding and liquidity through UK retail and corporate deposits, as well as in the financial markets through its own debt programmes and facilities to support its business activities and liquidity requirements. It does this in reliance on the strength of its own balance sheet and profitability and its own network of investors. It does not rely on a guarantee from Banco Santander, S.A. or any other member of the Banco Santander group (other than certain of the Company’s own subsidiaries) to generate this funding or liquidity. Santander UK does not raise funds to finance other members of the Banco Santander group or guarantee the debts of other members of the Banco Santander group (other than certain of the Company’s own subsidiaries).
Exposures to other Banco Santander group members are established and managed on an arm’s length commercial basis. All intergroup transactions are monitored by the Santander UK Board Risk Committee and transactions which are not in the ordinary course of business must be pre-approved by the Board. In addition, Santander UK is subject to PRA limits on exposures to, and on liquidity provided to, other members of the Banco Santander group.
The subsidiary model gives Santander UK considerable financial flexibility, yet enables it to continue to take advantage of the significant synergies and strengths that come from being part of the global Banco Santander group, in brand, products, systems, platforms, development capacity and management capability. In the subsidiary model, the Banco Santander group facilitates the sharing of best practice and provides common technology, operations and support services to all of its subsidiaries via independent operating entities, themselves established by the Banco Santander group so as to be able to continue operating as viable standalone businesses.
BUSINESS REVIEW
Details of Santander UK’s activities and business performance during 2013 are set out in the Strategic Report on pages 2 to 24 and the Detailed Business Review on pages 25 to 163.
RESULTS AND DIVIDENDS
The results of Santander UK are discussed above. The Directors do not recommend the payment of a final dividend for 2013 (2012: £nil). Two interim dividends were declared on the Company’s ordinary shares in issue during the year. The first of £215m was declared on 27 June 2013 and paid on 12 September 2013 and the second of £210m was declared on 17 December 2013 and is expected to be paid in March 2014. An interim dividend of £450m was declared in 2012 and paid in 2013.
EVENTS AFTER THE BALANCE SHEET DATE AND CHANGE IN CONTROL
With effect from 10 January 2014, Santander UK Group Holdings Limited, a subsidiary of Banco Santander, S.A. and Santusa Holding, S.L., became the beneficial owner of the entire issued ordinary share capital of the Company by virtue of a share exchange agreement between Santander UK Group Holdings Limited, Banco Santander, S.A. and Santusa Holding, S.L. This represented a change in control for Santander UK.
RESEARCH AND DEVELOPMENT
The Company has a comprehensive product approval process and policy and develops new products and services in each of its business divisions in the ordinary course of business. All new products, campaigns and business initiatives are reviewed and approved by the Company’s Product Approval and Oversight Committee.
| | |
| 188 | | Santander UK plc Annual Report 2013 |
Governance
Directors’ Reportcontinued
GOING CONCERN
The Directors confirm that they are satisfied that Santander UK has adequate resources to continue in business for the foreseeable future. For this reason, they continue to adopt a going concern basis of accounting in preparing the financial statements.
As outlined above, Santander UK’s business activities, together with the factors likely to affect its future development, performance and position are set out in the Chief Executive Officer’s Review on pages 8 to 11, the Chief Financial Officer’s Review on pages 12 to 14 and in the Group and Divisional Results on pages 25 to 38. The financial position of Santander UK, its cash flows, liquidity position and borrowing facilities are described in the Balance Sheet Review on pages 39 to 60. In addition, Note 47 to the Consolidated Financial Statements includes Santander UK’s objectives, policies and processes for managing its capital. As also outlined above, in respect of the principal risks and uncertainties facing Santander UK, financial risks are described in the Risk Management Report on pages 61 to 163, and material risk factors are described in the Risk Factors section on pages 317 to 334.
In assessing going concern, the Directors take account of all information of which they are aware about the future, which is at least, but is not limited to, 12 months from the date that the balance sheet is signed. This information includes Santander UK’s results forecasts and projections, estimated capital, funding and liquidity requirements, contingent liabilities, and possible economic, market and product developments, taking account of reasonably possible changes in trading performance.
Since the acquisition of the Company by Banco Santander, S.A., Santander UK has a history of profitable operations. Management prepares a 3-year plan (the ‘3-Year Plan’) that forecasts balance sheet, income and margin, by product, with a particular focus on the forthcoming year.
The 3-Year Plan, its assumptions, forecast results and key sensitivities are reviewed by senior management and presented to the Executive Committee, the Board and to senior executives of Banco Santander, S.A. The budget is reforecast frequently and reviewed by the Executive Committee and the Board. As part of the budget and planning process, a particular emphasis is placed on ensuring the sustainability of earnings, and achieving and maintaining a high level of operating efficiency in Santander UK to enable competitive products to be developed for customers.
To assess Santander UK’s ability to adapt to various market challenges, the budgets are “stress tested” as part of Santander UK’s ICAAP under Basel II and CRD IV. Several scenarios are modelled, including a severe scenario, and senior management makes an assessment of how this would affect Santander UK’s profit and funding plans. Quarterly ICAAP updates are prepared and reviewed by the Executive Risk Committee and the Capital Committee, with a summary of the findings sent to the Board. The quarterly ICAAP updates are sent to the PRA, and used by them in the Supervisory Review and Evaluation Process.
| • | | Borrowing requirements and liability management |
Santander UK’s financial plans are constructed to ensure that they allow Santander UK to meet its financial obligations as they fall due, both in respect of maturing existing liabilities and future borrowing requirements.
Santander UK’s funding requirements are met from a variety of sources, with a significant majority being sourced from customer deposits (i.e. retail and corporate deposits). The balance of Santander UK’s funding is sourced from the wholesale markets with reference to prevailing and expected market conditions and the desired balance sheet structure. The Board considers it appropriate to balance cost effective short-term financing with medium and long-term funds, which have less refinancing risk, within the context of maintaining a diverse range of sources of wholesale funding.
Financial Management & Investor Relations produce strategic and tactical funding plans as part of Santander UK’s planning process. These funding plans are approved by the Board and the Asset and Liability Committee and are controlled on a day-to-day basis by the Finance Director and are based on the Risk Framework. The plans are stressed (including potential outflows arising from credit rating downgrades) to ensure adverse conditions can be accommodated via a range of management levers. Funding and liquidity management is the responsibility of the Finance Director who delegates day-to-day responsibility to the Director, Asset and Liability Management; the Director, Funding & Collateral Management and the Head of Short Term Markets. Liquidity risk control and oversight are provided by the Chief Risk Officer, supported by the Risk Division. See the Risk Management Report for further details on liquidity risk management.
The Directors, via the Board Audit Committee, also consider Santander UK’s exposure to contingent liabilities. This consideration addresses contingent liabilities experienced by Santander UK in the past, such as legal proceedings, guarantees, operating lease commitments, customer remediation liabilities, tax contingencies, and those arising in respect of the UK Financial Services Compensation Scheme, but also addresses whether there are any new contingencies. Contingent liabilities are captured on a timely basis for purposes of disclosure in the Annual Report and the Half-Yearly Financial Report.
Non-trading guarantees require the approval of the Chief Executive Officer or the Chief Financial Officer or, in their absence, any two Company Executive Directors or one Company Executive Director and the Company Secretary & General Counsel. This provision forms part of the Company’s Corporate Governance Framework (other Financial Delegated Authorities).
The Directors review information about the major aspects of the economic environment within which Santander UK operates at Board meetings. This information includes an update which contains data on key economic and market trends. In addition, Santander UK’s Economic Analysis team monitors and provides information to the Board on current and prospective economic and market developments. Retail financial markets, such as the housing market, are a major focus for analysing current trends and potential developments. The Directors also receive regular briefings on market share for Santander UK’s major products and quarterly competitor analyses. Wholesale market conditions are reviewed daily by the Finance Director and an update presented on a monthly basis to the Asset and Liability Committee. Executive Directors receive a daily report detailing key wholesale indicators and product flows. The funding plans are updated, if necessary, with reference to current and expected market conditions.
| | |
| Santander UK plc Annual Report 2013 | | 189 |
Governance
Directors’ Reportcontinued
Santander UK’s risk management focuses on major areas of risk, as described in the Risk Management Report, which also sets out in detail how Santander UK manages these risks. With respect to the eurozone, Santander UK’s exposure to eurozone sovereign debt is insignificant. See the ‘Country Risk Exposure’ section of the Risk Management Report for further information on country risk exposures, consisting of sovereign debt exposures, other country risk exposures and balances with other Banco Santander group companies.
The Directors also consider the ability of Santander UK to take effective action to alter the amounts and timing of cash flows so that it can respond to unexpected needs or opportunities. Such financial adaptability mitigates the areas of financial risk as set out on page 189 above in considering the appropriateness of the going concern presumption in relation to Santander UK. In determining the financial adaptability of Santander UK, the Directors have considered the ability of Santander UK to:
| | • | | Obtain new sources of finance |
Santander UK minimises refinancing risk by sourcing funds from a variety of markets as appropriate and subject to consideration of the appropriate leverage ratio and funding mix for Santander UK, and in particular customer deposit levels and medium-term funding. Santander UK actively manages its relationships with existing providers of funding and considers new sources of funds as and when they arise.
Day-to-day sources of finance consist primarily of retail deposits. To the extent that wholesale funding is required, a variety of sources are usually available from a range of markets, including:
| | • | | Money markets: both unsecured (including interbank and customer deposits, and issuances of certificates of deposit and commercial paper) and secured (including repos in open market operations); |
| | • | | Debt capital markets (including discrete bond issues and medium term notes); |
| | • | | Mortgage-backed funding (including securitisation and covered bond issuance); and |
| | • | | Capital instruments (although primarily issued to maintain capital ratios). |
In addition to day-to-day funding sources, Santander UK has access to contingent sources from central banks, including the Bank of England, the US Federal Reserve and the Swiss National Bank. Santander UK ensures that it has access to these contingent facilities as part of its prudent liquidity risk management. See the Risk Management Report for further details on liquidity and funding risk management. Santander UK minimises reliance on any one market by maintaining a diverse funding base, and avoiding concentrations by maturity, currency and institutional type.
| | • | | Obtain financial support from other Banco Santander group companies |
For capital, funding and liquidity purposes, Santander UK operates on a stand-alone basis, as described on page 188. However, in case of stress conditions, it would consult with its ultimate parent company, Banco Santander, S.A. about financial support.
| | • | | Continue business by making limited reductions in the level of operations or by making use of alternative resources |
Santander UK maintains, within its Recovery and Resolution Plan, contingency funding plans to cover potential extreme scenarios. These plans include the maintenance of specific management actions that can be executed in the event of a stress to rapidly raise funds. These actions are updated on a monthly basis.
After making enquiries, the Directors have a reasonable expectation that the Company and Santander UK have adequate resources to continue in operational existence for the foreseeable future.
RISK MANAGEMENT
The Board and its Committees are responsible for ensuring the effectiveness of management’s system of risk management and internal controls. Details of Santander UK’s risk framework and system of internal controls for risk management can be found in the Risk Management Report on pages 61 to 163.
| | |
| 190 | | Santander UK plc Annual Report 2013 |
Governance
Directors’ Reportcontinued
DIRECTORS
The members of the Company’s Board at 31 December 2013 are named on pages 165 to 168. For each Director, the date of appointment is shown. At 31 December 2013 and the date of this report, the Board comprised a Chair, four Executive Directors including the Chief Executive Officer, and eleven Non-Executive Directors.
All Directors are appointed in accordance with the Company’s Articles of Association and the Companies Act and related legislation. All Non-Executive Directors, including the Chair, serve under letters of appointment and either party can terminate on three months’ written notice, except in the case of the Chair where 12 months’ written notice is required. When they were appointed, the appointments of Ana Botín, Juan Rodríguez Inciarte, José María Fuster, José María Carballo, José María Nus, Antonio Escámez and Manuel Soto were all proposed by Banco Santander, S.A. The Company may pay an Executive Director instead of requiring them to work during their notice period. The details of their emoluments and interests can be found in the remuneration report on pages 182 to 187.
DIRECTORS’ REMUNERATION (audited)
The aggregate remuneration received by the Directors of the Company in 2013 and 2012 was:
| | | | | | | | |
| | | 2013
£ | | | 2012
£ | |
Salaries and fees | | | 6,183,203 | | | | 5,799,704 | |
Performance-related payments(1) | | | 4,800,051 | | | | 4,265,082 | |
Other taxable benefits | | | — | | | | — | |
| | | | | | | | |
Total remuneration excluding pension contributions | | | 10,983,254 | | | | 10,064,786 | |
Pension contributions | | | — | | | | — | |
Compensation for loss of office | | | — | | | | — | |
| | | | | | | | |
| | | 10,983,254 | | | | 10,064,786 | |
| | | | | | | | |
In line with the Code, a proportion of the performance-related payment was deferred. Further details can be found in “Further Remuneration Disclosures” and in Note 44 to the Consolidated Financial Statements.
REMUNERATION OF HIGHEST PAID DIRECTOR (audited)
In 2013, the remuneration, excluding pension contributions, of the highest paid Director, was £3,907,783 (2012: £3,956,774) of which £1,878,379 (2012: £1,821,209) was performance related. There was no accrued pension benefit for the highest paid Director (2012: £nil), other than that accrued by, or treated to be accrued by a Spanish subsidiary of Banco Santander, S.A. No conditional award of shares was made to the highest paid Director under the LTIP during 2013.
RETIREMENT BENEFITS (audited)
Defined benefit pension schemes are provided to certain Santander UK employees. See Note 37 to the Consolidated Financial Statements for a description of the schemes and the related costs and obligations. No retirement benefits are accruing for any directors under a defined benefit scheme (2012: £nil) in respect of their qualifying services to Santander UK.
NON-EXECUTIVE DIRECTORS (audited)
Details of the fees paid to Non-Executive Directors in 2013 are contained in the Directors’ Remuneration Report on page 186.
DIRECTORS’ INTERESTS AND RELATED PARTY TRANSACTIONS (audited)
In 2013, loans were made to six Directors (2012: five Directors), with a principal amount of £61,883 outstanding at 31 December 2013 (2012: £304,286). In 2013, loans were made to eight members of Santander UK’s Key Management Personnel (2012: eleven), with a principal amount of £3,435,567 outstanding at 31 December 2013 (2012: £3,528,962). These loans were made in the ordinary course of Santander UK’s business, on normal terms and conditions. See Note 44 to the Consolidated Financial Statements for further information.
See Notes 43 and 44 to the Consolidated Financial Statements for disclosures of deposits and investments made by the Directors, Key Management Personnel and their connected persons with Santander UK at 31 December 2013. Note 44 to the Consolidated Financial Statements also includes details of other related party transactions.
In 2013 and 2012, there were no other transactions, arrangements or agreements with Santander UK in which Directors or Key Management Personnel or persons connected with them had a material interest. In addition, in 2013 and 2012, no Director had a material interest in any contract of significance other than a service contract with Santander UK at any time during the year.
In 2013 and 2012, no Director held any interest in the shares of any company within Santander UK at any time and no Director exercised or was granted any rights to subscribe for shares in any company within Santander UK. In addition, in 2013 and 2012, no Directors exercised share options over shares in Banco Santander, S.A., the parent company of the Company.
Santander UK engaged in certain transactions with its parent company, Banco Santander, S.A., and certain of its subsidiaries in the ordinary course of business. These transactions were made substantially on the same terms as for comparable transactions with third party counterparties. For a description of these transactions in 2013, 2012 and 2011, see Note 44 to the Consolidated Financial Statements.
| | |
| Santander UK plc Annual Report 2013 | | 191 |
Governance
Directors’ Reportcontinued
DIRECTORS’ INDEMNITIES
Indemnities are provided to the Directors of the Company, its subsidiaries and associated companies by the Company against liabilities and associated costs which they could incur in the course of their duties to the Company. A copy of each of the indemnities is kept at the registered address shown on page 335.
FINANCIAL INSTRUMENTS
The financial risk management objectives and policies of Santander UK; the policy for hedging each major type of forecasted transaction for which hedge accounting is used; and the exposure of Santander UK to credit risk, market risk, and funding and liquidity risk are outlined in the Risk Management Report.
PENSION SCHEMES
The assets of the pension schemes are held separately from those of Santander UK and are under the control of trustees.
Defined Contribution Pension schemes
Santander UK operates a number of defined contribution pension schemes. Since December 2009, the Santander Retirement Plan, an occupational defined contribution scheme has been the principal pension scheme into which eligible employees have been enrolled automatically. The assets of the Santander Retirement Plan are held in a separate trustee-administered fund. At 31 December 2013, there were 16,809 members in the Santander Retirement Plan, comprising 15,275 active members and 1,534 preserved members.
Defined Benefit Pension schemes
Santander UK also operates a number of defined benefit pension schemes, which are closed to new members. The principal pension scheme is the Santander (UK) Group Pension Scheme. The Santander (UK) Group Pension Scheme consists of seven separate actuarially-segregated sections and has a corporate trustee, Santander (UK) Group Pension Scheme Trustees Limited which, at 31 December 2013, had fourteen Directors, comprising seven Santander UK-appointed Directors and seven member-elected Directors.
At 31 December 2013, the assets of the Santander (UK) Group Pension Scheme were invested in the Santander (UK) Common Investment Fund which has a corporate trustee, Santander (CF Trustee) Limited comprising four Santander UK-appointed Directors and three Directors appointed by the Santander (UK) Group Pension Scheme Trustees Limited. Asset management of the Santander (UK) Common Investment Fund is delegated to a number of fund managers and the trustees receive independent professional advice on the performance of the managers. Legal advice to the trustees is provided by external firms of solicitors. The audits of the pension schemes are separate from that of Santander UK. Formal actuarial valuations of assets and liabilities of the defined benefit schemes are carried out on at least a triennial basis by independent professional qualified actuaries and valued for accounting purposes at each balance sheet date. In 2010, Santander UK and the trustees agreed scheme-specific funding targets, statement of funding principles, and schedule of contributions for the principal pension schemes. These agreements form the basis of Santander UK’s commitment that the sections have sufficient assets to make payments to members in respect of their accrued benefits as and when they fall due. The latest formal actuarial valuation for the Santander (UK) Group Pension scheme is being made as at 31 March 2013, and is due to be finalised by 30 June 2014. Further information is provided in Note 37 to the Consolidated Financial Statements.
EMPLOYEE INVOLVEMENT
Employee share ownership
Santander UK currently operates two all-employee, HMRC-approved share schemes: a Save-As-You-Earn (‘Sharesave’) Scheme and a Share Incentive Plan (‘SIP’), the latter of which allows employees to purchase Banco Santander, S.A. shares from gross salary. In addition, for certain eligible employees, arrangements remain outstanding under previous years’ grants under the Long-Term Incentive Plan, the closed Executive Share Option Scheme and the closed Alliance & Leicester SIP. Shares have also been granted to eligible employees in receipt of vested deferred bonus awards. All the share options and awards relate to shares in Banco Santander, S.A. See Note 42 to the Consolidated Financial Statements for a description of the plans and the related costs and obligations.
Communication
Santander UK wants to involve and inform employees on matters that affect them. The intranet is a focal point for communications with daily updates on what is happening across Santander UK, an online question and answer site and ‘The Village’ a site for staff to share information, ideas and best practice. On 1 November 2012, a new site was launched which connects staff to all the information they need about working for Santander UK in one easy to navigate place that is accessible from work and home. Santander UK also uses face-to-face communication, such as team meetings, regional road shows and annual staff conventions for strategic updates, as well as a quarterly online and print staff magazine with in-depth business features. All these channels are designed to keep employees fully informed of news and developments which may have an impact on them, and also to keep them up to date on financial, economic and other factors which affect Santander UK’s performance. Santander UK considers employees’ opinions and asks for their views on a range of issues through regular Company-wide surveys.
Consultation
Santander UK has a long history of trade union recognition governed by a partnership agreement with Advance, the independent trade union that it recognises to act as the voice of Santander UK employees. Within the former Alliance & Leicester parts of the business, Santander UK also works closely with its recognised independent trade union, the Communication Workers Union (‘CWU’). Advance and CWU are affiliated to the Trades Union Congress. Santander UK consults senior trade union officials on significant proposals within the business at both national and local levels. Santander UK holds regular Joint Consultative and Negotiating Committee meetings to enable collaborative working and ensure that communication is open and two-way.
| | |
| 192 | | Santander UK plc Annual Report 2013 |
Governance
Directors’ Reportcontinued
POLITICAL CONTRIBUTIONS
In 2013 and 2012, no contributions were made for political purposes and no political expenditure was incurred.
SUPPLIERS
Santander UK has a Cost Management & Procurement Policy and process that is enforced across all significant purchases from suppliers to provide a consistent approach. Checks are made that our suppliers act in an ethical and responsible way, as part of the supplier selection process and by requiring suppliers to adhere to Santander UK’s Corporate Social Responsibility Protocol, unless it is not relevant to the type of work being undertaken. The protocol covers human rights, labour standards, environment and anti-corruption and bribery, in line with the principles in the UN Global Compact.
MARKET VALUE OF LAND AND BUILDINGS
On the basis of a periodic review process, the estimated aggregate market value of Santander UK’s land and buildings was not significantly different from the fixed asset net book value of £1,064m (2012: £1,013m), as disclosed in Note 26 to the Consolidated Financial Statements.
CORPORATE SOCIAL RESPONSIBILITY (including carbon emissions)
For further details on Corporate Social Responsibility, including employee and environmental matters, see the Corporate Governance Review on pages 23 and 24 of the Strategic Report. The carbon emissions disclosure as set out on page 24 is incorporated by reference into the Directors’ Report.
CHARITABLE DONATIONS
Santander UK made total contributions to society during the year of £21,634,521 (2012: £19,465,444) predominantly supporting projects related to education, enterprise and employment. £8,450,000 (2012: £6,494,224) was contributed through the Santander Universities programme. Support for small businesses and social enterprises equated to £4,418,266 (2012: £5,729,370) through Santander Breakthrough and the Santander SEDA scheme. Donations of £5,828,173 (2012: £4,099,489) were made by the Santander Foundation to UK-registered charities. A further £2,938,082 (2012: £1,806,212) supported other employment, education and community projects.
EMPLOYEES
Our goal to be the best bank for our customers is only achievable if we reach our aspiration to be the best place to work for our employees. A workplace that provides excellent opportunities for career progression, and a culture that recognises individual needs and encourages accountability and teamwork are key to achieving this goal.
DISABILITY
Santander UK is committed to equality of access and quality of service for disabled people and embraces the spirit of the UK Equality Act 2010 throughout its business operations. Santander UK has processes in place to help train, develop, retain and promote employees with disabilities. It is committed to giving full and fair consideration to applications for employment made by disabled persons, and for continuing the employment of employees who have become disabled by arranging appropriate training and making reasonable adjustments within the workplace.
CODE OF CONDUCT
Santander UK is committed to maintaining high ethical standards – adhering to laws and regulations, conducting business in a responsible way and treating all stakeholders with honesty and integrity. These principles are further reflected in the Company’s new Code of Conduct which was communicated to all staff on 19 December 2013. The Code sets out the standards expected of all employees, and supports the Santander Way and the Company’s commitment to being simple, personal and fair.
Under their terms and conditions of employment, staff are required to act at all times with the highest standards of business conduct in order to protect Santander UK’s reputation and ensure a company culture which is free from any risk of corruption, compromise or conflicts of interest. Staff are also required to comply with all Company policies, including the Anti-Bribery and Corruption Policy.
These terms and conditions require that employees must:
| • | | Abide by all relevant laws and regulations; |
| • | | Act with integrity in all their business actions on Santander UK’s behalf; |
| • | | Not use their authority or office for personal gain; |
| • | | Conduct business relationships in a transparent manner; and |
| • | | Reject all improper practices or dealings they may be exposed to. |
| | |
| Santander UK plc Annual Report 2013 | | 193 |
Governance
Directors’ Reportcontinued
The SEC requires companies to disclose whether they have a code of ethics that applies to the Chief Executive Officer and senior financial officers that promotes honest and ethical conduct, full, fair, accurate, timely and understandable disclosures, compliance with applicable governmental laws, rules and regulations, prompt internal reporting violations and accountability for adherence to such a code of ethics. Santander UK meets these requirements through its new Code of Conduct (and previously the Banco Santander, S.A. General Code of Conduct), the Anti-Bribery and Corruption Policy, the Whistleblowing Policy, the FCA’s Principles for Business, and the FCA’s Principles and Code of Practice for Approved Persons, with which the Chief Executive Officer and senior financial officers must comply. These include requirements to manage conflicts of interest appropriately and to disclose any information the FCA may want to know about. Santander UK provides a copy of these documents to anyone, free of charge, on application to the address on page 335.
SUPERVISION AND REGULATION
Under the terms of the Financial Services Act (2012), the FSA was replaced by two regulatory bodies, the PRA, which has responsibility for the prudential regulation of deposit takers and insurance companies, and the FCA, which supervises the conduct of business, and seeks to improve outcomes for consumers.
Since the enactment of the changes, Santander UK is now authorised by the PRA and authorised and regulated by the FCA and is subject to UK financial services laws and regulations. The key regulatory requirements as related to its material risk factors (including supervision and regulatory risks and risks relating to taxation) are described in the Risk Factors section on pages 317 to 334.
Further details on the impact of regulatory developments on liquidity and capital can be found in the Risk Management Report on pages 61 to 163. While Santander UK operates primarily in the UK, it is also subject to the laws and regulations of the other jurisdictions in which it operates, such as the requirements of the SEC for its activities in the US.
DISCLOSURE CONTROLS AND PROCEDURES OVER FINANCIAL REPORTING
Santander UK has evaluated, with the participation of its Chief Executive Officer and Chief Financial Officer, the effectiveness of Santander UK’s disclosure controls and procedures at 31 December 2013. There are inherent limitations to the effectiveness of any system of disclosure controls and procedures, including the possibility of human error and the circumvention or overriding of the controls and procedures. Accordingly, even effective disclosure controls and procedures can only provide reasonable assurance of achieving their control objectives.
Based upon Santander UK’s evaluation, the Chief Executive Officer and the Chief Financial Officer have concluded that, at 31 December 2013, Santander UK disclosure controls and procedures were effective to provide reasonable assurance that information required to be disclosed by Santander UK in the reports that Santander UK files and submits under the US Securities Exchange Act of 1934 is recorded, processed, summarised and reported within the time periods specified in the applicable rules and forms, and that it is accumulated and communicated to Santander UK’s management, including the Chief Executive Officer and Chief Financial Officer, as appropriate, to allow timely decisions regarding disclosure.
CHANGES TO INTERNAL CONTROL OVER FINANCIAL REPORTING
There have been no material changes to management’s system of internal controls over financial reporting during the year.
MANAGEMENT’S REPORT ON INTERNAL CONTROL OVER FINANCIAL REPORTING
Internal control over financial reporting is a component of an overall system of internal control. Santander UK’s internal control over financial reporting is a process designed to provide reasonable assurance regarding the reliability of financial reporting, the preparation and fair presentation of financial statements for external purposes in accordance with International Financial Reporting Standards (‘IFRS’) as issued by the International Accounting Standards Board, and as endorsed by the European Union.
Santander UK’s internal control over financial reporting includes:
| • | | Policies and procedures that relate to the maintenance of records that fairly and accurately reflect the transactions and disposition of assets. |
| • | | Controls providing reasonable assurance that transactions are recorded as necessary to permit the preparation of financial statements in accordance with IFRS, and that receipts and expenditures are being made only as authorised by management. |
| • | | Controls providing reasonable assurance regarding prevention or timely detection of unauthorised acquisition, use or disposition of assets that could have a material effect on the financial statements. |
Because of its inherent limitations, internal control over financial reporting may not prevent or detect misstatements. In addition, projections of any evaluation of effectiveness to future periods are subject to the risk that controls may become inadequate because of changes in conditions or because the degree of compliance with policies or procedures may deteriorate.
Management is responsible for establishing and maintaining adequate internal control over the financial reporting of Santander UK. Management assessed the effectiveness of Santander UK’s internal control over financial reporting at 31 December 2013 based on the criteria established in the Internal Control - Integrated Framework issued by the Committee of Sponsoring Organizations of the Treadway Commission (1992) (‘COSO’). In May 2013, COSO issued the 2013 Internal Control – Integrated Framework (the ‘2013 Framework’). The 2013 Framework is expected to supersede the original Framework on 15 December 2014 and during this transitional period, companies may continue to rely on the original Framework as a basis of their internal control. Santander UK is continuing to use the original Framework and is currently evaluating the 2013 Framework.
Based on this assessment, management believes that, at 31 December 2013, Santander UK’s internal control over financial reporting was effective.
| | |
| 194 | | Santander UK plc Annual Report 2013 |
Governance
Directors’ Reportcontinued
RELEVANT AUDIT INFORMATION
Each of the Directors at the date of approval of this report confirms that:
| • | | So far as the Director is aware, there is no relevant audit information of which Santander UK’s auditor is unaware; and |
| • | | The Director has taken all steps that he/she ought to have taken as a Director to make himself/herself aware of any relevant audit information and to establish that Santander UK’s auditor is aware of that information. |
This confirmation is given and should be interpreted in accordance with the provisions of Section 418 of the UK Companies Act 2006.
BRITISH BANKERS’ ASSOCIATION CODE FOR FINANCIAL REPORTING DISCLOSURE
In September 2010, the British Bankers’ Association published a Code for Financial Reporting Disclosure. The Code sets out five disclosure principles, together with supporting guidance. The principles are that UK banks will: provide high quality, meaningful and decision-useful disclosures; review and enhance their financial instrument disclosures for key areas of interest to market participants; assess the applicability and relevance of good practice recommendations to their disclosures acknowledging the importance of such guidance; seek to enhance the comparability of financial statement disclosures across the UK banking sector; and clearly differentiate in their annual reports between information that is audited and information that is unaudited.
Santander UK and other major UK banks voluntarily adopted the Code in their 2013 and 2012 financial statements. Santander UK’s 2013 financial statements have therefore been prepared in compliance with the Code’s principles.
DIRECTORS’ RESPONSIBILITIES
The Directors are responsible for preparing the Annual Report and Accounts including the financial statements in accordance with applicable law and regulations. Company law requires the Directors to prepare financial statements for each financial year. The Directors are required by the International Accounting Standards (‘IAS’) Regulation to prepare the group financial statements under IFRS, as adopted by the European Union, and have also elected to prepare the parent company financial statements in accordance with IFRS, as adopted by the European Union. The financial statements are also required by law to be properly prepared in accordance with the UK Companies Act 2006 and Article 4 of the IAS Regulation. In addition, in order to meet certain US requirements, the Directors are required to prepare Santander UK’s financial statements in accordance with IFRS, as issued by the International Accounting Standards Board.
The Directors acknowledge their responsibility to ensure the financial statements give a true and fair view of the assets, liabilities, financial position and profit or loss presented and that the management report (comprising the Strategic Report and the Directors’ Report), includes a fair review of the development and performance of the business and a description of the principal risks and uncertainties the business faces.
International Accounting Standard 1 requires that financial statements present fairly, for each financial year, the Company’s financial position, financial performance and cash flows. This requires the faithful representation of the effects of transactions, other events and conditions in accordance with the definitions and recognition criteria for assets, liabilities, income and expenses set out in the International Accounting Standards Board’s “Framework for the preparation and presentation of financial statements”. In virtually all circumstances, a fair presentation will be achieved by compliance with all applicable IFRS. However, the Directors are also required to:
| • | | Properly select and apply accounting policies; |
| • | | Present information, including accounting policies, in a manner that provides relevant, reliable, comparable and understandable information; |
| • | | Provide additional disclosures when compliance with the specific requirements in IFRS are insufficient to enable users to understand the impact of particular transactions, other events and conditions on the entity’s financial position and financial performance; and |
| • | | Make an assessment of the Company’s ability to continue as a going concern. |
The Directors are responsible for keeping adequate accounting records that are sufficient to show and explain the Company’s transactions and disclose with reasonable accuracy at any time the financial position of the Company and enable them to ensure that the financial statements comply with the UK Companies Act 2006. They are also responsible for safeguarding the assets of the Company and hence for taking reasonable steps for the prevention and detection of fraud and other irregularities.
The Directors are responsible for the maintenance and integrity of the corporate and financial information included on the Company’s website. Legislation in the United Kingdom governing the preparation and dissemination of financial statements may differ from legislation in other jurisdictions.
AUDITOR
Deloitte LLP have expressed their willingness to continue in office as auditor and a resolution to reappoint them will be proposed at the Company’s forthcoming Annual General Meeting.
By Order of the Board

Karen M. Fortunato
Company Secretary
26 February 2014
2 Triton Square, Regent’s Place, London NW1 3AN
| | |
| Santander UK plc Annual Report 2013 | | 195 |
Governance
Directors’ Responsibilities Statement
We confirm to the best of our knowledge that:
| 1. | The financial statements, prepared in accordance with International Financial Reporting Standards, as adopted by the EU, give a fair, balanced and understandable view of the assets, liabilities, financial position and profit or loss of the Company and the undertakings included in the consolidation taken as a whole; and |
| 2. | The management report, which is incorporated into the Directors’ Report, includes a fair, balanced and understandable review of the development and performance of the business and the position of the Company and the undertakings included in the consolidation taken as a whole, together with a description of the principal risks and uncertainties they face. |
By Order of the Board

Ana Botín
Chief Executive Officer
26 February 2014
| | |
| 196 | | Santander UK plc Annual Report 2013 |
Governance
Further Remuneration Disclosures
FCA REMUNERATION DISCLOSURES
The following disclosures are prepared in accordance with the regulatory Handbook for banks, building societies and investment firms (‘BIPRU’) sections 11.5.18 (1) to (7). More detailed information on Santander UK’s remuneration processes and policies, together with the role and composition of the Board Remuneration Oversight Committee is contained in the Directors’ Remuneration Report on page 178.
Role of the Board Remuneration Oversight Committee
The Board Remuneration Oversight Committee (the ’Committee’) was established with effect from 1 January 2010. The Committee is primarily responsible for overseeing and supervising the Banco Santander group’s policies and frameworks covering remuneration and reward as applied in, or devolved to the UK. It provides governance and strategic input into the Company’s executive and employee remuneration and reward activities. In January 2013, PricewaterhouseCoopers LLP (’PwC’) were re-appointed by the Committee to provide independent professional advice to the Committee and throughout 2013, the Committee’s work was supported by them. The Committee’s full Terms of Reference are available on the Company’s website www.aboutsantander.co.uk.
Decision-making process for determining remuneration policy
Santander UK’s remuneration policies are agreed locally by the Board Remuneration Oversight Committee in conjunction with the Company’s Central Reward team. Where such policies may have a material impact on the success of the business and/or require Regulatory or Compliance approval, decisions are then subject to formal approval by the Committee. For UK Executive Directors and first tier senior management, remuneration policies and practices are aligned to those of the Banco Santander group generally. The Committee continues to keep under review the relationship of risk to remuneration. When determining remuneration practices, the Company ensures that the value and make up of the remuneration policy is aligned to the Company’s risk appetite. The performance of the Company (for variable remuneration purposes) is measured in respect of its RORWA. This risk-adjusted measure ensures that inappropriate incentives are removed at a Company level. This encourages the Company to consider the risks and therefore the economic capital consumption involved in order to generate target profits.
Code Staff criteria
The following groups of employees have been identified as meeting the FCA’s criteria for Code Staff subject to the mandatory requirements of the FCA Remuneration Code.
| • | | The Company’s Non-Executive Directors and members of the Company’s Executive Committee (which includes the Company’s Executive Directors); |
| • | | Senior managers of significant divisions and control functions such as legal, audit and risk; |
| • | | Other senior managers reporting to the Board and heads of major divisions; |
| • | | Employees whose total remuneration takes them into the same bracket as senior executives; and |
| • | | Risk takers, whose professional activities may have a material impact on the firm’s risk profile. |
The categories above include all senior level management across the Company as well as those responsible for the management of the main businesses and control function heads.
Link between pay and performance
Remuneration at Santander UK is made up of fixed and variable pay designed to reward performance. Performance-related pay is designed to reflect actual achievement against the range of targets which are set for our employees, taking into account the context in which results were achieved. The Company operates a range of incentive structures, focussed on each particular business area, which are designed to reinforce each area’s strategic objectives and how that links to what its employees are being asked to deliver and to reward increasing performance. There is a clear focus on achieving successful performance so that, individually and by business area, the best performers and the best performance will continue to be the best rewarded.
The key objective in determining bonus awards is to incentivise and motivate the desired performance whilst ensuring pay is justified given business and individual performance, which includes financial and non financial measures, risk performance and any other relevant factors. Dependent upon the nature of an individual’s role, the size and weighting of the various elements may differ to ensure that the overall package is competitive, relevant and performance enhancing. However, overall, the remuneration package for each of our employees is designed to reflect market practice for their role.
Under the Banco Santander group’s deferral arrangements, a significant proportion of annual incentive awards for the more senior employees is deferred over a three year period. The purpose of deferred awards is to support a performance culture where employees recognise the importance of sustainable performance of both the Banco Santander group generally and the Santander UK group.
From 1 July 2011, the eligibility criteria of the Banco Santander Long-term Incentive Plan (‘LTIP’) changed. Under the LTIP granted on 1 July 2011, only Key Management Personnel (as defined in Note 43 to the Consolidated Financial Statements) and other nominated individuals who were not classified as Code Staff under the FCA’s Remuneration Code were granted conditional awards of shares in Banco Santander, S.A. Instead, for Code Staff, an amount equivalent to the target value of the LTIP for 2011 was included within the cash bonus target level for 2011 and as such is subject to financial, non-financial and risk-based performance measures and deferral as determined by the Code. This arrangement was devised in response to discussions between Banco Santander, S.A. and the Bank of Spain. No new awards were granted under the LTIP in both 2012 and 2013 as a result of a review by Banco Santander, S.A. as to how it rewards and retains the senior management across all its operating companies globally. Instead, for the Company’s senior management, the Committee considered and approved the proposal for the Company to operate a cash-based Incentive Plan. Those staff classified as Code staff were not eligible for an award under this Incentive Plan.
| | |
| Santander UK plc Annual Report 2013 | | 197 |
Governance
Further Remuneration Disclosurescontinued
Design and structure of remuneration
Santander UK’s remuneration policies are designed to encourage a high-performance culture where people are rewarded and recognised for their performance and ability, and the impact they have on the Company’s success.
The individual elements of employees’ remuneration packages comprise fixed pay (base salary, retirement and other benefits) and performance-related pay (consisting of annual incentives, deferred awards and long-term incentives). The size and weighting of the various reward elements will differ, dependent upon the nature of an individual’s role, to ensure that the package is competitive, relevant and performance-enhancing. Taking into account the expected value of long-term incentives, or bonus deferred in to shares as applicable, the performance-related elements of the package make up an appropriate and considerable proportion of the total remuneration of the Company’s senior executives and senior employees, while maintaining an appropriate balance between fixed and variable elements.
Reward processes are underpinned by a robust performance management system which drives appropriate behaviours in line with the Company’s values: Commitment, Innovation, Teamwork and Excellence. The Company’s performance management process forms the basis of measuring the performance of individuals, which impacts in turn the extent to which variable pay awards are made. The key aspects of the remuneration components are set out below:
a) Base salary
Base salaries are reviewed annually, appropriately benchmarked and set around market median levels, and with reference to the specific market for the business in which an individual works and the skills and competencies that the individual brings to their business area. The level of fixed pay aims to be sufficient so that inappropriate risk-taking is not encouraged. Pay awards take account of prevailing market and economic conditions, governance trends and the approach to employee pay throughout the organisation.
b) Annual bonus
Santander UK’s policy in respect of short-term incentives is to reward good financial and non-financial performance, which supports the Company and relevant business area’s business strategy, and takes into account the Company’s risk appetite and personal contribution in a clear and transparent way. Specific and measurable targets are set at the beginning of the year and communicated to employees. Robust design principles have been established, alongside strict governance procedures to that ensure that all existing and future annual bonus schemes support Santander UK’s business strategy and risk appetite.
c) Long-term incentives
Banco Santander, S.A. operates an LTIP for its senior executives and other nominated employees across the Banco Santander group. No new awards were granted in 2013 and those employees classified as Code Staff did not receive any awards in 2012 either. Future awards will depend on the outcome of a review by Banco Santander, S.A. as to how it rewards and retains the senior management across all its operating companies globally. The LTIP was designed to reinforce the alignment of Santander UK’s employees in achieving the common objectives of the Banco Santander group, the creation of value over the long term and to align the reward of participants with the return to shareholders. The performance measures and rules of the plan were reviewed on an annual basis and approved at Banco Santander, S.A.’s Annual General Meeting. Participants in each annual cycle of the LTIP were granted conditional awards of shares in Banco Santander, S.A. against performance over a three year period. The number of unconditional shares a participant actually received depended on the performance of Banco Santander, S.A. against the performance criteria measured after the completion of the performance period.
All unconditional awards under the LTIP vesting and transferred to participants in 2011 and 2010 were dependent on Banco Santander, S.A.’s Total Shareholder Return and the growth of Earnings per Share performance against a comparator benchmark group. All conditional awards granted to participants in 2011 (for the performance period 1 April 2011 to 1 April 2014) and 2010 (for the performance period 1 April 2010 to 1 April 2013), and those awards vested and transferred to participants in 2013 depend on Banco Santander, S.A.’s Total Shareholder Return performance against a comparator benchmark group. Specific details of the conditional awards made in 2011 and 2010 to certain participants in the Company can be found in Note 44 to the Consolidated Financial Statements.
d) Deferral and vesting
To ensure the interests of the Company and its employees are aligned with those of the shareholders of Banco Santander, S.A., and the Company’s approach to risk management supports the interests of all stakeholders, the vesting of deferred annual bonus awards and long-term incentive awards is subject to continued employment (which may be terminated in the event of gross or serious misconduct) and, in the case of deferred bonus awards, subject to the Banco Santander group’s and the Company’s rules on performance adjustment and claw-back.
Santander UK ensures that it is compliant in its mandatory deferral requirements for its Code Staff and the amount of bonus to be deferred is based on the total variable pay received. The FCA Remuneration Code prescribes that at least 40% of variable pay must be made over a period of at least three years and, for staff earning more than £500,000 in variable remuneration, at least 60% of a bonus must be deferred over the same period. Santander UK meets these requirements.
All UK bonus awards in 2013 are subject to deferral principles that have been set at the Banco Santander group level. Such principles, as applied to the Company, are subject to ratification by the Committee and can be overridden by UK national requirements to meet any criteria set by the PRA/FCA or other regulator/law. However, the general deferral principles are as follows:
| • | | a proportion of an individual’s bonus (on a sliding scale) will become subject to deferral if the bonus exceeds certain levels depending on the nature of the role; |
| • | | any deferred amount will be issued in shares over a three year period (in three equal deferral tranches); and |
| • | | deferrals are subject to continued employment with the Banco Santander group in the UK and on the condition that none of the prescribed circumstances of forfeiture occur. |
| | |
| 198 | | Santander UK plc Annual Report 2013 |
Governance
Further Remuneration Disclosurescontinued
Santander UK will continue to ensure that the requirements of the FCA Remuneration Code are met for its employees and particularly for Code Staff. Santander UK will prevent vesting of all or part of the amount of deferred remuneration in any of the following circumstances:
| • | | evidence of employee misbehaviour or material error; |
| • | | material downturn in the Company or relevant business unit’s performance; |
| • | | the Company or relevant business unit suffers a material failure of risk management; |
| • | | significant changes in the Banco Santander group’s or the Company’s economic or regulatory capital base and the qualitative assessment of risks; or |
| • | | a material restatement of the Banco Santander group’s or the Company’s financial statements (except when required due to modification of the accounting rules). |
In such circumstances, the Committee will have final discretion to determine the amount of deferred remuneration that will not vest or extinguish an award altogether, following recommendations from Banco Santander, S.A.’s Committee for Evaluation of Risk & Remuneration.
e) Allocation into shares
The FCA Remuneration Code requires at least 50% of variable remuneration of Code Staff to be paid in shares or other specific instruments. This requirement applies to both deferred and non-deferred variable remuneration, such that no more than 30% of non-deferred variable remuneration can be awarded up front in cash.
For 2013, Santander UK complied in full with the FCA Remuneration Code requirements in this regard for its Code Staff and pays the non-deferred element of annual bonus as 50% in cash and 50% in shares or share-linked instruments, the necessary approvals from shareholders having been obtained.
f) Risk adjustments
Santander UK’s remuneration policies are set to ensure the value and make up of remuneration scheme design is linked to the Company’s risk appetite. The Committee continues to keep under review the relationship of risk to remuneration. When determining remuneration practices, the Company ensures that the value and make up of the remuneration policy is aligned to the Company’s risk appetite. The performance of the Company (for variable remuneration purposes) is measured in respect of its Return on Risk Weighted Assets (‘ROWRA’). This risk-adjusted measure ensures that inappropriate incentives are removed at a Company level. This encourages the Company to consider the risks and therefore the economic capital consumption involved in order to generate target profits. Further to this, for 2013, the Committee also considered outcomes of the Company’s Enterprise Wide Risk Review.
Certain members of the Committee are also members of the Company’s Board Audit Committee. In addition, the Company’s Deputy Chief Risk Officer is an attendee at the Committee’s meetings and the Committee is supported by the Company’s Risk Function as required. This framework ensures the Committee is engaged with the risk management of the business and is provided with risk information on an ongoing basis.
QUANTITATIVE REMUNERATION DISCLOSURE
The Company is required to disclose aggregate quantitative remuneration information for its Code Staff in the years ended 31 December 2013 and 2012. At 31 December 2013, there were 29 Code Staff (2012: 25) who have been identified as Key Management Personnel and 41 other Code Staff (2012: 30).
Aggregate remuneration expenditure
Aggregate remuneration is made up of total fixed and variable remuneration awarded in respect of the 2013 and 2012 performance years as follows:
| | | | | | | | |
Business Area | | 2013
£’000 | | | 2012
£’000 | |
Markets | | | 6,836 | | | | 5,335 | |
Commercial Banking | | | 4,566 | | | | 4,786 | |
Other | | | 37,853 | | | | 31,636 | |
Amounts and form of fixed and variable remuneration
a) Fixed remuneration
Total fixed remuneration paid in 2013 and 2012 included all benefits and allowances, including pensions contributions by employer, pension cash allowance, housing and energy allowances, car allowances and miscellaneous benefits (net) was as follows:
| | | | | | | | |
| | | 2013
£’000 | | | 2012
£’000 | |
Key Management Personnel | | | 14,928 | | | | 12,398 | |
Other Code Staff | | | 11,057 | | | | 9,479 | |
| | |
| Santander UK plc Annual Report 2013 | | 199 |
Governance
Further Remuneration Disclosurescontinued
b) Total variable remuneration (including total deferred remuneration)
Variable remuneration payable in respect of 2013 and 2012 performance consisted of cash bonuses, share awards, long-term incentives and other discretionary one-off awards was as follows.
Variable remuneration awarded in respect of 2013 performance year
| | | | | | | | |
| | | Key Management Personnel
£’000 | | | Other Code Staff
£’000 | |
Variable remuneration: | | | | | | | | |
- Bonus in cash | | | 6,821 | | | | 5,592 | |
- Bonus in shares(1) | | | 6,821 | | | | 4,941 | |
| | | | | | | | |
Total variable remuneration | | | 13,642 | | | | 10,533 | |
| | | | | | | | |
| | |
Deferred remuneration: | | | | | | | | |
Amount deferred in cash | | | 3,856 | | | | 2,209 | |
Amount deferred in shares | | | 3,856 | | | | 2,209 | |
| | | | | | | | |
Total deferred remuneration | | | 7,712 | | | | 4,418 | |
| | | | | | | | |
| (1) | Value of bonus in shares awarded for performance in 2013, based on share price at award. |
| (2) | Value of bonus in deferred shares for performance in 2013, and long-term incentive shares for performance in 2013. |
Variable remuneration awarded in respect of 2012 performance year
| | | | | | | | |
| | | Key Management Personnel
£’000 | | | Other Code Staff
£’000 | |
Variable remuneration: | | | | | | | | |
- Bonus in cash | | | 6,028 | | | | 6,385 | |
- Bonus in shares(1) | | | 6,028 | | | | 5,416 | |
- Long-term incentives in shares | | | — | | | | — | |
| | | | | | | | |
Total variable remuneration | | | 12,056 | | | | 11,801 | |
| | | | | | | | |
| | |
Deferred remuneration: | | | | | | | | |
Amount deferred in cash | | | 3,395 | | | | 2,718 | |
Amount deferred in shares(2) | | | 3,395 | | | | 2,718 | |
| | | | | | | | |
Total deferred remuneration | | | 6,790 | | | | 5,436 | |
| | | | | | | | |
| (1) | Value of bonus in shares awarded for performance in 2012, based on share price at award. |
| (2) | Value of bonus in deferred shares for performance in 2012, and long-term incentive shares for performance in 2012. |
c) Outstanding deferred remuneration
This refers to deferred remuneration awarded in respect of the 2012 and 2011 performance years, as well as that paid out during the year in respect of previous years’ deferrals and all unvested remuneration on 31 December 2013 and 2012. This includes deferred bonus awards and long-term incentive plans contingent on multi-year performance. Deferred remuneration reduced during the year relates to long-term incentives lapsing when performance conditions are not met or deferred awards being reduced due to claw-back.
2013 category of deferred remuneration
| | | | | | | | |
| | | Key Management Personnel
£’000 | | | Other Code Staff
£’000 | |
Awarded in year(1) | | | 7,712 | | | | 4,418 | |
Paid out from prior years(2) | | | 735 | | | | 1,481 | |
Amount by which payouts from prior years were reduced by performance adjustments(3) | | | 804 | | | | 1,080 | |
Unvested at year end(4) | | | 10,904 | | | | 18,368 | |
| (1) | Value of deferred and long-term incentive shares granted in 2013, based on share price at award/grant, plus deferred cash from 2013 bonus. |
| (2) | Value of long-term incentive shares that vested in 2013, based on share price at vesting, plus deferred cash from 2010 and 2011 bonus paid in 2013. |
| (3) | Value of long-term incentive shares or deferred cash delivered in 2013 that either lapsed or were reduced as a result of performance conditions not being satisfied or claw back policy. |
| (4) | Value of both deferred and long-term incentive shares unvested at 31 December 2013, based on a share price at 31 December 2013, plus deferred cash outstanding from previous bonuses. Does not include remuneration awarded in respect of 2013 performance. |
2012 category of deferred remuneration
| | | | | | | | |
| | | Key Management Personnel
£’000 | | | Other Code Staff
£’000 | |
Awarded in year(1) | | | 6,790 | | | | 5,436 | |
Paid out from prior years(2) | | | 644 | | | | 2,589 | |
Amount by which payouts from prior years were reduced by performance adjustments(3) | | | 553 | | | | 720 | |
Unvested at year end(4) | | | 6,335 | | | | 9,215 | |
| (1) | Value of deferred and long-term incentive shares granted in 2012, based on share price at award/grant, plus deferred cash from 2012 bonus. |
| (2) | Value of long-term incentive shares that vested in 2012, based on share price at vesting, plus deferred cash from 2009 and 2010 bonus paid in 2012. |
| (3) | Value of long-term incentive shares or deferred cash delivered in 2012 that either lapsed or were reduced as a result of performance conditions not being satisfied or claw back policy. |
| (4) | Value of both deferred and long-term incentive shares unvested at 31 December 2012, based on a share price at 31 December 2012, plus deferred cash outstanding from previous bonuses. Does not include remuneration awarded in respect of 2012 performance. |
d) Sign-on (buy-out) and severance payments
Payments totalling £2,232,651 were made to seven Code Staff employees during the year (2012: £2,818,800) in respect of buying-out deferred compensation from previous employers. Severance payments of £653,489 were made to four Code Staff employees during the year (2012: £321,957).
| | |
| 200 | | Santander UK plc Annual Report 2013 |
Financial Statements
| | |
| Santander UK plc Annual Report 2013 | | 201 |
Financial Statements
Report of independent registered public accounting firm
To the Board of Directors and Shareholders of Santander UK plc
We have audited the accompanying consolidated balance sheets of Santander UK plc and subsidiaries (the “Group”) as of 31 December 2013 and 2012, and the related consolidated income statements, statements of comprehensive income, statement of changes in equity and cash flow statements for each of the three years in the period ended 31 December 2013, the related notes 1 to 48 and the information on pages 62 to 163 of the Risk Management Report, except for those items marked as unaudited. These consolidated financial statements are the responsibility of the Group’s management. Our responsibility is to express an opinion on these consolidated financial statements based on our audits.
We conducted our audits in accordance with the standards of the Public Company Accounting Oversight Board (United States). Those standards require that we plan and perform the audit to obtain reasonable assurance about whether the financial statements are free of material misstatement. The Group is not required to have, nor were we engaged to perform, an audit of its internal control over financial reporting. Our audits included consideration of internal control over financial reporting as a basis for designing audit procedures that are appropriate in the circumstances, but not for the purpose of expressing an opinion on the effectiveness of the Group’s internal control over financial reporting. Accordingly, we express no such opinion. An audit also includes examining, on a test basis, evidence supporting the amounts and disclosures in the financial statements, assessing the accounting principles used and significant estimates made by management, as well as evaluating the overall financial statement presentation. We believe that our audits provide a reasonable basis for our opinion.
In our opinion, such consolidated financial statements present fairly, in all material respects, the financial position of Santander UK plc and subsidiaries as of 31 December 2013 and 2012, and the results of their operations and their cash flows for each of the three years in the period ended 31 December 2013, in conformity with International Financial Reporting Standards (“IFRS”) as adopted by the European Union and IFRS as issued by the International Accounting Standards Board (“IASB”).

Deloitte LLP
London, UK
26 February 2014
| | |
| 202 | | Santander UK plc Annual Report 2013 |
Financial Statements
This page intentionally left blank
| | |
| Santander UK plc Annual Report 2013 | | 203 |
Financial Statements
This page intentionally left blank
| | |
| 204 | | Santander UK plc Annual Report 2013 |
Financial Statements
Primary Financial Statements
CONSOLIDATED INCOME STATEMENT
For the years ended 31 December 2013, 2012 and 2011
| | | | | | | | | | | | | | |
| | | Notes | | 2013
£m | | | 2012(1)
£m | | | 2011(1)
£m | |
Interest and similar income | | 3 | | | 7,170 | | | | 7,432 | | | | 7,411 | |
Interest expense and similar charges | | 3 | | | (4,207 | ) | | | (4,698 | ) | | | (3,778 | ) |
| | | | | | | | | | | | | | |
Net interest income | | | | | 2,963 | | | | 2,734 | | | | 3,633 | |
| | | | | | | | | | | | | | |
Fee and commission income | | 4 | | | 1,058 | | | | 1,086 | | | | 1,044 | |
Fee and commission expense | | 4 | | | (300 | ) | | | (225 | ) | | | (180 | ) |
| | | | | | | | | | | | | | |
Net fee and commission income | | | | | 758 | | | | 861 | | | | 864 | |
| | | | | | | | | | | | | | |
Net trading and other income | | 5 | | | 308 | | | | 1,088 | | | | 439 | |
| | | | | | | | | | | | | | |
Total operating income | | | | | 4,029 | | | | 4,683 | | | | 4,936 | |
| | | | | | | | | | | | | | |
Administration expenses | | 6 | | | (1,947 | ) | | | (1,873 | ) | | | (1,876 | ) |
Depreciation, amortisation and impairment | | 7 | | | (248 | ) | | | (241 | ) | | | (438 | ) |
| | | | | | | | | | | | | | |
Total operating expenses excluding impairment losses, provisions and charges | | | | | (2,195 | ) | | | (2,114 | ) | | | (2,314 | ) |
| | | | | | | | | | | | | | |
Impairment losses on loans and advances | | 9 | | | (475 | ) | | | (988 | ) | | | (501 | ) |
Provisions for other liabilities and charges | | 9 | | | (220 | ) | | | (434 | ) | | | (907 | ) |
| | | | | | | | | | | | | | |
Total operating impairment losses, provisions and charges | | | | | (695 | ) | | | (1,422 | ) | | | (1,408 | ) |
| | | | | | | | | | | | | | |
Profit on continuing operations before tax | | | | | 1,139 | | | | 1,147 | | | | 1,214 | |
Tax on profit on continuing operations | | 10 | | | (218 | ) | | | (270 | ) | | | (345 | ) |
| | | | | | | | | | | | | | |
Profit on continuing operations after tax | | | | | 921 | | | | 877 | | | | 869 | |
(Loss)/profit from discontinued operations after tax | | 12 | | | (8 | ) | | | 62 | | | | 34 | |
| | | | | | | | | | | | | | |
Profit after tax for the year | | | | | 913 | | | | 939 | | | | 903 | |
| | | | | | | | | | | | | | |
Attributable to: | | | | | | | | | | | | | | |
Equity holders of the parent | | | | | 913 | | | | 939 | | | | 903 | |
| (1) | Adjusted to reflect the presentation of discontinued operations as set out in Note 12. |
CONSOLIDATED STATEMENT OF COMPREHENSIVE INCOME
For the years ended 31 December 2013, 2012 and 2011
| | | | | | | | | | | | | | |
| | | Notes | | 2013
£m | | | 2012
£m | | | 2011
£m | |
Profit for the year | | | | | 913 | | | | 939 | | | | 903 | |
| | | | | | | | | | | | | | |
Other comprehensive (expense)/income: | | | | | | | | | | | | | | |
Other comprehensive income that may be reclassified to profit or loss subsequently: | | | | | | | | | | | | | | |
Available-for-sale securities | | | | | | | | | | | | | | |
- Gains/(losses) on available-for-sale securities | | 23 | | | 15 | | | | 6 | | | | (3 | ) |
- Gains on available-for-sale securities transferred to profit or loss on sale | | | | | (46 | ) | | | (17 | ) | | | — | |
- Tax on above items | | 10 | | | 7 | | | | 3 | | | | 2 | |
| | | | | | | | | | | | | | |
| | | | | (24 | ) | | | (8 | ) | | | (1 | ) |
| | | | | | | | | | | | | | |
Cash flow hedges: | | | | | | | | | | | | | | |
- Losses on cash flow hedges | | | | | (207 | ) | | | — | | | | — | |
- Gains on cash flow hedges transferred to profit or loss | | | | | 66 | | | | — | | | | — | |
- Tax on above items | | 10 | | | 31 | | | | — | | | | — | |
| | | | | | | | | | | | | | |
| | | | | (110 | ) | | | — | | | | — | |
| | | | | | | | | | | | | | |
Net other comprehensive (expense)/income that may be reclassified to profit or loss subsequently | | | | | (134 | ) | | | (8 | ) | | | (1 | ) |
| | | | | | | | | | | | | | |
Other comprehensive income that will not be reclassified to profit or loss subsequently: | | | | | | | | | | | | | | |
Remeasurement of defined benefit pension obligations | | 37 | | | (564 | ) | | | (183 | ) | | | (37 | ) |
Tax on above item | | 10 | | | 113 | | | | 42 | | | | 9 | |
| | | | | | | | | | | | | | |
Net other comprehensive expense that will not be reclassified to profit or loss subsequently | | | | | (451 | ) | | | (141 | ) | | | (28 | ) |
| | | | | | | | | | | | | | |
Total other comprehensive expense for the year net of tax | | | | | (585 | ) | | | (149 | ) | | | (29 | ) |
| | | | | | | | | | | | | | |
Total comprehensive income for the year | | | | | 328 | | | | 790 | | | | 874 | |
| | | | | | | | | | | | | | |
Attributable to: | | | | | | | | | | | | | | |
Equity holders of the parent | | | | | 328 | | | | 790 | | | | 874 | |
The accompanying Notes on pages 212 to 316 and the audited sections of the Risk Management Report on pages 61 to 163 form an integral part of these Consolidated Financial Statements.
| | |
| Santander UK plc Annual Report 2013 | | 205 |
Financial Statements
Primary Financial Statementscontinued
CONSOLIDATED BALANCE SHEET
At 31 December 2013 and 2012
| | | | | | | | | | |
| | | Notes | | 2013
£m | | | 2012(1)
£m | |
Assets | | | | | | | | | | |
Cash and balances at central banks | | 13 | | | 26,374 | | | | 29,282 | |
Trading assets | | 15 | | | 22,294 | | | | 22,498 | |
Derivative financial instruments | | 16 | | | 20,049 | | | | 30,146 | |
Financial assets designated at fair value | | 17 | | | 2,747 | | | | 3,811 | |
Loans and advances to banks | | 18 | | | 2,347 | | | | 2,438 | |
Loans and advances to customers | | 19 | | | 184,587 | | | | 190,782 | |
Loans and receivables securities | | 22 | | | 1,101 | | | | 1,259 | |
Available-for-sale securities | | 23 | | | 5,005 | | | | 5,483 | |
Macro hedge of interest rate risk | | | | | 769 | | | | 1,222 | |
Interests in other entities | | 24 | | | 27 | | | | 8 | |
Intangible assets | | 25 | | | 2,335 | | | | 2,325 | |
Property, plant and equipment | | 26 | | | 1,521 | | | | 1,541 | |
Current tax assets | | | | | 114 | | | | 50 | |
Deferred tax assets | | 27 | | | 35 | | | | 60 | |
Retirement benefit assets | | 37 | | | 118 | | | | 254 | |
Other assets | | 28 | | | 882 | | | | 1,885 | |
| | | | | | | | | | |
Total assets | | | | | 270,305 | | | | 293,044 | |
| | | | | | | | | | |
Liabilities | | | | | | | | | | |
Deposits by banks | | 29 | | | 8,696 | | | | 9,935 | |
Deposits by customers | | 30 | | | 147,167 | | | | 149,037 | |
Trading liabilities | | 31 | | | 21,278 | | | | 21,109 | |
Derivative financial instruments | | 16 | | | 18,863 | | | | 28,861 | |
Financial liabilities designated at fair value | | 32 | | | 3,407 | | | | 4,002 | |
Debt securities in issue | | 33 | | | 50,870 | | | | 59,621 | |
Subordinated liabilities | | 34 | | | 4,306 | | | | 3,781 | |
Other liabilities | | 35 | | | 1,883 | | | | 2,526 | |
Provisions | | 36 | | | 639 | | | | 914 | |
Current tax liabilities | | | | | 4 | | | | 4 | |
Retirement benefit obligations | | 37 | | | 672 | | | | 305 | |
| | | | | | | | | | |
Total liabilities | | | | | 257,785 | | | | 280,095 | |
| | | | | | | | | | |
Equity | | | | | | | | | | |
Share capital and other equity instruments | | 39 | | | 3,709 | | | | 3,999 | |
Share premium | | 39 | | | 5,620 | | | | 5,620 | |
Retained earnings | | | | | 3,307 | | | | 3,312 | |
Other reserves | | | | | (116 | ) | | | 18 | |
| | | | | | | | | | |
Total shareholders’ equity | | | | | 12,520 | | | | 12,949 | |
| | | | | | | | | | |
Total liabilities and equity | | | | | 270,305 | | | | 293,044 | |
| | | | | | | | | | |
| (1) | Adjusted to reflect the presentation of the assets held for sale prior to the completion of the sale as set out in Note 12. |
The accompanying Notes on pages 212 to 316 and the audited sections of the Risk Management Report on pages 61 to 163 form an integral part of these Consolidated Financial Statements.
The Financial Statements on pages 205 to 316 were approved and authorised for issue by the Board on 26 February 2014 and signed on its behalf by:

Stephen Jones
Chief Financial Officer
Company Registered Number: 2294747
| | |
| 206 | | Santander UK plc Annual Report 2013 |
Financial Statements
Primary Financial Statementscontinued
CONSOLIDATED STATEMENT OF CHANGES IN EQUITY
For the years ended 31 December 2013, 2012 and 2011
| | | | | | | | | | | | | | | | | | | | | | | | | | | | | | |
| | | | | | | | | | | Other reserves | | | | | | | |
| | | Notes | | Share capital
and other
equity
instruments
£m | | | Share
premium
£m | | | Available
for sale
reserve
£m | | | Cash flow
hedging
reserve
£m | | | Foreign
currency
translation
reserve
£m | | | Retained
earnings
£m | | | Total
£m | |
1 January 2013 | | | | | 3,999 | | | | 5,620 | | | | 1 | | | | — | | | | 17 | | | | 3,312 | | | | 12,949 | |
Total comprehensive income/(expense): | | | | | | | | | | | | | | | | | | | | | | | | | | | | | | |
- Profit for the year | | | | | — | | | | — | | | | — | | | | — | | | | — | | | | 913 | | | | 913 | |
Other comprehensive income/(expense): | | | | | | | | | | | | | | | | | | | | | | | | | | | | | | |
- Gains on available-for-sale securities | | | | | — | | | | — | | | | 15 | | | | — | | | | — | | | | — | | | | 15 | |
- Gains on available-for-sale securities transferred to profit or loss | | | | | — | | | | — | | | | (46 | ) | | | — | | | | — | | | | — | | | | (46 | ) |
- Losses on cash flow hedges | | | | | — | | | | — | | | | — | | | | (207 | ) | | | — | | | | — | | | | (207 | ) |
- Losses on cash flow hedges transferred to profit or loss | | | | | — | | | | — | | | | — | | | | 66 | | | | — | | | | — | | | | 66 | |
- Remeasurement of defined benefit pension obligations | | | | | — | | | | — | | | | — | | | | — | | | | — | | | | (564 | ) | | | (564 | ) |
- Tax on other comprehensive income/(expense) | | | | | — | | | | — | | | | 7 | | | | 31 | | | | — | | | | 113 | | | | 151 | |
| | | | | | | | | | | | | | | | | | | | | | | | | | | | | | |
Other comprehensive income/(expense) net of tax | | | | | — | | | | — | | | | (24 | ) | | | (110 | ) | | | — | | | | (451 | ) | | | (585 | ) |
| | | | | | | | | | | | | | | | | | | | | | | | | | | | | | |
Repurchase of preference shares | | 39 | | | (290 | ) | | | — | | | | — | | | | — | | | | — | | | | 15 | | | | (275 | ) |
| | | | | | | | | | | | | | | | | | | | | | | | | | | | | | |
Dividends and other distributions | | 14 | | | — | | | | — | | | | — | | | | — | | | | — | | | | (482 | ) | | | (482 | ) |
| | | | | | | | | | | | | | | | | | | | | | | | | | | | | | |
31 December 2013 | | | | | 3,709 | | | | 5,620 | | | | (23 | ) | | | (110 | ) | | | 17 | | | | 3,307 | | | | 12,520 | |
| | | | | | | | | | | | | | | | | | | | | | | | | | | | | | |
1 January 2012 | | | | | 3,999 | | | | 5,620 | | | | 9 | | | | — | | | | 17 | | | | 3,021 | | | | 12,666 | |
Total comprehensive income/(expense): | | | | | | | | | | | | | | | | | | | | | | | | | | | | | | |
- Profit for the year | | | | | — | | | | — | | | | — | | | | — | | | | — | | | | 939 | | | | 939 | |
- Other comprehensive income/(expense): | | | | | | | | | | | | | | | | | | | | | | | | | | | | | | |
- Gains on available-for-sale securities | | | | | — | | | | — | | | | 6 | | | | — | | | | — | | | | — | | | | 6 | |
- Gains on available-for-sale securities transferred to profit or loss | | | | | — | | | | — | | | | (17 | ) | | | — | | | | — | | | | — | | | | (17 | ) |
- Remeasurement of defined benefit pension obligations | | | | | — | | | | — | | | | — | | | | — | | | | — | | | | (183 | ) | | | (183 | ) |
- Tax on other comprehensive income/(expense) | | | | | — | | | | — | | | | 3 | | | | — | | | | — | | | | 42 | | | | 45 | |
| | | | | | | | | | | | | | | | | | | | | | | | | | | | | | |
Other comprehensive income/(expense) net of tax | | | | | — | | | | — | | | | (8 | ) | | | — | | | | — | | | | (141 | ) | | | (149 | ) |
| | | | | | | | | | | | | | | | | | | | | | | | | | | | | | |
Dividends and other distributions | | 14 | | | — | | | | — | | | | — | | | | — | | | | — | | | | (507 | ) | | | (507 | ) |
| | | | | | | | | | | | | | | | | | | | | | | | | | | | | | |
31 December 2012 | | | | | 3,999 | | | | 5,620 | | | | 1 | | | | — | | | | 17 | | | | 3,312 | | | | 12,949 | |
| | | | | | | | | | | | | | | | | | | | | | | | | | | | | | |
1 January 2011 | | | | | 3,999 | | | | 5,620 | | | | 10 | | | | — | | | | 17 | | | | 2,628 | | | | 12,274 | |
Total comprehensive income/(expense): | | | | | | | | | | | | | | | | | | | | | | | | | | | | | | |
- Profit for the year | | | | | — | | | | — | | | | — | | | | — | | | | — | | | | 903 | | | | 903 | |
- Other comprehensive income/(expense) net of tax: | | | | | | | | | | | | | | | | | | | | | | | | | | | | | | |
- Losses on available-for-sale securities | | | | | — | | | | — | | | | (3 | ) | | | — | | | | — | | | | — | | | | (3 | ) |
- Remeasurement of defined benefit pension obligations | | | | | — | | | | — | | | | — | | | | — | | | | — | | | | (37 | ) | | | (37 | ) |
- Tax on other comprehensive income/(expense) | | | | | — | | | | — | | | | 2 | | | | — | | | | — | | | | 9 | | | | 11 | |
| | | | | | | | | | | | | | | | | | | | | | | | | | | | | | |
Other comprehensive income/(expense) net of tax | | | | | — | | | | — | | | | (1 | ) | | | — | | | | — | | | | (28 | ) | | | (29 | ) |
| | | | | | | | | | | | | | | | | | | | | | | | | | | | | | |
Dividends and other distributions | | 14 | | | — | | | | — | | | | — | | | | — | | | | — | | | | (482 | ) | | | (482 | ) |
| | | | | | | | | | | | | | | | | | | | | | | | | | | | | | |
31 December 2011 | | | | | 3,999 | | | | 5,620 | | | | 9 | | | | — | | | | 17 | | | | 3,021 | | | | 12,666 | |
| | | | | | | | | | | | | | | | | | | | | | | | | | | | | | |
The accompanying Notes on pages 212 to 316 and the audited sections of the Risk Management Report on pages 61 to 163 form an integral part of these Consolidated Financial Statements.
| | |
| Santander UK plc Annual Report 2013 | | 207 |
Financial Statements
Primary Financial Statementscontinued
CONSOLIDATED CASH FLOW STATEMENT
For the years ended 31 December 2013, 2012 and 2011
| | | | | | | | | | | | | | |
| | | Notes | | 2013
£m | | | 2012(1)
£m | | | 2011(1)
£m | |
Cash flows from/(used in) operating activities | | | | | | | | | | | | | | |
Profit for the year | | | | | 913 | | | | 939 | | | | 903 | |
Adjustments for: | | | | | | | | | | | | | | |
Non cash items included in profit | | | | | 1,437 | | | | 1,008 | | | | 3,668 | |
Change in operating assets | | | | | 17,614 | | | | 8,363 | | | | 2,219 | |
Change in operating liabilities | | | | | (15,796 | ) | | | (4,094 | ) | | | (12,015 | ) |
Corporation taxes (paid)/received | | | | | (118 | ) | | | (231 | ) | | | (165 | ) |
Effects of exchange rate differences | | | | | 702 | | | | (1,961 | ) | | | (1,662 | ) |
| | | | | | | | | | | | | | |
Net cash flow from/(used in) operating activities | | 40 | | | 4,752 | | | | 4,024 | | | | (7,052 | ) |
| | | | | | | | | | | | | | |
Cash flows (used in)/from investing activities | | | | | | | | | | | | | | |
Interests in other entities | | | | | (18 | ) | | | (6 | ) | | | — | |
Disposal of subsidiaries and businesses, net of cash disposed | | 40 | | | — | | | | — | | | | 76 | |
Purchase of property, plant and equipment and intangible assets | | 25,,26 | | | (339 | ) | | | (454 | ) | | | (397 | ) |
Proceeds from sale of property, plant and equipment and intangible assets | | | | | 99 | | | | 80 | | | | 93 | |
Purchase of available-for-sale securities | | | | | (2,904 | ) | | | (6,338 | ) | | | — | |
Proceeds from sale and redemption of available-for-sale securities | | | | | 3,344 | | | | 910 | | | | 124 | |
| | | | | | | | | | | | | | |
Net cash flow used in investing activities | | | | | 182 | | | | (5,808 | ) | | | (104 | ) |
| | | | | | | | | | | | | | |
Cash flows from/(used in) financing activities | | | | | | | | | | | | | | |
Issue of debt securities | | | | | 25,469 | | | | 37,219 | | | | 48,449 | |
Repayment of debt securities | | | | | (33,170 | ) | | | (35,636 | ) | | | (43,070 | ) |
Dividends paid on ordinary shares | | 14 | | | (665 | ) | | | (425 | ) | | | (375 | ) |
Dividends paid on preference shares classified in equity | | 14 | | | (19 | ) | | | (19 | ) | | | (19 | ) |
Dividends paid on Reserve Capital Instruments | | 14 | | | (21 | ) | | | (21 | ) | | | (21 | ) |
Dividends paid on Perpetual Preferred Securities | | 14 | | | (17 | ) | | | (17 | ) | | | (17 | ) |
| | | | | | | | | | | | | | |
Net cash flow from financing activities | | | | | (8,423 | ) | | | 1,101 | | | | 4,947 | |
| | | | | | | | | | | | | | |
Net (decrease)/increase in cash and cash equivalents | | | | | (3,489 | ) | | | (683 | ) | | | (2,209 | ) |
| | | | | | | | | | | | | | |
Cash and cash equivalents at beginning of the year | | | | | 41,639 | | | | 42,946 | | | | 45,500 | |
Effects of exchange rate changes on cash and cash equivalents | | | | | (971 | ) | | | (624 | ) | | | (345 | ) |
| | | | | | | | | | | | | | |
Cash and cash equivalents at the end of the year | | 40 | | | 37,179 | | | | 41,639 | | | | 42,946 | |
| | | | | | | | | | | | | | |
| (1) | Adjusted to reflect the presentation of discontinued operations, as set out in Note 12. |
The accompanying Notes on pages 212 to 316 and the audited sections of the Risk Management Report on pages 61 to 163 form an integral part of these Consolidated Financial Statements.
| | |
| 208 | | Santander UK plc Annual Report 2013 |
Financial Statements
Primary Financial Statementscontinued
COMPANY BALANCE SHEET
At 31 December 2013 and 2012
| | | | | | | | | | |
| | | Notes | | 2013(1)
£m | | | 2012(1)
£m | |
Assets | | | | | | | | | | |
Cash and balances at central banks | | 13 | | | 21,399 | | | | 28,883 | |
Derivative financial instruments | | 16 | | | 2,461 | | | | 4,899 | |
Financial assets designated at fair value | | 17 | | | 1 | | | | 44 | |
Loans and advances to banks | | 18 | | | 109,267 | | | | 97,846 | |
Loans and advances to customers | | 19 | | | 164,393 | | | | 171,697 | |
Loans and receivables securities | | 22 | | | 5,474 | | | | 5,941 | |
Available-for-sale securities | | 23 | | | 2,029 | | | | 357 | |
Macro hedge of interest rate risk | | | | | — | | | | 15 | |
Interests in other entities | | 24 | | | 6,176 | | | | 6,969 | |
Intangible assets | | 25 | | | 1,678 | | | | 1,647 | |
Property, plant and equipment | | 26 | | | 1,196 | | | | 1,157 | |
Current tax assets | | | | | 423 | | | | 240 | |
Deferred tax assets | | 27 | | | 73 | | | | 72 | |
Retirement benefit assets | | 37 | | | 110 | | | | 250 | |
Other assets | | 28 | | | 808 | | | | 716 | |
| | | | | | | | | | |
Total assets | | | | | 315,488 | | | | 320,733 | |
| | | | | | | | | | |
Liabilities | | | | | | | | | | |
Deposits by banks | | 29 | | | 115,218 | | | | 109,170 | |
Deposits by customers | | 30 | | | 179,399 | | | | 188,884 | |
Derivative financial instruments | | 16 | | | 1,803 | | | | 2,051 | |
Debt securities in issue | | 33 | | | 156 | | | | 645 | |
Subordinated liabilities | | 34 | | | 4,212 | | | | 3,846 | |
Other liabilities | | 35 | | | 1,584 | | | | 2,139 | |
Provisions | | 36 | | | 570 | | | | 859 | |
Retirement benefit obligations | | 37 | | | 670 | | | | 305 | |
| | | | | | | | | | |
Total liabilities | | | | | 303,612 | | | | 307,899 | |
| | | | | | | | | | |
Equity | | | | | | | | | | |
Share capital and other equity instruments | | 39 | | | 3,709 | | | | 3,999 | |
Share premium | | 39 | | | 5,620 | | | | 5,620 | |
Retained earnings | | | | | 2,547 | | | | 3,217 | |
Available for sale reserve | | | | | — | | | | (2 | ) |
| | | | | | | | | | |
Total shareholders’ equity | | | | | 11,876 | | | | 12,834 | |
| | | | | | | | | | |
Total liabilities and equity | | | | | 315,488 | | | | 320,733 | |
| | | | | | | | | | |
| (1) | The Company financial statements and all related footnotes have not been audited under the standards of the Public Company Accounting Oversight Board. |
The accompanying Notes on pages 212 to 316 and the audited sections of the Risk Management Report on pages 61 to 163 form an integral part of these Financial Statements.
The Financial Statements on pages 205 to 316 were approved and authorised for issue by the Board on 26 February 2014 and signed on its behalf by:
Stephen Jones
Chief Financial Officer
Company Registered Number: 2294747
| | |
| Santander UK plc Annual Report 2013 | | 209 |
Financial Statements
Primary Financial Statementscontinued
COMPANY STATEMENT OF CHANGES IN EQUITY
For the years ended 31 December 2013, 2012 and 2011
| | | | | | | | | | | | | | | | | | | | | | |
| | | Notes | | Share capital and
other equity
instruments
£m | | | Share
premium
£m | | | Available for
sale reserve
£m | | | Retained
earnings
£m | | | Total(1)
£m | |
1 January 2013 | | | | | 3,999 | | | | 5,620 | | | | (2 | ) | | | 3,217 | | | | 12,834 | |
Total comprehensive income/(expense): | | | | | | | | | | | | | | | | | | | | | | |
- Profit for the year | | | | | — | | | | — | | | | — | | | | 248 | | | | 248 | |
Other comprehensive income/(expense): | | | | | | | | | | | | | | | | | | | | | | |
- Gains on available-for-sale securities | | | | | — | | | | — | | | | 2 | | | | — | | | | 2 | |
- Remeasurement of defined benefit pension obligations | | | | | — | | | | — | | | | — | | | | (564 | ) | | | (564 | ) |
- Tax on other comprehensive income/(expense) | | | | | — | | | | — | | | | — | | | | 113 | | | | 113 | |
| | | | | | | | | | | | | | | | | | | | | | |
Other comprehensive income/(expense) net of tax | | | | | — | | | | — | | | | 2 | | | | (451 | ) | | | (449 | ) |
| | | | | | | | | | | | | | | | | | | | | | |
Repurchase of preference shares | | 39 | | | (290 | ) | | | — | | | | — | | | | 15 | | | | (275 | ) |
| | | | | | | | | | | | | | | | | | | | | | |
Dividends | | 14 | | | — | | | | — | | | | — | | | | (482 | ) | | | (482 | ) |
| | | | | | | | | | | | | | | | | | | | | | |
31 December 2013 | | | | | 3,709 | | | | 5,620 | | | | — | | | | 2,547 | | | | 11,876 | |
| | | | | | | | | | | | | | | | | | | | | | |
1 January 2012 | | | | | 3,999 | | | | 5,620 | | | | 7 | | | | 4,625 | | | | 14,251 | |
Total comprehensive income/(expense): | | | | | | | | | | | | | | | | | | | | | | |
- Profit for the year | | | | | — | | | | — | | | | — | | | | (760 | ) | | | (760 | ) |
- Other comprehensive income/(expense): | | | | | | | | | | | | | | | | | | | | | | |
- Gains on available-for-sale securities | | | | | — | | | | — | | | | 2 | | | | — | | | | 2 | |
Profits on available-for-sale securities transferred to profit or loss | | | | | — | | | | — | | | | (14 | ) | | | — | | | | (14 | ) |
- Remeasurement of defined benefit pension obligations | | | | | — | | | | — | | | | — | | | | (183 | ) | | | (183 | ) |
- Tax on other comprehensive income/(expense) | | | | | — | | | | — | | | | 3 | | | | 42 | | | | 45 | |
| | | | | | | | | | | | | | | | | | | | | | |
Other comprehensive income/(expense) net of tax | | | | | — | | | | — | | | | (9 | ) | | | (141 | ) | | | (150 | ) |
| | | | | | | | | | | | | | | | | | | | | | |
Dividends | | 14 | | | — | | | | — | | | | — | | | | (507 | ) | | | (507 | ) |
| | | | | | | | | | | | | | | | | | | | | | |
31 December 2012 | | | | | 3,999 | | | | 5,620 | | | | (2 | ) | | | 3,217 | | | | 12,834 | |
| | | | | | | | | | | | | | | | | | | | | | |
1 January 2011 | | | | | 3,999 | | | | 5,620 | | | | 7 | | | | 1,983 | | | | 11,609 | |
Total comprehensive income/(expense): | | | | | | | | | | | | | | | | | | | | | | |
- Profit for the year | | | | | — | | | | — | | | | — | | | | 3,153 | | | | 3,153 | |
- Other comprehensive income/(expense): | | | | | | | | | | | | | | | | | | | | | | |
- Losses on available-for-sale securities | | | | | — | | | | — | | | | (2 | ) | | | — | | | | (2 | ) |
- Remeasurement of defined benefit pension obligations | | | | | — | | | | — | | | | — | | | | (38 | ) | | | (38 | ) |
- Tax on other comprehensive income/(expense) | | | | | — | | | | — | | | | 2 | | | | 9 | | | | 11 | |
| | | | | | | | | | | | | | | | | | | | | | |
Other comprehensive income/(expense) net of tax | | | | | — | | | | — | | | | — | | | | (29 | ) | | | (29 | ) |
| | | | | | | | | | | | | | | | | | | | | | |
Dividends | | 14 | | | — | | | | — | | | | — | | | | (482 | ) | | | (482 | ) |
| | | | | | | | | | | | | | | | | | | | | | |
31 December 2011 | | | | | 3,999 | | | | 5,620 | | | | 7 | | | | 4,625 | | | | 14,251 | |
| | | | | | | | | | | | | | | | | | | | | | |
| (1) | The Company financial statements and all related footnotes have not been audited under the standards of the Public Company Accounting Oversight Board. |
The accompanying Notes on pages 212 to 316 and the audited sections of the Risk Management Report on pages 61 to 163 form an integral part of these Financial Statements.
| | |
| 210 | | Santander UK plc Annual Report 2013 |
Financial Statements
Primary Financial Statementscontinued
COMPANY CASH FLOW STATEMENT
For the years ended 31 December 2013, 2012 and 2011
| | | | | | | | | | | | | | |
| | | Notes | | 2013(1)
£m | | | 2012(1)
£m | | | 2011(1)
£m | |
Cash flows from/(used in) operating activities | | | | | | | | | | | | | | |
Profit for the year | | | | | 248 | | | | (760 | ) | | | 3,153 | |
Adjustments for: | | | | | | | | | | | | | | |
Non cash items included in profit | | | | | 2,593 | | | | 422 | | | | 1,760 | |
Change in operating assets | | | | | 22,317 | | | | 2,473 | | | | 5,712 | |
Change in operating liabilities | | | | | (4,876 | ) | | | 11,002 | | | | (29,053 | ) |
Corporation taxes paid | | | | | (87 | ) | | | (149 | ) | | | (121 | ) |
Effects of exchange rate differences | | | | | (182 | ) | | | (530 | ) | | | (47 | ) |
| | | | | | | | | | | | | | |
Net cash flow from/(used in) operating activities | | 40 | | | 20,013 | | | | 12,458 | | | | (18,596 | ) |
| | | | | | | | | | | | | | |
Cash flows used in investing activities | | | | | | | | | | | | | | |
Interests in other entities | | 24 | | | (1,084 | ) | | | — | | | | — | |
Purchase of property, plant and equipment and intangible assets | | 25, 26 | | | (320 | ) | | | (354 | ) | | | (340 | ) |
Proceeds from sale of property, plant and equipment and intangible assets | | | | | 38 | | | | 3 | | | | 5 | |
Purchase of available-for-sale securities | | | | | (1,680 | ) | | | (348 | ) | | | — | |
Proceeds from sale and redemption of available-for-sale securities | | | | | — | | | | 46 | | | | — | |
| | | | | | | | | | | | | | |
Net cash flow used in investing activities | | | | | (3,046 | ) | | | (653 | ) | | | (335 | ) |
| | | | | | | | | | | | | | |
Net cash flow used in financing activities | | | | | | | | | | | | | | |
Issue of loan capital | | | | | 907 | | | | — | | | | — | |
Repayment of debt securities | | | | | (517 | ) | | | (2,394 | ) | | | (1,957 | ) |
Dividends paid on ordinary shares | | 14 | | | (665 | ) | | | (425 | ) | | | (375 | ) |
Dividends paid on Perpetual Preferred Securities | | 14 | | | (17 | ) | | | (17 | ) | | | (17 | ) |
Dividends paid on preference shares classified in equity | | 14 | | | (19 | ) | | | (19 | ) | | | (19 | ) |
Dividends paid on Reserve Capital Instruments | | 14 | | | (21 | ) | | | (21 | ) | | | (21 | ) |
| | | | | | | | | | | | | | |
Net cash flow used in financing activities | | | | | (332 | ) | | | (2,876 | ) | | | (2,389 | ) |
| | | | | | | | | | | | | | |
Net increase/(decrease) in cash and cash equivalents | | | | | 16,635 | | | | 8,929 | | | | (21,320 | ) |
| | | | | | | | | | | | | | |
Cash and cash equivalents at beginning of the year | | | | | 54,282 | | | | 45,353 | | | | 66,673 | |
Effects of exchange rate changes on cash and cash equivalents | | | | | — | | | | — | | | | — | |
| | | | | | | | | | | | | | |
Cash and cash equivalents at the end of the year | | 40 | | | 70,917 | | | | 54,282 | | | | 45,353 | |
| | | | | | | | | | | | | | |
| (1) | The Company financial statements and all related footnotes have not been audited under the standards of the Public Company Accounting Oversight Board. |
The accompanying Notes on pages 212 to 316 and the audited sections of the Risk Management Report on pages 61 to 163 form an integral part of these Financial Statements.
| | |
| Santander UK plc Annual Report 2013 | | 211 |
Financial Statements
Notes to the Financial Statements
1. ACCOUNTING POLICIES
These financial statements are prepared for Santander UK plc (the ‘Company’) and the Santander UK plc group (the ‘Santander UK group’) under the Companies Act 2006. The principal activity of the Santander UK group is the provision of an extensive range of personal financial services, and a wide range of banking and financial services to business and public sector customers.
Santander UK plc is a public limited company, incorporated in England and Wales having a registered office in England. It is an operating company undertaking banking and financial services transactions.
BASIS OF PREPARATION
These financial statements incorporate the financial statements of the Company and entities controlled by the Company (its subsidiaries) made up to 31 December each year. The financial statements have been prepared on the going concern basis using the historical cost convention, as modified by the revaluation of available-for-sale financial assets, financial assets and financial liabilities held at fair value through profit or loss and all derivative contracts, assets held for sale, retirement benefit obligations and cash-settled share based payments. An assessment of the appropriateness of the adoption of the going concern basis of accounting is disclosed in the Directors’ statement of going concern set out in the Directors’ Report on pages 189 and 190.
a) Compliance with International Financial Reporting Standards
The Santander UK group consolidated financial statements have been prepared in accordance with International Financial Reporting Standards as issued by the International Accounting Standards Board (‘IASB’), including interpretations issued by the IFRS Interpretations Committee (‘IFRIC’) of the IASB (together ‘IFRS’). The Santander UK group has also complied with its legal obligation to comply with International Financial Reporting Standards as adopted by the European Union as there are no applicable differences between the two frameworks for the periods presented.
The Company financial statements have been prepared in accordance with International Financial Reporting Standards as adopted by the European Union and as applied in accordance with the provision of the Companies Act 2006.
Disclosures required by IFRS 7 ‘Financial Instruments: Disclosure’ relating to the nature and extent of risks arising from financial instruments can be found in the Risk Management Report on pages 61 to 163 which form an integral part of these financial statements.
Recent accounting developments
In 2013, the Santander UK group adopted the following amendments to standards which became effective.
| a) | IAS 1 ‘Presentation of Financial Statements’ – In June 2011, the IASB issued amendments to IAS 1 requiring additional disclosures to be made in the other comprehensive income section such that items of other comprehensive income are grouped into two categories: (i) items that will not be reclassified subsequently to profit or loss; and (ii) items that may be reclassified subsequently to profit or loss when specific conditions are met. Income tax on items of other comprehensive income is required to be allocated on the same basis. The amendments to IAS 1 are effective for annual periods beginning on or after 1 July 2012. |
The amendments have been applied retrospectively and hence the presentation of items of other comprehensive income has been modified to reflect the changes. Other than the above mentioned presentation changes, the application of the amendments to IAS 1 did not result in any impact on profit or loss, other comprehensive income and total comprehensive income.
| b) | IAS 19 ‘Employee Benefits’ – In June 2011, the IASB issued amendments to IAS 19 that change the accounting for defined benefit plans and termination benefits. The most significant change relates to the accounting for changes in defined benefit obligations and plan assets. The amendments require the recognition of changes in defined benefit obligations and in the fair value of plan assets when they occur, and hence eliminate the ‘corridor approach’ permitted under the previous version of IAS 19 and accelerate the recognition of past service costs. All actuarial gains and losses are recognised immediately through other comprehensive income in order for the net pension asset or liability recognised in the consolidated statement of financial position to reflect the full value of the plan deficit or surplus. Furthermore, the interest cost and expected return on plan assets used in the previous version of IAS 19 are replaced with a ‘net interest’ amount under IAS 19 (2011), which is calculated by applying the discount rate to the net defined benefit liability or asset. In addition, IAS 19 (2011) introduces more extensive disclosures in the presentation of the defined benefit cost. |
For the year ended 31 December 2013, the Santander UK group has presented a ‘net interest’ amount, determined in accordance with IAS 19 (2011). Comparative amounts have not been restated as the impact has been assessed as not material.
| c) | IFRS 7 ‘Disclosures – Offsetting Financial Assets and Financial Liabilities’ - In December 2011, the IASB issued amendments to IFRS 7 which require disclosure about the effect or potential effects of netting arrangements on an entity’s financial position. The Santander UK group adopted the amendments to IFRS 7 effective for annual periods beginning on or after 1 January 2013 and has provided the incremental disclosures required by the amendments in Note 46. |
| d) | IFRS 10 ’Consolidated Financial Statements’, IFRS 11 ‘Joint Arrangements’, IFRS 12 ‘Disclosure of Interests in Other Entities’, IAS 27 ‘Separate Financial Statements’ and IAS 28 ‘Investments in Associates and Joint Ventures’ – In May 2011, the package of five standards on consolidation, joint arrangements, associates and disclosures was issued. |
| | |
| 212 | | Santander UK plc Annual Report 2013 |
Financial Statements
Notes to the Financial Statementscontinued
Subsequent to the issue of these standards, amendments to IFRS 10, IFRS 11 and IFRS 12 were issued to clarify certain transitional guidance on the first-time application of the standards.
| | • | | Under IFRS 10, control is the single basis for consolidation, irrespective of the nature of the investee; this standard therefore eliminates the risks-and-rewards approach that was used for certain special purpose entities. IFRS 10 identifies the three elements of control as power over the investee, exposure, or rights, to variable returns from involvement with the investee and the ability to use power over the investee to affect the amount of the investor’s returns. An investor must possess all three elements to conclude that it controls an investee. The assessment of control is based on all facts and circumstances, and the conclusion is reassessed if there are changes to at least one of the three elements. Retrospective application is required subject to certain transitional provisions. |
Effective 1 January 2013, the Santander UK group has reviewed its control assessments for its investees in accordance with IFRS 10 and determined that the adoption of IFRS 10 did not result in any change in the consolidation status of any of its subsidiaries and investees held during the period or comparative periods covered by these financial statements apart from the deconsolidation of the finance subsidiaries which have issued trust preferred securities as detailed in Note 34. The deconsolidation of these entities had no material impact on the income statement, balance sheet or cash flow statement in current or prior periods. The other amendments to IAS 27 did not affect the Santander UK group.
| | • | | IFRS 11 applies to all entities that are parties to a joint arrangement. A joint arrangement is an arrangement of which two or more parties have joint control. IFRS 11 establishes two types of joint arrangements, joint operations and joint ventures, which are distinguished by the rights and obligations of the parties to the arrangement. In a joint operation, the parties to the joint arrangement (referred to as ‘joint operators’) have rights to the assets and obligations for the liabilities of the arrangement. By contrast, in a joint venture, the parties to the arrangement (referred to as ‘joint venturers’) have rights to the net assets of the arrangement. IFRS 11 requires that a joint operator recognise its share of the assets, liabilities, revenues and expenses in accordance with applicable IFRSs; however, a joint venturer would account for its interest by using the equity method of accounting under IAS 28 (2011). The amendments to IAS 28 did not affect the Company. |
Santander UK group has reassessed its joint arrangement and concluded that the adoption of IFRS 11 did not result in any changes in the accounting for its joint arrangement or operations.
| | • | | IFRS 12 integrates the disclosure requirements on interests in other entities, currently included in several standards, to make it easier to understand and apply the disclosure requirements for subsidiaries, joint arrangements, associates and unconsolidated structured entities. The standard also contains additional requirements on a number of topics. Under IFRS 12, an entity should disclose information about significant judgements and assumptions (and any changes to those assumptions) made in determining whether it has control, joint control, or significant influence over another entity and the type of joint arrangement. IFRS 12 also requires additional disclosures to provide information to enable users to assess the nature of, and risks associated with the Santander UK group’s interests in other entities and the effect of those interests on the Santander UK group’s financial position, performance and cash flow. Disclosures shall be aggregated or disaggregated so that useful information is not obscured by either the inclusion of a large amount of insignificant detail or the aggregation of items that have different characteristics. The standard has been applied prospectively from 1 January 2013. The disclosures required by IFRS 12 can be found in Note 24. |
| e) | IFRS 13 ‘Fair Value Measurement’ - In May 2011, the IASB issued IFRS 13, which establishes a single source of guidance for fair value measurements and disclosures about fair value measurements. IFRS 13 defines fair value, establishes a framework for measuring fair value, and requires disclosures about fair value measurements. IFRS 13 applies to both financial instrument items and non-financial instrument items for which other IFRSs require or permit fair value measurements and disclosures about fair value measurements, except in specified circumstances. |
IFRS 13 defines fair value as the price that would be received to sell an asset or paid to transfer a liability in an orderly transaction in the principal (or most advantageous) market at the measurement date under current market conditions. Fair value under IFRS is an exit price regardless of whether that price is directly observable or estimated using another valuation technique.
IFRS 13 requires prospective application from 1 January 2013. In addition, specific transitional provisions were given to entities such that they need not apply the disclosure requirements set out in the IFRS 13 in comparative information provided for periods before the initial application of this standard. In accordance with these transitional provisions, the Santander UK group has not made any new disclosures required by IFRS 13 for the comparative periods.
The application of IFRS 13 resulted in the recognition of a debit valuation adjustment in respect of derivative liabilities of £38m for the year ended 31 December 2013. The required disclosures can be found in Note 45.
| f) | There are a number of other changes to IFRS that were effective from 1 January 2013. Those changes did not have a significant impact on the Santander UK group’s financial statements. |
Future accounting developments
The Santander UK group has not yet adopted the following significant new or revised standards and interpretations, and amendments thereto, which have been issued but which are not yet effective for the Santander UK group:
| a) | IFRS 9 ‘Financial Instruments’ – In November 2009, the IASB issued IFRS 9 ‘Financial Instruments (‘IFRS 9’) which introduced new requirements for the classification and measurement of financial assets. In October 2010, the IASB issued an amendment to IFRS 9 incorporating requirements for financial liabilities. Together, these changes represent the first phase in the IASB’s planned replacement of IAS 39 ‘Financial Instruments: Recognition and Measurement’ (‘IAS 39’) with a less complex and improved standard for financial instruments. IFRS 9 is required to be applied retrospectively but prior periods need not be restated. |
The second and third phases in the IASB’s project to replace IAS 39 will address impairment of financial assets measured at amortised cost and hedge accounting.
The IASB re-opened the requirements for classification and measurement in IFRS 9 in 2012 to address practice and other issues, with an exposure draft of revised proposals issued in November 2012 proposing limited improvements to IFRS 9. The exposure draft proposes a new category for debt instruments which is ‘fair value through other comprehensive income’ when certain criteria are met. The proposals were finalised in November 2013 and it is not yet possible to estimate the financial effects.
With a tentative vote in a separate meeting held on 24 July 2013, the IASB decided to eliminate IFRS 9’s current mandatory
| | |
| Santander UK plc Annual Report 2013 | | 213 |
Financial Statements
Notes to the Financial Statementscontinued
effective date of January 1, 2015, and will not specify a new mandatory effective date at this time. Instead, the Board plans to set an effective date when other phases of its project to replace IAS 39 are complete (i.e., when it completes its projects to (1) amend the guidance in IFRS 9 related to classification and measurement and (2) finalise guidance on the impairment of financial assets).
| b) | In December 2011, the IASB issued amendments to IAS 32 ‘Offsetting Financial Assets and Financial Liabilities’ which clarified the requirements for offsetting financial instruments and addressed inconsistencies in current practice when applying the offsetting criteria in IAS 32 ‘Financial Instruments: Presentation’. The amendments are effective for annual periods beginning on or after 1 January 2014 with early adoption permitted and are required to be applied retrospectively. It is not practicable to quantify the effect as at the date of the publication of these financial statements. |
| c) | In May 2013 IFRIC issued Interpretation 21 which provides guidance on accounting for the liability to pay a government imposed levy. IFRIC 21 is effective for annual periods beginning on or after 1 January 2014. This interpretation clarifies that the obligating event that gives rise to a liability to pay a government levy is the activity that triggers the payment of the levy as set out in the relevant legislation. An entity does not have a constructive obligation to pay a levy that will be triggered by operating in a future period. It is not practicable to provide a reasonable estimate of the effect on the financial statements until a detailed review has been completed. |
| d) | There are a number of other standards which have been issued or amended that are expected to be effective in future periods. However, it is not practicable to provide a reasonable estimate of their effects on the Santander UK group’s financial statements until a detailed review has been completed. |
b) Comparative information
As required by US public company reporting requirements, these financial statements include two years of comparative information for the consolidated income statement, consolidated statement of comprehensive income, consolidated statement of changes in equity, consolidated statement of cash flows and related Notes.
CONSOLIDATION
a) Subsidiaries
The Consolidated Financial Statements incorporate the financial statements of Santander UK plc and entities (including structured entities) controlled by the Company and its subsidiaries. Control is achieved where the Company has (i) power over the investee; (ii) is exposed, or has rights, to variable returns from its involvement with the investee; and (iii) has the ability to use its power to affect its returns. The Company reassesses whether or not it controls an investee if facts and circumstances indicate that there are changes to one or more of the three elements of control listed above.
When the Company has less than a majority of the voting rights of an investee, it has power over the investee when the voting rights are sufficient to give it the practical ability to direct the relevant activities of the investee unilaterally. The Company considers all relevant facts and circumstances in assessing whether or not the Company’s voting rights in an investee are sufficient to give it power, including:
| • | | the size of the Company’s holding of voting rights relative to the size and dispersion of holdings of the other vote holders; |
| • | | potential voting rights held by the Company, other vote holders or other parties; |
| • | | rights arising from other contractual arrangements; and |
| • | | any additional facts and circumstances that indicate that the Company has, or does not have, the current ability to direct the relevant activities at the time that decisions need to be made, including voting patterns at previous shareholders’ meetings. |
Consolidation of a subsidiary begins when the Company obtains control over the subsidiary and ceases when the Company loses control of the subsidiary. Specifically, the results of a subsidiary acquired or disposed of during the year are included in the consolidated income statement and the consolidated statement of comprehensive income from the date the Company gains control until the date when the Company ceases to control the subsidiary. Inter-company transactions, balances and unrealised gains on transactions between Santander UK group companies are eliminated; unrealised losses are also eliminated unless the cost cannot be recovered.
The acquisition method of accounting is used to account for the acquisition of subsidiaries. The cost of an acquisition is measured at the fair value of the assets given up, shares issued or liabilities undertaken at the date of acquisition. Acquisition related costs are expensed as incurred. The excess of the cost of acquisition, as well as the fair value of any interest previously held, over the fair value of the Santander UK group’s share of the identifiable net assets of the acquired subsidiary, associate or business at the date of acquisition is recorded as goodwill. When the Santander UK group loses control of a subsidiary, the profit or loss on disposal is calculated as the difference between (i) the aggregate of the fair value of the consideration received and the fair value of any retained interest and (ii) the previous carrying amount of the assets (including goodwill), less liabilities of the subsidiary and any non-controlling interests. Amounts previously recognised in other comprehensive income in relation to the subsidiary are accounted for (i.e. reclassified to profit or loss or transferred directly to retained earnings) in the same manner as would be required if the relevant assets or liabilities are disposed of. The fair value of any investment retained in the former subsidiary at the date when control is lost is regarded as the fair value on initial recognition for subsequent accounting under IAS 39 “Financial Instruments: Recognition and Measurement” or, when applicable, the costs on initial recognition of an investment in an associate or jointly controlled entity.
Transactions between entities under common control, i.e. fellow subsidiaries of Banco Santander, S.A. (the “ultimate parent”) are outside the scope of IFRS 3 – “Business Combinations”, and there is no other guidance for such situations under IFRS. The Santander UK group elects to account for transactions between entities under common control for cash consideration in a manner consistent with the approach under IFRS 3R, except for the continued disclosure of those IBNO provisions for a portfolio that cannot easily be allocated to individual loans, unless the transaction represents a reorganisation of entities within the Santander UK group, in which case the transaction is accounted for at its historical cost. Business combinations between entities under common control transacted for non-cash consideration are accounted for by the Santander UK group in a manner consistent with group reconstruction relief under UK GAAP (merger accounting).
| | |
| 214 | | Santander UK plc Annual Report 2013 |
Financial Statements
Notes to the Financial Statementscontinued
b) Associates and joint ventures
Associates are entities over which the Santander UK group has significant influence and that is neither a subsidiary nor an interest in a joint venture. Significant influence is the power to participate in the financial and operating policy decisions of the investee but is not control or joint control over those policies. Unrealised gains on transactions between the Santander UK group and its associates are eliminated to the extent of the Santander UK group’s interest in the associates; unrealised losses are also eliminated unless the transaction provides evidence of an impairment of the asset transferred. The Santander UK group’s investment in associates includes goodwill on acquisition.
Joint ventures are joint arrangements whereby the parties that have joint control of the arrangement have rights to the net assets of the joint arrangement. Joint control is the contractually agreed sharing of control of an arrangement, which exists only when decisions about the relevant activities require unanimous consent of the parties sharing control. Accounting policies have been aligned to the extent there are differences from Santander UK group’s policies.
The Santander UK group’s investments in associates and joint ventures are accounted for by the equity method of accounting and are initially recorded at cost and adjusted each year to reflect the Santander UK group’s share of the post-acquisition results of the joint venture or associate. When the Santander UK group’s share of losses of an associate or a joint venture exceeds the Santander UK group’s interest in that associate or joint venture, the Santander UK group discontinues recognising its share of further losses. Additional losses are recognised only to the extent that the Santander UK group has incurred legal or constructive obligations or made payments on behalf of the associate or joint venture.
FOREIGN CURRENCY TRANSLATION
Items included in the financial statements of each entity (including foreign branch operations) in the Santander UK group are measured using the currency that best reflects the economic substance of the underlying events and circumstances relevant to that entity (the ‘functional currency’). The Consolidated Financial Statements are presented in pounds sterling, which is the functional currency of the Company.
Income statements and cash flows of foreign entities are translated into the Santander UK group’s presentation currency at average exchange rates for the year and their balance sheets are translated at the exchange rates ruling on 31 December.
Exchange differences arising from the translation of the net investment in foreign entities are recognised in other comprehensive income. When a foreign entity is sold, such exchange differences are recognised in the income statement as part of the gain or loss on sale.
Foreign currency transactions are translated into the functional currency of the entity involved at the exchange rates prevailing at the dates of the transactions. Foreign exchange gains and losses resulting from the settlement of such transactions and from the translation of monetary assets and liabilities denominated in foreign currencies are recognised in the income statement unless recognised in other comprehensive income in connection with a cash flow hedge. Non-monetary items denominated in a foreign currency measured at historical cost are not re-translated. Exchange rate differences arising on non-monetary items measured at fair value are recognised in the consolidated income statement except for differences arising on available-for-sale equity securities which are recognised in other comprehensive income.
Exchange rate differences recognised in the consolidated income statement on items not at fair value through profit and loss were £450m expense (2012: £1,631m income, 2011: £1,814m income) and are presented in the line item net trading and funding of other items by the trading booking of net trading and other income (see Note 5). Exchange rate differences on items measured at fair value through profit or loss are included in the changes to fair value as presented in net trading and other income.
REVENUE RECOGNITION
a) Interest income and expense
Interest income on financial assets that are classified as loans and receivables or available-for-sale, and interest expense on financial liabilities other than those at fair value through profit and loss are determined using the effective interest method. The effective interest rate is the rate that discounts the estimated future cash payments or receipts over the expected life of the instrument or, when appropriate, a shorter period, to the net carrying amount of the financial asset or financial liability. When calculating the effective interest rate, the future cash flows are estimated after considering all the contractual terms of the instrument excluding future credit losses. The calculation includes all amounts paid or received by the Santander UK group that are an integral part of the overall return, direct incremental transaction costs related to the acquisition, issue or disposal of the financial instrument and all other premiums or discounts. Interest income on assets classified as loans and receivables and available-for-sale, interest expense on liabilities classified at amortised cost, and interest income and expense on hedging derivatives are recognised in interest and similar income and interest expense and similar charges in the income statement.
In accordance with IFRS, the Santander UK group recognises interest income on assets after they have been written down as a result of an impairment loss. Interest continues to be accrued on all loans and the element of interest that is not anticipated to be recovered is provided for.
b) Fee and commission income and expense
Fees and commissions that are not an integral part of the effective interest rate are recognised when the service is provided. For retail and corporate products, fee and commission income consists principally of collection services fees, commission on foreign currencies, commission and other fees received from retailers for processing credit card transactions, fees received from other credit card issuers for providing cash advances for their customers through the Santander UK group’s branch and ATM networks, annual fees payable by credit card holders and fees for non-banking financial products. Revenue from these income streams is recognised when the service is provided.
For insurance products, fee and commission income consists principally of commissions earned on the sale of building and contents insurance, life protection insurance and payment cover insurance. Revenue from these income streams is recognised when the service is provided.
Asset management fee and commission income comprises portfolio and other management advisory and service fees, investment fund management fees, and fees for private banking, financial planning and custody services. Portfolio and other management advisory and service fees are recognised based on the applicable service contracts as the service is provided. Asset management fees related to investment funds are recognised rateably over the period the service is provided. The same principle is applied for private banking, financial planning and custody services that are continuously provided over an extended period of time.
Fee and commission income which forms an integral part of the effective interest rate of a financial instrument (e.g., certain loan commitment fees) is recognised as an adjustment to the effective interest rate and recorded in “Interest income”.
| | |
| Santander UK plc Annual Report 2013 | | 215 |
Financial Statements
Notes to the Financial Statementscontinued
c) Dividend income
Except for equity securities classified as trading assets or financial assets held at fair value through profit or loss, described below, dividend income is recognised when the right to receive payment is established. This is the ex-dividend date for equity securities.
d) Net trading and other income
Net trading and other income comprises all gains and losses from changes in the fair value of financial assets and liabilities held at fair value through profit or loss (including financial assets and financial liabilities held for trading and designated as fair value through profit or loss), together with related interest income, expense and dividends. It also includes income from operating lease assets, and profits/(losses) on the sales of property, plant and equipment and subsidiary undertakings.
Changes in the fair value of financial assets and liabilities held for trading, including trading derivatives, are recognised in the income statement as net trading and other income together with dividends and interest income and expense. Changes in the fair value of assets and liabilities designated as fair value through profit or loss are recognised in net trading and other income together with dividends, accrued interest income and expense and changes in fair value of derivatives managed in conjunction with these assets and liabilities. Changes in fair value of derivatives in a fair value hedging relationship are recognised in net trading and other income.
BORROWING COSTS
Borrowing costs directly attributable to the acquisition, construction or production of qualifying assets, including computer software, which are assets that necessarily take a substantial period of time to develop for their intended use, are added to the cost of those assets, until such time as the assets are substantially ready for their intended use. All other borrowing costs are recognised in profit or loss in the period in which they occur.
PENSIONS AND OTHER POST RETIREMENT BENEFITS
The Santander UK group operates various pension schemes. The schemes are generally funded through payments to insurance companies or trustee-administered funds, as determined by periodic actuarial calculations. A defined benefit plan is a pension plan that guarantees an amount of pension benefit to be provided, usually as a function of one or more factors such as age, years of service or compensation. A defined contribution plan is a pension plan under which the Santander UK group pays fixed contributions as they fall due into a separate entity (a fund). The pension paid to the member at retirement is based on the amount in the separate fund for each member. The Santander UK group has no legal or constructive obligations to pay further contributions into the fund to “top up” benefits to a certain guaranteed level. Pension costs are charged to the line item ‘Administration expenses’, with the net interest on the defined benefit asset or liability included within ‘Net interest income’ in the income statement.
a) Defined benefit plans
The asset or liability recognised in respect of defined benefit pension plans is the present value of the defined benefit obligation at the balance sheet date, less the fair value of plan assets. The defined benefit obligation is calculated annually by independent actuaries using the projected unit credit method. The assets of the schemes are measured at their fair values at the balance sheet date. Full actuarial valuations of the Santander UK group’s principal defined benefit schemes are carried out on a triennial basis. Each scheme’s Trustee is responsible for the actuarial valuations and in doing so considers or relies in part on a report of a third party expert.
The present value of the defined benefit obligation is estimated by projecting forward the growth in current accrued pension benefits to reflect inflation and salary growth to the date of pension payment, then discounted to present value using an interest rate applicable to high-quality AA rated corporate bonds of the same currency and which have terms to maturity closest to the terms of the scheme liabilities, adjusted where necessary to match those terms. In determining the value of scheme liabilities, demographic and financial assumptions are made by management about mortality, inflation, discount rates, pension increases and earnings growth, based on past experience. Financial assumptions are based on market conditions at the balance sheet date and can generally be derived objectively. Demographic assumptions require a greater degree of estimation and judgement to be applied to externally derived data. Any surplus or deficit of scheme assets over liabilities is recognised in the balance sheet as an asset (surplus) or liability (deficit). An asset is only recognised to the extent that the surplus can be recovered through reduced contributions in the future or through refunds from the scheme.
The income statement includes the net interest income/expense on the net defined benefit liability/asset, current service cost and any past service cost and gain or loss on settlement. Remeasurement of defined benefit pension schemes, including return on scheme assets (excludes amounts included in net interest), actuarial gains and losses arising from changes in financial assumptions and changes in actuarial assumptions and the effect of the changes to the asset ceiling (if applicable) are recognised in other comprehensive income. Remeasurement recognised in other comprehensive income will not be reclassified to the income statement. Past-service costs are recognised as an expense in the income statement at the earlier of when the plan amendment or curtailment occurs and when the related restructuring costs or termination benefits are recognised. Curtailments include the impact of significant reductions in the number of employees covered by a plan, or amendments to the terms of the plan so that a significant element of future service will no longer qualify for benefits or will qualify only for reduced benefits. Curtailment gains and losses on businesses that meet the definition of discontinued operations are included in profit or loss for the year from discontinued operations. Gains and losses on settlements are recognised when the settlement occurs.
b) Defined contribution plans
For defined contribution plans, the Santander UK group pays contributions to publicly or privately administered pension insurance plans on a mandatory, contractual or voluntary basis. Once the contributions have been paid, the Santander UK group has no further payment obligation. The regular contributions constitute net periodic costs for the year in which they are due and are included in staff costs which are presented in Administration expenses in the income statement.
c) Post-retirement medical benefit plans
Post-retirement medical benefit liabilities are determined using the Projected Unit Credit Method, with actuarial valuations updated at each yearend. The expected benefit costs are accrued over the period of employment using an accounting methodology similar to that for the defined benefit pension scheme.
| | |
| 216 | | Santander UK plc Annual Report 2013 |
Financial Statements
Notes to the Financial Statementscontinued
SHARE-BASED PAYMENTS
The Santander UK group engages in cash-settled and equity-settled share-based payment transactions in respect of services received from certain of its employees. Shares of the Santander UK group’s parent, Banco Santander, S.A. are purchased in the open market by the Santander UK group (for the Employee Sharesave scheme) or are purchased by Banco Santander, S.A. or another Banco Santander group company (for awards granted under the Long Term Incentive Plan and the Deferred Shares Bonus Plan) to satisfy share options as they vest.
Options granted under the Employee Sharesave scheme are accounted for as cash-settled share-based payment transactions. Awards granted under the Long-Term Incentive Plan and Deferred Shares Bonus Plan are accounted for as equity-settled share-based payment transactions.
The fair value of the services received is measured by reference to the fair value of the shares or share options initially on the date of the grant for both the cash and equity settled share-based payments and then subsequently at each reporting date for the cash settled share-based payments. The cost of the employee services received in respect of the shares or share options granted is recognised in the income statement within administration expenses, over the period that the services are received, which is the vesting period.
A liability equal to the portion of the goods or services received is recognised at the current fair value determined at each balance sheet date for cash-settled share-based payments. A liability equal to the amount to be reimbursed to Banco Santander, S.A. is recognised at the current fair value determined at the grant date for equity-settled share-based payments.
The fair value of the options granted under the Employee Sharesave scheme is determined using an option pricing model, which takes into account the exercise price of the option, the current share price, the risk free interest rate, the expected volatility of the Banco Santander, S.A. share price over the life of the option and the dividend growth rate. The fair value of the awards granted for the Long Term Incentive Plan was determined at the grant date using an option pricing model, which takes into account the share price at grant date, the risk free interest rate, the expected volatility of the Banco Santander, S.A. share price over the life of the award and the dividend growth rate. Vesting conditions included in the terms of the grant are not taken into account in estimating fair value, except for those that include terms related to market conditions. Non-market vesting conditions are taken into account by adjusting the number of shares or share options included in the measurement of the cost of employee service so that ultimately, the amount recognised in the income statement reflects the number of vested shares or share options.
Where an award has been modified, as a minimum, the expense of the original award continues to be recognised as if it had not been modified. Where the effect of a modification is to increase the fair value of an award or increase the number of equity instruments, the incremental fair value of the award or incremental fair value of the modification of the award is recognised in addition to the expense of the original grant, measured at the date of modification, over the modified vesting period.
A cancellation that occurs during the vesting period is treated as an acceleration of vesting, and recognised immediately for the amount that would otherwise have been recognised for services over the vesting period.
GOODWILL AND OTHER INTANGIBLE ASSETS
Goodwill represents the excess of the cost of an acquisition, as well as the fair value of any interest previously held, over the fair value of the Santander UK group’s share of the identifiable net assets of the acquired subsidiary, associate, or business at the date of acquisition. Goodwill on the acquisition of subsidiaries and businesses is included in Intangible assets. Goodwill on acquisitions of associates is included as part of Investment in associates. Goodwill is tested for impairment at each balance sheet date, or more frequently when events or changes in circumstances dictate, and carried at cost less accumulated impairment losses. Gains and losses on the disposal of an entity or business include the carrying amount of goodwill relating to the entity or business sold.
Other intangible assets are recognised if they arise from contracted or other legal rights or if they are capable of being separated or divided from the Santander UK group and sold, transferred, licensed, rented or exchanged. The value of such intangible assets is amortised on a straight-line basis over the useful economic life of the assets in question, which ranges from three to seven years. Other intangible assets are reviewed annually for impairment indicators and tested for impairment where indicators are present.
Marketing rights are capitalised when they are separately identifiable contractual agreements that are expected to provide future economic benefits and the costs are separately identifiable. The value of the marketing rights is classified in intangible assets on the balance sheet and amortised on a straight-line basis over their useful life of five to seven years.
Software development costs are capitalised when they are direct costs associated with identifiable and unique software products that are expected to provide future economic benefits and the cost of these products can be measured reliably. These costs include payroll, the costs of materials and services and directly attributable overheads. Internally developed software meeting these criteria and externally purchased software are classified in intangible assets on the balance sheet and amortised on a straight-line basis over their useful life of three to seven years, unless the software is an integral part of the related computer hardware, in which case it is treated as property, plant and equipment as described below. Capitalisation of costs ceases when the software is capable of operating as intended. Costs associated with maintaining software programmes are expensed as incurred.
PROPERTY, PLANT AND EQUIPMENT
Property, plant and equipment include owner-occupied properties (including leasehold properties), office fixtures and equipment and computer software. Property, plant and equipment are carried at cost less accumulated depreciation and accumulated impairment losses. A review for indications of impairment is carried out at each reporting date. Gains and losses on disposal are determined by reference to the carrying amount and are reported in net trading and other income. Repairs and renewals are charged to the income statement when the expenditure is incurred. Internally developed software meeting the criteria set out in “Goodwill and other intangible assets” above and externally purchased software are classified in property, plant and equipment on the balance sheet where the software is an integral part of the related computer hardware.
Classes of property, plant and equipment are depreciated on a straight-line basis over their useful life, as follows:
| | |
Owner-occupied properties | | Not exceeding 50 years |
Office fixtures and equipment | | 3 to 15 years |
Computer software | | 3 to 7 years |
Depreciation is not charged on freehold land and assets under construction.
| | |
| Santander UK plc Annual Report 2013 | | 217 |
Financial Statements
Notes to the Financial Statementscontinued
FINANCIAL ASSETS
The Santander UK group classifies its financial assets as: financial assets at fair value through profit or loss, loans and receivables, available-for-sale and held to maturity financial assets. Management determines the classification of its financial assets at initial recognition. Financial assets that are classified at fair value through profit or loss, which have not been designated as such or are not accounted for as derivatives, or assets classified as available-for-sale, may subsequently in rare circumstances, be reclassified from the fair value through profit or loss category to the loans and receivables, available-for-sale or held to maturity categories. In order to meet the criteria for reclassification, the asset must no longer be held for the purpose of selling or repurchasing in the near term and must also meet the definition of the category into which it is to be reclassified had it not been required to classify it at fair value through profit or loss at initial recognition. The reclassified value is the fair value of the asset at the date of reclassification. The Santander UK group has not utilised this option and therefore has not reclassified any assets from the fair value through profit or loss category that were classified as such at initial recognition.
a) Financial assets at fair value through profit or loss
Financial assets are classified as fair value through profit or loss if they are either held for trading or otherwise designated at fair value through profit or loss on initial recognition. A financial asset is classified as held for trading if it is a derivative or it is acquired principally for the purpose of selling in the near term, or forms part of a portfolio of financial instruments that are managed together and for which there is evidence of short-term profit taking.
In certain circumstances financial assets other than those that are held for trading are designated at fair value through profit or loss where this results in more relevant information because it significantly reduces a measurement inconsistency that would otherwise arise from measuring assets or recognising the gains or losses on them on a different basis, where the assets are managed and their performance evaluated on a fair value basis, or where a financial asset contains one or more embedded derivatives which are not closely related to the host contract.
Trading assets, derivative financial instruments and financial assets designated at fair value are classified as fair value through profit or loss. They are derecognised when the rights to receive cash flows from the asset have expired or when the Santander UK group has transferred substantially all the risks and rewards of ownership.
b) Loans and receivables
Loans and receivables are non-derivative financial assets with fixed or determinable payments, that are not quoted in an active market and which are not classified as available-for-sale or fair value through profit or loss. They arise when the Santander UK group provides money or services directly to a customer with no intention of trading the loan. Loans and receivables are initially recognised at fair value including direct and incremental transaction costs. They are subsequently valued at amortised cost, using the effective interest method. They are derecognised when the rights to receive cash flows have expired or the Santander UK group has transferred substantially all of the risks and rewards of ownership. Loans and receivables consist of loans and advances to banks, loans and advances to customers, and loans and receivables securities.
c) Available-for-sale financial assets
Available-for-sale financial assets are non-derivative financial assets that are designated as available-for-sale and are not categorised into any of the other categories described. They are initially recognised at fair value including direct and incremental transaction costs. They are subsequently held at fair value. Gains and losses arising from changes in fair value of available-for-sale securities are recognised in other comprehensive income until sale or until determined to be impaired when the cumulative gain or loss or impairment losses are transferred to the income statement. Where the financial asset is interest-bearing, interest is determined using the effective interest method.
Income on investments in equity shares, debt instruments and other similar interests is recognised in the income statement as and when dividends are declared and interest is accrued. Impairment losses and foreign exchange translation differences on monetary items are recognised in the income statement. The investments are derecognised when the rights to receive cash flows have expired or the Santander UK group has transferred substantially all the risks and rewards of ownership.
d) Held to maturity investments
Held to maturity investments are non-derivative financial assets with fixed or determinable payments and fixed maturity that an entity has the positive intention and ability to hold to maturity. Held to maturity investments are initially recognised at fair value including direct and incremental transaction costs. They are subsequently valued at amortised cost, using the effective interest method. They are derecognised when the rights to receive cash flows have expired or the Santander UK group has transferred substantially all of the risks and rewards of ownership. Were the Santander UK group to sell other than an insignificant amount of held to maturity assets, the entire category would be tainted and reclassified as available-for-sale.
The Santander UK group does not hold any held to maturity financial assets.
| | |
| 218 | | Santander UK plc Annual Report 2013 |
Financial Statements
Notes to the Financial Statementscontinued
VALUATION OF FINANCIAL INSTRUMENTS
Financial instruments that are classified or designated at fair value through profit or loss, including those held for trading purposes, or available-for-sale, and all derivatives are stated at fair value. The fair value of such financial instruments is the price that would be received to sell an asset or paid to transfer a liability in an orderly transaction between market participants at the measurement date in the principal, or in its absence, the most advantageous market to which Santander UK group has access at that date. The fair value of a liability reflects its non-performance risk.
Changes in the valuation of such financial instruments, including derivatives, are included in the line item ‘Net trading and other income’ in the income statement or in ‘Other comprehensive income’ in the statement of comprehensive income as applicable.
a) Initial measurement
The best evidence of the fair value of a financial instrument at initial recognition is the transaction price unless the valuation is evidenced by comparison with other observable current market transactions in the same instrument or based on a valuation technique whose variables include significant data from observable markets. Any difference between the transaction price and the value based on a valuation technique where the inputs are not based on data from observable current markets is not recognised in profit or loss on initial recognition. Subsequent gains or losses are only recognised to the extent that they arise from a change in a factor that market participants would consider in setting a price.
b) Subsequent measurement
The Santander UK group applies the following fair value hierarchy that prioritises the inputs to valuation techniques used in measuring fair value. The hierarchy establishes three categories for valuing financial instruments, giving the highest priority to unadjusted quoted prices in active markets for identical assets or liabilities and the lowest priority to unobservable inputs. The three categories are: quoted prices in active markets (Level 1), internal models based on observable market data (Level 2) and internal models based on other than observable market data (Level 3). If the inputs used to measure an asset or a liability fall to different levels within the hierarchy, the classification of the entire asset or liability will be based on the lowest level input that is significant to the overall fair value measurement of the asset or liability.
The Santander UK group categorises assets and liabilities measured at fair value within the fair value hierarchy based on the inputs to the valuation techniques as follows:
| | |
Level 1: | | Unadjusted quoted prices for identical assets or liabilities in an active market that the Santander UK group has the ability to access at the measurement date. Level 1 positions include debt securities, equity securities, exchange traded derivatives and short positions in securities. |
| |
Level 2: | | Quoted prices in non-active markets, quoted prices for similar assets or liabilities, recent market transactions, inputs other than quoted market prices for the asset or liability that are observable either directly or indirectly for substantially the full term, and inputs to valuation techniques that are derived principally from or corroborated by observable market data through correlation or other statistical means for substantially the full term of the asset or liability. Level 2 positions include loans and advances to banks, loans and advances to customers, equity securities, exchange rate derivatives, interest rate derivatives, equity and credit derivatives, debt securities, deposits by banks, deposits by customers and debt securities in issue. |
| |
Level 3: | | Inputs to the pricing or valuation techniques that are significant to the overall fair value measurement of the asset or liability are unobservable. Level 3 positions include exchange rate derivatives, equity and credit derivatives, loans and advances to customers, debt securities, and debt securities in issue. |
The Santander UK group assesses active markets for equity instruments based on the average daily trading volume both in absolute terms and relative to the market capitalisation for the instrument. The Santander UK group assesses active markets for debt instruments based on both the average daily trading volume and the number of days with trading activity. The Santander UK group assesses active markets for exchange traded derivatives based on the average daily trading volume both in absolute terms and relative to the market capitalisation for the instrument.
Market activity and liquidity is discussed in the relevant monthly Risk Forum as well as being part of the daily update given by each business at the start of the trading day. This information, together with the observation of active trading and the magnitude of the bid-offer spreads allow consideration of the liquidity of a financial instrument.
Underlying assets and liabilities are reviewed to consider the appropriate adjustment to mark the mid price reported in the trading systems to a fair value. This process takes into account the liquidity of the position in the size of the adjustment required. These liquidity adjustments are presented and discussed at the monthly Risk Forum.
In determining the appropriate measurement levels, the Santander UK group performs regular analyses on the assets and liabilities. Underlying assets and liabilities are regularly reviewed to determine whether a position should be regarded as illiquid; the most important practical consideration being the observability of trading. Where the bid-offer spread is observable, this is tested against actual trades. Changes in the observability of significant valuation inputs during the reporting period may result in a transfer of assets and liabilities within the fair value hierarchy. The Santander UK group recognises transfers between levels of the fair value hierarchy when there is a significant change in either its principal market or the level of observability of the inputs to the valuation techniques as at the end of the reporting period.
The Santander UK group manages certain groups of financial assets and liabilities on the basis of its net exposure to either market risks or credit risk. As a result it has elected to use the exception under IFRS 13 which permits the fair value measurement of a group of financial assets and financial liabilities on the basis of the price that would be received to sell a net long position for a particular risk exposure or paid to transfer a net short position for a particular risk exposure in an orderly transaction between market participants at the measurement date under current market conditions.
Financial instruments valued using observable market prices
If a quoted market price in an active market is available for an instrument, the fair value is calculated as the current bid price multiplied by the number of units of the instrument held.
| | |
| Santander UK plc Annual Report 2013 | | 219 |
Financial Statements
Notes to the Financial Statementscontinued
Financial instruments valued using a valuation technique
In the absence of a quoted market price in an active market, management uses internal models to make its best estimate of the price that the market would set for that financial instrument. In order to make these estimations, various techniques are employed, including extrapolation from observable market data and observation of similar financial instruments with similar characteristics. Wherever possible, valuation parameters for each product are based on prices directly observable in active markets or that can be derived from directly observable market prices. Valuation parameters for each type of financial instrument are discussed in Note 45. Chosen valuation techniques incorporate all the factors that market participants would take into account in pricing transactions.
Unrecognised gains as a result of the use of valuation models using unobservable inputs (‘Day One profits’)
The timing of recognition of deferred day one profit and loss is determined individually. It is deferred until either the instrument’s fair value can be determined using market observable inputs or is realised through settlement. The financial instrument is subsequently measured at fair value, adjusted for the deferred day one profit and loss. Subsequent changes in fair value are recognised immediately in the consolidated income statement without immediate reversal of deferred day one profits and losses.
“REGULAR WAY” PURCHASES OF FINANCIAL ASSETS AND ISSUES OF FINANCIAL LIABILITIES
A regular way purchase is a purchase of a financial asset under a contract whose terms require delivery of the asset within the timeframe established generally by regulation or convention in the market place concerned. Regular way purchases of financial assets classified as loans and receivables are recognised on settlement date; all other regular way purchases are recognised on trade date. The assets are derecognised when the rights to receive cash flows have expired or the Santander UK group has transferred substantially all the risks and rewards of ownership. Issues of equity or financial liabilities measured at amortised cost are recognised on settlement date; all other regular way issues are recognised on trade date. The liabilities are derecognised when extinguished.
OFFSETTING FINANCIAL ASSETS AND LIABILITIES
Financial assets and liabilities including derivatives are offset and the net amount reported in the balance sheet when there is a legally enforceable right to set off the recognised amounts and there is an intention to settle on a net basis, or realise the asset and settle the liability simultaneously. The Santander UK group is party to a number of arrangements, including master netting arrangements under industry standard agreements which facilitate netting of transactions in jurisdictions where netting agreements are recognised and have legal force. The netting arrangements do not generally result in an offset of balance sheet assets and liabilities for accounting purposes, as transactions are usually settled on a gross basis.
SALE AND REPURCHASE AGREEMENTS (INCLUDING STOCK BORROWING AND LENDING)
Securities sold subject to a commitment to repurchase them at a predetermined price (‘repos’) under which substantially all the risks and rewards of ownership are retained by the Santander UK group remain on the balance sheet and a liability is recorded in respect of the consideration received. Securities purchased under commitments to resell (‘reverse repos’) are not recognised on the balance sheet and the consideration paid is recorded as an asset. The difference between the sale and repurchase price is treated as trading income in the income statement, except where the repo is not treated as part of the trading book, in which case the difference is recorded in interest income or expense.
Securities lending and borrowing transactions are generally secured, with collateral taking the form of securities or cash advanced or received. Securities lent or borrowed are not reflected on the balance sheet. Collateral in the form of cash received or advanced is recorded as a deposit or a loan. Collateral in the form of securities is not recognised.
DERIVATIVE FINANCIAL INSTRUMENTS
Derivative financial instruments (‘derivatives’) are contracts or agreements whose value is derived from one or more underlying indices or asset values inherent in the contract or agreement, which require no or little initial net investment and are settled at a future date. Transactions are undertaken in interest rate, cross currency, equity, residential property and other index-related swaps, forwards, caps, floors, swaptions, as well as credit default and total return swaps, equity index contracts and exchange traded interest rate futures, and equity index options.
Derivatives are held for trading or for risk management purposes. Derivatives are classified as held for trading unless they are designated as being in a hedge relationship. The Santander UK group chooses to designate certain derivatives as in a hedging relationship if they meet specific criteria, as further described within ‘hedge accounting’ below.
Derivatives are recognised initially (on the date on which a derivative contract is entered into), and are subsequently remeasured, at their fair value. Fair values of exchange-traded derivatives are obtained from quoted market prices. Fair values of over-the-counter derivatives are obtained using valuation techniques, including discounted cash flow and option pricing models.
Derivatives may be embedded in other financial instruments, such as the conversion option in a convertible bond. Embedded derivatives are treated as separate derivatives when their economic characteristics and risks are not closely related to those of the host contract; the terms of the embedded derivative would meet the definition of a stand-alone derivative if they were contained in a separate contract; and the combined contract is not held for trading or designated at fair value. These embedded derivatives are measured at fair value with changes in fair value recognised in the income statement. Contracts containing embedded derivatives are not subsequently reassessed for separation unless either there has been a change in the terms of the contract which significantly modifies the cash flows (in which case the contract is reassessed at the time of modification) or the contract has been reclassified (in which case the contract is reassessed at the time of reclassification).
All derivatives are carried as assets when their fair value is positive and as liabilities when their fair value is negative, except where netting is permitted. The method of recognising fair value gains and losses depends on whether derivatives are held for trading or are designated as hedging instruments and, if the latter, the nature of the risks being hedged. All gains and losses from changes in the fair value of derivatives held for trading are recognised in the income statement, and included within net trading and other income.
| | |
| 220 | | Santander UK plc Annual Report 2013 |
Financial Statements
Notes to the Financial Statementscontinued
HEDGE ACCOUNTING
Santander UK plc group applies hedge accounting to represent, to the maximum possible extent permitted under accounting standards, the economic effects of its risk management strategies. Derivatives are used to hedge interest rate, exchange rate and exposures to certain indices such as retail price indices.
At the time a financial instrument is designated as a hedge (i.e., at the inception of the hedge), the Santander UK group formally documents the relationship between the hedging instrument(s) and hedged item(s), its risk management objective and strategy for undertaking the hedge. The documentation includes the identification of each hedging instrument and respective hedged item, the nature of the risk being hedged (including the benchmark interest rate being hedged in a hedge of interest rate risk) and how the hedging instrument’s effectiveness in offsetting the exposure to changes in the hedged item’s fair value attributable to the hedged risk is to be assessed. Accordingly, the Santander UK group formally assesses, both at the inception of the hedge and on an ongoing basis, whether the hedging derivatives have been and will be highly effective in offsetting changes in the fair value attributable to the hedged risk during the period that the hedge is designated. A hedge is normally regarded as highly effective if, at inception and throughout its life, the Santander UK group can expect, and actual results indicate, that changes in the fair value or cash flow of the hedged items are effectively offset by changes in the fair value or cash flow of the hedging instrument. If at any point it is concluded that it is no longer highly effective in achieving its documented objective, hedge accounting is discontinued.
Where derivatives are held for risk management purposes, and when transactions meet the required criteria for documentation and hedge effectiveness, the derivatives may be designated as either: (i) hedges of the change in fair value of recognised assets or liabilities or firm commitments (‘fair value hedges’); (ii) hedges of the variability in highly probable future cash flows attributable to a recognised asset or liability, or a forecast transaction (‘cash flow hedges’); or (iii) a hedge of a net investment in a foreign operation (‘net investment hedges’). The Santander UK group applies fair value hedge accounting and cash flow hedge accounting but not hedging of a net investment in a foreign operation.
a) Fair value hedge accounting
Changes in the fair value of derivatives that are designated and qualify as fair value hedges are recorded in the income statement, together with the changes in the fair value of the hedged asset or liability that are attributable to the hedged risk. Where the hedged item is measured at amortised cost, the fair value changes due to the hedged risk adjust the carrying amount of the hedged asset or liability. Changes in the fair value of portfolio hedged items are presented separately in the consolidated balance sheet position in Macro hedge of interest rate risk and recognised in the consolidated income statement as income or expenses on financial assets and liabilities held for trading. If the hedge no longer meets the criteria for hedge accounting, changes in the fair value of the hedged item attributable to the hedged risk are no longer recognised in the income statement. For fair value hedges of interest rate risk, the cumulative adjustment that has been made to the carrying amount of the hedged item is amortised to the income statement using the effective interest method over the period to maturity. For portfolio hedged items, the cumulative adjustment is amortised to the income statement using the straight line method over the period to maturity.
b) Cash flow hedge accounting
The effective portion of changes in the fair value of qualifying cash flow hedges is recognised in other comprehensive income in the cash flow hedging reserve. The gain or loss relating to the ineffective portion is recognised immediately in the income statement. Amounts accumulated in equity are reclassified to the income statement in the periods in which the hedged item affects profit or loss. When a hedging instrument expires or is sold, or when a hedge no longer meets the criteria for hedge accounting, any cumulative gain or loss existing in equity at that time remains in equity and is recognised in the income statement when the forecast transaction is ultimately recognised in the income statement. When a forecast transaction is no longer expected to occur, the cumulative gain or loss that was reported in equity is immediately transferred to the income statement.
Santander UK group is exposed to cash flow interest rate risk on its floating rate assets and foreign currency risk on its fixed rate debt issuances denominated in foreign currency. Cash flow hedging is used to hedge the variability in cash flows arising from both these risks.
SECURITISATION TRANSACTIONS
The Santander UK group has entered into certain arrangements where undertakings have issued mortgage-backed and other asset-backed securities or have entered into funding arrangements with lenders in order to finance specific loans and advances to customers. As the Santander UK group has retained substantially all the risks and rewards of the underlying assets, such financial instruments continue to be held on the Santander UK group balance sheet, and a liability recognised for the proceeds of the funding transaction.
| | |
| Santander UK plc Annual Report 2013 | | 221 |
Financial Statements
Notes to the Financial Statementscontinued
IMPAIRMENT OF FINANCIAL ASSETS
At each balance sheet date the Santander UK group assesses whether, as a result of one or more events occurring after initial recognition, there is objective evidence that a financial asset or group of financial assets classified as loans and receivables, available-for-sale or loans and receivables securities have become impaired. Evidence of impairment varies across different portfolios and may include indications that the borrower or group of borrowers have defaulted, are experiencing significant financial difficulty, or the debt has been restructured potentially reducing the burden to the borrower. Impairment losses are recorded as charges in the income statement and the carrying amount of the financial asset or group of financial assets is reduced by establishing an impairment loss allowance. Impairment loss allowances are maintained at the level that management deems sufficient to absorb incurred losses in the Santander UK group’s loans. Losses expected from future events are not recognised.
Impairment losses are assessed individually for financial assets that are individually significant and individually or collectively for assets that are not individually significant. An impairment loss allowance for incurred observed losses is established for all past due loans after a specified period of repayment default where it is probable that some of the capital or interest will not be repaid or recovered through enforcement of any applicable security. An allowance for incurred inherent losses is established for loans for which no evidence of loss has been specifically identified on an individual basis because the loans are not yet past due (i.e. incurred but not observed (‘IBNO’)) but are known from past experience to have deteriorated since the initial decision to lend was made. An example of this situation is where a borrower has not yet missed a payment but is experiencing financial difficulties at the reporting date, e.g. due to loss of employment, divorce or bereavement. In these circumstances, an inherent loss had been incurred at the reporting date.
Impairment loss allowances for loans and advances, less amounts released and recoveries of amounts written off are charged to the line item ‘Impairment losses on loans and advances’ in the income statement. The impairment loss allowances are deducted from the ‘Loans and advances to banks’, ‘Loans and advances to customers’ and ‘Loans and receivables securities’ line items on the balance sheet.
a) Loans and receivables
i) Retail assets
Retail assets are assessed either individually or collectively for impairment. An impairment loss is incurred if there is objective evidence that a loss event has occurred since initial recognition of the assets that has an impact on the estimated future cash flows of the assets.
Potential indicators of loss events
Potential indicators of loss events which may be evidence of financial difficulty for a retail borrower may include a request from a borrower to change contractual terms; the borrower notifying the Santander UK group of current or likely financial distress; contact from a debt management company; a change in payment source, lump sum payments and changes in activity or arrears on other accounts held by the borrower.
Individual assessment
For individually assessed assets, the Santander UK group measures the amount of the loss as the difference between the carrying amount of the asset and the present value of the estimated future cash flows from the asset discounted at the original effective interest rate of the asset.
Collective assessment
Impairment is assessed on a collective basis in two circumstances to cover losses which have been:
| • | | Incurred but have not yet been identified (i.e. IBNO losses); and |
In making a collective assessment for impairment, financial assets are grouped together according to their credit risk characteristics. These can include grouping by product, loan-to-value, brand, geography, type of customer and previous insolvency events. For each such portfolio or sub-segment of the portfolio, future cash flows are estimated through the use of historical loss experience. The historical loss experience is adjusted for current observable data, including estimated current property prices to reflect the effects of current conditions not affecting the period of historical experience. The loss is discounted at the effective interest rate, except where portfolios meet the criteria for short-term receivables. The unwind of the discount over time is reported through interest and other similar income within the income statement, with an increase to the impairment loss allowances on the balance sheet.
For each portfolio, the impairment loss allowance is calculated as the product of the number of accounts in the portfolio, the estimated proportion of accounts that will be written off, or repossessed in the case of mortgage loans (the ‘loss propensity’), the estimated proportion of such cases that will result in a loss (the ‘loss factor’) and the average loss incurred (the ‘loss per case’). Separate assessments are performed with respect to observed losses and IBNO losses.
The loss propensity for the observed segment represents the percentage of cases that will ultimately be written off. For the IBNO segment (i.e. where the account is currently up to date), the loss propensity represents the percentage of such cases that are expected to miss a payment in the appropriate emergence period and which will ultimately be written off. The loss propensities are based on recent historical experience, typically covering a period of no more than the most recent six months in the year under review.
The loss per case is based on actual cases using the most recent six month average data of losses that have been incurred during the most recent month for which data is available in the year under review (typically December), and is then discounted using an appropriate rate. Based on historical experience, the gross loss per case is realised in cash several months after the customer first defaults, during which time interest and fees and charges continue to accrue on the account. The future fees and charges included in the gross loss per case are removed and the balance discounted so as to calculate the present value of the loss per case. The discounted loss per case for accounts where a payment has already been missed (i.e. observed losses) is higher than for accounts that are up to date (i.e. IBNO losses) because the discounting effect is lower reflecting the fact that the process to recover the funds is further advanced.
| | |
| 222 | | Santander UK plc Annual Report 2013 |
Financial Statements
Notes to the Financial Statementscontinued
Incurred but not observed impairment loss allowances
Individually assessed loans for which no evidence of loss has been specifically identified on an individual basis are grouped together according to their credit risk characteristics for the purpose of calculating an allowance for IBNO losses. Such losses will only be individually identified in the future. As soon as information becomes available which identifies incurred losses on individual loans within the group, those loans are removed from the group and assessed for observed losses.
The allowance for IBNO losses is determined on a portfolio basis by applying the impairment loss allowances methodology outlined above to these accounts after taking into account:
| • | | historical loss experience in portfolios of similar credit risk characteristics (for example, by product); |
| • | | the estimated period between an impairment event occurring and the loss being identified and evidenced by the establishment of an observed loss allowance against the individual loan (known as the emergence period, as discussed below); and |
| • | | management’s judgement as to whether current economic and credit conditions are such that the actual level of inherent losses at the balance sheet date is likely to be greater or less than that suggested by historical experience. |
The emergence period
This is the period which the Santander UK group’s statistical analysis shows to be the period in which losses that had been incurred but have not been separately identified at the balance sheet date, become evident as the loans turn into past due. Based on the Santander UK group’s statistical analysis at 31 December 2013 and 2012, the emergence period was two to three months for unsecured lending and 12 months for secured lending. The longer emergence period for secured lending reflects the fact that a customer is more likely to default on unsecured debt before defaulting on secured lending. The factors considered in determining the length of the emergence period for unsecured lending are recent changes in customers’ debit/credit payment profiles and credit scores. The factors considered for secured lending are the frequency and duration of exceptions from adherence to the contractual payment schedule.
Observed impairment loss allowances
An impairment loss allowance for observed losses is established for all past due loans where it is probable that some of the capital will not be repaid or recovered through enforcement of any applicable security. Loans for which evidence of potential loss has been specifically identified are grouped together according to their credit risk characteristics for the purpose of calculating an estimated allowance for observed losses.
The allowance for observed losses is determined on a collective (or ‘portfolio’) basis by applying the impairment loss allowances methodology outlined above for IBNO losses to these accounts, with the exception that no consideration is given to an emergence period, as the losses are already observed.
Generally, the length of time before an asset is placed on default status for an impairment loss review is when at least one payment is missed. Repayment default periods vary depending on the nature of the collateral that secures the advances. On advances secured by residential or commercial property, the default period is three months. For advances secured by consumer goods such as cars or computers, the default period is less than three months, the exact period being dependent on the particular type of loan. On unsecured advances, such as personal term loans, the default period is generally three months. Exceptions to the general rule exist with respect to revolving facilities, such as bank overdrafts, which are placed on default upon a breach of the contractual terms governing the applicable account.
Reversals of impairment
If in a subsequent period, the amount of an impairment loss reduces and the reduction can be related objectively to an event occurring after the impairment was recognised, the excess is written back by reducing the impairment loss allowance accordingly. The write-back is recognised in the income statement.
Write-off
For secured loans, a write-off is only made when all collection procedures have been exhausted and the security has been sold or from claiming on any mortgage indemnity guarantee or other insurance. There is no threshold based on past due status beyond which all secured loans are written off as there can be significant variations in the time needed to enforce possession and sale of the security, especially due to the different legal frameworks that apply in different regions of the UK. For unsecured loans, a write-off is only made when all internal avenues of collecting the debt have been exhausted and the debt is passed over to external collection agencies. A past due threshold is applied to unsecured debt where accounts that are 180 days past due are written off unless there is a dispute awaiting resolution. Contact is made with customers with the aim to achieve a realistic and sustainable repayment arrangement. Litigation and/or enforcement of security is usually carried out only when the steps described above have been undertaken without success.
All write-offs are on a case-by-case basis, taking account of the exposure at the date of write-off, after accounting for the value from any collateral or insurance held against the loan. The exception to this is in cases where fraud has occurred, where the exposure is written off once full investigations have been completed and the probability of recovery is minimal. The time span between discovery and write-off will be short and may not result in an impairment loss allowance being raised. The write-off policy is regularly reviewed. Write-offs are charged against previously established impairment loss allowances.
Recoveries
Recoveries of impairment losses are not included in the impairment loss allowance, but are taken to income and offset against impairment losses. Recoveries of impairment losses are classified in the income statement as ‘Impairment losses on loans and advances’.
Impairment losses on retail assets subject to forbearance
To support retail customers that encounter actual or apparent financial difficulties, the Santander UK group may grant a concession, whether temporary or permanent, to amend contractual amounts or timings where a customer’s financial distress indicates a potential that satisfactory repayment may not be made within the original terms and conditions of the contract. These arrangements are known as forbearance.
There are different risk characteristics associated with loans that are subject to forbearance as compared to loans that are not. A range of forbearance arrangements may be entered into by the Santander UK group, reflecting the different risk characteristics of such loans. The Santander UK group’s forbearance programmes are described in the credit risk section in the Risk Management Report.
| | |
| Santander UK plc Annual Report 2013 | | 223 |
Financial Statements
Notes to the Financial Statementscontinued
- Mortgages
On advances secured by residential property, the main types of forbearance offered are capitalisation, under the forms of payment arrangements, term extension or an interest only concession, subject to customer negotiation and vetting. Such accounts are classified in the “collections” category and, if they are in arrears, continue to be reported in arrears until the arrears are capitalised, at which point the accounts will be transferred to the “performing” category. The impairment provision on these accounts is based on the delinquency cycle in which the account was classified when it entered forbearance, unless the account’s status has further deteriorated since then, in which case the impairment provision will be based on the current status.
The impairment loss allowances on these accounts are calculated in the same manner as on any other account, using the Santander UK group’s collective assessment methodology. In making a collective assessment for impairment, loans that are subject to forbearance are grouped together according to their credit risk characteristics.
Separate assessments are performed for loans in forbearance that are performing (and have never been in arrears), performing (and previously were in arrears) and non-performing, and for each type of forbearance applied, to reflect their differing risk profiles. The loss propensities are based on recent historical experience of each sub category, typically covering a period of no more than the most recent six months in the year under review. For each sub category of loans in forbearance, the loss propensity factor applied in the collective assessment calculation is higher than for other performing loans reflecting the higher risk of default attached to these accounts. Similarly, for each sub category of loans in forbearance the loss factor applied is higher reflecting the higher risk of loss attached to these accounts.
It is not expected that all accounts in the collections category will default, particularly as the Santander UK group’s lending policies only permit a mortgage to be forborne in circumstances where the customer is expected to be able to meet the related requirements and ultimately repay in full.
- Unsecured Personal Loans
For unsecured personal loans (‘UPLs’), the main types of forbearance offered are reduced repayments and reduced settlement arrangements. Where accounts undergoing forbearance are in arrears, these continue to be reported in the delinquency cycle, until all arrears are capitalised or paid up, at which point the accounts will be transferred to the “performing” category. The impairment provision on these accounts is based on the delinquency cycle in which the account was classified when it entered forbearance, unless the account’s status has further deteriorated since then, in which case the impairment provision will be based on the current status. Where the accounts reside in “performing” category as a result of forbearance, the impairment allowance requirements are based on default probability that take account of the higher inherent risk in the forborne asset relative to other performing assets.
- Credit Cards
For credit card lending, the main types of forbearance offered are reduced repayment arrangements and reduced settlement arrangements. Reduced settlement arrangements have no impact on the provisioning level as the agreed remaining balance is written off at the point of settlement. The impairment loss allowance takes into consideration the potential recoverable value on the debt sale market.
ii) Corporate assets
Corporate assets are assessed either individually or collectively for impairment. An impairment loss is incurred if there is objective evidence that a loss event has occurred since initial recognition of the assets that has an impact on the estimated future cash flows of the assets.
Potential indicators of loss events
Potential indicators of loss events which may be evidence of financial difficulty for a corporate borrower may include, but are not limited to, the borrower notifying the Santander UK group of current or likely financial distress; corporate results not meeting forecasts, missed repayments, requests for additional funding; breaches of covenants and changes in business plans.
Individual assessment
Impairment reviews are conducted monthly for individually significant assets. A specific observed impairment is established for all individually significant loans that have experienced a loss event such as:
| • | | where an asset has a payment default which has been outstanding for 90 days or more; |
| • | | where non-payment defaults have occurred and/or where it has become evident that a forbearance exercise will be undertaken; or |
| • | | where it has become evident that the value of any security is no longer considered adequate. |
In such situations the asset is transferred to the Commercial Banking Restructuring & Recoveries team. As part of their impairment reviews, an assessment is undertaken of the expected future cash flows (including a revaluation of collateral held) in relation to the relevant asset, appropriately discounted. The result is compared to the current carrying value of the asset. Any shortfall evidenced as a result of such a review will be assessed and the need for an observed impairment loss allowance established.
Collective assessment
A collective impairment loss allowance is established for all loans that have experienced a loss event. For individually significant loans this is undertaken as detailed above. Loans which are not individually significant but are not performing are grouped together according to their credit risk characteristics and the allowance for observed losses is determined on a collective basis by applying an estimated loss given default. Loans for which evidence of potential loss has been specifically identified and that are on the Santander UK group’s watchlist are grouped together according to their credit risk characteristics for the purpose of calculating an estimated allowance for observed losses. This is assessed on a collective basis using an estimate of the propensity for these loans to enter non performing loan status and the potential loss per case.
| | |
| 224 | | Santander UK plc Annual Report 2013 |
Financial Statements
Notes to the Financial Statementscontinued
Incurred but not observed impairment loss allowances
Loans for which no evidence of loss has been specifically identified on an individual basis are grouped together according to their credit risk characteristics for the purpose of calculating an estimated allowance for incurred inherent losses. Such losses will only be individually identified in the future. As soon as information becomes available which identifies incurred losses on individual loans within the group, those loans are removed from the group and assessed for observed losses.
The allowance for IBNO losses is determined on a portfolio basis using the following factors:
| • | | historical loss experience in portfolios of similar credit risk characteristics (for example, similar sector or product); |
| • | | the estimated period between an impairment event occurring and establishment of the loss event (known as the emergence period, as discussed below); and |
| • | | management’s judgement as to whether current economic and credit conditions are such that the actual level of inherent losses at the balance sheet date is likely to be greater or less than that suggested by historical experience. |
The emergence period
This is the period in which losses that had been incurred but have not been separately identified become evident. The emergence period of six months is estimated having regard to historic experience and loan characteristics across the portfolio. The factors considered in determining the length of the emergence period include the frequency of the management information received or any change in account utilisation behaviour.
Reversals of impairment
If in a subsequent period, the amount of an impairment loss reduces and the reduction can be related objectively to an event occurring after the impairment was recognised, the excess is written back by reducing the impairment loss allowance accordingly. The write-back is recognised in the income statement.
Write-off
For secured loans, a write-off is made when all collection procedures have been exhausted and the security has been sold. For unsecured loans, a write-off is made when all avenues for collecting the debt have been exhausted. There may be occasions where a write-off occurs for other reasons, for example, following a consensual restructure or refinancing of the debt or where the debt is sold for strategic reasons into the secondary market at a value lower than the face value of the debt. Write-offs are charged against previously established impairment loss allowances. There are no thresholds based on past due status beyond which all secured or unsecured loans are written off.
Recoveries
Recoveries of impairment losses are not included in the impairment loss allowance, but are taken to income and offset against impairment losses. Recoveries of impairment losses are classified in the income statement as ‘Impairment losses on loans and advances’.
Impairment losses on corporate assets subject to forbearance
To support corporate customers that encounter actual or apparent financial difficulties, the Santander UK group may grant a concession, whether temporary or permanent, to amend contractual amounts or timings where a customer’s financial distress indicates the potential that satisfactory repayment may not be made within the original terms and conditions of the contract. These arrangements are known as forbearance.
There are different risk characteristics associated with loans that are subject to forbearance as compared to loans that are not. A range of forbearance arrangements may be entered into by the Santander UK group, reflecting the different risk characteristics of such loans. The Santander UK group’s forbearance programmes are described in the credit risk section in the Risk Management Report.
For corporate borrowers, the main types of forbearance offered are term extensions or interest only concessions and in limited circumstances, other forms of forbearance options (including debt-for-equity swaps), subject to customer negotiation and vetting.
If such accounts were classified in the “non-performing” loan category prior to the forbearance, they continue to be classified as non-performing until evidence of compliance with the new terms is demonstrated (typically over a period of at least three months) before being reclassified as “substandard”. If the account was not categorised as non-performing at the time the revised arrangements were agreed, the case is reclassified to “substandard” upon completion of the forbearance agreement.
Once a substandard asset has demonstrated continued compliance with the new terms and the risk profile is deemed to have improved it may be reclassified as a “performing asset”. When such accounts are reclassified as performing assets, they continue to be assessed for impairment collectively for impairment losses under the Santander UK group’s normal observed collective assessment methodology. Until then, impairment loss allowances for such loans are assessed individually, taking into account the value of collateral held as confirmed by third party professional valuations and the available cash flow to service debt over the period of the forbearance. These impairment loss allowances are assessed and reviewed regularly. In the case of a debt for equity conversion, the converted debt is written off against the existing impairment loss allowance upon completion of the forbearance. The value of the equity acquired is reassessed periodically in light of subsequent performance of the restructured company.
iii) Loans and receivables securities
Loans and receivables securities are assessed individually for impairment. An impairment loss is incurred if there is objective evidence that a loss event has occurred since initial recognition of the assets that has an impact on the estimated future cash flows of the loans and receivables securities. Potential indicators of loss events include significant financial distress of the issuer and default or delinquency in interest and principal payments (breach of contractual terms).
Loans and receivables securities are monitored for potential impairment through a detailed expected cash flow analysis taking into account the structure and underlying assets of each individual security. Once specific events give rise to a reasonable expectation that future anticipated cash flows may not be received, the asset originating these doubtful cash flows will be deemed to be impaired with the impairment loss being measured as the difference between the expected future cash flows discounted at the original effective interest rate and the carrying value of the loans and receivable securities.
| | |
| Santander UK plc Annual Report 2013 | | 225 |
Financial Statements
Notes to the Financial Statementscontinued
b) Available-for-sale financial assets
The Santander UK group assesses at each balance sheet date whether there is objective evidence that a financial asset or a group of financial assets is impaired. In assessing whether assets are impaired, a significant or prolonged decline in the fair value of the security below its cost is considered evidence. The cumulative loss is measured as the difference between the acquisition cost and the current fair value, less any impairment loss previously reported in the income statement and is removed from other comprehensive income and recognised in the income statement.
If in a subsequent period, the fair value of a debt instrument classified as available-for-sale increases and the increase is due to an event occurring after the impairment loss was recognised in the income statement (with objective evidence to support this), the impairment loss is reversed through the income statement.
If in a subsequent period, the fair value of an equity instrument classified as available-for-sale increases, all such increases in the fair value are treated as a revaluation, and are recognised in other comprehensive income. Impairment losses recognised on equity instruments are not reversed through the income statement.
IMPAIRMENT OF NON-FINANCIAL ASSETS
At each balance sheet date, or more frequently when events or changes in circumstances dictate, property plant and equipment (including operating lease assets) and intangible assets (including goodwill) are assessed for indicators of impairment. If indications are present, these assets are subject to an impairment review.
The impairment review comprises a comparison of the carrying amount of the asset or cash generating unit with its recoverable amount: the higher of the asset’s or cash-generating unit’s fair value less costs to sell and its value in use. The cash-generating unit represents the lowest level at which non-financial assets including goodwill is monitored for internal management purposes and is not larger than an operating segment.
The fair value is the price that would be received to sell an asset or paid to transfer a liability in an orderly transaction between market participants at the measurement date. Value in use is calculated by discounting management’s expected future cash flows obtainable as a result of the asset’s continued use, including those resulting from its ultimate disposal, at a market based discount rate on a pre tax basis. The recoverable amounts of goodwill have been based on value in use calculations.
The carrying values of property, plant and equipment, goodwill and other intangible assets are written down by the amount of any impairment and the loss is recognised in the income statement in the period in which it occurs. A previously recognised impairment loss relating to property, plant and equipment may be reversed in part or in full when a change in circumstances leads to a change in the estimates used to determine the property, plant and equipment’s recoverable amount. The carrying amount of the fixed asset will only be increased up to the amount that would have been had the original impairment not been recognised. Impairment losses on goodwill are not reversed. For conducting goodwill impairment reviews, cash generating units are the lowest level at which management monitors the return on investment on assets.
LEASES
a) The Santander UK group as lessor
Operating lease assets are recorded at cost and depreciated over the life of the asset after taking into account anticipated residual values. Operating lease rental income and depreciation is recognised on a straight-line basis over the life of the asset. Amounts due from lessees under finance leases and hire purchase contracts are recorded as receivables at the amount of the Santander UK group’s net investment in the leases. Finance lease income is allocated to accounting periods so as to reflect a constant periodic rate of return on the Santander UK group’s net investment outstanding in respect of the leases and hire purchase contracts.
b) The Santander UK group as lessee
The Santander UK group enters into operating leases for the rental of equipment or real estate. Payments made under such leases are charged to the income statement on a straight-line basis over the period of the lease. When an operating lease is terminated before the lease period has expired, any payment to be made to the lessor by way of penalty is recognised as an expense in the period in which termination takes place.
If the lease agreement transfers the risk and rewards of the asset, the lease is recorded as a finance lease and the related asset is capitalised. At inception, the asset is recorded at the lower of the present value of the minimum lease payments or fair value and depreciated over the lower of the estimated useful life and the life of the lease. The corresponding rental obligations are recorded as borrowings. The aggregate benefit of incentives, if any, is recognised as a reduction of rental expense over the lease term on a straight-line basis.
INCOME TAXES, INCLUDING DEFERRED TAXES
The tax expense represents the sum of the income tax currently payable and deferred income tax.
Income tax payable on profits, based on the applicable tax law in each jurisdiction, is recognised as an expense in the period in which profits arise. Taxable profit differs from net profit as reported in the income statement because it excludes items of income or expense that are taxable or deductible in other years and it further excludes items that are never taxable or deductible. The liability for current tax is calculated using tax rates that have been enacted or substantively enacted by the balance sheet date.
Deferred income tax is the tax expected to be payable or recoverable on income tax losses available to carry forward and on temporary differences arising between the tax bases of assets and liabilities and their carrying amounts in the Consolidated Financial Statements and is accounted for using the balance sheet liability method. Deferred tax liabilities are generally recognised for all taxable temporary differences and deferred tax assets are recognised to the extent that it is probable that taxable profits will be available against which the assets may be utilised as they reverse. Such deferred tax liabilities are not recognised if the temporary difference arises from the initial recognition of goodwill. Deferred tax assets and liabilities are not recognised from the initial recognition of other assets (other than in a business combination) and liabilities in a transaction that affects neither the taxable profit nor the accounting profit.
| | |
| 226 | | Santander UK plc Annual Report 2013 |
Financial Statements
Notes to the Financial Statementscontinued
Deferred tax is calculated at the tax rates that are expected to apply in the period when the liability is settled or the asset is realised based on rates enacted or substantively enacted at the balance sheet date. Deferred tax is charged or credited in the income statement, except when it relates to items recognised in other comprehensive income or directly in equity, in which case the deferred tax is also recognised in other comprehensive income or directly in equity. Deferred tax liabilities are recognised for taxable temporary differences arising on investments in subsidiaries except where the Santander UK group is able to control reversal of the temporary difference and it is probable that it will not reverse in the foreseeable future. The Santander UK group reviews the carrying amount of deferred tax assets at each balance sheet date and reduces it to the extent that it is no longer probable that sufficient taxable profits will be available to allow all or part of the asset to be recovered.
Deferred and current tax assets and liabilities are only offset when they arise in the same tax reporting group and where there is both the legal right and the intention to settle on a net basis or to realise the asset and settle the liability simultaneously.
CASH AND CASH EQUIVALENTS
For the purposes of the cash flow statement, cash and cash equivalents comprise balances with less than three months’ maturity from the date of acquisition, including cash and non-restricted balances with central banks, treasury bills and other eligible bills, loans and advances to banks and short-term investments in securities.
FINANCIAL LIABILITIES
Financial liabilities are initially recognised when the Santander UK group becomes contractually bound to the transfer of economic benefits in the future. Financial liabilities are derecognised when extinguished.
a) Financial liabilities at fair value through profit or loss
Financial liabilities are classified as fair value through profit or loss if they are either held for trading or otherwise designated at fair value through profit or loss on initial recognition. A financial liability is classified as held for trading if it is a derivative or it is incurred principally for the purpose of repurchasing or being unwound in the near term, or forms part of a portfolio of financial instruments that are managed together and for which there is evidence of short-term profit taking.
In certain circumstances financial liabilities other than those that are held for trading are designated at fair value through profit or loss where this results in more relevant information because it significantly reduces a measurement inconsistency that would otherwise arise from measuring assets and liabilities or recognising the gains or losses on them on a different basis, or where a financial liability contains one or more embedded derivatives which are not closely related to the host contract. These liabilities are initially recognised at fair value and transaction costs are taken directly to the income statement. Gains and losses arising from changes in fair value are included directly in the income statement. Derivative financial instruments, Trading liabilities and Financial liabilities designated at fair value are classified as fair value through profit or loss.
b) Other financial liabilities
All other financial liabilities are initially recognised at fair value net of transaction costs incurred. They are subsequently stated at amortised cost, using the effective interest method. Deposits by banks, Deposits by customers, Debt securities in issue (unless designated at fair value) and Subordinated liabilities are classified as amortised cost.
Equity index-linked deposits
Contracts involving the receipt of cash on which customers receive an index-linked return are accounted for as equity index-linked deposits. The principal products are Capital Guaranteed/Protected Products which give the customers a limited participation in the upside growth of an equity index. In the event the index falls in price, a cash principal element is guaranteed/protected. The equity index-linked deposits contain embedded derivatives. These embedded derivatives, in combination with the principal cash deposit element, are designed to replicate the investment performance profile tailored to the return agreed in the contracts with customers.
Until 2009, equity index-linked deposits were managed within the equity derivatives trading book as an integral part of the equity derivatives portfolio, and classified as deposits by customers within trading liabilities. For products sold until 2009, the embedded derivatives are not separated from the host instrument and are not separately accounted for as a derivative financial instrument, as the entire contract embodies both the embedded derivative and the host instrument and is remeasured at fair value at each reporting date. As such, there is no requirement to bifurcate the embedded derivatives in those equity index-linked deposits.
Following a change in management’s trading strategy in 2009, products sold subsequently are not accounted for as fair value through profit and loss, nor classified as trading liabilities. These products are accounted for as deposits by customers at amortised cost. The embedded derivatives are separated from the host instrument and are separately accounted for as a derivative financial instrument. The embedded derivatives are economically hedged internally with the equity derivatives trading desk. These internal transactions are managed as part of the overall positions of the equity derivatives trading desk. This activity is managed and recorded on a fair value trading basis, with exposures managed on a value-at-risk basis, as described in “Traded market risk” in the Risk Management Report.
There is no difference between the products sold until 2009 which are accounted for as fair value through profit and loss and classified as trading liabilities, and the subsequent products sold that are accounted for as deposits by customers and related embedded derivatives.
| | |
| Santander UK plc Annual Report 2013 | | 227 |
Financial Statements
Notes to the Financial Statementscontinued
BORROWINGS
Borrowings (which include deposits by banks, deposits by customers, debt securities in issue and subordinated liabilities) are recognised initially at fair value, being their issue proceeds (fair value of consideration received) net of transaction costs incurred. Borrowings are subsequently stated at amortised cost or fair value through profit or loss dependent on designation at initial recognition.
Preference shares which carry a contractual obligation to transfer economic benefits are classified as financial liabilities and are presented in subordinated liabilities. The coupon on these preference shares is recognised in the income statement as interest expense on an amortised cost basis using the effective interest method.
PROVISIONS
Provisions are recognised for present obligations arising as consequences of past events where it is more likely than not that a transfer of economic benefits will be necessary to settle the obligation, and it can be reliably estimated.
Conduct provisions are made for the estimated cost of making redress payments with respect to the past sales of products, based on conclusions regarding the number of claims that will be received, including the number of those that will be upheld, the estimated average settlement per case and other related costs. Provision is made for the anticipated cost of restructuring, including redundancy costs, when an obligation exists. An obligation exists when the Santander UK group has a detailed formal plan for restructuring a business, has raised valid expectations in those affected by the restructuring, and has started to implement the plan or announce its main features.
When a leasehold property ceases to be used in the business, provision is made where the unavoidable costs of the future obligations relating to the lease are expected to exceed anticipated rental income. The net costs are discounted using market rates of interest to reflect the long-term nature of the cash flows.
Provision is made for loan commitments, other than those classified as held for trading, within impairment loss allowances if it is probable that the facility will be drawn and the resulting loan will be recognised at a value less than the cash advanced. Contingent liabilities are possible obligations whose existence will be confirmed only by certain future events or present obligations where the transfer of economic benefit is uncertain or cannot be reliably measured. Contingent liabilities are not recognised but are disclosed unless they are remote.
FINANCIAL GUARANTEE CONTRACTS
Financial guarantee contracts are contracts that require the issuer to make specified payments to reimburse the holder for a loss it incurs because a specified debtor fails to make payments when due in accordance with the terms of a debt instrument. The Santander UK group accounts for guarantees that meet the definition of a financial guarantee contract at fair value on initial recognition. In subsequent periods, these guarantees are measured at the higher of the initial fair value less cumulative amortisation and the amount that would be recognised as a provision in accordance with IAS 37.
SHARE CAPITAL
Incremental external costs directly attributable to the issue of new shares are deducted from equity net of related income taxes.
DIVIDENDS
Dividends on ordinary shares are recognised in equity in the period in which the right to receive payment is established.
| | |
| 228 | | Santander UK plc Annual Report 2013 |
Financial Statements
Notes to the Financial Statementscontinued
CRITICAL ACCOUNTING POLICIES AND AREAS OF SIGNIFICANT MANAGEMENT JUDGEMENT
The preparation of the Santander UK group’s Consolidated Financial Statements requires management to make estimates and judgements that affect the reported amount of assets and liabilities at the date of the financial statements and the reported amount of income and expenses during the reporting period. Management evaluates its estimates and judgements on an ongoing basis. Management bases its estimates and judgements on historical experience and on various other factors that are believed to be reasonable under the circumstances. Actual results may differ from these estimates under different assumptions or conditions.
The following accounting estimates and judgements are considered important to the portrayal of the Santander UK group’s financial results and financial condition because: (i) they are highly susceptible to change from period to period as assumptions are made to calculate the estimates, and (ii) any significant difference between the Santander UK group’s estimated amounts and actual amounts could have a material impact on the Santander UK group’s future financial results and financial condition.
In calculating each estimate, a range of outcomes was calculated based principally on management’s conclusions regarding the input assumptions relative to historic experience. The actual estimates were based on what management concluded to be the most probable assumptions within the range of reasonably possible assumptions.
a) Impairment loss allowances for loans and advances
The Santander UK group estimates impairment losses for loans and advances to customers, loans and receivables securities, and loans and advances to banks as described in the accounting policy “Impairment of financial assets” on page 222. The Santander UK group’s assumptions about impairment losses are based on past performance, past customer behaviour, the credit quality of recent underwritten business and general economic conditions, which are not necessarily an indication of future losses.
The net impairment loss (i.e. after recoveries) for loans and advances to customers in the Retail Banking segment recognised in 2013 was £359m (2012: £419m, 2011: £281m), and in the Commercial Banking segment was £108m (2012: £109m, 2011: £120m). In calculating the Retail Banking and Commercial Banking impairment loss allowances, a range of outcomes was calculated, either for each individual loan or by portfolio, based on management’s conclusions regarding the estimated number of accounts that will be written off or repossessed (the ‘loss propensity’), the estimated proportion of such cases that will result in a loss (the ‘loss factor’) and the average loss incurred (the ‘loss per case’) relative to historic experience.
Had management used different assumptions, a larger or smaller impairment loss allowance would have resulted that could have had a material impact on the Santander UK group’s reported profit before tax. Specifically, if management’s conclusions as to the loss propensity, the loss factor and the estimated loss per case were different, but within the range of what management deemed to be reasonably possible, the impairment loss for loans and advances in the Retail Banking segment could have decreased in 2013 from an actual impairment loss of £359m (2012: £419m, 2011: £281m) by up to £231m (2012: £80m, 2011: £120m), with a potential corresponding increase in the Santander UK group’s profit before tax in 2013 of up to 21% (2012: 6%, 2011: 10%), or increased by up to £71m (2012: £50m, 2011: £41m), with a potential corresponding decrease in the Santander UK group’s profit before tax in 2013 of up to 6% (2012: 4%, 2011: 3%).
Similarly, the impairment loss for loans and advances in the Commercial Banking segment could have decreased in 2013 from an actual impairment loss of £108m (2012: £109m, 2011: £120m) by up to £45m (2012: £27m, 2011: £29m), with a potential corresponding increase in the Santander UK group’s profit before tax in 2013 of up to 4% (2012: 2%, 2011: 4%), or increased by up to £36m (2012: £25m, 2011: £28m), with a potential corresponding decrease in the Santander UK group’s profit before tax in 2013 of up to 3% (2012: 2%, 2011: 4%).
Similarly, the impairment loss for loans and advances in the Corporate Centre segment could have decreased in 2013 from an actual impairment loss of £8m (2012: £460m, 2011: £100m) by up to £49m (2012: £58m, 2011: £24m), with a potential corresponding increase in the Santander UK group’s profit before tax in 2013 of up to 4% (2012: 5%, 2011: 2%), or increased by up to £28m (2012: £29m, 2011: £22m), with a potential corresponding decrease in the Santander UK group’s profit before tax in 2013 of up to 2% (2012: 2%, 2011: 2%).
b) Valuation of financial instruments
The Santander UK group trades in a wide variety of financial instruments in the major financial markets. When estimating the value of its financial instruments, including derivatives where quoted market prices are not available, management therefore considers a range of interest rates, volatility, exchange rates, counterparty credit ratings, valuation adjustments and other similar inputs, all of which vary across maturity bands. These are chosen to best reflect the particular characteristics of each transaction based on observable inputs and adjustment to these inputs for Level 2 instruments or unobservable inputs for Level 3 instruments. See the ‘Valuation of Financial Instruments’ section of the accounting policies on page 219 for further details.
Had management used different assumptions, a larger or smaller change in the valuation of financial instruments including derivatives where quoted market prices are not available would have resulted that could have had a material impact on the Santander UK group’s reported profit before tax.
Detailed disclosures on financial instruments, including sensitivities, can be found in Note 45. Further information about sensitivities to market risk (including Value-at-Risk (‘VaR’)) arising from financial instrument trading activities can be found in the Risk Management Report on page 122.
| | |
| Santander UK plc Annual Report 2013 | | 229 |
Financial Statements
Notes to the Financial Statementscontinued
c) Goodwill impairment
A goodwill impairment loss of £nil was recognised in 2013 (2012: £nil, 2011: £60m). The carrying amount of goodwill was £1,834m at 31 December 2013 (2012: £1,834m). The Santander UK group evaluates whether the carrying value of goodwill is impaired and performs impairment testing annually or more frequently if there are impairment indicators present. Details of the Santander UK group’s approach to identifying and quantifying impairment of goodwill are set out in Note 25. Assumptions about the measurement of the estimated recoverable amount of goodwill are based on management’s estimates of future cash flows, discount rates and growth rates of the cash-generating units. The Santander UK group’s assumptions about estimated future cash flows and growth rates are based on management’s view of future business prospects at the time of the assessment and are subject to a high degree of uncertainty.
Had management used different assumptions, a larger or smaller goodwill impairment loss would have resulted that could have had a material impact on the Santander UK group’s reported profit before tax. Detailed disclosures on the assumptions used, including sensitivities, can be found in Note 25.
d) Provision for conduct remediation
The provision charge/(credit) for conduct remediation relating to past activities and products sold recognised in 2013 was a credit of £45m (2012: charge of £232m, 2011: charge of £753m) before tax. The balance sheet provision amounted to £407m (2012: £659m, 2011: £747m). Detailed disclosures on the provision for conduct remediation can be found in Note 36.
The provision represents management’s best estimate of the anticipated costs of related customer contact and/or redress, including related costs. It requires significant judgement by management in determining appropriate assumptions, which include the level of complaints expected to be received, of those, the number that will be upheld and redressed, as well as the redress costs for each of the different populations of customers identified by the Santander UK group. Based on these factors, Santander UK determines its best estimate of the anticipated costs of redress and expected operating costs.
In the case of conduct risk projects where significant progress has been made in terms of customer communications sent, complaints received and redress paid, the assumptions are based on the actual data observed to date along with any expected developments. For projects which are still at an early stage, the assumptions are based on the outcomes of previous similar customer contact exercises conducted and quality control checks.
Had management used different assumptions, a larger or smaller provision charge would have resulted that could have had a material impact on the Santander UK group’s reported profit before tax. If the level of PPI complaints had been one percentage point higher/(lower) than estimated for all policies written then the provision at 31 December 2013 would have increased/(decreased) by approximately £20m (2012: £32m, 2011: £36m). There are a large number of inter-dependent assumptions under-pinning the provision; this sensitivity assumes that all assumptions, other than the level of complaints, remain constant. As PPI remains as the largest remediation project, the sensitivity has been calculated on that basis. In the event that all conduct risk areas are considered, the total sensitivity would be £24m.
The Santander UK group will re-evaluate the assumptions underlying its analysis at each reporting date as more information becomes available. As noted above, there is inherent uncertainty in making estimates; actual results in future periods may differ from the amount provided.
e) Pensions
The Santander UK group operates a number of defined benefit pension schemes as described in Note 37 and estimates their position described in the accounting policy “Pensions and other post retirement benefits” on page 216.
The defined benefit pension schemes which were in a net asset position had a surplus of £118m (2012: surplus of £254m) and the defined benefit pension schemes which were in a net liability position had a deficit of £672m (2012: deficit of £305m). The decrease in the net asset position and increase in net liability position was due to actuarial losses on liabilities as a result of an increase in RPI inflation market levels. This followed a decision by the Office of National Statistics, in early 2013, not to rebase RPI. In addition, actuarial losses on liabilities increased due to decreased corporate bond yields reducing the discount rate.
Accounting for defined benefit pension schemes requires management to make assumptions, principally about mortality, but also about price inflation, discount rates, pension increases, and earnings growth. Management’s assumptions are based on past experience and current economic trends, which are not necessarily an indication of future experience.
Detailed disclosures on the current year service cost and deficit, including sensitivities and the date of the last formal actuarial valuations of the assets and liabilities of the schemes can be found in Note 37.
| | |
| 230 | | Santander UK plc Annual Report 2013 |
Financial Statements
Notes to the Financial Statementscontinued
2. SEGMENTS
The principal activity of the Santander UK group is financial services. The Santander UK group’s business is managed and reported on the basis of the following segments:
| • | | Commercial Banking (formerly known as Corporate Banking); |
In early 2013, once it was determined to sell the co-brand credit cards business, the business was managed and reported for segmental reporting purposes as part of Corporate Centre, rather than Retail Banking as in 2012. In addition, the co-brand credit cards business qualified as a discontinued operation, as set out in Note 12. The segmental analyses for prior years have been adjusted to reflect these changes.
The Santander UK group’s segments are strategic business units that offer different products and services. They are managed separately because each business requires different technology and marketing strategies. The Santander UK group has four segments:
| • | | Retail Banking offers a wide range of products and financial services to customers through a network of branches, agencies and ATMs, as well as through telephony, e-commerce and intermediary channels. It principally serves personal banking customers, but also services small businesses with an annual turnover of up to £250,000. Retail Banking products include residential mortgage loans, savings and current accounts, credit cards (excluding the co-brand credit cards business) and personal loans as well as a range of insurance products. |
| • | | Commercial Banking offers a wide range of products and financial services to customers through a network of regional business centres and through telephony and e-commerce channels. Commercial Banking products and services include loans, bank accounts, deposits, treasury services, invoice discounting, cash transmission and asset finance. The management of our customers is organised according to the annual turnover of their business, enabling us to offer a differentiated service to small and medium enterprises (‘SMEs’), mid and large corporate customers. |
The SME and mid corporate business principally serves small and medium enterprises with an annual turnover of more than £250,000 up to £50m, and other corporate customers with an annual turnover of up to £500m. This also includes real estate lending.
The Large Corporates business offers specialist treasury services in fixed income and foreign exchange, lending, transactional banking services, capital markets and money markets to large multinational corporate customers with an annual turnover of more than £500m. Lending includes syndicated loans and structured finance. Transactional banking includes trade finance and cash management. Money market activities include securities lending/borrowing and repos.
| • | | Markets offers risk management and other services to financial institutions, as well as to other Santander UK divisions. Its main business areas are fixed income and foreign exchange, equity, capital markets and institutional sales. |
| • | | Corporate Centre includes Financial Management & Investor Relations (‘FMIR’) and the non-core corporate and legacy portfolios, as well as the co-brand credit cards business which has been presented as discontinued operations. FMIR is responsible for managing capital and funding, balance sheet composition, structural market risk and strategic liquidity risk for the Santander UK group. The non-core corporate and legacy portfolios include aviation, shipping, infrastructure, commercial mortgages, Social Housing loans and structured credit assets, all of which are being run-down and/or managed for value. The sale of the co-brand credit cards business was completed in 2013. |
The Company’s board of directors (the ‘Board’) is the chief operating decision maker for the Santander UK group. The segment information below is presented on the basis used by the Board to evaluate performance and allocate resources. The Board reviews discrete financial information for each segment of the business, including measures of operating results, assets and liabilities. The segment information reviewed by the Board is prepared on a statutory basis of accounting.
Transactions between the business segments are on normal commercial terms and conditions. The accounting policies of the segments are the same as those described in the summary of significant accounting policies. Internal charges and internal UK transfer pricing adjustments have been reflected in the performance of each segment. Revenue sharing agreements are used to allocate external customer revenues to a business segment on a reasonable basis. Funds are ordinarily reallocated between segments, resulting in funding cost transfers disclosed in operating income. Interest charged for these funds is based on the Santander UK group’s cost of wholesale funding.
Interest income and interest expense have not been reported separately. The majority of the revenues from the segments presented below are interest income in nature and the Board relies primarily on net interest income to both assess the performance of the segment and to make decisions regarding allocation of segmental resources.
| | |
| Santander UK plc Annual Report 2013 | | 231 |
Financial Statements
Notes to the Financial Statementscontinued
| | | | | | | | | | | | | | | | | | | | |
2013 | | Retail
Banking
£m | | | Commercial
Banking
£m | | | Markets
£m | | | Corporate
Centre
£m | | | Total
£m | |
Net interest income/(expense) | | | 3,022 | | | | 415 | | | | 2 | | | | (476 | ) | | | 2,963 | |
Non-interest income | | | 651 | | | | 290 | | | | 106 | | | | 19 | | | | 1,066 | |
| | | | | | | | | | | | | | | | | | | | |
Total operating income | | | 3,673 | | | | 705 | | | | 108 | | | | (457 | ) | | | 4,029 | |
| | | | | | | | | | | | | | | | | | | | |
Administration expenses | | | (1,520 | ) | | | (301 | ) | | | (98 | ) | | | (28 | ) | | | (1,947 | ) |
Depreciation, amortisation and impairment | | | (196 | ) | | | (17 | ) | | | (2 | ) | | | (33 | ) | | | (248 | ) |
| | | | | | | | | | | | | | | | | | | | |
Total operating expenses excluding impairment losses, provisions and charges | | | (1,716 | ) | | | (318 | ) | | | (100 | ) | | | (61 | ) | | | (2,195 | ) |
| | | | | | | | | | | | | | | | | | | | |
Impairment losses on loans and advances | | | (359 | ) | | | (108 | ) | | | — | | | | (8 | ) | | | (475 | ) |
Provisions for other liabilities and charges | | | — | | | | (6 | ) | | | (4 | ) | | | (210 | ) | | | (220 | ) |
| | | | | | | | | | | | | | | | | | | | |
Total operating impairment losses, provisions and charges | | | (359 | ) | | | (114 | ) | | | (4 | ) | | | (218 | ) | | | (695 | ) |
| | | | | | | | | | | | | | | | | | | | |
Profit/(loss) from continuing operations before tax | | | 1,598 | | | | 273 | | | | 4 | | | | (736 | ) | | | 1,139 | |
| | | | | | | | | | | | | | | | | | | | |
Loss from discontinued operations after tax | | | — | | | | — | | | | — | | | | (8 | ) | | | (8 | ) |
| | | | | | | | | | | | | | | | | | | | |
Revenue from external customers | | | 4,608 | | | | 795 | | | | 79 | | | | (1,453 | ) | | | 4,029 | |
Inter-segment revenue | | | (935 | ) | |
| (90
| )
| | | 29 | | | | 996 | | | | — | |
| | | | | | | | | | | | | | | | | | | | |
Total operating income | | | 3,673 | | |
| 705
|
| |
| 108
|
| | | (457 | ) | | | 4,029 | |
| | | | | | | | | | | | | | | | | | | | |
Customer assets | | | 155,613 | | | | 22,075 | | | | — | | | | 9,360 | | | | 187,048 | |
Total assets(1) | | | 160,512 | | | | 35,456 | | | | 19,329 | | | | 55,008 | | | | 270,305 | |
| | | | | | | | | | | | | | | | | | | | |
Customer deposits | | | 123,189 | | | | 12,631 | | | | — | | | | 10,624 | | | | 146,444 | |
Total liabilities | | | 128,106 | | | | 27,305 | | | | 18,536 | | | | 83,838 | | | | 257,785 | |
| | | | | | | | | | | | | | | | | | | | |
Average number of staff(2) | | | 17,764 | | | | 1,781 | | | | 359 | | | | 160 | | | | 20,064 | |
| | | | | | | | | | | | | | | | | | | | |
| (1) | Includes customer assets, net of impairment loss allowances. |
| (2) | Full-time equivalents. |
| | | | | | | | | | | | | | | | | | | | |
2012 | | Retail
Banking
£m | | | Commercial
Banking
£m | | | Markets
£m | | | Corporate
Centre
£m | | | Total
£m | |
Net interest income/(expense) | | | 2,674 | | | | 327 | | | | (6 | ) | | | (261 | ) | | | 2,734 | |
Non-interest income | | | 683 | | | | 381 | | | | 184 | | | | 701 | | | | 1,949 | |
| | | | | | | | | | | | | | | | | | | | |
Total operating income | | | 3,357 | | | | 708 | | | | 178 | | | | 440 | | | | 4,683 | |
| | | | | | | | | | | | | | | | | | | | |
Administration expenses | | | (1,501 | ) | | | (255 | ) | | | (98 | ) | | | (19 | ) | | | (1,873 | ) |
Depreciation, amortisation and impairment | | | (181 | ) | | | (15 | ) | | | (2 | ) | | | (43 | ) | | | (241 | ) |
| | | | | | | | | | | | | | | | | | | | |
Total operating expenses excluding impairment losses, provisions and charges | | | (1,682 | ) | | | (270 | ) | | | (100 | ) | | | (62 | ) | | | (2,114 | ) |
| | | | | | | | | | | | | | | | | | | | |
Impairment losses on loans and advances | | | (419 | ) | | | (109 | ) | | | — | | | | (460 | ) | | | (988 | ) |
Provisions for other liabilities and charges | | | — | | | | (2 | ) | | | (2 | ) | | | (430 | ) | | | (434 | ) |
| | | | | | | | | | | | | | | | | | | | |
Total operating impairment losses, provisions and charges | | | (419 | ) | | | (111 | ) | | | (2 | ) | | | (890 | ) | | | (1,422 | ) |
| | | | | | | | | | | | | | | | | | | | |
Profit/(loss) from continuing operations before tax | | | 1,256 | | | | 327 | | | | 76 | | | | (512 | ) | | | 1,147 | |
| | | | | | | | | | | | | | | | | | | | |
Profit from discontinued operations after tax | | | — | | | | — | | | | — | | | | 62 | | | | 62 | |
| | | | | | | | | | | | | | | | | | | | |
Revenue from external customers | | | 4,174 | | | | 1,206 | | | | 178 | | | | (875 | ) | | | 4,683 | |
Inter-segment revenue | | | (817 | ) | | | (498 | ) | | | — | | | | 1,315 | | | | — | |
| | | | | | | | | | | | | | | | | | | | |
Total operating income | | | 3,357 | | | | 708 | | | | 178 | | | | 440 | | | | 4,683 | |
| | | | | | | | | | | | | | | | | | | | |
Customer assets(1) | | | 164,126 | | | | 19,605 | | | | — | | | | 11,002 | | | | 194,733 | |
Total assets(1) (2) | | | 168,305 | | | | 35,736 | | | | 28,173 | | | | 60,830 | | | | 293,044 | |
| | | | | | | | | | | | | | | | | | | | |
Customer deposits | | | 127,178 | | | | 12,812 | | | | — | | | | 8,582 | | | | 148,572 | |
Total liabilities | | | 128,404 | | | | 24,040 | | | | 28,695 | | | | 98,956 | | | | 280,095 | |
| | | | | | | | | | | | | | | | | | | | |
Average number of staff(3) | | | 18,264 | | | | 2,136 | | | | 382 | | | | 165 | | | | 20,947 | |
| | | | | | | | | | | | | | | | | | | | |
| (1) | Adjusted to reflect the presentation of discontinued operations, as set out in Note 12. |
| (2) | Includes customer assets, net of impairment loss allowances. |
| (3) | Full-time equivalents. |
| | |
| 232 | | Santander UK plc Annual Report 2013 |
Financial Statements
Notes to the Financial Statementscontinued
| | | | | | | | | | | | | | | | | | | | |
2011 | | Retail
Banking
£m | | | Commercial
Banking
£m | | | Markets
£m | | | Corporate
Centre
£m | | | Total
£m | |
Net interest income/(expense) | | | 2,995 | | | | 296 | | | | (3 | ) | | | 345 | | | | 3,633 | |
Non-interest income | | | 724 | | | | 358 | | | | 162 | | | | 59 | | | | 1,303 | |
| | | | | | | | | | | | | | | | | | | | |
Total operating income | | | 3,719 | | | | 654 | | | | 159 | | | | 404 | | | | 4,936 | |
| | | | | | | | | | | | | | | | | | | | |
Administration expenses | | | (1,496 | ) | | | (212 | ) | | | (109 | ) | | | (59 | ) | | | (1,876 | ) |
Depreciation, amortisation and impairment | | | (199 | ) | | | (11 | ) | | | (2 | ) | | | (226 | ) | | | (438 | ) |
| | | | | | | | | | | | | | | | | | | | |
Total operating expenses excluding impairment losses, provisions and charges | | | (1,695 | ) | | | (223 | ) | | | (111 | ) | | | (285 | ) | | | (2,314 | ) |
| | | | | | | | | | | | | | | | | | | | |
Impairment losses on loans and advances | | | (281 | ) | | | (120 | ) | | | — | | | | (100 | ) | | | (501 | ) |
Provisions for other liabilities and charges | | | — | | | | (3 | ) | | | (3 | ) | | | (901 | ) | | | (907 | ) |
| | | | | | | | | | | | | | | | | | | | |
Total operating impairment losses, provisions and charges | | | (281 | ) | | | (123 | ) | | | (3 | ) | | | (1,001 | ) | | | (1,408 | ) |
| | | | | | | | | | | | | | | | | | | | |
Profit/(loss) from continuing operations before tax | | | 1,743 | | | | 308 | | | | 45 | | | | (882 | ) | | | 1,214 | |
| | | | | | | | | | | | | | | | | | | | |
Profit from discontinued operations after tax | | | — | | | | — | | | | — | | | | 34 | | | | 34 | |
| | | | | | | | | | | | | | | | | | | | |
Revenue from external customers | | | 5,056 | | | | 1,030 | | | | 159 | | | | (1,309 | ) | | | 4,936 | |
Inter-segment revenue | | | (1,337 | ) | | | (376 | ) | | | — | | | | 1,713 | | | | — | |
| | | | | | | | | | | | | | | | | | | | |
Total operating income | | | 3,719 | | | | 654 | | | | 159 | | | | 404 | | | | 4,936 | |
| | | | | | | | | | | | | | | | | | | | |
Customer assets(1) | | | 174,127 | | | | 18,949 | | | | — | | | | 11,946 | | | | 205,022 | |
Total assets(1) (2) | | | 179,008 | | | | 38,110 | | | | 28,652 | | | | 51,804 | | | | 297,574 | |
| | | | | | | | | | | | | | | | | | | | |
Customer deposits | | | 121,389 | | | | 12,118 | | | | — | | | | 15,685 | | | | 149,192 | |
Total liabilities | | | 126,153 | | | | 24,857 | | | | 32,760 | | | | 101,138 | | | | 284,908 | |
| | | | | | | | | | | | | | | | | | | | |
Average number of staff(3) | | | 18,503 | | | | 1,743 | | | | 346 | | | | 148 | | | | 20,740 | |
| | | | | | | | | | | | | | | | | | | | |
| (1) | Adjusted to reflect the presentation of discontinued operations, as set out in Note 12. |
| (2) | Includes customer assets, net of impairment loss allowances. |
Revenue by products and services
Details of revenue by product or service are disclosed in Notes 3 to 5.
Geographical information
A geographical analysis of total operating income is presented below:
| | | | | | | | | | | | |
| | | Group | |
| | | 2013
£m | | | 2012
£m | | | 2011
£m | |
United Kingdom | | | 3,988 | | | | 4,640 | | | | 4,875 | |
Other | | | 41 | | | | 43 | | | | 61 | |
| | | | | | | | | | | | |
| | | 4,029 | | | | 4,683 | | | | 4,936 | |
| | | | | | | | | | | | |
A geographical analysis of total assets other than financial instruments, current and deferred tax assets and post-employment benefit assets is presented below:
| | | | | | | | |
| | | 2013
£m | | | 2012
£m | |
United Kingdom | | | 3,936 | | | | 3,951 | |
Other | | | 2 | | | | 7 | |
| | | | | | | | |
| | | 3,938 | | | | 3,958 | |
| | | | | | | | |
| | |
| Santander UK plc Annual Report 2013 | | 233 |
Financial Statements
Notes to the Financial Statementscontinued
3. NET INTEREST INCOME
| | | | | | | | | | | | |
| | | Group | |
| | | 2013
£m | | | 2012(1)
£m | | | 2011(1)
£m | |
Interest and similar income: | | | | | | | | | | | | |
Loans and advances to banks | | | 132 | | | | 167 | | | | 120 | |
Loans and advances to customers | | | 6,958 | | | | 7,187 | | | | 7,218 | |
Other interest-earning financial assets | | | 80 | | | | 78 | | | | 73 | |
| | | | | | | | | | | | |
Total interest and similar income | | | 7,170 | | | | 7,432 | | | | 7,411 | |
| | | | | | | | | | | | |
Interest expense and similar charges: | | | | | | | | | | | | |
Deposits by banks | | | (188 | ) | | | (187 | ) | | | (158 | ) |
Deposits by customers | | | (2,658 | ) | | | (2,924 | ) | | | (2,711 | ) |
Debt securities in issue | | | (1,230 | ) | | | (1,399 | ) | | | (694 | ) |
Subordinated liabilities | | | (106 | ) | | | (174 | ) | | | (214 | ) |
Other interest-bearing financial liabilities | | | (25 | ) | | | (14 | ) | | | (1 | ) |
| | | | | | | | | | | | |
Total interest expense and similar charges | | | (4,207 | ) | | | (4,698 | ) | | | (3,778 | ) |
| | | | | | | | | | | | |
Net interest income | | | 2,963 | | | | 2,734 | | | | 3,633 | |
| | | | | | | | | | | | |
| (1) | Adjusted to reflect the presentation of discontinued operations, as set out in Note 12. |
4. NET FEE AND COMMISSION INCOME
| | | | | | | | | | | | |
| | | Group | |
| | | 2013
£m | | | 2012(1)
£m | | | 2011(1)
£m | |
Fee and commission income: | | | | | | | | | | | | |
Retail and corporate products | | | 894 | | | | 861 | | | | 828 | |
Insurance products | | | 92 | | | | 135 | | | | 143 | |
Asset management | | | 72 | | | | 90 | | | | 73 | |
| | | | | | | | | | | | |
Total fee and commission income | | | 1,058 | | | | 1,086 | | | | 1,044 | |
| | | | | | | | | | | | |
Fee and commission expense: | | | | | | | | | | | | |
Other fees paid | | | (300 | ) | | | (225 | ) | | | (180 | ) |
| | | | | | | | | | | | |
Total fee and commission expense | | | (300 | ) | | | (225 | ) | | | (180 | ) |
| | | | | | | | | | | | |
Net fee and commission income | | | 758 | | | | 861 | | | | 864 | |
| | | | | | | | | | | | |
| (1) | Adjusted to reflect the presentation of discontinued operations, as set out in Note 12. |
5. NET TRADING AND OTHER INCOME
| | | | | | | | | | | | |
| | | Group | |
| | | 2013
£m | | | 2012(1)
£m | | | 2011(1)
£m | |
Net trading and funding of other items by the trading book | | | 247 | | | | 513 | | | | 255 | |
Income from operating lease assets | | | 42 | | | | 54 | | | | 68 | |
Income on assets designated at fair value through profit or loss | | | 43 | | | | 271 | | | | 530 | |
Loss on liabilities designated at fair value through profit or loss | | | (139 | ) | | | (180 | ) | | | (105 | ) |
Gains/(losses) on derivatives managed with assets/liabilities held at fair value through profit or loss | | | 155 | | | | (439 | ) | | | (458 | ) |
Share of profit/(loss) from associates and joint ventures | | | 4 | | | | (4 | ) | | | 1 | |
Profit on sale of available-for-sale assets | | | 46 | | | | 24 | | | | — | |
Loss on sale of property, plant and equipment and intangible fixed assets | | | (2 | ) | | | — | | | | (2 | ) |
Hedge ineffectiveness and other | | | (121 | ) | | | 144 | | | | 150 | |
Profit on repurchase of debt issuance (See Note 34) | | | 33 | | | | 705 | | | | — | |
| | | | | | | | | | | | |
| | | 308 | | | | 1,088 | | | | 439 | |
| | | | | | | | | | | | |
| (1) | Adjusted to reflect the presentation of discontinued operations, as set out in Note 12. |
“Net trading and funding of other items by the trading book” includes fair value losses of £(58)m (2012: £(149)m, 2011: £(125)m) on embedded derivatives bifurcated from certain equity index-linked deposits, as described in the derivative financial instruments section of the Accounting Policies. The embedded derivatives are economically hedged internally with the equity derivatives trading desk. These internal transactions are managed as part of the overall positions of the equity derivatives trading desk, the results of which are also included in this line item, and amounted to £59m (2012: £150m, 2011: £127m). As a result, the net fair value movements recognised on the equity index-linked deposits and the related economic hedges were £1m (2012: £1m, 2011: £2m).
In July 2012, as part of a capital management exercise, the Company purchased certain of its debt capital instruments pursuant to a tender offer. The net impact of the purchase and crystallisation of mark-to-market positions on associated derivatives resulted in a pre-tax gain of £705m. A further but smaller exercise was carried out in 2013, generating a profit of £33m.
| | |
| 234 | | Santander UK plc Annual Report 2013 |
Financial Statements
Notes to the Financial Statementscontinued
6. ADMINISTRATION EXPENSES
| | | | | | | | | | | | |
| | | Group | |
| | | 2013
£m | | | 2012(1)
£m | | | 2011(1)
£m | |
Staff costs: | | | | | | | | | | | | |
Wages and salaries | | | 631 | | | | 643 | | | | 594 | |
Performance-related payments: - cash | | | 124 | | | | 131 | | | | 111 | |
- shares | | | 16 | | | | 19 | | | | 21 | |
Social security costs | | | 78 | | | | 82 | | | | 76 | |
Pensions costs: - defined contribution plans | | | 38 | | | | 34 | | | | 29 | |
- defined benefit plans | | | 29 | | | | 29 | | | | 24 | |
Other share-based payments | | | — | | | | — | | | | (1 | ) |
Other personnel costs | | | 62 | | | | 53 | | | | 84 | |
| | | | | | | | | | | | |
| | | 978 | | | | 991 | | | | 938 | |
Property, plant and equipment expenses | | | 177 | | | | 179 | | | | 184 | |
Information technology expenses | | | 418 | | | | 341 | | | | 373 | |
Other administration expenses | | | 374 | | | | 362 | | | | 381 | |
| | | | | | | | | | | | |
| | | 1,947 | | | | 1,873 | | | | 1,876 | |
| | | | | | | | | | | | |
| (1) | Adjusted to reflect the presentation of discontinued operations, as set out in Note 12. |
“Performance-related payments – shares” consist of bonuses paid in the form of shares and awards granted under the Long- Term Incentive Plan, as described in Note 42. Included in “performance-related payments – shares” is £16m (2012: £19m, 2011: £21m) which arose from equity-settled share-based payments, none of which related to option-based schemes. “Other share-based payments” consist of options granted under the Employee Sharesave scheme, as described in Note 42, which comprise the Santander UK group’s cash-settled share-based payments.
Performance-related payments above include amounts related to deferred performance awards as follows:
| | | | | | | | | | | | | | | | | | | | | | | | |
| | | Costs recognised in 2013 | | | Costs expected to be recognised in 2014 or later | |
| | | Arising from awards in
current year | | | Arising from awards in
prior year | | | Total | | | Arising from awards
in current year | | | Arising from awards
in prior year | | | Total | |
| | | £m | | | £m | | | £m | | | £m | | | £m | | | £m | |
Cash | | | 3 | | | | 5 | | | | 8 | | | | 9 | | | | 6 | | | | 15 | |
Shares | | | 3 | | | | 8 | | | | 11 | | | | 5 | | | | 4 | | | | 9 | |
| | | | | | | | | | | | | | | | | | | | | | | | |
Total | | | 6 | | | | 13 | | | | 19 | | | | 14 | | | | 10 | | | | 24 | |
| | | | | | | | | | | | | | | | | | | | | | | | |
The following table shows the amount of bonus awarded to employees for the performance year 2013. In the case of deferred cash and share awards, the final amount paid to an employee is influenced by forfeiture provisions and any performance conditions to which these awards are subject. The deferred share award amount is based on the fair value of these awards at the date of grant.
| | | | | | | | | | | | | | | | | | | | | | | | |
| | | Expenses charged in the year | | | Expenses deferred to future periods | | | Total | |
| | | 2013
£m | | | 2012
£m | | | 2013
£m | | | 2012
£m | | | 2013
£m | | | 2012
£m | |
Cash award - not deferred | | | 116 | | | | 126 | | | | — | | | | — | | | | 116 | | | | 126 | |
- deferred | | | 8 | | | | 5 | | | | 15 | | | | 10 | | | | 23 | | | | 15 | |
Shares award - not deferred | | | 5 | | | | 6 | | | | — | | | | — | | | | 5 | | | | 6 | |
- deferred | | | 11 | | | | 13 | | | | 9 | | | | 11 | | | | 20 | | | | 24 | |
| | | | | | | | | | | | | | | | | | | | | | | | |
Total discretionary bonus | | | 140 | | | | 150 | | | | 24 | | | | 21 | | | | 164 | | | | 171 | |
| | | | | | | | | | | | | | | | | | | | | | | | |
7. DEPRECIATION, AMORTISATION AND IMPAIRMENT
| | | | | | | | | | | | |
| | | Group | |
| | | 2013
£m | | | 2012(1)
£m | | | 2011(1)
£m | |
Depreciation of property, plant and equipment | | | 198 | | | | 210 | | | | 222 | |
Amortisation and impairment of intangible assets | | | 50 | | | | 31 | | | | 216 | |
| | | | | | | | | | | | |
| | | 248 | | | | 241 | | | | 438 | |
| | | | | | | | | | | | |
| (1) | Adjusted to reflect the presentation of discontinued operations, as set out in Note 12. |
There were no impairments in 2013 and 2012. In 2011, amortisation and impairment of intangible assets included £112m and £60m in respect of the impairment of software and goodwill, respectively.
| | |
| Santander UK plc Annual Report 2013 | | 235 |
Financial Statements
Notes to the Financial Statementscontinued
8. AUDIT AND OTHER SERVICES
The fees for audit and other services payable to the Company’s auditor, Deloitte LLP, are analysed as follows:
| | | | | | | | | | | | |
| | | Group | |
| | | 2013
£m | | | 2012
£m | | | 2011
£m | |
Audit fees: | | | | | | | | | | | | |
Fees payable to the Company’s auditor and its associates for the audit of the Santander UK group’s annual accounts(1) | | | 3.1 | | | | 3.0 | | | | 2.3 | |
Fees payable to the Company’s auditor and its associates for other services to the Santander UK group: | | | | | | | | | | | | |
- The audit of Santander UK group’s subsidiaries | | | 1.7 | | | | 1.8 | | | | 2.0 | |
| | | | | | | | | | | | |
Total audit fees | | | 4.8 | | | | 4.8 | | | | 4.3 | |
| | | | | | | | | | | | |
Non-audit fees: | | | | | | | | | �� | | | |
Audit-related assurance services | | | 2.5 | | | | 1.7 | | | | 1.6 | |
Other taxation advisory services | | | 0.3 | | | | 0.1 | | | | 0.4 | |
Other assurance services | | | 0.8 | | | | 1.9 | | | | — | |
| | | | | | | | | | | | |
Total non-audit fees | | | 3.6 | | | | 3.7 | | | | 2.0 | |
| | | | | | | | | | | | |
| (1) | Includes £0.4m charged in 2013. |
Fees paid to Deloitte LLP and its associates for non-audit services to the Santander UK group are not required to be disclosed because the consolidated financial statements are required to disclose such fees on a consolidated basis. Audit-related assurance services of £0.8m (2012: £0.5m, 2011: £0.8m) relate to services performed in connection with securitisation, debt issuances and prudential-related work.
No information technology, internal audit, valuation and actuarial, litigation, recruitment and remuneration or corporate finance services were provided by the external auditor during these years. A framework for ensuring auditor’s independence has been adopted which defines unacceptable non-audit assignments, pre-approval of acceptable non-audit assignments and procedures for approval of acceptable non-audit assignments by the Board Audit Committee. Services provided by the Santander UK group’s external auditor are subject to approval by the Board Audit Committee. No services were provided pursuant to contingent fee arrangements.
9. IMPAIRMENT LOSSES AND PROVISIONS
| | | | | | | | | | | | |
| | | Group | |
| | | 2013
£m | | | 2012(1)
£m | | | 2011(1)
£m | |
Impairment losses on loans and advances: | | | | | | | | | | | | |
- loans and advances to customers (Note 19) | | | 576 | | | | 1,053 | | | | 561 | |
- loans and advances to banks (Note 18) | | | — | | | | — | | | | — | |
- loans and receivables securities (Note 22) | | | — | | | | — | | | | — | |
Recoveries of loans and advances (Note 19) | | | (101 | ) | | | (65 | ) | | | (60 | ) |
| | | | | | | | | | | | |
| | | 475 | | | | 988 | | | | 501 | |
| | | | | | | | | | | | |
Impairment losses on available-for-sale financial assets (Note 23) | | | — | | | | — | | | | — | |
| | | | | | | | | | | | |
Provisions for other liabilities and charges: (Note 36) | | | | | | | | | | | | |
- New and increased allowances | | | 265 | | | | 437 | | | | 911 | |
- Provisions released | | | (45 | ) | | | (3 | ) | | | (4 | ) |
| | | | | | | | | | | | |
| | | 220 | | | | 434 | | | | 907 | |
| | | | | | | | | | | | |
Total impairment losses and provisions charged to the income statement | | | 695 | | | | 1,422 | | | | 1,408 | |
| | | | | | | | | | | | |
| (1) | Adjusted to reflect the presentation of discontinued operations, as set out in Note 12. |
| | |
| 236 | | Santander UK plc Annual Report 2013 |
Financial Statements
Notes to the Financial Statementscontinued
10. TAXATION CHARGE
| | | | | | | | | | | | |
| | | Group | |
| | | 2013
£m | | | 2012(1)
£m | | | 2011(1)
£m | |
Current tax: | | | | | | | | | | | | |
UK corporation tax on profit of the year | | | 143 | | | | 151 | | | | 230 | |
Adjustments in respect of prior years | | | (70 | ) | | | (113 | ) | | | (3 | ) |
| | | | | | | | | | | | |
Total current tax | | | 73 | | | | 38 | | | | 227 | |
| | | | | | | | | | | | |
Deferred tax: | | | | | | | | | | | | |
Origination and reversal of temporary differences | | | 120 | | | | 125 | | | | 102 | |
Change in rate of UK corporation tax | | | (15 | ) | | | 4 | | | | 20 | |
Adjustments in respect of prior years | | | 40 | | | | 103 | | | | (4 | ) |
| | | | | | | | | | | | |
Total deferred tax | | | 145 | | | | 232 | | | | 118 | |
| | | | | | | | | | | | |
Tax on profit on continuing operations | | | 218 | | | | 270 | | | | 345 | |
| | | | | | | | | | | | |
| (1) | Adjusted to reflect the presentation of discontinued operations, as set out in Note 12. |
UK corporation tax is calculated at 23.25% (2012: 24.5%, 2011: 26.5%) of the estimated assessable profits for the year. The standard rate of UK corporation tax was reduced from 24% to 23% with effect from 1 April 2013. Taxation for other jurisdictions is calculated at the rates prevailing in the relevant jurisdictions. The Finance Act 2013, which provides for a reduction in the main rate of UK corporation tax to 21% effective from 1 April 2014 and 20% effective from 1 April 2015 was enacted on 17 July 2013. As the changes in rates were substantively enacted prior to 31 December 2013, they have been reflected in the deferred tax balance at 31 December 2013.
The effective tax rate for 2013, based on profit before tax, was 19.1% (2012: 23.5%, 2011: 28.4%). The tax on profit before tax differs from the theoretical amount that would arise using the basic corporation tax rate of the Company as follows:
| | | | | | | | | | | | |
| | | Group | |
| | | 2013
£m | | | 2012
£m | | | 2011
£m | |
Profit on continuing operations before tax | | | 1,139 | | | | 1,147 | | | | 1,214 | |
| | | | | | | | | | | | |
Tax calculated at a tax rate of 23.25% (2012: 24.5%, 2011: 26.5%) | | | 265 | | | | 281 | | | | 322 | |
Non deductible preference dividends paid | | | 7 | | | | 7 | | | | 8 | |
Non deductible UK Bank Levy | | | 14 | | | | 12 | | | | 13 | |
Other non-equalised items | | | (17 | ) | | | (12 | ) | | | (4 | ) |
Effect of non-UK profits and losses | | | (3 | ) | | | (4 | ) | | | (7 | ) |
Utilisation of capital losses for which credit was not previously recognised | | | (3 | ) | | | (8 | ) | | | — | |
Effect of change in tax rate on deferred tax provision | | | (15 | ) | | | 4 | | | | 20 | |
Adjustment to prior year provisions | | | (30 | ) | | | (10 | ) | | | (7 | ) |
| | | | | | | | | | | | |
Tax expense | | | 218 | | | | 270 | | | | 345 | |
| | | | | | | | | | | | |
In addition to the corporation tax expense charged to profit or loss, tax of £151m (2012: £45m, 2011: £11m) has been charged in other comprehensive income in the year, as follows:
| | | | | | | | | | | | | | |
| 2013 | | Group | |
| | | Before tax amount
£m | | | Total tax
£m | | | After tax amount
£m | |
Remeasurement of defined benefit pension obligations | | | (564 | ) | | | 113 | | | | (451 | ) |
Movements in available-for-sale financial assets: | | - Gains due to changes in fair value | | | 15 | | | | (4 | ) | | | 11 | |
| | - Gains transferred to profit or loss on sale | | | (46 | ) | | | 11 | | | | (35 | ) |
Movements in cash flow hedge | | | | | (141 | ) | | | 31 | | | | (110 | ) |
| | | | | | | | | | | | | | |
Other comprehensive income | | | (736 | ) | | | 151 | | | | (585 | ) |
| | | | | | | | | | | | | | |
| |
| 2012 | | Group | |
| | | Before tax amount
£m | | | Total tax
£m | | | After tax amount
£m | |
Remeasurement of defined benefit pension obligations | | | (183 | ) | | | 42 | | | | (141 | ) |
Movements in available-for-sale financial assets: | | - Gains due to changes in fair value | | | 6 | | | | (1 | ) | | | 5 | |
| | - Gains transferred to profit or loss on sale | | | (17 | ) | | | 4 | | | | (13 | ) |
| | | | | | | | | | | | | | |
Other comprehensive income | | | (194 | ) | | | 45 | | | | (149 | ) |
| | | | | | | | | | | | | | |
| |
| 2011 | | Group | |
| | | Before tax amount
£m | | | Total tax
£m | | | After tax amount
£m | |
Remeasurement of defined benefit pension obligations | | | (37 | ) | | | 9 | | | | (28 | ) |
Movements in available-for-sale financial assets: | | - Losses due to changes in fair value | | | (3 | ) | | | 2 | | | | (1 | ) |
| | | | | | | | | | | | | | |
Other comprehensive income | | | (40 | ) | | | 11 | | | | (29 | ) |
| | | | | | | | | | | | | | |
Further information about deferred tax is presented in Note 27.
| | |
| Santander UK plc Annual Report 2013 | | 237 |
Financial Statements
Notes to the Financial Statementscontinued
11. PROFIT/(LOSS) AFTER TAX OF THE COMPANY
The profit/(loss) after tax of the Company attributable to shareholders was £248m (2012: £(760)m, 2011: £3,153m). As permitted by Section 408 of the UK Companies Act 2006, the Company’s individual income statement has not been presented. The significant decrease in profit in 2012 was attributable to the reversal of temporary mark-to-market gains recognised in 2011 of £1,224m on derivatives with other entities in the Santander UK group which eliminate on consolidation within Santander UK. Excluding this mark-to-market volatility, there would have been a profit of £464m in 2012.
12. DISCONTINUED OPERATIONS
In 2013, the Company sold its co-brand credit cards business for a cash consideration of £660m. The net assets disposed of consisted of loans to customers of £670m. The results and loss on sale, of the discontinued operations were as follows:
| | | | | | | | | | | | |
| | | Group | |
| | | 2013
£m | | | 2012
£m | | | 2011
£m | |
Total operating income | | | 76 | | | | 218 | | | | 249 | |
Total operating expenses excluding impairment losses, provisions and charges | | | (39 | ) | | | (108 | ) | | | (128 | ) |
Impairment losses on loans and advances | | | (12 | ) | | | (21 | ) | | | (64 | ) |
Provisions for other liabilities and charges | | | (25 | ) | | | (5 | ) | | | (10 | ) |
| | | | | | | | | | | | |
Profit of discontinued operations before tax | | | — | | | | 84 | | | | 47 | |
Taxation charge on discontinued operations | | | — | | | | (22 | ) | | | (13 | ) |
| | | | | | | | | | | | |
Loss on sale of discontinued operations | | | (10 | ) | | | — | | | | — | |
Taxation credit on loss on sale on discontinued operations | | | 2 | | | | — | | | | — | |
| | | | | | | | | | | | |
(Loss)/profit from discontinued operations (after tax) | | | (8 | ) | | | 62 | | | | 34 | |
| | | | | | | | | | | | |
At 31 December 2012, the co-brand credit cards business was classified as held for sale. As a result, the assets of the business, which consisted of loans and advances to customers were measured at the lower of carrying amount and fair value less costs to sell. In addition, the loans and advances were reclassified in the balance sheet from the line item “Loans and advances to customers” to the line item “Other Assets”, as set out in Notes 19 and 28, respectively.
Once it was determined to be sold, in early 2013, for segmental reporting purposes the business was managed and reported as part of Corporate Centre, rather than Retail Banking as in 2012. The segmental analyses presented in these financial statements have been adjusted to reflect the fact that reportable segments have changed, as set out in Note 2.
13. CASH AND BALANCES AT CENTRAL BANKS
| | | | | | | | | | | | | | | | |
| | | Group | | | Company | |
| | | 2013
£m | | | 2012
£m | | | 2013
£m | | | 2012
£m | |
Cash in hand | | | 1,214 | | | | 1,121 | | | | 1,150 | | | | 1,110 | |
Balances with central banks | | | 25,160 | | | | 28,161 | | | | 20,249 | | | | 27,773 | |
| | | | | | | | | | | | | | | | |
| | | 26,374 | | | | 29,282 | | | | 21,399 | | | | 28,883 | |
| | | | | | | | | | | | | | | | |
Balances with central banks above represent amounts held at the Bank of England and the US Federal Reserve as part of the Santander UK group’s liquidity management activities. This is described further in the Risk Management Report. In addition, it includes certain minimum cash balances held for regulatory purposes required to be maintained with the Bank of England. At 31 December 2013, these amounted to £315m (2012: £203m) for the Santander UK group and £277m (2012: £179m) for the Company.
14. DIVIDENDS
Ordinary dividends declared and authorised during the year were as follows:
| | | | | | | | | | | | | | | | | | | | | | | | |
| | | Group and Company | | | Group and Company | |
| | | 2013
Pence per
share | | | 2012
Pence per
share | | | 2011
Pence per
share | | | 2013
£m | | | 2012
£m | | | 2011
£m | |
Ordinary shares (equity): | | | | | | | | | | | | | | | | | | | | | | | | |
In respect of current year – first interim | | | 0.69 | | | | — | | | | 1.37 | | | | 215 | | | | — | | | | 425 | |
In respect of current year – second interim | | | 0.68 | | | | 1.45 | | | | — | | | | 210 | | | | 450 | | | | — | |
| | | | | | | | | | | | | | | | | | | | | | | | |
| | | 1.37 | | | | 1.45 | | | | 1.37 | | | | 425 | | | | 450 | | | | 425 | |
| | | | | | | | | | | | | | | | | | | | | | | | |
In addition, £19m (2012: £19m) of dividends were declared and paid on the £300m fixed/floating rate non-cumulative callable preference shares, £21m (2012: £21m) of dividends were declared and paid on the £300m Step-up Callable Perpetual Reserve Capital Instruments and £17m (2012: £17m) of dividends were declared and paid on the £300m Step-up Callable Perpetual Preferred Securities.
| | |
| 238 | | Santander UK plc Annual Report 2013 |
Financial Statements
Notes to the Financial Statementscontinued
15. TRADING ASSETS
| | | | | | | | | | |
| | | | | Group | |
| | | | | 2013
£m | | | 2012
£m | |
Loans and advances to banks | | - securities purchased under resale agreements | | | 4,219 | | | | 7,245 | |
| | - other(1) | | | 5,107 | | | | 2,743 | |
Loans and advances to customers | | - securities purchased under resale agreements | | | 4,210 | | | | 7,463 | |
| | - other(2) | | | 194 | | | | 89 | |
Debt securities | | | | | 7,859 | | | | 4,494 | |
Equity securities | | | | | 705 | | | | 464 | |
| | | | | | | | | | |
| | | | | 22,294 | | | | 22,498 | |
| | | | | | | | | | |
| (1) | Comprises cash collateral of £5,106m (2012: £2,741m) and short-term loans of £1m (2012: £2m). |
| (2) | Comprises short-term loans. |
Debt securities can be analysed by type of issuer as follows:
| | | | | | | | | | |
| | | | | Group | |
| | | | | 2013
£m | | | 2012
£m | |
Issued by public bodies: | | | | | | | | | | |
- Government securities | | | | | 6,631 | | | | 3,917 | |
Issued by other issuers: | | | | | | | | | | |
- Fixed and floating rate notes(1): | | - Government guaranteed | | | 1,081 | | | | 426 | |
| | - Other | | | 147 | | | | 138 | |
- Bank and building society certificates of deposit: Other | | | — | | | | 13 | |
| | | | | | | | | | |
| | | | | 7,859 | | | | 4,494 | |
| | | | | | | | | | |
| (1) | The FRNs are rated 24% AAA, 66% AA, 5% A, 5% BBB and below (2012: 75% AAA, 3% AA, 15% A, 7% BBB and below). |
Debt securities and equity securities can be analysed by listing status as follows:
| | | | | | | | |
| | | Group | |
| | | 2013
£m | | | 2012
£m | |
Debt securities: | | | | | | | | |
- Listed in the UK | | | 1,489 | | | | 2,145 | |
- Listed elsewhere | | | 1,582 | | | | 687 | |
- Unlisted(1) | | | 4,788 | | | | 1,662 | |
| | | | | | | | |
| | | 7,859 | | | | 4,494 | |
| | | | | | | | |
Equity securities: | | | | | | | | |
- Listed in the UK | | | 642 | | | | 372 | |
- Listed elsewhere | | | 63 | | | | 92 | |
| | | | | | | | |
| | | 705 | | | | 464 | |
| | | | | | | | |
| (1) | These largely represent Japanese Treasury bonds for which there is no financial listing. |
At 31 December 2013 and 2012, the Company had no trading assets. Included in the above balances are amounts owed to the Santander UK group by Banco Santander, S.A. and other subsidiaries of Banco Santander, S.A. outside the Santander UK group of £80m (2012: £206m) and £32m (2012: £nil) respectively.
| | |
| Santander UK plc Annual Report 2013 | | 239 |
Financial Statements
Notes to the Financial Statementscontinued
16. DERIVATIVE FINANCIAL INSTRUMENTS
Derivatives are financial instruments whose value is derived from the price of one or more underlying items such as equities, equity indices, interest rates, foreign exchange rates, property indices, commodities and credit spreads. Derivatives enable users to manage exposure to credit or market risks. The Santander UK group sells derivatives to its customers and uses derivatives to manage its own exposure to credit and market risks.
a) Use of derivatives
The Santander UK group transacts derivatives for four primary purposes:
| • | | to create risk management solutions for customers; |
| • | | to manage the portfolio risks arising from customer business; |
| • | | to manage and hedge the Santander UK group’s own risks; and |
| • | | to generate profits through sales activities. |
Under IAS 39, all derivatives are classified as “held for trading” (except for derivatives which are designated as effective hedging instruments in accordance with the detailed requirements of IAS 39) even if this is not the purpose of the transaction. The held for trading classification therefore includes two types of derivatives:
| • | | those used in sales activities; and |
| • | | those used for risk management purposes but, for various reasons, either the Santander UK group does not elect to claim hedge accounting for or they do not meet the qualifying criteria for hedge accounting. These consist of: |
| | • | | non-qualifying hedging derivatives (known as “economic hedges”), whose terms match other on-balance sheet instruments but do not meet the technical criteria for hedge accounting, or which use natural offsets within other on-balance sheet instruments containing the same risk features as part of an integrated approach to risk management, and hence do not require the application of hedge accounting to achieve a reduction in income statement volatility; |
| | • | | derivatives managed in conjunction with financial instruments designated at fair value (known as the “fair value option”). The fair value option is described more fully in the Accounting Policy “Financial assets” and Notes 17 and 32. The Santander UK group’s business model is primarily structured to maximise use of the fair value option, rather than electing to apply hedge accounting, in order to reduce the administrative burden on the Santander UK group associated with complying with the detailed hedge accounting requirements of IAS 39; |
| | • | | derivatives that do not meet the qualifying criteria for hedge accounting, including ineffective hedging derivatives and any components of hedging derivatives that are excluded from assessing hedge effectiveness; and |
| | • | | derivative contracts that represent the closing-out of existing positions through the use of matching deals. |
The following table summarises the activities undertaken, the related risks associated with such activities and the types of derivatives used in managing such risks. These risks may also be managed using on-balance sheet instruments as part of an integrated approach to risk management.
| | | | |
Activity | | Risk | | Type of derivative |
Management of the return on variable rate assets financed by shareholders’ funds and net non-interest-bearing liabilities. | | Reduced profitability due to falls in interest rates. | | Receive fixed interest rate swaps. |
| | |
| Management of the basis between administered rate assets and liabilities and wholesale market rates. | | Reduced profitability due to adverse changes in the basis spread. | | Basis swaps. |
| | |
| Management of repricing profile of wholesale funding. | | Reduced profitability due to adverse movement in wholesale interest rates when large volumes of wholesale funding are repriced. | | Forward rate agreements. |
| | |
| Fixed rate lending and investments. | | Sensitivity to increases in interest rates. | | Pay fixed interest rate swaps. |
| | |
| Fixed rate retail and wholesale funding. | | Sensitivity to falls in interest rates. | | Receive fixed interest rate swaps. |
| | |
| Equity-linked retail funding. | | Sensitivity to increases in equity market indices. | | Receive equity swaps. |
| | |
| Management of other net interest income on retail activities. | | Sensitivity of income to changes in interest rates. | | Interest rate swaps. |
| | |
| Issuance of products with embedded equity options. | | Sensitivity to changes in underlying index and index volatility causing option exercise. | | Interest rate swaps combined with equity options. |
| | |
| Lending and investments. | | Sensitivity to weakening credit quality. | | Purchase credit default swaps and total return swaps. |
| | |
| Borrowing funds in foreign currencies | | Sensitivity to changes in foreign exchange rates | | Cross currency swaps |
| | |
| Lending and issuance of products with embedded interest rate options. | | Sensitivity to changes in underlying rate and rate volatility causing option exercise. | | Interest rate swaps plus caps/floors. |
| | |
| Investment in, and issuance of, bonds with put/call features. | | Sensitivity to changes in rates causing option exercise. | | Interest rate swaps combined with swaptions(1) and other matched options. |
| (1) | A swaption is an option on a swap that gives the holder the right but not the obligation to buy or sell a swap. |
| | |
| 240 | | Santander UK plc Annual Report 2013 |
Financial Statements
Notes to the Financial Statementscontinued
The Santander UK group’s derivative activities do not give rise to significant open positions in portfolios of derivatives. Any residual position is managed to ensure that it remains within acceptable risk levels, with matching deals being utilised to achieve this where necessary. When entering into derivative transactions, the Santander UK group employs the same credit risk management procedures to assess and approve potential credit exposures that are used for traditional lending.
The hedging classification consists of derivatives that the Santander UK group has chosen to designate as in a hedging relationship because they meet the specific criteria in IAS 39.
All derivatives are required to be held at fair value through profit or loss, and shown in the balance sheet as separate totals of assets and liabilities. A description of how the fair values of derivatives are derived is set out in Note 45. This is described in more detail in the accounting policies “Derivative financial instruments” and “Hedge accounting” on pages 220 and 221. Derivative assets and liabilities on different transactions are only set off if the transactions are with the same counterparty, a legal right of set-off or netting exists and the cash flows are intended to be settled on a net basis.
b) Trading derivatives
Most of the Santander UK group’s derivative transactions relate to sales activities and derivative contracts that represent the closing-out of existing positions through the use of matching deals. Sales activities include the structuring and marketing of derivative products to customers to enable them to take, transfer, modify or reduce current or expected risks. Limited positions may be traded actively or be held over a period of time to benefit from expected changes in exchange rates, interest rates, equity prices or other market parameters. Trading includes market-making, positioning and arbitrage activities. Market-making entails quoting bid and offer prices to other market participants for the purpose of generating revenues based on spread and volume; positioning means managing market risk positions in the expectation of benefiting from favourable movements in prices, rates or indices; arbitrage involves identifying and profiting from price differentials between markets and products.
Trading derivatives include interest rate, cross currency, equity, property and other index related swaps, forwards, caps, floors, swaptions, as well as credit default and total return swaps, equity index contracts and exchange traded interest rate futures and options and equity index options.
Commercial Banking deals with commercial customers who wish to enter into derivative contracts. Any market risk arising from such transactions is hedged by Markets. Markets is responsible for implementing Santander UK group derivative hedging with the external market together with its own trading activities. For trading activities, its objectives are to gain value by:
| • | | Marketing derivatives to end users and hedging the resulting exposures efficiently; and |
| • | | The management of trading exposure reflected on the Santander UK group’s balance sheet. |
As mentioned above, other derivatives classified as held for trading include non-qualifying hedging derivatives (economic hedges), ineffective hedging derivatives and any components of hedging derivatives that are excluded from assessing hedge effectiveness, derivatives managed in conjunction with financial instruments designated at fair value and derivative contracts that represent the closing-out of existing positions through the use of matching deals.
c) Hedging derivatives
The Santander UK group uses derivatives (principally interest rate swaps and cross-currency swaps) for hedging purposes in the management of its own asset and liability portfolios, including fixed-rate lending, fixed-rate asset purchases, medium-term note issues, capital issues, and structural positions. This enables the Santander UK group to optimise the overall cost to it of accessing debt capital markets, and to mitigate the market risk which would otherwise arise from structural imbalances in the maturity and other profiles of its assets and liabilities.
The accounting for these derivatives is described in the accounting policy “Hedge accounting” in Note 1. Such risks may also be managed using natural offsets within other on-balance sheet instruments as part of an integrated approach to risk management.
Derivative products which are combinations of more basic derivatives (such as swaps with embedded option features), or which have leverage features, may be used in circumstances where the underlying position being hedged contains the same risk features. In such cases, the derivative used will be structured to match the risks of the underlying asset or liability. Exposure to market risk on such contracts is therefore hedged.
The fair values of derivative instruments classified as held for trading and hedging purposes are set out in the following tables. The tables show the contract or underlying principal amounts, and positive and negative fair values of derivatives analysed by contract. The contract/notional amounts of derivatives indicate the nominal value of transactions outstanding at the balance sheet date; they do not represent actual exposures. The fair values represent the price that would be received to sell the derivative asset or paid to transfer the derivative liability in an orderly transaction in the principal (or most advantageous) market at the measurement date under current market conditions.
As described above, derivatives classified as held for trading consist of those used in sales and trading activities, and those used for risk management purposes, either for which the Santander UK group does not elect to claim hedge accounting or which do not meet the qualifying criteria for hedge accounting. Derivatives classified as held for hedging in the table below consist of those that have been designated as in a hedging relationship in accordance with IAS 39.
| | |
| Santander UK plc Annual Report 2013 | | 241 |
Financial Statements
Notes to the Financial Statementscontinued
| | | | | | | | | | | | |
| 2013 | | Group | |
Derivatives held for trading | | Contract/notional amount
£m | | | Fair value assets
£m | | | Fair value liabilities
£m | |
Exchange rate contracts: | | | | | | | | | | | | |
- Cross-currency swaps | | | 110,425 | | | | 1,282 | | | | 2,027 | |
- Foreign exchange swaps, options and forwards | | | 41,849 | | | | 1,133 | | | | 417 | |
| | | | | | | | | | | | |
| | | 152,274 | | | | 2,415 | | | | 2,444 | |
| | | | | | | | | | | | |
Interest rate contracts: | | | | | | | | | | | | |
- Interest rate swaps | | | 512,101 | | | | 10,739 | | | | 9,972 | |
- Caps, floors and swaptions | | | 56,230 | | | | 1,912 | | | | 1,891 | |
- Futures (exchange traded) | | | 31,137 | | | | 11 | | | | 36 | |
- Forward rate agreements | | | 29,379 | | | | 1 | | | | 1 | |
| | | | | | | | | | | | |
| | | 628,847 | | | | 12,663 | | | | 11,900 | |
| | | | | | | | | | | | |
Equity and credit contracts: | | | | | | | | | | | | |
- Equity index swaps and similar products | | | 32,196 | | | | 2,009 | | | | 2,947 | |
- Equity index options (exchange traded) | | | 13,115 | | | | 312 | | | | 1 | |
- Credit default swaps and similar products | | | 158 | | | | 32 | | | | 3 | |
| | | | | | | | | | | | |
| | | 45,469 | | | | 2,353 | | | | 2,951 | |
| | | | | | | | | | | | |
Commodity contracts: | | | | | | | | | | | | |
- OTC swaps | | | 54 | | | | 2 | | | | 2 | |
| | | | | | | | | | | | |
| | | 54 | | | | 2 | | | | 2 | |
| | | | | | | | | | | | |
Total derivative assets and liabilities held for trading | | | 826,644 | | | | 17,433 | | | | 17,297 | |
| | | | | | | | | | | | |
| | | | | | | | | | | | |
| 2013 | | Group | |
Derivatives held for hedging | | Contract/notional amount
£m | | | Fair value assets
£m | | | Fair value liabilities
£m | |
Derivatives designated as fair value hedges: | | | | | | | | | | | | |
Exchange rate contracts: | | | | | | | | | | | | |
- Cross-currency swaps | | | 2,524 | | | | 46 | | | | 47 | |
Interest rate contracts: | | | | | | | | | | | | |
- Interest rate swaps | | | 105,138 | | | | 1,578 | | | | 1,066 | |
| | | | | | | | | | | | |
| | | 107,662 | | | | 1,624 | | | | 1,113 | |
| | | | | | | | | | | | |
Derivatives designated as cash flow hedges: | | | | | | | | | | | | |
Exchange rate contracts: | | | | | | | | | | | | |
- Cross-currency swaps | | | 15,507 | | | | 990 | | | | 445 | |
Interest rate contracts: | | | | | | | | | | | | |
- Interest rate swaps | | | 3,856 | | | | 2 | | | | 8 | |
| | | | | | | | | | | | |
| | | 19,363 | | | | 992 | | | | 453 | |
| | | | | | | | | | | | |
Total derivative assets and liabilities held for hedging | | | 127,025 | | | | 2,616 | | | | 1,566 | |
| | | | | | | | | | | | |
Total recognised derivative assets and liabilities | | | 953,669 | | | | 20,049 | | | | 18,863 | |
| | | | | | | | | | | | |
| | | | | | | | | | | | |
| 2012 | | Group | |
Derivatives held for trading | | Contract/notional amount
£m | | | Fair value assets
£m | | | Fair value liabilities
£m | |
Exchange rate contracts: | | | | | | | | | | | | |
- Cross-currency swaps | | | 117,658 | | | | 2,101 | | | | 2,195 | |
- Foreign exchange swaps, options and forwards | | | 19,568 | | | | 962 | | | | 654 | |
| | | | | | | | | | | | |
| | | 137,226 | | | | 3,063 | | | | 2,849 | |
| | | | | | | | | | | | |
Interest rate contracts: | | | | | | | | | | | | |
- Interest rate swaps | | | 457,430 | | | | 20,072 | | | | 18,977 | |
- Caps, floors and swaptions | | | 61,015 | | | | 3,584 | | | | 3,626 | |
- Futures (exchange traded) | | | 19,273 | | | | 54 | | | | 31 | |
- Forward rate agreements | | | 123,132 | | | | 9 | | | | 13 | |
| | | | | | | | | | | | |
| | | 660,850 | | | | 23,719 | | | | 22,647 | |
| | | | | | | | | | | | |
Equity and credit contracts: | | | | | | | | | | | | |
- Equity index swaps and similar products | | | 44,077 | | | | 1,086 | | | | 1,816 | |
- Equity index options (exchange traded) | | | 29,652 | | | | 152 | | | | 89 | |
- Credit default swaps and similar products | | | 335 | | | | 37 | | | | 7 | |
| | | | | | | | | | | | |
| | | 74,064 | | | | 1,275 | | | | 1,912 | |
| | | | | | | | | | | | |
Commodity contracts: | | | | | | | | | | | | |
- OTC swaps | | | 227 | | | | 7 | | | | 7 | |
| | | | | | | | | | | | |
| | | 227 | | | | 7 | | | | 7 | |
| | | | | | | | | | | | |
Total derivative assets and liabilities held for trading | | | 872,367 | | | | 28,064 | | | | 27,415 | |
| | | | | | | | | | | | |
| | | | | | | | | | | | |
| 2012 | | Group | |
Derivatives held for hedging | | Contract/notional amount
£m | | | Fair value assets
£m | | | Fair value liabilities
£m | |
Derivatives designated as fair value hedges: | | | | | | | | | | | | |
Exchange rate contracts: | | | | | | | | | | | | |
- Cross-currency swaps | | | 5,024 | | | | 76 | | | | 168 | |
Interest rate contracts: | | | | | | | | | | | | |
- Interest rate swaps | | | 77,592 | | | | 2,006 | | | | 1,278 | |
| | | | | | | | | | | | |
| | | 82,616 | | | | 2,082 | | | | 1,446 | |
| | | | | | | | | | | | |
Total derivative assets and liabilities held for hedging | | | 82,616 | | | | 2,082 | | | | 1,446 | |
| | | | | | | | | | | | |
Total recognised derivative assets and liabilities | | | 954,983 | | | | 30,146 | | | | 28,861 | |
| | | | | | | | | | | | |
| | |
| 242 | | Santander UK plc Annual Report 2013 |
Financial Statements
Notes to the Financial Statementscontinued
| | | | | | | | | | | | |
| 2013 | | Company | |
Derivatives held for trading | | Contract/notional amount
£m | | | Fair value assets
£m | | | Fair value liabilities
£m | |
Exchange rate contracts: | | | | | | | | | | | | |
- Cross-currency swaps | | | 2,460 | | | | 574 | | | | 549 | |
- Foreign exchange swaps, options and forwards | | | 1,729 | | | | 23 | | | | 24 | |
| | | | | | | | | | | | |
| | | 4,189 | | | | 597 | | | | 573 | |
| | | | | | | | | | | | |
Interest rate contracts: | | | | | | | | | | | | |
- Interest rate swaps | | | 60,652 | | | | 1,226 | | | | 793 | |
- Caps, floors and swaptions | | | 1,323 | | | | 8 | | | | 25 | |
- Futures (exchange traded) | | | — | | | | — | | | | — | |
| | | | | | | | | | | | |
| | | 61,975 | | | | 1,234 | | | | 818 | |
| | | | | | | | | | | | |
Equity and credit contracts: | | | | | | | | | | | | |
- Equity index swaps and similar products | | | 673 | | | | 69 | | | | 235 | |
| | | | | | | | | | | | |
| | | 673 | | | | 69 | | | | 235 | |
| | | | | | | | | | | | |
Total derivative assets and liabilities held for trading | | | 66,837 | | | | 1,900 | | | | 1,626 | |
| | | | | | | | | | | | |
| | | | | | | | | | | | |
2013 | | Company | |
Derivatives held for hedging | | Contract/notional amount
£m | | | Fair value assets
£m | | | Fair value liabilities
£m | |
Derivatives designated as fair value hedges: | | | | | | | | | | | | |
Exchange rate contracts: | | | | | | | | | | | | |
- Cross-currency swaps | | | 1,354 | | | | 184 | | | | 59 | |
Interest rate contracts: | | | | | | | | | | | | |
- Interest rate swaps | | | 4,214 | | | | 377 | | | | 118 | |
| | | | | | | | | | | | |
| | | 5,568 | | | | 561 | | | | 177 | |
Derivatives designated as cash flow hedges: | | | | | | | | | | | | |
Interest rate contracts: | | | | | | | | | | | | |
- Interest rate swaps | | | — | | | | — | | | | — | |
| | | | | | | | | | | | |
| | | — | | | | — | | | | — | |
| | | | | | | | | | | | |
Total derivative assets and liabilities held for hedging | | | 5,568 | | | | 561 | | | | 177 | |
| | | | | | | | | | | | |
Total recognised derivative assets and liabilities | | | 72,405 | | | | 2,461 | | | | 1,803 | |
| | | | | | | | | | | | |
| | | | | | | | | | | | |
2012 | | Company | |
Derivatives held for trading | | Contract/notional amount
£m | | | Fair value assets
£m | | | Fair value liabilities
£m | |
Exchange rate contracts: | | | | | | | | | | | | |
- Cross-currency swaps | | | 2,153 | | | | 728 | | | | 737 | |
- Foreign exchange swaps, options and forwards | | | 501 | | | | 36 | | | | 35 | |
| | | | | | | | | | | | |
| | | 2,654 | | | | 764 | | | | 772 | |
| | | | | | | | | | | | |
Interest rate contracts: | | | | | | | | | | | | |
- Interest rate swaps | | | 75,341 | | | | 3,257 | | | | 1,047 | |
- Caps, floors and swaptions | | | 2,461 | | | | 13 | | | | 25 | |
| | | | | | | | | | | | |
| | | 77,802 | | | | 3,270 | | | | 1,072 | |
| | | | | | | | | | | | |
Equity and credit contracts: | | | | | | | | | | | | |
- Equity index swaps and similar products | | | 16 | | | | 26 | | | | 205 | |
- Credit default swaps and similar products | | | 61 | | | | 1 | | | | — | |
| | | | | | | | | | | | |
| | | 77 | | | | 27 | | | | 205 | |
| | | | | | | | | | | | |
Total derivative assets and liabilities held for trading | | | 80,533 | | | | 4,061 | | | | 2,049 | |
| | | | | | | | | | | | |
| | | | | | | | | | | | |
| 2012 | | Company | |
Derivatives held for hedging | | Contract/notional amount
£m | | | Fair value assets
£m | | | Fair value liabilities
£m | |
Derivatives designated as fair value hedges: | | | | | | | | | | | | |
Exchange rate contracts: | | | | | | | | | | | | |
- Cross-currency swaps | | | 564 | | | | 381 | | | | — | |
Interest rate contracts: | | | | | | | | | | | | |
- Interest rate swaps | | | 2,590 | | | | 457 | | | | 2 | |
| | | | | | | | | | | | |
| | | 3,154 | | | | 838 | | | | 2 | |
| | | | | | | | | | | | |
Total derivative assets and liabilities held for fair value hedging | | | 3,154 | | | | 838 | | | | 2 | |
| | | | | | | | | | | | |
Total recognised derivative assets and liabilities | | | 83,687 | | | | 4,899 | | | | 2,051 | |
| | | | | | | | | | | | |
Included in the above balances are amounts owed to the Santander UK group by Banco Santander, S.A. and other subsidiaries of Banco Santander, S.A. outside the Santander UK group of £2,058m (2012: £2,028m) and £166m (2012: 169m) respectively and amounts owed by the Santander UK group to Banco Santander, S.A. and other subsidiaries of Banco Santander, S.A. outside the Santander UK group of £1,950m (2012: £1,916m) and £191m (2012: £117m). The net exposures after collateral to the ultimate parent undertaking and fellow subsidiaries at 31 December 2013 amounted to £nil (2012: £138m) and £nil (2012: £7m) respectively.
In addition, in the ordinary course of business, the Santander UK group entered into long-term interest rate contracts as economic hedges with five investment vehicles whose underlying assets comprise debt securities, bank loans and energy and infrastructure financings. Although the vehicles themselves are not externally rated, the counterparty exposure ranks super-senior to the most senior notes issued by the vehicles and these notes are rated AAA or AA. The total mark-to-market exposure at 31 December 2013 was £34m (2012: £50m). These long-term interest rate contracts are included within “derivatives held for trading - interest rate contracts” shown above.
| | |
| Santander UK plc Annual Report 2013 | | 243 |
Financial Statements
Notes to the Financial Statementscontinued
Net gains or losses arising from fair value and cash flow hedges included in net trading and other income
| | | | | | | | | | | | |
| | | Group | |
| | | 2013
£m | | | 2012
£m | | | 2011
£m | |
Fair value hedging: | | | | | | | | | | | | |
- (Losses)/Gains on hedging instruments | | | (281 | ) | | | (294 | ) | | | 1,454 | |
- Gain/(Losses) on hedged items attributable to hedged risks | | | 350 | | | | 464 | | | | (1,438 | ) |
| | | | | | | | | | | | |
Fair value hedging ineffectiveness | | | 69 | | | | 170 | | | | 16 | |
Cash flow hedging ineffectiveness | | | (176 | ) | | | — | | | | — | |
| | | | | | | | | | | | |
| | | (107 | ) | | | 170 | | | | 16 | |
| | | | | | | | | | | | |
The Santander UK group hedges its exposures to various risks, including interest rate risk and foreign currency risk, in connection with certain mortgage assets, covered bond issuances, and subordinated and senior debt securities in issue. The gains/(losses) arising on these assets and liabilities are presented in the table above on a combined basis.
Hedged cash flows
The following tables show when the Santander UK group’s hedged cash flows are expected to occur and when they will affect income for designated cash flow hedges.
| | | | | | | | | | | | | | | | | | | | | | | | | | | | | | | | |
| | | Up to 1
year | | | 1 - 2
years | | | 2 - 3
years | | | 3 - 4
years | | | 4 - 5
years | | | 5 - 10
years | | | 10 - 20
years | | | Total | |
31 December 2013 | | £m | | | £m | | | £m | | | £m | | | £m | | | £m | | | £m | | | £m | |
Hedged forecast cash flows expected to occur: | | | | | | | | | | | | | | | | | | | | | | | | | | | | | | | | |
Forecast receivable cash flows | | | 177 | | | | 211 | | | | 267 | | | | 283 | | | | 229 | | | | 681 | | | | 97 | | | | 1,945 | |
Forecast payable cash flows | | | (3,305 | ) | | | (4,229 | ) | | | (1,924 | ) | | | (1,180 | ) | | | (2,017 | ) | | | (4,834 | ) | | | (367 | ) | | | (17,856 | ) |
Hedged forecast cash flows affect profit or loss: | | | | | | | | | | | | | | | | | | | | | | | | | | | | | | | | |
Forecast receivable cash flows | | | 177 | | | | 210 | | | | 266 | | | | 279 | | | | 224 | | | | 671 | | | | 96 | | | | 1,923 | |
Forecast payable cash flows | | | (3,300 | ) | | | (4,182 | ) | | | (1,913 | ) | | | (1,174 | ) | | | (1,985 | ) | | | (4,776 | ) | | | (362 | ) | | | (17,692 | ) |
There were no hedging instruments designated as cash flow hedges during the years ended 31 December 2012 and 2011.
There were no transactions for which cash flow hedge accounting had to be ceased during the year ended 31 December 2013 as a result of the highly probable cash flows no longer being expected to occur.
Gains and losses transferred from the cash flow hedging reserve in the current year to net interest income was a £47m gain (2012: £nil, 2011: £nil) and net trading and other income was a £113m loss (2012: £nil, 2011: £nil).
| | |
| 244 | | Santander UK plc Annual Report 2013 |
Financial Statements
Notes to the Financial Statementscontinued
17. FINANCIAL ASSETS DESIGNATED AT FAIR VALUE
| | | | | | | | | | | | | | | | |
| | | Group | | | Company | |
| | | 2013
£m | | | 2012
£m | | | 2013
£m | | | 2012
£m | |
Loans and advances to customers | | | 2,219 | | | | 3,248 | | | | 1 | | | | 44 | |
Debt securities | | | 528 | | | | 563 | | | | — | | | | — | |
| | | | | | | | | | | | | | | | |
| | | 2,747 | | | | 3,811 | | | | 1 | | | | 44 | |
| | | | | | | | | | | | | | | | |
Financial assets are designated at fair value through profit or loss where this results in more relevant information because it significantly reduces a measurement inconsistency that would otherwise arise from measuring the assets or liabilities or recognising gains or losses on them on a different basis, or where the assets are managed and their performance evaluated on a fair value basis, or where a contract contains one or more embedded derivatives which would otherwise require bifurcation and separate recognition as derivatives.
The following assets have been designated at fair value through profit or loss:
| • | | Loans and advances to customers, representing loans secured on residential property to housing associations of £2,168m (2012: £3,187m) and other loans of £51m (2012: £61m). |
| | • | | Loans secured on residential property to housing associations of £2,168m (2012: £3,187m) which, at the date of their origination, were managed, and their performance evaluated, on a fair value basis in accordance with a documented investment strategy, and information about them was provided on that basis to management. Since 2009, the Santander UK group’s policy has been not to designate similar new loans at fair value through profit or loss. |
| | • | | Other loans of £51m (2012: £61m), representing a portfolio of roll-up mortgages, are managed, and their performance evaluated, on a fair value basis in accordance with a documented investment strategy, and information about them is provided on that basis to management. |
| • | | Debt securities, representing holdings of asset-backed securities of £316m (2012: £328m) and other debt securities of £212m (2012: £235m): |
| | • | | Mortgage-backed securities of £229m (2012: £250m), other asset-backed securities of £29m (2012: £31m), and other debt securities of £212m (2012: £235m) principally representing reversionary UK property securities. These securities are managed and their performance evaluated on a fair value basis in accordance with a documented investment strategy, and information about them is provided on that basis to management. |
| | • | | Other asset-backed securities of £58m (2012: £47m) which, at the date of their acquisition, were managed, and their performance evaluated, on a fair value basis in accordance with a documented investment strategy, and information about them was provided on that basis to management. Almost all of these securities are now managed on an accruals basis, but are not eligible for reclassification under IAS 39. These securities were issued by Banco Santander entities. |
Included in the above balances are amounts owed to the Santander UK group by Banco Santander, S.A. and other subsidiaries of Banco Santander, S.A. outside the Santander UK group of £nil (2012: £nil) and £56m (2012: £47m) respectively.
The maximum exposure to credit risk on loans and advances designated as held at fair value through profit or loss at the balance sheet date was £2,177m (2012: £3,248m) for the Santander UK group and £1m (2012: £44m) for the Company. The maximum exposure was mitigated by a charge over the residential properties in respect of lending to housing associations amounting to £2,288m (2012: £3,377m) for the Santander UK group and £23m (2012: £34m) for the Company.
The net movement during the year attributable to changes in credit risk for loans and advances designated at fair value was £98m (2012: net loss of £99m, 2011: net loss of £26m). The cumulative net loss attributable to changes in credit risk for loans and advances designated at fair value at 31 December 2013 was £258m (2012: cumulative net loss of £356m).
Debt securities can be analysed by type of issuer as follows:
| | | | | | | | | | | | | | | | |
| | | Group | | | Company | |
| | | 2013
£m | | | 2012
£m | | | 2013
£m | | | 2012
£m | |
Mortgage-backed securities | | | 229 | | | | 250 | | | | — | | | | — | |
Other asset-backed securities | | | 87 | | | | 78 | | | | — | | | | — | |
| | | | | | | | | | | | | | | | |
| | | 316 | | | | 328 | | | | — | | | | — | |
Other securities | | | 212 | | | | 235 | | | | — | | | | — | |
| | | | | | | | | | | | | | | | |
| | | 528 | | | | 563 | | | | — | | | | — | |
| | | | | | | | | | | | | | | | |
| | |
| Santander UK plc Annual Report 2013 | | 245 |
Financial Statements
Notes to the Financial Statementscontinued
Debt securities can be analysed by listing status as follows:
| | | | | | | | | | | | | | | | |
| | | Group | | | Company | |
| | | 2013
£m | | | 2012
£m | | | 2013
£m | | | 2012
£m | |
Listed in the UK | | | 218 | | | | 237 | | | | — | | | | — | |
Listed elsewhere | | | 88 | | | | 80 | | | | — | | | | — | |
Unlisted(1) | | | 222 | | | | 246 | | | | — | | | | — | |
| | | | | | | | | | | | | | | | |
| | | 528 | | | | 563 | | | | — | | | | — | |
| | | | | | | | | | | | | | | | |
| (1) | Includes Social Housing. |
Asset-backed securities can be analysed by the geographical location of the issuer or counterparty as follows:
| | | | | | | | | | | | | | | | | | | | | | | | | | | | | | | | | | | | | | | | |
| | | 31 December 2013 | | | 31 December 2012 | | | Income statement | |
| | | Nominal
value | | | Book
value | | | Fair
value | | | Fair value as
% of nominal | | | Nominal
value | | | Book
value | | | Fair
value | | | Fair value as
% of nominal | | | 2013 | | | 2012 | |
Country | | £m | | | £m | | | £m | | | % | | | £m | | | £m | | | £m | | | % | | | £m | | | £m | |
UK | | | | | | | | | | | | | | | | | | | | | | | | | | | | | | | | | | | | | | | | |
MBS | | | 171 | | | | 218 | | | | 218 | | | | 127 | | | | 171 | | | | 238 | | | | 238 | | | | 139 | | | | 2 | | | | 8 | |
| | | | | | | | | | | | | | | | | | | | | | | | | | | | | | | | | | | | | | | | |
| | | 171 | | | | 218 | | | | 218 | | | | 127 | | | | 171 | | | | 238 | | | | 238 | | | | 139 | | | | 2 | | | | 8 | |
| | | | | | | | | | | | | | | | | | | | | | | | | | | | | | | | | | | | | | | | |
US | | | | | | | | | | | | | | | | | | | | | | | | | | | | | | | | | | | | | | | | |
MBS | | | 7 | | | | 10 | | | | 10 | | | | 143 | | | | 8 | | | | 11 | | | | 11 | | | | 138 | | | | — | | | | 4 | |
| | | | | | | | | | | | | | | | | | | | | | | | | | | | | | | | | | | | | | | | |
| | | 7 | | | | 10 | | | | 10 | | | | 143 | | | | 8 | | | | 11 | | | | 11 | | | | 138 | | | | — | | | | 4 | |
| | | | | | | | | | | | | | | | | | | | | | | | | | | | | | | | | | | | | | | | |
Rest of Europe (principally Spain) | | | | | | | | | | | | | | | | | | | | | | | | | | | | | | | | | | | | | | | | |
ABS | | | 96 | | | | 87 | | | | 87 | | | | 91 | | | | 98 | | | | 78 | | | | 78 | | | | 80 | | | | (13 | ) | | | (13 | ) |
MBS | | | 1 | | | | 1 | | | | 1 | | | | 100 | | | | 1 | | | | 1 | | | | 1 | | | | 100 | | | | — | | | | — | |
| | | | | | | | | | | | | | | | | | | | | | | | | | | | | | | | | | | | | | | | |
| | | 97 | | | | 88 | | | | 88 | | | | 91 | | | | 99 | | | | 79 | | | | 79 | | | | 80 | | | | (13 | ) | | | (13 | ) |
| | | | | | | | | | | | | | | | | | | | | | | | | | | | | | | | | | | | | | | | |
Total | | | 275 | | | | 316 | | | | 316 | | | | 115 | | | | 278 | | | | 328 | | | | 328 | | | | 118 | | | | (11 | ) | | | (1 | ) |
| | | | | | | | | | | | | | | | | | | | | | | | | | | | | | | | | | | | | | | | |
Asset-backed securities can be analysed by the credit rating of the issuer or counterparty as follows:
| | | | | | | | | | | | | | | | | | | | | | | | | | | | | | | | | | | | | | | | |
| | | 31 December 2013 | | | 31 December 2012 | | | Income
statement | |
| | | Nominal
value | | | Book
value | | | Fair
value | | | Fair value as
% of nominal | | | Nominal
value | | | Book
value | | | Fair
value | | | Fair value as
% of nominal | | | 2013 | | | 2012 | |
Credit rating(1) | | £m | | | £m | | | £m | | | % | | | £m | | | £m | | | £m | | | % | | | £m | | | £m | |
AAA | | | | | | | | | | | | | | | | | | | | | | | | | | | | | | | | | | | | | | | | |
ABS | | | — | | | | — | | | | — | | | | — | | | | — | | | | — | | | | — | | | | — | | | | — | | | | — | |
MBS | | | 157 | | | | 203 | | | | 203 | | | | 129 | | | | 159 | | | | 222 | | | | 222 | | | | 140 | | | | 1 | | | | 10 | |
| | | | | | | | | | | | | | | | | | | | | | | | | | | | | | | | | | | | | | | | |
| | | 157 | | | | 203 | | | | 203 | | | | 129 | | | | 159 | | | | 222 | | | | 222 | | | | 140 | | | | 1 | | | | 10 | |
| | | | | | | | | | | | | | | | | | | | | | | | | | | | | | | | | | | | | | | | |
AA+ | | | | | | | | | | | | | | | | | | | | | | | | | | | | | | | | | | | | | | | | |
ABS | | | — | | | | — | | | | — | | | | — | | | | — | | | | — | | | | — | | | | — | | | | — | | | | — | |
| | | | | | | | | | | | | | | | | | | | | | | | | | | | | | | | | | | | | | | | |
| | | — | | | | — | | | | — | | | | — | | | | — | | | | — | | | | — | | | | — | | | | — | | | | — | |
| | | | | | | | | | | | | | | | | | | | | | | | | | | | | | | | | | | | | | | | |
AA | | | | | | | | | | | | | | | | | | | | | | | | | | | | | | | | | | | | | | | | |
ABS | | | 54 | | | | 51 | | | | 51 | | | | 94 | | | | 54 | | | | 49 | | | | 49 | | | | 91 | | | | (4 | ) | | | (15 | ) |
MBS | | | 20 | | | | 24 | | | | 24 | | | | 120 | | | | 20 | | | | 27 | | | | 27 | | | | 135 | | | | 1 | | | | 2 | |
| | | | | | | | | | | | | | | | | | | | | | | | | | | | | | | | | | | | | | | | |
| | | 74 | | | | 75 | | | | 75 | | | | 101 | | | | 74 | | | | 76 | | | | 76 | | | | 103 | | | | (3 | ) | | | (13 | ) |
| | | | | | | | | | | | | | | | | | | | | | | | | | | | | | | | | | | | | | | | |
A | | | | | | | | | | | | | | | | | | | | | | | | | | | | | | | | | | | | | | | | |
ABS | | | 40 | | | | 34 | | | | 34 | | | | 85 | | | | 42 | | | | 28 | | | | 28 | | | | 67 | | | | (9 | ) | | | 2 | |
MBS | | | 1 | | | | 1 | | | | 1 | | | | 100 | | | | 1 | | | | 1 | | | | 1 | | | | 100 | | | | — | | | | — | |
| | | | | | | | | | | | | | | | | | | | | | | | | | | | | | | | | | | | | | | | |
| | | 41 | | | | 35 | | | | 35 | | | | 85 | | | | 43 | | | | 29 | | | | 29 | | | | 67 | | | | (9 | ) | | | 2 | |
| | | | | | | | | | | | | | | | | | | | | | | | | | | | | | | | | | | | | | | | |
BBB | | | | | | | | | | | | | | | | | | | | | | | | | | | | | | | | | | | | | | | | |
ABS | | | 2 | | | | 2 | | | | 2 | | | | 100 | | | | 2 | | | | 1 | | | | 1 | | | | 50 | | | | — | | | | — | |
MBS | | | 1 | | | | 1 | | | | 1 | | | | 100 | | | | — | | | | — | | | | — | | | | — | | | | — | | | | — | |
| | | | | | | | | | | | | | | | | | | | | | | | | | | | | | | | | | | | | | | | |
| | | 3 | | | | 3 | | | | 3 | | | | 100 | | | | 2 | | | | 1 | | | | 1 | | | | 50 | | | | — | | | | — | |
| | | | | | | | | | | | | | | | | | | | | | | | | | | | | | | | | | | | | | | | |
Below BBB | | | | | | | | | | | | | | | | | | | | | | | | | | | | | | | | | | | | | | | | |
MBS | | | — | | | | — | | | | — | | | | — | | | | — | | | | — | | | | — | | | | — | | | | — | | | | — | |
| | | | | | | | | | | | | | | | | | | | | | | | | | | | | | | | | | | | | | | | |
| | | — | | | | — | | | | — | | | | — | | | | — | | | | — | | | | — | | | | — | | | | — | | | | — | |
| | | | | | | | | | | | | | | | | | | | | | | | | | | | | | | | | | | | | | | | |
Total | | | 275 | | | | 316 | | | | 316 | | | | 115 | | | | 278 | | | | 328 | | | | 328 | | | | 118 | | | | (11 | ) | | | (1 | ) |
| | | | | | | | | | | | | | | | | | | | | | | | | | | | | | | | | | | | | | | | |
| (1) | All exposures are internally rated. External ratings are taken into consideration in the rating process, where available. |
| | |
| 246 | | Santander UK plc Annual Report 2013 |
Financial Statements
Notes to the Financial Statementscontinued
18. LOANS AND ADVANCES TO BANKS
| | | | | | | | | | | | | | | | |
| | | Group | | | Company | |
| | | 2013
£m | | | 2012
£m | | | 2013
£m | | | 2012
£m | |
Placements with other banks - securities purchased under resale agreements | | | 273 | | | | — | | | | — | | | | — | |
- other | | | 2,013 | | | | 2,201 | | | | 499 | | | | 707 | |
Amounts due from Banco Santander - securities purchased under resale agreements | | | 50 | | | | 233 | | | | — | | | | — | |
- other | | | 11 | | | | 4 | | | | 11 | | | | — | |
Amounts due from Santander UK group undertakings - securities purchased under resale agreements | | | — | | | | — | | | | 1,005 | | | | 991 | |
- other | | | — | | | | — | | | | 107,752 | | | | 96,148 | |
| | | | | | | | | | | | | | | | |
| | | 2,347 | | | | 2,438 | | | | 109,267 | | | | 97,846 | |
| | | | | | | | | | | | | | | | |
During the years ended 31 December 2013, 2012 and 2011 no impairment losses were incurred. Loans and advances to banks are repayable as follows:
| | | | | | | | | | | | | | | | |
| | | Group | | | Company | |
Repayable: | | 2013
£m | | | 2012
£m | | | 2013
£m | | | 2012
£m | |
On demand | | | 1,237 | | | | 1,172 | | | | 18,191 | | | | 6,223 | |
In not more than 3 months | | | 72 | | | | 276 | | | | 31,615 | | | | 19,431 | |
In more than 3 months but not more than 1 year | | | 1 | | | | 122 | | | | 10,247 | | | | 19,621 | |
In more than 1 year but not more than 5 years | | | 23 | | | | 70 | | | | 43,045 | | | | 33,410 | |
In more than 5 years | | | 1,014 | | | | 798 | | | | 6,169 | | | | 19,161 | |
| | | | | | | | | | | | | | | | |
| | | 2,347 | | | | 2,438 | | | | 109,267 | | | | 97,846 | |
| | | | | | | | | | | | | | | | |
Loans and advances to banks can be analysed by the geographical location of the issuer or counterparty as follows:
| | | | | | | | |
| | | Group | |
Country | | 2013
£m | | | 2012
£m | |
UK | | | 1,530 | | | | 686 | |
Spain | | | 68 | | | | 237 | |
France | | | 62 | | | | 13 | |
Rest of Europe | | | 110 | | | | 149 | |
US | | | 527 | | | | 1,273 | |
Rest of world | | | 50 | | | | 80 | |
| | | | | | | | |
Total | | | 2,347 | | | | 2,438 | |
| | | | | | | | |
Loans and advances to banks can be analysed by the credit rating of the issuer or counterparty as follows:
| | | | | | | | |
| | | Group | |
Credit rating(1) | | 2013
£m | | | 2012
£m | |
AAA | | | — | | | | 5 | |
AA | | | 172 | | | | 7 | |
AA- | | | 428 | | | | 264 | |
A+ | | | 2 | | | | 167 | |
A | | | 569 | | | | 745 | |
A- | | | 1,024 | | | | 1,004 | |
BBB | | | 152 | | | | — | |
BB+ | | | — | | | | 237 | |
D | | | — | | | | 9 | |
| | | | | | | | |
Total | | | 2,347 | | | | 2,438 | |
| | | | | | | | |
| (1) | All exposures are internally rated. External ratings are taken into consideration in the rating process, where available. |
| | |
| Santander UK plc Annual Report 2013 | | 247 |
Financial Statements
Notes to the Financial Statementscontinued
19. LOANS AND ADVANCES TO CUSTOMERS
| | | | | | | | | | | | | | | | |
| | | Group | | | Company | |
| | | 2013
£m | | | 2012(1)
£m | | | 2013
£m | | | 2012
£m | |
Advances secured on residential properties | | | 149,022 | | | | 157,310 | | | | 149,012 | | | | 157,305 | |
Corporate loans: | | | | | | | | | | | | | | | | |
- SME | | | 10,372 | | | | 9,282 | | | | 8,598 | | | | 7,351 | |
- Social housing | | | 5,763 | | | | 4,738 | | | | 27 | | | | 15 | |
- Real estate | | | 3,363 | | | | 3,732 | | | | 147 | | | | 97 | |
- Large Corporates | | | 3,071 | | | | 2,278 | | | | 1,386 | | | | 1,265 | |
- Other | | | 1,234 | | | | 1,234 | | | | 295 | | | | 579 | |
- Legacy portfolios in run-off: | | | | | | | | | | | | | | | | |
- Aviation | | | 380 | | | | 620 | | | | — | | | | — | |
- Shipping | | | 366 | | | | 677 | | | | — | | | | — | |
- Other | | | 321 | | | | 750 | | | | — | | | | — | |
| | | | | | | | | | | | | | | | |
| | | 24,870 | | | | 23,311 | | | | 10,453 | | | | 9,307 | |
| | | | | | | | | | | | | | | | |
Finance leases: | | | | | | | | | | | | | | | | |
- Consumer finance | | | 2,048 | | | | 1,914 | | | | — | | | | — | |
- Other corporate | | | 942 | | | | 818 | | | | — | | | | — | |
- Legacy portfolios in run-off: Other | | | 168 | | | | 330 | | | | — | | | | — | |
| | | | | | | | | | | | | | | | |
| | | 3,158 | | | | 3,062 | | | | — | | | | — | |
| | | | | | | | | | | | | | | | |
Secured advances: | | | | | | | | | | | | | | | | |
- SME | | | 1,001 | | | | 1,299 | | | | 1,001 | | | | 1,299 | |
Other secured advances | | | 1,709 | | | | 1,710 | | | | 1,366 | | | | 1,281 | |
Other unsecured loans: | | | | | | | | | | | | | | | | |
- Overdrafts | | | 994 | | | | 894 | | | | 993 | | | | 893 | |
- UPLs | | | 2,859 | | | | 3,151 | | | | 2,066 | | | | 2,358 | |
- Other loans | | | 1,716 | | | | 1,500 | | | | 48 | | | | 94 | |
| | | | | | | | | | | | | | | | |
| | | 5,569 | | | | 5,545 | | | | 3,107 | | | | 3,345 | |
| | | | | | | | | | | | | | | | |
Amounts due from fellow Banco Santander group subsidiaries and joint ventures | | | 813 | | | | 347 | | | | 11 | | | | 13 | |
Amounts due from subsidiaries | | | — | | | | — | | | | 832 | | | | 462 | |
| | | | | | | | | | | | | | | | |
Loans and advances to customers | | | 186,142 | | | | 192,584 | | | | 165,782 | | | | 173,012 | |
Less: impairment loss allowances | | | (1,555 | ) | | | (1,802 | ) | | | (1,389 | ) | | | (1,315 | ) |
| | | | | | | | | | | | | | | | |
Loans and advances to customers, net of impairment loss allowances | | | 184,587 | | | | 190,782 | | | | 164,393 | | | | 171,697 | |
| | | | | | | | | | | | | | | | |
| | | | | | | | | | | | | | | | |
| | | Group | | | Company | |
Repayable: | | 2013
£m | | | 2012(1)
£m | | | 2013
£m | | | 2012
£m | |
On demand | | | 1,324 | | | | 1,314 | | | | 1,072 | | | | 974 | |
In no more than 3 months | | | 4,594 | | | | 4,254 | | | | 5,241 | | | | 3,130 | |
In more than 3 months but not more than 1 year | | | 7,590 | | | | 7,216 | | | | 11,300 | | | | 5,319 | |
In more than 1 year but not more than 5 years | | | 34,669 | | | | 34,386 | | | | 18,301 | | | | 25,636 | |
In more than 5 years | | | 137,965 | | | | 145,414 | | | | 129,868 | | | | 137,953 | |
| | | | | | | | | | | | | | | | |
Loans and advances to customers | | | 186,142 | | | | 192,584 | | | | 165,782 | | | | 173,012 | |
Less: impairment loss allowances | | | (1,555 | ) | | | (1,802 | ) | | | (1,389 | ) | | | (1,315 | ) |
| | | | | | | | | | | | | | | | |
Loans and advances to customers, net of impairment loss allowances | | | 184,587 | | | | 190,782 | | | | 164,393 | | | | 171,697 | |
| | | | | | | | | | | | | | | | |
| (1) | Adjusted to reflect the presentation of the assets held for sale prior to the completion of the sale as set out in Note 12. |
Finance lease and hire purchase contract receivables may be analysed as follows:
| | | | | | | | | | | | | | | | |
| | | Group | | | Company | |
Gross investment: | | 2013
£m | | | 2012
£m | | | 2013
£m | | | 2012
£m | |
Within 1 year | | | 1,436 | | | | 1,221 | | | | — | | | | — | |
Between 1-5 years | | | 1,840 | | | | 1,884 | | | | — | | | | — | |
In more than 5 years | | | 363 | | | | 696 | | | | — | | | | — | |
| | | | | | | | | | | | | | | | |
| | | 3,639 | | | | 3,801 | | | | — | | | | — | |
Less: unearned future finance income | | | (481 | ) | | | (739 | ) | | | — | | | | — | |
| | | | | | | | | | | | | | | | |
Net investment | | | 3,158 | | | | 3,062 | | | | — | | | | — | |
| | | | | | | | | | | | | | | | |
The net investment in finance leases and hire purchase contracts represents amounts recoverable as follows:
| | | | | | | | | | | | | | | | |
| | | Group | | | Company | |
| | | 2013
£m | | | 2012
£m | | | 2013
£m | | | 2012
£m | |
Within 1 year | | | 1,259 | | | | 1,050 | | | | — | | | | — | |
Between 1-5 years | | | 1,651 | | | | 1,600 | | | | — | | | | — | |
In more than 5 years | | | 248 | | | | 412 | | | | — | | | | — | |
| | | | | | | | | | | | | | | | |
| | | 3,158 | | | | 3,062 | | | | — | | | | — | |
| | | | | | | | | | | | | | | | |
| | |
| 248 | | Santander UK plc Annual Report 2013 |
Financial Statements
Notes to the Financial Statementscontinued
The Santander UK group enters into finance leasing arrangements primarily for the financing of motor vehicles and a range of assets to its corporate customers. Included in the carrying value of net investment in finance leases and hire purchase contracts is £49m (2012: £54m) of unguaranteed residual value at the end of the current lease terms, which is expected to be recovered through re-letting or sale. Contingent rent income of £11m (2012: £14m) was earned during the year, which was classified in “Interest and similar income”.
Finance lease receivable balances are secured over the asset leased. The Santander UK group is not permitted to sell or repledge the asset in the absence of default by the lessee. The Directors consider that the carrying amount of the finance lease receivables approximates to their fair value.
Included within loans and advances to customers are advances assigned to bankruptcy remote structured entities and Abbey Covered Bonds LLP. These loans provide security to issues of covered bonds and asset or mortgage backed securities made by the Santander UK group. See Note 20 for further details.
Loans and advances to customers have the following interest rate structures:
| | | | | | | | | | | | | | | | |
| | | Group | | | Company | |
| | | 2013
£m | | | 2012
£m | | | 2013
£m | | | 2012
£m | |
Fixed rate | | | 69,038 | | | | 64,661 | | | | 61,260 | | | | 56,610 | |
Variable rate | | | 117,104 | | | | 127,923 | | | | 104,522 | | | | 116,402 | |
Less: impairment loss allowances | | | (1,555 | ) | | | (1,802 | ) | | | (1,389 | ) | | | (1,315 | ) |
| | | | | | | | | | | | | | | | |
| | | 184,587 | | | | 190,782 | | | | 164,393 | | | | 171,697 | |
| | | | | | | | | | | | | | | | |
Movement in impairment loss allowances:
| | | | | | | | | | | | | | | | | | | | | | | | |
| | | Group | |
2013 | | Loans secured
on residential
property
£m | | | Corporate
Loans
£m | | | Finance
leases
£m | | | Other
secured
advances
£m | | | Other
unsecured
advances
£m | | | Total
£m | |
At 1 January 2013: | | | | | | | | | | | | | | | | | | | | | | | | |
- Observed | | | | | | | | | | | | | | | | | | | | | | | | |
- Individual | | | 58 | | | | 544 | | | | — | | | | 80 | | | | 11 | | | | 693 | |
- Collective | | | 327 | | | | 58 | | | | 6 | | | | 79 | | | | 197 | | | | 667 | |
- Incurred but not yet observed | | | 167 | | | | 125 | | | | 34 | | | | 10 | | | | 106 | | | | 442 | |
| | | | | | | | | | | | | | | | | | | | | | | | |
| | | 552 | | | | 727 | | | | 40 | | | | 169 | | | | 314 | | | | 1,802 | |
| | | | | | | | | | | | | | | | | | | | | | | | |
Charge/(release) to the income statement: | | | | | | | | | | | | | | | | | | | | | | | | |
- Observed | | | | | | | | | | | | | | | | | | | | | | | | |
- Individual | | | (19 | ) | | | 77 | | | | — | | | | 69 | | | | (11 | ) | | | 116 | |
- Collective | | | 105 | | | | (28 | ) | | | 12 | | | | 4 | | | | 313 | | | | 406 | |
- Incurred but not yet observed | | | 44 | | | | (85 | ) | | | 2 | | | | 82 | | | | 11 | | | | 54 | |
| | | | | | | | | | | | | | | | | | | | | | | | |
| | | 130 | | | | (36 | ) | | | 14 | | | | 155 | | | | 313 | | | | 576 | |
| | | | | | | | | | | | | | | | | | | | | | | | |
Write offs and other items(1) | | | (89 | ) | | | (287 | ) | | | (10 | ) | | | (95 | ) | | | (342 | ) | | | (823 | ) |
| | | | | | | | | | | | | | | | | | | | | | | | |
At 31 December 2013: | | | | | | | | | | | | | | | | | | | | | | | | |
- Observed | | | | | | | | | | | | | | | | | | | | | | | | |
- Individual | | | 39 | | | | 334 | | | | — | | | | 54 | | | | — | | | | 427 | |
- Collective | | | 343 | | | | 30 | | | | 8 | | | | 83 | | | | 128 | | | | 592 | |
- Incurred but not yet observed | | | 211 | | | | 40 | | | | 36 | | | | 92 | | | | 157 | | | | 536 | |
| | | | | | | | | | | | | | | | | | | | | | | | |
| | | 593 | | | | 404 | | | | 44 | | | | 229 | | | | 285 | | | | 1,555 | |
| | | | | | | | | | | | | | | | | | | | | | | | |
| |
| | | Group | |
2012 | | Loans secured
on residential
property
£m | | | Corporate
Loans
£m | | | Finance
leases
£m | | | Other
secured
advances
£m | | | Other
unsecured
advances
£m | | | Total
£m | |
At 1 January 2012: | | | | | | | | | | | | | | | | | | | | | | | | |
- Observed | | | | | | | | | | | | | | | | | | | | | | | | |
- Individual | | | 59 | | | | 324 | | | | — | | | | 83 | | | | — | | | | 466 | |
- Collective | | | 322 | | | | — | | | | 6 | | | | — | | | | 267 | | | | 595 | |
- Incurred but not yet observed | | | 97 | | | | 103 | | | | 31 | | | | 24 | | | | 113 | | | | 368 | |
| | | | | | | | | | | | | | | | | | | | | | | | |
| | | 478 | | | | 427 | | | | 37 | | | | 107 | | | | 380 | | | | 1,429 | |
| | | | | | | | | | | | | | | | | | | | | | | | |
Charge/(release) to the income statement: | | | | | | | | | | | | | | | | | | | | | | | | |
- Observed | | | | | | | | | | | | | | | | | | | | | | | | |
- Individual | | | (1 | ) | | | 382 | | | | — | | | | 50 | | | | 11 | | | | 442 | |
- Collective | | | 80 | | | | 58 | | | | 12 | | | | 79 | | | | 307 | | | | 536 | |
- Incurred but not yet observed | | | 70 | | | | 22 | | | | 4 | | | | (14 | ) | | | (7 | ) | | | 75 | |
| | | | | | | | | | | | | | | | | | | | | | | | |
| | | 149 | | | | 462 | | | | 16 | | | | 115 | | | | 311 | | | | 1,053 | |
| | | | | | | | | | | | | | | | | | | | | | | | |
Write offs and other items(1) | | | (75 | ) | | | (162 | ) | | | (13 | ) | | | (53 | ) | | | (377 | ) | | | (680 | ) |
| | | | | | | | | | | | | | | | | | | | | | | | |
At 31 December 2012: | | | | | | | | | | | | | | | | | | | | | | | | |
- Observed | | | | | | | | | | | | | | | | | | | | | | | | |
- Individual | | | 58 | | | | 544 | | | | — | | | | 80 | | | | 11 | | | | 693 | |
- Collective | | | 327 | | | | 58 | | | | 6 | | | | 79 | | | | 197 | | | | 667 | |
- Incurred but not yet observed | | | 167 | | | | 125 | | | | 34 | | | | 10 | | | | 106 | | | | 442 | |
| | | | | | | | | | | | | | | | | | | | | | | | |
| | | 552 | | | | 727 | | | | 40 | | | | 169 | | | | 314 | | | | 1,802 | |
| | | | | | | | | | | | | | | | | | | | | | | | |
| | |
| Santander UK plc Annual Report 2013 | | 249 |
Financial Statements
Notes to the Financial Statementscontinued
| | | | | | | | | | | | | | | | | | | | | | | | |
| | | Group | |
2011 | | Loans secured
on residential
property
£m | | | Corporate
Loans
£m | | | Finance
leases
£m | | | Other
secured
advances
£m | | | Other
unsecured
advances
£m | | | Total
£m | |
At 1 January 2011 | | | | | | | | | | | | | | | | | | | | | | | | |
- Observed | | | | | | | | | | | | | | | | | | | | | | | | |
- Individual | | | 62 | | | | 268 | | | | 2 | | | | 55 | | | | — | | | | 387 | |
- Collective | | | 307 | | | | — | | | | — | | | | — | | | | 384 | | | | 691 | |
- Incurred but not yet observed | | | 157 | | | | 121 | | | | 17 | | | | 22 | | | | 260 | | | | 577 | |
| | | | | | | | | | | | | | | | | | | | | | | | |
| | | 526 | | | | 389 | | | | 19 | | | | 77 | | | | 644 | | | | 1,655 | |
| | | | | | | | | | | | | | | | | | | | | | | | |
Charge/(release) to the income statement: | | | | | | | | | | | | | | | | | | | | | | | | |
- Observed | | | | | | | | | | | | | | | | | | | | | | | | |
- Individual | | | (4 | ) | | | 173 | | | | 8 | | | | 76 | | | | — | | | | 253 | |
- Collective | | | 108 | | | | — | | | | 6 | | | | — | | | | 412 | | | | 526 | |
- Incurred but not yet observed | | | (60 | ) | | | (19 | ) | | | 13 | | | | 2 | | | | (76 | ) | | | (140 | ) |
| | | | | | | | | | | | | | | | | | | | | | | | |
| | | 44 | | | | 154 | | | | 27 | | | | 78 | | | | 336 | | | | 639 | |
| | | | | | | | | | | | | | | | | | | | | | | | |
Write offs and other items(1) | | | (92 | ) | | | (116 | ) | | | (9 | ) | | | (48 | ) | | | (466 | ) | | | (731 | ) |
| | | | | | | | | | | | | | | | | | | | | | | | |
At 31 December 2011: | | | | | | | | | | | | | | | | | | | | | | | | |
- Observed | | | | | | | | | | | | | | | | | | | | | | | | |
- Individual | | | 59 | | | | 324 | | | | — | | | | 83 | | | | — | | | | 466 | |
- Collective | | | 322 | | | | — | | | | 6 | | | | — | | | | 330 | | | | 658 | |
- Incurred but not yet observed | | | 97 | | | | 103 | | | | 31 | | | | 24 | | | | 184 | | | | 439 | |
| | | | | | | | | | | | | | | | | | | | | | | | |
| | | 478 | | | | 427 | | | | 37 | | | | 107 | | | | 514 | | | | 1,563 | |
| | | | | | | | | | | | | | | | | | | | | | | | |
| (1) | Mortgage write-offs exclude the effect of the unwind over time of the discounting in estimating losses, as described in the accounting policies on page 222. Mortgage write-offs including this effect were £103m (2012: 87m, 2011: £103m). |
| | | | | | | | | | | | | | | | | | | | | | | | | | | | |
| | | Company | |
| | | Loans secured
on residential
property
£m | | | Amounts
due from
subsidiaries
£m | | | Corporate
Loans
£m | | | Finance
leases
£m | | | Other
secured
advances
£m | | | Other
unsecured
advances
£m | | | Total
£m | |
At 1 January 2013 | | | 551 | | | | 232 | | | | 178 | | | | — | | | | 169 | | | | 185 | | | | 1,315 | |
Charge/(release) to the income statement | | | 131 | | | | — | | | | 68 | | | | — | | | | 154 | | | | 241 | | | | 594 | |
Write offs and other items | | | (89 | ) | | | — | | | | (73 | ) | | | — | | | | (94 | ) | | | (264 | ) | | | (520 | ) |
| | | | | | | | | | | | | | | | | | | | | | | | | | | | |
At 31 December 2013 | | | 593 | | | | 232 | | | | 173 | | | | — | | | | 229 | | | | 162 | | | | 1,389 | |
| | | | | | | | | | | | | | | | | | | | | | | | | | | | |
At 1 January 2012 | | | 477 | | | | 244 | | | | 134 | | | | — | | | | 107 | | | | 249 | | | | 1,211 | |
Charge/(release) to the income statement | | | 149 | | | | — | | | | 89 | | | | — | | | | 115 | | | | 233 | | | | 586 | |
Write offs and other items | | | (75 | ) | | | (12 | ) | | | (45 | ) | | | — | | | | (53 | ) | | | (297 | ) | | | (482 | ) |
| | | | | | | | | | | | | | | | | | | | | | | | | | | | |
At 31 December 2012 | | | 551 | | | | 232 | | | | 178 | | | | — | | | | 169 | | | | 185 | | | | 1,315 | |
| | | | | | | | | | | | | | | | | | | | | | | | | | | | |
At 1 January 2011 | | | 524 | | | | 316 | | | | 140 | | | | — | | | | 77 | | | | 399 | | | | 1,456 | |
Charge/(release) to the income statement | | | 45 | | | | (72 | ) | | | 39 | | | | — | | | | 78 | | | | 162 | | | | 252 | |
Write offs and other items | | | (92 | ) | | | — | | | | (45 | ) | | | — | | | | (48 | ) | | | (312 | ) | | | (497 | ) |
| | | | | | | | | | | | | | | | | | | | | | | | | | | | |
At 31 December 2011 | | | 477 | | | | 244 | | | | 134 | | | | — | | | | 107 | | | | 249 | | | | 1,211 | |
| | | | | | | | | | | | | | | | | | | | | | | | | | | | |
Recoveries:
| | | | | | | | | | | | | | | | | | | | | | | | |
| | | Group | |
| | | Loans secured
on residential
property
£m | | | Corporate
Loans
£m | | | Finance
leases
£m | | | Other
secured
advances
£m | | | Other
unsecured
advances
£m | | | Total
£m | |
2013 | | | 4 | | | | 3 | | | | 2 | | | | 5 | | | | 87 | | | | 101 | |
| | | | | | | | | | | | | | | | | | | | | | | | |
2012 | | | 2 | | | | — | | | | 2 | | | | 6 | | | | 55 | | | | 65 | |
| | | | | | | | | | | | | | | | | | | | | | | | |
2011 | | | 3 | | | | 2 | | | | 3 | | | | 10 | | | | 56 | | | | 74 | |
| | | | | | | | | | | | | | | | | | | | | | | | |
| | |
| 250 | | Santander UK plc Annual Report 2013 |
Financial Statements
Notes to the Financial Statementscontinued
20. SECURITISATIONS AND COVERED BONDS
The Santander UK group uses Structured Entities to securitise some of the mortgage and other loans to customers that it originated. The Santander UK group also issues covered bonds, which are guaranteed by a pool of the Santander UK group’s mortgage loans that it has transferred into Abbey Covered Bonds LLP. The Santander UK group issues mortgage-backed securities, other asset-backed securities and covered bonds mainly in order to obtain diverse, low cost funding, but also to be used as collateral for raising funds via third party bilateral secured funding transactions or for creating collateral which could in the future be used for liquidity purposes. The Santander UK group has successfully used bilateral secured transactions as an additional form of medium term funding; this has allowed the Santander UK group to further diversify its medium term funding investor base. The Santander UK group’s principal securitisation programmes and covered bond programme, together with the balances of the advances subject to securitisation and the carrying value of the notes in issue at 31 December 2013 and 2012 are listed below. The related notes in issue are set out in Note 33.
Loans and advances to customers include portfolios of residential mortgage loans, and receivables derived from credit agreements with retail customers for the purchases of financed vehicles, which are subject to non-recourse finance arrangements. These loans and receivables have been purchased by, or assigned to, structured entities or Abbey Covered Bonds LLP, and have been funded primarily through the issue of mortgage-backed securities, asset backed securities or covered bonds. No gain or loss has been recognised as a result of these sales. The structured entities and Abbey Covered Bonds LLP are consolidated in the Santander UK group financial statements as subsidiaries. The Company and its subsidiaries do not own directly, or indirectly, any of the share capital of any of the structured entities.
a) Securitisations
The balances of loans and advances to customers subject to securitisation at 31 December 2013 and 2012 under the structures described below were:
| | | | | | | | |
| | | 2013 | | | 2012 | |
| | | Gross assets
securitised
£m | | | Gross assets
securitised
£m | |
Master Trust Structures: | | | | | | | | |
- Holmes | | | 12,389 | | | | 13,815 | |
- Fosse | | | 14,482 | | | | 18,756 | |
- Langton | | | 9,647 | | | | 13,161 | |
Other securitisation structures: | | | | | | | | |
- Motor | | | 1,055 | | | | 1,184 | |
| | | | | | | | |
| | | 37,573 | | | | 46,916 | |
| | | | | | | | |
i) Master Trust Structures
The Santander UK group makes use of a type of securitisation known as a master trust structure. In this structure, a pool of assets is assigned to a trust company by the asset originator. A funding entity acquires a beneficial interest in the pool of assets held by the trust company with funds borrowed from qualifying structured entities, which at the same time issue asset-backed securities to third-party investors or the Santander UK group. The trust company holds the pool of assets on trust for the funding entity and the originator. The originator holds a beneficial interest over the share of the pool of assets not purchased by the funding entity, known as the seller share.
The Company and its subsidiaries are under no obligation to support any losses that may be incurred by the securitisation companies or holders of the securities and do not intend to provide such further support. Holders of the securities are only entitled to obtain payment of principal and interest to the extent that the resources of the securitisation companies are sufficient to support such payments, and the holders of the securities have agreed in writing not to seek recourse in any other form.
The Company and its subsidiaries receive payments from the securitisation companies in respect of fees for administering the loans, and payment of deferred consideration for the sale of the loans. The Company and its subsidiaries have no right or obligation to repurchase any securitised loan, except if certain representations and warranties given by the Company or its subsidiaries at the time of transfer are breached and, in certain cases, if there is a product switch.
| | |
| Santander UK plc Annual Report 2013 | | 251 |
Financial Statements
Notes to the Financial Statementscontinued
Holmes
Outstanding balances of assets securitised and notes in issue (non-recourse finance) under the Holmes securitisation structure at 31 December 2013 and 2012 were:
| | | | | | | | | | | | | | | | | | | | | | | | | | | | |
| | | | | | 2013 | | | 2012 | |
Securitisation company | | Closing date
of securitisation | | | Gross
assets
securitised
£m | | | Notes in
issue
£m | | | Issued to
Santander
UK plc as
collateral
£m | | | Gross
assets
securitised
£m | | | Notes in
issue
£m | | | Issued to
Santander
UK plc as
collateral
£m | |
Holmes Master Issuer plc – 2010/1 | | | 12 November 2010 | | | | 1,934 | | | | 1,395 | | | | 601 | | | | 2,377 | | | | 1,846 | | | | 602 | |
Holmes Master Issuer plc – 2011/1 | | | 9 February 2011 | | | | 1,692 | | | | 1,295 | | | | 451 | | | | 2,081 | | | | 1,692 | | | | 451 | |
Holmes Master Issuer plc – 2011/2 | | | 24 March 2011 | | | | 161 | | | | 166 | | | | — | | | | 244 | | | | 251 | | | | — | |
Holmes Master Issuer plc – 2011/3 | | | 21 September 2011 | | | | 1,706 | | | | 1,760 | | | | — | | | | 1,968 | | | | 2,027 | | | | — | |
Holmes Master Issuer plc – 2012/1 | | | 24 January 2012 | | | | 2,176 | | | | 1,633 | | | | 612 | | | | 2,657 | | | | 2,125 | | | | 612 | |
Holmes Master Issuer plc – 2012/2 | | | 17 April 2012 | | | | 905 | | | | 758 | | | | 176 | | | | 920 | | | | 771 | | | | 176 | |
Holmes Master Issuer plc – 2012/3 | | | 7 June 2012 | | | | 615 | | | | 635 | | | | — | | | | 618 | | | | 636 | | | | — | |
Holmes Master Issuer plc – 2012/4 | | | 24 August 2012 | | | | 702 | | | | 543 | | | | 181 | | | | 689 | | | | 528 | | | | 181 | |
Holmes Master Issuer plc – 2013/1 | | | 30 May 2013 | | | | 1,021 | | | | 954 | | | | 100 | | | | | | | | | | | | | |
| | | | | | | | | | | | | | | | | | | | | | | | | | | | |
Beneficial interest in mortgages held by Holmes Trustees Ltd | | | | | | | 1,477 | | | | — | | | | — | | | | 2,261 | | | | — | | | | — | |
| | | | | | | | | | | | | | | | | | | | | | | | | | | | |
| | | | | | | 12,389 | | | | 9,139 | | | | 2,121 | | | | 13,815 | | | | 9,876 | | | | 2,022 | |
| | | | | | | | | | | | | | | | | | | | | | | | | | | | |
Less: Held by the Santander UK group | | | | — | | | | | | | | | | | | — | | | | | |
| | | | | | | | | | | | | | | | | | | | | | | | | | | | |
Total securitisations (See Note 33) | | | | | | | | | | | 9,139 | | | | | | | | | | | | 9,876 | | | | | |
| | | | | | | | | | | | | | | | | | | | | | | | | | | | |
Using a master trust structure, the Company has assigned portfolios of residential mortgages and their related security to Holmes Trustees Limited, a trust company that holds the portfolios of mortgages on trust for the Company and Holmes Funding Limited. Proceeds from notes issued to third party investors or the Santander UK group by SPE’s under the Holmes master trust structure have been loaned to Holmes Funding Limited, which in turn used the funds to purchase its referred beneficial interests in the portfolio of assets held by Holmes Trustees Limited. The minimum value of assets required to be held by Holmes Trustees Limited is a function of the notes in issue under the Holmes master trust structure and the Company’s required minimum share. The Holmes securitisation companies have placed cash deposits totalling £553m (2012: £0.1bn), which have been accumulated to finance the redemption of a number of securities issued by the Holmes securitisation companies. The share of Holmes Funding Limited in the trust assets is therefore reduced by this amount.
Holmes Funding Limited has a beneficial interest of £10.9bn (2012: £11.6bn) in the residential mortgage loans held by Holmes Trustees Limited, the remaining share of the beneficial interest in residential mortgage loans held by Holmes Trustees Limited belongs to Santander UK plc.
In 2013, £1.1bn (2012: £5.1bn) of mortgage-backed notes were issued from Holmes Master Issuer plc. Mortgage-backed securities totalling £1.7bn (2012: £1.6bn) equivalent were redeemed during the year.
Fosse
Outstanding balances of assets securitised and notes in issue (non-recourse finance) under the Fosse securitisation structure at 31 December 2013 and 2012 were:
| | | | | | | | | | | | | | | | | | | | | | | | | | | | |
| | | | | | 2013 | | | 2012 | |
Securitisation company | | Closing date
of securitisation | | | Gross
assets
securitised
£m | | | Notes in
issue
£m | | | Issued to
Santander
UK plc as
collateral
£m | | | Gross
assets
securitised
£m | | | Notes in
issue
£m | | | Issued to
Santander
UK plc as
collateral
£m | |
Fosse Master Issuer plc – 2006/1 | | | 28 November 2006 | | | | — | | | | — | | | | — | | | | 401 | | | | 415 | | | | — | |
Fosse Master Issuer plc – 2010/1 | | | 12 March 2010 | | | | 1,633 | | | | 1,264 | | | | 390 | | | | 1,701 | | | | 1,371 | | | | 390 | |
Fosse Master Issuer plc – 2010/2 | | | 3 June 2010 | | | | — | | | | — | | | | — | | | | 1,221 | | | | 1,012 | | | | 252 | |
Fosse Master Issuer plc – 2010/3 | | | 27 July 2010 | | | | 2,661 | | | | 2,194 | | | | 501 | | | | 3,695 | | | | 3,322 | | | | 501 | |
Fosse Master Issuer plc – 2010/4 | | | 9 September 2010 | | | | — | | | | — | | | | — | | | | 1,070 | | | | 1,108 | | | | — | |
Fosse Master Issuer plc – 2011/1 | | | 25 May 2011 | | | | 3,527 | | | | 2,605 | | | | 967 | | | | 3,952 | | | | 3,124 | | | | 967 | |
Fosse Master Issuer plc – 2011/2 | | | 6 December 2011 | | | | 1,064 | | | | 842 | | | | 235 | | | | 1,054 | | | | 856 | | | | 235 | |
Fosse Master Issuer plc – 2012/1 | | | 22 May 2012 | | | | 2,238 | | | | 1,980 | | | | 286 | | | | 2,455 | | | | 2,254 | | | | 286 | |
Beneficial interest in mortgages held by Fosse Master Trust Ltd | | | | | | | 3,359 | | | | — | | | | — | | | | 3,207 | | | | — | | | | — | |
| | | | | | | | | | | | | | | | | | | | | | | | | | | | |
| | | | | | | 14,482 | | | | 8,885 | | | | 2,379 | | | | 18,756 | | | | 13,462 | | | | 2,631 | |
| | | | | | | | | | | | | | | | | | | | | | | | | | | | |
Less: Held by the Santander UK group | | | | — | | | | | | | | | | | | (75 | ) | | | | |
| | | | | | | | | | | | | | | | | | | | | | | | | | | | |
Total securitisations (See Note 33) | | | | | | | | | | | 8,885 | | | | | | | | | | | | 13,387 | | | | | |
| | | | | | | | | | | | | | | | | | | | | | | | | | | | |
The Fosse Master Trust securitisation structure was established in 2006. Notes were issued by Fosse Master Issuer plc to third party investors and the proceeds loaned to Fosse Funding (No. 1) Limited, which in turn used the funds to purchase beneficial interests in mortgages held by Fosse Trustee Limited.
Both Fosse Funding (No. 1) Limited and the Company have a beneficial interest in the mortgages held in trust by Fosse Trustee Limited. The minimum value of assets required to be held by Fosse Trustee Limited is a function of the notes in issue under the Fosse master trust structure and the Company’s required minimum share.
Fosse Master Issuer plc has cash deposits totalling £351m (2012: £807m), which have been accumulated to finance the redemption of a number of securities issued by Fosse Master Issuer plc. Fosse Funding (No.1) Limited’s beneficial interest in the assets held by Fosse Trustee Limited is therefore reduced by this amount.
In 2013, there were no issuances from Fosse Master Issuer plc (2012: £2.6bn). Mortgage-backed notes totalling £4.9bn (2012: £3.2bn) equivalent were redeemed during the year.
| | |
| 252 | | Santander UK plc Annual Report 2013 |
Financial Statements
Notes to the Financial Statementscontinued
Langton
Outstanding balances of assets securitised and notes in issue (non-recourse finance) under the Langton securitisation structure at 31 December 2013 and 2012 were:
| | | | | | | | | | | | | | | | | | | | | | | | | | | | |
| | | | | | 2013 | | | 2012 | |
Securitisation company | | Closing date
of securitisation | | | Gross
assets
securitised
£m | | | Notes in
issue
£m | | | Issued to
Santander
UK plc as
collateral
£m | | | Gross
assets
securitised
£m | | | Notes in
issue
£m | | | Issued to
Santander
UK plc as
collateral
£m | |
Langton Securities (2010-1) plc (1) | | | 1 October 2010 | | | | 1,618 | | | | — | | | | 1,599 | | | | 1,642 | | | | — | | | | 1,599 | |
Langton Securities (2010-1) plc (2) | | | 12 October 2010 | | | | 1,299 | | | | — | | | | 1,282 | | | | 1,316 | | | | — | | | | 1,282 | |
Langton Securities (2010-2) plc (1) | | | 12 October 2010 | | | | 796 | | | | — | | | | 786 | | | | 1,545 | | | | — | | | | 1,504 | |
Langton Securities (2008-1) plc (2) | | | 23 March 2011 | | | | 2,198 | | | | — | | | | 2,171 | | | | 2,136 | | | | — | | | | 2,080 | |
Langton Securities (2010-2) plc (2) | | | 28 July 2011 | | | | 1,470 | | | | — | | | | 1,452 | | | | 1,517 | | | | — | | | | 1,477 | |
Beneficial interest in mortgages held by Langton Master Trust Ltd | | | | | | | 2,266 | | | | — | | | | — | | | | 5,005 | | | | — | | | | — | |
| | | | | | | | | | | | | | | | | | | | | | | | | | | | |
| | | | | | | 9,647 | | | | — | | | | 7,290 | | | | 13,161 | | | | — | | | | 7,942 | |
| | | | | | | | | | | | | | | | | | | | | | | | | | | | |
The Langton Master Trust securitisation structure was established on 25 January 2008. Notes were issued by Langton Securities (2008-1) plc, Langton Securities (2010-1) plc and Langton Securities (2010-2) plc to the Company for the purpose of creating collateral to be used for funding and liquidity. Each entity loaned the proceeds of the Notes issued to Langton Funding (No.1) Limited, which in turn used the funds to purchase a beneficial interest in the mortgages held by Langton Mortgages Trustee Limited.
Both Langton Funding (No. 1) Limited and the Company have a beneficial interest in the mortgages held in trust by Langton Mortgages Trustee Limited. The minimum value of assets required to be held by Langton Mortgages Trustee Limited is a function of the notes in issue under the Langton master trust structure and the Company’s required minimum share.
In 2013 and 2012, there were no issuances from any of the Langton issuing companies. Mortgage-backed notes totalling £0.8bn (2012: £33.8bn) equivalent were redeemed during the year.
ii) Other securitisation structures
Motor
In 2013, the Santander UK group issued £0.9bn notes (2012: £1.0bn) through pass-through stand-alone vehicles for the securitisation of receivables derived from credit agreements with retail customers for the purchases of financed vehicles.
Outstanding balances of assets securitised and notes in issue (non-recourse finance) under the Motor securitisation structure at 31 December 2013 and 2012 were:
| | | | | | | | | | | | | | | | | | | | | | | | | | | | |
| | | | | | 2013 | | | 2012 | |
Securitisation company | | Closing date
of securitisation | | | Gross
assets
securitised
£m | | | Notes in
issue
£m | | | Issued to
Santander
Consumer
(UK) plc as
collateral
£m | | | Gross
assets
securitised
£m | | | Notes in
issue
£m | | | Issued to
Santander
Consumer
(UK) plc as
collateral
£m | |
Motor 2011 plc | | | 21 April 2011 | | | | — | | | | — | | | | — | | | | 339 | | | | 29 | | | | 334 | |
Motor 2012 plc | | | 19 September 2012 | | | | 409 | | | | 346 | | | | 221 | | | | 845 | | | | 733 | | | | 221 | |
Motor 2013 plc | | | 19 June 2013 | | | | 646 | | | | 498 | | | | 176 | | | | — | | | | — | | | | — | |
| | | | | | | | | | | | | | | | | | | | | | | | | | | | |
| | | | | | | 1,055 | | | | 844 | | | | 397 | | | | 1,184 | | | | 762 | | | | 555 | |
| | | | | | | | | | | | | | | | | | | | | | | | | | | | |
Less: Held by the Santander UK group | | | | | | | | | | | — | | | | | | | | | | | | — | | | | | |
| | | | | | | | | | | | | | | | | | | | | | | | | | | | |
Total securitisations (See Note 33) | | | | | | | | | | | 844 | | | | | | | | | | | | 762 | | | | | |
| | | | | | | | | | | | | | | | | | | | | | | | | | | | |
b) Covered Bonds
The Santander UK group also issues covered bonds. In this structure, Abbey National Treasury Services plc (the ‘Issuer’) issues covered bonds, which are a direct, unsecured and unconditional obligation of the Issuer. The covered bonds benefit from a guarantee from the Company and Abbey Covered Bonds LLP. The Issuer makes a term advance to Abbey Covered Bonds LLP equal to the sterling proceeds of each issue of covered bonds. Abbey Covered Bonds LLP uses the proceeds of the term advance to purchase portfolios of residential mortgage loans and their security from the Company. Under the terms of the guarantee, Abbey Covered Bonds LLP has agreed to pay an amount equal to the guaranteed amounts when the same shall become due for payment but which would otherwise be unpaid by the Issuer or the Company.
Outstanding balances of loans and advances assigned to the covered bond programme at 31 December 2013 and 2012 were:
| | | | | | | | | | | | | | | | | | | | | | | | |
| | | 2013 | | | 2012 | |
| | | Gross
assets
assigned
£m | | | Notes in
issue
£m | | | Issued to
Santander
UK plc as
collateral
£m | | | Gross
assets
assigned
£m | | | Notes in
issue
£m | | | Issued to
Santander
UK plc as
collateral
£m | |
Euro 35bn Global Covered Bond Programme | | | 21,215 | | | | 18,379 | | | | — | | | | 35,123 | | | | 21,757 | | | | — | |
| | | | | | | | | | | | | | | | | | | | | | | | |
Less: Held by the Santander UK group | | | | | | | — | | | | | | | | | | | | — | | | | | |
| | | | | | | | | | | | | | | | | | | | | | | | |
Total Covered Bonds (See Note 33) | | | | | | | 18,379 | | | | | | | | | | | | 21,757 | | | | | |
| | | | | | | | | | | | | | | | | | | | | | | | |
For further information on the euro 35bn Global Covered Bond Programme, see Note 33.
| | |
| Santander UK plc Annual Report 2013 | | 253 |
Financial Statements
Notes to the Financial Statementscontinued
21. TRANSFERS OF FINANCIAL ASSETS NOT QUALIFYING FOR DERECOGNITION
The Santander UK group enters into transactions in the normal course of business by which it transfers recognised financial assets directly to third parties or to structured entities. These transfers may give rise to the full or partial derecognition of the financial assets concerned.
| • | | Full derecognition occurs when the Santander UK group transfers its contractual right to receive cash flows from the financial assets, or retains the right but assumes an obligation to pass on the cash flows from the asset, and transfers substantially all the risks and rewards of ownership. The risks include credit, interest rate, currency, prepayment and other price risks. |
| • | | Partial derecognition occurs when the Santander UK group sells or otherwise transfers financial assets in such a way that some but not substantially all of the risks and rewards of ownership are transferred but control is retained. These financial assets are recognised on the balance sheet to the extent of the Santander UK group’s continuing involvement. There are no assets subject to partial derecognition. |
Financial assets that do not qualify for derecognition consist of (i) securities held by counterparties as collateral under repurchase agreements, (ii) securities lent under securities lending agreements, and (iii) loans that have been securitised under arrangements by which the Santander UK group retains a continuing involvement in such transferred assets.
As the substance of the sale and repurchase and securities lending transactions is secured borrowings, the asset collateral continues to be recognised in full and the related liability reflecting the Santander UK group’s obligation to repurchase the transferred assets for a fixed price at a future date is recognised in deposits from banks or customers, as appropriate. As a result of these transactions, the Santander UK group is unable to use, sell or pledge the transferred assets for the duration of the transaction. The Santander UK group remains exposed to interest rate risk and credit risk on these pledged instruments. The counterparty’s recourse is not limited to the transferred assets.
The Santander UK group securitisation transfers do not qualify for derecognition. The Santander UK group remains exposed to credit risks arising from the mortgage loans and has retained control of the transferred assets. Circumstances in which the Santander UK group has continuing involvement in the transferred assets may include retention of servicing rights over the transferred assets, entering into a derivative transaction with the securitisation vehicle, retaining an interest in the securitisation vehicle or providing a cash reserve fund. Where the Santander UK group has continuing involvement it continues to recognise the transferred assets to the extent of its continuing involvement and recognises an associated liability. The net carrying amount of the transferred assets and associated liabilities reflects the rights and obligations that the Santander UK group has retained.
The following table analyses the carrying amount of financial assets that did not qualify for derecognition and their associated financial liabilities:
| | | | | | | | | | | | | | | | |
| | | Group | |
| | | 2013
£m | | | 2013
£m | | | 2012
£m | | | 2012
£m | |
Nature of transaction | | Carrying
amount of
transferred
assets | | | Carrying
amount of
associated
liabilities | | | Carrying
amount of
transferred
assets | | | Carrying
amount of
associated
liabilities | |
Sale and repurchase agreements | | | 1,177 | | | | 1,073 | | | | 1,367 | | | | 1,510 | |
Securities lending agreements | | | 5,196 | | | | 5,144 | | | | 2,422 | | | | 2,754 | |
Securitisations (See Notes 20 and 33) | | | 37,573 | | | | 18,868 | | | | 46,916 | | | | 24,025 | |
| | | | | | | | | | | | | | | | |
| | | 43,946 | | | | 25,085 | | | | 50,705 | | | | 28,289 | |
| | | | | | | | | | | | | | | | |
| | |
| 254 | | Santander UK plc Annual Report 2013 |
Financial Statements
Notes to the Financial Statementscontinued
22. LOANS AND RECEIVABLES SECURITIES
| | | | | | | | | | | | | | | | |
| | | Group | | | Company | |
| | | 2013
£m | | | 2012
£m | | | 2013
£m | | | 2012
£m | |
Floating rate notes | | | 125 | | | | 174 | | | | 125 | | | | 174 | |
Asset-backed securities | | | 880 | | | | 978 | | | | 5,253 | | | | 5,542 | |
Collateralised loan obligations | | | 75 | | | | 85 | | | | 75 | | | | 85 | |
Other(1) | | | 27 | | | | 28 | | | | 27 | | | | 146 | |
| | | | | | | | | | | | | | | | |
Loans and receivables securities | | | 1,107 | | | | 1,265 | | | | 5,480 | | | | 5,947 | |
Less: Impairment allowances | | | (6 | ) | | | (6 | ) | | | (6 | ) | | | (6 | ) |
| | | | | | | | | | | | | | | | |
Loans and receivables securities, net of impairment allowances | | | 1,101 | | | | 1,259 | | | | 5,474 | | | | 5,941 | |
| | | | | | | | | | | | | | | | |
| (1) | Includes £25m principal protected notes (2012: £27m) and £nil collateralised debt obligations (2012: £1m). |
These assets were acquired as part of the transfer of Alliance & Leicester plc to the Santander UK group in 2008 and as part of an alignment of portfolios across the Banco Santander, S.A. group in 2010 and are being run down. Detailed analysis of these securities is set out below. There were no movements in impairment allowances in 2013 or 2012.
Included in the above balances are amounts owed to the Santander UK group by Banco Santander, S.A. and other subsidiaries of Banco Santander, S.A. outside the Santander UK group of £nil (2012: £nil) and £23m (2012: £23m) respectively.
Floating rate notes
Floating rate notes can be analysed by the geographic location of the issuer or counterparty as follows:
| | | | | | | | | | | | | | | | | | | | | | | | | | | | | | | | | | | | | | | | |
| | | 31 December 2013 | | | 31 December 2012 | | | Income statement | |
| | | Nominal
value | | | Book
value | | | Fair
value | | | Fair value as
% of nominal | | | Nominal
value | | | Book
value | | | Fair
value | | | Fair value as
% of nominal | | | 2013 | | | 2012 | |
Country | | £m | | | £m | | | £m | | | % | | | £m | | | £m | | | £m | | | % | | | £m | | | £m | |
UK | | | — | | | | — | | | | — | | | | — | | | | — | | | | — | | | | — | | | | — | | | | — | | | | (4 | ) |
Italy | | | 76 | | | | 76 | | | | 76 | | | | 100 | | | | 74 | | | | 73 | | | | 72 | | | | 97 | | | | — | | | | 1 | |
Spain | | | 27 | | | | 27 | | | | 24 | | | | 89 | | | | 26 | | | | 27 | | | | 23 | | | | 88 | | | | — | | | | 2 | |
Rest of Europe | | | — | | | | — | | | | — | | | | — | | | | 50 | | | | 49 | | | | 43 | | | | 86 | | | | 2 | | | | 2 | |
US | | | 22 | | | | 22 | | | | 21 | | | | 95 | | | | 26 | | | | 25 | | | | 25 | | | | 96 | | | | (1 | ) | | | 1 | |
| | | | | | | | | | | | | | | | | | | | | | | | | | | | | | | | | | | | | | | | |
Total | | | 125 | | | | 125 | | | | 121 | | | | 97 | | | | 176 | | | | 174 | | | | 163 | | | | 93 | | | | 1 | | | | 2 | |
| | | | | | | | | | | | | | | | | | | | | | | | | | | | | | | | | | | | | | | | |
Floating rate notes can be analysed by the credit rating of the issuer or counterparty as follows:
| | | | | | | | | | | | | | | | | | | | | | | | | | | | | | | | | | | | | | | | |
| | | 31 December 2013 | | | 31 December 2012 | | | Income statement | |
| | | Nominal
value | | | Book
value | | | Fair
value | | | Fair value as
% of nominal | | | Nominal
value | | | Book
value | | | Fair
value | | | Fair value as
% of nominal | | | 2013 | | | 2012 | |
Credit rating(1) | | £m | | | £m | | | £m | | | % | | | £m | | | £m | | | £m | | | % | | | £m | | | £m | |
AA | | | 48 | | | | 48 | | | | 48 | | | | 100 | | | | 47 | | | | 46 | | | | 46 | | | | 98 | | | | — | | | | 1 | |
A | | | 66 | | | | 66 | | | | 63 | | | | 95 | | | | 118 | | | | 116 | | | | 107 | | | | 91 | | | | 1 | | | | 4 | |
BBB | | | — | | | | — | | | | — | | | | — | | | | — | | | | — | | | | — | | | | — | | | | — | | | | (3 | ) |
Below BBB | | | 11 | | | | 11 | | | | 10 | | | | 91 | | | | 11 | | | | 12 | | | | 10 | | | | 91 | | | | — | | | | — | |
| | | | | | | | | | | | | | | | | | | | | | | | | | | | | | | | | | | | | | | | |
Total | | | 125 | | | | 125 | | | | 121 | | | | 97 | | | | 176 | | | | 174 | | | | 163 | | | | 93 | | | | 1 | | | | 2 | |
| | | | | | | | | | | | | | | | | | | | | | | | | | | | | | | | | | | | | | | | |
| (1) | All exposures are internally rated. External ratings are taken into consideration in the rating process, where available. |
Asset-backed securities
Asset-backed securities can be analysed by the geographic location of the issuer or counterparty as follows:
| | | | | | | | | | | | | | | | | | | | | | | | | | | | | | | | | | | | | | | | |
| | | 31 December 2013 | | | 31 December 2012 | | | Income statement | |
| | | Nominal
value | | | Book
value | | | Fair
value | | | Fair value as
% of nominal | | | Nominal
value | | | Book
value | | | Fair
value | | | Fair value as
% of nominal | | | 2013 | | | 2012 | |
Country | | £m | | | £m | | | £m | | | % | | | £m | | | £m | | | £m | | | % | | | £m | | | £m | |
UK | | | | | | | | | | | | | | | | | | | | | | | | | | | | | | | | | | | | | | | | |
ABS | | | 42 | | | | 42 | | | | 42 | | | | 100 | | | | 74 | | | | 75 | | | | 75 | | | | 101 | | | | — | | | | — | |
MBS | | | 161 | | | | 151 | | | | 138 | | | | 86 | | | | 168 | | | | 156 | | | | 139 | | | | 83 | | | | 3 | | | | 6 | |
| | | | | | | | | | | | | | | | | | | | | | | | | | | | | | | | | | | | | | | | |
| | | 203 | | | | 193 | | | | 180 | | | | 89 | | | | 242 | | | | 231 | | | | 214 | | | | 88 | | | | 3 | | | | 6 | |
| | | | | | | | | | | | | | | | | | | | | | | | | | | | | | | | | | | | | | | | |
US | | | | | | | | | | | | | | | | | | | | | | | | | | | | | | | | | | | | | | | | |
ABS | | | 309 | | | | 284 | | | | 270 | | | | 87 | | | | 321 | | | | 292 | | | | 271 | | | | 84 | | | | 3 | | | | 4 | |
MBS | | | 21 | | | | 19 | | | | 17 | | | | 81 | | | | 26 | | | | 23 | | | | 20 | | | | 77 | | | | — | | | | 1 | |
| | | | | | | | | | | | | | | | | | | | | | | | | | | | | | | | | | | | | | | | |
| | | 330 | | | | 303 | | | | 287 | | | | 87 | | | | 347 | | | | 315 | | | | 291 | | | | 84 | | | | 3 | | | | 5 | |
| | | | | | | | | | | | | | | | | | | | | | | | | | | | | | | | | | | | | | | | |
Rest of Europe(1) | | | | | | | | | | | | | | | | | | | | | | | | | | | | | | | | | | | | | | | | |
ABS | | | 85 | | | | 116 | | | | 110 | | | | 129 | | | | 96 | | | | 95 | | | | 85 | | | | 89 | | | | 1 | | | | — | |
MBS | | | 260 | | | | 249 | | | | 226 | | | | 87 | | | | 333 | | | | 313 | | | | 267 | | | | 80 | | | | 14 | | | | (1 | ) |
| | | | | | | | | | | | | | | | | | | | | | | | | | | | | | | | | | | | | | | | |
| | | 345 | | | | 365 | | | | 336 | | | | 97 | | | | 429 | | | | 408 | | | | 352 | | | | 82 | | | | 15 | | | | (1 | ) |
| | | | | | | | | | | | | | | | | | | | | | | | | | | | | | | | | | | | | | | | |
Rest of world | | | | | | | | | | | | | | | | | | | | | | | | | | | | | | | | | | | | | | | | |
ABS | | | 9 | | | | 8 | | | | 6 | | | | 67 | | | | 11 | | | | 8 | | | | 9 | | | | 82 | | | | — | | | | 2 | |
MBS | | | 11 | | | | 11 | | | | 10 | | | | 91 | | | | 16 | | | | 16 | | | | 15 | | | | 94 | | | | — | | | | — | |
| | | | | | | | | | | | | | | | | | | | | | | | | | | | | | | | | | | | | | | | |
| | | 20 | | | | 19 | | | | 16 | | | | 80 | | | | 27 | | | | 24 | | | | 24 | | | | 89 | | | | — | | | | 2 | |
| | | | | | | | | | | | | | | | | | | | | | | | | | | | | | | | | | | | | | | | |
Total | | | 898 | | | | 880 | | | | 819 | | | | 91 | | | | 1,045 | | | | 978 | | | | 881 | | | | 84 | | | | 21 | | | | 12 | |
| | | | | | | | | | | | | | | | | | | | | | | | | | | | | | | | | | | | | | | | |
| (1) | For details, see “Country Risk Exposures” in the Risk Management Report. |
| | |
| Santander UK plc Annual Report 2013 | | 255 |
Financial Statements
Notes to the Financial Statementscontinued
Asset-backed securities can be analysed by the credit rating of the issuer or counterparty as follows:
| | | | | | | | | | | | | | | | | | | | | | | | | | | | | | | | | | | | | | | | |
| | | 31 December 2013 | | | 31 December 2012 | | | Income statement | |
| | | Nominal
value | | | Book
value | | | Fair
value | | | Fair value as
% of nominal | | | Nominal
value | | | Book
value | | | Fair
value | | | Fair value as
% of nominal | | | 2013 | | | 2012 | |
Credit rating(1) | | £m | | | £m | | | £m | | | % | | | £m | | | £m | | | £m | | | % | | | £m | | | £m | |
AAA | | | | | | | | | | | | | | | | | | | | | | | | | | | | | | | | | | | | | | | | |
ABS | | | 318 | | | | 299 | | | | 280 | | | | 88 | | | | 334 | | | | 312 | | | | 285 | | | | 85 | | | | 4 | | | | 4 | |
MBS | | | 302 | | | | 287 | | | | 267 | | | | 88 | | | | 385 | | | | 368 | | | | 325 | | | | 84 | | | | 12 | | | | 12 | |
| | | | | | | | | | | | | | | | | | | | | | | | | | | | | | | | | | | | | | | | |
| | | 620 | | | | 586 | | | | 547 | | | | 88 | | | | 719 | | | | 680 | | | | 610 | | | | 85 | | | | 16 | | | | 16 | |
| | | | | | | | | | | | | | | | | | | | | | | | | | | | | | | | | | | | | | | | |
AA+ | | | | | | | | | | | | | | | | | | | | | | | | | | | | | | | | | | | | | | | | |
ABS | | | — | | | | — | | | | — | | | | — | | | | 2 | | | | 2 | | | | 2 | | | | 100 | | | | — | | | | — | |
MBS | | | 10 | | | | 10 | | | | 9 | | | | 90 | | | | 17 | | | | 15 | | | | 14 | | | | 82 | | | | 1 | | | | — | |
| | | | | | | | | | | | | | | | | | | | | | | | | | | | | | | | | | | | | | | | |
| | | 10 | | | | 10 | | | | 9 | | | | 90 | | | | 19 | | | | 17 | | | | 16 | | | | 84 | | | | 1 | | | | — | |
| | | | | | | | | | | | | | | | | | | | | | | | | | | | | | | | | | | | | | | | |
AA | | | | | | | | | | | | | | | | | | | | | | | | | | | | | | | | | | | | | | | | |
ABS | | | 7 | | | | 6 | | | | 5 | | | | 71 | | | | 8 | | | | 7 | | | | 4 | | | | 50 | | | | — | | | | — | |
MBS | | | 109 | | | | 102 | | | | 89 | | | | 82 | | | | 114 | | | | 102 | | | | 84 | | | | 74 | | | | 3 | | | | (1 | ) |
| | | | | | | | | | | | | | | | | | | | | | | | | | | | | | | | | | | | | | | | |
| | | 116 | | | | 108 | | | | 94 | | | | 81 | | | | 122 | | | | 109 | | | | 88 | | | | 72 | | | | 3 | | | | (1 | ) |
| | | | | | | | | | | | | | | | | | | | | | | | | | | | | | | | | | | | | | | | |
A | | | | | | | | | | | | | | | | | | | | | | | | | | | | | | | | | | | | | | | | |
ABS | | | 13 | | | | 10 | | | | 10 | | | | 77 | | | | 91 | | | | 89 | | | | 89 | | | | 98 | | | | — | | | | 1 | |
MBS | | | 25 | | | | 24 | | | | 21 | | | | 84 | | | | 16 | | | | 12 | | | | 8 | | | | 50 | | | | 1 | | | | (3 | ) |
| | | | | | | | | | | | | | | | | | | | | | | | | | | | | | | | | | | | | | | | |
| | | 38 | | | | 34 | | | | 31 | | | | 82 | | | | 107 | | | | 101 | | | | 97 | | | | 91 | | | | 1 | | | | (2 | ) |
| | | | | | | | | | | | | | | | | | | | | | | | | | | | | | | | | | | | | | | | |
BBB | | | | | | | | | | | | | | | | | | | | | | | | | | | | | | | | | | | | | | | | |
ABS | | | 57 | | | | 52 | | | | 52 | | | | 91 | | | | — | | | | — | | | | — | | | | — | | | | — | | | | — | |
MBS | | | 3 | | | | 3 | | | | 2 | | | | 67 | | | | 6 | | | | 6 | | | | 5 | | | | 83 | | | | — | | | | — | |
| | | | | | | | | | | | | | | | | | | | | | | | | | | | | | | | | | | | | | | | |
| | | 60 | | | | 55 | | | | 54 | | | | 90 | | | | 6 | | | | 6 | | | | 5 | | | | 83 | | | | — | | | | — | |
| | | | | | | | | | | | | | | | | | | | | | | | | | | | | | | | | | | | | | | | |
Below BBB | | | | | | | | | | | | | | | | | | | | | | | | | | | | | | | | | | | | | | | | |
ABS | | | 50 | | | | 83 | | | | 81 | | | | 162 | | | | 67 | | | | 60 | | | | 60 | | | | 90 | | | | — | | | | 1 | |
MBS | | | 4 | | | | 4 | | | | 3 | | | | 75 | | | | 5 | | | | 5 | | | | 5 | | | | 100 | | | | — | | | | (2 | ) |
| | | | | | | | | | | | | | | | | | | | | | | | | | | | | | | | | | | | | | | | |
| | | 54 | | | | 87 | | | | 84 | | | | 156 | | | | 72 | | | | 65 | | | | 65 | | | | 90 | | | | — | | | | (1 | ) |
| | | | | | | | | | | | | | | | | | | | | | | | | | | | | | | | | | | | | | | | |
Total | | | 898 | | | | 880 | | | | 819 | | | | 91 | | | | 1,045 | | | | 978 | �� | | | 881 | | | | 84 | | | | 21 | | | | 12 | |
| | | | | | | | | | | | | | | | | | | | | | | | | | | | | | | | | | | | | | | | |
| (1) | All exposures are internally rated. External ratings are taken into consideration in the rating process, where available. |
Asset-backed securities above include the following:
| | • | | ALT-A US asset-backed securities –securities with book values of £14m (2012: £20m) and fair values of £13m (2012: £15m). |
| | • | | Monoline insurer exposures - The Santander UK group has a £54m (2012: £57m) exposure to corporate bonds and securitisations which are wrapped by monoline insurers. The principal risk exposures are recorded against the securitisations, with the monoline wraps being viewed as secondary sources of repayment. |
Collateralised Loan Obligations (‘CLOs’)
The Santander UK group acquired a portfolio of CLOs as part of the acquisition of Alliance & Leicester plc in 2008. This portfolio is being run down. At 31 December 2013, the Santander UK group had an exposure to CLOs with a nominal value of £82m (2012: £94m), a book value of £75m (2012: £85m) and a fair value of £71m (2012: £75m). In 2013, impairment losses of £nil (2012: £nil) were recognised in the income statement. The geographical locations of the issuer or counterparty of the CLO exposures are the UK, the rest of Europe and the US. 45% of the nominal values are rated BBB (2012: 51%) with 1% rated AAA (2012: 1%), 31% rated AA (2012: 26%), 23% rated A (2012: 20%) and nil% rated below BBB (2012: 2%).
| | |
| 256 | | Santander UK plc Annual Report 2013 |
Financial Statements
Notes to the Financial Statementscontinued
23. AVAILABLE-FOR-SALE SECURITIES
| | | | | | | | | | | | | | | | |
| | | Group | | | Company | |
| | | 2013
£m | | | 2012
£m | | | 2013
£m | | | 2012
£m | |
Debt securities | | | 4,981 | | | | 5,459 | | | | 2,019 | | | | 347 | |
Equity securities | | | 24 | | | | 24 | | | | 10 | | | | 10 | |
| | | | | | | | | | | | | | | | |
| | | 5,005 | | | | 5,483 | | | | 2,029 | | | | 357 | |
| | | | | | | | | | | | | | | | |
Debt securities and equity securities can be analysed by listing status as follows:
| | | | | | | | | | | | | | | | |
| | | Group | | | Company | |
| | | 2013
£m | | | 2012
£m | | | 2013
£m | | | 2012
£m | |
Debt securities: | | | | | | | | | | | | | | | | |
- Listed in the UK | | | 3,403 | | | | 4,026 | | | | 739 | | | | 183 | |
- Listed elsewhere | | | 1,106 | | | | 704 | | | | 808 | | | | 81 | |
- Unlisted | | | 472 | | | | 729 | | | | 472 | | | | 83 | |
| | | | | | | | | | | | | | | | |
| | | 4,981 | | | | 5,459 | | | | 2,019 | | | | 347 | |
| | | | | | | | | | | | | | | | |
Equity securities: | | | | | | | | | | | | | | | | |
- Listed in the UK | | | 21 | | | | 20 | | | | 8 | | | | 7 | |
- Listed elsewhere | | | 1 | | | | 1 | | | | — | | | | — | |
- Unlisted | | | 2 | | | | 3 | | | | 2 | | | | 3 | |
| | | | | | | | | | | | | | | | |
| | | 24 | | | | 24 | | | | 10 | | | | 10 | |
| | | | | | | | | | | | | | | | |
Debt securities can be analysed by contractual maturity and the related weighted average yield for the year as follows:
| | | | | | | | | | | | | | | | | | | | | | | | | | | | | | | | | | | | | | | | |
2013 | | On
demand
£m | | | Within 1
month
£m | | | 1-3
months
£m | | | 3-6
months
£m | | | 6-9
months
£m | | | 9 months
to 1 year
£m | | | 1-2
Years
£m | | | 2-5
years
£m | | | Over 5
years
£m | | | Total
£m | |
Issued by public bodies: | | | | | | | | | | | | | | | | | | | | | | | | | | | | | | | | | | | | | | | | |
- UK Government | | | — | | | | — | | | | — | | | | — | | | | — | | | | — | | | | — | | | | 2,284 | | | | 628 | | | | 2,912 | |
- Other OECD | | | — | | | | — | | | | — | | | | — | | | | — | | | | — | | | | — | | | | 201 | | | | 97 | | | | 298 | |
- Banks | | | — | | | | — | | | | — | | | | — | | | | — | | | | — | | | | 189 | | | | 745 | | | | 791 | | | | 1,725 | |
- Building societies | | | — | | | | — | | | | — | | | | — | | | | — | | | | — | | | | 46 | | | | — | | | | — | | | | 46 | |
| | | | | | | | | | | | | | | | | | | | | | | | | | | | | | | | | | | | | | | | |
| | | — | | | | — | | | | — | | | | — | | | | — | | | | — | | | | 235 | | | | 3,230 | | | | 1,516 | | | | 4,981 | |
| | | | | | | | | | | | | | | | | | | | | | | | | | | | | | | | | | | | | | | | |
Weighted average yield | | | — | | | | — | | | | — | | | | — | | | | — | | | | — | | | | 2.61 | % | | | 2.18 | % | | | 2.44 | % | | | 2.28 | % |
| | | | | | | | | | | | | | | | | | | | | | | | | | | | | | | | | | | | | | | | |
| | | | | | | | | | |
2012 | | On
demand
£m | | | Within 1
month
£m | | | 1-3
months
£m | | | 3-6
months
£m | | | 6-9
months
£m | | | 9 months
to 1 year
£m | | | 1-2
Years
£m | | | 2-5
years
£m | | | Over 5
years
£m | | | Total
£m | |
Issued by public bodies: | | | | | | | | | | | | | | | | | | | | | | | | | | | | | | | | | | | | | | | | |
- UK Government | | | — | | | | — | | | | — | | | | — | | | | 995 | | | | — | | | | — | | | | 2,849 | | | | — | | | | 3,844 | |
- Other OECD | | | — | | | | — | | | | — | | | | 149 | | | | 756 | | | | — | | | | — | | | | — | | | | 364 | | | | 1,269 | |
- Banks | | | — | | | | — | | | | — | | | | — | | | | — | | | | — | | | | — | | | | 301 | | | | — | | | | 301 | |
- Building societies | | | — | | | | — | | | | — | | | | — | | | | — | | | | — | | | | — | | | | 45 | | | | — | | | | 45 | |
| | | | | | | | | | | | | | | | | | | | | | | | | | | | | | | | | | | | | | | | |
| | | — | | | | — | | | | — | | | | 149 | | | | 1,751 | | | | — | | | | — | | | | 3,195 | | | | 364 | | | | 5,459 | |
| | | | | | | | | | | | | | | | | | | | | | | | | | | | | | | | | | | | | | | | |
Weighted average yield | | | — | | | | — | | | | — | | | | — | | | | 0.75 | % | | | — | | | | — | | | | 1.20 | % | | | 0.24 | % | | | 2.19 | % |
| | | | | | | | | | | | | | | | | | | | | | | | | | | | | | | | | | | | | | | | |
The movement in available-for-sale securities can be summarised as follows:
| | | | | | | | | | | | | | | | | | | | | | | | |
| | | Group | | | Company | |
| | | 2013
£m | | | 2012
£m | | | 2011
£m | | | 2013
£m | | | 2012
£m | | | 2011
£m | |
At 1 January | | | 5,483 | | | | 46 | | | | 175 | | | | 357 | | | | 34 | | | | 38 | |
Additions | | | 2,904 | | | | 6,338 | | | | — | | | | 1,680 | | | | 348 | | | | — | |
Redemptions and maturities | | | (3,344 | ) | | | (877 | ) | | | (126 | ) | | | — | | | | (25 | ) | | | (2 | ) |
Amortisation of discount | | | (55 | ) | | | (18 | ) | | | — | | | | (10 | ) | | | — | | | | — | |
Exchange adjustments | | | 2 | | | | (12 | ) | | | — | | | | — | | | | (2 | ) | | | — | |
Movement in fair value | | | 15 | | | | 6 | | | | (3 | ) | | | 2 | | | | 2 | | | | (2 | ) |
| | | | | | | | | | | | | | | | | | | | | | | | |
At 31 December | | | 5,005 | | | | 5,483 | | | | 46 | | | | 2,029 | | | | 357 | | | | 34 | |
| | | | | | | | | | | | | | | | | | | | | | | | |
| | |
| Santander UK plc Annual Report 2013 | | 257 |
Financial Statements
Notes to the Financial Statementscontinued
24. INTERESTS IN OTHER ENTITIES
| | | | | | | | | | | | | | | | |
| | | Group | | | Company | |
| | | 2013
£m | | | 2012
£m | | | 2013
£m | | | 2012
£m | |
Subsidiaries | | | — | | | | — | | | | 6,176 | | | | 6,969 | |
Associates | | | 4 | | | | 2 | | | | — | | | | — | |
Joint ventures | | | 23 | | | | 6 | | | | �� | | | | — | |
| | | | | | | | | | | | | | | | |
| | | 27 | | | | 8 | | | | 6,176 | | | | 6,969 | |
| | | | | | | | | | | | | | | | |
a) Interests in subsidiaries
Interests in subsidiaries are held at cost subject to impairment. The movement in interests in subsidiaries was as follows:
| | | | | | | | | | | | |
| | | Company | |
| | | Cost
£m | | | Impairment
£m | | | Net book value
£m | |
At 1 January 2013 | | | 7,302 | | | | (333 | ) | | | 6,969 | |
Additions | | | 1,023 | | | | (29 | ) | | | 994 | |
Reversal | | | — | | | | 199 | | | | 199 | |
Capital reduction of subsidiaries | | | (1,986 | ) | | | — | | | | (1,986 | ) |
| | | | | | | | | | | | |
At 31 December 2013 | | | 6,339 | | | | (163 | ) | | | 6,176 | |
| | | | | | | | | | | | |
| |
| | | Company | |
| | | Cost
£m | | | Impairment
£m | | | Net book value
£m | |
At 1 January 2012 | | | 7,360 | | | | (365 | ) | | | 6,995 | |
Additions | | | 244 | | | | — | | | | 244 | |
Reversal | | | — | | | | 32 | | | | 32 | |
Capital reduction of subsidiaries | | | (302 | ) | | | — | | | | (302 | ) |
| | | | | | | | | | | | |
At 31 December 2012 | | | 7,302 | | | | (333 | ) | | | 6,969 | |
| | | | | | | | | | | | |
In 2013 and 2012, the movements on interests in subsidiaries principally represented changes in the capital invested in certain subsidiaries as a result of an internal reorganisation within the Santander UK group. In addition, in December 2013, Santander UK entered into a share purchase agreement with its wholly owned subsidiary Abbey National Treasury Services plc, and acquired 100% of the issued share capital of Abbey National Treasury Services Overseas Holdings.
Abbey National Capital Trust I and Abbey National Capital LP (the “trust preferred entities”) were previously consolidated by the Santander UK group. Following the adoption of IFRS 10 as described in Note 1, with effect from 1 January 2012 the trust preferred entities are no longer consolidated by the Santander UK group as Santander UK plc is not exposed to variability of returns from the entities. Details of the carrying amount of liabilities recognised by Santander UK at the balance sheet date and prior year’s restatements are provided in Note 34.
Principal subsidiaries
The Santander UK group consists of a parent company, Santander UK plc, incorporated in the United Kingdom and a number of subsidiaries and associates held directly and indirectly by Santander UK plc. The principal subsidiaries of the Company that comprise related undertakings under the UK Companies Act 2006 (and so exclude certain securitisation companies) at 31 December 2013 are shown below. The Directors consider that to give full particulars of all subsidiary undertakings would lead to a statement of excessive length. In accordance with Section 410(2) of the UK Companies Act 2006, the following information relates to those subsidiary undertakings whose results or financial position, in the opinion of the Directors, principally affect the results of the Santander UK group. Full particulars of all subsidiary undertakings will be annexed to the Company’s next annual return in accordance with Section 410(3)(b) of the UK Companies Act 2006.
| | | | | | | | | | | | |
| | | | | % Interest held | | | |
Principal subsidiary | | Nature of business | | 2013 | | | 2012 | | | Country of incorporation or registration |
Abbey National International Limited | | Offshore deposit taking | | | 100 | | | | 100 | | | Jersey |
Abbey National North America LLC* | | Commercial paper issue | | | 100 | | | | 100 | | | United States |
Abbey National Treasury Services plc | | Treasury operations | | | 100 | | | | 100 | | | England and Wales |
Cater Allen Limited* | | Bank, deposit taker | | | 100 | | | | 100 | | | England and Wales |
Abbey National Treasury Services Overseas Holdings | | Investment | | | 100 | | | | 100 | | | England & Wales |
| * | Held indirectly through subsidiary companies. |
Santander UK holds directly or indirectly 100% of the issued ordinary share capital of its principal subsidiaries. All companies operate principally in their country of incorporation or registration. Abbey National Treasury Services plc also has a branch office in the US and the Cayman Islands. The Company has branches in the Isle of Man and in Jersey. On 7 May 2013, the offshore deposit taking business of ALIL Services Limited (formerly Alliance & Leicester International Limited) was transferred to Santander UK plc Isle of Man branch. From that date, the Company was no longer subject to regulatory capital requirements and was not considered a principal subsidiary of the Santander UK group.
Interests in consolidated structured entities
Structured entities are formed by the Santander UK group to accomplish specific and well-defined objectives. The Santander UK group consolidates these structured entities when the substance of the relationship indicates control, as described in Note 1. In addition to the structured entities disclosed in Note 20 which are used for securitisation and covered bond programmes, the only other structured entities consolidated by the Santander UK group are described below. All the external assets in these entities are included in the financial statements and in relevant Notes of these Consolidated Financial Statements. Other than as set out below, no significant judgements were required with respect to control or significant influence.
| | |
| 258 | | Santander UK plc Annual Report 2013 |
Financial Statements
Notes to the Financial Statementscontinued
i) Guaranteed Investment Products 1 PCC
Guaranteed Investment Products 1 PCC Limited is a Guernsey-incorporated, closed-ended, protected cell company. The objective of each cell is to achieve capital growth for the retail investors. In order to achieve the investment objective, Guaranteed Investment Products 1 PCC Limited, on behalf of the respective cells, has entered into transactions with the Santander UK group. Santander Guarantee Company, a Santander UK group company, also guarantees the shareholders of cells a fixed return on their investment and/or the investment amount. Guaranteed Investment Products 1 PCC Limited has no third party assets. Although the share capital is owned by the retail investors, Santander UK continues to have exposure to variable risks and returns through the guarantee of Santander Guarantee Company and has therefore consolidated this entity.
ii) Santander UK Foundation Limited
Santander UK Foundation Limited supports disadvantaged people throughout the UK through the charitable priorities of education and financial capability. The entity was set up by Santander UK and all its revenue arise through donations from Santander UK, and its third party assets are minimal, comprising of available-for-sale assets of £12m (2012: £12m). This entity has been consolidated as Santander UK directs its activities.
b) Interests in associates
The Santander UK group does not have any individually material interests in associates. As set out in the accounting policies in Note 1, interests in associates are accounted for using the equity method. In the year ended 31 December 2013, Santander UK group’s share in the profit after tax of its associates was £nil (2012: £nil). At 31 December 2013, the carrying amount of the Santander UK group’s interests was £4m (2012: £2m) and its shares of its associates’ commitments and contingent liabilities were £18m (2012: £nil) and £nil (2012: £nil), respectively.
Certain of the associates have also invested in structured entities. The amounts concerned are not significant. Management has concluded that the carrying value of the associates represents the maximum exposure to loss after taking into account any interest the associates may have in structured entitles.
c) Interests in joint ventures
The Santander UK group does not have any individually material interests in joint ventures. As set out in the accounting policies in Note 1, interests in joint ventures are accounted for using the equity method. In the year ended 31 December 2013, Santander UK group’s share in the profit after tax of its joint ventures was £3m (2012: loss after tax of £4m) before elimination of transactions between the Santander UK group and the joint ventures. At 31 December 2013, the carrying amount of the Santander UK group’s interests was £23m (2012: £6m). At 31 December 2013 and 2012, the joint ventures had no commitments and contingent liabilities.
d) Interests in unconsolidated structured entities
Structured entities sponsored by the Santander UK group
The Santander UK group also has interests in structured entities which it sponsors but does not control. The Santander UK group considers itself a sponsor of a structured entity when it facilitates the establishment of the structured entity. The structured entities sponsored but not consolidated by the Santander UK group are as follows. Other than as set out below, no significant judgements were required with respect to control or significant influence.
i) Structured entities which issue shares that back retail structured products
At 31 December 2013, the total value of products issued by these entities was £11m (2012: £25m). The Santander UK group’s arrangements with these entities comprise the provision of equity derivatives and a secondary market-making service to those retail customers who wish to exit early from these products. The maximum exposure to the structured entities sponsored but not consolidated by the Santander UK group consists of trading assets (Repurchases held by the Santander UK group) of £9m (2012: £10m). The Santander UK group holds no interest in these vehicles, nor does it have any control over, or exposure to the variable returns, and therefore these entities have not been consolidated.
ii) Santander (UK) Common Investment Fund
In 2008, a common investment fund was established to hold the assets of the Santander UK Group Pension Scheme. The Santander (UK) Common Investment Fund is not consolidated by the Santander UK group, but its assets of £7,878m (2012: £7,503m) are accounted for as part of the defined benefit assets and obligations recognised on the Santander UK group’s balance sheet. See Note 37 for further information about the entity. As this entity holds the assets of the pension scheme it is outside the scope of IFRS 10. Santander UK group’s maximum exposure to loss is equal to the sum of the carrying amount of the assets held.
iii) Trust preferred entities
The trust referred entities, previously consolidated by the Santander UK group were set up by Santander UK solely for the issuance of Trust Preferred Securities to third parties and lend the funds on to other Santander UK group companies. Following the adoption of IFRS 10 as described in Note 1, with effect from 1 January 2012 the trust preferred entities are no longer consolidated by the Santander UK group as Santander UK plc is not exposed to variability of returns from the entities. Details of the carrying amount of liabilities recognised by Santander UK at the balance sheet date and prior year’s restatements are provided in Note 34.
Structured entities not sponsored by the Santander UK group
The Santander UK group also has interests in structured entities which it does not sponsor or control. These largely relate to the legacy Treasury asset portfolio and consist of holdings of mortgage and other asset-backed securities issued by entities that were established and/or sponsored by other unrelated financial institutions. Details of these securities are set out in Note 17 ‘Financial assets designated at fair value’ and Note 22 ‘Loans and receivables securities’. Management has concluded that the Santander UK group has no control or significant influence over these entities and that the carrying value of the interests held in these entities represents the maximum exposure to loss.
| | |
| Santander UK plc Annual Report 2013 | | 259 |
Financial Statements
Notes to the Financial Statementscontinued
25. INTANGIBLE ASSETS
a) Goodwill
| | | | | | | | | | | | | | | | |
| | | Group | | | Company | |
| | | 2013
£m | | | 2012
£m | | | 2013
£m | | | 2012
£m | |
Cost | | | | | | | | | | | | | | | | |
At 1 January and 31 December | | | 1,916 | | | | 1,916 | | | | 1,194 | | | | 1,194 | |
| | | | | | | | | | | | | | | | |
Accumulated impairment | | | | | | | | | | | | | | | | |
At 1 January and 31 December | | | 82 | | | | 82 | | | | — | | | | — | |
| | | | | | | | | | | | | | | | |
Net book value | | | 1,834 | | | | 1,834 | | | | 1,194 | | | | 1,194 | |
| | | | | | | | | | | | | | | | |
Impairment of goodwill
During 2013 and 2012, no impairment of goodwill was recognised. Impairment testing in respect of goodwill allocated to each cash-generating unit is performed annually or more frequently if there are impairment indicators present. For the purpose of impairment testing, the cash-generating units are based on customer groups within the relevant business divisions.
The cash flow projections for each cash-generating unit are based on the five year plan prepared for regulatory purposes, based on the Santander UK group’s 3-Year Plan and approved by the Company’s Board. The assumptions included in the expected future cash flows for each cash-generating unit take into consideration the UK economic environment and financial outlook within which the cash-generating unit operates. Key assumptions include projected GDP growth rates, the level of interest rates and the level and change in unemployment rates in the UK. The discount rate used to discount the cash flows is based on a pre-tax rate that reflects the weighted average cost of capital allocated by the Santander UK group to investments in the business division within which the cash-generating unit operates. The growth rate used reflects management’s five-year forecasts, with a terminal growth rate of 2.2% (2012: 2.0%) for each year applied thereafter, in line with the estimated long-term average UK GDP growth rate.
Based on the conditions at the balance sheet date, management determined that a reasonably possible change in any of the key assumptions described above would not cause an impairment to be recognised in respect of goodwill arising on the Santander UK group’s business combinations.
The following cash-generating units include in their carrying values goodwill that comprises the goodwill reported by the Santander UK group. The cash-generating units do not carry on their balance sheets any other intangible assets with indefinite useful lives.
2013
| | | | | | | | | | | | | | | | |
Business Division | | Cash-Generating Unit | | Goodwill
£m | | | Basis of valuation | | Discount
rate | | | Growth
rate(1) | |
Retail Banking | | Personal financial services | | | 1,169 | | | Value in use: cash flow based on 5 year plan | | | 11.8 | % | | | 2 | % |
Retail Banking | | Credit cards | | | 456 | | | Value in use: cash flow based on 5 year plan | | | 11.8 | % | | | 3 | % |
Retail Banking | | Consumer finance | | | 175 | | | Value in use: cash flow based on 5 year plan | | | 11.8 | % | | | 1 | % |
Retail Banking | | Private banking | | | 30 | | | Value in use: cash flow based on 5 year plan | | | 11.8 | % | | | 3 | % |
Retail Banking | | Other | | | 4 | | | Value in use: cash flow based on 5 year plan | | | 11.8 | % | | | 2 | % |
| | | | | | | | | | | | | | | | |
| | | | | 1,834 | | | | | | | | | | | |
| | | | | | | | | | | | | | | | |
(1) Average growth rate based on the five year plan for the first five years and a growth rate of 2.2% applied thereafter. 2012 | |
Business Division | | Cash-Generating Unit | | Goodwill
£m | | | Basis of valuation | | Discount
rate | | | Growth
rate(1) | |
Retail Banking | | Personal financial services | | | 1,169 | | | Value in use: cash flow based on 5 year plan | | | 11.4 | % | | | 2 | % |
Retail Banking | | Credit cards | | | 456 | | | Value in use: cash flow based on 5 year plan | | | 11.4 | % | | | 4 | % |
Retail Banking | | Consumer finance | | | 175 | | | Value in use: cash flow based on 5 year plan | | | 11.4 | % | | | — | |
Retail Banking | | Private banking | | | 30 | | | Value in use: cash flow based on 5 year plan | | | 11.4 | % | | | 7 | % |
Retail Banking | | Other | | | 4 | | | Value in use: cash flow based on 5 year plan | | | 11.4 | % | | | 2 | % |
| | | | | | | | | | | | | | | | |
| | | | | 1,834 | | | | | | | | | | | |
| | | | | | | | | | | | | | | | |
| (1) | Average growth rate based on the five year plan for the first five years and a growth rate of 2.0% applied thereafter. |
In 2013, the discount rate increased by 0.4 percentage points to 11.8% (2012: 11.4%). The increase reflected changes in current market and economic conditions. In 2013, the change in growth rates reflected the updated strategic priorities for the Santander UK group in the context of forecast economic conditions.
| | |
| 260 | | Santander UK plc Annual Report 2013 |
Financial Statements
Notes to the Financial Statementscontinued
b) Other intangibles
| | | | | | | | | | | | | | | | |
| | | Group | | | Company | |
| | | 2013
£m | | | 2012
£m | | | 2013
£m | | | 2012
£m | |
Cost | | | | | | | | | | | | | | | | |
At 1 January | | | 762 | | | | 550 | | | | 732 | | | | 515 | |
Additions | | | 81 | | | | 224 | | | | 79 | | | | 217 | |
Disposals | | | (29 | ) | | | (12 | ) | | | — | | | | — | |
| | | | | | | | | | | | | | | | |
At 31 December | | | 814 | | | | 762 | | | | 811 | | | | 732 | |
| | | | | | | | | | | | | | | | |
Accumulated amortisation / impairment | | | | | | | | | | | | | | | | |
At 1 January | | | 271 | | | | 242 | | | | 279 | | | | 251 | |
Disposals | | | (8 | ) | | | (6 | ) | | | — | | | | — | |
Charge for the year | | | 50 | | | | 35 | | | | 48 | | | | 28 | |
| | | | | | | | | | | | | | | | |
At 31 December | | | 313 | | | | 271 | | | | 327 | | | | 279 | |
| | | | | | | | | | | | | | | | |
Net book value | | | 501 | | | | 491 | | | | 484 | | | | 453 | |
| | | | | | | | | | | | | | | | |
Other intangible assets of the Santander UK group and the Company consist of computer software, and marketing rights acquired by the Santander UK group during 2010. The marketing rights had a cost of £16m. Accumulated amortisation at the start of the year was £7m and amortisation of £2m (2012: £2m) was charged in the year, giving a net book value of £7m (2012: £9m) at the year-end.
26. PROPERTY, PLANT AND EQUIPMENT
| | | | | | | | | | | | | | | | | | | | |
| | | Group | |
| | | Property
£m | | | Office fixtures
and equipment
£m | | | Computer
software
£m | | | Operating lease
assets
£m | | | Total
£m | |
Cost: | | | | | | | | | | | | | | | | | | | | |
At 1 January 2013 | | | 1,143 | | | | 782 | | | | 390 | | | | 118 | | | | 2,433 | |
Additions | | | 109 | | | | 81 | | | | — | | | | 68 | | | | 258 | |
Disposals | | | (38 | ) | | | (18 | ) | | | — | | | | (80 | ) | | | (136 | ) |
| | | | | | | | | | | | | | | | | | | | |
At 31 December 2013 | | | 1,214 | | | | 845 | | | | 390 | | | | 106 | | | | 2,555 | |
| | | | | | | | | | | | | | | | | | | | |
Accumulated depreciation: | | | | | | | | | | | | | | | | | | | | |
At 1 January 2013 | | | 130 | | | | 447 | | | | 303 | | | | 12 | | | | 892 | |
Charge for the year | | | 33 | | | | 91 | | | | 40 | | | | 34 | | | | 198 | |
Disposals | | | (13 | ) | | | (14 | ) | | | — | | | | (29 | ) | | | (56 | ) |
| | | | | | | | | | | | | | | | | | | | |
At 31 December 2013 | | | 150 | | | | 524 | | | | 343 | | | | 17 | | | | 1,034 | |
| | | | | | | | | | | | | | | | | | | | |
Net book value | | | 1,064 | | | | 321 | | | | 47 | | | | 89 | | | | 1,521 | |
| | | | | | | | | | | | | | | | | | | | |
| |
| | | Group | |
| | | Property
£m | | | Office fixtures
and equipment
£m | | | Computer
software
£m | | | Operating lease
assets
£m | | | Total
£m | |
Cost: | | | | | | | | | | | | | | | | | | | | |
At 1 January 2012 | | | 1,052 | | | | 770 | | | | 390 | | | | 183 | | | | 2,395 | |
Additions | | | 93 | | | | 82 | | | | — | | | | 55 | | | | 230 | |
Disposals | | | (2 | ) | | | (70 | ) | | | — | | | | (120 | ) | | | (192 | ) |
| | | | | | | | | | | | | | | | | | | | |
At 31 December 2012 | | | 1,143 | | | | 782 | | | | 390 | | | | 118 | | | | 2,433 | |
| | | | | | | | | | | | | | | | | | | | |
Accumulated depreciation: | | | | | | | | | | | | | | | | | | | | |
At 1 January 2012 | | | 95 | | | | 426 | | | | 260 | | | | 18 | | | | 799 | |
Charge for the year | | | 36 | | | | 89 | | | | 43 | | | | 43 | �� | | | 211 | |
Disposals | | | (1 | ) | | | (68 | ) | | | — | | | | (49 | ) | | | (118 | ) |
| | | | | | | | | | | | | | | | | | | | |
At 31 December 2012 | | | 130 | | | | 447 | | | | 303 | | | | 12 | | | | 892 | |
| | | | | | | | | | | | | | | | | | | | |
Net book value | | | 1,013 | | | | 335 | | | | 87 | | | | 106 | | | | 1,541 | |
| | | | | | | | | | | | | | | | | | | | |
| | | | | | | | | | | | | | | | |
| | | Company | |
| | | Property
£m | | | Office fixtures
and equipment
£m | | | Computer
software
£m | | | Total
£m | |
Cost: | | | | | | | | | | | | | | | | |
At 1 January 2013 | | | 1,009 | | | | 928 | | | | 322 | | | | 2,259 | |
Additions | | | 165 | | | | 76 | | | | — | | | | 241 | |
Disposals | | | (38 | ) | | | (16 | ) | | | — | | | | (54 | ) |
| | | | | | | | | | | | | | | | |
At 31 December 2013 | | | 1,136 | | | | 988 | | | | 322 | | | | 2,446 | |
| | | | | | | | | | | | | | | | |
Accumulated depreciation: | | | | | | | | | | | | | | | | |
At 1 January 2013 | | | 267 | | | | 600 | | | | 235 | | | | 1,102 | |
Charge for the year | | | 29 | | | | 88 | | | | 40 | | | | 157 | |
Disposals | | | (1 | ) | | | (12 | ) | | | — | | | | (13 | ) |
Other | | | 4 | | | | — | | | | — | | | | 4 | |
| | | | | | | | | | | | | | | | |
At 31 December 2013 | | | 299 | | | | 676 | | | | 275 | | | | 1,250 | |
| | | | | | | | | | | | | | | | |
Net book value | | | 837 | | | | 312 | | | | 47 | | | | 1,196 | |
| | | | | | | | | | | | | | | | |
| | |
| Santander UK plc Annual Report 2013 | | 261 |
Financial Statements
Notes to the Financial Statementscontinued
| | | | | | | | | | | | | | | | |
| | | Company | |
| | | Property
£m | | | Office fixtures
and equipment
£m | | | Computer
software
£m | | | Total
£m | |
Cost: | | | | | | | | | | | | | | | | |
At 1 January 2012 | | | 952 | | | | 920 | | | | 322 | | | | 2,194 | |
Additions | | | 59 | | | | 78 | | | | — | | | | 137 | |
Disposals | | | (2 | ) | | | (70 | ) | | | — | | | | (72 | ) |
| | | | | | | | | | | | | | | | |
At 31 December 2012 | | | 1,009 | | | | 928 | | | | 322 | | | | 2,259 | |
| | | | | | | | | | | | | | | | |
Accumulated depreciation: | | | | | | | | | | | | | | | | |
At 1 January 2012 | | | 237 | | | | 583 | | | | 192 | | | | 1,012 | |
Charge for the year | | | 31 | | | | 85 | | | | 43 | | | | 159 | |
Disposals | | | (1 | ) | | | (68 | ) | | | — | | | | (69 | ) |
| | | | | | | | | | | | | | | | |
At 31 December 2012 | | | 267 | | | | 600 | | | | 235 | | | | 1,102 | |
| | | | | | | | | | | | | | | | |
Net book value | | | 742 | | | | 328 | | | | 87 | | | | 1,157 | |
| | | | | | | | | | | | | | | | |
At 31 December 2013, capital expenditure contracted but not provided for in respect of property, plant and equipment was £14m (2012: £70m). Of the carrying value at the balance sheet date, £279m (2012: £293m) related to assets under construction.
Operating lease assets
The Santander UK group’s operating lease assets consist of motor vehicles and other assets leased to its corporate customers. The Company has no operating lease assets. Future minimum lease receipts under non-cancellable operating leases are due over the following periods:
| | | | | | | | |
| | | Group | |
| | | 2013
£m | | | 2012
£m | |
In no more than 1 year | | | 30 | | | | 29 | |
In more than 1 year but no more than 5 years | | | 46 | | | | 57 | |
In more than 5 years | | | 1 | | | | 1 | |
| | | | | | | | |
| | | 77 | | | | 87 | |
| | | | | | | | |
Contingent rent income of £11m (2012: £nil) was recognised in the year.
27. DEFERRED TAX
Deferred taxes are calculated on temporary differences under the liability method using the tax rates expected to apply when the liability is settled or the asset is realised. The movement on the deferred tax account was as follows:
| | | | | | | | | | | | | | | | |
| | | Group | | | Company | |
| | | 2013
£m | | | 2012
£m | | | 2013
£m | | | 2012
£m | |
At 1 January | | | 60 | | | | 257 | | | | 72 | | | | 275 | |
Income statement charge | | | (145 | ) | | | (242 | ) | | | (112 | ) | | | (248 | ) |
(Charged)/credited to other comprehensive income: | | | | | | | | | | | | | | | | |
- retirement benefit obligations | | | 113 | | | | 42 | | | | 113 | | | | 42 | |
- available-for-sale financial assets | | | — | | | | 3 | | | | — | | | | 3 | |
- cash flow hedges | | | 7 | | | | — | | | | — | | | | — | |
| | | | | | | | | | | | | | | | |
| | | 120 | | | | 45 | | | | 113 | | | | 45 | |
| | | | | | | | | | | | | | | | |
At 31 December | | | 35 | | | | 60 | | | | 73 | | | | 72 | |
| | | | | | | | | | | | | | | | |
Deferred tax balances are presented in the balance sheet after offsetting assets and liabilities where the Santander UK group and Company has the legal right to off set and intends to settle on a net basis. The deferred tax assets and liabilities are attributable to the following items:
| | | | | | | | | | | | | | | | |
| | | Group | | | Company | |
| | | 2013
£m | | | 2012
£m | | | 2013
£m | | | 2012
£m | |
Deferred tax assets/ (liabilities) | | | | | | | | | | | | | | | | |
Pensions and other post retirement benefits | | | 108 | | | | 9 | | | | 108 | | | | 9 | |
Accelerated book depreciation | | | (20 | ) | | | (43 | ) | | | 12 | | | | 23 | |
IFRS transitional adjustments | | | 33 | | | | 53 | | | | 15 | | | | 26 | |
Other temporary differences | | | (86 | ) | | | (22 | ) | | | (62 | ) | | | (49 | ) |
Tax losses carried forward | | | — | | | | 63 | | | | — | | | | 63 | |
| | | | | | | | | | | | | | | | |
| | | 35 | | | | 60 | | | | 73 | | | | 72 | |
| | | | | | | | | | | | | | | | |
The deferred tax assets scheduled above have been recognised in both the Company and the Santander UK group on the basis that sufficient future taxable profits are forecast within the foreseeable future, in excess of the profits arising from the reversal of existing taxable temporary differences, to allow for the utilisation of the assets as they reverse. Based on the conditions at the balance sheet date, management determined that a reasonably possible change in any of the key assumptions underlying the estimated future taxable profits in the Santander UK group’s five year plan (described in Note 25) would not cause a reduction in the deferred tax assets recognised.
| | |
| 262 | | Santander UK plc Annual Report 2013 |
Financial Statements
Notes to the Financial Statementscontinued
The Santander UK group and the Company recognised deferred tax assets in respect of trading losses relating to the former Alliance & Leicester plc business which was transferred to Santander UK plc in May 2010 under Part VII of the Financial Services and Markets Act 2000. HM Revenue & Customs confirmed in 2010 that the availability of losses was unaffected by the transfer. Under current UK tax legislation, the tax losses do not time expire and the benefit of the tax losses carried forward may only be realised by the utilisation against the future taxable profits of the former Alliance & Leicester plc business. The tax losses were utilised as soon as practical taking into account discussions with HM Revenue & Customs over the level of profits attributable to the former Alliance & Leicester business. These tax losses were fully utilised during 2013.
At 31 December 2013, the Santander UK group had UK capital losses carried forward of £17m (2012: £28m). These losses are available for offset against future UK chargeable gains and under current UK tax legislation do not time expire. No deferred tax asset has been recognised in respect of these capital losses on the basis that future capital gains required to utilise the losses are not considered probable.
The deferred tax charge in respect of continuing and discontinued operations in the income statement comprises the following temporary differences:
| | | | | | | | | | | | |
| | | Group | |
| | | 2013
£m | | | 2012
£m | | | 2011
£m | |
Accelerated tax depreciation | | | 13 | | | | (39 | ) | | | (37 | ) |
Pensions and other post-retirement benefits | | | (14 | ) | | | (28 | ) | | | (64 | ) |
IFRS transition adjustments(1) | | | (20 | ) | | | (20 | ) | | | (18 | ) |
Tax losses carried forward | | | (63 | ) | | | (93 | ) | | | (90 | ) |
Other temporary differences(2) | | | (61 | ) | | | (62 | ) | | | 80 | |
| | | | | | | | | | | | |
| | | (145 | ) | | | (242 | ) | | | (129 | ) |
| | | | | | | | | | | | |
| (1) | The income statement Includes a charge of £nil (2012: 5m, 2011: £5m) relating to discontinued operations. |
| (2) | The income statement Includes a charge of £nil (2012: 5m, 2011: £6m) relating to discontinued operations. |
28. OTHER ASSETS
| | | | | | | | | | | | | | | | |
| | | Group | | | Company | |
| | | 2013
£m | | | 2012(1)
£m | | | 2013
£m | | | 2012
£m | |
Trade and other receivables | | | 737 | | | | 1,719 | | | | 684 | | | | 569 | |
Prepayments | | | 55 | | | | 84 | | | | 49 | | | | 76 | |
Accrued income | | | 22 | | | | 11 | | | | 7 | | | | — | |
General insurance assets | | | 68 | | | | 71 | | | | 68 | | | | 71 | |
| | | | | | | | | | | | | | | | |
| | | 882 | | | | 1,885 | | | | 808 | | | | 716 | |
| | | | | | | | | | | | | | | | |
| (1) | Adjusted to reflect the presentation of the assets held for sale prior to the completion of the sale as set out in Note 12. |
At 31 December 2012, trade and other receivables included £1,125m relating to the assets held for sale of the co-brand credit cards business sold in 2013.
Included in the above balances are amounts due to the Santander UK group by Banco Santander, S.A. and other subsidiaries of Banco Santander, S.A. outside the Santander UK group of £2m (2012: £2m) and £27m (2012: £10m) respectively.
29. DEPOSITS BY BANKS
| | | | | | | | | | | | | | | | |
| | | Group | | | Company | |
| | | 2013
£m | | | 2012
£m | | | 2013
£m | | | 2012
£m | |
Items in the course of transmission | | | 614 | | | | 340 | | | | 604 | | | | 319 | |
Deposits by banks - securities sold under agreements to repurchase | | | 5,465 | | | | 7,382 | | | | 1,301 | | | | 2,584 | |
Amounts due to Santander UK subsidiaries | | | — | | | | — | | | | 112,076 | | | | 105,591 | |
Amounts due to ultimate parent - securities sold under repurchase agreements | | | 50 | | | | 140 | | | | — | | | | — | |
-other | | | 636 | | | | 20 | | | | 629 | | | | 20 | |
Amounts due to fellow Banco Santander subsidiaries - securities sold under | | | | | | | | | | | | | | | | |
repurchase agreements | | | — | | | | — | | | | — | | | | — | |
- other | | | 1 | | | | 64 | | | | 1 | | | | 1 | |
Deposits held as collateral | | | 1,047 | | | | 1,382 | | | | 222 | | | | 342 | |
Other deposits | | | 883 | | | | 607 | | | | 385 | | | | 313 | |
| | | | | | | | | | | | | | | | |
| | | 8,696 | | | | 9,935 | | | | 115,218 | | | | 109,170 | |
| | | | | | | | | | | | | | | | |
| | |
| | | Group | | | Company | |
| | | 2013
£m | | | 2012
£m | | | 2013
£m | | | 2012
£m | |
Repayable: | | | | | | | | | | | | | | | | |
On demand | | | 2,929 | | | | 2,324 | | | | 17,946 | | | | 28,280 | |
In not more than 3 months | | | 658 | | | | 1,338 | | | | 21,115 | | | | 41,328 | |
In more than 3 months but not more than 1 year | | | 176 | | | | 636 | | | | 23,259 | | | | 13,117 | |
In more than 1 year but not more than 5 years | | | 4,375 | | | | 5,431 | | | | 38,963 | | | | 25,052 | |
In more than 5 years | | | 558 | | | | 206 | | | | 13,935 | | | | 1,393 | |
| | | | | | | | | | | | | | | | |
| | | 8,696 | | | | 9,935 | | | | 115,218 | | | | 109,170 | |
| | | | | | | | | | | | | | | | |
| | |
| Santander UK plc Annual Report 2013 | | 263 |
Financial Statements
Notes to the Financial Statementscontinued
30. DEPOSITS BY CUSTOMERS
| | | | | | | | | | | | | | | | |
| | | Group | | | Company | |
| | | 2013
£m | | | 2012
£m | | | 2013
£m | | | 2012
£m | |
Current and demand accounts: | | | | | | | | | | | | | | | | |
- interest-bearing | | | 46,242 | | | | 33,145 | | | | 42,507 | | | | 28,657 | |
- non interest-bearing | | | 984 | | | | 1,437 | | | | 900 | | | | 1,333 | |
Savings accounts(1) | | | 69,147 | | | | 76,260 | | | | 68,821 | | | | 75,268 | |
Time deposits | | | 28,860 | | | | 35,769 | | | | 21,675 | | | | 26,415 | |
Securities sold under repurchase agreements | | | 920 | | | | 906 | | | | 502 | | | | 500 | |
Amounts due to Santander UK subsidiaries | | | — | | | | — | | | | 43,980 | | | | 55,356 | |
Amounts due to fellow Banco Santander subsidiaries | | | 1,014 | | | | 1,520 | | | | 1,014 | | | | 1,355 | |
| | | | | | | | | | | | | | | | |
| | | 147,167 | | | | 149,037 | | | | 179,399 | | | | 188,884 | |
| | | | | | | | | | | | | | | | |
Repayable: | | | | | | | | | | | | | | | | |
On demand | | | 117,036 | | | | 111,603 | | | | 113,072 | | | | 106,470 | |
In no more than 3 months | | | 8,211 | | | | 6,842 | | | | 6,312 | | | | 6,067 | |
In more than 3 months but no more than 1 year | | | 14,633 | | | | 17,725 | | | | 11,650 | | | | 13,854 | |
In more than 1 year but not more than 5 years | | | 6,641 | | | | 12,091 | | | | 4,784 | | | | 9,268 | |
In more than 5 years | | | 646 | | | | 776 | | | | 43,581 | | | | 53,225 | |
| | | | | | | | | | | | | | | | |
| | | 147,167 | | | | 149,037 | | | | 179,399 | | | | 188,884 | |
| | | | | | | | | | | | | | | | |
| (1) | Includes equity index-linked deposits of £3,983m (2012: £5,002m). The capital amount guaranteed/protected and the amount of return guaranteed in respect of the equity index-linked deposits were £3,983m and £235m, respectively (2012: £5,002m and £336m, respectively). |
Savings accounts and time deposits are interest-bearing.
31. TRADING LIABILITIES
| | | | | | | | | | | | | | | | | | |
| | | | | Group | | | Company | |
| | | | | 2013
£m | | | 2012
£m | | | 2013
£m | | | 2012
£m | |
Deposits by banks | | - securities sold under repurchase agreements | | | 7,795 | | | | 6,833 | | | | — | | | | — | |
| | - other(1) | | | 3,496 | | | | 2,909 | | | | — | | | | — | |
Deposits by customers | | - securities sold under repurchase agreements | | | 6,329 | | | | 4,847 | | | | — | | | | — | |
| | - other(2) | | | 740 | | | | 2,401 | | | | — | | | | — | |
Short positions in securities and unsettled trades | | | 2,918 | | | | 4,119 | | | | — | | | | — | |
| | | | | | | | | | | | | | | | | | |
| | | | | 21,278 | | | | 21,109 | | | | — | | | | — | |
| | | | | | | | | | | | | | | | | | |
| (1) | Comprises cash collateral of £1,841m (2012: £2,269m) and short-term deposits of £1,655m (2012: £640m). |
| (2) | Comprises short-term deposits of £681m (2012: £1,702m) and equity index-linked deposits of £59m (2012: £699m). The capital amount guaranteed/protected and the amount of return guaranteed in respect of the equity index-linked deposits were £127m and £17m, respectively (2012: £559m and £109m, respectively). |
Included in the above balances are amounts owed by the Santander UK group to Banco Santander, S.A. of £193m (2012: £180m) and to other subsidiaries of Banco Santander, S.A. outside the Santander UK group of £13m (2012: £45m).
32. FINANCIAL LIABILITIES DESIGNATED AT FAIR VALUE
| | | | | | | | | | | | | | | | | | |
| | | | | Group | | | Company | |
| | | | | 2013
£m | | | 2012
£m | | | 2013
£m | | | 2012
£m | |
Debt securities in issue | | - US$10bn Euro Commercial Paper Programme | | | 865 | | | | 1,403 | | | | — | | | | — | |
| | - US$20bn Euro Medium Term Note Programme | | | 591 | | | | 655 | | | | — | | | | — | |
| | - Euro 10bn Note Certificate and Warrant Programme | | | 1,832 | | | | 1,740 | | | | — | | | | — | |
Warrants | | | | | 119 | | | | 204 | | | | — | | | | — | |
| | | | | | | | | | | | | | | | | | |
| | | | | 3,407 | | | | 4,002 | | | | — | | | | — | |
| | | | | | | | | | | | | | | | | | |
Financial liabilities are designated at fair value through profit or loss where this results in more relevant information because it significantly reduces a measurement inconsistency that would otherwise arise from measuring assets and liabilities or recognising the gains or losses on them on a different basis, or where a contract contains one or more embedded derivatives that would otherwise require separate recognition.
The ‘fair value option’ has been used where deposits by banks, deposits by customers, debt securities in issue and warrants would otherwise be measured at amortised cost, and any embedded derivatives or associated derivatives used to economically hedge the risk are held at fair value. Where the Santander UK group records its own debt securities in issue at fair value, the fair value is based on quoted prices in an active market for the specific instrument concerned, if available.
| | |
| 264 | | Santander UK plc Annual Report 2013 |
Financial Statements
Notes to the Financial Statementscontinued
When quoted market prices are unavailable, the own debt security in issue is valued using valuation techniques, the inputs for which are either based upon quoted prices in an inactive market for the instrument, or are estimated by comparison with quoted prices in an active market for similar instruments. In both cases, the fair value includes the effect of applying the credit spread which is appropriate to the Santander UK group’s liabilities. The change in fair value of issued debt securities attributable to the Santander UK group’s own credit spread is computed as follows: for each security at each reporting date, an externally verifiable price is obtained or a price is derived using credit spreads for similar securities for the same issuer or credit default swaps. Each security is then valued using discounted cash flows, incorporating a LIBOR-based discount curve. The difference in the valuations is attributable to the Santander UK group’s own credit spread. This methodology is applied consistently across all securities where it is believed that counterparties would consider the Santander UK group’s creditworthiness when pricing trades.
Gains and losses arising from changes in the credit spread of liabilities issued by the Santander UK group reverse over the contractual life of the debt, provided that the debt is not repaid at a premium or a discount. The net loss during the year attributable to changes in the Santander UK group’s own credit risk on the above debt securities in issue was £13m (2012: loss of £86m). The cumulative net loss attributable to changes in the Santander UK group’s own credit risk on the above debt securities in issue at 31 December 2013 was £6m (2012: net gain of £7m).
The amount that would be required to be contractually paid at maturity of the deposits by banks, deposits by customers, and debt securities in issue above is £216m (2012: £531m) higher than the carrying value.
US$10bn Euro Commercial Paper Programme
Abbey National Treasury Services plc may from time to time issue commercial paper under the US$10bn Euro Commercial Paper Programme that may be denominated in any currency as agreed between Abbey National Treasury Services plc and the relevant dealer. The commercial paper ranks at least pari passu with all other unsecured and unsubordinated obligations of Abbey National Treasury Services plc. The payments of all amounts due in respect of the commercial paper have been unconditionally and irrevocably guaranteed by the Company.
The commercial paper is issued in bearer form, subject to a minimum maturity of 1 day and a maximum maturity of 364 days. The commercial paper may be issued on a discounted basis or may bear fixed or floating rate interest or a coupon calculated by reference to an index or formula. The maximum aggregate nominal amount of all commercial paper outstanding from time to time under the Programme will not exceed US$10bn (or its equivalent in other currencies). The commercial paper is not listed on any stock exchange.
US$20bn Euro Medium Term Note Programme
Abbey National Treasury Services plc and the Company may from time to time issue notes denominated in any currency as agreed between the issuer and the relevant dealer under the US$20bn Euro Medium Term Note Programme. The payment of all amounts payable in respect of the notes is unconditionally and irrevocably guaranteed by the Company. The programme provides for issuance of fixed rate notes, floating rate notes, variable interest notes and zero-coupon/discount notes.
The maximum aggregate nominal amount of all notes outstanding under the programme may not exceed US$20bn (or its equivalent in other currencies) subject to any modifications in accordance with the terms of the programme agreement. Notes may be issued in bearer or registered form and can be listed on the London Stock Exchange or any other stock exchange(s) as agreed.
Euro 10bn Note, Certificate and Warrant Programme
Abbey National Treasury Services plc may from time to time issue structured notes and redeemable certificates (together the ‘N&C Securities’) and warrants (together with the N&C Securities, the ‘Securities’) denominated in any currency as agreed between Abbey National Treasury Services plc and the relevant dealers under the euro 10bn note, certificate and warrant programme (the ‘Omnibus Programme’). The securities are direct, senior and unsecured obligations of Abbey National Treasury Services plc that rank pari passu without preference among themselves and, subject as to any applicable statutory provisions or judicial order, at least equally with all other present and future senior and unsecured obligations of Abbey National Treasury Services plc. The payment of all amounts due in respect of the Securities has been unconditionally and irrevocably guaranteed by the Company.
The Omnibus Programme provides for the issuance of commodity linked N&C Securities, credit-linked N&C Securities, currency-linked Securities, equity-linked Securities, equity index-linked Securities, fixed rate N&C Securities, floating rate N&C Securities, fund-linked Securities, inflation-linked Securities, property-linked Securities, zero-coupon/discount N&C Securities and any other structured Securities as agreed between Abbey National Treasury Services plc and the relevant dealers. Securities issued under the Omnibus Programme are governed by English law.
The maximum aggregate outstanding nominal amount of all N&C Securities and the aggregate issue prices of outstanding warrants from time to time issued under the Omnibus Programme will not exceed euro 10bn (or its equivalent in other currencies).
Warrants programme
Abbey National Treasury Services plc established a warrants programme (the ‘Warrants Programme’) in 2009 for the issuance of structured warrants denominated in any currency as agreed between Abbey National Treasury Services plc and the relevant dealers under the Warrants Programme. Warrants are direct, unsecured and unconditional obligations of Abbey National Treasury Services plc that rank pari passu without preference among themselves and, subject as to any applicable statutory provisions or judicial order, rank at least equally with all other present and future unsecured and unsubordinated obligations of Abbey National Treasury Services plc.
As at the date of this report, Abbey National Treasury Services plc has discontinued the issue of new warrants under the Warrants Programme as new issuances are being made under the Omnibus Programme. The payments of all amounts due in respect of the previously issued warrants have been unconditionally and irrevocably guaranteed by the Company.
| | |
| Santander UK plc Annual Report 2013 | | 265 |
Financial Statements
Notes to the Financial Statementscontinued
33. DEBT SECURITIES IN ISSUE
| | | | | | | | | | | | | | | | |
| | | Group | | | Company | |
| | | 2013
£m | | | 2012
£m | | | 2013
£m | | | 2012
£m | |
Bonds and medium term notes: | | | | | | | | | | | | | | | | |
- Euro 35bn Global Covered Bond Programme | | | 18,379 | | | | 21,757 | | | | — | | | | — | |
- US$20bn Euro Medium Term Note Programme (See Note 32) | | | 7,690 | | | | 6,396 | | | | — | | | | — | |
- US$40bn Euro Medium Term Note Programme | | | 156 | | | | 645 | | | | 156 | | | | 645 | |
- US$20bn Commercial Paper Programme | | | 3,131 | | | | 2,289 | | | | — | | | | — | |
- Euro 5bn Guaranteed French Certificates of Deposit Programme | | | 890 | | | | — | | | | — | | | | — | |
- Certificates of deposit in issue | | | 1,756 | | | | 4,509 | | | | — | | | | — | |
| | | | | | | | | | | | | | | | |
| | | 32,002 | | | | 35,596 | | | | 156 | | | | 645 | |
| | | | | | | | | | | | | | | | |
Securitisation programmes (See Note 20): | | | | | | | | | | | | | | | | |
- Holmes | | | 9,139 | | | | 9,876 | | | | — | | | | — | |
- Fosse | | | 8,885 | | | | 13,387 | | | | — | | | | — | |
- Motor | | | 844 | | | | 762 | | | | — | | | | — | |
| | | | | | | | | | | | | | | | |
| | | 50,870 | | | | 59,621 | | | | 156 | | | | 645 | |
| | | | | | | | | | | | | | | | |
Included in the above balances are amounts owed by the Santander UK group to Banco Santander, S.A. and other subsidiaries of Banco Santander, S.A. outside the Santander UK group of £54m (2012: £2,058m) and £789m (2012: £1,232m) respectively.
Euro 35bn Global Covered Bond Programme
Abbey National Treasury Services plc issues covered bonds under the euro 35bn Global Covered Bond Programme that may be denominated in any currency as agreed between Abbey National Treasury Services plc and the relevant dealers. The programme provides that covered bonds may be listed or admitted to trading, on the official list of the UK Listing Authority and on the London Stock Exchange’s Regulated Market or any other stock exchanges or regulated or unregulated markets. Abbey National Treasury Services plc may also issue unlisted covered bonds and/or covered bonds not admitted to trading on any regulated or unregulated market.
The payments of all amounts due in respect of the covered bonds have been unconditionally guaranteed by the Company. Abbey Covered Bonds LLP (the ‘LLP’), together with the Company, has guaranteed payments of interest and principal under the covered bonds pursuant to a guarantee which is secured over the LLP’s portfolio of mortgages and its other assets. Recourse against the LLP under its guarantee is limited to its portfolio of mortgages and such assets.
Covered bonds may be issued in bearer or registered form. The maximum aggregate nominal amount of all covered bonds from time to time outstanding under the programme will not exceed euro 35bn (or its equivalent in other currencies), subject to any modifications in accordance with the programme.
On 11 November 2008, Abbey National Treasury Services plc was admitted to the register of issuers and the programme and the covered bonds issued previously under the programme were admitted to the register of regulated covered bonds, pursuant to Regulation 14 of the Regulated Covered Bonds Regulations 2008 (SI 2008/346).
US$20bn Commercial Paper Programme
Abbey National North America LLC may from time to time issue unsecured notes denominated in United States dollars as agreed between Abbey National North America LLC and the relevant dealers under the US$20bn US commercial paper programme. The Notes will rank at least pari passu with all other unsecured and unsubordinated indebtedness of Abbey National North America LLC and the Company. The payments of all amounts due in respect of the Notes have been unconditionally and irrevocably guaranteed by the Company. The Notes are not redeemable prior to maturity or subject to voluntary prepayment. The maximum aggregate nominal amount of all Notes from time to time outstanding under the Programme will not exceed US$20bn (or its equivalent in other currencies).
US$40bn Euro Medium Term Note Programme
In January 2009, it was decided that no further issuance would be made under the US$40bn Euro Medium Term Note Programme. Alliance & Leicester plc issued both senior notes and subordinated notes and from time to time issued notes denominated in any currency as agreed with the relevant dealer under the US$40bn Euro Medium Term Note Programme. The Programme provided for issuance of fixed rate Notes, floating rate notes, index linked notes, dual currency notes and zero-coupon notes. The notes are listed on the London Stock Exchange or may be listed on any other or further stock exchange(s) or may be unlisted, as agreed. The notes were issued in bearer form. The maximum aggregate nominal amount of all notes from time to time outstanding under the Programme did not exceed US$40bn (or its equivalent in other currencies), subject to any modifications in accordance with the terms of the Programme agreement.
The notes were direct, unsecured and unconditional obligations of Alliance & Leicester plc. The notes transferred to the Company with effect from 28 May 2010 under a business transfer scheme under Part VII of the Financial Services and Markets Act 2000. As a result, the notes are now direct, unsecured and unconditional obligations of the Company.
Euro 5bn Guaranteed French Certificates of Deposit Programme
The Company may from time to time issue certificates of deposit under the Euro5bn Guaranteed French Certificates of Deposit Programme that may be denominated in any currency as agreed between the Company and the relevant dealer. The certificates of deposit rank at least pari passu with all other unsecured and unsubordinated obligations of the Company. The payments of all amounts due in respect of the certificates of deposit have been unconditionally and irrevocably guaranteed by Santander UK plc. The certificates of deposit are issued in bearer form, subject to a maximum maturity of 365 days or 366 days in a leap year. The certificates of deposit may bear fixed or floating rate interest. The maximum aggregate nominal amount of all certificates of deposit outstanding from time to time under the programme will not exceed Euro5bn (or its equivalent in other currencies). The certificates of deposit are not listed on any stock exchange.
| | |
| 266 | | Santander UK plc Annual Report 2013 |
Financial Statements
Notes to the Financial Statementscontinued
Certificates of Deposit
The Company may from time to time issue certificates of deposit that may be denominated in any currency as agreed between the parties. The certificates of deposit rank at least pari passu with all other unsecured and unsubordinated obligations of the Company. The payments of all amounts due in respect of the certificates of deposit have been unconditionally and irrevocably guaranteed by Santander UK plc. The certificates of deposit are issued in bearer form and may bear fixed or floating rate interest. The certificates of deposit are not listed on any stock exchange.
US SEC registered debt shelf
Abbey National Treasury Services plc issues notes in the US from time to time pursuant to a shelf registration statement on Form F-3 filed with the US Securities and Exchange Commission. The notes may be issued in any currency agreed between Abbey National Treasury Services plc and the relevant underwriters in any particular issuance under the registration statement and are issued under the US$20bn Euro Medium Term Note Programme.
Securitisation programmes
The Santander UK group has provided prime retail mortgage-backed securitised products and other asset-backed securitised products to a diverse investor base through its mortgage and other asset-backed funding programmes, as described in Note 20.
Funding has historically been raised via mortgage-backed notes, both issued to third parties and retained. In addition, the Santander UK group has provided other asset-backed securitised products to investors through the securitisation of auto loan receivables.
An analysis of the above debt securities in issue by issue currency, interest rate and maturity is as follows:
| | | | | | | | | | | | | | | | | | | | | | |
| | | | | | | | Group | | | Company | |
Issue currency | | Interest rate | | Maturity | | | 2013
£m | | | 2012
£m | | | 2013
£m | | | 2012
£m | |
Euro | | 0.00% - 3.99% | | | 2013 - 2014 | | | | 1,951 | | | | 5,320 | | | | 42 | | | | 525 | |
| | | | | 2015 - 2019 | | | | 8,150 | | | | 7,134 | | | | — | | | | — | |
| | | | | 2020 - 2029 | | | | 2,573 | | | | 2,631 | | | | — | | | | — | |
| | | | | 2030 - 2059 | | | | 4,602 | | | | 5,974 | | | | — | | | | — | |
| | 4.00% - 4.99% | | | 2013 - 2014 | | | | 866 | | | | 855 | | | | — | | | | — | |
| | | | | 2015 - 2019 | | | | 983 | | | | 969 | | | | — | | | | — | |
| | | | | 2020 - 2029 | | | | 1,840 | | | | 2,111 | | | | — | | | | — | |
| | | | | 2030 - 2059 | | | | 76 | | | | 178 | | | | — | | | | — | |
| | 5.00% - 7.99% | | | 2014 - 2019 | | | | — | | | | 19 | | | | — | | | | — | |
US dollar | | 0.00% - 3.99% | | | Up to 2013 | | | | — | | | | 2 | | | | — | | | | | |
| | | | | 2013 - 2014 | | | | 6,495 | | | | 5,832 | | | | — | | | | — | |
| | | | | 2015 - 2019 | | | | 609 | | | | — | | | | — | | | | — | |
| | | | | 2020 - 2029 | | | | 416 | | | | 412 | | | | — | | | | — | |
| | | | | 2040 - 2059 | | | | 5,953 | | | | 7,690 | | | | — | | | | — | |
| | 4.00% - 5.99% | | | 2013 - 2014 | | | | 3 | | | | — | | | | — | | | | — | |
| | | | | 2015 - 2019 | | | | 663 | | | | 687 | | | | 32 | | | | 34 | |
| | | | | 2040 - 2059 | | | | 149 | | | | 157 | | | | | | | | — | |
Pounds sterling | | 0.00% - 3.99% | | | Up to 2013 | | | | — | | | | 8 | | | | — | | | | — | |
| | | | | 2013 - 2014 | | | | 1,211 | | | | 3,488 | | | | — | | | | — | |
| | | | | 2015 - 2019 | | | | 1,824 | | | | 1,534 | | | | — | | | | — | |
| | | | | 2020 - 2029 | | | | 502 | | | | 395 | | | | — | | | | — | |
| | | | | 2040 - 2059 | | | | 6,187 | | | | 8,148 | | | | — | | | | — | |
| | 4.00% - 5.99% | | | 2013 - 2014 | | | | 11 | | | | — | | | | — | | | | — | |
| | | | | 2015 - 2019 | | | | 1,027 | | | | 1,023 | | | | — | | | | — | |
| | | | | 2020 - 2029 | | | | 3,546 | | | | 3,455 | | | | — | | | | — | |
| | | | | 2040 - 2059 | | | | 524 | | | | 535 | | | | — | | | | — | |
| | 6.00% - 6.99% | | | 2015 - 2019 | | | | 82 | | | | 86 | | | | 82 | | | | 86 | |
Other currencies | | 0.00% - 5.99% | | | 2013 - 2014 | | | | — | | | | 245 | | | | — | | | | — | |
| | | | | 2015 - 2019 | | | | 192 | | | | 190 | | | | — | | | | — | |
| | | | | 2020 - 2029 | | | | 171 | | | | 191 | | | | — | | | | — | |
| | | | | 2040 - 2060 | | | | 264 | | | | 256 | | | | — | | | | — | |
| | 6.00% - 6.99% | | | 2050 - 2059 | | | | — | | | | 96 | | | | — | �� | | | — | |
| | | | | | | | | | | | | | | | | | | | | | |
| | | | | | | | | 50,870 | | | | 59,621 | | | | 156 | | | | 645 | |
| | | | | | | | | | | | | | | | | | | | | | |
| | |
| Santander UK plc Annual Report 2013 | | 267 |
Financial Statements
Notes to the Financial Statementscontinued
34. SUBORDINATED LIABILITIES
| | | | | | | | | | | | | | | | |
| | | Group | | | Company | |
| | | 2013
£m | | | 2012
£m | | | 2013
£m | | | 2012
£m | |
£325m Sterling Preference Shares | | | 344 | | | | 344 | | | | 344 | | | | 344 | |
£175m Fixed/Floating Rate Tier One Preferred Income Capital Securities | | | 209 | | | | 216 | | | | 202 | | | | 216 | |
Undated subordinated liabilities | | | 2,104 | | | | 2,199 | | | | 2,050 | | | | 2,199 | |
Dated subordinated liabilities | | | 1,649 | | | | 1,022 | | | | 1,616 | | | | 1,087 | |
| | | | | | | | | | | | | | | | |
| | | 4,306 | | | | 3,781 | | | | 4,212 | | | | 3,846 | |
| | | | | | | | | | | | | | | | |
The above securities will, in the event of the winding-up of the issuer, be subordinated to the claims of depositors and all other creditors of the issuer, other than creditors whose claims rank equally with, or are junior to, the claims of the holders of the subordinated liabilities. The subordination of specific subordinated liabilities is determined in respect of the issuer and any guarantors of that liability. The claims of holders of preference shares and preferred securities are generally junior to those of the holders of undated subordinated liabilities, which in turn are junior to the claims of holders of the dated subordinated liabilities. The subordination of the preference shares and preferred securities ranks equally with that of the £300m fixed/floating rate non-cumulative callable preference shares, £300m Step-up Callable Perpetual Preferred Securities and £300m Step-up Callable Perpetual Reserve Capital Instruments classified as share capital, as described in Note 39.
The Santander UK group has not had any defaults of principal, interest or other breaches with respect to its subordinated liabilities during the year (2012: none). No repayment or purchase by the issuer of the subordinated liabilities may be made prior to their stated maturity without the consent of the UK PRA.
Included in the above balances are amounts owed by the Santander UK group to Banco Santander, S.A. and other subsidiaries of Banco Santander, S.A. outside the Santander UK group of £691m (2012: £276m) and £1,609m (2012: £1,603m) respectively.
Following the adoption of IFRS 10 as described in Note 1, with effect from 1 January 2012, the trust preferred entities previously consolidated by the Santander UK group are no longer consolidated as Santander UK plc is not exposed to variability of returns from the entities. The trust preferred entities were set up by Santander UK solely for the issuance of trust preferred securities to third parties and to lend the funds raised on to Santander UK plc. The trust preferred entities were consolidated by the Santander UK group. As a result, the subordinated liabilities issued by Santander UK plc to Abbey National Capital LP I (which are for the same amount and terms as the notes issued to third parties by Abbey National Capital Trust I) were recognised as liabilities of Santander UK plc and classified as “Dated subordinated liabilities” in the Company balance sheet. In the consolidated balance sheet of the Santander UK group, these securities were eliminated as intercompany transactions. Instead, the trust preferred securities issued by the trust preferred entities were recognised as liabilities of the Santander UK group and classified as “US$1,000m Non-Cumulative Trust Preferred Securities”.
As a result of the adoption of IFRS 10, the notes issued by the trust preferred entities, previously recognised as liabilities of the Santander UK group are no longer recognised. Instead the subordinated liabilities issued by Santander UK plc to Abbey National Capital LP I are recognised as liabilities of the Santander UK group and classified as “Dated subordinated liabilities”. There is therefore no longer any difference between the accounting by Santander UK plc and the Santander UK group. The prior year comparative has been restated. Further information on the US$1,000m Non-Cumulative Trust Preferred Securities in accordance with SEC Regulation S-X is set out on the following page.
£325m Sterling Preference Shares
Holders of sterling preference shares are entitled to receive a biannual non-cumulative preferential dividend payable in sterling out of the distributable profits of the Company. The rate per annum will ensure that the sum of the dividend payable on such date and the associated tax credit (as defined in the terms of the sterling preference shares) represents an annual rate of 8 5/8% per annum of the nominal amount of shares issued in 1997, and an annual rate of 10 3/8% for shares issued in 1995 and 1996.
On a return of capital or on a distribution of assets on a winding up, the sterling preference shares shall rank pari passu with any other shares that are expressed to rank pari passu therewith as regards participation in assets, and otherwise in priority to any other share capital of the Company. On such a return of capital or winding up, each sterling preference share shall, out of the surplus assets of the Company available for distribution amongst the members after payment of the Company’s liabilities, carry the right to receive an amount equal to the amount paid up or credited as paid together with any premium paid on issue and the full amount of any dividend otherwise due for payment. Other than as set out above, no sterling preference share confers any right to participate on a return of capital or a distribution of assets of the Company.
Holders of the sterling preference shares are not entitled to receive notice of or attend, speak and vote at general meetings of the Company unless the business of the meeting includes the consideration of a resolution to wind up the Company or any resolution varying, altering or abrogating any of the rights, privileges, limitations or restrictions attached to the sterling preference shares or if the dividend on the sterling preference shares has not been paid in full for the three consecutive dividend periods immediately prior to the relevant general meeting. In any such case, the sterling preference shareholders are entitled to receive notice of and attend the general meeting at which such resolution is proposed and will be entitled to speak and vote on such a resolution but not on any other resolution.
£175m Fixed/Floating Rate Tier One Preferred Income Capital Securities
The Tier One Preferred Income Capital Securities were issued on 9 August 2002 by the Company and have no fixed redemption date. The Company has the right to redeem the Tier One Preferred Income Capital Securities whole but not in part on 9 February 2018 or on any coupon payment date thereafter, subject to the prior approval of the UK Financial Services Authority. The Tier One Preferred Income Capital Securities bear interest at a rate of 6.984% per annum, payable semi-annually in arrears. From (and including) 9 February 2018, the Tier One Preferred Income Capital Securities will bear interest, at a rate reset semi-annually of 1.86% per annum above the six-month sterling LIBOR rate, payable semi-annually in arrears. Interest payments may be deferred in limited circumstances, such as when the payment would cause the Company to become insolvent or breach applicable Capital Regulations.
The Tier One Preferred Income Capital Securities are not redeemable at the option of the holders and the holders do not have any rights against other Santander UK group companies. Where interest payments have been deferred, the Company may not declare or pay dividends on or redeem or repurchase any junior securities until it next makes a scheduled payment on the Tier One Preferred Income Capital Securities and the Reserve Capital Instruments.
The Tier One Preferred Income Capital Securities are unsecured securities of the Company and are subordinated to the claims of unsubordinated creditors and subordinated creditors holding loan capital of the Company. Upon the winding up of the Company, holders of Tier One Preferred Income Capital Securities will rank pari passu with the holders of the most senior class or classes of preference shares (if any) of the Company then in issue and in priority to all other Company shareholders.
| | |
| 268 | | Santander UK plc Annual Report 2013 |
Financial Statements
Notes to the Financial Statementscontinued
US$1,000m Non-Cumulative Trust Preferred Securities
Abbey National Capital Trust I and Abbey National Capital LP I are 100% owned finance subsidiaries (as defined in Regulation S-X under the US Securities Act 1933, as amended) of the Company. On 7 February 2000, Abbey National Capital Trust I issued US$1bn of 8.963% Non-cumulative Trust Preferred Securities, which have been registered under the US Securities Act of 1933, as amended. Abbey National Capital Trust I serves solely as a passive vehicle holding the partnership preferred securities issued by Abbey National Capital LP I and each has passed all the rights relating to such partnership preferred securities to the holders of trust preferred securities issued by Abbey National Capital Trust I. All of the trust preferred securities and the partnership preferred securities have been fully and unconditionally guaranteed on a subordinated basis by the Company. The terms of the securities do not include any significant restrictions on the ability of the Company to obtain funds, by dividend or loan, from any subsidiary. After 30 June 2030, the distribution rate on the preferred securities will be 2.825% per annum above the three-month US dollar LIBOR rate for the relevant distribution period. The trust preferred securities are not redeemable at the option of the holders and the holders do not have any rights against other Santander UK group companies. There is no fixed redemption date for the partnership preferred securities. The partnership preferred securities may be redeemed by the partnership, in whole or in part, on 30 June 2030 and on each distribution payment date thereafter. Redemption by the partnership of the partnership preferred securities may also occur in the event of a tax or regulatory change. Generally, holders of the preferred securities will have no voting rights. Upon the return of capital or distribution of assets in the event of the winding up of the partnership, holders of the partnership preferred securities will be entitled to receive, for each partnership preferred security, a liquidation preference of US $1,000, together with any due and accrued distributions and any additional amounts, out of the assets of the partnership available for distribution.
Undated subordinated liabilities
| | | | | | | | | | | | | | | | |
| | | Group | | | Company | |
| | | 2013
£m | | | 2012
£m | | | 2013
£m | | | 2012
£m | |
10.0625% Exchangeable subordinated capital securities | | | 205 | | | | 205 | | | | 205 | | | | 205 | |
5.56% Subordinated guaranteed notes (Yen 15,000m) | | | 93 | | | | 120 | | | | 93 | | | | 120 | |
5.50% Subordinated guaranteed notes (Yen 5,000m) | | | 31 | | | | 40 | | | | 31 | | | | 40 | |
Fixed/Floating Rate Subordinated notes (Yen 5,000m) | | | 32 | | | | 40 | | | | 32 | | | | 40 | |
10 Year step-up perpetual callable subordinated notes | | | 334 | | | | 340 | | | | 332 | | | | 340 | |
7.50% 15 Year step-up perpetual callable subordinated notes | | | 471 | | | | 499 | | | | 471 | | | | 499 | |
7.375% 20 Year step-up perpetual callable subordinated notes | | | 223 | | | | 239 | | | | 206 | | | | 239 | |
7.125% 30 Year step-up perpetual callable subordinated notes | | | 381 | | | | 391 | | | | 346 | | | | 391 | |
Fixed to floating rate perpetual callable subordinated notes | | | 334 | | | | 325 | | | | 334 | | | | 325 | |
| | | | | | | | | | | | | | | | |
| | | 2,104 | | | | 2,199 | | | | 2,050 | | | | 2,199 | |
| | | | | | | | | | | | | | | | |
The 10.0625% exchangeable subordinated capital securities are exchangeable into fully paid 10.375% non-cumulative non-redeemable sterling preference shares of £1 each, at the option of the Company. Exchange may take place on any interest payment date providing that between 30 and 60 days notice has been given to the holders. The holders will receive one new sterling preference share for each £1 principal amount of capital securities held.
The 5.56% Subordinated guaranteed notes are redeemable at par, at the option of the Company, on 31 January 2015 and each fifth anniversary thereafter.
The 5.50% Subordinated guaranteed notes are redeemable at par, at the option of the Company, on 27 June 2015 and each fifth anniversary thereafter.
The Fixed/Floating Rate Subordinated notes are redeemable at par, at the option of the Company, on 27 December 2016 and each interest payment date (quarterly) thereafter.
The 10 Year step-up perpetual callable subordinated notes are redeemable at par, at the option of the Company, on 28 September 2010 and each fifth anniversary thereafter. The coupon payable on the notes is 4.8138% from 28 September 2010 to 28 September 2015.
The 7.50% 15 Year step-up perpetual callable subordinated notes are redeemable at par, at the option of the Company, on 28 September 2015 and each fifth anniversary thereafter.
The 7.375% 20 Year step-up perpetual callable subordinated notes are redeemable at par, at the option of the Company, on 28 September 2020 and each fifth anniversary thereafter.
The 7.125% 30 Year step-up perpetual callable subordinated notes are redeemable at par, at the option of the Company, on 30 September 2030 and each fifth anniversary thereafter.
The Fixed to Floating rate perpetual callable subordinated notes are redeemable at par, at the option of the Company, on 28 September 2010 and each interest payment date thereafter. The Company did not exercise its options to call the notes during the year.
In common with other debt securities issued by Santander UK group companies, the undated subordinated liabilities are redeemable in whole at the option of the Company, on any interest payment date, in the event of certain tax changes affecting the treatment of payments of interest on the subordinated liabilities in the UK, at their principal amount together with any accrued interest.
| | |
| Santander UK plc Annual Report 2013 | | 269 |
Financial Statements
Notes to the Financial Statementscontinued
Dated subordinated liabilities
| | | | | | | | | | | | | | | | |
| | | Group | | | Company | |
| | | 2013
£m | | | 2012
£m | | | 2013
£m | | | 2012
£m | |
10.125% Subordinated guaranteed bond 2023 | | | 103 | | | | 110 | | | | 99 | | | | 110 | |
11.50% Subordinated guaranteed bond 2017 | | | 73 | | | | 78 | | | | 72 | | | | 78 | |
7.95% Subordinated notes 2029 (US$1,000m) | | | 217 | | | | 256 | | | | 217 | | | | 256 | |
6.50% Subordinated notes 2030 | | | 42 | | | | 42 | | | | 38 | | | | 42 | |
8.963% Subordinated notes 2030 (US$1,000m) | | | 159 | | | | 374 | | | | 159 | | | | 374 | |
Subordinated floating rate EURIBOR notes 2016 | | | — | | | | — | | | | — | | | | 65 | |
5.875% Subordinated notes 2031 | | | 10 | | | | 10 | | | | 8 | | | | 10 | |
9.625% Subordinated notes 2023 | | | 148 | | | | 152 | | | | 142 | | | | 152 | |
5% Subordinated notes 2023 (US$1,500m) | | | 897 | | | | — | | | | 881 | | | | — | |
| | | | | | | | | | | | | | | | |
| | | 1,649 | | | | 1,022 | | | | 1,616 | | | | 1,087 | |
| | | | | | | | | | | | | | | | |
In August 2013, as part of a capital management exercise, a proportion of the 8.963% Subordinated notes 2030 (US$1,000m) were purchased by the Company. There was no significant profit and loss on these repurchases.
The subordinated floating rate notes pay a rate of interest related to the LIBOR of the currency of denomination. The dated subordinated liabilities are redeemable in whole at the option of the Company, on any interest payment date, in the event of certain tax changes affecting the treatment of payments of interest on the subordinated liabilities in the UK, at their principal amount together with any accrued interest.
Subordinated liabilities are repayable:
| | | | | | | | | | | | | | | | |
| | | Group | | | Company | |
| | | 2013
£m | | | 2012
£m | | | 2013
£m | | | 2012
£m | |
In more than 1 year but no more than 5 years | | | 74 | | | | 78 | | | | 72 | | | | 78 | |
In more than 5 years | | | 1,575 | | | | 944 | | | | 1,544 | | | | 1,009 | |
Undated | | | 2,657 | | | | 2,759 | | | | 2,596 | | | | 2,759 | |
| | | | | | | | | | | | | | | | |
| | | 4,306 | | | | 3,781 | | | | 4,212 | | | | 3,846 | |
| | | | | | | | | | | | | | | | |
35. OTHER LIABILITIES
| | | | | | | | | | | | | | | | |
| | | Group | | | Company | |
| | | 2013
£m | | | 2012
£m | | | 2013
£m | | | 2012
£m | |
Trade and other payables | | | 1,012 | | | | 1,711 | | | | 956 | | | | 1,570 | |
Accrued expenses | | | 849 | | | | 795 | | | | 625 | | | | 566 | |
Deferred income | | | 22 | | | | 20 | | | | 3 | | | | 3 | |
| | | | | | | | | | | | | | | | |
| | | 1,883 | | | | 2,526 | | | | 1,584 | | | | 2,139 | |
| | | | | | | | | | | | | | | | |
Included in the above balances are amounts owed by the Santander UK group to Banco Santander, S.A. and other subsidiaries of Banco Santander, S.A. outside the Santander UK group of £164m (2012: £352m) and £83m (2012: £110m) respectively.
36. PROVISIONS
| | | | | | | | | | | | | | | | |
| | | Group | |
| | | Conduct remediation | | | | | | | |
| | | PPI
£m | | | Other products
£m | | | Other provisions(1)
£m | | | Total
£m | |
At 1 January 2013 | | | 382 | | | | 276 | | | | 256 | | | | 914 | |
Additional provisions | | | — | | | | — | | | | 265 | | | | 265 | |
Used during the year | | | (217 | ) | | | (9 | ) | | | (269 | ) | | | (495 | ) |
Provisions released and other | | | — | | | | (45 | ) | | | — | | | | (45 | ) |
| | | | | | | | | | | | | | | | |
At 31 December 2013 | | | 165 | | | | 222 | | | | 252 | | | | 639 | |
| | | | | | | | | | | | | | | | |
To be settled: | | | | | | | | | | | | | | | | |
Within 12 months | | | 153 | | | | 222 | | | | 165 | | | | 540 | |
In more than 12 months | | | 12 | | | | — | | | | 87 | | | | 99 | |
| | | | | | | | | | | | | | | | |
| | | 165 | | | | 222 | | | | 252 | | | | 639 | |
| | | | | | | | | | | | | | | | |
| (1) | Includes regulatory-related provisions of £169m in respect of the FSCS and the UK Bank Levy at 31 December 2013 (2012: £185m). |
| | |
| 270 | | Santander UK plc Annual Report 2013 |
Financial Statements
Notes to the Financial Statementscontinued
| | | | | | | | | | | | | | | | |
| | | Group | |
| | | Conduct remediation | | | | | | | |
| | | PPI
£m | | | Other products
£m | | | Other provisions(1)
£m | | | Total
£m | |
At 1 January 2012 | | | 688 | | | | 59 | | | | 223 | | | | 970 | |
Additional provisions | | | — | | | | 232 | | | | 214 | | | | 446 | |
Used during the year | | | (306 | ) | | | (15 | ) | | | (174 | ) | | | (495 | ) |
Provisions released and other | | | — | | | | — | | | | (7 | ) | | | (7 | ) |
| | | | | | | | | | | | | | | | |
At 31 December 2012 | | | 382 | | | | 276 | | | | 256 | | | | 914 | |
| | | | | | | | | | | | | | | | |
To be settled: | | | | | | | | | | | | | | | | |
Within 12 months | | | 229 | | | | 9 | | | | 169 | | | | 407 | |
In more than 12 months | | | 153 | | | | 267 | | | | 87 | | | | 507 | |
| | | | | | | | | | | | | | | | |
| | | 382 | | | | 276 | | | | 256 | | | | 914 | |
| | | | | | | | | | | | | | | | |
| (1) | Includes regulatory-related provisions of £185m in respect of the FSCS and the UK Bank Levy at 31 December 2012 (2011: £176m). |
| | | | | | | | | | | | | | | | |
| | | Company | |
| | | Conduct remediation | | | | | | | |
| | | PPI
£m | | | Other products
£m | | | Other provisions
£m | | | Total
£m | |
At 1 January 2013 | | | 371 | | | | 275 | | | | 213 | | | | 859 | |
Additional provisions | | | — | | | | — | | | | 153 | | | | 153 | |
Used during the year | | | (199 | ) | | | (9 | ) | | | (168 | ) | | | (376 | ) |
Provisions released and other | | | — | | | | (45 | ) | | | — | | | | (45 | ) |
Transfer between legal entities | | | (21 | ) | | | — | | | | — | | | | (21 | ) |
| | | | | | | | | | | | | | | | |
At 31 December 2013 | | | 151 | | | | 221 | | | | 198 | | | | 570 | |
| | | | | | | | | | | | | | | | |
To be settled: | | | | | | | | | | | | | | | | |
Within 12 months | | | 139 | | | | 221 | | | | 117 | | | | 477 | |
In more than 12 months | | | 12 | | | | — | | | | 81 | | | | 93 | |
| | | | | | | | | | | | | | | | |
| | | 151 | | | | 221 | | | | 198 | | | | 570 | |
| | | | | | | | | | | | | | | | |
| |
| | | Company | |
| | | Conduct remediation | | | | | | | |
| | | PPI
£m | | | Other products
£m | | | Other provisions
£m | | | Total
£m | |
At 1 January 2012 | | | 671 | | | | 59 | | | | 182 | | | | 912 | |
Additional provisions | | | — | | | | 228 | | | | 185 | | | | 413 | |
Used during the year | | | (300 | ) | | | (12 | ) | | | (154 | ) | | | (466 | ) |
| | | | | | | | | | | | | | | | |
At 31 December 2012 | | | 371 | | | | 275 | | | | 213 | | | | 859 | |
| | | | | | | | | | | | | | | | |
To be settled: | | | | | | | | | | | | | | | | |
Within 12 months | | | 218 | | | | 9 | | | | 123 | | | | 350 | |
In more than 12 months | | | 153 | | | | 266 | | | | 90 | | | | 509 | |
| | | | | | | | | | | | | | | | |
| | | 371 | | | | 275 | | | | 213 | | | | 859 | |
| | | | | | | | | | | | | | | | |
Conduct remediation
The amounts in respect of conduct remediation comprise the estimated cost of making redress payments, including related costs, with respect to the past sales of products. In calculating the conduct remediation provision, management’s best estimate of the provision was calculated based on conclusions regarding the number of claims, of those, the number that will be upheld, and the estimated average settlement per case. Sensitivities relating to the provision for conduct remediation can be found in “Critical Accounting Policies and Areas of Significant Management Judgement” in Note 1.
(i) Payment Protection Insurance (‘PPI’)
The provision for conduct remediation in respect of PPI represents management’s best estimate of the anticipated costs of related customer contact and/or redress, including related costs. The provision is calculated based on a number of key assumptions which involve significant management judgement. These are as follows:
| • | | Claim volumes – the estimated number of customer complaints received, |
| • | | Uphold rate – the estimated percentage of complaints that are, or will be, upheld in favour of the customer, and |
| • | | Average cost of redress – the estimated payment to customers, including compensation for any direct loss plus interest. |
The assumptions have been based on the following:
| • | | Analysis completed of the causes of complaints, and uphold rates, and how these are likely to vary in the future, |
| • | | Actual claims activity registered to date, |
| • | | The level of redress paid to customers, together with a forecast of how this is likely to change over time, |
| • | | The impact on complaints levels of proactive customer contact, and |
| • | | The effect of media coverage on the issue. |
The assumptions are kept under review, and regularly reassessed and validated against actual customer data, e.g. claims received; uphold rates, the impact of any changes in approach to uphold rates, and any re-evaluation of the estimated population.
| | |
| Santander UK plc Annual Report 2013 | | 271 |
Financial Statements
Notes to the Financial Statementscontinued
The most critical factor in determining the level of provision is the volume of claims. The uphold rate is a reasonably consistent function of the sales process and the average cost of redress can be predicted reasonably accurately given that management is dealing with a high volume and reasonably homogeneous population. In setting the provision, management estimated the total claims that were likely to be received. Previous experience has indicated that claims could be received over a number of years. While initial claim levels at the beginning of the process were quite low, this increased in line with our initial expectations as a result of press coverage and the activities of the claims management companies (‘CMCs’), and then began to decrease after reaching a peak in the second half of 2012, again as expected. The CMCs facilitate customer claims in return for a share of the redress payment and advertise heavily thereby resulting in an increase in the volume of claims experienced. The actual monthly volume of claim inflows has steadily reduced by 35% during 2013. In line with the declining volumes of claims received during 2013, the overall uphold rate has fallen from 82% to 71% over the year.
The table below sets out the key drivers of the provision balance and forecast assumptions used in the calculating provision.
| | | | | | | | |
| | | Cumulative to
31 December
2013 | | | Future
Expected
(unaudited) | |
Inbound complaints(1) (‘000) | | | 679 | | | | 41 | |
Outbound contact (‘000) | | | 319 | | | | 48 | |
Outbound contact completion | | | 87 | % | | | 13 | % |
Response rate to outbound contact | | | 30 | % | | | 64 | % |
Average uphold rate per claim(2) | | | 83 | % | | | 78 | % |
Average redress per claim | | £ | 1,841 | | | £ | 1,803 | |
| (1) | Excludes invalid claims where the complainant has not held a PPI policy. |
| (2) | Claims include inbound and responses to outbound contact. |
Number of PPI claims outstanding
Movements in the number of PPI claims outstanding during the years ended 31 December 2013, 2012 and 2011 were as follows:
| | | | | | | | | | | | |
| | | 2013
‘000 | | | 2012
‘000 | | | 2011
‘000 | |
Outstanding at 1 January | | | 31 | | | | 1 | | | | — | |
Complaints received(1) | | | 363 | | | | 437 | | | | 111 | |
Complaints rejected as invalid(2) | | | (298 | ) | | | (258 | ) | | | (90 | ) |
Complaints closed - upheld | | | (82 | ) | | | (149 | ) | | | (20 | ) |
| | | | | | | | | | | | |
Outstanding at 31 December | | | 14 | | | | 31 | | | | 1 | |
| | | | | | | | | | | | |
| (1) | Includes complaints that were deemed invalid, as there is no record of a relevant PPI policy being held by the customer. |
| (2) | The customer has the right to appeal to the FOS if their claim is rejected. FOS may uphold or reject the appeal and if upheld Santander UK is required to provide redress to the customer. Claims upheld or rejected above reflect the results of any appeals. |
2013 compared with 2012
The volume of PPI activity decreased and the number of complaints we received reduced by 29% in 2013, although the high proportion of invalid complaints continued. Monthly PPI redress costs, including related costs, decreased through the year to an average in the fourth quarter of 2013 of £11m per month, compared to a monthly average in the year ended 31 December 2013 of £18m (2012: monthly average of £26m). The PPI provision remains adequate and will continue to be monitored.
2012 compared with 2011
As anticipated, PPI complaints rose significantly in 2012, due to higher press coverage and increased focus by CMCs. The increase was partly driven by invalid complaints (which also drove an increase in the level of claims rejected) and claims originated by CMCs. In addition, Santander UK proactively contacted more than 300,000 customers during the year, which led to an increase in claims received. The number of claims closed in 2012 increased, reflecting both the increase in claims received and continued prompt settlement of claims.
(ii) Other products
The provision for conduct remediation in respect of other products represents management’s best estimate of the anticipated costs of related customer contact and/or redress, including related costs. A number of uncertainties remain as to the eventual costs with respect to conduct remediation in respect of these products given the inherent difficulties in determining the number of customers involved and the amount of any redress to be provided to them.
Interest rate hedging products
In 2012, the FCA (formerly known as the FSA) identified material failings in the sale of interest rate derivatives to some small and medium sized businesses at the four largest UK banks. The FCA did not identify any mis-selling issues with Santander UK. However, in order to ensure that customers are treated consistently, the FCA requested seven other UK banks (including Santander UK) to undertake a review of the sales of interest rate hedging products to SMEs since 2001.
A provision was initially recognised based on the pilot exercise completed in the second half of 2012 and subsequently revised following the customer contact exercise that commenced in the second quarter of 2013 and ongoing updated guidelines from the FCA. The level of provision is based on full redress i.e. unwinding of the trade (reversal of mark-to-market values) and refund of net interest payments made by customers. Response rates are monitored on a regular basis, and the provision updated accordingly.
Card Protection Plan
In August 2013, the FCA announced that Card Protection Plan Limited (“CPP”) and 13 banks and credit card issuers, including the Santander UK group, had agreed to a compensation scheme in relation to the sale of card and/or identity protection insurance to certain retail customers. CPP has now written to affected policyholders to confirm the details of the proposed scheme, which has recently been approved by a policyholder vote and by the High Court of England and Wales.
A provision was recognised based on the proposed compensation scheme for sales and renewals made from 2005 onwards and operational costs associated with the contact exercise to commence in 2014 and customer complaint handling costs. The level of provision will be assessed as the main redress and review exercise progresses.
Other retail products
A provision has also been recognised in respect of other retail products, principally related to the historic sale of certain investments products.
| | |
| 272 | | Santander UK plc Annual Report 2013 |
Financial Statements
Notes to the Financial Statementscontinued
Other provisions
Other provisions principally comprise amounts in respect of regulatory-related provisions (the FSCS and the UK Bank Levy), as well as litigation and related expenses, restructuring expenses and vacant property costs.
(i) Financial Services Compensation Scheme (‘FSCS’)
The FSCS is the UK’s independent statutory compensation fund for customers of authorised financial services firms and pays compensation if a firm is unable to pay claims against it. The FSCS is funded by levies on the industry (and recoveries and borrowings where appropriate). The levies raised comprise both management expenses levies and, where necessary, compensation levies on authorised firms.
Each deposit-taking institution contributes towards the management expenses levies in proportion to their share of total protected deposits on 31 December of the year preceding the scheme year, which runs from 1 April to 31 March. In determining an appropriate accrual in respect of the management expenses levy, certain assumptions have been made including the proportion of total protected deposits held by the Santander UK group.
Following the default of a number of deposit takers since 2008, the FSCS borrowed funds from HM Treasury to meet the compensation costs for customers of those firms. The interest on the borrowings with HM Treasury, which total approximately £18bn, are, with effect from 1 April 2012, assessed at the higher of 12 month LIBOR plus 100 basis points and the relevant gilt rate published by the Debt Management Office.
Whilst it is expected that the substantial majority of the principal will be repaid from funds the FSCS receives from asset sales, surplus cash flow or other recoveries in relation to the assets of the firms that defaulted, to the extent that there remains a shortfall, the FSCS will recover any shortfall of the principal by levying the deposit-taking sector in instalments. The first instalment was as expected, in scheme year 2013/14, and the Santander UK group made a first capital contribution in August 2013.
The FSCS and HM Treasury have agreed that the terms of the repayment of the borrowings will be reviewed every three years in light of market conditions and of the actual repayment from the estates of failed banks. The ultimate amount of any compensation levies to be charged in future years also depends on a number of factors including the level of protected deposits and the population of deposit-taking participants and will be determined at a later date.
Dunfermline Building Society was the first deposit taker to be resolved under the Special Resolution Regime which came into force under the Banking Act 2009. Recoveries are paid to HM Treasury and the FSCS has an obligation to contribute to the costs of the resolution, subject to a statutory cap. This contribution will be discharged in due course through levies on the deposit-taking sector.
For the year ended 31 December 2013, the Santander UK group charged £59m (2012: £50m) to the income statement in respect of the costs of the FSCS. The charge includes the effect of adjustments to provisions made in prior years as a result of more accurate information now being available.
(ii) UK Bank Levy
The Finance Act 2011 introduced an annual bank levy in the UK. The UK Bank Levy is based on the total chargeable equity and liabilities as reported in the balance sheet at the end of a chargeable period. In determining the chargeable equity and liabilities the following amounts are excluded: adjusted Tier 1 capital; certain “protected deposits” (for example those protected under the FSCS); liabilities that arise from certain insurance business within banking groups; liabilities in respect of currency notes in circulation; FSCS liabilities; liabilities representing segregated client money; and deferred tax liabilities, current tax liabilities, liabilities in respect of the UK Bank Levy, revaluation of property liabilities, liabilities representing the revaluation of business premises and defined benefit retirement liabilities.
It is also permitted in specified circumstances to reduce certain liabilities: by netting them against certain assets; offsetting assets on the relevant balance sheets that would qualify as high quality liquid assets (in accordance with the PRA definition); and repo liabilities secured against sovereign and supranational debt.
The UK Bank Levy will be set at a rate of 0.156% from 2014. During 2013 a rate of 0.130% was applied (2012: 0.088%). Certain liabilities are subject to only a half rate, namely any deposits not otherwise excluded, (except for those from financial institutions and financial traders) and liabilities with a maturity greater than one year at the balance sheet date. The UK Bank Levy is not charged on the first £20bn of chargeable liabilities.
The cost of the UK Bank Levy to the Santander UK group for 2013 was £59m in 2013 (2012: £48m). The Santander UK group paid £49m in 2013 (2012: £49m) and provided for a liability of £31m at 31 December 2013 (2012: £21m).
| | |
| Santander UK plc Annual Report 2013 | | 273 |
Financial Statements
Notes to the Financial Statementscontinued
37. RETIREMENT BENEFIT PLANS
The amounts recognised in the balance sheet were as follows:
| | | | | | | | | | | | | | | | |
| | | Group | | | Company | |
| | | 2013
£m | | | 2012
£m | | | 2013
£m | | | 2012
£m | |
Assets/(liabilities) | | | | | | | | | | | | | | | | |
Funded defined benefit pension scheme | | | 118 | | | | 254 | | | | 110 | | | | 250 | |
Funded defined benefit pension scheme | | | (632 | ) | | | (266 | ) | | | (630 | ) | | | (266 | ) |
Unfunded defined benefit pension scheme | | | (40 | ) | | | (39 | ) | | | (40 | ) | | | (39 | ) |
| | | | | | | | | | | | | | | | |
Total net liabilities | | | (554 | ) | | | (51 | ) | | | (560 | ) | | | (55 | ) |
| | | | | | | | | | | | | | | | |
Remeasurement losses recognised in other comprehensive income during the year were as follows:
| | | | | | | | | | | | |
| | | Group | |
| | | 2013
£m | | | 2012
£m | | | 2011
£m | |
Remeasurement of defined benefit schemes | | | 564 | | | | 183 | | | | 37 | |
a) Defined Contribution pension schemes
The Santander UK group operates a number of defined contribution pension schemes. The assets of the defined contribution pension schemes are held and administered separately from those of the Company. The Santander Retirement Plan, an occupational defined contribution scheme, is the plan into which eligible employees are enrolled automatically. The assets of the Santander Retirement Plan are held in separate trustee-administered funds. The defined contribution section of the Alliance & Leicester Pension Scheme was closed to new members employed from 29 May 2010, and was merged on a segregated basis with the Santander (UK) Group Pension Scheme on 1 July 2012.
An expense of £38m (2012: £34m, 2011: £29m) was recognised for defined contribution plans in the year, and is included in staff costs classified within administration expenses in the Income Statement. None of this amount was recognised in respect of key management personnel for the years ended 31 December 2013, 2012 and 2011.
b) Defined Benefit pension schemes
The Santander UK group operates a number of defined benefit pension schemes. The main pension scheme is the Santander (UK) Group Pension Scheme, formerly the Abbey National Group Pension scheme. The Abbey National Amalgamated Pension Fund, Abbey National Associated Bodies Pension Fund, the National & Provincial Building Society Pension Fund, the Scottish Mutual Assurance Staff Pension Scheme, the Scottish Provident Institution Staff Pension Fund and the Alliance & Leicester Pension Scheme were merged into the Santander (UK) Group Pension scheme on a segregated basis on 1 July 2012. The scheme covers 18% (2012: 20%, 2011: 20%) of the Santander UK group’s employees, and is a closed funded defined benefit scheme. Under the projected unit method, the current service cost when expressed as a percentage of pensionable salaries will gradually increase over time.
The corporate trustee of the Santander (UK) Group Pension Scheme is Santander (UK) Group Pension Scheme Trustee Limited, a private limited company incorporated in 1996 and a wholly-owned subsidiary of Santander UK plc. The principal duty of the trustees is to act in the best interests of the members of the schemes. The Trustee board comprises seven Directors selected by Santander UK plc, plus seven member-nominated Directors selected from eligible members who apply for the role.
Formal actuarial valuations of the assets and liabilities of the defined benefit schemes are carried out on at least a triennial basis by independent professionally qualified actuaries and valued for accounting purposes at each balance sheet date. The latest formal actuarial valuation for the Santander (UK) Group Pension scheme is being made as at 31 March 2013 and is due to be finalised by 30 June 2014.
The assets of the funded plans are held independently of the Santander UK group’s assets in separate trustee administered funds. Investment strategy across the schemes remains under regular review. Investment decisions are delegated by the Santander (UK) Group Pension Scheme Trustees to a common investment fund, managed by Santander (CF) Trustee Limited, a private limited company owned by seven Trustee directors, four appointed by Santander UK plc and three by Santander (UK) Group Pension Trustee Limited. The Trustee directors’ principal duty, within the investment powers delegated to them is to act in the best interest of the members of the Santander (UK) Group Pension Scheme. Ultimate responsibility for investment strategy rests with the Trustees of the schemes who are required under the Pensions Act 2004 to prepare a statement of investment principles.
The Trustees of the Santander (UK) Group Pension Scheme have developed the following investment principles:
| • | | To maintain a portfolio of suitable assets of appropriate quality, suitability and liquidity which will generate income and capital growth to meet, together with new contributions from members and the employers, the cost of current and future benefits which the pension scheme provides, as set out in the trust deed and rules; |
| • | | To limit the risk of the assets failing to meet the liabilities, over the long term and on a shorter-term basis as required by prevailing legislation; and |
| • | | To minimise the long-term costs of the pension scheme by maximising the return on the assets whilst having regard to the objectives shown above. |
| | |
| 274 | | Santander UK plc Annual Report 2013 |
Financial Statements
Notes to the Financial Statementscontinued
The Santander UK group’s defined benefit pension schemes expose it to actuarial risks such as investment risk, interest rate risk, longevity risk, salary risk and inflation risk:
| | |
| Investment risk | | The present value of the defined benefit scheme liability is calculated using a discount rate determined by reference to high quality corporate bond yields; if the return on scheme assets is below this rate, it will create a scheme deficit. |
| |
| Interest rate risk | | A decrease in the bond interest rate will increase the scheme liability; however this will be partially offset by an increase in the return on the scheme’s debt investments. |
| |
| Longevity risk | | The present value of the defined benefit scheme liability is calculated by reference to the best estimate of the mortality of plan participants both during and after their employment. An increase in life expectancy of the scheme participants will increase the scheme’s liability. |
| |
| Salary risk | | The present value of the defined benefit scheme’s liability is calculated by reference to the future salaries of scheme participants. As such, an increase in the salary of the scheme participants will increase the scheme’s liability. |
| |
| Inflation risk | | An increase in inflation rate will decrease the scheme liability, accompanied by a decrease in the return on the scheme’s investments. |
The Santander UK group does not hold insurance policies over the schemes, and has not entered into any significant transactions with the schemes.
The total amount charged/(credited) to the income statement, including any amounts classified as redundancy costs and in discontinued operations was as follows:
| | | | | | | | | | | | |
| | | Group | |
| | | 2013
£m | | | 2012
£m | | | 2011
£m | |
Net interest expense/(income) | | | 1 | | | | (12 | ) | | | (34 | ) |
Current service cost | | | 38 | | | | 38 | | | | 34 | |
Past service cost | | | 1 | | | | — | | | | — | |
Administration costs | | | 8 | | | | 8 | | | | 8 | |
| | | | | | | | | | | | |
| | | 48 | | | | 34 | | | | 8 | |
| | | | | | | | | | | | |
The amounts recognised in other comprehensive income for each of the five years indicated were as follows:
| | | | | | | | | | | | | | | | | | | | |
| | | Group | |
| | | 2013
£m | | | 2012
£m | | | 2011
£m | | | 2010
£m | | | 2009
£m | |
Return on plan assets (excluding amounts included in net interest expense) | | | (135 | ) | | | (117 | ) | | | (105 | ) | | | (235 | ) | | | (330 | ) |
Actuarial gains/(losses) arising from changes in demographic assumptions | | | 21 | | | | — | | | | — | | | | — | | | | — | |
Actuarial gains/(losses) arising from experience adjustments | | | 22 | | | | (28 | ) | | | 136 | | | | (76 | ) | | | (34 | ) |
Actuarial gains/(losses) arising from changes in financial assumptions | | | 656 | | | | 328 | | | | 6 | | | | 283 | | | | 969 | |
| | | | | | | | | | | | | | | | | | | | |
Remeasurement of defined benefit pension schemes | | | 564 | | | | 183 | | | | 37 | | | | (28 | ) | | | 605 | |
| | | | | | | | | | | | | | | | | | | | |
The net (liability)/asset recognised in the balance sheet was determined as follows:
| | | | | | | | | | | | | | | | | | | | |
| | | Group | |
| | | 2013
£m | | | 2012
£m | | | 2011
£m | | | 2010
£m | | | 2009
£m | |
Present value of defined benefit obligation | | | (8,432 | ) | | | (7,554 | ) | | | (7,072 | ) | | | (6,729 | ) | | | (6,318 | ) |
Fair value of plan assets | | | 7,878 | | | | 7,503 | | | | 7,097 | | | | 6,556 | | | | 5,248 | |
| | | | | | | | | | | | | | | | | | | | |
Net defined benefit (obligation)/asset | | | (554 | ) | | | (51 | ) | | | 25 | | | | (173 | ) | | | (1,070 | ) |
| | | | | | | | | | | | | | | | | | | | |
| | | | | | | | | | | | | | | | | | | | |
| | | Company | |
| | | 2013
£m | | | 2012
£m | | | 2011
£m | | | 2010
£m | | | 2009
£m | |
Present value of defined benefit obligation | | | (8,420 | ) | | | (7,542 | ) | | | (7,061 | ) | | | (6,718 | ) | | | (4,805 | ) |
Fair value of plan assets | | | 7,860 | | | | 7,487 | | | | 7,082 | | | | 6,541 | | | | 3,883 | |
| | | | | | | | | | | | | | | | | | | | |
Net defined benefit (obligation)/asset | | | (560 | ) | | | (55 | ) | | | 21 | | | | (177 | ) | | | (922 | ) |
| | | | | | | | | | | | | | | | | | | | |
| | |
| Santander UK plc Annual Report 2013 | | 275 |
Financial Statements
Notes to the Financial Statementscontinued
Movements in the present value of defined benefit obligations during the year were as follows:
| | | | | | | | | | | | | | | | |
| | | Group | | | Company | |
| | | 2013
£m | | | 2012
£m | | | 2013
£m | | | 2012
£m | |
Balance at 1 January | | | (7,554 | ) | | | (7,072 | ) | | | (7,542 | ) | | | (7,061 | ) |
Current service cost | | | (27 | ) | | | (27 | ) | | | (27 | ) | | | (26 | ) |
Current service cost paid by subsidiaries | | | (2 | ) | | | (2 | ) | | | (2 | ) | | | (2 | ) |
Current service cost paid by fellow Banco Santander group subsidiaries | | | (9 | ) | | | (9 | ) | | | (9 | ) | | | (10 | ) |
Interest cost | | | (336 | ) | | | (346 | ) | | | (336 | ) | | | (345 | ) |
Employer salary sacrifice contributions | | | (5 | ) | | | (7 | ) | | | (5 | ) | | | (7 | ) |
Past service cost | | | (1 | ) | | | — | | | | (1 | ) | | | — | |
Remeasurement gains/(losses): | | | | | | | | | | | | | | | | |
- Actuarial losses arising from changes in demographic assumptions | | | (21 | ) | | | — | | | | (21 | ) | | | — | |
- Actuarial gains/(losses) arising from experience adjustments | | | (22 | ) | | | 28 | | | | (22 | ) | | | 28 | |
- Actuarial gains/(losses) arising from changes in financial assumptions | | | (656 | ) | | | (328 | ) | | | (656 | ) | | | (328 | ) |
Actual benefit payments | | | 201 | | | | 209 | | | | 201 | | | | 209 | |
| | | | | | | | | | | | | | | | |
Balance at 31 December | | | (8,432 | ) | | | (7,554 | ) | | | (8,420 | ) | | | (7,542 | ) |
| | | | | | | | | | | | | | | | |
Movements in the fair value of scheme assets during the year were as follows:
| | | | | | | | | | | | | | | | |
| | | Group | | | Company | |
| | | 2013
£m | | | 2012
£m | | | 2013
£m | | | 2012
£m | |
Balance at 1 January | | | 7,503 | | | | 7,097 | | | | 7,487 | | | | 7,082 | |
Interest income | | | 327 | | | | 350 | | | | 326 | | | | 349 | |
Remeasurement gains: | | | | | | | | | | | | | | | | |
- Return on plan assets (excluding amounts included in net interest expense) | | | 136 | | | | 117 | | | | 137 | | | | 117 | |
Company contributions paid | | | 102 | | | | 136 | | | | 100 | | | | 136 | |
Contributions paid by subsidiaries and fellow Banco Santander group subsidiaries | | | 11 | | | | 12 | | | | 11 | | | | 12 | |
Actual benefit payments | | | (201 | ) | | | (209 | ) | | | (201 | ) | | | (209 | ) |
| | | | | | | | | | | | | | | | |
Balance at 31 December | | | 7,878 | | | | 7,503 | | | | 7,860 | | | | 7,487 | |
| | | | | | | | | | | | | | | | |
Costs of £8m (2012: £8m, 2011: £8m) and £8m (2012: £8m, 2011: £8m) associated with the management of scheme assets have been deducted from the interest income on plan assets for the Santander UK group and the Company, respectively.
The following tables provide information on the composition and fair value of the plan assets at 31 December 2013 and 31 December 2012.
31 December 2013
| | | | | | | | | | | | | | | | | | | | | | | | |
| | | Group | |
| | | Quoted prices in active markets | | | Prices not quoted in active
markets | | | Total | |
Category of plan assets | | £m | | | % | | | £m | | | % | | | £m | | | % | |
UK equities | | | 326 | | | | 4 | | | | 5 | | | | — | | | | 331 | | | | 4 | |
Overseas equities | | | 1,587 | | | | 20 | | | | 8 | | | | — | | | | 1,595 | | | | 20 | |
Corporate bonds | | | 2,415 | | | | 31 | | | | — | | | | — | | | | 2,415 | | | | 31 | |
Government fixed interest bonds | | | 208 | | | | 3 | | | | — | | | | — | | | | 208 | | | | 3 | |
Government index linked bonds | | | 2,056 | | | | 26 | | | | — | | | | — | | | | 2,056 | | | | 26 | |
Property | | | — | | | | — | | | | 828 | | | | 11 | | | | 828 | | | | 11 | |
Cash | | | — | | | | — | | | | 207 | | | | 2 | | | | 207 | | | | 2 | |
Other | | | 11 | | | | — | | | | 227 | | | | 3 | | | | 238 | | | | 3 | |
| | | | | | | | | | | | | | | | | | | | | | | | |
Total | | | 6,603 | | | | 84 | | | | 1,275 | | | | 16 | | | | 7,878 | | | | 100 | |
| | | | | | | | | | | | | | | | | | | | | | | | |
31 December 2012
| | | | | | | | | | | | | | | | | | | | | | | | |
| | | Group | |
| | | Quoted prices in active markets | | | Prices not quoted in active markets | | | Total | |
Category of plan assets | | £m | | | % | | | £m | | | % | | | £m | | | % | |
| | | | | | | | | | | | | | | | | | | | | | | | |
UK equities | | | 579 | | | | 8 | | | | — | | | | — | | | | 579 | | | | 8 | |
Overseas equities | | | 1,434 | | | | 19 | | | | — | | | | — | | | | 1,434 | | | | 19 | |
Corporate bonds | | | 1,878 | | | | 25 | | | | — | | | | — | | | | 1,878 | | | | 25 | |
Government fixed interest bonds | | | 473 | | | | 6 | | | | — | | | | — | | | | 473 | | | | 6 | |
Government index linked bonds | | | 1,843 | | | | 25 | | | | — | | | | — | | | | 1,843 | | | | 25 | |
Property | | | — | | | | — | | | | 208 | | | | 3 | | | | 208 | | | | 3 | |
Cash | | | — | | | | — | | | | 717 | | | | 10 | | | | 717 | | | | 10 | |
Other | | | 188 | | | | 2 | | | | 183 | | | | 2 | | | | 371 | | | | 4 | |
| | | | | | | | | | | | | | | | | | | | | | | | |
Total | | | 6,395 | | | | 85 | | | | 1,108 | | | | 15 | | | | 7,503 | | | | 100 | |
| | | | | | | | | | | | | | | | | | | | | | | | |
31 December 2013
| | | | | | | | | | | | | | | | | | | | | | | | |
| | | Company | |
| | | Quoted prices in active markets | | | Prices not quoted in active
markets | | | Total | |
Category of plan assets | | £m | | | % | | | £m | | | % | | | £m | | | % | |
UK equities | | | 322 | | | | 4 | | | | 5 | | | | — | | | | 327 | | | | 4 | |
Overseas equities | | | 1,584 | | | | 20 | | | | 8 | | | | — | | | | 1,592 | | | | 20 | |
Corporate bonds | | | 2,412 | | | | 31 | | | | — | | | | — | | | | 2,412 | | | | 31 | |
Government Fixed Interest | | | 206 | | | | 3 | | | | — | | | | — | | | | 206 | | | | 3 | |
Government Index Linked | | | 2,056 | | | | 26 | | | | — | | | | — | | | | 2,056 | | | | 26 | |
Property | | | — | | | | — | | | | 828 | | | | 11 | | | | 828 | | | | 11 | |
Cash | | | — | | | | — | | | | 206 | | | | 2 | | | | 206 | | | | 2 | |
Other | | | 11 | | | | — | | | | 222 | | | | 3 | | | | 233 | | | | 3 | |
| | | | | | | | | | | | | | | | | | | | | | | | |
Total | | | 6,591 | | | | 84 | | | | 1,269 | | | | 16 | | | | 7,860 | | | | 100 | |
| | | | | | | | | | | | | | | | | | | | | | | | |
| | |
| 276 | | Santander UK plc Annual Report 2013 |
Financial Statements
Notes to the Financial Statementscontinued
31 December 2012
| | | | | | | | | | | | | | | | | | | | | | | | |
| | | Company | |
| | | Quoted prices in active markets | | | Prices not quoted in active markets | | | Total | |
Category of plan assets | | £m | | | % | | | £m | | | % | | | £m | | | % | |
| | | | | | | | | | | | | | | | | | | | | | | | |
UK equities | | | 575 | | | | 8 | | | | — | | | | — | | | | 575 | | | | 8 | |
Overseas equities | | | 1,432 | | | | 19 | | | | — | | | | — | | | | 1,432 | | | | 19 | |
Corporate bonds | | | 1,875 | | | | 25 | | | | — | | | | — | | | | 1,875 | | | | 25 | |
Government Fixed Interest | | | 471 | | | | 6 | | | | — | | | | — | | | | 471 | | | | 6 | |
Government Index Linked | | | 1,843 | | | | 25 | | | | — | | | | — | | | | 1,843 | | | | 25 | |
Property | | | — | | | | — | | | | 208 | | | | 3 | | | | 208 | | | | 3 | |
Cash | | | — | | | | — | | | | 717 | | | | 10 | | | | 717 | | | | 10 | |
Other | | | 183 | | | | 2 | | | | 183 | | | | 2 | | | | 366 | | | | 4 | |
| | | | | | | | | | | | | | | | | | | | | | | | |
Total | | | 6,379 | | | | 85 | | | | 1,108 | | | | 15 | | | | 7,487 | | | | 100 | |
| | | | | | | | | | | | | | | | | | | | | | | | |
Plan assets are stated at fair value based upon quoted prices in active markets with the exception of property funds and those classified under “Other”. The “Other” category consists of asset-backed securities, annuities, funds (including private equity funds) and derivatives that are used to protect against exchange rate, equity market, inflation and interest rate movements. The property funds were valued using market valuations prepared by an independent expert. Of the assets in the “Other” category, investments in absolute return funds and foreign exchange, equity and interest rate derivatives were valued by investment managers by reference to market observable data. Private equity funds were valued by reference to their latest published accounts whilst the insured annuities were valued by scheme actuaries based on the liabilities insured.
The actual gains on scheme assets for the Santander UK group and the Company were £463m (2012: £467m, 2011: £493m) and £463m (2012: £466m, 2011: £493m), respectively.
The Santander UK group’s pension schemes did not directly hold any equity securities of the Company or any of its related parties at 31 December 2013 and 2012. The Santander UK group’s pension scheme assets do not include any property or other assets that are occupied or used by the Santander UK group.
The investment policy and performance of the scheme is monitored regularly by the Company and the Santander (CF) Trustee to ensure that the risk and return profile of investments meets objectives. Any changes to the investment policy are agreed with the Santander (UK) Group Pension Scheme Trustee and documented in the Statement of Investment Policy for the Common Investment Fund. In March 2013, following a strategic review of assets and liabilities, the strategic asset allocation target was revised to an asset mix based on 25% quoted equities, 50% debt instruments (including gilts, index-linked gilts, and corporate bonds) and 25% property and alternatives. A strategy was also approved to manage interest rate and inflation risk relating to the liabilities and hedging of these risks was increased accordingly to meet the target levels set for 2013. At 31 December 2013, the Santander (UK) Group Pension Scheme held interest rate swaps with a gross notional value of £997m (2012: £158m) and inflation swaps with a gross notional value of £1,031m (2012: £252m) for the purposes of liability matching.
In 2010, in compliance with the Pensions Act 2004, the Santander UK group and the trustees agreed a scheme-specific funding target, statement of funding principles, and a schedule of contributions for the principal pension schemes. This agreement forms the basis of the Santander UK group’s commitment that the schemes have sufficient assets to make payments to members in respect of their accrued benefits as and when they fall due. In accordance with the terms of the agreement, the Santander UK group contributed £64m (2012: £95m) to the schemes in the year. The agreed schedule of the Santander UK group’s remaining contributions to the schemes comprises contributions of £64m in 2014 and £70m each year from 2015 to 2019.
Actuarial assumptions
The principal actuarial assumptions used for the defined benefit schemes were as follows:
| | | | | | | | | | | | |
| | | Group and Company | |
| | | 2013
% | | | 2012
% | | | 2011
% | |
To determine benefit obligations: | | | | | | | | | | | | |
- Discount rate for scheme liabilities | | | 4.5 | | | | 4.5 | | | | 5.0 | |
- General price inflation | | | 3.4 | | | | 2.9 | | | | 3.1 | |
- General salary increase | | | 3.4 | | | | 2.9 | | | | 3.1 | |
- Expected rate of pension increase | | | 3.2 | | | | 2.8 | | | | 3.0 | |
| | | |
| | | Years | | | Years | | | Years | |
Longevity at 60 for current pensioners, on the valuation date: | | | | | | | | | | | | |
- Males | | | 29.0 | | | | 28.9 | | | | 28.8 | |
- Females | | | 29.6 | | | | 29.5 | | | | 29.4 | |
Longevity at 60 for future pensioners currently aged 40, on the valuation date: | | | | | | | | | | | | |
- Males | | | 31.4 | | | | 31.3 | | | | 31.1 | |
- Females | | | 31.2 | | | | 31.1 | | | | 31.0 | |
The rate used to discount the retirement benefit obligation is determined to reflect duration of the liabilities based on the annual yield at 31 December of the sterling 15+ year AA Corporate Bond iBoxx Index, representing the market yield of high quality corporate bonds on that date, adjusted to match the terms of the scheme liabilities. The inflation assumption is set based on the Bank of England projected inflation rates over the duration of scheme liabilities weighted by projected scheme cash flows.
In 2013, the mortality assumption used in the preparation of the valuation was based on the Continuous Mortality Investigation Table S1 Light with a future improvement underpin of 1.5% for males and 1% for females (2012: Continuous Mortality Investigation Table S1 Light with a future improvement underpin of 1.5% for males and 1% for females; 2011: Continuous Mortality Investigation Table PXA 92MCC 2009 with a future improvement underpin of 1.5% for males and 1% for females). The table above shows that a participant retiring at age 60 at 31 December 2013 is assumed to live for, on average, 29.0 years in the case of a male and 29.6 years in the case of a female. In practice, there will be variation between individual members but these assumptions are expected to be appropriate across all participants. It is assumed that younger members will live longer in retirement than those retiring now. This reflects the expectation that mortality rates will continue to fall over time as medical science and standards of living improve. To illustrate the degree of improvement assumed the table also shows the life expectancy for members aged 40 now, when they retire in 20 years’ time at age 60.
| | |
| Santander UK plc Annual Report 2013 | | 277 |
Financial Statements
Notes to the Financial Statementscontinued
The Santander UK group determined its expense measurements above based upon long-term assumptions taking into account target asset allocations of assets set at the beginning of the period, offset by actual returns during the period. Period-end obligation measurements are determined by reference to market conditions at the balance sheet date. Assumptions are set in consultation with third party advisors and in-house expertise.
Actuarial assumption sensitivities
The sensitivity analyses below have been determined based on reasonably possible changes of the respective assumptions occurring at the end of the reporting period, while holding all assumptions constant.
| | | | | | | | | | |
| | | Increase/(decrease) | |
| | | 2013
£m | | | 2012
£m | |
Discount rate | | Change in pension obligation at year end from a 25 bps increase | | | (442 | ) | | | (362 | ) |
| | Change in pension cost for the year from a 25 bps increase | | | (1 | ) | | | — | |
| | | |
General price inflation | | Change in pension obligation at year end from a 25 bps increase | | | 290 | | | | 343 | |
| | Change in pension cost for the year from a 25 bps increase | | | 14 | | | | 18 | |
| | | |
General salary increase | | Change in pension obligation at year end from a 25 bps increase | | | 33 | | | | 30 | |
| | | |
Mortality | | Change in pension obligation at year end from each additional year of longevity assumed | | | 176 | | | | 184 | |
The sensitivity analysis presented above may not be representative of the actual change in the defined benefit obligation as it is unlikely that the change in assumptions would occur in isolation of one another as some of the assumptions may be correlated. Furthermore, in presenting the above sensitivity analyses, the present value of the defined benefit obligation has been calculated using the projected unit credit method at the end of the reporting period, which is the same as that applied in calculating the defined benefit obligation liability recognised in the balance sheet. There was no change in the methods and assumptions used in preparing the sensitivity analyses from prior years.
The benefits expected to be paid in each of the next five years, and in the aggregate for the five years thereafter are:
| | | | |
Year ending 31 December: | | £m | |
2014 | | | 214 | |
2015 | | | 228 | |
2016 | | | 243 | |
2017 | | | 259 | |
2018 | | | 276 | |
Five years ending 2023 | | | 1,688 | |
The average duration of the defined benefit obligation at 31 December 2013 was 20.3 years (2012: 19.7 years) and comprised:
| | | | | | | | |
| | | 2013
years | | | 2012
years | |
Active members | | | 25.6 | | | | 25.2 | |
Deferred members | | | 25.5 | | | | 24.7 | |
Retired members | | | 14.0 | | | | 13.6 | |
| | |
| 278 | | Santander UK plc Annual Report 2013 |
Financial Statements
Notes to the Financial Statementscontinued
38. CONTINGENT LIABILITIES AND COMMITMENTS
| | | | | | | | | | | | | | | | |
| | | Group | | | Company | |
| | | 2013
£m | | | 2012
£m | | | 2013
£m | | | 2012
£m | |
Guarantees given to subsidiaries | | | — | | | | — | | | | 92,002 | | | | 109,888 | |
Guarantees given to third parties | | | 1,355 | | | | 857 | | | | 973 | | | | 338 | |
Formal standby facilities, credit lines and other commitments with original term to maturity of: | | | | | | | | | | | | | | | | |
- One year or less | | | 2,672 | | | | 4,211 | | | | 3,677 | | | | 2,740 | |
- More than one year | | | 26,008 | | | | 32,727 | | | | 7,431 | | | | 7,537 | |
Other contingent liabilities | | | 8 | | | | 8 | | | | 8 | | | | 8 | |
| | | | | | | | | | | | | | | | |
| | | 30,043 | | | | 37,803 | | | | 104,091 | | | | 120,511 | |
| | | | | | | | | | | | | | | | |
Where the items set out below can be reliably estimated, they are disclosed in the table above.
Guarantees given to subsidiaries
The Company has fully and unconditionally guaranteed the obligations of each of Abbey National Treasury Services plc, Abbey Stockbrokers Limited and Cater Allen Limited, all of which are wholly-owned subsidiaries of the Company that have been or will be incurred before 30 June 2015. In addition, the Company has fully and unconditionally guaranteed the deposit obligations of Abbey National International Limited, a wholly owned subsidiary of the Company that has been or will be incurred before 30 June 2015.
Capital Support Deed
The Company, Abbey National Treasury Services plc, and Cater Allen Limited, which are the three PRA-regulated entities within the Santander UK group, are party to a capital support deed dated 14 December 2012 (the “Capital Support Deed”) with certain other non-regulated subsidiaries of Santander UK plc. The parties to the Capital Support Deed constitute a core UK group for the purposes of section 10 of the Prudential Sourcebook for Banks, Building Societies and Investment Firms (“BIPRU”) of the PRA Handbook. Under section 10.8 of BIPRU, exposures of each of the three regulated entities to other members of the core UK group are exempt from large exposure limits that would otherwise apply. The purpose of the Capital Support Deed is to facilitate the prompt transfer of available capital resources from, or repayment of liabilities by, the non-regulated parties to any of the regulated parties in the event that one of the regulated parties has breached or is at risk of breaching its capital resources requirements or risk concentrations requirements. From January 1 2014, section 10.8 of BIPRU is replaced by Article 113 (6) of CRR.
Defined Liquidity Group liquidity facility
The Company, Abbey National Treasury Services plc, and Cater Allen Limited are party to a defined liquidity group liquidity facility agreement dated 28 May 2010 (the “DLG Facility Agreement”). The DLG Facility Agreement supports a defined liquidity group for the purposes of section 12 of BIPRU. Section 12.8 of BIPRU permits a member of a defined liquidity group to rely on the liquid resources of other members of the defined liquidity group to comply with the liquidity adequacy requirements under section 12 of BIPRU. Under the DLG Facility Agreement, each party agrees to lend, subject to certain conditions and limitations, its excess liquidity to each other party.
Guarantees given to third parties
Guarantees given to third parties consist primarily of letters of credit, bonds and guarantees granted by Commercial Banking as part of normal product facilities which are offered to customers.
Formal standby facilities, credit lines and other commitments
Standby facilities, credit lines and other commitments are granted by Retail Banking and Commercial Banking (including the Large Corporates business). Retail facilities comprise undrawn facilities granted on flexible mortgages, bank overdrafts and credit cards. On flexible mortgages, the credit limit is set at the point of granting the loan through property value and affordability assessments.
Subsequent assessments are made to ensure that the limit remains appropriate considering any change in the security value or the customer’s financial circumstances. On bank accounts and credit cards, the facilities are granted based on new business risk assessment and are reviewed more frequently based on internal, as well as, external data. The delinquency status of the account would result in the withdrawal of the facility. Corporate facilities comprise standby facilities which are subject to ongoing compliance with covenants and the provision of agreed security. Failure to comply with these terms can result in the withdrawal of the unutilised facility headroom.
Financial Services Compensation Scheme (‘FSCS’)
As described in Note 36, the Santander UK group participates in the UK’s national resolution scheme, the FSCS, and is thus subject to levies to fund the FSCS. The EU’s Recovery and Resolution Directive includes a requirement to pre-fund national resolution funds. The quantification and timing of any additional levy as a result of the pre-funding have yet to be determined and hence, although the Santander UK group’s share could be significant, no provision has yet been recognised.
Mortgage representations and warranties
In connection with the Santander UK group’s residential mortgage and auto loan securitisations and covered bond transactions described in Note 20, the Santander UK group makes various representations and warranties relating to the mortgage loans sold as of the date of such sale which cover, among other things:
| • | | The Santander UK group’s ownership of the loan. |
| • | | The validity of any legal charge securing the loan. |
| • | | The effectiveness of title insurance on any property securing the loan. |
| • | | The loan’s compliance with any applicable loan criteria established under the transaction structure. |
| • | | The loan’s compliance with applicable laws. |
| • | | Whether the mortgage property was occupied by the borrower. |
| • | | Whether the mortgage loan was originated in conformity with the originator’s lending criteria. |
| • | | The detailed data concerning the mortgage loan that was included on the mortgage loan schedule. |
| | |
| Santander UK plc Annual Report 2013 | | 279 |
Financial Statements
Notes to the Financial Statementscontinued
The specific representations and warranties in relation to the mortgage loans made by the Santander UK group depend on the nature of the transaction and the requirements of the transaction structure. The Santander UK group is principally a retail prime lender and has no appetite or product offering for any type of sub-prime business. The Santander UK group’s credit policy explicitly prohibits such lending.
Market conditions and credit-rating agency requirements may also affect representations and warranties the Santander UK group may agree to make upon the sale of the mortgage loans. Details of the outstanding balances under mortgage-backed securitisation transactions sponsored by the Santander UK group’s Structured Entities are described in Note 20. These outstanding transactions are collateralised by prime residential mortgage loans.
The Santander UK group’s representations and warranties regarding the sold mortgage loans are generally not subject to stated limits in amount or time of coverage. However, contractual liability may arise when the representations and warranties are breached. In the event of a breach of these representations and warranties, the Santander UK group may be required to either repurchase the mortgage loans (generally at unpaid principal balance plus accrued interest) with the identified defects or reduce its share in the trust holding the mortgage loans by an amount equivalent to the repurchase price. In the case of a repurchase, the Santander UK group may bear any subsequent credit loss on the mortgage loan. The Santander UK group manages and monitors its securitisation activities closely to minimise potential claims. To date, the Santander UK group has only identified a small number of non-compliant mortgage loans in its securitisation transactions.
Regulatory
The Santander UK group engages in discussion, and co-operates, with the FCA in their supervision of the Santander UK group, including reviews exercised under statutory powers, regarding its interaction with past and present customers and policyholders, both as part of the FCA’s general thematic work and in relation to specific products and services, including payment protection insurance. The position is monitored with particular reference to those reviews currently in progress and where greater clarity can now be ascertained as to the eventual outcome.
Taxation
The Santander UK group engages in discussion, and co-operates, with HM Revenue & Customs in their oversight of the Santander UK group’s tax matters. The Santander UK group adopted the UK’s Code of Practice on Taxation for Banks in 2010 and during 2013 re-confirmed its unconditional adoption of this code.
Other
As part of the sale of subsidiaries, and as is normal in such circumstances, the Santander UK group has given warranties and indemnities to the purchasers.
Obligations under stock borrowing and lending agreements
Obligations under stock borrowing and lending agreements represent contractual commitments to return stock borrowed. These obligations are offset by a contractual right to receive stock under other contractual agreements. See Note 41.
Other off-balance sheet commitments
The Santander UK group has commitments to lend at fixed interest rates which expose it to interest rate risk. For further information, see the Risk Management Report.
Operating lease commitments
| | | | | | | | | | | | | | | | |
| | | Group | | | Company | |
| | | 2013
£m | | | 2012
£m | | | 2013
£m | | | 2012
£m | |
Rental commitments under non-cancellable operating leases: | | | | | | | | | | | | | | | | |
- No later than 1 year | | | 80 | | | | 87 | | | | 69 | | | | 77 | |
- Later than 1 year but no later than 5 years | | | 260 | | | | 291 | | | | 222 | | | | 255 | |
- Later than 5 years | | | 223 | | | | 257 | | | | 179 | | | | 223 | |
| | | | | | | | | | | | | | | | |
| | | 563 | | | | 635 | | | | 470 | | | | 555 | |
| | | | | | | | | | | | | | | | |
Under the terms of these leases, the Santander UK group has the opportunity to extend its occupation of properties by a minimum of three years subject to 12 months’ notice and lease renewal being available from external landlords during the term of the lease. At expiry, the Santander UK group has the option to reacquire the freehold of certain properties. Santander UK group rental expense comprises:
| | | | | | | | | | | | |
| | | Group | |
| | | 2013
£m | | | 2012
£m | | | 2011
£m | |
In respect of minimum rentals | | | 61 | | | | 75 | | | | 77 | |
Less: sub-lease rentals | | | — | | | | — | | | | — | |
| | | | | | | | | | | | |
| | | 61 | | | | 75 | | | | 77 | |
| | | | | | | | | | | | |
Included in the above Santander UK group rental expense was £4m (2012: £6m) relating to contingent rent expense.
| | |
| 280 | | Santander UK plc Annual Report 2013 |
Financial Statements
Notes to the Financial Statementscontinued
39. SHARE CAPITAL AND OTHER EQUITY INSTRUMENTS
| | | | | | | | |
| | | Group and Company | |
| | | 2013
£m | | | 2012
£m | |
Ordinary share capital | | | 3,105 | | | | 3,105 | |
£300m fixed/floating rate non-cumulative callable preference shares | | | 300 | | | | 300 | |
£300m Step-up Callable Perpetual Reserve Capital Instruments | | | 297 | | | | 297 | |
£300m Step Up Callable Perpetual Preferred Securities | | | 7 | | | | 297 | |
| | | | | | | | |
| | | 3,709 | | | | 3,999 | |
| | | | | | | | |
a) Share capital
| | | | | | | | | | | | | | | | | | | | | | | | | | | | |
| | | Group and Company | |
Issued and fully paid share capital | | Ordinary shares
of £0.10 each | | | £300m Preference shares
of £1 each | | | £325m Preference shares
of £1 each | | | Total
£m | |
| | | No. | | | £m | | | No. | | | £m | | | No. | | | £m | | | £m | |
At 1 January 2012, 31 December 2012 and 31 December 2013 | | | 31,051,768,866 | | | | 3,105 | | | | 300,002 | | | | 300 | | | | 325,000,000 | | | | 325 | | | | 3,730 | |
The Company’s £325m sterling preference shares are classified as Subordinated Liabilities as described in Note 34.
| | | | | | | | |
| | | Group and Company | |
Share premium | | 2013
£m | | | 2012
£m | |
At 1 January and 31 December | | | 5,620 | | | | 5,620 | |
The Company has one class of ordinary shares which carries no right to fixed income.
£300m Fixed/Floating Rate Non-Cumulative Callable Preference Shares
The preference shares entitle the holders to a fixed non-cumulative dividend, at the discretion of the Company, of 6.22% per annum payable annually from 24 May 2010 until 24 May 2019 and quarterly thereafter at a rate of 1.13% per annum above three month sterling LIBOR. The preference shares are redeemable only at the option of the Company on 24 May 2019 or on each quarterly dividend payment date thereafter. No such redemption may be made without the consent of the PRA.
b) Other equity instruments
£300m Step-up Callable Perpetual Reserve Capital Instruments
The £300 million Step-up Callable Perpetual Reserve Capital Instruments were issued in 2001 by the Company. Reserve Capital Instruments are redeemable by the Company on 14 February 2026 or on any coupon payment date thereafter, subject to the prior approval of the PRA and provided that the auditors have reported to the trustee within the previous six months that the solvency condition is met. The Reserve Capital Instruments bear interest at a rate of 7.037% per annum, payable annually in arrears, from 14 February 2001 to 14 February 2026. Thereafter, the reserve capital instruments will bear interest at a rate, reset every five years, of 3.75% per annum above the gross redemption yield on the UK five-year benchmark gilt rate. Interest payments may be deferred by the Company.
The Reserve Capital Instruments are not redeemable at the option of the holders and the holders do not have any rights against other Santander UK group companies. Upon the occurrence of certain tax or regulatory events, the Reserve Capital Instruments may be exchanged, their terms varied, or redeemed. Where interest payments have been deferred, the Company may not declare or pay dividends on or redeem or repurchase any junior securities until it next makes a scheduled payment on the Reserve Capital Instruments and Tier One Preferred Income Capital Securities.
The Reserve Capital Instruments are unsecured securities of the Company and are subordinated to the claims of unsubordinated creditors and subordinated creditors holding loan capital of the Company. Upon the winding up of the Company, holders of Reserve Capital Instruments will rank pari passu with the holders of the most senior class or classes of preference shares (if any) of the Company then in issue and in priority to all other Company shareholders.
£300m Step-up Callable Perpetual Preferred Securities
The £300m Step Up Callable Perpetual Preferred Securities are perpetual securities and pay a coupon on 22 March each year. At each payment date, the Company can decide whether to declare or defer the coupon indefinitely. If a coupon is deferred then the Company may not pay a dividend on any share until it next makes a coupon payment (including payment of any deferred coupons). The Company can be obliged to make payment in the event of winding up. The coupon is 5.827% per annum until 22 March 2016. Thereafter the coupon steps up to a rate, reset every five years, of 2.13% per annum above the gross redemption yield on a UK Government Treasury Security. The Perpetual Preferred securities are redeemable at the option of the Company on 22 March 2016 or on each payment date thereafter. No such redemption may be made without the consent of the PRA.
In August 2013, as part of a capital management exercise, 98% of the Perpetual Preferred securities were purchased by the Company pursuant to a tender offer. There was no significant profit and loss on these repurchases.
| | |
| Santander UK plc Annual Report 2013 | | 281 |
Financial Statements
Notes to the Financial Statementscontinued
40. CASH FLOW STATEMENT
a) Reconciliation of profit after tax to net cash inflow/ (outflow) from operating activities:
| | | | | | | | | | | | | | | | | | | | | | | | |
| | | Group | | | Company | |
| | | 2013
£m | | | 2012
£m | | | 2011
£m | | | 2013
£m | | | 2012
£m | | | 2011
£m | |
Profit for the year | | | 913 | | | | 939 | | | | 903 | | | | 248 | | | | (760 | ) | | | 3,153 | |
Non-cash items included in net profit: | | | | | | | | | | | | | | | | | | | | | | | | |
Depreciation and amortisation | | | 248 | | | | 241 | | | | 438 | | | | 205 | | | | 187 | | | | 307 | |
Change in prepayments and accrued income | | | 2 | | | | (23 | ) | | | (24 | ) | | | 130 | | | | (27 | ) | | | 85 | |
Change in accruals and deferred income | | | (190 | ) | | | (479 | ) | | | (250 | ) | | | 39 | | | | (604 | ) | | | (648 | ) |
Amortisation of premiums/(discounts) on debt securities | | | 55 | | | | 18 | | | | — | | | | 10 | | | | — | | | | — | |
Provisions for liabilities and charges | | | 215 | | | | 434 | | | | 907 | | | | 87 | | | | 413 | | | | 886 | |
Impairment losses | | | 576 | | | | 1,053 | | | | 561 | | | | 2,413 | | | | 860 | | | | 227 | |
Corporation tax charge | | | 218 | | | | 270 | | | | 345 | | | | 65 | | | | 337 | | | | 179 | |
Other non-cash items | | | 313 | | | | (506 | ) | | | 1,691 | | | | (356 | ) | | | (744 | ) | | | 724 | |
| | | | | | | | | | | | | | | | | | | | | | | | |
| | | 2,350 | | | | 1,947 | | | | 4,571 | | | | 2,841 | | | | (338 | ) | | | 4,913 | |
Changes in operating assets and liabilities: | | | | | | | | | | | | | | | | | | | | | | | | |
Net change in cash and balances held at central banks | | | (112 | ) | | | (8 | ) | | | 3 | | | | (98 | ) | | | (1 | ) | | | 7 | |
Net change in trading assets | | | (251 | ) | | | (2,789 | ) | | | 11,021 | | | | — | | | | — | | | | — | |
Net change in derivative assets | | | 10,097 | | | | 634 | | | | (6,403 | ) | | | 2,438 | | | | 1,102 | | | | (3,007 | ) |
Net change in financial assets designated at fair value | | | 1,064 | | | | 1,194 | | | | 1,770 | | | | 43 | | | | 1 | | | | 5,081 | |
Net change in debt securities, treasury bills and other eligible bills | | | — | | | | — | | | | 7 | | | | — | | | | — | | | | 7 | |
Net change in loans and advances to banks & customers | | | 5,681 | | | | 8,580 | | | | (5,071 | ) | | | 19,871 | | | | 854 | | | | 3,119 | |
Net change in other assets | | | 1,135 | | | | 752 | | | | 892 | | | | 63 | | | | 517 | | | | 505 | |
Net change in deposits by banks and customers | | | (3,002 | ) | | | (484 | ) | | | (327 | ) | | | (3,399 | ) | | | 11,222 | | | | (29,040 | ) |
Net change in derivative liabilities | | | (9,998 | ) | | | (319 | ) | | | 6,775 | | | | (248 | ) | | | 845 | | | | 108 | |
Net change in trading liabilities | | | (21 | ) | | | (4,629 | ) | | | (17,068 | ) | | | — | | | | — | | | | — | |
Net change in financial liabilities designated at fair value | | | (38 | ) | | | (21 | ) | | | (187 | ) | | | — | | | | — | | | | (3 | ) |
Net change in debt securities in issue | | | (1,416 | ) | | | 2,332 | | | | (1,223 | ) | | | (3 | ) | | | (1 | ) | | | 14 | |
Net change in other liabilities | | | (1,321 | ) | | | (973 | ) | | | 15 | | | | (1,226 | ) | | | (1,064 | ) | | | (132 | ) |
Effects of exchange rate differences | | | 702 | | | | (1,961 | ) | | | (1,662 | ) | | | (182 | ) | | | (530 | ) | | | (47 | ) |
| | | | | | | | | | | | | | | | | | | | | | | | |
Net cash flow from/(used in) operating activities before tax | | | 4,870 | | | | 4,255 | | | | (6,887 | ) | | | 20,100 | | | | 12,607 | | | | (18,475 | ) |
Corporation tax paid | | | (118 | ) | | | (231 | ) | | | (165 | ) | | | (87 | ) | | | (149 | ) | | | (121 | ) |
| | | | | | | | | | | | | | | | | | | | | | | | |
Net cash flow from/(used in) operating activities | | | 4,752 | | | | 4,024 | | | | (7,052 | ) | | | 20,013 | | | | 12,458 | | | | (18,596 | ) |
| | | | | | | | | | | | | | | | | | | | | | | | |
b) Analysis of the balances of cash and cash equivalents in the balance sheet
| | | | | | | | | | | | | | | | |
| | | Group | | | Company | |
| | | 2013
£m | | | 2012
£m | | | 2013
£m | | | 2012
£m | |
Cash and balances at central banks | | | 26,374 | | | | 29,282 | | | | 21,399 | | | | 28,883 | |
Less: regulatory minimum cash balances (See Note 13) | | | (315 | ) | | | (203 | ) | | | (277 | ) | | | (179 | ) |
| | | | | | | | | | | | | | | | |
| | | 26,059 | | | | 29,079 | | | | 21,122 | | | | 28,704 | |
Net trading other cash equivalents | | | 9,853 | | | | 10,984 | | | | — | | | | — | |
Net non-trading other cash equivalents | | | 1,267 | | | | 1,576 | | | | 49,795 | | | | 25,578 | |
| | | | | | | | | | | | | | | | |
Cash and cash equivalents | | | 37,179 | | | | 41,639 | | | | 70,917 | | | | 54,282 | |
| | | | | | | | | | | | | | | | |
c) Sale of subsidiaries, associated undertakings and businesses
In the first half of 2013, the Company sold its co-brand credit cards business for cash consideration of £660m. The net assets disposed of consisted of loans to customers of £670m.
d) Discontinued operations
The co-brand credit cards business which was sold in the first half of 2013 qualifies as discontinued operations. In 2013, the net cash flows attributable to the operating, investing and financing activities of discontinued operations were a £5m outflow (2012: £115m inflow, 2011: £130m inflow), £nil (2012: £nil, 2011: £nil), and £nil (2012: £nil, 2011: £nil), respectively.
| | |
| 282 | | Santander UK plc Annual Report 2013 |
Financial Statements
Notes to the Financial Statementscontinued
41. ASSETS CHARGED AS SECURITY FOR LIABILITIES AND COLLATERAL ACCEPTED AS SECURITY FOR ASSETS
The following transactions are conducted under terms that are usual and customary to collateralised transactions, including, where relevant, standard securities lending and repurchase agreements.
a) Financial assets pledged to secure liabilities
The financial assets below are analysed between those assets accounted for on balance sheet and off-balance sheet in accordance with IFRS.
| | | | | | | | |
| | | Group | |
| | | 2013
£m | | | 2012
£m | |
On balance sheet: | | | | | | | | |
Treasury bills and other eligible securities | | | 6,342 | | | | 2,924 | |
Cash | | | 5,236 | | | | 2,863 | |
Loans and advances to customers - securitisations and covered bonds (See Note 20) | | | 58,788 | | | | 82,039 | |
Loans and advances to customers | | | 172 | | | | 1,722 | |
Debt securities | | | 1,123 | | | | 556 | |
Equity securities | | | 608 | | | | 309 | |
| | | | | | | | |
| | | 72,269 | | | | 90,413 | |
| | | | | | | | |
Off balance sheet: | | | | | | | | |
Treasury bills and other eligible securities | | | 11,171 | | | | 17,666 | |
Debt securities | | | 4,802 | | | | 662 | |
Equity securities | | | 181 | | | | 105 | |
| | | | | | | | |
| | | 16,154 | | | | 18,433 | |
| | | | | | | | |
The Santander UK group provides assets as collateral in the following areas of the business.
Sale and repurchase agreements
Subsidiaries of the Company enter into sale and repurchase agreements and similar transactions of equity and debt securities, which are accounted for as secured borrowings. Upon entering into such transactions, the subsidiaries provide collateral equal to 100%-131% of the borrowed amount. The carrying amount of assets that were so provided at 31 December 2013 was £18,843m (2012: £20,306m), of which £5,467m (2012: £8,082m) were classified within “loans and advances to customers – securitisations and covered bonds” in the table above.
Securitisations and covered bonds
As described in Note 20, the Company and certain of its subsidiaries enter into securitisation transactions whereby portfolios of residential mortgage loans and other loans are purchased by or assigned to structured securitisation companies, and have been funded through the issue of mortgage-backed securities and other asset-backed securities. Holders of the securities are only entitled to obtain payments of principal and interest to the extent that the resources of the securitisation companies are sufficient to support such payments and the holders of the securities have agreed in writing not to seek recourse in any other form. At 31 December 2013, £37,573m (2012: £46,916m) of loans were so assigned by the Santander UK group.
A subsidiary of the Company has also established a covered bond programme, whereby securities are issued to investors and are secured by a pool of ring-fenced residential mortgages. At 31 December 2013, the pool of ring-fenced residential mortgages for the covered bond programme was £21,215m (2012: £35,123m).
At 31 December 2013, total notes issued externally from secured programmes (securitisations and covered bonds) increased to £36,307m (2012: £43,322m), reflecting gross issuance of £3.1bn (2012: £10.9bn) in 2013. At 31 December 2013, a total of £14,599m (2012: £17,634m) of notes issued under securitisation and covered bond programmes had also been retained internally, a proportion of which had been used as collateral for raising funds via third party bilateral secured funding transactions, which totalled £7.6bn at 31 December 2013 (2012: £11.0bn), or for creating collateral which could in the future be used for liquidity purposes.
Stock borrowing and lending agreements
Asset balances under stock borrowing and lending agreements represent stock lent by the Santander UK group. These balances amounted to £11,025m at 31 December 2013 (2012: £11,723m) and are offset by contractual commitments to return stock borrowed or cash received.
Derivatives business
In addition to the arrangements described above, collateral is also provided in the normal course of derivative business to counterparties. At 31 December 2013, £5,236m (2012: £2,863m) of such collateral in the form of cash had been provided by the Santander UK group and is included in the table above.
| | |
| Santander UK plc Annual Report 2013 | | 283 |
Financial Statements
Notes to the Financial Statementscontinued
b) Collateral held as security for assets
The collateral held as security for assets below are analysed between those liabilities accounted for on the balance sheet and off-balance sheet in accordance with IFRS.
| | | | | | | | |
| | | Group | |
| | | 2013
£m | | | 2012
£m | |
On balance sheet: | | | | | | | | |
Trading liabilities | | | 3,512 | | | | 3,652 | |
| | | | | | | | |
| | | 3,512 | | | | 3,652 | |
Off balance sheet: | | | | | | | | |
Trading liabilities | | | 19,907 | | | | 24,862 | |
Deposits by banks | | | 49 | | | | 233 | |
| | | | | | | | |
| | | 19,956 | | | | 25,095 | |
| | | | | | | | |
Purchase and resale agreements
Subsidiaries of the Company also enter into purchase and resale agreements and similar transactions of equity and debt securities, which are accounted for as collateralised loans. Upon entering into such transactions, the subsidiaries receive collateral equal to 100%-105% of the loan amount. The level of collateral held is monitored daily and if required, further calls are made to ensure the market values of collateral remains at least equal to the loan balance. The subsidiaries are permitted to sell or repledge the collateral held in the absence of default. At 31 December 2013, the fair value of such collateral received was £16,727m (2012: £14,788m). Of the collateral received, almost all was sold or repledged. The subsidiaries have an obligation to return collateral that they have sold or pledged.
Stock borrowing and lending agreements
Obligations under stock borrowing and lending agreements represent contractual commitments to return stock borrowed. These obligations totalled £3,229m at 31 December 2013 (2012: £10,307m) and are offset by a contractual right to receive stock lent by the Santander UK group.
Derivatives business
In addition to the arrangements described above, collateral is also received from counterparties in the normal course of derivative business. At 31 December 2013, £3,512m (2012: £3,652m) of such collateral in the form of cash had been received by the Santander UK group and is included in the table above.
Lending activities
In addition to the above collateral held as security for assets, the Santander UK group may obtain a charge over a customer’s property in connection with its lending activities. Details of these arrangements are set out in the “Credit Risk” section of the Risk Management Report.
42. SHARE-BASED COMPENSATION
The Santander UK group operates share schemes and arrangements for eligible employees. The main current schemes are the Sharesave Schemes, the Long-Term Incentive Plan and the Deferred Shares Bonus Plan. The Santander UK group’s other current arrangement and scheme, respectively, are free shares awarded to eligible employees and partnership shares. In addition, a small number of arrangements remain outstanding under the closed Executive Share Option scheme and the closed Alliance & Leicester Share Incentive Plan. All the share options and awards relate to shares in Banco Santander, S.A.
The amount charged to the income statement in respect of share-based payment transactions is set out in Note 6. The total carrying amount at the end of the year for liabilities arising from share-based payment transactions was £5.5m (2012: £1m, 2011: £0.2m), none of which had vested at 31 December 2013 (2012: nil). Cash received from the exercise of share options was £nil (2012: £nil, 2011: £0.2m).
The main schemes are:
Sharesave Schemes
The Santander UK group launched its sixth HM Revenue & Customs approved Sharesave Scheme under Banco Santander, S.A. ownership in September 2013. The first five Sharesave Schemes were launched in September 2008, 2009, 2010, 2011 and 2012 under similar terms as the 2013 Scheme. Under these schemes, eligible employees may enter into contracts to save between £5 and £250 per month. At the expiry of a fixed term of three or five years after the grant date, the employees have the option to use these savings to acquire shares in Banco Santander, S.A. at a discount, calculated in accordance with the rules of the scheme. The discount is currently 20% of the average middle market quoted price of Banco Santander, S.A. shares over the first three dealing days prior to invitation. The vesting of awards under the scheme depends on continued employment with the Banco Santander, S.A. group. Participants in the scheme have six months from the date of vest in which the option can be exercised.
Prior to the Company’s acquisition by Banco Santander, S.A. in 2004, the Company operated similar Sharesave schemes. All the remaining options granted under those schemes were exercised or forfeited during 2011. The options previously outstanding under those Sharesave schemes were included in the disclosures below.
| | |
| 284 | | Santander UK plc Annual Report 2013 |
Financial Statements
Notes to the Financial Statementscontinued
The fair value of each Sharesave option for 2013, 2012 and 2011 has been estimated at the date of acquisition or grant using the Black Scholes model with the following assumptions:
| | | | | | | | | | | | |
| | | 2013 | | | 2012 | | | 2011 | |
Risk free interest rate | | | 1.2%-1.7 | % | | | 0.73%-1.04 | % | | | 1.41%-1.64 | % |
Dividend growth | | | 16%-19 | % | | | 16%-17 | % | | | 14%-16 | % |
Expected volatility of underlying shares based upon implied volatility to the maturity date of each scheme | | | 32.15%-32.32 | % | | | 38.62%-39.41 | % | | | 41.03%-41.9 | % |
Expected lives of options granted under 3 and 5 year schemes | | | 3 & 5 years | | | | 3 & 5 years | | | | 3 & 5 years | |
With the exception of vesting conditions that include terms related to market conditions, vesting conditions included in the terms of the grant are not taken into account in estimating fair value. Non-market vesting conditions are taken into account by adjusting the number of shares or share options included in the measurement of the cost of the employee service so that ultimately, the amount recognised in the income statement reflects the number of vested shares or share options.
Where vesting conditions are related to market conditions, the charges for the services received are recognised regardless of whether or not the market related vesting conditions are met, provided that the non-market vesting conditions are met. Share price volatility has been based upon the range of implied volatility for the Banco Santander, S.A. shares at the strikes and tenors in which the majority of the sensitivities lie.
The following table summarises the movement in the number of share options during the year, together with the changes in weighted average exercise price over the same period.
| | | | | | | | |
| | | Number of options
‘000s | | | Weighted average
exercise price
£ | |
2013 | | | | | | | | |
Options outstanding at the start of the year | | | 14,802 | | | | 4.23 | |
Options granted during the year | | | 4,340 | | | | 3.69 | |
Options exercised during the year | | | (78 | ) | | | 4.02 | |
Options forfeited during the year | | | (3,169 | ) | | | 4.72 | |
| | | | | | | | |
Options outstanding at the end of the year | | | 15,895 | | | | 3.98 | |
| | | | | | | | |
Options exercisable at the end of the year | | | 609 | | | | 7.22 | |
| | | | | | | | |
2012 | | | | | | | | |
Options outstanding at the start of the year | | | 11,261 | | | | 5.37 | |
Options granted during the year | | | 10,012 | | | | 3.66 | |
Options exercised during the year | | | (3 | ) | | | 4.56 | |
Options forfeited during the year | | | (6,468 | ) | | | 5.34 | |
| | | | | | | | |
Options outstanding at the end of the year | | | 14,802 | | | | 4.23 | |
| | | | | | | | |
Options exercisable at the end of the year | | | 592 | | | | 7.22 | |
| | | | | | | | |
2011 | | | | | | | | |
Options outstanding at the start of the year | | | 8,927 | | | | 7.09 | |
Options granted during the year | | | 7,725 | | | | 4.46 | |
Options exercised during the year | | | (43 | ) | | | 4.09 | |
Options forfeited during the year | | | (5,348 | ) | | | 6.92 | |
| | | | | | | | |
Options outstanding at the end of the year | | | 11,261 | | | | 5.37 | |
| | | | | | | | |
Options exercisable at the end of the year | | | 1,205 | | | | 7.69 | |
| | | | | | | | |
The weighted average grant-date fair value of options granted under the Employee Sharesave scheme during the year was £0.39 (2012: £0.42, 2011: £0.79). The weighted average share price at the date the share options were exercised was £5.17 (2012: £4.84, 2011: £7.36).
The following table summarises the range of exercise prices and weighted average remaining contractual life of the options outstanding at 31 December 2013 and 2012.
| | | | | | | | |
| | | Options outstanding | |
Range of exercise prices | | Weighted average remaining
contractual life
years | | | Weighted average
exercise price
£ | |
2013 | | | | | | | | |
Between £3 and £4 | | | 3 | | | | 3.67 | |
Between £4 and £5 | | | 2 | | | | 4.46 | |
Between £6 and £7 | | | 1 | | | | 6.46 | |
Between £7 and £8 | | | 1 | | | | 7.56 | |
2012 | | | | | | | | |
Between £3 and £4 | | | 4 | | | | 3.66 | |
Between £4 and £5 | | | 3 | | | | 4.46 | |
Between £6 and £7 | | | 2 | | | | 6.46 | |
Between £7 and £8 | | | 1 | | | | 7.41 | |
| | |
| Santander UK plc Annual Report 2013 | | 285 |
Financial Statements
Notes to the Financial Statementscontinued
Long-Term Incentive Plan
No new awards were granted under the Santander Long-Term Incentive Plan in 2013 or 2012. Under the Santander Long-Term Incentive Plans granted on 1 July 2011, 1 July 2010, 1 July 2009, 21 June 2008 and 31 July 2007, certain Executive Directors, Key Management Personnel (as defined in Note 43) and other nominated individuals were granted conditional awards of shares in Banco Santander, S.A.
The deferred share-based variable remuneration is implemented through a multiannual incentive plan, which is payable in shares of Banco Santander, S.A. This plan involves successive three-year cycles of share deliveries to the beneficiaries, so that each year one cycle will begin and, from 2009 onwards, another cycle will end. The aim was to establish an appropriate sequence between the end of the incentive programme linked to the previous plan and the successive cycles of this plan.
The first two cycles commenced in July 2007, the first cycle having a duration of two years, known as Incentivos Largo Plazo (‘ILP’) 09 and the second cycle having a standard three year term (ILP10). ILP09 and ILP10 vested in July 2009 and July 2010, respectively. In June 2008, June 2009, July 2010 and July 2011 the third, fourth, fifth and sixth cycles of the performance share plan (ILP11, ILP12, ILP13 and ILP14 respectively), all of which were to run for three years, were approved.
For each cycle, a maximum number of shares was established for each beneficiary who remains in the Santander UK group’s employment for the duration of the plan. The targets, which, if met, will determine the number of shares to be delivered with respect to the cycles approved until June 2008, were defined by comparing the Banco Santander, S.A. group’s performance with that of a benchmark group of financial institutions and were linked to two parameters, namely Banco Santander, S.A. TSR and growth in Banco Santander, S.A. EPS. The targets, which, if met, will determine the number of shares to be delivered under Plan ILP12, ILP13 and ILP14 are defined by comparing the Banco Santander, S.A. group’s performance with that of a benchmark group of financial institutions and are linked to only one parameter, namely Banco Santander, S.A. TSR.
The ultimate number of shares to be delivered will be determined in each of the cycles by the degree of achievement of the targets on the third anniversary of commencement of each cycle (with the exception of the first cycle, for which the second anniversary was considered), and the shares will be delivered within a maximum period of seven months from the end of the cycle. At the end of the cycles of Plans ILP10 and ILP11, the TSR and the EPS growth will be calculated for Banco Santander, S.A. and each of the benchmark entities and the results will be ranked from first to last. Each of the two criteria (TSR and EPS growth) will be weighted at 50% in the calculation of the percentage of shares to be delivered, based on the following scale and in accordance with Banco Santander, S.A.’s relative position among the group of benchmark financial institutions:
| | | | | | | | | | |
Banco Santander, S.A.’s place in the TSR ranking | | Percentage of maximum
shares to be delivered
% | | | Banco Santander, S.A.’s place in the EPS
growth ranking | | Percentage of maximum shares to be
delivered
% | |
1st to 6th | | | 50 | | | 1st to 6th | | | 50 | |
7th | | | 43 | | | 7th | | | 43 | |
8th | | | 36 | | | 8th | | | 36 | |
9th | | | 29 | | | 9th | | | 29 | |
10th | | | 22 | | | 10th | | | 22 | |
11th | | | 15 | | | 11th | | | 15 | |
12th and below | | | — | | | 12th and below | | | — | |
In the case of Plan ILP13, the TSR criterion will determine the percentage of shares to be delivered, based on the following scale and in accordance with Banco Santander, S.A.’s relative position among the group of benchmark financial institutions:
| | | | |
Banco Santander, S.A.’s place in the TSR ranking | | Percentage of maximum shares to be delivered
% | |
1st to 5th | | | 100.0 | |
6th | | | 82.5 | |
7th | | | 65.0 | |
8th | | | 47.5 | |
9th | | | 30.0 | |
10th and below | | | — | |
In the case of Plan ILP14 the TSR criterion will determine the percentage of shares to be delivered, based on the following scale and in accordance with Banco Santander, S.A.’s relative position among the group of benchmark financial institutions:
| | | | |
Banco Santander, S.A.’s place in the TSR ranking | | Percentage of maximum shares to be delivered
% | |
1st to 5th | | | 100 | |
6th | | | 86 | |
7th | | | 72 | |
8th | | | 58 | |
9th | | | 44 | |
10th | | | 30 | |
11th and below | | | — | |
| | |
| 286 | | Santander UK plc Annual Report 2013 |
Financial Statements
Notes to the Financial Statementscontinued
Any benchmark group entity that is acquired by another company, or whose shares cease trading or that ceases to exist will be excluded from the benchmark group. In an event of this or any similar nature, the comparison with the benchmark group will be performed in such a way that, for each of the measures considered (TSR and EPS growth, as appropriate), the maximum percentage of shares will be delivered if Banco Santander, S.A. ranks within the first quartile (including the 25th percentile) of the benchmark group; no shares will be delivered if Banco Santander, S.A. ranks below the median (50th percentile); 30% of the maximum amount of shares will be delivered if Banco Santander, S.A. is placed at the median. The linear interpolation method will be used for calculating the corresponding percentage for positions between the median and the first quartile.
Plans ILP10, ILP11 ILP12 and ILP13 matured in 2010, 2011, 2012 and 2013, respectively. As established in the plans, the number of shares received by each beneficiary was determined by the degree of achievement of the targets to which each plan was tied and, since they fell short of the maximum number established, the unearned options were cancelled.
The fair value of each award under the Long-Term Incentive Plans has been estimated at the date of acquisition or grant using the same methodology used to value the Sharesave options. The expected lives of awards granted have been estimated as three years.
The following table summarises the movement in the number of conditional share awards during 2013 and 2012.
| | | | |
Long Term Incentive Plan | | Number of awards
000s | |
2013 | | | | |
Conditional awards outstanding at the beginning of the year | | | 3,628 | |
Conditional awards exercised during the year | | | — | |
Conditional awards forfeited or cancelled during the year | | | (2,092 | ) |
| | | | |
Conditional awards outstanding at the end of the year | | | 1,536 | |
| | | | |
2012 | | | | |
Conditional awards outstanding at the beginning of the year | | | 5,627 | |
Conditional awards exercised during the year | | | (525 | ) |
Conditional awards forfeited or cancelled during the year | | | (1,474 | ) |
| | | | |
Conditional awards outstanding at the end of the year | | | 3,628 | |
| | | | |
See Note 44 for details of conditional share awards made to certain Executive Directors, Other Key Management Personnel and other nominated individuals under the Long-Term Incentive Plan.
The weighted average grant-date fair value of conditional share awards granted during the year was £nil (2012: £nil). At 31 December 2013, the weighted average remaining contractual life was less than one year (2012: one year).
Deferred Shares Bonus Plan
Deferred incentive awards are designed to align employee performance with shareholder value and encourage increased retention of senior employees. During 2011, in compliance with the FCA Code, Santander UK introduced the First Cycle of the Deferred Bonus Share Plan which includes Conditional Awarding. Employees who are awarded an annual performance incentive over a threshold level receive part of the incentive as a deferred award. Any deferred awards, including those in Banco Santander, S.A. shares, are dependent on future service. Deferral of the award is over a three year period, with delivery taking place on or around the anniversary of the initial incentive. For Code Staff, shares are subject to an additional one year retention period from the point of delivery.
Code Staff are required to defer either 40% or 60% of any incentive award (40% for annual performance incentives of no more than £500,000, 60% for incentives above this amount). Non-Code Staff employees are subject to a graduated system which ensures that those who receive higher value annual performance incentives are required to defer a greater proportion of the annual performance incentive award. Certain employees have a lower threshold, meaning that a higher portion of variable pay is subject to deferral.
Vesting of both deferred incentive awards and long-term incentive awards is subject to claw back in the event of deficient performance and prudent financial control provisions in accordance with the FCA Code.
Other arrangements and schemes
Partnership Shares
The Santander UK group also operates a Partnership Shares scheme for eligible employees under the SIP umbrella. Participants can elect to invest up to £1,500 per tax year from pre-tax salary to purchase Banco Santander, S.A. shares. Shares are held in trust for the participants. There are no vesting conditions attached to these shares, and no restrictions as to when the shares can be removed from the trust. However, if a participant chooses to sell the shares before the end of five years, they will be liable for the taxable benefit received when the shares are taken out of the trust. The shares can be released from trust after five years free of income tax and national insurance contributions. 880,679 shares were outstanding at 31 December 2013 (2012: 658,028 shares).
Closed schemes
At 31 December 2013, 12,000 options (2012: 12,000) remained outstanding and exercisable under the closed Executive Share Option Scheme with a weighted average exercise price of £4.54 (2012: £4.54), and 77,058 shares (2012: 91,438) remained outstanding under the closed Alliance & Leicester SIP partnership share scheme.
| | |
| Santander UK plc Annual Report 2013 | | 287 |
Financial Statements
Notes to the Financial Statementscontinued
43. DIRECTORS’ EMOLUMENTS AND INTERESTS
Ex gratia pensions paid to former Directors of the Company in 2013, which have been provided for previously, amounted to £14,893 (2012: £14,211, 2011: £14,211). In 1992, the Board decided not to award any new such ex gratia pensions.
There were no loans, quasi loans and credit transactions entered into or agreed by the Company or its subsidiaries with persons who are or were Directors, Other Key Management Personnel and each of their connected persons during the year except as described below:
| | | | | | | | |
| | | Number of
Persons
No. | | | Aggregate amount
outstanding
£000 | |
Other Key Management Personnel* - loans | | | | | | | | |
2013 | | | 14 | | | | 3,497 | |
2012 | | | 16 | | | | 3,833 | |
| * | Other Key Management Personnel are defined as the Board and the Executive Committee of the Company who served during the year. The above excludes any overdraft facilities provided to Directors, Other Key Management Personnel and their connected persons in the ordinary course of business. |
Secured and unsecured loans are made to Directors, Other Key Management Personnel and their connected persons in the ordinary course of business, with terms prevailing for comparable transactions and on the same terms and conditions as applicable to other employees within the Santander UK group. Such loans do not involve more than the normal risk of collectability or present any unfavourable features.
44. RELATED PARTY DISCLOSURES
a) Transactions with Directors, Other Key Management Personnel and each of their connected persons
Directors, Other Key Management Personnel and their connected persons have undertaken the following transactions with the Santander UK group in the course of normal banking and life assurance business.
| | | | | | | | |
2013 | | Number of directors
and Other Key Management
Personnel(1)
No. | | | Amounts in respect of directors,
Other Key Management Personnel(1)
and their connected persons
£000 | |
Secured loans, unsecured loans and overdrafts | | | | | | | | |
At 1 January | | | 16 | | | | 3,833 | |
Net movements in the year | | | (2 | ) | | | (336 | ) |
| | | | | | | | |
At 31 December | | | 14 | | | | 3,497 | |
| | | | | | | | |
Deposit, bank and instant access accounts and investments | | | | | | | | |
At 1 January | | | 19 | | | | 6,911 | |
Net movements in the year | | | 1 | | | | (491 | ) |
| | | | | | | | |
At 31 December | | | 20 | | | | 6,420 | |
| | | | | | | | |
| | |
2012 | | | | | | |
Secured loans, unsecured loans and overdrafts | | | | | | | | |
At 1 January | | | 10 | | | | 3,889 | |
Net movements in the year | | | 6 | | | | (56 | ) |
| | | | | | | | |
At 31 December | | | 16 | | | | 3,833 | |
| | | | | | | | |
Deposit, bank and instant access accounts and investments | | | | | | | | |
At 1 January | | | 19 | | | | 7,716 | |
Net movements in the year | | | — | | | | (805 | ) |
| | | | | | | | |
At 31 December | | | 19 | | | | 6,911 | |
| | | | | | | | |
| (1) | Other Key Management Personnel are defined as the Board and the Executive Committee of the Company who served during the year. |
During the year ended 31 December 2013, one Director undertook sharedealing transactions through the Santander UK group’s execution-only stockbroker (2012: one Director) with an aggregate net value of £701,863 (2012: £194,279). Any transactions were on normal business terms and standard commission rates were payable.
Secured and unsecured loans are made to Directors, Other Key Management Personnel and their connected persons, in the ordinary course of business, with terms prevailing for comparable transactions and on the same terms and conditions as applicable to other employees within the Santander UK group. Such loans do not involve more than the normal risk of collectability or present any unfavourable features. Amounts deposited by Directors, Other Key Management Personnel and their connected persons earn interest at the same rates as those offered to the market or on the same terms and conditions applicable to other employees within the Santander UK group. Investments are entered into by Directors, Other Key Management Personnel and their connected persons on normal market terms and conditions, or on the same terms and conditions as applicable to other employees within the Santander UK group.
| | |
| 288 | | Santander UK plc Annual Report 2013 |
Financial Statements
Notes to the Financial Statementscontinued
b) Remuneration of Key Management Personnel
The remuneration of the Directors, and Other Key Management Personnel of the Santander UK group, is set out in aggregate for each of the categories specified in IAS 24 Related Party Disclosures. Further information about the aggregate remuneration of the Directors is provided in the ‘Directors’ Remuneration’ table in the Directors’ Report on page 191.
| | | | | | | | | | | | |
Key management compensation | | 2013
£ | | | 2012
£ | | | 2011
£ | |
Short-term employee benefits | | | 28,158,177 | | | | 26,874,911 | | | | 19,208,174 | |
Post employment benefits | | | 402,500 | | | | — | | | | 210,910 | |
Other long-term benefits | | | — | | | | — | | | | — | |
Termination benefits | | | — | | | | — | | | | — | |
Share-based payments | | | 66,411 | | | | 220,904 | | | | 619,888 | |
| | | | | | | | | | | | |
| | | 28,627,088 | | | | 27,095,815 | | | | 20,038,972 | |
| | | | | | | | | | | | |
c) Santander Long-Term Incentive Plan
In 2013, no Executive Directors (2012: none, 2011: none) or Other Key Management Personnel (2012: none, 2011: none) were granted conditional awards of shares in Banco Santander, S.A. under the Santander Long-Term Incentive Plan. Under the Santander Long-Term Incentive Plans granted on 1 July 2010 and 1 July 2009 certain Executive Directors, Key Management Personnel (as defined in Note 43) and other nominated individuals were granted conditional awards of shares in Banco Santander, S.A.
The number of shares participants will receive depends on the performance of Banco Santander, S.A. during this period. The vesting of awards under the Santander Long-Term Incentive Plan depends on Santander’s Total Shareholder Return performance against a competitor benchmark group. Subject to performance conditions being met, 100% of the 2009 conditional award vested in July 2012 and 100% of the 2010 conditional award vested in July 2013. In 2013, Long-Term Incentive Plan shares awarded in 2010 vested for one Director (2012: two).
d) Parent undertaking and controlling party
On 10 January 2014, the ordinary shares of Santander UK plc were transferred to a new holding company, Santander UK Group Holdings Limited which is therefore now the Company’s immediate parent. The Company’s ultimate parent and controlling party is Banco Santander, S.A., a company incorporated in Spain. The smallest and largest group into which the Santander UK group’s results are included is the group accounts of Banco Santander, S.A., copies of which may be obtained from Santander Shareholder Relations, 2 Triton Square, Regent’s Place, London NW1 3AN.
e) Transactions with related parties
Transactions with related parties during the year and balances outstanding at the year end:
| | | | | | | | | | | | | | | | | | | | | | | | | | | | | | | | | | | | | | | | |
| | | Group | |
| | | Interest, fees and
other income received | | | Interest, fees and
other expenses paid | | | Amounts owed by
related parties | | | Amounts owed
to related parties | |
| | | 2013
£m | | | 2012
£m | | | 2011
£m | | | 2013
£m | | | 2012
£m | | | 2011
£m | | | 2013
£m | | | 2012
£m | | | 2013
£m | | | 2012
£m | |
Parent company | | | (395 | ) | | | (54 | ) | | | (163 | ) | | | 98 | | | | 207 | | | | 87 | | | | 2,201 | | | | 2,473 | | | | (3,737 | ) | | | (4,942 | ) |
Fellow subsidiaries | | | (346 | ) | | | (319 | ) | | | (281 | ) | | | 851 | | | | 717 | | | | 709 | | | | 328 | | | | 267 | | | | (3,697 | ) | | | (4,689 | ) |
Associates & joint ventures | | | (19 | ) | | | (3 | ) | | | (1 | ) | | | — | | | | 4 | | | | — | | | | 788 | | | | 328 | | | | (4 | ) | | | (2 | ) |
| | | | | | | | | | | | | | | | | | | | | | | | | | | | | | | | | | | | | | | | |
| | | (760 | ) | | | (376 | ) | | | (445 | ) | | | 949 | | | | 928 | | | | 796 | | | | 3,317 | | | | 3,068 | | | | (7,438 | ) | | | (9,633 | ) |
| | | | | | | | | | | | | | | | | | | | | | | | | | | | | | | | | | | | | | | | |
| |
| | | Company | |
| | | Interest, fees and
other income received | | | Interest, fees and
other expenses paid | | | Amounts owed by
related parties | | | Amounts owed
to related parties | |
| | | 2013
£m | | | 2012
£m | | | 2011
£m | | | 2013
£m | | | 2012
£m | | | 2011
£m | | | 2013
£m | | | 2012
£m | | | 2013
£m | | | 2012
£m | |
Parent company | | | — | | | | (1 | ) | | | — | | | | 40 | | | | 51 | | | | 64 | | | | 16 | | | | 3 | | | | (1,501 | ) | | | (650 | ) |
Subsidiaries | | | (3,705 | ) | | | (2,333 | ) | | | (2,686 | ) | | | 6,683 | | | | 4,574 | | | | 4,777 | | | | 114,488 | | | | 105,598 | | | | (156,160 | ) | | | (162,028 | ) |
Fellow subsidiaries | | | (160 | ) | | | (208 | ) | | | (205 | ) | | | 561 | | | | 492 | | | | 524 | | | | 42 | | | | 46 | | | | (2,700 | ) | | | (3,067 | ) |
Associates & joint ventures | | | — | | | | — | | | | (1 | ) | | | — | | | | — | | | | — | | | | — | | | | — | | | | — | | | | — | |
| | | | | | | | | | | | | | | | | | | | | | | | | | | | | | | | | | | | | | | | |
| | | (3,865 | ) | | | (2,542 | ) | | | (2,892 | ) | | | 7,284 | | | | 5,117 | | | | 5,365 | | | | 114,546 | | | | 105,647 | | | | (160,361 | ) | | | (165,745 | ) |
| | | | | | | | | | | | | | | | | | | | | | | | | | | | | | | | | | | | | | | | |
Further information on balances due from/(to) other Banco Santander group companies is set out in the section “Balances with other Banco Santander group companies” in the Risk Management Report on pages 155 and 156. In 2013, Banco Santander, S.A. sold 50% of its interest in its international asset management business to US private equity investors. The Company has guaranteed certain of Banco Santander, S.A.’s obligations under the transaction. Under the terms of the transaction, the Company’s obligations are fully cash collateralised by Banco Santander, S.A. at all times so that the Company has no residual credit exposure. The amount of cash collateral in relation to this transaction was £623m at 31 December 2013 and has been included in Deposits by banks. In addition, transactions with pension schemes operated by the Santander UK group are described in Note 37.
The above transactions were made in the ordinary course of business and substantially on the same terms as for comparable transactions with third party counterparties and within limits acceptable to the PRA. Such transactions do not involve more than the normal risk of collectability or present any unfavourable features.
| | |
| Santander UK plc Annual Report 2013 | | 289 |
Financial Statements
Notes to the Financial Statementscontinued
45. FINANCIAL INSTRUMENTS
a) Measurement basis of financial assets and liabilities
Financial assets and financial liabilities are measured on an ongoing basis either at fair value or at amortised cost. Note 1 describes how the classes of financial instruments are measured, and how income and expenses, including fair value gains and losses, are recognised. The following tables analyse the Santander UK group’s financial instruments into those measured at fair value and those measured at amortised cost in the balance sheet:
| | | | | | | | | | | | | | | | | | | | | | | | | | | | | | | | |
| | | Group | |
| | | Held at fair value | | | Held at amortised cost | | | Non- | | | Total | |
31 December 2013 | | Trading | | | Derivatives
designated
as hedges | | | Designated
at fair value
through P&L | | | Available-
for-sale | | | Financial
assets at
amortised cost | | | Financial
liabilities at
amortised cost | | | financial
assets/
liabilities | | |
| | | £m | | | £m | | | £m | | | £m | | | £m | | | £m | | | £m | | | £m | |
Assets | | | | | | | | | | | | | | | | | | | | | | | | | | | | | | | | |
Cash & balances at central banks | | | — | | | | — | | | | — | | | | — | | | | 26,374 | | | | — | | | | — | | | | 26,374 | |
Trading assets | | | 22,294 | | | | — | | | | — | | | | — | | | | — | | | | — | | | | — | | | | 22,294 | |
Derivative financial instruments | | | 17,433 | | | | 2,616 | | | | — | | | | — | | | | — | | | | — | | | | — | | | | 20,049 | |
Financial assets designated at FVTPL | | | — | | | | — | | | | 2,747 | | | | — | | | | — | | | | — | | | | — | | | | 2,747 | |
Loans and advances to banks | | | — | | | | — | | | | — | | | | — | | | | 2,347 | | | | — | | | | — | | | | 2,347 | |
Loans and advances to customers | | | — | | | | — | | | | — | | | | — | | | | 184,587 | | | | — | | | | — | | | | 184,587 | |
Loans and receivables securities | | | — | | | | — | | | | — | | | | — | | | | 1,101 | | | | — | | | | — | | | | 1,101 | |
Available-for-sale securities | | | — | | | | — | | | | — | | | | 5,005 | | | | — | | | | — | | | | — | | | | 5,005 | |
Macro hedge of interest rate risk | | | — | | | | — | | | | — | | | | — | | | | 769 | | | | — | | | | — | | | | 769 | |
Interests in other entities | | | — | | | | — | | | | — | | | | — | | | | — | | | | — | | | | 27 | | | | 27 | |
Intangible assets | | | — | | | | — | | | | — | | | | — | | | | — | | | | — | | | | 2,335 | | | | 2,335 | |
Property, plant and equipment | | | — | | | | — | | | | — | | | | — | | | | — | | | | — | | | | 1,521 | | | | 1,521 | |
Current tax assets | | | — | | | | — | | | | — | | | | — | | | | — | | | | — | | | | 114 | | | | 114 | |
Deferred tax assets | | | — | | | | — | | | | — | | | | — | | | | — | | | | — | | | | 35 | | | | 35 | |
Retirement benefit assets | | | — | | | | — | | | | — | | | | — | | | | — | | | | — | | | | 118 | | | | 118 | |
Other assets | | | — | | | | — | | | | — | | | | — | | | | — | | | | — | | | | 882 | | | | 882 | |
| | | | | | | | | | | | | | | | | | | | | | | | | | | | | | | | |
| | | 39,727 | | | | 2,616 | | | | 2,747 | | | | 5,005 | | | | 215,178 | | | | — | | | | 5,032 | | | | 270,305 | |
| | | | | | | | | | | | | | | | | | | | | | | | | | | | | | | | |
Liabilities | | | | | | | | | | | | | | | | | | | | | | | | | | | | | | | | |
Deposits by banks | | | — | | | | — | | | | — | | | | — | | | | — | | | | 8,696 | | | | — | | | | 8,696 | |
Deposits by customers | | | — | | | | — | | | | — | | | | — | | | | — | | | | 147,167 | | | | — | | | | 147,167 | |
Trading liabilities | | | 21,278 | | | | — | | | | — | | | | — | | | | — | | | | — | | | | — | | | | 21,278 | |
Derivative financial liabilities | | | 17,297 | | | | 1,566 | | | | — | | | | — | | | | — | | | | — | | | | — | | | | 18,863 | |
Financial liabilities designated at FVTPL | | | — | | | | — | | | | 3,407 | | | | — | | | | — | | | | — | | | | — | | | | 3,407 | |
Debt securities in issue | | | — | | | | — | | | | — | | | | — | | | | — | | | | 50,870 | | | | — | | | | 50,870 | |
Subordinated liabilities | | | — | | | | — | | | | — | | | | — | | | | — | | | | 4,306 | | | | — | | | | 4,306 | |
Other liabilities | | | — | | | | — | | | | — | | | | — | | | | — | | | | — | | | | 1,883 | | | | 1,883 | |
Provisions | | | — | | | | — | | | | — | | | | — | | | | — | | | | — | | | | 639 | | | | 639 | |
Current tax liabilities | | | — | | | | — | | | | — | | | | — | | | | — | | | | — | | | | 4 | | | | 4 | |
Retirement benefit obligations | | | — | | | | — | | | | — | | | | — | | | | — | | | | — | | | | 672 | | | | 672 | |
| | | | | | | | | | | | | | | | | | | | | | | | | | | | | | | | |
| | | 38,575 | | | | 1,566 | | | | 3,407 | | | | — | | | | — | | | | 211,039 | | | | 3,198 | | | | 257,785 | |
| | | | | | | | | | | | | | | | | | | | | | | | | | | | | | | | |
| | | | | | | | | | | | | | | | | | | | | | | | | | | | | | | | |
| | | Group | |
| | | Held at fair value | | | Held at amortised cost | | | Non- | | | Total | |
31 December 2012 | | Trading | | | Derivatives
designated
as hedges | | | Designated
at fair value
through P&L | | | Available-
for-sale | | | Financial
assets at
amortised cost | | | Financial
liabilities at
amortised cost | | | financial
assets/
liabilities | | |
| | | £m | | | £m | | | £m | | | £m | | | £m | | | £m | | | £m | | | £m | |
Assets | | | | | | | | | | | | | | | | | | | | | | | | | | | | | | | | |
Cash & balances at central banks | | | — | | | | — | | | | — | | | | — | | | | 29,282 | | | | — | | | | — | | | | 29,282 | |
Trading assets | | | 22,498 | | | | — | | | | — | | | | — | | | | — | | | | — | | | | — | | | | 22,498 | |
Derivative financial instruments | | | 28,064 | | | | 2,082 | | | | — | | | | — | | | | — | | | | — | | | | — | | | | 30,146 | |
Financial assets designated at FVTPL | | | — | | | | — | | | | 3,811 | | | | — | | | | — | | | | — | | | | — | | | | 3,811 | |
Loans and advances to banks | | | — | | | | — | | | | — | | | | — | | | | 2,438 | | | | — | | | | — | | | | 2,438 | |
Loans and advances to customers | | | — | | | | — | | | | — | | | | — | | | | 190,782 | | | | — | | | | — | | | | 190,782 | |
Loans and receivables securities | | | — | | | | — | | | | — | | | | — | | | | 1,259 | | | | — | | | | — | | | | 1,259 | |
Available-for-sale securities | | | — | | | | — | | | | — | | | | 5,483 | | | | — | | | | — | | | | — | | | | 5,483 | |
Macro hedge of interest rate risk | | | — | | | | — | | | | — | | | | — | | | | 1,222 | | | | — | | | | — | | | | 1,222 | |
Interests in other entities | | | — | | | | — | | | | — | | | | — | | | | — | | | | — | | | | 8 | | | | 8 | |
Intangible assets | | | — | | | | — | | | | — | | | | — | | | | — | | | | — | | | | 2,325 | | | | 2,325 | |
Property, plant and equipment | | | — | | | | — | | | | — | | | | — | | | | — | | | | — | | | | 1,541 | | | | 1,541 | |
Current tax assets | | | — | | | | — | | | | — | | | | — | | | | — | | | | — | | | | 50 | | | | 50 | |
Deferred tax assets | | | — | | | | — | | | | — | | | | — | | | | — | | | | — | | | | 60 | | | | 60 | |
Retirement benefit assets | | | — | | | | — | | | | — | | | | — | | | | — | | | | — | | | | 254 | | | | 254 | |
Other assets | | | — | | | | — | | | | — | | | | — | | | | — | | | | — | | | | 1,885 | | | | 1,885 | |
| | | | | | | | | | | | | | | | | | | | | | | | | | | | | | | | |
| | | 50,562 | | | | 2,082 | | | | 3,811 | | | | 5,483 | | | | 224,983 | | | | — | | | | 6,123 | | | | 293,044 | |
| | | | | | | | | | | | | | | | | | | | | | | | | | | | | | | | |
Liabilities | | | | | | | | | | | | | | | | | | | | | | | | | | | | | | | | |
Deposits by banks | | | — | | | | — | | | | — | | | | — | | | | — | | | | 9,935 | | | | — | | | | 9,935 | |
Deposits by customers | | | — | | | | — | | | | — | | | | — | | | | — | | | | 149,037 | | | | — | | | | 149,037 | |
Trading liabilities | | | 21,109 | | | | — | | | | — | | | | — | | | | — | | | | — | | | | — | | | | 21,109 | |
Derivative financial liabilities | | | 27,415 | | | | 1,446 | | | | — | | | | — | | | | — | | | | — | | | | — | | | | 28,861 | |
Financial liabilities designated at FVTPL | | | — | | | | — | | | | 4,002 | | | | — | | | | — | | | | — | | | | — | | | | 4,002 | |
Debt securities in issue | | | — | | | | — | | | | — | | | | — | | | | — | | | | 59,621 | | | | — | | | | 59,621 | |
Subordinated liabilities | | | — | | | | — | | | | — | | | | — | | | | — | | | | 3,781 | | | | — | | | | 3,781 | |
Other liabilities | | | — | | | | — | | | | — | | | | — | | | | — | | | | — | | | | 2,526 | | | | 2,526 | |
Provisions | | | — | | | | — | | | | — | | | | — | | | | — | | | | — | | | | 914 | | | | 914 | |
Current tax liabilities | | | — | | | | — | | | | — | | | | — | | | | — | | | | — | | | | 4 | | | | 4 | |
Retirement benefit obligations | | | — | | | | — | | | | — | | | | — | | | | — | | | | — | | | | 305 | | | | 305 | |
| | | | | | | | | | | | | | | | | | | | | | | | | | | | | | | | |
| | | 48,524 | | | | 1,446 | | | | 4,002 | | | | — | | | | — | | | | 222,374 | | | | 3,749 | | | | 280,095 | |
| | | | | | | | | | | | | | | | | | | | | | | | | | | | | | | | |
| | |
| 290 | | Santander UK plc Annual Report 2013 |
Financial Statements
Notes to the Financial Statementscontinued
| | | | | | | | | | | | | | | | | | | | | | | | | | | | | | | | |
| | | Company | |
| | | Held at fair value | | | Held at amortised cost | | | Non- | | | | |
31 December 2013 | | Trading | | | Derivatives
designated
as hedges | | | Designated
at fair value
through P&L | | | Available-
for-sale | | | Financial
assets at
amortised cost | | | Financial
liabilities at
amortised cost | | | financial
assets/
liabilities | | | Total | |
| | | £m | | | £m | | | £m | | | £m | | | £m | | | £m | | | £m | | | £m | |
Assets | | | | | | | | | | | | | | | | | | | | | | | | | | | | | | | | |
Cash & balances at central banks | | | — | | | | — | | | | — | | | | — | | | | 21,399 | | | | — | | | | — | | | | 21,399 | |
Derivative financial instruments | | | 1,900 | | | | 561 | | | | — | | | | — | | | | — | | | | — | | | | — | | | | 2,461 | |
Financial assets designated at FVTPL | | | — | | | | — | | | | 1 | | | | — | | | | — | | | | — | | | | — | | | | 1 | |
Loans and advances to banks | | | — | | | | — | | | | — | | | | — | | | | 109,267 | | | | — | | | | — | | | | 109,267 | |
Loans and advances to customers | | | — | | | | — | | | | — | | | | — | | | | 164,393 | | | | — | | | | — | | | | 164,393 | |
Loans and receivables securities | | | — | | | | — | | | | — | | | | — | | | | 5,474 | | | | — | | | | — | | | | 5,474 | |
Available-for-sale securities | | | — | | | | — | | | | — | | | | 2,029 | | | | — | | | | — | | | | — | | | | 2,029 | |
Interests in other entities | | | — | | | | — | | | | — | | | | — | | | | — | | | | — | | | | 6,176 | | | | 6,176 | |
Intangible assets | | | — | | | | — | | | | — | | | | — | | | | — | | | | — | | | | 1,678 | | | | 1,678 | |
Property, plant and equipment | | | — | | | | — | | | | — | | | | — | | | | — | | | | — | | | | 1,196 | | | | 1,196 | |
Current tax assets | | | — | | | | — | | | | — | | | | — | | | | — | | | | — | | | | 423 | | | | 423 | |
Deferred tax assets | | | — | | | | — | | | | — | | | | — | | | | — | | | | — | | | | 73 | | | | 73 | |
Retirement benefit assets | | | — | | | | — | | | | — | | | | — | | | | — | | | | — | | | | 110 | | | | 110 | |
Other assets | | | — | | | | — | | | | — | | | | — | | | | — | | | | — | | | | 808 | | | | 808 | |
| | | | | | | | | | | | | | | | | | | | | | | | | | | | | | | | |
| | | 1,900 | | | | 561 | | | | 1 | | | | 2,029 | | | | 300,533 | | | | — | | | | 10,464 | | | | 315,488 | |
| | | | | | | | | | | | | | | | | | | | | | | | | | | | | | | | |
Liabilities | | | | | | | | | | | | | | | | | | | | | | | | | | | | | | | | |
Deposits by banks | | | — | | | | — | | | | — | | | | — | | | | — | | | | 115,218 | | | | — | | | | 115,218 | |
Deposits by customers | | | — | | | | — | | | | — | | | | — | | | | — | | | | 179,399 | | | | — | | | | 179,399 | |
Derivative financial liabilities | | | 1,626 | | | | 177 | | | | — | | | | — | | | | — | | | | — | | | | — | | | | 1,803 | |
Debt securities in issue | | | — | | | | — | | | | — | | | | — | | | | — | | | | 156 | | | | — | | | | 156 | |
Subordinated liabilities | | | — | | | | — | | | | — | | | | — | | | | — | | | | 4,212 | | | | | | | | 4,212 | |
Other liabilities | | | — | | | | — | | | | — | | | | — | | | | — | | | | — | | | | 1,584 | | | | 1,584 | |
Provisions | | | — | | | | — | | | | — | | | | — | | | | — | | | | — | | | | 570 | | | | 570 | |
Retirement benefit obligations | | | — | | | | — | | | | — | | | | — | | | | — | | | | — | | | | 670 | | | | 670 | |
| | | | | | | | | | | | | | | | | | | | | | | | | | | | | | | | |
| | | 1,626 | | | | 177 | | | | — | | | | — | | | | — | | | | 298,985 | | | | 2,824 | | | | 303,612 | |
| | | | | | | | | | | | | | | | | | | | | | | | | | | | | | | | |
| | | | | | | | | | | | | | | | | | | | | | | | | | | | | | | | |
| | | Company | |
| | | Held at fair value | | | Held at amortised cost | | | Non- | | | | |
31 December 2012 | | Trading | | | Derivatives
designated
as hedges | | | Designated
at fair value
through P&L | | | Available-
for-sale | | | Financial
assets at
amortised cost | | | Financial
liabilities at
amortised cost | | | financial
assets/
liabilities | | | Total | |
| | | £m | | | £m | | | £m | | | £m | | | £m | | | £m | | | £m | | | £m | |
Assets | | | | | | | | | | | | | | | | | | | | | | | | | | | | | | | | |
Cash & balances at central banks | | | — | | | | — | | | | — | | | | — | | | | 28,883 | | | | — | | | | — | | | | 28,883 | |
Derivative financial instruments | | | 4,061 | | | | 838 | | | | — | | | | — | | | | — | | | | — | | | | — | | | | 4,899 | |
Financial assets designated at FVTPL | | | — | | | | — | | | | 44 | | | | — | | | | — | | | | — | | | | — | | | | 44 | |
Loans and advances to banks | | | — | | | | — | | | | — | | | | — | | | | 97,846 | | | | — | | | | — | | | | 97,846 | |
Loans and advances to customers | | | — | | | | — | | | | — | | | | — | | | | 171,697 | | | | — | | | | — | | | | 171,697 | |
Loans and receivables securities | | | — | | | | — | | | | — | | | | — | | | | 5,941 | | | | — | | | | — | | | | 5,941 | |
Available-for-sale securities | | | — | | | | — | | | | — | | | | 357 | | | | — | | | | — | | | | — | | | | 357 | |
Macro hedge of interest rate risk | | | — | | | | — | | | | — | | | | — | | | | 15 | | | | — | | | | — | | | | 15 | |
Interests in other entities | | | — | | | | — | | | | — | | | | — | | | | — | | | | — | | | | 6,969 | | | | 6,969 | |
Intangible assets | | | — | | | | — | | | | — | | | | — | | | | — | | | | — | | | | 1,647 | | | | 1,647 | |
Property, plant and equipment | | | — | | | | — | | | | — | | | | — | | | | — | | | | — | | | | 1,157 | | | | 1,157 | |
Current tax assets | | | — | | | | — | | | | — | | | | — | | | | — | | | | — | | | | 240 | | | | 240 | |
Deferred tax assets | | | — | | | | — | | | | — | | | | — | | | | — | | | | — | | | | 72 | | | | 72 | |
Retirement benefit assets | | | — | | | | — | | | | — | | | | — | | | | — | | | | — | | | | 250 | | | | 250 | |
Other assets | | | — | | | | — | | | | — | | | | — | | | | — | | | | — | | | | 716 | | | | 716 | |
| | | | | | | | | | | | | | | | | | | | | | | | | | | | | | | | |
| | | 4,061 | | | | 838 | | | | 44 | | | | 357 | | | | 304,382 | | | | — | | | | 11,051 | | | | 320,733 | |
| | | | | | | | | | | | | | | | | | | | | | | | | | | | | | | | |
Liabilities | | | | | | | | | | | | | | | | | | | | | | | | | | | | | | | | |
Deposits by banks | | | — | | | | — | | | | — | | | | — | | | | — | | | | 109,170 | | | | — | | | | 109,170 | |
Deposits by customers | | | — | | | | — | | | | — | | | | — | | | | — | | | | 188,884 | | | | — | | | | 188,884 | |
Derivative financial liabilities | | | 2,049 | | | | 2 | | | | — | | | | — | | | | — | | | | — | | | | — | | | | 2,051 | |
Debt securities in issue | | | — | | | | — | | | | — | | | | — | | | | — | | | | 645 | | | | — | | | | 645 | |
Subordinated liabilities | | | — | | | | — | | | | — | | | | — | | | | — | | | | 3,846 | | | | — | | | | 3,846 | |
Other liabilities | | | — | | | | — | | | | — | | | | — | | | | — | | | | — | | | | 2,139 | | | | 2,139 | |
Provisions | | | — | | | | — | | | | — | | | | — | | | | — | | | | — | | | | 859 | | | | 859 | |
Retirement benefit obligations | | | — | | | | — | | | | — | | | | — | | | | — | | | | — | | | | 305 | | | | 305 | |
| | | | | | | | | | | | | | | | | | | | | | | | | | | | | | | | |
| | | 2,049 | | | | 2 | | | | — | | | | — | | | | — | | | | 302,545 | | | | 3,303 | | | | 307,899 | |
| | | | | | | | | | | | | | | | | | | | | | | | | | | | | | | | |
| | |
| Santander UK plc Annual Report 2013 | | 291 |
Financial Statements
Notes to the Financial Statementscontinued
b) Fair values of financial instruments that are not measured at fair value on a recurring basis
The following tables analyse the fair value of financial instruments carried at amortised cost in the balance sheet at 31 December 2013 and 2012, including their levels in the fair value hierarchy. It does not include fair value information for financial assets and financial liabilities not measured at fair value if the carrying amount is a reasonable approximation of fair value.
| | | | | | | | | | | | | | | | | | | | | | | | | | | | | | | | | | | | | | |
| | | | | Group | |
| 31 December 2013 | | | | | | | | | | Internal models based on | | | | | | | | | | |
| Balance sheet category | | Quoted prices in
active markets
(Level 1) | | | Market
observable data
(Level 2) | | | Significant
unobservable data
(Level 3) | | | Total | | | Carrying
value | |
| | | | | £m | | | % | | | £m | | | % | | | £m | | | % | | | £m | | | % | | | £m | |
Assets | | | | | | | | | | | | | | | | | | | | | | | | | | | | | | | | | | | | | | |
Loans and advances to banks | | | | | — | | | | — | | | | 1,302 | | | | 56 | | | | 1,005 | | | | 44 | | | | 2,307 | | | | 100 | | | | 2,347 | |
| | | | | | | | | | | | | | | | | | | | | | | | | | | | | | | | | | | | | | |
Loans and advances to customers | | Advances secured on residential property | | | — | | | | — | | | | — | | | | — | | | | 150,604 | | | | 81 | | | | 150,604 | | | | 81 | | | | 148,429 | |
| | Corporate loans | | | — | | | | — | | | | 5,219 | | | | 3 | | | | 18,515 | | | | 10 | | | | 23,734 | | | | 13 | | | | 24,466 | |
| | Other advances | | | — | | | | — | | | | — | | | | — | | | | 11,737 | | | | 6 | | | | 11,737 | | | | 6 | | | | 11,692 | |
| | | | | | | | | | | | | | | | | | | | | | | | | | | | | | | | | | | | | | |
| | | | | — | | | | — | | | | 5,219 | | | | 3 | | | | 180,856 | | | | 97 | | | | 186,075 | | | | 100 | | | | 184,587 | |
| | | | | | | | | | | | | | | | | | | | | | | | | | | | | | | | | | | | | | |
Loans and receivables securities | | | | | — | | | | — | | | | 1,016 | | | | 98 | | | | 16 | | | | 2 | | | | 1,032 | | | | 100 | | | | 1,101 | |
| | | | | | | | | | | | | | | | | | | | | | | | | | | | | | | | | | | | | | |
Liabilities | | | | | | | | | | | | | | | | | | | | | | | | | | | | | | | | | | | | | | |
Deposits by banks | | Securities sold under agreements to repurchase | | | — | | | | — | | | | 5,660 | | | | 64 | | | | — | | | | — | | | | 5,660 | | | | 64 | | | | 5,465 | |
| | Other deposits | | | — | | | | — | | | | 2,817 | | | | 32 | | | | 414 | | | | 4 | | | | 3,231 | | | | 36 | | | | 3,231 | |
| | | | | | | | | | | | | | | | | | | | | | | | | | | | | | | | | | | | | | |
| | | | | — | | | | — | | | | 8,477 | | | | 96 | | | | 414 | | | | 4 | | | | 8,891 | | | | 100 | | | | 8,696 | |
| | | | | | | | | | | | | | | | | | | | | | | | | | | | | | | | | | | | | | |
Deposits by customers | | Current and demand accounts | | | — | | | | — | | | | — | | | | — | | | | 48,240 | | | | 32 | | | | 48,240 | | | | 32 | | | | 48,240 | |
| | Savings accounts | | | — | | | | — | | | | — | | | | — | | | | 69,633 | | | | 47 | | | | 69,633 | | | | 47 | | | | 69,147 | |
| | Time deposits | | | — | | | | — | | | | — | | | | — | | | | 29,120 | | | | 20 | | | | 29,120 | | | | 20 | | | | 28,860 | |
| | Securities sold under agreements to repurchase | | | — | | | | — | | | | 970 | | | | 1 | | | | — | | | | — | | | | 970 | | | | 1 | | | | 920 | |
| | | | | | | | | | | | | | | | | | | | | | | | | | | | | | | | | | | | | | |
| | | | | — | | | | — | | | | 970 | | | | 1 | | | | 146,993 | | | | 99 | | | | 147,963 | | | | 100 | | | | 147,167 | |
| | | | | | | | | | | | | | | | | | | | | | | | | | | | | | | | | | | | | | |
Debt securities in issue | | Bonds and medium term notes | | | — | | | | — | | | | 32,532 | | | | 60 | | | | — | | | | — | | | | 32,532 | | | | 60 | | | | 32,002 | |
| | Securitisation programmes | | | — | | | | — | | | | 20,547 | | | | 38 | | | | 844 | | | | 2 | | | | 21,391 | | | | 40 | | | | 18,868 | |
| | | | | | | | | | | | | | | | | | | | | | | | | | | | | | | | | | | | | | |
| | | | | — | | | | — | | | | 53,079 | | | | 98 | | | | 844 | | | | 2 | | | | 53,923 | | | | 100 | | | | 50,870 | |
| | | | | | | | | | | | | | | | | | | | | | | | | | | | | | | | | | | | | | |
Subordinated liabilities | | | | | — | | | | — | | | | 4,435 | | | | 100 | | | | — | | | | — | | | | 4,435 | | | | 100 | | | | 4,306 | |
| | | | | | | | | | | | | | | | | | | | | | | | | | | | | | | | | | | | | | |
The fair values and carrying values of loans and advances to customers may be further analysed, between those that are impaired and those that are not impaired, as follows:
| | | | | | | | | | | | | | | | | | | | | | | | | | |
| 31 December 2013 | | | | Group | |
| | | | | Impaired | | | Not impaired | | | Total | |
| | | | | | | | Carrying | | | | | | Carrying | | | | | | Carrying | |
| | | | | Fair Value | | | value | | | Fair Value | | | value | | | Fair Value | | | value | |
| | | | | £m | | | £m | | | £m | | | £m | | | £m | | | £m | |
Loans and advances to customers | | Advances secured on residential property | | | 2,298 | | | | 2,402 | | | | 148,306 | | | | 146,027 | | | | 150,604 | | | | 148,429 | |
| | Corporate loans | | | 205 | | | | 293 | | | | 23,529 | | | | 24,173 | | | | 23,734 | | | | 24,466 | |
| | Other unsecured advances | | | 76 | | | | 108 | | | | 11,661 | | | | 11,584 | | | | 11,737 | | | | 11,692 | |
| | | | | | | | | | | | | | | | | | | | | | | | | | |
| | | | | 2,579 | | | | 2,803 | | | | 183,496 | | | | 181,784 | | | | 186,075 | | | | 184,587 | |
| | | | | | | | | | | | | | | | | | | | | | | | | | |
There are no loans and advances to banks that are impaired, and there are no significant balances of loans and receivable securities that are impaired.
| | |
| 292 | | Santander UK plc Annual Report 2013 |
Financial Statements
Notes to the Financial Statementscontinued
| | | | | | | | | | | | | | | | | | | | | | | | | | | | | | | | | | | | | | |
| | | | | Group | |
| 31 December 2012 | | | | | | | | | | Internal models based on | | | | | | | | | | |
| Balance sheet category | | Quoted prices in
active markets
(Level 1) | | | Market
observable data
(Level 2) | | | Significant
unobservable data
(Level 3) | | | Total | | | Carrying
value | |
| | | | | £m | | | % | | | £m | | | % | | | £m | | | % | | | £m | | | % | | | £m | |
Assets | | | | | | | | | | | | | | | | | | | | | | | | | | | | | | | | | | | | | | |
Loans and advances to banks | | | | | — | | | | — | | | | 1,538 | | | | 72 | | | | 595 | | | | 28 | | | | 2,133 | | | | 100 | | | | 2,438 | |
| | | | | | | | | | | | | | | | | | | | | | | | | | | | | | | | | | | | | | |
Loans and advances to customers | | Advances secured on residential property | | | — | | | | — | | | | — | | | | — | | | | 159,849 | | | | 83 | | | | 159,849 | | | | 83 | | | | 156,758 | |
| | Corporate loans | | | — | | | | — | | | | 3,738 | | | | 2 | | | | 17,246 | | | | 9 | | | | 20,984 | | | | 11 | | | | 22,584 | |
| | Other advances | | | — | | | | — | | | | — | | | | — | | | | 11,397 | | | | 6 | | | | 11,397 | | | | 6 | | | | 11,440 | |
| | | | | | | | | | | | | | | | | | | | | | | | | | | | | | | | | | | | | | |
| | | | | — | | | | — | | | | 3,738 | | | | 2 | | | | 188,492 | | | | 98 | | | | 192,230 | | | | 100 | | | | 190,782 | |
| | | | | | | | | | | | | | | | | | | | | | | | | | | | | | | | | | | | | | |
Loans and receivables securities | | | | | — | | | | — | | | | 1,125 | | | | 99 | | | | 14 | | | | 1 | | | | 1,139 | | | | 100 | | | | 1,259 | |
| | | | | | | | | | | | | | | | | | | | | | | | | | | | | | | | | | | | | | |
Liabilities | | | | | | | | | | | | | | | | | | | | | | | | | | | | | | | | | | | | | | |
Deposits by banks | | Securities sold under agreements to repurchase | | | — | | | | — | | | | 7,659 | | | | 75 | | | | — | | | | — | | | | 7,659 | | | | 75 | | | | 7,382 | |
| | Other deposits | | | — | | | | — | | | | 2,154 | | | | 21 | | | | 399 | | | | 4 | | | | 2,553 | | | | 25 | | | | 2,553 | |
| | | | | | | | | | | | | | | | | | | | | | | | | | | | | | | | | | | | | | |
| | | | | — | | | | — | | | | 9,813 | | | | 96 | | | | 399 | | | | 4 | | | | 10,212 | | | | 100 | | | | 9,935 | |
| | | | | | | | | | | | | | | | | | | | | | | | | | | | | | | | | | | | | | |
Liabilities | | | | | | | | | | | | | | | | | | | | | | | | | | | | | | | | | | | | | | |
Deposits by customers | | Current and demand accounts | | | — | | | | — | | | | — | | | | — | | | | 36,102 | | | | 24 | | | | 36,102 | | | | 24 | | | | 36,102 | |
| | Savings accounts | | | — | | | | — | | | | — | | | | — | | | | 76,829 | | | | 51 | | | | 76,829 | | | | 51 | | | | 76,260 | |
| | Time deposits | | | — | | | | — | | | | — | | | | — | | | | 36,246 | | | | 24 | | | | 36,246 | | | | 24 | | | | 35,769 | |
| | Securities sold under agreements to repurchase | | | — | | | | — | | | | 1,014 | | | | 1 | | | | — | | | | — | | | | 1,014 | | | | 1 | | | | 906 | |
| | | | | | | | | | | | | | | | | | | | | | | | | | | | | | | | | | | | | | |
| | | | | — | | | | — | | | | 1,014 | | | | 1 | | | | 149,177 | | | | 99 | | | | 150,191 | | | | 100 | | | | 149,037 | |
| | | | | | | | | | | | | | | | | | | | | | | | | | | | | | | | | | | | | | |
Debt securities in issue | | Bonds and medium term notes | | | — | | | | — | | | | 36,898 | | | | 60 | | | | — | | | | — | | | | 36,898 | | | | 60 | | | | 35,596 | |
| | Securitisation programmes | | | — | | | | — | | | | 23,503 | | | | 39 | | | | 762 | | | | 1 | | | | 24,265 | | | | 40 | | | | 24,025 | |
| | | | | | | | | | | | | | | | | | | | | | | | | | | | | | | | | | | | | | |
| | | | | — | | | | — | | | | 60,401 | | | | 99 | | | | 762 | | | | 1 | | | | 61,163 | | | | 100 | | | | 59,621 | |
| | | | | | | | | | | | | | | | | | | | | | | | | | | | | | | | | | | | | | |
Subordinated liabilities | | | | | — | | | | — | | | | 3,597 | | | | 100 | | | | — | | | | — | | | | 3,597 | | | | 100 | | | | 3,781 | |
| | | | | | | | | | | | | | | | | | | | | | | | | | | | | | | | | | | | | | |
| | |
| Santander UK plc Annual Report 2013 | | 293 |
Financial Statements
Notes to the Financial Statementscontinued
| | | | | | | | | | | | | | | | | | | | | | | | | | | | | | | | | | | | | | |
| | | | | Company | |
| 31 December 2013 | | | | | | | | | | Internal models based on | | | | | | | | | | |
| Balance sheet category | | Quoted prices in
active markets
(Level 1) | | | Market
observable data
(Level 2) | | | Significant
unobservable data
(Level 3) | | | Total | | | Carrying
value | |
| | | | | £m | | | % | | | £m | | | % | | | £m | | | % | | | £m | | | % | | | £m | |
Assets | | | | | | | | | | | | | | | | | | | | | | | | | | | | | | | | | | | | | | |
Loans and advances to banks | | | | | — | | | | — | | | | 1,431 | | | | 1 | | | | 107,836 | | | | 99 | | | | 109,267 | | | | 100 | | | | 109,267 | |
| | | | | | | | | | | | | | | | | | | | | | | | | | | | | | | | | | | | | | |
Loans and advances to customers | | Advances secured on residential property | | | — | | | | — | | | | — | | | | — | | | | 150,594 | | | | 91 | | | | 150,594 | | | | 91 | | | | 148,419 | |
| | Corporate loans | | | — | | | | — | | | | — | | | | — | | | | 9,968 | | | | 6 | | | | 9,968 | | | | 6 | | | | 10,280 | |
| | Other loans | | | — | | | | — | | | | — | | | | — | | | | 5,702 | | | | 3 | | | | 5,702 | | | | 3 | | | | 5,694 | |
| | | | | | | | | | | | | | | | | | | | | | | | | | | | | | | | | | | | | | |
| | | | | — | | | | — | | | | — | | | | — | | | | 166,264 | | | | 100 | | | | 166,264 | | | | 100 | | | | 164,393 | |
| | | | | | | | | | | | | | | | | | | | | | | | | | | | | | | | | | | | | | |
Loans and receivables securities | | | | | — | | | | — | | | | 5,383 | | | | 100 | | | | 16 | | | | — | | | | 5,399 | | | | 100 | | | | 5,474 | |
| | | | | | | | | | | | | | | | | | | | | | | | | | | | | | | | | | | | | | |
Liabilities | | | | | | | | | | | | | | | | | | | | | | | | | | | | | | | | | | | | | | |
Deposits by banks | | Securities sold under agreements to repurchase | | | — | | | | — | | | | 1,346 | | | | 1 | | | | — | | | | — | | | | 1,346 | | | | 1 | | | | 1,301 | |
| | Other deposits | | | — | | | | — | | | | 834 | | | | 1 | | | | 113,083 | | | | 98 | | | | 113,917 | | | | 99 | | | | 113,917 | |
| | | | | | | | | | | | | | | | | | | | | | | | | | | | | | | | | | | | | | |
| | | | | — | | | | — | | | | 2,180 | | | | 2 | | | | 113,083 | | | | 98 | | | | 115,263 | | | | 100 | | | | 115,218 | |
| | | | | | | | | | | | | | | | | | | | | | | | | | | | | | | | | | | | | | |
Deposits by customers | | Current and demand accounts | | | — | | | | — | | | | — | | | | — | | | | 88,401 | | | | 49 | | | | 88,401 | | | | 49 | | | | 88,401 | |
| | Savings accounts | | | — | | | | — | | | | — | | | | — | | | | 69,307 | | | | 39 | | | | 69,307 | | | | 39 | | | | 68,821 | |
| | Time deposits | | | — | | | | — | | | | — | | | | — | | | | 21,416 | | | | 12 | | | | 21,416 | | | | 12 | | | | 21,675 | |
| | Securities sold under agreements to repurchase | | | — | | | | — | | | | 545 | | | | — | | | | — | | | | — | | | | 545 | | | | — | | | | 502 | |
| | | | | | | | | | | | | | | | | | | | | | | | | | | | | | | | | | | | | | |
| | | | | — | | | | — | | | | 545 | | | | — | | | | 179,124 | | | | 100 | | | | 179,669 | | | | 100 | | | | 179,399 | |
| | | | | | | | | | | | | | | | | | | | | | | | | | | | | | | | | | | | | | |
Debt securities in issue | | Bonds and medium term notes | | | — | | | | — | | | | 156 | | | | 100 | | | | — | | | | — | | | | 156 | | | | 100 | | | | 156 | |
| | | | | | | | | | | | | | | | | | | | | | | | | | | | | | | | | | | | | | |
Subordinated liabilities | | | | | — | | | | — | | | | 4,435 | | | | 100 | | | | — | | | | — | | | | 4,435 | | | | 100 | | | | 4,212 | |
| | | | | | | | | | | | | | | | | | | | | | | | | | | | | | | | | | | | | | |
| | | | | | | | | | | | | | | | | | | | | | | | | | |
| 31 December 2013 | | | | Company | |
| | | | | Impaired | | | Not impaired | | | Total | |
| | | | | | | | Carrying | | | | | | Carrying | | | | | | Carrying | |
| | | | | Fair Value | | | value | | | Fair Value | | | value | | | Fair Value | | | value | |
| | | | | £m | | | £m | | | £m | | | £m | | | £m | | | £m | |
Loans and advances to customers | | Advances secured on residential property | | | 2,296 | | | | 2,400 | | | | 148,298 | | | | 146,019 | | | | 150,594 | | | | 148,419 | |
| | Corporate loans | | | — | | | | — | | | | 9,968 | | | | 10,280 | | | | 9,968 | | | | 10,280 | |
| | Other loans | | | 162 | | | | 232 | | | | 5,540 | | | | 5,462 | | | | 5,702 | | | | 5,694 | |
| | | | | | | | | | | | | | | | | | | | | | | | | | |
| | | | | 2,458 | | | | 2,632 | | | | 163,806 | | | | 161,761 | | | | 166,264 | | | | 164,393 | |
| | | | | | | | | | | | | | | | | | | | | | | | | | |
| | |
| 294 | | Santander UK plc Annual Report 2013 |
Financial Statements
Notes to the Financial Statementscontinued
| | | | | | | | | | | | | | | | | | | | | | | | | | | | | | | | | | | | | | |
| | | | | Company | |
| 31 December 2012 | | | | | | | | | | Internal models based on | | | | | | | | | | |
| Balance sheet category | | | | Quoted prices in
active markets
(Level 1) | | | Market
observable data
(Level 2) | | | Significant
unobservable data
(Level 3) | | | Total | | | Carrying
value | |
| | | | | £m | | | % | | | £m | | | % | | | £m | | | % | | | £m | | | % | | | £m | |
Assets | | | | | | | | | | | | | | | | | | | | | | | | | | | | | | | | | | | | | | |
Loans and advances to banks | | | | | — | | | | — | | | | 1,312 | | | | 1 | | | | 99,937 | | | | 99 | | | | 101,249 | | | | 100 | | | | 97,846 | |
| | | | | | | | | | | | | | | | | | | | | | | | | | | | | | | | | | | | | | |
Loans and advances to customers | | Advances secured on residential property | | | — | | | | — | | | | — | | | | — | | | | 159,825 | | | | 92 | | | | 159,825 | | | | 92 | | | | 156,754 | |
| | Corporate loans | | | — | | | | — | | | | — | | | | — | | | | 9,129 | | | | 5 | | | | 9,129 | | | | 5 | | | | 9,129 | |
| | Other advances | | | — | | | | — | | | | — | | | | — | | | | 5,833 | | | | 3 | | | | 5,833 | | | | 3 | | | | 5,814 | |
| | | | | | | | | | | | | | | | | | | | | | | | | | | | | | | | | | | | | | |
| | | | | — | | | | — | | | | — | | | | — | | | | 174,787 | | | | 100 | | | | 174,787 | | | | 100 | | | | 171,697 | |
| | | | | | | | | | | | | | | | | | | | | | | | | | | | | | | | | | | | | | |
Loans and receivables securities | | | | | — | | | | — | | | | 5,816 | | | | 100 | | | | 14 | | | | — | | | | 5,830 | | | | 100 | | | | 5,941 | |
| | | | | | | | | | | | | | | | | | | | | | | | | | | | | | | | | | | | | | |
Liabilities | | | | | | | | | | | | | | | | | | | | | | | | | | | | | | | | | | | | | | |
Deposits by banks | | Securities sold under agreements to repurchase | | | — | | | | — | | | | 2,656 | | | | 2 | | | | — | | | | — | | | | 2,656 | | | | 2 | | | | 2,584 | |
| | Other deposits | | | — | | | | — | | | | 319 | | | | — | | | | 106,732 | | | | 98 | | | | 107,051 | | | | 98 | | | | 106,586 | |
| | | | | | | | | | | | | | | | | | | | | | | | | | | | | | | | | | | | | | |
| | | | | — | | | | — | | | | 2,975 | | | | 2 | | | | 106,732 | | | | 98 | | | | 109,707 | | | | 100 | | | | 109,170 | |
| | | | | | | | | | | | | | | | | | | | | | | | | | | | | | | | | | | | | | |
Deposits by customers | | Current and demand accounts | | | — | | | | — | | | | — | | | | — | | | | 86,701 | | | | 46 | | | | 86,701 | | | | 46 | | | | 86,701 | |
| | Savings accounts | | | — | | | | — | | | | — | | | | — | | | | 75,836 | | | | 40 | | | | 75,836 | | | | 40 | | | | 75,268 | |
| | Time deposits | | | — | | | | — | | | | — | | | | — | | | | 26,893 | | | | 14 | | | | 26,893 | | | | 14 | | | | 26,415 | |
| | Securities sold under agreements to repurchase | | | — | | | | — | | | | 594 | | | | — | | | | — | | | | — | | | | 594 | | | | — | | | | 500 | |
| | | | | | | | | | | | | | | | | | | | | | | | | | | | | | | | | | | | | | |
| | | | | — | | | | — | | | | 594 | | | | — | | | | 189,430 | | | | 100 | | | | 190,024 | | | | 100 | | | | 188,884 | |
| | | | | | | | | | | | | | | | | | | | | | | | | | | | | | | | | | | | | | |
Debt securities in issue | | Bonds and medium term notes | | | — | | | | — | | | | 660 | | | | 100 | | | | — | | | | — | | | | 660 | | | | 100 | | | | 645 | |
| | | | | | | | | | | | | | | | | | | | | | | | | | | | | | | | | | | | | | |
Subordinated liabilities | | | | | — | | | | — | | | | 3,697 | | | | 100 | | | | — | | | | — | | | | 3,697 | | | | 100 | | | | 3,846 | |
| | | | | | | | | | | | | | | | | | | | | | | | | | | | | | | | | | | | | | |
The carrying value above of any financial assets and liabilities that are designated as hedged items in a portfolio (or macro) fair value hedge relationship excludes gains and losses attributable to the hedged risk, as this is presented as a single separate line item on the balance sheet.
Valuation methodology
The fair value of financial instruments is the estimated price at which an orderly transaction to sell the asset or to transfer the liability would take place between market participants at the measurement date under current market conditions. If a quoted market price is available for an instrument, the fair value is calculated based on the market price. Where quoted market prices are not available, fair value is determined using pricing models which use a mathematical methodology based on accepted financial theories, depending on the product type and its components. Further information on fair value measurement can be found in Note 1 and the valuation techniques section below.
Fair value management
The fair value exposures set out in the tables above are managed by using a combination of hedging derivatives and offsetting on balance sheet positions. The approach to specific categories of financial instruments is described below.
Assets:
Cash and balances at central banks
This consists of demand deposits with the Bank of England and the US Federal Reserve, together with cash in tills and ATMs. The carrying amount of cash and balances at central banks is deemed an appropriate approximation of the fair value. These have therefore been excluded from the table above
Loans and advances to banks
These comprise secured loans, short-term placements with banks including collateral and unsettled financial transactions. The secured loans have been valued on the basis of spreads on credit default swaps for the term of the loans using “valuation technique A” as described in the valuation technique section on page 301. The carrying amount of the other items is deemed a reasonable approximation of their fair value, as the transactions are very short-term in duration.
Loans and advances to customers
The approach to estimating the fair value of the principal products and portfolios of loans and advances to customers has been set out below. This is an area of considerable estimation and uncertainty as there is no observable market and values are significantly affected by customer behaviour.
| | |
| Santander UK plc Annual Report 2013 | | 295 |
Financial Statements
Notes to the Financial Statementscontinued
i) Mortgages
The mortgage portfolio has been stratified into tranches by LTV; LTV being a significant driver of market pricing. The fair values have been estimated by comparing existing contractual interest rates over the weighted average lives with an estimation of new business interest rates based on competitor market information. Adjustments have also been made to:
| • | | Reduce the weighted average lives of low LTV loans on SVR to reflect the uncertainty inherent in the value that could be achieved, given that the borrower could re-finance at any time. The historic weighted average lives have been reduced from approximately 3 years to 2 years to reflect this. |
| • | | Discount by 15% the value of performing loans with a LTV over 95% to reflect the higher risk of this part of the portfolio and the fact that this is outside our normal underwriting standards. This is in addition to the use of higher rates within the underlying calculation. |
| • | | For impaired loans we made two further adjustments. The first was to discount the collateral value of loans with over 80% LTV to reflect the significantly higher possibility of re-possession and the lower value that is achieved on repossession. This was done by tranche above 80% LTV. The second was to apply a discount to reflect the fact that the model does not fully take into account the higher risk nature of these loans. For loans over 80%, the discount has been the same 15% used for performing loans over 95% LTV. For impaired loans under 80% LTV, a 5% discount has been used reflecting higher rates available in the market for loans in arrears but with an acceptable LTV. |
ii) Other loans
This consists of unsecured personal loans, credit cards, overdrafts and consumer credit (car loans). The weighted average lives of these portfolios are short, and the business was written relatively recently. As a result, contractual interest rates approximate new business interest rates, and therefore no mark-to-market surplus or deficit has been recorded with respect to the performing book with the exception of unsecured personal loans where a small surplus has been recognized based on a comparison of existing contractual interest rates over the weighted average lives with an estimation of new business interest rates. A discount of 30% has been applied to the impaired part of the book.
iii) Corporate lending
Following the transfer of the non-core corporate and legacy portfolios to Corporate Centre, the remaining corporate assets are written at margins consistent with current new business levels. Provisions are considered appropriate for the book that is not impaired. A discount has been applied to impaired loans. Although exits have generally been achieved at carrying value, sales of distressed assets have generated a loss of around 30% of carrying value, i.e. post provisions, and this reduction to fair value has been applied to the impaired book.
With respect to the non-core corporate and legacy portfolios, including commercial mortgages, but except for social housing which is set out below, an exercise has been undertaken to estimate their market value, based on an orderly disposal process over a period of three years. This portfolio is well provided for, and this is reflected in a relatively small mark-to-market deficit. This is evidenced by disposals during 2013 being achieved at carrying value with no additional provisions being required. In addition, the same 30% discount has been applied to the impaired book as for the corporate assets above.
With respect to Social Housing, part of this portfolio is held for historic reasons at fair value. The same methodology has been applied to calculate the fair value of loans held at amortised cost. The fair value of this portion of the portfolio has been determined using “valuation technique A” as described in the valuation technique section on page 301.
Loans and receivables securities
These debt securities consist primarily of floating rate notes, asset-backed securities and collateralised loan obligations. The fair values of the floating rate notes have been determined using ‘’valuation technique A’’ as described in the valuation technique section below. The asset-backed securities and collateralised loan obligations are more complex products and are valued with the assistance of an independent, specialist valuation firm. These fair values are determined using industry-standard valuation techniques, including discounted cash-flow models. The inputs to these models used in these valuation techniques include quotes from market makers, prices of similar assets, adjustments for differences in credit spreads, and additional quantitative and qualitative research. Disposals of these securities since 2008 have demonstrated that actual sales prices achieved have been close to fair values estimated under this method.
Liabilities:
Deposits by banks
The fair value of deposits by banks, including repos, has been estimated using ‘’valuation technique A’’ as described in the valuation technique section below.
Deposits by customers
The majority of deposit liabilities are payable on demand and therefore can be deemed short-term in nature with the fair value equal to the carrying value. However, given the long-term and continuing nature of the relationships with the Santander UK group’s customers, the Directors believe there is significant value to the Santander UK group in this source of funds. Certain of the deposit liabilities are at a fixed rate until maturity. The deficit of fair value over carrying value of these liabilities has been estimated by reference to the market rates available at the balance sheet date for similar deposit liabilities of similar maturities. The fair value of such deposits liabilities has been estimated using ‘’valuation technique A’’ as described in the valuation technique section below.
Debt securities in issue and subordinated liabilities
Where reliable prices are available, the fair value of debt securities in issue and subordinated liabilities has been calculated using quoted market prices. Other market values have been determined using ‘’valuation technique A’’ as described in the valuation technique section below.
| | |
| 296 | | Santander UK plc Annual Report 2013 |
Financial Statements
Notes to the Financial Statementscontinued
c) Fair values of financial instruments measured at fair value on a recurring basis
The following tables summarise the fair values at 31 December 2013 and 2012 of the financial asset and liability classes accounted for at fair value, analysed by the valuation methodology used by the Santander UK group to determine their fair value. The tables also disclose the percentages that the recorded fair values of financial assets and liabilities represent of the total assets and liabilities, respectively, that are recorded at fair value in the balance sheet:
| | | | | | | | | | | | | | | | | | | | | | | | | | | | | | | | | | | | | | |
| | | | | Group | |
| 31 December 2013 | | | | | | | | | | Internal models based on | | | | | | | | | | |
| Balance sheet category | | Quoted prices in
active markets
(Level 1) | | | Market
observable data
(Level 2) | | | Significant
unobservable data
(Level 3) | | | Total | | | Valuation
technique | |
| | | | | £m | | | % | | | £m | | | % | | | £m | | | % | | | £m | | | % | | | | |
Assets | | | | | | | | | | | | | | | | | | | | | | | | | | | | | | | | | | | | | | |
Trading assets | | Loans and advances to banks | | | — | | | | — | | | | 9,326 | | | | 19 | | | | — | | | | — | | | | 9,326 | | | | 19 | | | | A | |
| | Loans and advances to customers | | | — | | | | — | | | | 4,404 | | | | 9 | | | | — | | | | — | | | | 4,404 | | | | 9 | | | | A | |
| | Debt securities | | | 7,859 | | | | 16 | | | | — | | | | — | | | | — | | | | — | | | | 7,859 | | | | 16 | | | | — | |
| | Equity securities | | | 705 | | | | 1 | | | | — | | | | — | | | | — | | | | — | | | | 705 | | | | 1 | | | | — | |
Derivative assets | | Exchange rate contracts | | | — | | | | — | | | | 3,437 | | | | 7 | | | | 14 | | | | — | | | | 3,451 | | | | 7 | | | | A | |
| | Interest rate contracts | | | 11 | | | | — | | | | 14,232 | | | | 28 | | | | — | | | | — | | | | 14,243 | | | | 28 | | | | A & C | |
| | Equity and credit contracts | | | 311 | | | | 1 | | | | 1,911 | | | | 4 | | | | 131 | | | | — | | | | 2,353 | | | | 5 | | | | B & D | |
| | Commodity contracts | | | — | | | | — | | | | 2 | | | | — | | | | — | | | | — | | | | 2 | | | | — | | | | A | |
Financial assets at FVTPL | | Loans and advances to customers | | | — | | | | — | | | | 2,168 | | | | 4 | | | | 51 | | | | — | | | | 2,219 | | | | 4 | | | | A | |
| | Debt securities | | | — | | | | — | | | | 258 | | | | — | | | | 270 | | | | 1 | | | | 528 | | | | 1 | | | | A & B | |
AFS financial assets | | Equity securities | | | 24 | | | | — | | | | — | | | | — | | | | — | | | | — | | | | 24 | | | | — | | | | — | |
| | Debt securities | | | 4,981 | | | | 10 | | | | — | | | | — | | | | — | | | | — | | | | 4,981 | | | | 10 | | | | — | |
| | | | | | | | | | | | | | | | | | | | | | | | | | | | | | | | | | | | | | |
Total assets at fair value | | | | | 13,891 | | | | 28 | | | | 35,738 | | | | 71 | | | | 466 | | | | 1 | | | | 50,095 | | | | 100 | | | | | |
| | | | | | | | | | | | | | | | | | | | | | | | | | | | | | | | | | | | | | |
Liabilities | | | | | | | | | | | | | | | | | | | | | | | | | | | | | | | | | | | | | | |
Trading liabilities | | Deposits by banks | | | — | | | | — | | | | 11,291 | | | | 26 | | | | — | | | | — | | | | 11,291 | | | | 26 | | | | A | |
| | Deposits by customers | | | — | | | | — | | | | 7,069 | | | | 16 | | | | — | | | | — | | | | 7,069 | | | | 16 | | | | A | |
| | Short positions | | | 2,918 | | | | 6 | | | | — | | | | — | | | | — | | | | — | | | | 2,918 | | | | 6 | | | | — | |
Derivative liabilities | | Exchange rate contracts | | | — | | | | — | | | | 2,936 | | | | 7 | | | | — | | | | — | | | | 2,936 | | | | 7 | | | | A | |
| | Interest rate contracts | | | 36 | | | | — | | | | 12,938 | | | | 30 | | | | — | | | | — | | | | 12,974 | | | | 30 | | | | A & C | |
| | Equity and credit contracts | | | 771 | | | | 2 | | | | 2,132 | | | | 5 | | | | 48 | | | | — | | | | 2,951 | | | | 7 | | | | B & D | |
| | Commodity contracts | | | — | | | | — | | | | 2 | | | | — | | | | — | | | | — | | | | 2 | | | | — | | | | A | |
Financial liabilities at FVTPL | | Debt securities in issue | | | — | | | | — | | | | 3,370 | | | | 8 | | | | 37 | | | | — | | | | 3,407 | | | | 8 | | | | A | |
| | | | | | | | | | | | | | | | | | | | | | | | | | | | | | | | | | | | | | |
Total liabilities at fair value | | | | | 3,725 | | | | 8 | | | | 39,738 | | | | 92 | | | | 85 | | | | — | | | | 43,548 | | | | 100 | | | | | |
| | | | | | | | | | | | | | | | | | | | | | | | | | | | | | | | | | | | | | |
| | | | | | | | | | | | | | | | | | | | | | | | | | | | | | | | | | | | | | |
| | | | | Group | |
| 31 December 2012 | | | | | | | | | | Internal models based on | | | | | | | | | | |
| Balance sheet category | | Quoted prices in
active markets
(Level 1) | | | Market
observable data
(Level 2) | | | Significant
unobservable data
(Level 3) | | | Total | | | Valuation
technique | |
| | | | | £m | | | % | | | £m | | | % | | | £m | | | % | | | £m | | | % | | | | |
Assets | | | | | | | | | | | | | | | | | | | | | | | | | | | | | | | | | | | | | | |
Trading assets | | Loans and advances to banks | | | — | | | | — | | | | 9,988 | | | | 16 | | | | — | | | | — | | | | 9,988 | | | | 16 | | | | A | |
| | Loans and advances to customers | | | — | | | | — | | | | 7,552 | | | | 12 | | | | — | | | | — | | | | 7,552 | | | | 12 | | | | A | |
| | Debt securities | | | 4,494 | | | | 7 | | | | — | | | | — | | | | — | | | | — | | | | 4,494 | | | | 7 | | | | — | |
| | Equity securities | | | 464 | | | | 1 | | | | — | | | | — | | | | — | | | | — | | | | 464 | | | | 1 | | | | — | |
Derivative assets | | Exchange rate contracts | | | — | | | | — | | | | 3,103 | | | | 5 | | | | 36 | | | | — | | | | 3,139 | | | | 5 | | | | A | |
| | Interest rate contracts | | | 54 | | | | — | | | | 25,671 | | | | 41 | | | | — | | | | — | | | | 25,725 | | | | 41 | | | | A & C | |
| | Equity and credit contracts | | | 152 | | | | — | | | | 944 | | | | 2 | | | | 179 | | | | — | | | | 1,275 | | | | 2 | | | | B & D | |
| | Commodity contracts | | | — | | | | — | | | | 7 | | | | — | | | | — | | | | — | | | | 7 | | | | — | | | | A | |
Financial assets at FVTPL | | Loans and advances to customers | | | — | | | | — | | | | 3,187 | | | | 5 | | | | 61 | | | | — | | | | 3,248 | | | | 5 | | | | A | |
| | Debt securities | | | — | | | | — | | | | 279 | | | | 1 | | | | 284 | | | | 1 | | | | 563 | | | | 2 | | | | A & B | |
AFS financial assets | | Equity securities | | | 24 | | | | — | | | | — | | | | — | | | | — | | | | — | | | | 24 | | | | — | | | | — | |
| | Debt securities | | | 5,459 | | | | 9 | | | | — | | | | — | | | | — | | | | — | | | | 5,459 | | | | 9 | | | | — | |
| | | | | | | | | | | | | | | | | | | | | | | | | | | | | | | | | | | | | | |
Total assets at fair value | | | | | 10,647 | | | | 17 | | | | 50,731 | | | | 82 | | | | 560 | | | | 1 | | | | 61,938 | | | | 100 | | | | | |
| | | | | | | | | | | | | | | | | | | | | | | | | | | | | | | | | | | | | | |
Liabilities | | | | | | | | | | | | | | | | | | | | | | | | | | | | | | | | | | | | | | |
Trading liabilities | | Deposits by banks | | | — | | | | — | | | | 9,742 | | | | 18 | | | | — | | | | — | | | | 9,742 | | | | 18 | | | | A | |
| | Deposits by customers | | | — | | | | — | | | | 7,248 | | | | 13 | | | | — | | | | — | | | | 7,248 | | | | 13 | | | | A | |
| | Short positions | | | 4,119 | | | | 8 | | | | — | | | | — | | | | — | | | | — | | | | 4,119 | | | | 8 | | | | — | |
Derivative liabilities | | Exchange rate contracts | | | — | | | | — | | | | 3,017 | | | | 6 | | | | — | | | | — | | | | 3,017 | | | | 6 | | | | A | |
| | Interest rate contracts | | | 31 | | | | — | | | | 23,894 | | | | 45 | | | | — | | | | — | | | | 23,925 | | | | 45 | | | | A & C | |
| | Equity and credit contracts | | | 89 | | | | — | | | | 1,766 | | | | 3 | | | | 57 | | | | — | | | | 1,912 | | | | 3 | | | | B & D | |
| | Commodity contracts | | | — | | | | — | | | | 7 | | | | — | | | | — | | | | — | | | | 7 | | | | — | | | | A | |
Financial liabilities at FVTPL | | Debt securities in issue | | | — | | | | — | | | | 3,916 | | | | 7 | | | | 86 | | | | — | | | | 4,002 | | | | 7 | | | | A | |
| | | | | | | | | | | | | | | | | | | | | | | | | | | | | | | | | | | | | | |
Total liabilities at fair value | | | | | 4,239 | | | | 8 | | | | 49,590 | | | | 92 | | | | 143 | | | | — | | | | 53,972 | | | | 100 | | | | | |
| | | | | | | | | | | | | | | | | | | | | | | | | | | | | | | | | | | | | | |
During 2013, 2012 and 2011, there were no transfers between Level 1, Level 2 and Level 3 financial instruments.
| | |
| Santander UK plc Annual Report 2013 | | 297 |
Financial Statements
Notes to the Financial Statementscontinued
| | | | | | | | | | | | | | | | | | | | | | | | | | | | | | | | | | | | | | |
| | | | | Company | |
| 31 December 2013 | | | | | | | | | | Internal models based on | | | | | | | | | | |
| Balance sheet category | | Quoted prices in
active markets
(Level 1) | | | Market
observable data
(Level 2) | | | Significant
unobservable data
(Level 3) | | | Total | | | Valuation
technique | |
| | | | | £m | | | % | | | £m | | | % | | | £m | | | % | | | £m | | | % | | | | |
Assets | | | | | | | | | | | | | | | | | | | | | | | | | | | | | | | | | | | | | | |
Derivative assets | | Exchange rate contracts | | | — | | | | — | | | | 781 | | | | 17 | | | | — | | | | — | | | | 781 | | | | 17 | | | | A | |
| | Interest rate contracts | | | — | | | | — | | | | 1,611 | | | | 36 | | | | — | | | | — | | | | 1,611 | | | | 36 | | | | A & C | |
| | Equity and credit contracts | | | — | | | | — | | | | 69 | | | | 2 | | | | — | | | | — | | | | 69 | | | | 2 | | | | B & D | |
| | | | | | | | | | | | | | | | | | | | | — | | | | — | | | | | | | | | | | | | |
Financial assets at FVTPL | | Loans and advances to customers | | | — | | | | — | | | | 1 | | | | — | | | | — | | | | — | | | | 1 | | | | — | | | | A | |
AFS financial assets | | Equity securities | | | 10 | | | | — | | | | — | | | | — | | | | — | | | | — | | | | 10 | | | | — | | | | — | |
| | Debt securities | | | 2,019 | | | | 45 | | | | — | | | | — | | | | — | | | | — | | | | 2,019 | | | | 45 | | | | — | |
| | | | | | | | | | | | | | | | | | | | | | | | | | | | | | | | | | | | | | |
Total assets at fair value | | | | | 2,029 | | | | 45 | | | | 2,462 | | | | 55 | | | | — | | | | — | | | | 4,491 | | | | 100 | | | | | |
| | | | | | | | | | | | | | | | | | | | | | | | | | | | | | | | | | | | | | |
Liabilities | | | | | | | | | | | | | | | | | | | | | | | | | | | | | | | | | | | | | | |
Derivative liabilities | | Exchange rate contracts | | | — | | | | — | | | | 632 | | | | 35 | | | | — | | | | — | | | | 632 | | | | 35 | | | | A | |
| | Interest rate contracts | | | 6 | | | | — | | | | 930 | | | | 52 | | | | — | | | | — | | | | 936 | | | | 52 | | | | A & C | |
| | Equity and credit contracts | | | — | | | | — | | | | 235 | | | | 13 | | | | — | | | | — | | | | 235 | | | | 13 | | | | B | |
| | | | | | | | | | | | | | | | | | | | | | | | | | | | | | | | | | | | | | |
Total liabilities at fair value | | | | | 6 | | | | — | | | | 1,797 | | | | 100 | | | | — | | | | — | | | | 1,803 | | | | 100 | | | | | |
| | | | | | | | | | | | | | | | | | | | | | | | | | | | | | | | | | | | | | |
| | | | | | | | | | | | | | | | | | | | | | | | | | | | | | | | | | | | | | |
| | | | | Company | |
| 31 December 2012 | | | | | | | | | | Internal models based on | | | | | | | | | | |
| Balance sheet category | | | | Quoted prices in
active markets
(Level 1) | | | Market
observable
data
(Level 2) | | | Significant
unobservable data
(Level 3) | | | Total | | | Valuation
technique | |
| | | | | £m | | | % | | | £m | | | % | | | £m | | | % | | | £m | | | % | | | | |
Assets | | | | | | | | | | | | | | | | | | | | | | | | | | | | | | | | | | | | | | |
Derivative assets | | Exchange rate contracts | | | — | | | | — | | | | 1,145 | | | | 22 | | | | — | | | | — | | | | 1,145 | | | | 22 | | | | A | |
| | Interest rate contracts | | | — | | | | — | | | | 3,727 | | | | 70 | | | | — | | | | — | | | | 3,727 | | | | 70 | | | | A & C | |
| | Equity and credit contracts | | | — | | | | — | | | | 27 | | | | — | | | | — | | | | — | | | | 27 | | | | — | | | | B & D | |
Financial assets at FVTPL | | Loans and advances to customers | | | — | | | | — | | | | 44 | | | | 1 | | | | — | | | | — | | | | 44 | | | | 1 | | | | A | |
AFS financial assets | | Equity securities | | | 10 | | | | — | | | | — | | | | — | | | | — | | | | — | | | | 10 | | | | — | | | | — | |
| | Debt securities | | | 347 | | | | 7 | | | | — | | | | — | | | | — | | | | — | | | | 347 | | | | 7 | | | | — | |
| | | | | | | | | | | | | | | | | | | | | | | | | | | | | | | | | | | | | | |
Total assets at fair value | | | | | 357 | | | | 7 | | | | 4,943 | | | | 93 | | | | — | | | | — | | | | 5,300 | | | | 100 | | | | | |
| | | | | | | | | | | | | | | | | | | | | | | | | | | | | | | | | | | | | | |
Liabilities | | | | | | | | | | | | | | | | | | | | | | | | | | | | | | | | | | | | | | |
Derivative liabilities | | Exchange rate contracts | | | — | | | | — | | | | 772 | | | | 38 | | | | — | | | | — | | | | 772 | | | | 38 | | | | A | |
| | Interest rate contracts | | | — | | | | — | | | | 1,074 | | | | 52 | | | | — | | | | — | | | | 1,074 | | | | 52 | | | | A & C | |
| | Equity and credit contracts | | | — | | | | — | | | | 205 | | | | 10 | | | | — | | | | — | | | | 205 | | | | 10 | | | | B | |
| | | | | | | | | | | | | | | | | | | | | | | | | | | | | | | | | | | | | | |
Total liabilities at fair value | | | | | — | | | | — | | | | 2,051 | | | | 100 | | | | — | | | | — | | | | 2,051 | | | | 100 | | | | | |
| | | | | | | | | | | | | | | | | | | | | | | | | | | | | | | | | | | | | | |
| | |
| 298 | | Santander UK plc Annual Report 2013 |
Financial Statements
Notes to the Financial Statementscontinued
The following tables present the fair values at 31 December 2013 and 2012 of the above financial assets and liabilities by product, analysed by the valuation methodology used by the Santander UK group to determine their fair value. The tables also disclose the percentages that the recorded fair values of products represent of the total assets and liabilities, respectively, that are recorded at fair value in the balance sheet:
| | | | | | | | | | | | | | | | | | | | | | | | | | | | | | | | |
| | | Group | |
| 31 December 2013 | | | | | Internal models based on | | | | |
| Product | | Quoted prices in
active markets | | | Market observable
data | | | Significant
unobservable data | | | Total | |
| | | £m | | | % | | | £m | | | % | | | £m | | | % | | | £m | | | % | |
Assets | | | | | | | | | | | | | | | | | | | | | | | | | | | | | | | | |
Government and government-guaranteed debt securities | | | 10,624 | | | | 22 | | | | — | | | | — | | | | — | | | | — | | | | 10,624 | | | | 22 | |
Asset-backed securities | | | — | | | | — | | | | 258 | | | | — | | | | 270 | | | | 1 | | | | 528 | | | | 1 | |
Floating rate notes | | | 147 | | | | — | | | | — | | | | — | | | | — | | | | — | | | | 147 | | | | — | |
Other debt securities | | | 2,069 | | | | 4 | | | | — | | | | — | | | | — | | | | — | | | | 2,069 | | | | 4 | |
UK Social Housing association loans | | | — | | | | — | | | | 2,168 | | | | 4 | | | | — | | | | — | | | | 2,168 | | | | 4 | |
Other loans | | | — | | | | — | | | | — | | | | — | | | | 51 | | | | — | | | | 51 | | | | — | |
Term deposits and money market instruments | | | — | | | | — | | | | 13,730 | | | | 28 | | | | — | | | | — | | | | 13,730 | | | | 28 | |
Exchange rate derivatives | | | — | | | | — | | | | 3,437 | | | | 7 | | | | 14 | | | | — | | | | 3,451 | | | | 7 | |
Interest rate derivatives | | | 11 | | | | — | | | | 14,232 | | | | 28 | | | | — | | | | — | | | | 14,243 | | | | 28 | |
Equity & credit derivatives | | | 311 | | | | 1 | | | | 1,911 | | | | 4 | | | | 131 | | | | — | | | | 2,353 | | | | 5 | |
Commodity derivatives | | | — | | | | — | | | | 2 | | | | — | | | | — | | | | — | | | | 2 | | | | — | |
Ordinary shares and similar securities | | | 729 | | | | 1 | | | | — | | | | — | | | | — | | | | — | | | | 729 | | | | 1 | |
| | | | | | | | | | | | | | | | | | | | | | | | | | | | | | | | |
| | | 13,891 | | | | 28 | | | | 35,738 | | | | 71 | | | | 466 | | | | 1 | | | | 50,095 | | | | 100 | |
| | | | | | | | | | | | | | | | | | | | | | | | | | | | | | | | |
Liabilities | | | | | | | | | | | | | | | | | | | | | | | | | | | | | | | | |
Exchange rate derivatives | | | — | | | | — | | | | 2,936 | | | | 7 | | | | — | | | | — | | | | 2,936 | | | | 7 | |
Interest rate derivatives | | | 36 | | | | — | | | | 12,938 | | | | 30 | | | | — | | | | — | | | | 12,974 | | | | 30 | |
Equity & credit derivatives | | | 771 | | | | 2 | | | | 2,132 | | | | 5 | | | | 48 | | | | — | | | | 2,951 | | | | 7 | |
Commodity derivatives | | | — | | | | — | | | | 2 | | | | — | | | | — | | | | — | | | | 2 | | | | — | |
Deposits | | | — | | | | — | | | | 18,360 | | | | 42 | | | | — | | | | — | | | | 18,360 | | | | 42 | |
Debt securities in issue | | | 2,918 | | | | 6 | | | | 3,370 | | | | 8 | | | | 37 | | | | — | | | | 6,325 | | | | 14 | |
| | | | | | | | | | | | | | | | | | | | | | | | | | | | | | | | |
| | | 3,725 | | | | 8 | | | | 39,738 | | | | 92 | | | | 85 | | | | — | | | | 43,548 | | | | 100 | |
| | | | | | | | | | | | | | | | | | | | | | | | | | | | | | | | |
| |
| | | Group | |
| 31 December 2012 | | | | | Internal models based on | | | | |
| Product | | Quoted prices in
active markets | | | Market observable
data | | | Significant
unobservable data | | | Total | |
| | | £m | | | % | | | £m | | | % | | | £m | | | % | | | £m | | | % | |
Assets | | | | | | | | | | | | | | | | | | | | | | | | | | | | | | | | |
Government and government-guaranteed debt securities | | | 9,456 | | | | 15 | | | | — | | | | — | | | | — | | | | — | | | | 9,456 | | | | 15 | |
Asset-backed securities | | | — | | | | — | | | | 279 | | | | — | | | | 284 | | | | 1 | | | | 563 | | | | 1 | |
Certificates of deposits | | | 13 | | | | — | | | | — | | | | — | | | | — | | | | — | | | | 13 | | | | — | |
Floating rate notes | | | 138 | | | | — | | | | — | | | | — | | | | — | | | | — | | | | 138 | | | | — | |
Other debt securities | | | 346 | | | | 1 | | | | — | | | | — | | | | — | | | | — | | | | 346 | | | | 1 | |
UK Social housing association loans | | | — | | | | — | | | | 3,187 | | | | 5 | | | | — | | | | — | | | | 3,187 | | | | 5 | |
Other loans | | | — | | | | — | | | | — | | | | — | | | | 61 | | | | — | | | | 61 | | | | — | |
Term deposits and money market instruments | | | — | | | | — | | | | 17,540 | | | | 28 | | | | — | | | | — | | | | 17,540 | | | | 28 | |
Exchange rate derivatives | | | — | | | | — | | | | 3,103 | | | | 5 | | | | 36 | | | | — | | | | 3,139 | | | | 5 | |
Interest rate derivatives | | | 54 | | | | — | | | | 25,671 | | | | 42 | | | | — | | | | — | | | | 25,725 | | | | 42 | |
Equity & credit derivatives | | | 152 | | | | — | | | | 944 | | | | 2 | | | | 179 | | | | — | | | | 1,275 | | | | 2 | |
Commodity derivatives | | | — | | | | — | | | | 7 | | | | — | | | | — | | | | — | | | | 7 | | | | — | |
Ordinary shares and similar securities | | | 488 | | | | 1 | | | | — | | | | — | | | | — | | | | — | | | | 488 | | | | 1 | |
| | | | | | | | | | | | | | | | | | | | | | | | | | | | | | | | |
| | | 10,647 | | | | 17 | | | | 50,731 | | | | 82 | | | | 560 | | | | 1 | | | | 61,938 | | | | 100 | |
| | | | | | | | | | | | | | | | | | | | | | | | | | | | | | | | |
Liabilities | | | | | | | | | | | | | | | | | | | | | | | | | | | | | | | | |
Exchange rate derivatives | | | — | | | | — | | | | 3,017 | | | | 6 | | | | — | | | | — | | | | 3,017 | | | | 6 | |
Interest rate derivatives | | | 31 | | | | — | | | | 23,894 | | | | 45 | | | | — | | | | — | | | | 23,925 | | | | 45 | |
Equity & credit derivatives | | | 89 | | | | — | | | | 1,766 | | | | 3 | | | | 57 | | | | — | | | | 1,912 | | | | 3 | |
Commodity derivatives | | | — | | | | — | | | | 7 | | | | — | | | | — | | | | — | | | | 7 | | | | — | |
Deposits | | | — | | | | — | | | | 16,990 | | | | 31 | | | | — | | | | — | | | | 16,990 | | | | 31 | |
Debt securities in issue | | | 4,119 | | | | 8 | | | | 3,916 | | | | 7 | | | | 86 | | | | — | | | | 8,121 | | | | 15 | |
| | | | | | | | | | | | | | | | | | | | | | | | | | | | | | | | |
| | | 4,239 | | | | 8 | | | | 49,590 | | | | 92 | | | | 143 | | | | — | | | | 53,972 | | | | 100 | |
| | | | | | | | | | | | | | | | | | | | | | | | | | | | | | | | |
| | |
| Santander UK plc Annual Report 2013 | | 299 |
Financial Statements
Notes to the Financial Statementscontinued
| | | | | | | | | | | | | | | | | | | | | | | | | | | | | | | | |
| | | Company | |
| 31 December 2013 | | | | | Internal models based on | | | | |
| Product | | Quoted prices in
active markets | | | Market
observable data | | | Significant
unobservable data | | | Total | |
| | | £m | | | % | | | £m | | | % | | | £m | | | % | | | £m | | | % | |
Assets | | | | | | | | | | | | | | | | | | | | | | | | | | | | | | | | |
Government and government-guaranteed debt securities | | | 248 | | | | 6 | | | | — | | | | — | | | | — | | | | — | | | | 248 | | | | 6 | |
Other debt securities | | | 1,771 | | | | 39 | | | | — | | | | — | | | | — | | | | — | | | | 1,771 | | | | 39 | |
UK Social housing association loans | | | — | | | | — | | | | 1 | | | | — | | | | — | | | | — | | | | 1 | | | | — | |
Exchange rate derivatives | | | — | | | | — | | | | 781 | | | | 17 | | | | — | | | | — | | | | 781 | | | | 17 | |
Interest rate derivatives | | | — | | | | — | | | | 1,611 | | | | 36 | | | | — | | | | — | | | | 1,611 | | | | 36 | |
Equity & credit derivatives | | | — | | | | — | | | | 69 | | | | 2 | | | | — | | | | — | | | | 69 | | | | 2 | |
Ordinary shares and similar securities | | | 10 | | | | — | | | | — | | | | — | | | | — | | | | — | | | | 10 | | | | — | |
| | | | | | | | | | | | | | | | | | | | | | | | | | | | | | | | |
| | | 2,029 | | | | 45 | | | | 2,462 | | | | 55 | | | | — | | | | — | | | | 4,491 | | | | 100 | |
| | | | | | | | | | | | | | | | | | | | | | | | | | | | | | | | |
Liabilities | | | | | | | | | | | | | | | | | | | | | | | | | | | | | | | | |
Exchange rate derivatives | | | — | | | | — | | | | 632 | | | | 35 | | | | — | | | | — | | | | 632 | | | | 35 | |
Interest rate derivatives | | | 6 | | | | — | | | | 930 | | | | 52 | | | | — | | | | — | | | | 936 | | | | 52 | |
Equity & credit derivatives | | | — | | | | — | | | | 235 | | | | 13 | | | | — | | | | — | | | | 235 | | | | 13 | |
| | | | | | | | | | | | | | | | | | | | | | | | | | | | | | | | |
| | | 6 | | | | — | | | | 1,797 | | | | 100 | | | | — | | | | — | | | | 1,803 | | | | 100 | |
| | | | | | | | | | | | | | | | | | | | | | | | | | | | | | | | |
| |
| | | Company | |
| 31 December 2012 | | | | | Internal models based on | | | | |
| Product | | Quoted prices in
active markets | | | Market
observable data | | | Significant
unobservable data | | | Total | |
| | | £m | | | % | | | £m | | | % | | | £m | | | % | | | £m | | | % | |
Assets | | | | | | | | | | | | | | | | | | | | | | | | | | | | | | | | |
Other debt securities | | | 347 | | | | 7 | | | | — | | | | — | | | | — | | | | — | | | | 347 | | | | 7 | |
UK Social housing association loans | | | — | | | | — | | | | 44 | | | | 1 | | | | — | | | | — | | | | 44 | | | | 1 | |
Exchange rate derivatives | | | — | | | | — | | | | 1,145 | | | | 22 | | | | — | | | | — | | | | 1,145 | | | | 22 | |
Interest rate derivatives | | | — | | | | — | | | | 3,727 | | | | 70 | | | | — | | | | — | | | | 3,727 | | | | 70 | |
Equity & credit derivatives | | | — | | | | — | | | | 27 | | | | — | | | | — | | | | — | | | | 27 | | | | — | |
Ordinary shares and similar securities | | | 10 | | | | — | | | | — | | | | — | | | | — | | | | — | | | | 10 | | | | — | |
| | | | | | | | | | | | | | | | | | | | | | | | | | | | | | | | |
| | | 357 | | | | 7 | | | | 4,943 | | | | 93 | | | | — | | | | — | | | | 5,300 | | | | 100 | |
| | | | | | | | | | | | | | | | | | | | | | | | | | | | | | | | |
Liabilities | | | | | | | | | | | | | | | | | | | | | | | | | | | | | | | | |
Exchange rate derivatives | | | — | | | | — | | | | 772 | | | | 38 | | | | — | | | | — | | | | 772 | | | | 38 | |
Interest rate derivatives | | | — | | | | — | | | | 1,074 | | | | 52 | | | | — | | | | — | | | | 1,074 | | | | 52 | |
Equity & credit derivatives | | | — | | | | — | | | | 205 | | | | 10 | | | | — | | | | — | | | | 205 | | | | 10 | |
| | | | | | | | | | | | | | | | | | | | | | | | | | | | | | | | |
- | | | | | | | — | | | | 2,051 | | | | 100 | | | | — | | | | — | | | | 2,051 | | | | 100 | |
| | | | | | | | | | | | | | | | | | | | | | | | | | | | | | | | |
| | |
| 300 | | Santander UK plc Annual Report 2013 |
Financial Statements
Notes to the Financial Statementscontinued
d) Valuation techniques
The main valuation techniques employed in the Santander UK group’s internal models to measure the fair value of the financial instruments disclosed above at 31 December 2013 and 2012 are set out below. In substantially all cases, the principal inputs into these models are derived from observable market data. The Santander UK group did not make any material changes to the valuation techniques and internal models it used during the years ended 31 December 2013, 2012 and 2011.
| A | In the valuation of financial instruments requiring static hedging (for example interest rate, currency derivatives and commodity swaps) and in the valuation of loans and advances and deposits, the ‘present value’ method is used. Expected future cash flows are discounted using the interest rate curves of the applicable currencies or forward commodity prices as appropriate. The interest rate curves are generally observable market data and reference yield curves derived from quoted interest rates in appropriate time bandings, which match the timings of the cash flows and maturities of the instruments. The forward commodity prices are generally observable market data. |
| B | In the valuation of equity financial instruments requiring dynamic hedging (principally equity securities, options and other structured instruments), proprietary local volatility and stochastic volatility models are used. These types of models are widely accepted in the financial services industry. Observable market inputs used in these models include the bid-offer spread, foreign currency exchange rates, volatility and correlation between indices. In limited circumstances, other inputs may be used in these models that are based on data other than observable market data, such as the Halifax’s UK House Price Index (‘HPI’) volatility, HPI forward growth, HPI spot rate, and mortality. |
| C | In the valuation of financial instruments exposed to interest rate risk that require either static or dynamic hedging (such as interest rate futures, caps and floors, and options), the present value method (futures), Black’s model (caps/floors) and the Hull/White and Markov functional models (Bermudan options) are used. These types of models are widely accepted in the financial services industry. The significant inputs used in these models are observable market data, including appropriate interest rate curves, volatilities, correlations and exchange rates. In limited circumstances, other inputs may be used in these models that are based on data other than observable market data, such as HPI volatility, HPI forward growth, HPI spot rate and mortality. |
| D | In the valuation of linear instruments such as credit risk and fixed-income derivatives, credit risk is measured using dynamic models similar to those used in the measurement of interest rate risk. In the case of non-linear instruments, if the portfolio is exposed to credit risk such as credit derivatives, the probability of default is determined using the par spread level. The main inputs used to determine the underlying cost of credit of credit derivatives are quoted credit risk premiums and the correlation between the quoted credit derivatives of various issuers. |
The fair values of the financial instruments arising from the Santander UK group’s internal models take into account, among other things, contract terms and observable market data, which include such factors as bid-offer spread, interest rates, credit risk, exchange rates, the quoted market price of raw materials and equity securities, volatility and prepayments. In all cases, when it is not possible to derive a valuation for a particular feature of an instrument, management uses judgement to determine the fair value of the particular feature. In exercising this judgement, a variety of tools are used including proxy observable data, historical data and extrapolation techniques. Extrapolation techniques take into account behavioural characteristics of equity markets that have been observed over time, and for which there is a strong case to support an expectation of a continuing trend in the future. Estimates are calibrated to observable market prices when they become available.
The estimates thus obtained could vary if other valuation methods or assumptions were used. The Santander UK group believes its valuation methods are appropriate and consistent with other market participants. Nevertheless, the use of different valuation methods or assumptions, including imprecision in estimating unobservable market inputs, to determine the fair value of certain financial instruments could result in different estimates of fair value at the reporting date and the amount of gain or loss recorded for a particular instrument. Most of the valuation models are not significantly subjective, because they can be tested and, if necessary, recalibrated by the internal calculation of and subsequent comparison to market prices of actively traded securities, where available.
| | |
| Santander UK plc Annual Report 2013 | | 301 |
Financial Statements
Notes to the Financial Statementscontinued
e) Fair value adjustments
The internal models incorporate assumptions that the Santander UK group believes would be made by a market participant to establish fair value. Fair value adjustments are adopted when the Santander UK group considers that there are additional factors that would be considered by a market participant in the determination of fair value of the instrument that are not incorporated in the valuation model. The magnitude of fair value adjustments depends upon many entity-specific factors, including modelling sophistication, the nature of products traded, and the size and type of risk exposures. For this reason, fair value adjustments may not be comparable across the banking industry.
The Santander UK group classifies fair value adjustments as either ‘risk-related’ or ‘model-related’. The fair value adjustments form part of the portfolio fair value and are included in the balance sheet values of the product types to which they have been applied. The majority of these adjustments relate to Markets. The magnitude and types of fair value adjustment adopted by Markets are listed in the following table:
| | | | | | | | |
| | | 2013
£m | | | 2012
£m | |
Risk-related: | | | | | | | | |
- Bid-offer and trade specific adjustments | | | 27 | | | | 26 | |
- Uncertainty | | | 18 | | | | 22 | |
- Credit risk adjustment(1) | | | 45 | | | | 107 | |
| | | | | | | | |
| | | 90 | | | | 155 | |
| | | | | | | | |
Model-related: | | | | | | | | |
- Model limitation | | | 12 | | | | 17 | |
| | |
Day One profits | | | — | | | | — | |
| | | | | | | | |
| | | 102 | | | | 172 | |
| | | | | | | | |
| (1) | In accordance with the requirements of IFRS 13, with effect from 1 January 2013 this includes the debit valuation adjustment. |
Risk-related adjustments
‘Risk-related’ adjustments are driven, in part, by the magnitude of the Santander UK group’s market or credit risk exposure, and by external market factors, such as the size of market spreads.
(i) Bid-offer and trade specific adjustments
IAS 39 requires that portfolios are marked at bid or offer, as appropriate. Bid prices represent the price at which a long position could be sold and offer prices represent the price at which a short position could be bought back. Valuation models will typically generate mid market values. The bid-offer adjustment reflects the cost that would be incurred if substantially all residual net portfolio market risks were closed using available hedging instruments or by disposing of or unwinding the actual position.
The majority of the bid-offer adjustment relates to OTC derivative portfolios. For each portfolio, the major risk types are identified. These may include, inter alia, delta (the sensitivity to changes in the price of an underlying), vega (the sensitivity to changes in volatilities) and basis risk (the sensitivity to changes in the spread between two rates). For each risk type, the net portfolio risks are first classified into buckets, and then a bid-offer spread is applied to each risk bucket based upon the market bid-offer spread for the relevant hedging instrument.
The grouping of risk categories is dependent on the sensitivity factors of the trading portfolio. For example, interest rate risk will be by tenor and options will be by strikes.
The granularity of the risk bucketing is determined by reference to several factors, including the actual risk management practice undertaken by the Santander UK group, the granularity of risk bucketing within the risk reporting process, and the extent of correlation between risk buckets. Within a risk type, the bid-offer adjustment for each risk bucket may be aggregated without offset or limited netting may be applied to reflect correlation between buckets. There is no netting applied between risk types or between portfolios that are not managed together for risk management purposes. There is no netting across legal entities.
As bid-offer spreads vary by maturity and risk type to reflect different spreads in the market, for positions where there is no observable quote, a trade specific adjustment is further made. This is to reflect widened spreads in comparison to proxies due to reduced liquidity or observability. Trade specific adjustments can also be made to incorporate liquidity triggers whereby wider spreads are applied to risks above pre-defined thresholds or on exotic products to ensure overall reserves match market close-out costs. These market close-out costs inherently incorporate risk decay and cross-effects which are unlikely to be adequately reflected in the static hedge based on vanilla instruments.
(ii) Uncertainty
Certain model inputs may be less readily determinable from market data, and/or the choice of model itself may be more subjective, with less market evidence available from which to determine general market practice. In these circumstances, there exists a range of possible values that the financial instrument or market parameter may assume and an adjustment may be necessary to reflect the likelihood that in estimating the fair value of the financial instrument, market participants would adopt rather more conservative values for uncertain parameters and/or model assumptions than those used in the valuation model. Uncertainty adjustments are derived by considering the potential range of derivative portfolio valuation given the available market data. The objective of an uncertainty adjustment is to arrive at a fair value that is not overly prudent but rather reflects a level of prudence believed to be consistent with market pricing practice.
Uncertainty adjustments are applied to various types of exotic OTC derivative. For example, the mean reversion speed of interest rates may be an important component of an exotic derivative value and an uncertainty adjustment may be taken to reflect the range of possible values that market participants may assume for this parameter.
| | |
| 302 | | Santander UK plc Annual Report 2013 |
Financial Statements
Notes to the Financial Statementscontinued
(iii) Credit risk adjustment
Credit risk adjustments comprise credit valuation adjustments and, with effect from 1 January 2013, debit valuation adjustments:
Credit valuation adjustment
The Santander UK group adopts a credit risk adjustment (also frequently known as a ‘credit valuation adjustment’) against OTC derivative transactions to reflect within fair value the possibility that the counterparty may default, and the Santander UK group may not receive the full market value of the transactions. The Santander UK group calculates a separate credit risk adjustment for each Santander UK legal entity, and within each entity for each counterparty to which the entity has exposure. The Santander UK group attempts to mitigate credit risk to third parties by entering into netting and collateral arrangements. The net counterparty exposure (i.e. counterparty positions netted by offsetting transactions and both cash and securities collateral) is then assessed for counterparty creditworthiness. The Santander UK group has only a limited exposure to monolines, consisting of exposure to securitisations which are wrapped by monoline insurers. The principal risk exposures are recorded against the securitisations, with the monoline wraps being viewed as secondary sources of repayment, as described in Note 22. The description below relates to the credit risk adjustment taken against counterparties other than monolines.
The Santander UK group calculates the credit risk adjustment by applying the probability of default of the counterparty to the expected positive exposure to the counterparty, and multiplying the result by the loss expected in the event of default (i.e. the loss given default (‘LGD’)). The timing of the expected losses is reflected by using a discount factor. The calculation is performed over the life of the potential exposure i.e. the credit risk adjustment is measured as a lifetime expected loss.
The expected positive exposure is calculated at a trade level. The main drivers of the expected positive exposure are the size of the risk position with the counterparty along with the prevailing market environment. Probabilities of default are calculated using credit default swap prices where available. Where these are not available, probabilities of default are based upon analysis of historic default rates. The credit rating used for a particular counterparty is that determined by the Santander UK group’s internal credit process. The LGD is calculated at the facility level and takes into account the counterparty characteristics. Credit ratings and LGD are updated by the credit team as new relevant information becomes available and at periodic reviews performed at least annually.
Debit valuation adjustment
The Santander UK group also considers its own creditworthiness when determining the fair value of an instrument, including OTC derivative instruments and financial liabilities held at fair value through profit or loss if the Santander UK group believes market participants would take that into account when transacting the respective instrument. In accordance with the requirements of IFRS 13, with effect from 1 January 2013, the approach to measuring the impact of the Santander UK group’s credit risk on an instrument is the same as for third party credit risk. The impact of the Santander UK group’s credit risk is considered when calculating the fair value of an instrument, even when credit risk is not readily observable such as in OTC derivatives. Consequently, the Santander UK group’s adjustment against derivative liabilities, often referred to as a ‘debit valuation adjustment’ was £38m at 31 December 2013.
For certain types of exotic derivatives where the products are not currently supported by the standard methodology, the Santander UK group adopts an alternative methodology. Alternative methodologies used by the Santander UK group fall into two categories. One method maps transactions against the results for similar products which are accommodated by the standard methodology. Where such a mapping approach is not appropriate, a bespoke methodology is used, generally following the same principles as the standard methodology, reflecting the key characteristics of the instruments but in a manner that is computationally less intensive. The calculation is applied at a trade level, with more limited recognition of credit mitigants such as netting or collateral agreements than used in the standard methodology described previously.
The methodologies do not, in general, account for ‘wrong-way risk’. Wrong-way risk arises where the underlying value of the derivative prior to any credit risk adjustment is related to the probability of default of the counterparty. A more detailed description of wrong-way risk is set out below.
The Santander UK group includes all third-party counterparties in the credit risk adjustment calculation and the Santander UK group does not net credit risk adjustments across Santander UK group entities.
Wrong-way risk
Wrong-way risk arises when there is a strong correlation between the counterparty’s probability of default and the mark-to-market value of the underlying transaction. Wrong-way risk can be seen in the following examples:
| | • | | When the counterparty is resident and/or incorporated in an emerging market and seeks to sell a non-domestic currency in exchange for its home currency; |
| | • | | When the trade involves the purchase of an equity put option from a counterparty whose shares are the subject of the option; |
| | • | | The purchase of credit protection from a counterparty who is closely associated with the reference entity of the credit default swap or total return swap; and |
| | • | | The purchase of credit protection on an asset type which is highly concentrated in the exposure of the counterparty selling the credit protection. |
Exposure to ‘wrong way risk’ is limited via internal governance processes and deal pricing. The Santander UK group considers that an appropriate adjustment to reflect wrong way risk is currently nil (2012: nil).
| | |
| Santander UK plc Annual Report 2013 | | 303 |
Financial Statements
Notes to the Financial Statementscontinued
Model-related adjustments
These adjustments are primarily related to internal factors, such as the ability of the Santander UK group’s models to incorporate all material market characteristics. A description of each adjustment type is given below:
(i) Model limitation
Models used for portfolio valuation purposes, particularly for exotic derivative products, may be based upon a simplifying set of assumptions that do not capture all material market characteristics or may be less reliable under certain market conditions. Additionally, markets evolve, and models that were adequate in the past may require development to capture all material market characteristics in current market conditions. In these circumstances, model limitation adjustments are adopted outside the core valuation model. The adjustment methodologies vary according to the nature of the model. The Quantitative Risk Group (‘QRG’), an independent quantitative support function reporting into the Risk Department, highlights the requirement for model limitation adjustments and develops the methodologies employed. Over time, as model development progresses, model limitations are addressed within the core revaluation models and a model limitation adjustment is no longer needed.
Day One profits adjustments
Day One profit adjustments are adopted where the fair value estimated by a valuation model is based on one or more significant unobservable inputs, in accordance with IAS 39. Day One profits adjustments are amounts that have yet to be recognised in the income statement, which represent the difference between a transaction price (i.e. the fair value at initial recognition) and the amount that would have arisen had valuation models using unobservable inputs been used on initial recognition), less amounts subsequently recognised. Day One profits adjustments are calculated and reported on a portfolio basis. At 31 December 2013 and 2012, the Day One profits adjustments were less than £1m.
f) Control framework
Fair values are subject to a control framework designed to ensure that they are either determined or validated by a function independent of the risk-taker. To this end, ultimate responsibility for the determination of fair values lies jointly with the Risk Department and the Finance Department. For all financial instruments where fair values are determined by reference to externally quoted prices or observable pricing inputs to models, independent price determination or validation is utilised. In inactive markets, direct observation of a traded price may not be possible. In these circumstances, the Santander UK group will source alternative market information to validate the financial instrument’s fair value, with greater weight given to information that is considered to be more relevant and reliable.
The factors that are considered in this regard include:
| | • | | The extent to which prices may be expected to represent genuine traded or tradeable prices; |
| | • | | The degree of similarity between financial instruments; |
| | • | | The degree of consistency between different sources; |
| | • | | The process followed by the pricing provider to derive the data; |
| | • | | The elapsed time between the date to which the market data relates and the balance sheet date; and |
| | • | | The manner in which the data was sourced. |
The source of pricing data is considered as part of the process that determines the classification of the level of a financial instrument. Consideration is given to the quality of the information available that provides the current mark-to-model valuation and estimates of how different these valuations could be on an actual trade, taking into consideration how active the market is. For spot assets that cannot be sold due to illiquidity, forward estimates are discounted to provide an estimate of a realisable value over time. All adjustments for illiquid positions are regularly reviewed to reflect changing market conditions.
Internal valuation model review
Models provide a logical framework for the capture and processing of necessary valuation inputs. For fair values determined using a valuation model, the control framework may include, as applicable, independent development or validation of:
| | • | | The logic within valuation models; |
| | • | | The inputs to those models; |
| | • | | Any adjustments required outside the valuation models; and |
| | • | | Where possible, model outputs. |
All internal valuation models are validated independently by QRG. A validation report is produced for each model-derived valuation that assesses the mathematical assumptions behind the model and the implementation of the model and its integration within the trading system. Where there is observable market data, the models calibrate to market. Where pricing data is unobservable then the input parameters are regularly reviewed by QRG.
The results of the independent valuation process are presented to the Models Committee UK for formal approval. Various Risk functions are represented including QRG and Trading Market Risk in addition to senior management. The members of the Models Committee UK consider the appropriateness of the model and whether model risk fair value adjustments are required. Any changes to the fair value adjustments methodology must also be approved by the Models Committee UK.
| | |
| 304 | | Santander UK plc Annual Report 2013 |
Financial Statements
Notes to the Financial Statementscontinued
g) Internal models based on observable market data (Level 2)
1. Trading Assets
Loans and advances to banks and loans and advances to customers – securities purchased under resale agreements
These instruments consist of reverse repos with both professional non-bank customers and bank counterparties as part of the Santander UK group’s trading activities. The fair value of reverse repos is estimated by using the ‘present value’ method. Future cash flows are evaluated taking into consideration any derivative features of the reverse repos and are then discounted using the appropriate market rates for the applicable maturity and currency. Under these agreements, the Santander UK group receives collateral with a market value equal to, or in excess of, the principal amount loaned. The level of collateral held is monitored daily and if required, further calls are made to ensure the market values of collateral remains at least equal to the loan balance. As a result, there would be no adjustment, or an immaterial adjustment, to reflect the credit quality of the counterparty related to these agreements. As the inputs used in the valuation are based on observable market data, these reverse repos are classified within level 2 of the valuation hierarchy.
Loans and advances to banks and loans and advances to customers – other
These instruments consist of term deposits placed which are short-term in nature and are both utilised and managed as part of the funding requirements of the trading book. The fair value of loans and advances to banks and loans and advances to customers is estimated using the ‘present value’ method. Expected future cash flows are discounted using the interest rate curves of the applicable currencies. The interest rate curves are generally observable market data and reference yield curves derived from quoted interest rates in appropriate time bandings, which match the timings of the cashflows and maturities of the instruments. As the inputs used in the valuation are based on observable market data, these loans are classified within level 2 of the valuation hierarchy.
2. Derivative assets and liabilities
These instruments consist of exchange rate contracts, interest rate contracts, equity and credit contracts and equity derivatives. The models used in estimating the fair value of these derivatives do not contain a high level of subjectivity as the methodologies used in the models do not require significant judgement, and the inputs used in the models are observable market data such as plain vanilla interest rate swaps and option contracts. As the inputs used in the valuation are based on observable market data, these derivatives are classified within level 2 of the valuation hierarchy.
Certain derivatives which represent cross currency swaps, reversionary property interests, credit default swaps and options and forwards contain significant unobservable inputs or are traded less actively or traded in less-developed markets, and so are classified within level 3 of the valuation hierarchy. The valuation of such instruments is further discussed in the ‘internal models based on information other than market data’ section below.
3. Financial assets at fair value through profit or loss (‘FVTPL’)
Loans and advances to customers
These instruments consist of loans secured on residential property to housing associations. The fair value of these social housing loans is estimated using the ‘present value’ model based on a credit curve derived from current market spreads observable in the social housing loan data. Observable market data include current market spreads for new accepted mandates and bids for comparable loans and are used to support or challenge the benchmark level. This provides a range of reasonably possible estimates of fair value. As the inputs used in the valuation are based on market observable data, these loans are classified within level 2 of the valuation hierarchy.
Certain loans and advances to customers which represent a portfolio of roll-up mortgages contain significant unobservable inputs and so are classified within level 3 of the valuation hierarchy. The valuation of such instruments is further discussed below.
Debt securities
These instruments consist of holdings of asset-backed securities. A significant portion of these securities are priced using the ‘present value’ models, based on observable market data e.g. LIBOR, credit spreads. Where there are quoted prices for these instruments, the model value is checked against the quoted prices for reference purposes, but is not used as the fair value as the market for these instruments are lacking in liquidity and depth. As the inputs used in the valuation are based on observable market data, these debt securities are classified within level 2 of the valuation hierarchy.
Certain debt securities which represent reversionary property securities and securities issued by Banco Santander entities contain significant unobservable inputs, and so are classified within level 3 of the valuation hierarchy. The valuation of such instruments is further discussed below.
4. Available-for-sale financial assets – Equity securities
These instruments consist of unquoted equity investments in companies providing infrastructure services to the financial services industry and a small portfolio held within the Santander UK Foundation (which is consolidated by the Santander UK group). In the valuation of equity financial instruments requiring dynamic hedging, proprietary local volatility and stochastic volatility models are used. These types of models are widely accepted in the financial services industry.
Observable market inputs used in these models include the bid-offer spread, foreign currency exchange rates, volatility and correlation between indices. As the inputs used in the valuation are based on observable market data, these equity securities are classified within level 2 of the valuation hierarchy.
| | |
| Santander UK plc Annual Report 2013 | | 305 |
Financial Statements
Notes to the Financial Statementscontinued
5. Trading liabilities
Deposits by banks and deposits by customers – securities sold under repurchase agreements
These instruments consist of repos with both professional non-bank customers and bank counterparties as part of the Santander UK group’s trading activities. The fair value of repos is estimated using the same technique as those reverse repos in trading assets discussed above. Under these agreements, the Santander UK group is required to provide and maintain collateral with a market value equal to, or in excess of, the principal amount borrowed. As a result, there would be no adjustment, or an immaterial adjustment, to reflect the credit quality of the Santander UK group related to these agreements. As the inputs used in the valuation are based on observable market data, these repos are classified within level 2 of the valuation hierarchy.
Deposits by banks and deposits by customers – other
These instruments consist of certain term and time deposits which tend to be short-term in nature and are both utilised and managed as part of the funding requirements of the trading book. These instruments are valued using the same techniques as those instruments in trading assets - loans and advances to banks and loans and advances to customers discussed above. As the inputs used in the valuation are based on observable market data, these deposits are classified within level 2 of the valuation hierarchy.
6. Financial liabilities at FVTPL
Debt securities in issue
These instruments include commercial paper, medium term notes and other bonds and are valued using the same techniques as those instruments in financial assets at FVTPL - debt securities discussed above. As the inputs used in the valuation are based on observable market data, these debt securities are classified within level 2 of the valuation hierarchy.
Certain debt securities in issue which represent the more exotic senior debt issuances, consisting of power reverse dual currency (‘PRDC’) notes contain significant unobservable inputs and so are classified within level 3 of the valuation hierarchy. The valuation of such instruments is further discussed below.
h) Internal models based on information other than market data (Level 3)
The table below provides an analysis of financial instruments valued using internal models based on information other than market data together with the subsequent valuation technique used for each type of instrument. Each instrument is initially valued at transaction price:
| | | | | | | | | | | | | | | | | | | | | | | | |
| | | | | | | Balance sheet value | | | Amount recognised in
income/(expense) | |
| | | | | | | 2013 | | | 2012 | | | 2013 | | | 2012 | | | 2011 | |
Balance sheet line item | | Category | | Financial instrument product type | | £m | | | £m | | | £m | | | £m | | | £m | |
1. Derivative assets | | Exchange rate contracts | | Cross-currency swaps | | | 14 | | | | 36 | | | | (7 | ) | | | (5 | ) | | | 6 | |
2. Derivative assets | | Equity and credit contracts | | Reversionary property interests | | | 71 | | | | 76 | | | | (5 | ) | | | 2 | | | | 15 | |
3. Derivative assets | | Credit contracts | | Credit default swaps | | | 13 | | | | 17 | | | | (4 | ) | | | 1 | | | | 1 | |
4. Derivative assets | | Equity contracts | | Options and forwards | | | 47 | | | | 86 | | | | — | | | | — | | | | (7 | ) |
5. FVTPL | | Loans and advances to customers | | Roll-up mortgage portfolio | | | 51 | | | | 61 | | | | (6 | ) | | | 3 | | | | 8 | |
6. FVTPL | | Debt securities | | Reversionary property securities | | | 212 | | | | 235 | | | | 3 | | | | 10 | | | | 37 | |
7. FVTPL | | Debt securities | | Asset-backed securities | | | 58 | | | | 49 | | | | 13 | | | | 4 | | | | (8 | ) |
8. Derivative liabilities | | Equity contracts | | Options and forwards | | | (48 | ) | | | (57 | ) | | | 8 | | | | 3 | | | | (3 | ) |
9. FVTPL | | Debt securities in issue | | Non-vanilla debt securities | | | (37 | ) | | | (86 | ) | | | 7 | | | | 7 | | | | (6 | ) |
| | | | | | | | | | | | | | | | | | | | | | | | |
Total net assets | | | | | | | 381 | | | | 417 | | | | — | | | | — | | | | — | |
| | | | | | | | | | | | | | | | | | | | | | | | |
Total income/(expense) | | | | | — | | | | — | | | | 9 | | | | 25 | | | | 43 | |
| | | | | | | | | | | | | | | | | | | | | | | | |
Valuation technique
1. Derivative assets – Exchange rate contracts
These cross currency swaps are used to hedge the foreign currency risks arising from the PRDC notes issued by the Santander UK group, as described in Instrument 9 below. These derivatives are valued using a standard valuation model valuing each leg of the swap, with expected future cash flows less notional amount exchanged at maturity date discounted using an appropriate floating rate. The floating rate is adjusted by the relevant cross currency basis spread. Interest rates, foreign exchange rates, cross currency basis spread and long-dated foreign exchange (‘FX’) volatility are used as inputs to determine fair value. Interest rates, foreign exchange rates are observable on the market.
Cross currency spreads may be market observable or unobservable depending on the liquidity of the cross currency pair. As the Japanese Yen-US dollar cross currency pair related to the PRDC notes is liquid, the cross currency spreads (including long-dated cross currency spread) for these swaps are market observable. The significant unobservable inputs for the valuation of these financial instruments are the long-dated FX volatility and the correlation between the underlying assets.
The correlation between the underlying assets is assumed to be zero, as there are no actively traded options from which correlations between the underlying assets could be implied. Furthermore, the zero correlation assumption implies that the sources of the long-dated FX volatility are independent.
| | |
| 306 | | Santander UK plc Annual Report 2013 |
Financial Statements
Notes to the Financial Statementscontinued
Long-dated FX volatility
Long-dated FX volatility is extrapolated from shorter-dated FX volatilities which are directly observable on the market. Short-dated FX volatility is observable from the trading of FX options. As there is no active market for FX options with maturities greater than five years (long-dated FX options), long-dated FX volatility is not market observable. Furthermore, as historical prices are not relevant in determining the cost of hedging long-dated FX risk, long-dated FX volatility cannot be inferred from historical volatility. The Santander UK group extrapolates the long-dated FX volatility from the shorter-dated FX volatilities using Black’s model.
FX volatility is modelled as the composition of the domestic interest rate, foreign interest rates and FX spot volatilities using standard Hull-White formulae. The Hull-White approach is used for estimating the future distribution of domestic and foreign zero-coupon rates, constructed from the relevant yield curves. Using short-dated FX options, the FX spot volatility is calculated which is then extrapolated to derive the long-dated FX volatility.
2. Derivative assets – Equity and credit contracts
These reversionary property derivatives are valued using a probability weighted set of HPI forward prices, which are assumed to be a reasonable representation of the increase in value of the Santander UK group’s reversionary interest portfolio underlying the derivatives. The probability used reflects the likelihood of the home owner vacating the property and is calculated from mortality rates and acceleration rates which are a function of age and gender, obtained from the relevant mortality tables. Indexing is felt to be appropriate due to the size and geographical dispersion of the Santander UK group’s reversionary interest portfolio. These are determined using HPI Spot Rates adjusted to reflect estimated forward growth. Launched in 1984, the Halifax’s UK HPI is the UK’s longest running monthly house price data series covering the whole country. The indices calculated are standardised and represent the price of a typically transacted house. Both national and regional HPI are published. The national HPI is published monthly. The regional HPI reflects the national HPI disaggregated into 12 UK regions and is published quarterly. Both indices are published on two bases, including and excluding seasonal adjustments in the housing market. The Santander UK group uses the non-seasonally adjusted (‘NSA’) national and regional HPI in its valuation model to avoid any subjective judgement in the adjustment process which is made by Halifax.
The inputs used to determine the value of the reversionary property derivatives are HPI spot, HPI forward growth and mortality rates. The principal pricing parameter is HPI forward growth.
HPI Spot Rate
The HPI spot rate used in the model is a weighted average of NSA regional HPI spot rates i.e. adjusted for difference in the actual regional composition of the property underlying the Santander UK group’s reversionary interest portfolio and the composition of the published regional indices. The regional HPI spot rate (which is observable market data) is only published on specific quarterly dates. In between these dates, its value is estimated by applying the growth rate over the relevant time period inferred from the national HPI spot rates (which are observable market data and published monthly) to the most recently calculated weighted average regional HPI spot rate based on published regional indices.
An adjustment is also made to reflect the specific property risk i.e. possible deviation between the actual growth in the house prices underlying the Santander UK group’s reversionary interest portfolio and their assumed index-linked growth, which is based on the regional HPI. This adjustment is based on the average historical deviation of price changes of the Santander UK group’s actual property portfolio from that of the published indices over the time period since the last valuation date.
HPI Forward Growth Rate
Long-dated HPI forward growth rate is not directly observable in the market but is estimated from broker quotes and traded forward contracts. A specific spread is applied to the long-dated forward growth rate to reflect the uncertainty surrounding long-dated data. This spread is calculated by analysing the historical volatility of the HPI, whilst incorporating mean reversion. An adjustment is made to reflect the specific property risk as for the HPI spot rate above.
Mortality Rate
Mortality rates are obtained from the PNMA00 and PNFA00 Continuous Mortality Investigation Tables published by the UK Institute and Faculty of Actuaries. These mortality rates are adjusted by acceleration rates to reflect the mortality profile of the holders of Santander UK group’s reversionary property products underlying the derivatives. Mortality rates do not have a significant effect on the value of the instruments.
3. Derivative assets – Equity and credit contracts
These derivative assets are credit default swaps held against certain bonds. The credit default swaps are valued using the credit spreads of the referenced bonds. These referenced bonds are valued with the assistance of valuations prepared by an independent, specialist valuation firm as a deep and liquid market does not exist.
In valuing the credit default swaps, the main inputs used to determine the underlying cost of credit are quoted risk premiums and the correlation between the quoted credit derivatives of various issuers. The assumptions relating to the correlation between the values of quoted and unquoted assets are based on historical correlations between the impact of adverse changes in market variables and the corresponding valuation of the associated unquoted assets. The measurement of the assets will vary depending on whether a more or less conservative scenario is selected. The other main input is the probability of default of the referenced bonds. The significant unobservable input for the valuation of these financial instruments is the probability of default.
Probability of default
The probability of default is assessed by considering the credit quality of the underlying referenced bonds. However, as no deep and liquid market exists for these assets the assessment of the probability of default is not directly observable and instead an estimate is calculated using the Standard Gaussian Copula model.
| | |
| Santander UK plc Annual Report 2013 | | 307 |
Financial Statements
Notes to the Financial Statementscontinued
4. Derivative assets – Equity contracts
There are three types of derivatives within this category:
European options –These derivatives are valued using a modified Black-Scholes model where the HPI is log-normally distributed with the forward rates determined from the HPI forward growth.
Asian options –Asian (or average value) options are valued using a modified Black-Scholes model, with an amended strike price and volatility assumption to account for the average exercise period, through a closed form adjustment that reflects the strike price relative to the distribution of stock prices at each relevant date. This is also known as the Curran model.
Forward contracts –Forward contracts are valued using a standard forward pricing model.
The inputs used to determine the value of the above instruments are HPI spot rate, HPI forward growth rate and HPI volatility. The principal pricing parameter is HPI forward growth rate.
HPI Spot Rate
The HPI spot rate used is the NSA national HPI spot rate which is published monthly and directly observable in the market. This HPI rate used is different from the weighted average regional HPI spot rate used in the valuation of Instrument 2 above, as the underlying of these derivatives is the UK national HPI spot rate.
HPI Forward Growth Rate
The HPI forward growth rate used is unobservable and is the same as used in the valuation of Instrument 2 above.
HPI Volatility
Long-dated HPI volatility is not directly observable in the market but is estimated from the most recent traded values. An adjustment is applied to the long-dated HPI volatility rate to reflect the uncertainty surrounding long-dated data. This adjustment is based on the empirical standard deviation of historical volatility over a range of time horizons. HPI volatility rates do not have a significant effect on the value of the instruments.
5. FVTPL – Loans and advances to customers
These loans and advances to customers represent roll-up mortgages, which are an equity release scheme under which a property owner takes out a loan secured against their home. The owner does not make any interest payments during their lifetime and the fixed interest payments are rolled up into the mortgage. The loan or mortgage (capital and rolled-up interest) is repaid upon the owner’s vacation of the property and the value of the loan is only repaid from the value of the property. This is known as a ‘no negative pledge’. The Santander UK group suffers a loss if the sale proceeds from the property are insufficient to repay the loan, as it is unable to pursue the homeowner’s estate or beneficiaries for the shortfall.
The value of the mortgage ‘rolls up’ or accretes until the owner vacates the property. In order to value the roll-up mortgages, the Santander UK group uses a probability-weighted set of European option prices (puts) determined using the Black-Scholes model, in which the ‘no negative pledges’ are valued as short put options. The probability weighting applied is calculated from mortality rates and acceleration rates as a function of age and gender, taken from mortality tables.
The inputs used to determine the value of these instruments are HPI spot, HPI forward growth, HPI volatility, mortality rates and repayment rates. The principal pricing parameter is HPI forward growth. The HPI forward growth rate used is unobservable and is the same as used in the valuation of Instrument 2 above. The other parameters do not have a significant effect on the value of the instruments.
6. FVTPL – Debt securities
These debt securities consisting of reversionary property securities are an equity release scheme, where the property owner receives an upfront lump sum in return for paying a fixed percentage of the sales proceeds of the property when the owner vacates the property. These reversionary property securities are valued using a probability-weighted set of HPI forward prices which are assumed to be a reasonable representation of the increase in value of the Santander UK group’s reversionary interest portfolio underlying the derivatives. The probability weighting used reflects the probability of the home owner vacating the property through death and is calculated from death rates and acceleration factors which are a function of age and gender, obtained from the relevant mortality table.
The inputs used to determine the value of these instruments are HPI spot, HPI forward growth and mortality rates. The principal pricing parameter is HPI forward growth. Discussion of the HPI spot rate, HPI forward growth rate and mortality rates for this financial instrument is the same as Instrument 3 above. An adjustment is also made to reflect the specific property risk. Discussion of the specific property risk adjustment is the same as Instrument 2 above.
7. FVTPL – Debt securities
These securities consist of asset-backed securities issued by Banco Santander entities. Each instrument is valued with reference to the price from a consensus pricing service. This is then corroborated against the price from another consensus pricing service due to the lack of depth in the number of available market quotes. An average price is used where there is a more than insignificant difference between the two sources. The significant unobservable input is the adjustment to the credit spread embedded in the pricing consensus quotes.
8. Derivative liabilities – Equity contracts
These derivatives are the same as Instrument 4 with the exception that they have a negative fair value.
9. FVTPL – Debt securities in issue
These debt securities in issue are PRDC notes. These notes are financial structured products where an investor is seeking a better return and a borrower/issuer a lower rate by taking advantage of the interest rate differential between two countries. The note pays a foreign interest rate in the investor’s domestic currency. The power component of the name denotes higher initial coupons and the fact that coupons rise as the domestic/foreign exchange rate depreciates. The power feature comes with a higher risk for the investor. Cash flows may have a digital cap feature where the rate gets locked once it reaches a certain threshold. Other add-on features are barriers such as knockouts and cancellation provisions for the issuer.
These debt securities in issue are valued using a three-factor Gaussian Model. The three factors used in the valuation are domestic interest rates, foreign interest rates and foreign exchange rates. The correlations between the factors are assumed to be zero within the valuation.
The Hull-White approach is used for estimating the future distribution of domestic and foreign zero-coupon rates, constructed from the relevant yield curves. A Geometric Brownian Motion model is used for estimating the future distribution of spot foreign exchange rates. The
| | |
| 308 | | Santander UK plc Annual Report 2013 |
Financial Statements
Notes to the Financial Statementscontinued
foreign exchange and interest rate volatilities are the most crucial pricing parameters; the model calibrates to the relevant swaption volatility surface.
The significant unobservable inputs for the valuation of these financial instruments are the long dated FX volatility and the correlation between the underlying assets and are the same as Instrument 1.
Reconciliation of fair value measurements in Level 3 of the fair value hierarchy
The following table provides a reconciliation of the movement between opening and closing balances of Level 3 financial instruments, measured at fair value using a valuation technique with significant unobservable inputs:
| | | | | | | | | | | | | | | | | | | | | | | | |
| | | Assets | | | Liabilities | |
| | | Derivatives | | | Fair value
through P&L | | | Total | | | Derivatives | | | Fair value
through P&L | | | Total | |
| | | £m | | | £m | | | £m | | | £m | | | £m | | | £m | |
At 1 January 2013 | | | 215 | | | | 345 | | | | 560 | | | | (57 | ) | | | (86 | ) | | | (143 | ) |
Total gains/(losses) recognised in profit/(loss): | | | | | | | | | | | | | | | | | | | | | | | | |
- Fair value movements | | | (16 | ) | | | 10 | | | | (6 | ) | | | 8 | | | | 7 | | | | 15 | |
- Foreign exchange and other movements | | | (11 | ) | | | 7 | | | | (4 | ) | | | (11 | ) | | | 12 | | | | 1 | |
Sales | | | — | | | | (27 | ) | | | (27 | ) | | | — | | | | — | | | | — | |
Settlements | | | (43 | ) | | | (14 | ) | | | (57 | ) | | | 12 | | | | 30 | | | | 42 | |
| | | | | | | | | | | | | | | | | | | | | | | | |
At 31 December 2013 | | | 145 | | | | 321 | | | | 466 | | | | (48 | ) | | | (37 | ) | | | (85 | ) |
| | | | | | | | | | | | | | | | | | | | | | | | |
Gains/(losses) recognised in profit/(loss) relating to assets and liabilities held at the end of the year | | | (27 | ) | | | 17 | | | | (10 | ) | | | (3 | ) | | | 19 | | | | 16 | |
| | | | | | | | | | | | | | | | | | | | | | | | |
Total gains or losses are included in ‘Net trading and other income’ (see Note 5).
| | | | | | | | | | | | | | | | | | | | | | | | |
| | | Assets | | | Liabilities | |
| | | Derivatives | | | Fair value
through P&L | | | Total | | | Derivatives | | | Fair value
through P&L | | | Total | |
| | | £m | | | £m | | | £m | | | £m | | | £m | | | £m | |
At 1 January 2012 | | | 241 | | | | 359 | | | | 600 | | | | (73 | ) | | | (141 | ) | | | (214 | ) |
Total gains/(losses) recognised in profit/(loss): | | | | | | | | | | | | | | | | | | | | | | | | |
- Fair value movements | | | (2 | ) | | | 17 | | | | 15 | | | | 3 | | | | 7 | | | | 10 | |
- Foreign exchange and other movements | | | (12 | ) | | | (1 | ) | | | (13 | ) | | | — | | | | 16 | | | | 16 | |
Purchases | | | 10 | | | | — | | | | 10 | | | | — | | | | — | | | | — | |
Sales | | | — | | | | (25 | ) | | | (25 | ) | | | — | | | | — | | | | — | |
Settlements | | | (22 | ) | | | (5 | ) | | | (27 | ) | | | 13 | | | | 32 | | | | 45 | |
| | | | | | | | | | | | | | | | | | | | | | | | |
At 31 December 2012 | | | 215 | | | | 345 | | | | 560 | | | | (57 | ) | | | (86 | ) | | | (143 | ) |
| | | | | | | | | | | | | | | | | | | | | | | | |
Gains/(losses) recognised in profit/(loss) relating to assets and liabilities held at the end of the year | | | (14 | ) | | | 16 | | | | 2 | | | | 3 | | | | 23 | | | | 26 | |
| | | | | | | | | | | | | | | | | | | | | | | | |
Financial instrument assets and liabilities at 31 December 2013
Financial instrument assets valued using internal models based on information other than market data were 0.9% (2012: 0.9%) of total assets measured at fair value and 0.2% (2012: 0.2%) of total assets at 31 December 2013.
Derivative assets decreased in 2013 principally due to settlements. Assets designated at fair value through profit or loss were broadly unchanged in 2013 as increases due to fair value movements were offset by sales and settlements.
Financial instrument liabilities valued using internal models based on information other than market data were 0.2% (2012: 0.3%) of total liabilities measured at fair value and 0.03% (2012: 0.1%) of total liabilities at 31 December 2013.
Derivative liabilities decreased in 2013 due to settlements. Liabilities designated at fair value through profit or loss decreased in 2013 due to fair value and foreign exchange movements and settlements.
Financial instrument assets and liabilities at 31 December 2012
Financial instrument assets valued using internal models based on information other than market data were 0.9% (2011: 1%) of total assets measured at fair value and 0.2% (2011: 0.2%) of total assets at 31 December 2012. Derivative assets decreased in 2012 principally due to settlements and foreign exchange movements offset by purchases. Assets designated at fair value through profit or loss decreased in 2012 as primarily due to sales offset by increases in fair value movements.
Financial instrument liabilities valued using internal models based on information other than market data were 0.3% (2011: 0.3%) of total liabilities measured at fair value and 0.1% (2011: 0.1%) of total liabilities at 31 December 2012.
Derivative liabilities decreased in 2012 primarily due to settlements. Liabilities designated at fair value through profit or loss decreased due to fair value and foreign exchange movements and settlements.
Gains and losses for the year ended 31 December 2013
Losses of £27m in respect of derivative assets principally reflected changes in credit spreads and the HPI Index, and unfavourable movements in foreign exchange rates. Gains of £17m in respect of assets designated at fair value through profit or loss principally reflected the mark-to-market volatility on the reversionary property securities arising from a continued low interest rate environment, changes in the HPI index and a maturing portfolio.
Losses of £3m in respect of derivative liabilities principally reflected changes in credit spreads and the HPI Index. Gains of £19m in respect of liabilities designated at fair value through profit or loss principally reflected changes in foreign exchange. They are fully matched with derivatives.
| | |
| Santander UK plc Annual Report 2013 | | 309 |
Financial Statements
Notes to the Financial Statementscontinued
Gains and losses for the year ended 31 December 2012
Losses of £14m in respect of derivative assets principally reflected changes in credit spreads and the HPI Index, and unfavourable movements in foreign exchange rates. Gains of £16m in respect of assets designated at fair value through profit or loss principally reflected the mark-to-market volatility on the reversionary property securities arising from a continued low interest rate environment, changes in the HPI index and a maturing portfolio.
Gains of £3m in respect of derivative liabilities principally reflected changes in credit spreads and the HPI Index. Gains of £23m in respect of liabilities designated at fair value through profit or loss principally reflected changes in foreign exchange. They are fully matched with derivatives.
Effect of changes in significant unobservable assumptions to reasonably possible alternatives (Level 3)
As discussed above, the fair value of financial instruments are, in certain circumstances, measured using valuation techniques that incorporate assumptions that are not evidenced by prices from observable current market transactions in the same instrument and are not based on observable market data and, as such require the application of a degree of judgement. Changing one or more of the inputs to the valuation models to reasonably possible alternative assumptions would change the fair values significantly. The following table shows the sensitivity of these fair values to reasonably possible alternative assumptions.
Favourable and unfavourable changes are determined on the basis of changes in the value of the instrument as a result of varying the levels of the unobservable input as described in the table below. The potential effects do not take into effect any hedged positions.
31 December 2013
| | | | | | | | | | | | | | | | | | | | | | | | | | |
| | | | | | | | | | | | | | | | | Reflected in income statement | |
Balance sheet note line item and product | | Fair value | | | Significant unobservable input | | | Shift | | | Favourable
changes | | | Unfavourable
changes | |
| | | | | | | | Assumption value | | | | | | | | | | |
| | | £m | | | Assumption description | | Range(1) | | | Weighted
average | | | | | | £m | | | £m | |
2.Derivative assets– Equity and credit contracts: | | | 71 | | | HPI Forward growth rate | | | 0%-5 | % | | | 2.67 | % | | | 1 | % | | | 11 | | | | (11 | ) |
–Reversionary property derivative | | | | | | HPI Spot rate | | | n/a | | | | 578 | (2) | | | 10 | % | | | 8 | | | | (8 | ) |
3.Derivative assets– Equity and credit contracts: | | | 13 | | | Probability of default | | | 0.1%-1.2 | % | | | 0.7 | % | | | 20 | % | | | 3 | | | | (3 | ) |
– Credit default swaps | | | | | | | | | | | | | | | | | | | | | | | | | | |
4.Derivative assets– Equity and credit contracts: | | | 47 | | | HPI Forward growth rate | | | 0%-5 | % | | | 1.62 | % | | | 1 | % | | | 5 | | | | (5 | ) |
– Options and forwards | | | | | | HPI Spot rate | | | n/a | | | | 565 | (2) | | | 10 | % | | | 11 | | | | (10 | ) |
5. FVTPL– Loans and advances to customers: | | | 51 | | | HPI Forward growth rate | | | 0%-5 | % | | | 2.85 | % | | | 1 | % | | | 1 | | | | (1 | ) |
– Roll-up mortgage portfolio | | | | | | | | | | | | | | | | | | | | | | | | | | |
6. FVTPL– Debt securities: | | | 212 | | | HPI Forward growth rate | | | 0%-5 | % | | | 2.67 | % | | | 1 | % | | | 15 | | | | (16 | ) |
– Reversionary property securities | | | | | | HPI Spot rate | | | n/a | | | | 578 | (2) | | | 10 | % | | | 20 | | | | (20 | ) |
7. FVTPL– Debt securities: | | | 58 | | | Credit spread | | | 0%-15 | % | | | 5 | % | | | 10 | % | | | 6 | | | | (6 | ) |
– Mortgage-backed securities | | | | | | | | | | | | | | | | | | | | | | | | | | |
8. Derivative liabilities- Equity and credit contracts: | | | (48 | ) | | HPI Forward growth rate | | | 0%-5 | % | | | 1.62 | % | | | 1 | % | | | 2 | | | | (2 | ) |
– Options and forwards | | | | | | HPI Spot rate | | | n/a | | | | 565 | (2) | | | 10 | % | | | 7 | | | | (10 | ) |
| (1) | The range of actual assumption values used to calculate the weighted average disclosure. |
| (2) | Represents the HPI spot rate index level at 31 December 2013. |
31 December 2012
| | | | | | | | | | | | | | | | | | | | | | | | | | |
| | | | | | | | | | | | | | | | | Reflected in income statement | |
Balance sheet note line item and product | | Fair value | | | Significant unobservable input | | | Shift | | | Favourable
changes | | | Unfavourable
changes | |
| | | | | | | | Assumption value | | | | | | | | | | |
| | | £m | | | Assumption description | | Range(1) | | | Weighted
average | | | | | | £m | | | £m | |
2. Derivative assets – Equity and credit contracts: | | | 76 | | | HPI Forward growth rate | | | 0%-5 | % | | | 2.87 | % | | | 1 | % | | | 11 | | | | (11 | ) |
– Reversionary property derivatives | | | | | | HPI Spot rate | | | n/a | | | | 536 | (2) | | | 10 | % | | | 8 | | | | (8 | ) |
3. Derivative assets – Equity and credit contracts: | | | 17 | | | Probability of default | | | 0.1%-1.2 | % | | | 0.7 | % | | | 20 | % | | | 3 | | | | (3 | ) |
– Credit default swaps | | | | | | | | | | | | | | | | | | | | | | | | | | |
4. Derivative assets – Equity and credit contracts: | | | 86 | | | HPI Forward growth rate | | | 0%-5 | % | | | 2.21 | % | | | 1 | % | | | 7 | | | | (7 | ) |
– Options and forwards | | | | | | HPI Spot rate | | | n/a | | | | 521 | (2) | | | 10 | % | | | 12 | | | | (11 | ) |
5. FVTPL – Loans and advances to customers: | | | 61 | | | HPI Forward growth rate | | | 0%-5 | % | | | 2.94 | % | | | 1 | % | | | 2 | | | | (2 | ) |
– Roll-up mortgage portfolio | | | | | | | | | | | | | | | | | | | | | | | | | | |
6. FVTPL – Debt securities: | | | 235 | | | HPI Forward growth rate | | | 0%-5 | % | | | 2.87 | % | | | 1 | % | | | 19 | | | | (19 | ) |
– Reversionary property securities | | | | | | HPI Spot rate | | | n/a | | | | 536 | (2) | | | 10 | | | | 22 | | | | (22 | ) |
7. FVTPL – Debt securities: | | | 49 | | | Credit spread | | | 2%-12 | % | | | 6 | % | | | 10 | % | | | 5 | | | | (5 | ) |
– Mortgage-backed securities | | | | | | | | | | | | | | | | | | | | | | | | | | |
8. Derivative liabilities - Equity and credit contracts: | | | (57 | ) | | HPI Forward growth rate | | | 0%-5 | % | | | 2.21 | % | | | 1 | % | | | 3 | | | | (3 | ) |
– Options and forwards | | | | | | HPI Spot rate | | | n/a | | | | 521 | (2) | | | 10 | % | | | 6 | | | | (9 | ) |
| (1) | The range of actual assumption values used to calculate the weighted average disclosure. |
| (2) | Represents the HPI spot rate index level at 31 December 2012. |
No sensitivities are presented for the FVTPL - debt securities in issue (instrument 9) and related exchange rate derivatives (instrument 1), as the terms of these instruments are fully matched. As a result, any changes in the valuation of the debt securities in issue would be exactly offset by an equal and opposite change in the valuation of the exchange rate derivatives.
| | |
| 310 | | Santander UK plc Annual Report 2013 |
Financial Statements
Notes to the Financial Statementscontinued
i) Maturities of financial assets, liabilities and off-balance sheet commitments
The table below analyses the maturities of the undiscounted cash flows relating to financial assets, liabilities and off-balance sheet commitments of the Santander UK group based on the remaining period to the contractual maturity date at the balance sheet date. Deposits by customers largely consist of retail deposits.
There are no significant financial liabilities related to financial guarantee contracts. This table is not intended to show the liquidity of the Santander UK group.
| | | | | | | | | | | | | | | | | | | | | | | | | | | | | | | | | | | | | | | | |
| At 31 December 2013 | | Group | |
| | | On
Demand
£m | | | Within
1 month
£m | | | 1-3
months
£m | | | 3-6
months
£m | | | 6-9
months
£m | | | 9 months
to 1 year
£m | | | 1-2
years
£m | | | 2-5
years
£m | | | Over
5 years
£m | | | Total
£m | |
Assets | | | | | | | | | | | | | | | | | | | | | | | | | | | | | | | | | | | | | | | | |
Cash and balances at central banks | | | 26,036 | | | | — | | | | — | | | | — | | | | 315 | | | | — | | | | — | | | | — | | | | — | | | | 26,351 | |
Trading assets | | | 5,807 | | | | — | | | | — | | | | — | | | | — | | | | 32 | | | | 14,209 | | | | 1,677 | | | | 1,701 | | | | 23,426 | |
Derivative financial instruments | | | 137 | | | | 313 | | | | 490 | | | | 692 | | | | 736 | | | | 1,714 | | | | 1,823 | | | | 14,005 | | | | 855 | | | | 20,765 | |
Financial assets designated at FVTPL | | | — | | | | — | | | | — | | | | — | | | | — | | | | — | | | | 2 | | | | 60 | | | | 3,199 | | | | 3,261 | |
Loans and advances to banks | | | 1,237 | | | | 69 | | | | 3 | | | | — | | | | 1 | | | | — | | | | 23 | | | | — | | | | 1,037 | | | | 2,370 | |
Loans and advances to customers | | | 1,324 | | | | 2,049 | | | | 2,567 | | | | 2,537 | | | | 2,224 | | | | 3,008 | | | | 9,276 | | | | 29,213 | | | | 163,356 | | | | 215,554 | |
Available-for-sale securities | | | 9 | | | | — | | | | — | | | | — | | | | — | | | | — | | | | — | | | | 2,911 | | | | 2,602 | | | | 5,522 | |
Loans and receivables securities | | | — | | | | — | | | | — | | | | — | | | | — | | | | — | | | | 106 | | | | 77 | | | | 1,099 | | | | 1,282 | |
Macro hedge of interest rate risk | | | — | | | | — | | | | — | | | | 2 | | | | 18 | | | | 3 | | | | 27 | | | | 117 | | | | 995 | | | | 1,162 | |
| | | | | | | | | | | | | | | | | | | | | | | | | | | | | | | | | | | | | | | | |
Total financial assets | | | 34,550 | | | | 2,431 | | | | 3,060 | | | | 3,231 | | | | 3,294 | | | | 4,757 | | | | 25,466 | | | | 48,060 | | | | 174,844 | | | | 299,693 | |
Other assets | | | 4,912 | | | | — | | | | — | | | | — | | | | — | | | | — | | | | — | | | | — | | | | — | | | | 4,912 | |
| | | | | | | | | | | | | | | | | | | | | | | | | | | | | | | | | | | | | | | | |
Total assets | | | 39,462 | | | | 2,431 | | | | 3,060 | | | | 3,231 | | | | 3,294 | | | | 4,757 | | | | 25,466 | | | | 48,060 | | | | 174,844 | | | | 304,605 | |
| | | | | | | | | | | | | | | | | | | | | | | | | | | | | | | | | | | | | | | | |
Liabilities | | | | | | | | | | | | | | | | | | | | | | | | | | | | | | | | | | | | | | | | |
Deposits by banks | | | 2,929 | | | | 195 | | | | 477 | | | | 189 | | | | 22 | | | | 19 | | | | 602 | | | | 3,953 | | | | 592 | | | | 8,978 | |
Deposits by customers | | | 117,036 | | | | 2,649 | | | | 5,640 | | | | 3,962 | | | | 4,355 | | | | 6,532 | | | | 3,362 | | | | 3,498 | | | | 691 | | | | 147,725 | |
Derivative financial instruments: | | | | | | | | | | | | | | | | | | | | | | | | | | | | | | | | | | | | | | | | |
- Held for trading | | | 159 | | | | 239 | | | | 362 | | | | 302 | | | | 440 | | | | 758 | | | | 1,774 | | | | 3,252 | | | | 11,662 | | | | 18,948 | |
- Held for hedging(1) | | | — | | | | 35 | | | | 30 | | | | 72 | | | | 75 | | | | 28 | | | | 270 | | | | 261 | | | | 929 | | | | 1,700 | |
Trading liabilities | | | 1,885 | | | | 11,504 | | | | 4,631 | | | | 255 | | | | 204 | | | | 304 | | | | 277 | | | | 1,279 | | | | 1,224 | | | | 21,563 | |
Financial liabilities designated at FVPTL | | | — | | | | 141 | | | | 584 | | | | 214 | | | | 107 | | | | 434 | | | | 370 | | | | 738 | | | | 907 | | | | 3,495 | |
Debt securities in issue | | | — | | | | 2,302 | | | | 2,904 | | | | 3,292 | | | | 2,203 | | | | 1,598 | | | | 5,148 | | | | 10,261 | | | | 35,864 | | | | 63,572 | |
Subordinated liabilities | | | — | | | | 83 | | | | 40 | | | | 59 | | | | 59 | | | | 63 | | | | 241 | | | | 775 | | | | 5,238 | | | | 6,558 | |
| | | | | | | | | | | | | | | | | | | | | | | | | | | | | | | | | | | | | | | | |
Total financial liabilities | | | 122,009 | | | | 17,148 | | | | 14,668 | | | | 8,345 | | | | 7,465 | | | | 9,736 | | | | 12,044 | | | | 24,017 | | | | 57,107 | | | | 272,539 | |
Other liabilities | | | — | | | | 1,740 | | | | — | | | | — | | | | — | | | | — | | | | — | | | | — | | | | — | | | | 1,740 | |
Equity(2) | | | — | | | | — | | | | — | | | | — | | | | — | | | | — | | | | — | | | | — | | | | 12,520 | | | | 12,520 | |
| | | | | | | | | | | | | | | | | | | | | | | | | | | | | | | | | | | | | | | | |
Total liabilities and shareholders equity | | | 122,009 | | | | 18,888 | | | | 14,668 | | | | 8,345 | | | | 7,465 | | | | 9,736 | | | | 12,044 | | | | 24,017 | | | | 69,627 | | | | 286,799 | |
| | | | | | | | | | | | | | | | | | | | | | | | | | | | | | | | | | | | | | | | |
Off-balance sheet commitments given | | | 11,049 | | | | 444 | | | | 1,427 | | | | 3,634 | | | | 110 | | | | 380 | | | | 2,017 | | | | 7,080 | | | | 6,846 | | | | 32,987 | |
| | | | | | | | | | | | | | | | | | | | | | | | | | | | | | | | | | | | | | | | |
| |
| At 31 December 2012 | | Group | |
| | | On
Demand
£m | | | Within
1 month
£m | | | 1-3
months
£m | | | 3-6
months
£m | | | 6-9
months
£m | | | 9 months
to 1 year
£m | | | 1-2
years
£m | | | 2-5
years
£m | | | Over
5 years
£m | | | Total
£m | |
Assets | | | | | | | | | | | | | | | | | | | | | | | | | | | | | | | | | | | | | | | | |
Cash and balances at central banks | | | 29,079 | | | | — | | | | — | | | | — | | | | 203 | | | | — | | | | — | | | | — | | | | — | | | | 29,282 | |
Trading assets | | | 1 | | | | 13,013 | | | | 4,802 | | | | 1,143 | | | | 2,218 | | | | 31 | | | | 26 | | | | 483 | | | | 868 | | | | 22,585 | |
Derivative financial instruments | | | 496 | | | | 592 | | | | 1,067 | | | | 414 | | | | 269 | | | | 209 | | | | 1,249 | | | | 5,030 | | | | 22,289 | | | | 31,615 | |
Financial assets designated at FVPTL | | | — | | | | 1 | | | | 13 | | | | 8 | | | | 1 | | | | — | | | | — | | | | 122 | | | | 3,972 | | | | 4,117 | |
Loans and advances to banks | | | 1,172 | | | | 273 | | | | 5 | | | | 123 | | | | — | | | | — | | | | 25 | | | | 47 | | | | 818 | | | | 2,463 | |
Loans and advances to customers | | | 1,314 | | | | 2,166 | | | | 2,226 | | | | 2,713 | | | | 2,365 | | | | 2,586 | | | | 9,002 | | | | 29,555 | | | | 172,630 | | | | 224,557 | |
Available-for-sale securities | | | — | | | | — | | | | — | | | | 149 | | | | 1,753 | | | | — | | | | — | | | | 3,252 | | | | 419 | | | | 5,573 | |
Loans and receivables securities | | | — | | | | — | | | | — | | | | 1 | | | | — | | | | — | | | | 105 | | | | 140 | | | | 1,099 | | | | 1,345 | |
Macro hedge of interest rate risk | | | — | | | | 20 | | | | 18 | | | | 10 | | | | 1 | | | | 1 | | | | 82 | | | | 266 | | | | 824 | | | | 1,222 | |
| | | | | | | | | | | | | | | | | | | | | | | | | | | | | | | | | | | | | | | | |
Total financial assets | | | 32,062 | | | | 16,065 | | | | 8,131 | | | | 4,561 | | | | 6,810 | | | | 2,827 | | | | 10,489 | | | | 38,895 | | | | 202,919 | | | | 322,759 | |
Other assets | | | 4,998 | | | | — | | | | — | | | | — | | | | — | | | | — | | | | — | | | | — | | | | — | | | | 4,998 | |
| | | | | | | | | | | | | | | | | | | | | | | | | | | | | | | | | | | | | | | | |
Total assets | | | 37,060 | | | | 16,065 | | | | 8,131 | | | | 4,561 | | | | 6,810 | | | | 2,827 | | | | 10,489 | | | | 38,895 | | | | 202,919 | | | | 327,757 | |
| | | | | | | | | | | | | | | | | | | | | | | | | | | | | | | | | | | | | | | | |
Liabilities | | | | | | | | | | | | | | | | | | | | | | | | | | | | | | | | | | | | | | | | |
Deposits by banks | | | 2,324 | | | | 691 | | | | 666 | | | | 48 | | | | 25 | | | | 635 | | | | 875 | | | | 4,771 | | | | 219 | | | | 10,254 | |
Deposits by customers | | | 111,603 | | | | 979 | | | | 5,967 | | | | 6,151 | | | | 6,251 | | | | 5,619 | | | | 6,849 | | | | 5,596 | | | | 829 | | | | 149,844 | |
Derivative financial instruments: | | | | | | | | | | | | | | | | | | | | | | | | | | | | | | | | | | | | | | | | |
- Held for trading | | | 229 | | | | 637 | | | | 356 | | | | 443 | | | | 325 | | | | 289 | | | | 750 | | | | 5,228 | | | | 20,550 | | | | 28,807 | |
- Held for hedging(1) | | | 3 | | | | 8 | | | | 156 | | | | — | | | | — | | | | 233 | | | | 112 | | | | 783 | | | | 181 | | | | 1,476 | |
Trading liabilities | | | 4,377 | | | | 5,574 | | | | 4,670 | | | | 1,649 | | | | 237 | | | | 108 | | | | 752 | | | | 786 | | | | 3,299 | | | | 21,452 | |
Financial liabilities designated at FVPTL | | | — | | | | 735 | | | | 341 | | | | 129 | | | | 334 | | | | 165 | | | | 539 | | | | 1,031 | | | | 836 | | | | 4,110 | |
Debt securities in issue | | | — | | | | 5,659 | | | | 2,580 | | | | 3,025 | | | | 1,741 | | | | 499 | | | | 6,138 | | | | 13,046 | | | | 50,865 | | | | 83,553 | |
Subordinated liabilities | | | — | | | | 77 | | | | 38 | | | | 57 | | | | 57 | | | | 61 | | | | 233 | | | | 751 | | | | 4,721 | | | | 5,995 | |
| | | | | | | | | | | | | | | | | | | | | | | | | | | | | | | | | | | | | | | | |
Total financial liabilities | | | 118,536 | | | | 14,360 | | | | 14,774 | | | | 11,502 | | | | 8,970 | | | | 7,609 | | | | 16,248 | | | | 31,992 | | | | 81,500 | | | | 305,491 | |
Other liabilities | | | — | | | | 2,526 | | | | — | | | | — | | | | — | | | | — | | | | — | | | | — | | | | — | | | | 2,526 | |
Equity(2) | | | — | | | | — | | | | — | | | | — | | | | — | | | | — | | | | — | | | | — | | | | 12,949 | | | | 12,949 | |
| | | | | | | | | | | | | | | | | | | | | | | | | | | | | | | | | | | | | | | | |
Total liabilities and shareholders equity | | | 118,536 | | | | 16,886 | | | | 14,774 | | | | 11,502 | | | | 8,970 | | | | 7,609 | | | | 16,248 | | | | 31,992 | | | | 94,449 | | | | 320,966 | |
| | | | | | | | | | | | | | | | | | | | | | | | | | | | | | | | | | | | | | | | |
Off-balance sheet commitments given | | | 20,317 | | | | 352 | | | | 897 | | | | 1,293 | | | | 876 | | | | 882 | | | | 965 | | | | 6,709 | | | | 7,055 | | | | 39,346 | |
| | | | | | | | | | | | | | | | | | | | | | | | | | | | | | | | | | | | | | | | |
| (1) | Comprises the derivative liabilities for which contractual maturities are essential for an understanding of the timing of the cash flows. |
| (2) | Equity has no maturity and therefore has been classified in the “over five years” column. |
| | |
| Santander UK plc Annual Report 2013 | | 311 |
Financial Statements
Notes to the Financial Statementscontinued
| | | | | | | | | | | | | | | | | | | | | | | | | | | | | | | | | | | | | | | | |
| At 31 December 2013 | | Company | |
| | | On
Demand
£m | | | Within
1 month
£m | | | 1-3
months
£m | | | 3-6
months
£m | | | 6-9
months
£m | | | 9 months
to 1 year
£m | | | 1-2
years
£m | | | 2-5
years
£m | | | Over
5 years
£m | | | Total
£m | |
Assets | | | | | | | | | | | | | | | | | | | | | | | | | | | | | | | | | | | | | | | | |
Cash and balances at central banks | | | 21,099 | | | | — | | | | — | | | | — | | | | 277 | | | | — | | | | — | | | | — | | | | — | | | | 21,376 | |
Derivative financial instruments | | | 579 | | | | 10 | | | | 3 | | | | 4 | | | | 5 | | | | 7 | | | | 130 | | | | 382 | | | | 1,459 | | | | 2,579 | |
Financial assets designated at FVPTL | | | — | | | | — | | | | — | | | | — | | | | — | | | | — | | | | — | | | | — | | | | 1 | | | | 1 | |
Loans and advances to banks | | | 18,191 | | | | 3,615 | | | | 28,021 | | | | 3,203 | | | | 4,842 | | | | 2,240 | | | | 21,560 | | | | 21,946 | | | | 6,301 | | | | 109,919 | |
Loans and advances to customers | | | 1,072 | | | | 2,073 | | | | 1,427 | | | | 1,755 | | | | 1,640 | | | | 2,073 | | | | 6,312 | | | | 19,879 | | | | 132,678 | | | | 168,909 | |
Available-for-sale securities | | | 11 | | | | — | | | | — | | | | — | | | | — | | | | — | | | | — | | | | 834 | | | | 1,439 | | | | 2,284 | |
Loans and receivables securities | | | — | | | | — | | | | — | | | | — | | | | — | | | | — | | | | 106 | | | | 56 | | | | 827 | | | | 989 | |
Macro hedge of interest rate risk | | | — | | | | — | | | | — | | | | — | | | | — | | | | — | | | | — | | | | — | | | | — | | | | — | |
| | | | | | | | | | | | | | | | | | | | | | | | | | | | | | | | | | | | | | | | |
Total financial assets | | | 40,952 | | | | 5,698 | | | | 29,451 | | | | 4,962 | | | | 6,764 | | | | 4,320 | | | | 28,108 | | | | 43,097 | | | | 142,705 | | | | 306,057 | |
Other assets | | | 10,344 | | | | — | | | | — | | | | — | | | | — | | | | — | | | | — | | | | — | | | | — | | | | 10,344 | |
| | | | | | | | | | | | | | | | | | | | | | | | | | | | | | | | | | | | | | | | |
Total assets | | | 51,296 | | | | 5,698 | | | | 29,451 | | | | 4,962 | | | | 6,764 | | | | 4,320 | | | | 28,108 | | | | 43,097 | | | | 142,705 | | | | 316,401 | |
| | | | | | | | | | | | | | | | | | | | | | | | | | | | | | | | | | | | | | | | |
Liabilities | | | | | | | | | | | | | | | | | | | | | | | | | | | | | | | | | | | | | | | | |
Deposits by banks | | | 17,946 | | | | 6,929 | | | | 14,414 | | | | 10,485 | | | | 10,026 | | | | 3,453 | | | | 18,265 | | | | 22,280 | | | | 14,786 | | | | 118,584 | |
Deposits by customers | | | 113,072 | | | | 818 | | | | 5,672 | | | | 3,598 | | | | 4,138 | | | | 4,118 | | | | 3,571 | | | | 3,213 | | | | 46,460 | | | | 184,660 | |
Derivative financial instruments: | | | | | | | | | | | | | | | | | | | | | | | | | | | | | | | | | | | | | | | | |
- Held for trading | | | 19 | | | | 1 | | | | 8 | | | | 4 | | | | 5 | | | | 6 | | | | 19 | | | | 286 | | | | 1,477 | | | | 1,825 | |
- Held for hedging(1) | | | — | | | | — | | | | — | | | | — | | | | — | | | | — | | | | 1 | | | | 1 | | | | 200 | | | | 202 | |
Debt securities in issue | | | — | | | | 2 | | | | 1 | | | | 2 | | | | 2 | | | | 43 | | | | 110 | | | | — | | | | — | | | | 160 | |
Subordinated liabilities | | | — | | | | 74 | | | | 34 | | | | 52 | | | | 52 | | | | 54 | | | | 209 | | | | 627 | | | | 3,896 | | | | 4,998 | |
| | | | | | | | | | | | | | | | | | | | | | | | | | | | | | | | | | | | | | | | |
Total financial liabilities | | | 131,037 | | | | 7,824 | | | | 20,129 | | | | 14,141 | | | | 14,223 | | | | 7,674 | | | | 22,175 | | | | 26,407 | | | | 66,819 | | | | 310,429 | |
Other liabilities | | | — | | | | 1,441 | | | | — | | | | — | | | | — | | | | — | | | | — | | | | — | | | | — | | | | 1,441 | |
Equity(2) | | | — | | | | — | | | | — | | | | — | | | | — | | | | — | | | | — | | | | — | | | | 11,876 | | | | 11,876 | |
| | | | | | | | | | | | | | | | | | | | | | | | | | | | | | | | | | | | | | | | |
Total liabilities and shareholders equity | | | 131,037 | | | | 9,265 | | | | 20,129 | | | | 14,141 | | | | 14,223 | | | | 7,674 | | | | 22,175 | | | | 26,407 | | | | 78,695 | | | | 323,746 | |
| | | | | | | | | | | | | | | | | | | | | | | | | | | | | | | | | | | | | | | | |
Off-balance sheet commitments given | | | 4,158 | | | | 412 | | | | 1,303 | | | | 3,385 | | | | 15 | | | | 66 | | | | 427 | | | | 696 | �� | | | 4,952 | | | | 15,414 | |
| | | | | | | | | | | | | | | | | | | | | | | | | | | | | | | | | | | | | | | | |
| |
| At 31 December 2012 | | Company | |
| | | On
Demand
£m | | | Within
1 month
£m | | | 1-3
months
£m | | | 3-6
months
£m | | | 6-9
months
£m | | | 9 months
to 1 year
£m | | | 1-2
years
£m | | | 2-5
years
£m | | | Over
5 years
£m | | | Total
£m | |
Assets | | | | | | | | | | | | | | | | | | | | | | | | | | | | | | | | | | | | | | | | |
Cash and balances at central banks | | | 28,704 | | | | — | | | | — | | | | — | | | | 179 | | | | — | | | | — | | | | — | | | | — | | | | 28,883 | |
Derivative financial instruments | | | 15 | | | | 32 | | | | 22 | | | | 31 | | | | 17 | | | | 1 | | | | 113 | | | | 1,620 | | | | 3,864 | | | | 5,715 | |
Financial assets designated at FVPTL | | | — | | | | — | | | | — | | | | — | | | | — | | | | — | | | | — | | | | — | | | | 48 | | | | 48 | |
Loans and advances to banks | | | 6,223 | | | | 3,049 | | | | 16,398 | | | | 6,504 | | | | 5,093 | | | | 8,078 | | | | 15,911 | | | | 17,867 | | | | 19,684 | | | | 98,807 | |
Loans and advances to customers | | | 974 | | | | 1,835 | | | | 1,308 | | | | 2,030 | | | | 1,643 | | | | 1,660 | | | | 6,315 | | | | 19,304 | | | | 163,561 | | | | 198,630 | |
Available-for-sale securities | | | — | | | | — | | | | — | | | | — | | | | — | | | | — | | | | — | | | | 353 | | | | 11 | | | | 364 | |
Loans and receivables securities | | | — | | | | — | | | | — | | | | 1 | | | | — | | | | — | | | | 105 | | | | 321 | | | | 5,980 | | | | 6,407 | |
Macro hedge of interest rate risk | | | — | | | | — | | | | 1 | | | | 1 | | | | 1 | | | | 1 | | | | 3 | | | | 5 | | | | 3 | | | | 15 | |
| | | | | | | | | | | | | | | | | | | | | | | | | | | | | | | | | | | | | | | | |
Total financial assets | | | 35,916 | | | | 4,916 | | | | 17,729 | | | | 8,567 | | | | 6,933 | | | | 9,740 | | | | 22,447 | | | | 39,470 | | | | 193,151 | | | | 338,869 | |
Other assets | | | 11,051 | | | | — | | | | — | | | | — | | | | — | | | | — | | | | — | | | | — | | | | — | | | | 11,051 | |
| | | | | | | | | | | | | | | | | | | | | | | | | | | | | | | | | | | | | | | | |
Total assets | | | 46,967 | | | | 4,916 | | | | 17,729 | | | | 8,567 | | | | 6,933 | | | | 9,740 | | | | 22,447 | | | | 39,470 | | | | 193,151 | | | | 349,920 | |
| | | | | | | | | | | | | | | | | | | | | | | | | | | | | | | | | | | | | | | | |
Liabilities | | | | | | | | | | | | | | | | | | | | | | | | | | | | | | | | | | | | | | | | |
Deposits by banks | | | 28,280 | | | | 4,097 | | | | 37,437 | | | | 5,478 | | | | 4,413 | | | | 3,619 | | | | 16,053 | | | | 9,619 | | | | 1,484 | | | | 110,480 | |
Deposits by customers | | | 106,470 | | | | 592 | | | | 5,698 | | | | 4,845 | | | | 4,563 | | | | 4,705 | | | | 3,946 | | | | 7,929 | | | | 56,741 | | | | 195,489 | |
Derivative financial instruments | | | | | | | | | | | | | | | | | | | | | | | | | | | | | | | | | | | | | | | | |
- Held for trading | | | 44 | | | | 2 | | | | 26 | | | | 3 | | | | 2 | | | | 2 | | | | 21 | | | | 151 | | | | 1,919 | | | | 2,170 | |
- Held for hedging(1) | | | — | | | | — | | | | — | | | | — | | | | — | | | | — | | | | — | | | | — | | | | 2 | | | | 2 | |
Debt securities in issue | | | — | | | | 16 | | | | 106 | | | | 437 | | | | 5 | | | | 6 | | | | 59 | | | | 110 | | | | — | | | | 739 | |
Subordinated liabilities | | | — | | | | 78 | | | | 40 | | | | 61 | | | | 61 | | | | 64 | | | | 246 | | | | 803 | | | | 4,841 | | | | 6,194 | |
| | | | | | | | | | | | | | | | | | | | | | | | | | | | | | | | | | | | | | | | |
Total financial liabilities | | | 134,794 | | | | 4,785 | | | | 43,307 | | | | 10,824 | | | | 9,044 | | | | 8,396 | | | | 20,325 | | | | 18,612 | | | | 64,987 | | | | 315,074 | |
Other liabilities | | | — | | | | 2,156 | | | | — | | | | — | | | | — | | | | — | | | | — | | | | — | | | | — | | | | 2,156 | |
Equity(2) | | | — | | | | — | | | | — | | | | — | | | | — | | | | — | | | | — | | | | — | | | | 15,102 | | | | 15,102 | |
| | | | | | | | | | | | | | | | | | | | | | | | | | | | | | | | | | | | | | | | |
Total liabilities and shareholders equity | | | 134,794 | | | | 6,941 | | | | 43,307 | | | | 10,824 | | | | 9,044 | | | | 8,396 | | | | 20,325 | | | | 18,612 | | | | 80,089 | | | | 332,332 | |
| | | | | | | | | | | | | | | | | | | | | | | | | | | | | | | | | | | | | | | | |
Off-balance sheet commitments given | | | 3,332 | | | | 203 | | | | 704 | | | | 668 | | | | 674 | | | | 674 | | | | 330 | | | | 983 | | | | 5,116 | | | | 12,684 | |
| | | | | | | | | | | | | | | | | | | | | | | | | | | | | | | | | | | | | | | | |
| (1) | Include the remaining contractual maturities for which contractual maturities are essential for an understanding of the timing of the cash flows. |
| (2) | Equity has no maturity and therefore has been classified in the “over five years” column. |
As the above table is based on contractual maturities, no account is taken of a customer’s ability to repay early where it exists or call features related to subordinated liabilities. The repayment terms of debt securities may be accelerated in line with the covenants described in Note 34. In addition, no account is taken of the possible early repayment of the Santander UK group’s mortgage-backed non-recourse finance which is redeemed by the Santander UK group as funds become available from redemptions of the residential mortgages. The Santander UK group has no control over the timing and amount of redemptions of residential mortgages.
| | |
| 312 | | Santander UK plc Annual Report 2013 |
Financial Statements
Notes to the Financial Statementscontinued
46. OFFSETTING FINANCIAL ASSETS AND LIABILITIES
In accordance with IAS 32 Financial Instruments: Presentation, the Santander UK group reports financial assets and financial liabilities on a net basis on the balance sheet only if there is a legally enforceable right to set off the recognised amounts and there is intention to settle on a net basis, or to realise the asset and settle the liability simultaneously. The following table shows the impact of netting arrangements on:
| • | | All financial assets and liabilities that are reported net on the balance sheet; and |
| • | | All derivative financial instruments and repurchase agreements and other similar secured lending and borrowing agreements that are subject to enforceable master netting arrangements or similar agreements, but do not qualify for balance sheet netting. |
The table identifies the amounts that have been offset in the balance sheet and also those amounts that are covered by enforceable netting arrangements (offsetting arrangements and financial collateral) but do not qualify for netting under the requirements of IAS 32 described above.
For derivative contracts, the ‘Financial instruments’ column identifies financial assets and liabilities that are subject to set off under netting agreements, such as the ISDA Master Agreement or derivative exchange or clearing counterparty agreements, whereby all outstanding transactions with the same counterparty can be offset and close-out netting applied across all outstanding transaction covered by the agreements if an event of default or other predetermined events occur. Financial collateral refers to cash and non-cash collateral obtained, typically daily or weekly, to cover the net exposure between counterparties by enabling the collateral to be realised in an event of default or if other predetermined events occur.
For repurchase and reverse repurchase agreements and other similar secured lending and borrowing, the ‘Financial instruments’ column identifies financial assets and liabilities that are subject to set off under netting agreements, such as global master repurchase agreements and global master securities lending agreements, whereby all outstanding transactions with the same counterparty can be offset and close-out netting applied across all outstanding transaction covered by the agreements if an event of default or other predetermined events occur. Financial collateral typically comprises highly liquid securities which are legally transferred and can be liquidated in the event of counterparty default.
The Santander UK group engages in a variety of counterparty credit mitigation strategies in addition to netting and collateral arrangements. Therefore, the net amounts presented in the tables below do not purport to represent the Santander UK group’s actual credit exposure.
| | | | | | | | | | | | | | | | | | | | | | | | | | | | | | | | |
| | | Group | |
| | | Amounts subject to enforceable netting arrangements | | | | | | | |
| 31 December 2013 | | Effects of offsetting on balance sheet | | | Related amounts not offset | | | | |
| | | Gross amounts | | | Amounts
offset | | | Net amounts
reported on the balance sheet | | | Financial
instruments | | | Financial
collateral(1) | | | Net
amount | | | Assets not
subject to
enforceable
netting
arrangements(2) | | | Balance sheet
total(3) | |
| | | £m | | | £m | | | £m | | | £m | | | £m | | | £m | | | £m | | | £m | |
Derivative financial assets | | | 21,104 | | | | (1,832 | ) | | | 19,272 | | | | (15,443 | ) | | | (1,688 | ) | | | 2,141 | | | | 777 | | | | 20,049 | |
Reverse repurchase, securities borrowing & similar agreements: | | | | | | | | | | | | | | | | | | | | | | | | |
- Trading assets | | | 18,622 | | | | (10,215 | ) | | | 8,407 | | | | (3,372 | ) | | | (5,035 | ) | | | — | | | | 22 | | | | 8,429 | |
- Loans and advances to banks | | | 323 | | | | — | | | | 323 | | | | — | | | | (323 | ) | | | — | | | | — | | | | 323 | |
Loans and advances to customers and banks(4) | | | 8,154 | | | | (1,890 | ) | | | 6,264 | | | | — | | | | — | | | | 6,264 | | | | 180,347 | | | | 186,611 | |
| | | | | | | | | | | | | | | | | | | | | | | | | | | | | | | | |
Total assets | | | 48,203 | | | | (13,937 | ) | | | 34,266 | | | | (18,815 | ) | | | (7,046 | ) | | | 8,405 | | | | 181,146 | | | | 215,412 | |
| | | | | | | | | | | | | | | | | | | | | | | | | | | | | | | | |
Derivative financial liabilities | | | 20,512 | | | | (1,832 | ) | | | 18,680 | | | | (15,443 | ) | | | (1,872 | ) | | | 1,365 | | | | 183 | | | | 18,863 | |
Repurchase, securities lending & similar agreements: | | | | | | | | | | | | | | | | | | | | | | | | |
- Deposits by banks | | | 24,339 | | | | (10,215 | ) | | | 14,124 | | | | (3,235 | ) | | | (10,889 | ) | | | — | | | | — | | | | 14,124 | |
- Trading liabilities | | | 5,933 | | | | — | | | | 5,933 | | | | (137 | ) | | | (5,796 | ) | | | — | | | | 502 | | | | 6,435 | |
Deposits by customers and banks(4) | | | 3,975 | | | | (1,890 | ) | | | 2,085 | | | | — | | | | — | | | | 2,085 | | | | 147,343 | | | | 149,428 | |
| | | | | | | | | | | | | | | | | | | | | | | | | | | | | | | | |
Total liabilities | | | 54,759 | | | | (13,937 | ) | | | 40,822 | | | | (18,815 | ) | | | (18,557 | ) | | | 3,450 | | | | 148,028 | | | | 188,850 | |
| | | | | | | | | | | | | | | | | | | | | | | | | | | | | | | | |
| |
| | | Group | |
| | | Amounts subject to enforceable netting arrangements | | | | | | | |
| 31 December 2012 | | Effects of offsetting on balance sheet | | | Related amounts not offset | | | | | | | |
| | | Gross
amounts | | | Amounts
offset | | | Net amounts
reported on the balance
sheet | | | Financial
instruments | | | Financial
collateral(1) | | | Net
amount | | | Assets not
subject to
enforceable
netting
arrangements(2) | | | Balance sheet
total(3) | |
| | | £m | | | £m | | | £m | | | £m | | | £m | | | £m | | | £m | | | £m | |
Derivative financial assets | | | 29,600 | | | | — | | | | 29,600 | | | | (25,705 | ) | | | (2,421 | ) | | | 1,474 | | | | 546 | | | | 30,146 | |
Reverse repurchase, securities borrowing & similar agreements: | | | | | | | | | | | | | | | | | | | | | | | | | | | | | | | | |
- Trading assets | | | 26,784 | | | | (12,411 | ) | | | 14,373 | | | | (5,223 | ) | | | (9,150 | ) | | | — | | | | 335 | | | | 14,708 | |
- Loans and advances to banks | | | 233 | | | | — | | | | 233 | | | | — | | | | (233 | ) | | | — | | | | — | | | | 233 | |
Loans and advances to customers and banks(4) | | | 5,683 | | | | (1,026 | ) | | | 4,657 | | | | — | | | | — | | | | 4,657 | | | | 188,330 | | | | 192,987 | |
| | | | | | | | | | | | | | | | | | | | | | | | | | | | | | | | |
Total assets | | | 62,300 | | | | (13,437 | ) | | | 48,863 | | | | (30,928 | ) | | | (11,804 | ) | | | 6,131 | | | | 189,211 | | | | 238,074 | |
| | | | | | | | | | | | | | | | | | | | | | | | | | | | | | | | |
Derivative financial liabilities | | | 28,678 | | | | — | | | | 28,678 | | | | (25,705 | ) | | | (2,540 | ) | | | 433 | | | | 183 | | | | 28,861 | |
Repurchase, securities lending & similar agreements: | | | | | | | | | | | | | | | | | | | | | | | | | | | | | | | | |
- Trading liabilities | | | 23,289 | | | | (12,411 | ) | | | 10,878 | | | | (4,596 | ) | | | (6,282 | ) | | | — | | | | 802 | | | | 11,680 | |
- Deposits by banks | | | 7,926 | | | | — | | | | 7,926 | | | | (627 | ) | | | (7,299 | ) | | | — | | | | 502 | | | | 8,428 | |
Deposits by customers and banks(4) | | | 1,026 | | | | (1,026 | ) | | | — | | | | — | | | | — | | | | — | | | | 150,544 | | | | 150,544 | |
| | | | | | | | | | | | | | | | | | | | | | | | | | | | | | | | |
Total liabilities | | | 60,919 | | | | (13,437 | ) | | | 47,482 | | | | (30,928 | ) | | | (16,121 | ) | | | 433 | | | | 152,031 | | | | 199,513 | |
| | | | | | | | | | | | | | | | | | | | | | | | | | | | | | | | |
| (1) | Financial collateral is reflected at its fair value, but has been limited to the net balance sheet exposure so as not to include any over-collateralisation. |
| (2) | This column includes contractual rights of set-off that are subject to uncertainty under the laws of the relevant jurisdiction. |
| (3) | The balance sheet total is the sum of ‘Net amounts reported on the balance sheet’ that are subject to enforceable netting arrangements and ‘Amounts not subject to enforceable netting arrangements’. |
| (4) | The amounts offset within loans and advances to customers/banks or deposits by customers/banks relate to offset mortgages and film deals which are classified as either and that are subject to netting. |
| | |
| Santander UK plc Annual Report 2013 | | 313 |
Financial Statements
Notes to the Financial Statementscontinued
| | | | | | | | | | | | | | | | | | | | | | | | | | | | | | | | |
| | | Company | |
| | | Amounts subject to enforceable netting arrangements | | | | | | | |
| 31 December 2013 | | Effects of offsetting on balance sheet | | | Related amounts not offset | | | | | | | |
| | | Gross
amounts | | | Amounts
offset | | | Net amounts
reported on
the balance
sheet | | | Financial
instruments | | | Financial
collateral(1) | | | Net
amount | | | Assets not
subject to
enforceable
netting
arrangements(2) | | | Balance sheet
total(3) | |
| | | £m | | | £m | | | £m | | | £m | | | £m | | | £m | | | £m | | | £m | |
Derivative financial assets | | | 2,330 | | | | — | | | | 2,330 | | | | (19 | ) | | | (233 | ) | | | 2,078 | | | | 131 | | | | 2,461 | |
Reverse repurchase, securities borrowing & similar agreements: | | | | | | | | | | | | | | | | | | | | | | | | | | | | | | | | |
- Trading assets | | | — | | | | — | | | | — | | | | — | | | | — | | | | — | | | | — | | | | — | |
- Loans and advances to banks | | | 1,005 | | | | — | | | | 1,005 | | | | (402 | ) | | | (603 | ) | | | — | | | | — | | | | 1,005 | |
Loans and advances to customers and banks(4) | | | 244,847 | | | | (131,320 | ) | | | 113,527 | (4) | | | (107,751 | ) | | | — | | | | 5,776 | | | | 159,128 | | | | 272,655 | |
| | | | | | | | | | | | | | | | | | | | | | | | | | | | | | | | |
Total assets | | | 248,182 | | | | (131,320 | ) | | | 116,862 | | | | (108,172 | ) | | | (836 | ) | | | 7,854 | | | | 159,259 | | | | 276,121 | |
| | | | | | | | | | | | | | | | | | | | | | | | | | | | | | | | |
Derivative financial liabilities | | | 1,779 | | | | — | | | | 1,779 | | | | (19 | ) | | | (74 | ) | | | 1,686 | | | | 24 | | | | 1,803 | |
Repurchase, securities lending & similar agreements: | | | | | | | | | | | | | | | | | | | | | | | | | | | | | | | | |
- Trading liabilities | | | — | | | | — | | | | — | | | | — | | | | — | | | | — | | | | — | | | | — | |
- Deposits by banks | | | 1,769 | | | | — | | | | 1,769 | | | | (402 | ) | | | (1,367 | ) | | | — | | | | 502 | | | | 2,271 | |
Deposits by customers and banks(4) | | | 242,928 | | | | (131,320 | ) | | | 111,608 | | | | (107,751 | ) | | | — | | | | 3,857 | | | | 180,738 | | | | 292,346 | |
| | | | | | | | | | | | | | | | | | | | | | | | | | | | | | | | |
Total liabilities | | | 246,476 | | | | (131,320 | ) | | | 115,156 | | | | (108,172 | ) | | | (1,441 | ) | | | 5,543 | | | | 181,264 | | | | 296,420 | |
| | | | | | | | | | | | | | | | | | | | | | | | | | | | | | | | |
| |
| | | Company | |
| | | Amounts subject to enforceable netting arrangements | | | | | | | |
| 31 December 2012 | | Effects of offsetting on balance sheet | | | Related amounts not offset | | | | | | | |
| | | Gross amounts | | | Amounts offset | | | Net amounts
reported on
the balance
sheet | | | Financial
instruments | | | Financial
collateral(1) | | | Net
amount | | | Assets not
subject to enforceable netting
arrangements(2) | | | Balance sheet
total(3) | |
| | | £m | | | £m | | | £m | | | £m | | | £m | | | £m | | | £m | | | £m | |
Derivative financial assets | | | 2,527 | | | | — | | | | 2,527 | | | | (1,422 | ) | | | (692 | ) | | | 413 | | | | 2,372 | | | | 4,899 | |
Reverse repurchase, securities borrowing & similar agreements: | | | | | | | | | | | | | | | | | | | | | | | | |
- Trading assets | | | — | | | | — | | | | — | | | | — | | | | — | | | | — | | | | — | | | | — | |
- Loans and advances to banks | | | 1,018 | | | | — | | | | 1,018 | | | | (990 | ) | | | (28 | ) | | | — | | | | — | | | | 1,018 | |
Loans and advances to customers and banks(4) | | | 254,509 | | | | (153,704 | ) | | | 100,805 | | | | (96,147 | ) | | | — | | | | 4,658 | | | | 167,720 | | | | 268,525 | |
| | | | | | | | | | | | | | | | | | | | | | | | | | | | | | | | |
Total assets | | | 258,054 | | | | (153,704 | ) | | | 104,350 | | | | (98,559 | ) | | | (720 | ) | | | 5,071 | | | | 170,092 | | | | 274,442 | |
| | | | | | | | | | | | | | | | | | | | | | | | | | | | | | | | |
Derivative financial liabilities | | | 1,970 | | | | — | | | | 1,970 | | | | (1,422 | ) | | | (76 | ) | | | 472 | | | | 81 | | | | 2,051 | |
Repurchase, securities lending & similar agreements: | | | | | | | | | | | | | | | | | | | | | | | | |
- Trading liabilities | | | — | | | | — | | | | — | | | | — | | | | — | | | | — | | | | — | | | | — | |
- Deposits by banks | | | 2,455 | | | | — | | | | 2,455 | | | | (990 | ) | | | (1,465 | ) | | | — | | | | 1,193 | | | | 3,648 | |
Deposits by customers and banks(4) | | | 258,696 | | | | (153,704 | ) | | | 104,992 | | | | (96,147 | ) | | | — | | | | 8,845 | | | | 189,414 | | | | 294,406 | |
| | | | | | | | | | | | | | | | | | | | | | | | | | | | | | | | |
Total liabilities | | | 263,121 | | | | (153,704 | ) | | | 109,417 | | | | (98,559 | ) | | | (1,541 | ) | | | 9,317 | | | | 190,688 | | | | 300,105 | |
| | | | | | | | | | | | | | | | | | | | | | | | | | | | | | | | |
| (1) | Financial collateral is reflected at its fair value, but has been limited to the net balance sheet exposure so as not to include any over-collateralisation. |
| (2) | This column includes contractual rights of set-off that are subject to uncertainty under the laws of the relevant jurisdiction. |
| (3) | The balance sheet total is the sum of ‘Net amounts reported on the balance sheet’ that are subject to enforceable netting arrangements and ‘Amounts not subject to enforceable netting arrangements’. |
| (4) | The amounts offset within loans and advances to customers/banks or deposits by customers/banks relate to offset mortgages and film deals which are classified as either and that are subject to netting. |
| | |
| 314 | | Santander UK plc Annual Report 2013 |
Financial Statements
Notes to the Financial Statementscontinued
47. CAPITAL MANAGEMENT AND RESOURCES
This note reflects the transactions and amounts reported on a basis consistent with the Santander UK group’s regulatory filings.
Capital management and capital allocation
Santander UK plc and its subsidiaries are a UK banking group effectively subject to two tiers of supervision. Santander UK is subject to prudential supervision by both the PRA (as a UK authorised bank) and Banco de España (the Bank of Spain) (as a member of the Banco Santander group). As a PRA regulated entity, Santander UK is expected to satisfy the PRA liquidity and capital requirements on a standalone basis. Similarly, Santander UK must demonstrate to the PRA that it can withstand liquidity and capital stress tests without parental support. Reinforcing the corporate governance framework adopted by Santander UK, the PRA exercises oversight through its rules and regulations on the Santander UK Board and senior management appointments.
The Board is responsible for capital management strategy and policy and ensuring that capital resources are appropriately monitored and controlled within regulatory and internal limits. Authority for capital management flows to the Chief Executive Officer and from her to specific individuals who are members of the Santander UK Capital Committee.
The Capital Committee adopts a centralised capital management approach that is driven by the Santander UK group’s corporate purpose and strategy. This approach takes into account the regulatory and commercial environment in which the Santander UK group operates, the Santander UK group’s risk appetite, the management strategy for each of the Santander UK group’s material risks (including whether or not capital provides an appropriate risk mitigant) and the impact of appropriate adverse scenarios and stresses on the Santander UK group’s capital requirements. This approach is reviewed annually as part of the Santander UK group’s Internal Capital Adequacy Assessment Process (‘ICAAP’).
The Santander UK group manages its capital requirements, debt funding and liquidity on the basis of policies and plans reviewed regularly by the Capital Committee. Capital requirements are also reviewed as part of the ICAAP while debt funding and liquidity are also reviewed as part of the Internal Liquidity Adequacy Assessment (‘ILAA’) process. To support its capital and senior debt issuance programmes, Santander UK plc is rated on a stand alone basis from Banco Santander, S.A.
On an ongoing basis, and in accordance with the latest ICAAP review, the Santander UK group forecasts its regulatory and internal capital requirements based on the approved capital volumes allocated to business units as part of the corporate planning process which generates the Santander UK group’s strategic 3-Year Plan. Alongside this plan, the Santander UK group develops a series of macro economic scenarios to stress test its capital requirements and confirm that it has adequate regulatory capital resources to meet its projected and stressed regulatory capital requirement and to meet its obligations as they fall due. Internally assigned buffers augment the various regulatory minimum capital criteria. Buffers are held in order to ensure there is sufficient time for management actions to be implemented against unexpected movements.
Decisions on the allocation of capital resources are conducted as part of the Santander UK group’s strategic three year planning process based on the relative returns on capital using both economic and regulatory capital measures. Capital allocations are reviewed in response to changes in risk appetite and risk management strategy, changes to the commercial environment, changes in key economic indicators or when additional capital requests are received.
This combination of regulatory and economic capital ratios and limits, internal buffers and restrictions, together with the relevant costs of differing capital instruments and a consideration of the various other capital management techniques are used to shape the most cost-effective structure to fulfil the Santander UK group’s capital needs.
Capital adequacy
The Santander UK group manages its capital on a Basel II basis. During the years ended 31 December 2013 and 2012, the Santander UK group held capital over and above its regulatory requirements, and managed internal capital allocations and targets in accordance with its capital and risk management policies.
| | |
| Santander UK plc Annual Report 2013 | | 315 |
Financial Statements
Notes to the Financial Statementscontinued
Group Capital
| | | | | | | | |
| | | 2013
£m | | | 2012
£m | |
Core Tier 1 capital | | | 12,261 | | | | 11,890 | |
Deductions from Core Tier 1 capital | | | (2,581 | ) | | | (2,588 | ) |
| | | | | | | | |
Total Core Tier 1 capital after deductions | | | 9,680 | | | | 9,302 | |
Other Tier 1 capital | | | 1,379 | | | | 1,901 | |
| | | | | | | | |
Total Tier 1 capital after deductions | | | 11,059 | | | | 11,203 | |
| | | | | | | | |
Tier 2 capital | | | 3,822 | | | | 3,092 | |
Deductions from Tier 2 capital | | | (309 | ) | | | (336 | ) |
| | | | | | | | |
Total Tier 2 capital after deductions | | | 3,513 | | | | 2,756 | |
| | | | | | | | |
Total Capital Resources | | | 14,572 | | | | 13,959 | |
| | | | | | | | |
Tier 1 includes audited profits for the years ended 31 December 2013 and 2012 respectively after adjustment to comply with PRA rules. Tier 1 deductions primarily relate to goodwill and expected losses. The expected losses deduction represents the difference between expected loss calculated in accordance with the Santander UK group’s Basel II Retail Internal Rating-Based (‘IRB’) and Advanced Internal Rating-Based (‘AIRB’) models, and the impairment loss allowances calculated in accordance with IFRS. The Santander UK group’s accounting policy for impairment loss allowances is set out in Note 1. Regulatory expected losses are calculated using risk parameters based on either through-the-cycle, or economic downturn estimates, and are subject to conservatism due to the imposition of regulatory floors. They are therefore currently higher than the impairment loss allowances under IFRS which only reflect losses incurred at the balance sheet date. In addition, the Santander UK group has elected to deduct certain securitisation positions from capital rather than treat these exposures as a risk weighted asset. Tier 2 deductions also represent expected losses and securitisation positions described above.
During 2013, Core Tier 1 capital increased by £378m to £9,680m (2012: £9,302m). This increase was largely due to audited profits for the year of £913m, less dividends declared of £482m. During 2012, Core Tier 1 capital increased by £441m to £9,302m due to audited profits for the year of £939m, less dividends declared of £507m. The significant reduction in Santander UK’s Other Tier 1 capital during 2013 principally reflects the capital management exercise undertaken in August 2013 as described in Note 34 to the Consolidated Financial Statements.
The significant increase in Tier 2 capital in 2013 was due to an issuance of US$1,500m dated subordinated debt.
48. EVENTS AFTER THE BALANCE SHEET DATE
With effect from 10 January 2014, Santander UK Group Holdings Limited, a subsidiary of Banco Santander, S.A. and Santusa Holding, S.L., became the beneficial owner of the entire issued ordinary share capital of the Company by virtue of a share exchange agreement between Santander UK Group Holdings Limited, Banco Santander, S.A. and Santusa Holding, S.L. This represented a change in control for Santander UK.
| | |
| 316 | | Santander UK plc Annual Report 2013 |
Shareholder Information
Risk Factors
An investment in Santander UK plc (the “Company”) and its subsidiaries (“us”, “we” or “Santander UK group”) involves a number of risks, the material ones of which are set out below.
We rely on recruiting, retaining and developing appropriate senior management and skilled personnel.
Our continued success depends in part on the continued service of key members of our management team. The ability to continue to attract, train, motivate and retain highly qualified and talented professionals is a key element of our strategy. The successful implementation of our growth strategy depends on the availability of skilled management, both at our head office and in each of our business units. If we or one of our business units or other functions fails to staff its operations appropriately or loses one or more of its key senior executives and fails to replace them in a satisfactory and timely manner, our business, financial condition and results of operations, including control and operational risks, may be adversely affected.
In addition, the financial industry has and may continue to experience more stringent regulation of employee compensation, which could have an adverse effect on our ability to hire or retain the most qualified employees. If we fail or are unable to attract and appropriately train, motivate and retain qualified professionals, our business may also be adversely affected.
We are vulnerable to disruptions and volatility in the global financial markets.
In the past six years, financial systems worldwide have experienced difficult credit and liquidity conditions and disruptions leading to less liquidity, greater volatility, general widening of spreads and, in some cases, lack of price transparency on interbank lending rates. Global economic conditions deteriorated significantly between 2007 and 2009 and many countries, including the United Kingdom (the “UK”), went through a prolonged recession. Many major financial institutions, including some of the world’s largest global commercial banks, investment banks, mortgage lenders, mortgage guarantors and insurance companies, experienced significant difficulties. Around the world, there were runs on deposits at several financial institutions, numerous institutions sought additional capital or were assisted by central banks and governments providing liquidity, whilst many lenders and institutional investors reduced or ceased providing funding to borrowers (including to other financial institutions). The global economic slowdown, and the downturn in the UK in particular, had a negative impact on the UK economy and adversely affected our business.
In particular, we may face, among others, the following risks related to an economic downturn:
| • | | Increased regulation of our industry. Compliance with such regulation may increase our costs, may affect the pricing for our products and services, and limit our ability to pursue business opportunities. |
| • | | Reduced demand for our products and services. |
| • | | Inability of our borrowers to comply fully or in a timely manner with their existing obligations. |
| • | | The process we use to estimate losses inherent in our credit exposure requires complex judgements, including forecasts of economic conditions and how such conditions may impair the ability of our borrowers to repay their loans. The degree of uncertainty concerning economic conditions may adversely affect the accuracy of our estimates, which may, in turn, impact the reliability of the process and the sufficiency of our loan loss allowances. |
| • | | The value and liquidity of the portfolio of investment securities that we hold may be adversely affected. |
| • | | Any worsening of the global economic conditions may delay the recovery of the international financial industry and impact our operating results, financial condition and prospects. |
| • | | Adverse macroeconomic shocks may negatively impact the household income of our retail customers and may adversely affect the recoverability of our retail loans, resulting in increased loan losses. |
Despite recent improvements in certain segments of the global economy, uncertainties remain concerning the future economic environment. There can be no assurance that economic conditions in these segments will continue to improve or that the global economic condition as a whole will improve significantly. Such economic uncertainties could have a negative impact on our business and results of operations. Investors remain cautious and, for example, the downgrade of certain sovereign debt has induced greater volatility in the capital markets. A slowing or failing of the economic recovery would likely aggravate the adverse effects of these difficult economic and market conditions on us and on others in the financial services industry.
Continued or worsening disruption and volatility in the global financial markets could have a material adverse effect on us, including our ability to access capital and liquidity on financial terms acceptable to us, if at all. If capital markets financing ceases to become available, or becomes excessively expensive, we may be forced to raise the rates we pay on deposits to attract more customers and become unable to maintain certain liability maturities. Any such increase in capital markets funding costs or deposit rates could have a material adverse effect on our interest margins and liquidity.
If all or some of the foregoing risks were to materialise, this could have a material adverse effect on us.
Our operating results, financial condition and prospects may be materially impacted by economic conditions in the UK.
Our business activities are concentrated in the UK and on the offering of mortgage, loan, deposits and banking and savings related products and services to retail and corporate customers. As a consequence, our operating results, financial condition and prospects are significantly affected by economic conditions in the UK generally.
Our financial performance is intrinsically linked to the UK economy. Whilst evidence of recovery has emerged, the possibility of a renewed economic downturn, along with its concomitant impacts on our profitability, remains a real risk. Conversely, strengthened UK economic performance may increase the possibility of a higher interest rate environment. In such a scenario, other market participants might offer more competitive product pricing resulting in increased customer attrition.
Uncertainty surrounding the future of the eurozone is less acute than before, but slow growth increase may pose a risk of a further slowdown in the UK’s principal export markets which would have an adverse effect on the broader UK economy.
Adverse changes in the credit quality of our borrowers and counterparties or a general deterioration in UK or global economic conditions could reduce the recoverability and value of our assets and require an increase in our level of provisions for bad and doubtful debts. Likewise, a significant reduction in the demand for our products and services could negatively impact our business and financial condition. UK economic conditions and uncertainties may have an adverse effect on the quality of our loan portfolio and may result in a rise in delinquency and default rates. There can be no assurance that we will not have to increase our provisions for loan losses in the future as a result of increases in non-performing loans or for other reasons beyond our control. Material increases in our provisions for loan losses and write-offs/charge-offs could have an adverse effect on our operating results, financial condition and prospects.
| | |
| Santander UK plc Annual Report 2013 | | 317 |
Shareholder Information
Risk Factorscontinued
The UK Government has taken measures to address the exceptionally high level of national debt, including tax increases and public spending cuts. Credit quality could be adversely affected by a renewed increase in unemployment. Any related significant reduction in the demand for our products and services could have a material adverse effect on our operating results, financial condition and prospects.
Exposure to UK political developments could have a material adverse effect on us.
The outcome of any future UK political developments, including but not limited to any changes in government structure and policies, could affect the fiscal, monetary and regulatory landscape to which we are subject and therefore no assurance can be given that our operating results, financial condition and prospect would not be adversely impacted as a result.
We are subject to regulatory capital and leverage requirements that could limit our operations, and changes to these requirements may further limit and adversely affect our operating results, financial condition and prospects.
We are subject to capital adequacy requirements applicable to banks and adopted by the Prudential Regulation Authority (“PRA”) of the Bank of England which provide for a minimum ratio of total capital to risk-adjusted assets both on a consolidated basis and on a solo-consolidated basis (the basis used by the PRA solely for the purpose of the calculation of capital resources and capital resources requirements, which measure the capital of the Company and certain subsidiaries) and in 2013 included a minimum ratio of Core Tier 1 capital to risk weighted assets on a consolidated basis. From 2014 we will be subject to a minimum ratio of Common Equity Tier 1 capital to risk weighted assets, Tier 1 capital to risk weighted assets and total capital to risk weighted assets each on both a consolidated basis and on a solo-consolidated basis. Any failure by us to maintain our ratios may result in administrative actions or sanctions which may affect our ability to fulfil our obligations.
In response to the recent financial crisis, the PRA imposed more stringent capital adequacy requirements. For instance, the PRA adopted a supervisory approach in relation to certain large UK banks, including Santander UK, under which those banks were expected to maintain Core Tier 1 capital in excess of the minimum levels required by the then existing rules and guidance of the PRA. The PRA has continued to impose such higher capital requirements and we have been required to hold Core Tier 1 capital reserves equivalent to at least 7 per cent. of our risk-weighted assets and to maintain a 3% Tier 1 leverage ratio. In the future, the PRA may impose further higher capital requirements and also increase capital ratios as part of the implementation of UK macro-prudential capital regulation tools.
In December 2010, the Basel Committee on Banking Supervision (the “Basel Committee”) proposed comprehensive changes to the capital adequacy framework, known as Basel III. A revised version of these proposals was issued in June 2011. The reforms to the regulatory capital framework were proposed to raise the resilience of the banking sector, through increasing both the quality and quantity of the regulatory capital base and enhancing the risk coverage of the capital framework. As part of these reforms, the amount and quality of capital that institutions are required to hold was raised, innovative Tier 1 capital instruments with an incentive to redeem were to be phased out and the rules for determining Tier 2 capital instruments were to be harmonised. Basel III also requires institutions to build counter-cyclical capital buffers that could be drawn upon in stress periods and to hold a capital conservation buffer above minimum capital ratio levels, which have the effect of raising the minimum level of tangible common equity capital from 2 per cent. to 7 per cent. of risk-weighted assets. In addition, a leverage ratio was proposed for institutions as a backstop, which would be applied alongside current risk-based regulatory capital requirements. The Basel Committee has also proposed introducing additional capital requirements for systemically important institutions from 2016.
The implementation of Basel III in the European Union is being performed through the Capital Requirements Directive IV and the Capital Requirements Regulation (“CRD IV”) legislative package. CRD IV was published in the Official Journal on 27 June 2013 and will come into effect on 1 January 2014, with particular requirements being phased in over a period of time to be effective by 2019, although requirements relating to certain deductions from Common Equity Tier 1 could be delayed until 2024. CRD IV substantially reflects the Basel III capital and liquidity standards and facilitates the applicable implementation timeframes. However, certain issues continue to remain under discussion and certain details remain to be clarified in further binding technical standards to be issued by the European Banking Authority. On 19 December 2013, the PRA published its rules and supervisory statements associated with the implementation of CRD IV, which cover prudential rules for banks, building societies and investment firms.
In addition to Basel III and CRD IV, regulators in the UK and worldwide have produced a range of proposals for future legislative and regulatory changes which could force us to comply with certain operational restrictions or take steps to raise further capital, or could increase our expenses, or otherwise adversely affect our operating results, financial condition and prospects. These include:
| • | | the introduction of recovery and resolution planning requirements (popularly known as “living wills”) for banks and other financial institutions as contingency planning for the failure of a financial institution that may affect the stability of the financial system, as set out in the PRA’s final rules on recovery and resolution planning which came into force on 1 January 2014; |
| • | | the introduction of more regular and detailed reporting obligations; |
| • | | a move to pre-funding of the deposit protection scheme in the UK; and |
| • | | proposed revisions to the approaches for determining trading book capital requirements and banking book risk-weighted assets from the Basel Committee. |
These measures could have a material adverse effect on our operating results, and consequentially, on our financial condition and prospects. There is a risk that changes to the UK’s capital adequacy regime (including any increase to the minimum leverage ratio) may result in increased minimum capital requirements, which could reduce available capital for business purposes and thereby adversely affect our profitability and ability to pay dividends, continue organic growth (including increased lending), or pursue acquisitions or other strategic opportunities (alternatively we could restructure our balance sheet to reduce the capital charges incurred pursuant to the PRA’s rules in relation to the assets held, or raise additional capital but at increased cost and subject to prevailing market conditions). In addition, changes to the eligibility criteria for Tier 1 and Tier 2 capital may affect our ability to raise Tier 1 and Tier 2 capital and impact the recognition of existing Tier 1 and Tier 2 capital resources in the calculation of our capital position.
Our business could be affected if our capital is not managed effectively or if these measures limit our ability to manage our balance sheet and capital resources effectively or to access funding on commercially acceptable terms. Effective management of our capital position is important to our ability to operate our business, to continue to grow organically and to pursue our business strategy.
| | |
| 318 | | Santander UK plc Annual Report 2013 |
Shareholder Information
Risk Factorscontinued
We are subject to liquidity requirements that could limit our operations, and changes to these requirements may further limit and adversely affect our operating results, financial condition and prospects.
On 5 October 2009, the FSA published liquidity rules which significantly broadened the scope of the existing liquidity regime. These were designed to enhance regulated firms’ liquidity risk management practices. As part of these reforms, the FSA implemented requirements for financial institutions to hold prescribed levels of specified liquid assets and have in place other sources of liquidity to address the institution-specific and market-wide liquidity risks that institutions may face in short-term and prolonged stress scenarios. These rules have applied to us since June 2010 with some subsequent technical revisions.
In addition to the changes to the capital adequacy framework published in December 2010 described above, the Basel Committee also published its global quantitative liquidity framework, comprising the Liquidity Coverage Ratio (“LCR”) and Net Stable Funding Ratio (“NSFR”) metrics, with objectives to (1) promote the short-term resilience of banks’ liquidity risk profiles by ensuring they have sufficient high-quality liquid assets to survive a significant stress scenario; and (2) promote resilience over a longer time horizon by creating incentives for banks to fund their activities with more stable sources of funding on an ongoing basis. The LCR was subsequently revised by the Basel Committee in January 2013. These revisions amended the definition of high-quality liquid assets and agreed a revised timetable for phase-in of the standard from 2015 to 2019, as well as making some technical changes to some of the stress scenario assumptions.
As with the Basel Committee’s proposed changes to the capital adequacy framework, the Basel III liquidity standards are being implemented within the European Union through the CRD IV / CRR legislative package. As mentioned above, CRD IV / CRR substantially reflects the Basel III liquidity standards and the applicable implementation timeframes. However, various related issues remain under discussion, particularly on the detail of final liquidity and leverage rules. In January 2014 the Basel Committee published amendments to the Leverage Ratio and technical revisions to the NSFR ratio, confirming that it remains the intention that the latter ratio, including any future revisions, will become a minimum standard by 1 January 2018. Also, in January 2014, the Basel Committee proposed uniform disclosure standards related to the LCR and issued a new modification to the ratio, which should be adopted by banks from 1 January 2015.
There is a risk that implementing and maintaining enhanced liquidity risk management systems may incur significant costs, and more stringent requirements to hold liquid assets may materially affect our lending business as more funds may be required to acquire or maintain a liquidity buffer, thereby reducing future profitability.
Exposure to UK Government debt could have a material adverse effect on us.
Like many other UK banks, we invest in debt securities of the UK Government largely for liquidity purposes. As of 31 December 2013, approximately 1 per cent. of our total assets and 28 per cent. of our securities portfolio were comprised of debt securities issued by the UK Government. Any failure by the UK Government to make timely payments under the terms of these securities, or a significant decrease in their market value, will have a material adverse effect on us.
We may suffer adverse effects as a result of the continued economic and sovereign debt tensions in the eurozone.
Eurozone markets and economies continue to show signs of fragility and volatility, with recession in several economies and only sporadic access to capital markets in others. Interest rate differentials among eurozone countries indicate continued doubts about some governments’ ability to fund themselves and affect borrowing rates in those economies. Further, the possibility remains that one or more eurozone countries could depart from the euro or that the euro could be abandoned as a currency altogether, which could have negative effects on both existing contractual relations and the fulfilment of obligations by us, our counterparties and/or our customers. This in turn would have a material adverse effect on our operating results, financial position and prospects.
There is currently no established legal or practical framework to facilitate a member state’s exit from the euro. Apart from the exit process, uncertainties that heighten the risk of re-denomination include how an exiting member state would deal with its existing euro-denominated assets and liabilities and the valuation of any newly-adopted currency against the euro. These uncertainties make it impossible to predict what our losses might be as a result of any member state’s decision to exit the euro.
A wide-scale break-up of the eurozone would most likely be associated with a deterioration in the economic and financial environment in the UK and could have a material adverse impact on the whole financial sector, creating new challenges in sovereign and corporate lending and resulting in significant disruptions in financial activities at both the market and retail levels. This could materially and adversely affect our operating results, financial condition and prospects.
The European Central Bank and European Council took action in 2012 and 2013 with the aim of reducing the risk of contagion in the eurozone and beyond. These included the creation of the Open Market Transaction facility of the ECB and the decision by eurozone governments to progress towards the creation of a banking union. Nonetheless, a significant number of financial institutions throughout Europe have substantial exposures to sovereign debt issued by eurozone nations which are under severe financial stress. Should any of those nations default on their debt, or experience a significant widening of credit spreads, major financial institutions and banking systems throughout Europe could be destabilised, resulting in the further spread of the ongoing economic crisis.
The continued high cost of capital for some European governments was felt in the wholesale markets in the UK, which has resulted in an increase in the cost of retail funding and greater competition in a savings market that is growing slowly by historical standards. In the absence of a permanent resolution of the eurozone crisis, conditions could deteriorate.
Although we conduct the majority of our business in the UK, we have direct and indirect exposure to financial and economic conditions throughout the eurozone economies. For further description of our country risk exposures, including eurozone and peripheral eurozone exposures and redenomination risk, see the “Country Risk Exposure” section in the Risk Management Report on pages 151 to 156. In addition, general financial and economic conditions in the UK, which directly affect our operating results, financial condition and prospects, may deteriorate as a result of conditions in the eurozone.
| | |
| Santander UK plc Annual Report 2013 | | 319 |
Shareholder Information
Risk Factorscontinued
We are exposed to risks faced by other financial institutions.
We routinely transact with counterparties in the financial services industry, including brokers and dealers, commercial banks, investment banks, mutual funds, hedge funds and other institutional clients. Defaults by, and even rumours or questions about the solvency of, certain financial institutions and the financial services industry generally have led to market-wide liquidity problems and could lead to losses or defaults by other institutions. Many of the routine transactions we enter into expose us to significant credit risk in the event of default by one of our significant counterparties. The European sovereign debt crisis and the risk it poses to financial institutions throughout Europe have had, and may continue to have, an adverse effect on interbank financial transactions in general. A default by a significant financial counterparty, or liquidity problems in the financial services industry generally, could have a material adverse effect on us.
Liquidity and funding risks are inherent in our business and could have a material adverse effect on us.
Liquidity risk is the risk that we, although solvent, either do not have available sufficient financial resources to meet our obligations as they fall due or can secure them only at excessive cost. This risk is inherent in any retail and commercial banking business and can be heightened by a number of enterprise-specific factors, including over-reliance on a particular source of funding, changes in credit ratings or market-wide phenomena such as market dislocation. While we implement liquidity management processes to seek to mitigate and control these risks, unforeseen systemic market factors in particular make it difficult to eliminate completely these risks. Adverse and continued constraints in the supply of liquidity, including inter-bank lending, has affected and may again materially and adversely affect the cost of funding our business, and extreme liquidity constraints may affect our current operations as well as limit growth possibilities.
Continued or worsening disruption and volatility in the global financial markets could have a material adverse effect on our ability to access capital and liquidity on financial terms acceptable to us.
Our cost of obtaining funding is directly related to prevailing market interest rates and to our credit spreads. Increases in interest rates and our credit spreads can significantly increase the cost of our funding. Changes in our credit spreads are market-driven, and may be influenced by market perceptions of our creditworthiness. Changes to interest rates and our credit spreads occur continuously and may be unpredictable and highly volatile.
If wholesale markets financing ceases to become available, or becomes excessively expensive, we may be forced to raise the rates we pay on deposits, with a view to attracting more customers, and/or to sell assets, potentially at depressed prices. The persistence or worsening of these adverse market conditions or an increase in base interest rates could have a material adverse effect on our ability to access liquidity and cost of funding (whether directly or indirectly).
Although central banks around the world have made coordinated efforts to increase liquidity in the financial markets, by taking measures such as increasing the amounts they lend directly to financial institutions, lowering interest rates and ensuring that currency swaps markets remain liquid, it is only gradually becoming known internationally how long these central bank schemes will continue or on what terms. The slowing of loose monetary policy in the US from the second half of 2013 initially led to some market disruption with direct impacts on emerging markets which experienced a withdrawal of offshore funds. The European Central Bank has yet to clarify its longer term approach to liquidity support. In October 2013, the Bank of England updated its Sterling Monetary Framework to provide more transparent liquidity insurance support in exceptional circumstances. The indexed Long Term Repo Facility will now be available to support regular bank requirements for liquidity while the Discount Window Facility has been reinforced as support for banks experiencing idiosyncratic stress. The Extended Collateral Term Repo will be made available to support markets in the event of a market wide liquidity stress.
The Bank of England and HM Treasury announced changes to the terms of the Funding for Lending Scheme (“FLS”) on 28 November 2013 to re-focus the incentives in the revised scheme towards supporting business lending in 2014. The FLS extension will allow participants to draw from the scheme from February 2014 until January 2015, but beginning in 2014 household lending will no longer generate any additional borrowing allowances as it did in the initial scheme. Instead additional allowances will now only reflect lending to businesses in 2014. Any initial borrowing allowances in the FLS extension already earned by household and business lending in 2013 will be unaffected. As at 31 December 2013, we had drawn £100m of UK treasury bills under the FLS.
The availability of Bank of England facilities for UK financial institutions, to the extent that they provide us with access to cheaper and more attractive funding than other sources, reduces our reliance on retail or wholesale markets. To the extent that we make use of Bank of England facilities, any significant reduction or withdrawal of those facilities would increase our funding costs.
Each of the factors described above – the persistence or worsening of adverse market conditions, and the lack of availability, or withdrawal, of such central bank schemes or an increase in base interest rates – could have a material adverse effect on our ability to access liquidity and cost of funding (whether directly or indirectly).
We aim for a funding structure that is consistent with our assets, avoids excessive reliance on short term wholesale funding, attracts enduring commercial deposits and provides diversification in products and tenor. We therefore rely, and will continue to rely, on commercial deposits to fund a significant proportion of lending activities. The ongoing availability of this type of funding is sensitive to a variety of factors outside our control, such as general economic conditions and the confidence of commercial depositors in the economy, in general, and the financial services industry in particular, and the availability and extent of deposit guarantees, as well as competition between banks for deposits. Any of these factors could significantly increase the amount of commercial deposit withdrawals in a short period of time, thereby reducing our ability to access commercial deposit funding on appropriate terms, or at all, in the future.
We anticipate that our customers will continue to make short-term deposits (particularly demand deposits and short-term time deposits), and we intend to maintain our emphasis on the use of banking deposits as a source of funds. The short-term nature of this funding source could cause liquidity problems for us in the future if deposits are not made in the volumes we expect or are not renewed. If a substantial number of our depositors withdraw their demand deposits or do not roll over their time deposits upon maturity, we may be materially and adversely affected. For additional information about our liquidity position and other liquidity matters, including the policies and procedures we use to manage our liquidity risks, see ‘Balance Sheet Review – Capital Management and Resources’ on pages 53 to 56, ‘Balance Sheet Review – Liquidity and Funding’ on pages 57 to 58 and ‘Risk Management Report – Liquidity and Funding risk’ on pages 133 to 143.
A sudden or unexpected shortage of funds in the banking system could lead to increased funding costs, a reduction in the term of funding instruments or require us to liquidate certain assets. If these circumstances were to arise, this could have a material adverse effect on our operating results, financial condition and prospects.
| | |
| 320 | | Santander UK plc Annual Report 2013 |
Shareholder Information
Risk Factorscontinued
A movement in our external credit rating would likely increase our cost of funding, require us to post additional collateral or take other actions under some of our derivative contracts and adversely affect our interest margins and results of operations.
Credit ratings can in some instances affect the cost and other terms upon which we are able to obtain funding. Credit rating agencies regularly evaluate us, and their credit ratings of our institution and our debt in issue are based on a number of factors, including our financial strength and that of the UK economy, conditions affecting the financial services industry generally and the willingness and ability of the UK Government to provide support to systemically important UK banks.
Any downgrade in our credit ratings could increase our borrowing costs and could require us to post additional collateral or take other actions under some of our derivative contracts, and could limit our access to capital markets and adversely affect our commercial business. For example, a credit rating downgrade could adversely affect our ability to sell or market certain of our products, engage in certain longer-term transactions and derivatives transactions and retain our customers, particularly customers who need a minimum rating threshold in order to invest. In addition, under the terms of certain of our derivative contracts, we may be required to maintain a minimum credit rating or otherwise our counterparties may be able to terminate such contracts. Any of these results of a credit rating downgrade could, in turn, reduce our liquidity and have an adverse effect on us, including our operating results, financial condition and prospects. For example, we estimate that as at 31 December 2013, if Fitch, Moody’s and S&P were concurrently to downgrade our long-term credit ratings by one notch, and thereby trigger a short-term credit rating downgrade, this could result in an outflow of £7.6bn of cash and collateral. A hypothetical two notch downgrade would result in an outflow of £9.5bn of cash and collateral. However, while certain potential impacts are contractual and quantifiable, the full consequences of a credit rating downgrade are inherently uncertain, as they depend upon numerous dynamic, complex and inter-related factors and assumptions, including market conditions at the time of any downgrade, whether any downgrade of a firm’s long-term credit rating precipitates downgrades to its short-term credit rating, and assumptions about the potential behaviours of various customers, investors and counterparties. Actual outflows could be higher or lower than this hypothetical example, depending upon certain factors including any management or restructuring actions that could be taken to reduce cash outflows and the potential liquidity impact from loss of unsecured funding (such as from money market funds) or loss of secured funding capacity.
Although unsecured and secured funding stresses are included in our stress testing scenarios and a portion of our total liquid assets is held against these risks, it is still the case that a credit rating downgrade could have a material adverse effect on us. In addition, if certain counterparties terminated derivative contracts with us and we were unable to replace such contracts, our market risk profile could be altered.
Likewise, a downgrade of the UK sovereign credit rating, or the perception that such a downgrade may occur, may have a material adverse effect on our operating results, financial condition, prospects and the marketability and trading value of our securities. This might also impact on our own credit rating, borrowing costs and our ability to secure funding. A UK sovereign credit rating downgrade or the perception that such a downgrade may occur could also have a material effect in depressing consumer confidence, restricting the availability, and increasing the cost, of funding for individuals and companies, further depressing economic activity, increasing unemployment and/or reducing asset prices.
In light of the difficulties in the financial services industry and the financial markets, there can be no assurance that the credit rating agencies will maintain our current credit ratings or outlooks. Our failure to maintain favourable credit ratings and outlooks could increase our cost of funding and adversely affect our interest margins, which could have a material negative effect on us.
Our financial results are constantly exposed to market risk. We are subject to fluctuations in interest rates and other market risks, which may materially adversely affect us.
Market risk refers to the probability of variations in our net interest income or in the market value of our assets and liabilities due to volatility of interest rate, exchange rate or equity price. Changes in interest rates affect the following areas, among others, of our business:
| • | | the volume of loans originated; |
| • | | the market value of our securities holdings; |
| • | | gains from sales of loans and securities; and |
| • | | gains and losses from derivatives. |
Variations in short-term interest rates could affect our net interest income, which comprises the majority of our revenue, reducing our growth rate and might even result in losses. When interest rates rise, we may be required to pay higher interest on our floating-rate borrowings while interest earned on our fixed-rate assets does not rise as quickly, which could cause profits to grow at a reduced rate or decline in some parts of our portfolio. Interest rate variations could adversely affect us, including our net interest income, reducing its growth rate or even resulting in losses. Interest rates are highly sensitive to many factors beyond our control, including increased regulation of the financial sector, monetary policies, domestic and international economic and political conditions and other factors.
Increases in interest rates may reduce the volume of loans we originate. Sustained high interest rates have historically discouraged customers from borrowing and have resulted in increased delinquencies in outstanding loans and deterioration in the quality of assets. Increases in interest rates may also reduce the propensity of our customers to prepay or refinance fixed-rate loans, reduce the value of our financial assets and reduce gains or require us to record losses on sales of our loans or securities.
If interest rates decrease, although this is likely to reduce our funding costs, it is likely to compress our interest margin, as well as adversely impacting the income we receive arising from our investments in securities and loans with similar maturities, which could have a negative effect on our operating results, financial condition and prospects.
The market value of a security with a fixed interest rate generally decreases when prevailing interest rates rise, which may have an adverse effect on our earnings and financial condition. In addition, we may incur costs (which, in turn, will impact our results) as we implement strategies to reduce future interest rate exposure. The market value of an obligation with a floating interest rate can be adversely affected when interest rates increase, due to a lag in the implementation of re-pricing terms or an inability to refinance at lower rates.
We are also exposed to foreign exchange rate risk as a result of mismatches between assets and liabilities denominated in different currencies. Fluctuations in the exchange rate between currencies may negatively affect our earnings and value of our assets and securities. Our capital is stated in pound sterling and we do not fully hedge our capital position against changes in currency exchange rates. Although we seek to hedge most of our currency risk through hedging and purchase of cross-currency swaps, these hedges do not eliminate currency risk and we can make no assurance that we will not suffer adverse financial consequences as a result of currency fluctuations. Significant exchange rate volatility and the depreciation of the pound sterling in particular could have an adverse impact on our results of operations and our ability to meet our US dollar and euro-denominated obligations, and could have a material adverse effect on our operating results, financial condition and prospects.
| | |
| Santander UK plc Annual Report 2013 | | 321 |
Shareholder Information
Risk Factorscontinued
We are also exposed to equity price risk in connection with our trading investments in equity securities as part of our normal course of business as a commercial bank. The performance of financial markets may cause changes in the value of our investment and trading portfolios. The volatility of world equity markets, due to the continued economic uncertainty and sovereign debt tensions, has had a particularly strong impact on the financial sector. Continued volatility may affect the value of our investments in entities in this sector and, depending on their fair value and future recovery expectations, could become a permanent impairment which would be subject to write-offs against our results. To the extent any of these risks materialise, our net interest income or the market value of our assets and liabilities could be adversely affected.
Market conditions have had resulted in, and could continue to result in, material changes to the estimated fair values of our financial assets. Negative fair value adjustments could have a material adverse effect on our operating results, financial condition and prospects.
In the past six years, financial markets have been subject to significant stress resulting in steep falls in perceived or actual financial asset values, particularly due to volatility in global financial markets and the resulting widening of credit spreads. We have material exposures to securities, loans and other investments that are recorded at fair value and are therefore exposed to potential negative fair value adjustments. Asset valuations in future periods, reflecting then prevailing market conditions, may result in negative changes in the fair values of our financial assets and these may also translate into increased impairments. In addition, the value ultimately realised by us on disposal may be lower than the current fair value. Any of these factors could require us to record negative fair value adjustments, which may have a material adverse effect on our operating results, financial condition or prospects.
In addition, to the extent that fair values are determined using financial valuation models, such values may be inaccurate or subject to change, as the data used by such models may not be available or may become unavailable due to changes in market conditions, particularly for illiquid assets, and particularly in times of economic instability. In such circumstances, our valuation methodologies require us to make assumptions, judgements and estimates in order to establish fair value.
This is a challenging task as reliable assumptions are difficult to make and are inherently uncertain. Moreover valuation models are complex, making them inherently imperfect predictors of actual results. Any consequential impairments or write-downs could have a material adverse effect on our operating results, financial condition and prospects.
Failure to successfully implement and continue to improve our credit risk management systems could materially and adversely affect our business.
As a commercial bank one of the main types of risks inherent in our business is credit risk. For example, an important feature of our credit risk management system is to employ our own credit rating system to assess the particular risk profile of a customer. This system is primarily generated internally but, in the case of counterparties with a global presence, also builds off the credit assessment assigned by other Banco Santander group members. As this process involves detailed analyses of the customer or credit risk, taking into account both quantitative and qualitative factors, it is subject to human error. In exercising their judgement, our employees may not always be able to assign an accurate credit rating to a customer or credit risk, which may result in our exposure to higher credit risks than indicated by our risk rating system.
In addition, we have refined our credit policies and guidelines to address potential risks associated with particular industries or types of customers, such as affiliated entities and group customers. However, we may not be able to timely detect these risks before they occur, or due to limited tools available to us, our employees may not be able to effectively implement them, which may increase our credit risk. Failure to effectively implement, consistently follow or continuously refine our credit risk management system may result in an increase in the level of non-performing loans and a higher risk exposure for us, which could have a material adverse effect on us.
We are subject to various risks associated with our derivative transactions that could have a material adverse effect on us.
We enter into derivative transactions for trading purposes as well as for hedging purposes. We are subject to various risks associated with these transactions, including market risk, operational risk, basis risk (the risk of loss associated with variations in the spread between the asset yield and the funding and/or hedge cost) and credit or default risk (the risk of insolvency or other inability of the counterparty to a particular transaction to perform its obligations thereunder, including providing sufficient collateral).
Market practices and documentation for derivative transactions in the UK may differ from those in other countries. In addition, the execution and performance of these transactions depends on our ability to develop adequate control and administration systems and to hire and retain qualified personnel. Moreover, our ability to adequately monitor, analyse and report derivative transactions continues to depend, to a great extent, on our information technology systems. This factor further increases the risks associated with these transactions and could have a material adverse effect on us.
Operational risks, including risks relating to data collection, processing and storage systems are inherent in our business.
Our businesses depend on the ability to process a large number of transactions efficiently and accurately, and on our ability to rely on our digital technologies, computer and email services, software and networks, as well as on the secure processing, storage and transmission of confidential and other information in our computer systems and networks. The proper functioning of financial control, accounting or other data collection and processing systems is critical to our businesses and to our ability to compete effectively. Losses can result from inadequate personnel, human error, inadequate or failed internal control processes and systems, or from external events that interrupt normal business operations. We also face the risk that the design of our controls and procedures prove to be inadequate or are circumvented. Although we work with our clients, vendors, service providers, counterparties and other third parties to develop secure transmission capabilities and prevent against cyber attacks, we routinely exchange personal, confidential and proprietary information by electronic means, and we may be the target of attempted cyber attacks. If we cannot maintain an effective data collection, management and processing system, we may be materially and adversely affected.
| | |
| 322 | | Santander UK plc Annual Report 2013 |
Shareholder Information
Risk Factorscontinued
We take protective measures and continuously monitor and develop our systems to protect our technology infrastructure and data from misappropriation or corruption, but our systems, software and networks nevertheless may be vulnerable to unauthorised access, misuse, computer viruses or other malicious code and other events that could have a security impact. An interception, misuse or mishandling of personal, confidential or proprietary information sent to or received from a client, vendor, service provider, counterparty or third party could result in legal liability, regulatory action and reputational harm. Furthermore, these may require us to expend significant additional resources to modify our protective measures or to investigate and remediate vulnerabilities or other exposures. There can be no assurance that we will not suffer material losses from operational risks in the future, including relating to cyber attacks or other such security breaches. Further, as cyber attacks continue to evolve, we may incur significant costs in our attempt to modify or enhance our protective measures or investigate or remediate any vulnerability.
We manage and hold confidential personal information of customers in the conduct of our banking operations. Although we have procedures and controls to safeguard personal information in our possession, unauthorised disclosures could subject us to legal actions and administrative sanctions as well as damages that could materially and adversely affect our operating results, financial condition and prospects.
In addition, our businesses are exposed to risk from potential non-compliance with policies, employee misconduct or negligence and fraud, which could result in regulatory sanctions and serious reputational or financial harm. In recent years, a number of multinational financial institutions have suffered material losses due to the actions of ‘rogue traders’ or other employees. It is not always possible to deter or prevent employee misconduct and the precautions we take to prevent and detect this activity may not always be effective.
We may be required to report events related to information security issues, such as hacking or hacking attempts, events where customer information may be compromised, unauthorised access and other security breaches, to the relevant regulatory authorities. Any material disruption or slowdown of our systems could cause information, including data related to customer requests, to be lost or to be delivered to our clients with delays or errors, which could reduce demand for our services and products and could materially and adversely affect us.
Any failure to effectively improve or upgrade our information technology infrastructure and management information systems in a timely manner could have a material adverse effect on us.
Our businesses and our ability to remain competitive depends to a significant extent upon the functionality of our information technology systems (including Partenon, the global banking information technology platform utilised by Santander UK and Banco Santander, S.A), and on our ability to upgrade and expand the capacity of our information technology on a timely and cost-effective basis. The proper functioning of our financial control, risk management, credit analysis and reporting, accounting, customer service and other information technology systems, as well as the communication networks between its branches and main data processing centres, are critical to our businesses and our ability to compete. We must continually make significant investments and improvements in our information technology infrastructure in order to remain competitive. We cannot be certain that in the future we will be able to maintain the level of capital expenditures necessary to support the improvement, expansion or upgrading of our information technology infrastructure as effectively as its competitors, this may result in a loss of the competitive advantages that we believe our information technology systems provide. Any failure to effectively improve, expand or upgrade our information technology infrastructure and management information systems in a timely manner could have a material adverse effect on us.
Despite our risk management policies, procedures and methods, we may nonetheless be exposed to unidentified or unanticipated risks.
The management of risk is an integral part of our activities. We seek to monitor and manage our risk exposure through a variety of separate but complementary financial, credit, market, operational, compliance and legal reporting systems. For further description of our risk management policies see the Risk Management Report on pages 61 to 163. While we employ a broad and diversified set of risk monitoring and risk mitigation techniques, such techniques and strategies may not be fully effective in mitigating our risk exposure in all economic market environments or against all types of risk, including risks that we fail to identify or anticipate.
Some of our qualitative tools and metrics for managing risk are based upon our use of observed historical market behaviour. We apply statistical and other tools to these observations to arrive at quantifications of our risk exposures. These qualitative tools and metrics may fail to predict future risk exposures. These risk exposures could, for example, arise from factors we did not anticipate or correctly evaluate in its statistical models. This would limit our ability to manage our risks. Our losses thus could be significantly greater than the historical measures indicate. In addition, our quantified modelling does not take all risks into account. Our more qualitative approach to managing those risks could prove insufficient, exposing us to material unanticipated losses. If existing or potential customers believe our risk management is inadequate, they could take their business elsewhere. This could have a material adverse effect on our operating results, financial condition and prospects.
Competition with other financial institutions could adversely affect us.
We face substantial competition in all parts of our business, including in originating loans and in attracting deposits. The competition in originating loans comes principally from other domestic and foreign banks, mortgage banking companies, consumer finance companies, insurance companies and other lenders and purchasers of loans. The market for UK financial services is highly competitive and the recent financial crisis continues to reshape the banking landscape in the UK, particularly the financial services and mortgage markets, reinforcing both the importance of a retail deposit funding base and the strong capitalisation of an institution. Lenders have moved increasingly towards a policy of concentrating on the highest quality customers, judged by credit score and loan to value criteria, and there is strong competition for these customers. The supply of credit is more limited for those potential customers without a large deposit or good credit history.
We expect competition to intensify in response to consumer demand, technological changes, the impact of consolidation, regulatory actions and other factors. In particular, the Independent Commission on Banking (the “ICB”), chaired by Sir John Vickers, has recommended that steps be taken to increase competition in the personal and small business banking sector (including, for example, strengthening the objectives of the Financial Conduct Authority (the “FCA”) (as successor to the FSA) for the role of conduct supervision, such that it is obliged to regulate in a manner which promotes competition. On 19 December 2011, HM Treasury published its response to the ICB report, agreeing with the majority of the ICB’s recommendations. The Financial Services Act 2012 has amended the Financial Services and Markets Act 2000 (“FSMA”) with effect from 1 April 2013 to include in the FCA’s operational objectives the objective of promoting effective competition in the interests of consumers in the markets for regulated financial services. A strong political and regulatory will to foster consumer choice in retail financial services could lead to even greater competition in the UK personal and small business banking sector.
| | |
| Santander UK plc Annual Report 2013 | | 323 |
Shareholder Information
Risk Factorscontinued
If financial markets remain unstable, financial institution consolidation may continue (whether as a result of the UK Government taking ownership and control over other financial institutions in the UK or otherwise). Financial institution consolidation could also result from the UK Government disposing of its stakes in those financial institutions it currently controls. Such consolidation could adversely affect our operating results, financial condition and prospects. There can be no assurance that this increased competition will not adversely affect our growth prospects, and therefore our operations. We also face competition from non-bank competitors, such as supermarkets and department stores for some credit products and generally from other loan providers.
Increasing competition could require that we increase our rates offered on deposits or lower the rates we charge on loans, which could also have a material adverse effect on us, including our profitability. It may also negatively affect our business results and prospects by, among other things, limiting our ability to increase our customer base and expand our operations and increasing competition for investment opportunities. In addition, if our customer service levels were perceived by the market to be materially below those of our competitor financial institutions, we could lose existing and potential business. If we are not successful in retaining and strengthening customer relationships, we may lose market share, incur losses on some or all of our activities or fail to attract new deposits or retain existing deposits, which could have a material adverse effect on our operating results, financial condition and prospects.
Our ability to maintain our competitive position depends, in part, on the success of new products and services we offer our customers and our ability to continue offering products and services from third parties, and we may not be able to manage various risks we face as we expand our range of products and services that could have a material adverse effect on us.
The success of our operations and our profitability depends, in part, on the success of new products and services we offer our customers. However, we cannot guarantee that our new products and services will be responsive to customer demands or successful once they are offered to our customers, or that they will be successful in the future. In addition, our customers’ needs or desires may change over time, and such changes may render our products and services obsolete, outdated or unattractive and we may not be able to develop new products that meet our customers’ changing needs. If we cannot respond in a timely fashion to the changing needs of our customers, we may lose customers, which could in turn materially and adversely affect us.
As we expand the range of our products and services, some of which may be at an early stage of development in the UK market, we will be exposed to new and potentially increasingly complex risks and development expenses. Our employees and risk management systems, as well as our experience and that of our partners, may not be sufficient or adequate to enable us to properly handle or manage such risks. In addition, the cost of developing products that are not launched is likely to affect our results of operations.
Further, our customers may issue complaints and seek redress if they consider that they have suffered loss from our products and services, for example, as a result of any alleged misselling or incorrect application of the terms and conditions of a particular product. This could in turn subject us to risks of potential legal action by our customers and intervention by our regulators. For further detail on our legal and regulatory risk exposures, please see the Risk Factor entitled “We are exposed to risk of loss from legal and regulatory proceedings” on page 328 and the Risk Factor entitled “Potential intervention by the FCA, the PRA or an overseas regulator may occur, particularly in response to customer complaints” on page 328.
Any or all of the above factors, individually or collectively, could have a material adverse effect on us.
If we are unable to effectively control the level of non-performing or poor credit quality loans in the future, or if our loan loss reserves are insufficient to cover future loan losses, this could have a material adverse effect on us.
Risks arising from changes in credit quality and the recoverability of loans and amounts due from counterparties are inherent in a wide range of our businesses. Non-performing or low credit quality loans can negatively impact our results of operations. We cannot be sure that we will be able to effectively control the level of the impaired loans in our total loan portfolio. In particular, the amount of our reported non-performing loans may increase in the future as a result of growth in our total loan portfolio, including as a result of loan portfolios that we may acquire in the future, or factors beyond our control, such as adverse changes in the credit quality of our borrowers and counterparties or a general deterioration in the UK or global economic conditions, impact of political events, events affecting certain industries or events affecting financial markets and global economies.
Our current loan loss reserves may not be adequate to cover an increase in the amount of non-performing loans or any future deterioration in the overall credit quality of our total loan portfolio. Our loan loss reserves are based on our current assessment of and expectations concerning various factors affecting the quality of our loan portfolio. These factors include, among other things, our borrowers’ financial condition, repayment abilities and repayment intentions, the realisable value of any collateral, the prospects for support from any guarantor, government macroeconomic policies, interest rates and the legal and regulatory environment. As the recent global financial crisis has demonstrated, many of these factors are beyond our control. As a result, there is no precise method for predicting loan and credit losses, and we cannot assure you that our loan loss reserves will be sufficient to cover actual losses.
If our assessment of and expectations concerning the above mentioned factors differ from actual developments, if the quality of our total loan portfolio deteriorates, for any reason, including the increase in lending to individuals and small and medium enterprises, the volume increase in the credit card portfolio and the introduction of new products, or if the future actual losses exceed our estimates of incurred losses, we may be required to increase our loan loss reserves, which may adversely affect us. If we are unable to control or reduce the level of our non-performing or poor credit quality loans, this could have a material adverse effect on us
Interest rates payable on a significant portion of our outstanding mortgage loan products fluctuate over time due to, among other factors, changes in the Bank of England base rate. As a result borrowers with variable interest rate mortgage loans are exposed to increased monthly payments when the related mortgage interest rate adjusts upward. Similarly, borrowers of mortgage loans with fixed or introductory rates adjusting to variable rates after an initial period are exposed to the risk of increased monthly payments at the end of this period. Over the last few years both variable and fixed interest rates have been at relatively low levels, which has benefited borrowers of new loans and those repaying existing variable rate loans regardless of special or introductory rates. Future increases in borrowers’ required monthly payments may result in higher delinquency rates and losses in the future. Borrowers seeking to avoid these increased monthly payments by refinancing their mortgage loans may no longer be able to find available replacement loans at comparably low interest rates. These events, alone or in combination, may contribute to higher delinquency rates and losses.
| | |
| 324 | | Santander UK plc Annual Report 2013 |
Shareholder Information
Risk Factorscontinued
Our loan portfolio is subject to risk of prepayment, which could have a material adverse effect on us.
Our loan portfolio is subject to prepayment risk, which results from the ability of a borrower or issuer to pay a debt obligation prior to maturity. Generally, in a declining interest rate environment, prepayment activity increases, which reduces the weighted average lives of our earning assets and could have a material adverse effect on us. We would also be required to amortise net premiums into income over a shorter period of time, thereby reducing the corresponding asset yield and net interest income. Prepayment risk also has a significant adverse impact on credit card and collateralised mortgage loans, since prepayments could shorten the weighted average life of these assets, which may result in a mismatch in our funding obligations and reinvestment at lower yields. Prepayment risk is inherent to our commercial activity and an increase in prepayments could have a material adverse effect on us.
The value of the collateral, including real estate, securing our loans may not be sufficient, and we may be unable to realise the full value of the collateral securing our loan portfolio.
The value of the collateral securing our loan portfolio may significantly fluctuate or decline due to factors beyond our control, including macroeconomic factors affecting the UK’s economy. The residential mortgage loan portfolio is one of our principal assets, comprising 83 per cent. of our loan portfolio as of 31 December 2013. As a result, we are highly exposed to developments in the residential property market in the UK.
The housing market has performed stronger than anticipated in 2013, with an increase in both house prices and the volume of property transactions. However, these increases have not so far resulted in strong growth in net mortgage lending in the market. Any further increase in house prices may be limited by the high level of prices relative to household earnings given the continued weakness seen in real earnings growth. The depth of the previous house price declines as well as the continuing uncertainty as to the extent and sustainability of the UK economic recovery will mean that losses could be incurred on loans should they go into possession.
The value of the collateral securing our loan portfolio may also be adversely affected by force majeure events such as natural disasters like floods or landslides. Any force majeure event may cause widespread damage and could have an adverse impact on the economy of the affected region and may therefore impair the asset quality of our loan portfolio in that area.
We may also not have sufficiently up-to-date information on the value of collateral, which may result in an inaccurate assessment for impairment losses of our loans secured by such collateral. If this were to occur, we may need to make additional provisions to cover actual impairment losses of our loans, which may materially and adversely affect our operating results, financial condition and prospects.
We have a core strategy to develop our operations organically and through acquisitions, but if we are unable to manage such development effectively, this could have an adverse impact on our profitability.
We allocate management and planning resources to develop strategic plans for organic development, and to identify possible acquisitions and disposals and areas for restructuring our businesses. We cannot provide assurance that we will, in all cases, be able to manage our growth effectively or deliver our strategic development objectives. Challenges that may result from our strategic development decisions include our ability to:
| • | | manage efficiently the operations and employees of expanding businesses; |
| • | | maintain or grow our existing customer base; |
| • | | assess the value, strengths and weaknesses of investment or acquisition candidates; |
| • | | finance strategic opportunities, investments or acquisitions; |
| • | | fully integrate strategic investments, or newly-established entities or acquisitions, in line with our strategy; |
| • | | align our current information technology systems adequately with those of an enlarged group; |
| • | | apply our risk management policy effectively to an enlarged group; and |
| • | | manage a growing number of entities without over-committing management or losing key personnel. |
Any failure to manage our development effectively, including relating to any or all of the above challenges associated with our development plans, could have a material adverse effect on our operating results, financial condition and prospects.
From time to time, we evaluate acquisition and partnership opportunities that we believe could offer additional value to our shareholders and are consistent with our business strategy. However, we may not be able to identify suitable acquisition or partnership candidates, and we may not be able to acquire promising targets or form partnerships on favourable terms or at all. Furthermore preparations for acquisitions which do not complete can be disruptive. We base our assessment of potential acquisitions and partnerships on limited and potentially inexact information and on assumptions with respect to value, operations, profitability and other matters that may prove to be incorrect. Our ability to benefit from any such acquisitions and partnerships will depend in part on our successful integration of those businesses. Such integration entails significant risks such as challenges in retaining the customers and employees of the acquired businesses, unforeseen difficulties in integrating operations and systems and unexpected liabilities or contingencies such as legal claims. We can give no assurances that our expectations with regards to integration and synergies will materialise. In addition, any acquisition or venture could result in the loss of key employees and inconsistencies in standards, controls, procedures and policies.
Moreover, the success of the acquisition or venture will at least in part be subject to a number of political, economic and other factors that are beyond our control. Any or all of these factors, individually or collectively, could have a material adverse effect on us.
Goodwill impairments may be required in relation to acquired businesses.
We have made business acquisitions in recent years and may make further in the future. It is possible that the goodwill which has been attributed, or may be attributed, to these businesses may have to be written-down if our valuation assumptions are required to be reassessed as a result of any deterioration in their underlying profitability, asset quality and other relevant matters. Impairment testing in respect of goodwill is performed annually, more frequently if there are impairment indicators present, and comprises a comparison of the carrying amount of the cash-generating unit with its recoverable amount. Goodwill impairment does not however affect our regulatory capital. Whilst no impairment of goodwill was recognised in 2012 or 2013, there can be no assurances that we will not have to write down the value attributed to goodwill in the future, which would adversely affect our results and net assets.
| | |
| Santander UK plc Annual Report 2013 | | 325 |
Shareholder Information
Risk Factorscontinued
We are subject to substantial regulation and governmental oversight which could adversely affect our business and operations.
As a financial institution, we are subject to extensive financial services laws, regulations, administrative actions and policies in the UK, the European Union and each other location in which we operate (including in the US and, indirectly, in Spain by the Banco de España (the Bank of Spain) as a result of being part of the Banco Santander, S.A. group) which materially affects our businesses. Statutes, regulations and policies to which we are subject, in particular those relating to the banking sector and financial institutions, may be changed at any time, and the interpretation and the application of those laws and regulations by regulators is also subject to change. Any legislative or regulatory actions and any required changes to our business operations resulting from such legislation and regulations could result in significant loss of revenue, limit our ability to pursue business opportunities in which we might otherwise consider engaging, affect the value of assets that we hold, require us to increase our prices and therefore reduce demand for our products, impose additional costs on us or otherwise adversely affect our businesses. Accordingly, there can be no assurance that future changes in regulations or in their interpretation or application will not adversely affect us.
During the recent market turmoil, there have been unprecedented levels of government and regulatory intervention and scrutiny, and changes to the regulations governing financial institutions and the conduct of business. In addition, in light of the financial crisis, regulatory and governmental authorities are considering, or may consider, further enhanced or new legal or regulatory requirements intended to prevent future crises or otherwise assure the stability of institutions under their supervision. This intensive approach to supervision has been maintained by the PRA and the FCA (as successor regulatory authorities to the FSA).
Recent proposals and measures taken by governmental, tax and regulatory authorities and further future changes in supervision and regulation, in particular in the UK, which are beyond our control, could materially affect our business, value of assets and operations, and result in significant increases in operational costs. Products and services offered by us could also be affected. Changes in UK legislation and regulation to address the stability of the financial sector may also affect the competitive position of the UK banks, including the Company, particularly if such changes are implemented before international consensus is reached on key issues affecting the industry, for instance in relation to the PRA’s regulations on capital and liquidity risk management and also the UK Government’s introduction of the bank levy. Although we work closely with our regulators and continually monitor the situation, future changes in law, regulation, fiscal or other policies can be unpredictable and are beyond our control. No assurance can be given generally that laws or regulations will be adopted, enforced or interpreted in a manner that will not have an adverse effect on our business.
On 16 June 2010, the Chancellor of the Exchequer announced the creation of the ICB. The ICB was asked to consider structural and related non-structural reforms to the UK banking sector to promote financial stability and competition, and to make recommendations to the UK Government. The ICB gave its recommendations on 12 September 2011 and proposed: (i) implementation of a retail ring fence; (ii) increased capital requirements; and (iii) improvement of competition – which were broadly endorsed by the Government in its response published on 19 December 2011. A White Paper was published on 14 June 2012 detailing how the Government intends to implement the recommendations of the ICB. A draft of the initial bill to implement the ICB recommendations was published on 12 October 2012, in the format of framework legislation to put in place the architecture to effect the reforms, with detailed policy being provided for through secondary legislation. On 4 February 2013, the Financial Services (Banking Reform) Bill (the “Banking Reform Bill”) was introduced to Parliament. Draft secondary legislation covering certain aspects of the ICB’s recommendations was released for consultation in July 2013. The Government expects the primary and secondary legislation to be in place by 2015 and to take effect by 2019. On 1 October 2013, amendments were made to the Banking Reform Bill. These amendments included provisions to implement the June 2013 recommendations of the Parliamentary Commission on Banking Standards, such as the creation of a new banking standards regime covering the conduct of bank staff and a criminal offence for reckless misconduct of banking staff.
On 18 December 2013, the Banking Reform Bill (as amended) received Royal Assent in the House of Lords as the Financial Services (Banking Reform) Act 2013 (the “Banking Reform Act”). Among other things, the Banking Reform Act
| • | | provides HM Treasury and the PRA powers to implement the ICB recommendations; |
| • | | introduces a senior persons regime, replacing the approved persons regime established under FSMA (as amended by the Financial Services Act 2012); |
| • | | introduces a new criminal offence for reckless misconduct in the management of a bank; |
| • | | establishes a new payment systems regulator to be established by the FCA; and |
| • | | amends the Banking Act 2009 to include a bail-in stabilisation option forming part of the special resolution regime (see the Risk Factor entitled “The Banking Act, the Banking Reform Act and similar European legislation, may adversely affect our business” on page 329 for further detail). |
It is too early to assess the full impact of the Banking Reform Act and any ancillary secondary legislation which may come into force. However, it is expected that changes to our structure and business, for example, will be necessary for us to comply with the Banking Reform Act and such changes could have an adverse effect on our operating results, financial condition and prospects.
In the United States, the Dodd-Frank Wall Street Reform and Consumer Protection Act, enacted on 21 July 2010 (the “Dodd-Frank Act”), has been implemented in part and continues to be implemented by various US federal regulatory agencies. The Dodd-Frank Act, among other things, imposes a new regulatory framework on swap transactions, including swaps of the sort that we enter into, requires regulators to adopt new rules governing the retention of credit risk by securitisers or originators of securitisations and significantly expands the coverage and scope of regulations that limit affiliate transactions within a banking organisation.
Within the Dodd-Frank Act, the so-called “Volcker Rule” prohibits “banking entities” from engaging in certain forms of proprietary trading or from sponsoring or investing in certain private funds, subject to certain exemptions, including exemptions permitting foreign banking entities to engage in trading and fund activities that take place solely outside of the United States. The Volcker Rule became effective on 21 July 2012 and on 31 January 2014, US regulators published final regulations to implement the Volcker Rule. In connection with the publication of final implementing regulations for the Volcker Rule, the Federal Reserve Board extended the conformance period for all banking entities until 21 July 2015, and additional extensions are possible. Banking entities must bring their activities and investments into compliance with the requirements of the Volcker Rule by the end of the conformance period. We are assessing how the final implementing regulations for the Volcker Rule will affect our businesses and have been developing and implementing plans to bring affected businesses into compliance.
Each of these aspects of the Dodd-Frank Act, as well as others, may directly and indirectly impact various aspects of our business. The full spectrum of risks that the Dodd-Frank Act, including the Volcker Rule, poses to us is not yet known. However, such risks could be material and we could be materially and adversely affected by them.
| | |
| 326 | | Santander UK plc Annual Report 2013 |
Shareholder Information
Risk Factorscontinued
In the UK and elsewhere, there is continuing political and regulatory scrutiny of the banking industry and, in particular, retail banking. Political involvement in the regulatory process, in the behaviour and governance of the UK banking sector and in the major financial institutions in which the UK Government has a direct financial interest is likely to continue. The Competition Commission, the FSA (and, following 1 April 2013, its successor, the FCA) and the Office of Fair Trading (“OFT”) have recently carried out, or are currently conducting, several enquiries.
The resolution of a number of issues, including regulatory reforms, investigations and reviews and court cases, affecting the UK financial services industry could have an adverse effect on our operating results, financial condition and prospects, or our relations with our customers and potential customers.
The structure of the financial regulatory authorities in the UK and the UK regulatory framework that applies to us has been reformed and reorganised and we are subject to any potential resulting uncertainty and changes to the UK regulatory regime in general.
Under the Financial Services Act 2012 which received Royal Assent on 19 December 2012, the UK Government introduced a range of structural reforms to UK financial regulatory bodies. Such reforms were implemented on 1 April 2013 as follows:
| • | | the FSA ceased to exist; |
| • | | a new Financial Policy Committee (“FPC”) was established within the Bank of England which is responsible for macro-prudential regulation, or regulation of stability and resilience of the financial system as a whole; |
| • | | an independent subsidiary of the Bank of England, the PRA, was established to oversee micro-prudential regulation of financial institutions that manage significant risks on their balance sheets; and |
| • | | the FCA was established and it has the responsibility for conduct of business and markets regulation. The FCA also represents the UK’s interests in market regulation at the new European Securities and Markets Authority. |
In addition, from 1 April 2014, regulation of consumer credit business (including second and subsequent charge mortgages) will be transferred from the OFT to the FCA pursuant to provisions contained in the Financial Services Act 2012. This is discussed in further detail in the Risk Factor entitled, “Various reforms to the mortgage lending and personal loans market have been proposed which could require significant implementation costs or changes to our business strategy”.
The new supervisory regimes of the PRA and the FCA are still in their initial stages, but it is already evident that implementation of the Financial Services Act 2012 has increased regulatory oversight of our activities, resulting in e.g. constraints in our business activities and increases in regulatory capital requirements. No assurance can be given that further changes will not be made to the regulatory regime in the UK generally, our particular business sectors in the market or specifically in relation to us. Any or all of these factors could have a material adverse effect on the conduct of our business and, therefore, also on our strategy and profitability, and ability to respond to and satisfy the supervisory requirements of the relevant UK regulatory authorities.
Various reforms to the mortgage lending and personal loans market have been proposed which could require significant implementation costs or changes to our business strategy.
In December 2011, the FSA published a consultation paper that consolidates proposals arising out of its wide-ranging “mortgage market review”, which was launched in October 2009 to consider strengthening rules and guidance on, among other things, affordability assessments, product regulation, arrears charges and responsible lending. The FSA’s aim was to ensure the continued provision of mortgage credit for the majority of borrowers who can afford the financial commitment of a mortgage, while preventing a re-emergence of poor lending practices as the supply of mortgage credit in the market recovers. In October 2012, the FSA published a feedback statement and final rules that will come into force on 26 April 2014. These rules will require, among other things, an assessment of affordability in accordance with detailed requirements, with transitional arrangements where the borrower does not take on additional borrowing except for essential repairs or maintenance work, and will ban self-certified loans. These rules will permit interest-only loans where there is a clearly understood and credible strategy for repaying the capital (evidence of which the lender must obtain before making the loan and check at least once during the term of the loan) and the cost of the repayment strategy must be part of the affordability assessment.
The impact of the changes is now clear and the reforms have presaged a period of significant change for our mortgage lending business which will mean reforms to its mortgage sales delivery systems, changes to its mortgage documentation and significant reform of our approach to risk assessment of prospective mortgage customers. These could have an adverse effect on our operating results, financial condition and prospects.
The Financial Services Act 2012 contains provisions enabling this transfer of consumer credit regulation (which includes new and existing second charge mortgages) from the OFT to the FCA. HM Treasury has announced that consumer credit regulation will be transferred to the FCA from 1 April 2014. The related secondary consumer credit legislation was enacted in July 2013. Under the new regime, the FCA may make rules under which, and from dates to be specified: (a) carrying on certain credit-related activities (including in relation to servicing credit agreements) otherwise than in accordance with permission from the FCA will render the credit agreement unenforceable without FCA approval and (b) the FCA will have power to render unenforceable contracts made in contravention of its rules on cost and duration of credit agreements or in contravention of its product intervention rules. The Financial Services Act 2012 also provides for formalised cooperation to exist between the FCA and the Financial Ombudsman Service (the “FOS”) (which determines complaints by eligible complainants in relation to authorised financial services firms, consumer credit licensees and certain other businesses), particularly where issues identified potentially have wider implications with a view to the FCA requiring firms to operate consumer redress schemes.
On 3 October 2013, the FCA published a further consultation paper containing detailed proposals for conduct of business and prudential rules for consumer credit firms and containing feedback to the FSA’s earlier consultation.
Given the uncertainties still surrounding the transition of the consumer credit regime from the OFT to the FCA, it is not clear what the impact on us will be. However, a likely consequence of these pending changes is that we will have to review and reform the sales processes and documentation of our consumer credit products including our credit card and unsecured personal loan products before April 2014. This review and the changes we may have to make could adversely affect its business.
Further, in March 2011, the European Commission published a proposal for a directive on credit agreements relating to residential immovable property for consumers (the “Mortgage Credit Directive”). The proposal requires, among other things, standard pre-contractual information, calculation of the annual percentage rate of charge in accordance with a prescribed formula, and a right of the borrower to make early repayment. On 10 December 2013, the European Parliament adopted the text of the proposed Mortgage Credit Directive and the European Council is expected to formally adopt the text of the Mortgage Credit Directive in one of its forthcoming meetings. The FCA Director of Mortgage and Consumer Lending stated in November 2013 that the FCA intended to publish a consultation on the implementation of the Mortgage Credit Directive in mid-2014. Until the UK implementing legislation is published, it is not certain what effect the adoption and implementation of the Mortgage Credit Directive will have on our mortgage business.
| | |
| Santander UK plc Annual Report 2013 | | 327 |
Shareholder Information
Risk Factorscontinued
We are exposed to risk of loss from legal and regulatory proceedings.
We face various issues that may give rise to risk of loss from legal and regulatory proceedings. These issues, including appropriately dealing with potential conflicts of interest, and legal and regulatory requirements, could increase the amount of damages asserted against us or subject us to regulatory enforcement actions, fines and penalties. The current regulatory environment, with its increased supervisory focus on enforcement, combined with uncertainty about the evolution of the regulatory regime, may lead to material operational and compliance costs. These include the risk that:
| • | | certain aspects of our business may be determined by the Bank of England, the PRA, the FCA, HM Treasury, the OFT, the FOS or the courts as not to have been or being conducted in accordance with applicable laws or regulations, or, in the case of the FOS, with what is fair and reasonable in the FOS’s opinion; |
| • | | the alleged misselling of financial products, such as payment protection insurance (“PPI”), including as a result of having sales practices and/or rewards structures that are now deemed to have been inappropriate, results in disciplinary action (including significant fines) or requires us to amend sales processes, withdraw products, or provide restitution to affected customers, all of which may require additional provisions to be recorded in our financial statements and could adversely impact future revenues from affected products; |
| • | | we hold accounts for entities that might be or are subject to interest from various regulators, including the UK’s Serious Fraud Office, regulators in the US and elsewhere (we are not aware of any current investigation into us as a result of any such enquiries, but cannot exclude the possibility of our conduct being reviewed as part of any such investigation); and |
| • | | we may be liable for damages to third parties harmed by the conduct of our business. |
We are from time to time subject to certain claims and party to certain legal proceedings incidental to the normal course of our business, including in connection with our lending activities, relationships with our employees and other commercial or tax matters. These can be brought against us under UK regulatory processes or in the UK courts, or those in other jurisdictions where we operate, including the European Union and the United States. In view of the inherent difficulty of predicting the outcome of legal matters, particularly where the claimants seek very large or indeterminate damages, or where the cases present novel legal theories, involve a large number of parties or are in the early stages of discovery, we cannot state with confidence what the eventual outcome of these pending matters will be or what the eventual loss, fines or penalties related to each pending matter may be and these pending matters are not disclosed by name because they are under assessment. We believe that we have made adequate provisions related to the costs anticipated to be incurred in connection with these various claims and legal proceedings. However, the amount of these provisions is substantially less than the total amount of the claims asserted against us and in light of the uncertainties involved in such claims and proceedings, there can be no assurance that the ultimate resolution of these matters will not significantly exceed the provisions currently accrued by us. As a result, the outcome of a particular matter may be material to our operating results for a particular period, depending upon, among other factors, the size of the loss or liability imposed and our level of income for that period.
The FCA carries out regular and frequent reviews of the conduct of business by financial institutions including banks. An adverse finding by a regulator could result in the need for extensive changes in systems and controls, business policies, and practices coupled with suspension of sales, withdrawal of services, customer redress, fines and reputational damage.
Failure to manage these risks adequately could have a material adverse effect on our reputation, operating results, financial condition and prospects.
Potential intervention by the FCA, the PRA or an overseas regulator may occur, particularly in response to customer complaints.
The PRA and the FCA now have a more outcome-focused regulatory approach than their predecessor the FSA. This involves more proactive enforcement and more punitive penalties for infringement. As a result, we and other PRA and/or FCA-authorised firms are therefore facing increased supervisory intrusion and scrutiny (resulting in increasing internal compliance costs and supervision fees) and in the event of a breach of their regulatory obligations are likely to face more stringent penalties.
In particular, the FCA has a strong focus on consumer protection and it is taking a more interventionist approach in its increasing scrutiny of product terms and conditions. FSMA (as amended by the Financial Services Act 2012) gives the FCA the power to make temporary product intervention rules either to improve a firm’s systems and controls in relation to product design, product management and implementation, or to address problems identified with products which may potentially cause significant detriment to consumers because of certain product features or firms’ flawed governance and distribution strategies. Such rules may prevent firms from entering into product agreements with consumers until such problems have been rectified.
The regulatory regime requires us to be in compliance across all aspects of our business, including the training, authorisation and supervision of personnel, systems, processes and documentation. If we fail to be compliant with relevant regulations, there is a risk of an adverse impact on our business from sanctions, fines or other action imposed by the regulatory authorities. Customers of financial services institutions, including our customers, may seek redress if they consider that they have suffered loss as a result of the misselling of a particular product, or through incorrect application of the terms and conditions of a particular product. Given the inherent unpredictability of litigation and the evolution of judgements by the FOS, it is possible that an adverse outcome in some matters could have a material adverse effect on our operating results, financial condition and prospects arising from any penalties imposed or compensation awarded, together with the costs of defending such an action.
Under the Financial Services Act 2010, the FCA has the power to require authorised firms, including us, to establish a consumer redress scheme if it considers that consumers have suffered loss or damage as a consequence of a widespread or regular regulatory failing, including misselling.
| | |
| 328 | | Santander UK plc Annual Report 2013 |
Shareholder Information
Risk Factorscontinued
In recent years there have been several industry-wide issues in which the FSA (now the FCA) has intervened directly. One such issue is the misselling of PPI. In August 2010, the FSA published a policy statement entitled “The assessment and redress of Payment Protection Insurance complaints” (the “Policy Statement”). The Policy Statement contained rules which altered the basis on which regulated firms (including the Company and certain members of the Santander UK group) must consider and deal with complaints in relation to the sale of PPI and potentially increased the amount of compensation payable to customers whose complaints are upheld. A legal challenge of these rules by the British Bankers’ Association (the ‘BBA’) was unsuccessful. In light of this and the consequential increase in claims levels we performed a detailed review of our provision requirements in the first half of 2011 and, as a result, revised our provision for PPI complaint liabilities to reflect the new information. The overall effect of the above was a substantial increase in the provision requirement for 2011. In setting the PPI provision, management estimated the total claims that were likely to be received. While initial claim levels at the beginning of the process were quite low, this increased as a result of press coverage and the activities of the claims management companies (“CMCs”), and then began to decrease after reaching a peak in the second half of 2012. In line with expectations, the volume of activity observed and the number of complaints received decreased over 2013. Although we continue to receive a significant number of complaints via CMCs, these are declining in line with overall volumes. The PPI provision remains adequate in management’s view and will continue to be monitored.
Notwithstanding the recent trend of decreasing complaints, the ultimate financial impact on us of the claims arising from PPI complaints is still uncertain and will depend on a number of factors, including the implementation of the Policy Statement, the rate at which new complaints arise, the content and quality of the complaints (including the availability of supporting evidence), the role of claims management companies and the average uphold rates and redress costs. We can make no assurance that expenses associated with PPI complaints will not exceed the provision we have made relating to these claims. More generally, we can make no assurance that our estimates for potential liabilities, based on the key assumptions we used, are correct, and the reserves taken as a result may prove inadequate. If we were to incur additional expenses that exceed provisions for PPI liabilities or other provisions, these expenses could have a material adverse effect on our operating results, financial condition and prospects. For further information about the provisions for PPI complaint liabilities and other conduct remediation see Note 36 to the Financial Statements.
All the above is similarly relevant to any future industry-wide misselling or other issues that could affect us, such as the sale of other retail financial products and interest-rate derivative products sold to SMEs. This may lead from time to time to: (i) significant direct costs or liabilities (including in relation to misselling); and (ii) changes in the practices of such businesses which benefit customers at a cost to shareholders.
Decisions taken by the FOS (or any overseas equivalent that has jurisdiction) could, if applied to a wider class or grouping of customers, have a material adverse effect on our operating results, financial condition and prospects.
The Financial Services and Markets Act 2000 (Designated Consumer Bodies) Order 2013 (the “Order”) was made on 16 December 2013 and came into force on 1 January 2014. The Order designates the National Association of Citizens Advice Bureaux, the Consumers’ Association, the General Consumer Council for Northern Ireland and the National Federation of Self Employed and Small Businesses as consumer bodies that may submit a super-complaint to the FCA on behalf of consumers of financial services where it considers that a feature, or a combination of features, of the market for financial services in the UK is seriously damaging the interests of these customers. Complaints about damage to the interests of individual consumers will continue to be dealt with by the FOS. If a super-complaint is made against us by a designated consumer body under this Order, any response published or action taken by the FCA could have a material adverse effect on our operating results, financial condition and prospects.
The Banking Act, the Banking Reform Act and similar European legislation, may adversely affect our business.
The Banking Act 2009 (the “Banking Act”) came into force on 21 February 2009. The special resolution regime set out in the Banking Act provides HM Treasury, the Bank of England, the PRA and the FCA (and their successor bodies) with a variety of powers for dealing with UK deposit taking institutions (and, in certain circumstances, their holding companies) that are failing or likely to fail, including: (i) to take a bank or bank holding company into temporary public ownership; (ii) to transfer all or part of the business of a bank to a private sector purchaser; or (iii) to transfer all or part of the business of a bank to a “bridge bank”. The special resolution regime also comprises a separate insolvency procedure and administration procedure each of which is of specific application to banks. These insolvency and administration measures may be invoked prior to the point at which an application for insolvency proceedings with respect to a relevant institution could be made.
If an instrument or order were made under the Banking Act in respect of the Company, such instrument or order (as the case may be) may (among other things): (i) result in a compulsory transfer of shares or other securities or property of the Company; (ii) impact on the rights of the holders of shares or other securities in the Company or result in the nullification or modification of the terms and conditions of such shares or securities; or (iii) result in the de-listing of the Company’s shares and/or other securities. In addition, such an order may affect matters in respect of the Company and/or other aspects of the Company’s shares or other securities which may negatively affect the ability of the Company to meet its obligations in respect of such shares or securities.
At present, no instruments or orders have been made under the Banking Act relating to us and there has been no indication that any such order will be made, but there can be no assurance that holders of shares or other securities in the Company would not be adversely affected by any such order if made in the future.
In addition, pursuant to recent amendments made to the Banking Act (which amendments have not taken effect), provision has been made for tools to be used in respect of a wider range of UK entities, including investment firms and certain banking group companies, provided that certain conditions are met. HM Treasury is currently consulting on secondary legislation that specifies the definition of such companies. This consultation closed on 21 November 2013. The proposed secondary legislation would, if enacted, have the effect of allowing the Banking Act powers to be applied to investment firms that are required to hold initial capital of€730,000 and to certain UK incorporated non-bank companies in the Santander UK group. Until such secondary legislation is made, it is too early to anticipate the full impact of the amendments made to the Banking Act and it is not possible to determine the impact of any action taken under the relevant provisions on investors, should such provisions apply to companies in the Santander UK group.
In June 2012, the European Commission published a legislative proposal for a directive providing for the establishment of an EU-wide framework for the recovery and resolution of credit institutions and investment firms (the “CMD”). The stated aim of the draft CMD is to provide authorities with common tools and powers to address banking crises pre-emptively in order to safeguard financial stability and minimise taxpayers’ exposure to losses. The draft CMD currently contains similar resolution tools and powers to the Banking Act, including a ‘bail-in’ power which, if implemented, would give resolution authorities the power to write down the claims of unsecured creditors of a failing institution and to convert unsecured debt claims to equity (subject to certain parameters). The draft CMD currently contemplates that its provisions must be applied by EU Member States from 1 January 2015 except for the bail-in tool (in relation to certain instruments) which is to be applied from 1 January 2018.
| | |
| Santander UK plc Annual Report 2013 | | 329 |
Shareholder Information
Risk Factorscontinued
The draft CMD envisages that the resolution powers, including the bail-in power, could, if certain trigger conditions are satisfied, be applied to credit institutions and certain large investment firms in the EU. Consequently, if the CMD were implemented in its current form and the relevant trigger conditions satisfied, there is a possibility that these powers could be applied to us. The implementation of such powers currently set out in the draft CMD would impact how credit institutions and investment firms (including us) are managed as well as, in certain circumstances, the rights of creditors. However, the proposed directive is not in final form and changes may be made to it in the course of the legislative process. In addition, many of the proposals contained in the draft CMD have already been implemented in the Banking Act and it is currently unclear as to what extent, if any, the provisions of the Banking Act may need to change once the draft CMD is implemented. The European Parliament is due to consider the draft CMD at its February 2014 plenary session. Accordingly, it is not yet possible to assess the full impact of the draft CMD on us and there can be no assurance that, once it is implemented, the fact of its implementation or the taking of any actions currently contemplated in it would not materially and adversely affect our operating results, financial condition and prospects.
In addition, the CMD provides for resolution authorities to have the power to require institutions and groups to make structural changes to ensure legal and operational separation of “critical functions” from other functions where necessary, or to require institutions to limit or cease existing or proposed activities in certain circumstances. If used in respect of us, these ex ante powers could have a negative impact on our business.
On 1 October 2013, the UK Government published amendments to the Financial Services (Banking Reform) Bill. The amendments introduce, among other things, a national UK bail-in power, which would form part of the existing special resolution regime under the Banking Act. On 18 December 2013, the Banking Reform Bill received Royal Assent in the House of Lords as the Banking Reform Act. The Banking Reform Act amends the Banking Act to include a bail-in stabilisation option forming part of the special resolution regime, giving the UK authorities, in advance of CMD implementation, the power to cancel, write-down or convert to equity any securities issued by us. It is not yet possible to assess the full impact of the UK bail-in power on us and there can be no assurance that its implementation or the taking of any actions contemplated by it would not materially and adversely affect our operating results, financial condition and prospects.
We are responsible for contributing to compensation schemes in the UK in respect of banks and other authorised financial services firms that are unable to meet their obligations to customers.
In the UK, the Financial Services Compensation Scheme (“FSCS”) was established under the Financial Services and Markets Act 2000 and is the UK’s statutory fund of last resort for customers of authorised financial services firms. The FSCS can pay compensation to customers if a PRA or FCA-authorised firm is unable, or likely to be unable, to pay claims against it (for instance, an authorised bank is unable to pay claims by depositors). The FSCS is funded by levies on firms authorised by the PRA or the FCA, including the Company and other members of the Santander UK group.
Following the default of a number of authorised financial services firms since 2008, the FCSC borrowed funds totalling approximately £18 billion from HM Treasury to meet the compensation costs for customers of those firms. Whilst it is expected that the substantial majority of the principal will be repaid from funds the FSCS levies from asset sales, surplus cash flow or other recoveries in relation to assets of the firms that defaulted, to the extent there remains a shortfall, the FSCS will recover this shortfall by levying firms authorised by the PRA or the FCA in instalments. The first instalment was in scheme year 2013/14 and we made a first capital contribution in August 2013. For the year ended 31 December 2013, we charged £59m to the income statement in respect of the costs of the FSCS.
In the event that the FSCS raises further funds from authorised firms or increases the levies to be paid by such firms or the frequency at which the levies are to be paid, the associated cost to us may have a material adverse effect on our operating results, financial condition and prospects. The recent measures taken to protect the depositors of deposit-taking institutions involving the FSCS, such as the borrowing from HM Treasury mentioned above, have resulted in a significant increase in the levies made by the FSCS on the industry and such levies may continue to go up if similar measures are required to protect depositors of other institutions.
In addition, regulatory reform initiatives in the UK and internationally may result in further changes to the FSCS, which could result in additional costs and risks for us. For instance, the FSA announced in October 2011 that it was restarting its review of the funding of the FSCS and on 25 July 2012 it announced a consultation on proposed changes to the funding of the FSCS. A second consultation dealing with certain proposals relating to intermediaries and investment providers followed and this closed on 18 February 2013. In a policy statement published in March 2012, the FCA expressed its intention to proceed as outlined in its July 2012 consultation paper and its final rules came into effect on 1 April 2013. Similarly, in July 2013, the Council of the European Union announced its intention that revisions to the EU Deposit Guarantee Scheme Directive should be adopted by the end of 2013. The proposed revisions include the introduction of a tighter definition of deposits, a requirement that the Deposit Guarantee Scheme pay customers within a week and a requirement that banks must be able to provide information on the aggregated deposits of a depositor. If these revisions are adopted, they are likely to affect the methodology employed by the FSCS for determining levies on institutions. Changes as a result of this may affect the profitability of the Company (and other members of the Santander UK group required to contribute to the FSCS). The European Parliament and EU member States are in the final stages of negotiation on the text of the EU Deposit Guarantee Scheme Directive which is expected to be formally approved in early 2014.
FSCS levies are collected by the FCA as part of a single payment by firms covering the FCA, the PRA, the FOS and the FSCS fees. It is possible that future policy of the FSCS and future levies on the firms authorised by the FCA or PRA may differ from those at present and that this could lead to a period of some uncertainty for members of the Santander UK group. In addition, it is possible that other jurisdictions where we operate could introduce or amend their similar compensation, contributory or reimbursement schemes. As a result of any such developments, we may incur additional costs and liabilities which may adversely affect our operating results, financial condition and prospects.
We may not be able to detect money laundering and other illegal or improper activities fully or on a timely basis, which could expose us to additional liability and could have a material adverse effect on us.
We are required to comply with applicable anti-money laundering, anti-terrorism and other laws and regulations in the jurisdictions in which we operate. These laws and regulations require us, among other things, to adopt and enforce “know-your-customer” policies and procedures and to report suspicious and large transactions to the applicable regulatory authorities. These laws and regulations have become increasingly complex and detailed, require improved systems and sophisticated monitoring and compliance personnel and have become the subject of enhanced government supervision.
| | |
| 330 | | Santander UK plc Annual Report 2013 |
Shareholder Information
Risk Factorscontinued
While we have adopted policies and procedures aimed at detecting and preventing the use of our banking network for money laundering and related activities, such policies and procedures have in some cases only been recently adopted and may not completely eliminate instances where we may be used by other parties to engage in money laundering and other illegal or improper activities. In addition, the personnel we employ in supervising these activities may not have experience that is comparable to the level of sophistication of criminal organisations. To the extent we fail to fully comply with applicable laws and regulations, the relevant government agencies to which we report have the power and authority to impose fines and other penalties on us, including the revocation of licences. Our business and reputation could also suffer if customers use our banking network for money laundering or illegal or improper purposes.
In addition, while we review our relevant counterparties’ internal policies and procedures with respect to such matters, we, to a large degree, rely upon our relevant counterparties to maintain and properly apply their own appropriate anti-money laundering procedures. Such measures, procedures and compliance may not be completely effective in preventing third parties from using us and our relevant counterparties)as a conduit for money laundering (including illegal cash operations) without our and our relevant counterparties’ knowledge. If we are associated with, or even accused of being associated with, or of becoming a party to, money laundering, then our reputation could suffer and/or we could become subject to fines, sanctions and/or legal enforcement (including being added to any “black lists” that would prohibit certain parties from engaging in transactions with us), any one of which could have a material adverse effect on our operating results, financial condition and prospects.
Changes in taxes and other assessments may adversely affect us.
The tax and other assessment regimes to which we and our customers are subject are regularly reformed, or subject to proposed reforms. Such reforms include changes in the rate of assessments and, occasionally, enactment of temporary taxes, the proceeds of which may be earmarked for designated governmental purposes. The effects of these changes and any other changes that result from enactment of additional tax reforms have not been, and cannot be, quantified and there can be no assurance that these reforms will not, once implemented, have an adverse effect upon our business. Furthermore, such changes may produce uncertainty in the financial system, increasing the cost of borrowing and contributing to the increase in our non-performing credit portfolio.
The following paragraphs discuss three major reforms (the UK bank levy, FATCA and possible future changes in the taxation of banking groups in the European Union) which could have a material adverse effect on our operating results, financial condition and prospects, and the competitive position of UK banks, including the Company.
UK Bank Levy: HM Treasury introduced an annual UK bank levy (the “Bank Levy”) via legislation in the Finance Act 2011. The Bank Levy is imposed on (amongst other entities) UK banking groups and subsidiaries, and therefore applies to us. The amount of the Bank Levy is based on a bank’s total liabilities, excluding (amongst other things) Tier 1 Capital, insured retail deposits and repos secured on sovereign debt. A reduced rate is applied to longer-term liabilities. The UK Government intends that the Bank Levy should raise at least £2.5bn each year. To offset the shortfall in Bank Levy receipts, and also to take account of the benefit to the banking sector of reductions in the rate of corporation tax, the rate of the Bank Levy was increased on 1 January 2012 and again on 1 January 2013. In December 2013, it was further announced that on 1 January 2014, the rate of the Bank Levy would rise to 0.156% in order to raise an estimated £2.7 billion in 2014 to 2015 and an estimated £2.9 billion each year from 2015 to 2016.
FATCA: Sections 1471 through 1474 of the US Internal Revenue Code (“FATCA”) impose a new reporting regime and potentially a 30 per cent. withholding tax with respect to certain payments to any non-US financial institution (a “foreign financial institution “ or “FFI” (as defined by FATCA)) that (i) does not become a “Participating FFI” by entering into an agreement with the US Internal Revenue Service (the “IRS”) to provide the IRS with certain information in respect of its account holders and investors; or (ii) is not otherwise exempt from or in deemed compliance with FATCA. We are classified as an FFI.
Final regulations implementing FATCA were promulgated in January 2013. The new reporting and withholding regime will be phased in over time (with withholding beginning 1 July 2014 for certain payments from sources within the United States and 1 January 2017 for payments of gross proceeds on assets that could generate US source dividend or interest and “foreign pass thru payments” (a term not yet defined)).
The US and the UK have entered into an agreement for the implementation of FATCA (the “US-UK IGA”) under which we expect to be treated as a Reporting FI (as defined under the US-UK IGA) and accordingly do not anticipate being required to deduct any tax under FATCA. The UK regulations implementing the US-UK IGA and accompanying guidance on their application were published in final form in August 2013. Each relevant member of the Santander UK group subject to the US-UK IGA will, however, need to comply with certain due diligence and reporting requirements to HMRC. There can be no assurance that any such member of the Santander UK group will be treated as a Reporting FI or that in the future we would not be required to deduct tax under FATCA from payments we make on certain financial products.
Further, additional rules similar to FATCA are being implemented and the UK has entered into information sharing agreements based on FATCA with its Crown Dependencies and Overseas Territories. The Crown Dependency agreements are reciprocal and will require UK Financial Institutions to identify customers who are tax residents of the Crown Dependencies (and vice versa). The commencement date for these agreements is the same as for FATCA i.e., 1 July 2014.
Similarly, the Organisation for Economic Co-operation and Development (“OECD”) is working to develop a draft common reporting standard and model competent authority agreement to enable the multilateral exchange of financial account information (“AEOI”). The OECD work is borne out of FATCA and the starting point is the Model 1 Intergovernmental Agreement (on which the US-UK IGA is based). It is expected that Financial Institutions will be required to identify and report the tax residence status of customers in the 30 plus countries that have endorsed the plans. Whilst it is welcome that FATCA is the foundation of AEOI, the required systemic solutions to meet the multilateral context will require significant lead times to build and implement. For early adopting countries reporting under this model could take place in 2016.
European Taxation: As of 1 August 2012, pursuant to the French amending finance law for 2012, a financial transaction tax in France was introduced (the “French Financial Transaction Tax”). The French Financial Transaction Tax is set to be imposed on certain transactions, referenced to, or in relation with, French listed shares where the relevant issuer’s stock market capitalisation exceeds 1 billion euros. The French Financial Transaction Tax rate is 0.1 per cent. of the sale price of the transaction.
Similarly, on 24 December 2012, pursuant to paragraphs 491 to 500 of Article 1 of the Italian Law 288, a financial transaction tax in Italy was introduced (the “Italian Financial Transaction Tax”). The Italian Financial Transaction Tax commenced on 1 March 2013 for transactions in Italian equity instruments from 1 July 2013 for Italian equity derivatives. The Italian Financial Transaction Tax rate is between 0.12 per cent. and 0.22 per cent. of the sale price of the transaction reducing to between 0.2% and 0.1% respectively from 1 January 2014.
| | |
| Santander UK plc Annual Report 2013 | | 331 |
Shareholder Information
Risk Factorscontinued
Furthermore, in September 2011, the European Commission (the “Commission”) tabled a proposal for a common system of financial transactions taxes (“EU Financial Transaction Tax”). Despite intense discussions on this proposal there was no unanimity amongst the 27 Member States. Eleven Member States (each a “Participating Member State”) requested enhanced cooperation on a EU Financial Transaction Tax based upon the Commission’s original proposal. The Commission presented a Decision to this effect and this Decision was adopted by the EU’s Council of Finance Ministers at its committee meeting on 22 January 2013. The formal Directive was published on 14 February 2013, under which Participating Member States may charge a EU Financial Transaction Tax on all financial transactions with effect from 1 January 2014 where (i) at least one party to the transaction is established in the territory of a Participating Member State and (ii) a financial institution established in the territory of a Participating Member State is a party to the transaction acting either for its own account or for the account of another person, or is acting in the name of a party to the transaction. Whilst the UK is not a Participating Member State, the Directive proposals are broad and as such may impact transactions completed by financial institutions operating in non-Participating Member States. We are still assessing the proposals to determine the likely impact on us.
The EU Financial Transaction Tax proposal remains subject to negotiation between the Participating Member States and is the subject of legal challenge. It may therefore be altered prior to any implementation. The tax was expected to enter into force from 1 January 2014; however, the Commission announced a formal delay in June 2013 of at least six months. The Commission stated that Financial Transaction Tax is expected to be introduced “towards the middle of 2014”.
Changes in our pension liabilities and obligations could have a materially adverse effect on us.
We provide retirement benefits for many of our former and current employees in the UK through a number of defined benefit pension schemes established under trust. The Company is the principal employer under these schemes, but we have only limited control over the rate at which we pay into such schemes. Under the UK statutory funding requirements, employers are usually required to contribute to the schemes at the rate they agree with the scheme trustees, although if they cannot agree, such rate can be set by the Pensions Regulator. The scheme trustees may, in the course of discussions about future valuations, seek higher employer contributions. The scheme trustees’ power in relation to the payment of pension contributions depends on the terms of the trust deed and rules governing the pension schemes.
The UK Pensions Regulator has the power to issue a financial support direction to companies within a group in respect of the liability of employers participating in the UK defined benefit pension plans where that employer is a service company, or is otherwise “insufficiently resourced” (as defined for the purposes of the relevant legislation). As some of the employers within the Santander UK group are service companies, if they become insufficiently resourced, other companies within the Santander UK group which are connected with or an associate of those employers are at risk of a financial support direction in respect of those employers’ liabilities to the defined benefit pension schemes in circumstances where the Pensions Regulator properly considers it reasonable to issue one. Such a financial support direction could require the companies to guarantee or provide security for the pension liabilities of those employers, or could require additional amounts to be paid into the relevant pension schemes in respect of them.
The UK courts have previously decided that liabilities under financial support directions issued by the Pensions Regulator against companies after they have gone into administration were payable as an expense of the administration, and did not rank as provable debts. This would have meant that such liabilities must be satisfied before any distributions to unsecured creditors could be made. On 24 July 2013, the Supreme Court issued its decision on this case and reversed the decision of the lower courts, thus pension liabilities will receive no special protection above secured and non-secured creditors.
The Pensions Regulator can also issue contribution notices if it is of the opinion that an employer has taken actions, or failed to take actions, deliberately designed to avoid meeting its pension promises or which are materially detrimental to the scheme’s ability to meet its pension promises. A contribution notice can be moved to any company which is connected with or an associate of such employer in circumstances where the Regulator considers it reasonable to issue. The risk of a contribution notice being imposed may inhibit our freedom to restructure or to undertake certain corporate activities.
In a judgment handed down on 18 December 2013, the High Court has held that, where multiple group companies are potential targets for the Pensions Regulator’s power to issue contribution notices, the aggregate total of the contributions required by those notices was not limited to the amount required to fully fund the deficit in the relevant pension scheme under section 75 of the Pensions Act 1995 (Section 75). Although such a limit still applies in relation to a single contribution notice, this judgment means that, where there is more than one target for the Pensions Regulator’s powers, each of the contribution notices it could issue to those targets can be for the full amount of the Section 75 funding deficit and, further, the scheme may, under such multiple contribution notices, recover more than the actual or notional employer debt, potentially creating a surplus for the scheme. The High Court’s decision reopens the issue of schemes having a superior priority position over other creditors. This decision is expected to be the subject of an appeal to the Court of Appeal.
Any increase in the current size of the deficit in the defined benefit schemes operated by us, due to reduction in the value of the pension fund assets (depending on the performance of financial markets) or an increase in the pension fund liabilities due to changes in mortality assumptions, the rate of increase of salaries, discount rate assumptions, inflation, the expected rate of return on plan assets, or other factors, could result in us having to make increased contributions to reduce or satisfy the deficits which would divert resources from use in other areas of our business and reduce the Company’s capital resources. While we can control a number of the above factors, there are some over which we have no or limited control. Although the trustees of the defined benefit pension schemes are obliged to consult with us before changing the pension schemes’ investment strategy, the trustees have the final say and ultimate responsibility for investment strategy rests with them. For example, our principal defined pension scheme is the Santander (UK) Group Pension Scheme and its corporate trustee is Santander (UK) Group Pension Scheme Trustee Limited (the “Trustee”), a wholly-owned subsidiary of the Company. As at 31 December 2013, the Trustee had 14 directors, comprising seven Santander-UK appointed directors and seven member- elected directors. Investment decisions are delegated by the Trustee to a common investment fund, managed by Santander (CF) Trustee Limited, a private limited company owned by seven Trustee directors, four appointed by the Company and three by the Trustee. The Trustee directors’ principal duty, within the investment powers delegated to them, is to act in the best interest of the members of the Santander UK Group Pension Scheme and not that of the Company. Any increase in our pension liabilities and obligations could have a material adverse effect on our operating results, financial condition and prospects.
The ongoing changes in the UK supervision and regulatory regime and particularly the implementation of the ICB’s recommendations may require us to make changes to its structure and business which could have an impact on our pension schemes or liabilities. For a discussion of the ICB’s recommendations see “We are subject to substantial regulation and governmental oversight which could adversely affect our business and operations” on pages 325 to 326.
| | |
| 332 | | Santander UK plc Annual Report 2013 |
Shareholder Information
Risk Factorscontinued
Damage to our reputation could cause harm to our business prospects.
Maintaining a positive reputation is critical to our attracting and maintaining customers, investors and employees and conducting business transactions with counterparties. Damage to our reputation, the reputation of Banco Santander, S.A. (as the majority shareholder in the Company), the reputation of affiliates operating under the “Santander” brand or any of our other brands or the reputation of the UK or of Spain could therefore cause significant harm to our business and prospects. Harm to our reputation can arise from numerous sources, including, among others, employee misconduct, litigation, failure to deliver minimum standards of service and quality, compliance failures, breach of legal or regulatory requirements, unethical behaviour (including adopting inappropriate sales and trading practices), and the activities of customers and counterparties. Further, negative publicity regarding us, whether or not true, may result in harm to our operating results, financial condition and prospects.
Actions by the financial services industry generally or by certain members of, or individuals in, the industry can also affect our reputation. For example, the role played by financial services firms in the financial crisis and the seeming shift toward increasing regulatory supervision and enforcement has caused public perception of us and others in the financial services industry to decline.
We could suffer significant reputational harm if we fail to properly identify and manage potential conflicts of interest. Management of potential conflicts of interest has become increasingly complex as we expand our business activities through more numerous transactions, obligations and interests with and among our customers. The failure to adequately address, or the perceived failure to adequately address, conflicts of interest could affect the willingness of customers to deal with us, or give rise to litigation or enforcement actions against us. Therefore, there can be no assurance that conflicts of interest will not arise in the future that could cause material harm to us.
Changes in accounting standards could impact reported earnings.
The accounting standard setters and other regulatory bodies periodically change the financial accounting and reporting standards that govern the preparation of our consolidated financial statements. These changes can materially impact how we record and report our financial condition and results of operations. In some cases, we could be required to apply a new or revised standard retroactively, resulting in the restatement of prior period financial statements.
Our financial statements are based in part on assumptions and estimates which, if inaccurate, could cause material misstatement of the results of our operations and financial condition.
The preparation of financial statements requires management to make judgements, estimates and assumptions that affect the reported amounts of assets, liabilities, income and expenses. Due to the inherent uncertainty in making estimates, actual results reported in future periods may be based upon amounts which differ from those estimates. Estimates, judgements and assumptions are continually evaluated and are based on historical experience and other factors, including expectations of future events that are believed to be reasonable under the circumstances. Revisions to accounting estimates are recognised in the period in which the estimate is revised and in any future periods affected. The accounting policies deemed critical to our results and financial condition, based upon materiality and significant judgements and estimates, include impairment of loans and advances, valuation of financial instruments, goodwill impairment, provision for conduct remediation and pensions.
The valuation of financial instruments measured at fair value can be subjective, in particular where models are used which include unobservable inputs. Given the uncertainty and subjectivity associated with valuing such instruments it is possible that the results of our operations and financial condition could be materially misstated if the estimates and assumptions used prove to be inaccurate.
If the judgement, estimates and assumptions we use in preparing our consolidated financial statements are subsequently found to be incorrect, there could be a material effect on our results of operations and a corresponding effect on our funding requirements and capital ratios.
Disclosure controls and procedures over financial reporting may not prevent or detect all errors or acts of fraud.
Disclosure controls and procedures over financial reporting are designed to reasonably assure that information required to be disclosed by us in reports filed or submitted under the US Securities Exchange Act of 1934, as amended (the “Exchange Act”) is accumulated and communicated to management, and recorded, processed, summarised and reported within the time periods specified in the SEC’s rules and forms.
There are inherent limitations to the effectiveness of any system of disclosure controls and procedures, including the possibility of human error and the circumvention or overriding of the controls and procedures. Accordingly, even effective disclosure controls and procedures can only provide reasonable assurance of achieving their control objectives.
Consequently, our businesses are exposed to risk from potential non-compliance with policies, employee misconduct or negligence and fraud, which could result in regulatory sanctions and serious reputational or financial harm. In recent years, a number of multinational financial institutions have suffered material losses due to the actions of ‘rogue traders’ or other employees. It is not always possible to deter employee misconduct and the precautions we take to prevent and detect this activity may not always be effective. As a result of the inherent limitations in the control system, misstatements due to error or fraud may occur and not be detected.
| | |
| Santander UK plc Annual Report 2013 | | 333 |
Shareholder Information
Risk Factorscontinued
We rely on third parties for important infrastructure support, products and services.
Third party vendors provide key components of our business infrastructure such as loan and deposit servicing systems, internet connections and network access. Any problems caused by these third parties, including as a result of their not providing us their services for any reason or their performing their services poorly, could adversely affect our ability to deliver products and services to customers and otherwise to conduct business. Replacing these third party vendors could also entail significant delays and expense.
We engage in transactions with our subsidiaries or affiliates that others may not consider to be on an arm’s-length basis.
We and our subsidiaries and affiliates have entered into a number of services agreements pursuant to which we render services, such as administrative, accounting, finance, treasury, legal services and others. We rely upon certain outsourced services (including information technology support, maintenance and consultancy services in connection with Partenon) provided by certain other members of the Banco Santander, S.A. group.
English law applicable to public companies and financial groups and institutions, as well as our articles of association, provide for several procedures designed to ensure that the transactions entered into with or among our financial subsidiaries do not deviate from prevailing market conditions for those types of transactions, including the requirement that our board of directors approve such transactions. We are likely to continue to engage in transactions with our subsidiaries or affiliates (including our controlling shareholder). Future conflicts of interests between us and any of our subsidiaries or affiliates, or among our subsidiaries and affiliates, may arise, which conflicts are not required to be and may not be resolved in our favour.
Different disclosure and accounting principles between the UK and the US may provide you with different or less information about us than you expect.
There may be less publicly available information about us than is regularly published about companies in the United States. Issuers of securities in the UK are required to make public disclosures that are different from, and that may be reported under presentations that are not consistent with, disclosures required in countries with a relatively more developed capital market, including the United States. While we are subject to the periodic reporting requirements of the Exchange Act, we are not subject to the same disclosure requirements in the United States as a domestic US registrant under the Exchange Act, including the requirements to prepare and issue quarterly reports, or the proxy rules applicable to domestic US registrants under Section 14 of the Exchange Act or the insider reporting and short-swing profit rules under Section 16 of the Exchange Act. Accordingly, the information about us available to you will not be the same as the information available to holders of securities of a US company and may be reported in a manner that you are not familiar with.
Risks concerning enforcement of judgements made in the United States.
The Company is a public limited company registered in England and Wales. With the exception of one director, all of the Company’s directors live outside the United States of America. As a result, it may not be possible to serve process on such persons in the United States of America or to enforce judgements obtained in US courts against them or us based on the civil liability provisions of the US federal securities laws or other laws of the United States of America or any state thereof. The Directors’ Report on pages 188 to 196 and the Strategic Report on pages 2 to 24 of our 2013 Annual Report (together the “Reports”) have been prepared and presented in accordance with and in reliance upon English company law and the liabilities of the Directors in connection with those Reports shall be subject to the limitations and restrictions provided by such law. Under the UK Companies Act 2006, a safe harbour limits the liability of Directors in respect of statements in and omissions from the Directors’ Report on pages 188 to 196 and the Strategic Report on pages 2 to 24 of our 2013 Annual Report. Under this safe harbour, the Directors would only be liable to the Company (and not to any third party) if either or both Reports contain errors as a result of recklessness or knowing misstatement or dishonest concealment of a material fact.
| | |
| 334 | | Santander UK plc Annual Report 2013 |
Shareholder Information
Contact and Other Information
Santander UK plc principal executive office and registered office, principal office and investor relations department
| | |
2 Triton Square Regent’s Place London NW1 3AN | | Phone number: 0870-607-6000 |
Designated agent
The designated agent for service of process on Santander UK in the United States is Abbey National Treasury Services plc (Connecticut branch), 400 Atlantic Street, Stamford, CT 06901.
Santander Shareholder Relations
| | | | |
2 Triton Square Regent’s Place London NW1 3AN | | Phone numbers: 0871-384-2000 +44 (0) 121-415-7188 (outside the UK) | | Email: shareholders@santander.com |
Other information
Documents on display
The Company is subject to the information requirements of the US Securities Exchange Act of 1934. In accordance with these requirements, the Company files its Annual Report and Accounts and other related documents with the US Securities and Exchange Commission. These documents may be inspected by US investors at the US Securities and Exchange Commission’s public reference rooms, which are located at 100 F Street NE, Room 1580, Washington, DC 20549-0102. Information on the operation of the public reference rooms can be obtained by calling the US Securities and Exchange Commission on +1-202-551-8090 or by looking at the US Securities and Exchange Commission’s website at www.sec.gov.
Legal proceedings
Santander UK is party to various legal proceedings in the ordinary course of business, the ultimate resolution of which is not expected to have a material adverse effect on the financial position or the results of operations of Santander UK. See Notes 36 and 38 to the Consolidated Financial Statements.
Material contracts
Santander UK is party to various contracts in the ordinary course of business. For the three years ended 31 December 2013 there have been no material contracts entered into outside the ordinary course of business.
Audit fees
See Note 8 to the Consolidated Financial Statements.
Profit on sale of subsidiaries
No profits arose on sales of Santander UK group undertakings in the three years ended 31 December 2013.
Significant acquisitions and disposals
The results were not materially affected by acquisitions and disposals during the three years ended 31 December 2013.
Current and future accounting developments under IFRS
See Note 1 to the Consolidated Financial Statements.
| | |
| Santander UK plc Annual Report 2013 | | 335 |
Glossary of Financial Services Industry Terms
| | |
Term used in the Annual Report | | Definition |
| Alternative A-paper (‘Alt-A’) | | A US description for loans regarded as better risk than sub-prime, but with higher risk characteristics than lending under normal criteria. |
| |
| Arrears | | Customers are said to be in arrears when they are behind in fulfilling their obligations with the result that an outstanding loan is unpaid or overdue. Such a customer is also said to be in a state of delinquency. When a customer is in arrears, his entire outstanding balance is said to be delinquent, meaning that delinquent balances are the total outstanding loans on which payments are overdue. |
| |
| Asset Backed Securities (‘ABS’) | | Securities that represent an interest in an underlying pool of referenced assets. The referenced pool can comprise any assets which attract a set of associated cash flows but are commonly pools of residential or commercial mortgages but could also include leases, credit card receivables, motor vehicles or student loans. |
| |
| Bank Levy (‘UK Bank Levy’) | | The levy that applies to certain UK banks, UK building societies and the UK operations of foreign banks from 1 January 2011. The levy is payable based on a percentage of the chargeable equity and liabilities of the bank at the balance sheet date. |
| |
| Banking net interest margin | | Net interest income (adjusted to remove net interest income from the Treasury asset portfolio) divided by average commercial assets (mortgages, unsecured personal loans, credit cards, corporate loans and overdrafts). |
| |
| Basel II | | The capital adequacy framework issued by the Basel Committee on Banking Supervision in June 2006 in the form of the ‘International Convergence of Capital Measurement and Capital Standards’. |
| |
| Basel III | | In December 2010, the Basel Committee on Banking Supervision issued the Basel III rules text, which presents the details of strengthened global regulatory standards on bank capital adequacy and liquidity. The standards are expected to be implemented beginning in January 2014. |
| |
| Basis point | | One hundredth of a per cent (i.e. 0.01%), so 100 basis points is 1%. Used in quoting movements in interest rates or yields on securities. |
| |
| BIPRU | | The prudential sourcebook for banks, building societies and investment firms which sets out the UK Financial Services Authority’s capital requirements. |
| |
| Business Banking | | ‘Business Banking’ is enterprises with a turnover of up to £250,000 per annum. |
| |
| Collateralised Loan Obligation (‘CLO’) | | A security backed by the repayments from a pool of commercial loans. The payments may be made to different classes of owners (in tranches). |
| |
| Collectively assessed loan impairment provisions | | Impairment losses assessment on a collective basis for loans that are part of homogeneous pools of similar loans and that are not individually significant, using appropriate statistical techniques. See “Impairment of financial assets” in Note 1 “Accounting Policies” to the Consolidated Financial Statements. |
| |
| Commercial Mortgage-Backed Securities (‘CMBS’) | | Securities that represent interests in a pool of commercial mortgages. Investors in these securities have the right to cash received from future mortgage payments (interest and/or principal). |
| |
| Commercial Paper | | An unsecured promissory note issued to finance short-term credit needs. It specifies the face amount paid to investors on the maturity date. Commercial paper can be issued as an unsecured obligation of the Santander UK group and is usually issued for periods ranging from one week up to nine months. However, the depth and reliability of some CP markets means that issuers can repeatedly roll over CP issuance and effectively achieve longer term funding. CP can be issued in a range of denominations and can be either discounted or interest-bearing. |
| |
| Commercial Real Estate | | Includes office buildings, industrial property, medical centres, hotels, malls, retail stores, shopping centres, farm land, multifamily housing buildings, warehouses, garages and industrial properties. |
| |
| Common Equity Tier 1 Capital | | Called-up share capital and eligible reserves less deductions specified in the CRD IV legislative package, including transitional provisions. |
| |
| Common Equity Tier 1 (‘CET 1’) capital ratio | | Common Equity Tier 1 capital as a percentage of risk weighted assets. |
| |
| Contractual maturity | | The final payment date of a loan or other financial instrument, at which point all the remaining outstanding principal will be repaid and interest is due to be paid. |
| |
| Core Tier 1 capital | | Called up share capital and eligible reserves plus equity non-controlling interests, less intangible assets and deductions relating to the excess of expected loss over regulatory impairment loss allowance and securitisation positions as specified by the UK Prudential Regulation Authority. |
| |
| Core Tier 1 capital ratio | | Core Tier 1 capital as a percentage of risk weighted assets. |
| |
| Cost:income ratio | | Operating expenses as a percentage of total income. |
| |
| Coverage ratio | | Impairment loss allowances as a percentage of total non-performing loans and advances. See non-performing loans and advances tables in the Risk Management Report for industry specific definitions of individual products. |
| |
| Covered bonds | | Debt securities backed by a portfolio of mortgages that is segregated from the issuer’s other assets solely for the benefit of the holders of the covered bonds. The Santander UK group issues covered bonds as part of its funding activities. |
| | |
| 336 | | Santander UK plc Annual Report 2013 |
Glossary of Financial Services Industry Terms
| | |
Term used in the Annual Report | | Definition |
| Credit Default Swap (‘CDS’) | | A credit derivative contract where the protection seller receives premium or interest-related payments in return for contracting to make payments to the protection buyer in the event of a defined credit event. Credit events normally include bankruptcy, payment default on a reference asset or assets, or downgrades by a rating agency. |
| |
| Credit derivative | | A contractual agreement whereby the credit risk of an asset (the reference asset) is transferred from the buyer to the seller of protection. The buyer of the credit derivative pays a periodic fee in return for a payment by the protection seller upon the occurrence, if any, of a credit event defined at the inception of the transaction. Credit events normally include bankruptcy, payment default on a reference asset or assets, or downgrades by a rating agency. Credit derivatives include credit default swaps, total return swaps and credit swap options. |
| |
| Credit risk | | The risk of financial loss arising from the default of a customer or counterparty to which the Santander UK group has directly provided credit, or for which the Santander UK group has assumed a financial obligation, after realising collateral held. Credit risk includes residual credit risk and concentration risk. |
| |
| Credit risk mitigation | | A technique to reduce the credit risk associated with an exposure by application of credit risk mitigants such as collateral, guarantee and credit protection. |
| |
| Credit risk spread | | The yield spread between securities with the same coupon rate and maturity structure but with different associated credit risks, with the yield spread rising as the credit rating worsens. It is the premium over the benchmark or risk-free rate required by the market to accept a lower credit quality. |
| |
| Credit Valuation Adjustment (‘CVA’) | | Adjustments to the fair values of derivative assets to reflect the creditworthiness of the counterparty. |
| |
| Currency swap | | An arrangement in which two parties exchange specific principal amounts of different currencies at inception and subsequently interest payments on the principal amounts. Often, one party will pay a fixed interest rate, while the other will pay a floating exchange rate (though there are also fixed-fixed and floating-floating arrangements). At the maturity of the swap, the principal amounts are usually re-exchanged. |
| |
| Customer accounts/customer deposits | | Money deposited by all individuals and companies that are not credit institutions. Such funds are recorded as liabilities in the Santander UK group’s balance sheet under Deposits by Customers, Trading Liabilities or Financial Liabilities designated at Fair Value. |
| |
| Debt restructuring | | This occurs when the terms and provisions of outstanding debt agreements are changed. This is often done in order to improve cash flow and the ability of the borrower to repay the debt. It can involve altering the repayment schedule as well as reducing the debt or interest charged on the loan. |
| |
| Debt securities | | Transferable instruments creating or acknowledging indebtedness. They include debentures, bonds, certificates of deposit, notes and commercial paper. The holder of a debt security is typically entitled to the payment of principal and interest, together with other contractual rights under the terms of the issue, such as the right to receive certain information. Debt securities are generally issued for a fixed term and redeemable by the issuer at the end of that term. Debt securities can be secured or unsecured. |
| |
| Debt securities in issue | | Transferable certificates of indebtedness of the Santander UK group to the bearer of the certificates. These are liabilities of the Santander UK group and include commercial paper, certificates of deposit, bonds and medium-term notes. |
| |
| Defined benefit obligation | | The present value of expected future payments required to settle the obligations of a defined benefit plan resulting from employee service. |
| |
| Defined benefit plan | | A pension plan that defines an amount of pension benefit to be provided, usually as a function of one or more factors such as age, years of service or compensation. The employer’s obligation can be more or less than its contributions to the fund. |
| |
| Defined contribution plan | | A pension plan under which the Santander UK group pays fixed contributions as they fall due into a separate entity (a fund) and will have no legal or constructive obligations to pay further contributions, i.e. the employer’s obligation is limited to its contributions to the fund. |
| |
| Delinquency | | See ‘Arrears’. |
| |
| Deposits by banks | | Money deposited by banks and other credit institutions. They include money-market deposits, securities sold under repurchase agreements, and other short-term deposits. Such funds are recorded as liabilities in the Santander UK group’s balance sheet under Deposits by Banks Trading Liabilities or Financial Liabilities designated at Fair Value. |
| |
| Derivative | | A contract or agreement whose value changes with changes in an underlying index such as interest rates, foreign exchange rates, share prices or indices and which requires no initial investment or an initial investment that is smaller than would be required for other types of contracts with a similar response to market factors. The principal types of derivatives are: swaps, forwards, futures and options. |
| |
| Discount Window Facility (‘DWF’) | | The Discount Window Facility (‘DWF’) is a bilateral facility introduced by the Bank of England designed to address short-term liquidity requirements without distorting banks’ incentives for prudent liquidity management. Eligible banks and building societies may borrow gilts, for 30 or 364 days, against a wide range of collateral in return for a fee, which varies with the collateral used and the total size and maturity of borrowings. |
| | |
| Santander UK plc Annual Report 2013 | | 337 |
Glossary of Financial Services Industry Terms
| | |
Term used in the Annual Report | | Definition |
| Economic capital | | An internal measure of the minimum equity and preference capital required for the Santander UK group to maintain its credit rating based upon its risk profile. |
| |
| Effective Interest rate method | | A method of calculating the amortised cost or carrying value of a financial asset or financial liability (or group of financial assets or liabilities) and of allocating the interest income or interest expense over the expected life of the asset or liability. |
| |
| Expected loss | | The Santander UK group measure of anticipated loss for exposures captured under an internal ratings-based credit risk approach for capital adequacy calculations. It is measured as the Santander UK group-modelled view of anticipated loss based on Probability of Default, Loss Given Default and Exposure at Default, with a one-year time horizon. |
| |
| Exposure | | The maximum loss that a financial institution might suffer if a borrower, counterparty or group fails to meet their obligations or assets and off-balance sheet positions have to be realised. |
| |
| Exposure at default (‘EAD’) | | The estimation of the extent to which the Santander UK group may be exposed to a customer or counterparty in the event of, and at the time of, that counterparty’s default. At default, the customer may not have drawn the loan fully or may already have repaid some of the principal, so that exposure is typically less than the approved loan limit. |
| |
| Fair value adjustment | | An adjustment to the fair value of a financial instrument which is determined using a valuation technique (level 2 and level 3) to include additional factors that would be considered by a market participant that are not incorporated within the valuation model. |
| |
| Financial Conduct Authority (‘FCA’) | | A UK quasi-governmental agency formed as one of the successors to the Financial Services Authority (’FSA’). The FCA regulates financial firms providing services to UK consumers and maintains the integrity of the UK’s financial markets. It focuses on the regulation of conduct by both retail and wholesale financial services firms. |
| |
| Financial Services Compensation Scheme (‘FSCS’) | | The UK’s statutory fund of last resort for customers of authorised financial services firms, established under the Financial Services and Markets Act (‘FSMA’) 2000. The FSCS can pay compensation to customers if a UK FSA authorised firm is unable, or likely to be unable, to pay claims against it (for instance, an authorised bank is unable to pay claims by depositors). The FSCS is funded by levies on firms authorised by the UK FSA, including Santander UK plc and other members of the Santander UK group. |
| |
| First/Second Charge | | First charge (also known as first lien): debt that places its holder first in line to collect compensation from the sale of the underlying collateral in the event of a default on the loan. Second charge (also known as second lien): debt that is issued against the same collateral as a higher charge debt but that is subordinate to it. In the case of default, compensation for this debt will only be received after the first charge has been repaid and thus represents a riskier investment than the first charge. |
| |
| Forbearance | | Forbearance takes place when a concession is made on the contractual terms of a loan in response to an obligor’s financial difficulties. |
| |
| Foundation Internal Ratings-based (‘IRB’) approach | | A method for calculating credit risk capital requirements using the Santander UK group’s internal Probability of Default models but with supervisory estimates of Loss Given Default and conversion factors for the calculation of Exposure at Default. |
| |
| Full time equivalent | | Full time equivalent employee units are the on-job hours paid for employee services divided by the number of ordinary-time hours normally paid for a full-time staff member when on the job (or contract employee where applicable). |
| |
| Funded/unfunded | | Exposures where the notional amount of the transaction is either funded or unfunded. Represents exposures where a commitment to provide future funding has been made and the funds have been released/not released. |
| |
| Funding for Lending Scheme (‘FLS’) | | A scheme designed by the Bank of England and HM Treasury to incentivise banks and building societies to boost their lending to UK households and non-financial companies. It aims to do this by providing funding to banks and building societies for an extended period, with both the price and quantity of funding provided linked to their performance in lending to the UK non-financial sector. |
| |
| Home loan (Residential mortgage) | | A loan to purchase a residential property which is then used as collateral to guarantee repayment of the loan. The borrower gives the lender a lien against the property and the lender can foreclose on the property if the borrower does not repay the loan per the agreed terms. Also known as a residential mortgage. |
| |
| Impaired loans | | Loans where an individual identified impairment loss allowance has been raised and also include loans which are fully collateralised or where indebtedness has already been written down to the expected realisable value. The impaired loan category may include loans, which, while impaired, are still performing. |
| |
| Impairment allowance (Loan impairment provisions) | | A loss allowance held on the balance sheet as a result of the raising of a charge against profit for the incurred loss inherent in the lending book. An impairment loss allowance may either be identified or unidentified and individual or collective. |
| |
| Impairment losses | | The raising of a charge against profit for the incurred loss inherent in the lending book following an impairment review. For financial assets carried at amortised cost, impairment losses are recognised in the income statement and the carrying amount of the financial asset or group of financial assets is reduced by establishing an allowance for impairment losses. For available-for-sale financial assets, the cumulative loss including impairment losses is removed from equity and recognised in the income statement. |
| |
| Individually assessed loan impairment provisions | | Impairment is measured individually for assets that are individually significant. For these assets, the Santander UK group measures the amount of the impairment loss as the difference between the carrying amount of the asset or group of assets and the present value of the estimated future cash flows from the asset or group of assets discounted at the original effective interest rate of the asset. |
| | |
| 338 | | Santander UK plc Annual Report 2013 |
Glossary of Financial Services Industry Terms
| | |
Term used in the Annual Report | | Definition |
| Internal Capital Adequacy Assessment Process (‘ICAAP’) | | The Santander UK groups own assessment of its regulatory capital requirements, as part of Basel II. It takes into account the regulatory and commercial environment in which the Santander UK group operates, the Santander UK group’s risk appetite, the management strategy for each of the Santander UK group’s material risks and the impact of appropriate adverse scenarios and stresses on the Santander UK group’s capital requirements. |
| |
| Internal ratings-based approach (‘IRB’) | | The Santander UK group’s method, under Basel II framework, of calculating credit risk capital requirements using internal, rather than supervisory, estimates of risk parameters. It is a more sophisticated technique in credit risk management and can be Foundation IRB or Advanced IRB. |
| |
| Investment grade | | A debt security, treasury bill or similar instrument with a credit rating measured by external agencies of AAA to BBB. |
| |
| ISDA (International Swaps and Derivatives Association) Master agreement | | Standardised contract developed by ISDA used as an umbrella under which bilateral derivatives contracts are entered into. |
| |
| Level 1 - quoted market prices | | The fair value of these financial instruments is based on unadjusted quoted prices for identical assets or liabilities in an active market that the Santander UK group has the ability to access at the measurement date. |
| |
| Level 2 - valuation techniques using observable inputs | | The fair value of these financial instruments is based on quoted prices in markets that are not active or quoted prices for similar assets or liabilities, recent market transactions, inputs other than quoted market prices for the asset or liability that are observable either directly or indirectly for substantially the full term, and inputs to valuation techniques that are derived principally from or corroborated by observable market data through correlation or other statistical means for substantially the full term of the asset or liability. |
| |
| Level 3 - valuation techniques with significant unobservable inputs | | The fair value of these financial instruments is based on inputs to the pricing or valuation techniques that are significant to the overall fair value measurement of the asset or liability are unobservable. |
| |
| Liquidity and Credit enhancements | | Credit enhancement facilities are used to enhance the creditworthiness of financial obligations and cover losses due to asset default. Two general types of credit enhancement are third-party loan guarantees and self-enhancement through over collateralisation. Liquidity enhancement makes funds available if required, for other reasons than asset default, e.g. to ensure timely repayment of maturing commercial paper. |
| |
| Liquidity Coverage Ratio ’LCR’) | | The ratio of the stock of high quality liquid assets to expected net cash outflows over the next 30 days. High quality liquid assets should be unencumbered, liquid in markets during a time of stress and ideally be central bank eligible. The Basel III rules require this ratio to be at least 100%. It is expected to apply from 2015. |
| |
| Loan loss rate | | Defined as total credit impairment charge (excluding available for sale assets and reverse repurchase agreements) divided by gross loans and advances to customers and banks (at amortised cost). |
| |
| Loan to deposit ratio | | Loan-to-deposit ratio’ is calculated as loans and advances to customers (excluding reverse repos) divided by deposits by customers (excluding repos). |
| |
| Loan to value ratio (‘LTV’) | | The amount of a first mortgage charge as a percentage of the total appraised value of real property. The LTV ratio is used in determining the appropriate level of risk for the loan and therefore the price of the loan to the borrower. LTV ratios may be expressed in a number of ways, including origination LTV and indexed LTV. |
| |
| Loss Given Default (‘LGD’) | | The fraction of Exposure at Default (defined above) that will not be recovered following default. LGD comprises the actual loss (the part that is not recovered), together with the economic costs associated with the recovery process. |
| |
| Master netting agreement | | An industry standard agreement which facilitates netting of transactions (such as financial assets and liabilities including derivatives) in jurisdictions where netting agreements are recognised and have legal force. The netting arrangements do not generally result in an offset of balance sheet assets and liabilities for accounting purposes, as transactions are usually settled on a gross basis. |
| |
| Medium-Term Notes (‘MTNs’) | | Corporate notes (or debt securities) continuously offered by a company to investors through a dealer. Investors can choose from differing maturities, ranging from nine months to 30 years. They can be issued on a fixed or floating coupon basis or with an exotic coupon; with a fixed maturity date (non-callable) or with embedded call or put options or early repayment triggers. MTNs are most generally issued as senior, unsecured debt. |
| |
| Monoline insurers | | An entity which specialises in providing credit protection to the holders of debt instruments in the event of default by a debt security counterparty. This protection is typically held in the form of derivatives such as credit default swaps referencing the underlying exposures held. |
| |
| Mortgage-Backed Securities (‘MBS’) | | Securities that represent interests in groups of mortgages, which may be on residential or commercial properties. Investors in these securities have the right to cash received from future mortgage payments (interest and/or principal). When the MBS references mortgages with different risk profiles, the MBS is classified according to the highest risk class. |
| |
| Mortgage vintage | | The year the mortgage was issued. |
| |
| Net interest income | | The difference between interest received on assets and interest paid on liabilities. |
| |
| Net interest margin | | Net interest income as a percentage of average interest-earning assets. |
| |
| Net Stable Funding Ratio (‘NSFR’) | | The ratio of available stable funding resources to stable funding requirements over a one year time horizon, assuming a stressed scenario. The Basel III rules require this ratio to be over 100%. |
| |
| Non-performing loans (‘NPLs’) | | Loans and advances are classified as non-performing typically when the counterparty fails to make payments when contractually due for three months or longer, although there can be additional qualifying criteria depending upon the business segment and product. For additional information on the definition of mortgage NPLs, see “Credit Performance” on page 98 and for banking and consumer credit lending NPLs, see “Banking and Consumer Credit” on page 104. For additional information on the definition of Commercial Banking NPLs, see “Credit Performance” on page 108, and for additional information of the definition of Corporate Centre NPLs, see “Credit Performance” on page 119. |
| | |
| Santander UK plc Annual Report 2013 | | 339 |
Glossary of Financial Services Industry Terms
| | |
Term used in the Annual Report | | Definition |
| Over the counter (‘OTC’) derivatives | | Contracts that are traded (and privately negotiated) directly between two parties, without going through an exchange or other intermediary. They offer flexibility because, unlike standardised exchange-traded products, they can be tailored to fit specific needs. |
| |
| Own credit | | The effect of the Santander UK group’s own credit standing on the fair value of financial liabilities. |
| |
| Past due | | A financial asset such as a loan is past due when the counterparty has failed to make a payment when contractually due. In the Santander UK group’s retail loans book, a loan or advance is considered past due when any contractual payments have been missed. In the Santander UK group’s corporate loans book, a loan or advance is considered past due when 90 days past due, and also when the Santander UK group has reason to believe that full repayment of the loan is in doubt. |
| |
| Pillar 2 | | The part of the Basel II Accord which sets out the process by which a bank should review its overall capital adequacy and the processes under which the supervisors evaluate how well financial institutions are assessing their risks and take appropriate actions in response to the assessments. |
| |
| Pillar 3 | | The part of the Basel II Accord which sets out the disclosure requirements for firms to publish details of their risks, capital and risk management. The aims are greater transparency and strengthening market discipline. |
| |
| Potential problem loans | | Loans other than non-accrual loans, accruing loans which are contractually overdue 90 days or more as to principal or interest and troubled debt restructurings where known information about possible credit problems of the borrower causes management to have serious doubts about the borrower’s ability to meet the loan’s repayment terms. |
| |
| Prime/ prime mortgage loans | | A US description for mortgages granted to the most creditworthy category of borrowers. |
| |
| Private equity investments | | Equity holdings in operating companies not quoted on a public exchange. |
| |
| Probability of default (‘PD’) | | The likelihood that a loan will not be repaid and will fall into default. PD may be calculated for each client who has a loan (normally applicable to wholesale customers/clients) or for a portfolio of clients with similar attributes (normally applicable to retail customers). To calculate PD, the Santander UK group assesses the credit quality of borrowers and other counterparties and assigns them an internal risk rating. Multiple rating methodologies may be used to inform the rating decision on individual large credits, such as internal and external models, rating agency ratings, and for wholesale assets market information such as credit spreads. For smaller credits, a single source may suffice such as the result from an internal rating model. |
| |
| Prudential Regulation Authority (’PRA’) | | The UK financial services regulator formed as one of the successors to the FSA. The PRA is a part of the Bank of England and responsible for the prudential regulation and supervision of banks, building societies, credit unions, insurers and major investment firms. It sets standards and supervises financial institutions at the level of the individual firm. |
| |
| Regulatory capital | | The amount of capital that the Santander UK group holds, determined in accordance with rules established by the UK Prudential Regulation Authority for the consolidated Santander UK group and by local regulators for individual Santander UK group companies. |
| |
| Repurchase agreement (‘Repo’) | | In a sale and repurchase agreement one party, the seller, sells a financial asset to another party, the buyer, under commitments to reacquire the asset at a later date. The buyer at the same time agrees to resell the asset at the same later date. From the seller’s perspective such agreements are securities sold under repurchase agreements (‘repos’) and from the buyer’s securities purchased under commitments to resell (‘reverse repos’). |
| |
| Residential Mortgage-Backed Securities (‘RMBS’) | | Securities that represent interests in a group of residential mortgages. Investors in these securities have the right to cash received from future mortgage payments (interest and/or principal). |
| |
| Retail IRB approach | | The Santander UK group’s internal method of calculating credit risk capital requirements for its key retail portfolios. The UK Financial Services Authority approved the Santander UK group’s application of the Retail IRB approach to the Santander UK group’s credit portfolios with effect from 1 January 2008. |
| |
| Retail loans | | Loans to individuals rather than institutions, including residential mortgage lending and banking and consumer credit. |
| |
| Return on average tangible equity | | The profit attributable to ordinary shareholders divided by average shareholders’ equity, less preference shares and intangible assets (including goodwill). |
| |
| Risk appetite | | The level of risk (types and quantum) that the Santander UK group is willing to accept (or not accept) to safeguard the interests of shareholders whilst achieving business objectives. |
| |
| Risk weighted assets | | A measure of a bank’s assets adjusted for their associated risks. Risk weightings are established in accordance with the Basel Capital Accord as implemented by the UK Prudential Regulation Authority. |
| |
| Securitisation | | Securitisation is a process by which a group of assets, usually loans, are aggregated into a pool, which is used to back the issuance of new securities. Securitisation is the process by which ABS (asset backed securities) are created. A company sells assets to a structured entity which then issues securities backed by the assets, based on their value. This allows the credit quality of the assets to be separated from the credit rating of the original company and transfers risk to external investors. Assets used in securitisations include mortgages to create mortgage-backed securities or residential mortgage-backed securities (‘RMBS’) as well as commercial mortgage-backed securities. The Santander UK group has established several securitisation structures as part of its funding and capital management activities. |
| |
| Small and medium enterprises (‘SMEs’) | | ‘SME’ is small and medium enterprises with a turnover of between £250,000 and £50m per annum. |
| |
| Standardised approach | | In relation to credit risk, a method for calculating credit risk capital requirements under Basel II, using External Credit Assessment Institutions ratings and supervisory risk weights. The Standardised approach is less risk-sensitive than IRB (see ‘IRB’ above). In relation to operational risk, a method of calculating the operational capital requirement under Basel II, by the application of a supervisory defined percentage charge to the gross income of eight specified business lines. |
| |
| Stress testing | | Stress testing is a management tool that facilitates a forward looking perspective on risk management, strategic planning, capital and liquidity & funding planning. |
| | |
| 340 | | Santander UK plc Annual Report 2013 |
Glossary of Financial Services Industry Terms
| | |
Term used in the Annual Report | | Definition |
| Structured entity | | Structured entity is an entity that has been designed so that voting or similar rights are not the dominant factor in deciding who controls the entity, such as when any voting rights relate to administrative tasks only and the relevant activities are directed by means of contractual arrangements. |
| |
| Structured finance/notes | | A structured note is an instrument which pays a return linked to the value or level of a specified asset or index and sometimes offers capital protection if the value declines. Structured notes can be linked to a range of underlying assets, including equities, interest rates, funds, commodities and foreign currency. |
| |
| Subordinated liabilities | | Liabilities which, in the event of insolvency or liquidation of the issuer, are subordinated to the claims of depositors and other creditors of the issuer. |
| |
| Subordination | | The state of prioritising repayments of principal and interest on debt to a creditor lower than repayments to other creditors by the same debtor. That is, claims of a security are settled by a debtor to a creditor only after the claims of securities held by other creditors of the same debtor have been settled. |
| |
| Sub-prime | | Loans to borrowers typically having weakened credit histories that include payment delinquencies and potentially more severe problems such as court judgements and bankruptcies. They may also display reduced repayment capacity as measured by credit scores, high debt-to-income ratios, or other criteria indicating heightened risk of default. |
| |
| Tier 1 capital | | A measure of a bank’s financial strength defined by the UK FSA. It captures Core Tier 1 capital plus other Tier 1 securities in issue, but is subject to a deduction in respect of material holdings in financial companies. |
| |
| Tier 1 capital ratio | | The ratio expresses Tier 1 capital as a percentage of risk weighted assets. |
| |
| Tier 2 capital | | Defined by the UK Prudential Regulation Authority. Broadly, it includes qualifying subordinated debt and other Tier 2 securities in issue, eligible collective impairment allowances, unrealised available for sale equity gains and revaluation reserves. It is subject to deductions relating to the excess of expected loss over regulatory impairment allowance, securitisation positions and material holdings in financial companies. |
| |
| Total operating income | | Total operating income comprises net interest and similar income, net fee and commission income and net trading and other income, as described in Notes 3, 4 and 5, respectively, of the Consolidated Financial Statements. |
| |
| Traded market risk | | See ‘Market risk’ |
| |
| Trading book | | The trading book consists of all positions in financial instruments and commodities held either with trading intent or in order to hedge other elements of the trading book, which must be free of restrictive covenants on their tradability or ability to be hedged. |
| |
| Troubled debt restructurings | | A US description for restructuring a debt whereby the creditor for economic or legal reasons related to a debtor’s financial difficulties grants a concession to the debtor that it would not otherwise consider. |
| |
| Value at Risk (‘VaR’) | | An estimate of the potential loss which might arise from market movements under normal market conditions, if the current positions were to be held unchanged for one business day, measured to a confidence level. |
| |
| Write-down | | After an advance has been identified as impaired and is subject to an impairment allowance, the stage may be reached whereby it is concluded that there is no realistic prospect of further recovery. Write-downs will occur when, and to the extent that, the whole or part of a debt is considered irrecoverable. |
| |
| Wrong-way risk | | An aggravated form of concentration risk and arises when there is an adverse correlation between the counterparty’s probability of default and the mark-to-market value of the underlying transaction. |
| | |
| Santander UK plc Annual Report 2013 | | 341 |
Forward- looking Statements
Santander UK plc (the ‘Company’) and its subsidiaries (together ‘Santander UK’ or the ‘Santander UK group’) may from time to time make written or oral forward-looking statements. The Company makes written forward-looking statements in this Annual Report and may also make forward-looking statements in its periodic reports to the SEC on Forms 20-F and 6-K, in its offering circulars and prospectuses, in press releases and other written materials and in oral statements made by its officers, directors or employees to third parties. Examples of such forward-looking statements include, but are not limited to:
| • | | projections or expectations of revenues, costs, profit (or loss), earnings (or loss) per share, dividends, capital structure or other financial items or ratios; |
| • | | statements of plans, objectives or goals of Santander UK or its management, including those related to products or services; |
| • | | statements of future economic performance; and |
| • | | statements of assumptions underlying such statements. |
Words such as ‘believes’, ‘anticipates’, ‘expects’, ‘intends’, ‘aims’, ‘plans’, ‘targets’ and similar expressions are intended to identify forward-looking statements, but are not the exclusive means of identifying such statements.
By their very nature, forward-looking statements are not statements of historical or current facts; they cannot be objectively verified, are speculative and involve inherent risks and uncertainties, both general and specific, and risks exist that the predictions, forecasts, projections and other forward-looking statements will not be achieved. Santander UK cautions readers that a number of important factors could cause actual results to differ materially from the plans, objectives, expectations, estimates and intentions expressed in such forward-looking statements made by Santander UK or on Santander UK’s behalf. Some of these factors, which could affect the Santander UK group’s business, financial condition and/or results of operations, are considered in detail in the Risk Management Report on pages 61 to 163 and the Risk Factors section on pages 317 to 334 and they include:
| • | | the disruptions and volatility in the global financial markets; |
| • | | the effects of UK economic conditions; |
| • | | Santander UK’s exposure to UK political developments; |
| • | | the extent to which regulatory capital and leverage requirements and any changes to these requirements may limit Santander UK’s operations; |
| • | | the extent to which liquidity requirements and any changes to these requirements may limit the Santander UK’s operations; |
| • | | Santander UK’s exposure to UK Government debt; |
| • | | the effects of the ongoing economic and sovereign debt tensions in the eurozone; |
| • | | Santander UK’s exposure to risks faced by other financial institutions; |
| • | | Santander UK’s ability to access liquidity and funding on acceptable financial terms ; |
| • | | the effects of any movement in the external credit rating assigned to the Santander UK group, any Santander UK group member or any of their respective debt securities; |
| • | | the effects of fluctuations in interest rates, exchange rates, equity prices and other market risks; |
| • | | the extent to which Santander UK may be required to record negative fair value adjustments for its financial assets due to changes in market conditions; |
| • | | the risk of failing to successfully implement and continue to improve Santander UK’s credit risk management systems; |
| • | | the risks associated with Santander UK’s derivative transactions; |
| • | | the extent which Santander UK may be exposed to operational losses (e.g. failed internal or external processes, people and systems); |
| • | | the risk of failing to effectively improve or upgrade Santander UK’s information technology infrastructure and management information systems in a timely manner; |
| • | | Santander UK’s exposure to unidentified or unanticipated risks despite its risk management policies, procedures and methods; |
| • | | the effects of competition, or intensification of such competition, in the financial services markets in which Santander UK conducts business and the impact of customer perception of Santander UK’s customer service levels on existing or potential business; |
| • | | the various risks facing Santander UK as its expands its range of products and services (e.g. risk of new products and services not being responsive to customer demands or successful, risk of changing customer needs); |
| • | | Santander UK’s ability to assess the credit quality of borrowers and control the level of non-performing loans, loan prepayment and the enforceability of collateral, including real-estate securing such loans; |
| • | | the ability of Santander UK to manage any future development effectively (e.g. efficiently managing the operations and employees of expanding businesses and maintaining or growing its existing customer base); |
| • | | the ability of Santander UK to realise the anticipated benefits of its business combinations and the exposure, if any, of Santander UK to any unknown liabilities or goodwill impairments relating to acquired businesses; |
| • | | the effects of the financial services laws, regulations, governmental oversight, administrative actions and policies and any changes thereto in each location or market in which Santander UK operates; |
| • | | Santander UK’s exposure to any potential uncertainly and changes to the UK regulatory regime as a result of the reform and reorganisation of the UK financial regulatory authorities and the UK regulatory framework; |
| • | | the effects of any new reforms to the UK mortgage lending and the personal loans market; |
| • | | Santander UK’s exposure to any risk of loss form legal and regulatory proceedings; |
| • | | the power of the FCA, the PRA or an overseas regulator to potentially intervene in response to e.g. attempts by customers to seek redress from financial service institutions, including Santander UK, in case of industry-wide issues; |
| • | | the effects which the UK Banking Act 2009 (as amended), the UK Financial Services (Banking Reform) Act 2013 and similar European legislation may have on Santander UK’s business; |
| • | | the extent to which members of the Santander UK group may be responsible for contributing to compensation schemes in the UK in respect of banks and other authorised financial services firms that are unable to meet their obligations to customers; |
| • | | the risk of third parties using Santander UK as a conduit for illegal or improper activities without Santander UK’s knowledge; |
| • | | the effects of taxation requirements and other assessments and any changes thereto in each location in which Santander UK operates; |
| • | | the effects of any changes in the pension liabilities and obligations of Santander UK; |
| • | | the ability of Santander UK to recruit, retain and develop appropriate senior management and skilled personnel; |
| • | | the effects of any changes to the reputation of the Santander UK group, any Santander UK group member or any affiliate operating under the Santander UK brands; |
| • | | the effects of any changes to accounting and reporting standards applicable to preparation of the Company or the Santander UK’s group’s financial statements; |
| • | | the basis of the preparation of the Company’s and the Santander UK group’s financial statements and information available about the Santander UK group, including the extent to which assumptions and estimates made during such preparation are accurate; |
| • | | the extent to which disclosure controls and procedures over financial reporting may prevent errors or acts of fraud; |
| • | | the extent to which Santander UK rely on third parties for important infrastructure support, products and services; |
| • | | the possibility of risk arising in the future in relation to transactions between the Company and its parent, subsidiaries or affiliates; |
| • | | Santander UK’s success at managing the risks to which it is exposed, including the items above. |
Undue reliance should not be placed on forward-looking statements when making decisions with respect to Santander UK and/or its securities. Investors and others should take into account the inherent risks and uncertainties of forward-looking statements and should carefully consider the foregoing non-exhaustive list of important factors. Forward-looking statements speak only as of the date on which they are made and are based on the knowledge, information available and views taken on the date on which they are made; such knowledge, information and views may change at any time. Santander UK does not undertake any obligation to update or revise any forward-looking statement, whether as a result of new information, future events or otherwise.
| | |
| 342 | | Santander UK plc Annual Report 2013 |
Other Information for US Investors
Selected Financial Data
The financial information set forth below for the years ended 31 December 2013, 2012 and 2011 and at 31 December 2013 and 2012 has been derived from the audited Consolidated Financial Statements of Santander UK plc (the ‘Company’) and its subsidiaries (together, the ‘Santander UK group’) prepared in accordance with IFRS included elsewhere in this Annual Report. The information should be read in connection with, and is qualified in its entirety by reference to, the Santander UK group’s Consolidated Financial Statements and the notes thereto. Financial information set forth below for the years ended 31 December 2010 and 2009, and at 31 December 2011, 2010 and 2009, has been derived from the audited Consolidated Financial Statements of the Santander UK group for 2011, 2010 and 2009 not included in this Annual Report. The Consolidated Financial Statements of the Santander UK group for the years ended 31 December 2013, 2012, 2011, 2010 and 2009 were audited by Deloitte LLP.
BALANCE SHEETS
| | | | | | | | | | | | | | | | | | | | | | | | |
| | | 2013(1)
US$m | | | 2013
£m | | | 2012(2)
£m | | | 2011
£m | | | 2010
£m | | | 2009
£m | |
Assets | | | | | | | | | | | | | | | | | | | | | | | | |
Cash and balances at central banks | | | 43,781 | | | | 26,374 | | | | 29,282 | | | | 25,980 | | | | 26,502 | | | | 4,163 | |
Trading assets | | | 37,008 | | | | 22,294 | | | | 22,498 | | | | 21,891 | | | | 35,461 | | | | 33,290 | |
Derivative financial instruments | | | 33,281 | | | | 20,049 | | | | 30,146 | | | | 30,780 | | | | 24,377 | | | | 22,827 | |
Financial assets designated at fair value | | | 4,560 | | | | 2,747 | | | | 3,811 | | | | 5,005 | | | | 6,777 | | | | 12,358 | |
Loans and advances to banks | | | 3,896 | | | | 2,347 | | | | 2,438 | | | | 4,487 | | | | 3,852 | | | | 9,151 | |
Loans and advances to customers | | | 306,414 | | | | 184,587 | | | | 190,782 | | | | 201,069 | | | | 195,132 | | | | 186,804 | |
Loans and receivables securities | | | 1,828 | | | | 1,101 | | | | 1,259 | | | | 1,771 | | | | 3,610 | | | | 9,898 | |
Available for sale securities | | | 8,308 | | | | 5,005 | | | | 5,483 | | | | 46 | | | | 175 | | | | 797 | |
Macro hedge of interest rate risk | | | 1,277 | | | | 769 | | | | 1,222 | | | | 1,221 | | | | 1,091 | | | | 1,127 | |
Interests in other equities | | | 45 | | | | 27 | | | | 8 | | | | 2 | | | | 2 | | | | 75 | |
Intangible assets | | | 3,876 | �� | | | 2,335 | | | | 2,325 | | | | 2,142 | | | | 2,178 | | | | 1,446 | |
Property, plant and equipment | | | 2,525 | | | | 1,521 | | | | 1,541 | | | | 1,596 | | | | 1,705 | | | | 1,250 | |
Current tax assets | | | 189 | | | | 114 | | | | 50 | | | | — | | | | 277 | | | | 85 | |
Deferred tax assets | | | 58 | | | | 35 | | | | 60 | | | | 257 | | | | 566 | | | | 946 | |
Retirement benefit assets | | | 196 | | | | 118 | | | | 254 | | | | 241 | | | | — | | | | — | |
Other assets | | | 1,464 | | | | 882 | | | | 1,885 | | | | 1,086 | | | | 1,155 | | | | 1.074 | |
| | | | | | | | | | | | | | | | | | | | | | | | |
Total assets | | | 448,706 | | | | 270,305 | | | | 293,044 | | | | 297,574 | | | | 302,860 | | | | 285,291 | |
| | | | | | | | | | | | | | | | | | | | | | | | |
Liabilities | | | | | | | | | | | | | | | | | | | | | | | | |
Deposits by banks | | | 14,435 | | | | 8,696 | | | | 9,935 | | | | 11,626 | | | | 7,784 | | | | 5,811 | |
Deposits by customers | | | 244,296 | | | | 147,167 | | | | 149,037 | | | | 148,342 | | | | 152,643 | | | | 143,893 | |
Trading liabilities | | | 35,321 | | | | 21,278 | | | | 21,109 | | | | 25,745 | | | | 42,827 | | | | 46,152 | |
Derivative financial instruments | | | 31,313 | | | | 18,863 | | | | 28,861 | | | | 29,180 | | | | 22,405 | | | | 18,963 | |
Financial liabilities designated at fair value | | | 5,656 | | | | 3,407 | | | | 4,002 | | | | 6,837 | | | | 3,687 | | | | 4,423 | |
Debt securities in issue | | | 84,444 | | | | 50,870 | | | | 59,621 | | | | 52,651 | | | | 51,783 | | | | 47,758 | |
Subordinated liabilities | | | 7,148 | | | | 4,306 | | | | 3,781 | | | | 6,499 | | | | 6,372 | | | | 6,949 | |
Other liabilities | | | 3,126 | | | | 1,883 | | | | 2,526 | | | | 2,571 | | | | 2,026 | | | | 2,323 | |
Provisions | | | 1,061 | | | | 639 | | | | 914 | | | | 970 | | | | 185 | | | | 91 | |
Current tax liabilities | | | 7 | | | | 4 | | | | 4 | | | | 271 | | | | 492 | | | | 300 | |
Deferred tax liabilities | | | — | | | | — | | | | — | | | | — | | | | 209 | | | | 336 | |
Retirement benefit obligations | | | 1,116 | | | | 672 | | | | 305 | | | | 216 | | | | 173 | | | | 1,070 | |
| | | | | | | | | | | | | | | | | | | | | | | | |
Total liabilities | | | 427,923 | | | | 257,785 | | | | 280,095 | | | | 284,908 | | | | 290,586 | | | | 278,069 | |
| | | | | | | | | | | | | | | | | | | | | | | | |
Equity | | | | | | | | | | | | | | | | | | | | | | | | |
Share capital | | | 6,157 | | | | 3,709 | | | | 3,999 | | | | 3,999 | | | | 3,999 | | | | 2,709 | |
Share premium account | | | 9,329 | | | | 5,620 | | | | 5,620 | | | | 5,620 | | | | 5,620 | | | | 1,857 | |
Retained earnings | | | 5,490 | | | | 3,307 | | | | 3,312 | | | | 3,021 | | | | 2,628 | | | | 1,911 | |
Other reserves | | | (193 | ) | | | (116 | ) | | | 18 | | | | 26 | | | | 27 | | | | 29 | |
| | | | | | | | | | | | | | | | | | | | | | | | |
Total shareholders’ equity | | | 20,783 | | | | 12,520 | | | | 12,949 | | | | 12,666 | | | | 12,274 | | | | 6,506 | |
Non-controlling interest | | | — | | | | — | | | | — | | | | — | | | | — | | | | 716 | |
| | | | | | | | | | | | | | | | | | | | | | | | |
Total equity | | | 20,783 | | | | 12,520 | | | | 12,949 | | | | 12,666 | | | | 12,274 | | | | 7,222 | |
| | | | | | | | | | | | | | | | | | | | | | | | |
Total liabilities and equity | | | 448,706 | | | | 270,305 | | | | 293,044 | | | | 297,574 | | | | 302,860 | | | | 285,291 | |
| | | | | | | | | | | | | | | | | | | | | | | | |
| (1) | Amounts stated in US dollars have been translated from sterling at the rate of £1.00—US$1.66, the noon buying rate on 31 December 2013. |
| (2) | Adjusted to reflect the presentation of the assets held for sale prior to the completion of the sale as set out in Note 12 to the Consolidated Financial Statements. |
| | |
| Santander UK plc Annual Report 2013 | | 343 |
Other Information for US Investors
Selected Financial Datacontinued
INCOME STATEMENTS
| | | | | | | | | | | | | | | | | | | | | | | | |
| | | 2013(1)
US$m | | | 2013
£m | | | 2012(2)
£m | | | 2011(2)
£m | | | 2010
£m | | | 2009
£m | |
Net interest income | | | 4,919 | | | | 2,963 | | | | 2,734 | | | | 3,633 | | | | 3,814 | | | | 3,412 | |
Net fee and commission income | | | 1,258 | | | | 758 | | | | 861 | | | | 864 | | | | 699 | | | | 824 | |
Net trading and other income | | | 511 | | | | 308 | | | | 1,088 | | | | 439 | | | | 521 | | | | 460 | |
| | | | | | | | | | | | | | | | | | | | | | | | |
Total operating income | | | 6,688 | | | | 4,029 | | | | 4,683 | | | | 4,936 | | | | 5,034 | | | | 4,696 | |
| | | | | | | | | | | | | | | | | | | | | | | | |
Administration expenses | | | (3,232 | ) | | | (1,947 | ) | | | (1,873 | ) | | | (1,876 | ) | | | (1,793 | ) | | | (1,848 | ) |
Depreciation, amortisation and impairment | | | (411 | ) | | | (248 | ) | | | (241 | ) | | | (438 | ) | | | (275 | ) | | | (260 | ) |
| | | | | | | | | | | | | | | | | | | | | | | | |
Total operating expenses exc impairment losses, provisions and charges | | | (3,643 | ) | | | (2,195 | ) | | | (2,114 | ) | | | (2,314 | ) | | | (2,068 | ) | | | (2,108 | ) |
| | | | | | | | | | | | | | | | | | | | | | | | |
Impairment losses on loans and advances | | | (789 | ) | | | (475 | ) | | | (988 | ) | | | (501 | ) | | | (712 | ) | | | (842 | ) |
Provisions for other liabilities and charges | | | (365 | ) | | | (220 | ) | | | (434 | ) | | | (907 | ) | | | (129 | ) | | | (56 | ) |
| | | | | | | | | | | | | | | | | | | | | | | | |
Total operating impairment losses, provisions and charges | | | (1,154 | ) | | | (695 | ) | | | (1,422 | ) | | | (1,408 | ) | | | (841 | ) | | | (898 | ) |
| | | | | | | | | | | | | | | | | | | | | | | | |
Profit on continuing operations before tax | | | 1,891 | | | | 1,139 | | | | 1,147 | | | | 1,214 | | | | 2,125 | | | | 1,690 | |
Tax on profit on continuing operations | | | (362 | ) | | | (218 | ) | | | (270 | ) | | | (345 | ) | | | (542 | ) | | | (445 | ) |
| | | | | | | | | | | | | | | | | | | | | | | | |
Profit on continuing operations after tax | | | 1,529 | | | | 921 | | | | 877 | | | | 869 | | | | 1,583 | | | | 1,245 | |
(Loss)/profit from discontinued operations after tax | | | (13 | ) | | | (8 | ) | | | 62 | | | | 34 | | | | — | | | | — | |
| | | | | | | | | | | | | | | | | | | | | | | | |
Profit after tax for the year | | | 1,516 | | | | 913 | | | | 939 | | | | 903 | | | | 1,583 | | | | 1,245 | |
| | | | | | | | | | | | | | | | | | | | | | | | |
Attributable to: | | | | | | | | | | | | | | | | | | | | | | | | |
Equity holders of the parent | | | 1,516 | | | | 913 | | | | 939 | | | | 903 | | | | 1,544 | | | | 1,190 | |
Non-controlling interest | | | — | | | | — | | | | — | | | | — | | | | 39 | | | | 55 | |
| (1) | Amounts stated in US dollars have been translated from sterling at the rate of £1.00 - US$1.66, the noon buying rate on 31 December 2013. |
| (2) | Adjusted to reflect the presentation of discontinued operations as set out in Note 12 to the Consolidated Financial Statements. |
EXCHANGE RATES
The following tables set forth, for the periods indicated, certain information concerning the exchange rate for pounds sterling based on the noon buying rate in New York City for cable transfers in foreign currencies, as certified for customs purposes by the Federal Reserve Bank of New York, expressed in US dollars per £1.00. No representation is made that amounts in pounds sterling have been, could have been or could be converted into US dollars at the noon buying rate or at any other rate. The noon buying rate for US dollars on 28 February 2014 was US$1.68.
| | | | | | | | | | | | | | | | |
Calendar period | | High
US$ Rate | | | Low
US$ Rate | | | Average(1)
US$ Rate | | | Period end
US$ Rate | |
Years ended 31 December: | | | | | | | | | | | | | | | | |
2013 | | | 1.66 | | | | 1.48 | | | | 1.56 | | | | 1.66 | |
2012 | | | 1.63 | | | | 1.53 | | | | 1.59 | | | | 1.63 | |
2011 | | | 1.67 | | | | 1.54 | | | | 1.60 | | | | 1.55 | |
2010 | | | 1.64 | | | | 1.43 | | | | 1.55 | | | | 1.54 | |
2009 | | | 1.70 | | | | 1.37 | | | | 1.57 | | | | 1.62 | |
Months ended: | | | | | | | | | | | | | | | | |
February 2014 | | | 1.68 | | | | 1.63 | | | | 1.66 | | | | 1.68 | |
January 2014 | | | 1.66 | | | | 1.63 | | | | 1.65 | | | | 1.64 | |
December 2013 | | | 1.66 | | | | 1.63 | | | | 1.64 | | | | 1.66 | |
November 2013 | | | 1.64 | | | | 1.59 | | | | 1.61 | | | | 1.64 | |
October 2013 | | | 1.62 | | | | 1.59 | | | | 1.61 | | | | 1.61 | |
September 2013 | | | 1.62 | | | | 1.55 | | | | 1.59 | | | | 1.62 | |
| (1) | The average of the noon buying rates on the last business day of each month during the relevant period. |
| | |
| 344 | | Santander UK plc Annual Report 2013 |
Other Information for US Investors
Selected Financial Datacontinued
SELECTED STATISTICAL INFORMATION
This Annual Report includes certain financial measures which are not accounting measures within the scope of IFRS. Such non-IFRS measures are defined as ones that measure historical or future financial performance, financial position or cash flows but which exclude or include amounts that would not be so adjusted in the most comparable IFRS measures. Such measures are defined further in the footnotes that follow, including, where relevant, reconciliations to the closest IFRS measure. These non-IFRS measures are not a substitute for IFRS measures. Such non-IFRS measures include return on tangible equity, Banking net interest margin, Common Equity Tier 1 capital ratio and the 2012 cost-to-income ratio.
| | | | | | | | | | | | | | | | | | | | |
| | | 2013
% | | | 2012
% | | | 2011
% | | | 2010
% | | | 2009
% | |
Profitability ratios: | | | | | | | | | | | | | | | | | | | | |
Return on assets (1) | | | 0.31 | | | | 0.31 | | | | 0.29 | | | | 0.54 | | | | 0.43 | |
Return on ordinary shareholders’ funds(2) | | | 7.2 | | | | 7.3 | | | | 7.2 | | | | 17.1 | | | | 19.2 | |
Return on tangible equity(3) | | | 8.9 | | | | 9.1 | | | | 9.0 | | | | 21.2 | | | | 24.2 | |
Banking net interest margin(4) | | | 1.55 | | | | 1.36 | | | | 1.80 | | | | 1.94 | | | | 1.83 | |
Cost-to-income ratio(5) | | | 54 | | | | 53 | | | | 47 | | | | 41 | | | | 45 | |
Dividend payout ratio(6) | | | 47 | | | | 48 | | | | 47 | | | | 49 | | | | 40 | |
Non-performing loans ratio(7) | | | 2.04 | | | | 2.16 | | | | 1.93 | | | | 1.84 | | | | 1.90 | |
Loan-to-deposit ratio(8) | | | 126 | | | | 129 | | | | 135 | | | | 128 | | | | 132 | |
| | | | | |
Capital ratios: | | | | | | | | | | | | | | | | | | | | |
Equity to assets ratio(9) | | | 4.41 | | | | 4.33 | | | | 4.04 | | | | 3.13 | | | | 2.26 | |
Core Tier 1 capital ratio | | | 12.9 | | | | 12.2 | | | | 11.4 | | | | 11.5 | | | | 6.8 | |
Common Equity Tier 1 capital ratio(10) | | | 11.6 | | | | 11.1 | | | | n/a | | | | n/a | | | | n/a | |
| | | | | |
Ratio of earnings to fixed charges:(11) | | | | | | | | | | | | | | | | | | | | |
- Excluding interest on retail deposits | | | 174 | | | | 165 | | | | 214 | | | | 363 | | | | 202 | |
- Including interest on retail deposits | | | 127 | | | | 124 | | | | 132 | | | | 166 | | | | 143 | |
| (1) | Profit after tax divided by average total assets. |
| (2) | Profit after tax divided by average ordinary shareholders’ funds. |
| (3) | Return on tangible equity (‘RoTE’) (formerly known as return on average tangible book value) is defined as the profit attributable to equity shareholders divided by average shareholders’ equity less preference shares and intangible assets (including goodwill). In 2010 and 2009, when Santander UK had non-controlling interests, these were also excluded. Management reviews RoTE in order to measure the overall profitability of the Santander UK group and believes that presentation of this financial measure provides useful information to investors regarding the Santander UK group’s results of operations. A reconciliation between RoTE and return on ordinary shareholders’ funds is as follows: |
| | | | | | | | | | | | | | | | | | | | |
| | | 2013
£m | | | 2012
£m | | | 2011
£m | | | 2010
£m | | | 2009
£m | |
Profit after tax | | | 913 | | | | 939 | | | | 903 | | | | 1,583 | | | | 1,245 | |
Preference dividends | | | (57 | ) | | | (57 | ) | | | (57 | ) | | | (57 | ) | | | (57 | ) |
| | | | | | | | | | | | | | | | | | | | |
Profit attributable to equity shareholders | | | 856 | | | | 882 | | | | 846 | | | | 1,526 | | | | 1,188 | |
| | | | | | | | | | | | | | | | | | | | |
Average shareholders’ equity | | | 12,735 | | | | 12,808 | | | | 12,470 | | | | 9,591 | | | | 7,185 | |
Average non-controlling interests | | | — | | | | — | | | | — | | | | (326 | ) | | | (714 | ) |
| | | | | | | | | | | | | | | | | | | | |
Average ordinary shareholders funds | | | 12,735 | | | | 12,808 | | | | 12,470 | | | | 9,265 | | | | 6,471 | |
Average preference shares | | | (763 | ) | | | (894 | ) | | | (894 | ) | | | (669 | ) | | | (297 | ) |
Average goodwill and intangible assets | | | (2,330 | ) | | | (2,234 | ) | | | (2,160 | ) | | | (1,401 | ) | | | (1,261 | ) |
| | | | | | | | | | | | | | | | | | | | |
Average tangible equity | | | 9,642 | | | | 9,680 | | | | 9,416 | | | | 7,195 | | | | 4,913 | |
| | | | | | | | | | | | | | | | | | | | |
Return on ordinary shareholders’ funds | | | 7.2 | % | | | 7.3 | % | | | 7.2 | % | | | 17.1 | % | | | 19.2 | % |
Return on tangible equity | | | 8.9 | % | | | 9.1 | % | | | 9.0 | % | | | 21.2 | % | | | 24.2 | % |
| (4) | Banking net interest margin (‘Banking NIM’) is defined as net interest income divided by average customer loans. Management reviews Banking NIM in order to measure the overall profitability of the Santander UK group and believes that presentation of this financial measure provides useful information to investors regarding the Santander UK group’s results of operations. A reconciliation between Banking NIM and net interest margin is as follows: |
| | | | | | | | | | | | | | | | | | | | |
| | | 2013
£m | | | 2012
£m | | | 2011
£m | | | 2010
£m | | | 2009
£m | |
Net interest income | | | 2,963 | | | | 2,734 | | | | 3,633 | | | | 3,814 | | | | 3,412 | |
| | | | | | | | | | | | | | | | | | | | |
Average interest earning assets | | | 229,114 | | | | 235,129 | | | | 230,490 | | | | 220,813 | | | | 211,082 | |
Average customer loans | | | 190,699 | | | | 200,719 | | | | 201,524 | | | | 196,596 | | | | 186,730 | |
| | | | | | | | | | | | | | | | | | | | |
Net interest margin | | | 1.29 | % | | | 1.16 | % | | | 1.58 | % | | | 1.73 | % | | | 1.61 | % |
Banking net interest margin | | | 1.55 | % | | | 1.36 | % | | | 1.80 | % | | | 1.94 | % | | | 1.83 | % |
| (5) | The cost-to-income ratio is defined as total expenses divided by total income. The cost-to-income ratio in 2012 is a non-IFRS measure due to the exclusion of the gain of £705m on the capital management exercise. |
| (6) | Ordinary equity dividends declared divided by profit after tax. |
| (7) | Non-performing loans ratio is defined as non-performing loans as a percentage of customer assets. |
| (8) | The loan-to-deposit ratio is defined as loans and advances to customers (excluding reverse repos) divided by deposits by customers (excluding repos). |
| (9) | Average ordinary shareholders’ funds divided by average total assets. |
| (10) | Common Equity Tier 1 (‘CET 1’) capital ratio is defined on the basis of the Capital Requirements Directive IV (‘CRD IV’) rules, which will implement Basel III in the EU due to apply at the end of the transitional period. Management monitors the CET 1 capital ratio to ensure Santander UK maintains sufficient capital resources relative to the minimum regulatory capital requirements, and support its risk appetite and economic capital requirements, and capacity to grow. A reconciliation between the CET 1 capital ratio and the Core Tier 1 capital ratio is as follows: |
| | | | | | | | |
| | | 2013
£m | | | 2012
£m | |
Core Tier 1 capital - current PRA rules | | | 9,680 | | | | 9,302 | |
CRD IV adjustments to Core Tier 1: | | | | | | | | |
- Excess of regulatory expected losses over impairment losses | | | (335 | ) | | | (370 | ) |
- Defined benefit pension adjustment | | | (310 | ) | | | (101 | ) |
- Other(a) | | | (66 | ) | | | (23 | ) |
| | | | | | | | |
CET 1 capital - CRD IV | | | 8,969 | | | | 8,808 | |
| | | | | | | | |
Pillar 1 RWA - current PRA rules | | | 75,242 | | | | 76,524 | |
CRD IV adjustments to RWA: | | | | | | | | |
- Securitisation | | | 983 | | | | 970 | |
- Counterparty Risk and Other(b) | | | 1,425 | | | | 2,028 | |
| | | | | | | | |
RWA - CRD IV | | | 77,650 | | | | 79,522 | |
| | | | | | | | |
Core Tier 1 ratio | | | 12.9 | % | | | 12.2 | % |
| | | | | | | | |
CET1 capita/ RWA ratio | | | 11.6 | % | | | 11.1 | % |
| | | | | | | | |
| (a) | Other adjustments to Core Tier 1 capital include the effect of additional valuation adjustments, deferred tax, securitisation and unrealised losses on available-for-sale securities. |
| (b) | The counterparty risk adjustments to RWA include credit valuation adjustment, central counterparty clearing, asset value correlation, operational risk and changes to credit risk from provision treatment and SME risk weight reduction. |
| (11) | For the purpose of calculating the ratios of earnings to fixed charges, earnings consist of profit before tax from continuing operations plus fixed charges. Fixed charges consist of interest payable, including the amortisation of discounts and premiums on debt securities in issue. |
| | |
| Santander UK plc Annual Report 2013 | | 345 |
Other Information for US Investors
Impairment loss allowances on loans and advances to customers
The disclosure of credit risk elements in this section reflects US accounting practice and classifications. The purpose of the disclosure is to present within the US disclosure framework those elements of the loan portfolios with a greater risk of loss. The main classifications of credit risk elements presented are:
| • | | Unimpaired loans contractually past due 90 days or more as to interest or principal; |
| • | | Troubled debt restructurings; |
| • | | Potential problem loans and advances; and |
| • | | Cross border outstandings. |
Impaired loans
Loans are classified as impaired when there is objective evidence that not all contractual cash flows will be received. Under IFRS, separate disclosure is required of loans that are: neither past due nor impaired; past due but not impaired; and impaired. This disclosure may be found in the “Loans and Advances” section of the Risk Management Report.
In accordance with IFRS, Santander UK recognises interest income on assets after they have been written down as a result of an impairment loss. Interest continues to be accrued on all loans and the element of interest that is not anticipated to be recovered is provided for. Interest income recognised on impaired loans is set out in the Consolidated Financial Statements. The income adjustment in respect of interest that is not anticipated to be recovered was £31m (2012: £37m, 2011: £48m).
Unimpaired loans contractually past due 90 days or more as to interest or principal
In the Retail Banking business, loans and advances are classified as non-performing typically when the customer fails to make payments when contractually due for three months or longer. In the Commercial Banking business, loans and advances are classified as non-performing either when payments are three months or more past due or where there are reasonable doubts about full repayment (principal and interest) under the contractual terms.
Details of Santander UK’s non-performing loans and advances, including separate disclosure about unimpaired loans contractually past due 90 days or more as to interest or principal, are set out on page 163.
Forbearance
To support customers that encounter difficulties, Santander UK operates forbearance programmes to amend contractual amounts or timings where a customer’s financial distress indicates the potential that satisfactory repayment may not be made within the original terms and conditions of the contract. A range of forbearance strategies are employed in order to improve the management of customer relationships, maximise collection opportunities within customers’ affordability and, if possible, avoid foreclosure or repossession. Further information can be found in the “Credit Risk Management—Retail Banking”, “Credit Risk Management—Commercial Banking” and “Credit Risk Management – Corporate Centre” sections of the Risk Management Report.
Troubled debt restructurings
The US Securities and Exchange Commission requires separate disclosure of any loans whose terms have been modified by the lender because of the borrower’s financial difficulties, as a concession that the lender would not otherwise consider. These are classified as troubled debt restructurings. Disclosure is required of loans that would otherwise have been classified as past due or impaired whose terms have been renegotiated. This disclosure and disclosure on forbearance may be found in the “Credit Risk” section of the Risk Management Report.
Potential problem loans and advances
Credit risk elements also cover potential problem loans. These are loans where information on possible credit problems among borrowers causes management to seriously doubt their ability to comply with the loan repayment terms. There are no potential problem loans other than those discussed above, and as discussed in disclosures by division given in the “Credit Risk” section of the Risk Management Report.
Cross border outstandings
Cross border outstandings, as defined by bank regulatory rules, are amounts payable to Santander UK by residents of foreign countries, regardless of the currency in which the claim is denominated, and local country claims in excess of local country obligations. Cross border outstandings consist mainly of loans and advances to customers and banks, finance lease debtors, interest-bearing investments and other monetary assets.
In addition to credit risk, cross border outstandings have the risk that, as a result of political or economic conditions in a country, borrowers may be unable to meet their contractual payment obligations of principal and or interest when due because of the unavailability of, or restrictions on, foreign exchange needed by borrowers to repay their obligations. These cross border outstandings are controlled through a well-developed system of country limits, which are reviewed to avoid concentrations of transfer, economic or political risks.
For further analysis of the Santander UK’s country risk exposures, including eurozone and peripheral eurozone exposures and redenomination risk, see the “Country Risk Exposure” section in the Risk Management Report on pages 151 to 156.
| | |
| 346 | | Santander UK plc Annual Report 2013 |
Other Information for US Investors
Risk elements in the loan portfolio
(i) Cross border outstandings exceeding 1% of total assets
At 31 December 2013, 2012 and 2011, Santander UK had cross border outstandings exceeding 1% of total assets as follows:
| | | | | | | | | | | | | | | | |
31 December 2013 | | Governments and
official institutions
£bn | | | Banks and other
financial institutions
£bn | | | Other
£bn | | | Total
£bn | |
US | | | 5.3 | | | | 8.3 | | | | 0.6 | | | | 14.2 | |
Japan | | | 3.8 | | | | 0.1 | | | | 0.1 | | | | 4.0 | |
| | | | |
31 December 2012 | | Governments and
official institutions
£bn | | | Banks and other
financial institutions
£bn | | | Other
£bn | | | Total
£bn | |
US | | | 0.8 | | | | 15.2 | | | | 0.8 | | | | 16.8 | |
Germany | | | 1.3 | | | | 3.5 | | | | 0.2 | | | | 5.0 | |
Switzerland | | | 0.5 | | | | 2.3 | | | | 0.5 | | | | 3.3 | |
| | | | |
31 December 2011 | | Governments and
official institutions
£bn | | | Banks and other
financial institutions
£bn | | | Other
£bn | | | Total
£bn | |
US | | | 7.1 | | | | 11.0 | | | | 1.4 | | | | 19.5 | |
Spain | | | — | | | | 5.5 | | | | 0.1 | | | | 5.6 | |
Switzerland | | | 1.2 | | | | 2.7 | | | | 0.5 | | | | 4.4 | |
Germany | | | 0.1 | | | | 3.2 | | | | 0.2 | | | | 3.5 | |
(ii) Cross border outstandings between 0.75% and 1% of total assets
At 31 December 2013, 2012 and 2011, Santander UK had cross border outstandings between 0.75% and 1% of total assets as follows:
| | | | | | | | | | | | | | | | |
31 December 2013 | | Governments and
official institutions
£bn | | | Banks and other
financial institutions
£bn | | | Other
£bn | | | Total
£bn | |
Spain | | | — | | | | 2.5 | | | | 0.1 | | | | 2.6 | |
France | | | 0.4 | | | | 1.9 | | | | 0.2 | | | | 2.5 | |
Switzerland | | | 0.5 | | | | 1.3 | | | | 0.5 | | | | 2.3 | |
| | | | |
31 December 2012 | | Governments and
official institutions
£bn | | | Banks and other
financial institutions
£bn | | | Other
£bn | | | Total
£bn | |
Spain | | | — | | | | 2.8 | | | | 0.1 | | | | 2.9 | |
France | | | — | | | | 2.2 | | | | 0.2 | | | | 2.4 | |
Denmark | | | — | | | | 2.3 | | | | — | | | | 2.3 | |
| | | | |
31 December 2011 | | Governments and
official institutions
£bn | | | Banks and other
financial institutions
£bn | | | Other
£bn | | | Total
£bn | |
France | | | 0.1 | | | | 2.4 | | | | 0.3 | | | | 2.8 | |
(iii) Cross border outstandings between 0.5% and 0.75% of total assets
At 31 December 2013, 2012 and 2011, Santander UK had cross border outstandings between 0.5% and 0.75% of total assets as follows:
| | | | | | | | | | | | | | | | |
31 December 2013 | | Governments and
official institutions
£bn | | | Banks and other
financial institutions
£bn | | | Other
£bn | | | Total
£bn | |
Germany | | | — | | | | 1.6 | | | | 0.2 | | | | 1.8 | |
Denmark | | | — | | | | 1.4 | | | | 0.1 | | | | 1.5 | |
| | | | |
31 December 2012 | | Governments and
official institutions
£bn | | | Banks and other
financial institutions
£bn | | | Other
£bn | | | Total
£bn | |
Japan | | | 1.2 | | | | 0.2 | | | | 0.2 | | | | 1.6 | |
31 December 2011
None.
| | |
| Santander UK plc Annual Report 2013 | | 347 |
Other Information for US Investors
Impairment loss allowances on loans and advances to customers
The geographical analysis below is based on the location of the office from which the loans and advances to customers are made, rather than the domicile of the borrower. Further geographical analysis, showing the country of domicile of the borrower rather than the office of lending is contained within the “Country Risk Exposure” section on page 151.
An analysis of Santander UK’s impairment loss allowances on loans and advances to customers is presented below.
| | | | | | | | | | | | | | | | | | | | |
| | | 2013
£m | | | 2012
£m | | | 2011
£m | | | 2010
£m | | | 2009
£m | |
Observed impairment loss allowances | | | | | | | | | | | | | | | | | | | | |
Advances secured on residential properties - UK | | | 382 | | | | 385 | | | | 381 | | | | 369 | | | | 313 | |
Corporate loans - UK | | | 364 | | | | 602 | | | | 324 | | | | 271 | | | | 185 | |
Finance leases - UK | | | 8 | | | | 6 | | | | 6 | | | | 2 | | | | 1 | |
Other secured advances - UK | | | 137 | | | | 159 | | | | 83 | | | | 55 | | | | 50 | |
Unsecured personal advances - UK | | | 128 | | | | 208 | | | | 330 | | | | 381 | | | | 341 | |
| | | | | | | | | | | | | | | | | | | | |
Total observed impairment loss allowances | | | 1,019 | | | | 1,360 | | | | 1,124 | | | | 1,078 | | | | 890 | |
| | | | | | | | | | | | | | | | | | | | |
Incurred but not yet observed impairment loss allowances | | | | | | | | | | | | | | | | | | | | |
Advances secured on residential properties - UK | | | 211 | | | | 167 | | | | 97 | | | | 157 | | | | 171 | |
Corporate loans - UK | | | 40 | | | | 125 | | | | 103 | | | | 125 | | | | 172 | |
Finance leases - UK | | | 36 | | | | 34 | | | | 31 | | | | 17 | | | | 1 | |
Other secured advances - UK | | | 92 | | | | 10 | | | | 24 | | | | 22 | | | | 12 | |
Unsecured personal advances - UK | | | 157 | | | | 106 | | | | 184 | | | | 256 | | | | 53 | |
| | | | | | | | | | | | | | | | | | | | |
Total incurred but not yet observed impairment loss allowances | | | 536 | | | | 442 | | | | 439 | | | | 577 | | | | 409 | |
| | | | | | | | | | | | | | | | | | | | |
Total impairment loss allowances | | | 1,555 | | | | 1,802 | | | | 1,563 | | | | 1,655 | | | | 1,299 | |
| | | | | | | | | | | | | | | | | | | | |
Movements in impairment loss allowances on loans and advances to customers
An analysis of movements in Santander UK’s impairment loss allowances on loans and advances to customers is presented below.
| | | | | | | | | | | | | | | | | | | | |
| | | 2013
£m | | | 2012
£m | | | 2011
£m | | | 2010
£m | | | 2009
£m | |
Impairment loss allowances at 1 January | | | 1,802 | | | | 1,429 | | | | 1,655 | | | | 1,299 | | | | 1,001 | |
Amounts written off | | | | | | | | | | | | | | | | | | | | |
Advances secured on residential properties - UK | | | (89 | ) | | | (75 | ) | | | (92 | ) | | | (42 | ) | | | (84 | ) |
Corporate loans - UK | | | (287 | ) | | | (162 | ) | | | (116 | ) | | | (68 | ) | | | — | |
Finance leases - UK | | | (10 | ) | | | (13 | ) | | | (9 | ) | | | (5 | ) | | | (4 | ) |
Other secured advances - UK | | | (95 | ) | | | (53 | ) | | | (48 | ) | | | (48 | ) | | | (17 | ) |
Unsecured personal advances - UK | | | (342 | ) | | | (377 | ) | | | (466 | ) | | | (448 | ) | | | (425 | ) |
| | | | | | | | | | | | | | | | | | | | |
Total amounts written off | | | (823 | ) | | | (680 | ) | | | (731 | ) | | | (611 | ) | | | (530 | ) |
| | | | | | | | | | | | | | | | | | | | |
Observed impairment losses charged against profit | | | | | | | | | | | | | | | | | | | | |
Advances secured on residential properties - UK | | | 86 | | | | 79 | | | | 104 | | | | 98 | | | | 223 | |
Corporate loans - UK | | | 49 | | | | 440 | | | | 173 | | | | 154 | | | | 172 | |
Finance leases - UK | | | 12 | | | | 12 | | | | 14 | | | | 6 | | | | 5 | |
Other secured advances - UK | | | 73 | | | | 129 | | | | 76 | | | | 53 | | | | 30 | |
Unsecured personal advances - UK | | | 302 | | | | 318 | | | | 412 | | | | 488 | | | | 539 | |
| | | | | | | | | | | | | | | | | | | | |
Total observed impairment losses charged against profit | | | 522 | | | | 978 | | | | 779 | | | | 799 | | | | 969 | |
| | | | | | | | | | | | | | | | | | | | |
Incurred but not yet observed impairment losses charged against profit | | | 54 | | | | 75 | | | | (140 | ) | | | (53 | ) | | | (141 | ) |
| | | | | | | | | | | | | | | | | | | | |
Total impairment losses charged against profit | | | 576 | | | | 1,053 | | | | 639 | | | | 746 | | | | 828 | |
| | | | | | | | | | | | | | | | | | | | |
Assumed through transfers of entities under common control | | | — | | | | — | | | | — | | | | 221 | | | | — | |
| | | | | | | | | | | | | | | | | | | | |
Impairment loss allowances at 31 December | | | 1,555 | | | | 1,802 | | | | 1,563 | | | | 1,655 | | | | 1,299 | |
| | | | | | | | | | | | | | | | | | | | |
Recoveries
An analysis of Santander UK’s recoveries is presented below.
| | | | | | | | | | | | | | | | | | | | |
| | | 2013
£m | | | 2012
£m | | | 2011
£m | | | 2010
£m | | | 2009
£m | |
Advances secured on residential properties - UK | | | 4 | | | | 4 | | | | 3 | | | | 1 | | | | 1 | |
Corporate loans - UK | | | 3 | | | | — | | | | 2 | | | | 12 | | | | 23 | |
Finance leases - UK | | | 2 | | | | 2 | | | | 3 | | | | 1 | | | | 1 | |
Other secured advances - UK | | | 5 | | | | 6 | | | | 10 | | | | — | | | | — | |
Unsecured personal advances - UK | | | 87 | | | | 53 | | | | 56 | | | | 20 | | | | 30 | |
| | | | | | | | | | | | | | | | | | | | |
Total amount recovered | | | 101 | | | | 65 | | | | 74 | | | | 34 | | | | 55 | |
| | | | | | | | | | | | | | | | | | | | |
| | |
| 348 | | Santander UK plc Annual Report 2013 |
Other Information for US Investors
Taxation for US investors
The following is a summary, under current law, of the principal UK tax considerations relating to the beneficial ownership by a US taxpayer of the securities of the Company. The following summary is provided for general guidance and does not address investors that are subject to special rules or that do not hold the perpetual securities as capital assets. US residents should consult their local tax advisers, particularly in connection with any potential liability to pay US taxes on disposal, lifetime gift or bequest of their perpetual securities.
United Kingdom taxation on dividends
Under UK law, income tax is not withheld from dividends paid by UK companies. Shareholders, whether resident in the UK or not, receive the full amount of the dividend actually declared.
United Kingdom taxation on capital gains
Under UK law, when you sell shares you may be liable to pay either capital gains tax or corporation tax on chargeable gains. However if you are either:
| • | | an individual who is neither resident nor ordinarily resident in the UK; or |
| • | | a company which is not resident in the UK, |
you will not be liable to UK tax on any capital gains made on disposal of your shares. The exception is if the shares are held in connection with a trade or business that is conducted in the UK through a branch or agency (for capital gains tax purposes) or a permanent establishment (for corporation tax purposes).
United Kingdom inheritance tax
Under the current estate and gift tax convention between the US and the UK, shares held by an individual shareholder who is:
| • | | domiciled for the purposes of the convention in the US; and |
| • | | is not for the purposes of the convention a national of the UK; |
will not be subject to UK inheritance tax on:
| • | | the individual’s death; or |
| • | | on a gift of the shares during the individual’s lifetime. |
The exception is if the shares are part of the business property of a permanent establishment of the individual in the UK or, in the case of a shareholder who performs independent personal services, pertain to a fixed base situated in the UK.
Share Information
Sterling-denominated preference shares
At 31 December 2013, the Company had outstanding 325,300,002 sterling-denominated preference shares. 325,000,000 of these sterling preference shares, nominal value of £1.00 each were issued in October 1995, February 1996 and June 1997. In addition, the Company issued 300,002 sterling preference shares, nominal value of £1.00 each in April 2010.
Major shareholders
At 31 December 2013, the Company was a subsidiary of Banco Santander, S.A. and Santusa Holding, S.L. On 12 November 2004, Banco Santander, S.A. acquired the entire issued ordinary share capital of the Company by means of a scheme of arrangement under Section 425 of the Companies Act 1985.
With effect from 10 January 2014, Santander UK Group Holdings Limited, a subsidiary of Banco Santander, S.A. and Santusa Holding, S.L., became the beneficial owner of the entire issued ordinary share capital of the Company by virtue of a share exchange agreement between Santander UK Group Holdings Limited, Banco Santander, S.A. and Santusa Holding, S.L.
Exchange controls
There are no UK laws, decrees or regulations that restrict Santander UK’s export or import of capital, including the availability of cash and cash equivalents for use by Santander UK, or that affect the remittance of dividends or other shareholder payments to non-UK holders of Company shares, except as outlined in the section on Taxation for US Investors above.
| | |
| Santander UK plc Annual Report 2013 | | 349 |
Other Information for US Investors
Articles of Association
The following is a summary of the Articles of Association (the ‘Articles’) of the Company.
Santander UK plc is a public company registered in England and Wales, registered number 2294747. The Articles do not specifically state or limit the objects of the Company which are therefore unrestricted.
A Director shall not vote on, or be counted in the quorum in relation to any resolution of the Directors in respect of any contract in which he has an interest, or any resolution of the Directors concerning his own appointment, or the settlement or variation of the terms or the termination of his or her appointment.
Preference shares entitle the holder to receive a preferential dividend payment at a fixed or variable rate, such dividend to be payable on a date determined by the Board prior to the allotment of the shares. The Board will also determine whether these dividend rights are cumulative or non-cumulative. If dividends are unclaimed for twelve years, the right to the dividend ceases. The holders of any series of preference shares will only be entitled to receive notice of and to attend any general meeting of the Company if the preference dividend on the preference shares of such series has not, at the date of the notice of the general meeting, been paid in full in respect of such dividend periods as the Board may prior to allotment determine, in which case the holders of the preference shares will be entitled to speak and/or vote upon any resolution proposed; or, if a resolution is proposed at the general meeting, for, or in relation to, the winding-up of the Company; or varying, altering or abrogating any of the rights, privileges, limitations or restrictions attached to the preference shares of such series, in which case the holders of the preference shares of such series will be entitled to speak and/or vote only upon such resolution; or in such other circumstances, and upon and subject to such terms, as the Board may determine prior to allotment.
Unless the Board determines, prior to allotment, that the series of preference shares shall be non-redeemable, each series shall be redeemable at the option of the Company on any date as the Board may determine prior to the date of allotment. On redemption the Company shall pay the amount due. The formula for calculation of any relevant redemption premium is set out in the Articles of Association.
There are no sinking fund provisions. Where the preference shares are partly paid, the Board may make further calls upon the holders. There are no provisions discriminating against any existing or prospective shareholder as a result of such shareholder owning a substantial number of shares.
Dividends are payable to the holders of ordinary shares. These ordinary shares are transferable. If dividends are unclaimed for twelve years, the right to the dividend ceases.
Subject to any special terms as to voting upon which any ordinary shares may be issued or may for the time being be held or any suspension or any abrogation of voting rights as set out in the Articles of Association, on a show of hands every member who is present in person at a general meeting of the Company shall have one vote and every proxy present who has been duly appointed by a member shall have one vote. On a poll every member who is present in person or by proxy shall have one vote for every share of which he is the holder.
Subject to the prior rights of holders of preference shares, the Company pays dividends on its ordinary shares only out of its distributable profits and not out of share capital. Dividends are determined by the Board.
The Company’s Articles of Association authorise it to issue redeemable shares, but the Company’s ordinary shares are not redeemable. There are no sinking fund provisions. The Board may from time to time make calls upon the members in respect of any monies unpaid on their shares. There are no provisions discriminating against any existing or prospective shareholder as a result of such shareholder owning a substantial number of ordinary shares.
Subject to the provisions of the UK Companies Act 2006, all or any of the rights attached to any class of shares (whether or not the Company is being wound up) may be varied with the consent in writing of the holders of not less than three-fourths in nominal value of the issued shares of that class or with the sanction of a special resolution passed at a separate general meeting of the holders of those shares. Additional quorum and voting requirements apply to such meeting.
General meetings shall be called by at least 14 clear days’ notice (that is, excluding the day of the General Meeting and the day on which the notice is given). A general meeting may be called by shorter notice if it is so agreed, in the case of an annual general meeting, by all the shareholders having a right to attend and vote, or in other cases, by a majority in number of the shareholders having a right to attend and vote, being a majority together holding not less than 95 per cent in nominal value of the shares giving the right. The notice shall specify the date, time and place of the meeting and the general nature of the business to be transacted.
There are no restrictions on the rights to own securities for either resident or non-resident shareholders, other than those to which they may be subject as a result of the laws and regulations in their home jurisdiction.
| | |
| 350 | | Santander UK plc Annual Report 2013 |
Other Information for US Investors
Disclosure pursuant to Section 219 of the Iran Threat Reduction and Syria Human Rights Act
Pursuant to Section 219 of the Iran Threat Reduction and Syria Human Rights Act of 2012, which added Section 13(r) to the Securities Exchange Act of 1934, as amended, an issuer is required to disclose in its annual or quarterly reports, as applicable, whether it or any of its affiliates knowingly engaged in certain activities, transactions or dealings relating to Iran or with individuals or entities designated pursuant to certain Executive Orders. Disclosure is generally required even where the activities, transactions or dealings were conducted in compliance with applicable law.
During the period covered by this annual report:
| (a) | A Santander UK customer, being an Iranian national resident in the UK, was designated in September 2013 as acting for or on behalf of the Government of Iran. This accountholder’s current account and credit card with Santander UK were closed in December 2013. No revenue was generated by Santander UK on these products. |
| (b) | In early October 2013, Santander UK opened an account for a Tunisian national, resident in the UK, who is currently designated by the U.S. for terrorism. After becoming aware of this customer’s designation, Santander UK exited the relationship later in October 2013. No revenue was generated by Santander UK on these accounts. |
| (c) | Santander UK holds frozen savings and current accounts for three customers resident in the UK who are currently designated by the US for terrorism. The accounts held by each customer were blocked after the customer’s designation and have remained blocked and dormant throughout 2013. No revenue was generated by Santander UK on these accounts. |
| (d) | A UK company maintained two commercial accounts at Santander UK that were used to provide payroll processing services for a UK entity that is currently designated by the US under the Iran sanctions regime. The accounts may have been used to provide payroll services to other Iranian clients. Santander UK became aware of this account activity in September 2013 and exited the relationship in January 2014. No revenue was generated by Santander UK on these accounts. |
| (e) | An Iranian national, resident in the UK, who is designated by the U.S. and the UK under the Iran Sanctions regime held a mortgage with Santander UK plc. No further drawdown has been made (or would be allowed) under this mortgage although we continue to receive repayment instalments. In 2013, total revenue in connection with the mortgage was £10,421.15 whilst net profits were negligible relative to the overall profits of Santander UK. Santander UK does not intend to enter into any new relationships with this customer, and any disbursements will only be made in accordance with applicable sanctions. |
The following activities are disclosed in response to Section 13(r) with respect to affiliates of the Company within the Banco Santander group:
The same Iranian national referred to under sub-section (e) above also holds two investment accounts with Santander Asset Management UK Limited, part of the Banco Santander group. The accounts have remained frozen throughout 2013. The investment returns are being automatically reinvested, and no disbursements have been made to the customer. Total revenue for the Banco Santander group in connection with the investment accounts was £247.49 whilst net profits were negligible in 2013 relative to the overall profits of Banco Santander, S.A.
In addition, the Banco Santander group has certain legacy export credits and performance guarantees with Bank Mellat, which is included on the US Department of the Treasury’s Office of Foreign Assets Control’s Specially Designated Nationals and Blocked Persons List. Two bilateral credit facilities were entered into in February 2000 with an aggregate principal amount of euro 25.9 million. Both credit facilities matured in 2012. In addition, in 2005 Banco Santander, S.A. participated in a syndicated credit facility for Bank Mellat of euro 15.5 million, which will mature on 6 July 2015. At 31 December 2013, the Banco Santander group was owed euro 4.3 million under this credit facility.
Bank Mellat has been in default under all of these agreements in recent years and Banco Santander S.A. has been and expects to continue to be repaid any amounts due by official export credit agencies, which insure between 95% and 99% of the outstanding amounts under these credit facilities. No funds have been extended by Banco Santander S.A. under these facilities since they were granted.
The Banco Santander group also has certain legacy performance guarantees for the benefit of Bank Sepah and Bank Mellat (stand-by letters of credit to guarantee the obligations – either under tender documents or under contracting agreements – of contractors who participated in public bids in Iran) that were in place prior to 27 April 2007. However, should any of the contractors default in their obligations under the public bids, the Banco Santander group would not be able to pay any amounts due to Bank Sepah or Bank Mellat because any such payments would be frozen pursuant to Council Regulation (EU) No. 961/2010.
In the aggregate, all of the transactions described above resulted in approximately euro 72,000 gross revenues and approximately euro 123,000 net loss to the Banco Santander group in 2013, all of which resulted from the performance of export credit agencies rather than any Iranian entity. The Banco Santander group has undertaken significant steps to withdraw from the Iranian market such as closing its representative office in Iran and ceasing all banking activities therein, including correspondent relationships, deposit taking from Iranian entities and issuing export letters of credit, except for the legacy transactions described above. The Banco Santander group is not contractually permitted to cancel these arrangements without either: (i) paying the guaranteed amount – which payment would be frozen as explained above (in the case of the performance guarantees); or (ii) forfeiting the outstanding amounts due to it (in the case of the export credits). As such, the Banco Santander group intends to continue to provide the guarantees and hold these assets in accordance with company policy and applicable laws.
| | |
| Santander UK plc Annual Report 2013 | | 351 |
Other Information for US Investors
New York Stock Exchange (‘NYSE’) Corporate Governance - differences in UK and NYSE corporate governance practice
The Company has fully and unconditionally guaranteed the debt securities of its wholly owned subsidiary Abbey National Treasury Services plc (‘ANTS’) that are listed on the New York Stock Exchange (‘NYSE’). We believe the following to be the significant differences between our current corporate governance practices and those applicable to US companies under the NYSE listing standards.
Under the NYSE listing standards, Independent Directors must comprise a majority of the Board. Our Board is currently comprised of a Chair (who is also a Non-Executive Director), four Executive Directors (including the Chief Executive Officer) and eleven Non-Executive Directors. Six of the Non-Executive Directors are independent, and the other five Non-Executive Directors are not independent, according to both the NYSE listing standards and the UK Corporate Governance Code (the ‘Code’).
The NYSE listing standards require that US listed companies have a nominating or corporate governance committee composed entirely of Independent Directors and with a written charter addressing certain corporate governance matters. Applicable UK rules do not require companies without equity shares listed on the London Stock Exchange, such as the Company, to have a nominating committee. However, the Company has a Board Nomination Committee, which leads the process for Board appointments. This committee has written Terms of Reference setting out its role to identify and nominate candidates for Board and Board Committee appointments. The following Directors make up the Board Nomination Committee: Lord Burns, Ana Botín, Roy Brown, Bruce Carnegie-Brown (from 19 March 2013), Juan Rodríguez Inciarte and Rosemary Thorne. With effect from 1 January 2014, the membership of the Board Nomination Committee was refined to include Mike Amato, Alain Dromer and Scott Wheway. Of the nine current members of the Board Nomination Committee, Mike Amato, Roy Brown, Bruce Carnegie-Brown, Alain Dromer, Rosemary Thorne and Scott Wheway are Independent Non-Executive Directors in accordance with both the NYSE listing standards and the Code. The Code recommends that a majority of members of the Board Nomination Committee are independent. As a result of the membership refinements referred to above, the Committee satisfies this Code recommendation.
In addition, the Board is responsible for monitoring the effectiveness of the Company’s governance practices and making changes as needed to ensure the alignment of the Company’s governance system with current best practices. The Board monitors and manages potential conflicts of interest of management, Board members, shareholders, external advisors and other service providers, including misuse of corporate assets and abuse in related party transactions.
The NYSE listing standards require that US listed companies have a compensation committee composed entirely of Independent Directors and with a written charter addressing certain corporate governance matters. The Board Remuneration Oversight Committee was established with effect from 1 January 2010. Under its written Terms of Reference, this committee is primarily responsible for overseeing and supervising Santander UK’s policies and frameworks covering remuneration and reward. The Board Remuneration Oversight Committee composed of four Non-Executive Directors: Roy Brown (Chair), Bruce Carnegie-Brown, José María Carballo and Rosemary Thorne. José María Carballo ceased to be independent under the Code from 30 November 2013. With effect from 1 January 2014, Mike Amato, Alain Dromer and Scott Wheway joined the Board Remuneration Oversight Committee and José María Carballo and Rosemary Thorne stepped down as Committee members. All the five current members of the Board Remuneration Oversight Committee are Independent Non-Executive Directors in accordance with both the NYSE listing standards and the Code.
The NYSE listing standards and Rule 10A-3 under the US Exchange Act of 1934, as amended (the ‘Exchange Act’), require that US listed companies have an audit committee that satisfies the requirements of the Exchange Act, with a written charter addressing certain corporate governance matters, and whose members are all independent. As a wholly-owned subsidiary of a parent that satisfies the requirements of Rule 10A-3(c)(2), the Company is exempt from the requirements of Rule 10A-3. The Company does have a Board Audit Committee composed of four Non-Executive Directors: Rosemary Thorne (Chair), Roy Brown, José María Carballo (having ceased to be independent under the Code from 30 November 2013) and Bruce Carnegie-Brown. On 1 January 2014, Roy Brown and José María Carballo stepped down and Alain Dromer and Manuel Soto were appointed. Of the current four members of the Board Audit Committee, Bruce Carnegie-Brown, Alain Dromer and Rosemary Thorne are Independent Non-Executive Directors in accordance with both Rule 10A-3 and the Code. The Code recommends that at least three members of the Board Audit Committee are independent and the Committee satisfied this requirement throughout the year and continues to do so. However the scope of the Board Audit Committee’s Terms of Reference as well as the duties and responsibilities of such committee are more limited than that required of audit committees under the NYSE listing standards. For example, the Board Audit Committee does not provide an audit committee report as required by the NYSE listing standards to be included in the Company’s annual proxy statement. See ”Summary of Board, Board Committee and Executive Committee Responsibilities” in the Corporate Governance Report on p.169 for more information.
The NYSE listing standards require that US listed companies adopt and disclose corporate governance guidelines, including with respect to the qualification, training and evaluation of their Directors. The NYSE listing standards also require that the Board conducts a self-evaluation at least annually to determine whether it and its committees are functioning effectively. The Board has undertaken regular reviews of Board effectiveness primarily through an internal process led by the Chair. In 2013 the first external Board effectiveness review was conducted by Bvalco Limited, an external evaluator.
A Chief Executive Officer of a US company listed on the NYSE must annually certify that he or she is not aware of any violation by the company of NYSE corporate government standards. In accordance with NYSE listing rules applicable to foreign private issuers, our CEO is not required to provide the NYSE with such an annual compliance certification.
In addition, as a wholly-owned subsidiary of an NYSE-listed company, the Company is exempt from two NYSE listing standards otherwise applicable to foreign listed companies as well as US listed companies. The first requires the CEO of any NYSE-listed foreign company to notify promptly the NYSE in writing after any executive of the issuer becomes aware of any material non-compliance with any applicable NYSE corporate governance standards. The second requires NYSE-listed foreign companies to submit executed Written Affirmations annually to the NYSE.
| | |
| 352 | | Santander UK plc Annual Report 2013 |
Other Information for US Investors
Cross-reference to Form 20-F
| | | | | | | | |
Part I | |
1 | | Identity of Directors, Senior Management and Advisers | | | * | |
2 | | Offer Statistics and Expected Timetable | | | | | * | |
3 | | Key Information | | Selected Financial Data | | | 343 | |
| | | | Capitalisation and Indebtedness | | | * | |
| | | | Reasons for the Offer and use of Proceeds | | | * | |
| | | | | Risk Factors | | | 317 | |
4 | | Information on the Company | | History and Development of the Company | | | 2 | |
| | | | Business Overview | | | 3, 8 | |
| | | | Organisational Structure | | | 2 | |
| | | | | Property, Plant and Equipment | | | 49 | |
4A | | Unresolved Staff Comments | | | | | N/a | |
5 | | Operating and Financial Review and Prospects | | Operating Results | | | 25 | |
| | | | Liquidity and Capital Resources | | | 57, 53 | |
| | | | Research and Development, Patents and Licenses, etc | | | N/a | |
| | | | Trend Information | | | 10, 11, 14 | |
| | | | Off-Balance Sheet Arrangements | | | 52 | |
| | | | | Contractual Obligations | | | 52 | |
6 | | Directors, Senior Management and Employees | | Directors and senior management | | | 165 | |
| | | | Compensation | | | 185 | |
| | | | Board Practices | | | 171 | |
| | | | Employees | | | 192 | |
| | | | | Share Ownership | | | 198, 284 | |
7 | | Major Shareholders and Related Party Transactions | | Major Shareholders | | | 349 | |
| | | | Related Party Transactions | | | 191, 288 | |
| | | | | Interests of Experts and Counsel | | | * | |
8 | | Financial Information | | Consolidated Statements and Other Financial Information | | | 205 | |
| | | | | Significant Changes | | | 316 | |
9 | | The Offer and Listing | | Offer Listing and Details | | | * | |
| | | | Plan of Distribution | | | * | |
| | | | Markets | | | N/a | |
| | | | Selling shareholders | | | * | |
| | | | Dilution | | | * | |
| | | | | Expenses of the Issue | | | * | |
10 | | Additional Information | | Share Capital | | | * | |
| | | | Articles of Association | | | 350 | |
| | | | Material Contracts | | | 335 | |
| | | | Exchange Controls | | | N/a | |
| | | | Taxation | | | 349 | |
| | | | Dividends and Paying Agents | | | * | |
| | | | Statements by Experts | | | * | |
| | | | Documents on Display | | | 335 | |
| | | | | Subsidiary Information | | | N/a | |
11 | | Quantitative and Qualitative Disclosures about Market Risk | | | 122 | |
12 | | Description of Securities Other Than Equity Securities | | Debt Securities | | | * | |
| | | | Warrants and Rights | | | * | |
| | | | Other Securities | | | * | |
| | | | American Depositary Shares | | | * | |
Part II | | | | | | | | |
13 | | Defaults, Dividend Arrearages and Delinquencies | | | N/a | |
14 | | Material Modifications to the Rights of Security Holders and Use of Proceeds | | | N/a | |
15 | | Controls and Procedures | | Disclosure Controls and Procedures | | | 194 | |
| | | | Management’s Annual Report on Internal Control over Financial Reporting | | | 194 | |
| | | | Attestation Report of the Registered Public Accounting Firm | | | N/a | |
| | | | | Changes in Internal Control Over Financial Reporting | | | 194 | |
16A | | Board Audit Committee Financial Expert | | | | | 175 | |
16B | | Code of Ethics | | | | | 193 | |
16C | | Principal Accountant Fees and Services | | | | | 236 | |
16D | | Exemptions from the Listing Standards for Board Audit Committees | | | N/a | |
16E | | Purchases of Equity Securities by the Issuer and Affiliated Purchasers | | | N/a | |
16F | | Change in Registrant’s Certifying Accountant | | | N/a | |
16G | | Corporate Governance | | | 170 | |
Part III | | | | | | | | |
17 | | Financial Statements | | | | | N/a | |
18 | | Financial Statements | | | | | 205 | |
19 | | Exhibits | | | | | Filed with SEC | |
| * | Not required for an Annual Report. |
| | |
| Santander UK plc Annual Report 2013 | | 353 |
SIGNATURE
The registrant hereby certifies that it meets all the requirements for filing on Form 20-F and that it has duly caused and authorized the undersigned to sign this annual report on its behalf.
SANTANDER UK plc
| | |
| By: | | /s/ Ana Botín |
| | Ana Botín |
| | Chief Executive Officer |
Dated: 7 March 2014
EXHIBIT INDEX
| | |
| Exhibits1 | | |
| |
| 1.1 | | Articles of Association of Santander UK plc (incorporated by reference to Santander UK plc’s Form 6-K furnished with the Securities and Exchange Commission on 10 March 2010) |
| |
| 7.1 | | Statement of ratio of earnings to fixed charges2 |
| |
| 8.1 | | List of Subsidiaries of Santander UK plc |
| |
| 12.1 | | CEO Certificate pursuant to Section 302 of the Sarbanes-Oxley Act of 2002 |
| |
| 12.2 | | CFO Certificate pursuant to Section 302 of the Sarbanes-Oxley Act of 2002 |
| |
| 13.1 | | Certificate pursuant to Section 906 of the Sarbanes-Oxley Act of 2002 |
| |
| 15.1 | | Consent of Deloitte LLP2 |
| 1 | Documents concerning Santander UK plc referred to within the Annual Report on Form 20-F 2013 may be inspected at 2 Triton Square, Regent’s Place, London NW1 3AN, the principal executive offices and registered address of Santander UK plc. |
| 2 | Incorporated by reference into Registration Statement Nos. 333-190509, 333-10232 and 333-11320 on Forms F-3. |