Table of Contents
UNITED STATES
SECURITIES AND EXCHANGE COMMISSION
WASHINGTON, D.C. 20549
FORM 10-K
(Mark One)
| x | ANNUAL REPORT PURSUANT TO SECTION 13 OR 15(d) OF THE SECURITIES EXCHANGE ACT OF 1934 |
For the Fiscal Year Ended December 31, 2010
OR
| ¨ | TRANSITION REPORT PURSUANT TO SECTION 13 OR 15(d) OF THE SECURITIES EXCHANGE ACT OF 1934 |
For the Transition Period from to .
Commission File No. 000-26937
QUEST SOFTWARE, INC.
(Exact Name of Registrant as Specified in its Charter)
| Delaware | 33-0231678 | |
(State or Other Jurisdiction of Incorporation or Organization) | (I.R.S. Employer Identification No.) | |
5 Polaris Way Aliso Viejo, California | 92656 | |
| (Address of Principal Executive Offices) | (Zip Code) | |
Registrant’s Telephone Number, Including Area Code: (949) 754-8000
Securities Registered Pursuant to Section 12(b) of the Act:
Title of Each Class | Name of Exchange on Which Registered | |
| Common Stock | The Nasdaq Stock Market LLC | |
| (Nasdaq Global Select Market) |
Securities Registered Pursuant to Section 12(g) of the Act: None
Indicate by check mark if the registrant is a well-known seasoned issuer, as defined in Rule 405 of the Securities Act. Yes ¨ No x
Indicate by check mark if the registrant is not required to file reports pursuant to Section 13 or Section 15 (d) of the Act. Yes ¨ No x
Indicate by check mark whether the Registrant: (1) has filed all reports required to be filed by Section 13 or 15(d) of the Securities Exchange Act of 1934 during the preceding 12 months (or for such shorter period that the Registrant was required to file such reports), and (2) has been subject to such filing requirements for the past 90 days. Yes x No ¨
Indicate by check mark whether the Registrant has submitted electronically and posted on its corporate Web site, if any, every Interactive Data File required to be submitted and posted pursuant to Rule 405 of Regulation S-T (§232.405 of this chapter) during the preceding 12 months (or for such shorter period that the registrant was required to submit and post such files). Yes x No ¨
Indicate by check mark if disclosure of delinquent filers pursuant to Item 405 of Regulation S-K (§229.405 of this chapter) is not contained herein and will not be contained, to the best of Registrant’s knowledge, in definitive proxy or information statements incorporated by reference in Part III of this Form 10-K or any amendment to this Form 10-K. ¨
Indicate by check mark whether the Registrant is a large accelerated filer, an accelerated filer, a non-accelerated filer or a smaller reporting company. See the definitions of “large accelerated filer,” “accelerated filer” and “smaller reporting company” in Rule 12b-2 of the Exchange Act.
| Large accelerated filer | x | Accelerated filer | ¨ | |||
| Non-accelerated filer | ¨ (do not check if a smaller reporting company) | Smaller reporting company | ¨ |
Indicate by check mark whether the Registrant is a shell company (as defined in Rule 12b-2 of the Exchange Act). Yes ¨ No x
The aggregate market value of the voting stock held by non-affiliates of the Registrant was approximately $1.1 billion as of June 30, 2010, based upon the closing sale price reported for that date on The Nasdaq Global Select Market.
As of February 10, 2011, 93,151,561 shares of the Registrant’s common stock were outstanding.
Documents Incorporated by Reference
Portions of the Registrant’s Definitive Proxy Statement, to be delivered to stockholders in connection with the Registrant’s 2011 Annual Meeting of Stockholders, are incorporated by reference into Part III of this Report.
Table of Contents
ANNUAL REPORT ON FORM 10-K
TABLE OF CONTENTS
2
Table of Contents
Discussions under the captions“Business,” “Risk Factors,” and“Management’s Discussion and Analysis of Financial Condition and Results of Operations” and other parts of this Annual Report on Form 10-K include or may include forward-looking statements within the meaning of the federal securities laws. We have based these forward-looking statements on currently available information and our current beliefs, expectations and projections about future events. All forward-looking statements contained herein are subject to numerous risks and uncertainties. Our actual results and the timing of certain events could differ materially from those projected in the forward-looking statements due to a number of factors including those discussed under the heading“Risk Factors” in this Report and in our other filings with the Securities and Exchange Commission (“SEC”). Should one or more of these risks or uncertainties materialize, or should the underlying estimates or assumptions prove incorrect, actual results or outcomes may vary significantly from those suggested by forward-looking information. Any forward-looking statements contained in this document are based on information available at the time of filing and we make no undertaking to update any of these forward-looking statements.
PART I
| Item 1. | Business |
Quest Software, Inc. (“Quest,” “Quest Software,” the “Company,” “we,” “us” or “our”) designs, develops, markets, distributes, and supports enterprise systems management software products. Our goal is to provide our customers with systems management products that improve the performance, productivity and reliability of their software applications and associated software infrastructure components such as databases, application servers, operating systems, and virtual environments. Quest is an “Independent Software Vendor,” or “ISV,” a company whose products are designed to support or to interact or interoperate with other vendors’ software or hardware platforms. As such, we continually strive to innovate and evolve our product portfolio to support the dynamic nature of our markets, as well as those of our customers’ IT environments. Our success has been predicated on identifying large and evolving markets, developing and acquiring new products and technologies, and then leveraging our sales organization and installed base of customers to further our growth. While the Company began as a provider of software tools and solutions for the Oracle database market, which we call our Database Management market, we subsequently expanded our offerings into other adjacent markets such as Application Management, Windows Management, and Virtualization Management. As embodied in our slogan, “Simplicity at Work,” we seek to provide IT management software that is simple to use, saving our customers time and money across physical, virtual and cloud environments.
We generate revenues by licensing our software products, principally on a perpetual basis. In addition to perpetual software licenses, we sell a small amount of time-based software licenses (or term licenses) wherein customers pay a single fee for the right to use the software and receive maintenance for a defined period of time. We also provide support, maintenance and implementation services for these products. As such, our reportable operating segments are Licenses and Services. The Licenses segment develops, and markets and sells licenses to use, our software products. The Services segment provides post-sale support for software products, and fee-based training and consulting services related to our software products. We have a large product portfolio of high-value products that includes very technically complex solutions focused on improving the management and performance of mission-critical software applications and the underlying component infrastructure. We also have volume products and software tools that enable our customers to reduce capital and operating expenditures or leverage existing investments in personnel and IT systems. Our active acquisition program is an important element of our corporate strategy and has served as a mechanism to broaden our product portfolio and enter new markets. This is evidenced by our entrance into the Application Management, Windows Management, and Virtualization Management markets, through a series of acquisitions which served to propel the Company beyond its Database Management roots. Within the last five fiscal years, we have invested approximately $389.2 million, in the aggregate, to acquire 19 companies. Our acquisition strategy is directed at broadening our product portfolio and strengthening our competitive position against both direct competitors and the continual improvements made by the platform vendors. We believe that acquisitions completed in 2010 have contributed to Quest’s position as a leading independent software vendor in the Virtualization space.
3
Table of Contents
Our primary portfolio of software products includes software solutions grouped into four categories: 1) Application Management, 2) Database Management, 3) Windows Management, and 4) Virtualization Management. Examples of the benefits delivered by our products’ include:
| • | improved application and database performance for large-scale, complex, mission-critical type systems |
| • | the ability to manage multi-tiered heterogeneous operating environments with integrated dashboards and metrics to leverage existing investments and support new technologies |
| • | comprehensive migration, management and integration capabilities to simplify, automate and secure an organization’s Windows infrastructure |
| • | solutions for business continuity, high availability and disaster recovery for virtualized infrastructure environments |
Application Management is a core competency and is predicated on ensuring performance and availability of mission-critical applications throughout their life cycle. We have made significant investments in the form of hiring experienced developers, product managers and others with marketing expertise to improve and broaden our suite of solutions for Application Management, and our aforementioned acquisition program. Our products are focused on the monitoring and performance management of customers’ primary enterprise software applications, whether packaged or custom developed. These applications are complex in that they traverse every layer of the IT stack including storage, databases, application servers, web servers and the actual network itself, all of which adds to the complexity of managing this environment. Historically, the management of these applications was isolated among each physical layer of the technology stack. As applications themselves became modular over time and our customers’ need to improve application service levels became a market requirement, we embarked on a comprehensive research and development (“R&D”) effort to build new product solutions to unify a set of existing tools and create new functionality to support the current customer demand profile. Today, customers require a solution which not only manages application service levels and helps diagnose the root causes of performance problems, but also integrates and supports the means to provide necessary corrective action. Our success within the market, and current strategic focus for building increased capabilities, is based upon the fact that packaged and custom-developed applications run within multi-vendor infrastructure environments. This means that customers have a myriad of platforms and investments they have deployed over the years, and require tools that manage the breadth and depth of their environments. Today, the advent of virtualization management has created another facet in which an IT professional charged with managing this infrastructure must rely on a set of tools and solutions to ensure performance levels of the application. Our flagship Foglight® solution provides functionality that enhances visibility for an administrator who may be working within an environment encompassing both physical and virtual applications running concurrently. From a breadth perspective, our products manage custom web-based applications written in Java and .NET, as well as packaged applications like PeopleSoft, Oracle E-Business Suite and SAP. From a depth perspective, our products cover key databases such as Oracle, DB2 and SQL Server, as well as Oracle and IBM application servers and all key web servers in today’s market. In 2009, we expanded our solution with the acquisition of PacketTrap Networks to encompass the network layer via the Perspective product line. By integrating network level with application-aware monitoring for our customers, we are able to provide a comprehensive view of performance, capturing activity throughout the key elements of the infrastructure. In May 2010, Quest was named a leader in the Gartner Magic Quadrant for Application Performance Monitoring, a distinction that was driven by Foglight.
Database Management is a market in which we initially built an industry-leading reputation, and today continues to represent a core technical strength for Quest. Our Database portfolio has gained wide acceptance in the market and continues to generate a significant amount of cash flow for the Company. While applications become more complex, so does the challenge of developing, architecting, monitoring, and optimizing the back-end database tier. Architectural complexity is only part of the problem. Ever-increasing data volumes require more database instances, and in the vast majority of datacenters, those databases are heterogeneous (Oracle, SQL Server, DB2, Sybase, MySQL, etc.) New database technologies such as “NoSQL” databases, Cloud Databases, and Hadoop, are also disrupting the status-quo of relational databases that we have seen for nearly two decades. From an infrastructure perspective, Database Administrators (DBAs) are being asked to manage more than ever before, but all of this diversity and sprawl ultimately must be orchestrated to support a business service. Therefore, to be successful in this complex environment, a vendor must offer a broad toolset not only for the database domain specialists, but one that also tightly integrates with other aspects of the entire application architecture. Our main competition is the traditional platform vendors themselves. As they compete against each other, they will often release
4
Table of Contents
capabilities that were previously available only in third-party tools. When the vendors release such capabilities, it negatively impacts our ability to continue to grow license revenue, which requires us to constantly evolve our strategy. Specifically, we have implemented a four-pronged approach to continue our dominance in this market in light of pressure from the platform providers. First, as stated, we offer support across a heterogeneous environment allowing customers to avoid lock-in by a single vendor and also maximize the efficiency of their current employees. Second, we focus on several customer personas ranging from DBA, to Developer, to Data Analyst. Third, we have moved into adjacent markets, most notably the Business Intelligence space, where Data Analysts were already using our traditional offerings. Fourth, we have demystified new database technologies with products that allow traditional database users to quickly experiment and leverage the power of these new offerings. This strategy allows us to solve the pressing issues of today and also bridge customers into the technologies of tomorrow.
Our Windows Management product portfolio has been one of the key drivers of our revenue growth during the last few years. Our portfolio of products has been built by both internal development and key acquisitions such as FastLane Technologies, Inc., Aelita Software Corporation, ScriptLogic Corporation, NetPro Computing, Inc., and, in 2010, Völcker Informatik AG. Our Windows Management products are focused within five areas of the Microsoft infrastructure including Active Directory, Exchange, Windows Server, SharePoint, and the Windows desktop. Our strategy has been to identify opportunities within this framework, and to create incremental value-add products which broaden the core functionality a customer receives “out of the box.” A portion of our product portfolio is focused on assisting customers in the migration process from one platform to the next within the Windows infrastructure, but we also help customers migrate from non-Windows platforms to the associated Windows platform. For example, our migration products can assist an IT professional in moving his or her firm’s resources to the current version of Active Directory to take advantage of new features from Microsoft that were not present in an earlier version of Active Directory, or from another directory-based product to a current Active Directory platform. Another portion of our portfolio is targeted at IT professionals who manage the core elements of the Windows infrastructure such as Windows Server, Exchange, Active Directory and SharePoint, and is predicated on providing incremental management capabilities to streamline administration, increase system availability, optimize storage, and enhance security. The acquisition of ScriptLogic in August 2007 added core products to support desktop management, including the centralized configuration and management of an end user’s environment, software inventory, and application deployment and remote administration, to allow the administrator the ability to manage his or her enterprise desktops in an efficient manner. In September 2008, we acquired NetPro Computing, Inc., an Active Directory management and administration tools vendor, and subsequently integrated its operations into our Windows Management operations to expand our customer footprint and broaden and enhance our portfolio of solutions. In 2010, we acquired Völcker Informatik AG, a Germany-based company specializing in the management of user identities, access privileges and security across multiple applications and systems. The integration of Völcker’s ActiveEntry with our Quest® One Identity Solution extends the One Identity Solution product portfolio, adding stronger user and resource provisioning, self-service and workflow capabilities that simplify identity and access management (“IAM”).
Our Virtualization Management product portfolio was built initially through our investment in Vizioncore during 2005, and supplemented by our acquisitions of Invirtus and Provision Networks during 2007. In December 2007, we acquired the remaining minority interest in Vizioncore, and, in 2010, fully integrated Vizioncore into Quest. In August 2010, recognizing that cloud automation is the next evolution of virtualization, we expanded our virtualization management capabilities by completing the acquisition of Surgient, Inc., a leader in private cloud automation software. In January 2011, we acquired BakBone Software, a leading provider of heterogeneous data protection technologies, to complement our data protection portfolio, particularly in the areas of virtual server backup and recovery. As Virtualization Management continues to be more broadly deployed within production servers and the datacenter, and enterprises increasingly turn to the cloud to automate IT administration tasks, the need to manage virtual and cloud environments becomes more critical. As with a physical infrastructure, the operational requirements and administration of virtual platforms have resulted in the need for Virtualization Management tools, thereby creating product categories for virtualization utilities, disaster recovery, application monitoring and virtual desktop infrastructure. Similarly, the increased use of cloud platforms is driving the need for enterprise-class cloud automation and management technologies. The taxonomy of the Virtualization Management market is following previous paths, where platform companies created the delivery mechanism and partnered with other third-party vendors, such as Quest, to support their platform. Today, the platform market leader is VMware, but companies like Microsoft and Citrix/Xensource also have entered the virtualization market, so the need has grown for “cross-platform” tools
5
Table of Contents
that support such datacenter requirements as provisioning, monitoring, reporting, disaster recovery, and the typical functions found in today’s physical environment. Virtualization is our fastest growing business and, with the integration of Vizioncore and acquisition of Surgient, Quest is now a market leader in virtualization management, with solutions that span server virtualization, desktop virtualization, and cloud automation, and support multiple hypervisor platforms.
We invest a significant portion of our cash flow into our product development and management capabilities, and just over one-third of our employees work in product development, quality assurance or technical documentation roles. Given the need for many of our products to perform across different combinations of existing infrastructure within our customers’ IT configurations, we spend a significant amount of our R&D efforts to ensure that our products work consistently within heterogeneous IT environments. For example, a particular customer that deploys an Oracle financial application on an Oracle application server with an Oracle database will generally get different performance characteristics than another customer that deploys the same application on an IBM application server with a DB2 database. We test, evaluate and build capabilities within our products that help our customers manage these subtle differences, and this requires an extended effort to capture the potential and associated combinations and permutations of our customers’ infrastructures. A large proportion of our R&D organization supports and develops existing product lines. As we increasingly seek new product opportunities within emerging markets, we have, at times, successfully leveraged our expertise from current products. An example of this is our entrance into the SharePoint market with products that share technical aspects found in a few of our other products. In other instances where time to market is essential, we have supplemented our own technical efforts with technology and products from acquired companies. For example, key technology components of our vFoglight® Virtualization Management capabilities were derived from the inter-relationship between the Vizioncore and Quest R&D teams.
In building our products, we stress technical innovation and depth; ease of deployment; ease of use; and tangible, readily articulated and measurable customer benefits. We sell our products primarily via our direct field sales force and, increasingly, our telesales organization, supplemented by indirect sales through resellers and distributors. We are a global company with offices located throughout the world.
We were incorporated in California in 1987 and reincorporated in Delaware in 2009. Our principal offices are located at 5 Polaris Way, Aliso Viejo, California, 92656. We operate on a calendar fiscal year.
Solutions, Products and Services
Solutions
We develop innovative products that increase the performance of applications, databases and infrastructure, and improve the productivity of the people who manage them, enabling customers to solve some of today’s toughest IT challenges. IT organizations today rely on Quest to help achieve compliance, manage complex applications and simplify identity management.
Products
We market products grouped along four main categories: 1) Application Management, 2) Database Management, 3) Windows Management and 4) Virtualization Management. Major products in these categories are described as follows.
Application Management
Our Application Management products are geared to support the spectrum of professionals all the way from the Java application developer to the CIO. The primary focus of these products is to automate the tasks performed by the IT organization to manage the complexity of the application lifecycle. Our flagship product for Application Management is Foglight, while our Stat®, JClass®, PerformaSure® and JProbe® products – the latter three focused on Java applications – comprise the remainder of our offerings.
Foglight® is an enterprise-class solution providing true 24x7 monitoring, custom threshold alerts and automated optimization. Our solution portfolio includes Foglight monitoring for the Oracle, SQL Server, DB2, and Sybase databases, as well as Foglight Performance Analysis for Oracle and Foglight Performance Analysis for SQL Server, which provide consolidated, integrated views to perform deep diagnostics and intelligent analysis, track changes, and enable root-cause detection of performance concerns in Oracle and SQL Server databases. Foglight is an industry-leading Application Performance Monitoring solution that provides a complete view of applications to proactively detect and diagnose the root
6
Table of Contents
cause of performance and availability problems in a priority that makes sense to the business. Foglight correlates relationships from multiple sources and maps the metrics into a dashboard, providing the IT user with an understanding of how performance and availability of services are impacting the business, as well as what the end user is experiencing. It accomplishes this by depicting the technology contributing to application performance issues and availability, including the database and both the physical and virtual infrastructures running behind the scenes. Our Foglight portfolio serves Active Directory, Exchange, Oracle, and SQL Server, and also includes Foglight Network Management System (“Foglight NMS”), a comprehensive, robust network management and application monitoring solution for end user IT departments.
Stat ACM (Application Change Management) helps IT managers lower their PeopleSoft and Oracle E-Business Suite total cost of ownership by providing end-to-end change management and version control. It helps keep up with change configurations and customizations so that they are updated, approved and deployed to instances throughout the application implementation lifecycle. By tracking version control and versioning capabilities as well as process management, change request tracking, requirements management, and distributed development support, Stat ACM adds visibility, hides complexity and automates workflow through an easy-to-use GUI (graphical user interface) environment.
JClass helps build Java standard and enterprise applications quickly and easily, offering Java and web developers world-class versions of the components required by many internal and customer-facing applications, such as charts, tables, reporting and printing.
PerformaSuredelivers deep-level application performance diagnostics spanning the Java technology stack. It combines transactional data with infrastructure metrics to help development and QA teams measure and analyze Java enterprise application performance. PerformaSure integrates with JProbe to support performance testing and tuning down to the line of code.
JProbeis an enterprise-class Java profiler which provides intelligent diagnostics on memory usage, performance and test coverage, allowing developers to pinpoint and repair the root cause of application code performance and stability problems that obstruct component and integration integrity.
Database Management
A company’s database management systems represent some of the most complex and critical components within its infrastructure. As companies broaden their utilization of databases from multiple platform vendors, database administrators and developers are required to learn to use non-integrated toolsets across their environment to manage the performance and complexity of this tier. Our market leading database management products support the needs of today’s database developers and DBAs by providing superior domain capabilities and cross-platform productivity tools within an integrated console, to improve database quality and performance.
Database Development These tools improve the productivity and capability of database developers working in the Oracle Procedural Language (“PL”)/SQL environment. The primary products in this product family are TOAD® and SQL Navigator®. We provide a complete and integrated development environment for coding stored procedures, schemas and SQL scripts from one intuitive graphical user interface. Debugging, SQL tuning, change analysis, and general administration features improve the quality and performance of database applications before they enter production.
SharePlex® provides real-time replication of Oracle databases for customers who need to ensure that a current, secondary copy of their transactional Oracle database is available if the primary database is unavailable. Many customers use SharePlex to offload management reporting, so the activity no longer compromises the performance of transaction processing. Further, SharePlex is also frequently used to eliminate end user disruption by providing continuous access to data during the migration of operating systems, hardware platforms and major application releases.
Quest® LiteSpeed®for SQL Serveroffers significant benefits to database administrators responsible for managing Microsoft SQL Server databases, including reduced backup times, dramatically lowered storage costs and improved database recoverability. LiteSpeed for SQL Server works by compressing data in significantly less time than other backup solutions; its LiteSpeed for SQL Server backup engine compresses data up to 95%, in half the time required by other backup solutions. LiteSpeed speeds up restore times through its ability to recover individual database objects and encapsulate complete database restores into a single file.
7
Table of Contents
Windows Management
Microsoft applications and their associated infrastructure platform continue to be a global standard. Our products enable IT personnel to simplify, automate and secure their infrastructure with management, migration and integration capabilities for this environment. Our products are focused on key elements of the infrastructure including Microsoft’s Active Directory, Exchange, Windows Server, SharePoint and the Windows desktop. Our Windows Management products include:
Quest® Managementfor Active Directory Microsoft Active Directory is technically complex and requires meticulous management to ensure the accuracy and security of its content across the entire enterprise. Quest Management for Active Directory is a set of products that provide diagnostics, recovery, detailed auditing, group policy management, reporting, self-service, role-based delegation, and user provisioning. Our products offer a practical approach to automated user provisioning, and provide a comprehensive delegation model, consolidated reporting and auditing, and expert advice on problem resolution for teams managing complex Microsoft infrastructures.
Quest® Managementfor ExchangeE-mail growth is leading to increased traffic, storage and support issues, including compliance. Quest Management for Exchange provides a comprehensive set of tools to migrate, store, recover and intelligently manage growth and the related spending for mission-critical Exchange infrastructures. Our products enable mailbox and public folder management, distribution list management, usage analysis, and diagnostics to optimize investment and performance in Exchange environments. This allows administrators and managers to better target investments, enforce corporate policies, enhance customer service, reduce administrative costs, and improve troubleshooting efficiency. Additional functionality and integration is available for customers who have chosen Microsoft Operations Manager (“MOM”) as their unattended monitoring solution.
Quest® Migration Suitefor Active DirectoryThe Quest Migration Suite for Active Directory is a ZeroIMPACT™ solution for planning and executing migration projects to Active Directory from Windows NT or Novell NDS. It supports thorough migration planning and Active Directory pruning and grafting – with no interruption to business workflow. The suite’s distributed processing and robust project management features simplify migration processes.
Quest® Migration Suitefor ExchangeThe Quest Migration Suite for Exchange is a ZeroIMPACT solution for assessing and executing migration projects from early versions of Exchange to Exchange 2003/2007/2010. The suite provides centralized project management, and is equipped with robust analysis and reporting tools to ensure a seamless migration process.
Quest® One Identity SolutionThe Quest One Identity Solution provides a full spectrum of authentication, authorization, administration, and compliance solutions to help organizations simplify identity and access management and address these challenges.
Quest® Notes Migratorfor SharePoint enables organizations to migrate standard or complex/custom Lotus Notes, QuickPlace and Domino.Doc applications to SharePoint lists, pages, InfoPath, or Word documents. It allows organizations to accelerate conversions by consolidating similar applications and automating the reuse of development work and migration jobs. Notes Migrator for SharePoint can migrate advanced SharePoint features such as content types, managed metadata, document sets, and InfoPath list forms, requiring minimal development resources for organizations, and reducing overall project costs.
Quest® Migration Managerfor SharePoint enables organizations to reorganize, deploy, consolidate and migrate SharePoint content from legacy versions of SharePoint to SharePoint 2010. It also provides the tools to effectively reorganize SharePoint 2007 site structure to streamline information access, optimize content storage, enhance recovery time objectives, and better prepare for upgrades. Migration Manager helps minimize impact on the production systems and end users by scheduling resource-intensive migration tasks for off-peak hours.
Quest® InTrust® offers auditing and policy compliance to help systems administrators securely collect, store, report and alert on event data from Windows, Unix and Linux systems to meet the needs of external regulations, internal policies and security best practices.
Quest® Authentication Servicesenables organizations to extend the security and compliance of Active Directory to Unix, Linux, and Mac platforms, as well as to many enterprise applications. It addresses the compliance need for cross-platform access control, the operational need for centralized authentication and single sign-on, and enables the unification of identities and consolidation of directories for simplified identity and access management.
ScriptLogic® Desktop Authority® centralizes control over the desktop, combining into one comprehensive solution the functionality to integrate configuration, inventory, reporting, patch management, anti-spyware, device lockdown, power management, and remote management.
8
Table of Contents
Virtualization Management
Our Virtualization Management products span server virtualization, desktop virtualization, and cloud automation, supporting multiple hypervisor platforms to help companies safeguard and optimize their virtual and cloud environments. Our products support essential IT strategies including business continuity, high availability, disaster recovery, and desktop, data protection, and application lifecycle management. Our Virtualization Management products include:
Quest® vFoglight is a cross platform monitoring tool that provides real-time and historical monitoring and performance management for virtual environments. In addition to powerful virtual infrastructure monitoring, capacity planning, and Hyper-V and VMware management, vFoglight provides a chargeback solution for the VMware ESX Server environment to apportion those costs to virtual machines based on utilization.
Quest® vRanger® Pro provides full, incremental and differential ESX and ESX(i) backup for virtualized environments.
Quest® vWorkspace is a virtual desktop management platform that manages, secures and provisions virtual desktop environments, and brokers connections. It delivers virtual applications and desktops from multiple hypervisors, Remote Desktop Session Hosts (Terminal Servers) and blade PCs through a single user access point and management center.
Quest® Cloud Automation Platform is a solution for creating and managing private enterprise clouds, enabling organizations to rapidly create flexible and robust infrastructure-as-a-service (IaaS) private clouds and reduce administrative workloads. It automates infrastructure delivery, eliminates virtual machine sprawl, and scales to accommodate environments ranging from individual departments to the global enterprise.
Quest® vOptimizer Pro and Quest® vOptimizer WasteFinder are virtual storage management solutions that help IT organizations manage capacity and reclaim over-allocated virtual machine storage.
Services
Customer Support Services (Maintenance)
A high level of product maintenance and technical support services is critical to the successful marketing and sale of our products and the development of long-term customer relationships. We have a reputation for providing a high level of global customer support, and believe that this is a competitive differentiator. Initial enrollment in our customer support program for one year is bundled with a sale of a software license, and entitles a customer to problem resolution services, new functional enhancements of a product, and ongoing compatibility with new releases of the database, application or other platforms supported by the product; annual renewals are offered thereafter. We also offer multi-year support. Customer support is provided domestically through our offices in Aliso Viejo, and internationally through our offices in Europe, Canada and Singapore. We also offer SupportLink, a customer portal on our website, www.quest.com, where customers can find product information and downloads, answers to questions, video tutorials, access to our various Quest communities, and many other support-related resources.
Consulting and Training Services
Our consulting and training services include pre- and post-sales consulting, as well as education and training. Our consulting services include a wide range of offerings such as assistance with optimization; migration; simplifying an infrastructure or increasing its responsiveness; and installation and systems integration for the rapid deployment of Quest products. We offer our consulting and training services with the initial deployment of our products, as well as on an ongoing basis to address the continuing needs of our customers. Our consulting and training services staff is located throughout the Americas, Europe and APAC, enabling us to perform installations and respond to customer demands rapidly across our global customer base.
We also have relationships with resellers, professional service organizations and system integrators including Accenture, Avanade, IBM and others, which include participation in the deployment of our products to customers. These relationships help promote Quest products and provide additional technical expertise that enables us to provide the full range of consulting and training services our customers require to deploy our products.
9
Table of Contents
We offer product education courses to train our business partners and customers on the implementation and use of our products. Product training is provided at our headquarters, online and at customer sites, as well as other regional and international locations.
Sales, Marketing and Distribution
We market and sell our products and services worldwide primarily through our direct sales organization, our telesales organization and, increasingly, via indirect sales channels with a group of value added resellers (“VARs”) and distributors. Given the nature of our sales model and product price points, we generally transact significant sales volume at the end of a quarter, with the largest amount of the yearly volume occurring during the fourth quarter. However, our government business typically operates within a timeline concurrent with the government budget, whereby we see the most significant impact during the third quarter. At December 31, 2010, we had 1,384 full-time sales and marketing employees, of whom 734 were full-time, sales representatives. We have 313 pre-sales systems engineers who work with our field sales teams to provide technical assistance and demonstrations to sales prospects. We have continued to invest in this area, and have supplemented our direct sales organization with an indirect sales channel that includes companies such as Dell and IBM, in addition to resellers focused on governmental business. This activity requires broad-based programs to recruit, manage and expand our support operations to grow these relationships. We also employ local resellers in certain international territories not covered by our local sales offices.
We have sales offices in many major cities of the United States, Europe, Asia and Australia to facilitate close contact between current and potential customers and our field sales organization. Sales that originate outside of the United States are generally denominated in the foreign currency of the country of origin. As such, we have exposure to fluctuations in foreign exchange rates, which for the year ending December 31, 2010 contributed approximately $1.7 million to our overall increase in total revenues, when comparing 2010 rates to 2009.
Our marketing efforts are designed to create awareness, generate leads, and assist the worldwide sales organization with converting leads into closed sales. Marketing initiatives and programs focus on how Quest products address critical issues facing today’s IT buyers. We use a full complement of marketing vehicles including industry trade shows and conferences, user groups and discussion forums, educational white papers and technical briefs, electronic and print advertising, webcasts, electronic direct marketing, and online advertising. Strategic and channel partners often assist us with the development, funding and execution of our marketing programs. Targeted campaigns and sales programs are developed based on objective, audience and product mix, and are executed in our regions around the world to maximize revenue opportunities as quickly as possible.
For information regarding our segment revenue and revenue by geographic area, please refer to Note 3 – Geographic and Segment Reporting of our Notes to Consolidated Financial Statements.
We believe that strong research and product development capabilities are essential to enhancing our core technologies and developing additional products. Quest products typically exhibit innovative capabilities, strong product engineering and rich user interfaces. Our commitment to ongoing product development is reflected in our investments in R&D, which were $151.9 million, $144.4 million and $153.5 million for the years ended December 31, 2010, 2009 and 2008, respectively. We have actively recruited key software engineers and developers with expertise in the areas of Oracle technologies, Java, Microsoft infrastructure technologies, ERP, Virtualization, and CRM systems. We have also built up these competencies through acquisitions. In addition to the U.S., we have significant product development operations in Canada, Australia, Russia, Israel and China. Our internal R&D is supplemented by our acquisition strategy, which is focused primarily on young enterprises with recently developed and in-process technologies.
The market for enterprise systems management solutions is intensely competitive and characterized by rapidly changing technology and evolving standards. We expect competition to continue to increase both from existing competitors and new market entrants. We believe that our ability to compete effectively depends on many factors, including:
| • | the ease of use, performance, features, price, and reliability of our products as compared to those of our competitors |
| • | the value proposition of our products in terms of return on investment and/or reduced cost of ownership |
10
Table of Contents
| • | the timing and market acceptance of new products and enhancements to existing products developed by us and our competitors |
| • | the quality of our customer support |
| • | the effectiveness of our sales and marketing efforts |
We compete, in some instances, with the platform vendors of databases, applications, infrastructure, and other systems our products are designed to support. If these vendors include similar or equivalent functionality relative to our software as standard features of their underlying product, our revenues could be adversely affected. For example, competition with Oracle over the last several years has materially reduced license revenues generated by certain of our Database Management products including SharePlex®, and has negatively impacted the growth rate of license revenues associated with our Oracle Database Development tools. Microsoft has continually upgraded the functionality of its platform offerings, which we believe will increase competitive pressure for our products in the future.
We also compete with other vendors of database, application, windows, and virtualization management tools. Public and private companies with whom we compete include:
| • | Oracle, BMC Software and CA in the database management product area |
| • | IBM/Tivoli, Hewlett Packard/Mercury, CA, Compuware, and BMC Software in the application management product area |
| • | Symantec and NetIQ in the Windows management product area |
| • | VMware and Citrix in the virtualization management product area |
Some of our competitors and potential competitors have greater name recognition; a larger installed customer base company-wide; and significantly greater financial, technical, marketing, and other resources than we do. Competitors may also be able to respond more quickly to new or emerging technologies and changes in customer requirements, or devote greater resources to the development, promotion and sale of their products than we can.
Because there are relatively low barriers to entry in the software market, we may encounter additional competition as other established and emerging companies enter our field and introduce new products and technologies. Venture capitalists and others have funded numerous systems management companies. Accordingly, it is likely that new competitors or alliances among current and new competitors will emerge and see their offerings rapidly gain acceptance.
There can be no assurance that we will be able to compete successfully against current and future competitors. Increased competition could result in price reductions, fewer customer orders, reduced gross margins, and loss of market share, any of which could materially affect our business, operating results or financial condition.
We have experienced seasonality in our orders and revenues. We typically achieve the highest levels of orders and revenues for the year in the fourth quarter, which levels are usually higher than we achieve in the first quarter of the following year. However, our government business typically operates within a timeline concurrent with the government budget, whereby we see the most significant impact during the third quarter. We believe that, in general, historical seasonality results primarily from the budgeting cycles of our customers, which typically are higher in the third and fourth quarters and, to a lesser extent, from the structure of our sales commission program. In addition, the tendency of some of our customers to wait until the end of a fiscal quarter to finalize orders has resulted in higher order volumes towards the end of the quarter. These factors, combined with the relatively fixed nature of our expenses, leads to seasonality of net income. We expect this seasonality to continue in the future.
We rely on a combination of patents, copyrights, trademarks, service marks, trade secret laws, and contractual restrictions to establish and protect proprietary rights in our products and services. The source code for our products is protected both as a trade secret and as an unpublished copyrighted work. Despite our precautions, it may be possible for a third party to copy or otherwise obtain and use our products or technology without authorization. In addition, the laws of various countries in which our products may be sold may not protect our products and intellectual property rights to the same extent as the laws of the U.S. Our competitors may independently develop technologies that are substantially equivalent or superior to our technology. Refer to Note 16 – Commitments and Contingencies of our Notes to Consolidated Financial Statements for discussions on patent litigation.
11
Table of Contents
We rely on software that we license from third parties for certain components of our products and services to enhance our products and services, and meet evolving customer needs. The failure to license any necessary technology, or to maintain our existing licenses, could result in reduced demand for our products.
Because the software industry is characterized by rapid technological change, we believe such factors as the technological and creative skills of our personnel, new product developments, frequent product enhancements, name recognition, and reliable product maintenance are more important to establishing and maintaining a technology leadership position than the various legal protections of our technology.
Although we believe our products and services, and other proprietary rights, do not infringe upon the proprietary rights of third parties, third parties may assert intellectual property infringement claims against us in the future. Any such claims may result in costly, time-consuming litigation and may require us to enter into royalty or cross-license arrangements. Refer to Note 16 – Commitments and Contingencies of our Notes to Consolidated Financial Statements for discussions on patent litigation.
We have trademarks and registered trademarks in the United States and other countries, including Quest, Quest Software, the Quest Software logo, AccessManager, ActiveRoles, Akonix, Benchmark Factory, Big Brother, BridgeAccess, BridgeAutoEscalate, BridgeSearch, BridgeTrak, BusinessInsight, ChangeAuditor, CI Discovery, Defender, Desktop Authority, Directory Analyzer, Directory Troubleshooter, DS Analyzer, DS Expert, Foglight, GPOADmin, Help Desk Authority, IntelliProfile, InTrust, iToken, JClass, JProbe, LiteSpeed, LiveReorg, LogADmin, MessageStats, Monosphere, NBSpool, NetBase, Npulse, PassGo, PerformaSure, Point, Click, Done!, ReportADmin, RestoreADmin, ScriptLogic, SelfServiceADmin, SharePlex, SmartAlarm, Spotlight, SQL Navigator, SQL Watch, SQLab, Stat, StealthCollect, Storage Horizon, Tag and Follow, Toad, T.O.A.D., Toad World, vConverter, vEcoShell, VESI, vFoglight, vRanger, vSpotlight, vToad, Vintela, VizionCore, WebDefender, Webthority, Xaffire, and XRT. Other trademarks and registered trademarks are the property of their respective owners.
As of December 31, 2010, we employed 3,460 full-time employees, including 1,384 in sales and marketing, 133 in consulting and training services and product fulfillment, 1,222 in research and development, 318 in customer service and support and 403 in general and administrative, including information services personnel. We believe that our future success will depend in large part upon our continuing ability to attract and retain highly skilled managerial, sales, marketing, customer support, research and development, and general and administrative personnel. Like other software companies, we face intense competition for such personnel, and, at times, we have experienced, and continue to experience, difficulty in recruiting and retaining qualified personnel. None of our employees are represented by a labor union; we have never experienced any work stoppages and we believe that our relationships with our employees are good.
Website Access to United States Securities and Exchange Commission Filings
Our website is located at www.quest.com. Information at that website address shall not be deemed incorporated by reference into this report. We make available, free of charge on or through our website, our annual report on Form 10-K, quarterly reports on Form 10-Q, current reports on Form 8-K, and all amendments to those reports as soon as reasonably practicable after such material is electronically filed with, or furnished to, the Securities and Exchange Commission, or SEC. Information contained on our website is not part of this Annual Report on Form 10-K. Members of the public may read and copy any materials we file with, or furnish to, the SEC, at the SEC’s Public Reference Room at 100 F Street, NE, Washington, DC 20549. To obtain information on the operation of the Public Reference Room, please call the SEC at 1-800-SEC-0330. The SEC also maintains an Internet site at http://www.sec.gov that contains the reports, proxy and information statements, and other information that we file electronically with the SEC.
| Item 1A. | Risk Factors |
An investment in our stock involves risks and uncertainties. You should carefully consider the factors described below before making an investment decision in our securities. The risks described below are the risks that we currently believe are material risks of the business and the industry in which we compete.
Our business, financial condition and results of operations could be adversely affected by any of the following risks. If we are adversely affected by such risks, then the trading price of our common stock could decline, and you could lose part or all of your investment.
12
Table of Contents
Current economic conditions may harm our business and results of operations
Beginning in 2008 and continuing through 2009 but to a lesser extent in 2010, the U.S. and global economies slowed dramatically as a result of a variety of serious problems, including turmoil in the credit and financial markets, concerns regarding the stability and viability of major financial institutions, the state of the housing markets and volatility in worldwide stock markets. During 2010, we experienced reductions in revenues from our Europe, Middle East and Africa (“EMEA”) sales region due to the impact of the debt crisis in countries within Europe, primarily Greece. These economic conditions, which are beyond our control, could cause many of our existing and potential customers to delay or reduce purchases of our products or services for some time, which in turn would harm our business by adversely affecting our revenues, results of operations, cash flows and financial condition. We cannot predict the duration of these economic conditions or the impact they will have on our customers or business.
Our future success may be impaired and our operating results will suffer if we cannot respond to rapid market, competitive and technological conditions in the software industry
The market for our software products and services is characterized by:
| • | rapidly changing technology; |
| • | frequent introduction of new products and services and enhancements to existing products and services by platform vendors of database, application, Windows and virtualization products and by our competitors; |
| • | increasing complexity and interdependence of software applications; |
| • | consolidation of the software industry; |
| • | changes in industry standards and practices; and |
| • | changes in customer requirements and demands. |
To maintain our competitive position, we must continue to enhance our existing products and develop new products and services, functionality, and technology that address the increasingly sophisticated and varied needs of our customers and prospective customers, which requires significant investment in research and development resources and capabilities, involves significant technical and business risks and requires substantial lead-time and significant investments in product development. If we fail to anticipate new technology developments, customer requirements, industry standards, or if we are unable to develop new products and services that adequately address these new developments, requirements, and standards in a timely manner, or if we are incapable of timely bringing new or enhanced products to market, our products and services may become obsolete, we may not generate suitable returns from our research and development investments, and our ability to compete may be impaired, our revenue could decline, and our operating results may suffer.
A large portion of our revenue has been attributable to the growth of our Windows Management and Virtualization Management products and services, and we have relied upon cash flow generation from our Windows Management products to fund sales, marketing and research and development initiatives associated with our other product areas. We cannot provide any assurance that we will sustain or grow the revenues we derive from these product areas. In addition, over the last few years we have committed significant resources to development of new and enhanced application management products and have realigned our sales and services organizations to address anticipated business opportunities presented by our expanding application management product and services lines. We cannot provide any assurance that this strategy will be successful or that the release of our enhanced application management products or other new products or services will increase our revenue growth rate.
Our quarterly operating results may fluctuate in future periods and, as a result, we may fail to meet expectations of investors and analysts, causing our stock price to fluctuate or decline
Our revenues and operating results may vary significantly from quarter-to-quarter due to a number of factors. These factors include the following:
| • | the size and timing of customer orders (See “Variations in the size and timing of our customer orders and differing nature of our products and services could expose us to revenue fluctuations and higher operating costs”); |
| • | the discretionary nature of our customers’ purchasing decisions and budget cycles; |
| • | the timing of revenue recognition for sales of software products and services (See “Contractual terms or issues arising during software license negotiations may affect the timing of transactions and revenues”); |
| • | changes in U.S. GAAP that affect the timing of reporting revenues and costs; |
| • | the extent to which our customers renew their maintenance contracts with us; |
| • | exposure to general economic conditions and reductions in corporate or public sector IT spending (See “Current economic conditions may harm our business and results of operations”); |
13
Table of Contents
| • | changes in our level of operating expenses and our ability to control costs; |
| • | customers opting to license our products for a fixed term rather than on a perpetual basis which defers the accounting recognition of such license revenue; |
| • | our ability to attain market acceptance of new products and services and enhancements to our existing products; |
| • | our ability to introduce new products or enhancements to existing products and services in a timely manner; |
| • | our ability to maintain our field and inside sales organizations with adequate numbers of sales and services personnel, and to minimize our costs of sales and marketing through efficient allocation of sales resources and methods to products having different sales characteristics and profiles; |
| • | the introduction of new or enhanced products and services by our competitors and changes in the pricing policies of these competitors; |
| • | the relative growth rates of competing operating system, database and application platforms and competitive conditions among vendors of these platforms; |
| • | the unpredictability of the timing, level of sales and subsequent revenue recognition of our expanded efforts within our indirect sales channels; |
| • | costs related to acquisitions of technologies or businesses, including acquired in-process research and development and amortization costs for intangible assets and possible impairments and uncertainties arising from the integration of products, services, employees and operations of acquired companies; and |
| • | the timing of releases of new versions of third-party software products that our products support or with which our products compete. |
In addition, the timing of our software product revenues is difficult to predict and can vary substantially from product-to-product and customer-to-customer. We budget our operating expenses on our expectations regarding future revenue levels. The timing of larger orders and customer buying patterns are difficult to forecast. Therefore, we may not learn of shortfalls in revenue or earnings or other failures to meet our expectations until late in a particular quarter. As a result, if total revenues for a particular quarter are below our expectations, we would not be able to proportionately reduce operating expenses for that quarter.
We have experienced seasonality in our orders and revenues. We typically achieve the highest levels of orders and revenues for the year in the fourth quarter, which levels are usually higher than we achieve in the first quarter of the following year. We believe that this seasonality results primarily from the budgeting cycles of our customers being typically higher in the third and fourth quarters and, to a lesser extent, from the structure of our sales commission program. In addition, the tendency of some of our customers to wait until the end of a fiscal quarter to finalize orders has resulted in higher order volumes towards the end of the quarter. These factors, combined with the relatively fixed nature of our expenses, leads to seasonality of earnings. We expect this seasonality to continue in the future.
Due to these factors, we believe that period-to-period comparisons of our results of operations are not necessarily meaningful and should not be relied upon as indications of future performance. Fluctuations in our results of operations are also likely to affect the market price of our common stock, if our operating results differ from expectations of investors or securities analysts, and may not be related to or indicative of our long-term performance.
In periods of poor economic conditions, our exposure to credit risk and payment delinquencies on our accounts receivable significantly increases
Our outstanding accounts receivables are generally not secured. In addition, our standard terms and conditions permit payment within a specified number of days following the receipt of our product. While we have procedures to monitor and limit exposure to credit risk on our receivables and have not suffered any material losses, there can be no assurance such procedures will continue to effectively limit our credit risk and avoid losses. As economic conditions have deteriorated, certain of our customers have faced and may face liquidity concerns and have delayed and may delay or may be unable to satisfy their payment obligations, which would have a material adverse effect on our financial condition, operating results and cash flows.
Our cash and cash equivalents could be adversely affected if the financial institutions in which we hold our cash and cash equivalents fail
Our cash and cash equivalents are highly liquid investments with original maturities of three months or less at the time of purchase. We maintain the cash and cash equivalents with major financial institutions. Deposits with these banks exceed the Federal Deposit Insurance Corporation (“FDIC”) insurance limits or similar limits in foreign jurisdictions. While we monitor daily the cash balances in the operating accounts and adjust the balances as appropriate, these balances could be impacted if one or more of the financial institutions with which we deposit fails or is subject to other adverse conditions in the financial or credit markets. To date we have experienced no loss or lack of access to our invested cash or cash equivalents; however, we can provide no assurance that access to our invested cash and cash equivalents will not be impacted by adverse conditions in the financial and credit markets.
14
Table of Contents
Variations in the size and timing of our customer orders and differing nature of our products and services could expose us to revenue fluctuations and higher operating costs
Our license revenues in any quarter are substantially dependent on orders booked and delivered in that quarter. Our revenues in a given quarter could be adversely affected if we are unable to complete one or more large license transactions or if the contract terms were to prevent us from recognizing revenue during that quarter. The sales cycles for certain of our software products can last from three to nine months, or longer and often require pre-purchase evaluation periods and customer education, which can affect timing of orders. Further, we have often booked a large amount of our sales in the last month, weeks or days of each quarter and delays in the closing of sales near the end of a quarter could cause quarterly revenue to fall short of anticipated levels. Finally, while a portion of our revenues each quarter is recognized from previously deferred revenue, our quarterly performance will depend primarily upon current order volumes to generate license revenues for that quarter. These factors may cause significant periodic variation in our license revenues. In addition, we incur or commit to operating expenses based on anticipated revenue levels, and generally do not know whether revenues in any quarter will meet expectations until the end of that quarter.
Our product portfolio is engineered for a broad variety of operating system, database and application platforms, and having a diverse set of functions and features. Some products, such as our database management products and other component products, are directed at database administrators and are generally sold at lower price points, and we strive to generate demand for these products through our telesales organization and marketing programs designed to maximize lead generation and website traffic. Sales of other, enterprise-wide products, primarily SharePlex, Foglight and Desktop Virtualization products, require substantial time and effort from our sales and support staff as well as involvement by our professional services organizations and, to an increasing degree, our systems integrator partners. Large individual sales, or even small delays in customer orders, can cause significant variation in our revenues and adversely affect our results of operations for a particular period. Historically, we have not placed significant reliance on large sales transactions in any given quarter, with a substantial volume of our revenues being driven from smaller transactions. However, if we encounter difficulty sustaining our component product volumes, and cannot generate a sufficient number of large customer orders, or if customers delay or cancel such orders in a particular quarter, our revenues and operating results may be adversely affected. For these reasons, we face increasing complexity in building and sustaining the optimum combination of field and inside sales personnel to address the various and changing sales and distribution characteristics of our products, which in turn impacts our ability to manage and minimize our sales and marketing costs.
We rely heavily on our direct sales activities for license and services revenues, including renewals of annual maintenance contracts. We have in the past restructured or made other adjustments to our sales force in response to management changes, product changes, performance issues and other internal considerations.
Accordingly, if our revenue growth rates slow or our revenues decline, or if we fail to efficiently correlate our sales and marketing resources to our various products and their differing sales and distribution strategies, our operating results could be seriously impaired because many of our expenses are relatively fixed in nature and cannot be easily or quickly changed.
Contractual terms or issues arising during software license negotiations may affect the timing of transactions and revenues
Because our software products are designed to work with critical elements of the information technology systems of our customers, pre-sales evaluations of our products by potential customers and contractual negotiations are often protracted and complex, and the time necessary to negotiate mutually acceptable terms and complete software license or services transactions often result in extended sales cycles. While we generally use standardized forms of software license agreements and order documentation in our transactions, it is not uncommon for large, more sophisticated IT customers to heavily negotiate terms and conditions for sales and services involving amendments to our standard forms or the use of alternative forms of agreements, which can also delay completion of transactions and recognition of the related revenue.
Several other factors may require us to defer recognition of license revenue for a period of time after entering into a license arrangement, including instances where we are required to deliver specified additional products, product upgrades or services for which we do not have vendor-specific objective evidence of fair value, licensing our product for a fixed term rather than on a perpetual basis, or where negotiated terms of the software license agreement affect other software revenue recognition requirements.
15
Table of Contents
Many of our products are vulnerable to direct competition from Oracle and other platform vendors
We compete with Oracle in the market for database management solutions and the competitive pressure continues to increase. We expect that Oracle’s commitment to and presence in the database management product market will increase in the future and therefore substantially increase competitive pressures. We believe that Oracle will continue to incorporate database management technology into its server software offerings and expand their development products possibly at no additional cost to its users. Competition from Oracle with certain of our Database Management products including SharePlex, Quest Central for Oracle and TOAD, our market leading Database Development product for Oracle databases, has increased over the last few years.
In addition to the increasing competitive pressure from Oracle, Microsoft has continually upgraded the functionality of its platform offerings, which we also believe will increase competitive pressure for our Microsoft products in the future.
In some cases these types of platform vendor-provided tools are bundled with the platform and in other cases they are separately chargeable products, albeit at significantly lower price points. The inclusion of the functionality of our software as standard features of the underlying database solution or application supported by our products or sale at much lower cost could erode our revenues, particularly if the competing products and features were of comparable capability to our products. Even if the functionality provided as standard features or lower costs by these system providers is more limited than that of our software, there can be no assurance that a significant number of customers would not elect to accept more limited functionality in lieu of purchasing our products. Moreover, there is substantial risk that the mere announcements of competing products or features by large competitors such as Oracle could result in the delay or cancellation of customer orders for our products in anticipation of the introduction of such new products or features.
Our migration products for Microsoft’s Active Directory and Exchange are vulnerable to fluctuations in the rate at which customers migrate to these products
Our migration products for Microsoft’s Active Directory and Exchange products contribute a significant portion of our Windows platform revenue. Our ability to sell licenses for our Active Directory and Exchange migration products depends in part on the rate at which customers migrate to newer versions of Microsoft’s Active Directory or to newer versions of Microsoft Exchange, and from other messaging platforms to Exchange. If these migration rates were to materially decrease, our license revenues from these migration products would likely decline.
Many of our products are dependent on database or application technologies of others; if these technologies lose market share or become incompatible with our products, or if these vendors introduce competitive products or acquire or form strategic relationships with our competitors, the demand for our products could suffer
We believe that our success has depended in part, and will continue to depend in part for the foreseeable future, upon our relationships with providers of major database and enterprise software programs, including Oracle, IBM, Microsoft, VMware, Cisco and SAP. Our competitive advantage consists in substantial part on the integration between our products and products provided by these major software providers, and our extensive knowledge of their products and technologies. If these companies for any reason decide to promote technologies and standards that are not compatible with our technologies, or if they lose market share for their database or application products, our business, operating results and financial condition would be materially adversely affected. Furthermore, these major software vendors could attempt to increase their presence in the markets we serve by either introducing products that compete with our products or acquiring or forming strategic alliances with our competitors. These companies have longer operating histories, larger installed bases of customers and substantially greater financial, distribution, marketing and technical resources than we do, as well as well-established relationships with many of our present and potential customers, and may be in better position to withstand and respond to the current factors impacting this industry. As a result, we may not be able to compete effectively with these companies in the future, which could materially adversely affect our business, financial condition, operating results and cash flows.
If we fail to manage our operations and grow revenue or fail to continue to effectively control expenses, our future operating results could be adversely affected
The scope of our operations, the number of our employees and the geographic area of our operations and our revenue have grown. In addition, we have acquired both domestic and international companies. This growth and the assimilation of acquired operations and their employees could continue to place a significant strain on our managerial, operational and financial resources. To manage our current operations and any future growth effectively, we need to continue to implement and improve additional management and financial systems and controls. We may not be able to manage the current scope of our operations or future growth effectively and still exploit market opportunities for our products and services in a timely and cost-effective way.
16
Table of Contents
We cannot assure you that our operating expenses will be lower than our estimated or actual revenues in any given quarter. If we experience a shortfall in revenue in any given quarter, we likely will not be able to further reduce operating expenses quickly in response. Any significant shortfall in revenue could immediately and adversely affect our results of operations for that quarter. Also, due to the fixed nature of many of our expenses and our current revenue expectations, our income from operations and cash flows from operating and investing activities could be lower than in recent years.
Failure to develop and sustain additional distribution channels in the future may adversely affect our ability to grow revenues
We intend to direct additional efforts to drive domestic and international revenue growth through sales of our products and services through indirect distribution channels, such as global hardware and software vendors, systems integrators, or value-added resellers. Our recent acquisition of BakBone significantly increases the scope of business we conduct via indirect distribution channels. Our ability to increase future revenues depends on our ability to build out our channel organization and further expand our indirect distribution channels. If we fail in our efforts to maintain, expand and diversify our indirect distribution channels, our business, results of operations and financial condition could be adversely affected. Increasing activity in indirect distribution channels will present a number of additional risks, including:
| • | we may face conflicts between the activities of our indirect channels and our direct sales and marketing activities, which may result in lost sales and customer confusion; |
| • | our channel partners can cease marketing and distributing our products and services with limited or no notice and with little or no penalty; |
| • | our channel partners may not be able to effectively sell our products and services; |
| • | our channel partners may experience financial difficulties that might lead to delays, or even default, in their payment obligations; |
| • | we may not be able to recruit additional channel partners, or replace any of our existing ones; and |
| • | our channel partners may also offer competitive products and services, and may not give priority to marketing our products or services. |
Intense competition in the markets for our products could adversely affect our results of operations
The markets for our products are highly competitive. As a result, our future success will be affected by our ability to, among other things, outperform our competitors in meeting the needs of current and prospective customers and identifying and addressing new technological and market opportunities. Our competitors may develop more advanced technology, adopt more aggressive pricing policies and undertake more effective sales and marketing campaigns and may be able to leverage more extensive financial, technical or partner resources. If we are unable to maintain our competitive position, our revenues may decline and our operating results may be adversely affected.
Our operating results may be negatively impacted by fluctuations in foreign currency exchange rates
Our international operations are generally conducted through our international subsidiaries, with the associated revenues and related expenses, and balance sheets, denominated in the currency of the country in which the international subsidiaries operate. As a result, our operating results may be harmed by fluctuations in exchange rates between the U.S. Dollar and other foreign currencies. The foreign currencies to which we currently have the most significant exposure are the Canadian Dollar, the British Pound, the Euro, the Australian Dollar and the Russian Ruble. We have implemented a foreign exchange hedging program using derivative financial instruments to hedge certain of our foreign exchange exposures. However, we do not rely on our hedging program to eliminate all foreign currency exchange rate risk.
Our international operations expose us to certain risks
We maintain research and development operations in Canada, Australia, Russia, United Kingdom, China, Czech Republic, Hong Kong and Israel, and we also have significant sales activities around the globe. As a percentage of total revenues, revenues outside of the Americas were 34.6%, 32.8% and 37.9% for the years ended December 31, 2010, 2009 and 2008, respectively. As a result, we face risks from our international operations, including, among others:
| • | difficulties in staffing, managing and operating our foreign operations; |
| • | difficulties in coordinating the activities of our geographically dispersed and culturally diverse operations; |
| • | difficulties in adapting our existing foreign operations, particularly in Asia, to the control structure and requirements of a US public entity given the historical environment and cultural approach to conducting business in Asian countries; |
| • | longer payment cycles and difficulties in collecting accounts receivable; |
17
Table of Contents
| • | seasonal reductions in business activity during the summer months in Europe, the Middle East and Africa (“EMEA”) and in other periods in other countries; |
| • | increased financial accounting and reporting burdens and complexities; |
| • | fluctuations in foreign currency exchange rates that are not wholly mitigated by our foreign currency hedging program; |
| • | limitations on future growth or inability to maintain current levels of revenue from international operations if we do not invest sufficiently in our international operations; |
| • | potentially adverse tax consequences; |
| • | potential loss of proprietary information due to piracy, misappropriation or weaker laws regarding intellectual property protection; |
| • | delays in localizing our products; |
| • | political unrest or terrorism, particularly in areas in which we have facilities; |
| • | our ability to adapt and conform to accepted local business practices and customs, including providing letters of credit or other forms of support to or for the benefit of our subsidiaries or resellers; |
| • | compliance with a wide variety of complex foreign laws and treaties, including employment restrictions; |
| • | compliance with licenses, tariffs and other trade barriers; |
| • | activities by our employees, contractor or agents, especially in countries with developing economies, that are prohibited by U.S. laws and regulations such as the Foreign Corrupt Practices Act and by local laws prohibiting corrupt payments to government officials, in spite of our policies and procedures designed to ensure compliance with these laws; |
| • | wage inflation in foreign countries where we have historically benefited from relatively low labor costs; |
| • | integrating the foreign operations of our acquisition targets, including our BakBone acquisition, which significantly expands our presence in the Asia-Pacific (“APAC”) region, particularly in Japan; and |
| • | potential transition challenges arising from our plans to open a shared services center for our EMEA region in Cork, Ireland and to downsize operations elsewhere in our EMEA region. |
Operating in international markets also requires significant management attention and financial resources and will place additional burdens on our management, administrative, operational and financial infrastructure. We cannot be certain that investment and additional resources required in establishing facilities in other countries will produce desired levels of revenue or profitability. In addition, we have limited experience in developing localized versions of our products and marketing and distributing them internationally.
Cash earned by our foreign subsidiaries is held at those subsidiaries and transferring this cash to the United States could have a negative impact on our earnings
A substantial portion of our cash balances result from the operations of, and are held by, our foreign subsidiaries. The repatriation of cash balances from certain of our foreign subsidiaries to fund our activities within the United States could have adverse tax consequences and be limited by foreign currency exchange controls.
Acquisitions of companies or technologies may result in disruptions to our business and diversion of management attention, and may subject us to additional business challenges and risks
We have in the past made and we expect to continue to make acquisitions of complementary companies, products or technologies. Acquisitions require us to assimilate the operations, products and personnel of the acquired businesses and train, retain and motivate key personnel from the acquired businesses. We may be unable to maintain uniform standards, controls, procedures and policies if we fail in these efforts. Similarly, acquisitions may subject us to liabilities and risks that are not known or identifiable at the time of the acquisition or may cause disruptions in our operations and divert management’s attention from day-to-day operations, which could impair our relationships with our current employees, customers and strategic partners. Some of our recent acquisitions, such as Surgient and BakBone, may subject us to additional business challenges and risks. For example, Surgient’s data center and hosting business model differs from the model with which we have traditionally operated, while BakBone, our largest acquisition to date in terms of number of personnel and geographic scope, expands the breadth of our channel business, and significantly increases our presence in Japan and throughout the APAC region. We may have to use cash, incur debt or issue equity securities to pay for any future acquisitions. Use of cash or debt may affect our liquidity and use of cash would reduce our cash reserves and reduce our financial flexibility. The issuance of equity securities for any acquisition could be substantially dilutive to our stockholders. In addition, our profitability may suffer because of acquisition-related costs or amortization costs for intangible assets with
18
Table of Contents
indefinite useful lives. In consummating acquisitions, we are also subject to risks of entering geographic and business markets in which we have no or limited prior experience. If we are unable to fully integrate acquired businesses, products or technologies with our existing operations, we may not receive the intended benefits of an acquisition.
If our goodwill or amortizable intangible assets become impaired we may be required to record a significant charge to earnings
Under generally accepted accounting principles, we review our goodwill and amortizable intangible assets for impairment when events or changes in circumstances indicate the carrying value may not be recoverable. Goodwill is required to be tested for impairment at least annually. Factors that may be considered a change in circumstances indicating that the carrying value of our goodwill or amortizable intangible assets may not be recoverable include a decline in stock price and market capitalization, future cash flows, and slower growth rates in our industry. We may be required to record a significant charge to earnings in our financial statements during the period in which any impairment of our goodwill or amortizable intangible assets is determined, resulting in an impact on our results of operations.
Accounting for equity investments in companies may affect our operating results
We have made equity investments in other software companies and a private equity fund. We regularly consider opportunities to make equity investments in other companies focused on software development or marketing activities, and expect from time to time to complete additional investments. These investments are risky because the market for the products and technologies being developed by these companies are typically in the early stages and may never materialize. Estimating the fair value of our equity investments is inherently subjective and may contribute to volatility in our reported results of operations. We have recognized accounting charges due to the impairment of the value of our investments in the past and may need to do so again in the future if we determine that the estimated fair value is below the investment’s carrying value. If we are required to consolidate the operating results of these companies, use the equity method of accounting, or write down the value of our cost method investments, our operating results may be adversely affected.
Our investment portfolio may become impaired by deterioration of the capital markets
We invest our cash balances in high-quality issuers and, limit the amount of credit exposure to any one issuer other than the United States government and its agencies. Our cash equivalent and investment portfolio as of December 31, 2010 consists of money market funds, deposit accounts, U.S. treasury securities, U.S. agency securities, commercial paper, corporate notes/bonds and certificates/term deposits. Our investments are subject to general credit, liquidity and market and interest rate risks. As a result, we may experience reductions in value or loss of liquidity of our investments. In addition, should any investment cease paying or reduce the amount of interest paid to us, our interest income would suffer. These market risks associated with our investment portfolio could have a material adverse effect on our business, results of operations, liquidity, and financial condition. See Note 4 – Cash and Cash Equivalents and Investments of our Notes to Consolidated Financial Statements for additional information about our cash equivalents and investment portfolio.
Changes in, or interpretations of, tax rules and regulations may adversely affect our effective tax rates
We are a U.S. based multinational company subject to tax in multiple U.S. and foreign tax jurisdictions. Unanticipated changes in our tax rates could affect our future results of operations. Our future effective tax rates could be unfavorably affected by changes in, or interpretation of, tax rules and regulations in the jurisdictions in which we do business, by unanticipated decreases in the amount of revenue or earnings in countries with low statutory tax rates, by lapses of the availability of the U.S. research and development tax credit, or by changes in the valuation of our deferred tax assets and liabilities.
In addition, we are subject to the continual examination of our income tax returns by the IRS and other domestic and foreign tax authorities. These examinations are expected to focus on our intercompany transfer pricing practices as well as other matters. We regularly assess the likelihood of outcomes resulting from these examinations to determine the adequacy of our provision for income taxes and have reserved for potential adjustments that may result from the examinations. We believe such estimates to be reasonable; however, there can be no assurance that the final determination of any of these examinations will not have an adverse effect on our financial position, operating results and cash flows.
We face risks associated with governmental contracting
We derive a portion of our revenues from contracts with the United States government and its agencies and from contracts with state and local governments or agencies. Most of our government contracting is conducted indirectly through third party resellers and only an immaterial portion of our government contracting revenues arise from contracts in which we bear the risk of renegotiation of profits or contractual termination at the government’s election. However, demand and payment for our products and services are impacted by public sector budgetary cycles and funding availability, with funding reductions or delays adversely impacting public sector demand for our products and services. Public sector customers may also change the way they procure new contracts and may adopt new rules or regulations governing contract procurement, including required competitive bidding or use of “open source” products, where available. These factors may limit the growth of or reduce the amount of revenues we derive from the public sector, which could negatively affect our results of operations.
19
Table of Contents
We may not generate increased business from our current customers, which could slow our revenue growth in the future
Most of our customers initially make a purchase of our products for a single department or location. Many of these customers may choose not to expand their use of our products. If we fail to generate expanded business from our current customers, our business, operating results and financial condition could be materially adversely affected. In addition, as we deploy new modules and features for our existing products or introduce new products, our current customers may choose not to purchase this new functionality or these new products.
Maintenance revenue growth could decline
Our services revenues arising from maintenance services have increased over the last three years as a result of a growing base of installed products. Declines in our license bookings, adverse changes in our foreign currency exchange rates, increased discounting in maintenance renewal bookings and/or a reduction in the extent to which our customers renew maintenance contracts would lead to declines in our maintenance revenue growth rates. As maintenance revenue makes up a substantial portion of our total revenue, any decline in our maintenance revenue could have an adverse impact on our business and financial results.
Failure to develop or leverage strategic relationships could harm our business by denying us selling opportunities and other benefits
Our development, marketing, and distribution strategies rely increasingly on our ability to form strategic relationships with software and other technology companies. These business relationships often consist of cooperative marketing programs, joint customer seminars, lead referrals, and cooperation in product development. Many of these relationships are not contractual and depend on the continued voluntary cooperation of each party with us. Divergence in strategy or change in focus by, or competitive product offerings by, any of these companies may interfere with our ability to develop, market, sell, or support our products, which in turn could harm our business. Further, if these companies enter into strategic alliances with other companies or are acquired, they could reduce their support of our products. Our existing relationships may be jeopardized if we enter into alliances with competitors of our strategic partners. In addition, one or more of these companies may use the information they gain from their relationship with us to develop or market competing products.
Failure to adequately protect our intellectual property rights could harm our competitive position
Our success and ability to compete are dependent on our ability to develop and maintain the proprietary aspects of our technology. We generally rely on a combination of trademark, trade secret, patent, copyright law and contractual restrictions to establish and protect our proprietary rights in our products and services.
Despite our efforts to protect our proprietary rights, unauthorized parties may attempt to copy aspects of our products or to obtain and use information that we regard as proprietary. Litigation may be necessary in the future to enforce our intellectual property rights, to protect our trade secrets, and to determine the validity and scope of the proprietary rights of others. Any such resulting litigation, whether successful or unsuccessful, could result in substantial costs and diversion of management and financial resources, which could harm our business. Refer to Note 16 – Commitments and Contingencies of our Notes to Consolidated Financial Statements for details of our patent litigation.
Our means of protecting our proprietary rights may prove to be inadequate and competitors may independently develop similar or superior technology. Policing unauthorized use of our products is difficult, and we cannot be certain that the steps we have taken will prevent misappropriation of our technology, particularly in foreign countries where the laws may not protect our proprietary rights as fully as in the United States. We also believe that, because of the rapid rate of technological change in the software industry, trade secret and copyright protection are less significant than factors such as the knowledge, ability and experience of our employees, frequent product enhancements and the timeliness and quality of customer support services.
Third parties may claim that our software products or services infringe on their intellectual property rights, exposing us to litigation that, regardless of merit, may be costly to defend
Our success and ability to compete are also dependent upon our ability to operate without infringing upon the proprietary rights of others. Third parties may claim that our current or future products infringe their intellectual property rights. Any such claim, with or without merit, could have a significant effect on our business and financial results. Any future third party claim could be time consuming, divert management’s attention from our business operations and result in substantial litigation costs, including any monetary damages and customer indemnification obligations, which may result from such claims. In addition, parties making these claims may be able to obtain injunctive or other equitable relief affecting our ability to license the products that incorporate the challenged intellectual property. As a result of such claims, we may be required to obtain licenses from third parties, develop alternative technology or redesign our products. We cannot be sure that such licenses would be available on terms acceptable to us, if at all. If a successful claim is made against us and we are unable to develop or license alternative technology, our business and financial results and position could be materially adversely affected. Refer to Note 16 – Commitments and Contingencies of our Notes to Consolidated Financial Statements for details of our patent litigation.
20
Table of Contents
Our business may be adversely affected if our software contains errors or security flaws, or if we suffer breaches of data or network security
The software products we offer are inherently complex. Despite testing and quality control, we cannot be certain that errors or security flaws will not be found in current versions, new versions or enhancements of our products after commencement of commercial shipments. Significant technical challenges also arise with our products because our customers purchase and deploy our products across a variety of computer platforms and integrate them with a number of third-party software applications and databases. If new or existing customers have difficulty deploying our products or require significant amounts of customer support, our operating margins could be harmed. Moreover, we could face possible claims and higher development costs if our software contains undetected errors or security flaws or if we fail to meet our customers’ expectations. As a result of the foregoing, we could experience:
| • | loss of or delay in revenues and loss of market share; |
| • | loss of customers; |
| • | damage to our reputation; |
| • | failure to achieve market acceptance; |
| • | diversion of development resources; |
| • | increased service and warranty costs; |
| • | legal actions by customers against us which could, whether or not successful, increase costs and distract our management; and |
| • | increased insurance costs. |
The detection and correction of any security flaws can be time consuming and costly. In addition, a product liability claim, whether or not successful, could harm our business by increasing our costs and distracting our management.
We have network security, disaster recovery and systems management measures in place to protect our IT systems and related software applications. Despite these protections, our computer systems may be subject to attacks that penetrate our network security, create system disruptions or shutdowns, exploit security vulnerabilities in our products, result in the loss or misuse of proprietary and sensitive or confidential information, or damage our systems, resulting in disruption to our business.
We incorporate software licensed from third parties into some of our products and any significant interruption in the availability of these third-party software products or defects in these products could reduce the demand for, or prevent the shipping of, our products
Certain of our software products contain components developed and maintained by third-party software vendors. We expect that we may have to incorporate software from third-party vendors in our future products. We may not be able to replace the functionality provided by the third-party software currently offered with our products if that software becomes obsolete, defective or incompatible with future versions of our products or is not adequately maintained or updated. Any significant interruption in the availability of these third-party software products or defects in these products could harm our sales unless and until we can secure an alternative source. Although we believe there are adequate alternate sources for the technology licensed to us, such alternate sources may not provide us with the same functionality as that currently provided to us.
Natural disasters or power outages could disrupt our business
A substantial portion of our operations is located in California, and we are subject to risks of damage and business disruptions resulting from earthquakes, floods, wildfires and similar events, as well as from power outages. We have in the past experienced limited and temporary power outages in our California facilities due to power shortages, and we expect in the future to experience additional power losses. While the impact to our business and operating results has not been material, we cannot assure you that natural disasters or power outages will not adversely affect our business in the future. Since we do not have sufficient redundancy in our networking infrastructure, a natural disaster or other unanticipated problem could have an adverse effect on our business, including both our internal operations and our ability to communicate with our customers or sell and deliver our products.
21
Table of Contents
Personnel turnover and failure to attract and retain personnel may negatively impact our business
Our success and ability to compete depends largely on the continued contributions of our key management, sales, engineering, marketing, support, professional services and finance personnel. We experience turnover throughout our organization and many key positions are held by people who are new to the Company or to their roles. We have an especially high number of new personnel within our overseas sales senior leadership team. If these people are unable to quickly become familiar with the issues they face in their roles or are not well suited to their new roles, then this could result in the Company having problems in executing its strategy or in reporting its financial results. We are highly dependent upon the talents, relationships and contributions of a few executives and have no guarantee of their retention. We have been targeted by recruitment agencies seeking to hire our key management, finance, engineering, sales and marketing and professional services personnel.
We use stock options as a component of our employee compensation program to align employees’ interests with the interests of our stockholders, encourage employee retention and provide competitive compensation packages. We have also used restricted stock units (RSUs) to compensate and retain key employees and to align the interests of our employees and stockholders. For example, beginning in 2008 we designed an employee reward program for key employees, which provides us with the ability to make awards under the program in the form of RSUs. If we are unable to hire or retain qualified personnel, or if newly hired personnel fail to develop the necessary skills or fail to reach expected levels of productivity, our ability to develop and market our products will be weakened.
Our revolving line of credit agreement and our loan agreement contain financial and non-financial covenants, and default of any covenant could adversely affect us
Our revolving line of credit agreement with Wells Fargo Foothill, LLC, as well as our loan agreement with Mutual of Omaha Bank which is secured by our real property at our headquarters in Aliso Viejo, California, impose operating restrictions on us in the form of financial and non-financial covenants (refer to Note 8 – Loans Payable and Note 17 – Subsequent Events of our Notes to Consolidated Financial Statements for additional details). These restrictions limit the manner in which we can conduct our business and may restrict us from engaging in favorable business opportunities. If we were to fail to comply with these covenants and not obtain a waiver from our lenders, we would be in default under these agreements, in which case our lenders could, among other things, terminate the facilities, demand immediate repayment of any outstanding amounts, and foreclose on our collateral.
Unforeseen difficulties with the second and final stage of implementation and operation of our Oracle computerized accounting system, or with the upgrading or implementation of our other computerized accounting, finance and sales support systems, could adversely affect our operating results, our ability to manage our business effectively, and the effectiveness of our internal controls over financial reporting
In October 2009, we began implementing an upgrade to our financial system. As part of the first stage of this process, which we completed in August 2010, we implemented a full rollout of all financial system upgrade modules in the United States, Canada, Australia and certain parts of our EMEA region, which together comprise the largest part of our business. The second and final stage of implementation of the upgrade to our financial system is the rollout of the remaining modules to the rest of our company, which is scheduled to be completed in the first quarter of 2012. Designing and implementing these systems is a major undertaking, both financially and from a management and personnel perspective. Costs and risks inherent in the conversion to our upgraded and new systems may include disruption to our normal procedures, potential delays, expenditure overruns beyond the projects’ budgets, and problems achieving accuracy in the conversion of electronic data. Failure to properly or adequately address these issues could result in increased costs and the diversion of management’s attention and resources, negatively impacting our operating results and ability to effectively manage our business. Once upgraded and new systems are implemented, they may not operate as we expect them to. Any significant failure or malfunction may result in disruptions of our operations.
This project will require changes to certain aspects of our existing system of internal controls over financial reporting. If we encounter unanticipated delays in upgrading our systems and implementing new systems, we may be unable to complete our testing of internal controls within the required time periods, which could create a material weakness or significant deficiency in our overall internal controls. Due to the number of controls examined, the complexity of our processes, and the subjectivity involved in determining the effectiveness of controls, we cannot be certain that, in the future, all of our controls will continue to be considered effective by management or, if considered effective by our management, that our auditors will agree with such assessment. Consequently, we could be subject to regulatory sanctions or lose investor confidence in the accuracy or completeness of our financial reports. Management believes that it has taken the necessary steps to monitor and maintain appropriate internal controls during this implementation period and that our internal controls have been enhanced by the new financial accounting system.
22
Table of Contents
Our stock price could become more volatile and your investment could lose value
All of the factors discussed in this section could affect our stock price. The timing of announcements in the public market regarding new products, product enhancements or technological advances by our competitors or us, and any announcements by us of acquisitions, major transactions, or management changes could also affect our stock price. Changes in the amounts and frequency of our share repurchases could adversely affect our stock price as well. Our stock price is subject to speculation in the press and the analyst community, changes in recommendations or earnings estimates by financial analysts, changes in investors’ or analysts’ valuation measures for our stock, our credit ratings and market trends unrelated to our performance. In addition, if the market for technology stocks, or the stock market in general, experiences uneven investor confidence, the trading price of our common stock could decline for reasons unrelated to our business, operating results or financial condition. A significant drop in our stock price could expose us to the risk of securities class actions lawsuits, which could result in substantial costs and divert management’s attention and resources, which could adversely affect our business.
| Item 1B. | Unresolved Staff Comments |
None.
| Item 2. | Properties |
Our corporate and administrative headquarters and certain research and development, sales and marketing and support personnel are located at two buildings that comprise our 170,000 square foot facility that we own in Aliso Viejo, California. We also lease properties throughout the United States and foreign countries to house additional research and development, sales and marketing, general and administrative and support personnel. Our largest leased facilities include:
Location | Area Leased (sq. ft.) | Lease Expiration | ||
Dublin, Ohio | 51,307 | August 2013 | ||
St. Petersburg, Russia | 38,470 | December 2015 | ||
Ontario, Canada | 27,263 | May 2013 | ||
Toronto, Canada | 27,237 | December 2013 | ||
Austin, Texas | 26,943 | December 2012 | ||
Boca Raton, Florida | 25,909 | April 2015 | ||
Halifax, Canada | 25,047 | July 2013 | ||
Cologne, Germany | 21,087 | July 2011 |
We believe that our properties are in good condition, adequately maintained and suitable for the conduct of our business. Certain of our lease agreements provide options to extend the lease for additional specified periods. For additional information regarding our obligations under leases, see Note 16 – Commitments and Contingencies of our Notes to Consolidated Financial Statements.
| Item 3. | Legal Proceedings |
The information set forth under Note 16 - Commitments and Contingencies of our Notes to Consolidated Financial Statements, included in Part IV, Item 15, Financial Statements, of this Report, is incorporated herein by reference. For an additional discussion of certain risks associated with legal proceedings, see the section entitled Part I, Item 1A, Risk Factors, of this Report.
23
Table of Contents
PART II
| Item 5. | Market for Registrant’s Common Equity, Related Stockholder Matters and Issuer Purchases of Equity Securities |
Market Information
Our common stock is listed on The Nasdaq Global Select Market (formerly the NASDAQ National Market) under the symbol “QSFT.” The following table sets forth the high and low sale prices on The Nasdaq Global Select Market for our common stock for the periods indicated.
| High | Low | |||||||
2010: | ||||||||
First Quarter | $ | 18.73 | $ | 15.16 | ||||
Second Quarter | 20.60 | 15.93 | ||||||
Third Quarter | 25.04 | 17.36 | ||||||
Fourth Quarter | 28.20 | 23.56 | ||||||
2009: | ||||||||
First Quarter | $ | 13.39 | $ | 10.41 | ||||
Second Quarter | 14.78 | 12.34 | ||||||
Third Quarter | 17.69 | 13.68 | ||||||
Fourth Quarter | 18.82 | 16.17 | ||||||
Holders
On February 10, 2011, the closing sale price of our common stock on The Nasdaq Global Select Market was $25.76 per share. As of February 10, 2011, there were 122 holders of record of our common stock (not including beneficial holders of shares held in “street name”).
Dividends
We have never declared or paid any cash dividends on our common stock and do not expect to do so in the foreseeable future. We currently intend to retain all available funds for use in the operation and expansion of our business. Any future determination to pay dividends will be at the discretion of our board of directors and will depend on our results of operations, financial condition, contractual and legal restrictions and other factors the board deems relevant.
Issuer Purchases of Equity Shares
The table below summarizes information about our purchases of equity securities registered pursuant to Section 12 of the Exchange Act during the quarterly period ended December 31, 2010.
Period | Total Number of Shares of Common Stock Purchased (1) | Price Paid per Share of Common Stock (2) | Total Number of Shares of Common Stock Purchased as Part of Publicly Announced Plans or Programs (1) | Maximum Approximate Dollar Value of Shares of Common Stock that May Yet Be Purchased Under the Plans or Programs (in millions) | ||||||||||||
Oct. 1, 2010 through Oct. 31, 2010 | — | $ | — | — | $ | 51.5 | ||||||||||
Nov. 1, 2010 through Nov. 30, 2010 | — | $ | — | — | $ | 51.5 | ||||||||||
Dec. 1, 2010 through Dec. 31, 2010 | — | $ | — | — | $ | 51.5 | ||||||||||
Total | — | $ | — | — | $ | 51.5 | ||||||||||
| (1) | In August 2009, the Board of Directors authorized a plan to repurchase up to $100 million of our common stock. Any stock repurchases may be made through open market and privately negotiated transactions, at times and in such amounts as management deems appropriate, including pursuant to one or more Rule 10b5-1 trading plans. Rule 10b5-1 permits Quest to establish, while not in possession of material nonpublic information, prearranged plans to buy stock at a specific price in the future, regardless of any subsequent possession of material nonpublic information. The timing and actual number of shares repurchased will depend on a variety of factors including market conditions, corporate and regulatory requirements, and capital availability. The stock repurchase program does not have an expiration date and may be limited or terminated at any time without prior notice. In February 2011, the Board of Directors increased the authorization under our current stock repurchase program to an aggregate of $150 million (refer to Note 17 – Subsequent Events of our Notes to the Consolidated Financial Statements for additional details). |
24
Table of Contents
| (2) | The price paid per share of common stock does not include the related transaction costs. |
Performance Graph
The following graph shows a comparison of cumulative total shareholder return, calculated on a dividend reinvested basis, for Quest Software, the NASDAQ Composite Index (the “NASDAQ Index”), and the S&P Systems Software Index (the “Industry Index”). The graph assumes $100 was invested in each of the Common Stock of Quest Software, the NASDAQ Index and the Industry Index on December 31, 2005. Note that historic stock price performance is not necessarily indicative of future stock price performance.
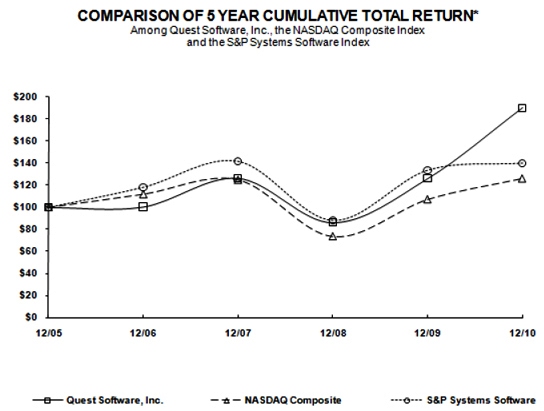
25
Table of Contents
| Item 6. | Selected Financial Data |
| Year ended/As of December 31 | ||||||||||||||||||||
| 2010 (1) | 2009 (2) | 2008 (3) | 2007 (4) | 2006 (5) | ||||||||||||||||
| (in thousands, except per share amounts) | ||||||||||||||||||||
Consolidated Income Statement Data: | ||||||||||||||||||||
Revenues: | ||||||||||||||||||||
Licenses | $ | 320,683 | $ | 279,238 | $ | 334,083 | $ | 308,652 | $ | 290,247 | ||||||||||
Services | 446,414 | 415,998 | 401,294 | 322,329 | 271,342 | |||||||||||||||
Total revenues | 767,097 | 695,236 | 735,377 | 630,981 | 561,589 | |||||||||||||||
Cost of revenues: | ||||||||||||||||||||
Licenses | 8,303 | 7,581 | 8,586 | 6,111 | 5,570 | |||||||||||||||
Services | 67,809 | 58,528 | 62,060 | 55,173 | 49,773 | |||||||||||||||
Amortization of purchased technology | 16,101 | 19,393 | 20,231 | 14,459 | 15,932 | |||||||||||||||
Total cost of revenues | 92,213 | 85,502 | 90,877 | 75,743 | 71,275 | |||||||||||||||
Gross profit | 674,884 | 609,734 | 644,500 | 555,238 | 490,314 | |||||||||||||||
Operating expenses: | ||||||||||||||||||||
Sales and marketing | 304,934 | 272,944 | 312,493 | 275,037 | 247,500 | |||||||||||||||
Research and development | 151,896 | 144,370 | 153,464 | 122,592 | 110,612 | |||||||||||||||
General and administrative | 84,808 | 76,748 | 84,954 | 81,758 | 65,821 | |||||||||||||||
Amortization of other purchased intangible assets | 12,670 | 13,159 | 11,302 | 7,345 | 6,758 | |||||||||||||||
In-process research and development | — | — | 955 | 220 | 960 | |||||||||||||||
Litigation loss provision, net(6) | — | 19,025 | — | — | — | |||||||||||||||
Total operating expenses | 554,308 | 526,246 | 563,168 | 486,952 | 431,651 | |||||||||||||||
Gain on sale of corporate aircraft | — | — | — | — | 3,987 | |||||||||||||||
Income from operations | 120,576 | 83,488 | 81,332 | 68,286 | 62,650 | |||||||||||||||
Other (expense) income, net | (5,657 | ) | 2,549 | 1,030 | 22,422 | 13,005 | ||||||||||||||
Income before income tax provision | 114,919 | 86,037 | 82,362 | 90,708 | 75,655 | |||||||||||||||
Income tax provision | 16,352 | 15,678 | 14,319 | 27,589 | 16,670 | |||||||||||||||
Net income | $ | 98,567 | $ | 70,359 | $ | 68,043 | $ | 63,119 | $ | 58,985 | ||||||||||
Basic net income per share | $ | 1.09 | $ | 0.77 | $ | 0.65 | $ | 0.62 | $ | 0.58 | ||||||||||
Diluted net income per share | $ | 1.06 | $ | 0.75 | $ | 0.64 | $ | 0.60 | $ | 0.57 | ||||||||||
Weighted average shares outstanding: | ||||||||||||||||||||
Basic | 90,411 | 91,926 | 104,192 | 101,819 | 101,380 | |||||||||||||||
Diluted | 93,282 | 94,066 | 106,261 | 105,284 | 104,103 | |||||||||||||||
Consolidated Balance Sheet Data: | ||||||||||||||||||||
Cash and cash equivalents and short-term and long-term investments(7) | $ | 492,829 | $ | 386,256 | $ | 260,362 | $ | 365,715 | $ | 390,160 | ||||||||||
Total assets | 1,635,584 | 1,465,138 | 1,345,659 | 1,319,130 | 1,161,537 | |||||||||||||||
Current and long-term portion of deferred revenue | 424,385 | 372,138 | 338,712 | 285,660 | 235,559 | |||||||||||||||
Short-term obligations | 93,818 | 114,049 | 88,804 | 96,302 | 104,936 | |||||||||||||||
Long-term obligations(8) | 85,115 | 86,159 | 44,391 | 39,842 | 2,129 | |||||||||||||||
Total stockholders’ equity | 1,032,266 | 892,792 | 873,752 | 897,326 | 818,913 | |||||||||||||||
| (1) | In 2010, we completed two acquisitions for total purchase consideration of $57.2 million (see Note 2 – Acquisitions of our Notes to Consolidated Financial Statements). |
| (2) | In 2009, we completed one acquisition for total purchase consideration of $15.0 million (see Note 2 – Acquisitions of our Notes to Consolidated Financial Statements). |
| (3) | In 2008, we completed five acquisitions for total purchase consideration of $144.3 million (see Note 2 – Acquisitions of our Notes to Consolidated Financial Statements). |
26
Table of Contents
| (4) | In 2007, we completed nine acquisitions for total purchase consideration of $157.1 million. |
| (5) | In 2006, we completed two acquisitions for total purchase consideration of $17.6 million. |
| (6) | Litigation loss provision recorded during 2009 with our settlement of the shareholder class action relating to our completed stock option investigation. |
| (7) | As of December 31, 2010, includes $0.5 million of restricted cash primarily relating to bank guarantees for our office leases overseas. As of December 31, 2009, includes $0.8 million of restricted cash primarily designated for our acquisition of PacketTrap Networks, Inc. As of December 31, 2008, includes $2.4 million of restricted cash designated for the satisfying of certain indemnification obligations related to escrow agreements with acquired companies where Quest is the holder of the escrow money. As of December 31, 2007, includes $48.9 million of restricted cash designated for the acquisition of PassGo Technologies Limited which closed on January 2, 2008. |
| (8) | Includes $41.4 million, $44.4 million, $40.8 million and $37.1 million as of December 31, 2010, 2009, 2008 and 2007, respectively, in long-term taxes payable recorded in compliance with provisions set forth in FASB’s standard onAccounting for Uncertainty in Income Taxes—An Interpretation of FASB’s standard on Accounting for Income Taxes, which we adopted on January 1, 2007. |
| Item 7. | Management’s Discussion and Analysis of Financial Condition and Results of Operations |
The following discussion of our financial condition and results of operations (“MD&A”) should be read in conjunction with the consolidated financial statements and notes to those statements included elsewhere in this Report. Certain statements in this Report, including statements regarding our business strategies, operations, financial condition, and prospects are forward-looking statements. Use of the words“believe,” “expect,” “anticipate,” “will,” “contemplate,” “would,” “project,” “plan,” “may,” “could,” “intend,” “likely,” “might,” “estimate,” “continue”and similar expressions that contemplate future events may identify forward-looking statements.
Numerous important factors, risks and uncertainties affect our operations and could cause actual results to differ materially from those expressed or implied by these or any other forward-looking statements made by us or on our behalf. Readers are urged to carefully review and consider the various disclosures made in this Report, including those described under Part I, Item 1A, Risk Factors, and in other filings with the SEC that attempt to advise interested parties of certain risks and factors that may affect our business, which are available on the SEC’s website at http://www.sec.gov. Readers are cautioned not to place undue reliance on these forward-looking statements, which are based on current expectations and reflect management’s opinions only as of the date thereof. We do not assume any obligation to revise or update forward-looking statements. Finally, our historic results should not be viewed as indicative of future performance.
Our Company and Business Model
Quest Software, Inc. delivers simple-to-use IT management software that saves time and money across physical, virtual, and cloud environments. In each of our product areas – Application Management, Database Management, Windows Management, and Virtualization Management – we concentrate on developing practical, innovative solutions to make IT tasks easier and less costly for our customers, who number more than 100,000 around the world. Our products are designed to simplify even the most complex IT tasks.
We have a diverse product portfolio that address customer needs across Windows technologies; databases; applications; or physical, virtual or cloud environments. We also offer support and professional services to our customers. The assistance of skilled support professionals is delivered through support centers located around the world. In addition, our Professional Services personnel are available to help with platform migrations and identity and access management, as well as optimizing, simplifying and extending IT infrastructure.
Our initial core competency as a database management company was built upon expertise within the Oracle database platform, where we assembled a portfolio of products to manage and speed the development on the platform. Today, Quest is best known for our Toad products, but we also offer many other types of database development and administration tools that help our customers improve IT productivity, and boost database performance for Oracle, SQL Server, DB2, MySQL, Sybase ASE and Visual Studio.
Foglight® remains our flagship product and the largest revenue component of our application management product area, and we have continually evolved the development of products for this market. Today, our solutions simplify performance monitoring and management of complex ERP and web-based applications for Java, .NET, CRM and custom applications.
27
Table of Contents
Our broad portfolio of Windows management products simplifies IT tasks on almost every Microsoft platform, and represents the largest portion of our total revenues. Today, Quest is one of Microsoft’s leading Independent Software Vendors with solutions that help our customers automate, secure and extend Microsoft infrastructure and Windows desktops.
Our virtualization management product area grew from the acquisition of Vizioncore into our position today as a leading independent software vendor in the virtualization management space. Our robust portfolio of solutions spans server virtualization, desktop virtualization, and cloud automation while supporting multiple hypervisor platforms.
In January 2011, we acquired BakBone Software to complement our data protection portfolio, particularly in the areas of virtual server backup and recovery. This acquisition brings additional technologies and products which provide data protection solutions across heterogeneous physical, virtual and application-level environments.
Strategic acquisitions and investments have been a key part of our corporate strategy. Over the past three years, we spent approximately $210.6 million on 8 acquisitions and invested $10.5 million in 4 early stage private companies. This strategic deployment of capital covered many of our existing market segments, including Application Management, Windows Management, and Virtualization Management. We intend to continue to identify and acquire companies in adjacent or contiguous markets, as we have done in the past. We have also used acquisitions and investments to build upon or extend our core competencies with incremental technology to increase our existing product functionality or complete a key portion of a deliverable on the product roadmap.
We derive revenues from three primary sources: (1) software licenses, (2) post-contract technical support services (“maintenance”) and (3) consulting and training services. Our software licensing model is primarily based on perpetual license fees. In addition to perpetual software licenses, we sell a small amount of time-based software licenses (or term licenses), wherein customers pay a single fee for the right to use the software and receive maintenance for a defined period of time. Our license fees are typically calculated either on a per-server basis, per managed user or a per-seat/user basis.
Maintenance contracts entitle a customer to telephone or internet support and unspecified maintenance releases, updates and enhancements. First-year maintenance contracts are typically sold with the related perpetual software license and renewed on an annual basis thereafter at the customer’s option. Generally, annual maintenance renewal fees are priced as a percentage of the net initial customer purchase price (which includes both the fee for a perpetual license and first year maintenance). Revenue is allocated to first year maintenance based on vendor-specific objective evidence (“VSOE”) of fair value and amortized over the term of the maintenance contract, typically 12 months, although at times, we sell maintenance with terms of greater than 12 months.
We also provide consulting and training services that relate to the installation and configuration of our products, but do not include significant customization to or development of the underlying software code. Revenue allocated to consulting and training services is analyzed based on VSOE of fair value and recognized as the services are performed. Such revenues represented 10.4 percent, 9.1 percent and 10.2 percent of total services revenues for the years ended December 31, 2010, 2009 and 2008, respectively.
Summary of Consolidated Financial Results
As discussed in more detail throughout our MD&A, for the year ended December 31, 2010 compared to the year ended December 31, 2009, we delivered the following financial performance:
| • | Total revenues increased by $71.9 million, or 10.3%, to $767.1 million; |
| • | Total expenses increased by $34.8 million, or 5.7%, to $646.5 million; |
| • | Income from operations increased by $37.1 million, or 44.4%, to $120.6 million; |
| • | Other (expense) income, net decreased from a gain of $2.5 million to a loss of $5.7 million; |
| • | Diluted earnings per share increased by $0.31, or 41.3%, to $1.06; |
| • | Weighted average basic and diluted shares outstanding decreased from 91.9 million and 94.1 million in 2009 to 90.4 million and 93.2 million in 2010. |
28
Table of Contents
Our 2010 total revenues increased by 10.3% compared to the same period in 2009. Our Americas sales region, which includes United States, Canada and Latin America, as well as our Asia Pacific (“APAC”) sales region, delivered a strong performance throughout the year. Our EMEA sales region, which includes Europe, the Middle East and Africa, showed significant improvement in the last quarter of the year which contributed to an increase in revenues for the year compared to the same period in 2009. Our Americas sales region contributed 65.4% of total revenues and the rest of the world contributed 34.6% of total revenues in 2010 as compared to 65.9% and 34.1% in the comparable period last year.
Our license revenues grew 14.8% compared to the same period in 2009. The increase in our total revenues was primarily driven by increased sales of our Windows Management products, particularly our Exchange, Migration & Identity Management solutions, and related professional services. We expect continued strength in our Windows Management products due to our customers’ migration to Microsoft Exchange Server 2010 and the growth within the Identity and Access Management (“IDAM”) market. The continued need for IT system access controls to comply with existing and new regulations and the growing need to automate and control end-user access to IT resources are driving our IDAM growth. In addition, we acquired Völcker in July 2010 and Surgient in August 2010 (refer to Note 2 – Acquisitions of our Notes to Consolidated Financial Statements for further details). These acquisitions contributed to approximately 8.1% of our overall increase in total revenues compared to the same period in 2009. Our acquisition of Völcker gives us access to a larger aspect of the Identity Access Management market and the continued expansion of our Identity Management solution capabilities whereas with Surgient, we added private cloud management capabilities to our virtualization product portfolio. In January 2011, we acquired BakBone Software to complement our data protection portfolio, particularly in the areas of virtual server backup and recovery. This acquisition gives us additional technologies to provide data protection solutions across heterogeneous physical, virtual and application-level environments, making Quest a leader in the data protection market. Revenues from our Virtualization Management products increased significantly compared to the same period in 2009. We expect this trend to continue as companies continue to embrace virtual computing. We believe we are well positioned to capitalize on this major growth trend as we offer flexible solutions for managing virtualized IT infrastructure.
Total revenues in fiscal year 2010 were positively impacted by the weak U.S. Dollar relative to certain non-U.S. Dollar currencies, partially offset by a strong U.S. Dollar relative to the Euro and British Pound in the second half of the year. The impact from foreign currency resulted in higher US dollar equivalent sales of approximately $1.7 million.
Total expenses increased compared to the same period in 2009. Our expenses primarily consist of personnel costs, which include compensation, benefits and payroll related taxes and are primarily a function of our worldwide headcount. Our average full-time employee headcount for the fiscal year 2010 decreased to 3,336 compared to 3,425 for fiscal year 2009. Our average full-time employee headcount in locations outside of the United States was 1,546 for fiscal year 2010, a decrease of 67 compared to 1,613 for fiscal year 2009. Our total expenses in fiscal year 2010 were impacted by the weak U.S. Dollar, partially offset by a strong U.S. Dollar relative to the Euro and British Pound in the second half of the year, which resulted in higher U.S. Dollar equivalent expenses. Our total expenses in fiscal year 2010 increased by $6.2 million compared to the same period in 2009 as a result of the impact of foreign currency exchange rates when comparing 2010 rates to 2009. Net increase in total expenses was primarily due to the increase in sales and marketing expenses, $17.9 million of which was due to higher sales commissions and bonuses as a result of higher revenues compared to the fiscal year 2009. Also, our acquisitions of Völcker and Surgient contributed to approximately $6.8 million of the net increase in total expenses relating to their operating costs.
Foreign Currency
While we are a U.S. Dollar functional company on a world-wide basis, we transact business and operate using multiple foreign currencies. As such, the value of our revenues, expenses, certain account balances and cash flows are exposed to fluctuations in foreign currencies against the value of the U.S. Dollar. For example, when the U.S. Dollar strengthens against several non-U.S. Dollar currencies as has recently occurred, our foreign revenues and thus our total revenues can be negatively impacted. A stronger U.S. Dollar translates into lower expenses in those entities where we have operations and our personnel and occupancy expenses are denominated in non-U.S. Dollars, resulting in lower total expenses. Conversely, a weaker U.S. Dollar would have the opposite effects on total revenues and expenses. In certain geographic regions and within specific currencies, partial offsets between revenues and expenses or balance sheet positions may reduce this exposure. In other instances, we can manage our operations to reduce foreign currency exposure or utilize derivative instruments to manage this exposure. See Note 14 – Derivative Instruments of our Notes to Consolidated Financial Statements for additional details.
29
Table of Contents
The following are percentage of total revenues:
| Year Ended December 31 | ||||||||||||
| 2010 | 2009 | 2008 | ||||||||||
Revenues: | ||||||||||||
Licenses | 41.8 | % | 40.2 | % | 45.4 | % | ||||||
Services | 58.2 | 59.8 | 54.6 | |||||||||
Total revenues | 100.0 | 100.0 | 100.0 | |||||||||
Cost of revenues: | ||||||||||||
Licenses | 1.1 | 1.1 | 1.2 | |||||||||
Services | 8.8 | 8.4 | 8.4 | |||||||||
Amortization of purchased technology | 2.1 | 2.8 | 2.8 | |||||||||
Total cost of revenues | 12.0 | 12.3 | 12.4 | |||||||||
Gross profit | 88.0 | 87.7 | 87.6 | |||||||||
Operating expenses: | ||||||||||||
Sales and marketing | 39.8 | 39.3 | 42.5 | |||||||||
Research and development | 19.8 | 20.8 | 20.9 | |||||||||
General and administrative | 11.0 | 11.0 | 11.6 | |||||||||
Amortization of other purchased intangible assets | 1.7 | 1.9 | 1.5 | |||||||||
In-process research and development | — | — | 0.1 | |||||||||
Litigation loss provision, net | — | 2.7 | — | |||||||||
Total operating expenses | 72.3 | 75.7 | 76.6 | |||||||||
Income from operations | 15.7 | 12.0 | 11.0 | |||||||||
Other (expense) income, net | (0.7 | ) | 0.4 | 0.1 | ||||||||
Income before income tax provision | 15.0 | 12.4 | 11.1 | |||||||||
Income tax provision | 2.1 | 2.3 | 1.9 | |||||||||
Net income | 12.9 | % | 10.1 | % | 9.2 | % | ||||||
Comparison of Fiscal Years Ended December 31, 2010 and 2009
Revenues
Total revenues and year-over-year changes are as follows (in thousands, except for percentages):
| 2010 | 2009 | Increase/(Decrease) | ||||||||||||||
| Dollars | Percentage | |||||||||||||||
Revenues: | ||||||||||||||||
Licenses | ||||||||||||||||
Americas | $ | 204,089 | $ | 177,120 | $ | 26,969 | 15.2% | |||||||||
Rest of World | 116,594 | 102,118 | 14,476 | 14.2% | ||||||||||||
Total license revenues | 320,683 | 279,238 | 41,445 | 14.8% | ||||||||||||
Services | ||||||||||||||||
Americas | 297,479 | 281,378 | 16,101 | 5.7% | ||||||||||||
Rest of World | 148,935 | 134,620 | 14,315 | 10.6% | ||||||||||||
Total service revenues | 446,414 | 415,998 | 30,416 | 7.3% | ||||||||||||
Total revenues | $ | 767,097 | $ | 695,236 | $ | 71,861 | 10.3% | |||||||||
| �� | ||||||||||||||||
30
Table of Contents
Our revenues for fiscal year 2010 are comprised of 41.8% of license revenues and 58.2% of service revenues compared to 40.2% of license revenues and 59.8% of service revenues in fiscal year 2009.
Licenses Revenues— The increase in license revenues was due primarily to increased sales of our Windows Management products across all geographic regions. Our Windows products, led by migration, continued to perform well due to customers’ adoption of Exchange 2010. Also, our Identity and Access Management products, a key growth area in our Windows Management business, continued to expand and gain market share with the Quest One Identity Solution. Our 2010 license revenues were also positively impacted by the weak U.S. Dollar relative to certain non-U.S. Dollar currencies in 2010, partially offset by strong U.S. Dollar relative to the Euro and British Pound. This resulted in a higher U.S. Dollar equivalent for several currencies. Since certain of our international sales are denominated in these non-U.S. Dollar currencies, the impact from foreign currency comprised approximately $1.6 million, or 3.8% of the overall increase in license revenues.
Services Revenues— Services revenues are derived from post-contract technical support services (“maintenance”) and consulting and training services. The largest component of our services revenues is maintenance revenue. Maintenance revenues are generated from support and maintenance services relating to current year sales of new software products and from the renewal of existing maintenance agreements for software licenses sold in prior periods. The main driver of our growth in services revenues was maintenance renewals on our Windows Management products across geographic regions. Also, contributing to the growth in services revenues were maintenance renewals on our Virtualization Management products across all geographic regions. Maintenance revenues from our Database Management products decreased particularly in the Americas region. Revenue from consulting and training services as a percentage of total service revenues was approximately 10.4% and 9.1% of total service revenues in the twelve months ended December 31, 2010 and 2009, respectively.
Maintenance revenues continue to contribute a larger percentage of our total revenues primarily because of maintenance contracts associated with our growing installed base of customers and because maintenance contract growth exceeds that of license contracts from time to time. As our maintenance customer base grows, maintenance renewals have a larger influence on the maintenance revenue growth rate and the amount of new software license revenues has a diminishing effect. Therefore, the growth rate of total revenues does not necessarily correlate directly to the growth rate of new software license revenues in a given period. The primary determinant of changes in our maintenance revenue profile is the extent to which our customers renew their annual maintenance agreements, taking into account the number of products and licenses for which each customer renews, and the timing of the renewals by each such customer. If our maintenance renewals were to decline materially, our maintenance revenues, total revenues and cash flows would likely decline materially as well.
Cost of Revenues
Total cost of revenues and year-over-year changes are as follows (in thousands, except for percentages):
| 2010 | 2009 | Increase/(Decrease) | ||||||||||||||
| Dollars | Percentage | |||||||||||||||
Cost of Revenues: | ||||||||||||||||
Licenses | $ | 8,303 | $ | 7,581 | $ | 722 | 9.5% | |||||||||
Services | 67,809 | 58,528 | 9,281 | 15.9% | ||||||||||||
Amortization of purchased technology | 16,101 | 19,393 | (3,292) | (17.0)% | ||||||||||||
Total cost of revenues | $ | 92,213 | $ | 85,502 | $ | 6,711 | 7.9% | |||||||||
Cost of Licenses— Cost of licenses primarily consists of third-party software royalties, product packaging, delivery, and personnel costs. Cost of licenses as a percentage of license revenues was 2.6% and 2.7% for the twelve months ended December 31, 2010 and 2009.
Cost of Services— Cost of services primarily consists of personnel, outside consultants, facilities and systems costs used in providing maintenance, consulting and training services. Cost of services does not include development costs related to bug fixes and upgrades which are classified in research and development and which are not separately determinable. Cost of services as a percentage of service revenues was 15.2% and 14.1% in the twelve months ended December 31, 2010 and 2009, respectively. Personnel related costs and general expenses increased by $4.2 million and $2.4 million, respectively. The impact from foreign currency comprised approximately 8.1% of the overall increase in cost of services.
Amortization of Purchased Technology— Amortization of purchased technology includes amortization of the fair value of purchased technology associated with acquisitions. The decrease is due to past acquisition-related purchased technology being fully amortized prior to January 1, 2010 coupled with fewer acquisitions completed during the past 18 months compared to the same period in 2009.
31
Table of Contents
Operating Expenses
Year-over-year changes in the principal components of our operating expenses are as follows (in thousands, except for percentages):
| 2010 | 2009 | Increase/(Decrease) | ||||||||||||||
| Dollars | Percentage | |||||||||||||||
Operating Expenses: | ||||||||||||||||
Sales and marketing | $ | 304,934 | $ | 272,944 | $ | 31,990 | 11.7% | |||||||||
Research and development | 151,896 | 144,370 | 7,526 | 5.2% | ||||||||||||
General and administrative | 84,808 | 76,748 | 8,060 | 10.5% | ||||||||||||
Amortization of other purchased intangible assets | 12,670 | 13,159 | (489) | (3.7)% | ||||||||||||
Litigation loss provision, net | — | 19,025 | (19,025) | (100.0)% | ||||||||||||
Total operating expenses | $ | 554,308 | $ | 526,246 | $ | 28,062 | 5.3% | |||||||||
Sales and Marketing— Sales and marketing expenses consist primarily of compensation and benefit costs for sales and marketing personnel, sales commissions, and costs of trade shows, travel and entertainment and various discretionary marketing programs. Sales and marketing expenses as a percentage of total revenues for 2010 was 39.8%, which is comparable to 39.3% in 2009. The increase in sales and marketing expense during the twelve months ended December 31, 2010 over the comparable period in 2009 was due primarily to an increase in personnel related costs of $25.2 million, $17.9 million of which relates to higher sales commissions expense and bonuses due to higher revenues compared to the twelve months ended December 31, 2009 and the performance salary increase program effective July 1, 2010. We implemented a sales plan incentive that is tied to achieving consistent performance throughout the year. We started the year with fewer sales employees which in turn yielded larger territories. Thus, as our sales employees exceeded plan during each quarter, we had more sales employees enter into the higher tiers of their compensation plans. Our average full time sales and marketing employee headcount for the twelve months ended December 31, 2010 decreased by 74 employees. Also, travel-related expenses and general expenses increased by approximately $7.0 million compared to the same period in 2009, primarily due to the events of VM World and Oracle Open World. The impact from foreign currency comprised approximately 5.1% of the overall increase in sales and marketing expenses.
Research and Development— Research and development expenses consist primarily of compensation and benefit costs for software developers who develop new products, bug fixes and upgrades to existing products and at times provide engineering support for maintenance services, software product managers, quality assurance and technical documentation personnel, and payments made to outside software development consultants in connection with our ongoing efforts to enhance our core technologies and develop additional products. Research and development expenses as a percentage of total revenues was 19.8% and 20.8% for the twelve months ended December 31, 2010 and 2009, respectively. The increase in research and development expense during the twelve months ended December 31, 2010 as compared to the same period in 2009 was due primarily to a $5.7 million increase in personnel related costs (partly due to our performance salary increase program effective July 1, 2010), $2.6 million of which relates to stock-based compensation expense. Our average full-time research and development employee headcount for 2010 was 1,150 compared to1,197 in 2009. Also, research and development expenses increased due to the impact of the weak U.S. Dollar in fiscal year 2010, partially offset by a strong U.S. Dollar relative to the Euro and British Pound in the second half of 2010, as a significant portion of our developers are located outside of the U.S. Foreign currency had a negative impact of approximately 45.7% of the increase in research and development expenses for the twelve months ended December 31, 2010.
General and Administrative— General and administrative expenses consist primarily of compensation and benefit costs for our executive, finance, legal, human resources, administrative and information services personnel, and professional fees for audit, tax and legal services. General and administrative expenses as a percentage of total revenues was 11.1% and 11.0% for the twelve months ended December 31, 2010 and 2009, respectively. The increase in general and administrative expense during the twelve months ended December 31, 2010 over the comparable period in 2009 was due mainly to an increase in personnel related costs of $7.0 million (partly due to our performance salary increase program effective July 1, 2010), $3.1 million of which relates to stock-based compensation expense.
Amortization of Other Purchased Intangible Assets— Amortization of other purchased intangible assets includes the amortization of customer lists, trademarks and trade names, non-compete agreements and maintenance contracts associated
32
Table of Contents
with acquisitions. The decrease is due to past acquisition-related other purchased intangible assets being fully amortized prior to January 1, 2010 coupled with fewer acquisitions completed during the past 18 months compared with the same period in 2009.
Litigation Loss Provision, Net— Litigation loss provision, net of $19.0 million in 2009 relates to a $29.4 million settlement of our completed stock option investigation, which amount was offset by approximately $10 million in insurance proceeds paid by our insurance providers.
Other (Expense) Income, Net
Other (expense) income, net consists of the following (in thousands):
| Increase/(Decrease) | ||||||||||||||||
| 2010 | 2009 | Dollars | Percentage | |||||||||||||
Interest income | $ | 2,393 | $ | 1,863 | $ | 530 | 28.4% | |||||||||
Interest expense | (4,445) | (2,827 | ) | (1,618) | (57.2)% | |||||||||||
Foreign currency (loss) gain, net | (3,211) | 3,640 | (6,851) | (188.2)% | ||||||||||||
Forward foreign currency contracts loss, net | (459) | (893 | ) | 434 | (48.6)% | |||||||||||
Other income | 65 | 766 | (701) | (91.5)% | ||||||||||||
Total other (expense) income, net | $ | (5,657) | $ | 2,549 | $ | (8,206) | (321.9)% | |||||||||
Other (expense) income, net primarily includes interest income generated by our investment portfolio, interest expense from our borrowings, gains and losses from foreign exchange fluctuations and gains or losses on other financial assets as well as a variety of other non-operating expenses. Other (expense) income, net was $(5.7) million in the twelve months ended December 31, 2010 compared to $2.5 million in the same period of 2009. Interest expense was $4.4 million and $2.8 million in the twelve months ended December 31, 2010 and 2009, respectively. The increase in interest expense is due to debt agreements entered into in the second half of 2009. See Note 8 – Loans Payable of our Notes to Consolidated Financial Statements for additional information regarding our debt agreements. Interest income was $2.3 million and $1.9 million in the twelve months ended December 31, 2010 and 2009, respectively. The increase in interest income was due primarily to higher average investment yields and average cash and investment balances. We had a foreign currency (loss) gain of $(3.2) million and $3.6 million for the twelve months ended December 31, 2010 and 2009, respectively. Our foreign currency gains or losses are predominantly attributable to translation gains or losses relative to the U.S. Dollar on the re-measurement of net monetary assets, including accounts receivable and cash, which were primarily denominated in the Euro, and to a lesser extent, the British Pound and Canadian Dollar. Other income includes unrealized gains on our ARS offset by unrealized losses on our Put Options (see Note 4 – Cash and Cash Equivalents and Investments of our Notes to Consolidated Financial Statements for details).
Income Tax Provision
During the twelve months ended December 31, 2010, the provision for income taxes increased to $16.4 million from $15.7 million in the comparable period of 2009, representing an increase of $0.7 million. The effective income tax rate decreased to 14.2% in 2010, compared to 18.2% in 2009. The decrease in the effective tax rate is primarily related to a combination of factors including the mix of income between high and low tax jurisdictions, incremental tax credit benefits and the release of reserves associated with the passing of the statute of limitations relating to U.S. federal income taxes for the tax years ended December 31, 2005 and December 31, 2006 (refer to Note 10 – Income Taxes of our Notes to Consolidated Financial Statements for detail discussion of our income taxes).
Comparison of Fiscal Years Ended December 31, 2009 and 2008
Revenues
Total revenues and year-over-year changes are as follows (in thousands, except for percentages):
| 2009 | 2008 | Increase/(Decrease) | ||||||||||||||
| Dollars | Percentage | |||||||||||||||
Revenues: | ||||||||||||||||
Licenses | ||||||||||||||||
Americas | $ | 177,120 | $ | 192,781 | $ | (15,661 | ) | (8.1 | )% | |||||||
Rest of World | 102,118 | 141,302 | (39,184 | ) | (27.7 | )% | ||||||||||
Total license revenues | 279,238 | 334,083 | (54,845 | ) | (16.4 | )% | ||||||||||
Services | ||||||||||||||||
Americas | 281,378 | 265,230 | 16,148 | 6.1 | % | |||||||||||
Rest of World | 134,620 | 136,064 | (1,444 | ) | (1.1 | )% | ||||||||||
Total service revenues | 415,998 | 401,294 | 14,704 | 3.7 | % | |||||||||||
Total revenues | $ | 695,236 | $ | 735,377 | $ | (40,141 | ) | (5.5 | )% | |||||||
33
Table of Contents
Licenses Revenues— The decrease in license revenues was due primarily to decreased sales of our Database Management products across all geographic regions and Windows Management products in our Europe, the Middle East and Africa (“EMEA”) region. In 2009 we sold significantly more term-based licenses, which resulted in $22.9 million of deferred license revenue at the end of 2009 compared to $6.9 million in 2008, representing an approximate $16 million increase in deferred license revenue that would have otherwise been recognized as license revenue in 2009 had those same sales been perpetual based. Our 2009 license revenues were also negatively impacted by the strengthening U.S. Dollar relative to certain non-U.S. Dollar currencies in 2009. This resulted in a lesser U.S. Dollar equivalent for several currencies including the Euro and British Pound. Since certain of our international sales are denominated in these non-U.S. Dollar currencies, the impact from foreign currency comprised approximately 16% of the overall decrease in license revenues.
Services Revenues— Services revenues are derived from post-contract technical support services (“maintenance”) and consulting and training services. The largest component of our services revenues is maintenance revenue. Maintenance revenues are generated from support and maintenance services relating to current year sales of new software products and from the renewal of existing maintenance agreements for software licenses sold in prior periods. The main driver of our growth in services revenues was maintenance renewals on our Windows Management products in the Americas. Also contributing to the growth in services revenues were maintenance renewals on our Virtualization Management products across all geographic regions. Maintenance revenues from our Database Management products decreased particularly in the EMEA region. Revenue from consulting and training services as a percentage of total service revenues was approximately 9.1% and 10.2% of total service revenues in the twelve months ended December 31, 2009 and 2008, respectively.
Maintenance revenues continue to contribute a larger percentage of our total revenues for two primary reasons: growth of our installed base of customers via new license sales, and acquisitions and their related maintenance contracts. As our maintenance customer base grows, maintenance renewals have a larger influence on the maintenance revenue growth rate and the amount of new software license revenues has a diminishing effect. Therefore, the growth rate of total revenues does not necessarily correlate directly to the growth rate of new software license revenues in a given period. The primary determinant of changes in our maintenance revenue profile is the extent to which our customers renew their annual maintenance agreements, taking into account the number of products and licenses for which each customer renews, and the timing of the renewals by each such customer. If our maintenance renewals were to decline materially, our maintenance revenues, total revenues and cash flows would likely decline materially as well.
Over the past twelve months we have experienced declining growth in our maintenance revenues and expect this trend to continue through at least 2010. The three main reasons for this decline are: reduced sales of new software licenses during 2009; fewer acquisitions which resulted in less revenue contribution from acquired deferred maintenance revenues; and impact from foreign currency.
Cost of Revenues
Total cost of revenues and year-over-year changes are as follows (in thousands, except for percentages):
| 2009 | 2008 | Decrease | ||||||||||||||
| Dollars | Percentage | |||||||||||||||
Cost of Revenues: | ||||||||||||||||
Licenses | $ | 7,581 | $ | 8,586 | $ | (1,005 | ) | (11.7 | )% | |||||||
Services | 58,528 | 62,060 | (3,532 | ) | (5.7 | )% | ||||||||||
Amortization of purchased technology | 19,393 | 20,231 | (838 | ) | (4.1 | )% | ||||||||||
Total cost of revenues | $ | 85,502 | $ | 90,877 | $ | (5,375 | ) | (5.9 | )% | |||||||
Cost of Licenses— Cost of licenses primarily consists of third-party software royalties, product packaging, delivery, and personnel costs. Cost of licenses as a percentage of license revenues was 2.7% and 2.6% for the twelve months ended December 31, 2009 and 2008. The decrease in cost of licenses was due primarily to a $0.6 million reduction in hardware and inventory purchases that are sold with certain of our software products and a $0.3 million reduction in delivery costs.
34
Table of Contents
Cost of Services— Cost of services primarily consists of personnel, outside consultants, facilities and systems costs used in providing maintenance, consulting and training services. Cost of services does not include development costs related to bug fixes and upgrades which are classified in research and development and which are not separately determinable. Personnel related costs and travel decreased by $2.0 million and $1.0 million, respectively. An additional $0.8 million of the overall decrease in cost of services was due to lower consulting and other professional fees. The impact from foreign currency comprised approximately 80% of the overall decrease in cost of services. Cost of services as a percentage of service revenues was 14.1% and 15.5% in the twelve months ended December 31, 2009 and 2008, respectively.
Amortization of Purchased Technology— Amortization of purchased technology includes amortization of the fair value of purchased technology associated with acquisitions. We expect amortization of purchased technology within the cost of revenues arising from acquisitions completed prior to December 31, 2009 to be not less than $15.1 million in the year ending December 31, 2010.
Operating Expenses
Year-over-year changes in the principal components of our operating expenses are as follows (in thousands, except for percentages):
| 2009 | 2008 | Increase/(Decrease) | ||||||||||||||
| Dollars | Percentage | |||||||||||||||
Operating Expenses: | ||||||||||||||||
Sales and marketing | $ | 272,944 | $ | 312,493 | $ | (39,549 | ) | (12.7 | )% | |||||||
Research and development | 144,370 | 153,464 | (9,094 | ) | (5.9 | )% | ||||||||||
General and administrative | 76,748 | 84,954 | (8,206 | ) | (9.7 | )% | ||||||||||
Amortization of other purchased intangible assets | 13,159 | 11,302 | 1,857 | 16.4 | % | |||||||||||
In-process research and development | — | 955 | (955 | ) | (100 | )% | ||||||||||
Litigation loss provision, net | 19,025 | — | 19,025 | — | % | |||||||||||
Total operating expenses | $ | 526,246 | $ | 563,168 | $ | (36,922 | ) | (6.6 | )% | |||||||
Sales and Marketing— Sales and marketing expenses consist primarily of compensation and benefit costs for sales and marketing personnel, sales commissions, and costs of trade shows, travel and entertainment and various discretionary marketing programs. The decrease in sales and marketing expense during the twelve months ended December 31, 2009 over the comparable period in 2008 was due primarily to a $26.9 million decrease in personnel related costs and a $4.9 million decrease in travel costs. The decrease in personnel related costs was due primarily to reductions in commissions, base salary and related payroll taxes, stock-based compensation and bonuses. We also had a $3.6 million decrease in conferences and trade show costs and a $1.4 million decrease in advertising costs. The impact from foreign currency comprised approximately 32% of the overall decrease in sales and marketing expense.
Research and Development— Research and development expenses consist primarily of compensation and benefit costs for software developers who develop new products, bug fixes and upgrades to existing products and at times provide engineering support for maintenance services, software product managers, quality assurance and technical documentation personnel, and payments made to outside software development consultants in connection with our ongoing efforts to enhance our core technologies and develop additional products. The decrease in research and development expense during the twelve months ended December 31, 2009 as compared to the same period in 2008 was due primarily to a $5.1 million decrease in personnel related costs and a $1.8 million decrease in travel costs. Also, expenditures related to certain post-acquisition contingent payment obligations that were tied to technology milestones decreased by approximately $2.7 million. Research and development expenses were also impacted by the increased value of the U.S. Dollar as a significant portion of our developers are located outside of the U.S. The impact from foreign currency comprised approximately 90% of the overall decrease in research and development expenses.
General and Administrative— General and administrative expenses consist primarily of compensation and benefit costs for our executive, finance, legal, human resources, administrative and information services personnel, and professional fees for audit, tax and legal services. The decrease in general and administrative expense during the twelve months ended December 31, 2009 over the comparable period in 2008 was due primarily to a decrease of $5.5 million in personnel related costs and a $0.5 million decrease in travel costs. Lower corporate insurance, recruiting and legal costs contributed $3.1 million to the overall decrease in general and administrative costs. The impact from foreign currency comprised approximately 22% of the overall decrease in general and administrative expenses.
35
Table of Contents
Amortization of Other Purchased Intangible Assets— Amortization of other purchased intangible assets includes the amortization of customer lists, trademarks, non-compete agreements and maintenance contracts associated with acquisitions. The increase in amortization of other purchased intangible assets during the twelve months ended December 31, 2009 over the comparable period in 2008 was due primarily to a full twelve months of amortization of intangibles acquired during the last half of 2008, resulting in an increase of $3.7 million. The increase from 2008 acquired intangibles was partially offset by certain other purchased intangible assets that were fully amortized prior to the twelve months ended December 31, 2009. We expect amortization of other purchased intangible assets within operating expenses arising from acquisitions completed prior to December 31, 2009 to be not less than $12.1 million in the year ending December 31, 2010.
In-Process Research and Development— In-process research and development expenses relate to in-process technology acquired in May 2008. These costs were charged to operations as the technologies had not reached technological feasibility and did not have alternative future uses at the date of acquisition.
Litigation Loss Provision, Net— Litigation loss provision, net of $19.0 million relates to a $29.4 million settlement of the shareholder class action for alleged stock option backdating filed in October 2006 in the U.S. District Court for the Central District of California against Quest and certain of our current or former officers and directors, which amount was offset by approximately $10 million in insurance proceeds paid by our insurance providers in the fourth quarter of 2009.
Other Income, Net
Other income, net consists of the following (in thousands):
| Year Ended December 31 | ||||||||
| 2009 | 2008 | |||||||
Interest income | $ | 1,863 | $ | 10,972 | ||||
Interest expense | (2,827 | ) | (128 | ) | ||||
Foreign currency gain (loss), net(1) | 3,640 | (7,532 | ) | |||||
Forward foreign currency contracts loss, net(2) | (893 | ) | — | |||||
Unrealized gains (losses) on ARS(3) | 5,172 | (8,515 | ) | |||||
Unrealized (losses) gains on Put Options(3) | (4,543 | ) | 7,873 | |||||
Impairment losses on cost method investments | — | (2,001 | ) | |||||
Other income | 137 | 361 | ||||||
Total other income, net | $ | 2,549 | $ | 1,030 | ||||
Other income, net primarily includes interest income generated by our investment portfolio, gains and losses from foreign exchange fluctuations and gains or losses on other financial assets as well as a variety of other non-operating expenses. Other income, net was $2.5 million in the twelve months ended December 31, 2009 compared to $1.0 million in the same period of 2008. Interest expense was $2.8 million and $0.1 million in the twelve months ended December 31, 2009 and 2008, respectively. The increase in interest expense is due to debt agreements entered into in 2009. Interest income was $1.9 million and $11.0 million in the twelve months ended December 31, 2009 and 2008, respectively. The decrease in interest income was due primarily to lower average investment yields and average cash and investment balances. We had a foreign currency gain of $3.6 million and a loss of $7.5 million for the twelve months ended December 31, 2009 and 2008, respectively. Our foreign currency gains or losses are predominantly attributable to translation gains or losses relative to the U.S. Dollar on the re-measurement of net monetary assets, including accounts receivable and cash, which were primarily denominated in the Euro, and to a lesser extent, the British Pound and Canadian Dollar.
Income Tax Provision
During the twelve months ended December 31, 2009, the provision for income taxes increased to $15.7 million from $14.3 million in the comparable period of 2008, representing an increase of $1.4 million. The effective income tax rate increased to 18.2% in 2009, compared to 17.4% in 2008. The increase in the effective tax rate is primarily related to a combination of factors including the mix of income between high and low tax jurisdictions, a net benefit due to the closure of a California Franchise Tax Audit during the year ended December 31, 2009, and the closure of an Internal Revenue Service examination which provided a benefit during the year ended December 31, 2008.
36
Table of Contents
Inflation
Economic inflation has not had a significant effect on our results of operations or financial position for the years ended December 31, 2010, 2009 and 2008.
Liquidity and Capital Resources
Cash and cash equivalents and short-term and long-term investments were approximately $492.3 million and $385.5 million as of December 31, 2010 and 2009, respectively. Of these amounts, $282.6 million and $214.1 million as of December 31, 2010 and 2009, respectively, are domiciled in locations outside of the U.S. We do not expect the repatriation of cash balances from certain of our foreign subsidiaries to fund our activities within the U.S. as this would result in payment of U.S. income taxes.
At December 31, 2009, we had within short-term investments $47.6 million par value (with a fair value of $44.2 million) of investment grade municipal notes with an auction reset feature (“auction rate securities” or “ARS”). These securities are collateralized by higher education funded student loans which are supported by the federal government as part of the Federal Family Education Loan Program (“FFELP”). In October 2008, we entered into agreements (the “Agreements”) with the investment firm that sold us our ARS. By entering into the Agreements, we (1) received the right (“Put Options”) to sell all of our ARS back to the investment firm at par, at our sole discretion, anytime during the period from June 30, 2010 through July 2, 2012, (2) gave the investment firm the right to purchase all of our ARS or sell them on our behalf at par anytime after the execution of the Agreements through July 2, 2012, (3) received an offer for a “no net cost” loan for up to 70% of the par value of the ARS until June 30, 2010, and (4) agreed to release the investment firm from certain potential claims related to the collateralized ARS in certain specified circumstances. We exercised our Put Options in July 2010 under the Agreements and redeemed our remaining ARS at par value.
Summarized annual cash flow information is as follows (in thousands):
| 2010 | 2009 | 2008 | ||||||||||
Cash provided by operating activities | $ | 185,309 | $ | 153,286 | $ | 151,851 | ||||||
Cash used in investing activities | (116,451 | ) | (70,084) | (76,047 | ) | |||||||
Cash used in financing activities | (6,175 | ) | (3,706) | (101,927 | ) | |||||||
Effect of exchange rate changes | 910 | (2,451) | 6,450 | |||||||||
Net increase (decrease) in cash and cash equivalents | $ | 63,593 | $ | 77,045 | $ | (19,673 | ) | |||||
Operating Activities
Cash provided by operating activities is primarily comprised of net income, adjusted for non-cash activities such as depreciation and amortization and compensation expense associated with stock-based payments. In 2009, we paid approximately $19.0 million relating to the settlement of our completed stock option investigation.
The non-cash adjustments represent charges reflected in net income, therefore, to the extent that non-cash items increase or decrease our future operating results, there will be no corresponding impact on our cash flows. After excluding the effects of these non-cash charges, the primary changes in cash flows relating to operating activities resulted from changes in operating assets and liabilities. The analyses of the changes in our operating assets and liabilities are as follows:
| • | Accounts receivable increased to $179.6 million at December 31, 2010 from $157.5 million at December 31, 2009 resulting in an increase in operating assets and reflecting a cash outflow of $21.2 million. Day’s sales outstanding, or DSO, were 76 days and 75 days as of December 31, 2010 and December 31, 2009, respectively, and our daily sales was $2.4 million for the quarter ended December 31, 2010 compared to $2.1 million for the quarter ended December 31, 2009. Collection of accounts receivable and related DSO could fluctuate in future periods due to the timing and amount of our revenues and their linearity and the effectiveness of our collection efforts. |
| • | Deferred revenue increased to $424.4 million at December 31, 2010 from $372.1 million at December 31, 2009, resulting in an increase in operating liabilities and reflecting a cash inflow of $48.5 million for the twelve months ended December 31, 2010. The increase in deferred revenue was due primarily to the increase in sales of our time-based software licenses and to the growth of our post-contract services customer base. |
| • | Income taxes payable decreased by $23.0 million to $13.3 million at December 31, 2010 compared to December 31, 2009 resulting in a decrease in operating liabilities and reflecting a cash outflow of $23.7 million for the twelve months ended December 31, 2010. Net cash paid for income taxes for the twelve months ended December 31, 2010 was $33.0 million. |
37
Table of Contents
Investing Activities
Cash used in investing activities in the twelve months ended December 31, 2010 included $226.2 million for purchases of investment securities, $58.7 million paid for acquisitions and $13.7 million in capital expenditures. We acquired Völcker, a German company with a product called ActiveEntry in the Identity Access Management market, and Surgient, a Texas-based cloud management company for a total cash consideration of $55.2 million for these acquisitions (refer to Note 2 – Acquisitions of our Notes to Consolidated Financial Statements for additional details). In addition, we received $186.2 million in proceeds from sale and maturities of our investment securities. Included in the proceeds from sale and maturities of our investment securities were redemptions of approximately $47.6 million par value of our ARS during the twelve months ended December 31, 2010. We exercised our Put Options on July 1, 2010 under the Agreements, and redeemed our remaining ARS (refer to Note 4 – Cash and Cash Equivalents and Investments of our Notes to Consolidated Financial Statements for further details).
We expect that we will continue to purchase property and equipment needed in the normal course of our business. We plan to use excess cash generated from operations to invest in short and long-term investments consistent with past investment practices. Also, we plan to use cash generated from operations and/or proceeds from our investment securities to fund other strategic investment and acquisition opportunities that we continue to evaluate.
Financing Activities
Cash used in financing activities in the twelve months ended December 31, 2010 included $37.4 million paid for repurchases of our common stock and $32.7 million for repayment of loans outstanding and fees related to our undrawn line of credit. We received net proceeds of $62.5 million from the issuance of our common stock due to exercises of stock options.
In 2009, the Board of Directors authorized a plan to repurchase up to $100 million of our common stock. Any stock repurchases may be made through open market and privately negotiated transactions, at times and in such amounts as management deems appropriate, including pursuant to one or more Rule 10b5-1 trading plans. Rule 10b5-1 permits Quest to establish, while not in possession of material nonpublic information, prearranged plans to buy stock at a specific price in the future, regardless of any subsequent possession of material nonpublic information. The timing and actual number of shares repurchased will depend on a variety of factors including market conditions, corporate and regulatory requirements, and capital availability. The stock repurchase program does not have an expiration date and may be limited or terminated at any time without prior notice. During the twelve months ended December 31, 2010, we repurchased 2.3 million shares under this stock repurchase authorization at a weighted-average price per share of $16.5, for a total cost of $37.4 million. A total of $51.5 million remains available pursuant to this stock repurchase authorization. In February 2011, the Board of Directors increased the authorization under our current stock repurchase program to an aggregate of $150 million (refer to Note 17 – Subsequent Events of our Notes to the Consolidated Financial Statements for additional details).
In February 2009, we entered into a two year revolving line of credit agreement with Wells Fargo Foothill, LLC as the arranger, administrative agent and lender. We intend to use the proceeds from the credit agreement for working capital and other general corporate purposes. The credit agreement allows for cash borrowings and letters of credit under a secured revolving credit facility of up to a maximum of $100 million. Interest will accrue at a floating rate based on, at the Company’s election, (i) LIBOR (subject to reserve requirements and a minimum LIBOR of 2.75%) or (ii) the greatest of (a) 4.0%, (b) the Federal Funds Rate plus 0.5% or (c) Wells Fargo’s prime rate, in each case, plus an applicable margin. The credit agreement includes limitations on the Company’s ability to, among other things, incur debt, grant liens, make acquisitions and other investments, make certain restricted payments such as dividend payments, and dispose of assets. The credit agreement is secured by substantially all of the Company’s assets, subject to certain exceptions including the company headquarters facility. As of December 31, 2010, we have a zero balance outstanding under this line of credit. On February 17, 2011, this line of credit agreement was amended and renewed for a subsequent five-year term with Wells Fargo Capital Finance, LLC (formerly known as Wells Fargo Foothill, LLC), as arranger, administrative agent and lender (refer to Note 17 – Subsequent Events of our Notes to the Consolidated Financial Statements for additional details).
In July 2009, we drew down $34.4 million, or 70%, of the par value against the value of our ARS. As this credit line was structured as a “net no cost” loan, any interest charges will be offset by interest earned on the underlying ARS. As of December 31, 2009, we had a $32.1 million recorded as Current loans payable in our balance sheet. We fully paid our remaining balance outstanding on our UBS Financial Services line of credit from the proceeds on redemptions of our auction rate securities in the second quarter of 2010.
In August 2009, we entered into a loan agreement with Mutual of Omaha Bank whereby we borrowed an aggregate principal amount of $34 million. The loan is secured by our real property at our headquarters in Aliso Viejo, California. We intend to use the proceeds from the loan for working capital and other general corporate purposes. The loan matures in five years, during which time we will make equal monthly principal and interest payments at a 7.03% interest rate on a fixed rate, 25-year amortization schedule.
38
Table of Contents
Events of default include, among other things, payment defaults, breaches of covenants and bankruptcy events. In the case of a continuing event of default, the lender may, among other things, accelerate the payment of any unpaid principal and interest amounts, increase the then-current interest rate by 5% and foreclose on the real estate collateral.
We were in compliance with all debt-related covenants at December 31, 2010. For additional information on our loans payable, please refer to Note 8 – Loans Payable of our Notes to Consolidated Financial Statements.
As we continue to evaluate potential acquisitions, potential future stock repurchases or other general corporate expenditures which may be in excess of current cash available within certain operating entities, sourcing cash to fund these activities requires financial flexibility afforded by financing instruments. As such, we plan to continue to evaluate potential debt financings when and if reasonable financing terms become available to us.
Based on our current operating plan, we believe that our existing cash, cash equivalents, investment balances, cash flows from operations and available debt financing will be sufficient to finance our operational cash needs through at least the next 12 to 24 months. Our ability to generate cash from operations is subject to substantial risks described under Part I, Item 1A, Risk Factors, of this Report. One of these risks is that our future business does not stay at a level that is similar to, or better than, our recent past. In that event, we may be unable to generate or sustain positive cash flow from operating activities. We would then be required to use existing cash, cash equivalents, investment balances and debt financing to support our working capital and other cash requirements. Also, acquisitions are an important part of our business model. As such, significant amounts of cash could and will likely be used in the future for additional acquisitions or strategic investments. If additional funds are required to support our working capital requirements, acquisitions or other purposes, we may seek to raise funds through public or private equity or, as discussed above, debt financing or from other sources. We can provide no assurance that additional financing will be available at all or, if available, that we would be able to obtain additional financing on terms favorable to us.
Contractual Obligations and Off-Balance Sheet Arrangements
As of December 31, 2010, our contractual obligations or commercial commitments include our facility lease commitments and operating leases for office facilities and certain items of equipment. We do not have any other off-balance sheet arrangements that could reduce our liquidity.
The following table summarizes our obligations as of December 31, 2010 and the effect we expect such obligations to have on our liquidity and cash flows in future periods (in thousands):
Contractual Obligations | Payments due by period | |||||||||||||||||||
| Total | Less Than 1 Year | 1-3 Years | 3-5 Years | More Than 5 Years | ||||||||||||||||
Operating lease obligations | $ | 46,401 | $ | 16,424 | $ | 22,703 | $ | 7,151 | $ | 123 | ||||||||||
Capital lease obligations | 158 | 132 | 26 | — | — | |||||||||||||||
Purchase obligations(1) | 1,084 | 920 | 164 | — | — | |||||||||||||||
Loans payable, including interest | 41,289 | 2,674 | 5,834 | 32,781 | — | |||||||||||||||
Contingent consideration(2) | 8,515 | 2,427 | 6,088 | — | — | |||||||||||||||
Total contractual cash obligations | $ | 97,447 | $ | 22,577 | $ | 34,815 | $ | 39,932 | $ | 123 | ||||||||||
| (1) | Our purchase obligations relate primarily to marketing contracts, public relations contracts and committed sales events. |
| (2) | We enter into earn-out agreements with the shareholders of certain companies we acquire. The earn-out contingency are typically based on the acquired company’s products’ total revenue or sales growth over a specified period after the acquisition date. Refer to Note 2 – Acquisitions and Note 15 – Fair Value Measurements of our Notes to Consolidated Financial Statements for additional details. |
In addition to the cash commitments above, $46.8 million of unrecognized tax benefits, excluding penalties and interest of $4.3 million, have been recorded as liabilities in accordance with FASB’s interpretation of accounting for uncertainty in income taxes, and we are uncertain as to if or when such amounts may be settled and is not included in the above table (refer to Note 10 – Income Taxes of our Notes to Consolidated Financial Statements for additional details).
Recently Issued Accounting Pronouncements
See Note 1 – Summary of Significant Accounting Policies of our Notes to Consolidated Financial Statements for information regarding recently issued accounting pronouncements.
Critical Accounting Policies and Estimates
Our consolidated financial statements are based on the selection and application of generally accepted accounting principles in the United States of America (“GAAP”), which require us to make estimates and assumptions about future
39
Table of Contents
events that affect the amounts reported in our financial statements and the accompanying notes. Future events and their effects cannot be determined with certainty. Therefore, the determination of estimates requires the exercise of judgment. Actual results could differ from those estimates and any such differences may be material to our financial statements. We believe that the policies set forth below may involve a higher degree of judgment and complexity in their application than our other accounting policies and represent the critical accounting policies and estimates used in the preparation of our financial statements. If different assumptions or conditions were to prevail, the results could be materially different from our reported results. Historically, our assumptions, judgments and estimates relative to our critical accounting policies and estimates have not differed materially from actual results. Management has discussed the development and selection of these critical accounting policies and estimates with the Audit Committee of our Board of Directors and the Audit Committee has reviewed the related disclosures below and our significant accounting policies presented within Note 1 – Summary of Significant Accounting Policies of our Notes to Consolidated Financial Statements.
Revenue Recognition
Our revenue recognition policy is one of our critical accounting policies because revenue is a key component of our results of operations and is based on complex rules that require us to make significant judgments and estimates. In applying our revenue recognition policy we must determine which portions of our revenue are recognized currently (generally perpetual software licenses) and which portions must be deferred (generally maintenance, consulting and training services). In addition, we analyze various factors including our pricing policies, the credit-worthiness of our customers, accounts receivable aging data and contractual terms and conditions in helping us make judgments about revenue recognition. Changes in judgments with respect to any of these factors could materially impact the timing and amount of revenue and costs recognized.
We recognize revenue pursuant to FASB’s authoritative guidance on software revenue recognition. We cannot recognize any revenue before all of the following criteria are met: (1) there is persuasive evidence of an arrangement; (2) we deliver the products; (3) fees are fixed or determinable and license agreement terms are free of contingencies or uncertainties that may alter the agreement such that it may not be complete and final; and (4) collection is probable.
We initially capture value for our products by selling a perpetual software license to end customers. The fee for the first year of maintenance is included in, or bundled with, the perpetual software license at the time of initial sale. As such, the combination at initial sale of a perpetual software license and one year of maintenance represents a “multiple-element” arrangement for revenue recognition purposes.
When all four of our revenue recognition criteria are met, the multiple-element aspect of our arrangements means the only revenue recognized upfront, at the time of initial sale, is the residual revenue allocated to the perpetual software license. The revenue associated with the fair value of the undelivered maintenance and/or consulting and training services included in the initial sale is deferred and is subsequently recorded to revenue ratably over the support term and as such services are performed, respectively. The fair value of the undelivered elements is determined based on VSOE of fair value.
Revenue for our standalone sales of annual maintenance renewals in years two, three and beyond is recognized ratably over the support term. Sales of maintenance for multiple annual periods are treated similarly.
Revenue from our consulting and training services is generally recognized as the services are performed in accordance with the underlying service contracts.
Our maintenance VSOE of fair value is determined by reference to the prices our customers pay for this support when it is sold separately; that is, when we enter into an arms-length, annual renewal transaction with customers where the only offering sold is maintenance. These standalone maintenance renewal transactions are typically one year in duration and are priced as a targeted percentage of the initial, purchase price which includes both the upfront license fee and the first year of maintenance. We bill maintenance renewal transactions in advance of the services provided. We also offer customers the right to purchase maintenance for multiple annual periods at discounted prices beyond the first year as they will be paying cash upfront, well in advance of the multi-year services performed.
Our consulting and training services VSOE of fair value is determined by reference to our established pricing and discounting practices for these services when sold separately. Our consulting and training services are typically sold as time-and-materials based contracts that range from five to fifteen days in duration. We sell consulting and training services both standalone and as part of multiple-element arrangements.
Our VSOE of fair value is impacted by estimates and judgments that, if significantly different, could materially impact the timing and amount of revenue recognized in current and future periods. These estimates and judgments include, among other items:
| • | the ability to identify and validate VSOE of fair value for undelivered elements via the use of sampling techniques; |
40
Table of Contents
| • | the impact on sampling results of customer negotiating pressure on renewal rates; |
| • | the impact on sampling results of maintenance renewals on deals originally sold via indirect channels; |
| • | the fair value of the undelivered element for sampled transactions; and |
| • | the economic impact of combining multiple renewal rate negotiations relative to varying products with varying purchase dates, into a single, new coterminous maintenance. |
Historically, we have been able to establish VSOE of fair value for maintenance, consulting and training services but we may modify our pricing and discounting practices in the future. This could result in changes to our VSOE of fair value for these undelivered elements. If this were to occur, our future revenue recognition for multiple-element arrangements would differ significantly from our historical results. If we were unable to support at all through VSOE the fair value of our maintenance, consulting or training services, the entire amount of revenue from our initial, upfront sale of both a perpetual software license bundled with one year of maintenance and any consulting and training services would be deferred and recognized ratably over the life of the contract.
If we cannot objectively determine the fair value of any undelivered element (hardware, software, specific upgrade rights, etc.) in a bundled software and services arrangement, we defer revenue until all elements are delivered and services are performed, or until fair value can be objectively determined for any remaining undelivered elements.
In addition to perpetual software licenses, we sell a small amount of time-based software licenses (or term licenses) each year wherein customers pay a single fee for the right to use the software and receive maintenance for a defined period of time. Approximately 5% of 2010 license revenue was generated by these time-based software licenses. All license and support revenues on these term licenses are deferred and recognized ratably over the license term.
We license our products primarily through our direct sales force, our telesales force and, increasingly, indirect channels including value added resellers and distributors. For our direct sales, we utilize written contracts as the means to establish the terms and conditions upon which our products and services are sold to our end customers. For our indirect sales transactions, we accept orders from our resellers and distributors when they have existing orders from an end customer. Indirect sales through resellers are a growing proportion of our transaction volume. These transactions are generally handled via processes and policies that are similar to an end customer sale. We utilize written contracts coupled with purchase orders as the means to establish the terms and conditions of these indirect sales transactions.
We recognize revenue from reseller and distributor transactions upon invoicing the order provided all other revenue recognition criteria have been met. For those resellers and distributors that have established a history of consistent, timely cash collection with us, we accept orders and recognize revenue upon shipment since the resellers and distributors have existing orders from an end user customer. For those resellers that have not established a history of consistent, timely cash collection with us, we accept orders and defer revenue until cash collection occurs. The probability of collection criteria per GAAP is applied to each individual reseller or distributor rather than to all channel partners sales in aggregate.
Substantially all of our software license arrangements do not include acceptance provisions. Since such acceptance provisions are not contained in our software license arrangements as standard provisions and the incidence of returns in accordance with such acceptance provisions cannot be reasonably estimated, if a contract does include such a provision we recognize revenue upon the earlier of receipt of written customer acceptance or expiration of the acceptance period.
We evaluate arrangements with governmental entities containing “fiscal funding” or “termination for convenience” provisions, when such provisions are required by law, to determine the probability of possible cancellation. We consider multiple factors, including the history with the customer in similar transactions, and the planning, budgeting and approval processes undertaken by the governmental entity. If we determine upon execution of these arrangements that cancellation is not likely, we then recognize revenue once all of the criteria described above have been met. If such a determination cannot be made, revenue is recognized upon the earlier of cash receipt or approval of the applicable funding provision by the governmental entity.
We assess whether fees are fixed or determinable at the time of sale and recognize revenue if all other requirements have been met. Our standard payment terms require payment within 30 days but may vary based on the country in which the agreement is executed. We generally deem payments that are due within 6 months to be fixed and determinable based on collections history and thereby satisfy the required revenue recognition criteria.
For additional information regarding our revenue recognition accounting policies see Note 1 – Summary of Significant Accounting Policies of our Notes to Consolidated Financial Statements.
41
Table of Contents
Asset Valuation
Asset valuation includes assessing the recorded value of certain assets, including accounts receivable, goodwill and other intangible assets. We use a variety of factors to assess valuation, depending upon the asset.
| • | Accounts Receivable – We maintain an allowance for sales returns and cancellations as well as an allowance for bad debt. Regarding our allowance for sales returns and cancellations, our standard form license and maintenance and/or service agreements do not typically or expressly provide for product returns or cancellations as a matter of right unless we have breached the product warranty and are unable to cure the breach. Our product warranties are typical industry warranties that a product will perform in accordance with established written specifications. However, we maintain the sales returns and cancellations allowance to cover the circumstances where the company accepts returns or cancellations on a discretionary basis even though not contractually obligated to do so. This allowance also covers estimated losses for our customer’s unwillingness to make required payments. The allowance for bad debt is for estimated losses resulting from our customer’s inability to make required payments related to enforceable contracts. To support both these allowances, we are required to make significant estimates of future software license returns, of cancellations for both maintenance and consulting and training services, and of write-offs of customer accounts as bad debts – all related to current period revenues. The amount of our reserves is based on these estimates, the contractual terms and conditions of our contracts, our accounts receivable aging and our historical collection experience with a customer base. If significant product performance issues were to arise resulting in our accepting sales returns, additional allowances may be required which would result in a reduction of revenue in the period such determination was made. While such return, cancellation and bad debt write-off amounts have historically been within our planned expectations and the allowances established, we cannot guarantee that our sales returns and allowances will be adequate to cover future performance issues of our customer base and allowances may be required which would result in less revenues and additional general and administrative expense in the period such determination was made. |
| • | Goodwill – We test goodwill for impairment at the reporting unit level on an annual basis in the fourth quarter or more frequently if we believe indicators of impairment exist. Goodwill impairment is deemed to exist if the net book value of a reporting unit exceeds its estimated fair value. We performed our annual impairment review in the fourth quarter of 2010 and determined that the carrying value of each reporting unit was less than the estimated fair value of the reporting units. In calculating the fair value of the reporting units (licenses and services), the market approach and income approach were the methodologies deemed the most reliable and were the primary methods used for our impairment analysis. Based on our most recent annual impairment review, the estimated fair value of our reporting units was substantially in excess of carrying value. We will continue to perform annual impairment reviews during the fourth quarter of each year or earlier if indicators of potential impairment exist. Future impairment reviews could result in significant charges against earnings to write down the value of goodwill. |
| • | Amortizing Intangible Assets – These assets are recorded at their estimated fair value and include acquired technology, in-process research and development (“IPR&D”), customer relationships, non-compete agreements, trademarks and trade names acquired and are being amortized using the straight-line method over estimated useful lives ranging from two to seven years. |
We make estimates of fair value based upon assumptions believed to be reasonable. These estimates are based on historical experience and information obtained from the management of the acquired companies and are inherently uncertain. Critical estimates in valuing certain of the intangible assets include but are not limited to: future expected cash flows from license sales, maintenance agreements, consulting contracts, customer contracts and acquired developed technologies and patents; expected costs to develop the in-process research and development into commercially viable products and estimated cash flows from the projects when completed; the acquired company’s brand and market position, as well as assumptions about the period of time the acquired brand will continue to be used in the combined company’s product portfolio; acquired company key personnel’s willingness and ability to compete; and discount rates. Unanticipated events and circumstances may occur which may affect the accuracy or validity of such assumptions, estimates or actual results.
The net carrying amount of amortizing intangible assets was considered recoverable at December 31, 2010. In accordance with FASB’s authoritative guidance on accounting for the impairment or disposal of long-lived assets, these intangible assets are reviewed for events or changes in circumstances, which indicate that their carrying value may not be recoverable. We periodically review the carrying value of these assets to determine whether or not impairment to such value has occurred. In the event that in the future it is determined that the other intangible assets value has been impaired, an adjustment will be made in that corresponding period resulting in a charge against earnings for the write-down.
| • | Investments in Non-Consolidated Companies – All of our investments in non-consolidated companies are currently accounted for under the cost method, as we do not have the ability to exercise significant influence over these companies’ operations. Significant influence is generally deemed to exist when we have an ownership interest in the voting stock of the investee of between 20% and 50%, although other factors, such as representation on the investee’s Board of Directors, voting rights and the impact of |
42
Table of Contents
commercial arrangements, are also typically considered in determining the appropriate accounting treatment. We periodically monitor our investments for impairment and will record reductions in carrying values if and when necessary. The evaluation process is based on information that we request from these privately-held companies. This information is not subject to the same disclosure regulations as U.S. public companies and, as such, the basis for these evaluations is subject to the timing and the accuracy of the data received from these companies. As part of this evaluation process, our review includes but is not limited to a review of each company’s cash position, recent financing activities, financing needs, earnings and revenue outlook, operational performance, management or ownership changes, and impacts from competitive pressures. If we determine that the carrying value of our investment in a company is at an amount above fair value, an adjustment will be made in that corresponding period resulting in a charge against earnings for the write-down. |
Accounting for Income Taxes
As part of the process of preparing our financial statements, we are required to estimate our obligation for income taxes in each of the jurisdictions in which we operate. This process requires a significant amount of judgment, estimation and uncertainty and our estimate of income taxes can be highly sensitive to shifts of taxable income reported between such tax jurisdictions. Additionally, our U.S. and foreign tax returns are subject to routine compliance reviews by the various tax authorities. Although we believe we have appropriate support for the positions taken on our tax returns, our income tax expense includes amounts intended to satisfy income tax assessments that could result from the examination of our tax returns. Determining the income tax expense for such contingencies requires a significant amount of judgment and estimation.
We recognize liabilities for uncertain tax positions based on a two-step process. Both steps presume that the tax position will be examined by the appropriate taxing authority that has full knowledge of all relevant information. The first step is to evaluate the tax position for recognition by determining if, based on the weight of available evidence, it is more likely than not that the position will be sustained on examination. The second step requires us to estimate and measure the tax benefit as the largest amount that is more than 50% likely of being realized upon ultimate settlement with a taxing authority. It is inherently difficult and subjective to estimate such amounts, as this may require us to determine the probability of various possible outcomes. We reevaluate these uncertain tax positions on a periodic basis. This evaluation is based on factors including, but not limited to, current year tax positions, expiration of statutes of limitations, litigation, legislative activity, or other changes in facts and circumstances. Such a change in recognition or measurement would result in the recognition of a tax benefit or an additional charge to the tax provision in that period. The amounts ultimately paid upon resolution of such uncertain tax positions could be materially different from the amounts previously included in our income tax expense and therefore could have a material impact on our consolidated results of operations. The tax liabilities for uncertain tax positions are recorded as a separate component in our long-term income taxes payable/receivable balance.
We recognize deferred income tax assets and liabilities based upon the differences between the financial statement carrying amounts and the tax bases of assets and liabilities. Such deferred income taxes primarily relate to the timing of the recognition of certain revenue items and the timing of the deductibility of certain reserves and accruals for income tax purposes. We regularly review the deferred tax assets for recoverability and establish a valuation allowance when it is more likely than not that some portion or all of the deferred tax assets will not be realized. If we are unable to generate sufficient future taxable income, or if there is a material change in the actual effective tax rates or time periods within which the underlying timing differences become taxable or deductible, we could be required to establish an additional valuation allowance against the deferred tax assets, which could result in a substantial increase in our effective tax rate and have a materially adverse impact on our operating results. U.S. income taxes were not provided for on undistributed earnings from certain non-U.S. subsidiaries because those earnings are considered permanently reinvested. Should that judgment change, U.S. income taxes would have to be recognized on those undistributed earnings no longer considered to be permanently invested.
Accounting for Stock-based Compensation
We account for stock-based compensation in accordance with the fair value recognition provisions per GAAP. Under GAAP, stock-based compensation expense is measured at the grant date based on the value of the award and is recognized as expense over the vesting period. We use the Black-Scholes option-pricing model to determine the fair value of stock options. The Black-Scholes option-pricing model incorporates various subjective assumptions including expected volatility, expected term and the risk-free interest rates. We estimate the expected volatility based upon historical volatilities of our common stock. We determine the expected term of our stock-based awards based on historical exercise patterns across two different groups of employees. In addition, judgment is also required in estimating the forfeiture rate on stock-based awards. We calculate the expected forfeiture rate based on average historical trends. These input factors are subjective and are determined using management’s judgment. If a difference arises between the assumptions used in determining stock-based compensation cost and the actual factors which become known over time, we may change the input factors used in determining future stock-based compensation costs. Any such changes could materially impact our results of operations in the period in which the changes are made and in periods thereafter.
43
Table of Contents
Determining Functional Currencies for Purpose of the Consolidation of Non-U.S. Subsidiaries
In preparing our consolidated financial statements, we are required to re-measure the financial statements of the foreign subsidiaries from their local currency into United States dollars. This process results in foreign currency re-measurement gains and losses included in Other (expense) income, net in the consolidated income statements.
Under the relevant accounting guidance, the treatment of these re-measurement gains or losses is dependent upon our determination of the functional currency of each subsidiary. The functional currency is determined based on the judgment of management and involves consideration of all relevant economic facts and circumstances affecting the subsidiary. The currency in which the subsidiary transacts a majority of its transactions (including transfer pricing arrangements, billings, financing, payroll and other expenditures) is one consideration of determining the functional currency; however, any dependency upon the parent and the nature of the subsidiary’s operations are also considered.
Other (expense) income, net includes any gain or loss associated with the re-measurement of a subsidiary’s financial statements when the functional currency of a subsidiary is the United States dollar. However, if the functional currency is deemed to be the local currency, any gain or loss associated with the translation of these financial statements into the United States dollar would be included within accumulated other comprehensive income on our consolidated balance sheets. If we determine that there has been a change in the functional currency of a subsidiary to the local currency, any translation gains or losses arising after the date of change would be included within stockholders’ equity as a component of accumulated other comprehensive income.
Based on our assessment of the factors discussed above, we consider the United States dollar to be the functional currency for each of our international subsidiaries. As a result of this determination, assets and liabilities in these subsidiaries are re-measured at current period-end exchange rates, except for property and equipment and deferred revenue, which are re-measured at historical exchange rates. Revenues and expenses are re-measured at weighted average exchange rates in effect during the reporting period except for revenue and costs related to the above mentioned balance sheet items which are re-measured at historical exchange rates. Accordingly, we had a net foreign currency re-measurement (loss) gain of $(3.2) million for the year ended December 31, 2010 and a net foreign currency re-measurement loss of $3.6 million for the year ended December 31, 2009, recorded to Other (expense) income, net in the respective periods. Had we determined that the functional currency of our subsidiaries was the local currency, these translation gains and losses would have been included in our statement of stockholders’ equity as a component of comprehensive income for each of the years presented, and would not have the impacts on our net income that are currently reflected in our consolidated financial statements.
The magnitude of these gains or losses is dependent upon fluctuations within the exchange rates of the foreign currencies in which we transact business against the United States dollar and the significance of the assets, liabilities, revenues and expenses denominated in foreign currencies and the effect of any foreign currency hedging activities that we have entered into (See Note 14 – Derivative Instruments of our Notes to Consolidated Financial Statements for details). The company operates in a number of currencies worldwide, most notably in the Euro, the British Pound, Canadian Dollar, Australian Dollar and Russian Ruble. Any future re-measurement gains or losses could differ significantly from those we have experienced in recent years. In addition, if we determine that a change in the functional currency of one of our subsidiaries has occurred at any point in time, we would be required to include any translation gains or losses from the date of change in accumulated other comprehensive income on our consolidated balance sheets.
| Item 7A. | Quantitative and Qualitative Disclosures About Market Risk |
Foreign Exchange Risk
We are a U.S. Dollar functional company and transact business in a number of different foreign countries around the world. In most instances, revenues are collected and operating expenses are paid in the local currency of the country in which we are transacting. Accordingly, we are exposed to both transaction and translation risk relating to changes in foreign exchange rates.
Our exposure to foreign exchange risk originates both from our foreign operations net profits and losses denominated in currencies other than the U.S. Dollar, as well as our net balances of monetary assets and liabilities in our foreign subsidiaries. These exposures have the potential to produce either gains or losses depending on the directional movement of the foreign currencies versus the U.S. Dollar and our operational profile in foreign subsidiaries. Our cumulative currency gains or losses in any given period may be lessened by the economic benefits of diversification and the correlative relationships of different currencies, but there can be no assurance that this pattern will continue to be true in future periods. During the twelve months ended December 31, 2010, we had a positive effect, or an increase of $1.7 million on total revenues and a negative effect in the form of an increase to total expenses by $6.2 million related to foreign currency fluctuation when comparing 2010 rates to 2009. In addition, for the twelve months ended December 31, 2010, within other (expense) income, net we had foreign currency (loss) gain of $(3.2) million compared to $3.6 million in 2009.
44
Table of Contents
The foreign currencies to which we currently have the most significant exposure are the Euro, the Canadian Dollar, the British Pound, the Australian Dollar and the Russian Ruble. In 2009, we implemented a foreign exchange hedging program. We enter into hedges in the form of foreign currency contracts to reduce the range of outcomes foreign currency rate changes can have on non-functional currency denominated forecasted transactions and balance sheet positions, which include certain monetary assets and liabilities denominated in foreign currencies. The foreign currency contracts are carried at fair value and denominated in various currencies as listed in the tables below. The duration of these contracts ranges from less than one month to nine months. A description of our accounting for foreign currency contracts is included in Note 1 – Summary of Significant Accounting Policies and Note 14 – Derivative Instruments of our Notes to Consolidated Financial Statements.
The magnitude of success of our hedging activities depends upon the accuracy of our estimates of various balances and transactions denominated in non-functional currencies. To the extent our estimates are correct, gains and losses on our forward foreign currency contracts will be offset by corresponding losses and gains on the underlying transactions. In order to monitor the financial impact of our foreign currency hedges, we subject our hedges to a stress test. This test is intended to quantify the impact to our financial statements of an abnormal change in the foreign currency rates in which we do business. When subjected to a 10% and 20% adverse change, we estimated that the fair value of our contracts would decline by $9.0 million and $18.0 million, respectively.
We do not use foreign currency contracts for speculative or trading purposes. We enter into foreign currency contracts with reputable financial institutional counterparties whose financial health we monitor. To date, we have not experienced nonperformance by any of these counterparties and anticipate performance by all counterparties.
The following table summarizes the notional amounts of our outstanding foreign currency contracts at December 31, 2010 and 2009. All contracts have maturities of nine months or less. (in U.S. Dollars in thousands):
| December 31 | ||||||||
Currency | 2010 | 2009 | ||||||
Australian Dollar | $ | 6,634 | $ | 2,545 | ||||
Canadian Dollar | 7,694 | 11,554 | ||||||
Chinese Yuan | 1,167 | — | ||||||
Danish Krone | 1,073 | 1,214 | ||||||
Euro | 45,961 | 21,991 | ||||||
British Pound | 14,988 | 9,965 | ||||||
Israeli Shekel | 2,105 | 1,947 | ||||||
Brazil Real | 2,381 | — | ||||||
Swedish Krona | 743 | — | ||||||
Norwegian Krone | 1,028 | — | ||||||
Russian Ruble | 6,206 | 5,586 | ||||||
Total | $ | 89,980 | $ | 54,802 | ||||
Interest Rate Risk
Our exposure to market interest-rate risk relates primarily to our investment portfolio. We traditionally do not use derivative financial instruments to hedge the market risks of our investments. We place our investments with high-quality issuers and money market funds and articulate allocation limits in our investment policy to any one issuer other than the United States government. Our investment portfolio as of December 31, 2010 consisted of money market funds, U.S. Treasuries, US agency securities, commercial paper, certificates of deposit and corporate bonds. Investments purchased with an original maturity of three months or less are considered to be cash equivalents. We classify our investments as available-for-sale securities. Available-for-sale securities are carried at fair value, with unrealized gains and losses, net of tax, reported in a separate component of stockholders’ equity. Trading securities are carried at fair value, with changes in fair value reported in earnings.
45
Table of Contents
Information about our investment portfolio is presented in the table below, which states the amortized book value and related weighted-average interest rates by year of maturity (in thousands):
| Amortized Book Value | Weighted Average Rate | |||||||
Investments maturing by December 31, 2011(1) | $ | 384,469 | 0.28% | |||||
2012 | 33,312 | 1.48% | ||||||
2013 | 11,959 | 2.46% | ||||||
2014 | — | — | ||||||
2015 | — | — | ||||||
Thereafter | — | — | ||||||
Total portfolio | $ | 429,740 | 0.42% | |||||
| (1) | Includes $294.3 million in cash equivalents. |
See Note 4 – Cash and Cash Equivalents and Investments of our Notes to Consolidated Financial Statements for additional information regarding our investment portfolio.
46
Table of Contents
| Item 8. | Financial Statements and Supplementary Data |
The financial statements required by this item are included in Part IV, Item 15 of this Form 10-K and are presented beginning on page F-1.
The following tables set forth selected unaudited consolidated quarterly financial data for the eight quarters ended December 31, 2010:
| Quarters Ended | ||||||||||||||||||||||||||||||||
| Dec. 31, 2010 (1) | Sept. 30, 2010 | June 30, 2010 | March 31, 2010 | Dec. 31, 2009 (2) | Sept. 30, 2009 (2) | June 30, 2009 | March 31, 2009 | |||||||||||||||||||||||||
| (in thousands, except per share data) | ||||||||||||||||||||||||||||||||
Revenues | $ | 216,782 | $ | 193,042 | $ | 186,102 | $ | 171,171 | $ | 194,531 | $ | 170,849 | $ | 164,257 | $ | 165,597 | ||||||||||||||||
Gross profit | 190,577 | 169,565 | 164,608 | 150,133 | 172,560 | 149,062 | 143,259 | 144,852 | ||||||||||||||||||||||||
Income before income tax provision | 31,257 | 34,306 | 29,155 | 20,202 | 44,680 | 711 | 26,100 | 14,544 | ||||||||||||||||||||||||
Net income | $ | 37,064 | $ | 28,501 | $ | 17,391 | $ | 15,613 | $ | 37,022 | $ | 2,949 | $ | 20,459 | $ | 9,929 | ||||||||||||||||
Basic net income per share | $ | 0.40 | $ | 0.31 | $ | 0.19 | $ | 0.17 | $ | 0.41 | $ | 0.03 | $ | 0.22 | $ | 0.11 | ||||||||||||||||
Diluted net income per share | $ | 0.39 | $ | 0.31 | $ | 0.19 | $ | 0.17 | $ | 0.40 | $ | 0.03 | $ | 0.21 | $ | 0.10 | ||||||||||||||||
| (1) | We recorded a year-end adjustment of $6.8 million relating to tax reserves that should have been released in prior periods. Management has concluded that this correction is not material to any periods affected. Refer to Note 1 – Summary of Significant Accounting Policies of our Notes to Consolidated Financial Statements for details of our tax adjustment related to prior periods. |
| (2) | The net income for the quarter ended September 30, 2009 included a $29.4 million litigation loss provision recorded in connection with our completed stock option investigation. The net income for the quarter ended December 31, 2009 included a $10.0 million credit to litigation loss provision representing insurance proceeds paid by our insurance providers in the fourth quarter of 2009. |
| Item 9. | Changes In and Disagreements with Accountants on Accounting and Financial Disclosure |
None.
| Item 9A. Controls | and Procedures |
Evaluation of Disclosure Controls and Procedures
The Company maintains disclosure controls and procedures designed to provide reasonable assurance that information required to be disclosed in reports filed under the Securities Exchange Act of 1934, as amended (the “Exchange Act”) is recorded, processed, summarized and reported within the specified time periods and accumulated and communicated to management, including its Chief Executive Officer and Chief Financial Officer, as appropriate, to allow timely decisions regarding required disclosure.
Our management, with the participation of our Chief Executive Officer and Chief Financial Officer, evaluated the effectiveness of our disclosure controls and procedures as of December 31, 2010 as required by paragraph (b) of Rule 13a-15 or Rule 15d-15 of the Exchange Act. Based on that evaluation, our Chief Executive Officer and Chief Financial Officer have concluded that, as of that date, the Company’s disclosure controls and procedures as defined in Rules 13a-15(e) or 15d-15(e) under the Exchange Act were effective, at the reasonable assurance level.
In October 2009, we began implementing an upgrade to our financial system. As part of the first stage of this process, which we completed in August 2010, we implemented a full rollout of all financial system upgrade modules in the United States, Canada, Australia and certain parts of our EMEA region, which together comprise the largest part of our business. The second and final stage of implementation of the upgrade to our financial system is the rollout of the remaining modules to the rest of our company, which is scheduled to be completed in the first quarter of 2012. Our upgraded financial system is a significant component of our internal control over financial reporting. Management believes that it has taken the necessary steps to monitor and maintain appropriate internal controls during this implementation period and that our internal controls have been enhanced by the new financial accounting system.
47
Table of Contents
Management’s Report on Internal Control over Financial Reporting
Our management is responsible for establishing and maintaining adequate internal control over financial reporting (as defined in Rule 13a-15(f) under the Exchange Act). Our management assessed the effectiveness of our internal control over financial reporting as of December 31, 2010.
Management performed an assessment of the effectiveness of the Company’s internal control over financial reporting as of December 31, 2010, utilizing the criteria described in the “Internal Control — Integrated Framework” issued by the Committee of Sponsoring Organizations of the Treadway Commission. The objective of this assessment was to determine whether the Company’s internal control over financial reporting was effective as of December 31, 2010. Based on this evaluation and those criteria, our management, with the participation of our Chief Executive Officer and Chief Financial Officer, concluded that, as of December 31, 2010, our internal control over financial reporting was effective.
The effectiveness of the Company’s internal control over financial reporting has been audited by Deloitte & Touche LLP, an independent registered public accounting firm, as stated in their report which is included herein.
Changes in Internal Control over Financial Reporting
There have not been any changes in internal control over financial reporting that occurred in the fourth quarter of 2010 that have materially affected or are reasonably likely to materially affect our internal control over financial reporting.
48
Table of Contents
REPORT OF INDEPENDENT REGISTERED PUBLIC ACCOUNTING FIRM
To the Board of Directors and Stockholders of
Quest Software, Inc.
Aliso Viejo, California
We have audited the internal control over financial reporting of Quest Software, Inc. and subsidiaries (the “Company”) as of December 31, 2010, based on criteria established inInternal Control — Integrated Frameworkissued by the Committee of Sponsoring Organizations of the Treadway Commission. The Company’s management is responsible for maintaining effective internal control over financial reporting and for its assessment of the effectiveness of internal control over financial reporting, included in the accompanying Management’s Report on Internal Control over Financial Reporting. Our responsibility is to express an opinion on the Company’s internal control over financial reporting based on our audit.
We conducted our audit in accordance with the standards of the Public Company Accounting Oversight Board (United States). Those standards require that we plan and perform the audit to obtain reasonable assurance about whether effective internal control over financial reporting was maintained in all material respects. Our audit included obtaining an understanding of internal control over financial reporting, assessing the risk that a material weakness exists, testing and evaluating the design and operating effectiveness of internal control based on the assessed risk, and performing such other procedures as we considered necessary in the circumstances. We believe that our audit provides a reasonable basis for our opinion.
A company’s internal control over financial reporting is a process designed by, or under the supervision of, the company’s principal executive and principal financial officers, or persons performing similar functions, and effected by the company’s board of directors, management, and other personnel to provide reasonable assurance regarding the reliability of financial reporting and the preparation of financial statements for external purposes in accordance with generally accepted accounting principles. A company’s internal control over financial reporting includes those policies and procedures that (1) pertain to the maintenance of records that, in reasonable detail, accurately and fairly reflect the transactions and dispositions of the assets of the company; (2) provide reasonable assurance that transactions are recorded as necessary to permit preparation of financial statements in accordance with generally accepted accounting principles, and that receipts and expenditures of the company are being made only in accordance with authorizations of management and directors of the company; and (3) provide reasonable assurance regarding prevention or timely detection of unauthorized acquisition, use, or disposition of the company’s assets that could have a material effect on the financial statements.
Because of the inherent limitations of internal control over financial reporting, including the possibility of collusion or improper management override of controls, material misstatements due to error or fraud may not be prevented or detected on a timely basis. Also, projections of any evaluation of the effectiveness of the internal control over financial reporting to future periods are subject to the risk that the controls may become inadequate because of changes in conditions, or that the degree of compliance with the policies or procedures may deteriorate.
In our opinion, the Company maintained, in all material respects, effective internal control over financial reporting as of December 31, 2010, based on the criteria established inInternal Control — Integrated Frameworkissued by the Committee of Sponsoring Organizations of the Treadway Commission.
We have also audited, in accordance with the standards of the Public Company Accounting Oversight Board (United States), the consolidated financial statements and financial statement schedule as of and for the year ended December 31, 2010, of the Company and our report dated February 23, 2011 expressed an unqualified opinion on those financial statements and financial statement schedule.
/s/ DELOITTE & TOUCHE LLP
Costa Mesa, California
February 23, 2011
49
Table of Contents
| Item 9B. | Other Information |
Not applicable.
PART III
| Item 10. | Directors, Executive Officers and Corporate Governance |
Information required by this item will be included in the sections captioned“Directors,” “Executive Officers,” “Code of Ethics,” “Corporate Governance,” “Board of Directors and Committees” and“Section 16(a) Beneficial Ownership Reporting Compliance” of our definitive proxy statement, to be delivered to stockholders in connection with our 2011 Annual Meeting of Stockholders. Such information is incorporated herein by reference.
| Item 11. | Executive Compensation |
Information regarding compensation of certain named executive officers will be included in the section captioned“Executive Compensation and Related Information” appearing in our definitive proxy statement, to be delivered to stockholders in connection with our 2011 Annual Meeting of Stockholders. Such information is incorporated herein by reference.
| Item 12. | Security Ownership of Certain Beneficial Owners and Management and Related Stockholder Matters |
Information required by this item will be included in the section captioned“Security Ownership of Certain Beneficial Owners and Management and Related Stockholder Matters” appearing in our definitive proxy statement, to be delivered to stockholders in connection with our 2011 Annual Meeting of Stockholders. Such information is incorporated herein by reference.
| Item 13. | Certain Relationships and Related Transactions, and Director Independence |
Information required by this item will be included in the section captioned“Certain Relationships and Related Transactions,” and“Corporate Governance” appearing in our definitive proxy statement, to be delivered to stockholders in connection with our 2011 Annual Meeting of Stockholders. Such information is incorporated herein by reference.
| Item 14. | Principal Accounting Fees and Services |
Information required by this item will be included in the section captioned“Fees Paid to the Independent Registered Public Accounting Firm” in our definitive proxy statement, to be delivered to stockholders in connection with our 2011 Annual Meeting of Stockholders. Such information is incorporated herein by reference.
50
Table of Contents
PART IV
| Item 15. | Exhibits, Financial Statement Schedules |
The following documents are filed as part of this Form 10-K.
| (1) | Financial Statements |
| (2) | Financial Statement Schedule |
The following financial statement schedule should be read in conjunction with the consolidated financial statements of Quest Software, Inc. filed as part of this Report:
| • | Schedule II — Valuation and Qualifying Accounts |
Schedules other than that listed above have been omitted since they are either not required or not applicable or because the information required is included in the consolidated financial statements included elsewhere herein or the notes thereto.
| (3) | Exhibits |
51
Table of Contents
Exhibit | Exhibit Title | |
| 3.1* | Certificate of Incorporation of Quest Software, Inc. (incorporated by reference to our Current Report on Form 8-K filed on April 30, 2009) | |
| 3.2* | Bylaws of Quest Software, Inc. (incorporated by reference to our Current Report on Form 8-K filed on April 30, 2009) | |
| 4.1* | Form of Registrant’s Specimen Common Stock Certificate (incorporated by reference to our Registration Statement on Form S-1 and all amendments thereto filed on June 11, 1999 (File No. 333-80543)) | |
| 10.1* | Form of Directors’ and Officers’ Indemnification Agreement (incorporated by reference to our Registration Statement on Form S-1 and all amendments thereto filed on June 11, 1999 (File No. 333-80543)) | |
| 10.2*++ | Quest Software, Inc. 1999 Stock Incentive Plan, as amended (incorporated by reference to our Quarterly Report on Form 10-Q for the period ended March 31, 2008) | |
| 10.3*++ | Form of Stock Option Agreement used under the Quest Software, Inc. 1999 Stock Incentive Plan (incorporated by reference to our Quarterly Report on Form 10-Q for the period ended September 30, 2004) | |
| 10.4*++ | Form of Restricted Stock Unit Award Agreement used under the Quest Software, Inc. 1999 Stock Incentive Plan, as amended (incorporated by reference to our Quarterly Report on Form 10-Q for the period ended March 31, 2008) | |
| 10.5*++ | Quest Software, Inc. 2001 Stock Incentive Plan, as amended (incorporated by reference to our Quarterly Report on Form 10-Q for the period ended March 31, 2008) | |
| 10.6*++ | Form of Stock Option Agreement used under the Quest Software, Inc. 2001 Stock Incentive Plan (incorporated by reference to our Registration Statement on Form S-8 (File No. 333-82784) filed on February 14, 2002) | |
| 10.7*++ | Quest Software, Inc. 2008 Stock Incentive Plan (incorporated by reference to our Quarterly Report on Form 10-Q for the period ended March 31, 2008) | |
| 10.8*++ | Form of Stock Option Agreement used under the Quest Software, Inc. 2008 Stock Incentive Plan (incorporated by reference to our Quarterly Report on Form 10-Q for the period ended March 31, 2008) | |
| 10.9*++ | Form of Restricted Stock Unit Award Agreement used under the Quest Software, Inc. 2008 Stock Incentive Plan (incorporated by reference to our Quarterly Report on Form 10-Q for the period ended March 31, 2008) | |
| 10.10*++ | Quest Software, Inc. Executive Incentive Plan (incorporated by reference to our Annual Report on Form 10-K for the year ended December 31, 2007) | |
| 10.11* | Credit Agreement dated as of February 17, 2009 between Quest Software, Inc. and Wells Fargo Foothill, LLC (incorporated by reference to our Quarterly Report on Form 10-Q for the period ended March 31, 2009) | |
| 10.12* | Security Agreement dated as of February 17, 2009 among Quest Software, Inc., Aelita Software Corporation, ScriptLogic Corporation, Vizioncore, Inc., NetPro Computing, Inc. and those additional entities that hereafter become parties hereto, and Wells Fargo Foothill, LLC (incorporated by reference to our Quarterly Report on Form 10-Q for the period ended March 31, 2009) | |
| 10.13*++ | Voting Agreement dated June 1, 2009 by and between Quest Software, Inc. and Vincent C. Smith (incorporated by reference to our Current Report on Form 8-K filed on June 1, 2009) | |
| 10.14* | Loan and Security Agreement, dated as of August 3, 2009, between Quest Software, Inc. as Borrower and Mutual of Omaha Bank as Lender (incorporated by reference to our Current Report on Form 8-K filed on August 7, 2009) | |
| 10.15* | Secured Promissory Note, dated as of August 3, 2009, from Quest Software, Inc. as Maker to Mutual of Omaha Bank as Payee (incorporated by reference to our Current Report on Form 8-K filed on August 7, 2009) | |
| 10.16* | Deed of Trust, Security Agreement, Assignment of Rents and Leases, and Fixture Filing, dated as of August 3, 2009, by and among Quest Software, Inc. as Trustor, Mutual of Omaha Bank as Beneficiary, and Fidelity National Title Company as Trustee (incorporated by reference to our Current Report on Form 8-K filed on August 7, 2009) | |
52
Table of Contents
Exhibit | Exhibit Title | |
| 10.17* | Environmental Certification and Indemnity Agreement, dated as of August 3, 2009, by Quest Software, Inc. as Obligor in favor of Mutual of Omaha Bank as Lender (incorporated by reference to our Current Report on Form 8-K filed on August 7, 2009) | |
| 14.1* | Code of Conduct and Ethics (incorporated by reference to our Annual Report on Form 10-K for the period ended December 31, 2009) | |
| 21.1 | Subsidiaries of the Registrant | |
| 23.1 | Consent of Deloitte & Touche LLP | |
| 31.1 | Certification of the Principal Executive Officer Pursuant to Rule 13a-14(a) of the Securities Exchange Act of 1934, as amended | |
| 31.2 | Certification of the Principal Financial Officer Pursuant to Rule 13a-14(a) of the Securities Exchange Act of 1934, as amended | |
| 32.1 | Certification of Principal Executive Officer and Principal Financial Officer pursuant to 18 U.S.C. Section 1350, as adopted pursuant to Section 906 of the Sarbanes-Oxley Act of 2002 | |
| 101.INS | XBRL Instance Document | |
| 101.SCH | XBRL Taxonomy Extension Schema Document | |
| 101.CAL | XBRL Taxonomy Extension Calculation Linkbase Document | |
| 101.DEF | XBRL Taxonomy Extension Definition Linkbase Document | |
| 101.LAB | XBRL Taxonomy Extension Label Linkbase Document | |
| 101.PRE | XBRL Taxonomy Extension Presentation Linkbase Document | |
| * | Incorporated by reference |
| ++ | Indicates a management contract or compensatory arrangement. |
53
Table of Contents
Pursuant to the requirements of Section 13 or 15(d) of the Securities Exchange Act of 1934, the Registrant has duly caused this Report to be signed on its behalf by the undersigned, thereunto duly authorized.
| QUEST SOFTWARE, INC. | ||||
| Dated: February 24, 2011 | By: | /s/ Douglas F. Garn | ||
| Douglas F. Garn | ||||
| President and Chief Executive Officer | ||||
Pursuant to the requirements of the Securities Act of 1934, this Report has been signed below by the following persons on behalf of the Registrant and in the capacities and on the dates indicated.
Signature | Title | Date | ||
/s/ Douglas F. Garn Douglas F. Garn | President, Chief Executive Officer (Principal Executive Officer) and Director | February 24, 2011 | ||
/s/ Scott J. Davidson Scott J. Davidson | Senior Vice President and Chief Financial Officer (Principal Financial Officer) | February 24, 2011 | ||
/s/ Scott H. Reasoner Scott H. Reasoner | Vice President, Corporate Controller (Principal Accounting Officer) | February 24, 2011 | ||
/s/ Vincent C. Smith Vincent C. Smith | Executive Chairman of the Board of Directors | February 24, 2011 | ||
/s/ Kevin M. Klausmeyer Kevin M. Klausmeyer | Director | February 24, 2011 | ||
/s/ Raymond J. Lane Raymond J. Lane | Director | February 24, 2011 | ||
/s/ Augustine L. Nieto II Augustine L. Nieto II | Director | February 24, 2011 | ||
/s/ Paul A. Sallaberry Paul A. Sallaberry | Director | February 24, 2011 | ||
/s/ H. John Dirks H. John Dirks | Director | February 24, 2011 | ||
54
Table of Contents
CONSOLIDATED FINANCIAL STATEMENTS AND
REPORT OF INDEPENDENT REGISTERED PUBLIC ACCOUNTING FIRM
QUEST SOFTWARE, INC. AND SUBSIDIARIES
December 31, 2010, 2009 and 2008
F-1
Table of Contents
QUEST SOFTWARE, INC. AND SUBSIDIARIES
INDEX TO CONSOLIDATED FINANCIAL STATEMENTS
December 31, 2010, 2009 and 2008
| Page | ||||
| F-3 | ||||
Consolidated Financial Statements | ||||
| F-4 | ||||
| F-5 | ||||
Consolidated Statements of Stockholders’ Equity and Comprehensive Income | F-6 | |||
| F-7 | ||||
| F-8 | ||||
F-2
Table of Contents
REPORT OF INDEPENDENT REGISTERED PUBLIC ACCOUNTING FIRM
To the Board of Directors and Stockholders of
Quest Software, Inc.
Aliso Viejo, California
We have audited the accompanying consolidated balance sheets of Quest Software, Inc. and subsidiaries (the “Company”) as of December 31, 2010 and 2009, and the related consolidated statements of income, stockholders’ equity and comprehensive income, and cash flows for each of the three years in the period ended December 31, 2010. Our audits also included the financial statement schedule listed in the Index at Item 15. These consolidated financial statements and financial statement schedule are the responsibility of the Company’s management. Our responsibility is to express an opinion on the consolidated financial statements and financial statement schedule based on our audits.
We conducted our audits in accordance with the standards of the Public Company Accounting Oversight Board (United States). Those standards require that we plan and perform the audit to obtain reasonable assurance about whether the financial statements are free of material misstatement. An audit includes examining, on a test basis, evidence supporting the amounts and disclosures in the financial statements. An audit also includes assessing the accounting principles used and significant estimates made by management, as well as evaluating the overall financial statement presentation. We believe that our audits provide a reasonable basis for our opinion.
In our opinion, such consolidated financial statements present fairly, in all material respects, the financial position of the Company as of December 31, 2010 and 2009, and the results of its operations and its cash flows for each of the three years in the period ended December 31, 2010, in conformity with accounting principles generally accepted in the United States of America. Also, in our opinion, such financial statement schedule, when considered in relation to the basic consolidated financial statements taken as a whole, presents fairly, in all material respects, the information set forth therein.
We have also audited, in accordance with the standards of the Public Company Accounting Oversight Board (United States), the Company’s internal control over financial reporting as of December 31, 2010, based on the criteria established inInternal Control — Integrated Framework issued by the Committee of Sponsoring Organizations of the Treadway Commission and our report dated February 23, 2011, expressed an unqualified opinion on the Company’s internal control over financial reporting.
/s/ DELOITTE & TOUCHE LLP
Costa Mesa, California
February 23, 2011
F-3
Table of Contents
QUEST SOFTWARE, INC. AND SUBSIDIARIES
CONSOLIDATED BALANCE SHEETS
(In thousands, except par value)
| December 31 | ||||||||
| 2010 | 2009 | |||||||
| ASSETS | ||||||||
Current assets: | ||||||||
Cash and cash equivalents | $ | 356,533 | $ | 292,940 | ||||
Short-term investments | 90,284 | 90,109 | ||||||
Accounts receivable, net of allowances of $5,367 and $5,605 at December 31, 2010 and 2009, respectively | 179,621 | 157,534 | ||||||
Prepaid expenses and other current assets | 48,312 | 32,974 | ||||||
Deferred income taxes | 6,677 | 11,832 | ||||||
Total current assets | 681,427 | 585,389 | ||||||
Property and equipment, net | 70,854 | 70,051 | ||||||
Long-term investments | 45,466 | 2,411 | ||||||
Intangible assets, net | 62,785 | 76,072 | ||||||
Goodwill | 706,224 | 670,481 | ||||||
Deferred income taxes | 46,985 | 34,127 | ||||||
Other assets | 21,843 | 26,607 | ||||||
Total assets | $ | 1,635,584 | $ | 1,465,138 | ||||
| LIABILITIES AND STOCKHOLDERS’ EQUITY | ||||||||
Current liabilities: | ||||||||
Accounts payable | $ | 5,512 | $ | 3,714 | ||||
Accrued compensation | 55,185 | 45,831 | ||||||
Other accrued expenses | 32,600 | 31,902 | ||||||
Loans payable | 521 | 32,602 | ||||||
Deferred revenue | 324,121 | 285,907 | ||||||
Total current liabilities | 417,939 | 399,956 | ||||||
Long-term liabilities: | ||||||||
Deferred revenue | 100,264 | 86,231 | ||||||
Income taxes payable | 41,385 | 44,433 | ||||||
Loans payable | 32,730 | 33,292 | ||||||
Other long-term liabilities | 11,000 | 8,434 | ||||||
Total long-term liabilities | 185,379 | 172,390 | ||||||
Total liabilities | 603,318 | 572,346 | ||||||
Commitments and contingencies (Notes 2 and 16) | ||||||||
Stockholders’ equity: | ||||||||
Preferred stock, $0.001 par value, 10,000 shares authorized; no shares issued or outstanding | — | — | ||||||
Common stock, $0.001 par value, 200,000 shares authorized; 92,893 and 90,202 shares issued and outstanding at December 31, 2010 and 2009, respectively | 93 | 90 | ||||||
Additional paid-in-capital | 729,640 | 689,385 | ||||||
Retained earnings | 301,697 | 203,130 | ||||||
Accumulated other comprehensive income | 836 | 187 | ||||||
Total stockholders’ equity | 1,032,266 | 892,792 | ||||||
Total liabilities and stockholders’ equity | 1,635,584 | $ | 1,465,138 | |||||
The accompanying notes are an integral part of these consolidated financial statements.
F-4
Table of Contents
QUEST SOFTWARE, INC. AND SUBSIDIARIES
CONSOLIDATED INCOME STATEMENTS
(In thousands, except per share data)
| Year Ended December 31 | ||||||||||||
| 2010 | 2009 | 2008 | ||||||||||
Revenues: | ||||||||||||
Licenses | $ | 320,683 | $ | 279,238 | $ | 334,083 | ||||||
Services | 446,414 | 415,998 | 401,294 | |||||||||
Total revenues | 767,097 | 695,236 | 735,377 | |||||||||
Cost of revenues: | ||||||||||||
Licenses | 8,303 | 7,581 | 8,586 | |||||||||
Services | 67,809 | 58,528 | 62,060 | |||||||||
Amortization of purchased technology | 16,101 | 19,393 | 20,231 | |||||||||
Total cost of revenues | 92,213 | 85,502 | 90,877 | |||||||||
Gross profit | 674,884 | 609,734 | 644,500 | |||||||||
Operating expenses: | ||||||||||||
Sales and marketing | 304,934 | 272,944 | 312,493 | |||||||||
Research and development | 151,896 | 144,370 | 153,464 | |||||||||
General and administrative | 84,808 | 76,748 | 84,954 | |||||||||
Amortization of other purchased intangible assets | 12,670 | 13,159 | 11,302 | |||||||||
In-process research and development | — | — | 955 | |||||||||
Litigation loss provision, net | — | 19,025 | — | |||||||||
Total operating expenses | 554,308 | 526,246 | 563,168 | |||||||||
Income from operations | 120,576 | 83,488 | 81,332 | |||||||||
Other (expense) income, net | (5,657 | ) | 2,549 | 1,030 | ||||||||
Income before income tax provision | 114,919 | 86,037 | 82,362 | |||||||||
Income tax provision | 16,352 | 15,678 | 14,319 | |||||||||
Net income | $ | 98,567 | $ | 70,359 | $ | 68,043 | ||||||
Net income per share: | ||||||||||||
Basic | $ | 1.09 | $ | 0.77 | $ | 0.65 | ||||||
Diluted | $ | 1.06 | $ | 0.75 | $ | 0.64 | ||||||
Weighted-average shares: | ||||||||||||
Basic | 90,411 | 91,926 | 104,192 | |||||||||
Diluted | 93,282 | 94,066 | 106,261 | |||||||||
The accompanying notes are an integral part of these consolidated financial statements.
F-5
Table of Contents
QUEST SOFTWARE, INC. AND SUBSIDIARIES
CONSOLIDATED STATEMENTS OF STOCKHOLDERS’ EQUITY
AND COMPREHENSIVE INCOME
(In thousands)
| Common Stock | Additional Paid- In Capital | Retained Earnings | Accumulated Other Comprehensive Income (Loss) | Total Stockholders’ Equity | Total Comprehensive Income | |||||||||||||||||||||||
| Shares | Amount | |||||||||||||||||||||||||||
BALANCE, December 31, 2007 | 101,819 | 102 | 832,948 | 64,728 | (452 | ) | 897,326 | |||||||||||||||||||||
Common stock issued under stock-based compensation plans | 3,926 | 4 | 39,960 | — | — | 39,964 | ||||||||||||||||||||||
Repurchase of common stock | (11,440 | ) | (11 | ) | (142,989 | ) | — | — | (143,000 | ) | ||||||||||||||||||
Fees related to the repurchase of common stock | — | — | (2,250 | ) | — | — | (2,250 | ) | ||||||||||||||||||||
Net tax deficiency related to stock-based compensation | — | — | (2,500 | ) | — | — | (2,500 | ) | ||||||||||||||||||||
Cancellation and retirement of shares related to settlement of the Imceda escrow | (7 | ) | (1 | ) | (87 | ) | — | — | (88 | ) | ||||||||||||||||||
Cash settlement of equity based awards | — | — | (743 | ) | — | — | (743 | ) | ||||||||||||||||||||
Proceeds received from certain executive officers as part of our restatement remedial actions | — | — | 200 | — | — | 200 | ||||||||||||||||||||||
Compensation expense associated with stock-based payments | — | — | 16,348 | — | — | 16,348 | ||||||||||||||||||||||
Losses reclassified to net income | — | — | — | — | 452 | 452 | $ | 452 | ||||||||||||||||||||
Net income | — | — | — | 68,043 | — | 68,043 | 68,043 | |||||||||||||||||||||
Comprehensive income | — | — | — | — | — | — | $ | 68,495 | ||||||||||||||||||||
BALANCE, December 31, 2008 | 94,298 | 94 | 740,887 | 132,771 | — | 873,752 | ||||||||||||||||||||||
Common stock issued under stock-based compensation plans | 3,752 | 4 | 43,260 | — | — | 43,264 | ||||||||||||||||||||||
Net tax benefit related to stock-based compensation | — | — | 4,867 | — | — | 4,867 | ||||||||||||||||||||||
Repurchase of common stock | (7,848 | ) | (8 | ) | (111,009 | ) | — | — | (111,017 | ) | ||||||||||||||||||
Fees related to the repurchase of common stock | — | — | (1,431 | ) | — | — | (1,431 | ) | ||||||||||||||||||||
Cash settlement of equity based awards | — | — | (1,268 | ) | — | — | (1,268 | ) | ||||||||||||||||||||
Compensation expense associated with stock-based payments | — | — | 14,079 | — | — | 14,079 | ||||||||||||||||||||||
Unrealized loss on available-for-sale securities, net of tax | — | — | — | — | (9 | ) | (9 | ) | $ | (9 | ) | |||||||||||||||||
Unrealized gain on foreign currency hedges, net of tax | — | — | — | — | 196 | 196 | 196 | |||||||||||||||||||||
Net income | — | — | — | 70,359 | — | 70,359 | 70,359 | |||||||||||||||||||||
Comprehensive income | — | — | — | — | — | — | $ | 70,546 | ||||||||||||||||||||
BALANCE, December 31, 2009 | 90,202 | $ | 90 | $ | 689,385 | $ | 203,130 | $ | 187 | $ | 892,792 | |||||||||||||||||
Common stock issued under stock-based compensation plans | 4,954 | 5 | 62,499 | — | — | 62,504 | ||||||||||||||||||||||
Net tax deficiency related to stock-based compensation | — | — | (3,071 | ) | — | — | (3,071 | ) | ||||||||||||||||||||
Repurchase of common stock | (2,263 | ) | (2 | ) | (37,361 | ) | — | — | (37,363 | ) | ||||||||||||||||||
Fees related to the repurchase of common stock | — | — | (9 | ) | — | — | (9 | ) | ||||||||||||||||||||
Cash settlement of equity based awards | — | — | (3,421 | ) | — | — | (3,421 | ) | ||||||||||||||||||||
Compensation expense associated with stock-based payments | — | — | 21,618 | — | — | 21,618 | ||||||||||||||||||||||
Unrealized loss on available-for-sale securities, net of tax | — | — | — | — | 290 | 290 | $ | 290 | ||||||||||||||||||||
Unrealized gain on foreign currency hedges, net of tax | — | — | — | — | 359 | 359 | 359 | |||||||||||||||||||||
Net income | — | — | — | 98,567 | — | 98,567 | 98,567 | |||||||||||||||||||||
Comprehensive income | — | — | — | — | — | — | $ | 99,216 | ||||||||||||||||||||
BALANCE, December 31, 2010 | 92,893 | $ | 93 | $ | 729,640 | $ | 301,697 | $ | 836 | $ | 1,032,266 | |||||||||||||||||
The accompanying notes are an integral part of these consolidated financial statements.
F-6
Table of Contents
QUEST SOFTWARE, INC. AND SUBSIDIARIES
CONSOLIDATED STATEMENTS OF CASH FLOWS
(In thousands)
| Year Ended December 31 | ||||||||||||
| 2010 | 2009 | 2008 | ||||||||||
Cash flows from operating activities: | ||||||||||||
Net income | $ | 98,567 | $ | 70,359 | $ | 68,043 | ||||||
Adjustments to reconcile net income to net cash provided by operating activities: | ||||||||||||
Depreciation and amortization | 43,031 | 47,973 | 48,255 | |||||||||
Compensation expense associated with stock-based payments | 23,101 | 15,178 | 17,106 | |||||||||
Change in fair value of contingent consideration | 2,500 | — | — | |||||||||
Deferred income taxes | 6,286 | 2,376 | (236 | ) | ||||||||
Impairment losses on cost method investments | — | — | 2,001 | |||||||||
Excess tax benefit related to stock-based compensation | (1,582 | ) | (1,825 | ) | (3,415 | ) | ||||||
Provision for bad debts | 616 | 72 | 1,358 | |||||||||
Other non-cash adjustments, net | 950 | (382 | ) | 2,175 | ||||||||
Changes in operating assets and liabilities, net of effects of acquisitions: | ||||||||||||
Accounts receivable | (21,177 | ) | 320 | (6,915 | ) | |||||||
Prepaid expenses and other current assets | 4,329 | (1,156 | ) | 1,809 | ||||||||
Other assets | 1,988 | (674 | ) | 986 | ||||||||
Accounts payable | 1,008 | (491 | ) | (1,694 | ) | |||||||
Accrued compensation | 3,859 | (3,208 | ) | (3,871 | ) | |||||||
Other accrued expenses | (786 | ) | (8,339 | ) | (5,359 | ) | ||||||
Income taxes payable | (23,660 | ) | (3,149 | ) | (5,465 | ) | ||||||
Deferred revenue | 48,520 | 33,426 | 37,113 | |||||||||
Other liabilities | (2,241 | ) | 2,806 | (40 | ) | |||||||
Net cash provided by operating activities | 185,309 | 153,286 | 151,851 | |||||||||
Cash flows from investing activities: | ||||||||||||
Purchases of property and equipment | (13,731 | ) | (11,286 | ) | (12,244 | ) | ||||||
Cash paid for acquisitions, net of cash acquired | (58,734 | ) | (12,253 | ) | (137,207 | ) | ||||||
Change in restricted cash | 587 | 1,494 | 46,496 | |||||||||
Cash paid for software rights | (2,229 | ) | — | — | ||||||||
Notes receivable from a cost method investee | (2,000 | ) | — | — | ||||||||
Change in notes receivable | (300 | ) | — | — | ||||||||
Purchases of cost method investments | — | (3,000 | ) | (3,160 | ) | |||||||
Purchases of investment securities | (226,201 | ) | (47,853 | ) | (52,003 | ) | ||||||
Sales and maturities of investment securities | 186,157 | 2,814 | 82,071 | |||||||||
Net cash used in investing activities | (116,451 | ) | (70,084 | ) | (76,047 | ) | ||||||
Cash flows from financing activities: | ||||||||||||
Proceeds from loans payable | — | 68,428 | — | |||||||||
Repayment of loans payable | (32,653 | ) | (2,534 | ) | — | |||||||
Repurchase of common stock | (37,363 | ) | (112,447 | ) | (145,250 | ) | ||||||
Repayment of capital lease obligations | (245 | ) | (263 | ) | (256 | ) | ||||||
Cash paid for line of credit fees | — | (1,979 | ) | — | ||||||||
Proceeds from the exercise of stock options | 62,504 | 43,264 | 39,964 | |||||||||
Excess tax benefit related to stock-based compensation | 1,582 | 1,825 | 3,415 | |||||||||
Proceeds received from certain executive officers as part of our restatement remedial actions | — | — | 200 | |||||||||
Net cash used in financing activities | (6,175 | ) | (3,706 | ) | (101,927 | ) | ||||||
Effect of exchange rate changes on cash and cash equivalents | 910 | (2,451 | ) | 6,450 | ||||||||
Net increase (decrease) in cash and cash equivalents | 63,593 | 77,045 | (19,673 | ) | ||||||||
Cash and cash equivalents, beginning of period | 292,940 | 215,895 | 235,568 | |||||||||
Cash and cash equivalents, end of period | $ | 356,533 | $ | 292,940 | $ | 215,895 | ||||||
Supplemental disclosures of consolidated cash flow information: | ||||||||||||
Cash paid for interest | $ | 3,305 | $ | 3,746 | $ | 289 | ||||||
Cash paid for income taxes | $ | 32,988 | $ | 15,077 | $ | 22,452 | ||||||
Supplemental schedule of non-cash investing and financing activities: | ||||||||||||
Unrealized gain (loss) on available-for-sale securities, net of tax | $ | 290 | $ | (9 | ) | $ | — | |||||
Unrealized gain on forward foreign currency contracts | $ | 359 | $ | 196 | $ | — | ||||||
Contingent consideration related to acquisitions | $ | 2,015 | $ | 4,000 | $ | — | ||||||
Unpaid purchases of property and equipment | $ | 1,382 | $ | 1,081 | $ | 852 | ||||||
The accompanying notes are an integral part of these consolidated financial statements.
F-7
Table of Contents
QUEST SOFTWARE, INC. AND SUBSIDIARIES
NOTES TO CONSOLIDATED FINANCIAL STATEMENTS
NOTE 1 — SUMMARY OF SIGNIFICANT ACCOUNTING POLICIES
Organization and Financial Statement Presentation
Quest Software, Inc. was incorporated in California in 1987 and reincorporated in Delaware in 2009. We are a leading developer and vendor of application, database, Windows and virtualization management software products. We also provide consulting, training, and support services to our customers. We have wholly-owned research and development subsidiaries and sales subsidiaries for marketing, distribution, and support of our products and services in the United States and abroad. References to “Quest,” “Quest Software,” the “Company,” “we,” “us,” or “our” refer to Quest Software, Inc. and its consolidated subsidiaries.
The accompanying consolidated financial statements have been prepared in accordance with accounting principles generally accepted in the United States of America and include our accounts and those of our majority owned subsidiaries. Intercompany transactions are eliminated and the portion of the net income or net loss of subsidiaries applicable to minority interests adjusts to Other (expense) income, net.
Certain reclassifications have been made to fiscal year 2008 amounts to conform to the current year presentation of our consolidated statements of stockholders’ equity and comprehensive income as a result of changing our state of incorporation from California to Delaware during 2009 and assigning a par value to our common stock.
Tax Adjustment Related to Prior Periods
During the year-end close process, we discovered that approximately $6.8 million in tax reserves should have been released in prior periods upon the lapsing of statutes of limitations in federal taxing jurisdictions. The release of these tax reserves would result in higher net income and earnings per share than previously reported for the prior interim periods and the year ended December 31, 2009. We recorded a year-end adjustment of $6.8 million and management has concluded that this correction is not material to any periods affected. The impact of the year-end adjustment for the three months and twelve months ended December 31, 2010 was an increase in net income of $6.8 million and an increase in diluted earnings per share of $0.07. The impact to prior interim periods for the income statement would have been an increase in net income of $2.1 million, $0.1 million and $4.6 million for the three months ended September 30, 2010, December 31, 2009 and September 30, 2009, respectively and an increase in diluted earnings per share of $0.02, $— and $0.05 for the three months ended September 30, 2010, December 31, 2009 and September 30, 2009, respectively. The impact to prior year would have been an increase in net income of $4.7 million and an increase in diluted earnings per share of $0.05 for the twelve months ended December 31, 2009. The impact to prior periods for the balance sheet would have been a decrease in non-current deferred income taxes of $1.0 million and a decrease in long-term income taxes payable of $7.8 million as of September 30, 2010, a decrease in non-current deferred income taxes of $0.7 million and a decrease in long-term income taxes payable of $5.4 million as of December 31, 2009, and a decrease in non-current deferred income taxes of $0.7 million and a decrease in long-term income taxes payable of $5.3 million as of September 30, 2009, respectively.
Cumulative Effect of Prior Period Consolidated Balance Sheet Adjustment
Included in the “net tax benefit related to stock-based compensation” in the period ending December 31, 2009 is a correction of $6.9 million related to deferred income taxes on stock options that had been incorrectly derecognized in 2006. The correction does not impact earnings and management has concluded that this correction is immaterial. Since the $6.9 million should not have been recorded as reductions to deferred tax assets and additional paid-in capital during 2006, both the deferred tax asset and additional paid-in capital are being re-established in the period ending December 31, 2009. The relative impact to prior periods would have been an increase in the deferred tax asset and additional paid-in capital of $7.1 million as of December 31, 2008 and 2007.
Use of Estimates
The preparation of the consolidated financial statements in conformity with accounting principles generally accepted in the United States of America requires management to make estimates and assumptions that affect the reported amounts of assets and liabilities and disclosure of contingent assets and liabilities at the date of the consolidated financial statements and the reported amounts of revenues and expenses during the reporting period. Actual results could differ from those estimates.
New Accounting Pronouncements
In October 2009, Financial Accounting Standards Board (“FASB”) issued an amendment to its accounting guidance on revenue arrangements with multiple deliverables. This new accounting guidance addresses the unit of accounting for arrangements involving multiple deliverables and how consideration should be allocated to separate units of accounting, when applicable. This guidance is effective for fiscal years beginning on or after June 15, 2010. There was no material impact from the adoption of this guidance on our consolidated financial position or results of operations.
F-8
Table of Contents
QUEST SOFTWARE, INC. AND SUBSIDIARIES
NOTES TO CONSOLIDATED FINANCIAL STATEMENTS—(Continued)
In October 2009, FASB issued an amendment to its accounting guidance on certain revenue arrangements that include software elements. The new accounting guidance excludes from consideration of software revenue recognition principles all tangible products containing both software and non-software components that function together to deliver the product’s essential functionality. This guidance is effective for fiscal years beginning on or after June 15, 2010. This guidance must be adopted in the same period that the company adopts the amended accounting for arrangements with multiple deliverables described in the preceding paragraph. There was no material impact from the adoption of this guidance on our consolidated financial position or results of operations.
In December 2009, FASB issued new guidance regarding improvements to financial reporting by enterprises involved with variable interest entities. The new guidance provides an amendment to its consolidation guidance for variable interest entities and the definition of a variable interest entity and requires enhanced disclosures to provide more information about an enterprise’s involvement in a variable interest entity. This amendment also requires ongoing assessments of whether an enterprise is the primary beneficiary of a variable interest entity and is effective January 1, 2010. There was no impact from the adoption of this guidance on our consolidated financial position or results of operations.
In January 2010, FASB issued an amendment to its accounting for distributions to shareholders with components of stock and cash. This new guidance clarifies that the stock portion of a distribution to shareholders that allows them to elect to receive cash or shares with a potential limitation on the total amount of cash that all shareholders can elect to receive in the aggregate is considered a share issuance. This guidance is effective for interim and annual periods ending on or after December 15, 2009, and should be applied on a retrospective basis. There was no impact from the adoption of this guidance since we have never declared dividends on our common stock.
In January 2010, FASB issued an amendment to its accounting and reporting for decreases in ownership of a subsidiary. This amendment clarifies the scope of the decrease in ownership provisions in the consolidation – overall subtopic and related guidance. This amendment is effective beginning in the period that an entity adopts FASB’s guidance onNoncontrolling Interests in Consolidated Financial Statements,which was effective January 1, 2009. There was no impact from the adoption of this guidance on our consolidated financial position or results of operations.
In January 2010, FASB issued an amendment regarding improving disclosures about fair value measurements. This new guidance requires some new disclosures and clarifies some existing disclosure requirements about fair value measurement. The new disclosures and clarifications of existing disclosures are effective for interim and annual reporting periods beginning after December 15, 2009, except for the disclosures about purchases, sales, issuances and settlements in the roll forward of activity in Level 3 fair value measurements. Those disclosures are effective for fiscal years beginning after December 15, 2010 and for interim periods within those fiscal years. There was no impact from the adoption of this guidance to our consolidated financial position or results of operations as the amendment only addresses disclosures.
In March 2010, FASB issued an amendment toDerivatives and Hedging-Embedded Derivatives. The amendment provided clarifications and related additional examples to improve financial reporting by resolving potential ambiguity about the breadth of the embedded credit derivative scope exception. The amendment is effective for each reporting entity at the beginning of its first fiscal quarter beginning after June 15, 2010. There was no impact from our adoption of this guidance to our consolidated financial position or results of operations as we do not have contracts containing embedded credit derivative features.
In April 2010, FASB issued an amendment toStock Compensation. The amendment clarifies that an employee stock-based payment award with an exercise price denominated in the currency of a market in which a substantial portion of the entity’s equity shares trades should not be considered to contain a condition that is not a market, performance, or service condition. Therefore, an entity would not classify such an award as a liability if it otherwise qualifies as equity. The amendments are effective for fiscal years, and interim periods within those fiscal years, beginning on or after December 15, 2010. We do not anticipate any impact from our adoption of this guidance since our stock-based payment awards have an exercise price denominated in the same currency of the market in which our Company shares are traded.
F-9
Table of Contents
QUEST SOFTWARE, INC. AND SUBSIDIARIES
NOTES TO CONSOLIDATED FINANCIAL STATEMENTS—(Continued)
In July 2010, FASB issued an amendment toDisclosures about the Credit Quality of Financing Receivables and the Allowance for Credit Losses. The amendment enhances disclosures about the credit quality of financing receivables and the allowance for credit losses. This Update requires an entity to provide a greater level of disaggregated information about the credit quality of its financing receivables and its allowance for credit losses. In addition, the amendments in this Update require an entity to disclose credit quality indicators, past due information, and modifications of its financing receivables. These improvements will help financial statement users assess an entity’s credit risk exposures and its allowance for credit losses. The amendment is effective for interim and annual periods ending on or after December 15, 2010. There was no impact from our adoption of this guidance since we do not have any financing receivables.
In December 2010, FASB issued an amendment to goodwill impairment test. The amendments modify Step 1 of the goodwill impairment test for reporting units with zero or negative carrying amounts. For those reporting units, an entity is required to perform Step 2 of the goodwill impairment test if it is more likely than not that a goodwill impairment exists. In determining whether it is more likely than not that goodwill impairment exists, an entity should consider whether there are any adverse qualitative factors indicating that impairment may exist. The qualitative factors are consistent with the existing guidance and examples, which require that goodwill of a reporting unit be tested for impairment between annual tests if an event occurs or circumstances change that would more likely than not reduce the fair value of a reporting unit below its carrying amount. The amendments are effective for fiscal years, and interim periods within those years, beginning after December 15, 2010. Early adoption is not permitted. We do not anticipate any impact from our adoption of this guidance since we do not have any reporting units with zero or negative carrying amounts at December 31, 2010.
In December 2010, FASB issued an amendment to the disclosure of supplementary pro forma information for business combinations. The amendments in this ASU specify that if a public entity presents comparative financial statements, the entity should disclose revenue and earnings of the combined entity as though the business combination that occurred during the current year had occurred as of the beginning of the comparable prior annual reporting period only. The amendments also expand the supplemental pro forma disclosures to include a description of the nature and amount of material, nonrecurring pro forma adjustments directly attributable to the business combination included in the reported pro forma revenue and earnings. The amendments are effective prospectively for business combinations for which the acquisition date is on or after the beginning of the first annual reporting period beginning on or after December 15, 2010. Early adoption is permitted, but was not elected.
Cash Equivalents and Investments
We consider highly liquid investments with original maturities of three months or less at the date of purchase to be cash equivalents. Cash equivalents consist primarily of AAA-rated money market funds in all periods presented. Investments consist of available-for-sale or trading securities as defined inAccounting for Certain Investments in Debt and Equity Securities. These investments are recorded at fair value and are classified as investments in the accompanying consolidated balance sheets as of December 31, 2010. The changes in fair values on trading securities are recorded as a component of Other (expense) income, net. The changes in fair values, net of applicable taxes, on available-for-sale investment securities are recorded as unrealized gains (losses) as a component of accumulated other comprehensive income in stockholders’ equity. Realized gains and losses and declines in value judged to be other-than-temporary on available-for-sale securities are included in Other (expense) income, net. The cost basis for realized gains and losses on available-for-sale securities is determined on a specific identification basis. Investments are made based on our investment policy which restricts the types of investments that can be made. We have classified available-for-sale and trading securities as short-term or long-term based primarily on the maturity date of the related securities.
Concentration of Credit Risk
Financial instruments that potentially subject us to credit risk include cash and cash equivalents, investments and accounts receivable. We believe that credit risks related to our investment portfolio are moderated by limitations we place on our exposure to any one issuer and credit risks on accounts receivable are moderated by the diversity of our products, customers and geographic sales areas. We monitor extensions of credit and have not experienced significant credit losses in the past. We maintain an allowance both for bad debts and for sales returns and cancellations and such losses and returns have historically been within management’s expectations. No single customer accounted for 10% or more of our total revenues or accounts receivable for the years ended December 31, 2010, 2009 or 2008.
F-10
Table of Contents
QUEST SOFTWARE, INC. AND SUBSIDIARIES
NOTES TO CONSOLIDATED FINANCIAL STATEMENTS—(Continued)
Allowances for Doubtful Accounts and Returns
We record allowances for doubtful accounts based upon a specific review of significant outstanding invoices and/or our historical write-off experience. We also record a provision for estimated sales returns and allowances on product and service related sales in accordance with GAAP. These estimates are based on historical sales returns and other known factors.
Other Assets
The following table summarizes our other assets by asset type at the dates indicated (in thousands):
Asset Type | December 31 | |||||||
| 2010 | 2009 | |||||||
Cost method investments | $ | 14,304 | $ | 14,427 | ||||
Income taxes receivable | 2,092 | 4,885 | ||||||
Lease security deposits | 2,678 | 2,622 | ||||||
Non-current restricted cash(1) | 1,040 | 1,197 | ||||||
Other | 1,729 | 3,476 | ||||||
Total Other Assets | $ | 21,843 | $ | 26,607 | ||||
| (1) | Relates primarily to cash restricted as a condition to certain non-US facility leases. |
Cost method investments are investments made in non-consolidated companies accounted for under the cost method given that we do not have the ability to exercise significant influence over these companies’ operations. These investments were made in early stage private companies and a private equity fund for business and strategic purposes. We may make additional investments of this nature in the future. We periodically monitor our investments for impairment and will record reductions in carrying values if and when necessary. The evaluation process is based on information that we request from these privately-held companies. This information is not subject to the same disclosure regulations as U.S. public companies and, as such, the basis for these evaluations is subject to the timing and the accuracy of the data received from these companies. As part of this evaluation process, our review includes but is not limited to a review of each company’s cash position, recent financing activities, financing needs, earnings and revenue outlook, operational performance, management or ownership changes, and impacts from competitive pressure to the extent that we have access to such information. If we were to subsequently determine that the carrying value of our investment in a company is at an amount above fair value, an adjustment will be made in that corresponding period resulting in a charge against earnings for the write-down.
Property and Equipment
Property and equipment are stated at cost less accumulated depreciation and amortization. Depreciation and amortization are provided using the straight-line method over the following estimated useful lives:
| Years | ||||
Building | 30 | |||
Furniture and fixtures | 7 | |||
Machinery and equipment | 7 | |||
Computer equipment | 3 | |||
Computer software | 3-7 | |||
Leasehold improvements are amortized over the shorter of the estimated useful lives of the improvements or the term of the related lease. Repair and maintenance costs associated with property, equipment and leasehold improvements are expensed as incurred. Software licenses are recorded at cost and are amortized over the shorter of the estimated useful lives of the related products or the term of the license, generally three years.
We capitalize external direct costs of materials and services used in developing or obtaining internal-use computer software and amortize these costs using the straight-line method over the estimated useful life of the software, which range from 3 to 7 years. Costs of significant upgrades and enhancements that result in additional functionality are also capitalized, whereas costs incurred for maintenance and minor upgrades and enhancements are expensed as incurred.
F-11
Table of Contents
QUEST SOFTWARE, INC. AND SUBSIDIARIES
NOTES TO CONSOLIDATED FINANCIAL STATEMENTS—(Continued)
Business Acquisitions and Related Intangible Assets
For business acquisitions, we recognize separately from goodwill the identifiable assets acquired, the liabilities assumed, and any noncontrolling interests in an acquiree, which are measured at the acquisition date fair value. Goodwill arising from acquisitions (see Note 2 - Acquisitions and Note 6 – Goodwill and Intangible Assets, Net) is measured as the excess of consideration transferred over the net amounts of the identifiable assets acquired and the liabilities assumed at the acquisition date.
We use significant estimates and assumptions, including fair value estimates, as of the business combination date and refine those estimates that are provisional, as necessary, during the measurement period. The measurement period is the period after the acquisition date, not to exceed one year, in which we may gather new information about facts and circumstances that existed as of the acquisition date to adjust the provisional amounts recognized. Measurement period adjustments are applied retrospectively. All other adjustments are recorded to the income statement.
Commencing January 1, 2009, costs to effect an acquisition are recorded in general and administrative expenses on the consolidated income statements as the expenses are incurred.
Intangible assets are recorded at the estimated fair value of acquired technology, in-process research and development (“IPR&D”), customer relationships, non-compete agreements, trademarks and trade names acquired and amortized using the straight-line method over estimated useful lives. The estimated useful lives of the intangible assets being amortized range from two to seven years. The estimated fair value of trade names associated with ScriptLogic Corporation acquired in 2007 and PacketTrap Networks, Inc. acquired in 2009 were assigned indefinite useful lives and are not being amortized. Accumulated amortization of intangible assets was $203.6 million and $174.8 million at December 31, 2010 and 2009, respectively. The net carrying amount of intangible assets was considered recoverable at December 31, 2010. We test goodwill for impairment at the reporting unit level on an annual basis in the fourth quarter or more frequently if we believe indicators of impairment exist. The carrying amount of goodwill was considered recoverable at December 31, 2010, based on the results of our goodwill impairment evaluation performed in the fourth quarter of 2010.
Long-Lived Assets
We account for the impairment and disposition of long-lived assets in accordance withAccounting for the Impairment or Disposal of Long-Lived Assets. In accordance with this guidance, long-lived assets to be held and used are reviewed for events or changes in circumstances, which indicate that their carrying value may not be recoverable. We periodically review the carrying value of long-lived assets to determine whether or not impairment to such value has occurred.
Derivative Instruments
Foreign Exchange Risk Management Policy
In February 2009, our Board of Directors approved our Foreign Exchange Risk Management Policy. The policy identifies target exposures such as balance sheet, cash flow and income statement risks, program objectives, approved financial instruments and counterparties, accounting and tax treatment, as well as oversight, reporting and controls. The functional currency of all our subsidiaries is the U.S. Dollar. Our exposure to foreign exchange risk is composed of the combination of our foreign operations net profits and losses denominated in currencies other than the U.S. Dollar, as well as our net balances of monetary assets and liabilities within our foreign subsidiaries. These exposures have the potential to produce either gains or losses depending on the directional movement of the foreign currencies versus the U.S. Dollar and our operational profile in foreign subsidiaries. Certain balance sheet items are re-measured each period and the changes in value are recorded within Other income, net.
FASB’s authoritative guidance on derivative instruments and hedging activities requires that we recognize all derivative instruments on the balance sheet at fair value. If certain conditions are met, hedge accounting may be applied and the derivative instrument may be specifically designated as: (a) a hedge of the exposure to changes in the fair value of a recognized asset or liability or unrecognized firm commitment, referred to as afair value hedge,or (b) a hedge of the exposure to the variability of cash flows of a recognized asset, liability or forecasted transaction, referred to as acash flow hedge,or (c) a hedge of the foreign currency exposure of an unrecognized firm commitment, a recognized asset or liability, a forecasted transaction or a net investment in a foreign operation, referred to as a foreign currency hedge.
In the case of a qualifying cash flow hedge, changes in the value of the derivative instruments that are highly effective are recognized in Accumulated other comprehensive income (“AOCI”) on the consolidated balance sheets, until the hedged item is recognized in the consolidated income statement. The ineffective portion of a derivative’s change in fair value is recognized through the consolidated income statement. Upon the occasional termination of a cash flow hedge, the remaining cost of that hedge is amortized over the remaining life of the hedged item in proportion to the change in the hedged forecasted transaction. We have derivatives in place to hedge the exposure to the variability in future cash flows for revenues and forecasted research and development cash expenses. We formally document all qualifying hedge relationships, as well as our risk management objective and strategy for undertaking each hedge transaction. Derivatives that are non-designated hedges are adjusted to fair value through the consolidated income statement. Quest does not use derivative instruments for speculative purposes. See Note 14 – Derivative Instruments for a full description of our derivative activities.
F-12
Table of Contents
QUEST SOFTWARE, INC. AND SUBSIDIARIES
NOTES TO CONSOLIDATED FINANCIAL STATEMENTS—(Continued)
Fair Value of Financial Instruments
The carrying amounts of our financial instruments including cash and cash equivalents, investments in available-for-sale and trading securities, accounts receivable, derivatives, accounts payable, accrued liabilities and loans payable approximate their respective fair values because of the relatively short period of time between origination of the instruments and their expected realization or liquidation, or because they are carried at fair value.
We adopted FASB’s standard for financial assets and financial liabilities measured at fair value on a recurring basis on January 1, 2008. The standard defines fair value measurements, establishes a framework for measuring fair value and outlines a fair value hierarchy based on the inputs to valuation techniques used to measure fair value. The standard categorizes the inputs to valuation techniques into a three-level hierarchy based on the extent to which the measurement relies on observable market inputs in measuring fair value. Assets and liabilities are classified within this hierarchy in their entirety based on the lowest level of any input that is significant to the fair value measurement. Financial instruments carried at fair value under a Level 1 include inputs based on unadjusted quoted prices in active markets for those identical financial instruments. The financial instruments recorded under Level 2 are valued primarily utilizing inputs or prices that are observable in the marketplace, can be derived from observable market data or corroborated by observable levels at which transactions are executed. Because financial instruments classified as Level 3 are generally based on unobservable inputs, the process to determine fair value is generally more subjective and involves management judgment and assumptions. These assumptions may have a significant effect on our estimates of fair value, and the use of different assumptions as well as changes in market conditions could have a material effect on our results of operations or financial condition.
We adopted FASB’s standard for nonfinancial assets and nonfinancial liabilities measured at fair value on a nonrecurring basis on January 1, 2009.
See Note 15 – Fair Value Measurements for further information, including the classification within the three-level hierarchy of all of our assets and liabilities carried in our consolidated balance sheet at fair value as of December 31, 2010.
Revenue Recognition
We derive revenues from three primary sources: (1) software licenses, (2) annual maintenance and support services and (3) consulting and training services. We recognize revenue in accordance with FASB’s authoritative guidance on software revenue recognition.
Before revenue can be recognized all of the following criteria must be satisfied:
| (1) | Persuasive evidence of an arrangement exists – including a written contract signed by both the end customer and Quest. |
| (2) | Delivery has occurred – when all product and/or service that is essential to the functionality is delivered to the end customer. |
| (3) | The fee is fixed or determinable – when we have a signed contract that states the agreed upon fee for our product and/or service and specifies the related terms and conditions that govern that arrangement, and is free of material contingencies or significant uncertainty. |
| (4) | Collection is probable – assessed based on the probability of collection on a customer-by-customer basis based on payment history and our evaluation of the customer’s financial position. |
We license our products primarily through our direct sales force, our telesales force and, increasingly, indirect channels including value added resellers and distributors. For our direct sales, we utilize written contracts as the means to establish the terms and conditions upon which our products and services are sold to our end customers. For our indirect sales transactions, we accept orders from our resellers and distributors when they have existing orders from an end customer. Indirect sales through resellers are a growing proportion of our transaction volume. These transactions are generally handled via processes and policies that are similar to an end customer sale. We utilize written contracts coupled with purchase orders as the means to establish the terms and conditions of these indirect sales transactions.
F-13
Table of Contents
QUEST SOFTWARE, INC. AND SUBSIDIARIES
NOTES TO CONSOLIDATED FINANCIAL STATEMENTS—(Continued)
We recognize revenue from reseller and distributor transactions upon invoicing the order provided all other revenue recognition criteria have been met. For those resellers and distributors that have established a history of consistent, timely cash collection with us, we accept orders and simultaneously recognize revenue since the resellers and distributors have existing orders from an end user customer. For those resellers that have not established a history of consistent, timely cash collection with us, we accept orders and defer revenue until cash collection occurs. The probability of collection criteria per GAAP is applied to each individual reseller or distributor rather than to all channel partners sales in aggregate.
Most of our software products are “off the shelf” products that do not require customization. We initially capture value for our products by selling a perpetual software license to end customers. The fee for the first year of maintenance is included in, or bundled with, the perpetual software license at the time of initial sale. As such, the combination at initial sale of a perpetual software license and one year of maintenance services represents a “multiple-element” arrangement for revenue recognition purposes.
We account for the perpetual software license component of these multiple-element arrangements using the residual method, which requires recognition of the perpetual software license revenue once all software products have been delivered to the end customer and the only undelivered element is maintenance, consulting and training services, if applicable. The value of the undelivered elements is determined based on vendor specific objective evidence (“VSOE”) of fair value and is deferred. The residual value, after allocation of the fee to the undelivered elements based on VSOE of fair value, is then allocated to the perpetual software license for the software products being sold.
Our maintenance VSOE of fair value is determined by reference to the prices our customers pay for this support when it is sold separately; that is, when we enter into an arms-length, annual renewal transaction with customers where the only offering sold is maintenance. These standalone maintenance renewal transactions are typically for one year in duration and are priced as a targeted percentage of the initial, discounted purchase price. We bill these renewal transactions in advance of the services provided. We also offer customers the right to purchase maintenance for multiple annual periods beyond the first year. Revenue for our standalone sale of annual maintenance renewals in years two, three and beyond is recognized ratably over the support term. Sales of maintenance for multiple annual periods are treated similarly.
Our consulting and training services VSOE of fair value is determined by reference to our established pricing and discounting practices for these services when sold separately. Our consulting and training services are typically sold as time-and-materials based contracts that range from five to fifteen days in duration. Revenue from consulting and training services is generally recognized as the services are performed in accordance with the underlying service contracts.
If we cannot objectively determine the fair value of any undelivered element (hardware, software, specific upgrade rights, etc.) in a bundled software and services arrangement, we defer revenue until all elements are delivered and services are performed, or until fair value can be objectively determined based on VSOE of fair value for any remaining undelivered elements.
In addition to perpetual software licenses, we sell a small amount of time-based software licenses (or term licenses) each year wherein customers pay a single fee for the right to use the software and receive maintenance for a defined period of time. Approximately 5% of our 2010 license revenue was generated by these time-based software licenses. All license and maintenance revenues on these term licenses are deferred and recognized ratably over the license term.
There are numerous factors that can affect our assessment of whether the revenue recognition criteria are satisfied. For example:
| • | An arrangement with governing terms and conditions that extend payment terms beyond our customary and historical practices may indicate that collection is not probable. We assess whether fees are fixed or determinable at the time of sale and recognize revenue if all other requirements have been met. Our standard payment terms are 30 days but may vary based on the country in which the agreement is executed. We generally deem payments that are due within 6 months to be fixed and determinable based on collections history and thereby satisfy the required revenue recognition criterion. |
| • | An arrangement with a contractual clause indicating the transaction is contingent on the end customer’s “satisfaction with and acceptance of” the product may yield a conclusion that the fee is not yet fixed or determinable. Substantially all of our software license arrangements do not include acceptance provisions. Since such acceptance provisions are not contained in our software license arrangements as standard provisions and the incidence of returns in accordance with such acceptance provisions cannot be reasonably estimated, if a contract does include such a provision we recognize revenue upon the earlier of receipt of written customer acceptance or expiration of the acceptance period. |
| • | We evaluate arrangements with governmental entities containing “fiscal funding” or “termination for convenience” provisions, when such provisions are required by law, to determine the probability of possible |
F-14
Table of Contents
QUEST SOFTWARE, INC. AND SUBSIDIARIES
NOTES TO CONSOLIDATED FINANCIAL STATEMENTS—(Continued)
cancellation. We consider multiple factors, including the history with the customer in similar transactions, and the planning, budgeting and approval processes undertaken by the governmental entity. If we determine upon execution of these arrangements that the likelihood of cancellation is not likely, we then recognize revenue once all of the criteria described above have been met. If such a determination cannot be made, revenue is recognized upon the earlier of cash receipt or approval of the applicable funding provision by the governmental entity. |
Our product return policy is reflected in our standard form license, maintenance and/or service agreements for end customers as well as for resellers and distributors. These agreements do not typically or expressly provide for product returns and cancellations as a matter of right. Quest maintains an allowance for sales returns and cancellations to cover the circumstances where the company accepts returns or cancellations on a discretionary basis even though not contractually obligated to do so. This allowance is intended only as an estimate of customer payment obligations associated with enforceable contracts for the delivery of products or services, which based on our history, we do not expect to collect.
We analyze various factors including our historical experience, the credit-worthiness of our customers, accounts receivable aging data, contractual terms and conditions and our current analysis of the collectability of accounts receivable in helping us make judgments about the level of allowances to hold for sales returns and cancellations. Changes in judgments on any of these factors could materially impact the timing and amount of revenue and costs recognized.
We recognize channel rebates in accordance with GAAP. The rebates provided to those who distribute our products are recorded as an offset to revenue as they are considered adjustments of the selling price of our products during the period of the corresponding order.
Uncollected Deferred Revenue
Because of our revenue recognition policies, there are circumstances for which we are unable to recognize revenue relating to sales transactions that have been billed, but the related account receivable has not been collected. While the receivable represents an enforceable obligation, for balance sheet presentation purposes we have offset the deferred revenue with the related account receivable and no amounts appear in our consolidated balance sheets for such transactions. The aggregate amount of unrecognized accounts receivable and deferred revenue was $33.0 million and $39.8 million at December 31, 2010 and 2009, respectively.
Software Development Costs
Costs incurred in the research and development of new software products and enhancements to existing software products are expensed as incurred until technological feasibility has been established. After technological feasibility is established, any additional costs are capitalized in accordance with FASB’s authoritative guidance onAccounting for the Costs of Computer Software to Be Sold, Leased or Otherwise Marketeduntil the product is available for general release. Because our current process for developing software is essentially completed concurrently with the establishment of technological feasibility, no software development costs have been capitalized as of December 31, 2010 and 2009.
Advertising Expenses
We expense all advertising costs as incurred, and such costs were $5.9 million, $4.5 million and $5.9 million for the years ended December 31, 2010, 2009 and 2008, respectively.
Foreign Currency Translation
In accordance with FASB’s authoritative guidance onForeign Currency Translation, the US Dollar is considered to be the functional currency for each of our foreign subsidiaries, as such subsidiaries act primarily as an extension of our parent company’s operations. The determination of functional currency is primarily based on the subsidiaries’ relative financial and operational dependence on the parent company. Assets and liabilities in these subsidiaries are re-measured at current exchange rates, except for property and equipment, deferred revenue, depreciation and investments, which are translated at historical exchange rates. Revenues and expenses are re-measured at weighted average exchange rates in effect during the year except for costs related to the above mentioned balance sheet items which are translated at historical rates. Foreign currency gains and losses are included in Other (expense) income, net in the consolidated income statements. There was a net foreign currency (loss) gain of $(3.2) million, $3.6 million and $(7.5) million for the year ended December 31, 2010, 2009 and 2008, respectively, based on re-measurement.
F-15
Table of Contents
QUEST SOFTWARE, INC. AND SUBSIDIARIES
NOTES TO CONSOLIDATED FINANCIAL STATEMENTS—(Continued)
Income Taxes
Income taxes are accounted for under the asset and liability method in accordance with FASB’s authoritative guidance onAccounting for Income Taxes.Deferred tax assets and liabilities are recognized for future tax consequences attributable to differences between the financial statement carrying amounts of existing assets and liabilities and their respective tax bases and operating loss and tax credit carry-forwards. Deferred tax assets and liabilities are measured using enacted tax rates expected to apply to taxable income in the years in which those temporary differences are expected to be recovered or settled. The effect on deferred tax assets and liabilities of a change in tax rates is recognized in income in the period that includes the enactment date. We provide valuation allowances against the net deferred tax asset for amounts that are not considered more likely than not to be realized (See Note 10 – Income Taxes for disclosure of amounts related to deferred taxes and associated valuation allowances).
In accordance with FASBs guidance on Accounting for Uncertainty in Income Taxes, we perform a comprehensive review of our portfolio of uncertain tax positions regularly. In this regard, an uncertain tax position represents our expected treatment of a tax position taken in a filed tax return, or planned to be taken in a future tax return or claim, which has not been reflected in measuring income tax expense for financial reporting purposes. Until these positions are sustained by the taxing authorities, we have not recognized the tax benefits resulting from such positions and report the tax effects as a liability for uncertain tax positions in our consolidated income statements.
Taxes Collected from Customers and Remitted to Governmental Authorities
We present taxes collected from customers and remitted to governmental authorities in accordance with the guidance onHow Taxes Collected from Customers and Remitted to Governmental Authorities Should Be Presented in the Income Statement (That Is, Gross versus Net Presentation), on a net basis.
Net Income Per Share
Basic net income per share is computed by dividing net income available to common stockholders by the weighted-average number of common shares outstanding for the period. Diluted net income per share reflects the potential dilution of securities by including other common stock equivalents, including stock options and restricted stock units, in the weighted-average number of common shares outstanding for a period, if dilutive.
The table below sets forth the reconciliation of the denominator of the net income per share calculation (in thousands):
| Year Ended December 31 | ||||||||||||
| 2010 | 2009 | 2008 | ||||||||||
Shares used in computing basic net income per share | 90,411 | 91,926 | 104,192 | |||||||||
Dilutive effect of stock options and restricted stock units(1) | 2,871 | 2,140 | 2,069 | |||||||||
Shares used in computing diluted net income per share | 93,282 | 94,066 | 106,261 | |||||||||
| (1) | Options to purchase 6,524, 6,314 and 9,126 shares of common stock were outstanding during 2010, 2009 and 2008, respectively, but were not included in the computation of diluted net income per share as inclusion would have been anti-dilutive. |
Stock-Based Compensation
We account for stock-based compensation using the fair value recognition provisions per GAAP.We estimate the fair value of stock options granted using a Black Scholes option valuation model and a single option award approach. We use historical data to estimate pre-vesting option forfeitures and record stock-based compensation expense only for those awards that are expected to vest. We amortize the fair value of stock options on a straight-line basis over the requisite service periods of the awards, which are generally the vesting periods. We value restricted stock units granted based on the market price of our common stock on the date of the grant. We amortize the value of restricted stock units on a straight-line basis over the restriction period. See Note 13 – Stock Based Compensation and Employee Benefit Plans for a description of our stock-based employee compensation plans and the assumptions we use to calculate the fair value of stock-based employee compensation.
F-16
Table of Contents
QUEST SOFTWARE, INC. AND SUBSIDIARIES
NOTES TO CONSOLIDATED FINANCIAL STATEMENTS—(Continued)
NOTE 2 — ACQUISITIONS
2010 Acquisitions
Völcker Informatik AG – In July 2010, we acquired 100% voting equity interest of Germany-based Völcker Informatik AG (“Völcker”), a privately held identity management solutions provider, for cash consideration of approximately $20.2 million. The acquisition further extends theQuest® One Identity Solution product portfolio. In connection with the acquisition, Quest also agreed to certain post-closing payments with a maximum potential payout of approximately $5.0 million paid over three years, of which $2.5 million relates to an earn-out contingent upon achieving certain sales targets and the remainder to retention bonuses tied to continued employment. The estimated fair value of the earn-out contingency of $2.0 million has been recorded as an accrual, making the total purchase price approximately $22.2 million.
The earn-out contingency requires payments of up to $2.5 million that will be due and payable if certain levels of billings to customers for Völcker products are met during the three-year period subsequent to the close of the acquisition. The fair value of the earn-out contingency was determined using the income approach with significant inputs that are not observable in the market. A key assumption is a discount rate consistent with our estimated pre-tax cost of debt. The expected outcomes were recorded at net present value. Subsequent changes in the fair value of the earn-out contingency will be recorded in earnings (refer to Note 15 – Fair Value Measurements).
The acquisition has been accounted for as a business combination and the purchase price was allocated primarily to goodwill and other intangible assets. Actual results of operations of Völcker are included in our consolidated financial statements from the date of acquisition. Our preliminary allocation of the purchase price to assets and liabilities based upon fair value determinations was as follows (in thousands):
Current assets | $ | 2,823 | ||
Acquired technologies with a useful life of 4.5 years | 5,416 | |||
Customer relationships with a useful life of 4.5 years | 3,401 | |||
Goodwill | 13,930 | |||
Other assets | 490 | |||
Current liabilities | (1,246 | ) | ||
Deferred income tax liabilities – non-current | (2,645 | ) | ||
Total purchase price | $ | 22,169 | ||
The preliminary allocation of purchase price for Völcker was based upon valuation information and estimates and assumptions available at the time of our filing. Our estimates and assumptions are subject to change. The areas of the purchase price allocation that are not yet finalized and are subject to change within the measurement period relate to our completion of income taxes review and the resulting goodwill.
The intangible assets will be amortized over the pattern in which the economic benefits of the intangible assets are being utilized, which in general reflects the cash flows generated from such assets. The goodwill associated with this acquisition is reported within our license and service segments of our business, and is not expected to be deductible for tax purposes. The goodwill allocation of 50% to licenses and 50% to services is based on both historical and projected relative contribution from licenses and services revenues. Goodwill results from expected synergies from the transaction, including complementary products that will enhance our overall product portfolio, and opportunities within new markets, which we believe will result in incremental revenue and profitability.
Surgient, Inc. – In August 2010, we acquired 100% voting equity interest of Texas-based Surgient, Inc. (“Surgient”), a privately held cloud management innovator for cash consideration of $35.0 million. Surgient will expand our cloud management set of capabilities. Surgient solutions are focused on creating and managing private enterprise clouds. The Surgient platform enables enterprise organizations to create flexible, robust, and scalable infrastructure-as-a-service (IaaS) clouds with existing data center infrastructure.
F-17
Table of Contents
QUEST SOFTWARE, INC. AND SUBSIDIARIES
NOTES TO CONSOLIDATED FINANCIAL STATEMENTS—(Continued)
The acquisition has been accounted for as a business combination and the purchase price was allocated primarily to goodwill and other intangible assets. Actual results of operations of Surgient are included in our consolidated financial statements from the date of acquisition. Our preliminary allocation of the purchase price to assets and liabilities based upon fair value determinations was as follows (in thousands):
Current assets | $ | 789 | ||
Acquired technologies with a useful life of 3.5 years | 1,030 | |||
In-process research and development | 120 | |||
Customer relationships with a useful life of 3.5 years | 1,240 | |||
Goodwill | 19,886 | |||
Deferred income tax assets – non-current | 15,303 | |||
Other assets | 1,271 | |||
Deferred revenue – current | (2,943 | ) | ||
Other current liabilities | (1,124 | ) | ||
Deferred revenue – non-current | (572 | ) | ||
Total purchase price | $ | 35,000 | ||
The preliminary allocation of purchase price for Surgient was based upon valuation information and estimates and assumptions available at the time of our filing. Our estimates and assumptions are subject to change. The areas of the purchase price allocation that are not yet finalized and are subject to change within the measurement period relate to our completion of income taxes review and the resulting goodwill.
The intangible assets will be amortized over the pattern in which the economic benefits of the intangible assets are being utilized, which in general reflects the cash flows generated from such assets. We acquired one in-process research and development (“IPR&D”) project. The value assigned to the IPR&D project was determined utilizing the income approach by determining cash flow projections relating to the project. We applied a discount rate of 12% to determine the value of the IPR&D project. The IPR&D project will be assessed for impairment until completed. Upon completion, the project will be amortized over its estimated useful life over the pattern in which the economic benefit of the intangible asset is being utilized. The goodwill associated with this acquisition is reported within our license and service segments of our business, and is not expected to be deductible for tax purposes. The goodwill allocation of 55% to licenses and 45% to services is based on both historical and projected relative contribution from licenses and services revenues. Goodwill results from expected synergies from the transaction, including complementary products that will enhance our overall product portfolio, and opportunities within new markets, which we believe will result in incremental revenue and profitability.
The pro forma effects of all 2010 acquisitions individually, or in the aggregate, would not have been material to our results of operations for the years ended December 31, 2010, 2009 and 2008, and therefore are not presented.
2009 Acquisition
PacketTrap Networks, Inc. – In December 2009, we acquired all of the outstanding shares of PacketTrap Networks, Inc. (“PacketTrap”), a provider of enterprise class network and application management software, for purchase consideration of approximately $11.0 million. The acquisition of PacketTrap allows us to fill a technical gap in our existing product lines for the network management space and to bolster our focus and product offerings in the mid-market. The PacketTrap purchase agreement provides for earn-out contingency payments totaling up to $10.8 million contingent upon the achievement of certain PacketTrap sales targets. The fair value of the earn-out contingency at acquisition date of $4.0 million has been accrued for a total purchase price of $15.0 million.
The PacketTrap contingent consideration arrangement requires payments of up to $10.8 million that will be due and payable if certain criteria in relation to amounts billed to customers for PacketTrap products are met during the three-year period subsequent to the close of the acquisition. The fair value of the contingent consideration arrangement was determined using the income approach with significant inputs that are not observable in the market. Key assumptions include a discount rate consistent with the level of risk of achievement and probability of meeting those sales targets. The expected outcomes were recorded at net present value. Subsequent changes in the fair value of the liability were recorded in earnings. At December, 31, 2010, the estimated fair value of the earn-out contingency was $6.5 million (refer to Note 15 – Fair Value Measurements). The estimated fair value increased due to actual earn-out achievement for 2010, improved expectations for the PacketTrap business in 2011 forward, adjustments to the earn-out agreement providing PacketTrap with greater opportunity to earn a higher payout for the 2011 earn-out period and the passage of time.
F-18
Table of Contents
QUEST SOFTWARE, INC. AND SUBSIDIARIES
NOTES TO CONSOLIDATED FINANCIAL STATEMENTS—(Continued)
The acquisition has been accounted for as a business combination and the purchase price was allocated primarily to other intangible assets and to the residual asset, goodwill. Actual results of operations of PacketTrap are included in our consolidated financial statements from the date of acquisition. Our final allocation of the purchase price to assets and liabilities based upon the fair value determinations was as follows (in thousands):
Current assets | $ | 51 | ||
Acquired technologies with a useful life of 3.0 years | 1,500 | |||
In-process research and development | 1,100 | |||
Trade name with an indefinite useful life | 800 | |||
Customer relationships | 100 | |||
Non-compete agreements with a useful life of 3.0 years | 650 | |||
Goodwill | 9,985 | |||
Other non-current assets | 875 | |||
Current liabilities | (61 | ) | ||
Total purchase price | $ | 15,000 | ||
The intangible assets will be amortized over the pattern in which the economic benefits of the intangible assets are being utilized, which in general reflects the cash flows generated from such assets. We acquired one in-process research and development (“IPR&D”) project. The value assigned to the IPR&D project was determined utilizing the income approach by determining cash flow projections relating to the project. We applied a discount rate of 21% to determine the value of the IPR&D project. The IPR&D project will be assessed for impairment and we did not identify any impairment as of December 31, 2010. Upon completion, the project will be amortized over its estimated useful life over the pattern in which the economic benefit of the intangible asset is being utilized. The goodwill associated with this acquisition is reported within our license and service segments of our business, and is not expected to be deductible for tax purposes. The goodwill allocation of 50% to licenses and 50% to services is based on both historical and projected relative contribution from licenses and services revenues. The goodwill results from expected synergies from the acquired business, including complementary products that will enhance our overall product portfolio, and opportunities within new markets, which we believe will result in incremental revenue and profitability.
The pro forma effects of PacketTrap would not have been material to our results of operations for the years ended December 31, 2009 and 2008, and therefore are not presented.
2008 Acquisitions
NetPro Computing, Inc. – In September 2008 we acquired NetPro Computing, Inc. (“NetPro”), a leading provider of Microsoft infrastructure optimization solutions, for purchase consideration of approximately $79.1 million, including $0.4 million in transaction costs. The acquisition of NetPro allows Quest to further extend our product portfolio to deliver a comprehensive set of products to manage complex Microsoft infrastructures. The combined product offering is expected to provide robust solutions to better migrate, manage and secure Microsoft Active Directory, Exchange, SharePoint and SQL Server environments. The acquisition has been accounted for as a purchase and the purchase price was allocated primarily to goodwill and other intangible assets. Total goodwill of $54.1 million was assigned $32.4 million and $21.7 million to the license and service segments of our business, respectively, and is not expected to be deductible for tax purposes. The goodwill allocation of 60% to licenses and 40% to services is based on both historical and projected relative contribution from licenses and services revenues. Actual results of operations of NetPro are included in our consolidated financial statements from the date of acquisition. Our allocation of the purchase price to assets and liabilities based upon the fair value determinations was as follows (in thousands):
Cash and cash equivalents | $ | 3,798 | ||
Other current assets | 3,877 | |||
Acquired technologies with a useful life of 4.0 years | 16,500 | |||
Customer relationships with a weighted average useful life of 4.1 years | 18,300 | |||
Non-compete agreements with a useful life of 3.0 years | 1,000 | |||
Goodwill | 54,082 | |||
Other non-current assets | 1,134 | |||
Other current liabilities | (4,736 | ) | ||
Deferred revenue | (7,061 | ) | ||
Non-current liabilities | (7,797 | ) | ||
Total purchase price | $ | 79,097 | ||
F-19
Table of Contents
QUEST SOFTWARE, INC. AND SUBSIDIARIES
NOTES TO CONSOLIDATED FINANCIAL STATEMENTS—(Continued)
PassGo Technologies Limited –In January 2008 we acquired PassGo Technologies Limited (“PassGo”), a privately held, UK-based leader in access and identity management solutions, for purchase consideration of approximately $52.2 million, including $1.1 million in transaction costs. The acquisition has been accounted for as a purchase and the purchase price was allocated primarily to goodwill and other intangible assets. Total goodwill of $34.2 million was assigned $12.0 million and $22.2 million to the license and service segments of our business, respectively, and is not expected to be deductible for tax purposes. The goodwill allocation of 35% to licenses and 65% to services is based on both historical and projected relative contribution from licenses and services revenues. Actual results of operations of PassGo are included in our consolidated financial statements from the date of acquisition. Our allocation of the purchase price to assets and liabilities based upon the fair value determinations finalized in June 2008 was as follows (in thousands):
Cash and cash equivalents | $ | 3,070 | ||
Other current assets | 4,329 | |||
Acquired technologies with a weighted average useful life of 4.8 years | 9,360 | |||
Customer relationships with a weighted average useful life of 5.6 years | 9,680 | |||
Non-compete agreements with a useful life of 2.0 years | 170 | |||
Trade name with a useful life of 2.0 years | 90 | |||
Goodwill | 34,158 | |||
Other non-current assets | 4,443 | |||
Other current liabilities | (5,578 | ) | ||
Deferred revenue | (6,951 | ) | ||
Non-current liabilities | (546 | ) | ||
Total purchase price | $ | 52,225 | ||
Other Acquisitions – We completed three other acquisitions during the twelve months ended December 31, 2008. The aggregate purchase price for these transactions was $13.1 million and was allocated as follows: $7.6 million to goodwill, $1.0 million to in-process research and development which was written off on the date of acquisition, $5.6 million to intangible assets and $(1.1) million to assumed liabilities, net of tangible assets acquired. Actual results of operations of these acquisitions are included in our consolidated financial statements from the effective dates of the acquisitions.
The following represents the aggregate allocation of the purchase price for these three acquisitions to amortizing intangible assets, (in thousands):
Acquired technology with a weighted average useful life of 4.9 years | $ | 3,648 | ||
Customer relationships with a useful life of 4.5 years | 891 | |||
Non-compete agreements with a weighted average useful life of 2.5 years | 1,018 | |||
Total intangible assets | $ | 5,557 | ||
The pro forma effects of all 2008 acquisitions individually, or in the aggregate, would not have been material to our results of operations for the year ended December 31, 2008, and therefore are not presented.
NOTE 3— GEOGRAPHIC AND SEGMENT REPORTING
Operating segments are defined as components of an enterprise about which separate financial information is available that is evaluated regularly by our chief operating decision maker, or decision-making group, in assessing performance and deciding how to allocate resources.
Our reportable operating segments are Licenses and Services. The Licenses segment develops and markets licenses to use our software products. The Services segment provides after-sale support for software products and fee-based training and consulting services related to our software products.
We do not separately allocate operating expenses to these segments, nor do we allocate specific assets to these segments. Therefore, segment information reported includes only revenues, cost of revenues, and gross profit.
F-20
Table of Contents
QUEST SOFTWARE, INC. AND SUBSIDIARIES
NOTES TO CONSOLIDATED FINANCIAL STATEMENTS—(Continued)
Reportable segment data for the three years ended December 31, 2010, is as follows (in thousands):
| Licenses | Services | Total | ||||||||||
Year ended December 31, 2010: | ||||||||||||
Revenues | $ | 320,683 | $ | 446,414 | $ | 767,097 | ||||||
Cost of revenues | 24,404 | 67,809 | 92,213 | |||||||||
Gross profit | $ | 296,279 | $ | 378,605 | $ | 674,884 | ||||||
Year ended December 31, 2009: | ||||||||||||
Revenues | $ | 279,238 | $ | 415,998 | $ | 695,236 | ||||||
Cost of revenues | 26,974 | 58,528 | 85,502 | |||||||||
Gross profit | $ | 252,264 | $ | 357,470 | $ | 609,734 | ||||||
Year ended December 31, 2008: | ||||||||||||
Revenues | $ | 334,083 | $ | 401,294 | $ | 735,377 | ||||||
Cost of revenues | 28,817 | 62,060 | 90,877 | |||||||||
Gross profit | $ | 305,266 | $ | 339,234 | $ | 644,500 | ||||||
Revenues are attributed to geographic areas based on the location of the entity to which the products or services were invoiced. Revenues and long-lived assets concerning principal geographic areas in which we operate are as follows (in thousands):
| United States | Ireland | United Kingdom | Other International (2) | Total | ||||||||||||||||
Year ended/As of December 31, 2010: | ||||||||||||||||||||
Revenues | $ | 477,255 | $ | 104,075 | $ | 61,346 | $ | 124,421 | $ | 767,097 | ||||||||||
Long-lived assets(1) | 79,422 | 5 | 2,634 | 10,636 | 92,697 | |||||||||||||||
Year ended/As of December 31, 2009: | ||||||||||||||||||||
Revenues | $ | 434,213 | $ | 66,103 | $ | 64,389 | $ | 130,531 | $ | 695,236 | ||||||||||
Long-lived assets(1) | 81,627 | 10 | 3,539 | 11,482 | 96,658 | |||||||||||||||
Year ended/As of December 31, 2008: | ||||||||||||||||||||
Revenues | $ | 430,191 | $ | 56,721 | $ | 85,525 | $ | 162,940 | $ | 735,377 | ||||||||||
Long-lived assets(1) | 89,934 | 29 | 7,793 | 9,457 | 107,213 | |||||||||||||||
| (1) | Includes property and equipment, net and other assets. |
| (2) | No single location within Other International accounts for greater than 10% of total revenues. |
NOTE 4 — CASH AND CASH EQUIVALENTS AND INVESTMENTS
The following table summarizes our cash and cash equivalents and investments by balance sheet classification at the dates indicated (in thousands):
Classification on balance sheet | December 31 | |||||||||||||||
| 2010 | 2009 | |||||||||||||||
| Cost | Fair Value(1) | Cost | Fair Value(1) | |||||||||||||
Cash and cash equivalents | $ | 356,533 | $ | 356,533 | $ | 292,940 | $ | 292,940 | ||||||||
Short-term investments | 90,466 | 90,284 | 93,459 | 90,109 | ||||||||||||
Long-term investments | 45,647 | 45,466 | 2,416 | 2,411 | ||||||||||||
Total cash and cash equivalents and investments | $ | 492,646 | $ | 492,283 | $ | 388,815 | $ | 385,460 | ||||||||
| ||||||||||||||||
| (1) | See Note 15 – Fair Value Measurements for details regarding fair value measurements. |
F-21
Table of Contents
QUEST SOFTWARE, INC. AND SUBSIDIARIES
NOTES TO CONSOLIDATED FINANCIAL STATEMENTS—(Continued)
The following table summarizes our investments by investment category at the dates indicated (in thousands):
| December 31 | ||||||||||||||||
| 2010 | 2009 | |||||||||||||||
Investment category: | Cost | Fair Value | Cost | Fair Value | ||||||||||||
Available-for-sale securities: | ||||||||||||||||
US treasury securities | $ | 24,500 | $ | 24,511 | $ | 34,982 | $ | 34,978 | ||||||||
US agency securities | 35,407 | 35,387 | 1,500 | 1,495 | ||||||||||||
Commercial paper | 14,958 | 14,984 | 4,998 | 4,998 | ||||||||||||
Corporate notes/bonds | 51,561 | 51,181 | — | — | ||||||||||||
Certificates/term deposits | 9,687 | 9,687 | 6,820 | 6,820 | ||||||||||||
Total available-for-sale securities | 136,113 | 135,750 | 48,300 | 48,291 | ||||||||||||
Trading securities: | ||||||||||||||||
Municipal auction rate securities | — | — | 47,575 | 44,229 | ||||||||||||
Total investments | $ | 136,113 | $ | 135,750 | $ | 95,875 | $ | 92,520 | ||||||||
At December 31, 2009, we held $47.6 million par value (with a fair value of $44.2 million) in municipal notes with an auction reset feature (“auction rate securities” or “ARS”). These securities are collateralized long-term debt instruments that provide liquidity through a Dutch auction process that resets the applicable interest rate at pre-determined intervals, typically every 35 days. In October 2008, we entered into agreements (the “Agreements”) with the investment firm that sold us our ARS. By entering into the Agreements, we (1) received the right (“Put Options”) to sell all of our ARS back to the investment firm at par, at our sole discretion, anytime during the period from June 30, 2010 through July 2, 2012, (2) gave the investment firm the right to purchase all of our ARS or sell them on our behalf at par anytime after the execution of the Agreements through July 2, 2012, (3) received an offer for a “no net cost” loan for up to 70% of the par value of the ARS until June 30, 2010, and (4) agreed to release the investment firm from certain potential claims related to the collateralized ARS in certain specified circumstances. We exercised our Put Options in July 2010 under the Agreements with the investment firm that sold us our ARS and the investment firm transferred our remaining ARS out of our account and replaced with cash, fulfilling their obligation under the Agreements and reducing our auction rate securities to zero (refer to Note 15 – Fair Value Measurement for additional details).
Interest income, included in Other (expense) income, net in the accompanying consolidated income statements, was $2.4 million, $1.9 million and $11.0 million for the years ended December 31, 2010, 2009 and 2008, respectively.
NOTE 5 — PROPERTY AND EQUIPMENT, NET
Net property and equipment consisted of the following (in thousands):
| December 31 | ||||||||
| 2010 | 2009 | |||||||
Building | $ | 39,003 | $ | 38,975 | ||||
Furniture and fixtures | 15,846 | 15,693 | ||||||
Machinery and equipment | 7,181 | 6,775 | ||||||
Computer equipment | 54,940 | 51,841 | ||||||
Computer software | 43,822 | 37,867 | ||||||
Leasehold improvements | 15,438 | 14,262 | ||||||
Land | 11,154 | 11,154 | ||||||
| 187,384 | 176,567 | |||||||
Less accumulated depreciation and amortization | (116,530 | ) | (106,516 | ) | ||||
Property and equipment, net | $ | 70,854 | $ | 70,051 | ||||
Total depreciation and amortization expense related to property and equipment was $14.2 million, $15.4 million and $16.6 million in 2010, 2009 and 2008, respectively.
F-22
Table of Contents
QUEST SOFTWARE, INC. AND SUBSIDIARIES
NOTES TO CONSOLIDATED FINANCIAL STATEMENTS—(Continued)
NOTE 6— GOODWILL AND INTANGIBLE ASSETS, NET
The changes in the carrying amount of goodwill by reportable operating segment for the years ended December 31, 2009 and 2008, are as follows (in thousands):
| Licenses | Services | Total | ||||||||||
Balance as of December 31, 2008 | $ | 463,194 | $ | 192,583 | $ | 655,777 | ||||||
Acquisitions(1) | 5,478 | 5,478 | 10,956 | |||||||||
Adjustments(2) | 2,262 | 1,486 | 3,748 | |||||||||
Balance as of December 31, 2009 | 470,934 | 199,547 | 670,481 | |||||||||
Acquisitions(1) | 17,837 | 15,860 | 33,697 | |||||||||
Adjustments(3) | 1,324 | 722 | 2,046 | |||||||||
Balance as of December 31, 2010 | $ | 490,095 | $ | 216,129 | $ | 706,224 | ||||||
| ||||||||||||
| (1) | Refer to Note 2 – Acquisitions for additional details. |
| (2) | Primarily from finalization of purchase price allocations for various acquisitions made prior to 2009. |
| (3) | Primarily from post-acquisition payment obligations to former shareholders of acquisitions we made in 2007 pursuant to accounting principles applicable to acquisitions in that year. |
Intangible assets, net are comprised of the following (in thousands):
| December 31 | ||||||||||||||||||||||||
| 2010 | 2009 | |||||||||||||||||||||||
| Gross Carrying Amount | Accumulated Amortization | Net | Gross Carrying Amount | Accumulated Amortization | Net | |||||||||||||||||||
Acquired technology and IPR&D(1) | $ | 164,816 | $ | (133,591 | ) | $ | 31,225 | $ | 154,247 | $ | (117,424 | ) | $ | 36,823 | ||||||||||
Customer relationships | 74,318 | (50,639 | ) | 23,679 | 69,577 | (39,438 | ) | 30,139 | ||||||||||||||||
Non-compete agreements | 13,919 | (13,201 | ) | 718 | 13,919 | (12,176 | ) | 1,743 | ||||||||||||||||
Trademarks and trade names(2) | 13,302 | (6,139 | ) | 7,163 | 13,080 | (5,713 | ) | 7,367 | ||||||||||||||||
| $ | 266,355 | $ | (203,570 | ) | $ | 62,785 | $ | 250,823 | $ | (174,751 | ) | $ | 76,072 | |||||||||||
| (1) | With our 2009 acquisition of PacketTrap and 2010 acquisition of Surgient, IPR&D projects were identified and valued. These projects will be continually assessed for impairment. Upon completion, the project will be amortized over its estimated useful life. |
| (2) | Trademarks and trade names include $6.2 million and $0.8 million in trade names related to our acquisition of ScriptLogic and PacketTrap, respectively, that each have an indefinite useful life, and as such are not being amortized. |
Amortization expense for intangible assets was $28.8 million, $32.6 million and $31.5 million for the year ended December 31, 2010, 2009 and 2008, respectively. Estimated annual amortization expense related to intangible assets reflected on our December 31, 2010 balance sheet is as follows (in thousands):
| Estimated Annual Amortization Expense | ||||
2011 | $ | 26,488 | ||
2012 | 19,099 | |||
2013 | 5,908 | |||
2014 | 3,154 | |||
2015 and thereafter | 1,136 | |||
Total accumulated amortization | $ | 55,785 | ||
NOTE 7 — COST METHOD INVESTMENTS
We invested $2.1 million and $3.0 million in early stage private companies during the year ended December 31, 2010 and 2009, respectively. Our investments in early stage private companies and a private equity fund were accounted for under the cost method, given that we do not have the ability to exercise significant influence. We periodically monitor our investments for impairment and will record reductions in carrying values if and when necessary. The fair value of a cost method investment is not estimated if there are no identified events or changes in circumstances that may have a significant adverse effect on the fair value of the investment. No such events were noted during 2010.
F-23
Table of Contents
QUEST SOFTWARE, INC. AND SUBSIDIARIES
NOTES TO CONSOLIDATED FINANCIAL STATEMENTS—(Continued)
Our cumulative investments are included as part of Other assets in our consolidated balance sheet at December 31, 2010 and 2009 and were carried at $14.3 million and $14.4 million, respectively. In the first quarter of 2010, we had $2.0 million in notes receivable from a cost method investee included in Other assets in our consolidated balance sheet. The loan bore interest on the outstanding principal amount at the rate of 10% per annum. The note was due and payable on November 1, 2011. In August 2010, the principal amount plus all accrued interest under the notes receivable was converted into equity and was reclassified to cost method investments. Also, during 2010 we had a carrying amount of $2.2 million as minority investment in AVIcode. In October 2010, AVIcode, Inc. was purchased by Microsoft. We received approximately $2.0 million proceeds from this sale in January 2011.
NOTE 8— LOANS PAYABLE
In February 2009, we entered into a two year revolving line of credit agreement with Wells Fargo Foothill, LLC as the arranger, administrative agent and lender. We intend to use any proceeds from the credit agreement for working capital and other general corporate purposes. The credit agreement allows for cash borrowings and letters of credit under a secured revolving credit facility of up to a maximum of $100 million. Interest will accrue at a floating rate based on, at the Company’s election, (i) LIBOR (subject to reserve requirements and a minimum LIBOR of 2.75%) or (ii) the greatest of (a) 4.0%, (b) the Federal Funds Rate plus 0.5% or (c) Wells Fargo’s prime rate, in each case, plus an applicable margin. The credit agreement includes limitations on the Company’s ability to, among other things, incur debt, grant liens, make acquisitions and other investments, make certain restricted payments such as dividend payments, and dispose of assets. The credit agreement is secured by substantially all of the Company’s assets, subject to certain exceptions including the company headquarters facility, and includes certain financial covenants. Total fees associated with this line of credit paid upfront were approximately $2.0 million and are being amortized over the life of the credit agreement as interest expense. For the year ended December 31, 2010 and 2009, $1.0 million and $0.9 million in amortization of these fees was recognized as interest expense within Other (expense) income, net. As of December 31, 2010, we have a zero balance outstanding under this line of credit. On February 17, 2011, this line of credit agreement was amended and renewed for a subsequent five-year term with Wells Fargo Capital Finance, LLC (formerly known as Wells Fargo Foothill, LLC), as arranger, administrative agent and lender (refer to Note 17 – Subsequent Events for additional details).
In July 2009, we drew down $34.4 million, or 70%, of the par value against the value of our ARS. The ARS were pledged as collateral for the amount drawn on our UBS line of credit. As this credit line was structured as a “net no cost” loan, any interest charges will be offset by interest earned on the underlying ARS (see Note 4 – Cash and Cash Equivalents and Investments for additional details regarding these investments). At December 31, 2009, we had $32.1 million balance outstanding on this loan. During the second quarter of 2010, we redeemed approximately $40.6 million of our auction rate securities, a portion of such redemption paid in full our $29.6 million balance outstanding on our UBS line of credit.
In August 2009, we entered into a loan agreement with Mutual of Omaha Bank whereby we borrowed an aggregate principal amount of $34 million. The loan is secured by our real property at our headquarters in Aliso Viejo, California. We have used the proceeds from the loan for working capital and other general corporate purposes. The loan matures in five years, during which time we will make equal monthly principal and interest payments at a 7.03% interest rate on a fixed rate, 25-year amortization schedule. Events of default include, among other things, payment defaults, breaches of covenants and bankruptcy events. In the case of a continuing event of default, the lender may, among other things, accelerate the payment of any unpaid principal and interest amounts, increase the then-current interest rate by 5% and foreclose on the real estate collateral. As of December 31, 2010, we have a $33.3 million balance outstanding with $0.5 million recorded as current and $32.8 million recorded as long-term portion of loans payable.
Scheduled maturities of current and long-term loans payable are as follows (in thousands):
| Year Ending December 31 | ||||
2011 | $ | 521 | ||
2012 | 597 | |||
2013 | 648 | |||
2014 | 31,485 | |||
Total loans payable | $ | 33,251 | ||
F-24
Table of Contents
QUEST SOFTWARE, INC. AND SUBSIDIARIES
NOTES TO CONSOLIDATED FINANCIAL STATEMENTS—(Continued)
We were in compliance with all debt-related covenants at December 31, 2010.
NOTE 9 — OTHER (EXPENSE) INCOME, NET
Other (expense) income, net consists of the following (in thousands):
| Year Ended December 31 | ||||||||||||
| 2010 | 2009 | 2008 | ||||||||||
Interest income | $ | 2,393 | $ | 1,863 | $ | 10,972 | ||||||
Interest expense | (4,445 | ) | (2,827 | ) | (128 | ) | ||||||
Foreign currency (loss) gain, net(1) | (3,211 | ) | 3,640 | (7,532 | ) | |||||||
Forward foreign currency contracts loss, net(2) | (459 | ) | (893 | ) | — | |||||||
Impairment losses on cost method investments | — | — | (2,001 | ) | ||||||||
Other income(3) | 65 | 766 | (281 | ) | ||||||||
Total other (expense) income, net | $ | (5,657 | ) | $ | 2,549 | $ | 1,030 | |||||
| (1) | Our foreign currency (losses) gains, net are predominantly attributable to the re-measurement gains or losses on our net balances of monetary assets and liabilities in our foreign subsidiaries, including accounts receivable and cash, which were primarily denominated in the Euro, and to a lesser extent, the British Pound and Canadian Dollar. The foreign currency re-measurement adjustments to these balance sheet items are calculated by comparing the currency spot rates at the end of a month to the spot rates at the end of the previous month. |
| (2) | Relates to changes in fair value of our forward foreign currency contracts not designated as hedging instruments. See Note 14 — Derivative Instruments for further details. |
| (3) | Includes unrealized gains on our ARS and unrealized losses from our Put Options (refer to Note 4 – Cash and Cash Equivalents and Investments and Note 15 – Fair Value Measurements for details). |
NOTE 10— INCOME TAXES
The provision for income taxes consists of the following (in thousands):
| Year Ended December 31 | ||||||||||||
| 2010 | 2009 | 2008 | ||||||||||
Current: | ||||||||||||
Federal | $ | 2,664 | $ | 3,509 | $ | 12,226 | ||||||
State | 2,427 | 1,674 | 4,244 | |||||||||
Foreign | 4,975 | 12,871 | 2,804 | |||||||||
Deferred: | ||||||||||||
Federal | 7,579 | 1,791 | (1,289 | ) | ||||||||
State | 15 | 1,284 | (1,074 | ) | ||||||||
Foreign | (1,308 | ) | (5,451 | ) | (2,592 | ) | ||||||
Total income tax provision | $ | 16,352 | $ | 15,678 | $ | 14,319 | ||||||
The reconciliations of the U.S. federal statutory rate to the effective income tax rate are as follows:
| Year Ended December 31 | ||||||||||||
| 2010 | 2009 | 2008 | ||||||||||
Tax provision at U.S. federal statutory rates | 35.0 | % | 35.0 | % | 35.0 | % | ||||||
State taxes | 1.3 | 2.0 | 2.7 | |||||||||
Foreign taxes and foreign losses with tax benefit | (14.8 | ) | (19.8 | ) | (21.1 | ) | ||||||
Change in U.S. valuation allowance | (0.2 | ) | (0.3 | ) | 1.3 | |||||||
Research and development credits | (3.4 | ) | (2.1 | ) | (5.3 | ) | ||||||
Other | (3.7 | ) | 3.4 | 4.8 | ||||||||
| 14.2 | % | 18.2 | % | 17.4 | % | |||||||
F-25
Table of Contents
QUEST SOFTWARE, INC. AND SUBSIDIARIES
NOTES TO CONSOLIDATED FINANCIAL STATEMENTS—(Continued)
Our effective income tax rate decreased to 14.2% compared to the previous year primarily due to the release of our reserves due to the passing of income tax year statutes for years 2005 to 2006 and other items that resulted in a benefit for the year ended December 31, 2010. This benefit was partially offset by an increase resulting from the mix of income between high and low tax jurisdictions.
Deferred income taxes reflect the net tax effect of temporary differences between the carrying amounts of assets and liabilities for financial reporting purposes and the amounts used for income tax purposes. Significant components of our deferred taxes are as follows (in thousands):
| December 31 | ||||||||
| 2010 | 2009 | |||||||
Deferred tax assets: | ||||||||
Accounts receivable and sales returns reserves | $ | 170 | $ | 767 | ||||
Accrued liabilities | 7,353 | 7,689 | ||||||
Deferred revenue | 4,256 | 2,265 | ||||||
Foreign net operating loss carry-forwards | 18,292 | 20,602 | ||||||
U.S. net operating loss carry-forwards | 17,827 | 5,938 | ||||||
Stock compensation | 16,549 | 24,634 | ||||||
Tax credits | 14,303 | 14,647 | ||||||
Fixed assets | (92 | ) | 3,587 | |||||
Other | 11,831 | 10,083 | ||||||
Total gross deferred tax assets | 90,489 | 90,212 | ||||||
Deferred tax liability - Intangibles | (16,518 | ) | (21,120 | ) | ||||
Valuation allowance | (20,309 | ) | (23,133 | ) | ||||
Net deferred income taxes | 53,662 | 45,959 | ||||||
Less current portion | (6,677 | ) | (11,832 | ) | ||||
Non-current portion | $ | 46,985 | $ | 34,127 | ||||
At December 31, 2010, our valuation allowance was approximately $20.3 million on certain of our deferred tax assets. The change of $2.8 million in our valuation allowance primarily relates to a net decrease in allowances related to the utilization of foreign net operating losses in the United Kingdom. Based on the weight of available evidence, we believe that it is more likely than not that these deferred tax assets will not be realized.
At December 31, 2010, we have estimated federal and state net operating loss carry-forwards of approximately $54.8 million from acquired subsidiaries which begin to expire in 2011. Additionally, we have certain federal net operating losses of approximately $5.4 million related to an acquired subsidiary that, as a result of federal consolidation rules, are not available to offset current or future income of our other U.S. entities. At December 31, 2010, we also have foreign net operating loss carry-forwards of approximately $79.6 million, which began to expire in 2011. Approximately $16.9 million of the foreign net operating loss carry-forwards were incurred by subsidiaries prior to the date of our acquisition of such subsidiaries. We established a valuation allowance of approximately $6.0 million at the dates of acquisition related to these subsidiaries.
At December 31, 2010, we have state tax credit carry-forwards of $8.0 million, which will carry forward indefinitely until utilized. Also, we have $1.4 million of acquired state tax credits that are subject to ownership change limitations and will begin to expire in 2018.
During the current year, we realized net tax benefits of $13.6 million from the exercise of stock options. That amount was allocated and credited (debited) to the following items (in thousands):
Stockholders’ equity | $ | 4,406 | ||
Goodwill | (22 | ) | ||
Deferred income tax asset | (16,875 | ) | ||
Income tax provision | (1,137 | ) | ||
Total | $ | (13,628 | ) | |
F-26
Table of Contents
QUEST SOFTWARE, INC. AND SUBSIDIARIES
NOTES TO CONSOLIDATED FINANCIAL STATEMENTS—(Continued)
Income before income taxes consists of the following components (in thousands):
| Year Ended December 31 | ||||||||||||
| 2010 | 2009 | 2008 | ||||||||||
United States | $ | 55,856 | $ | 14,953 | $ | 32,379 | ||||||
Foreign | 59,062 | 71,084 | 49,983 | |||||||||
Total | $ | 114,918 | $ | 86,037 | $ | 82,362 | ||||||
At December 31, 2010, gross undistributed earnings of our foreign subsidiaries were approximately $258.7 million and are considered permanently reinvested outside the United States. It is not practicable to estimate the amount of tax that may be payable upon distribution, therefore we have not provided for U.S. income taxes or foreign withholding taxes on such undistributed earnings.
As of December 31, 2010, the estimated liability for our uncertain tax positions was approximately $46.8 million. The change in unrecognized tax benefits, excluding interest, is as follows (in thousands):
| Year Ended December 31 | ||||||||
| 2010 | 2009 | |||||||
Unrecognized tax benefit at the beginning of the year | $ | 51,332 | $ | 47,477 | ||||
Additions from tax positions taken in the current year | 7,366 | 9,129 | ||||||
Additions from tax positions taken in prior years(1) | 151 | 7,467 | ||||||
Reductions from tax positions taken in prior years | (2,974 | ) | (10,665 | ) | ||||
Settlements of tax audits | — | (2,076 | ) | |||||
Decrease related to lapse of statute of limitations | (9,029 | ) | — | |||||
Unrecognized tax benefit at the end of the year | $ | 46,846 | $ | 51,332 | ||||
| (1) | Such amount in 2009 primarily relate to unrecognized tax benefits on deferred tax assets and are currently being broken out to reflect the liability in the tabular roll forward on a gross basis. |
Included in the unrecognized tax benefit at December 31, 2010 is $39.5 million of tax benefits that, if recognized, would affect the effective tax rate. Also included in the unrecognized tax benefits at December 31, 2010 is $7.7 million of tax benefits that, if recognized would result in adjustments to deferred tax assets and long term income taxes payable or valuation allowances,
During the years ended December 31, 2010 and 2009, we recorded approximately $4.3 million and $5.4 million for tax-related interest and penalties within the income tax provision, respectively. Penalties and tax-related interest expense are reported as a component of our income tax provision.
As of December 31, 2010, we are no longer subject to U.S. federal audits and California state audits for years through December 31, 2006. We continue to be subject to examination in the U.S. federal jurisdiction for years from 2007 through 2009, as well as various state and foreign jurisdictions for the tax years from 2005 through 2009.
During 2008, we entered into the appeals process with the Interregional Inspectorate of the Federal Tax Service of Russia as a result of the tax adjustments proposed for the years ended 2004 through 2006. On February 4, 2010, we received notification from our attorneys that the outstanding matter was resolved in our favor. The decision was further appealed to a higher authority by the Interregional Inspectorate of the Federal Tax Service of Russia. On September 1, 2010, we received notification from our attorneys that the appeal was resolved in our favor. We have since obtained a full refund of taxes and penalties paid in advance of the appeal in addition to interest.
During 2009, we filed requests with Irish Inland Revenue and the French Tax Authority to enter into the Mutual Agreement Procedure pursuant to Article 24 of the Ireland-France Income Tax Treaty. This request attempts to resolve the adjustments proposed by the French Tax Authority during their audit of our French subsidiary for the period April 1, 2003 through December 31, 2004. This request continues to be outstanding as of December 31, 2010.
F-27
Table of Contents
QUEST SOFTWARE, INC. AND SUBSIDIARIES
NOTES TO CONSOLIDATED FINANCIAL STATEMENTS—(Continued)
Additionally we are currently under examination by the French Tax Authority for the years ended December 31, 2005 – 2008, the Canada Revenue Agency for the years ended December 31, 2006 – 2007, the German Tax Authority for the years ended December 31, 2005 – 2007 and Her Majesty’s Revenue & Customs (UK) for the year ended December 31, 2006 - 2007. In December 2009, we received a tax assessment from the French Tax Authority for the years ended December 31, 2005 – 2006, which we are currently appealing. In November 2010, we received a tax assessment from the French Tax Authority for the years ended December 31, 2007 – 2008, which we are currently appealing. Neither assessment from the French Tax Authority has been incorporated into the current Mutual Agreement Procedure pursuant to Article 24 of the Ireland-France Income Tax Treaty.
We believe appropriate provisions for all outstanding issues have been made for all jurisdictions and all open years. However, due to the risk that audit outcomes and the timing of audit settlements are subject to significant uncertainty and as we continue to evaluate such uncertainties in light of current facts and circumstances, our current estimate of the total amounts of unrecognized tax benefits could increase or decrease for all open tax years. As of the date of this report, we do not anticipate that there will be any material change in the unrecognized tax benefits within the next twelve months.
NOTE 11— STOCKHOLDERS’ EQUITY
In August 2009, the Board of Directors authorized a plan to repurchase up to $100 million of Quest’s common stock. Any stock repurchases may be made through open market and privately negotiated transactions, at times and in such amounts as management deems appropriate, including pursuant to one or more Rule 10b5-1 trading plans. Rule 10b5-1 permits Quest to establish, while not in possession of material nonpublic information, prearranged plans to buy stock at a specific price in the future, regardless of any subsequent possession of material nonpublic information. The timing and actual number of shares repurchased will depend on a variety of factors including market conditions, corporate and regulatory requirements, and capital availability. The stock repurchase program does not have an expiration date and may be limited or terminated at any time without prior notice. During the year ended December 31, 2010, we repurchased 2.3 million shares under this plan at a weighted average price per share of $16.5 for a total cost of $37.4 million. A total of $51.5 million remains available pursuant to this stock repurchase authorization. In February 2011, the Board of Directors increased the authorization under our current stock repurchase program to an aggregate of $150 million (refer to Note 17 – Subsequent Events for additional details).
In June 2009, we commenced a modified “Dutch Auction” tender offer to purchase up to 10,715,000 shares of our common stock. In July 2009, we accepted for purchase 6,850,871 shares in the tender offer, at a price of $14.00 per share, for a total cost of $95.9 million excluding approximately $1.3 million in fees and expenses related to the tender offer.
In March 2009, our Board of Directors authorized a stock repurchase of up to $100 million of our common stock. This stock repurchase authorization was terminated in connection with the commencement of the June 2009 tender offer as discussed above. During the year ended December 31, 2009, we repurchased 341,639 shares under this stock repurchase authorization at a weighted-average price per share of $11.37, for a total cost of $3.9 million.
In December 2008, we accepted for purchase 11,440,000 shares in a modified “Dutch auction” tender offer, at a price of $12.50 per share, for a total cost of $143.0 million, not including $2.3 million in fees and expenses related to the tender offer. The 11,440,000 shares purchased in the tender offer represent 10.8% of the shares outstanding on December 9, 2008.
NOTE 12 — RELATED PARTY TRANSACTIONS
In 2000, we received a note receivable with a face amount of $15.8 million from one of our then executive officers for the purchase of 339,200 shares of our common stock at a purchase price of $46.50 per share. The note receivable bears interest at 6.33% per annum. The officer granted Quest a security interest in the shares and also assigned, transferred, and pledged the shares to Quest to secure his obligations under the note. The Company maintains physical possession of the certificates representing the shares purchased as collateral until payment of the principal and interest under the note is made. The former officer remained employed by Quest as of December 31, 2010. The note receivable is deemed to be a non-recourse obligation of the former officer for financial reporting purposes, and as such we recorded the note as a reduction to stockholders’ equity and recorded a corresponding credit to common stock. The original maturity date of the note receivable was August 2007. In December 2009, the former executive officer and Quest signed a letter extending the due date of the note receivable until June 1, 2010. The note receivable is due and we are currently pursuing methods of collection or other means of recovery.
F-28
Table of Contents
QUEST SOFTWARE, INC. AND SUBSIDIARIES
NOTES TO CONSOLIDATED FINANCIAL STATEMENTS—(Continued)
We believe that the transactions set forth above were made on terms no less favorable to us than could have been otherwise obtained from unaffiliated third parties.
NOTE 13— STOCK-BASED COMPENSATION AND EMPLOYEE BENEFIT PLANS
Profit Sharing Plan
We adopted the Managing for Results (“MFR”) Profit Sharing Plan in 2008, which is intended to reward and recognize key management and individual contributors capable of affecting the long-term growth, profitability, and major market successes of the global corporation. The participating employees are awarded performance plan unit(s) that are payable at the discretion of the Compensation Committee of our Board of Directors in either stock awards or cash. For the 2008 and 2009 Plan years, the performance plan units were converted into restricted stock units (RSUs) and for the 2010 Plan year, the performance plan units were converted to stock options. All awards are subject to the achievement of certain performance objectives and service requirements. The RSUs awarded are subject to a three-year quarterly vesting schedule while the option awards vest over three years in equal increments. Eligible employees must maintain active employment status on each vesting date to maintain eligibility to receive the shares of stock. Any stock based awards granted under the profit sharing plan will be granted pursuant to the terms of our 2008 Stock Incentive Plan described below.
Stock-Based Compensation Plans
In March 2008, our Board of Directors adopted the Quest Software, Inc. 2008 Stock Incentive Plan (the “2008 Plan”). The 2008 Plan, which was approved by our stockholders in May 2008, is the successor to the Quest Software, Inc. 1999 Stock Incentive Plan, as amended (the “1999 Plan”) and the Quest Software, Inc. 2001 Stock Incentive Plan (the “2001 Plan” and, together with the 1999 Plan, the “Prior Plans”). The 2008 Plan became effective and replaced the Prior Plans effective July 1, 2008. Our Board adopted the 2008 Plan to provide a means to secure and retain the services of our employees, directors, and consultants, to provide a means by which such eligible individuals may be given an opportunity to benefit from increases in the value of our Common Stock through the grant of stock awards, and thereby align the long-term compensation and interests of those individuals with our stockholders.
We had previously authorized for issuance an aggregate 38.5 million shares of common stock available to employees, directors and consultants under the Prior Plans. Any shares remaining available for issuance pursuant to the exercise of options or settlement of stock awards under the Prior Plans are available for issuance pursuant to stock awards granted under the 2008 Plan. Any shares subject to outstanding stock awards granted under the Prior Plans that expire or terminate for any reason prior to exercise or settlement shall become available for issuance pursuant to stock awards granted under the 2008 Plan.
The 2008 Plan provides for the discretionary grant of incentive stock options, non-statutory stock options, restricted stock awards, restricted stock unit awards, stock appreciation rights, and other forms of equity compensation (collectively, the “stock awards”). Incentive stock options granted under the 2008 Plan are intended to qualify as “incentive stock options” within the meaning of Section 422 of the Internal Revenue Code of 1986, as amended, or the “Code.” Non-statutory stock options granted under the 2008 Plan are not intended to qualify as incentive stock options under the Code. The 2008 Plan also provides for the automatic grant of stock options to non-employee Board members over their period of service on our Board, continuing the similar program for automatic stock option grants to non-employee directors under the 1999 Plan.
Non-qualified stock options granted under the 2008 Plan and Prior Plans generally have a 10-year life and vest ratably over a four to five year period, generally at the rate of 20% one year after the grant date and 10% semi-annually thereafter. In 2010, we granted MFR option awards that vest over three years. All outstanding stock awards granted under the Prior Plans will continue to remain subject to the terms and conditions of those predecessor plans. All stock awards granted after the July 1, 2008 effective date of the 2008 Plan will be subject to the terms of the 2008 Plan. The exercise price of all options granted under the 2008 Plan is to be established by the Plan Administrator; provided, however, that the exercise price of stock options shall not be less than the market value of our Common Stock on the date of grant. The Plan Administrator for the 2008 Plan is the Compensation Committee of the Board of Directors. Except as otherwise noted, the terms of stock awards granted under the 2008 Plan are substantially similar to those granted under the Prior Plans.
The number of shares of Common Stock available for issuance under the 2008 Plan is 22.5 million as of December 31, 2010. The number of shares of Common Stock reserved for issuance under the 2008 Plan will be reduced by 1 share for each share of Common Stock issued under the 2008 Plan pursuant to a stock option and by 1.94 shares for each share of Common Stock issued under the 2008 Plan pursuant to a restricted stock award, restricted stock unit award, or other stock award. As of December 31, 2010, there were 8.8 million shares available for grant under the 2008 Plan.
F-29
Table of Contents
QUEST SOFTWARE, INC. AND SUBSIDIARIES
NOTES TO CONSOLIDATED FINANCIAL STATEMENTS—(Continued)
Our Board may amend or modify the 2008 Plan at any time, subject to any required stockholder approval. To the extent required by applicable law or regulation, stockholder approval will be required for any amendment that (a) materially increases the number of shares available for issuance under the 2008 Plan; (b) materially expands the class of individuals eligible to receive stock awards under the 2008 Plan; (c) materially increases the benefits accruing to the participants under the 2008 Plan or materially reduces the price at which shares of common stock may be issued or purchased under the 2008 Plan; (d) materially extends the term of the 2008 Plan; or (e) expands the types of awards available for issuance under the 2008 Plan.
Stock Option Awards
A summary of the activity of employee stock options during the year ended December 31, 2010, and details regarding the options outstanding and exercisable at December 31, 2010, are provided below:
| Number of Shares (in thousands) | Weighted-Average Exercise Price (per share) | Weighted-Average Remaining Contractual Term (in years) | Aggregate Intrinsic Value (in thousands) (2) | |||||||||||||
Outstanding at December 31, 2009 | 13,400 | $ | 16.77 | |||||||||||||
Granted(1) | 5,820 | $ | 19.03 | |||||||||||||
Exercised | (4,561 | ) | $ | 13.70 | ||||||||||||
Canceled/forfeited/expired | (1,529 | ) | $ | 33.12 | ||||||||||||
Outstanding at December 31, 2010 | 13,130 | $ | 16.93 | 6.50 | $ | 141,924 | ||||||||||
Vested or expected to vest at December 31, 2010 | 12,360 | $ | 16.84 | 6.33 | $ | 134,716 | ||||||||||
Exercisable at December 31, 2010 | 5,764 | $ | 15.09 | 3.07 | $ | 72,911 | ||||||||||
| (1) | Most of this was stock options granted in the third quarter of 2010 that are performance-based under our Managing For Results Profit Sharing Plan. |
| (2) | These amounts represent the difference between the exercise price and $27.74, the closing price of Quest Software, Inc. stock on December 31, 2010 as reported on the NASDAQ National Market, for all options outstanding that have an exercise price currently below the closing price. |
The weighted-average fair value of options granted during the years ended December 31, 2010 and 2009 was $7.11 and $6.54, respectively. The total intrinsic value of options exercised was $37.6 million and $14.5 million for the years ended December 31, 2010 and 2009, respectively. The total fair value of options vested during the years ended December 31, 2010 and 2009 was $8.9 million and $8.8 million, respectively.
In connection with our stock option investigation and related restatement completed in December 2007, we determined that the accounting measurement dates for most of our options granted between June 1998 and May 2002, covering options to purchase 21.8 million shares of our common stock, differed from the measurement dates previously used for such awards. As a result, there were potential adverse tax consequences that may apply to holders of affected options. In June 2008, pursuant to a Tender Offer (“TO”), we amended or replaced certain of these affected options by adjusting the exercise price for each such option. Participants whose affected options were amended or replaced pursuant to the TO became entitled to a special cash payment with respect to those options. As a result, we made cash payments of $1.2 million in January 2009 to reimburse affected U.S. employees, and we made cash payments of $0.3 million in July 2008 to reimburse affected Canadian employees, for the increases in their exercise prices. As a result of this modification to make cash payments for the affected options, we recorded incremental stock-based compensation expense of $0.8 million in the twelve months ended December 31, 2008.
Restricted Stock Unit Awards
RSUs have been granted to selected executives pursuant to our Executive Incentive Plan. We have also granted RSUs to key employees pursuant to the MFR Profit Sharing Plan described above. All of our outstanding RSUs vest over three years with vesting contingent upon continuous service and meeting certain company-wide performance goals, including sales, operating profit margin, and cash flow targets. We estimate the fair value of RSUs using the market price of our common stock on the date of the grant. The fair value of these awards is amortized on a straight-line basis over the vesting period.
F-30
Table of Contents
QUEST SOFTWARE, INC. AND SUBSIDIARIES
NOTES TO CONSOLIDATED FINANCIAL STATEMENTS—(Continued)
A summary of our RSUs activity during the year ended December 31, 2010 is provided below:
| Number of Shares | Weighted-Average Grant Date Fair Value (per share) | |||||||
Nonvested at January 1, 2010 | 713,449 | $ | 12.79 | |||||
Granted | 716,507 | $ | 16.68 | |||||
Vested | (581,390 | ) | $ | 14.40 | ||||
Forfeited | (60,768 | ) | $ | 14.69 | ||||
Nonvested at December 31, 2010(1) | 787,798 | $ | 14.99 | |||||
| (1) | Of which, 759,858 shares are expected to vest. |
The total fair value of RSUs vested during the year ended December 31, 2010 was $8.4 million.
Stock-Based Compensation Expense
The following table presents the income statement classification of all stock-based compensation expense for the years ended December 31, 2010, 2009 and 2008 (in thousands):
| Year Ended December 31, | ||||||||||||
| 2010 | 2009 | 2008 | ||||||||||
Cost of licenses | $ | 1 | $ | 1 | $ | 3 | ||||||
Cost of services | 1,114 | 737 | 877 | |||||||||
Sales and marketing | 6,861 | 4,997 | 6,829 | |||||||||
Research and development | 8,015 | 5,385 | 5,800 | |||||||||
General and administrative | 7,109 | 4,058 | 4,726 | |||||||||
Total stock-based compensation | 23,100 | 15,178 | 18,235 | |||||||||
Tax benefit associated with stock-based compensation expense(1) | 8,940 | 6,071 | 7,294 | |||||||||
Reduction of net income | $ | 14,160 | $ | 9,107 | $ | 10,941 | ||||||
| (1) | The recognized tax benefit related to stock-based compensation expense is estimated to be 38.7% in 2010 and 40% in 2009 and 2008. These rates approximate the blended Federal and State statutory tax rate after the benefit for state taxes which provides an accurate estimate of the current and deferred tax benefits ultimately received from stock-based compensation. |
As of December 31, 2010, total unrecognized stock-based compensation cost related to unvested stock option awards was $37.2 million, which is expected to be recognized over a weighted-average period of 3.4 years and total unrecognized stock-based compensation expense related to unvested RSUs was $9.7 million, which is expected to be recognized over a weighted-average period of 1.5 years.
Determining Fair Value
Valuation and Amortization Method.We estimate the fair value of stock options granted using the Black-Scholes option valuation model utilizing a single option approach. For equity awards that are expected to be settled with RSUs, but not yet granted (related to the MFR Profit Sharing Plan), we measure the value of these awards based on the market price of our common stock as of the date of the end of each reporting period. Once an RSU is granted (approved by the Compensation Committee of our Board of Directors and communicated to the participating employees) we estimate the fair value of RSUs using the market price of our common stock on the date of the grant. The fair value of all stock-based awards is generally amortized on a straight-line basis over the vesting period.
We have reviewed our historical pattern of option exercises and have determined that meaningful differences in option activity existed among employees. Therefore, for all stock options granted after January 1, 2006, we have categorized these awards into two separate groups of employees. The employees within each group have similar historical exercise behavior for valuation purposes.
Determining the fair value of stock option awards at the grant date requires judgment, including estimating the expected term, expected volatility, risk-free interest rate and dividend yield. We may use different assumptions under the Black-Scholes option valuation model in determining the fair value of any option grants in future years, which could materially affect the measurement of the fair value of those options.
F-31
Table of Contents
QUEST SOFTWARE, INC. AND SUBSIDIARIES
NOTES TO CONSOLIDATED FINANCIAL STATEMENTS—(Continued)
Expected Term.The expected term of options granted represents the period of time such options are expected to be outstanding. We estimate the expected terms of options granted based on historical exercise patterns across two different groups of employees. We believe these estimates are reasonably representative of each group’s likely future behavior.
Expected Volatility.As of January 1, 2009, expected volatilities are based on historical volatilities of Quest’s stock, which is a departure from past practice of using implied volatilities derived from the market prices of our traded options with similar terms. We decided to make this change because we had significantly reduced the level of option award granting activity and both analyses produced similar results. The level of option award granting activity has increased in 2010, however, we believe the historical volatilities to be a fair indicator of future volatility of our stock.
Risk-Free Interest Rate.We base the risk-free interest rate on the U.S. Treasury zero-coupon issues in effect at the time of option grant for equivalent remaining terms.
Dividend Yield.We do not expect to pay any dividends and, therefore, we use an expected dividend yield of zero.
We used the following assumptions to estimate the fair value of options granted during the years ended December 31, 2010, 2009 and 2008:
| Year Ended December 31 | ||||||||||||||||
| 2010 | 2009 | 2008 | ||||||||||||||
| Range: | Weighted Average: | Range: | Weighted Average: | Range: | Weighted Average: | |||||||||||
| Risk-free interest rate | 1.1% to 3.1% | 2.1% | 1.6% to 3.2% | 2.6% | 2.9% to 3.9% | 3.5% | ||||||||||
| Expected term (in years) | 5.3 to 8.0 | 5.85 | 5.4 to 5.9 | 5.85 | 6.1 to 7.0 | 6.9 | ||||||||||
| Expected volatility | 34% to 37% | 35% | 36% to 40% | 38% | 43% to 44% | 43% | ||||||||||
| Expected dividend yield | None | None | None | None | None | None | ||||||||||
Employee 401(k) Plan
We sponsor the Quest Software, Inc. 401(k) Plan (“401(k) Plan”) covering substantially all of our employees. As allowed under Section 401(k) of the Internal Revenue Code, the 401(k) Plan provides tax-deferred salary deductions for eligible employees. Employees may contribute from 1% to 100% of their annual compensation to the 401(k) Plan, limited to a maximum annual amount as set periodically by the Internal Revenue Service. Participant contributions and discretionary matching contributions to employees with three years of service vest immediately, while discretionary matching contributions made to employees with less than three years of service have certain vesting requirements. Our discretionary matching contributions totaled $2.9 million and $2.6 million for the years ended December 31, 2010 and 2009, respectively.
NOTE 14— DERIVATIVE INSTRUMENTS
Foreign Exchange Risk Management Policy
Our Foreign Exchange Risk Management Policy identifies target exposures such as balance sheet, cash flow and income statement risks, program objectives, approved financial instruments and counterparties, accounting and tax treatment, as well as oversight, reporting and controls. The functional currency of all our subsidiaries is the U.S. Dollar. Our exposure to foreign exchange risk originates both from our foreign operations net profits and losses denominated in currencies other than the U.S. Dollar, as well as our net balances of monetary assets and liabilities within our foreign subsidiaries. These exposures have the potential to produce either gains or losses depending on the directional movement of the foreign currencies versus the U.S. Dollar and our operational profile in foreign subsidiaries. Certain balance sheet items are re-measured each period and the changes in value are recorded within other (expense) income, net.
We utilize a balance sheet hedging program with the stated objective of reducing volatility within other (expense) income, net. Under this program, we use derivatives in the form of forward foreign currency contracts to hedge certain balance sheet exposures. We do not designate these contracts as hedging instruments and therefore do not qualify for hedge accounting. Accordingly, these outstanding non-designated derivatives are recognized on the consolidated balance sheet at fair value and the changes in fair value from these contracts are recorded in other (expense) income, net, in the consolidated income statement. These derivative contracts typically have a one month term.
F-32
Table of Contents
QUEST SOFTWARE, INC. AND SUBSIDIARIES
NOTES TO CONSOLIDATED FINANCIAL STATEMENTS—(Continued)
We have a cash flow hedging program primarily focused on reducing volatility in our forecasted research and development cash expenses and license revenues; some of which are denominated in non-U.S. Dollar currencies. Under this program, we use derivatives in the form of forward foreign currency contracts and foreign currency option contracts to hedge certain forecasted transactions. These derivatives, with durations ranging from less than one month to twelve months, are designated as hedging instruments and qualify for hedge accounting. Accordingly, these outstanding designated derivatives are recognized on the consolidated balance sheet at fair value. Changes in value that are highly effective are recognized in Accumulated other comprehensive income (“AOCI”) on the consolidated balance sheets, until the hedged item is recognized in the income statement. Any ineffective portion of a derivative’s change in fair value is recorded in Other (expense) income, net, in the consolidated income statement. There was no material ineffectiveness in our cash flow hedging program for the year ended December 31, 2010.
We had the following notional amounts for our foreign currency contracts included in our consolidated balance sheets (in U.S. Dollars in thousands):
Currency | December 31 2010 | December 31 2009 | ||||||
Derivatives designated as hedging instruments | ||||||||
Australian Dollar | $ | 2,788 | $ | 2,545 | ||||
Canadian Dollar | 7,694 | 11,554 | ||||||
Chinese Yuan | 1,167 | — | ||||||
Israeli Shekel | 2,105 | 1,947 | ||||||
Russian Ruble | 6,206 | 5,586 | ||||||
British Pound | 7,188 | — | ||||||
Euro | 22,029 | 6,440 | ||||||
Total | $ | 49,177 | $ | 28,072 | ||||
| Derivatives not designated as hedging instruments | ||||||||
Danish Krone | $ | 2,126 | $ | 1,214 | ||||
Norwegian Krone | 2,013 | — | ||||||
Swedish Krona | 2,058 | — | ||||||
Euro | 43,600 | 15,551 | ||||||
Australian Dollar | 3,846 | — | ||||||
Brazil Real | 4,705 | — | ||||||
British Pound | 18,724 | 9,965 | ||||||
Total | $ | 77,072 | $ | 26,730 | ||||
Fair Value of Derivative Instruments
The following table provides the fair value of our foreign currency contracts included in our consolidated balance sheets (in thousands):
| Derivative Assets | Derivative Liabilities | |||||||||||||||||||||||
| December 31, 2010 | December 31, 2009 | December 31, 2010 | December 31, 2009 | |||||||||||||||||||||
Derivatives designated as hedging instruments | Balance Sheet Location | Fair Value (1) | Balance Sheet Location | Fair Value(1) | Balance Sheet Location | Fair Value(1) | Balance Sheet Location | Fair Value(1) | ||||||||||||||||
Foreign currency contracts | Prepaid expenses and other current assets | $ | 1,123 | Prepaid expenses and other current assets | $ | 284 | Other accrued expenses | $ | 424 | Other accrued expenses | — | |||||||||||||
F-33
Table of Contents
QUEST SOFTWARE, INC. AND SUBSIDIARIES
NOTES TO CONSOLIDATED FINANCIAL STATEMENTS—(Continued)
| Derivative Assets | Derivative Liabilities | |||||||||||||||||||||||
| December 31, 2010 | December 31, 2009 | December 31, 2010 | December 31, 2009 | |||||||||||||||||||||
Derivatives not designated as hedging instruments | Balance Sheet Location | Fair Value(1) | Balance Sheet Location | Fair Value(1) | Balance Sheet Location | Fair Value(1) | Balance Sheet Location | Fair Value(1) | ||||||||||||||||
Foreign currency contracts | Prepaid expenses and other current assets | $ | — | Prepaid expenses and other current assets | $ | 836 | Other accrued expenses | $ | 956 | Other accrued expenses | $ | — | ||||||||||||
| (1) | See Note 15 – Fair Value Measurements for details. |
The Effect of Derivative Instruments on Financial Performance
The following tables provide the effect derivative instruments had on our AOCI and results of operations (in thousands):
| Year Ended December 31 | ||||||||||||||||||
Derivatives designated as hedging instruments | Amount of gain | Location of gain (loss) reclassified from accumulated AOCI into income statement (effective portion) | Amount of gain (loss) accumulated AOCI | |||||||||||||||
| 2010 | 2009 | 2010 | 2009 | |||||||||||||||
Foreign currency contracts | $ | 359 | $ | 196 | Revenues | $ (973) | $ — | |||||||||||
| Operating expenses | $ 738 | $ 221 | ||||||||||||||||
Year Ended December 31 | ||||||||||
Derivatives not designated as hedging instruments | Location of gain (loss) recognized on derivative instruments | Amount of gain (loss) recognized on derivative instruments | ||||||||
| 2010 | 2009 | |||||||||
Foreign currency contracts | Other expense, net | $ | (459) | $ | (893) | |||||
NOTE 15— FAIR VALUE MEASUREMENTS
We perform fair value measurements in accordance with FASB’s authoritative guidance on fair value measurements and disclosures. This standard defines fair value, provides guidance for measuring fair value and requires certain disclosures. This standard does not require any new fair value measurements, but rather applies under other accounting pronouncements that require or permit fair value measurements. This standard defines fair value, provides guidance for measuring fair value and requires certain disclosures. This standard does not require any new fair value measurements, but rather applies under other accounting pronouncements that require or permit fair value measurements. The standard discusses valuation techniques, such as the market approach (comparable market prices), the income approach (present value of future income or cash flow) and the cost approach (cost to replace the service capacity of an asset or replacement cost). The statement establishes a fair value hierarchy that prioritizes the inputs to valuation techniques used to measure fair value into three broad levels. The following is a brief description of those three levels:
| • | Level 1: Observable inputs such as quoted prices (unadjusted) in active markets that are accessible at the measurement date for identical, unrestricted assets or liabilities. |
| • | Level 2: Inputs other than quoted prices that are observable for the asset or liability, either directly or indirectly. These include quoted prices for similar assets or liabilities in active markets and quoted prices for identical or similar assets or liabilities in markets that are not active. |
| • | Level 3: Unobservable inputs that reflect the reporting entity’s own assumptions when there is little or no market data. |
We measure our financial assets and liabilities at fair value on a recurring basis using the following valuation techniques:
(a) Market Approach – uses prices and other relevant information generated by market transactions involving identical or comparable assets or liabilities.
(b) Income Approach – uses valuation techniques to convert future estimated cash flows to a single present amount based on current market expectations about those future amounts, using present value techniques.
F-34
Table of Contents
QUEST SOFTWARE, INC. AND SUBSIDIARIES
NOTES TO CONSOLIDATED FINANCIAL STATEMENTS—(Continued)
The following table represents our fair value hierarchy and the valuation techniques used for financial assets and financial liabilities measured at fair value on a recurring basis (in thousands):
| December 31, 2010 | ||||||||||||||||||||
| Total | Level 1 | Level 2 | Level 3 | Valuation Techniques | ||||||||||||||||
Assets: | ||||||||||||||||||||
Money market funds | $ | 268,118 | $ | 268,118 | $ | — | $ | — | (a) | |||||||||||
U.S. treasury securities | 24,511 | 24,511 | — | — | (a) | |||||||||||||||
U.S. agency securities | 35,387 | 35,387 | — | — | (a) | |||||||||||||||
Corporate notes/bonds | 51,181 | — | 51,181 | — | (a) | |||||||||||||||
Certificates/term deposits | 10,777 | — | 10,777 | — | (a) | |||||||||||||||
Commercial paper | 14,984 | — | 14,984 | — | (a) | |||||||||||||||
Derivative assets(1) | 1,123 | — | 1,123 | — | (a) | |||||||||||||||
Total | $ | 406,081 | $ | 328,016 | $ | 78,065 | $ | — | ||||||||||||
Liabilities: | ||||||||||||||||||||
Derivative liabilities(1) | 1,380 | — | 1,380 | — | (a) | |||||||||||||||
Contingent consideration(2) | 8,515 | — | — | 8,515 | (b) | |||||||||||||||
Total | $ | 9,895 | $ | — | $ | 1,380 | $ | 8,515 | ||||||||||||
| December 31, 2009 | ||||||||||||||||||||
| Total | Level 1 | Level 2 | Level 3 | Valuation Techniques | ||||||||||||||||
Assets: | ||||||||||||||||||||
Money market funds | $ | 178,303 | $ | 178,303 | $ | — | $ | — | (a) | |||||||||||
U.S. treasuries | 55,371 | 55,371 | — | — | (a) | |||||||||||||||
U.S. agency securities | 1,495 | 1,495 | — | — | (a) | |||||||||||||||
Certificates of deposit | 8,598 | 8,598 | — | — | (a) | |||||||||||||||
Commercial paper | 29,991 | 29,991 | — | — | (a) | |||||||||||||||
ARS | 44,229 | — | — | 44,229 | (b) | |||||||||||||||
Put Options | 3,330 | — | — | 3,330 | (b) | |||||||||||||||
Derivative assets(1) | 1,120 | — | 1,120 | — | (a) | |||||||||||||||
Total | $ | 322,437 | $ | 273,758 | $ | 1,120 | $ | 47,559 | ||||||||||||
| �� | ||||||||||||||||||||
Level 3 as % of total | 14.7 | % | ||||||||||||||||||
Liability: | ||||||||||||||||||||
Contingent consideration (2) | $ | 4,000 | $ | — | $ | — | $ | 4,000 | (b) | |||||||||||
| (1) | See Note 14 – Derivative Instruments for details. |
| (2) | Refer to Note 2 – Acquisitions for further details on our contingent consideration. |
We held certain assets that are required to be measured at fair value on a recurring basis. These assets included cash equivalents and investments. At December 31, 2009, included in our investments was $44.2 million par value (with a fair value of $47.6 million) in ARS. We exercised our Put Options on July 1, 2010 under the Agreements with the investment firm that sold us our ARS and the investment firm transferred our remaining ARS out of our account and replaced with cash, fulfilling their obligation under the Agreements and reducing our auction rate securities to zero.
F-35
Table of Contents
QUEST SOFTWARE, INC. AND SUBSIDIARIES
NOTES TO CONSOLIDATED FINANCIAL STATEMENTS—(Continued)
The following table presents our assets measured at fair value on a recurring basis using significant unobservable inputs (Level 3) for the year ended December 31, 2010 and 2009 (in thousands):
| Year Ended December 31 | ||||||||
| 2010 | 2009 | |||||||
Total, beginning of the period | $ | 47,559 | $ | 49,283 | ||||
Unrealized gains on ARS included within other expense, net | 3,322 | 5,172 | ||||||
Unrealized losses on put options included within other expense, net | (3,330 | ) | (4,543) | |||||
Sale of ARS (par value) | (47,551 | ) | (2,353) | |||||
Total, end of the period | $ | — | $ | 47,559 | ||||
The following table presents our liabilities measured at fair value on a recurring basis using significant unobservable inputs (Level 3) for the year ended December 31, 2010 and 2009 (in thousands):
| Year Ended December 31 | ||||||||
| 2010 | 2009 | |||||||
Total, beginning of the period | $ | 4,000 | $ | — | ||||
Contingent consideration(1) | 2,015 | 4,000 | ||||||
Change in fair value of contingent consideration(2) | 2,500 | — | ||||||
Total, end of the period | $ | 8,515 | $ | 4,000 | ||||
| (1) | We enter into earn-out agreements with the shareholders of certain companies we acquire. The earn-out contingency are typically based on the acquired company’s products’ total revenue or sales growth over a specified period after the acquisition date. Refer to Note 2 – Acquisitions for additional details. |
| (2) | This relates to PacketTrap contingent consideration. The estimated fair value increased due to actual earn-out achievement for 2010, improved expectations for the PacketTrap business in 2011 forward, adjustments to the earn-out agreement providing PacketTrap with greater opportunity to earn a higher payout for the 2011 earn-out period and the passage of time. |
Other Financial Assets and Liabilities
The carrying amounts of our other financial assets and liabilities including accounts receivable, accounts payable and accrued liabilities approximate their respective fair values because of the relatively short period of time between their origination and their expected realization.
The book value and fair value of our current and long-term portion of loans payable as of December 31, 2010 are as follows (in thousands):
| Book Value | Fair Value (1) | |||||||
Current portion of loans payable | $ | 521 | $ | 521 | ||||
Long-term portion of loans payable | 32,730 | 32,730 | ||||||
| $ | 33,251 | $ | 33,251 | |||||
| (1) | Estimated fair value of long-term debt is based on quoted prices for similar liabilities for which significant inputs are observable. |
NOTE 16 — COMMITMENTS AND CONTINGENCIES
Leases. We lease office facilities and certain equipment under various operating leases. A majority of these leases are non-cancelable and obligate us to pay costs of maintenance, utilities, and applicable taxes. The leases on most of the office facilities contain escalation clauses and renewal options. Rental expense is recorded on a straight-line basis over the life of the lease. Total rent expense was $17.8 million, $17.8 million and $18.7 million for the years ended December 31, 2010, 2009 and 2008, respectively.
F-36
Table of Contents
QUEST SOFTWARE, INC. AND SUBSIDIARIES
NOTES TO CONSOLIDATED FINANCIAL STATEMENTS—(Continued)
Minimum lease commitments under non-cancelable operating leases as of December 31, 2010 are as follows (in thousands):
| Year ending December 31: | Minimum Lease Commitment | |||
2011 | $ | 16,423 | ||
2012 | 13,426 | |||
2013 | 9,277 | |||
2014 | 4,837 | |||
2015 | 2,313 | |||
Thereafter | 124 | |||
Total minimum lease commitments | $ | 46,400 | ||
Securities Litigation. In October 2006, a purported shareholder class action was filed in the United States District Court for the Central District of California against Quest and certain of its current or former officers and directors (the “Options Class Action”). The plaintiff alleged that (i) the Company improperly backdated stock options, resulting in false or misleading disclosures concerning, among other things, Quest’s financial condition and (ii) the individual defendants sold Quest stock while in possession of material nonpublic information resulting in damages to the putative plaintiff class, in violation of Sections 10(b), 20(a) and 20A of the Securities Exchange Act of 1934 and Rule 10b-5 promulgated thereunder.
Pursuant to a Stipulation and Agreement of Settlement entered into on November 6, 2009, the Company, the class representative and certain current and former officers and directors of the Company agreed to settle the Options Class Action for a payment of $29.4 million. On December 7, 2009, the U.S. District Court preliminarily approved the settlement. Shortly thereafter, the Company funded its share, $19.0 million, of the $29.4 million settlement, with the remainder being funded directly by the Company’s liability insurance carriers. No class members opted out of or objected to the settlement prior to the February 15, 2010 deadline for doing so. In a final hearing before the U.S. District Court on April 26, 2010, the U.S. District Court entered a judgment dismissing the Options Class Action with prejudice as to all defendants, including the Company. None of the Plaintiffs included in the class appealed the judgment, and the judgment is now final.
Patent Litigation. On August 27, 2010, we filed a complaint in the United States District Court for the District of Utah against Centrify Corporation and Likewise Software alleging that Centrify’s DirectControl software and Likewise’s Enterprise software infringe Quest’s United States Patent No. 7,617,501 (the “‘501 Patent”). Our complaint seeks money damages, costs, attorneys’ fees, and the entry of permanent injunctions against each defendant. A trial date in the ‘501 Patent litigation has been set for April 9, 2012.
On August 30, 2010, Centrify filed a complaint in the United States District Court for the Northern District of Utah against Quest alleging that our Authentication Services software infringes Centrify’s United States Patent No. 7,591,005 (the “‘005 Patent”). Centrify’s complaint seeks an unspecified amount of money damages, costs, attorneys’ fees, and a permanent injunction. On October 21, 2010, we filed a motion to dismiss Centrify’s complaint for failure to state a claim on which relief may be granted. On November 15, 2010, Centrify filed an amended complaint amending its allegations that our Authentication Services software infringes Centrify’s ‘005 Patent. A trial date in the ‘005 Patent litigation has been set for September 24, 2012. Court-ordered mediation in the ‘005 Patent litigation is scheduled for March 2, 2011. We believe the claims asserted against Quest by Centrify are without merit and we intend to defend vigorously against Centrify’s infringement claims.
On August 31, 2010, we filed a petition with the United States Patent and Trademark Office alleging that Centrify’s ‘005 Patent is invalid and requesting the United States Patent and Trademark Office to commence aninter partesreexamination of the patentability of Centrify’s ‘005 Patent. On November 15, 2010, the United States Patent and Trademark Office granted our petition forinter partesreexamination of the patentability of Centrify’s ‘005 Patent and issued a first office action rejecting all claims of Centrify’s ‘005 Patent. On January 18, 2011, Centrify filed a response to the United States Patent and Trademark Office’s first office action regarding theinter partesreexamination of the patentability of Centrify’s ‘005 Patent in which Centrify requested that the United States Patent and Trademark Office withdraw the outstanding rejections of all claims of Centrify’s ‘005 Patent. We are currently in the process of preparing our comments to Centrify’s response, which we will file with the United States Patent and Trademark Office upon completion.
On September 30, 2010, Centrify filed a petition with the United States Patent and Trademark Office alleging that our ‘501 Patent is invalid and requesting the United States Patent and Trademark Office to commence aninter partesreexamination of the patentability of our ‘501 Patent. On November 30, 2010, the United States Patent and Trademark Office granted Centrify’s petition forinter partesreexamination of the patentability of our ‘501 Patent. On January 21, 2011, the United States Patent and Trademark Office issued a first office action rejecting all claims of our ‘501 Patent. Our response to the United States Patent and Trademark Office is due by March 21, 2011. We believe that our ‘501 patent is valid and enforceable and intend to vigorously defend the patentability of the ‘501 Patent.
F-37
Table of Contents
QUEST SOFTWARE, INC. AND SUBSIDIARIES
NOTES TO CONSOLIDATED FINANCIAL STATEMENTS—(Continued)
General. The Company and its subsidiaries are also involved in other legal proceedings, claims and litigation arising in the ordinary course of business. The foregoing discussion includes material developments that occurred during the year ended December 31, 2010 or thereafter in our material legal proceedings.
In the normal course of our business, we enter into certain types of agreements that require us to indemnify or guarantee the obligations of other parties. These commitments include (i) intellectual property indemnities to licensees of our software products, (ii) indemnities to certain lessors under office space leases for certain claims arising from our use or occupancy of the related premises, or for the obligations of our subsidiaries under leasing arrangements, (iii) indemnities to customers, vendors and service providers for claims based on negligence or willful misconduct of our employees and agents, (iv) indemnities to our directors and officers to the maximum extent permitted under applicable law, and (v) letters of credit and similar obligations as a form of credit support for our international subsidiaries and certain resellers. The terms and duration of these commitments varies and, in some cases, may be indefinite, and certain of these commitments do not limit the maximum amount of future payments we could become obligated to make there under; accordingly, our actual aggregate maximum exposure related to these types of commitments cannot be reasonably estimated. Historically, we have not been obligated to make significant payments for obligations of this nature, and no liabilities have been recorded for these obligations in our financial statements included in this report.
We have indemnification agreements with present and former directors and officers under which we are generally required to indemnify them against expenses, including attorney’s fees, judgments, fines and settlements, arising from certain legal proceedings and investigations (subject to certain exceptions, including liabilities arising from willful misconduct or conduct that is knowingly fraudulent or deliberately dishonest or results in improper personal benefit). The Company has paid or reimbursed certain legal expenses incurred in connection with now-concluded securities investigation and litigation matters by a number of its current and former directors and officers. The Company has no known future indemnification payment obligations to present or former directors and officers.
NOTE 17 — SUBSEQUENT EVENTS
In January 2011, we acquired 100% voting equity interest of BakBone Software Incorporated, a publicly-held provider of data protection software, for an aggregate amount of approximately $53 million, including the payment of certain debt obligations and net of anticipated cash on hand. At date of our filing, we are still working through our acquisition accounting. We expect this acquisition to be accounted for as a business combination and the purchase price is expected to be allocated primarily to goodwill and other intangible assets. The effect of this transaction is not material to our consolidated results.
In February 2011, our Board of Directors has increased the authorization under our current stock repurchase program to an aggregate of up to $150 million of our common stock. Any stock repurchases may be made through open market and privately negotiated transactions, at times and in such amounts as management deems appropriate, including pursuant to one or more Rule 10b5-1 trading plans. Rule 10b5-1 permits Quest to establish, while not in possession of material nonpublic information, prearranged plans to buy stock at a specific price in the future, regardless of any subsequent possession of material nonpublic information. The timing and actual number of shares repurchased will depend on a variety of factors including market conditions, corporate and regulatory requirements, and capital availability. The stock repurchase program does not have an expiration date and may be limited or terminated at any time without prior notice.
In February 2009, we entered into a two year revolving line of credit agreement with Wells Fargo Foothill, LLC as the arranger, administrative agent and lender. This line of credit agreement was amended and renewed for a subsequent five-year term effective February 17, 2011 (the “Amended Credit Agreement”) with Wells Fargo Capital Finance, LLC (formerly known as Wells Fargo Foothill, LLC), as arranger, administrative agent and lender. The Amended Credit Agreement allows for cash borrowings and letters of credit under a secured revolving credit facility of up to a maximum of $100.0 million. Interest will accrue based on a floating rate based on, at the Company’s election, (i) LIBOR (subject to reserve requirements) or (ii) the greater of (a) the Federal Funds Rate plus 1/2% or (b) Wells Fargo’s prime rate, in each case, plus an applicable margin. The Amended Credit Agreement includes limitations on the Company’s ability to, among other things, incur debt, grant liens, make acquisitions and other investments, make certain restricted payments such as dividend payments, and dispose of assets. The Amended Credit Agreement is secured by substantially all of the Company’s assets, subject to certain exceptions.
F-38
Table of Contents
QUEST SOFTWARE, INC. AND SUBSIDIARIES
FINANCIAL STATEMENT SCHEDULE
SCHEDULE II—VALUATION AND QUALIFYING ACCOUNTS
Description | Balance at Beginning of Period | Acquired Balances | Charges, Costs and Expenses | Additions/ Deductions | Balance at End of Period | |||||||||||||||
| (In Thousands) | ||||||||||||||||||||
Year ended December 31, 2010: | ||||||||||||||||||||
Allowance for bad debt | $ | 535 | $ | — | $ | 458 | $ | (484 | ) | $ | 509 | |||||||||
Allowance for sales returns and cancellations | $ | 5,070 | $ | — | $ | 2,112 | $ | (2,324 | ) | $ | 4,858 | |||||||||
Year ended December 31, 2009: | ||||||||||||||||||||
Allowance for bad debt | $ | 847 | $ | — | $ | 72 | $ | (384 | ) | $ | 535 | |||||||||
Allowance for sales returns and cancellations | $ | 7,537 | $ | 1 | $ | 1,062 | $ | (3,530 | ) | $ | 5,070 | |||||||||
Year ended December 31, 2008: | ||||||||||||||||||||
Allowance for bad debt | $ | 434 | $ | — | $ | 1,358 | $ | (945 | ) | $ | 847 | |||||||||
Allowance for sales returns and cancellations | $ | 7,603 | $ | 1,315 | $ | 2,174 | $ | (3,555 | ) | $ | 7,537 | |||||||||
S-1
Table of Contents
2010 Form 10-K Exhibit List
Exhibit | Exhibit Title | |
| 3.1* | Certificate of Incorporation of Quest Software, Inc. (incorporated by reference to our Current Report on Form 8-K filed on April 30, 2009) | |
| 3.2* | Bylaws of Quest Software, Inc. (incorporated by reference to our Current Report on Form 8-K filed on April 30, 2009) | |
| 4.1* | Form of Registrant’s Specimen Common Stock Certificate (incorporated by reference to our Registration Statement on Form S-1 and all amendments thereto filed on June 11, 1999 (File No. 333-80543)) | |
| 10.1* | Form of Directors’ and Officers’ Indemnification Agreement (incorporated by reference to our Registration Statement on Form S-1 and all amendments thereto filed on June 11, 1999 (File No. 333-80543)) | |
| 10.2* ++ | Quest Software, Inc. 1999 Stock Incentive Plan, as amended (incorporated by reference to our Quarterly Report on Form 10-Q for the period ended March 31, 2008) | |
| 10.3* ++ | Form of Stock Option Agreement used under the Quest Software, Inc. 1999 Stock Incentive Plan (incorporated by reference to our Quarterly Report on Form 10-Q for the period ended September 30, 2004) | |
| 10.4* ++ | Form of Restricted Stock Unit Award Agreement used under the Quest Software, Inc. 1999 Stock Incentive Plan, as amended (incorporated by reference to our Quarterly Report on Form 10-Q for the period ended March 31, 2008) | |
| 10.5* ++ | Quest Software, Inc. 2001 Stock Incentive Plan, as amended (incorporated by reference to our Quarterly Report on Form 10-Q for the period ended March 31, 2008) | |
| 10.6* ++ | Form of Stock Option Agreement used under the Quest Software, Inc. 2001 Stock Incentive Plan (incorporated by reference to our Registration Statement on Form S-8 (File No. 333-82784) filed on February 14, 2002) | |
| 10.7* ++ | Quest Software, Inc. 2008 Stock Incentive Plan (incorporated by reference to our Quarterly Report on Form 10-Q for the period ended March 31, 2008) | |
| 10.8* ++ | Form of Stock Option Agreement used under the Quest Software, Inc. 2008 Stock Incentive Plan (incorporated by reference to our Quarterly Report on Form 10-Q for the period ended March 31, 2008) | |
| 10.9* ++ | Form of Restricted Stock Unit Award Agreement used under the Quest Software, Inc. 2008 Stock Incentive Plan (incorporated by reference to our Quarterly Report on Form 10-Q for the period ended March 31, 2008) | |
| 10.10* ++ | Quest Software, Inc. Executive Incentive Plan (incorporated by reference to our Annual Report on Form 10-K for the year ended December 31, 2007) | |
| 10.11* | Credit Agreement dated as of February 17, 2009 between Quest Software, Inc. and Wells Fargo Foothill, LLC (incorporated by reference to our Quarterly Report on Form 10-Q for the period ended March 31, 2009) | |
| 10.12* | Security Agreement dated as of February 17, 2009 among Quest Software, Inc., Aelita Software Corporation, ScriptLogic Corporation, Vizioncore, Inc., NetPro Computing, Inc. and those additional entities that hereafter become parties hereto, and Wells Fargo Foothill, LLC (incorporated by reference to our Quarterly Report on Form 10-Q for the period ended March 31, 2009) | |
| 10.13* ++ | Voting Agreement dated June 1, 2009 by and between Quest Software, Inc. and Vincent C. Smith (incorporated by reference to our Current Report on Form 8-K filed on June 1, 2009) | |
| 10.14* | Loan and Security Agreement, dated as of August 3, 2009, between Quest Software, Inc. as Borrower and Mutual of Omaha Bank as Lender (incorporated by reference to our Current Report on Form 8-K filed on August 7, 2009) | |
| 10.15* | Secured Promissory Note, dated as of August 3, 2009, from Quest Software, Inc. as Maker to Mutual of Omaha Bank as Payee (incorporated by reference to our Current Report on Form 8-K filed on August 7, 2009) | |
| 10.16* | Deed of Trust, Security Agreement, Assignment of Rents and Leases, and Fixture Filing, dated as of August 3, 2009, by and among Quest Software, Inc. as Trustor, Mutual of Omaha Bank as Beneficiary, and Fidelity National Title Company as Trustee (incorporated by reference to our Current Report on Form 8-K filed on August 7, 2009) | |
Table of Contents
Exhibit | Exhibit Title | |
| 10.17* | Environmental Certification and Indemnity Agreement, dated as of August 3, 2009, by Quest Software, Inc. as Obligor in favor of Mutual of Omaha Bank as Lender (incorporated by reference to our Current Report on Form 8-K filed on August 7, 2009) | |
| 14.1* | Code of Conduct and Ethics (incorporated by reference to our Annual Report on Form 10-K for the period ended December 31, 2009) | |
| 21.1 | Subsidiaries of the Registrant | |
| 23.1 | Consent of Deloitte & Touche LLP | |
| 31.1 | Certification of the Principal Executive Officer Pursuant to Rule 13a-14(a) of the Securities Exchange Act of 1934, as amended | |
| 31.2 | Certification of the Principal Financial Officer Pursuant to Rule 13a-14(a) of the Securities Exchange Act of 1934, as amended | |
| 32.1 | Certification of Principal Executive Officer and Principal Financial Officer pursuant to 18 U.S.C. Section 1350, as adopted pursuant to Section 906 of the Sarbanes-Oxley Act of 2002 | |
| 101.INS | XBRL Instance Document | |
| 101.SCH | XBRL Taxonomy Extension Schema Document | |
| 101.CAL | XBRL Taxonomy Extension Calculation Linkbase Document | |
| 101.DEF | XBRL Taxonomy Extension Definition Linkbase Document | |
| 101.LAB | XBRL Taxonomy Extension Label Linkbase Document | |
| 101.PRE | XBRL Taxonomy Extension Presentation Linkbase Document | |
| * | Incorporated by reference |
| ++ | Indicates a management contract or compensatory arrangement |