0001089113ifrs-full:LifetimeExpectedCreditLossesMemberhsbc:LoansAndAdvancesToBanksAndCustomersIncludingLoanCommitmentsAndFinancialGuaranteesMemberifrs-full:FinancialInstrumentsNotCreditimpairedMemberifrs-full:AccumulatedImpairmentMember2020-12-310001089113ifrs-full:LifetimeExpectedCreditLossesMemberifrs-full:FinancialGuaranteeContractsMemberifrs-full:GrossCarryingAmountMemberifrs-full:FinancialInstrumentsNotCreditimpairedMemberhsbc:IFRS9Member2020-12-310001089113ifrs-full:Level3OfFairValueHierarchyMemberhsbc:NetIncomeFromFinancialInstrumentsHeldForTradingOrManagedOnAFairValueBasisMemberifrs-full:RecurringFairValueMeasurementMemberifrs-full:FinancialLiabilitiesAtFairValueThroughProfitOrLossThatMeetDefinitionOfHeldForTradingCategoryMember2020-07-012020-12-31
FORM 6-K
SECURITIES AND EXCHANGE COMMISSION
Washington, D.C. 20549
Report of Foreign Private Issuer
Pursuant to Rule 13a - 16 or 15d - 16 of
the Securities Exchange Act of 1934
For the month of August 2021
Commission File Number: 001-14930
HSBC Holdings plc
42nd Floor, 8 Canada Square, London E14 5HQ, England
(Indicate by check mark whether the registrant files or will file annual reports under cover of Form 20-F or Form 40-F).
Form 20-F X Form 40-F ......
Indicate by check mark if the registrant is submitting the Form 6-K in paper as permitted by Regulation S-T Rule 101(b)(1): ______
Indicate by check mark if the registrant is submitting the Form 6-K in paper as permitted by Regulation S-T Rule 101(b)(7): ______
This Report on Form 6-K with respect to our interim results for the first half of 2021 is hereby incorporated by reference in HSBC Holdings plc’s registration statement on Form F-3 (333-253632).
Neither our website referred to herein, nor any of the information contained on our website, is incorporated by reference in the Form 6-K.
Contents
Overview
1a Cautionary statement regarding forward-looking statements
1b Certain defined terms
2 Highlights
4 Group Chief Executive’s review
8 Our strategy
10 How we do business
12 Financial overview
16 Global businesses
23 Risk overview
Interim management report
27 Financial summary
34 Global businesses
42 Geographical regions
52 Reconciliation of alternative performance measures
55 Risk
55 – Key developments in the first half of 2021
55 – Areas of special interest
59 – Credit risk
86 – Treasury risk
94 – Market risk
96 – Insurance manufacturing operations risk
Interim condensed financial statements
98 Interim condensed financial statements
104 Notes on the interim condensed financial statements
Additional information
125 Shareholder information
131 Abbreviations
A reminder
The currency we report in is US dollars.
Adjusted measures
We supplement our IFRSs figures with non-IFRSs measures used by management internally that constitute alternative performance measures under European Securities and Markets Authority guidance and non-GAAP financial measures defined in and presented in accordance with US Securities and Exchange Commission rules and regulations. These measures are highlighted with the following symbol: <>
Further explanation may be found on page 14.
In this document we use the following abbreviations to refer to reporting periods:
1H21 First half of 2021 2Q21 Second quarter of 2021
2H20 Second half of 2020 1Q21 First quarter of 2021
1H20 First half of 2020 2Q20 Second quarter of 2020 1Q20 First quarter of 2020
None of the websites referred to in this Interim Report on Form 6-K for the half-year ended June 30, 2020 (the ‘Form 6-K’), including where a link is provided, nor any of the information contained on such websites is incorporated by reference in the Form 6-K.
Our global businesses
We serve customers through three global businesses. On pages 16 to 22 we provide an overview of our performance in the first half of 2021 for each of the global businesses, as well as our Corporate Centre.
Wealth and Personal Banking (’WPB’)
We help millions of our customers look after their day-to-day finances and manage, protect and grow their wealth.
Commercial Banking (‘CMB’)
Our global reach and expertise help domestic and international businesses around the world unlock their potential.
Global Banking and Markets (’GBM’)
We provide a comprehensive range of financial services and products to corporates, governments and institutions.
Cautionary statement regarding forward-looking statements
This Form 6-K contains certain forward-looking statements with respect to HSBC’s: financial condition; results of operations and business, including the strategic priorities; financial, investment and capital targets; and ESG targets/commitments described herein.
Statements that are not historical facts, including statements about HSBC’s beliefs and expectations, are forward-looking statements. Words such as ‘will’, ‘should’, ‘expects’, ‘targets’, ‘anticipates’, ‘intends’, ‘plans’, ‘believes’, ‘seeks’, ‘estimates’, ‘potential’ and ‘reasonably possible’, variations of these words and similar expressions are intended to identify forward-looking statements. These statements are based on current plans, information, data, estimates and projections, and therefore undue reliance should not be placed on them. Forward-looking statements speak only as of the date they are made. HSBC makes no commitment to revise or update any forward-looking statements to reflect events or circumstances occurring or existing after the date of any forward-looking statements.
Written and/or oral forward-looking statements may also be made in the periodic reports to the US Securities and Exchange Commission, summary financial statements to shareholders, proxy statements, offering circulars and prospectuses, press releases and other written materials, and in oral statements made by HSBC’s Directors, officers or employees to third parties, including financial analysts.
Forward-looking statements involve inherent risks and uncertainties. Readers are cautioned that a number of factors could cause actual results to differ, in some instances materially, from those anticipated or implied in any forward-looking statement. These include, but are not limited to:
•changes in general economic conditions in the markets in which we operate, such as continuing or deepening recessions and fluctuations in employment and creditworthy customers beyond those factored into consensus forecasts (including, without limitation, as a result of the Covid-19 pandemic); the Covid-19 pandemic, which is expected to continue to have adverse impacts on our income due to lower lending and transaction volumes, lower wealth and insurance manufacturing revenue, and lower or negative interest rates in markets where we operate, as well as, more generally, the potential for material adverse impacts on our financial condition, results of operations, prospects, liquidity, capital position and credit ratings; deviations from the market and economic assumptions that form the basis for our ECL measurements (including, without limitation, as a result of the Covid-19 pandemic); potential changes in HSBC’s dividend policy; changes in foreign exchange rates and interest rates, including the accounting impact resulting from financial reporting in respect of hyperinflationary economies; volatility in equity markets; lack of liquidity in wholesale funding or capital markets, which may affect our ability to meet our obligations under financing facilities or to fund new loans, investments and businesses; geopolitical tensions or diplomatic developments producing social instability or legal uncertainty, such as the developments in Hong Kong and the South China Sea, the US’s approach to strategic competition with China, supply chain restrictions, claims of human rights violations, diplomatic tensions between China and the UK, the EU, Australia and India, and other potential areas of tension, which may affect HSBC by creating regulatory, reputational and market risks; the efficacy of government, customer and HSBC’s actions in managing and mitigating climate change and in supporting the global transition to net zero carbon emissions, which may cause both idiosyncratic and systemic risks resulting in potential financial and non-financial impacts; illiquidity and downward price pressure in national real estate markets; adverse changes in central banks’ policies with respect to the provision of liquidity support to financial markets; heightened market concerns over sovereign creditworthiness in over-indebted countries; adverse changes in the funding status of public or private defined benefit pensions; societal shifts in customer financing and investment needs, including consumer perception as to the continuing availability of credit; exposure to counterparty risk, including third parties using us as a conduit for illegal activities without our knowledge; the expected discontinuation of certain key Ibors and the development of near risk-free benchmark rates, as well as the transition of legacy Ibor contracts to near risk-free benchmark rates, which exposes HSBC to material execution risks, and increases some financial and non-financial risks; and price competition in the market segments we serve;
•changes in government policy and regulation, including the monetary, interest rate and other policies of central banks and other regulatory authorities in the principal markets in which we operate and the consequences thereof (including, without limitation, actions taken as a result of the Covid-19 pandemic); initiatives to change the size, scope of activities and interconnectedness of financial institutions in connection with the implementation of stricter regulation of financial institutions in key markets worldwide; revised capital and liquidity benchmarks, which could serve to deleverage bank balance sheets and lower returns available from the current business model and portfolio mix; changes to tax laws and tax rates applicable to HSBC, including the imposition of levies or taxes designed to change business mix and risk appetite; the practices, pricing or responsibilities of financial institutions serving their consumer markets; expropriation, nationalisation, confiscation of assets and changes in legislation relating to foreign ownership; the future of the UK’s relationship with the EU following the UK’s withdrawal from the EU, which may continue to be characterised by uncertainty despite the signing of the Trade and Cooperation Agreement between the UK and the EU; passage of the Hong Kong national security law and restrictions on telecommunications, as well as the US Hong Kong Autonomy Act, which have caused tensions between China, the US and the UK; general changes in government policy that may significantly influence investor decisions; the costs, effects and outcomes of regulatory reviews, actions or litigation, including any additional compliance requirements; and the effects of competition in the markets where we operate including increased competition from non-bank financial services companies; and
•factors specific to HSBC, including our success in adequately identifying the risks we face, such as the incidence of loan losses or delinquency, and managing those risks (through account management, hedging and other techniques); our ability to achieve our financial,
investment, capital and ESG targets/commitments, which may result in our failure to achieve any of the expected benefits of our strategic priorities; model limitations or failure, including, without limitation, the impact that the consequences of the Covid-19 pandemic have had on the performance and usage of financial models, which may require us to hold additional capital, incur losses and/or use compensating controls, such as judgemental post-model adjustments, to address model limitations; changes to the judgements, estimates and assumptions we base our financial statements on; changes in our ability to meet the requirements of regulatory stress tests; a reduction in the credit ratings assigned to us or any of our subsidiaries, which could increase the cost or decrease the availability of our funding and affect our liquidity position and net interest margin; changes to the reliability and security of our data management, data privacy, information and technology infrastructure, including threats from cyber-attacks, which may impact our ability to service clients and may result in financial loss, business disruption and/ or loss of customer services and data; changes in insurance customer behaviour and insurance claim rates; our dependence on loan payments and dividends from subsidiaries to meet our obligations; changes in accounting standards, which may have a material impact on the way we prepare our financial statements; changes in our ability to manage third-party, fraud and reputational risks inherent in our operations; employee misconduct, which may result in regulatory sanctions and/or reputational or financial harm; changes in skill requirements, ways of working and talent shortages, which may affect our ability to recruit and retain senior management and diverse and skilled personnel; and changes in our ability to develop sustainable finance products and our capacity to measure the climate impact from our financing activity, which may affect our ability to achieve our climate ambition. Effective risk management depends on, among other things, our ability through stress testing and other techniques to prepare for events that cannot be captured by the statistical models it uses; our success in addressing operational, legal and regulatory, and litigation challenges; and other risks and uncertainties we identify in ‘Top and emerging risks’ on pages 25 to 26.
Certain defined terms
Unless the context requires otherwise, ‘HSBC Holdings’ means HSBC Holdings plc and ‘HSBC’, the ‘Group’, ‘we’, ‘us’ and ‘our’ refer to HSBC Holdings together with its subsidiaries. Within this document the Hong Kong Special Administrative Region of the People’s Republic of China is referred to as ‘Hong Kong’. When used in the terms ‘shareholders’ equity’ and ‘total shareholders’ equity’, ‘shareholders’ means holders of HSBC Holdings ordinary shares and those preference shares and capital securities issued by HSBC Holdings classified as equity. The abbreviations ‘$m’, ‘$bn’ and ‘$tn’ represent millions, billions (thousands of millions) and trillions of US dollars, respectively.
Opening up a world of opportunity
Our ambition is to be the preferred international financial partner for our clients.
In February 2021, we refined our purpose, ambition and values to reflect our strategy and to support our focus on execution.
Read more on our purpose and values on page 16 of our Annual Report and Accounts 2020.
Our values
Our values help define who we are as an organisation, and are key to our long-term success.
We value difference
Seeking out different perspectives
We succeed together
Collaborating across boundaries
We take responsibility
Holding ourselves accountable and taking the long view
We get it done
Moving at pace and making things happen
For further details on how we are embedding our values, see page 10.
Key themes
Global performance
Performance demonstrated our continued strength in Asia and a material recovery in profitability in our other regions, which benefited from net ECL releases. All of our regions were profitable for the first time since 1H18.
Read more on page 12.
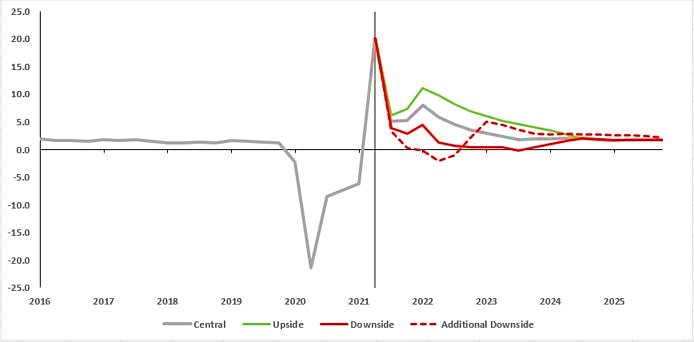
Economic outlook
Economic forecasts have improved as countries emerge from the Covid-19 pandemic, although uncertainties remain as countries respond at different speeds, government support measures unwind and new virus strains test the efficacy of vaccination programmes.
Read more on page 2.
Growth signals
While the impacts of low global interest rates and the Covid-19 pandemic are expected to provide headwinds to improved profitability and returns, there are emerging signs of unsecured personal lending and commercial lending growth.
Read more on page 8.
Progress in key areas
Growth and transformation
We have made good progress in areas of strength and expanded our digital capabilities. In addition, we are improving the way we work to energise the organisation for growth.
Read more on page 8.
Strategic transactions
We have announced the potential sale of our retail banking business in France, as well as the exit of domestic mass market retail banking in the US.
Read more on page 8.
Climate
We continue to make progress with our environmental, social and governance (‘ESG’) agenda, including towards the climate commitments we announced in October 2020.
Read more on page 10.
Performance in 1H21
Reported profit after tax
$8.4bn
(1H20: $3.1bn)
Basic earnings per share
$0.36
(1H20: $0.10)
Gender diversity
31.1%
Women in senior leadership roles.
Target: 35% by 2025.
(31 December 2020: 30.3%)
Sustainable finance and investments
$87.4bn
Cumulative total provided and facilitated since 1 January 2020. Target: $750bn to $1tn by end-2030.
(31 December 2020: $44.1bn)
Read more on our financial overview on page 12.
Our data dictionary, which includes a definition of sustainable finance and investments, can be found at www.hsbc.com/who-we-are/esg-and-responsible-business/esg-reporting-centre.
Highlights
Performance in the first half of 2021 reflected an improvement in global economic conditions. While uncertainties remain, the outlook is more positive with evidence of growth in strategic areas.
Financial performance (1H21 vs 1H20)
•Reported profit after tax increased by $5.3bn to $8.4bn and reported profit before tax increased by $6.5bn to $10.8bn. A fall in revenue reflected 2020 interest rate reductions and lower Markets and Securities Services (‘MSS’) revenue relative to a strong 1H20. This was more than offset by releases in our expected credit losses and other credit impairment charges (‘ECL’). Reported profit in 1H20 included an impairment of software intangibles of $1.2bn, mainly in Europe.
•All regions profitable in 1H21, notably HSBC UK Bank plc reported profit before tax of over $2.1bn in the period. Despite interest rate headwinds, there was continued strength in Asia and a material recovery in profitability in all other regions, reflecting a net release in ECL as the economic outlook improved.
•Reported revenue down 4% to $25.6bn, primarily reflecting 2020 interest rate reductions and lower MSS revenue in Global Banking and Markets (‘GBM’). These reductions were partly offset by net favourable movements in market impacts in life insurance manufacturing and valuation adjustments in GBM.
•In 1H21, lending increased by $21.5bn on a reported basis, reflecting growth in Wealth and Personal Banking (‘WPB’) and Commercial Banking (‘CMB’). Deposits grew by $26.3bn on a reported basis, with increases in all global businesses.
•Net interest margin (‘NIM’) of 1.21% in 1H21, down 22 basis points (‘bps’) from 1H20. NIM in 2Q21 of 1.20% remained stable compared with 1Q21.
•Reported ECL were a net release of $0.7bn, compared with a $6.9bn charge in 1H20. The net release in 1H21 primarily reflected an improvement in the economic outlook since 2020. The reduction also reflected low levels of stage 3 charges in 1H21, as well as the non-recurrence of a large charge in 1H20 related to a corporate exposure in Singapore.
•Reported and adjusted operating expenses increased 3%, primarily due to a higher performance-related pay accrual as profitability improved, as well as continued investment, partly offset by the impact of our cost-saving initiatives.
•Return on average tangible equity (‘RoTE‘) (annualised) of 9.4%, up 5.6 percentage points compared with 1H20.
•Common equity tier 1 (‘CET1’) ratio of 15.6%, down 0.3 percentage points from 31 December 2020, reflecting an increase in RWAs from lending growth and a decrease in CET1 capital including the impact of foreseeable dividends.
•The Board has announced an interim dividend for 1H21 of $0.07 per ordinary share, to be paid in cash with no scrip alternative.
Financial performance (2Q21 vs 2Q20)
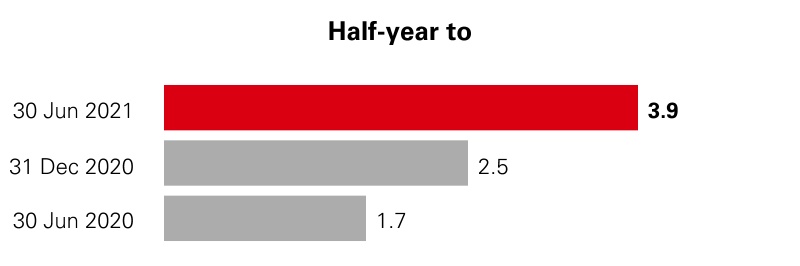
•Reported profit after tax up $3.2bn to $3.9bn and reported profit before tax up $4.0bn to $5.1bn. Reported revenue was down 4%, mainly due to lower revenue in MSS, as well as the impact of lower interest rates. This was more than offset by net releases in reported ECL and lower reported operating expenses.
Outlook for 2021
•The execution of our strategy continues at pace, including the announcement of transactions in relation to our retail operations in France and mass market retail operations in the US.
•Despite continued revenue headwinds, notably in fixed income markets relative to strong comparative periods, as well as low interest rates and Covid-19 impacts, there are emerging signs of unsecured personal lending and commercial lending growth. We expect mid-single-digit lending growth for the full year, which is expected to translate into low-single-digit RWA growth as we progress with our RWA reduction actions.
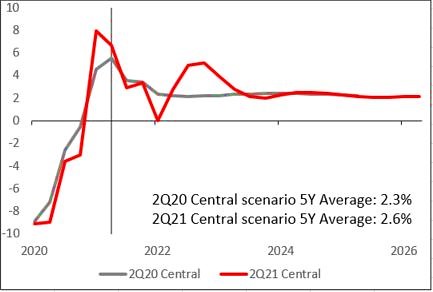
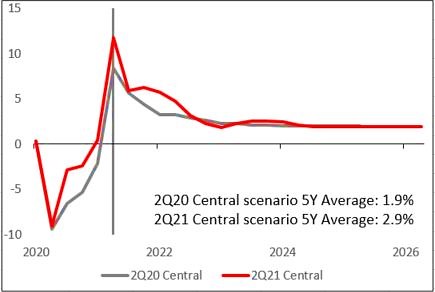
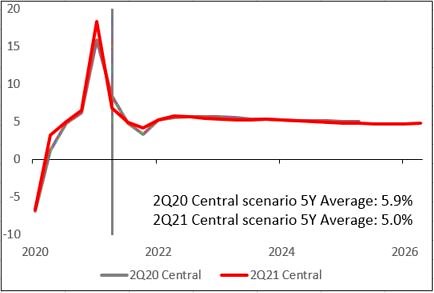
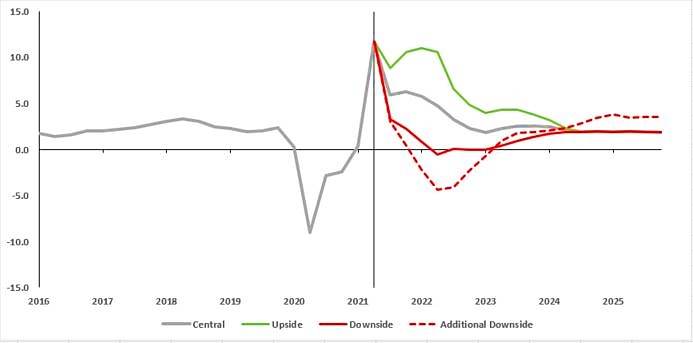
•Given current consensus economics and default experience, ECL charges for 2021 are expected to be materially lower than our medium-term range of 30bps to 40bps of average loans and possibly a net release for the year. Uncertainty remains as countries emerge from the pandemic at different speeds, government support measures unwind and new virus strains test the efficacy of vaccination programmes. To reflect this uncertainty, at 30 June 2021 around $2.4bn remained of the stage 1 and stage 2 ECL allowance uplift we made during 2020. For further details, see ‘Measurement uncertainty and sensitivity analysis of ECL estimates’ on page 62.
•Our cost reduction programme remains on track. We expect adjusted operating expenses for 2021 to be broadly in line with 2020, excluding the benefit from a reduced bank levy. This remains subject to final decisions on performance-related pay, which will primarily reflect the performance of the Group.
•The Group maintains a strong capital position and is well placed to fund growth and step up capital returns. Reflecting the current improved economic outlook and operating environment in many of our markets, we now expect to move to within our target dividend payout ratio range of 40% to 55% of reported earnings per ordinary share in 2021.
Delivery against our financial targets
Return on average tangible equity (annualised) <>
9.4%
Target: ≥10% in the medium term.
(1H20: 3.8%)
Adjusted operating expenses <>
$16.2bn
Target: ≤$31bn in 2022 (based on average December 2020 FX rates).
(1H20: $15.7bn)
Gross risk-weighted asset (‘RWA’) reduction
$84.5bn
Updated target: $110bn by end-2022.
CET1 capital ratio
15.6%
Target: >14%, managing in range of 14% to 14.5% in medium term.
(31 December 2020: 15.9%)
Interim dividend per ordinary share for 1H21
$0.07
Further explanation of performance against Group financial targets may be found on page 12.
Key financial metrics
| | | | | | | | | | | |
| Half-year to |
| Reported results | 30 Jun 2021 | 30 Jun 2020 | 31 Dec 2020 |
| Reported revenue ($m) | 25,551 | | 26,745 | | 23,684 | |
| Reported profit before tax ($m) | 10,839 | | 4,318 | | 4,459 | |
| Reported profit after tax ($m) | 8,422 | | 3,125 | | 2,974 | |
| Profit attributable to the ordinary shareholders of the parent company ($m) | 7,276 | | 1,977 | | 1,921 | |
| Cost efficiency ratio (%) | 66.9 | | 61.8 | | 75.6 | |
| Basic earnings per share ($) | 0.36 | | 0.10 | | 0.10 | |
| Diluted earnings per share ($) | 0.36 | | 0.10 | | 0.09 | |
Net interest margin (%)1 | 1.21 | | 1.43 | | 1.32 | |
| | | |
Alternative performance measures <> | | | |
| Adjusted revenue ($m) | 25,797 | | 27,597 | | 24,523 | |
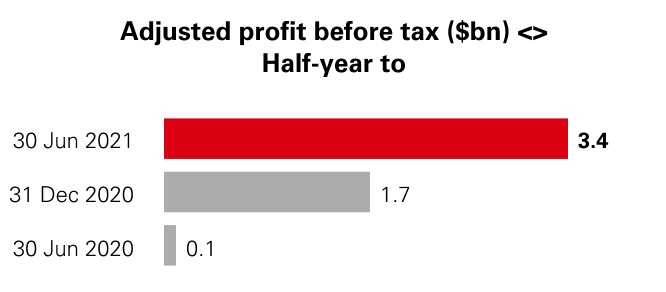
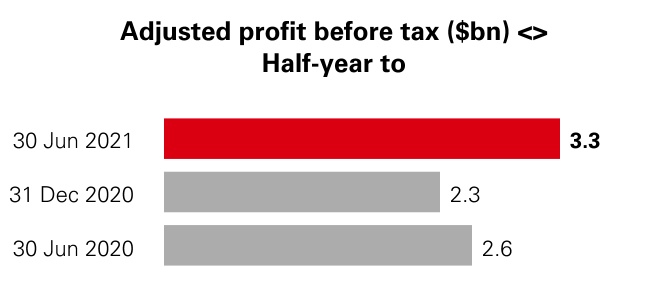
| Adjusted profit before tax ($m) | 11,950 | | 5,654 | | 6,680 | |
| | | |
| Adjusted cost efficiency ratio (%) | 62.9 | | 56.9 | | 69.1 | |
| Annualised expected credit losses and other credit impairment charges (‘ECL’) as a % of average gross loans and advances to customers (%) | (0.14) | | 1.34 | | 0.38 | |
| Return on average ordinary shareholders’ equity (annualised) (%) | 8.4 | | 2.4 | | 2.3 | |
Return on average tangible equity (annualised) (%)1,2 | 9.4 | | 3.8 | | 3.1 |
| | | |
| | At | |
| Balance sheet | 30 Jun 2021 | 30 Jun 2020 | 31 Dec 2020 |
| Total assets ($m) | 2,976,005 | | 2,922,798 | | 2,984,164 | |
| Net loans and advances to customers ($m) | 1,059,511 | | 1,018,681 | | 1,037,987 | |
| Customer accounts ($m) | 1,669,091 | | 1,532,380 | | 1,642,780 | |
Average interest-earning assets ($m)1 | 2,188,991 | | 2,034,939 | | 2,092,900 | |
| Loans and advances to customers as % of customer accounts (%) | 63.5 | | 66.5 | | 63.2 | |
| Total shareholders’ equity ($m) | 198,218 | | 187,036 | | 196,443 | |
| Tangible ordinary shareholders’ equity ($m) | 157,985 | | 147,879 | | 156,423 | |
Net asset value per ordinary share at period end ($)3 | 8.69 | | 8.17 | | 8.62 | |
| Tangible net asset value per ordinary share at period end ($) | 7.81 | | 7.34 | | 7.75 | |
| | | |
| Capital, leverage and liquidity | | | |
Common equity tier 1 capital ratio (%)4 | 15.6 | | 15.0 | | 15.9 | |
Risk-weighted assets ($m)4 | 862,292 | | 854,552 | | 857,520 | |
Total capital ratio (%)4 | 21.0 | | 20.7 | | 21.5 | |
Leverage ratio (%)4 | 5.3 | | 5.3 | | 5.5 | |
| High-quality liquid assets (liquidity value) ($bn) | 659 | | 654 | | 678 | |
| Liquidity coverage ratio (%) | 134 | | 148 | | 139 | |
| | | |
| Share count | | | |
| Period end basic number of $0.50 ordinary shares outstanding (millions) | 20,223 | | 20,162 | | 20,184 | |
| Period end basic number of $0.50 ordinary shares outstanding and dilutive potential ordinary shares (millions) | 20,315 | | 20,198 | | 20,272 | |
| Average basic number of $0.50 ordinary shares outstanding (millions) | 20,211 | | 20,162 | | 20,176 | |
| Dividend per ordinary share (in respect of the period) ($) | 0.07 | | — | | 0.15 | |
For reconciliations of our reported results to an adjusted basis, including lists of significant items, see page 35. Definitions and calculation of other alternative performance measures are included in our ‘Reconciliation of alternative performance measures’ on page 52.
1 For these metrics, half-year to 31 December 2020 is calculated on a full-year basis and not a 2H20 basis.
2 Profit attributable to ordinary shareholders, excluding impairment of goodwill and other intangible assets and changes in present value of in-force insurance contracts (‘PVIF’) (net of tax), divided by average ordinary shareholders’ equity excluding goodwill, PVIF and other intangible assets (net of deferred tax).
3 The definition of net asset value per ordinary share is total shareholders’ equity less non-cumulative preference shares and capital securities, divided by the number of ordinary shares in issue excluding shares the company has purchased and are held in treasury.
4 Unless otherwise stated, regulatory capital ratios and requirements are based on the transitional arrangements of the Capital Requirements Regulation in force at the time. These include the regulatory transitional arrangements for IFRS 9 ‘Financial Instruments’, which are explained further on page 89. Leverage ratios are calculated using the end point definition of capital and the IFRS 9 regulatory transitional arrangements. Following the end of the transition period after the UK’s withdrawal from the EU, any reference to EU regulations and directives (including technical standards) should be read as a reference to the version onshored into UK law under the European Union (Withdrawal) Act 2018, as amended.
Group Chief Executive’s review
We are implementing our growth and transformation plans with pace and purpose, building on the progress of 2020 with the aim of delivering a world-leading service to our customers and strong returns for our investors.
In February this year, we launched an updated purpose for HSBC. ‘Opening up a world of opportunity’ was the product of wide consultation with our colleagues and customers around the world. Since then, I have spoken with thousands of my colleagues across HSBC to discuss how we live that purpose every day.
I have been excited by the energy of those conversations. Our purpose and the values that underpin it – we value difference, we succeed together, we take responsibility, and we get it done – have resonated strongly, not just as a means of guiding our behaviour, but in articulating what our people want us to be as a business. Many expressed great pride in our heritage and culture, but also belief in the need to adapt to meet present and future challenges. Above all though, there was a strong desire to learn from and embed the lessons of the past 18 months, which is a conviction that my senior management team and I all share.
This spirit was evident in a good first-half performance. The customer-centricity that characterised our response to the Covid-19 pandemic remained to the fore, driven by increased collaboration and the benefits of our continued digital investment. This enabled us not just to better serve our existing customers, but also to attract new clients, win new mandates and strengthen our lending pipelines. We also generated strong momentum behind our growth and transformation plans, with good delivery against all four pillars – focus on our strengths, digitise at scale, energise for growth, and transition to net zero.
Our biggest challenge has remained the Covid-19 pandemic, which continues to threaten our customers, colleagues and communities. This was especially true in India, where the devastating spread of the Delta variant was a stark reminder of the danger that the virus continues to pose. India is both a growth market and an important service hub for the Group, and around 39,000 of our people are based there. While measures were already in place to enable a large majority of these colleagues to work from home, we took urgent steps to help them and their dependants to receive a vaccine, and provided financial support to local organisations delivering the relief effort on the ground. Operationally, we were able to maintain an unbroken service due to the continuity measures in place since March 2020. This was a testament both to the extraordinary efforts of our people, and the resilience of our systems and processes.
We received a strong endorsement of our recent progress in May, through the upgrade of our MSCI ESG rating from ‘average’ to ‘leader’. Among other things, MSCI recognised the significant increase in our employee engagement and talent development scores during 2020; the extensive involvement of our Board in incorporating climate considerations into our business strategy; our strong performance in customer complaints handling and financial education; and our achievement of the highest possible rating for corporate governance. We will work hard to maintain this rating in the coming quarters.
“Our purpose and the values that underpin it have resonated strongly, not just as a means of guiding our behaviour, but in articulating what our people want us to be as a business.“
Financial performance
Recovering economic growth in many of our main markets had a positive impact on our first-half financial performance. The improved economic outlook enabled us to begin releasing expected credit losses, which was the main driver of our improved profitability. The adverse impact of central bank interest rate cuts in 2020 continued to flow through to our interest-rate sensitive business lines, although our net interest income has now stabilised. A combination of increased fee income and cost-programme savings helped to compensate for the resulting reduction in revenue, and we strengthened our lending pipelines in our retail and wholesale businesses in the first half of the year.
As a consequence, the Group delivered $10.8bn of reported profit before tax, up 151% on the first half of 2020, and $12bn of adjusted profits, up 111%. We were profitable in every region in the first six months of the year.
Adjusted revenue was 7% lower than the same period last year. This was due mainly to the impact of interest rate cuts during 2020 on our deposit franchises in all three global businesses. However, our lending pipeline began to translate into business growth in the second quarter and we further strengthened that pipeline during the half-year.
Our cost reduction programmes continued to mitigate the cost of increased technology investment, although our adjusted operating expenses rose by 3% due to an increase in performance-related pay. We spent around $3.0bn on technology in the first half of the year, up 4% on the same period last year.
Our funding, liquidity and capital remain strong. We grew deposits by $27bn on a constant currency basis, with growth in all three global businesses. Our common equity tier one ratio was 15.6% on 30 June 2021. As a consequence, we are able to pay an interim dividend of $0.07 per ordinary share for the first half of the year.
Focus on our strengths
We made good progress in restructuring our portfolio of businesses in the first half of the year, investing in businesses that we intend to grow and withdrawing from areas in which we lack the scale to compete.
In particular, we took firm steps to resolve the future of our businesses in the US and continental Europe. In the US, we entered into agreements to sell our mass market retail business in the country, and in continental Europe, we entered into a memorandum of understanding with My Money Group aimed at selling our retail banking activities in France. Both of these followed a period of extensive strategic review, and are important milestones in the transformation of the Group. They will help enable both our US and continental Europe businesses to become more focused, simpler and sustainably profitable, and to better serve the international needs of our wholesale and wealth management customers.
In Asia, we continued to put in place the building blocks for future growth. We further grew our Pinnacle digital wealth management business in mainland China, recruiting more than 350 new wealth managers and accelerating our coverage expansion to five cities – Beijing, Shanghai, Guangzhou, Shenzhen and Hangzhou. We also improved our ability to serve the wealth needs of customers in Asia and the Asian diaspora by expanding our digital wealth capabilities in Hong Kong, Malaysia and Singapore, and reorganising our wealth businesses in continental Europe and the US to better connect international customers to the global wealth opportunity. The benefits of our investment in Asia wealth were evident in the first six months of 2021 through strong customer acquisition, increased fee income and significant growth in wealth balances.
“We are seeking to energise HSBC for growth through a strong sense of purpose and simpler ways of working, and by equipping our colleagues with the future skills they need.“
Digitise at scale
Our technology investment continues to improve the experiences of our customers and colleagues, and to boost efficiency while reducing our cost base. In the first half of the year, we launched a number of new, scalable digital capabilities for our customers and rolled out more of our existing capabilities to new markets.
For our personal customers, our digital Global Money Account allows our international customers to hold, manage and send funds in various currencies without paying any fees. Having launched this successfully in the US in 2020, we expanded it successfully into the UAE and Singapore in the first half of the year, with more to follow during 2021.
For our business customers, we launched HSBC Global Wallet, a new multi-currency digital wallet which allows businesses to hold, send and receive cash in multiple currencies using a single global account. Launched initially for customers in Singapore, the UK and the US, we intend to roll out new features and currencies to the platform in the second half of the year.
We also launched HSBC Kinetic for business customers in the UK. Kinetic is designed to be a truly mobile-first banking service, as opposed to a bank account with mobile features. Built on insights from more than 3,000 small business owners, it allows customers to manage their finances entirely through their smartphone. More than 10,000 businesses have now signed up, benefiting from online onboarding in 15 minutes, the ability to apply for lending products with instant lending decisions, and a number of critical insight capabilities.
Energise for growth
We are seeking to energise HSBC for growth through a strong sense of purpose and simpler ways of working, and by equipping our colleagues with the future skills they need. This includes embedding the lessons of the past 18 months to help build a dynamic, entrepreneurial and inclusive culture.
We are moving to a hybrid working model wherever possible, giving our people the flexibility to work in a way that suits both them and their customers. We will need less office space as a result, and we have plans to reduce our global office footprint by more than 3.6 million square feet – or around 20% – by the end of 2021. We are also relocating three of our global business CEOs to Asia on a permanent basis, taking them closer to our customers and to the core of our business.
We continue to simplify the organisation wherever we can. In the first half, we reduced the number of full-time equivalent employees by around 3,500. We also announced changes to our senior leadership bands to help ensure clarity of scope and accountability, and to empower our leaders to make decisions to accelerate our transformation and drive growth.
I am conscious that our current operating environment remains challenging for many colleagues and their families. While our employee engagement scores have remained above pre-pandemic levels, we have continued to see a rise in fatigue and anxiety among employees. To
help tackle this, we have provided a variety of well-being resources to support our people, including mindfulness training. This is something that I continue to monitor closely, particularly as our people adapt to our new hybrid working model.
Transition to net zero
We took a number of important steps towards our net zero ambitions in the first half of the year, and strengthened our position as a market leader of sustainable finance.
I was particularly pleased that 99.7% of our shareholders backed our special resolution on climate change at our AGM in May. This was a strong endorsement of our climate strategy, which has at its core a commitment to support our customers on their transitions to a low-carbon future. The resolution commits us to setting out the next steps in our transition, including through short- and medium-term sector-based targets; to phasing out financing of coal power and thermal coal mining by 2030 in EU and OECD countries, and by 2040 globally; and to reporting annually on our progress. Above all, it signals a unity of purpose between our business and our investors, which is vital as we confront the shared challenge of the low-carbon transition.
I have always said that partnership lies at the heart of the low-carbon transition. Part of our approach has been to attempt to forge new partnerships to find new solutions and accelerate progress, whether with our customers, governments or our peers in the banking sector. In April, we became a founding member of the Net-Zero Banking Alliance (‘NZBA’), which aims to deliver the banking sector’s ambition to align its climate commitments with the Paris Agreement goals in a collaborative, rigorous and transparent way. Through the NZBA, we also joined the Glasgow Financial Alliance for Net Zero, which combines the leading initiatives across the financial system to accelerate the transition to net zero emissions by 2050 at the latest.
In May, we launched a five-year partnership with World Resources Institute and WWF, backed by $100m of philanthropic funding from HSBC. The Climate Solutions Partnership seeks to unlock barriers to finance for companies and projects that tackle climate change, bringing emerging climate solutions to commercial viability and scale. By combining our resources, knowledge and insight with our partners on the ground, we are aiming to make a real-world impact in a targeted way, with a focus on scaling up climate innovation and nature-based solutions, and helping to transition the energy sector in Asia towards renewables.
We strengthened our position in the ESG bond market in the first half, participating in more issuances than in the whole of 2020. First-half mandates included the world’s first sovereign sustainable sukuk bond; the first sovereign green bonds issued by the UK and Canada; and a pioneering sustainability-linked bond for an energy company with the cost of financing tied to the reduction of its entire carbon footprint, including the emissions of products sold.
Our people
None of the achievements of the last six months would have been possible without the commitment and hard work of my colleagues. I do not underestimate the challenges that many still face as a consequence of the Covid-19 pandemic, which remains a presence in all of our lives. I am especially grateful to my colleagues in parts of the world where Covid-19 remains prevalent, and who have continued to go to extraordinary lengths for their customers and colleagues in extremely challenging circumstances.
We have had a good start to the year, but there is much more to do to deliver our ambitions for HSBC. We have a firm platform on which to build over the remainder of 2021.
Noel Quinn
Group Chief Executive
2 August 2021
Our strategy
We are implementing our strategy across the four strategic pillars aligned to our purpose, values and ambition announced in February 2021.
Progress on our 2021 commitments
In February 2021, we refreshed our strategy, in recognition of the fundamental shifts in the operating environment and to help achieve our ambition to be the preferred international financial partner for our clients. We have since made good progress across our four strategic pillars: focus on our areas of strength; digitise at scale to adapt our operating model for the future; energise our organisation for growth; and support the transition to a net zero global economy.
In the first half of 2021, we put in place strong building blocks for future growth, primarily in Asia, in terms of the reallocation of resources, growth in lending balances and our client pipeline. At the same time, we have accelerated the pace of execution of our strategy, with the announcements of the exit of domestic mass market retail banking in the US, as well as the potential sale of our retail banking business in France.
Focus on our strengths
In our global businesses
In each of our global businesses, we focus on delivering growth in areas where we have distinctive capabilities and have significant opportunities.
Wealth and Personal Banking
We expanded our Wealth franchise, with a particular focus on Asia. In 1H21, our reported global wealth balances grew to approximately $1.7tn, an 18% increase compared with 1H20, with client assets and funds under management growing by 23%. In 1H21, our Asia wealth balances reached $810bn. We recruited approximately 600 Asia wealth front-line FTEs, and our Asia affluent and high net worth customer base grew 7%, compared with 1H20, to 1.7 million customers. Wealth revenue in Asia increased by 26% compared with 1H20, including the benefit of $359m of insurance market impacts, and we also rolled out Pinnacle, our digital financial planning wealth platform, to five cities in mainland China with more locations in the pipeline.
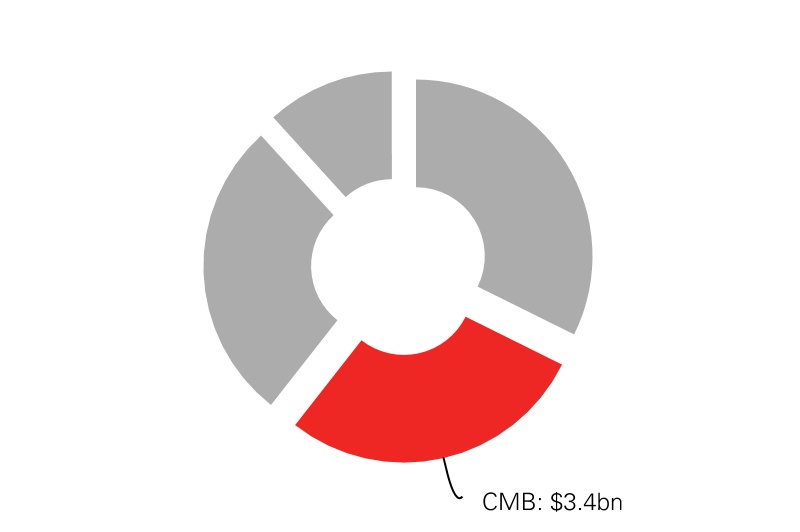
Commercial Banking
A strong lending pipeline and investment in digital solutions have started to translate into growth. Customer lending grew by 2% during 1H21 to $351bn, largely driven by an increase of 8% in Asia, with $6.7bn of net adjusted lending growth in trade finance, primarily in Hong Kong and mainland China. In Asia, lending approval limits, which includes renewal and refinancing activity, have also doubled since 2H20. Furthermore, we have invested heavily in digital services and platforms. We introduced Global Wallet, a digital wallet that allows businesses to hold, send and receive cash in multiple currencies, in Singapore, the UK and the US.
Global Banking and Markets
We made good progress on capital repositioning to drive growth. At 30 June 2021, overall reported RWAs were 8% lower than at 30 June 2020, driven by a reduction in products and domestic clients not aligned to our strategy. In the same period, RWAs allocated to Asia increased by 6%. This supports our focus on serving international clients into and within these high-growth regions. In 1H21, we also delivered $184m of cost saves, as part of the Group-wide cost reduction programme. We have increased collaboration revenue with our other global businesses by 6% compared with 1H20, with approximately $0.8bn generated with WPB, and approximately $1.3bn with CMB.
Reshaping our portfolio
To help create capacity for growth, we are refocusing our US business and HSBC Bank plc, our UK non-ring-fenced bank and Europe. In May 2021, we announced the exit of the domestic mass market retail business, including branches, in the US, and the potential sale of our retail banking business in France. We have seen rebounds in profits in both markets even as we reshape our portfolio.
Our US business
The transformation of the US business has continued at pace, with reported profit before tax of $0.4bn in 1H21, compared with a loss before tax of $0.1bn in 1H20, and adjusted profit before tax of $0.5bn in 1H21, up from $0.1bn in 1H20. We have reduced reported RWAs by $15bn or 16% since 30 June 2020, and completed the migration of our Fixed Income derivatives trading book from New York to London. We also delivered approximately $100m of cost saves in 1H21, achieving a total of $450m cost reduction since 2020, to operate under a simpler, leaner model. Furthermore, we announced the sale of our mass market retail banking business, subject to regulatory approval, to focus on our international corporate and wealth business. This sale would include approximately 1 million clients and 90 out of our existing 148 branches.
US adjusted costs <>
$bn
HSBC Bank plc (UK non-ring-fenced bank and Europe)
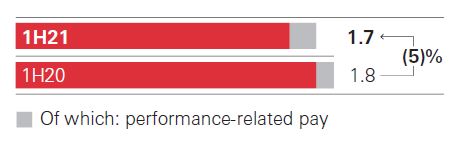
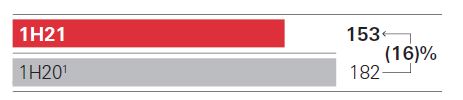
We saw progress in our transformation programme, with $1.1bn of reported profit before tax in 1H21, compared with a loss before tax of $1.6bn in 1H20, and adjusted profit before tax of $1.4bn, an uplift from a loss before tax of $0.6bn in 1H20. We also saw a reduction of approximately 16% of adjusted RWAs and 3% of the adjusted cost base compared with 1H20. We are on track to simplify our continental European operating model into an integrated business, and have refocused our wholesale client portfolio to align to our ambition to be the leading international wholesale bank in Europe, with a particular focus on the East, and to better serve our targeted customers. We signed a memorandum of understanding, relating to the potential sale of our retail banking operations in France, marking a significant step in the transformation of our European franchise.
HSBC Bank plc adjusted RWAs <>
$bn
1 Reported RWAs at 30 June 2020 were $171bn with foreign currency translation differences of $11bn.
Digitise at scale
Investing in technology
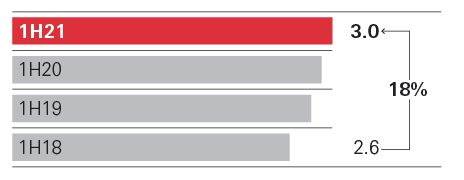
We continued to invest in technology to help deliver excellent customer service and improve productivity across our organisation. In 1H21, we spent $3bn on technology, an increase of 18% since 1H18.
To improve our operational proficiency, we are increasingly using the Cloud in our back-office functions, which helps to increase resilience and reduce maintenance costs, through partnerships with big technology firms such as Google and Amazon. The number of live services processed on the Cloud has approximately doubled from 1H20 to 1H21. For our customers, we reduced manual intervention in our payments processing, with the straight-through-processing rate increasing to 96.7%. We also enhanced the First Direct customer journey by improving the account opening speed from 10 days to 10 minutes.
During 1H21, we accelerated the roll-out of our digital services. In 1H21, Kinetic, our digital business banking platform, reached 10,000 customers and received a 4.8 out of 5.0 iOS app store rating in the UK. Global Money, our multi-currency account for retail customers, has expanded into Singapore and the UAE, following the US launch in 4Q20. As of July 2021, Global Money served approximately 45,000 users across the UAE and the US. We also continue to invest in transforming our trade platform to drive growth and improve customer experience.
Technology spend (adjusted) <>
$bn
Energise for growth
Since we launched our refreshed purpose and values in February 2021, we have been applying our values in how we work across the organisation. Our most recent all-employee survey in June showed employee engagement decreased slightly after significant gains in 2020, but has remained above 2019 levels. We are moving towards a more hybrid way of working. Since the start of 2020, we have exited or downsized 77 buildings, resulting in a 10% reduction in our global office footprint. We are also progressing well against our aspirational target of 35% women in senior leadership roles by 2025, reaching 31.1% in 1H21. In addition, we are the founding member of the World Economic Forum’s Partnering for Racial Justice in Business, and a signatory to the United Nations LGBTI Standards of Conduct for Business.
We are growing our Asia talent base and cementing our leadership in the region to accelerate the execution of our strategy. We commenced the relocation of key executives to Hong Kong, including the CEOs of WPB, CMB and Asset Management, and a co-CEO of GBM. We appointed new co-CEOs of Asia-Pacific, bringing in a breadth of regional experience, to support our leadership’s strategic focus on geographies where we want to grow, including Greater China, the ASEAN region and India. For recruiting plans, we hired more than 650 new graduates – comprising 52% women and representing 48 different nationalities – in 17 markets.
Transition to net zero
Becoming a net zero bank
Within the wider financial services sector, we joined various initiatives, including the Net-Zero Banking Alliance as a founding member, the Glasgow Financial Alliance for Net Zero, Sustainable Markets Initiative, and the Partnership for Carbon Accounting Financials. Within our organisation, we are developing climate stress testing capabilities and are actively participating in the Bank of England’s climate change biennial exploratory scenario exercise. We invited suppliers representing 60% of our total supplier spend to participate in CDP (formerly the Carbon Disclosure Project). For our colleagues, we expanded our network of employee-led sustainability champions, with more than 30,000 colleagues across 70 teams, and included a sustainability module in our mandatory learning.
Supporting our customers
Our aim is to provide $750bn to $1tn of sustainable finance and investments by 2030 to help our customers transition to lower carbon emissions. Since 1 January 2020, cumulatively we have provided and facilitated $87.4bn of sustainable finance and investments. In 1H21, we also participated in carrying out more green, social, sustainability and sustainability-linked bonds for clients than we did in the whole of 2020. We were named the joint structuring adviser for the UK’s and Canada’s inaugural sovereign green bond issuances, and were awarded Euromoney’s Best Bank for Sustainable Finance in Asia and the Middle East in July 2021.
Unlocking new climate solutions
In May 2021, we formed the Climate Solutions Partnership with the World Resources Institute and WWF, backed by $100m of our philanthropic capital to accelerate support for innovative solutions tackling climate change. We launched our first in-market green mortgage product in the UAE, and a lower carbon bond fund in mainland China and Taiwan. To promote client engagement, we launched a Business Plan for the Planet campaign globally, to help businesses transition to a sustainable model, and published a guide to net zero for companies in the UK.
How we do business
We conduct our business intent on opening up opportunities to ensure the sustained success of our customers, people and other stakeholders.
Our approach
Our purpose, ‘Opening up a world of opportunity’, explains why we exist and guides us in what we do every day. In the first half of 2021, we encouraged all our colleagues to explore what ‘Opening up a world of opportunity’ meant to them personally and how it can help us collectively contribute to delivering our strategy.
Our refreshed values define the principles that guide our individual and organisational behaviours. They influence the way we work together and the choices we make. We are embedding the values throughout our organisation, and our leaders and colleagues are regularly encouraged to reflect on what our values mean in day-to-day actions and decisions. This was most clearly demonstrated when many of our colleagues in India volunteered their own time to support each other and their families during the second wave of the Covid-19 pandemic in India (see below).
We recognise the important role we play in ‘Opening up a world of opportunity’ for our customers, investors, our people and communities, and in building a more sustainable, inclusive world.
Fair outcomes
We continued to promote and encourage good conduct through our people's behaviour and the decisions that we take. We also launched our simplified conduct approach to align to the Group’s new purpose and values, in particular the value ‘We take responsibility’. Our new conduct approach encourages colleagues to recognise the impact each of us has on our customers and the financial markets in which we operate, and sets out a number of conduct outcomes to be achieved. As we implement our new approach during 2021, we will continue to enhance our existing policies, frameworks and governance approach. Further details on our conduct approach are available at www.hsbc.com/who-we-are/esg-and-responsible-business/our-conduct.
Bringing together diverse people, ideas and perspectives helps us open up opportunities and build a more inclusive company. We are working to accelerate the development and progression of women and ethnically diverse employees into more senior roles. We are progressing well against our aspirational target of 35% women in senior leadership roles by 2025. We are also building the foundations that will help enable us to accelerate towards our goal to at least double the number of Black senior leaders globally by 2025. In early 2021, we made it possible for 91% of our global workforce to be able to declare their ethnicity in our HR information system. We are now using this data to uncover areas of largest opportunity.
Our climate ambition
The Board provided further details on our ambition to become a net zero bank with a special resolution on climate change at our Annual General Meeting (‘AGM’) in May, which was approved by 99.7% of shareholders. The resolution commits the Group to set, disclose and implement a strategy with short- and medium-term targets to align its provision of finance across all sectors, starting in 2021 with oil and gas, and power and utilities, with the goals and timelines of the Paris Agreement. We also committed to publish and implement a policy to phase out the financing of coal-fired power and thermal coal mining by 2030 in EU and OECD countries, and by 2040 in other markets. For the purposes of the resolution, ‘finance’ and ‘financing’ means providing project finance or direct lending to, or underwriting capital markets transactions for, corporate clients of our Global Banking and Commercial Banking businesses. Our progress against our commitments will be reported annually, including a summary of the methodology, scenarios and core assumptions used.
We recognise the critical need for industry collaboration to accelerate climate action and lower global emissions. As part of our efforts, the Group Chief Executive, Noel Quinn, chairs the Financial Services Task Force (‘FSTF’), part of HRH The Prince of Wales’ Sustainable Markets Initiative. The FSTF brings together 11 of the world’s largest banks to amplify and accelerate action on climate-related initiatives.
We became a founding signatory of the Net-Zero Banking Alliance, convened by the United Nations Environment Programme Finance Initiative and co-launched by the FSTF. The members of the alliance are committed to aligning their lending and investment portfolios with net zero emissions by 2050, and setting an intermediate target for 2030 or sooner using robust, science-based guidelines. Net-Zero Banking Alliance is a member alliance of the Glasgow Financial Alliance for Net Zero, which combines the leading initiatives across the financial system to accelerate the transition to net zero emissions by 2050. We also joined the Partnership for Carbon Accounting Financials to help us measure our financed emissions and provide transparent and comparable disclosures.
Living our values – We succeed together
We set up a Covid-19 taskforce to help colleagues and their families who needed critical support during the second wave of the pandemic in India. Many colleagues volunteered, using the collective energy of our network to assist a wider group of people in this time of crisis. The taskforce provided 24/7 support and worked in collaboration with partners to mobilise resources to provide hospital beds, oxygen and medicines. Our offices were set up to manage vaccination drives for employees and their families. The volunteers played a critical role, providing moral support and counsel to colleagues during a period of anxiety and national emergency. In addition to the actions of our people, we pledged financial assistance of around $10m for the ongoing Covid-19 relief efforts in India.
Delivering for our stakeholders
Having a clear purpose and strong values has never been more important, with the pandemic testing us all in ways we could never have anticipated. As the world changed over the course of the past 18 months, we adapted to new ways of working and endeavoured to provide support to our customers during this challenging period.
We recognise that the world is at different stages of the pandemic, with some countries going through a peak while others are on a trajectory to recovery. We look to support our stakeholders, taking this into account.
In the adjacent table, we set out how we have supported our stakeholders – our customers, employees, investors, communities, governments and regulators, and suppliers – during the first half of 2021.
| | | | | |
| |
| Customers | •Our provision of financial relief to our customers to support them during the pandemic reduced during the first half of 2021, as forbearance programmes began to come to an end (for further details of our customer relief programmes, see page 75). We have put a contact and communications strategy in place in all of our markets to engage with customers to help them understand and decide on their options following the expiry of their Covid-19 relief measures.
•We remain committed to removing barriers to financial services to help more people access opportunities. In the UK, we launched a campaign to raise awareness of our No Fixed Address service, which offers financial support to those who are homeless, in partnership with the charity Shelter. In Hong Kong, we launched basic banking services for ethnic minority groups who do not understand English or Chinese. |
|
| Employees | •Our most recent all-employee survey in June showed employee engagement decreased slightly after significant gains in 2020, but remained above 2019 levels. We have continued to see a rise in fatigue and anxiety among employees and in response, provided a variety of well-being resources including mindfulness training. We continued to monitor our colleagues’ preferences for returning to office and branch locations, including increasing support for a more flexible, hybrid approach in the future. •We continue to focus on managing change well for our people, providing targeted career transition support and a service through which in 1H21 we redeployed approximately 25% of employees who were impacted by our business change programme.
•In support of our programme to build skills for the future, our learning experience platform is now live to more than 70,000 employees and we have launched a trial of our Talent Marketplace for 10,300 employees in India, with plans to grow both. |
|
| Investors | •We continue to engage investors virtually, but will endeavour to accommodate in-person meetings once it is safe to do so. In May, we were able to offer a hybrid AGM, with both in-person and virtual attendees. •We were encouraged by the constructive engagement with ShareAction, the Investor Forum and our institutional shareholders, to help develop our AGM resolution on climate change, and we were extremely pleased that 99.7% of our shareholders voted in favour of the climate change resolution. •We were also pleased to reinstate the $0.15 interim dividend for 2020, paid in April 2021. We acknowledge that dividends are important to all of our shareholders, and announced an updated dividend policy based on a payout ratio approach in February 2021. Reflecting the current improved economic outlook and operating environment in many of our markets, we now intend to transition towards a target payout ratio of between 40% and 55% of our reported earnings per share from 2021 onwards while retaining the flexibility to adjust for non-cash significant items. Should we achieve our targets, the dividend is expected to progressively increase over the coming years, in line with growth in our earnings per share. The Board has announced an interim dividend for the first half of 2021 of $0.07 per ordinary share. |
|
| Communities | •During 2021 we announced a donation of $10m towards Covid-19 relief efforts in India, as well as $1.5m to UNICEF supporting work to deliver vaccines to countries on behalf of the Covax facility. This is in addition to the $25m that we donated to support relief and recovery efforts around the world during 2020. |
|
| Governments and regulators | •We continue to work closely with governments in our major markets to ensure a sustainable economic recovery. We have participated in a number of government-backed Covid-19 support schemes, providing vital funds to businesses and households affected by the pandemic. We have also provided support to governments seeking to raise revenue through bond issuance programmes. We continue to engage with our regulators regarding their supervisory and policy objectives. |
|
| Suppliers | •We invited companies representing 60% of our total spend on suppliers to participate in the CDP (formerly the Carbon Disclosure Project) supply chain programme, which helps to improve our understanding of their carbon emissions and zero carbon ambitions. |
|
Financial overview
In assessing the Group’s financial performance, management uses a range of financial measures that focus on the delivery of sustainable returns for our shareholders and maintaining our financial strength.
Executive summary
Performance in the first half of 2021 benefited from the improved economic outlook and resultant release in ECL allowances, which significantly improved our profitability. While the low interest-rate environment continued to impact revenue, net interest margin remained broadly stable in the last quarter and we are starting to see the positive impact of our strategy.
Reported profit before tax of $10.8bn increased by $6.5bn compared with 1H20, and our annualised return on average tangible equity (‘RoTE’) for 1H21 was 9.4%, compared with 3.8% in 1H20. The increase in reported profit was driven by a net release of reported ECL and included the non-recurrence of a $1.2bn impairment of capitalised software in 1H20. Reported revenue fell, reflecting the full impact of 2020 interest rate reductions, as well as lower revenue in GBM, notably in Markets and Securities Services (‘MSS’), relative to a strong 1H20. Adjusted profit before tax of $12.0bn increased by $6.3bn.
In 1H21, all of our regions were profitable. Despite the impact of lower global interest rates, our operations in Asia continued to deliver a strong performance. In addition, there was a material recovery in profitability in all other regions, primarily reflecting a net release in ECL following the improved economic outlook.
The Group maintained its strong capital position, with a CET1 ratio of 15.6% at 30 June 2021, and continued to grow both lending and deposit balances. In respect of 1H21, the Board has announced an interim dividend of $0.07 per ordinary share.
Delivery against Group financial targets
Return on average tangible equity (%) <>
9.4%
(1H20: 3.8%)
In February 2021, we updated our reported annualised RoTE target following the significant changes to the operating environment in 2020. The Group is now targeting a RoTE of greater than or equal to 10% in the medium term.
In 1H21, we achieved a RoTE (annualised) of 9.4%, compared with 3.8% in 1H20. The improvement in RoTE was driven by the favourable impact of lower ECL.
Adjusted operating expenses <>
$16.2bn
(1H20: $15.7bn)
The Group is targeting an adjusted cost base of $31bn or less in 2022 (based on average December 2020 rates of foreign exchange, or $31.5bn based on average June 2021 rates). In 1H21, adjusted operating expenses were $16.2bn, an increase of 3% compared with 1H20, primarily due to a higher performance-related pay accrual.
Our cost reduction programme is on track to deliver cost saves of between $5bn and $5.5bn in the period from 2020 to 2022 and expect to spend around $7bn in costs to achieve.
Cumulatively, our cost programmes have generated savings of $2.0bn, with costs to achieve of $2.7bn.
Gross RWA reductions
$84.5bn
In February 2020, we announced our intention to improve our return profile through a targeted gross RWA reduction of $100bn by 2022, mainly in low-returning parts of the Group. During 1H21, we updated the list of clients we are remediating and also implemented other methodology changes to better align the tracking and reporting of reductions to how the RWA reduction programme is managed. In line with these changes, we have also increased our gross RWA reduction target to $110bn by 2022. We intend to update executive scorecards accordingly.
At 30 June 2021, the Group had delivered cumulative gross RWA reductions of $84.5bn, including accelerated saves of $9.6bn made in 2019.
Capital and dividends
We intend to maintain a CET1 ratio in excess of 14%, managing in the range of 14% to 14.5% in the medium term. We will seek to manage this range down in the longer term.
At 30 June 2021, our CET1 ratio was 15.6%, down 0.3 percentage points from 31 December 2020. This reflected an increase in RWAs from lending growth and a decrease in CET1 capital, including the impact of foreseeable dividends on ordinary shares of $3.5bn. This dividend accrual, equal to 47.5% of 1H21 basic earnings per ordinary share (‘EPS’) of $0.36, is not a forecast and represents the mid-point of our target payout ratio of 40% to 55% of reported EPS. The Group’s strong capital position means it is well placed to fund growth and step up capital returns. Our dividend policy aims to deliver sustainable cash dividends, while retaining the flexibility to invest and grow the business in the future, supplemented by additional shareholder distributions, if appropriate. Reflecting the current improved economic outlook and operating environment in many of our markets, we now expect to move to within our target payout ratio in 2021. In line with our dividend policy, we will retain the flexibility to adjust EPS for non-cash significant items. Additionally, in 2022, we intend to adjust EPS to exclude the forecast loss on the sale of our retail banking operations in France.
The Board has announced an interim dividend for 1H21 of $0.07 per ordinary share, to be paid in cash with no scrip alternative.
CET1 ratio
15.6%
Interim dividend per ordinary share for 1H21
$0.07
*Medium term is three to four years; long term is five to six years.
Reported results
| | | | | | | | | | | | | | | | | | | | |
| Half-year to | Quarter ended |
| Reported results | 30 Jun 2021 $m | 30 Jun 2020 $m | 31 Dec 2020 $m | 30 Jun 2021 $m | 30 Jun 2020 $m | 31 Mar 2021 $m |
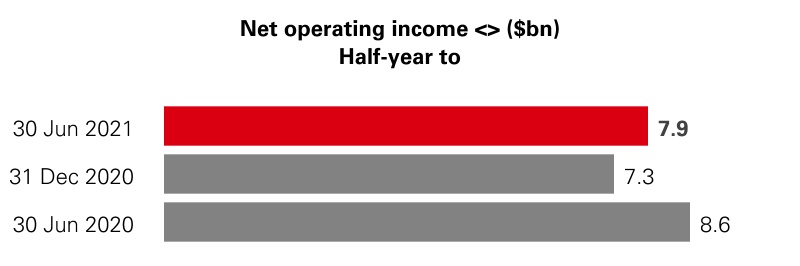
| Net operating income before change in expected credit losses and other credit impairment charges (‘revenue’) | 25,551 | | 26,745 | | 23,684 | | 12,565 | | 13,059 | | 12,986 | |
| ECL | 719 | | (6,858) | | (1,959) | | 284 | | (3,832) | | 435 | |
| Net operating income | 26,270 | | 19,887 | | 21,725 | | 12,849 | | 9,227 | | 13,421 | |
| Total operating expenses | (17,087) | | (16,527) | | (17,905) | | (8,560) | | (8,675) | | (8,527) | |
| Operating profit/(loss) | 9,183 | | 3,360 | | 3,820 | | 4,289 | | 552 | | 4,894 | |
| Share of profit in associates and joint ventures | 1,656 | | 958 | | 639 | | 771 | | 537 | | 885 | |
| Profit before tax | 10,839 | | 4,318 | | 4,459 | | 5,060 | | 1,089 | | 5,779 | |
| Tax expense | (2,417) | | (1,193) | | (1,485) | | (1,206) | | (472) | | (1,211) | |
| Profit/(loss) after tax | 8,422 | | 3,125 | | 2,974 | | 3,854 | | 617 | | 4,568 | |
Reported performance - 1H21 vs 1H20
Reported profit
Reported profit after tax of $8.4bn in 1H21 was $5.3bn higher than in 1H20.
Reported profit before tax of $10.8bn was $6.5bn higher than in 1H20. Reported revenue fell, reflecting the continued impact of lower global interest rates and a decline in revenue in GBM’s MSS business following lower market volatility and client activity in 1H21, compared with a notably strong 1H20. These decreases were partly offset by the favourable impact on certain volatile items in WPB and GBM.
The reduction in reported revenue was more than offset by a net release of reported ECL in 1H21 due to an improvement in the forward economic outlook, notably in the UK, compared with the significant build-up of stage 1 and stage 2 allowances in 1H20. In addition, our reported share of profit from associates and joint ventures in Corporate Centre increased. Reported operating expenses increased, primarily from a higher performance-related pay accrual, continued investment in our digital capabilities and higher restructuring and other related costs, which more than offset a reduction due to the non-recurrence of a 1H20 impairment of $1.2bn of capitalised software related principally to businesses within HSBC Bank plc.
In 1H21, all of our regions were profitable. Despite the impact of lower global interest rates, our Asia business continued to deliver a strong performance. In addition, there was a material recovery in profitability in all other regions, primarily reflecting a net release in ECL as the economic outlook improved, notably in HSBC UK Bank plc, where reported profit before tax increased to over $2.1bn.
The net favourable mark-to-market movements on certain volatile items discussed above resulted from the following:
•In WPB, favourable market impacts in life insurance manufacturing of $413m compared with adverse movements in 1H20 of $334m.
•In GBM, MSS included favourable credit and funding valuation adjustments of $35m (1H20: $355m adverse). In Principal Investments, valuation gains of $237m compared with losses of $12m in 1H20.
These were partly offset:
•In Corporate Centre, 1H21 included adverse fair value movements on our long-term debt and associated swaps of $54m (1H20: $195m favourable).
IFRS 17 ‘Insurance Contracts’ sets the requirements that an entity should apply in accounting for insurance contracts it issues and reinsurance contracts it holds. IFRS 17 is effective from 1 January 2023 and could have a significant impact on the revenue of our insurance business. For further details, see ‘Future accounting developments’ on page 289 of the Annual Report and Accounts 2020.
Reported revenue
Reported revenue of $25.6bn was $1.2bn or 4% lower than in 1H20. The reduction primarily reflected a fall in net interest income as a result of the impact of lower global interest rates, notably affecting our deposit franchises in WPB and in Global Liquidity and Cash Management ('GLCM') in CMB and GBM. While we grew average interest-earning assets, interest-bearing liabilities also increased, resulting in continued downward pressure on NIM. In GBM’s MSS business, revenue decreased in Global Foreign Exchange and Global Debt Markets, as trading volatility and client activity in 1H21 was lower, although activity increased in Equities and Securities Services. There were also favourable movements in credit and funding valuation adjustments.
The reduction in revenue was partly offset by favourable market impacts in life insurance manufacturing, which compared with adverse movements in 1H20, as discussed above. GBM revenue also benefited from valuation gains in Principal Investments, compared with small losses in 1H20.
The reduction in reported revenue also included adverse fair value movements on financial instruments of $0.5bn, which were more than offset by favourable foreign currency translation differences of $1.1bn.
Reported ECL
Reported ECL were a net release of $0.7bn in 1H21, compared with a charge of $6.9bn in 1H20. The net release in 1H21 reflected an improvement in the economic outlook, notably in the UK. This compared with the significant build-up of stage 1 and stage 2 allowances in 1H20 due to the worsening economic outlook at the onset of the Covid-19 outbreak. The reduction in ECL also reflected low levels of stage 3 charges, as well as the non-recurrence of a significant charge in 1H20 related to a corporate exposure in Singapore.
Given current consensus economics and default experience, ECL charges for 2021 are expected to be materially lower than our medium-term range of 30bps to 40bps of average loans and possibly a net release for the year. Uncertainty remains as countries emerge from the pandemic at different speeds, government support measures unwind and new virus strains test the efficacy of vaccination programmes.
For further details on the calculation of ECL, including the measurement uncertainties and significant judgements applied to such calculations, the impact of alternative/additional scenarios and post-model adjustments, see pages 63 to 71.
Reported operating expenses
Reported operating expenses of $17.1bn were $0.6bn or 3% higher than in 1H20. This primarily reflected higher performance-related pay of $0.9bn, which is accrued based on the profile of our expected profit performance. In addition, investment in technology, including investments in our digital capabilities, increased by $0.3bn. Our Asia wealth investment also rose by $0.1bn. These increases were partly offset by a $0.9bn impact of our cost-saving initiatives.
The increase in reported operating expenses also included adverse foreign currency translation differences of $0.9bn and an increase in restructuring and other related costs of $0.3bn, of which $0.1bn related to severance payments. However, these items were broadly offset by the non-recurrence of a $1.2bn impairment of intangible assets in Europe in 1H20, of which $0.2bn was within restructuring and other related costs.
Reported share of profit in associates and joint ventures
Reported share of profit in associates of $1.7bn was $0.7bn or 73% higher, primarily reflecting an increased share of profit from Bank of Communications Co., Limited ('BoCom'), a recovery in asset valuations of a UK associate relative to 1H20, and a higher share of profit from The Saudi British Bank (‘SABB’).
In relation to BoCom, we continue to be subject to a risk of impairment in the carrying value of our investment. For further details of our impairment review process, see Note 10 on the interim condensed financial statements.
Tax expense
The effective tax rate for 1H21 of 22.3% was lower than the 27.6% for 1H20. The effective tax rate for 1H21 was increased due to the impact of substantively enacted legislation to increase the UK statutory tax rate from 1 April 2023. The 1H20 effective tax rate was high, due mainly to the non-recognition of deferred tax on losses in the UK.
Reported performance - 2Q21 vs 2Q20
Reported profit
Reported profit after tax of $3.9bn in 2Q21 was $3.2bn higher than in 2Q20.
Reported profit before tax of $5.1bn was $4.0bn higher. This rise reflected a net release of reported ECL provisions and included the non-recurrence of a $1.2bn impairment in 2Q20 of capitalised software intangibles in Europe. These factors were partly offset by lower reported revenue.
Reported revenue of $12.6bn was $0.5bn or 4% lower, driven by a decrease in GBM, notably in MSS, reflecting lower market volatility and client activity compared with a strong 2Q20, and a fall in Principal Investments revenue due to the non-recurrence of revaluation gains recognised in 2Q20. These were compounded by the impact of interest rate reductions adversely affecting our deposit franchises within WPB and in the GLCM business in CMB and GBM.
ECL were a net release of $0.3bn, which compared with a charge of $3.8bn in 2Q20, as the significant build-up of stage 1 and stage 2 allowances in 2Q20 due to the worsening economic outlook at the onset of the Covid-19 outbreak was partially released in 2Q21. In addition, there were low levels of stage 3 charges during 2Q21.
Reported operating expenses of $8.6bn were $0.1bn or 1% lower, reflecting the non-recurrence of a $1.2bn impairment of software intangibles in Europe in 2Q20. This was partly offset by higher performance-related pay and continued investment in technology, and included adverse foreign currency translation differences of $0.6bn.
Reported share of profit in associates and joint ventures increased by $0.2bn, primarily reflecting an increased share of profit from SABB.
Adjusted results
Our reported results are prepared in accordance with International Financial Reporting Standards (‘IFRSs’) as detailed in the notes on the interim condensed financial statements on page 104.
We also present alternative performance measures (non-GAAP financial measures). These include adjusted performance, which we use to align internal and external reporting, identify and quantify items management believes to be significant, and provide insight into how management assesses period-on-period performance. Alternative performance measures are highlighted with the following symbol: <>
To derive adjusted performance, we adjust for:
- the period-on-period effects of foreign currency translation differences; and
- the effect of significant items that distort period-on-period comparisons, which are excluded to improve understanding of the underlying trends in the business.
The results of our global businesses are presented on an adjusted basis, which is consistent with how we manage and assess global business performance.
For reconciliations of our reported results to an adjusted basis, including lists of significant items, see page 35. Definitions and calculation of other alternative performance measures are included in our ‘Reconciliation of alternative performance measures’ on page 52.
| | | | | | | | | | | | | | | | | | | | |
Adjusted results <> | Half-year to | | 1H21 vs 1H20 |
30 Jun 2021
$m | 30 Jun 2020
$m | 31 Dec 2020
$m | | $m | % |
| Revenue | 25,797 | | 27,597 | | 24,523 | | | (1,800) | | (7) | |
| ECL | 719 | | (7,287) | | (2,031) | | | 8,006 | | >100 |
| Total operating expenses | (16,222) | | (15,705) | | (16,951) | | | (517) | | (3) | |
| Operating profit | 10,294 | | 4,605 | | 5,541 | | | 5,689 | | >100 |
| Share of profit in associates and joint ventures | 1,656 | | 1,049 | | 1,139 | | | 607 | | 58 | |
| Profit before tax | 11,950 | | 5,654 | | 6,680 | | | 6,296 | | >100 |
Adjusted performance - 1H21 vs 1H20
Adjusted profit before tax <>
Adjusted profit before tax of $12.0bn was $6.3bn higher than in 1H20.
Adjusted revenue fell, mainly reflecting the continued impact of lower global interest rates and a reduction in MSS revenue in GBM from lower market volatility and client activity, despite the favourable impact of certain volatile items in WPB and GBM. However, this decrease was more than offset by a net release of adjusted ECL in 1H21 due to an improvement in the economic outlook, notably in the UK, compared with the significant build-up of stage 1 and stage 2 allowances in 1H20. Adjusted operating expenses were higher, while our share of profit from associates and joint ventures increased.
Reconciliation of reported to adjusted profit before tax
| | | | | | | | | | | |
| Half-year to |
30 Jun 2021
$m | 30 Jun 2020
$m | 31 Dec 2020 $m |
| Reported profit before tax | 10,839 | | 4,318 | | 4,459 | |
| Currency translation | — | | (108) | | 125 | |
| Significant items: | 1,111 | | 1,444 | | 2,096 | |
| | | |
| – customer redress programmes (total) | (1) | | 24 | | (57) | |
| – disposals, acquisitions and investment in new businesses (total) | — | | 8 | | 2 | |
| – fair value movements on financial instruments | 194 | | (299) | | 35 | |
| – impairment of goodwill and other intangible assets | — | | 1,025 | | 65 | |
| – restructuring and other related costs (total) | 918 | | 554 | | 1,524 | |
| – settlements and provisions in connection with legal and regulatory matters | — | | 5 | | 7 | |
| – past service costs of guaranteed minimum pension benefits equalisation | — | | — | | 17 | |
| – goodwill impairment (share of profit in associates and joint ventures) | — | | — | | 462 | |
| – currency translation on significant items | — | | 127 | | 41 | |
| Adjusted profit before tax | 11,950 | | 5,654 | | 6,680 | |
Adjusted revenue <>
Adjusted revenue of $25.8bn was $1.8bn or 7% lower than in 1H20. The reduction was primarily in net interest income due to the impact of lower global interest rates, mainly affecting our deposit franchises within WPB and in GLCM in CMB and GBM. In GBM’s MSS business, revenue decreased in Global Foreign Exchange and Global Debt Markets, reflecting lower market volatility and client activity, although activity increased in Equities and Securities Services. In addition, there was a net favourable movement in credit and funding valuation adjustments of $411m. These decreases were in part mitigated by net favourable movements in market impacts in life insurance manufacturing in WPB of $764m. In addition, GBM adjusted revenue benefited from favourable revaluations in Principal Investments, compared with losses in 1H20.
Adjusted ECL <>
Adjusted ECL, which removes the period-on-period effects of foreign currency translation differences, were a net release of $0.7bn compared with a charge of $7.3bn in 1H20. These reflected releases as a result of an improvement in the economic outlook, notably in the UK. This compared with the significant build-up of stage 1 and stage 2 allowances in 1H20 due to the worsening economic outlook at the onset of the Covid-19 outbreak. The reduction in ECL also reflected low levels of stage 3 charges in 1H21, as well as the non-recurrence of a significant charge in 1H20 related to a corporate exposure in Singapore.
Adjusted operating expenses <>
Adjusted operating expenses of $16.2bn were $0.5bn or 3% higher than in 1H20. This primarily reflected higher performance-related pay of $0.9bn, which is accrued based on the profile of our expected profit performance. In addition, investment in technology, including investments in our digital capabilities, increased by $0.3bn. Our Asia wealth investment also rose by $0.1bn. These increases were partly offset by a $0.9bn impact of our cost-saving initiatives.
We expect adjusted operating expenses for 2021 to be broadly in line with 2020, excluding the benefit from a reduced bank levy. This remains subject to final decisions on performance-related pay, which will primarily reflect the performance of the Group.
The number of employees expressed in full-time equivalent staff (‘FTE’) at 30 June 2021 was 222,550, a decrease of 3,509 compared with 31 December 2020. The number of contractors at 30 June 2021 was 7,401, an increase of 1,709, primarily reflecting increases associated with our growth and transformation initiatives.
Adjusted share of profit in associates and joint ventures<>
Adjusted share of profit from associates and joint ventures of $1.7bn was $0.6bn or 58% higher than in 1H20, including an increased share of profit from BoCom, a recovery in asset valuations of a UK associate relative to 1H20, and a higher share of profit from SABB.
Balance sheet and capital
Balance sheet strength
Total assets of $3.0tn were broadly in line with 31 December 2020. Cash balances increased as we redeployed our commercial surplus and as customer accounts rose, which was largely offset by adverse revaluation movements on derivative assets.
Loans and advances to customers of $1.1tn were $22bn higher, or $23bn on a constant currency basis, as customers used short-term borrowing to fund investments in initial public offerings, as well as from higher mortgage balances in the UK and Hong Kong. Customer accounts of $1.7tn increased by $26bn, or $27bn on a constant currency basis, from reduced customer spending.
Distributable reserves
The distributable reserves of HSBC Holdings at 30 June 2021 were $31.6bn, compared with $31.3bn at 31 December 2020. The increase was primarily driven by profits generated of $4.2bn net of ordinary dividend and additional tier 1 coupon payments of $3.7bn.
Capital position
We actively manage the Group’s capital position to support our business strategy and meet our regulatory requirements at all times, including under stress, while optimising our capital efficiency. To do this, we monitor our capital position using a number of measures. These include our capital ratios, the impact on our capital ratios as a result of stress, and the degree of double leverage being run by HSBC Holdings. Double leverage is a constraint on managing our capital position, given the complexity of the Group’s subsidiary structure and the multiple regulatory regimes under which we operate. For further details, see page 87.
Our CET1 ratio at 30 June 2021 was 15.6%, down from 15.9% at 31 December 2020, reflecting an increase in RWAs from lending growth and a decrease in CET1 capital including the impact of foreseeable dividends.
Liquidity position
We actively manage the Group’s liquidity and funding to support our business strategy and meet regulatory requirements at all times, including under stress. To do this, we monitor our position using a number of risk appetite measures, including the liquidity coverage ratio (‘LCR’) and the net stable funding ratio. During 1H21, we revised our approach to calculate the Group’s LCR to reflect the requirements of the EC Delegated Act. At 30 June 2021, the Group’s LCR was 134% and we held high-quality liquid assets of $659bn. For further details, see page 92.
Wealth and Personal Banking
Contribution to Group 1H21 adjusted profit before tax<>
| | |
| % contribution to Group |
| 32 | % |
WPB customer deposits, lending and wealth sales increased in 1H21, as markets began to emerge from the pandemic. We continued to support customers through payment holidays, short-term credit facilities and access to cash. Performance in 1H21 was favourably impacted by a release of ECL provisions and strong wealth sales in Asia, although revenue was affected by the impact of lower interest rates, despite strong balance sheet growth. Aligned with our strategy, we continued investing in our digital capabilities and people to expand our Wealth franchise in Asia, and address our customers’ international needs.
We serve more than 39 million customers across the full spectrum from retail customers to ultra high net worth individuals and their families.
We offer locally-tailored products and services across multiple channels for our customers’ everyday banking needs, as well as insurance, investment management, advisory and wealth solutions for those with more sophisticated requirements. Our global presence provides for customers with international needs.
| | | | | | | | | | | | | | | | | | | | |
| Adjusted results <> | Half-year to | | 1H21 vs 1H20 |
30 Jun 2021 $m | 30 Jun 2020 $m | 31 Dec 2020 $m | | $m | % |
| Net operating income | 11,401 | | 11,694 | | 11,019 | | | (293) | | (3) | |
| ECL | 52 | | (2,328) | | (685) | | | 2,380 | | >100 |
| Operating expenses | (7,600) | | (7,695) | | (7,871) | | | 95 | | 1 | |
| Share of profit in associates and JVs | 11 | | (8) | | 15 | | | 19 | | >100 |
| Profit before tax | 3,864 | | 1,663 | | 2,478 | | | 2,201 | | >100 |
| RoTE excluding significant items (annualised, YTD) (%) | 17.9 | | 6.0 | | 9.1 | | | | |
During the first half of 2021, we announced the potential sale of our retail banking business in France, as well as the exit of domestic mass market retail banking in the US, including our Personal and Advance propositions and retail business banking. In 1H21, the reported and adjusted profit before tax contributions of these businesses to the WPB segment was not significant.
•In 1H21, our retail banking business in France contributed approximately 2% of WPB reported and adjusted revenue and approximately 35% of France WPB reported and adjusted revenue of $618m. At 30 June 2021, this business had loans and advances to customers of $25.6bn (31 December 2020: $25.5bn), customer accounts of $23.5bn (31 December 2020: $22.4bn) and RWAs of $7bn (31 December 2020: $7bn).
•In 1H21, we entered into sale agreements with Citizens Bank and Cathay Bank in the US. The proposed transaction contributed approximately 1% of WPB reported and adjusted revenue and approximately 15% of US WPB reported and adjusted revenue. At 30 June 2021, these elements had loans and advances to customers of $2.6bn (31 December 2020: $3bn), customer accounts of $9.9bn (31 December 2020: $10bn) and RWAs of approximately $1bn (31 December 2020: approximately $1bn) relating to them. At 30 June 2021, the loans and advances to customers and customer accounts were classified as held for sale and reported on the Group’s balance sheet as ‘other assets’ and ‘other liabilities’.
| | | | | | | | | | | | | | | | | | | | |
Management view of adjusted revenue1 <> | Half-year to | | 1H21 vs 1H20 |
30 Jun 2021
$m | 30 Jun
2020
$m | 31 Dec
2020
$m | | $m | % |
| Wealth | 4,822 | | 3,700 | | 4,268 | | | 1,122 | | 30 | |
| – investment distribution | 1,851 | | 1,638 | | 1,628 | | | 213 | | 13 | |
| – life insurance manufacturing | 1,439 | | 583 | | 1,237 | | | 856 | | >100% |
| – Global Private Banking | 935 | | 960 | | 840 | | | (25) | | (3) | |
| net interest income | 320 | | 388 | | 303 | | | (68) | | (18) | |
| non-interest income | 615 | | 572 | | 537 | | | 43 | | 8 | |
| – asset management | 597 | | 519 | | 563 | | | 78 | | 15 | |
| Personal Banking | 6,144 | | 7,195 | | 6,229 | | | (1,051) | | (15) | |
| – net interest income | 5,456 | | 6,577 | | 5,577 | | | (1,121) | | (17) | |
| – non-interest income | 688 | | 618 | | 652 | | | 70 | | 11 | |
Other2 | 435 | | 799 | | 522 | | | (364) | | (46) | |
Net operating income3 | 11,401 | | 11,694 | | 11,019 | | | (293) | | (3) | |
1 With effect from the first quarter of 2021, certain items within the management view of adjusted revenue have been renamed. 'Wealth Management' has been renamed 'Wealth' and 'Retail Banking' has been renamed 'Personal Banking'.
2 ‘Other’ includes Markets Treasury, HSBC Holdings interest expense and Argentina hyperinflation. It also includes the distribution and manufacturing (where applicable) of retail and credit protection insurance, disposal gains and other non-product specific income.
3 ‘Net operating income’ means net operating income before change in expected credit losses and other credit impairment charges (also referred to as ‘revenue’).
Financial performance
Adjusted profit before tax of $3.9bn in 1H21 was $2.2bn higher than in 1H20. This reflected a release of adjusted ECL in 1H21 as the economic outlook improved, compared with the significant build-up of allowances in 1H20. The impact of lower global interest rates resulted in a decrease in net interest income, which was largely offset by an increase in Wealth revenue due to a net favourable movement of $764m in market impacts in insurance and growth in investment distribution.
Adjusted revenue of $11.4bn was $0.3bn or 3% lower.
In Personal Banking, revenue of $6.1bn was down $1.1bn or 15%.
•Net interest income was $1.1bn lower due to narrower margins as global interest rates fell in 2020 as a result of the Covid-19 outbreak. This reduction was partly mitigated by deposit balance growth of $32bn or 4%, mainly in the UK and Hong Kong, and higher mortgage lending of $24bn or 7%, particularly in the UK.
•Non-interest income increased by $70m or 11%, reflecting growth from mortgages in the UK and Hong Kong, partly offset by lower income on unarranged overdrafts. Since March 2020, we moved from charging fees on unarranged overdrafts to an interest-based charging model, consistent with market practice.
In Wealth, net revenue of $4.8bn was up $1.1bn or 30%.
•In life insurance manufacturing, revenue was $0.9bn higher, which included a net favourable movement in market impacts of $764m. In 1H21, there was a favourable movement of $413m, compared with an adverse movement in 1H20 of $351m, as equity markets performance continued to improve after the sharp fall in March 2020. The value of new business written was $0.1bn higher, as we broadened how we engage with customers, including through our improved digital capabilities, to mitigate the ongoing impact of the Covid-19 pandemic.
•Investment distribution revenue was $0.2bn or 13% higher, reflecting strong equity market conditions in Hong Kong, which resulted in higher mutual fund sales and growth in brokerage fees as transaction volumes increased.
•In Global Private Banking, revenue was $25m or 3% lower, as net interest income fell by $68m or 18% as a result of the impact of lower global interest rates. This was partly offset by growth in non-interest income of $43m or 8%, as investment revenue increased, reflecting higher fees from advisory and discretionary mandates and increased market volatility.
Adjusted ECL were a net release of $0.1bn, compared with a charge of $2.3bn in 1H20. ECL reflected releases in 1H21 as the economic outlook improved. This compared with the significant build-up of allowances in 1H20 as a result of the Covid-19 outbreak.
Adjusted operating expenses of $7.6bn were $0.1bn or 1% lower, as the benefits of our cost-saving initiatives funded our continued investment in Wealth in Asia and offset a higher performance-related pay accrual.
Divisional highlights
$1.7tn
WPB wealth balances at 30 June 2021. This was an 18% year-on-year increase, and a 5% increase from 31 December 2020.
$24bn
Growth in mortgage book, notably in the UK (up 9%) and Hong Kong (up 6%) since 30 June 2020.
Adjusted profit before tax <>
($bn)
$3.9bn
Adjusted net operating income <>
($bn)
$11.4bn
Commercial Banking
Contribution to Group 1H21 adjusted profit before tax<>
| | |
| % contribution to Group |
| 28 | % |
CMB supported our customers’ liquidity and working capital needs, growing lending and deposit balances, while our ongoing investment in technology has helped enable us to support customers under exceptionally challenging conditions. Performance in 1H21 was favourably impacted by the release of ECL provisions, partly offset by the impact of lower interest rates globally on revenue.
We support approximately 1.3 million business customers in 53 countries and territories, ranging from small enterprises focused primarily on their domestic markets to large companies operating globally.
We help entrepreneurial businesses grow by supporting their financial needs, facilitating cross-border trade and payment services, and providing access to products and services offered by other global businesses.
| | | | | | | | | | | | | | | | | | | | |
| Adjusted results <> | Half-year to | | 1H21 vs 1H20 |
30 Jun 2021 $m | 30 Jun 2020 $m | 31 Dec 2020 $m | | $m | % |
| Net operating income | 6,651 | | 7,326 | | 6,489 | | | (675) | | (9) | |
| ECL | 249 | | (3,751) | | (1,265) | | | 4,000 | | >100 |
| Operating expenses | (3,525) | | (3,457) | | (3,491) | | | (68) | | (2) | |
| Share of profit in associates and JVs | 1 | | — | | (1) | | | 1 | | — | |
| Profit before tax | 3,376 | | 118 | | 1,732 | | | 3,258 | | >100 |
| RoTE excluding significant items (annualised, YTD) (%) | 11.1 | | (1.6) | | 1.3 | | | | |
| | | | | | | | | | | | | | | | | | | | |
| Management view of adjusted revenue <> | Half-year to | | 1H21 vs 1H20 |
30 Jun 2021 $m | 30 Jun 2020 $m | 31 Dec 2020 $m | | $m | % |
Global Trade and Receivables Finance | 933 | | 925 | | 869 | | | 8 | | 1 | |
| Credit and Lending | 2,965 | | 2,885 | | 2,988 | | | 80 | | 3 | |
| Global Liquidity and Cash Management | 1,741 | | 2,411 | | 1,865 | | | (670) | | (28) | |
Markets products, Insurance and Investments, and Other1 | 1,012 | | 1,105 | | 767 | | | (93) | | (8) | |
| – of which: share of revenue from Markets and Securities Services and Banking products | 524 | | 492 | | 465 | | | 32 | | 7 | |
Net operating income2
| 6,651 | | 7,326 | | 6,489 | | | (675) | | (9) | |
1 Includes CMB's share of revenue from the sale of Markets and Securities Services and Banking products to CMB customers. GBM's share of revenue from the sale of these products to CMB customers is included within the corresponding lines of the GBM management view of adjusted revenue. Also includes allocated revenue from Markets Treasury, HSBC Holdings interest expense and Argentina hyperinflation.
2 ‘Net operating income’ means net operating income before change in expected credit losses and other credit impairment charges (also referred to as ‘revenue’).
Financial performance
Adjusted profit before tax of $3.4bn was $3.3bn higher than in 1H20. This reflected a release of adjusted ECL in 1H21 as the economic outlook improved, compared with 1H20 where we had a significant build-up of allowances, along with a notable charge related to a corporate exposure in Singapore. This was partly offset by a decline in adjusted revenue due to the impact of lower global interest rates.
Adjusted revenue of $6.7bn was $0.7bn or 9% lower.
•In GLCM, revenue decreased by $0.7bn or 28%, reflecting the impact of lower global interest rates, mainly in Hong Kong and the UK. This was partly offset by a 19% increase in average deposit balances, with growth particularly in the UK, Hong Kong and the US, as well as from a 5% increase in fee income.
•In Markets products, Insurance and Investments, and Other, revenue reduced by $93m or 8%, reflecting the impact of lower global interest rates on income earned on capital held in the business. This reduction was partly offset by higher collaboration revenue from GBM, in Markets and Capital Markets and Advisory.
These decreases were partly offset:
•In Credit and Lending, revenue increased by $80m or 3%, reflecting wider margins, notably in the UK, North America and Latin America, partly offset by lower average balances, as customers’ funding requirements fell in the second half of 2020 due to the Covid-19 restrictions. During 2021, balances grew in Asia, although this was partly offset by a reduction in Europe.
•In Global Trade and Receivables Finance, revenue was up by $8m or 1%, driven by a 5% growth in fee income across all regions from a recovery in global trade volumes during 2021, partly offset by lower average balances. However, during 2021 there was strong growth in lending balances in all regions, particularly in Asia.
Adjusted ECL were a net release of $0.2bn, compared with a charge of $3.8bn in 1H20. ECL in 1H21 included a release of stage 1 and stage 2 allowances as the economic outlook improved, notably in the UK. This compared with the significant build-up of allowances in 1H20 as a result of the adverse economic outlook due to the Covid-19 outbreak. The reduction in ECL also reflected minimal stage 3 charges in 1H21, compounded by a significant charge in 1Q20 related to a corporate exposure in Singapore.
Adjusted operating expenses of $3.5bn were $68m or 2% higher, primarily reflecting an increase in the performance-related pay accrual and continued investment in our digital and transactional banking capabilities. These increases were partly offset by continued cost discipline, and the impact of our cost-saving initiatives.
Divisional highlights
$4.2bn
Net new money from CMB clients referred to Global Private Banking during 2021, including $3.2bn or 75% in Asia.
12%
Increase in international account openings, compared with 1H20.
Adjusted profit before tax <>
($bn)
$3.4bn
Adjusted net operating income <>
($bn)
$6.7bn
Global Banking and Markets
Contribution to Group 1H21 adjusted profit before tax<>
| | |
| % contribution to Group |
| 28 | % |
GBM adjusted profit before tax increased, reflecting a net release in ECL in 1H21. While adjusted revenue fell, there was continued momentum in Equities, Capital Markets and our Securities Services business, where assets under custody reached over $10tn for the first time. We also continued to invest in technology to support our clients and to improve our operational resilience.
We support major government, corporate and institutional clients worldwide. Our product specialists deliver a comprehensive range of transaction banking, financing, advisory, capital markets and risk management services.
| | | | | | | | | | | | | | | | | | | | |
| Adjusted results <> | Half-year to | | 1H21 vs 1H20 |
30 Jun 2021 $m | 30 Jun 2020 $m | 31 Dec 2020 $m | | $m | % |
| Net operating income | 7,878 | | 8,574 | | 7,323 | | | (696) | | (8) | |
| ECL | 414 | | (1,195) | | (95) | | | 1,609 | | >100 |
| Operating expenses | (4,985) | | (4,813) | | (4,916) | | | (172) | | (4) | |
| Share of profit in associates and JVs | — | | — | | — | | | — | | — | |
| Profit before tax | 3,307 | | 2,566 | | 2,312 | | | 741 | | 29 | |
| RoTE excluding significant items (annualised, YTD) (%) | 10.7 | | 7.7 | | 6.7 | | | | |
Financial performance
Adjusted profit before tax of $3.3bn was $0.7bn higher than in 1H20. This mainly reflected releases of ECL allowances, compared with the significant build-up of allowances in 1H20, despite a decrease in adjusted revenue.
Adjusted revenue of $7.9bn decreased by $0.7bn compared with 1H20.
•In Markets and Securities Services, revenue decreased by $0.6bn or 12%, reflecting lower market volatility and a reduction in client activity in Global Foreign Exchange and Global Debt Markets, in the context of a strong performance in 1H20. In Securities Financing, income fell by $0.1bn or 25% due to margin compression. In addition, in Securities Services revenue fell by $0.1bn or 6% due to lower global interest rates, while fees increased by 15%, as assets under custody surpassed $10tn for the first time and transaction volumes increased in Asia and Europe. These decreases more than offset favourable movements in credit and funding valuation adjustments of $0.4bn and a strong performance in structured derivatives in Equities, reflecting strong client activity in Wealth, particularly in Asia.
•In Banking, revenue decreased by $0.3bn or 8%, mainly in GLCM, which fell by $0.2bn or 20% due to the impact of lower global interest rates, although fee income increased. Credit and Lending revenue fell by $41m or 3% due to lower net interest income reflecting strategic actions to reduce RWAs, and as 1H20 included elevated drawdowns due to the Covid-19 outbreak. The reduction in 'Other' reflected the non-recurrence of gains in 1H20 due to widening credit spreads on portfolio hedges. These decreases were
partly offset by an increase in Capital Markets and Advisory from a strong performance in leveraged finance and advisory, despite lower investment grade underwriting fees, reflecting a strong first half of 2020.
•In GBM Other, Principal Investments revenue increased by $0.2bn, reflecting revaluation gains on several funds, mainly in Europe.
| | | | | | | | | | | | | | | | | | | | |
Management view of adjusted revenue1, 2 <> | Half-year to | | 1H21 vs 1H20 |
30 Jun 2021 $m | 30 Jun 2020 $m | 31 Dec 2020 $m | | $m | % |
| Markets and Securities Services | 4,432 | | 5,029 | | 4,028 | | | (597) | | (12) | |
| – Securities Services | 924 | | 985 | | 862 | | | (61) | | (6) | |
| – Global Debt Markets | 713 | | 1,040 | | 426 | | | (327) | | (31) | |
| – Global Foreign Exchange | 1,680 | | 2,486 | | 1,679 | | | (806) | | (32) | |
| – Equities | 642 | | 313 | | 540 | | | 329 | | >100% |
| – Securities Financing | 438 | | 581 | | 414 | | | (143) | | (25) | |
| – Credit and funding valuation adjustments | 35 | | (376) | | 107 | | | 411 | | >100% |
| Banking | 3,291 | | 3,563 | | 3,230 | | | (272) | | (8) | |
| – Global Trade and Receivables Finance | 358 | | 364 | | 348 | | | (6) | | (2) | |
| – Global Liquidity and Cash Management | 892 | | 1,115 | | 932 | | | (223) | | (20) | |
| – Credit and Lending | 1,312 | | 1,353 | | 1,354 | | | (41) | | (3) | |
| – Capital Markets and Advisory | 610 | | 534 | | 545 | | | 76 | | 14 | |
– Other3 | 119 | | 197 | | 51 | | | (78) | | (40) | |
| GBM Other | 155 | | (18) | | 65 | | | 173 | | >100% |
| – Principal Investments | 237 | | (11) | | 124 | | | 248 | | >100% |
– Other4 | (82) | | (7) | | (59) | | | (75) | | >(100)% |
Net operating income5 | 7,878 | | 8,574 | | 7,323 | | | (696) | | (8) | |
1 With effect from the first quarter of 2021, management view of adjusted revenue has been revised to align with changes to the management responsibilities of the business and how we assess business performance. Comparative data have been re-presented accordingly.
2 From 1 June 2020, revenue from Issuer Services, previously reported in Securities Services, was reported in Banking. This resulted in $80m of revenue being recorded in Securities Services in 1H20. Comparatives have not been re-presented.
3 Includes portfolio management, earnings on capital and other capital allocations on all Banking products.
4 Includes notional tax credits and Markets Treasury, HSBC Holdings interest expense and Argentina hyperinflation.
5 ‘Net operating income’ means net operating income before change in expected credit losses and other credit impairment charges (also referred to as ‘revenue’).
Adjusted ECL were a net release of $0.4bn, compared with a charge of $1.2bn in 1H20. ECL in 1H21 reflected the release of stage 1 and stage 2 allowances as the economic outlook improved, and benefited from a net release of provisions against specific stage 3 customers. This compared with the significant build-up of allowances in 1H20 as a result of the Covid-19 outbreak.
Adjusted operating expenses of $5.0bn were $0.2bn or 4% higher, from an increased performance-related pay accrual of approximately $0.3bn and higher technology investment. These were partly offset by the impact of our cost-saving initiatives.
Divisional highlights
48%
Percentage of adjusted revenue generated in Asia in 1H21 (1H20: 49%).
$10tn
Assets under custody in Securities Services, our highest ever balance.
Adjusted profit before tax <>
($bn)
$3.3bn
Adjusted net operating income <>
($bn)
$7.9bn
Corporate Centre
Contribution to Group 1H21 adjusted profit before tax<>
| | |
| % contribution to Group |
| 12 | % |
Corporate Centre performance was broadly in line with 1H20 and included higher share of profit from associates and joint ventures.
The results of Corporate Centre primarily comprise the share of profit from our interests in our associates and joint ventures. It also includes Central Treasury, stewardship costs and consolidation adjustments.
| | | | | | | | | | | | | | | | | | | | |
| Adjusted results<> | Half-year to | | 1H21 vs 1H20 |
30 Jun 2021 $m | 30 Jun 2020 $m | 31 Dec 2020 $m | | $m | % |
| Net operating income | (133) | | 3 | | (308) | | | (136) | | >(100) |
| ECL | 4 | | (13) | | 14 | | | 17 | | >100 |
| Operating expenses | (112) | | 260 | | (673) | | | (372) | | >(100) |
| Share of profit in associates and JVs | 1,644 | | 1,057 | | 1,125 | | | 587 | | 56 | |
| Profit before tax | 1,403 | | 1,307 | | 158 | | | 96 | | 7 | |
| RoTE excluding significant items (annualised, YTD) (%) | 5.1 | | 4.7 | | 3.1 | | | | |
Financial performance
Adjusted profit before tax of $1.4bn was $96m or 7% higher than in 1H20, as higher income from the share of profit in associates and joint ventures was partly offset by the fall in adjusted revenue and higher adjusted operating expenses.
Adjusted revenue decreased by $136m, mainly in Central Treasury, from a net adverse fair value movement of $249m relating to the economic hedging of interest rate and exchange rate risk on our long-term debt with associated swaps. This was partly offset by higher revenue from our legacy portfolios, as 1H20 included valuation losses as a result of the Covid-19 outbreak.
Adjusted operating expenses, which are stated after recovery of costs from our global businesses, increased by $372m due to a reduction in recoveries from our global businesses, higher expenditure on regulatory projects and a higher performance-related pay accrual.
Adjusted share of profit from associates and joint ventures of $1.6bn increased by $0.6bn. This reflected increases in the share of profit from BoCom, and also from SABB, reflecting improved market conditions and a better economic outlook. Additionally, the share of profit increased in Europe by $0.2bn, mainly from a UK associate, reflecting a recovery in asset valuations relative to 1H20.
| | | | | | | | | | | | | | | | | | | | |
| Management view of adjusted revenue <> | Half-year to | | 1H21 vs 1H20 |
30 Jun 2021 $m | 30 Jun 2020 $m | 31 Dec 2020 $m | | $m | % |
Central Treasury1 | (54) | | 201 | | (44) | | | (255) | | >(100)% |
| Legacy portfolios | 16 | | (52) | | 31 | | | 68 | | >100% |
| | | | | | |
| | | | | | |
Other2 | (95) | | (146) | | (295) | | | 51 | | 35 | |
| | | | | | |
Net operating income3 | (133) | | 3 | | (308) | | | (136) | | >(100)% |
| | | | | | |
1 Central Treasury includes adverse valuation differences on issued long-term debt and associated swaps of $54m (1H20: gains of $195m; 2H20: losses of $44m).
2 Revenue from Markets Treasury, HSBC Holdings net interest expense and Argentina hyperinflation are allocated out to the global businesses, to align them better with their revenue and expense. The total Markets Treasury revenue component of this allocation for 1H21 was $1,320m (1H20: $1,582m; 2H20: $1,287m).
3 ‘Net operating income’ means net operating income before change in expected credit losses and other credit impairment charges (also referred to as ‘revenue’).
Risk overview
Active risk management helps us to achieve our strategy, serve our customers and communities and grow our business safely.
Managing risk
Banks continued to play an expanded role in supporting society and customers during the first half of 2021 due to the unprecedented global economic events caused by the Covid-19 outbreak. Many of our customers’ business models and income were impacted by the global economic downturn, requiring them to take significant levels of support from both governments and banks.
Throughout the pandemic, we have continued to support our customers and adapted our operational processes. We have maintained high levels of service as our people, processes and systems responded to the required changes.
The financial performance of our operations varied in different geographies, but our balance sheet and liquidity remained strong. This helped us to support our customers both during periods of government-imposed restrictions and when these restrictions were eased.
To help meet the additional challenges created by the Covid-19 pandemic, we supplemented our approach to risk management with additional tools and practices, and these continue to be in place today. We increased our focus on the quality and timeliness of the data used to inform management decisions, through measures such as early warning indicators, prudent active risk management of our risk appetite, and ensuring regular communication with our Board and key stakeholders.
Our risk appetite
Our risk appetite defines our desired forward-looking risk profile, and informs the strategic and financial planning process. It provides an objective baseline to guide strategic decision making, helping to ensure that planned business activities provide an appropriate balance of return for the risk assumed, while remaining within acceptable risk levels. Risk appetite supports senior management in allocating capital, funding and liquidity optimally to finance growth, while monitoring exposure to non-financial risks.
Capital and liquidity remain at the core of our risk appetite framework, with forward-looking statements informed by stress testing. We continue to develop our climate risk appetite as we engage with businesses on including climate risk in decision making and starting to embed climate risk appetite into business planning.
During the first half of 2021, metrics monitoring the change in expected credit losses and other credit impairment charges returned to within their defined risk appetite thresholds. This was achieved by adapting our strategy in the context of the Covid-19 pandemic and recovery; enhancing our risk monitoring; developing management actions, such as reviews of our portfolios that are highly vulnerable to general economic conditions; and implementing additional review measures for new credit requests.
Key risk appetite metrics
| | | | | | | | | | | |
| Component | Measure | Risk appetite | 1H21 |
| Capital | CET1 ratio – end point basis | ≥13.0% | 15.6 | % |
| Change in expected credit losses and other credit impairment charges | Change in expected credit losses and other credit impairment charges as a % of advances: Retail (WPB) | ≤0.50% | 0.13% |
Change in expected credit losses and other credit impairment charges as a % of advances: Wholesale (GBM, CMB) | ≤0.45% | 0.10% |
Stress tests
We regularly conduct stress tests to assess the resilience of our balance sheet and our capital adequacy, as well as to provide actionable insights into how key elements of our portfolios may behave during crises. We use the outcomes to calibrate our risk appetite and to review the robustness of our strategic and financial plans, helping to improve the quality of management’s decision making. Stress testing analysis assists
management in understanding the nature and extent of vulnerabilities to which the Group is exposed. The results from the stress tests also drive recovery and resolution planning to help enhance the Group’s financial stability under various macroeconomic scenarios. The selection of stress scenarios is based upon the identification and assessment of our top and emerging risks identified and our risk appetite.
In 2021, the Bank of England (‘BoE’) required all major UK banks to conduct a solvency stress test to assess whether the capital buffers that banks had built during the Covid-19 outbreak are large enough to deal with how a prevailing stress period could unfold. This exercise differed from previous BoE stress tests, which were used to determine the capital requirements for participating banks. The 2021 solvency stress test incorporated a ‘double dip’ scenario, whereby an economy faces a recession and then a partial or full recovery for a short period of time before entering a second recessionary period. Additionally, it represented an intensification of the macroeconomic shocks seen in 2020, with economic weaknesses persisting across the world, leading to ongoing weaknesses in global GDP.
In addition to the BoE requirement for the solvency stress test, we conducted our own internal stress test, which explored potential impacts for key vulnerabilities to which the Group is exposed, including geopolitical impacts and the Covid-19 outbreak. The internal stress test considered the impacts of various risk scenarios across all risk types and on capital resources. The results of the internal stress test were shared with senior management, and showed that after taking appropriate actions, the Group would remain adequately capitalised.
We have also continued to build our climate stress testing and scenario analysis capabilities in preparation for regulatory stress tests and to further enhance our understanding of our climate risk exposures for use in risk management and business decision making.
Our operations
We remain committed to investing in the reliability and resilience of our IT systems and critical services that support all parts of our business. We do so to protect our customers, affiliates and counterparties, and to help ensure that we minimise any disruption to services that could result in reputational and regulatory consequences. We continue to operate in a challenging environment in which cyber threats are prevalent. We continue to invest in business and technical controls to defend against these threats.
We are making progress with the implementation of our business transformation plans, while seeking to ensure that we are able to manage safely the risks of the restructuring, which include execution, operational, governance, reputational, conduct and financial risks. We have put in place support to help our people, particularly when we are unable to find alternative roles for them.
For further details on our risk management framework and risks associated with our banking and insurance manufacturing operations, see pages 107 and 118 of the Annual Report and Accounts 2020, respectively.
Risks related to Covid-19
The Covid-19 outbreak and its effect on the global economy have continued to impact our customers, and the future effects of the pandemic remain uncertain. The economic impact of the pandemic has affected regions at different times and to varying degrees.
The varying government support measures and restrictions put in place in response to the outbreak have created additional challenges, given the rapid pace of change and significant operational demands. The speed at which countries and territories are able to return to pre-Covid-19 levels of economic activity will vary based on the levels of continuing government support offered, the level of infection, and ability of governments to roll out vaccines across each country. Renewed outbreaks, including as a result of the emergence of new variants of the virus, emphasise the ongoing threat of Covid-19. A full return to pre-pandemic levels of social interaction across all our key markets is unlikely in the short to medium term, despite the easing of government restrictions in some countries. We continue to monitor the situation.
While the approval and roll-out of vaccines during the first half of 2021 raised hopes that government restrictions will be lifted across developed markets by the end of 2021, there has been significant divergence in the speed at which vaccines have been deployed across countries. Most developed countries are now offering vaccines to a large proportion of their populations, although take-up rates vary both within countries and across age groups. Many less developed countries have struggled to secure supplies and are at a much earlier stage of their vaccination programmes. There remains uncertainty regarding the efficacy and side effects of the vaccines over various time horizons, particularly as new variants of the virus emerge. Tensions have been evident and may persist as countries compete for access to the array of vaccines either under development, pending approval or already approved.
The operational support functions on which the Group relies are based in a number of countries worldwide, some of which, notably India, have been particularly affected by the Covid-19 outbreak and have recently experienced a significant increase in infection rates. As a result of the pandemic, business continuity responses have been implemented and the majority of service level agreements have been maintained in locations where the Group operates. We continue to monitor the situation closely, in particular in those countries and regions where Covid-19 infections are most prevalent.
The outbreak has also resulted in changes in the behaviours of our retail and wholesale customers, leading some to require payment holidays and others to miss or delay payments on loan balances. Alongside the number of government support measures in place, these factors have impacted the performance of our ECL models, requiring enhanced monitoring of model outputs and use of compensating controls. These include management judgemental adjustments based on the expert judgement of senior credit risk managers and the recalibration of key loss models to take into account the impacts of Covid-19 on critical model inputs. In addition, we have been responding to complex conduct considerations and heightened risk of fraud related to the varying government support measures and restrictions. The continued economic uncertainty from the Covid-19 outbreak could adversely impact our revenue assumptions, notably volume growth.
For further details on our approach to the risks related to Covid-19, see ‘Areas of special interest’ on page 55.
Geopolitical and macroeconomic risks
The trade and regulatory environment is increasingly fragmented, as markets lay out plans to recover from the Covid-19 outbreak and look to strengthen supply chain networks. Heightened geopolitical tensions will continue to impact business sentiment, while the relationship between the UK and the EU may take time to settle following the UK's departure from the EU, despite the signing of the Trade and Cooperation Agreement at the end of 2020. Central bank interest rates remain at historically low levels, although a vaccine-led economic recovery and rising inflation indicators have contributed to an increase in interest rate yields and a steepening of yield curves in our major markets in the first half of
2021. Monetary policies have remained very accommodative during this period, but rising inflation is posing a policy dilemma for some central banks.
Potential changes to tax legislation and tax rates in the countries in which we operate could increase the Group’s effective tax rate in future periods, as governments in many countries seek revenue sources to pay for the Covid-19 support packages that they have implemented. An OECD initiative to introduce a global minimum tax rate reached agreement on the key principles and could significantly increase the Group’s tax charge if implemented.
Geopolitical tensions could have potential ramifications for the Group and its customers. Developments in Hong Kong, the US approach to strategic competition with China, supply chain restrictions, claims of human rights violations, diplomatic tensions between China and the UK, the EU, India and other countries, alongside other potential areas of tension may affect the Group by creating regulatory, reputational and market risks. The US and recently the UK, EU, Canada and other US allies acting in concert have imposed various sanctions and trade restrictions on Chinese persons and companies, and the US continues to advance development of its framework for strategic competition with China. Certain US measures are of particular relevance, including the Hong Kong Autonomy Act and Executive Order 13959, as amended, as are the promulgation and use of US, EU and UK human rights-based sanctions. China has subsequently announced a number of sanctions and trade restrictions and promulgated laws in response to foreign sanctions and trade restrictions against China. There is also increasing discussion in the US and Europe on multilateral efforts to address certain issues with China, which may create a more complex operating environment for the Group and its customers. We continue to carefully monitor and seek to manage the potential implications of these developments.
The financial impact to the Group of geopolitical risks in Asia is heightened due to the strategic importance of the region, and Hong Kong in particular, in terms of profitability and prospects for growth. Business sentiment in some sectors in Hong Kong remains dampened, although the financial services sector has remained strong and has benefited from stable liquidity conditions.
For further details on our approach to geopolitical and macroeconomic risks, see ‘Areas of special interest’ on page 55.
Ibor transition
During the first half of 2021, our interbank offered rate (‘Ibor’) transition programme – which is tasked with the development of new near risk-free rate (‘RFR’) products and the transition from legacy Ibor products – has continued to engage with our clients, and to implement the required IT and operational changes necessary to facilitate an orderly transition from Ibors to RFRs, or alternative benchmarks, such as policy interest rates. In March 2021, the interest rate benchmark administrator, ICE Benchmark Administration Limited (‘IBA’), announced that the publication of 24 of the 35 main Libor currency interest rate benchmark settings would cease at the end of 2021 and that US dollar Libor will continue to be published for the most widely used settings until 30 June 2023. Therefore, the Group’s transition programme is focusing on client engagement for Ibors demising in 2021. Additionally, the Group has met industry guidelines on the cessation of new Ibor contract issuance in Ibors demising in 2021, including but not limited to, the end of the first and second quarter cessation dates for new sterling Libor-linked products.
For Ibors demising in 2021, HSBC plans to transition all viable legacy Ibor contracts by 30 September 2021 to the extent possible, in line with RFR working group guidelines. However, the Group’s transition plans are dependent on the readiness of our customers and the market, which is likely to result in operational activities potentially extending beyond 30 September 2021, and being concentrated into the latter part of 2021. All required contractual repapering and rebooking activities will be managed through bilateral and bulk transition processes, with fallback provisions negotiated where active transition is not achieved. However, to allow for a smooth transition of all contracts, we may also need to rely on some jurisdictional legislative solutions, such as the proposed ‘synthetic’-based Libor methodology in the UK.
For further details on our approach to Ibor transition, see ‘Areas of special interest’ on page 57.
Top and emerging risks
Our top and emerging risks report identifies forward-looking risks so that they can be considered in determining whether any incremental action is needed to either prevent them from materialising or to limit their effect.
Top risks are those that may have a material impact on the financial results, reputation or business model of the Group in the year ahead. Emerging risks are those that have large unknown components and may form beyond a one-year horizon. If any of these risks were to occur, they could have a material effect on HSBC.
Our suite of top and emerging risks is subject to regular review by senior governance forums. We continue to monitor closely the identified risks and ensure robust management actions are in place, as required.
Our current top and emerging risks are summarised on the next page and discussed in more detail on page 110 of the Annual Report and Accounts 2020.
| | | | | | | | |
| Risk | Trend | Mitigants |
| Externally driven | | |
Geopolitical and macroeconomic risks
| > | We continue to closely monitor emerging risks posed by an evolving geopolitical landscape, as well as macroeconomic risks, and adopt commensurate procedures and controls based on an assessment of the impacts these may have on our portfolios. In spite of a rapid economic recovery during the first half of 2021 in many of our markets and a reduced credit stress in our portfolios, we maintain heightened monitoring activities to identify sectors and customers experiencing financial difficulties as a result of the Covid-19 outbreak. In light of continued geopolitical tensions, we continue to assess those sectors likely to be particularly impacted by a resulting proliferation of laws and regulatory actions. |
| Cyber threat and unauthorised access to systems | >
| We protect HSBC and our customers by strengthening our cyber defences, helping us to execute our business priorities safely and keep our customers’ information secure. We focus on controls to prevent, detect and mitigate the impacts of persistent and increasingly advanced cyber threats with a specific emphasis on vulnerability management, malware defences, protections against unauthorised access and third-party risk. We closely monitor the continued dependency on widespread remote working and online facilities.
|
| | | | | | | | |
| Regulatory developments including conduct, with adverse impact on business model and profitability | > | We closely monitor for regulatory developments to ensure they are interpreted and implemented effectively and in a timely way. We also engage with regulators, policy makers and standard setters as appropriate, to help shape new regulatory requirements. Key themes currently driving the regulatory compliance agenda include: consumer protection and customer vulnerability; the impact of digital services and innovation; and ESG matters, with a particular focus on climate risk. |
| Financial crime risk environment | >
| We continued to support our customers and the business throughout the Covid-19 pandemic, while making improvements to our financial crime controls. We updated and refreshed our fraud controls. We continued to invest in advanced analytics and artificial intelligence as key elements of our next generation of tools to fight financial crime. |
| Ibor transition | ^ | We remain focused on completing the provision of alternative near-RFR products – and the supporting processes and systems – to replace all outstanding Ibor-linked contracts that are on a demise path, within the required timelines. Due to delays in market readiness, we are preparing for an increased risk that the transition of outstanding contracts will be concentrated in the latter part of 2021. |
Climate-related risks
| ^
| We have established a climate risk team to support our climate strategy and to respond to regulatory expectations. We have integrated climate risk into the Group risk management framework and enhanced our climate risk appetite statement with quantitative metrics. We are developing a training programme for all levels of employees across the Group. We continue to roll out customer transition risk questionnaires, assess physical risk to our mortgage portfolio, and build scenario analysis capabilities in preparation for regulatory stress tests. |
| Internally driven | |
| IT systems infrastructure and resilience | >
| We continue to monitor and improve IT systems and network resilience to minimise service disruption and improve customer experience. To support the business strategy, we strengthened our end-to-end service management, build and deployment controls and system monitoring capabilities. |
| Risks associated with workforce capability, capacity and environmental factors with potential impact on growth | > | We monitor workforce capacity and capability requirements in line with our published growth strategy. We have put in place measures to support our people to work safely during the Covid-19 outbreak, and to integrate them back into the workplace as government restrictions ease. We monitor people risks that may arise due to business transformation to help sensitively manage redundancies and support impacted employees. |
| Risks arising from the receipt of services from third parties | >
| The impacts of the Covid-19 pandemic on the delivery of services to the Group are being closely monitored, with businesses and functions taking appropriate action where needed. We have continued to enhance our third-party risk management programme to help ensure engagements comply with our third-party risk policy and required standards. |
| Model risk management | > | We continue to strengthen our oversight of models. A new model risk policy, including updated controls around the monitoring and use of models, has been implemented. We are redeveloping our capital models to reflect the evolving regulatory requirements, and in some cases the potential effects of the Covid-19 outbreak. In addition, Ibor models impacted by the switch to new alternative measures are being redeveloped. We have enhanced the oversight of models used in Sarbanes-Oxley processes in light of potential impacts from the uncertain external environment on the model outcomes.
|
| Data management | > | We continue to remediate the control environment for data-related risks with focused investments in data governance, data usage, data integrity, data privacy and information lifecycle management. In the first half of 2021, our data strategy was refreshed to align to three pillars: protect, connect and unlock. |
| Change execution risk | ^ | We continue to monitor and manage our change execution risk, including our capacity and resources to meet the increased levels of change for 2021 associated with the delivery of our strategic transformation and regulatory requirements. We are working to deliver sustainable change efficiently and safely, with a new change framework launched in May 2021. |
^ Risk heightened during the first half of 2021
> Risk remained at the same level as 2020
| | | | | |
| Financial summary |
| Page |
| Use of alternative performance measures | |
| Adjusted performance | |
| Significant items | |
| Foreign currency translation differences | |
| |
| Summary consolidated income statement | |
| Income statement commentary | |
| Net interest income | |
| |
| |
| |
| |
| |
| |
| |
| |
| |
| |
| Tax expense | |
| Summary consolidated balance sheet | |
| Balance sheet commentary compared with 31 December 2020 | |
| | |
| Use of alternative performance measures |
Our reported results are prepared in accordance with IFRSs as detailed in the interim condensed financial statements starting on page 98.
To measure our performance, we supplement our IFRSs figures with non-IFRSs measures, which constitute alternative performance measures under European Securities and Markets Authority guidance and non-GAAP financial measures defined in and presented in accordance with US Securities and Exchange Commission rules and regulations. These measures include those derived from our reported results that eliminate factors that distort period-on-period comparisons. The ‘adjusted performance’ measure used throughout this report is described below. Definitions and calculations of other alternative performance measures are included in our ‘Reconciliation of alternative performance measures’ on page 52. All alternative performance measures are reconciled to the closest reported performance measure.
The global business segmental results are presented on an adjusted basis in accordance with IFRS 8 ‘Operating Segments’ as detailed in Note 5: ‘Segmental analysis’ on page 106.
Adjusted performance
Adjusted performance is computed by adjusting reported results for the effects of foreign currency translation differences and significant items, which distort period-on-period comparisons.
We consider adjusted performance provides useful information for investors by aligning internal and external reporting, identifying and quantifying items management believes to be significant, and providing insight into how management assesses period-on-period performance.
Significant items
‘Significant items’ refers collectively to the items that management and investors would ordinarily identify and consider separately to improve the understanding of the underlying trends in the business.
The tables on pages 35 to 37 and pages 44 to 49 detail the effects of significant items on each of our global business segments, geographical regions and selected countries/territories in 1H21, 1H20 and 2H20.
Foreign currency translation differences
Foreign currency translation differences reflect the movements of the US dollar against most major currencies during 2021.
We exclude them to derive constant currency data, allowing us to assess balance sheet and income statement performance on a like-for-like basis and to better understand the underlying trends in the business.
| | |
Foreign currency translation differences Foreign currency translation differences for the half-year to 30 June 2021 are computed by retranslating into US dollars for non-US dollar branches, subsidiaries, joint ventures and associates: •the income statements for the half-years to 30 June 2020 and 31 December 2020 at the average rates of exchange for the half-year to 30 June 2021; and •the balance sheets at 30 June 2020 and 31 December 2020 at the prevailing rates of exchange on 30 June 2021. No adjustment has been made to the exchange rates used to translate foreign currency-denominated assets and liabilities into the functional currencies of any HSBC branches, subsidiaries, joint ventures or associates. The constant currency data of HSBC’s Argentina subsidiaries have not been adjusted further for the impacts of hyperinflation. When reference is made to foreign currency translation differences in tables or commentaries, comparative data reported in the functional currencies of HSBC’s operations have been translated at the appropriate exchange rates applied in the current period on the basis described above. |
| | |
| Summary consolidated income statement |
| | | | | | | | | | | | |
|
| | Half-year to |
| | 30 Jun | 30 Jun | 31 Dec |
| | 2021 | 2020 | 2020 |
| | $m | $m | $m |
| Net interest income | | 13,098 | | 14,509 | | 13,069 | |
| Net fee income | | 6,674 | | 5,926 | | 5,948 | |
| Net income from financial instruments held for trading or managed on a fair value basis | | 4,184 | | 5,768 | | 3,814 | |
| Net income/(expense) from assets and liabilities of insurance businesses, including related derivatives, measured at fair value through profit or loss | | 2,795 | | (1,290) | | 3,371 | |
Change in fair value of designated debt and related derivatives1 | | (67) | | 197 | | 34 | |
| Changes in fair value of other financial instruments mandatorily measured at fair value through profit or loss | | 548 | | 80 | | 375 | |
| Gains less losses from financial investments | | 433 | | 466 | | 187 | |
| | | | |
| Net insurance premium income | | 5,663 | | 5,020 | | 5,073 | |
| Other operating income | | 155 | | 471 | | 56 | |
| Total operating income | | 33,483 | | 31,147 | | 31,927 | |
| Net insurance claims and benefits paid and movement in liabilities to policyholders | | (7,932) | | (4,402) | | (8,243) | |
Net operating income before change in expected credit losses and other credit impairment charges2 | | 25,551 | | 26,745 | | 23,684 | |
| Change in expected credit losses and other credit impairment charges | | 719 | | (6,858) | | (1,959) | |
| Net operating income | | 26,270 | | 19,887 | | 21,725 | |
| Total operating expenses excluding impairment of goodwill and other intangible assets | | (17,045) | | (15,239) | | (17,805) | |
| Impairment of goodwill and other intangible assets | | (42) | | (1,288) | | (100) | |
| Operating profit | | 9,183 | | 3,360 | | 3,820 | |
| Share of profit in associates and joint ventures | | 1,656 | | 958 | | 639 | |
| Profit before tax | | 10,839 | | 4,318 | | 4,459 | |
| Tax expense | | (2,417) | | (1,193) | | (1,485) | |
| Profit for the period | | 8,422 | | 3,125 | | 2,974 | |
| Attributable to: | | | | |
| – ordinary shareholders of the parent company | | 7,276 | | 1,977 | | 1,921 | |
| – preference shareholders of the parent company | | 7 | | 45 | | 45 | |
| – other equity holders | | 666 | | 617 | | 624 | |
| – non-controlling interests | | 473 | | 486 | | 384 | |
| Profit for the period | | 8,422 | | 3,125 | | 2,974 | |
| | $ | $ | $ |
| Basic earnings per share | | 0.36 | | 0.10 | | 0.10 | |
| Diluted earnings per share | | 0.36 | | 0.10 | | 0.09 | |
Dividend per ordinary share (paid in the period)3 | | 0.15 | | — | | — | |
| | % | % | % |
| Post-tax return on average total assets (annualised) | | 0.6 | | 0.2 | | 0.2 | |
| Return on average ordinary shareholders’ equity (annualised) | | 8.4 | | 2.4 | | 2.3 | |
Return on average tangible equity (annualised)4 | | 9.4 | | 3.8 | | 2.4 | |
1 The debt instruments, issued for funding purposes, are designated under the fair value option to reduce an accounting mismatch.
2 Net operating income before change in expected credit losses and other credit impairment charges, also referred to as revenue.
3 Interim dividend of $0.15 per ordinary share in respect of the financial year ending 31 December 2020, paid in April 2021.
4 Half-year to 31 December 2020 is calculated on a full-year basis and not a 2H20 basis.
| | |
| Income statement commentary |
For further financial performance data of our global business segments, see pages 35 to 41. For further financial performance data by geographical regions and selected countries/territories, see pages 42 to 51.
Net interest income
| | | | | | | | | | | | | | | | | | |
| | Half-year to | Quarter to |
| | 30 Jun | 30 Jun | 30 Jun | 31 March | 30 Jun |
| | 2021 | 2020 | 2021 | 2021 | 2020 |
| | $m | $m | $m | $m | $m |
| Interest income | | 17,960 | | 23,000 | | 8,975 | | 8,985 | | 10,372 | |
| Interest expense | | (4,862) | | (8,491) | | (2,391) | | (2,471) | | (3,475) | |
| Net interest income | | 13,098 | | 14,509 | | 6,584 | | 6,514 | | 6,897 | |
| Average interest-earning assets | | 2,188,991 | | 2,034,939 | | 2,198,953 | | 2,178,918 | | 2,078,178 | |
| | % | % | % | % | % |
Gross interest yield1 | | 1.65 | | 2.27 | | 1.64 | | 1.67 | | 2.01 | |
Less: gross interest payable1 | | (0.54) | | (1.00) | | (0.53) | | (0.56) | | (0.81) | |
Net interest spread2 | | 1.11 | | 1.27 | | 1.11 | | 1.11 | | 1.20 | |
Net interest margin3 | | 1.21 | | 1.43 | | 1.20 | | 1.21 | | 1.33 | |
1 Gross interest yield is the average annualised interest rate earned on average interest-earning assets (‘AIEA’). Gross interest payable is the average annualised interest cost as a percentage of average interest-bearing liabilities.
2 Net interest spread is the difference between the average annualised interest rate earned on AIEA, net of amortised premiums and loan fees, and the average annualised interest rate payable on average interest-bearing funds.
3 Net interest margin is net interest income expressed as an annualised percentage of AIEA.
| | | | | | | | | | | | | | | | | | | | | | | | | | | | | | |
| Summary of interest income by type of asset |
| | Half-year to | Full-year to |
| | 30 Jun 2021 | 30 Jun 2020 | 31 Dec 2020 |
| | Average
balance | Interest
income | Yield | Average
balance | Interest
income | Yield | Average
balance | Interest
income | Yield |
| | $m | $m | % | $m | $m | % | $m | $m | % |
| Short-term funds and loans and advances to banks | | 421,521 | | 507 | | 0.24 | | 255,559 | | 760 | | 0.60 | | 298,255 | | 1,264 | | 0.42 | |
| Loans and advances to customers | | 1,063,974 | | 13,005 | | 2.46 | | 1,041,931 | | 15,978 | | 3.08 | | 1,046,795 | | 29,391 | | 2.81 | |
| Reverse repurchase agreements – non-trading | | 201,428 | | 486 | | 0.49 | | 222,151 | | 1,292 | | 1.17 | | 221,901 | | 1,819 | | 0.82 | |
| Financial investments | | 448,587 | | 3,391 | | 1.52 | | 451,344 | | 4,451 | | 1.98 | | 463,542 | | 8,143 | | 1.76 | |
| Other interest-earning assets | | 53,481 | | 571 | | 2.15 | | 63,954 | | 519 | | 1.63 | | 62,407 | | 1,139 | | 1.83 | |
| Total interest-earning assets | | 2,188,991 | | 17,960 | | 1.65 | | 2,034,939 | | 23,000 | | 2.27 | | 2,092,900 | | 41,756 | | 2.00 | |
| | | | | | | | | | | | | | | | | | | | | | | | | | | | | | |
| Summary of interest expense by type of liability |
| | Half-year to | Full-year to |
| | 30 Jun 2021 | 30 Jun 2020 | 31 Dec 2020 |
| | Average
balance | Interest
expense | Cost | Average
balance | Interest
expense | Cost | Average
balance | Interest
expense | Cost |
| | $m | $m | % | $m | $m | % | $m | $m | % |
Deposits by banks1 | | 73,402 | | 107 | | 0.29 | | 61,765 | | 226 | | 0.74 | | 65,536 | | 330 | | 0.50 | |
Customer accounts2 | | 1,355,092 | | 2,020 | | 0.30 | | 1,203,640 | | 4,069 | | 0.68 | | 1,254,249 | | 6,478 | | 0.52 | |
| Repurchase agreements – non-trading | | 108,165 | | 166 | | 0.31 | | 139,498 | | 754 | | 1.09 | | 125,376 | | 963 | | 0.77 | |
| Debt securities in issue – non-trading | | 199,058 | | 1,864 | | 1.89 | | 223,255 | | 2,720 | | 2.45 | | 219,610 | | 4,944 | | 2.25 | |
| Other interest-bearing liabilities | | 68,376 | | 705 | | 2.08 | | 77,256 | | 722 | | 1.88 | | 76,395 | | 1,463 | | 1.92 | |
| Total interest-bearing liabilities | | 1,804,093 | | 4,862 | | 0.54 | | 1,705,414 | | 8,491 | | 1.00 | | 1,741,166 | | 14,178 | | 0.81 | |
1 Including interest-bearing bank deposits only.
2 Including interest-bearing customer accounts only.
Net interest income (‘NII’) for 1H21 was $13.1bn, a decrease of $1.4bn or 9.7% compared with 1H20. This reflected lower average market interest rates across the major currencies and in particular in Asia compared with 1H20, partly offset by interest income associated with the increase in average interest-earning assets (‘AIEA’) of $154.1bn or 7.6%.
Excluding the effects of foreign currency translation differences, NII decreased by $2bn or 13.1%.
NII for the second quarter of 2021 was $6.6bn, down 4.5% compared with the previous year, and up 1.1% compared with the previous quarter. The year-on-year decrease was driven by the impact of lower market interest rates, which was partly offset by higher NII from growth in short-term funds and loans to banks as well as mortgages. The increase compared with the previous quarter was driven by the additional day in the second quarter. The NII adjusted for the day-count differences remained materially unchanged.
Net interest margin (‘NIM’) of 1.21% was 22 basis points (‘bps’) lower compared with 1H20, as the reduction in the yield on AIEA of 62bps was partly offset by the fall in the funding cost of average interest-bearing liabilities of 46bps. The decrease in NIM in 1H21 included the adverse effects of foreign currency translation differences on AIEA. Excluding this, NIM fell by 21bps.
NIM for the second quarter of 2021 was 1.20%, down 13bps year-on-year, and down 1bps compared with the previous quarter. The year-on-year decrease was predominantly driven by lower market interest rates. The decrease compared with the previous quarter was due to a change in asset mix towards lower yielding assets.
Interest income of $18bn decreased by $5bn or 22%, primarily due to the lower average interest rates compared with 1H20 as the yield on AIEA fell 62bps. This was partly offset by income from balance sheet growth, predominantly in Europe and Asia, and driven by higher balances in short-term funds and loans to banks and mortgages, which increased by $166bn and $42.7bn,
respectively. The decrease in interest income included $0.8bn from the favourable effects of foreign currency translation. Excluding these, interest income decreased by $5.8bn.
Interest income of $9bn in the second quarter of 2021 was down $1.4bn year-on-year and materially unchanged compared with the previous quarter. The year-on-year decrease was predominantly driven by the impact of lower market interest rates, although partly offset by growth in short-term funds and loans to banks and mortgages.
Interest expense of $4.9bn decreased by $3.6bn or 43% compared with 1H20. This reflected the decrease in funding costs of 46bps, mainly arising from lower interest rates paid on interest-bearing liabilities. This was partly offset by higher interest expense due to a rise in balances in interest-bearing customer accounts, which increased by $151.5bn.
The decrease in interest expense included the adverse effects of foreign currency translation differences of $0.3bn. Excluding this, interest expense decreased by $3.9bn.
Interest expense of $2.4bn in the second quarter of 2021 was down $1.1bn compared with the previous year, and down $0.1bn compared with the previous quarter. The year-on-year decrease was predominantly driven by the impact of lower market interest rates, partly offset by growth in customer accounts. The decrease compared with the previous quarter was mainly driven by reduced volumes in issued debt.
Net fee income of $6.7bn was $0.7bn higher than in 1H20, and included favourable foreign currency translation differences of $0.2bn. The remaining increase primarily reflected higher net fee income in all of our global businesses.
In WPB, the growth in fee income was mainly in Wealth, as improved market sentiment resulted in increased customer demand, particularly in the first quarter of 2021. This increase included higher fee income from unit trusts in Asia, from funds under management in Hong Kong, the UK and France, and from broking in Hong Kong.
In GBM, higher fee income was from growth in account services, which included higher activity from transaction banking clients. Fee income also increased in credit facilities, broking income, global custody and corporate finance, reflecting a higher level of client activity compared with 1H20.
In CMB, fee income increased from remittances and credit facilities, as well as from trade products, as global trade volumes recovered during 2021.
Net income from financial instruments held for trading or managed on a fair value basis of $4.2bn was $1.6bn lower and included adverse fair value movements on non-qualifying hedges of $0.4bn and adverse debit value adjustments of $0.1bn.
The remaining reduction was in GBM, as 1H20 benefited from higher market volatility supporting a particularly strong performance within Global Foreign Exchange and Global Debt Markets.
Net income/(expense) from assets and liabilities of insurance businesses, including related derivatives, measured at fair value through profit or loss was a net income of $2.8bn, primarily due to favourable equity market performances in France and Hong Kong. This compared with a net loss of $1.3bn in 1H20, which reflected unfavourable market performances following the Covid-19 outbreak.
This favourable movement resulted in a corresponding movement in liabilities to policyholders and the present value of in-force long-term insurance business (‘PVIF’) (see ‘Other operating income’ below). This reflected the extent to which the policyholders and shareholders respectively participate in the investment performance of the associated asset portfolios.
Change in fair value of designated debt and related derivatives of $0.1bn was $0.3bn adverse compared with 1H20. The movements were driven by the fall in interest rates between the periods, notably in US dollars and pounds sterling.
The majority of our financial liabilities designated at fair value are fixed-rate, long-term debt issuances and are managed in conjunction with interest rate swaps as part of our interest rate management strategy.
Changes in fair value of other financial instruments mandatorily measured at fair value through profit or loss of $0.5bn were $0.5bn higher compared with 1H20. This primarily reflected the impact of adverse movements in equity markets in 1H20 following the Covid-19 outbreak. The 1H21 period benefited from favourable equity market movements.
Gains less losses from financial investments of $0.4bn were broadly unchanged from 1H20, as gains on the disposal of debt securities remained stable.
Net insurance premium income of $5.7bn was $0.6bn higher than in 1H20, reflecting higher sales volumes, particularly in France and Singapore.
Other operating income of $0.2bn decreased by $0.3bn compared with 1H20, primarily due to lower net favourable changes in PVIF compared with 1H20 (down $0.4bn).
The change in PVIF included a net reduction of $0.5bn from assumption changes and experience variances, primarily in
Hong Kong and Singapore, partly offset in France where improved economic conditions resulted in a positive impact on PVIF assumptions. The net reduction due to assumption changes was partly offset by a $0.1bn increase in the value of new business written, primarily in Hong Kong.
PVIF is presented in accordance with IFRS 4. As set out in our Annual Report and Accounts 2020, IFRS 17 ‘Insurance Contracts’ is effective from 1 January 2023. Under IFRS 17, there will be no PVIF asset recognised. Instead, the estimated future profit will be included in the measurement of the insurance contract liability as the contractual service margin and gradually recognised in revenue as services are provided over the duration of the insurance contract.
The net reduction in PVIF was partly offset by the non-recurrence of revaluation losses on investment properties in Hong Kong in 1H20.
Net insurance claims and benefits paid and movement in liabilities to policyholders of $7.9bn were $3.5bn higher, primarily due to higher returns on financial assets supporting contracts where the policyholder is subject to part or all of the investment risk in France and Hong Kong, and from higher sales volumes in France and Singapore.
Change in expected credit losses and other credit impairment charges (‘ECL’) were a net release of $0.7bn in 1H21, compared with a charge of $6.9bn in 1H20. The net release in 1H21 reflected an improvement in the economic outlook, notably in the UK. This compared with the significant build-up of stage 1 and stage 2 allowances in 1H20 due to the worsening economic outlook at the onset of the Covid-19 outbreak. The reduction in ECL also reflected low levels of stage 3 charges, as well as the non-recurrence of a significant charge in 1H20 related to a corporate exposure in Singapore.
Given current consensus economic and default experience, ECL charges for 2021 are expected to be materially lower than our medium-term range of 30bps to 40bps of average loans and possibly a net release for the year. Uncertainty remains as countries emerge from the pandemic at different speeds, government support measures unwind and new virus strains test the efficacy of vaccination programmes. We expect further net releases of ECL in the first half of 2022.
For further details on the calculation of ECL, including the measurement uncertainties and significant judgements applied to such calculations, the impact of alternative/additional scenarios and post model-adjustments, see pages 63 to 71.
| | | | | | | | | | | | |
| Operating expenses – significant items and currency translation |
| | Half-year to |
| | 30 Jun | 30 Jun | 31 Dec |
| | 2021 | 2020 | 2020 |
| | $m | $m | $m |
| Significant items | | 865 | | 1,709 | | 1,425 | |
| | | | |
| – customer redress programmes | | 17 | | 50 | | (104) | |
| | | | |
| – impairment of goodwill and other intangibles | | — | | 1,025 | | 65 | |
| – past service costs of guaranteed minimum pension benefits equalisation | | — | | — | | 17 | |
– restructuring and other related costs1 | | 848 | | 505 | | 1,403 | |
| – settlements and provisions in connection with legal and regulatory matters | | — | | 5 | | 7 | |
| – currency translation on significant items | | | 124 | | 37 | |
| Currency translation | | | (887) | | (471) | |
| Total | | 865 | | 822 | | 954 | |
1 Includes impairment of software intangible assets of $173m in the six months to 30 June 2020 and impairment of tangible assets of $197m in the six months to 31 December 2020.
| | | | | | | | | | | |
| Staff numbers (full-time equivalents) |
| At |
| 30 Jun | 30 Jun | 31 Dec |
| 2021 | 2020 | 2020 |
| Global businesses | | | |
| Wealth and Personal Banking | 132,616 | | 140,040 | | 135,727 | |
| Commercial Banking | 43,241 | | 44,506 | | 43,221 | |
| Global Banking and Markets | 46,326 | | 47,811 | | 46,729 | |
| Corporate Centre | 367�� | | 407 | | 382 | |
| Total staff numbers | 222,550 | | 232,764 | | 226,059 | |
Operating expenses of $17.1bn were $0.6bn or 3% higher than in 1H20. This primarily reflected higher performance-related pay of $0.9bn, which is accrued based on the profile of our expected profit performance. In addition, investment in technology, including investments in our digital capabilities, increased by $0.3bn. Our Asia wealth investment also rose by $0.1bn. These increases were partly offset by a $0.9bn impact of our cost-saving initiatives.
The increase in operating expenses also included adverse foreign currency translation differences of $0.9bn and an increase in restructuring and other related costs of $0.3bn, of which $0.1bn related to severance payments. However, these items were broadly offset by the non-recurrence of a $1.2bn impairment of intangible assets in Europe in 1H20, of which $0.2bn was within restructuring and other related costs.
The number of employees expressed in full-time equivalent staff (‘FTEs’) at 30 June 2021 was 222,550, a decrease of 3,509 from 31 December 2020. Additionally, the number of contractors at 30 June 2021 was 7,401, an increase of 1,709 from 31 December 2020, primarily reflecting increases associated with our growth and transformation initiatives.
Share of profit in associates and joint ventures of $1.7bn was $0.7bn or 73% higher, primarily reflecting an increased share of profit from Bank of Communications Co., Limited (‘BoCom‘) and a recovery in asset valuations of a UK associate relative to 1H20. In addition, our share of profit from The Saudi British Bank (‘SABB’) increased.
In relation to BoCom, we continue to be subject to a risk of impairment in the carrying value of our investment. For further details of our impairment review process, see Note 10 on the interim condensed financial statements.
Tax expense
The effective tax rate for 1H21 of 22.3% was lower than the 27.6% for 1H20. The effective tax rate for 1H21 was increased by 1.7% due to the remeasurement of UK deferred tax balances following substantive enactment of legislation to increase the UK main rate of corporation tax from 19% to 25% with effect from 1 April 2023. The effective tax rate for 1H20 was high, mainly due to the non-recognition of deferred tax on losses in the UK.
| | | | | | | | | | |
| Summary consolidated balance sheet |
| | At |
| | 30 Jun | | 31 Dec |
| | 2021 | | 2020 |
| | $m | | $m |
| Assets | | | | |
| Cash and balances at central banks | | 393,559 | | | 304,481 | |
| Trading assets | | 260,250 | | | 231,990 | |
| Financial assets designated and otherwise mandatorily measured at fair value through profit or loss | | 49,120 | | | 45,553 | |
| Derivatives | | 209,516 | | | 307,726 | |
| Loans and advances to banks | | 86,886 | | | 81,616 | |
Loans and advances to customers1 | | 1,059,511 | | | 1,037,987 | |
| Reverse repurchase agreements – non-trading | | 201,714 | | | 230,628 | |
| Financial investments | | 434,576 | | | 490,693 | |
| Other assets | | 280,873 | | | 253,490 | |
| Total assets | | 2,976,005 | | | 2,984,164 | |
| Liabilities and equity | | | | |
| Liabilities | | | | |
| Deposits by banks | | 100,448 | | | 82,080 | |
| Customer accounts | | 1,669,091 | | | 1,642,780 | |
| Repurchase agreements – non-trading | | 112,798 | | | 111,901 | |
| Trading liabilities | | 89,637 | | | 75,266 | |
| Financial liabilities designated at fair value | | 151,686 | | | 157,439 | |
| Derivatives | | 200,156 | | | 303,001 | |
| Debt securities in issue | | 84,218 | | | 95,492 | |
| Liabilities under insurance contracts | | 110,572 | | | 107,191 | |
| Other liabilities | | 250,635 | | | 204,019 | |
| Total liabilities | | 2,769,241 | | | 2,779,169 | |
| Equity | | | | |
| Total shareholders’ equity | | 198,218 | | | 196,443 | |
| Non-controlling interests | | 8,546 | | | 8,552 | |
| Total equity | | 206,764 | | | 204,995 | |
| Total liabilities and equity | | 2,976,005 | | | 2,984,164 | |
1 Net of impairment allowances.
| | | | | | | | | |
| Selected financial information |
| | At |
| | 30 Jun | 31 Dec |
| | 2021 | 2020 |
| | $m | $m |
| Called up share capital | | 10,376 | 10,347 |
Capital resources1 | | 181,122 | 184,423 |
| Undated subordinated loan capital | | 1,969 | 1,970 |
Preferred securities and dated subordinated loan capital2 | | 29,349 | 30,721 |
| Risk-weighted assets | | 862,292 | 857,520 |
| Total shareholders' equity | | 198,218 | 196,443 |
| Less: preference shares and other equity instruments | | (22,414) | (22,414) |
| Total ordinary shareholders’ equity | | 175,804 | 174,029 |
| Less: goodwill and intangible assets (net of tax) | | (17,819) | (17,606) |
| Tangible ordinary shareholders' equity | | 157,985 | 156,423 |
| Financial statistics | | | |
| Loans and advances to customers as a percentage of customer accounts | | 63.5% | 63.2% |
| Average total shareholders’ equity to average total assets | | 6.56% | 6.46% |
Net asset value per ordinary share at period end ($)3 | | 8.69 | 8.62 |
| Tangible net asset value per ordinary share at period end ($) | | 7.81 | 7.75 |
| Tangible net asset value per fully diluted ordinary share at period end ($) | | 7.78 | 7.72 |
| Number of $0.50 ordinary shares in issue (millions) | | 20,751 | 20,694 | |
| Basic number of $0.50 ordinary shares outstanding (millions) | | 20,223 | 20,184 |
| Basic number of $0.50 ordinary shares outstanding and dilutive potential ordinary shares (millions) | | 20,315 | 20,272 |
| Closing foreign exchange translation rates to $: | | | |
| $1: £ | | 0.724 | 0.732 |
| $1: € | | 0.843 | 0.816 |
1 Capital resources are regulatory capital, the calculation of which is set out on page 88.
2 Including perpetual preferred securities.
3 The definition of net asset value per ordinary share is total shareholders‘ equity, less non-cumulative preference shares and capital securities, divided by the number of ordinary shares in issue, excluding own shares held by the company, including those purchased and held in treasury.
A more detailed consolidated balance sheet is contained in the interim condensed financial statements on page 100.
Balance sheet commentary compared with 31 December 2020
At 30 June 2021, our total assets were $3.0tn, broadly in line with 31 December 2020.
Our asset base included offsetting movements, with lower derivative asset balances due to adverse revaluation movements on interest rate contracts. In addition, there were decreases in financial investments and reverse repurchase agreements as we redeployed our commercial surplus into cash and balances at central banks. Other assets also increased due to the seasonal reduction in settlement accounts at 31 December 2020, as clients settled trades prior to the year end.
Our ratio of loans and advances to customers to customer accounts of 63% was in line with 31 December 2020.
Assets
Cash and balances at central banks increased by $89bn or 29%, mainly in the UK, France and the US, as we redeployed our commercial surplus to cash to increase liquidity for our clients and as a result of deposit inflows.
Trading assets increased by $28bn or 12%, notably from an increase in equity securities held, particularly in the UK, Hong Kong and the US, largely driven by client demand.
Derivative assets decreased by $98bn or 32%, primarily in the UK and France, reflecting adverse revaluation movements on interest rate contracts due to higher long-term yield curve rates in most major markets. Foreign exchange contracts also decreased as a result of foreign exchange rate movements and lower client demand. The decrease in derivative assets was consistent with the decrease in derivative liabilities, as the underlying risk is broadly matched.
Loans and advances to customers of $1.1tn were $22bn higher, which included adverse foreign currency translation differences of $1bn. On a constant currency basis, customer lending balances were $23bn higher.
The commentary below is on a constant currency basis.
Customer lending increased in WPB by $22bn to $491bn, which included a $9bn increase in Hong Kong as customers borrowed to fund investments in initial public offerings. This was partly offset by $2.6bn of loans and advances to customers being reclassified to assets held for sale, which is reported in ‘other assets’, reflecting the strategic initiative to exit the mass market retail banking business in the US. The remaining increase reflected higher mortgage balances, notably in the UK (up $5bn), Hong Kong (up $3bn) and Canada (up $2bn) as activity in housing markets globally continued to increase. There was also an increase in secured lending in Hong Kong Private Banking (up $3bn).
In CMB, customer lending of $351bn was $8bn higher, reflecting a recovery in trade volumes in 2021 and from increased term lending in Asia, partly offset by a reduction in other term balances in the UK.
In GBM, customer lending of $216bn fell by $7bn, primarily as customers repaid credit facilities, primarily in the UK, Singapore and the US.
Reverse repurchase agreements – non-trading decreased by $29bn or 13%, primarily in the US, as we redeployed our commercial surplus to cash due to a favourable US Federal Funds Rate. Additionally, in Europe there was an increase in balances eligible for netting, resulting in an overall balance reduction. These decreases were partly offset by an increase in Asia due to client demand.
Financial investments decreased by $56bn or 11%, mainly as we decreased our holdings of debt securities and treasury bills through a combination of disposals and maturities. A notable portion of these funds was redeployed into cash as we managed our commercial surplus.
Other assets grew by $27bn or 11%, primarily due to an increase in settlement accounts in the US, the UK and Hong Kong from higher trading activity, compared with the seasonal reduction in
December 2020. Additionally, $3bn of loans and advances to customers were reclassified to assets held for sale, reflecting our exit of mass market retail banking in the US. These increases were partly offset by lower cash collateral as derivative balances decreased.
Liabilities
Customer accounts of $1.7tn increased by $26bn on a reported basis, including adverse foreign currency translation differences of $1bn. On a constant currency basis, customer accounts were $27bn higher.
The commentary below is on a constant currency basis.
The increase in customer accounts was primarily in WPB (up $7bn), despite a reclassification of $9.9bn to liabilities of disposal groups held for sale, which is reported in ‘other liabilities’, reflecting our exit of mass market retail banking in the US. The remaining increase was driven by lower consumer spending, resulting in higher deposit and savings balances, due to ongoing Covid-19 restrictions. There was a continued movement of funds from term accounts to call accounts as customers showed a preference for liquidity while interest rates remained low.
Additionally, increases in CMB (up $15bn) and GBM (up $5bn) were observed as wholesale customers continued to consolidate funds across many of our markets.
Trading liabilities increased by $14bn or 19%, notably from an increase in debt security and equity short positions in Hong Kong, the UK and the US.
Derivative liabilities decreased by $103bn or 34%, which is consistent with the decrease in derivative assets, since the underlying risk is broadly matched.
Other liabilities increased by $47bn or 23%. During the period $10bn of customer accounts were reclassified to liabilities held for sale, reflecting our exit of mass market retail banking in the US. Additionally, there was an increase in settlement accounts in the US, France, Hong Kong and the UK from higher trading activity, compared with the seasonal reduction in December 2020. These increases were partly offset by lower cash collateral as derivative balances decreased.
Equity
Total shareholders’ equity, including non-controlling interests, increased by $1.8bn or 1% compared with 31 December 2020, reflecting the effects of profits generated of $8.4bn. These were partly offset by coupon distributions on securities classified as equity and dividends paid of $4.1bn, as well as net losses through other comprehensive income (‘OCI’) of $2.7bn. The net losses in OCI included adverse fair value movements of debt instruments of $1.4bn, an adverse remeasurement of defined benefit pension obligations of $0.7bn and adverse foreign exchange differences of $0.4bn.
Financial summary | Global businesses
| | | | | | | | |
| Customer accounts by country/territory |
| At |
| 30 Jun | 31 Dec |
| | 2021 | 2020 |
| $m | $m |
| Europe | 663,996 | | 629,647 | |
| – UK | 534,034 | | 504,275 | |
| – France | 55,924 | | 55,111 | |
| – Germany | 23,530 | | 21,605 | |
| – Switzerland | 10,464 | | 10,102 | |
| – other | 40,044 | | 38,554 | |
| Asia | 759,948 | | 762,406 | |
| – Hong Kong | 529,172 | | 531,489 | |
| – Singapore | 52,126 | | 55,140 | |
| – mainland China | 57,227 | | 56,826 | |
| – Australia | 27,340 | | 29,286 | |
| – India | 23,976 | | 20,199 | |
| – Malaysia | 15,823 | | 15,997 | |
| – Taiwan | 15,367 | | 16,041 | |
| – Indonesia | 5,593 | | 5,198 | |
| – other | 33,324 | | 32,230 | |
| Middle East and North Africa (excluding Saudi Arabia) | 41,086 | | 41,221 | |
| – United Arab Emirates | 19,541 | | 20,974 | |
| – Egypt | 6,054 | | 5,659 | |
| – Turkey | 4,554 | | 3,987 | |
| – other | 10,937 | | 10,601 | |
| North America | 176,152 | | 182,028 | |
– US1 | 110,579 | | 117,485 | |
| – Canada | 56,660 | | 56,520 | |
| – other | 8,913 | | 8,023 | |
| Latin America | 27,909 | | 27,478 | |
| – Mexico | 22,516 | | 22,220 | |
| – other | 5,393 | | 5,258 | |
| At end of period | 1,669,091 | | 1,642,780 | |
1 At 30 June 2021, customer accounts of $9.9bn related to the disposal of the US retail banking business met the criteria to be classified as held for sale and are reported within ‘Accruals, deferred income and other liabilities’ on the balance sheet. Refer to Note 15 on page 123 for further details.
Risk-weighted assets
Risk-weighted assets (‘RWAs’) rose by $4.8bn during the first half of the year, including a decrease of $2.7bn due to foreign currency translation differences. The increase of $7.5bn in RWAs (excluding foreign currency translation differences) included the following movements:
•a $12.9bn asset size increase, largely driven by WPB and CMB lending growth in Asia, partly offset by reductions in GBM and market risk RWAs, which included the effects of management initiatives; and
•a $5.2bn decrease in RWAs due to changes in methodology and policy. This was mostly due to risk parameter refinements in GBM and CMB.
| | | | | |
| Global businesses |
| Page |
| Summary | |
| Basis of preparation | |
| |
| |
| Reconciliation of reported and adjusted items – global businesses | |
| Reconciliation of reported and adjusted items – risk-weighted assets | |
| Supplementary tables for WPB | |
| |
The Group Chief Executive, supported by the rest of the Group Executive Committee (‘GEC’), reviews operating activity on a number of bases, including by global business and geographical region. Global businesses are our reportable segments under IFRS 8 ‘Operating Segments’, and are presented in Note 5: ‘Segmental analysis’ on page 106.
| | |
Basis of preparation The Group Chief Executive, supported by the rest of the GEC, is considered the Chief Operating Decision Maker (‘CODM’) for the purposes of identifying the Group’s reportable segments. Global business results are assessed by the CODM on the basis of adjusted performance, which removes the effects of significant items and currency translation from reported results. Therefore, we present these results on an adjusted basis. Adjusted performance information for 1H20 and 2H20 is presented on a constant currency basis as described on page 27. As required by IFRS 8, reconciliations of the total adjusted global business results to the Group’s reported results are presented on page 107. Supplementary reconciliations from reported to adjusted results by global business are presented on pages 35 to 37 for information purposes. Global business performance is also assessed using return on tangible equity (‘RoTE’), excluding significant items. A reconciliation of global business RoTE, excluding significant items to the Group’s RoTE is provided on page 52. Our operations are closely integrated and, accordingly, the presentation of data includes internal allocations of certain items of income and expense. These allocations include the costs of certain support services and global functions to the extent that they can be meaningfully attributed to global businesses and geographical regions. While such allocations have been made on a systematic and consistent basis, they necessarily involve a degree of subjectivity. Costs that are not allocated to global businesses are included in Corporate Centre. Where relevant, income and expense amounts presented include the results of inter-segment funding along with inter-company and inter-business line transactions. All such transactions are undertaken on arm’s length terms. The intra-Group elimination items for the global businesses are presented in Corporate Centre. The expense of the UK bank levy is included in the Europe geographical region as HSBC regards the levy as a cost of being headquartered in the UK. The current year expense is reflected in the fourth quarter as it is assessed on our balance sheet position as at 31 December. For the purposes of the presentation by global business, the cost of the levy is included in Corporate Centre. The results of geographical regions are presented on a reported and adjusted basis. Geographical information is classified by the location of the principal operations of the subsidiary or, for The Hongkong and Shanghai Banking Corporation Limited, HSBC Bank plc, HSBC UK Bank plc, HSBC Bank Middle East Limited and HSBC Bank USA, by the location of the branch responsible for reporting the results or providing funding. |
A description of the global businesses is provided in the Overview section, pages 16 to 22.
| | |
| Reconciliation of reported and adjusted items – global businesses |
Supplementary unaudited analysis of significant items by global business is presented below.
| | | | | | | | | | | | | | | | | | |
| | Half-year to 30 Jun 2021 |
| | Wealth and
Personal
Banking | Commercial
Banking | Global
Banking and
Markets | Corporate
Centre | Total |
| | $m | $m | $m | $m | $m |
Revenue1 | | | | | | |
| Reported | | 11,400 | | 6,670 | | 7,703 | | (222) | | 25,551 | |
| Significant items | | 1 | | (19) | | 175 | | 89 | | 246 | |
| – customer redress programmes | | 2 | | (20) | | — | | — | | (18) | |
| | | | | | |
– fair value movements on financial instruments2 | | (1) | | (1) | | 13 | | 183 | | 194 | |
– restructuring and other related costs3 | | — | | 2 | | 162 | | (94) | | 70 | |
| Adjusted | | 11,401 | | 6,651 | | 7,878 | | (133) | | 25,797 | |
| ECL | | | | | | |
| Reported | | 52 | | 249 | | 414 | | 4 | | 719 | |
| Adjusted | | 52 | | 249 | | 414 | | 4 | | 719 | |
| Operating expenses | | | | | | |
| Reported | | (7,817) | | (3,544) | | (5,058) | | (668) | | (17,087) | |
| Significant items | | 217 | | 19 | | 73 | | 556 | | 865 | |
| – customer redress programmes | | 13 | | — | | — | | 4 | | 17 | |
| | | | | | |
| | | | | | |
| – restructuring and other related costs | | 204 | | 19 | | 73 | | 552 | | 848 | |
| | | | | | |
| Adjusted | | (7,600) | | (3,525) | | (4,985) | | (112) | | (16,222) | |
| Share of profit in associates and joint ventures | | | | | | |
| Reported | | 11 | | 1 | | — | | 1,644 | | 1,656 | |
| Adjusted | | 11 | | 1 | | — | | 1,644 | | 1,656 | |
| Profit before tax | | | | | | |
| Reported | | 3,646 | | 3,376 | | 3,059 | | 758 | | 10,839 | |
| Significant items | | 218 | | — | | 248 | | 645 | | 1,111 | |
| – revenue | | 1 | | (19) | | 175 | | 89 | | 246 | |
| – operating expenses | | 217 | | 19 | | 73 | | 556 | | 865 | |
| Adjusted | | 3,864 | | 3,376 | | 3,307 | | 1,403 | | 11,950 | |
| Loans and advances to customers (net) | | | | | | |
| Reported | | 491,320 | | 350,945 | | 216,098 | | 1,148 | | 1,059,511 | |
| Adjusted | | 491,320 | | 350,945 | | 216,098 | | 1,148 | | 1,059,511 | |
| Customer accounts | | | | | | |
| Reported | | 841,257 | | 485,689 | | 341,242 | | 903 | | 1,669,091 | |
| Adjusted | | 841,257 | | 485,689 | | 341,242 | | 903 | | 1,669,091 | |
1 Net operating income before change in expected credit losses and other credit impairment charges, also referred to as revenue.
2 Includes fair value movements on non-qualifying hedges and debt valuation adjustments on derivatives.
3 Comprises losses associated with the RWA reduction commitments and gains relating to the business update in February 2020.
| | | | | | | | | | | | | | | | | | |
| Reconciliation of reported results to adjusted results – global businesses (continued) |
| | Half-year to 30 Jun 2020 |
| | Wealth and
Personal
Banking | Commercial
Banking | Global
Banking and
Markets | Corporate
Centre | Total |
| | $m | $m | $m | $m | $m |
Revenue1 | | | | | | |
| Reported | | 11,270 | | 7,000 | | 8,185 | | 290 | | 26,745 | |
| Currency translation | | 445 | | 326 | | 390 | | (44) | | 1,117 | |
| Significant items | | (21) | | — | | (1) | | (243) | | (265) | |
| – customer redress programmes | | (26) | | — | | — | | — | | (26) | |
| – disposals, acquisitions and investment in new businesses | | 7 | | — | | — | | 1 | | 8 | |
– fair value movements on financial instruments2 | | — | | — | | (65) | | (234) | | (299) | |
– restructuring and other related costs3 | | — | | — | | 58 | | (9) | | 49 | |
| – currency translation on significant items | | (2) | | — | | 6 | | (1) | | 3 | |
| Adjusted | | 11,694 | | 7,326 | | 8,574 | | 3 | | 27,597 | |
| ECL | | | | | | |
| Reported | | (2,202) | | (3,526) | | (1,118) | | (12) | | (6,858) | |
| Currency translation | | (126) | | (225) | | (77) | | (1) | | (429) | |
| Adjusted | | (2,328) | | (3,751) | | (1,195) | | (13) | | (7,287) | |
| Operating expenses | | | | | | |
| Reported | | (7,569) | | (3,397) | | (5,153) | | (408) | | (16,527) | |
| Currency translation | | (366) | | (178) | | (376) | | 33 | | (887) | |
| Significant items | | 240 | | 118 | | 716 | | 635 | | 1,709 | |
| | | | | | |
| – customer redress programmes | | 49 | | 1 | | — | | — | | 50 | |
| – impairment of goodwill and other intangibles | | 85 | | 41 | | 567 | | 332 | | 1,025 | |
– restructuring and other related costs4 | | 89 | | 65 | | 72 | | 279 | | 505 | |
| – settlements and provisions in connection with legal and regulatory matters | | — | | — | | 2 | | 3 | | 5 | |
| – currency translation on significant items | | 17 | | 11 | | 75 | | 21 | | 124 | |
| Adjusted | | (7,695) | | (3,457) | | (4,813) | | 260 | | (15,705) | |
| Share of profit in associates and joint ventures | | | | | | |
| Reported | | (8) | | — | | — | | 966 | | 958 | |
| Currency translation | | — | | — | | — | | 91 | | 91 | |
| Adjusted | | (8) | | — | | — | | 1,057 | | 1,049 | |
| Profit before tax | | | | | | |
| Reported | | 1,491 | | 77 | | 1,914 | | 836 | | 4,318 | |
| Currency translation | | (47) | | (77) | | (63) | | 79 | | (108) | |
| Significant items | | 219 | | 118 | | 715 | | 392 | | 1,444 | |
| – revenue | | (21) | | — | | (1) | | (243) | | (265) | |
| – operating expenses | | 240 | | 118 | | 716 | | 635 | | 1,709 | |
| Adjusted | | 1,663 | | 118 | | 2,566 | | 1,307 | | 5,654 | |
| Loans and advances to customers (net) | | | | | | |
| Reported | | 429,487 | | 344,567 | | 243,355 | | 1,272 | | 1,018,681 | |
| Currency translation | | 26,776 | | 17,527 | | 10,771 | | 93 | | 55,167 | |
| Adjusted | | 456,263 | | 362,094 | | 254,126 | | 1,365 | | 1,073,848 | |
| Customer accounts | | | | | | |
| Reported | | 775,870 | | 418,263 | | 337,573 | | 674 | | 1,532,380 | |
| Currency translation | | 34,267 | | 23,164 | | 19,509 | | 64 | | 77,004 | |
| Adjusted | | 810,137 | | 441,427 | | 357,082 | | 738 | | 1,609,384 | |
1 Net operating income before change in expected credit losses and other credit impairment charges, also referred to as revenue.
2 Includes fair value movements on non-qualifying hedges and debt valuation adjustments on derivatives.
3 Comprises losses associated with the RWA reduction commitments we made at our business update in February 2020.
4 Includes impairment of software intangible assets of $173m (of the total software intangible asset impairment of $1,247m).
| | | | | | | | | | | | | | | | | | |
| Reconciliation of reported results to adjusted results – global businesses (continued) |
| | Half-year to 31 Dec 2020 |
| | Wealth and
Personal
Banking | Commercial
Banking | Global
Banking and
Markets | Corporate
Centre | Total |
| | $m | $m | $m | $m | $m |
Revenue1 | | | | | | |
| Reported | | 10,729 | | 6,294 | | 6,809 | | (148) | | 23,684 | |
| Currency translation | | 258 | | 177 | | 187 | | 8 | | 630 | |
| Significant items | | 32 | | 18 | | 327 | | (168) | | 209 | |
| – customer redress programmes | | 31 | | 16 | | — | | — | | 47 | |
| – disposals, acquisitions and investment in new businesses | | 2 | | — | | — | | — | | 2 | |
– fair value movements on financial instruments2 | | — | | 1 | | 67 | | (33) | | 35 | |
– restructuring and other related costs3 | | — | | 1 | | 249 | | (129) | | 121 | |
| – currency translation on significant items | | (1) | | — | | 11 | | (6) | | 4 | |
| Adjusted | | 11,019 | | 6,489 | | 7,323 | | (308) | | 24,523 | |
| ECL | | | | | | |
| Reported | | (653) | | (1,228) | | (91) | | 13 | | (1,959) | |
| Currency translation | | (32) | | (37) | | (4) | | 1 | | (72) | |
| Adjusted | | (685) | | (1,265) | | (95) | | 14 | | (2,031) | |
| Operating expenses | | | | | | |
| Reported | | (7,877) | | (3,503) | | (5,016) | | (1,509) | | (17,905) | |
| Currency translation | | (189) | | (93) | | (174) | | (15) | | (471) | |
| Significant items | | 195 | | 105 | | 274 | | 851 | | 1,425 | |
| | | | | | |
| – customer redress programmes | | (113) | | — | | — | | 9 | | (104) | |
| – impairment of goodwill and other intangibles | | 209 | | 4 | | 10 | | (158) | | 65 | |
| – past service costs of guaranteed minimum pension benefits equalisation | | — | | — | | — | | 17 | | 17 | |
– restructuring and other related costs4 | | 103 | | 100 | | 254 | | 946 | | 1,403 | |
| – settlements and provisions in connection with legal and regulatory matters | | — | | — | | — | | 7 | | 7 | |
| – currency translation on significant items | | (4) | | 1 | | 10 | | 30 | | 37 | |
| Adjusted | | (7,871) | | (3,491) | | (4,916) | | (673) | | (16,951) | |
| Share of profit in associates and joint ventures | | | | | | |
| Reported | | 14 | | (1) | | — | | 626 | | 639 | |
| Currency translation | | 1 | | — | | — | | 37 | | 38 | |
| Significant items | | — | | — | | — | | 462 | | 462 | |
– impairment of goodwill5 | | — | | — | | — | | 462 | | 462 | |
| | | | | | |
| Adjusted | | 15 | | (1) | | — | | 1,125 | | 1,139 | |
| Profit/(loss) before tax | | | | | | |
| Reported | | 2,213 | | 1,562 | | 1,702 | | (1,018) | | 4,459 | |
| Currency translation | | 38 | | 47 | | 9 | | 31 | | 125 | |
| Significant items | | 227 | | 123 | | 601 | | 1,145 | | 2,096 | |
| – revenue | | 32 | | 18 | | 327 | | (168) | | 209 | |
| – operating expenses | | 195 | | 105 | | 274 | | 851 | | 1,425 | |
| – share of profit in associates and joint ventures | | — | | — | | — | | 462 | | 462 | |
| Adjusted | | 2,478 | | 1,732 | | 2,312 | | 158 | | 6,680 | |
| Loans and advances to customers (net) | | | | | | |
| Reported | | 469,186 | | 343,182 | | 224,364 | | 1,255 | | 1,037,987 | |
| Currency translation | | 32 | | (231) | | (969) | | (1) | | (1,169) | |
| Adjusted | | 469,218 | | 342,951 | | 223,395 | | 1,254 | | 1,036,818 | |
| Customer accounts | | | | | | |
| Reported | | 834,759 | | 470,428 | | 336,983 | | 610 | | 1,642,780 | |
| Currency translation | | (383) | | 258 | | (1,006) | | (1) | | (1,132) | |
| Adjusted | | 834,376 | | 470,686 | | 335,977 | | 609 | | 1,641,648 | |
1 Net operating income before change in expected credit losses and other credit impairment charges, also referred to as revenue.
2 Includes fair value movements on non-qualifying hedges and debt valuation adjustments on derivatives.
3 Comprises losses associated with the RWA reduction commitments and gains relating to the business update in February 2020.
4 Includes impairment of tangible assets of $197m.
5 During the six months to 31 December 2020, The Saudi British Bank ('SABB'), an associate of HSBC, impaired the goodwill that arose following the merger with Alawwal bank in 2019. HSBC's post-tax share of the goodwill impairment was $462m.
| | |
| Reconciliation of reported and adjusted risk-weighted assets |
| | | | | | | | | | | | | | | | | |
| At 30 Jun 2021 |
| Wealth and
Personal
Banking | Commercial
Banking | Global
Banking and
Markets | Corporate
Centre | Total |
| $bn | $bn | $bn | $bn | $bn |
| Risk-weighted assets | | | | | |
| Reported | 185.0 | | 332.1 | | 255.2 | | 90.0 | | 862.3 | |
| | | | | |
| | | | | |
| | | | | |
| | | | | |
| Adjusted | 185.0 | | 332.1 | | 255.2 | | 90.0 | | 862.3 | |
| | | | | |
| At 30 Jun 2020 |
| | | | | |
| | | | | |
| Risk-weighted assets | | | | | |
| Reported | 161.8 | | 330.9 | | 277.6 | | 84.3 | | 854.6 | |
| Currency translation | 6.6 | | 17.0 | | 9.0 | | 1.0 | | 33.6 | |
| | | | | |
| | | | | |
| Adjusted | 168.4 | | 347.9 | | 286.6 | | 85.3 | | 888.2 | |
| | | | | | | | | | | | | | | | | |
| | | | | |
| At 31 Dec 2020 |
| | | | | |
| | | | | |
| Risk-weighted assets | | | | | |
| Reported | 172.8 | | 327.7 | | 265.1 | | 91.9 | | 857.5 | |
| Currency translation | (0.5) | | (0.7) | | (1.2) | | (0.3) | | (2.7) | |
| | | | | |
| | | | | |
| Adjusted | 172.3 | | 327.0 | | 263.9 | | 91.6 | | 854.8 | |
| | |
| Supplementary tables for WPB |
WPB adjusted performance by business unit
A breakdown of WPB by business unit is presented below to reflect the basis of how the revenue performance of the business units is assessed and managed.
| | | | | | | | | | | | | | | | | | |
| WPB – summary (adjusted basis) |
| | Total
WPB | Consists of1 |
| | Banking
operations | Insurance
manufacturing | Global Private
Banking | Asset
management |
| | $m | $m | $m | $m | $m |
| Half-year to 30 Jun 2021 | | | | | | |
Net operating income before change in expected credit losses and other credit impairment charges2 | | 11,401 | | 8,392 | | 1,477 | | 935 | | 597 | |
| – net interest income | | 7,068 | | 5,608 | | 1,142 | | 320 | | (2) | |
| – net fee income/(expense) | | 3,042 | | 2,298 | | (316) | | 477 | | 583 | |
| – other income | | 1,291 | | 486 | | 651 | | 138 | | 16 | |
| ECL | | 52 | | 71 | | (20) | | 1 | | — | |
| Net operating income | | 11,453 | | 8,463 | | 1,457 | | 936 | | 597 | |
| Total operating expenses | | (7,600) | | (6,209) | | (268) | | (712) | | (411) | |
| Operating profit | | 3,853 | | 2,254 | | 1,189 | | 224 | | 186 | |
| Share of profit/(loss) in associates and joint ventures | | 11 | | 4 | | 7 | | — | | — | |
| Profit before tax | | 3,864 | | 2,258 | | 1,196 | | 224 | | 186 | |
| | | | | | |
| Half-year to 30 Jun 2020 | | | | | | |
Net operating income before change in expected credit losses and other credit impairment charges2 | | 11,694 | | 9,595 | | 620 | | 960 | | 519 | |
| – net interest income | | 8,332 | | 6,831 | | 1,115 | | 388 | | (2) | |
| – net fee income/(expense) | | 2,785 | | 2,130 | | (285) | | 431 | | 509 | |
| – other income/(expense) | | 577 | | 634 | | (210) | | 141 | | 12 | |
| ECL | | (2,328) | | (2,166) | | (105) | | (57) | | — | |
| Net operating income | | 9,366 | | 7,429 | | 515 | | 903 | | 519 | |
| Total operating expenses | | (7,695) | | (6,422) | | (204) | | (702) | | (367) | |
| Operating profit | | 1,671 | | 1,007 | | 311 | | 201 | | 152 | |
| Share of profit/(loss) in associates and joint ventures | | (8) | | 3 | | (11) | | — | | — | |
| Profit before tax | | 1,663 | | 1,010 | | 300 | | 201 | | 152 | |
| | | | | | |
| | | | | | |
| | | | | | |
| | | | | | |
| | | | | | |
| | | | | | |
| | | | | | |
| | | | | | |
| | | | | | |
| | | | | | |
| | | | | | |
| | | | | | |
| | | | | | | | | | | | | | | | | | |
| WPB – summary (adjusted basis) (continued) |
| | Total
WPB | Consists of1 |
| | Banking
operations | Insurance manufacturing | Global Private Banking | Asset
management |
| | $m | $m | $m | $m | $m |
| Half-year to 31 Dec 2020 | | | | | | |
Net operating income before change in expected credit losses and other credit impairment charges2 | | 11,019 | | 8,356 | | 1,259 | | 840 | | 564 | |
| – net interest income | | 7,231 | | 5,783 | | 1,145 | | 303 | | — | |
| – net fee income/(expense) | | 2,763 | | 2,064 | | (245) | | 417 | | 527 | |
| – other income/(expense) | | 1,025 | | 509 | | 359 | | 120 | | 37 | |
| ECL | | (685) | | (708) | | 39 | | (15) | | (1) | |
| Net operating income | | 10,334 | | 7,648 | | 1,298 | | 825 | | 563 | |
| Total operating expenses | | (7,871) | | (6,455) | | (286) | | (736) | | (394) | |
| Operating profit | | 2,463 | | 1,193 | | 1,012 | | 89 | | 169 | |
| Share of profit in associates and joint ventures | | 15 | | 3 | | 12 | | — | | — | |
| Profit before tax | | 2,478 | | 1,196 | | 1,024 | | 89 | | 169 | |
1 The results presented for insurance manufacturing operations are shown before elimination of inter-company transactions with HSBC non-insurance operations. These eliminations are presented within Banking operations.
2 Net operating income before change in expected credit losses and other credit impairment charges, also referred to as revenue. WPB insurance manufacturing adjusted revenue of $1,477m (1H20: $620m, 2H20: $1,259m) is disclosed within the management view of adjusted revenue on page 16, as follows: Wealth Management $1,439m (1H20: $583m, 2H20: $1,237m) and Other $38m (1H20: $37m, 2H20: $22m).
WPB insurance manufacturing adjusted results
The following table shows the results of our insurance manufacturing operations by income statement line item. It shows the results of insurance manufacturing operations for WPB and for all global business segments in aggregate, and separately the insurance distribution income earned by HSBC bank channels.
| | | | | | | | | | | | | | | | | | | | | | | |
Adjusted results of insurance manufacturing operations and insurance distribution income earned by HSBC bank channels1, 2 | | |
| | Half-year to | |
| | 30 Jun | 30 Jun | 31 Dec | | |
| | 2021 | 2020 | 2020 | | |
| | WPB | All global
businesses | WPB | All global
businesses | WPB | All global
businesses | | |
| | $m | $m | $m | $m | $m | $m | | |
| Net interest income | | 1,142 | | 1,232 | | 1,115 | | 1,187 | | 1,145 | | 1,239 | | | |
| Net fee expense | | (316) | | (340) | | (285) | | (310) | | (245) | | (258) | | | |
| – fee income | | 46 | | 58 | | 61 | | 70 | | 50 | | 62 | | | |
| – fee expense | | (362) | | (398) | | (346) | | (380) | | (295) | | (320) | | | |
| Net income/(expense) from financial instruments held for trading or managed on a fair value basis | | 2 | | (1) | | 17 | | 18 | | 51 | | 68 | | | |
| Net income/(expense) from assets and liabilities of insurance businesses, including related derivatives, measured at fair value through profit or loss | | 2,771 | | 2,798 | | (1,343) | | (1,362) | | 3,468 | | 3,440 | | | |
| Gains less losses from financial investments | | 58 | | 54 | | 4 | | 4 | | 9 | | 9 | | | |
| Net insurance premium income | | 5,399 | | 5,726 | | 4,934 | | 5,189 | | 4,938 | | 5,175 | | | |
| Other operating income/(expense) | | 55 | | 39 | | 393 | | 408 | | (58) | | (59) | | | |
| Of which: PVIF | | 25 | | 13 | | 428 | | 443 | | (59) | | (62) | | | |
| Total operating income | | 9,111 | | 9,508 | | 4,835 | | 5,134 | | 9,308 | | 9,614 | | | |
| Net insurance claims and benefits paid and movement in liabilities to policyholders | | (7,634) | | (7,953) | | (4,215) | | (4,458) | | (8,049) | | (8,308) | | | |
Net operating income before change in expected credit losses and other credit impairment charges3 | | 1,477 | | 1,555 | | 620 | | 676 | | 1,259 | | 1,306 | | | |
| Change in expected credit losses and other credit impairment charges | | (20) | | (20) | | (105) | | (116) | | 39 | | 40 | | | |
| Net operating income | | 1,457 | | 1,535 | | 515 | | 560 | | 1,298 | | 1,346 | | | |
| Total operating expenses | | (268) | | (280) | | (204) | | (231) | | (286) | | (287) | | | |
| Operating profit | | 1,189 | | 1,255 | | 311 | | 329 | | 1,012 | | 1,059 | | | |
| Share of profit/(loss) in associates and joint ventures | | 7 | | 7 | | (11) | | (11) | | 12 | | 12 | | | |
Profit before tax of insurance manufacturing operations4 | | 1,196 | | 1,262 | | 300 | | 318 | | 1,024 | | 1,071 | | | |
| | | | | | | | | |
| Annualised new business premiums of insurance manufacturing operations | | 1,551 | | 1,588 | | 1,238 | | 1,288 | | 1,090 | | 1,104 | | | |
| | | | | | | | | |
| Insurance distribution income earned by HSBC bank channels | | 399 | | 444 | | 407 | | 459 | | 349 | | 362 | | | |
| | | | | | | | | |
| | | | | | | | | |
1 Adjusted results are derived by adjusting for period-on-period effects of foreign currency translation differences, and the effect of significant items that distort period-on-period comparisons. There are no significant items included within insurance manufacturing, and the impact of foreign currency translation on ‘All global businesses’ profit before tax is 1H20: $10m favourable (reported: $308m), 2H20: $2m favourable (reported: $1,069m).
2 The results presented for insurance manufacturing operations are shown before elimination of inter-company transactions with HSBC non-insurance operations.
3 Net operating income before change in expected credit losses and other credit impairment charges, also referred to as revenue.
4 The effect on the insurance manufacturing operations of applying hyperinflation accounting in Argentina resulted in an increase in adjusted revenue in 1H21 of $6m (1H20: increase of $4m, 2H20: increase of $5m) and an increase in profit before tax in 1H21 of $6m (1H20: increase of $9m, 2H20: increase of $3m). These effects are recorded within ‘All global businesses’.
Insurance manufacturing
The following commentary, unless otherwise specified, relates to the ‘All global businesses’ results.
HSBC recognises the present value of long-term in-force insurance contracts and investment contracts with discretionary participation features (‘PVIF’) as an asset on the balance sheet.
The overall balance sheet equity, including PVIF, is therefore a measure of the embedded value in the insurance manufacturing entities, and the movement in this embedded value in the period drives the overall income statement result.
Adjusted profit before tax of $1.3bn increased by $0.9bn compared with 1H20.
Net operating income before change in expected credit losses and other credit impairment charges was $1.6bn, which was $0.9bn higher than in 1H20. This reflected the following:
•‘Net income from assets and liabilities of insurance businesses, including related derivatives, measured at fair value through profit or loss’ of $2.8bn in 1H21 compared with a net expense of $1.4bn in 1H20. This was primarily due to favourable equity market performances in France and Hong Kong in 1H21, compared with unfavourable market performances in 1H20 following the outbreak of Covid-19.
This favourable movement resulted in a corresponding movement in liabilities to policyholders and PVIF (see ‘Other operating income’ below), reflecting the extent to which policyholders and shareholders respectively participate in the investment performance of the associated asset portfolios.
•Net insurance premium income of $5.7bn was $0.5bn higher than in 1H20. This increase reflected higher sales volumes, particularly in France and Singapore.
•Other operating income decreased by $0.4bn compared with 1H20, mainly due to a net reduction of $0.5bn from assumption changes and experience variances, primarily in Hong Kong and Singapore. This was partly offset by positive experience variances in France where improved economic conditions resulted in a positive impact on PVIF assumptions. This overall net reduction due to assumption changes was partly offset by a
$0.1bn increase in the value of new business written, primarily in Hong Kong.
•Net insurance claims and benefits paid and movement in liabilities to policyholders of $8.0bn were $3.5bn higher, primarily due to increased returns on financial assets supporting contracts where the policyholder is subject to part or all of the investment risk primarily in France and Hong Kong and higher sales volumes in France and Singapore.
•Change in expected credit losses and other credit impairment charges (‘ECL’) were $0.1bn lower than 1H20, mainly due to charges in the comparative period following the onset of the Covid-19 pandemic.
•Total operating expenses of $0.3bn increased by 21% compared with 1H20, reflecting the investment in core insurance functions and capabilities, including preparation for the implementation of IFRS 17 ‘Insurance Contracts’.
Annualised new business premiums (‘ANP’) is a measure of new insurance premium generation by the business. It is calculated as 100% of annualised first year regular premiums and 10% of single premiums, before reinsurance ceded. The higher ANP during the period reflected an increase in new business volumes, mainly in Hong Kong.
Insurance distribution income from HSBC channels included $265m (1H20: $277m; 2H20: $202m) on HSBC manufactured products, for which a corresponding fee expense is recognised within insurance manufacturing, and $179m (1H20: $182m; 2H20: $160m) on products manufactured by third-party providers. The WPB component of this distribution income was $230m (1H20: $234m; 2H20: $197m) from HSBC manufactured products and $169m (1H20: $173m; 2H20: $152m) from third-party products.
WPB: Client assets and funds under management
The following table shows the client assets and funds under management, including self-directed client investments and execution-only trades, across our WPB global business. Funds under management represents assets managed, either actively or passively, on behalf of our customers.
| | | | | | | | | | | |
WPB – reported client assets and funds under management1 |
| Half-year to |
| 30 Jun | 30 Jun | 31 Dec |
| 2021 | 2020 | 2020 |
| $bn | $bn | $bn |
| Global Private Banking client assets | 427 | | 353 | | 394 | |
| – managed by Global Asset Management | 69 | | 62 | | 66 | |
| – external managers, direct securities and other | 358 | | 291 | | 328 | |
| Retail Wealth balances | 457 | | 357 | | 407 | |
| – managed by Global Asset Management | 231 | | 196 | | 219 | |
| – external managers, direct securities and other | 226 | | 161 | | 188 | |
| Asset Management third-party distribution | 317 | | 263 | | 317 | |
| Closing balance | 1,201 | | 973 | | 1,118 | |
1 Client funds distributed and under management are not reported on the Group’s balance sheet, except where it is deemed that we are acting as principal rather than agent in our role as investment manager. Customer deposits included in client assets are on-balance sheet.
WPB wealth balances
The following table shows the consolidated areas of focus across all WPB wealth balances.
| | | | | | | | | | | |
| WPB wealth balances |
| Half-year to |
| 30 Jun | 30 Jun | 31 Dec |
| 2021 | 2020 | 2020 |
| $bn | $bn | $bn |
| Client assets and funds under management | 1,201 | | 973 | | 1,118 | |
Premier and Jade deposits1 | 470 | | 445 | | 470 | |
| Total | 1,671 | | 1,418 | | 1,588 | |
1 Premier and Jade deposits, which include Prestige deposits in Hang Seng Bank, form part of the total WPB customer accounts balance of $841bn on page 35 (30 June 2020: $776bn, 31 December 2020: $835bn).
Asset Management: Funds under management
The following table shows the funds under management of our Asset Management business. Funds under management represents assets managed, either actively or passively, on behalf of our customers.
| | | | | | | | | | | | |
| |
| | | | |
| | | | |
| | | | |
| | | | |
| | | | |
| | | | |
| | | | |
| | | | |
| | | | |
Asset Management – reported funds under management1 |
| Half-year to |
| 30 Jun | 30 Jun | 31 Dec | |
| 2021 | 2020 | 2020 | |
| $bn | $bn | $bn | |
| Opening balance | 602 | | 506 | | 521 | | |
| Net new money | 4 | | 33 | | 20 | | |
| Value change | 16 | | (9) | | 26 | | |
| Exchange and other | (6) | | (9) | | 35 | | |
| | | | |
| Closing balance | 616 | | 521 | | 602 | | |
| | | | |
| Asset Management – reported funds under management by geography |
| At |
| 30 Jun | 30 Jun | 31 Dec | |
| 2021 | 2020 | 2020 | |
| $bn | $bn | $bn | |
| Europe | 347 | | 292 | | 346 | | |
| Asia | 186 | | 160 | | 176 | | |
| MENA | 6 | | 5 | | 6 | | |
| North America | 68 | | 57 | | 65 | | |
| Latin America | 9 | | 7 | | 9 | | |
| Closing balance | 616 | | 521 | | 602 | | |
1 Funds under management are not reported on the Group’s balance sheet, except where it is deemed that we are acting as principal rather than agent in our role as investment manager.
Global Private Banking client assets1
The following table shows the client assets of our Global Private Banking business.
| | | | | | | | | | | | |
Global Private Banking – reported client assets2 |
| Half-year to |
| 30 Jun | 30 Jun | 31 Dec | |
| 2021 | 2020 | 2020 | |
| $bn | $bn | $bn | |
| Opening balance | 394 | | 361 | | 353 | | |
| Net new money | 20 | | 5 | | 1 | | |
| | | | |
| Value change | 16 | | (16) | | 22 | | |
| | | | |
| Exchange and other | (3) | | 3 | | 18 | | |
| Closing balance | 427 | | 353 | | 394 | | |
| | | | | | | | | | | |
| Global Private Banking – reported client assets by geography |
| At |
| 30 Jun | 30 Jun | 31 Dec |
| 2021 | 2020 | 2020 |
| $bn | $bn | $bn |
| Europe | 176 | | 161 | | 174 | |
| Asia | 193 | | 154 | | 176 | |
| North America | 58 | | 38 | | 44 | |
| | | |
| | | |
| Closing balance | 427 | | 353 | | 394 | |
1 Client assets are translated at the rates of exchange applicable for their respective period-ends, with the effects of currency translation reported separately.
2 Client assets are not reported on the Group’s balance sheet, except where it is deemed that we are acting as principal rather than agent in our role as investment manager. Customer deposits included in these client assets are on balance sheet.
| | | | | |
| Geographical regions |
| Page |
| Analysis of reported results by geographical regions | |
| Reconciliation of reported and adjusted items – geographical regions | |
| Analysis by country/territory | |
| | |
| Analysis of reported results by geographical regions |
| | | | | | | | | | | | | | | | | | | | | | | | |
| HSBC reported profit/(loss) before tax and balance sheet data |
| | Half-year to 30 Jun 2021 |
| | Europe | Asia | MENA | North
America | Latin
America | Intra-HSBC
items | Total |
| | $m | $m | $m | $m | $m | $m | $m |
| Net interest income | | 3,144 | | 6,266 | | 650 | | 1,432 | | 1,009 | | 597 | | 13,098 | |
| Net fee income | | 1,925 | | 3,115 | | 370 | | 1,009 | | 255 | | — | | 6,674 | |
| Net income from financial instruments held for trading or managed on a fair value basis | | 1,439 | | 2,010 | | 205 | | 258 | | 235 | | 37 | | 4,184 | |
| Net income from assets and liabilities of insurance businesses, including related derivatives, measured at fair value through profit and loss | | 1,074 | | 1,700 | | — | | — | | 21 | | — | | 2,795 | |
| Changes in fair value of other financial instruments mandatorily measured at fair value through profit or loss | | 1,124 | | (3) | | (3) | | 31 | | 36 | | (637) | | 548 | |
Other income/(expense)1 | | 1,523 | | 168 | | 30 | | 321 | | (71) | | (3,719) | | (1,748) | |
Net operating income before change in expected credit losses and other credit impairment charges2 | | 10,229 | | 13,256 | | 1,252 | | 3,051 | | 1,485 | | (3,722) | | 25,551 | |
| Change in expected credit losses and other credit impairment charges | | 670 | | (207) | | 116 | | 212 | | (72) | | — | | 719 | |
| Net operating income | | 10,899 | | 13,049 | | 1,368 | | 3,263 | | 1,413 | | (3,722) | | 26,270 | |
| Total operating expenses excluding impairment of goodwill and other intangible assets | | (9,071) | | (7,457) | | (782) | | (2,448) | | (1,009) | | 3,722 | | (17,045) | |
| Impairment of goodwill and other intangible assets | | (13) | | (15) | | (3) | | (10) | | (1) | | — | | (42) | |
| Operating profit/(loss) | | 1,815 | | 5,577 | | 583 | | 805 | | 403 | | — | | 9,183 | |
| Share of profit in associates and joint ventures | | 153 | | 1,359 | | 140 | | — | | 4 | | — | | 1,656 | |
| Profit/(loss) before tax | | 1,968 | | 6,936 | | 723 | | 805 | | 407 | | — | | 10,839 | |
| | % | % | % | % | % | | % |
| Share of HSBC’s profit before tax | | 18.2 | | 64.0 | | 6.7 | | 7.4 | | 3.7 | | | 100.0 | |
| Cost efficiency ratio | | 88.8 | | 56.4 | | 62.7 | | 80.6 | | 68.0 | | | 66.9 | |
| Balance sheet data | | $m | $m | $m | $m | $m | $m | $m |
| Loans and advances to customers (net) | | 402,778 | | 502,360 | | 27,608 | | 106,414 | | 20,351 | | — | | 1,059,511 | |
| | | | | | | | |
| Total assets | | 1,376,064 | | 1,249,145 | | 68,351 | | 383,082 | | 49,102 | | (149,739) | | 2,976,005 | |
| Customer accounts | | 663,996 | | 759,948 | | 41,086 | | 176,152 | | 27,909 | | — | | 1,669,091 | |
| | | | | | | | |
Risk-weighted assets3 | | 269,873 | | 407,117 | | 59,476 | | 115,208 | | 34,845 | | — | | 862,292 | |
| | | | | | | | |
| | Half-year to 30 Jun 2020 |
| Net interest income | | 2,782 | | 7,820 | | 777 | | 1,483 | | 963 | | 684 | | 14,509 | |
| Net fee income | | 1,747 | | 2,692 | | 347 | | 910 | | 230 | | — | | 5,926 | |
| Net income from financial instruments held for trading or managed on a fair value basis | | 2,090 | | 2,630 | | 211 | | 630 | | 370 | | (163) | | 5,768 | |
| Net expense from assets and liabilities of insurance businesses, including related derivatives, measured at fair value through profit and loss | | (809) | | (512) | | — | | — | | 31 | | — | | (1,290) | |
| Changes in fair value of other financial instruments mandatorily measured at fair value through profit or loss | | 563 | | 22 | | (5) | | (2) | | 21 | | (519) | | 80 | |
Other income/(expense)1 | | 2,603 | | 1,928 | | 49 | | 384 | | (38) | | (3,174) | | 1,752 | |
Net operating income before change in expected credit losses and other credit impairment charges2 | | 8,976 | | 14,580 | | 1,379 | | 3,405 | | 1,577 | | (3,172) | | 26,745 | |
| Change in expected credit losses and other credit impairment charges | | (2,885) | | (1,818) | | (611) | | (887) | | (657) | | — | | (6,858) | |
| Net operating income | | 6,091 | | 12,762 | | 768 | | 2,518 | | 920 | | (3,172) | | 19,887 | |
| Total operating expenses excluding impairment of goodwill and other intangible assets | | (7,933) | | (6,356) | | (722) | | (2,491) | | (909) | | 3,172 | | (15,239) | |
| Impairment of goodwill and other intangible assets | | (1,168) | | (74) | | (41) | | (4) | | (1) | | — | | (1,288) | |
| Operating profit/(loss) | | (3,010) | | 6,332 | | 5 | | 23 | | 10 | | — | | 3,360 | |
| Share of profit/(loss) in associates and joint ventures | | (50) | | 1,037 | | (31) | | — | | 2 | | — | | 958 | |
| Profit/(loss) before tax | | (3,060) | | 7,369 | | (26) | | 23 | | 12 | | — | | 4,318 | |
| | % | % | % | % | % | | % |
| Share of HSBC’s profit before tax | | (70.9) | | 170.7 | | (0.6) | | 0.5 | | 0.3 | | | 100.0 | |
| Cost efficiency ratio | | 101.4 | | 44.1 | | 55.3 | | 73.3 | | 57.7 | | | 61.8 | |
| Balance sheet data | | $m | $m | $m | $m | $m | $m | $m |
| Loans and advances to customers (net) | | 378,729 | | 474,739 | | 29,615 | | 115,813 | | 19,785 | | — | | 1,018,681 | |
| | | | | | | | |
| Total assets | | 1,357,087 | | 1,164,850 | | 68,418 | | 449,393 | | 48,933 | | (165,883) | | 2,922,798 | |
| Customer accounts | | 562,505 | | 723,072 | | 41,197 | | 180,489 | | 25,117 | | — | | 1,532,380 | |
| | | | | | | | |
Risk-weighted assets3 | | 278,500 | | 374,684 | | 58,585 | | 130,580 | | 33,278 | | — | | 854,552 | |
| | | | | | | | | | | | | | | | | | | | | | | | |
| HSBC reported profit/(loss) before tax and balance sheet data (continued) |
| | Half-year to 31 Dec 2020 |
| | Europe | Asia | MENA | North
America | Latin
America | Intra-HSBC/
Global
impairment | Total |
| | $m | $m | $m | $m | $m | $m | $m |
| Net interest income | | 2,913 | | 6,498 | | 688 | | 1,353 | | 997 | | 620 | | 13,069 | |
| Net fee income | | 1,752 | | 2,726 | | 348 | | 885 | | 237 | | — | | 5,948 | |
| Net income from financial instruments held for trading or managed on a fair value basis | | 1,176 | | 1,643 | | 191 | | 367 | | 223 | | 214 | | 3,814 | |
| Net income from assets and liabilities of insurance businesses, including related derivatives, measured at fair value through profit and loss | | 1,136 | | 2,211 | | — | | — | | 24 | | — | | 3,371 | |
| Changes in fair value of other financial instruments mandatorily measured at fair value through profit or loss | | 1,184 | | (5) | | 8 | | 4 | | 19 | | (835) | | 375 | |
Other income/(expense)1 | | 1,282 | | (731) | | 14 | | 361 | | (57) | | (3,762) | | (2,893) | |
Net operating income before change in expected credit losses and other credit impairment charges2 | | 9,443 | | 12,342 | | 1,249 | | 2,970 | | 1,443 | | (3,763) | | 23,684 | |
| Change in expected credit losses and other credit impairment charges | | (866) | | (466) | | (147) | | (13) | | (467) | | — | | (1,959) | |
| Net operating income | | 8,577 | | 11,876 | | 1,102 | | 2,957 | | 976 | | (3,763) | | 21,725 | |
| Total operating expenses excluding impairment of goodwill and other intangible assets | | (9,927) | | (7,228) | | (799) | | (2,590) | | (1,024) | | 3,763 | | (17,805) | |
| Impairment of goodwill and other intangible assets | | 154 | | (4) | | (24) | | (222) | | (4) | | — | | (100) | |
| Operating profit/(loss) | | (1,196) | | 4,644 | | 279 | | 145 | | (52) | | — | | 3,820 | |
| Share of profit/(loss) in associates and joint ventures | | 51 | | 819 | | (234) | | — | | 3 | | — | | 639 | |
| Profit/(loss) before tax | | (1,145) | | 5,463 | | 45 | | 145 | | (49) | | — | | 4,459 | |
| | % | % | % | % | % | | % |
| Share of HSBC’s profit before tax | | (25.7) | | 122.5 | | 1.0 | | 3.3 | | (1.1) | | | 100.0 | |
| Cost efficiency ratio | | 103.5 | | 58.6 | | 65.9 | | 94.7 | | 71.2 | | | 75.6 | |
| Balance sheet data | | $m | $m | $m | $m | $m | $m | $m |
| Loans and advances to customers (net) | | 408,495 | | 473,165 | | 28,700 | | 107,969 | | 19,658 | | — | | 1,037,987 | |
| | | | | | | | |
| Total assets | | 1,416,111 | | 1,206,404 | | 68,860 | | 373,167 | | 49,703 | | (130,081) | | 2,984,164 | |
| Customer accounts | | 629,647 | | 762,406 | | 41,221 | | 182,028 | | 27,478 | | — | | 1,642,780 | |
| | | | | | | | |
Risk-weighted assets3 | | 284,322 | | 384,228 | | 60,181 | | 117,755 | | 35,240 | | — | | 857,520 | |
1 Other income/(expense) in this context comprises, where applicable, net income/(expense) from other financial instruments designated at fair value, gains less losses from financial investments, dividend income, net insurance premium income and other operating income less net insurance claims and benefits paid and movement in liabilities to policyholders.
2 Net operating income before change in expected credit losses and other credit impairment charges, also referred to as revenue.
3 Risk-weighted assets are non-additive across geographical regions due to market risk diversification effects within the Group.
| | |
| Reconciliation of reported and adjusted items – geographical regions |
| | | | | | | | | | | | | | | | | | | | | | |
| Reconciliation of reported and adjusted items – geographical regions and selected countries/territories | |
| | Half-year to 30 Jun 2021 | |
| | Europe | Asia | MENA | North America | Latin America | Total | |
| | $m | $m | $m | $m | $m | $m | |
Revenue1 | | | | | | | | |
Reported2 | | 10,229 | | 13,256 | | 1,252 | | 3,051 | | 1,485 | | 25,551 | | |
| Significant items | | 79 | | (54) | | — | | 3 | | 7 | | 246 | | |
| – customer redress programmes | | (18) | | — | | — | | — | | — | | (18) | | |
| | | | | | | | |
– fair value movements on financial instruments3 | | 188 | | 5 | | — | | — | | 1 | | 194 | | |
– restructuring and other related costs2,4 | | (91) | | (59) | | — | | 3 | | 6 | | 70 | | |
Adjusted2 | | 10,308 | | 13,202 | | 1,252 | | 3,054 | | 1,492 | | 25,797 | | |
| ECL | | | | | | | | |
| Reported | | 670 | | (207) | | 116 | | 212 | | (72) | | 719 | | |
| Adjusted | | 670 | | (207) | | 116 | | 212 | | (72) | | 719 | | |
| Operating expenses | | | | | | | | |
Reported2 | | (9,084) | | (7,472) | | (785) | | (2,458) | | (1,010) | | (17,087) | | |
| Significant items | | 634 | | 202 | | 22 | | 191 | | 27 | | 865 | | |
| – customer redress programmes | | 17 | | — | | — | | — | | — | | 17 | | |
| | | | | | | | |
| | | | | | | | |
| | | | | | | | |
– restructuring and other related costs2 | | 617 | | 202 | | 22 | | 191 | | 27 | | 848 | | |
| | | | | | | | |
Adjusted2 | | (8,450) | | (7,270) | | (763) | | (2,267) | | (983) | | (16,222) | | |
| Share of profit in associates and joint ventures | | | | | | | | |
| Reported | | 153 | | 1,359 | | 140 | | — | | 4 | | 1,656 | | |
| Adjusted | | 153 | | 1,359 | | 140 | | — | | 4 | | 1,656 | | |
| Profit before tax | | | | | | | | |
| Reported | | 1,968 | | 6,936 | | 723 | | 805 | | 407 | | 10,839 | | |
| Significant items | | 713 | | 148 | | 22 | | 194 | | 34 | | 1,111 | | |
– revenue2 | | 79 | | (54) | | — | | 3 | | 7 | | 246 | | |
– operating expenses2 | | 634 | | 202 | | 22 | | 191 | | 27 | | 865 | | |
| Adjusted | | 2,681 | | 7,084 | | 745 | | 999 | | 441 | | 11,950 | | |
| Loans and advances to customers (net) | | | | | | | | |
| Reported | | 402,778 | | 502,360 | | 27,608 | | 106,414 | | 20,351 | | 1,059,511 | | |
| Adjusted | | 402,778 | | 502,360 | | 27,608 | | 106,414 | | 20,351 | | 1,059,511 | | |
| Customer accounts | | | | | | | | |
| Reported | | 663,996 | | 759,948 | | 41,086 | | 176,152 | | 27,909 | | 1,669,091 | | |
| Adjusted | | 663,996 | | 759,948 | | 41,086 | | 176,152 | | 27,909 | | 1,669,091 | | |
1 Net operating income before change in expected credit losses and other credit impairment charges, also referred to as revenue.
2 Amounts are non-additive across geographical regions due to inter-company transactions within the Group.
3 Includes fair value movements on non-qualifying hedges and debt valuation adjustments on derivatives.
4 Comprises losses associated with the RWA reduction commitments and gains relating to the business update in February 2020.
| | | | | | | | | | | | | | | | | | |
| Reconciliation of reported and adjusted items – geographical regions and selected countries/territories (continued) |
| | Half-year to 30 Jun 2021 |
| | UK | Hong
Kong | Mainland
China | US | Mexico |
| | $m | $m | $m | $m | $m |
Revenue1 | | | | | | |
| Reported | | 8,179 | | 7,661 | | 1,791 | | 2,048 | | 1,149 | |
| Significant items | | 119 | | 25 | | (21) | | 4 | | 16 | |
| – customer redress programmes | | (18) | | — | | — | | — | | — | |
| | | | | | |
– fair value movement on financial instruments2 | | 186 | | 2 | | — | | — | | 1 | |
| – restructuring and other related costs | | (49) | | 23 | | (21) | | 4 | | 15 | |
| Adjusted | | 8,298 | | 7,686 | | 1,770 | | 2,052 | | 1,165 | |
| ECL | | | | | | |
| Reported | | 655 | | (91) | | (2) | | 174 | | (68) | |
| Adjusted | | 655 | | (91) | | (2) | | 174 | | (68) | |
| Operating expenses | | | | | | |
| Reported | | (7,307) | | (3,945) | | (1,306) | | (1,849) | | (725) | |
| Significant items | | 575 | | 86 | | 11 | | 153 | | 10 | |
| | | | | | |
| – customer redress programmes | | 17 | | — | | — | | — | | — | |
| | | | | | |
| | | | | | |
| – restructuring and other related costs | | 558 | | 86 | | 11 | | 153 | | 10 | |
| | | | | | |
| Adjusted | | (6,732) | | (3,859) | | (1,295) | | (1,696) | | (715) | |
| Share of profit in associates and joint ventures | | | | | | |
| Reported | | 153 | | 8 | | 1,348 | | — | | 4 | |
| Adjusted | | 153 | | 8 | | 1,348 | | — | | 4 | |
| Profit before tax | | | | | | |
| Reported | | 1,680 | | 3,633 | | 1,831 | | 373 | | 360 | |
| Significant items | | 694 | | 111 | | (10) | | 157 | | 26 | |
| – revenue | | 119 | | 25 | | (21) | | 4 | | 16 | |
| – operating expenses | | 575 | | 86 | | 11 | | 153 | | 10 | |
| | | | | | |
| Adjusted | | 2,374 | | 3,744 | | 1,821 | | 530 | | 386 | |
| Loans and advances to customers (net) | | | | | | |
| Reported | | 313,966 | | 328,913 | | 51,123 | | 51,985 | | 17,793 | |
| Adjusted | | 313,966 | | 328,913 | | 51,123 | | 51,985 | | 17,793 | |
| Customer accounts | | | | | | |
| Reported | | 534,034 | | 529,172 | | 57,227 | | 110,579 | | 22,516 | |
| Adjusted | | 534,034 | | 529,172 | | 57,227 | | 110,579 | | 22,516 | |
1 Net operating income before change in expected credit losses and other credit impairment charges, also referred to as revenue.
2 Includes fair value movements on non-qualifying hedges and debt valuation adjustments on derivatives.
| | | | | | | | | | | | | | | | | | | | | | |
| Reconciliation of reported and adjusted items – geographical regions and selected countries/territories (continued) | |
| | Half-year to 30 Jun 2020 | |
| | Europe | Asia | MENA | North
America | Latin
America | Total | |
| | $m | $m | $m | $m | $m | $m | |
Revenue1 | | | | | | | | |
Reported2 | | 8,976 | | 14,580 | | 1,379 | | 3,405 | | 1,577 | | 26,745 | | |
Currency translation2 | | 879 | | 301 | | (26) | | 74 | | (35) | | 1,117 | | |
| Significant items | | (230) | | (35) | | (1) | | 6 | | (5) | | (265) | | |
| – customer redress programmes | | (26) | | — | | — | | — | | — | | (26) | | |
| – disposals, acquisitions and investment in new businesses | | — | | — | | — | | 8 | | — | | 8 | | |
– fair value movements on financial instruments3 | | (252) | | (34) | | (1) | | (3) | | (9) | | (299) | | |
– restructuring and other related costs4 | | 48 | | — | | — | | 1 | | — | | 49 | | |
| – currency translation on significant items | | — | | (1) | | — | | — | | 4 | | 3 | | |
Adjusted2 | | 9,625 | | 14,846 | | 1,352 | | 3,485 | | 1,537 | | 27,597 | | |
| ECL | | | | | | | | |
| Reported | | (2,885) | | (1,818) | | (611) | | (887) | | (657) | | (6,858) | | |
| Currency translation | | (320) | | (62) | | 3 | | (23) | | (27) | | (429) | | |
| Adjusted | | (3,205) | | (1,880) | | (608) | | (910) | | (684) | | (7,287) | | |
| Operating expenses | | | | | | | | |
Reported2 | | (9,101) | | (6,430) | | (763) | | (2,495) | | (910) | | (16,527) | | |
Currency translation2 | | (791) | | (165) | | 15 | | (46) | | 24 | | (887) | | |
| Significant items | | 1,459 | | 17 | | 41 | | 184 | | 8 | | 1,709 | | |
| | | | | | | | |
| – customer redress programmes | | 50 | | — | | — | | — | | — | | 50 | | |
| | | | | | | | |
| – impairment of goodwill and other intangibles | | 984 | | — | | 41 | | — | | — | | 1,025 | | |
– restructuring and other related costs5 | | 292 | | 18 | | — | | 184 | | 11 | | 505 | | |
| – settlement and provisions in connection with legal and regulatory matters | | 5 | | — | | — | | — | | — | | 5 | | |
| – currency translation on significant items | | 128 | | (1) | | — | | — | | (3) | | 124 | | |
Adjusted2 | | (8,433) | | (6,578) | | (707) | | (2,357) | | (878) | | (15,705) | | |
| Share of profit in associates and joint ventures | | | | | | | | |
| Reported | | (50) | | 1,037 | | (31) | | — | | 2 | | 958 | | |
| Currency translation | | — | | 92 | | (1) | | — | | — | | 91 | | |
| Adjusted | | (50) | | 1,129 | | (32) | | — | | 2 | | 1,049 | | |
| Profit/(loss) before tax | | | | | | | | |
| Reported | | (3,060) | | 7,369 | | (26) | | 23 | | 12 | | 4,318 | | |
| Currency translation | | (232) | | 166 | | (9) | | 5 | | (38) | | (108) | | |
| Significant items | | 1,229 | | (18) | | 40 | | 190 | | 3 | | 1,444 | | |
| – revenue | | (230) | | (35) | | (1) | | 6 | | (5) | | (265) | | |
| – operating expenses | | 1,459 | | 17 | | 41 | | 184 | | 8 | | 1,709 | | |
| Adjusted | | (2,063) | | 7,517 | | 5 | | 218 | | (23) | | 5,654 | | |
| | | | | | | | |
| | | | | | | | |
| Loans and advances to customers (net) | | | | | | | | |
| Reported | | 378,729 | | 474,739 | | 29,615 | | 115,813 | | 19,785 | | 1,018,681 | | |
| Currency translation | | 39,693 | | 8,833 | | (538) | | 4,727 | | 2,452 | | 55,167 | | |
| Adjusted | | 418,422 | | 483,572 | | 29,077 | | 120,540 | | 22,237 | | 1,073,848 | | |
| Customer accounts | | | | | | | | |
| Reported | | 562,505 | | 723,072 | | 41,197 | | 180,489 | | 25,117 | | 1,532,380 | | |
| Currency translation | | 60,068 | | 9,796 | | (670) | | 5,440 | | 2,370 | | 77,004 | | |
| Adjusted | | 622,573 | | 732,868 | | 40,527 | | 185,929 | | 27,487 | | 1,609,384 | | |
1 Net operating income before change in expected credit losses and other credit impairment charges, also referred to as revenue.
2 Amounts are non-additive across geographical regions due to inter-company transactions within the Group.
3 Includes fair value movements on non-qualifying hedges and debt valuation adjustments on derivatives.
4 Comprises losses associated with the RWA reduction commitments we made at our business update in February 2020.
5 Includes impairment of software intangible assets of $173m (of the total software intangible asset impairment of $1,247m).
| | | | | | | | | | | | | | | | | | |
| Reconciliation of reported and adjusted items – geographical regions and selected countries/territories (continued) |
| | Half-year to 30 Jun 2020 |
| | UK | Hong
Kong | Mainland
China | US | Mexico |
| | $m | $m | $m | $m | $m |
Revenue1 | | | | | | |
| Reported | | 6,329 | | 9,075 | | 1,576 | | 2,492 | | 1,139 | |
| Currency translation | | 720 | | — | | 139 | | 1 | | 73 | |
| Significant items | | (219) | | (16) | | — | | 7 | | (4) | |
| – customer redress programmes | | (26) | | — | | — | | — | | — | |
| – disposals, acquisitions and investment in new businesses | | — | | — | | — | | 8 | | — | |
– fair value movements on financial instruments2 | | (243) | | (16) | | — | | (3) | | (6) | |
– restructuring and other related costs3 | | 47 | | — | | — | | 1 | | — | |
| – currency translation on significant items | | 3 | | — | | — | | 1 | | 2 | |
| Adjusted | | 6,830 | | 9,059 | | 1,715 | | 2,500 | | 1,208 | |
| ECL | | | | | | |
| Reported | | (2,492) | | (516) | | (107) | | (615) | | (574) | |
| Currency translation | | (282) | | 1 | | (9) | | — | | (48) | |
| Adjusted | | (2,774) | | (515) | | (116) | | (615) | | (622) | |
| Operating expenses | | | | | | |
| Reported | | (7,210) | | (3,460) | | (1,016) | | (1,957) | | (647) | |
| Currency translation | | (619) | | — | | (89) | | — | | (45) | |
| Significant items | | 1,090 | | 10 | | 1 | | 177 | | 2 | |
| | | | | | |
| – customer redress programmes | | 50 | | — | | — | | — | | — | |
| – impairment of goodwill and other intangibles | | 842 | | — | | — | | — | | — | |
| | | | | | |
| – restructuring and other related costs | | 98 | | 10 | | 1 | | 177 | | 2 | |
| – settlements and provisions in connection with legal and regulatory matters | | 5 | | — | | — | | — | | — | |
| – currency translation on significant items | | 95 | | — | | — | | — | | — | |
| Adjusted | | (6,739) | | (3,450) | | (1,104) | | (1,780) | | (690) | |
| Share of profit in associates and joint ventures | | | | | | |
| Reported | | (49) | | (7) | | 1,044 | | — | | 2 | |
| Currency translation | | (1) | | — | | 92 | | — | | — | |
| Adjusted | | (50) | | (7) | | 1,136 | | — | | 2 | |
| Profit/(loss) before tax | | | | | | |
| Reported | | (3,422) | | 5,092 | | 1,497 | | (80) | | (80) | |
| Currency translation | | (182) | | 1 | | 133 | | 1 | | (20) | |
| Significant items | | 871 | | (6) | | 1 | | 184 | | (2) | |
| – revenue | | (219) | | (16) | | — | | 7 | | (4) | |
| – operating expenses | | 1,090 | | 10 | | 1 | | 177 | | 2 | |
| Adjusted | | (2,733) | | 5,087 | | 1,631 | | 105 | | (102) | |
| Loans and advances to customers (net) | | | | | | |
| Reported | | 285,335 | | 308,798 | | 43,338 | | 68,036 | | 17,220 | |
| Currency translation | | 34,490 | | (609) | | 4,133 | | — | | 2,843 | |
| Adjusted | | 319,825 | | 308,189 | | 47,471 | | 68,036 | | 20,063 | |
| Customer accounts | | | | | | |
| Reported | | 437,735 | | 514,381 | | 47,557 | | 120,236 | | 19,759 | |
| Currency translation | | 52,911 | | (1,013) | | 4,536 | | — | | 3,262 | |
| Adjusted | | 490,646 | | 513,368 | | 52,093 | | 120,236 | | 23,021 | |
1 Net operating income before change in expected credit losses and other credit impairment charges, also referred to as revenue.
2 Includes fair value movements on non-qualifying hedges and debt valuation adjustments on derivatives.
3 Comprises losses associated with the RWA reduction commitments we made at our business update in February 2020.
| | | | | | | | | | | | | | | | | | | | | |
| Reconciliation of reported and adjusted items – geographical regions and selected countries/territories (continued) |
| | Half-year to 31 Dec 2020 |
| | Europe | Asia | MENA | North
America | Latin
America | Total |
| | $m | $m | $m | $m | $m | $m |
Revenue1 | | | | | | | |
Reported2 | | 9,443 | | 12,342 | | 1,249 | | 2,970 | | 1,443 | | 23,684 | |
Currency translation2 | | 507 | | 127 | | (4) | | 44 | | 3 | | 630 | |
| Significant items | | (12) | | (1) | | — | | 35 | | 6 | | 209 | |
| – customer redress programmes | | 47 | | — | | — | | — | | — | | 47 | |
| – disposals, acquisitions and investment in new businesses | | — | | — | | — | | 2 | | — | | 2 | |
– fair value movements on financial instruments3 | | (2) | | 29 | | 1 | | 1 | | 6 | | 35 | |
– restructuring and other related costs2,4 | | (57) | | (32) | | — | | 34 | | — | | 121 | |
| – currency translation on significant items | | — | | 2 | | (1) | | (2) | | — | | 4 | |
Adjusted2 | | 9,938 | | 12,468 | | 1,245 | | 3,049 | | 1,452 | | 24,523 | |
| ECL | | | | | | | |
| Reported | | (866) | | (466) | | (147) | | (13) | | (467) | | (1,959) | |
| Currency translation | | (45) | | 1 | | — | | — | | (28) | | (72) | |
| Adjusted | | (911) | | (465) | | (147) | | (13) | | (495) | | (2,031) | |
| Operating expenses | | | | | | | |
Reported2 | | (9,773) | | (7,232) | | (823) | | (2,812) | | (1,028) | | (17,905) | |
Currency translation2 | | (412) | | (88) | | 4 | | (30) | | 8 | | (471) | |
| Significant items | | 914 | | 155 | | 41 | | 420 | | 76 | | 1,425 | |
| | | | | | | |
| – customer redress programmes | | (104) | | — | | — | | — | | — | | (104) | |
| | | | | | | |
| – impairment of goodwill and other intangibles | | (181) | | — | | 23 | | 223 | | — | | 65 | |
| – past service costs of guaranteed minimum pension benefits equalisation | | 17 | | — | | — | | — | | — | | 17 | |
– restructuring and other related costs2,5 | | 1,133 | | 153 | | 19 | | 194 | | 80 | | 1,403 | |
| – settlements and provisions in connection with legal and regulatory matters | | 7 | | — | | — | | — | | — | | 7 | |
| – currency translation on significant items | | 42 | | 2 | | (1) | | 3 | | (4) | | 37 | |
Adjusted2 | | (9,271) | | (7,165) | | (778) | | (2,422) | | (944) | | (16,951) | |
| Share of profit/(loss) in associates and joint ventures | | | | | | | |
| Reported | | 51 | | 819 | | (234) | | — | | 3 | | 639 | |
| Currency translation | | 1 | | 37 | | — | | — | | — | | 38 | |
| Significant items | | — | | — | | 462 | | — | | — | | 462 | |
– impairment of goodwill6 | | — | | — | | 462 | | — | | — | | 462 | |
| – currency translation on significant items | | — | | — | | — | | — | | — | | — | |
| Adjusted | | 52 | | 856 | | 228 | | — | | 3 | | 1,139 | |
| Profit/(loss) before tax | | | | | | | |
| Reported | | (1,145) | | 5,463 | | 45 | | 145 | | (49) | | 4,459 | |
| Currency translation | | 51 | | 77 | | — | | 14 | | (17) | | 125 | |
| Significant items | | 902 | | 154 | | 503 | | 455 | | 82 | | 2,096 | |
– revenue2 | | (12) | | (1) | | — | | 35 | | 6 | | 209 | |
– operating expenses2 | | 914 | | 155 | | 41 | | 420 | | 76 | | 1,425 | |
– share of profit in associates and joint ventures6 | | — | | — | | 462 | | — | | — | | 462 | |
| Adjusted | | (192) | | 5,694 | | 548 | | 614 | | 16 | | 6,680 | |
| Loans and advances to customers (net) | | | | | | | |
| Reported | | 408,495 | | 473,165 | | 28,700 | | 107,969 | | 19,658 | | 1,037,987 | |
| Currency translation | | 789 | | (2,632) | | (468) | | 1,335 | | (193) | | (1,169) | |
| Adjusted | | 409,284 | | 470,533 | | 28,232 | | 109,304 | | 19,465 | | 1,036,818 | |
| Customer accounts | | | | | | | |
| Reported | | 629,647 | | 762,406 | | 41,221 | | 182,028 | | 27,478 | | 1,642,780 | |
| Currency translation | | 2,306 | | (3,961) | | (563) | | 1,573 | | (487) | | (1,132) | |
| Adjusted | | 631,953 | | 758,445 | | 40,658 | | 183,601 | | 26,991 | | 1,641,648 | |
1 Net operating income before change in expected credit losses and other credit impairment charges, also referred to as revenue.
2 Amounts are non-additive across geographical regions due to inter-company transactions within the Group.
3 Includes fair value movements on non-qualifying hedges and debt valuation adjustments on derivatives.
4 Comprises losses associated with the RWA reduction commitments and gains relating to the business update in February 2020.
5 Includes impairment of tangible assets of $197m.
6 During the six months to 31 December 2020, The Saudi British Bank ('SABB'), an associate of HSBC, impaired the goodwill that arose following the merger with Alawwal bank in 2019. HSBC's post-tax share of the goodwill impairment was $462m.
| | | | | | | | | | | | | | | | | | |
| Reconciliation of reported and adjusted items – geographical regions and selected countries/territories (continued) |
| | Half-year to 31 Dec 2020 |
| | UK | Hong
Kong | Mainland
China | US | Mexico |
| | $m | $m | $m | $m | $m |
Revenue1 | | | | | | |
| Reported | | 7,557 | | 7,270 | | 1,512 | | 2,098 | | 1,095 | |
| Currency translation | | 472 | | (9) | | 71 | | (2) | | 62 | |
| Significant items | | 34 | | 30 | | (5) | | 33 | | (7) | |
| – customer redress programmes | | 47 | | — | | — | | — | | — | |
| – disposals, acquisitions and investment in new businesses | | — | | — | | — | | 2 | | — | |
– fair value movements on financial instruments2 | | (13) | | 16 | | (1) | | 1 | | 5 | |
– restructuring and other related costs3 | | 1 | | 15 | | (4) | | 32 | | (12) | |
| – currency translation on significant items | | (1) | | (1) | | — | | (2) | | — | |
| Adjusted | | 8,063 | | 7,291 | | 1,578 | | 2,129 | | 1,150 | |
| ECL | | | | | | |
| Reported | | (764) | | (308) | | (7) | | (7) | | (476) | |
| Currency translation | | (47) | | 1 | | (1) | | 1 | | (27) | |
| Adjusted | | (811) | | (307) | | (8) | | (6) | | (503) | |
| Operating expenses | | | | | | |
| Reported | | (7,645) | | (3,852) | | (1,195) | | (2,237) | | (729) | |
| Currency translation | | (378) | | 4 | | (55) | | — | | (39) | |
| Significant items | | 354 | | 90 | | 19 | | 380 | | 41 | |
| | | | | | |
| – customer redress programmes | | (104) | | — | | — | | — | | — | |
| | | | | | |
| – impairment of goodwill and other intangibles | | (192) | | — | | — | | 223 | | — | |
| – past service costs of guaranteed minimum pension benefits equalisation | | 17 | | — | | — | | — | | — | |
| – restructuring and other related costs | | 595 | | 90 | | 18 | | 156 | | 40 | |
| – settlements and provisions in connection with legal and regulatory matters | | 7 | | — | | — | | — | | — | |
| – currency translation on significant items | | 31 | | — | | 1 | | 1 | | 1 | |
| Adjusted | | (7,669) | | (3,758) | | (1,231) | | (1,857) | | (727) | |
| Share of profit in associates and joint ventures | | | | | | |
| Reported | | 50 | | 5 | | 805 | | — | | 3 | |
| Currency translation | | 3 | | — | | 35 | | — | | — | |
| Adjusted | | 53 | | 5 | | 840 | | — | | 3 | |
| Profit/(loss) before tax | | | | | | |
| Reported | | (802) | | 3,115 | | 1,115 | | (146) | | (107) | |
| Currency translation | | 50 | | (4) | | 50 | | (1) | | (4) | |
| Significant items | | 388 | | 120 | | 14 | | 413 | | 34 | |
| – revenue | | 34 | | 30 | | (5) | | 33 | | (7) | |
| – operating expenses | | 354 | | 90 | | 19 | | 380 | | 41 | |
| Adjusted | | (364) | | 3,231 | | 1,179 | | 266 | | (77) | |
| Loans and advances to customers (net) | | | | | | |
| Reported | | 314,530 | | 302,454 | | 46,113 | | 58,082 | | 17,296 | |
| Currency translation | | 3,859 | | (469) | | 533 | | — | | (14) | |
| Adjusted | | 318,389 | | 301,985 | | 46,646 | | 58,082 | | 17,282 | |
| Customer accounts | | | | | | |
| Reported | | 504,275 | | 531,489 | | 56,826 | | 117,485 | | 22,220 | |
| Currency translation | | 6,186 | | (824) | | 657 | | — | | (18) | |
| Adjusted | | 510,461 | | 530,665 | | 57,483 | | 117,485 | | 22,202 | |
1 Net operating income before change in expected credit losses and other credit impairment charges, also referred to as revenue.
2 Includes fair value movements on non-qualifying hedges and debt valuation adjustments on derivatives.
3 Comprises losses associated with the RWA reduction commitments we made at our business update in February 2020.
| | |
| Analysis by country/territory |
| | | | | | | | | | | | | | | | | | | | |
| Profit/(loss) before tax by country/territory within global businesses | |
| | Wealth and
Personal Banking | Commercial Banking | Global Banking
and Markets | | Corporate Centre | Total | |
| | $m | $m | $m | | $m | $m | |
| Europe | | 853 | | 1,348 | | 111 | | | (344) | | 1,968 | | |
– UK1 | | 654 | | 1,156 | | (42) | | | (88) | | 1,680 | | |
| of which: HSBC UK Bank plc (ring-fenced bank) | | 802 | | 1,403 | | 58 | | | (125) | | 2,138 | | |
| of which: HSBC Bank plc (non-ring-fenced bank) | | 115 | | 113 | | 327 | | | 22 | | 577 | | |
| of which: Holdings and other | | (263) | | (360) | | (427) | | | 15 | | (1,035) | | |
| – France | | 164 | | 52 | | (41) | | | (72) | | 103 | | |
| – Germany | | 11 | | 41 | | 116 | | | 105 | | 273 | | |
| – Switzerland | | 20 | | 12 | | (1) | | | (12) | | 19 | | |
| – other | | 4 | | 87 | | 79 | | | (277) | | (107) | | |
| Asia | | 2,544 | | 1,259 | | 1,953 | | | 1,180 | | 6,936 | | |
| – Hong Kong | | 2,310 | | 774 | | 767 | | | (218) | | 3,633 | | |
| – Australia | | 83 | | 62 | | 74 | | | (6) | | 213 | | |
| – India | | (11) | | 146 | | 317 | | | 77 | | 529 | | |
| – Indonesia | | 18 | | (8) | | 59 | | | (5) | | 64 | | |
| – mainland China | | (3) | | 171 | | 304 | | | 1,359 | | 1,831 | | |
| – Malaysia | | 36 | | (68) | | 59 | | | (10) | | 17 | | |
| – Singapore | | 96 | | 54 | | 134 | | | (7) | | 277 | | |
| – Taiwan | | 11 | | 7 | | 58 | | | (1) | | 75 | | |
| – other | | 4 | | 121 | | 181 | | | (9) | | 297 | | |
| Middle East and North Africa | | 80 | | 145 | | 402 | | | 96 | | 723 | | |
| – Egypt | | 36 | | 18 | | 77 | | | (4) | | 127 | | |
| – UAE | | 37 | | 22 | | 188 | | | (35) | | 212 | | |
| – Saudi Arabia | | 11 | | — | | 23 | | | 139 | | 173 | | |
| – other | | (4) | | 105 | | 114 | | | (4) | | 211 | | |
| North America | | 4 | | 522 | | 419 | | | (140) | | 805 | | |
| – US | | (86) | | 243 | | 318 | | | (102) | | 373 | | |
| – Canada | | 72 | | 274 | | 85 | | | (36) | | 395 | | |
| – other | | 18 | | 5 | | 16 | | | (2) | | 37 | | |
| Latin America | | 165 | | 102 | | 174 | | | (34) | | 407 | | |
| – Mexico | | 178 | | 73 | | 134 | | | (25) | | 360 | | |
| – other | | (13) | | 29 | | 40 | | | (9) | | 47 | | |
| Half-year to 30 Jun 2021 | | 3,646 | | 3,376 | | 3,059 | | | 758 | | 10,839 | | |
| | | | | | | | |
| | | | | | | | |
| Europe | | (898) | | (678) | | (1,298) | | | (186) | | (3,060) | | |
– UK1 | | (536) | | (638) | | (1,243) | | | (1,005) | | (3,422) | | |
| of which: HSBC UK Bank plc (ring-fenced bank) | | (275) | | (242) | | 39 | | | (10) | | (488) | | |
| of which: HSBC Bank plc (non-ring-fenced bank) | | 44 | | 1 | | (858) | | | (279) | | (1,092) | | |
| of which: Holdings and other | | (305) | | (397) | | (424) | | | (716) | | (1,842) | | |
| – France | | (343) | | (127) | | (207) | | | (64) | | (741) | | |
| – Germany | | 12 | | (4) | | 109 | | | (9) | | 108 | | |
| – Switzerland | | (15) | | 3 | | 1 | | | (1) | | (12) | | |
| – other | | (16) | | 88 | | 42 | | | 893 | | 1,007 | | |
| Asia | | 2,799 | | 921 | | 2,393 | | | 1,256 | | 7,369 | | |
| – Hong Kong | | 2,790 | | 1,173 | | 1,119 | | | 10 | | 5,092 | | |
| – Australia | | 32 | | 35 | | 78 | | | 1 | | 146 | | |
| – India | | 5 | | 83 | | 313 | | | 160 | | 561 | | |
| – Indonesia | | (11) | | (1) | | 81 | | | (8) | | 61 | | |
| – mainland China | | (26) | | 190 | | 232 | | | 1,101 | | 1,497 | | |
| – Malaysia | | 1 | | 12 | | 82 | | | (6) | | 89 | | |
| – Singapore | | 3 | | (682) | | 140 | | | (9) | | (548) | | |
| – Taiwan | | 12 | | 12 | | 58 | | | (1) | | 81 | | |
| – other | | (7) | | 99 | | 290 | | | 8 | | 390 | | |
| Middle East and North Africa | | (63) | | (122) | | 208 | | | (49) | | (26) | | |
| – Egypt | | 34 | | 19 | | 101 | | | 1 | | 155 | | |
| – UAE | | (40) | | (158) | | 23 | | | (23) | | (198) | | |
| – Saudi Arabia | | 5 | | — | | 14 | | | (32) | | (13) | | |
| – other | | (62) | | 17 | | 70 | | | 5 | | 30 | | |
| North America | | (224) | | (62) | | 509 | | | (200) | | 23 | | |
| – US | | (274) | | (89) | | 463 | | | (180) | | (80) | | |
| – Canada | | 32 | | 25 | | 34 | | | (22) | | 69 | | |
| – other | | 18 | | 2 | | 12 | | | 2 | | 34 | | |
| Latin America | | (123) | | 18 | | 102 | | | 15 | | 12 | | |
| – Mexico | | (67) | | (31) | | (5) | | | 23 | | (80) | | |
| – other | | (56) | | 49 | | 107 | | | (8) | | 92 | | |
| Half-year to 30 Jun 2020 | | 1,491 | | 77 | | 1,914 | | | 836 | | 4,318 | | |
| | | | | | | | | | | | | | | | | | | |
| Profit/(loss) before tax by country/territory within global businesses (continued) |
| | Wealth and Personal Banking | Commercial Banking | Global Banking and Markets | | Corporate
Centre |
Total |
| | $m | $m | $m | | $m | $m |
| Europe | | 218 | | 149 | | (511) | | | (1,001) | | (1,145) | |
– UK1 | | 179 | | 95 | | (526) | | | (550) | | (802) | |
| of which: HSBC UK Bank plc (ring-fenced bank) | | 388 | | 409 | | 51 | | | (114) | | 734 | |
| of which: HSBC Bank plc (non-ring-fenced bank) | | 65 | | 35 | | (172) | | | (175) | | (247) | |
| of which: Holdings and other | | (274) | | (349) | | (405) | | | (261) | | (1,289) | |
| – France | | 3 | | (41) | | (140) | | | (246) | | (424) | |
| – Germany | | 5 | | 20 | | 88 | | | (6) | | 107 | |
| – Switzerland | | 13 | | (7) | | (1) | | | (9) | | (4) | |
| – other | | 18 | | 82 | | 68 | | | (190) | | (22) | |
| Asia | | 2,232 | | 1,023 | | 1,609 | | | 599 | | 5,463 | |
| – Hong Kong | | 2,137 | | 614 | | 555 | | | (191) | | 3,115 | |
| – Australia | | 76 | | 41 | | 60 | | | (8) | | 169 | |
| – India | | 11 | | 104 | | 280 | | | 68 | | 463 | |
| – Indonesia | | 5 | | (13) | | 66 | | | (5) | | 53 | |
| – mainland China | | (8) | | 105 | | 274 | | | 744 | | 1,115 | |
| – Malaysia | | 7 | | 21 | | 59 | | | (49) | | 38 | |
| – Singapore | | 42 | | 38 | | 99 | | | (3) | | 176 | |
| – Taiwan | | (3) | | 6 | | 46 | | | (1) | | 48 | |
| – other | | (35) | | 107 | | 170 | | | 44 | | 286 | |
| Middle East and North Africa | | 48 | | 2 | | 270 | | | (275) | | 45 | |
| – Egypt | | 34 | | 27 | | 84 | | | (2) | | 143 | |
| – UAE | | 19 | | (52) | | 79 | | | (16) | | 30 | |
| – Saudi Arabia | | 16 | | — | | 12 | | | (232) | | (204) | |
| – other | | (21) | | 27 | | 95 | | | (25) | | 76 | |
| North America | | (225) | | 428 | | 203 | | | (261) | | 145 | |
| – US | | (273) | | 228 | | 110 | | | (211) | | (146) | |
| – Canada | | 20 | | 200 | | 66 | | | (45) | | 241 | |
| – other | | 28 | | — | | 27 | | | (5) | | 50 | |
| Latin America | | (60) | | (40) | | 131 | | | (80) | | (49) | |
| – Mexico | | (48) | | (75) | | 64 | | | (48) | | (107) | |
| – other | | (12) | | 35 | | 67 | | | (32) | | 58 | |
| | | | | | | |
| Half-year to 31 Dec 2020 | | 2,213 | | 1,562 | | 1,702 | | | (1,018) | | 4,459 | |
1 UK includes results from the ultimate holding company, HSBC Holdings plc, and the separately incorporated group of service companies (‘ServCo Group’).
Reconciliation of alternative performance measures
| | | | | |
| Reconciliation of alternative performance measures |
| Page |
| Use of alternative performance measures | |
| Return on average ordinary shareholders’ equity and return on average tangible equity | |
| Net asset value and tangible net asset value per ordinary share | |
| Post-tax return and average total shareholders’ equity on average total assets | |
| Expected credit losses and other credit impairment charges as % of average gross loans and advances to customers | |
| |
| | |
| Use of alternative performance measures |
Our reported results are prepared in accordance with IFRSs as detailed in our interim condensed financial statements starting on page 98.
As described on page 27, we use a combination of reported and alternative performance measures, including those derived from our reported results that eliminate factors that distort period-on-period comparisons. These are considered alternative performance measures (non-GAAP financial measures).
The following information details the adjustments made to the reported results and the calculation of other alternative performance measures. All alternative performance measures are reconciled to the closest reported performance measure.
| | |
Return on average ordinary shareholders’
equity and return on average tangible equity |
Return on average ordinary shareholders’ equity (‘RoE’) is computed by taking profit attributable to the ordinary shareholders of the parent company (‘reported results’), divided by average ordinary shareholders’ equity (‘reported equity’) for the period. The adjustment to reported results and reported equity excludes amounts attributable to non-controlling interests and holders of preference shares and other equity instruments.
Return on average tangible equity (‘RoTE’) is computed by adjusting reported results for the movements in the present value of in-force long-term insurance business (‘PVIF’) and for impairment of goodwill and other intangible assets (net of tax), divided by average reported equity adjusted for goodwill, intangibles and PVIF for the period.
Return on average tangible equity excluding significant items is annualised profit attributable to ordinary shareholders, excluding changes in PVIF, significant items and bank levy (net of tax), divided by average tangible shareholders’ equity excluding fair value of own debt, debt valuation adjustment (‘DVA’) and other adjustments for the period. Since 1 January 2021, the UK bank levy has no longer been excluded from the calculation of this measure. Comparative data have not been re-presented.
We provide RoTE ratios in addition to RoE as a way of assessing our performance, which is closely aligned to our capital position.
| | | | | | | | | | | |
| Return on average ordinary shareholders’ equity and return on average tangible equity | | | |
| Half-year ended | Year ended |
| 30 Jun | 30 Jun | 31 Dec |
| 2021 | 2020 | 2020 |
| $m | $m | $m |
| Profit | | | |
| Profit attributable to the ordinary shareholders of the parent company | 7,276 | | 1,977 | | 3,898 | |
| Impairment of goodwill and other intangible assets (net of tax) | — | | 1,154 | | 1,036 | |
| Decrease/(increase) in PVIF (net of tax) | 16 | | (310) | | (253) | |
| Profit attributable to ordinary shareholders, excluding goodwill impairment and PVIF | 7,292 | | 2,821 | | 4,681 | |
Significant items (net of tax) and other adjustments1 | 994 | | 227 | | 2,402 | |
Profit attributable to ordinary shareholders, excluding goodwill impairment, PVIF and significant items1 | 8,286 | | 3,048 | | 7,083 | |
| Equity | | | |
| Average total shareholders’ equity | 197,402 | 187,633 | | 189,719 | |
| Effect of average preference shares and other equity instruments | (23,414) | | (22,308) | | (22,326) | |
| Average ordinary shareholders’ equity | 173,988 | 165,325 | | 167,393 | |
| Effect of goodwill, PVIF and other intangibles (net of deferred tax) | (17,576) | | (17,310) | | (17,292) | |
| Average tangible equity | 156,412 | 148,015 | | 150,101 | |
| Fair value of own debt, DVA and other adjustments | 3,286 | (852) | | 422 | |
| Average tangible equity excluding fair value of own debt, DVA and other adjustments | 159,698 | 147,163 | | 150,523 | |
| Ratio | % | % | % |
| Return on average ordinary shareholders’ equity (annualised) | 8.4 | | 2.4 | | 2.3 | |
| Return on average tangible equity (annualised) | 9.4 | | 3.8 | | 3.1 | |
Return on average tangible equity excluding significant items (annualised)1 | 10.5 | | 4.2 | | 4.7 | |
1 Since 1 January 2021, the UK bank levy has no longer been excluded from the calculation of this measure. Comparative data have not been re-presented.
| | | | | | | | | | | | | | | | | |
| Return on average tangible equity by global business |
| Half-year ended 30 Jun 2021 |
| Wealth and
Personal
Banking | Commercial
Banking | Global
Banking and
Markets | Corporate
Centre | Total |
| $m | $m | $m | $m | $m |
| Profit before tax | 3,646 | | 3,376 | | 3,059 | | 758 | | 10,839 | |
| Tax expense | (769) | | (874) | | (624) | | (150) | | (2,417) | |
| Profit after tax | 2,877 | | 2,502 | | 2,435 | | 608 | | 8,422 | |
| Less attributable to: preference shareholders, other equity holders, non-controlling interests | (389) | | (343) | | (382) | | (32) | | (1,146) | |
| Profit attributable to ordinary shareholders of the parent company | 2,488 | | 2,159 | | 2,053 | | 576 | | 7,276 | |
| Decrease/(increase) in PVIF (net of tax) | 9 | | 10 | | — | | (3) | | 16 | |
Significant items (net of tax)1 | 169 | | (6) | | 197 | | 600 | | 960 | |
| Other adjustments | — | | (1) | | (1) | | 36 | | 34 | |
Profit attributable to ordinary shareholders, excluding PVIF and significant items1 | 2,666 | | 2,162 | | 2,249 | | 1,209 | | 8,286 | |
| Average tangible shareholders’ equity excluding fair value of own debt, DVA and other adjustments | 29,971 | | 39,310 | | 42,428 | | 47,989 | | 159,698 | |
RoTE excluding significant items (annualised) (%)1 | 17.9 | 11.1 | 10.7 | 5.1 | 10.5 |
|
| Half-year ended 30 Jun 2020 |
| Profit before tax | 1,491 | | 77 | | 1,914 | | 836 | | 4,318 | |
| Tax expense | (269) | | (147) | | (650) | | (127) | | (1,193) | |
| Profit after tax | 1,222 | | (70) | | 1,264 | | 709 | | 3,125 | |
| Less attributable to: preference shareholders, other equity holders, non-controlling interests | (353) | | (330) | | (322) | | (143) | | (1,148) | |
| Profit attributable to ordinary shareholders of the parent company | 869 | | (400) | | 942 | | 566 | | 1,977 | |
| Increase in PVIF (net of tax) | (299) | | (9) | | — | | (2) | | (310) | |
| Significant items (net of tax) and UK bank levy | 195 | | 109 | | 624 | | 272 | | 1,200 | |
| Other adjustments | 8 | | (3) | | (4) | | 180 | | 181 | |
| Profit attributable to ordinary shareholders, excluding PVIF, significant items and UK bank levy | 773 | | (303) | | 1,562 | | 1,016 | | 3,048 | |
| Average tangible shareholders’ equity excluding fair value of own debt, DVA and other adjustments | 25,865 | | 37,233 | | 40,865 | | 43,200 | | 147,163 | |
| RoTE excluding significant items and UK bank levy (annualised) (%) | 6.0 | (1.6) | 7.7 | 4.7 | 4.2 |
|
| Year ended 31 Dec 2020 |
| Profit before tax | 3,704 | | 1,639 | | 3,616 | | (182) | | 8,777 | |
| Tax expense | (509) | | (661) | | (977) | | (531) | | (2,678) | |
| Profit after tax | 3,195 | | 978 | | 2,639 | | (713) | | 6,099 | |
| Less attributable to: preference shareholders, other equity holders, non-controlling interests | (736) | | (673) | | (784) | | (8) | | (2,201) | |
| Profit attributable to ordinary shareholders of the parent company | 2,459 | | 305 | | 1,855 | | (721) | | 3,898 | |
| Increase in PVIF (net of tax) | (242) | | (10) | | — | | (1) | | (253) | |
| Significant items (net of tax) and UK bank levy | 190 | | 208 | | 958 | | 2,041 | | 3,397 | |
| Other adjustments | 20 | | (14) | | (25) | | 60 | | 41 | |
| Profit attributable to ordinary shareholders, excluding PVIF, significant items and UK bank levy | 2,427 | | 489 | | 2,788 | | 1,379 | | 7,083 | |
| Average tangible shareholders’ equity excluding fair value of own debt, DVA and other adjustments | 26,551 | | 37,826 | | 41,566 | | 44,580 | | 150,523 | |
| RoTE excluding significant items and UK bank levy (annualised) (%) | 9.1 | 1.3 | 6.7 | 3.1 | 4.7 |
1 Since 1 January 2021, the UK bank levy has no longer been excluded from the calculation of this measure. Comparative data have not been re-presented.
Reconciliation of alternative performance measures | Risk
| | |
| Net asset value and tangible net asset value per ordinary share |
Net asset value per ordinary share is total shareholders' equity less non-cumulative preference shares and capital securities (‘total ordinary shareholders’ equity’), divided by the number of ordinary shares in issue excluding shares that the company has purchased and are held in treasury.
Tangible net asset value per ordinary share is total ordinary shareholders’ equity excluding goodwill, PVIF and other intangible assets (net of deferred tax) (‘tangible ordinary shareholders’ equity’), divided by the number of basic ordinary shares in issue excluding shares that the company has purchased and are held in treasury.
| | | | | | | | | | | |
| Net asset value and tangible net asset value per ordinary share | | | |
| At |
| 30 Jun | 30 Jun | 31 Dec |
| 2021 | 2020 | 2020 |
| $m | $m | $m |
| Total shareholders’ equity | 198,218 | | 187,036 | | 196,443 | |
| Preference shares and other equity instruments | (22,414) | | (22,319) | | (22,414) | |
| Total ordinary shareholders’ equity | 175,804 | | 164,717 | | 174,029 | |
| Goodwill, PVIF and intangible assets (net of deferred tax) | (17,819) | | (16,838) | | (17,606) | |
| Tangible ordinary shareholders’ equity | 157,985 | | 147,879 | | 156,423 | |
| Basic number of $0.50 ordinary shares outstanding | 20,223 | | 20,162 | | 20,184 | |
| Value per share | $ | $ | $ |
| Net asset value per ordinary share | 8.69 | | 8.17 | | 8.62 | |
| Tangible net asset value per ordinary share | 7.81 | | 7.34 | | 7.75 | |
| | |
| Post-tax return and average total shareholders’ equity on average total assets |
Post-tax return on average total assets is profit after tax divided by average total assets for the period.
Average total shareholders’ equity to average total assets is average total shareholders’ equity divided by average total assets for the period.
| | | | | | | | | | | |
| Post-tax return and average total shareholders’ equity on average total assets |
| Half-year ended | Year-ended |
| 30 Jun | 30 Jun | 31 Dec |
| 2021 | 2020 | 2020 |
| $m | $m | $m |
| Profit after tax | 8,422 | | 3,125 | | 6,099 | |
| Average total shareholders’ equity | 197,402 | | 187,633 | | 189,719 | |
| Average total assets | 3,011,306 | | 2,883,976 | | 2,936,939 | |
| | | |
| Ratio | % | % | % |
| Post-tax return on average total assets (annualised) | 0.6 | | 0.2 | | 0.2 | |
| Average total shareholders’ equity to average total assets | 6.56 | | 6.51 | | 6.46 | |
| | |
| Expected credit losses and other credit impairment charges as % of average gross loans and advances to customers |
Expected credit losses and other credit impairment charges (‘ECL’) as % of average gross loans and advances to customers is the annualised adjusted ECL divided by adjusted average gross loans and advances to customers for the period.
The adjusted numbers are derived by adjusting reported ECL and loans and advances to customers for the effects of foreign currency translation differences.
| | | | | | | | | | | |
| Expected credit losses and other credit impairment charges as % of average gross loans and advances to customers |
| Half-year ended |
| 30 Jun | 30 Jun | 31 Dec |
| 2021 | 2020 | 2020 |
| $m | $m | $m |
| Expected credit losses and other credit impairment charges (‘ECL’) | 719 | | (6,858) | | (1,959) | |
| Currency translation | — | | (429) | | (72) | |
| Adjusted ECL | 719 | | (7,287) | | (2,031) | |
| Average gross loans and advances to customers | 1,059,548 | | 1,042,683 | | 1,046,476 | |
| Currency translation | 582 | | 48,388 | | 29,004 | |
| Average gross loans and advances to customers – at most recent balance sheet foreign exchange rates | 1,060,130 | | 1,091,071 | | 1,075,480 | |
| | | |
| Ratio | % | % | % |
| Expected credit losses and other credit impairment charges as % of average gross loans and advances to customers (annualised) | (0.14) | | 1.34 | | 0.38 | |
| | | | | |
| Risk |
| Page |
| Key developments in the first half of 2021 | |
| Areas of special interest | |
| Credit risk | |
| Treasury risk | |
| Market risk | |
| Insurance manufacturing operations risk | |
We recognise that the primary role of risk management is to protect our customers, business, colleagues, shareholders and the communities that we serve, while ensuring we are able to support our strategy and provide sustainable growth.
The implementation of our business strategy, which includes a major transformation programme, remains a key focus. As we implement change initiatives, we actively manage the execution risks. We also perform periodic risk assessments, including against strategies, to help ensure retention of key personnel for our continued safe operation.
We aim to use a comprehensive risk management approach across the organisation and across all risk types, underpinned by our culture and values. This is outlined in our risk management framework, including the key principles and practices that we employ in managing material risks, both financial and non-financial. The framework fosters continual monitoring, promotes risk awareness and encourages sound operational and strategic decision making. It also supports a consistent approach to identifying, assessing, managing and reporting the risks we accept and incur in our activities. We continue to actively review and develop our risk management framework and enhance our approach to managing risk, through our activities with regard to: people and capabilities; governance; reporting and management information; credit risk management models; and data.
All our people are responsible for the management of risk, with the ultimate accountability residing with the Board. We merged our Group Risk and Compliance functions on 1 July 2021 to take an increasingly comprehensive view of risk, and enhance cross-discipline collaboration on key areas such as fraud, credit and conduct risk. This merger does not impact our current policies and practices regarding the management of risk set out in the Annual Report and Accounts 2020. Led by the Group Chief Risk and Compliance Officer, this merged function plays an important role in reinforcing our culture and values. It focuses on creating an environment that encourages our people to speak up and do the right thing.
Group Risk and Compliance is independent from the global businesses, including our sales and trading functions, to provide challenge, oversight and appropriate balance in risk/reward decisions.
A summary of our current policies and practices regarding the management of risk is set out in the ‘Risk management’ section on pages 107 to 109 of the Annual Report and Accounts 2020.
| | |
| Key developments in the first half of 2021 |
We continued to actively manage the risks resulting from the Covid-19 outbreak and its impacts on our customers and operations during the first half of 2021, as well as other key risks described in this section. In addition, we enhanced our risk management in the following areas:
•We streamlined the articulation of our risk appetite framework, providing further clarity on how risk appetite interacts with strategic planning and recovery planning processes.
•We continued to simplify our approach to non-financial risk management, with the implementation of more effective oversight tools and techniques to improve end-to-end identification and management of these risks.
•We accelerated the transformation of our approach to managing financial risks across the businesses and risk functions, including initiatives to enhance portfolio monitoring
and analytics, credit risk, traded risk and treasury risk management, as well as the models used to manage financial risks.
•We continued to enhance our approach to portfolio and concentration risk management, through clearly defined roles and responsibilities, and improving our data and management information reporting capabilities.
•We appointed a Head of Climate Risk in support of our climate change strategy and to oversee the development of our climate risk management capabilities. Our climate risk programme will shape our approach to climate risk across four key pillars: governance and risk appetite; risk management; stress testing; and disclosures. We enhanced our risk appetite statement with quantitative climate risk metrics.
•We continued to improve the effectiveness of our financial crime controls with a targeted update of our fraud controls. We refreshed our financial crime policies, ensuring they remained up-to-date and addressed changing and emerging risks, and we continued to meet our regulatory obligations.
•We introduced enhanced governance and oversight around model adjustments and related processes for IFRS 9 models and Sarbanes-Oxley controls.
| | |
| Areas of special interest |
During the first half of 2021, a number of areas were considered as part of our top and emerging risks because of the effect they have on the Group. In this section we have focused on risks related to Covid-19, geopolitical and macroeconomic risk, and interbank offered rate (‘Ibor’) transition.
Risks related to Covid-19
The Covid-19 outbreak and its effect on the global economy have impacted our customers. The outbreak necessitated governments to respond at unprecedented levels to protect public health, and to support local economies and livelihoods. It affected regions at different times and to varying degrees. Various government support measures and restrictions in response have added challenges, given the rapid pace of change and significant operational demands. The speed at which countries and territories are able to return to pre-Covid-19 levels of economic activity will vary based on the extent of continuing government support offered, infection rates and the ability to roll out vaccines. Renewed outbreaks emphasise the ongoing threat of Covid-19, as seen in India during the first half of 2021 following the outbreak of a new variant of the virus, and may again result in renewed tightening of government restrictions following recent relaxations.
Government restrictions imposed around the world to limit the spread of Covid-19 resulted in a sharp contraction in global economic activity during 2020. Our Central scenario used to calculate impairment assumes that economic activity will recover over the course of 2021. In this scenario, recovery is supported by a successful roll-out of vaccination programmes across our key markets, and the use of a variety of non-pharmacological measures to contain the virus. Governments and central banks are expected to continue to work together across many of our key markets to ensure that households and firms receive an appropriate level of financial support until restrictions on economic activity and mobility can be materially eased. There is a high degree of uncertainty associated with economic forecasts in the current environment and there are significant risks to our Central scenario. The degree of uncertainty varies by market, driven by country-specific trends in the evolution of the pandemic and associated policy responses. As a result, our Central scenario for impairment has not been assigned an equal likelihood of occurrence across our key markets. For further details of our Central and other scenarios, see ‘Measurement uncertainty and sensitivity analysis of ECL estimates’ on page 63.
There is a material risk of a renewed drop in economic activity, particularly in countries with low vaccination rates. The economic fallout from the Covid-19 outbreak risks increasing inequality across markets that have already suffered from social unrest. It
will likely take time before societies return to pre-pandemic levels of social interactions, meaning that increased inequalities in living standards within societies will continue to disrupt most markets in the medium term. This will leave the burden on governments and central banks to maintain or increase fiscal and monetary stimulus, possibly in a more targeted fashion than seen during 2020 and the first half of 2021. After financial markets suffered a sharp fall in the early phases of the spread of Covid-19, they rebounded but still remain volatile. Depending on the long-term impact on global economic growth, financial asset prices may suffer a further sharp fall.
Governments and central banks in major economies have deployed extensive measures to support their local populations. Central banks in developed markets are expected to maintain historically low interest rates for a considerable period of time, but some of their emerging markets counterparts have begun to increase their interest rates to contain rising inflation or counter the risk of capital outflows. Government debt has risen in most advanced economies, and is expected to remain high into the medium term. This could eventually pose a dilemma for central banks, as they face the conflicting aims of keeping debt servicing costs contained while preventing a steep rise in inflation.
We continue to support our personal and business customers through market-specific measures initiated during the Covid-19 outbreak, and by supporting national government schemes that focus on the parts of the economy most impacted by the pandemic. For further details of our customer relief programmes, see page 75.
The rapid introduction and varying nature of the government support schemes introduced throughout the Covid-19 pandemic has led to increased operational risks, including complex conduct considerations, increased reputational risk and increased risk of fraud. These risks are likely to be heightened further as and when those government support schemes are unwound. Central bank and government actions and support measures, and our responses to those, have also led to increased litigation risk, including lawsuits that have been and may continue to be brought in connection with our cancellation of the fourth interim dividend for 2019.
The impact of the pandemic on the long-term prospects of businesses in the most vulnerable sectors of the economy – such as retail, hospitality and commercial real estate – remains uncertain and may lead to significant credit losses on specific exposures, which may not be fully captured in ECL estimates. In addition, in times of stress, fraudulent activity is often more prevalent, leading to potentially significant credit or operational losses.
As economic conditions improve, and government support measures come to an end, there is a risk that the outputs of IFRS 9 models may have a tendency to underestimate loan losses. Model outputs and management adjustments are closely monitored and independently reviewed at the Group and country level for reliability and appropriateness prior to inclusion in the financial results. We are also working to redevelop models used to calculate capital levels and drive business decisions. These include those related to credit and traded risk to address new and changing regulatory requirements to internal ratings-based methodologies, Ibor replacement and the fundamental review of the trading book.
The operational support functions on which the Group relies are based in a number of countries worldwide, some of which, notably India, have been particularly affected by the Covid-19 outbreak and have recently experienced a significant increase in infection rates. As a result of the Covid-19 outbreak, business continuity responses have been implemented, with no significant impacts to service delivery in locations where the Group operates. We continue to monitor the situation, in particular in those countries and regions where the level of Covid-19 infections is most prevalent.
Despite the ongoing economic recovery, significant uncertainties remain in assessing the duration and impact of the Covid-19 outbreak, including whether any subsequent outbreaks result in a
reimposition of government restrictions. There is a risk that economic activity remains below pre-pandemic levels for a prolonged period. We continue to monitor the situation closely, and given the novel and prolonged nature of the outbreak, additional mitigating actions may be required.
Geopolitical and macroeconomic risk
Our operations and portfolios are exposed to risks associated with political instability, civil unrest and military conflict, which could lead to disruption of our operations, physical risk to our staff and/or physical damage to our assets.
Global tensions over trade, technology and ideology are manifesting themselves in divergent regulatory standards and compliance regimes, presenting long-term strategic challenges for multinational businesses.
The Covid-19 outbreak, including its perceived origins and responses, has also heightened geopolitical tensions, which could have potential ramifications for the Group and its customers. Developments in Hong Kong, the US approach to strategic competition with China, supply chain restrictions, claims of human rights violations, diplomatic tensions between China and the UK, the EU, India and other countries, and other potential areas of tension may affect the Group by creating regulatory, reputational and market risks. Some of these tensions have manifested themselves through actions taken by governments in 2020 and during the first half of 2021.
The US-China relationship in particular remains complex, with divisions over a number of issues. The US has imposed a range of sanctions and trade restrictions on Chinese individuals and companies. These include sanctions and trade restrictions on those individuals and companies that the US considers to be involved in human rights violations; the erosion of Hong Kong’s autonomy; China’s military-industrial complex; and technology and telecommunications that implicate US national security. The Biden administration issued an advisory highlighting risks, including reputational, regulatory, financial and legal risks for businesses operating in Hong Kong. This was issued in light of recent actions by the governments of China and Hong Kong, including the passing of the national security law.
Certain measures are of particular relevance. The US Hong Kong Autonomy Act authorises the imposition of secondary sanctions against non-US financial institutions found to be knowingly engaged in significant transactions with individuals and entities subject to US sanctions for engaging in certain activities that undermine Hong Kong’s autonomy. In addition, the US has imposed restrictions on US persons’ ability to purchase or sell certain publicly traded securities linked to a number of prominent Chinese companies.
There are also increasing discussions between the US and other governments on multilateral efforts to address certain issues with China, which are likely to create a more complex operating environment for the Group and its customers. Notably, the US has increasingly instituted sanctions with its traditional allies including the EU, UK, and Canada, primarily in response to allegations of human rights abuses in Xinjiang.
In response, over the last year, China announced a number of its own sanctions and trade restrictions that target or provide authority to target foreign individuals and companies, which have been primarily imposed against certain public officials associated with the implementation of foreign sanctions against China. More generally, China has promulgated new laws that provide a legal framework for further imposing such sanctions, prohibit implementing or complying with foreign sanctions against China and create private rights of action in Chinese courts for damages caused by third parties implementing foreign sanctions or other discriminatory measures. To date, no financial institution has been targeted for action under these measures. However, it should be noted that the scope and application of the recent Chinese laws remain uncertain. These and any future measures and countermeasures that may be taken by the US, China and other countries may affect the Group, its customers and the markets in which the Group operates.
Expanding data privacy and cybersecurity laws in a number of markets could pose potential challenges to intra-group data sharing. These developments could increase financial institutions’ compliance burdens in respect of cross-border transfers of personal information.
As geopolitical tensions rise, compliance by multinational corporations with their legal or regulatory obligations in one jurisdiction may be seen as supporting the law or policy objectives of that jurisdiction over another, creating additional compliance, reputational and political risks for the Group. We maintain an open dialogue with our regulators on the impact of legal and regulatory obligations on HSBC's business and customers.
Multilateral institutions have mobilised support for emerging and frontier economies, with the International Monetary Fund expected to approve a $650bn increase in reserve assets in August 2021. Much of this is anticipated to go towards countering the effects of the pandemic on the countries that have most suffered. Developed markets are expected to continue recovering from the economic crisis, as macroeconomic policies remain highly accommodative. However, permanent business closures and job losses in some sectors will likely prevent some developed markets from achieving pre-crisis activity levels in the near term. These countries and territories should be able to manage the higher public deficits and debts necessary to offset private sector weaknesses, given that debt servicing costs are likely to remain low for the foreseeable future. Nevertheless, renewed government restrictions in response to new waves of infections could once again put pressure on these economies.
A benign near-term outlook for global economic growth may benefit the creditworthiness of HSBC’s clients and foster business growth. We continue to monitor the situation.
Central bank interest rates remain at historically low levels, although a vaccine-led economic recovery and rising inflation indicators contributed to an increase in interest rate yields and a steepening of yield curves in our major markets in the first half of 2021. Against a backdrop of high and rising asset valuations, monetary policies remained very accommodative during this period, but rising inflation is posing a policy dilemma for some central banks. We continue to monitor our risk profile closely in the context of a possible tightening in monetary policy.
The recovery in the global economy since the beginning of 2021 is easing financial difficulties for some of our customers. As a result, we have seen a reduction in ECL charges for wholesale GBM and CMB customers. For further details on customer relief programmes, see page 75.
Potential changes to tax legislation and tax rates in the countries in which we operate could increase the Group’s effective tax rate in future periods as governments in many countries seek revenue sources to pay for the Covid-19 support packages that they have implemented. In June 2021, the finance ministers of G7 countries reached agreement on the key principles with respect to the introduction of a global minimum tax rate. This was followed in July 2021 by confirmation from the Organisation for Economic Co-operation and Development of agreement across 130 countries (including all of the G20 countries) to the key components of the proposed rules and commitment to implement the global minimum tax rate by 2023. The financial impact on HSBC will depend significantly on the minimum tax rate, which is proposed by the G7 and G20 to be at least 15%, as well as finalisation of several key aspects of the calculations. It is expected that the rules will be finalised during the second half of 2021. Given the uncertainty of both the application of these proposed tax rules (and any further implications on related tax requirements) and the future mix of profits earned by geography, we are not able to reliably estimate the potential impact at this stage.
The EU and the UK agreed a Trade and Cooperation Agreement just before the end of the transition period on 31 December 2020, following the UK’s withdrawal from the EU. The agreement mainly focuses on goods and services but also covers a wide range of other areas, including competition, state aid, tax, fisheries, transport, data and security. It addressed financial services in a limited manner and, as a result, did not change HSBC’s planning
in relation to the UK’s withdrawal from the EU. Bilateral discussions have now concluded at a technical level to create the framework for voluntary regulatory cooperation in financial services between the UK and EU through the establishment of a Joint UK-EU Financial Regulatory Forum, which will provide a platform within which both parties will be able to discuss financial services-related issues including future equivalence determinations.
Our global presence and diversified customer base should help mitigate the direct impacts on our financial position of the absence of a comprehensive agreement on financial services between the UK and EU. Our existing wholesale and markets footprint in the EU provides a strong foundation for us to build upon. Over the medium to long term the UK’s withdrawal from the EU may impact markets and increase economic risk, particularly in the UK, which could adversely impact our profitability and prospects for growth in this market.
Ibor transition
Interbank offered rates (‘Ibors’) are used to set interest rates on hundreds of trillions of US dollars of different types of financial transactions and are used extensively for valuation purposes, risk measurement and performance benchmarking.
The UK’s Financial Conduct Authority (‘FCA’) announced in July 2017 that it would no longer continue to persuade or require panel banks to submit rates for the London interbank offered rate (‘Libor’) after 2021. In addition, the 2016 EU Benchmark Regulation, which aims to ensure the accuracy, robustness and integrity of interest rate benchmarks, has resulted in other regulatory bodies reassessing their national benchmarks. As a result, HSBC is participating in industry-led national working groups, which are discussing the mechanisms for an orderly transition of five Libor currencies, four Asia-Pacific benchmarks that reference US dollar Libor, the Euro Overnight Index Average (‘Eonia’), the Singapore interbank offered rate (‘Sibor’), and the Turkish Lira interbank offered rate (‘TRLibor’), to their chosen replacement rates.
Furthermore, the FCA and the administrator of Libor, ICE Benchmark Administration Limited (‘IBA’), announced on 5 March 2021 that publication of 24 of the 35 main Libor currency interest rate benchmark settings would cease at the end of 2021. Additionally, the FCA and IBA confirmed that the publication of the most widely used US dollar Libor settings will be extended until
30 June 2023, and that consultation will occur for continuing three sterling and three Japanese yen settings under a ‘synthetic’ calculation methodology. As a result, HSBC’s transition programme continued its efforts to provide near risk-free rate (‘RFR’) and alternative rate products and is currently focused on actively transitioning clients away from those contracts that reference Ibors demising at the end of 2021.
Provision of RFR and alternative rate product capabilities
During 2020 and the first half of 2021, all of our global businesses developed and implemented system, modelling, and operational capabilities for the majority of RFR products and alternative rates, with only a limited number of non-standard products requiring completion in the second half of 2021. Our product readiness and increased market liquidity enabled new transactions to be undertaken in RFR and alternative rate products for all benchmarks. This, and market initiatives to reduce Ibor trade volumes, contributed to a continued decrease in Ibor exposures that have post-2021 maturities.
However, given the extension of the publication of US dollar Libor for the most widely used settings, the market activity for the Secured Overnight Financing Rate (‘SOFR’) continues to develop at a slow pace. We are currently monitoring other industry developments related to term SOFR, and supporting market initiatives to increase the volume of activity in the SOFR derivative market. We will also continue to develop additional products for our clients and in support of the transition from US dollar Libor.
Transition legacy contracts
For benchmarks demising in 2021, we plan to transition all viable legacy Ibor contracts by 30 September 2021 to the extent possible, in line with RFR working group guidelines. However, we remain dependent on our clients’ decisions and the market to meet these targets. In support of our plans, by the end of the first half of 2021, we had held transition discussions with more than 85% of our customers. We approached clients in a structured manner, based on product readiness and client prioritisation, and our transition progress is being tracked using internal targets. In prioritising our client engagement, we also took into account our clients’ adherence to the fallback provisions for derivatives within the ISDA protocol, implemented in January 2021, and contractual fallback language within legacy loan contracts. We placed greater emphasis on engaging with clients who do not have contractual fallback provisions, which as at 30 June 2021 accounted for approximately 15% of non-US dollar bilateral derivatives trades, and approximately 1% of non-US dollar loan contracts.
Following our transition discussions with clients, we will be led by their decisions on timing and their level of readiness to transition. We are tracking client decisions to adequately plan for operational activities that need to occur in the second half of 2021. However, given the continued impact of Covid-19 on our customers and the market, there is a risk that our clients are not operationally ready to transition their Ibor contracts. This could potentially result in delays to transition, past the 30 September 2021 target date, with transition activities being further concentrated into the latter part of 2021. This could increase regulatory compliance, legal, resilience and operational risks.
While operational risks could be increased, contractual repapering and rebooking activities will be managed accordingly through bilateral and bulk transition processes. However, we may need to rely on some jurisdictional legislative solutions to allow for a smooth transition of all contracts, such as the proposed ‘synthetic’-based Libor methodology in the UK. Adequate contract continuity provisions will be critical to the successful implementation of such solutions.
As a result of our transition efforts, we continue to reduce our derivative, loan and bond exposures to Ibors and Eonia maturing beyond 2021.
For derivatives exposures, following the first quarter cessation milestone for issuance of new sterling Libor linear derivatives, we are only transacting sterling Libor linear derivatives for risk management purposes. This has led to a decrease in Libor exposure and an increase in the volume of transactions referencing Sterling Overnight Index Average (‘Sonia’). We now have approximately 80% of the Group’s sterling linear cleared interest rate derivatives notional in Sonia. Second quarter industry milestones for cessation of sterling non-linear derivatives have been adhered to and this is expected to result in a further exposure reduction.
For HSBC’s loan book, all loan contracts referencing 2021 demising Ibors that require refinancing are being offered on an RFR or alternative rate basis. We have adhered to the first half cessation milestones for issuance of new Libor loans, and continue to support and engage our clients in transitioning to a suitable RFR or alternative rate product, prior to the relevant Ibor cessation date. For syndicated loans, we are actively engaging with agents and participants, as appropriate, but will be reliant on all syndicate members to transition.
With respect to HSBC’s legacy bond issuances referencing Ibors that are subject to demise, we continue to work on plans to transition such bond issuances into suitable alternatives in line with Ibor cessation dates. The success of these transition plans will, to a certain extent, also depend on the participation and engagement of third-party market participants. This dependency is also true for those bonds where HSBC is the paying agent, and paying agents are reliant on the timing set out by third-party market participants in the transition process of their issued debt. We have identified and engaged with issuers as appropriate to aid in this transition.
Financial instruments impacted by Ibor reform
| | | | | | | | | | | | | | | | | | |
| Financial instruments yet to transition to alternative benchmarks, by main benchmark |
| USD Libor | GBP Libor | JPY Libor | | | | Others1 | |
| At 30 Jun 2021 | $m | $m | $m | | | | $m | |
Non-derivative financial assets2 | 64,882 | | 43,587 | | 367 | | | | | 9,478 | | |
Non-derivative financial liabilities2 | 28,224 | | 7,098 | | 1,451 | | | | | 421 | | |
| Derivative notional contract amount | 2,326,050 | | 1,210,192 | | 489,421 | | | | | 428,113 | | |
| | | | | | | | |
| | | | | | | | | | | | | | | | | | |
| |
| | | | | | | | |
| At 31 Dec 2020 | $m | $m | $m | | | | $m | |
Non-derivative financial assets2 | 94,148 | | 46,587 | | 371 | | | | | 10,763 | | |
Non-derivative financial liabilities2 | 33,602 | | 7,183 | | 1,548 | | | | | 549 | | |
| Derivative notional contract amount | 3,045,337 | | 1,196,865 | | 508,200 | | | | | 514,959 | | |
1 Comprises financial instruments referencing other significant benchmark rates yet to transition to alternative benchmarks (Euro Libor, Swiss franc Libor, Eonia, SOR, THBFIX and Sibor).
2 Gross carrying amount excluding allowances for expected credit losses.
The amounts in the above table relate to HSBC’s main operating entities where HSBC has material exposures impacted by Ibor reform, including in the UK, Hong Kong, France, the US, Mexico, Canada, Singapore, the UAE, Bermuda, Australia, Qatar, Germany, Japan and Thailand. The amounts provide an indication of the extent of the Group’s exposure to the Ibor benchmarks that are due to be replaced. Amounts are in respect of financial instruments that:
•contractually reference an interest rate benchmark that is planned to transition to an alternative benchmark;
•have a contractual maturity date beyond the date by which the reference interest rate benchmark is expected to cease; and
•are recognised on HSBC’s consolidated balance sheet.
In March 2021, the administrator of Libor, IBA, announced that the publication date of most US dollar Libor tenors has been extended from 31 December 2021 to 30 June 2023. Publication of one-week and two-month tenors will cease after 31 December 2021. This change, together with the extended publication dates of Sibor, SOR and THBFIX, reduce the amounts presented at 30 June 2021 in the above table as some financial instruments included at
31 December 2020 will reach their contractual maturity date prior to the extended publication dates. Comparative data have not been re-presented.
| | | | | |
| Page |
| |
| |
| Overview | |
| Risk elements in the loan portfolio | |
| Credit risk in the first half of 2021 | |
| Summary of credit risk | |
| Measurement uncertainty and sensitivity analysis of ECL estimates | |
| Reconciliation of changes in gross carrying/nominal amount and allowances for loans and advances to banks and customers | |
| Credit quality of financial instruments | |
| Customer relief programmes | |
| Personal lending | |
| Wholesale lending | |
| Supplementary information | |
| |
| |
Overview
Credit risk is the risk of financial loss if a customer or counterparty fails to meet an obligation under a contract. Credit risk arises principally from direct lending, trade finance and leasing business, but also from certain other products, such as guarantees and derivatives.
Risk elements in the loan portfolio
Unless otherwise stated, the disclosure of credit risk elements in this section reflects US accounting practice and classifications. The purpose of the disclosure is to present within the US disclosure framework those elements of the loan portfolios with a greater risk of loss. The three main classifications of credit risk elements presented are:
•impaired loans;
•unimpaired loans contractually more than 90 days past due as to interest or principal; and
•troubled debt restructurings not included in the above.
Impaired loans
In the following tables, we present information on our impaired loans and advances in accordance with the classification approach described in the Annual Report and Accounts 2020.
A loan is impaired, and an impairment allowance is recognised, when there is objective evidence of a loss event that has an effect on the cash flows of the loan which can be reliably estimated. In accordance with IFRSs, we recognise interest income on assets after they have been written down as a result of an impairment loss.
The balance of impaired loans at 30 June 2021 has decreased by $0.1bn when compared with 31 December 2020. This is primarily driven by customers in the personal lending.
Unimpaired loans more than 90 days past due
Under IFRS 9 the Group determines that a financial instrument is credit-impaired and in stage 3 by considering relevant objective evidence, primarily whether:
•contractual payments of either principal or interest are past due for more than 90 days;
•there are other indications that the borrower is unlikely to pay such as that a concession has been granted to the borrower for economic or legal reasons relating to the borrower’s financial condition; and
•the loan is otherwise considered to be in default.
If such unlikeliness to pay is not identified at an earlier stage, it is deemed to occur when an exposure is 90 days past due, even where regulatory rules permit default to be defined based on 180 days past due. Therefore the definitions of credit-impaired and default are aligned as far as possible so that stage 3 represents all loans which are considered defaulted or otherwise credit-impaired. Interest income is recognised by applying the effective interest rate to the amortised cost amount (i.e. gross carrying amount less ECL allowance).
As a financial instrument is considered impaired if contractual payments of either principal or interest are past due for more than 90 days, these amounts will be reported under impaired loans with no balance reported under unimpaired loans more than 90 days past due.
Troubled debt restructurings
Under US GAAP, a troubled debt restructuring (‘TDR’) is a loan, the terms of which have been modified for economic or legal reasons related to the borrower’s financial difficulties to grant a concession to the borrower that the lender would not otherwise consider. A modification which results in a delay in payment that is considered insignificant is not regarded as a concession for the purposes of this disclosure. The SEC requires separate disclosure of any loans which meet the definition of a TDR that are not included in the previous two loan categories. Loans that have been identified as TDRs under the US guidance retain this designation until maturity or derecognition. This treatment differs from the Group’s impaired loans disclosure convention under IFRSs under which a loan may return to unimpaired status after demonstrating a significant reduction in the risk of non-payment of future cash flows. As a result, reported TDRs include those loans that have returned to unimpaired status under the Group’s disclosure convention for renegotiated loans.
The balance of TDRs not included as impaired loans at 30 June 2021 was $1.7bn, $0.4bn higher than at 31 December 2020. Under the Group’s IFRS 9 methodology financial instruments (except for renegotiated loans) are transferred out of stage 3 when they no longer exhibit any evidence of credit impairment. Wholesale renegotiated loans will continue to be in stage 3 until there is sufficient evidence to demonstrate a significant reduction in the risk of non-payment of future cash flows, observed over a minimum one-year period and there are no other indicators of impairment. For loans that are assessed for impairment on a portfolio basis, the evidence typically comprises a history of payment performance against the original or revised terms, as appropriate to the circumstances. For loans that are assessed for impairment on an individual basis, all available evidence is assessed on a case-by-case basis. Retail renegotiated loans are deemed to remain credit impaired until repayment or derecognition.
Potential problem loans
Potential problem loans are loans where information on possible credit problems among borrowers causes management to seriously doubt their ability to comply with the loan repayment terms.
Under IFRS 9, an assessment of whether credit risk has increased significantly since initial recognition is performed at each reporting period by considering the change in the risk of default occurring over the remaining life of the financial instrument. Any financial instrument deemed to have suffered a significant increase in credit risk is transferred from stage 1 to stage 2.
The assessment explicitly or implicitly compares the risk of default occurring at the reporting date with that at initial recognition, taking into account reasonable and supportable information, including information about past events, current conditions and future economic conditions. The assessment is unbiased, probability weighted and, to the extent relevant, uses forward-looking information consistent with that used in the measurement of ECL.
The analysis of credit risk is multifactor. The determination of whether a specific factor is relevant and its weight compared with other factors depends on the type of product, the characteristics of the financial instrument and the borrower, and the geographical region. Therefore, it is not possible to provide a single set of criteria that will determine what is considered to be a significant increase in credit risk and these criteria will differ for different types of lending, particularly between retail and wholesale. However, unless identified at an earlier stage, all financial assets are deemed to have suffered a significant increase in credit risk when 30 days past due. Financial instruments classified as stage 2
and greater than 30 days past due are considered to have a higher risk of containing potential problem loans.
Analysis of risk elements in the loan portfolio by geographical region
The analysis below sets out the amount of risk elements in loan portfolios included within loans and advances to customers and
banks in the consolidated balance sheet, trading loans classified as in default and assets obtained by taking possession of security.
The table excludes the amount of risk elements in loan portfolios classified as ‘assets held for sale’ in the consolidated balance sheet.
| | | | | | | | |
| Risk elements in the loan portfolio by geographical region |
| At |
| 30 Jun 2021 | 31 Dec 2020 |
| $m | $m |
| Impaired loans | 19,285 | | 19,372 | |
| – Europe | 9,172 | | 9,151 | |
| – Asia | 5,251 | | 4,718 | |
| – Middle East and North Africa | 2,057 | | 2,233 | |
| – North America | 1,814 | | 2,291 | |
| – Latin America | 991 | | 979 | |
| Unimpaired loans contractually more than 90 days past due as to principal or interest | — | | — | |
| – Europe | — | | — | |
| – Asia | — | | — | |
| – Middle East and North Africa | — | | — | |
| – North America | — | | — | |
| – Latin America | — | | — | |
| Troubled debt restructurings (not included in the classifications above) | 1,732 | | 1,349 | |
| – Europe | 1,049 | | 1,073 | |
| – Asia | 5 | | — | |
| – Middle East and North Africa | 114 | | 150 | |
| – North America | 95 | | 107 | |
| – Latin America | 469 | | 19 | |
| Trading loans classified as in default | — | | — | |
| – Europe | — | | — | |
| – Asia | — | | — | |
| – Middle East and North Africa | — | | — | |
| – North America | — | | — | |
| – Latin America | — | | — | |
| Risk elements on loans | 21,017 | | 20,721 | |
| – Europe | 10,221 | | 10,224 | |
| – Asia | 5,256 | | 4,718 | |
| – Middle East and North Africa | 2,171 | | 2,383 | |
| – North America | 1,909 | | 2,398 | |
| – Latin America | 1,460 | | 998 | |
| Assets held for resale | 43 | | 44 | |
| – Europe | 8 | | 10 | |
| – Asia | 29 | | 28 | |
| – Middle East and North Africa | — | | — | |
| – North America | 2 | | 3 | |
| – Latin America | 4 | | 3 | |
| Total risk elements | 21,060 | | 20,765 | |
| – Europe | 10,229 | | 10,234 | |
| – Asia | 5,285 | | 4,746 | |
| – Middle East and North Africa | 2,171 | | 2,383 | |
| – North America | 1,911 | | 2,401 | |
| – Latin America | 1,464 | | 1,001 | |
| % | % |
| Allowance for ECL as a percentage of risk elements on loans | 61.3 | | 70.1 | |
Credit risk in the first half of 2021
There were no material changes to credit risk policy in the first half of 2021.
A summary of our current policies and practices for the management of credit risk is set out in ‘Credit risk management’ on page 119 of the Annual Report and Accounts 2020.
At 30 June 2021, gross loans and advances to customers and banks of $1,159bn increased by $25.2bn, compared with 31 December 2020. This included adverse foreign exchange movements of $1.5bn and a $2.6bn decrease due to the exit of domestic mass market retail banking in the US being reclassified to assets held for sale.
Excluding foreign exchange movements, the growth was driven by a $21.2bn increase in personal loans and advances to customers and a $6.0bn increase in loans and advances to banks. Wholesale loans and advances to customers decreased by $0.5bn.
The increase in personal loans and advances to customers was driven by other personal loans growth of $12.5bn, mainly in Hong Kong (up $13.0bn). Mortgages increased by $10.0bn, mainly in the UK (up 5.1bn), Hong Kong (up $2.9bn) and Canada (up $2.0bn). This was partly offset by a decrease of $1.0bn in credit cards, mainly in the US (down $0.4bn) and Hong Kong (down $0.2bn).
During the first six months of 2021, the Group experienced a release in allowances for ECL, which was driven by improving economic forecasts. Excluding foreign exchange movements, the allowance for ECL in relation to loans and advances to customers decreased by $1.6bn from 31 December 2020. This was attributable to:
•a $0.9bn decrease in wholesale loans and advances to customers, of which $0.7bn was driven by stages 1 and 2; and
•a $0.7bn decrease in personal loans and advances to customers, of which $0.6bn was driven by stages 1 and 2.
At 30 June 2021, the allowance for ECL of $13.8bn decreased by $1.9bn compared with 31 December 2020, including favourable foreign exchange movements of $0.1bn. The $13.8bn allowance comprised $13.1bn in respect of assets held at amortised cost, $0.6bn in respect of loan commitments and financial guarantees, and $0.1bn in respect of debt instruments measured at fair value through other comprehensive income (‘FVOCI’).
Stage 3 balances at 30 June 2021 remained broadly stable compared with 31 December 2020.
The ECL release for the first six months of 2021 was $719m, inclusive of recoveries. This comprised: $633m in respect of wholesale lending, of which the stage 3 and purchased or originated credit impaired ('POCI') charge was $196m; $116m in respect of personal lending, of which the stage 3 charge was $221m; and $26m in respect of debt instruments measured at FVOCI, partly offset by a charge of $56m in other financial assets measured at amortised cost. Uncertainty remains as countries emerge from the pandemic at different speeds, government
support measures unwind and new virus strains test the efficacy of vaccination programmes.
During 1H21, we continued to provide Covid-19-related support to customers under the current policy framework. For further details of market-specific measures to support our personal and business customers, see page 75.
Summary of credit risk
The following disclosure presents the gross carrying/nominal amount of financial instruments to which the impairment requirements in IFRS 9 are applied and the associated allowance for ECL.
The following tables analyse loans by industry sector and represent the concentration of exposures on which credit risk is managed. The allowance for ECL decreased from $15.7bn at 31 December 2020 to $13.8bn at 30 June 2021.
| | | | | | | | | | | | | | | |
| Summary of financial instruments to which the impairment requirements in IFRS 9 are applied |
| | At 30 Jun 2021 | At 31 Dec 2020 |
| | Gross carrying/
nominal amount | Allowance for ECL1 | Gross carrying/
nominal amount | Allowance for ECL1 |
| | $m | $m | $m | $m |
| Loans and advances to customers at amortised cost | | 1,072,375 | | (12,864) | | 1,052,477 | | (14,490) | |
| – personal | | 482,447 | | (4,006) | | 460,809 | | (4,731) | |
| – corporate and commercial | | 520,201 | | (8,640) | | 527,088 | | (9,494) | |
| – non-bank financial institutions | | 69,727 | | (218) | | 64,580 | | (265) | |
| Loans and advances to banks at amortised cost | | 86,905 | | (19) | | 81,658 | | (42) | |
| Other financial assets measured at amortised cost | | 854,504 | | (224) | | 772,408 | | (175) | |
| – cash and balances at central banks | | 393,562 | | (3) | | 304,486 | | (5) | |
| – items in the course of collection from other banks | | 9,406 | | 0 | | 4,094 | | 0 | |
| – Hong Kong Government certificates of indebtedness | | 41,880 | | 0 | | 40,420 | | 0 | |
| – reverse repurchase agreements – non-trading | | 201,714 | | 0 | | 230,628 | | 0 | |
| – financial investments | | 84,662 | | (88) | | 88,719 | | (80) | |
– prepayments, accrued income and other assets2 | | 123,280 | | (133) | | 104,061 | | (90) | |
| Total gross carrying amount on-balance sheet | | 2,013,784 | | (13,107) | | 1,906,543 | | (14,707) | |
| Loans and other credit-related commitments | | 661,373 | | (530) | | 659,783 | | (734) | |
| – personal | | 238,559 | | (23) | | 236,170 | | (40) | |
| – corporate and commercial | | 288,414 | | (475) | | 299,802 | | (650) | |
| – financial | | 134,400 | | (32) | | 123,811 | | (44) | |
| Financial guarantees | | 27,274 | | (64) | | 18,384 | | (125) | |
| – personal | | 919 | | (1) | | 900 | | (1) | |
| – corporate and commercial | | 21,679 | | (58) | | 12,946 | | (114) | |
| – financial | | 4,676 | | (5) | | 4,538 | | (10) | |
Total nominal amount off-balance sheet3 | | 688,647 | | (594) | | 678,167 | | (859) | |
| | 2,702,431 | | (13,701) | | 2,584,710 | | (15,566) | |
| | | | | |
| | Fair
value | Memorandum allowance for ECL4 | Fair
value | Memorandum allowance for ECL4 |
| | $m | $m | $m | $m |
| | | | | |
| Debt instruments measured at fair value through other comprehensive income (‘FVOCI’) | | 348,107 | | (111) | | 399,717 | | (141) | |
1 Total ECL is recognised in the loss allowance for the financial asset unless total ECL exceeds the gross carrying amount of the financial asset, in which case the ECL is recognised as a provision.
2 Includes only those financial instruments that are subject to the impairment requirements of IFRS 9. ‘Prepayments, accrued income and other assets’, as presented within the consolidated balance sheet on page 100, includes both financial and non-financial assets. The 30 June 2021 balances include $2,649m gross carrying amounts and $48m allowances for ECL related to assets held for sale due to the exit of domestic mass market retail banking in the US.
3 Represents the maximum amount at risk should the contracts be fully drawn upon and clients default.
4 Debt instruments measured at FVOCI continue to be measured at fair value with the allowance for ECL as a memorandum item. Change in ECL is recognised in ‘Change for expected credit losses and other credit impairment charges’ in the income statement.
The following table provides an overview of the Group’s credit risk by stage and industry, and the associated ECL coverage. The financial assets recorded in each stage have the following characteristics:
•Stage 1: These financial assets are unimpaired and without a significant increase in credit risk for which a 12-month allowance for ECL is recognised.
•Stage 2: A significant increase in credit risk has been experienced on these financial assets since initial recognition for which a lifetime ECL is recognised.
•Stage 3: There is objective evidence of impairment and the financial assets are therefore considered to be in default or otherwise credit impaired for which a lifetime ECL is recognised.
•POCI: Financial assets that are purchased or originated at a deep discount are seen to reflect the incurred credit losses on which a lifetime ECL is recognised.
| | | | | | | | | | | | | | | | | | | | | | | | | | | | | | | | | | | | | | | | | | | | | | | |
| Summary of credit risk (excluding debt instruments measured at FVOCI) by stage distribution and ECL coverage by industry sector at 30 June 2021 |
| Gross carrying/nominal amount1 | Allowance for ECL | ECL coverage % |
| Stage 1 | Stage 2 | Stage 3 | POCI2 | Total | Stage 1 | Stage 2 | Stage 3 | POCI2 | Total | Stage 1 | Stage 2 | Stage 3 | POCI2 | Total |
| $m | $m | $m | $m | $m | $m | $m | $m | $m | $m | % | % | % | % | % |
| Loans and advances to customers at amortised cost | 895,546 | | 157,544 | | 19,069 | | 216 | | 1,072,375 | | (1,770) | | (3,888) | | (7,131) | | (75) | | (12,864) | | 0.2 | | 2.5 | | 37.4 | | 34.7 | | 1.2 | |
| – personal | 455,646 | | 21,338 | | 5,463 | | — | | 482,447 | | (747) | | (1,850) | | (1,409) | | — | | (4,006) | | 0.2 | | 8.7 | | 25.8 | | — | | 0.8 | |
| – corporate and commercial | 378,700 | | 128,212 | | 13,073 | | 216 | | 520,201 | | (983) | | (1,970) | | (5,612) | | (75) | | (8,640) | | 0.3 | | 1.5 | | 42.9 | | 34.7 | | 1.7 | |
| – non-bank financial institutions | 61,200 | | 7,994 | | 533 | | — | | 69,727 | | (40) | | (68) | | (110) | | — | | (218) | | 0.1 | | 0.9 | | 20.6 | | — | | 0.3 | |
| Loans and advances to banks at amortised cost | 85,486 | | 1,419 | | — | | — | | 86,905 | | (16) | | (3) | | — | | — | | (19) | | — | | 0.2 | | — | | — | | — | |
| Other financial assets measured at amortised cost | 848,978 | | 5,200 | | 284 | | 42 | | 854,504 | | (130) | | (38) | | (47) | | (9) | | (224) | | — | | 0.7 | | 16.5 | | 21.4 | | — | |
| Loans and other credit-related commitments | 612,969 | | 47,658 | | 744 | | 2 | | 661,373 | | (184) | | (266) | | (80) | | — | | (530) | | — | | 0.6 | | 10.8 | | — | | 0.1 | |
| – personal | 236,485 | | 1,927 | | 147 | | — | | 238,559 | | (21) | | (1) | | (1) | | — | | (23) | | — | | 0.1 | | 0.7 | | — | | — | |
| – corporate and commercial | 246,462 | | 41,389 | | 561 | | 2 | | 288,414 | | (151) | | (249) | | (75) | | — | | (475) | | 0.1 | | 0.6 | | 13.4 | | — | | 0.2 | |
| – financial | 130,022 | | 4,342 | | 36 | | — | | 134,400 | | (12) | | (16) | | (4) | | — | | (32) | | — | | 0.4 | | 11.1 | | — | | — | |
| Financial guarantees | 23,169 | | 3,883 | | 221 | | 1 | | 27,274 | | (17) | | (30) | | (17) | | — | | (64) | | 0.1 | | 0.8 | | 7.7 | | — | | 0.2 | |
| – personal | 892 | | 26 | | 1 | | — | | 919 | | — | | (1) | | — | | — | | (1) | | — | | 3.8 | | — | | — | | 0.1 | |
| – corporate and commercial | 18,489 | | 2,984 | | 205 | | 1 | | 21,679 | | (14) | | (28) | | (16) | | — | | (58) | | 0.1 | | 0.9 | | 7.8 | | — | | 0.3 | |
| – financial | 3,788 | | 873 | | 15 | | — | | 4,676 | | (3) | | (1) | | (1) | | — | | (5) | | 0.1 | | 0.1 | | 6.7 | | — | | 0.1 | |
| At 30 Jun 2021 | 2,466,148 | | 215,704 | | 20,318 | | 261 | | 2,702,431 | | (2,117) | | (4,225) | | (7,275) | | (84) | | (13,701) | | 0.1 | | 2.0 | | 35.8 | | 32.2 | | 0.5 | |
1 Represents the maximum amount at risk should the contracts be fully drawn upon and clients default.
2 Purchased or originated credit-impaired (‘POCI‘).
Unless identified at an earlier stage, all financial assets are deemed to have suffered a significant increase in credit risk when they are 30 days past due (‘DPD’) and are transferred from stage 1 to stage 2. The following disclosure presents the ageing of
stage 2 financial assets by those less than 30 and greater than 30 DPD and therefore presents those financial assets classified as stage 2 due to ageing (30 DPD) and those identified at an earlier stage (less than 30 DPD).
| | | | | | | | | | | | | | | | | | | | | | | | | | | | | | | | | | | | | | |
| Stage 2 days past due analysis at 30 June 2021 |
| Gross carrying/nominal amount | Allowance for ECL | ECL coverage % |
| | | | | | | | | | | | |
| Stage 2 | Up-to-date | 1 to 29 DPD1,2 | 30 and > DPD1,2 | Stage 2 | Up-to-date | 1 to 29 DPD1,2 | 30 and > DPD1,2 | Stage 2 | Up-to-date | 1 to 29 DPD1,2 | 30 and > DPD1,2 |
| $m | $m | $m | $m | $m | $m | $m | $m | % | % | % | % |
| Loans and advances to customers at amortised cost | 157,544 | | 154,354 | | 1,901 | | 1,289 | | (3,888) | | (3,413) | | (217) | | (258) | | 2.5 | | 2.2 | | 11.4 | | 20.0 | |
| – personal | 21,338 | | 19,014 | | 1,349 | | 975 | | (1,850) | | (1,437) | | (187) | | (226) | | 8.7 | | 7.6 | | 13.9 | | 23.2 | |
| – corporate and commercial | 128,212 | | 127,461 | | 437 | | 314 | | (1,970) | | (1,910) | | (28) | | (32) | | 1.5 | | 1.5 | | 6.4 | | 10.2 | |
| – non-bank financial institutions | 7,994 | | 7,879 | | 115 | | — | | (68) | | (66) | | (2) | | — | | 0.9 | | 0.8 | | 1.7 | | — | |
| Loans and advances to banks at amortised cost | 1,419 | | 1,419 | | — | | — | | (3) | | (3) | | — | | — | | 0.2 | | 0.2 | | — | | — | |
| Other financial assets measured at amortised cost | 5,200 | | 5,082 | | 34 | | 84 | | (38) | | (35) | | (2) | | (1) | | 0.7 | | 0.7 | | 5.9 | | 1.2 | |
1 Days past due (‘DPD‘).
2 The days past due amounts presented above are on a contractual basis and include the benefit of any customer relief payment holidays granted.
| | | | | | | | | | | | | | | | | | | | | | | | | | | | | | | | | | | | | | | | | | | | | | | | | |
| Summary of credit risk (excluding debt instruments measured at FVOCI) by stage distribution and ECL coverage by industry sector at 31 December 2020 |
| Gross carrying/nominal amount1 | | Allowance for ECL | | ECL coverage % |
| Stage 1 | Stage 2 | Stage 3 | POCI2 | Total | | Stage 1 | Stage 2 | Stage 3 | POCI2 | Total | | Stage 1 | Stage 2 | Stage 3 | POCI2 | Total |
| $m | $m | $m | $m | $m | | $m | $m | $m | $m | $m | | % | % | % | % | % |
| Loans and advances to customers at amortised cost | 869,920 | | 163,185 | | 19,095 | | 277 | | 1,052,477 | | | (1,974) | | (4,965) | | (7,439) | | (112) | | (14,490) | | | 0.2 | | 3.0 | | 39.0 | | 40.4 | | 1.4 | |
| – personal | 430,134 | | 25,064 | | 5,611 | | — | | 460,809 | | | (827) | | (2,402) | | (1,502) | | — | | (4,731) | | | 0.2 | | 9.6 | | 26.8 | | — | | 1.0 | |
| – corporate and commercial | 387,563 | | 126,287 | | 12,961 | | 277 | | 527,088 | | | (1,101) | | (2,444) | | (5,837) | | (112) | | (9,494) | | | 0.3 | | 1.9 | | 45.0 | | 40.4 | | 1.8 | |
| – non-bank financial institutions | 52,223 | | 11,834 | | 523 | | — | | 64,580 | | | (46) | | (119) | | (100) | | — | | (265) | | | 0.1 | | 1.0 | | 19.1 | | — | | 0.4 | |
| Loans and advances to banks at amortised cost | 79,654 | | 2,004 | | — | | — | | 81,658 | | | (33) | | (9) | | — | | — | | (42) | | | — | | 0.4 | | — | | — | | 0.1 | |
Other financial assets
measured at amortised cost | 768,216 | | 3,975 | | 177 | | 40 | | 772,408 | | | (80) | | (44) | | (42) | | (9) | | (175) | | | — | | 1.1 | | 23.7 | | 22.5 | | — | |
| Loans and other credit-related commitments | 604,485 | | 54,217 | | 1,080 | | 1 | | 659,783 | | | (290) | | (365) | | (78) | | (1) | | (734) | | | — | | 0.7 | | 7.2 | | 100.0 | | 0.1 | |
| – personal | 234,337 | | 1,681 | | 152 | | — | | 236,170 | | | (39) | | (1) | | — | | — | | (40) | | | — | | 0.1 | | — | | — | | — | |
| – corporate and commercial | 253,062 | | 45,851 | | 888 | | 1 | | 299,802 | | | (236) | | (338) | | (75) | | (1) | | (650) | | | 0.1 | | 0.7 | | 8.4 | | 100.0 | | 0.2 | |
| – financial | 117,086 | | 6,685 | | 40 | | — | | 123,811 | | | (15) | | (26) | | (3) | | — | | (44) | | | — | | 0.4 | | 7.5 | | — | | — | |
| Financial guarantees | 14,090 | | 4,024 | | 269 | | 1 | | 18,384 | | | (37) | | (62) | | (26) | | — | | (125) | | | 0.3 | | 1.5 | | 9.7 | | — | | 0.7 | |
| – personal | 872 | | 26 | | 2 | | — | | 900 | | | — | | (1) | | — | | — | | (1) | | | — | | 3.8 | | — | | — | | 0.1 | |
| – corporate and commercial | 9,536 | | 3,157 | | 252 | | 1 | | 12,946 | | | (35) | | (54) | | (25) | | — | | (114) | | | 0.4 | | 1.7 | | 9.9 | | — | | 0.9 | |
| – financial | 3,682 | | 841 | | 15 | | — | | 4,538 | | | (2) | | (7) | | (1) | | — | | (10) | | | 0.1 | | 0.8 | | 6.7 | | — | | 0.2 | |
| At 31 Dec 2020 | 2,336,365 | | 227,405 | | 20,621 | | 319 | | 2,584,710 | | | (2,414) | | (5,445) | | (7,585) | | (122) | | (15,566) | | | 0.1 | | 2.4 | | 36.8 | | 38.2 | | 0.6 | |
1 Represents the maximum amount at risk should the contracts be fully drawn upon and clients default.
2 Purchased or originated credit impaired ('POCI').
| | | | | | | | | | | | | | | | | | | | | | | | | | | | | | | | | | | | | | |
| Stage 2 days past due analysis at 31 December 2020 |
| Gross carrying amount | Allowance for ECL | ECL coverage % |
| | | | | | | | | | | | |
| Stage 2 | Up-to-date | 1 to 29 DPD1,2 | 30 and > DPD1,2 | Stage 2 | Up-to-date | 1 to 29 DPD1,2 | 30 and > DPD1,2 | Stage 2 | Up-to-date | 1 to 29 DPD1,2 | 30 and > DPD1,2 |
| $m | $m | $m | $m | $m | $m | $m | $m | % | % | % | % |
| Loans and advances to customers at amortised cost | 163,185 | | 159,367 | | 2,052 | | 1,766 | | (4,965) | | (4,358) | | (275) | | (332) | | 3.0 | | 2.7 | | 13.4 | | 18.8 | |
| – personal | 25,064 | | 22,250 | | 1,554 | | 1,260 | | (2,402) | | (1,895) | | (227) | | (280) | | 9.6 | | 8.5 | | 14.6 | | 22.2 | |
| – corporate and commercial | 126,287 | | 125,301 | | 489 | | 497 | | (2,444) | | (2,344) | | (48) | | (52) | | 1.9 | | 1.9 | | 9.8 | | 10.5 | |
| – non-bank financial institutions | 11,834 | | 11,816 | | 9 | | 9 | | (119) | | (119) | | — | | — | | 1.0 | | 1.0 | | — | | — | |
| Loans and advances to banks at amortised cost | 2,004 | | 2,004 | | — | | — | | (9) | | (9) | | — | | — | | 0.4 | | 0.4 | | — | | — | |
| Other financial assets measured at amortised cost | 3,975 | | 3,963 | | 3 | | 9 | | (44) | | (44) | | — | | — | | 1.1 | | 1.1 | | — | | — | |
1 Days past due (‘DPD‘).
2 The days past due amounts presented above are on a contractual basis and include the benefit of any customer relief payment holidays granted.
Measurement uncertainty and sensitivity analysis of ECL estimates
There remains a high degree of uncertainty as countries emerge from the pandemic at different speeds, government support measures unwind and new virus strains test the efficacy of vaccination programmes. As a result of this uncertainty, management judgements and estimates reflect a degree of caution. Over 2020, stage 1 and stage 2 ECL provisions on loans increased by $3.9bn, reflecting mainly the evolution of the global pandemic, and while they reduced by $1.5bn in 1H21 as economic conditions recovered, $2.4bn of the 2020 uplift remained at 1H21 ($1.7bn wholesale and $0.7bn retail). Caution is reflected both in the selection of economic scenarios and their weightings, and in the management judgemental adjustments, which reflect how economic conditions interact with modelled outcomes, and are described in more detail below. The highest degree of uncertainty in ECL estimates relates to the UK.
The recognition and measurement of ECL involves the use of significant judgement and estimation. We form multiple economic scenarios based on economic forecasts, apply these assumptions to credit risk models to estimate future credit losses, and
probability-weight the results to determine an unbiased ECL estimate.
Methodology
NaN economic scenarios have been used to capture the exceptional nature of the current economic environment and to articulate management’s view of the range of potential outcomes. Scenarios produced to calculate ECL are aligned to HSBC’s top and emerging risks. NaN of these scenarios are drawn from consensus forecasts and distributional estimates. The Central scenario is deemed the ‘most likely’ scenario, and usually attracts the largest probability weighting, while the outer scenarios represent the tails of the distribution, which are less likely to occur. The Central scenario is created using the average of a panel of external forecasters, while consensus Upside and Downside scenarios are created with reference to distributions for select markets that capture forecasters’ views of the entire range of outcomes. Management has chosen to use an additional scenario to represent its view of severe downside risks. The use of an additional scenario is in line with HSBC’s forward economic guidance methodology and has been regularly used over the course of 2021. Management may include additional scenarios if it
feels that the consensus scenarios do not adequately capture the top and emerging risks. Unlike the consensus scenarios, these additional scenarios are driven by narrative assumptions, could be country-specific and may incorporate shocks that drive economic activity permanently away from trend.
Description of consensus economic scenarios
The economic assumptions presented in this section have been formed by HSBC, with reference to external forecasts specifically for the purpose of calculating ECL.
Global economic growth is experiencing a recovery in 2021, following an unprecedented contraction in 2020. Restrictions to mobility have started to ease across our key markets, aided in some cases by the successful roll-out of vaccination programmes. Data from vaccinated groups suggests vaccines provide a high level of immunity against the Covid-19 virus despite the emergence of more transmissible variants. To date, vaccinations have shown their effectiveness in lowering hospitalisations and deaths. A rapid roll-out of vaccination programmes has been a key factor enabling economies to reopen and some resumption of travel. The emergence of new variants that reduce the efficacy of vaccines remains a risk.
Economic forecasts are subject to a high degree of uncertainty in the current environment. While risks to the economic outlook are dominated by the progression and management of the pandemic and vaccine roll-out, geopolitical risks also present downside threats. These geopolitical risks include continued differences between the US and China over a range of issues, dampened business sentiment in Hong Kong, and the evolution of the UK’s relationship with the EU. NaN global scenarios have been used for the purpose of calculating ECL at 30 June 2021. These are the consensus Central scenario, the consensus Upside scenario, the consensus Downside scenario and an additional Downside scenario.
The scenarios used to calculate ECL in the Interim Report 2021 are described below.
The consensus Central scenario
Following a severe and unprecedented drop in global economic activity in 2020, HSBC’s Central scenario features a sharp recovery in 2021, followed by a subsequent normalisation of growth. The
V-shape in activity over the course of 2020 and 2021 reflects the impact of the pandemic on our key markets, with restrictions to mobility and a reduction in activity resulting in a strong contraction in 2020, and an increase in mobility and resumption in activity in 2021 signalling a recovery.
The Central scenario further assumes that the stringent restrictions on activity, employed across several countries and territories in 2020 and the first half of 2021, will not be repeated. This will allow economic activity to first rebound and then revert to more normal long-run trend rates of growth. Minimal long-term damage to economic prospects is expected. Cross-region differences in the speed and scale of recovery across the forecast horizon reflect timing differences in the progression of the Covid-19 outbreak, different speeds of roll-out of vaccination programmes, national level differences in restrictions imposed and the scale of support measures.
Global GDP is expected to grow by 5.3% in 2021 in the Central scenario. The average rate of global GDP growth is expected to be 3.3% over the forecast period, which is higher than the average growth rate over the five-year period prior to the onset of the pandemic.
The unique circumstances surrounding the current fall in economic activity make it difficult to compare current prospects for global economic activity with previous recessions. However, we note that the depth of the contraction in economic activity and the subsequent recovery are both expected to be sharper than experienced during the last global economic downturn of
2008–2009 across our key markets.
Across the key markets, the Central scenario assumes the following:
•Economic growth is expected to increase sharply in 2021 as governments ease restrictions to mobility, encouraging consumers and firms to spend and invest. GDP is expected to grow across all our major markets in 2021. Country-specific measures aimed at supporting labour markets as economies reopen will affect the rate at which unemployment will decline.
•Inflation is expected to rise in 2021 in line with the economic recovery, before gradually converging back to central bank targets over the forecast period.
•Fiscal deficits are expected to reduce gradually over the course of the projection period from their peak in 2020 following a period where governments, in several of our key markets, provided extensive support to households and corporates. Sovereign indebtedness is expected to remain at high levels.
•Interest rate policy is expected to be highly accommodative over the projection horizon after major central banks lowered their main policy interest rates, implemented emergency support measures for funding markets, and either restarted or increased quantitative easing programmes, in order to support economies and the financial system.
•The West Texas Intermediate oil price is forecast to average $58 per barrel over the projection period.
The Central scenario was first created with forecasts available in May, and subsequently updated in June to reflect significant changes to forecasts. Probability weights assigned to the Central scenario reflect both the higher level of uncertainty in the current global economic environment and relative differences across markets. Weights assigned to the Central scenario vary from 45% to 80%.
The following table describes key macroeconomic variables and the probabilities assigned in the consensus Central scenario.
| | | | | | | | | | | | | | | | | | | | | | | | | | |
| Central scenario 3Q21–2Q26 |
| UK | US | Hong Kong | Mainland China | Canada | France | UAE | Mexico |
| % | % | % | % | % | % | % | % |
| GDP growth rate | | | | | | | | |
| 2021: Annual average growth rate | 6.1 | | 6.1 | | 5.2 | | 8.5 | | 5.8 | | 4.9 | | 2.5 | | 4.9 | |
| 2022: Annual average growth rate | 5.5 | | 4.0 | | 3.2 | | 5.5 | | 3.9 | | 3.9 | | 3.8 | | 2.9 | |
| 2023: Annual average growth rate | 2.2 | | 2.3 | | 2.7 | | 5.3 | | 2.3 | | 2.1 | | 3.0 | | 2.3 | |
| 5-year average | 3.0 | | 2.9 | | 2.6 | | 5.0 | | 2.6 | | 2.1 | | 3.6 | | 2.4 | |
| Unemployment rate | | | | | | | | |
| 2021: Annual average rate | 5.8 | | 5.5 | | 6.2 | | 3.9 | | 7.6 | | 8.9 | | 2.7 | | 4.5 | |
| 2022: Annual average rate | 5.8 | | 4.3 | | 4.6 | | 3.8 | | 6.3 | | 8.7 | | 2.7 | | 4.2 | |
| 2023: Annual average rate | 5.0 | | 4.0 | | 3.9 | | 3.8 | | 6.1 | | 8.4 | | 2.7 | | 4.1 | |
| 5-year average | 5.1 | | 4.1 | | 4.0 | | 3.8 | | 6.1 | | 8.3 | | 2.7 | | 4.2 | |
| House price growth | | | | | | | | |
| 2021: Annual average growth rate | 8.3 | | 11.9 | | 2.6 | | 4.3 | | 16.1 | | 4.5 | | (3.9) | | 5.4 | |
| 2022: Annual average growth rate | 2.7 | | 6.2 | | 3.9 | | 6.0 | | 6.4 | | 3.5 | | (0.7) | | 5.2 | |
| 2023: Annual average growth rate | 2.5 | | 4.4 | | 2.5 | | 5.4 | | 2.6 | | 4.2 | | 0.3 | | 4.7 | |
| 5-year average | 3.0 | | 5.1 | | 2.9 | | 4.9 | | 4.7 | | 3.5 | | 0.8 | | 4.6 | |
| Short-term interest rate | | | | | | | | |
| 2021: Annual average rate | 0.2 | | 0.3 | | 0.9 | | 3.4 | | 0.5 | | (0.6) | | 0.8 | | 4.5 | |
| 2022: Annual average rate | 0.3 | | 0.4 | | 1.2 | | 3.4 | | 0.7 | | (0.6) | | 0.9 | | 5.5 | |
| 2023: Annual average rate | 0.5 | | 0.7 | | 1.6 | | 3.5 | | 1.2 | | (0.5) | | 1.2 | | 6.4 | |
| 5-year average | 0.6 | | 1.1 | | 1.9 | | 3.5 | | 1.4 | | (0.4) | | 1.5 | | 6.4 | |
| Probability | 50 | | 75 | | 70 | | 80 | | 70 | | 45 | | 65 | | 65 | |
The graphs comparing the respective Central scenarios in the second quarters of 2020 and 2021 reveal the extent of economic dislocation that occurred in 2020 and compare current economic expectations with those held a year ago.
GDP growth: Comparison of Central scenarios
Note: Real GDP shown as year-on-year percentage change.
Note: Real GDP shown as year-on-year percentage change.
Note: Real GDP shown as year-on-year percentage change.
Note: Real GDP shown as year-on-year percentage change.
The consensus Upside scenario
Compared with the consensus Central scenario, the consensus Upside scenario features a faster recovery in economic activity during the first two years, before converging to long-run trends.
The scenario is consistent with a number of key upside risk themes. These include the orderly and rapid global abatement of
Covid-19 via successful containment and prompt deployment of vaccines; de-escalation of tensions between the US and China;
de-escalation of political tensions in Hong Kong; continued support from fiscal and monetary policy; and smooth relations between the UK and the EU.
The following table describes key macroeconomic variables and the probabilities assigned in the consensus Upside scenario.
| | | | | | | | | | | | | | | | | | | | | | | | | | | | | | | | | | | | | | | | | | | | | | | | | | |
| Consensus Upside scenario best outcome |
| UK | | US | | Hong Kong | | Mainland China | | Canada | | France | | UAE | | Mexico | |
| % | | % | | % | | % | | % | | % | | % | | % | |
| GDP growth rate | 11.1 | | (1Q22) | 11.0 | | (1Q22) | 10.0 | | (2Q22) | 13.5 | | (2Q22) | 11.2 | | (2Q22) | 8.3 | | (2Q22) | 14.9 | | (1Q22) | 8.6 | | (2Q22) |
| Unemployment rate | 3.4 | | (2Q23) | 2.2 | | (1Q22) | 3.2 | | (2Q23) | 3.6 | | (3Q22) | 4.7 | | (1Q22) | 7.2 | | (3Q22) | 2.2 | | (2Q22) | 3.0 | | (1Q22) |
| House price growth | 9.1 | | (3Q21) | 12.0 | | (3Q21) | 8.9 | | (4Q21) | 13.9 | | (2Q22) | 20.2 | | (4Q21) | 6.1 | | (3Q22) | 21.1 | | (3Q22) | 8.7 | | (3Q22) |
| Short-term interest rate | 0.2 | | (3Q21) | 0.5 | | (3Q21) | 1.2 | | (3Q21) | 3.4 | | (3Q21) | 0.6 | | (3Q21) | (0.6) | | (1Q22) | 1.0 | | (3Q21) | 5.0 | | (3Q21) |
| Probability | 5 | | | 5 | | | 5 | | | 10 | | | 10 | | | 5 | | | 5 | | | 5 | | |
Note: Extreme point in the consensus Upside is ‘best outcome’ in the scenario, for example the highest GDP growth and the lowest unemployment rate, in the first two years of the scenario.
The consensus Downside scenario
In the consensus Downside scenario, economic recovery is considerably weaker compared with the Central scenario. GDP growth remains weak, unemployment rates stay elevated and asset and commodity prices fall before gradually recovering towards their long-run trends.
The scenario is consistent with the key downside risks articulated above. Further outbreaks of Covid-19, coupled with delays in vaccination programmes, lead to longer-lasting restrictions on economic activity in this scenario. Other global risks also increase and drive a rise in risk aversion in asset markets.
The following table describes key macroeconomic variables and the probabilities assigned in the consensus Downside scenario.
| | | | | | | | | | | | | | | | | | | | | | | | | | | | | | | | | | | | | | | | | | | | | | | | | | |
| Consensus Downside scenario worst outcome |
| UK | | US | | Hong Kong | | Mainland China | | Canada | | France | | UAE | | Mexico | |
| % | | % | | % | | % | | % | | % | | % | | % | |
| GDP growth rate | 0.4 | | (2Q23) | (0.6) | | (2Q22) | (6.0) | | (1Q22) | (0.7) | | (4Q21) | (0.5) | | (1Q22) | (1.6) | | (3Q21) | (3.3) | | (3Q22) | (2.7) | | (1Q22) |
| Unemployment rate | 7.3 | | (2Q22) | 6.9 | | (1Q22) | 7.1 | | (3Q21) | 4.1 | | (4Q21) | 8.3 | | (4Q21) | 11.0 | | (4Q21) | 3.2 | | (2Q22) | 5.5 | | (4Q21) |
| House price growth | (3.7) | | (4Q22) | 2.7 | | (4Q22) | (8.0) | | (2Q22) | 0.8 | | (2Q22) | (2.3) | | (4Q22) | 0.3 | | (1Q22) | (17.0) | | (4Q22) | 2.3 | | (3Q22) |
| Short-term interest rate | 0.2 | | (2Q23) | 0.4 | | (1Q22) | 1.2 | | (2Q23) | 3.1 | | (3Q21) | 0.4 | | (2Q23) | (0.6) | | (3Q21) | 0.9 | | (4Q21) | 3.4 | | (3Q21) |
| Probability | 30 | | | 15 | | | 20 | | | 8 | | | 10 | | | 35 | | | 25 | | | 25 | | |
Note: Extreme point in the consensus Downside is ‘worst outcome’ in the scenario, for example the lowest GDP growth and the highest unemployment rate, in the first two years of the scenario.
Additional Downside scenario
An additional Downside scenario that features a global recession has been created to reflect management’s view of severe risks. Such a scenario has been in use since 2Q20. In this scenario, infections rise over the second half of 2021, with setbacks to vaccine programmes such that it takes until the end of 2022 for the pandemic to come to an end. The scenario also assumes governments and central banks are unable to significantly increase
fiscal and monetary programmes, which results in a rise in unemployment and a fall in asset prices. In Hong Kong and France, the impacts on the unemployment rate are similar to those in the consensus Downside scenario, reflective of recent historical experiences. GDP growth is stronger in the additional Downside scenario compared with the other scenarios and this stronger bounce-back is a consequence of the deeper initial economic contraction.
The following table describes key macroeconomic variables and the probabilities assigned in the additional Downside scenario.
| | | | | | | | | | | | | | | | | | | | | | | | | | | | | | | | | | | | | | | | | | | | | | | | | | |
| Additional Downside scenario worst outcome |
| UK | | US | | Hong Kong | | Mainland China | | Canada | | France | | UAE | | Mexico | |
| % | | % | | % | | % | | % | | % | | % | | % | |
| GDP growth rate | (2.1) | | (2Q22) | (4.4) | | (2Q22) | (10.6) | | (1Q22) | (7.4) | | (2Q22) | (4.6) | | (2Q22) | (3.1) | | (1Q22) | (11.6) | | (2Q22) | (7.6) | | (2Q22) |
| Unemployment rate | 9.3 | | (3Q22) | 11.0 | | (2Q23) | 7.1 | | (3Q21) | 5.7 | | (1Q23) | 9.8 | | (2Q22) | 11.1 | | (4Q21) | 4.4 | | (3Q21) | 6.1 | | (4Q22) |
| House price growth | (7.8) | | (2Q22) | (5.7) | | (2Q22) | (17.0) | | (2Q22) | (20.7) | | (2Q22) | (16.1) | | (3Q22) | (5.9) | | (2Q22) | (18.1) | | (2Q22) | 0.9 | | (4Q22) |
| Short-term interest rate | 1.0 | | (4Q21) | 1.3 | | (4Q21) | 2.1 | | (3Q21) | 4.8 | | (4Q21) | 0.5 | | (3Q21) | 0.3 | | (4Q21) | 0.4 | | (4Q21) | 7.2 | | (4Q21) |
| Probability | 15 | | | 5 | | | 5 | | | 2 | | | 10 | | | 15 | | | 5 | | | 5 | | |
Note: Extreme point in the additional Downside is ‘worst outcome’ in the scenario, for example the lowest GDP growth and the highest unemployment rate, in the first two years of the scenario.
In considering economic uncertainty and assigning probabilities to scenarios, management has considered both global and country-specific factors. This has led management to assigning scenario probabilities that are tailored to its view of uncertainty in individual markets.
To inform its view, management has considered trends in the progression of the virus in individual countries, the expected reach
and efficacy of vaccine roll-outs over the course of 2021, the size and effectiveness of future government support schemes and the connectivity with other countries. Management has also been guided by the actual response to the Covid-19 outbreak and by the economic experience across countries in 2020. China’s visible success at containing the virus and its repeated rapid response to localised outbreaks, coupled with government support programmes and clear signs of economic recovery, have led
management to conclude that the economic outlook for mainland China is the least volatile out of all our top markets. The Central scenario for mainland China has an 80% probability while a total of 10% has been assigned to the 2 Downside scenarios. In Hong Kong, the combination of recurrent outbreaks in the recent past, delays to its vaccination programme, evidence of vaccine hesitancy which has delayed the original target of reaching widespread immunity by the end of the third quarter this year, and the other risks outlined above, have led management to assign 25% weight to the 2 Downside scenarios.
The UK and France face the greatest economic uncertainties in our key markets. In the UK, the discovery of more infectious strains of the virus and subsequent national restrictions on activity imposed before the end of 2020, as well as the current increase in infections, have resulted in considerable uncertainty in the economic outlook. In France, the increases in cases and hospitalisations in the first few months of 2021, the difficulties experienced with the launch of a national vaccination programme and the spread of a more infectious strain of the virus similarly affect the economic outlook. Given these considerations, the consensus Central scenarios for the UK and France have been assigned probabilities of 50% and 45% respectively, while the consensus Downside scenarios have been allocated 30% and 35%. The additional Downside scenario has been assigned 15% probability to each of these markets to reflect the view that the balance of risks is weighted to the downside, and the consensus Upside scenario for these countries has been given a 5% probability.
For the US, Canada and Mexico, connectivity across the 3 North American economies has been considered. In the UAE, the impact of the oil price on the economy and the ability of non-oil sectors to contribute to economic recovery have influenced the view of uncertainty. The Central scenario has been assigned between 65% and 75% weight for these 4 markets and, with risks perceived as being weighted to the downside, the 2 Downside scenarios have been given weights of between 20% and 30%.
The following graphs show the historical and forecasted GDP growth rate for the various economic scenarios in our 4 largest markets.
Note: Real GDP shown as year-on-year percentage change.
Critical accounting estimates and judgements
The calculation of ECL under IFRS 9 involves significant judgements, assumptions and estimates, as set out in the Annual Report and Accounts 2020 under ‘Critical accounting estimates and judgements’. The level of estimation uncertainty and judgement has remained high since 31 December 2020 as a result of the economic effects of the Covid-19 outbreak, including judgements relating to:
•the selection and weighting of economic scenarios, given rapidly changing economic conditions in an unprecedented manner, uncertainty as to the effect of government and central bank support measures designed to alleviate adverse economic impacts, and a wide distribution of economic forecasts. There is judgement in making assumptions about the length of time and severity of the economic effects of the pandemic and the shape of recovery;
•estimating the economic effects of those scenarios on ECL, when the volatility of economic changes associated with the pandemic are outside the observable historical trends that can be reflected in the models. Modelled assumptions and linkages between economic factors and credit losses may underestimate or overestimate ECL in these conditions, including the effect of real estate prices on modelled ECL outcomes; and
•the identification of customers experiencing significant increases in credit risk and credit impairment, where judgements are made about the extent to which government support programmes have deferred or mitigated the risk of defaults, and the effects once support levels are reduced, particularly in relation to lending in high-risk and vulnerable sectors. Where customers have accepted payment deferrals and other reliefs designed to address short-term liquidity issues, or have extended those deferrals, judgements include the extent to which they are able to meet their financial obligations on returning to their original terms. The use of segmentation techniques for indicators of significant increases in credit risk for retail customers involves estimation uncertainty.
How economic scenarios are reflected in ECL calculations
The methodologies for the application of forward economic guidance into the calculation of ECL for wholesale and retail loans and portfolios are set out on page 132 of the Annual Report and Accounts 2020. Models are used to reflect economic scenarios on ECL estimates. These models are based largely on historical observations and correlations with default rates.
We continue to observe volatility in macroeconomic variables as a result of the Covid-19 pandemic, which – together with significant governmental support programmes, forbearance and payment holidays – have impacted model performance and historical correlations between macroeconomic variables and defaults. As economic forecasts begin to improve, the level and speed of economic recovery remains outside the range of historical experience used to calibrate the models, and the timing of defaults has considerably shifted from the modelled assumptions. Management judgements have been used to overcome the limitations in the model generated outcome, increasing the ECL.
Management judgemental adjustments arise when data and model limitations are addressed in the short term using in-model and post-model adjustments. This includes refining model inputs and outputs and using post-model adjustments based on management judgement and higher level quantitative analysis for impacts that are difficult to model.
Management judgemental adjustments
In the context of IFRS 9, management judgemental adjustments are typically short-term increases or decreases to the ECL at either a customer or portfolio level to account for late-breaking events, model deficiencies and other assessments applied during management review and challenge.
At 30 June 2021, management judgements were applied to reflect credit risk dynamics not captured by our models. The drivers of the management judgemental adjustments continue to evolve with the economic environment. We have internal governance in place to monitor management judgemental adjustments regularly and, where possible, to reduce the reliance on these through model recalibration or redevelopment, as appropriate.
Wider-ranging model changes will take time to develop and need observable loss data on which models can be developed. Models will be revisited over time once the longer-term impacts of the Covid-19 outbreak are observed. Therefore, we continue to anticipate significant management judgemental adjustments for the foreseeable future.
Judgemental adjustments, which primarily relate to delays in the timing and extent of defaults, will likely cease to occur when macroeconomic forecasts have stabilised and move within the range of historical experience, portfolio impacts due to unwinding of government schemes become visible and the uncertainty due to Covid-19 reduces.
The wholesale and retail management judgemental adjustments are presented as part of the global business impairment committees with representation from Model Risk Management. This is in line with the governance process as set out on page 120 of the Annual Report and Accounts 2020.
Management judgemental adjustments made in estimating the reported ECL at 30 June 2021 are set out in the following table. The table includes adjustments in relation to data and model limitations resulting from the pandemic, and as a result of the regular process of model development and implementation. It shows the adjustments applicable to the scenario-weighted ECL numbers.
| | | | | | | | | | | |
Management judgemental adjustments to ECL at 30 June 20211 |
| Retail | Wholesale | Total |
| $bn | $bn | $bn |
| | | |
| Low-risk counterparties (banks, sovereigns and government entities) | 0.1 | | (0.8) | | (0.7) | |
| Corporate lending adjustments | | 1.4 | | 1.4 | |
| Retail lending probability of default adjustments | (0.1) | | | (0.1) | |
| Retail model default timing adjustments | 0.4 | | | 0.4 | |
| Macroeconomic-related adjustments | 0.6 | | | 0.6 | |
| Other retail lending adjustments | 0.3 | | | 0.3 | |
| Total | 1.3 | | 0.7 | | 2.0 | |
| | | |
| | | | | | | | | | | |
Management judgemental adjustments to ECL at 31 December 20201 |
| Retail | Wholesale | Total |
| $bn | $bn | $bn |
| | | |
| Low-risk counterparties (banks, sovereigns and government entities) | 0 | | (0.7) | | (0.7) | |
| Corporate lending adjustments | | 0.5 | | 0.5 | |
| Retail lending probability of default adjustments | (0.8) | | | (0.8) | |
| Retail model default timing adjustments | 1.9 | | | 1.9 | |
| Macroeconomic-related adjustments | 0.1 | | | 0.1 | |
| Other retail lending adjustments | 0.3 | | | 0.3 | |
| Total | 1.5 | | (0.2) | | 1.3 | |
1 Management judgemental adjustments presented in the table reflect increases or (decreases) to ECL, respectively.
In the wholesale portfolio, management judgemental adjustments were an ECL increase of $0.7bn (31 December 2020: $0.2bn decrease).
The adjustments relating to wholesale low-credit risk exposures decreased ECL by $0.8bn at 30 June 2021 (31 December 2020: $0.7bn decrease). These were mainly to highly rated banks, sovereigns and US government-sponsored entities, where modelled credit factors did not fully reflect the underlying fundamentals of these entities or the effect of government support and economic programmes in the Covid-19 environment.
Adjustments to corporate exposures increased ECL by $1.4bn at 30 June 2021 (31 December 2020: $0.5bn increase). These principally reflected the outcome of management judgements for high-risk and vulnerable sectors in some of our key markets, supported by credit experts’ input, quantitative analyses and
benchmarks. Considerations include uncertainty around vaccine efficacy and risk of new variants and, uncertainty around timing and extent of defaults in some sectors due to government intervention. The increase in adjustment impact relative to
31 December 2020 was mostly driven by management judgements as a result of further improvement of macroeconomic scenarios and increased dislocation of modelled outcomes to management expectations for high-risk and vulnerable sectors.
In the retail portfolio, management judgemental adjustments were an ECL increase of $1.3bn at 30 June 2021 (31 December 2020: $1.5bn increase).
The retail model default timing adjustment increased ECL by $0.4bn (31 December 2020: $1.9bn increase). This was applied in several economies as customer relief and government support programmes continue to delay the emergence of defaults. The
level of adjustment decreased during the period given the improvement in macroeconomic forecasts and the unwinding in a number of markets as customer relief and government support concludes. Retail models are reliant on the assumption that as macroeconomic conditions deteriorate, defaults will crystallise. We will monitor the continuation of customer relief and government support programmes that have stabilised macroeconomic conditions and therefore the timing of retail model defaults.
The retail lending probability of default adjustments decreased ECL by $0.1bn (31 December 2020: $0.8bn decrease). These related to severe projections of macroeconomic variables that are outside the historical observations on which IFRS 9 models have been built and calibrated to operate. The majority of scenarios are now within historical observations leading to lower levels of adjustment.
Macroeconomic-related adjustments increased ECL by $0.6bn
(31 December 2020: $0.1bn increase). These were applied to reflect management’s expectation in regards to the extent of previously forecast defaults that have not yet emerged in the retail portfolio in the context of improvements in the macroeconomic forecasts.
Other retail lending adjustments increased ECL by $0.3bn (31 December 2020: $0.3bn increase), reflecting those who remain in or have recently exited customer support programmes and all other data and model adjustments.
Economic scenarios sensitivity analysis of ECL estimates
Management considered the sensitivity of the ECL outcome against the economic forecasts as part of the ECL governance process by recalculating the ECL under each scenario described above for selected portfolios, applying a 100% weighting to each scenario in turn. The weighting is reflected in both the determination of a significant increase in credit risk and the measurement of the resulting ECL.
The ECL calculated for the Upside and Downside scenarios should not be taken to represent the upper and lower limits of possible
ECL outcomes. The impact of defaults that might occur in the future under different economic scenarios is captured by recalculating ECL for loans in stages 1 and 2 at the balance sheet date. The population of stage 3 loans (in default) at the balance sheet date is unchanged in these sensitivity calculations. Stage 3 ECL would only be sensitive to changes in forecasts of future economic conditions if the loss-given default of a particular portfolio was sensitive to these changes.
There is a particularly high degree of estimation uncertainty in numbers representing tail risk scenarios when assigned a 100% weighting.
For wholesale credit risk exposures, the sensitivity analysis excludes ECL for financial instruments related to defaulted obligors because the measurement of ECL is relatively more sensitive to credit factors specific to the obligor than future economic scenarios. Therefore, it is impracticable to separate the effect of macroeconomic factors in individual assessments.
For retail credit risk exposures, the sensitivity analysis includes ECL for loans and advances to customers related to defaulted obligors. This is because the retail ECL for secured mortgage portfolios, including loans in all stages, is sensitive to macroeconomic variables.
Wholesale and retail sensitivity
The wholesale and retail sensitivity analysis is stated inclusive of management judgemental adjustments, as appropriate to each scenario. The results tables exclude portfolios held by the insurance business and small portfolios, and as such cannot be directly compared with personal and wholesale lending presented in other credit risk tables. Additionally, in both the wholesale and retail analysis, the comparative period results for additional/ alternative Downside scenarios are also not directly comparable with the current period, because they reflect different risk profiles relative to the consensus scenarios for the period end.
Wholesale analysis
| | | | | | | | | | | | | | | | | | | | |
IFRS 9 ECL sensitivity to future economic conditions1, 2 |
| Gross carrying amount | Reported
ECL | Central scenario ECL | Upside scenario ECL | Downside scenario ECL | Additional Downside scenario ECL |
| By geography at 30 Jun 2021 | $m | $m | $m | $m | $m | $m |
| | | | | | |
| UK | 481,849 | | 1,740 | | 1,433 | | 1,083 | | 1,888 | | 2,949 | |
| US | 229,768 | | 270 | | 253 | | 185 | | 319 | | 490 | |
| Hong Kong | 436,443 | | 429 | | 377 | | 211 | | 557 | | 892 | |
| Mainland China | 124,547 | | 98 | | 75 | | 16 | | 224 | | 1,192 | |
| Canada | 84,398 | | 146 | | 115 | | 66 | | 176 | | 361 | |
| Mexico | 24,971 | | 180 | | 161 | | 123 | | 210 | | 358 | |
| UAE | 45,997 | | 201 | | 164 | | 119 | | 257 | | 607 | |
| France | 197,175 | | 133 | | 115 | | 107 | | 147 | | 233 | |
| | | | | | | | | | | | | | | | | | | | |
|
| | | | | | |
| By geography at 31 Dec 2020 | | | | | | |
| | | | | | |
| UK | 430,555 | | 2,077 | | 1,514 | | 1,026 | | 2,271 | | 3,869 | |
| US | 201,263 | | 369 | | 314 | | 219 | | 472 | | 723 | |
| Hong Kong | 452,983 | | 474 | | 388 | | 211 | | 672 | | 1,363 | |
| Mainland China | 118,163 | | 116 | | 93 | | 28 | | 252 | | 1,158 | |
| Canada | 85,720 | | 183 | | 140 | | 82 | | 253 | | 528 | |
| Mexico | 25,920 | | 246 | | 222 | | 177 | | 285 | | 437 | |
| UAE | 44,777 | | 250 | | 241 | | 190 | | 330 | | 536 | |
| France | 164,899 | | 117 | | 109 | | 97 | | 131 | | 238 | |
1 ECL sensitivity includes off-balance sheet financial instruments that are subject to significant measurement uncertainty.
2 Includes low credit-risk financial instruments such as debt instruments at FVOCI, which have high carrying amounts but low ECL under all the above scenarios.
At 30 June 2021, the most significant level of ECL sensitivity was observed in the UK, mainland China and Hong Kong. This higher sensitivity was largely driven by significant exposure in these regions and more severe impacts of the Downside scenarios relative to the Central and probability-weighted scenarios. For
mainland China, the additional Downside scenario weighting of 2% reflected a scenario that is considered highly unlikely and is significantly more adverse compared with the Central scenario, resulting in a higher ECL estimate relative to the reported and Central scenarios.
Retail analysis
| | | | | | | | | | | | | | | | | | | | |
IFRS 9 ECL sensitivity to future economic conditions1,2 |
| Gross carrying amount | Reported
ECL | Central scenario ECL | Upside scenario ECL | Downside scenario ECL | Additional Downside scenario |
| By geography at 30 June 2021 | $m | $m | $m | $m | $m | $m |
| UK | | | | | | |
| Mortgages | 151,435 | | 205 | | 199 | | 193 | | 210 | | 221 | |
| Credit cards | 7,563 | | 678 | | 625 | | 533 | | 767 | | 945 | |
| Other | 8,460 | | 713 | | 631 | | 534 | | 779 | | 934 | |
| Mexico | | | | | | |
| Mortgages | 4,427 | | 112 | | 104 | | 93 | | 125 | | 142 | |
| Credit cards | 1,044 | | 180 | | 175 | | 163 | | 198 | | 214 | |
| Other | 2,626 | | 395 | | 380 | | 357 | | 412 | | 437 | |
| Hong Kong | | | | | | |
| Mortgages | 93,283 | | 0 | | 0 | | 0 | | 0 | | 0 | |
| Credit cards | 7,414 | | 244 | | 231 | | 213 | | 269 | | 384 | |
| Other | 5,787 | | 102 | | 96 | | 89 | | 119 | | 141 | |
| UAE | | | | | | |
| Mortgages | 1,902 | | 55 | | 52 | | 44 | | 60 | | 64 | |
| Credit cards | 395 | | 73 | | 66 | | 61 | | 80 | | 95 | |
| Other | 613 | | 28 | | 28 | | 26 | | 29 | | 31 | |
| France | | | | | | |
| Mortgages | 23,583 | | 61 | | 60 | | 60 | | 61 | | 62 | |
| Other | 1,668 | | 75 | | 75 | | 74 | | 76 | | 77 | |
| US | | | | | | |
| Mortgages | 15,283 | | 41 | | 41 | | 40 | | 42 | | 48 | |
| Credit cards | 938 | | 162 | | 161 | | 160 | | 164 | | 178 | |
| Canada | | | | | | |
| Mortgages | 24,681 | | 31 | | 30 | | 27 | | 32 | | 38 | |
| Credit cards | 232 | | 10 | | 10 | | 10 | | 10 | | 10 | |
| Other | 1,699 | | 21 | | 21 | | 20 | | 23 | | 25 | |
| | | | | | | | | | | | | | | | | | | | |
|
| | | | | | |
| By geography at 31 December 2020 | | | | | | |
| UK | | | | | | |
| Mortgages | 146,478 | | 197 | | 182 | | 172 | | 205 | | 221 | |
| Credit cards | 7,869 | | 857 | | 774 | | 589 | | 904 | | 1,084 | |
| Other | 9,164 | | 897 | | 795 | | 471 | | 1,022 | | 1,165 | |
| Mexico | | | | | | |
| Mortgages | 3,896 | | 111 | | 101 | | 79 | | 136 | | 167 | |
| Credit cards | 1,113 | | 260 | | 255 | | 243 | | 269 | | 290 | |
| Other | 2,549 | | 436 | | 428 | | 411 | | 451 | | 491 | |
| Hong Kong | | | | | | |
| Mortgages | 89,943 | | 0 | | 0 | | 0 | | 0 | | 0 | |
| Credit cards | 7,422 | | 266 | | 259 | | 247 | | 277 | | 405 | |
| Other | 6,020 | | 112 | | 105 | | 102 | | 115 | | 130 | |
| UAE | | | | | | |
| Mortgages | 1,889 | | 66 | | 63 | | 53 | | 73 | | 78 | |
| Credit cards | 426 | | 92 | | 81 | | 62 | | 107 | | 126 | |
| Other | 683 | | 38 | | 37 | | 33 | | 41 | | 46 | |
| France | | | | | | |
| Mortgages | 24,565 | | 68 | | 68 | | 68 | | 69 | | 70 | |
| Other | 1,725 | | 88 | | 87 | | 85 | | 88 | | 91 | |
| US | | | | | | |
| Mortgages | 15,399 | | 41 | | 39 | | 38 | | 41 | | 53 | |
| Credit cards | 570 | | 86 | | 84 | | 81 | | 88 | | 119 | |
| Canada | | | | | | |
| Mortgages | 22,454 | | 31 | | 30 | | 29 | | 31 | | 36 | |
| Credit cards | 260 | | 9 | | 9 | | 8 | | 9 | | 9 | |
| Other | 1,775 | | 22 | | 21 | | 20 | | 24 | | 28 | |
1 ECL sensitivities exclude portfolios utilising less complex modelling approaches.
2 At 30 June 2021, US sensitivity includes the implementation of an enhanced model.
At 30 June 2021, the most significant level of ECL sensitivity was observed in the UK, Mexico and Hong Kong. Mortgages reflected the lowest level of ECL sensitivity across most markets as collateral values remain resilient. Hong Kong mortgages had low levels of reported ECL due to the credit quality of the portfolio, and so presented sensitivity was negligible. Credit cards and other unsecured lending are more sensitive to economic forecasts, which have reflected improvements during the first half of 2021.
Group ECL sensitivity results
The ECL impact of the scenarios and management judgemental adjustments are highly sensitive to movements in economic forecasts, including the efficacy of government support measures. Based upon the sensitivity tables presented above, if the Group ECL balance (excluding wholesale stage 3, which is assessed individually) was estimated solely on the basis of the Central scenario, Upside scenario, Downside scenario or the additional Downside scenario at 30 June 2021, it would increase/(decrease) as presented in the below table.
| | | | | | | | |
| Retail1 | Wholesale1 |
| Total Group ECL at 30 June 2021 | $bn | $bn |
| Reported ECL | 3.9 | | 3.7 | |
| Scenarios | | |
| 100% consensus Central scenario | (0.2) | | (0.6) | |
| 100% consensus Upside scenario | (0.5) | | (1.4) | |
| 100% consensus Downside scenario | 0.3 | | 0.7 | |
| 100% additional Downside scenario | 1.1 | | 4.5 | |
| | | | | | | | |
| | |
| Total Group ECL at 31 December 2020 | | |
| Reported ECL | 4.5 | | 4.5 | |
| Scenarios | | |
| 100% consensus Central scenario | (0.3) | | (0.9) | |
| 100% consensus Upside scenario | (1.0) | | (2.0) | |
| 100% consensus Downside scenario | 0.3 | | 1.0 | |
| 100% alternative Downside scenario | 1.3 | | 5.9 | |
1 On the same basis as retail and wholesale sensitivity analysis.
At 30 June 2021, Group ECL sensitivity decreased across all scenarios compared with 31 December 2020, driven by the improvement of macroeconomic forecasts.
There still remains a significant degree of uncertainty in relation to the UK economic outlook. If a 100% weight were applied to the consensus Downside and additional Downside scenario for the UK, respectively, it would result in an increase in ECL of $0.1bn and $1.2bn in wholesale and $0.2bn and $0.5bn in retail.
Reconciliation of changes in gross carrying/nominal amount and allowances for loans and advances to banks and customers
The following disclosure provides a reconciliation by stage of the Group’s gross carrying/nominal amount and allowances for loans and advances to banks and customers, including loan commitments and financial guarantees. Movements are calculated on a quarterly basis and therefore fully capture stage movements between quarters. If movements were calculated on a year-to-date basis they would only reflect the opening and closing position of the financial instrument.
The transfers of financial instruments represent the impact of stage transfers upon the gross carrying/nominal amount and associated allowance for ECL.
The net remeasurement of ECL arising from stage transfers represents the increase or decrease due to these transfers, for example, moving from a 12-month (stage 1) to a lifetime (stage 2) ECL measurement basis. Net remeasurement excludes the underlying customer risk rating (‘CRR’)/probability of default (‘PD’) movements of the financial instruments transferring stage. This is captured, along with other credit quality movements in the ‘changes in risk parameters – credit quality’ line item.
Changes in ‘New financial assets originated or purchased’, ‘assets derecognised (including final repayments)’ and ‘changes to risk parameters – further lending/repayments’ represent the impact from volume movements within the Group’s lending portfolio.
| | | | | | | | | | | | | | | | | | | | | | | | | | | | | | | | |
| Reconciliation of changes in gross carrying/nominal amount and allowances for loans and advances to banks and customers including loan commitments and financial guarantees |
| Non-credit impaired | Credit impaired | |
| Stage 1 | Stage 2 | Stage 3 | POCI | Total |
| Gross carrying/ nominal amount | Allowance for ECL | Gross carrying/ nominal amount | Allowance for ECL | Gross carrying/ nominal amount | Allowance for ECL | Gross carrying/ nominal amount | Allowance for ECL | Gross carrying/ nominal amount | Allowance for ECL |
| $m | $m | $m | $m | $m | $m | $m | $m | $m | $m |
| At 1 Jan 2021 | 1,506,451 | | (2,331) | | 223,432 | | (5,403) | | 20,424 | | (7,544) | | 279 | | (113) | | 1,750,586 | | (15,391) | |
| Transfers of financial instruments: | (9,572) | | (993) | | 6,141 | | 1,411 | | 3,431 | | (418) | | — | | — | | — | | — | |
| – transfers from stage 1 to stage 2 | (88,050) | | 273 | | 88,050 | | (273) | | — | | — | | — | | — | | — | | — | |
| – transfers from stage 2 to stage 1 | 79,249 | | (1,239) | | (79,249) | | 1,239 | | — | | — | | — | | — | | — | | — | |
| – transfers to stage 3 | (1,092) | | 18 | | (3,248) | | 522 | | 4,340 | | (540) | | — | | — | | — | | — | |
| – transfers from stage 3 | 321 | | (45) | | 588 | | (77) | | (909) | | 122 | | — | | — | | — | | — | |
| Net remeasurement of ECL arising from transfer of stage | — | | 625 | | — | | (320) | | — | | (12) | | — | | — | | — | | 293 | |
| | | | | | | | | | |
| New financial assets originated or purchased | 224,124 | | (268) | | — | | — | | — | | — | | 1 | | — | | 224,125 | | (268) | |
| Assets derecognised (including final repayments) | (143,261) | | 82 | | (15,521) | | 258 | | (1,559) | | 234 | | (8) | | 6 | | (160,349) | | 580 | |
| Changes to risk parameters – further lending/repayments | (25,456) | | 285 | | (3,440) | | 285 | | (808) | | 348 | | (44) | | 4 | | (29,748) | | 922 | |
| | | | | | | | | | |
| Change in risk parameters – credit quality | — | | 609 | | — | | (397) | | — | | (1,229) | | — | | 28 | | — | | (989) | |
| Changes to models used for ECL calculation | — | | 12 | | — | | (12) | | — | | 0 | | — | | — | | — | | 0 | |
| Assets written off | — | | — | | — | | — | | (1,356) | | 1,352 | | (9) | | 1 | | (1,365) | | 1,353 | |
| Credit-related modifications that resulted in derecognition | — | | — | | — | | — | | (1) | | — | | — | | — | | (1) | | — | |
| | | | | | | | | | |
| Foreign exchange | (3,130) | | (7) | | (91) | | (19) | | (92) | | 35 | | (1) | | — | | (3,314) | | 9 | |
| Other | (180) | | 7 | | (20) | | 5 | | (7) | | 2 | | — | | — | | (207) | | 14 | |
| At 30 Jun 2021 | 1,548,976 | | (1,979) | | 210,501 | | (4,192) | | 20,032 | | (7,232) | | 218 | | (74) | | 1,779,727 | | (13,477) | |
| ECL income statement change for the period | | 1,345 | | | (186) | | | (659) | | | 38 | | | 538 | |
| Recoveries | | | | | | | | | | 209 | |
| | | | | | | | | | |
| | | | | | | | | | |
| | | | | | | | | | |
| Other | | | | | | | | | | (41) | |
| Total ECL income statement change for the period | | | | | | | | | | 706 | |
| | | | | | | | | | | | |
|
| At 30 Jun 2021 | | 6 months ended 30 Jun 2021 |
| Gross carrying/nominal amount | Allowance for
ECL | | ECL release/(charge) |
| | $m | $m | | $m |
| As above | 1,779,727 | | (13,477) | | | 706 | |
| Other financial assets measured at amortised cost | 854,504 | | (224) | | | (56) | |
| Non-trading reverse purchase agreement commitments | 68,200 | | — | | | — | |
| Performance and other guarantees | — | | — | | | 43 | |
| Summary of financial instruments to which the impairment requirements in IFRS 9 are applied/Summary consolidated income statement | 2,702,431 | | (13,701) | | | 693 | |
| Debt instruments measured at FVOCI | 348,107 | | (111) | | | 26 | |
| Total allowance for ECL/total income statement ECL charge for the period | n/a | (13,812) | | | 719 | |
As shown in the previous table, the allowance for ECL for loans and advances to customers and banks and relevant loan commitments and financial guarantees decreased by $1,914m during the period, from $15,391m at 31 December 2020 to $13,477m at 30 June 2021.
This decrease was driven by:
•$1,353m of assets written off;
•$1,234m relating to volume movements, which included the ECL allowance associated with new originations, assets derecognised and further pending repayment;
•$293m relating to the net remeasurement impact of stage transfers; and
•foreign exchange and other movements of $23m.
This decrease was offset by $989m relating to underlying credit quality changes, including the credit quality impact of financial instruments transferring between stages.
The ECL release for the period of $538m presented in the previous table consisted of $1,234m relating to underlying net book volume and $293m relating to the net remeasurement impact of stage transfers. These were partly offset by $989m relating to underlying credit quality changes, including the credit quality impact of financial instruments transferring between stages.
| | | | | | | | | | | | | | | | | | | | | | | | | | | | | | | | |
| Reconciliation of changes in gross carrying/nominal amount and allowances for loans and advances to banks and customers including loan commitments and financial guarantees (continued) |
| Non-credit impaired | Credit impaired | |
| Stage 1 | Stage 2 | Stage 3 | POCI | Total |
| Gross carrying/ nominal amount | Allowance for ECL | Gross carrying/ nominal amount | Allowance for ECL | Gross carrying/ nominal amount | Allowance for ECL | Gross carrying/ nominal amount | Allowance for ECL | Gross carrying/ nominal amount | Allowance for ECL |
| $m | $m | $m | $m | $m | $m | $m | $m | $m | $m |
| At 1 Jan 2020 | 1,561,613 | | (1,464) | | 105,551 | | (2,441) | | 14,335 | | (5,121) | | 345 | | (99) | | 1,681,844 | | (9,125) | |
| Transfers of financial instruments: | (129,236) | | (1,122) | | 116,783 | | 1,951 | | 12,453 | | (829) | | — | | — | | — | | — | |
– transfers from stage 1 to stage 2 | (298,725) | | 947 | | 298,725 | | (947) | | — | | — | | — | | — | | — | | — | |
– transfers from stage 2 to stage 1 | 172,894 | | (2,073) | | (172,894) | | 2,073 | | — | | — | | — | | — | | — | | — | |
| – transfers to stage 3 | (3,942) | | 30 | | (10,320) | | 986 | | 14,262 | | (1,016) | | — | | — | | — | | — | |
| – transfers from stage 3 | 537 | | (26) | | 1,272 | | (161) | | (1,809) | | 187 | | — | | — | | — | | — | |
| Net remeasurement of ECL arising from transfer of stage | — | | 907 | | — | | (1,158) | | — | | (750) | | — | | — | | — | | (1,001) | |
| New financial assets originated or purchased | 437,836 | | (653) | | — | | — | | — | | — | | 25 | | (1) | | 437,861 | | (654) | |
| Assets derecognised (including final repayments) | (313,347) | | 160 | | (37,409) | | 464 | | (3,430) | | 485 | | (23) | | 2 | | (354,209) | | 1,111 | |
| Changes to risk parameters – further lending/repayment | (83,147) | | 157 | | 29,092 | | 85 | | (597) | | 248 | | (50) | | (2) | | (54,702) | | 488 | |
| Changes in risk parameters – credit quality | — | | (408) | | — | | (4,374) | | — | | (4,378) | | — | | (39) | | — | | (9,199) | |
| Changes to models used for ECL calculation | — | | 134 | | — | | 294 | | — | | 5 | | — | | — | | — | | 433 | |
| Assets written off | — | | — | | — | | — | | (2,946) | | 2,944 | | (30) | | 30 | | (2,976) | | 2,974 | |
| Credit-related modifications that resulted in derecognition | — | | — | | — | | — | | (23) | | 7 | | — | | — | | (23) | | 7 | |
| Foreign exchange | 32,808 | | (47) | | 9,123 | | (223) | | 633 | | (163) | | 4 | | (3) | | 42,568 | | (436) | |
| Other | (76) | | 5 | | 292 | | (1) | | (1) | | 8 | | 8 | | (1) | | 223 | | 11 | |
| At 31 Dec 2020 | 1,506,451 | | (2,331) | | 223,432 | | (5,403) | | 20,424 | | (7,544) | | 279 | | (113) | | 1,750,586 | | (15,391) | |
| ECL income statement change for the period | | 297 | | | (4,689) | | | (4,390) | | | (40) | | | (8,822) | |
| Recoveries | | | | | | | | | | 326 | |
| | | | | | | | | | |
| | | | | | | | | | |
| Others | | | | | | | | | | (84) | |
Total ECL income statement change for the period1 | | | | | | | | | | (8,580) | |
| | | | | | | | | | | | |
|
| At 31 Dec 2020 | | 12 months ended 31 Dec 2020 |
| Gross carrying/nominal amount | Allowance for
ECL | | ECL charge |
| $m | $m | | $m |
| As above | 1,750,586 | | (15,391) | | | (8,580) | |
| Other financial assets measured at amortised cost | 772,408 | | (175) | | | (95) | |
| Non-trading reverse purchase agreement commitments | 61,716 | | — | | | — | |
| Performance and other guarantees | — | | — | | | (94) | |
| Summary of financial instruments to which the impairment requirements in IFRS 9 are applied/Summary consolidated income statement | 2,584,710 | | (15,566) | | | (8,769) | |
| Debt instruments measured at FVOCI | 399,717 | | (141) | | | (48) | |
| Total allowance for ECL/total income statement ECL charge for the period | n/a | (15,707) | | | (8,817) | |
1 The 31 December 2020 total ECL income statement change of $8,580m is attributable to $6,464m for the six months ended 30 June 2020 and $2,116m to the six months ended 31 December 2020.
Credit quality of financial instruments
We assess the credit quality of all financial instruments that are subject to credit risk. The credit quality of financial instruments is a point-in-time assessment of PD, whereas stages 1 and 2 are determined based on relative deterioration of credit quality since initial recognition. Accordingly, for non-credit-impaired financial instruments, there is no direct relationship between the credit quality assessment and stages 1 and 2, though typically the lower credit quality bands exhibit a higher proportion in stage 2.
The five credit quality classifications each encompass a range of granular internal credit rating grades assigned to wholesale and personal lending businesses and the external ratings attributed by external agencies to debt securities, as shown in the following table. Personal lending credit quality is disclosed based on a
12-month point-in-time PD adjusted for multiple economic scenarios. The credit quality classifications for wholesale lending are based on internal credit risk ratings.
| | | | | | | | | | | | | | | | | | | | | |
| Credit quality classification |
| | Sovereign debt securities
and bills | Other debt
securities
and bills | Wholesale lending
and derivatives | Retail lending |
| | External credit rating | External credit rating | Internal credit rating | 12-month Basel probability of default % | Internal credit rating | 12 month probability- weighted PD % |
Quality classification1,2 | | | | | | | |
| Strong | | BBB and above | A- and above | CRR 1 to CRR 2 | 0 – 0.169 | Band 1 and 2 | 0.000 – 0.500 |
| Good | | BBB- to BB | BBB+ to BBB- | CRR 3 | 0.170 – 0.740 | Band 3 | 0.501 – 1.500 |
| Satisfactory | | BB- to B and unrated | BB+ to B and unrated | CRR 4 to CRR 5 | 0.741 – 4.914 | Band 4 and 5 | 1.501 – 20.000 |
| Sub-standard | | B- to C | B- to C | CRR 6 to CRR 8 | 4.915 – 99.999 | Band 6 | 20.001 – 99.999 |
| Credit impaired | | Default | Default | CRR 9 to CRR 10 | 100 | Band 7 | 100 |
1 Customer risk rating (‘CRR’).
2 12-month point-in-time probability-weighted probability of default (‘PD’).
| | | | | | | | | | | | | | | | | | | | | | | | | | | |
| Distribution of financial instruments to which the impairment requirements in IFRS 9 are applied, by credit quality and stage allocation |
|
| | Gross carrying/nominal amount | Allowance for ECL | Net |
| | Strong | Good | Satisfactory | Sub-
standard | Credit impaired | Total |
| | $m | $m | $m | $m | $m | $m | $m | $m |
| Loans and advances to customers at amortised cost | | 528,036 | | 232,101 | | 258,457 | | 34,496 | | 19,285 | | 1,072,375 | | (12,864) | | 1,059,511 | |
| – stage 1 | | 522,137 | | 204,332 | | 164,251 | | 4,826 | | 0 | | 895,546 | | (1,770) | | 893,776 | |
| – stage 2 | | 5,899 | | 27,769 | | 94,206 | | 29,670 | | 0 | | 157,544 | | (3,888) | | 153,656 | |
| – stage 3 | | 0 | | 0 | | 0 | | 0 | | 19,069 | | 19,069 | | (7,131) | | 11,938 | |
| – POCI | | 0 | | 0 | | 0 | | 0 | | 216 | | 216 | | (75) | | 141 | |
| Loans and advances to banks at amortised cost | | 77,928 | | 4,819 | | 3,155 | | 1,003 | | 0 | | 86,905 | | (19) | | 86,886 | |
| – stage 1 | | 77,739 | | 4,662 | | 3,062 | | 23 | | 0 | | 85,486 | | (16) | | 85,470 | |
| – stage 2 | | 189 | | 157 | | 93 | | 980 | | 0 | | 1,419 | | (3) | | 1,416 | |
| – stage 3 | | 0 | | 0 | | 0 | | 0 | | 0 | | 0 | | 0 | | 0 | |
| – POCI | | 0 | | 0 | | 0 | | 0 | | 0 | | 0 | | 0 | | 0 | |
| Other financial assets measured at amortised cost | | 751,028 | | 71,664 | | 30,323 | | 1,163 | | 326 | | 854,504 | | (224) | | 854,280 | |
| – stage 1 | | 750,477 | | 70,918 | | 27,469 | | 114 | | 0 | | 848,978 | | (130) | | 848,848 | |
| – stage 2 | | 551 | | 746 | | 2,854 | | 1,049 | | 0 | | 5,200 | | (38) | | 5,162 | |
| – stage 3 | | 0 | | 0 | | 0 | | 0 | | 284 | | 284 | | (47) | | 237 | |
| – POCI | | 0 | | 0 | | 0 | | 0 | | 42 | | 42 | | (9) | | 33 | |
| Loan and other credit-related commitments | | 408,027 | | 150,779 | | 91,284 | | 10,537 | | 746 | | 661,373 | | (530) | | 660,843 | |
| – stage 1 | | 404,424 | | 139,198 | | 67,581 | | 1,766 | | 0 | | 612,969 | | (184) | | 612,785 | |
| – stage 2 | | 3,603 | | 11,581 | | 23,703 | | 8,771 | | 0 | | 47,658 | | (266) | | 47,392 | |
| – stage 3 | | 0 | | 0 | | 0 | | 0 | | 744 | | 744 | | (80) | | 664 | |
| – POCI | | 0 | | 0 | | 0 | | 0 | | 2 | | 2 | | 0 | | 2 | |
| Financial guarantees | | 15,693 | | 5,018 | | 5,125 | | 1,216 | | 222 | | 27,274 | | (64) | | 27,210 | |
| – stage 1 | | 15,592 | | 4,178 | | 3,151 | | 248 | | 0 | | 23,169 | | (17) | | 23,152 | |
| – stage 2 | | 101 | | 840 | | 1,974 | | 968 | | 0 | | 3,883 | | (30) | | 3,853 | |
| – stage 3 | | 0 | | 0 | | 0 | | 0 | | 221 | | 221 | | (17) | | 204 | |
| – POCI | | 0 | | 0 | | 0 | | 0 | | 1 | | 1 | | 0 | | 1 | |
| At 30 Jun 2021 | | 1,780,712 | | 464,381 | | 388,344 | | 48,415 | | 20,579 | | 2,702,431 | | (13,701) | | 2,688,730 | |
Debt instruments at FVOCI1 | | | | | | | | | |
| – stage 1 | | 317,105 | | 13,039 | | 11,126 | | 0 | | 0 | | 341,270 | | (65) | | 341,205 | |
| – stage 2 | | 791 | | 93 | | 321 | | 741 | | 0 | | 1,946 | | (15) | | 1,931 | |
| – stage 3 | | 0 | | 0 | | 0 | | 0 | | 226 | | 226 | | (24) | | 202 | |
| – POCI | | 0 | | 0 | | 0 | | 0 | | 48 | | 48 | | (7) | | 41 | |
| At 30 Jun 2021 | | 317,896 | | 13,132 | | 11,447 | | 741 | | 274 | | 343,490 | | (111) | | 343,379 | |
| | | | | | | | | |
1 For the purposes of this disclosure, gross carrying value is defined as the amortised cost of a financial asset, before adjusting for any loss allowance. As such, the gross carrying value of debt instruments at FVOCI will not reconcile to the balance sheet as it excludes fair value gains and losses.
| | | | | | | | | | | | | | | | | | | | | | | | | | | |
| Distribution of financial instruments to which the impairment requirements in IFRS 9 are applied, by credit quality and stage allocation (continued) |
| | Gross carrying/notional amount | | |
| | Strong | Good | Satisfactory | Sub- standard | Credit impaired | Total | Allowance for ECL | Net |
| | $m | $m | $m | $m | $m | $m | $m | $m |
| Loans and advances to customers at amortised cost | | 506,231 | | 233,320 | | 256,584 | | 36,970 | | 19,372 | | 1,052,477 | | (14,490) | | 1,037,987 | |
| – stage 1 | | 499,836 | | 199,138 | | 165,507 | | 5,439 | | 0 | | 869,920 | | (1,974) | | 867,946 | |
| – stage 2 | | 6,395 | | 34,182 | | 91,077 | | 31,531 | | 0 | | 163,185 | | (4,965) | | 158,220 | |
| – stage 3 | | 0 | | 0 | | 0 | | 0 | | 19,095 | | 19,095 | | (7,439) | | 11,656 | |
| – POCI | | 0 | | 0 | | 0 | | 0 | | 277 | | 277 | | (112) | | 165 | |
| Loans and advances to banks at amortised cost | | 71,318 | | 5,496 | | 3,568 | | 1,276 | | 0 | | 81,658 | | (42) | | 81,616 | |
| – stage 1 | | 71,126 | | 5,098 | | 3,357 | | 73 | | 0 | | 79,654 | | (33) | | 79,621 | |
| – stage 2 | | 192 | | 398 | | 211 | | 1,203 | | 0 | | 2,004 | | (9) | | 1,995 | |
| – stage 3 | | 0 | | 0 | | 0 | | 0 | | 0 | | 0 | | 0 | | 0 | |
| – POCI | | 0 | | 0 | | 0 | | 0 | | 0 | | 0 | | 0 | | 0 | |
| Other financial assets measured at amortised cost | | 683,231 | | 61,768 | | 26,581 | | 611 | | 217 | | 772,408 | | (175) | | 772,233 | |
| – stage 1 | | 682,412 | | 61,218 | | 24,532 | | 54 | | 0 | | 768,216 | | (80) | | 768,136 | |
| – stage 2 | | 819 | | 550 | | 2,049 | | 557 | | 0 | | 3,975 | | (44) | | 3,931 | |
| – stage 3 | | 0 | | 0 | | 0 | | 0 | | 177 | | 177 | | (42) | | 135 | |
| – POCI | | 0 | | 0 | | 0 | | 0 | | 40 | | 40 | | (9) | | 31 | |
| Loan and other credit-related commitments | | 400,911 | | 157,339 | | 90,784 | | 9,668 | | 1,081 | | 659,783 | | (734) | | 659,049 | |
| – stage 1 | | 396,028 | | 143,600 | | 63,592 | | 1,265 | | 0 | | 604,485 | | (290) | | 604,195 | |
| – stage 2 | | 4,883 | | 13,739 | | 27,192 | | 8,403 | | 0 | | 54,217 | | (365) | | 53,852 | |
| – stage 3 | | 0 | | 0 | | 0 | | 0 | | 1,080 | | 1,080 | | (78) | | 1,002 | |
| – POCI | | 0 | | 0 | | 0 | | 0 | | 1 | | 1 | | (1) | | 0 | |
| Financial guarantees | | 6,356 | | 5,194 | | 5,317 | | 1,247 | | 270 | | 18,384 | | (125) | | 18,259 | |
| – stage 1 | | 6,286 | | 4,431 | | 3,163 | | 210 | | 0 | | 14,090 | | (37) | | 14,053 | |
| – stage 2 | | 70 | | 763 | | 2,154 | | 1,037 | | 0 | | 4,024 | | (62) | | 3,962 | |
| – stage 3 | | 0 | | 0 | | 0 | | 0 | | 269 | | 269 | | (26) | | 243 | |
| – POCI | | 0 | | 0 | | 0 | | 0 | | 1 | | 1 | | 0 | | 1 | |
| At 31 Dec 2020 | | 1,668,047 | | 463,117 | | 382,834 | | 49,772 | | 20,940 | | 2,584,710 | | (15,566) | | 2,569,144 | |
| | | | | | | | | |
Debt instruments at FVOCI1 | | | | | | | | | |
| – stage 1 | | 367,542 | | 12,585 | | 10,066 | | 0 | | 0 | | 390,193 | | (88) | | 390,105 | |
| – stage 2 | | 143 | | 93 | | 343 | | 825 | | 0 | | 1,404 | | (20) | | 1,384 | |
| – stage 3 | | 0 | | 0 | | 0 | | 0 | | 257 | | 257 | | (23) | | 234 | |
| – POCI | | 0 | | 0 | | 0 | | 0 | | 49 | | 49 | | (10) | | 39 | |
| At 31 Dec 2020 | | 367,685 | | 12,678 | | 10,409 | | 825 | | 306 | | 391,903 | | (141) | | 391,762 | |
1 For the purposes of this disclosure, gross carrying value is defined as the amortised cost of a financial asset, before adjusting for any loss allowance. As such, the gross carrying value of debt instruments at FVOCI will not reconcile to the balance sheet as it excludes fair value gains and losses.
Customer relief programmes
In response to the Covid-19 outbreak, governments and regulators around the world introduced a number of support measures for both personal and wholesale customers in market-wide schemes. The following table presents the number of personal accounts/wholesale customers and the associated drawn loan values of customers under these schemes and HSBC-specific measures for major markets at 30 June 2021. In relation to personal lending, the majority of relief measures, including payment holidays, relate to existing lending, while in wholesale lending the relief measures comprise payment holidays, refinancing of existing facilities and new lending under government-backed schemes.
At 30 June 2021, the gross carrying value of loans to personal customers under relief was $1.6bn (31 December 2020: $5.5bn). This comprised $1.3bn in relation to mortgages (31 December 2020: $4.7bn) and $0.3bn in relation to other personal lending (31 December 2020: $0.9bn). The decrease in personal customer relief during the first six months of 2021 was driven by customers exiting relief measures. The gross carrying value of loans to wholesale customers under relief was $27.8bn (31 December 2020: $35.3bn). We continue to monitor the recoverability of loans granted under customer relief programmes, including loans to a small number of customers that were subsequently found to be ineligible for such relief. The ongoing performance of such loans remains an area of uncertainty at 30 June 2021.
| | | | | | | | | | | | | | | | | | | | | |
| Personal lending | |
| Extant at 30 June 2021 | | UK | Hong Kong | US | Other major markets1,2 | Total | |
| Market-wide schemes | | | | | | | |
| Number of accounts granted mortgage customer relief | 000s | 1 | | — | | — | | 2 | | 3 | | |
| Drawn loan value of accounts granted mortgage customer relief | $m | 167 | | — | | — | | 231 | | 398 | | |
| Number of accounts granted other personal lending customer relief | 000s | 2 | | — | | — | | 21 | | 23 | | |
| Drawn loan value of accounts granted other personal lending customer relief | $m | 19 | | — | | — | | 207 | | 226 | | |
| HSBC-specific measures | | | | | | | |
| Number of accounts granted mortgage customer relief | 000s | — | | 1 | | 1 | | — | | 2 | | |
| Drawn loan value of accounts granted mortgage customer relief | $m | 3 | | 267 | | 587 | | 19 | | 876 | | |
| Number of accounts granted other personal lending customer relief | 000s | — | | — | | — | | 3 | | 3 | | |
| Drawn loan value of accounts granted other personal lending customer relief | $m | — | | 52 | | 29 | | 18 | | 99 | | |
| Total personal lending to major markets under market-wide schemes and HSBC-specific measures | | | | | | | |
| Number of accounts granted mortgage customer relief | 000s | 1 | | 1 | | 1 | | 2 | | 5 | | |
| Drawn loan value of accounts granted mortgage customer relief | $m | 170 | | 267 | | 587 | | 250 | | 1,274 | | |
| Number of accounts granted other personal lending customer relief | 000s | 2 | | — | | — | | 24 | | 26 | | |
| Drawn loan value of accounts granted other personal lending customer relief | $m | 19 | | 52 | | 29 | | 225 | | 325 | | |
| | | | | | | |
| | | | | | | |
| | | | | | | |
| | | | | | | |
| | | | | | | |
| | | | | | | |
| | | | | | | |
| | | | | | | |
| | | | | | | |
| | | | | | | |
| | | | | | | |
| | | | | | | |
| | | | | | | |
| | | | | | | |
| | | | | | | |
| | | | | | | |
| | | | | | | |
| | | | | | | |
| | | | | | | |
| | | | | | | |
| | | | | | | |
| | | | | | | |
| | | | | | | |
| | | | | | | |
| | | | | | | |
| | | | | | | |
| | | | | | | |
| | | | | | | |
| | | | | | | |
| | | | | | | |
| Market-wide schemes and HSBC-specific measures – mortgage relief as a proportion of total mortgages | % | 0.1 | | 0.3 | | 3.6 | | 0.3 | | 0.4 | | |
| Market-wide schemes and HSBC-specific measures – other personal lending relief as a proportion of total other personal lending loans and advances | % | 0.1 | | 0.1 | | 2.2 | | 0.4 | | 0.3 | | |
| | | | | | | |
| Wholesale lending | |
| Extant at 30 June 2021 | | UK | Hong Kong | US | Other major markets1 | Total | |
| Market-wide schemes | | | | | | | |
| Number of customers under market-wide measures | 000s | 236 | | 1 | | 3 | | 5 | | 245 | | |
| Drawn loan value of customers under market-wide schemes | $m | 14,024 | | 4,786 | | 819 | | 5,306 | | 24,935 | | |
| HSBC-specific schemes | | | | | | | |
| Number of customers under HSBC-specific measures | 000s | 1 | | — | | — | | — | | 1 | | |
| Drawn loan value of customers under HSBC-specific measures | $m | 260 | | — | | 551 | | 2,098 | | 2,909 | | |
| Total wholesale lending to major markets under market-wide schemes and HSBC-specific measures | | | | | | | |
| Number of customers | 000s | 237 | | 1 | | 3 | | 5 | | 246 | | |
| Drawn loan value | $m | 14,284 | | 4,786 | | 1,370 | | 7,404 | | 27,844 | | |
| | | | | | | |
| | | | | | | |
| | | | | | | |
| | | | | | | |
| | | | | | | |
| | | | | | | |
| | | | | | | |
| | | | | | | |
| | | | | | | |
| | | | | | | |
| | | | | | | |
| | | | | | | |
| | | | | | | |
| | | | | | | |
| | | | | | | |
| | | | | | | |
| | | | | | | |
| Market-wide schemes and HSBC-specific measures as a proportion of total wholesale lending loans and advances | % | 10.4 | | 2.5 | | 4.0 | | 3.9 | | 5.0 | | |
1 Other major markets include Australia, Canada, mainland China, Egypt, France, Germany, India, Indonesia, Malaysia, Mexico, Singapore, Switzerland, Taiwan and UAE.
2 In Malaysia, personal lending customers are granted an automatic moratorium programme for all eligible retail customers. At 30 June 2021, the number of accounts under this moratorium was 20,000 with an associated drawn balance of $247m.
| | | | | | | | | | | | | | | | | | | | | |
| Personal lending (continued) | |
| Extant at 31 December 2020 | | UK | Hong Kong | US | Other major markets1,2,3 | Total | |
| Market-wide schemes | | | | | | | |
| Number of accounts granted mortgage customer relief | 000s | 6 | — | | — | | 5 | 11 | | |
| Drawn loan value of accounts granted mortgage customer relief | $m | 1,412 | — | | — | | 908 | 2,320 | | |
| Number of accounts granted other personal lending customer relief | 000s | 15 | — | | — | | 28 | 43 | | |
| Drawn loan value of accounts granted other personal lending customer relief | $m | 140 | — | | — | | 386 | 526 | | |
| HSBC-specific measures | | | | | | | |
| Number of accounts granted mortgage customer relief | 000s | — | | 3 | 2 | 3 | 8 | | |
| Drawn loan value of accounts granted mortgage customer relief | $m | 7 | | 1,124 | 864 | 360 | 2,355 | | |
| Number of accounts granted other personal lending customer relief | 000s | — | | 1 | 6 | 18 | 25 | | |
| Drawn loan value of accounts granted other personal lending customer relief | $m | — | | 75 | 67 | 182 | 324 | | |
| Total personal lending to major markets under market-wide schemes and HSBC-specific measures | | | | | | | |
| Number of accounts granted mortgage customer relief | 000s | 6 | | 3 | | 2 | | 8 | | 19 | | |
| Drawn loan value of accounts granted mortgage customer relief | $m | 1,419 | | 1,124 | | 864 | | 1,268 | | 4,675 | | |
| Number of accounts granted other personal lending customer relief | 000s | 15 | | 1 | | 6 | | 46 | | 68 | | |
| Drawn loan value of accounts granted other personal lending customer relief | $m | 140 | | 75 | | 67 | | 568 | | 850 | | |
| | | | | | | |
| | | | | | | |
| | | | | | | |
| | | | | | | |
| | | | | | | |
| | | | | | | |
| | | | | | | |
| | | | | | | |
| | | | | | | |
| | | | | | | |
| | | | | | | |
| | | | | | | |
| | | | | | | |
| | | | | | | |
| | | | | | | |
| | | | | | | |
| | | | | | | |
| | | | | | | |
| | | | | | | |
| | | | | | | |
| | | | | | | |
| | | | | | | |
| | | | | | | |
| | | | | | | |
| | | | | | | |
| | | | | | | |
| | | | | | | |
| | | | | | | |
| | | | | | | |
| | | | | | | |
| Market-wide schemes and HSBC-specific measures – mortgage relief as a proportion of total mortgages | % | 0.9 | | 1.2 | | 4.7 | | 1.6 | | 1.4 | | |
| Market-wide schemes and HSBC-specific measures – other personal lending relief as a proportion of total other personal lending loans and advances | % | 0.7 | | 0.2 | | 3.1 | | 1.1 | | 0.8 | | |
| | | | | | | |
| | | | | | | | | | | | | | | | | | | | | |
| | | | | | | |
| Wholesale lending (continued) | |
| Extant at 31 December 2020 | | UK | Hong Kong | US | Other major markets1 | Total | |
| Market-wide schemes | | | | | | | |
| Number of customers under market-wide measures | 000s | 226 | 3 | 3 | 5 | 237 | | |
| Drawn loan value of customers under market-wide schemes | $m | 13,517 | 10,622 | 1,043 | 6,017 | 31,199 | | |
| HSBC-specific schemes | | | | | | | |
| Number of customers under HSBC-specific measures | 000s | — | — | — | | — | — | | |
| Drawn loan value of customers under HSBC-specific measures | $m | 349 | — | 924 | 2,869 | 4,142 | | |
| Total wholesale lending to major markets under market-wide schemes and HSBC-specific measures | | | | | | | |
| Number of customers | 000s | 226 | | 3 | | 3 | | 5 | | 237 | | |
| Drawn loan value | $m | 13,866 | | 10,622 | | 1,967 | | 8,886 | | 35,341 | | |
| | | | | | | |
| | | | | | | |
| | | | | | | |
| | | | | | | |
| | | | | | | |
| | | | | | | |
| | | | | | | |
| | | | | | | |
| | | | | | | |
| | | | | | | |
| | | | | | | |
| | | | | | | |
| | | | | | | |
| | | | | | | |
| | | | | | | |
| | | | | | | |
| | | | | | | |
| Market-wide schemes and HSBC-specific measures as a proportion of total wholesale lending loans and advances | % | 9.6 | | 5.9 | | 5.2 | | 4.6 | | 6.4 | | |
1 Other major markets include Australia, Canada, mainland China, Egypt, France, Germany, India, Indonesia, Malaysia, Mexico, Singapore, Switzerland, Taiwan and UAE.
2 In Malaysia, personal lending customers are granted an automatic moratorium programme for all eligible retail customers. At 31 December 2020, the number of accounts under this moratorium was 26,000 with an associated drawn balance of $452m.
3 In Mexico, at 31 December 2020, there were 16,000 personal lending accounts under customer relief with an associated drawn balance of $233m.
The initial granting of customer relief does not automatically trigger a migration to stage 2 or 3. However, information provided by payment deferrals is considered in the context of other reasonable and supportable information. This forms part of the overall assessment for whether there has been a significant increase in credit risk and credit impairment to identify loans for which lifetime ECL is appropriate. An extension in payment deferral does not automatically result in stage 2 or stage 3. The key accounting and credit risk judgement to ascertain whether a significant increase in credit risk has occurred is whether the economic effects of the Covid-19 outbreak on the customer are likely to be temporary or whether they indicate that a concession is being made in respect of financial difficulty that would be consistent with stage 3.
On 4 March 2021, the Hong Kong Monetary Authority, together with the Banking Sector SME Lending Coordination Mechanism, announced that the Pre-approved Principal Payment Holiday Scheme for corporate customers will be extended for another six months to October 2021.
On 6 April 2021, the UK launched the Recovery Loan Scheme that provides businesses of any size financial support to recover from the Covid-19 pandemic subject to eligibility and viability assessments. The scheme will run until 31 December 2021. A government guarantee of 80% is provided under the scheme.
Personal lending
This section provides further details on the regions, countries and products driving the increase in personal loans and advances to customers. Additionally, Hong Kong and UK mortgage book
loan-to-value (‘LTV’) data are provided.
Further product granularity is also provided by stage, with geographical data presented for loans and advances to customers, loans and other credit-related commitments, and financial guarantees and similar contracts.
At 30 June 2021, total personal lending for loans and advances to customers of $482.4bn increased by $21.6bn compared with 31 December 2020. This increase included favourable exchange movements of $0.4bn. Excluding foreign exchange movements, there was growth of $21.2bn, primarily driven by $16.9bn in Asia and $4.5bn in Europe.
The allowance for ECL attributable to personal lending, excluding off-balance sheet loan commitments and guarantees, decreased by $0.7bn to $4.0bn at 30 June 2021, driven by other personal lending.
Excluding foreign exchange movements, mortgage lending balances grew by $10.0bn to $363.6bn at 30 June 2021. Mortgages grew in the UK by $5.1bn, driven in part by stamp duty holidays on residential properties purchased up until
30 September 2021. In Asia, mortgages grew $4.3bn, notably $2.9bn in Hong Kong. Mortgages grew by $2.0bn in Canada. In addition, mortgages with a value of $2.0bn were transferred to assets held for sale due to the exit of domestic mass market retail banking business in the US.
The allowance for ECL attributable to mortgages remained broadly flat at $0.7bn.
The quality of both our Hong Kong and UK mortgage books remained high, with negligible defaults and impairment allowances. The average LTV ratio on new mortgage lending in Hong Kong was 61%, compared with an estimated 43% for the overall mortgage portfolio. The average LTV ratio on new lending in the UK was 67%, compared with an estimated 54% for the overall mortgage portfolio.
Excluding foreign exchange movements, other personal lending balances at 30 June 2021 increased by $11.2bn compared with 31 December 2020. The increase was attributable to a $12.5bn growth in loans and overdrafts, partially offset by a $1.0bn decline in credit cards. The increase in loans and overdrafts was driven by $13.2bn in Asia, notably $13.0bn in Hong Kong.
The allowance for ECL attributable to other personal lending, excluding loan commitments and guarantees, decreased by $0.7bn to $3.3bn at 30 June 2021, with the greatest impact on stage 2 that decreased by $0.6bn. The main drivers of this decrease were loans and overdrafts and credit cards in the UK with decreases of $0.2bn in both products.
| | | | | | | | | | | | | | | | | | | | | | | | | | | | |
| Total personal lending for loans and advances to customers by stage distribution | | |
| Gross carrying amount | Allowance for ECL | | |
| Stage 1 | Stage 2 | Stage 3 | Total | Stage 1 | Stage 2 | Stage 3 | Total | | |
| $m | $m | $m | $m | $m | $m | $m | $m | | |
| By portfolio | | | | | | | | | | |
| First lien residential mortgages | 349,840 | | 10,482 | | 3,300 | | 363,622 | | (119) | | (191) | | (439) | | (749) | | | |
| – of which: | | | | | | | | | | |
| interest only (including offset) | 28,978 | | 2,490 | | 315 | | 31,783 | | (8) | | (33) | | (86) | | (127) | | | |
| affordability (including US adjustable rate mortgages) | 12,991 | | 1,257 | | 496 | | 14,744 | | (13) | | (7) | | (4) | | (24) | | | |
| Other personal lending | 105,806 | | 10,856 | | 2,163 | | 118,825 | | (628) | | (1,659) | | (970) | | (3,257) | | | |
| – other | 86,715 | | 6,229 | | 1,678 | | 94,622 | | (272) | | (685) | | (650) | | (1,607) | | | |
| – credit cards | 17,373 | | 4,415 | | 440 | | 22,228 | | (346) | | (962) | | (307) | | (1,615) | | | |
| – second lien residential mortgages | 318 | | 67 | | 39 | | 424 | | (2) | | (6) | | (8) | | (16) | | | |
| – motor vehicle finance | 1,400 | | 145 | | 6 | | 1,551 | | (8) | | (6) | | (5) | | (19) | | | |
| At 30 Jun 2021 | 455,646 | | 21,338 | | 5,463 | | 482,447 | | (747) | | (1,850) | | (1,409) | | (4,006) | | | |
| By geography | | | | | | | | | | |
| Europe | 208,712 | | 8,089 | | 2,482 | | 219,283 | | (260) | | (963) | | (746) | | (1,969) | | | |
– of which: UK | 172,498 | | 7,090 | | 1,587 | | 181,175 | | (235) | | (928) | | (483) | | (1,646) | | | |
| Asia | 192,257 | | 9,425 | | 1,350 | | 203,032 | | (157) | | (396) | | (253) | | (806) | | | |
– of which: Hong Kong | 132,928 | | 6,015 | | 205 | | 139,148 | | (58) | | (250) | | (50) | | (358) | | | |
| MENA | 4,856 | | 235 | | 225 | | 5,316 | | (45) | | (81) | | (136) | | (262) | | | |
| North America | 42,427 | | 2,685 | | 1,080 | | 46,192 | | (55) | | (163) | | (126) | | (344) | | | |
| Latin America | 7,394 | | 904 | | 326 | | 8,624 | | (230) | | (247) | | (148) | | (625) | | | |
| At 30 Jun 2021 | 455,646 | | 21,338 | | 5,463 | | 482,447 | | (747) | | (1,850) | | (1,409) | | (4,006) | | | |
| | | | | | | | | | | | | | | | | | | | | | | | | | | | |
| Total personal lending for loans and other credit-related commitments and financial guarantees by stage distribution | | |
| Nominal amount | Allowance for ECL | | |
| Stage 1 | Stage 2 | Stage 3 | Total | Stage 1 | Stage 2 | Stage 3 | Total | | |
| $m | $m | $m | $m | $m | $m | $m | $m | | |
| | | | | | | | | | |
| | | | | | | | | | |
| Europe | 58,423 | | 702 | | 103 | | 59,228 | | (12) | | (2) | | (1) | | (15) | | | |
| – of which: UK | 55,576 | | 405 | | 99 | | 56,080 | | (12) | | (2) | | (1) | | (15) | | | |
| Asia | 157,382 | | 1,007 | | 17 | | 158,406 | | — | | — | | — | | — | | | |
| – of which: Hong Kong | 119,194 | | 163 | | 15 | | 119,372 | | — | | — | | — | | — | | | |
| MENA | 2,749 | | 27 | | 2 | | 2,778 | | (1) | | — | | — | | (1) | | | |
| North America | 15,105 | | 189 | | 22 | | 15,316 | | (5) | | — | | — | | (5) | | | |
| Latin America | 3,718 | | 28 | | 4 | | 3,750 | | (3) | | — | | — | | (3) | | | |
| At 30 Jun 2021 | 237,377 | | 1,953 | | 148 | | 239,478 | | (21) | | (2) | | (1) | | (24) | | | |
| | | | | | | | | | | | | | | | | | | | | | | | | | | | |
| Total personal lending for loans and advances to customers by stage distribution (continued) | | |
| Gross carrying amount | Allowance for ECL | | |
| Stage 1 | Stage 2 | Stage 3 | Total | Stage 1 | Stage 2 | Stage 3 | Total | | |
| $m | $m | $m | $m | $m | $m | $m | $m | | |
| By portfolio | | | | | | | | | | |
| First lien residential mortgages | 336,666 | | 12,233 | | 3,383 | | 352,282 | | (125) | | (188) | | (442) | | (755) | | | |
| – of which: | | | | | | | | | | |
| interest only (including offset) | 29,143 | | 3,074 | | 351 | | 32,568 | | (9) | | (19) | | (88) | | (116) | | | |
| affordability (including US adjustable rate mortgages) | 13,265 | | 2,209 | | 606 | | 16,080 | | (11) | | (11) | | (5) | | (27) | | | |
| Other personal lending | 93,468 | | 12,831 | | 2,228 | | 108,527 | | (702) | | (2,214) | | (1,060) | | (3,976) | | | |
| – other | 74,174 | | 7,288 | | 1,489 | | 82,951 | | (305) | | (914) | | (665) | | (1,884) | | | |
| – credit cards | 17,327 | | 5,292 | | 680 | | 23,299 | | (386) | | (1,281) | | (380) | | (2,047) | | | |
| – second lien residential mortgages | 593 | | 100 | | 51 | | 744 | | (3) | | (9) | | (10) | | (22) | | | |
| – motor vehicle finance | 1,374 | | 151 | | 8 | | 1,533 | | (8) | | (10) | | (5) | | (23) | | | |
| At 31 Dec 2020 | 430,134 | | 25,064 | | 5,611 | | 460,809 | | (827) | | (2,402) | | (1,502) | | (4,731) | | | |
| By geography | | | | | | | | | | |
| Europe | 200,120 | | 11,032 | | 2,511 | | 213,663 | | (247) | | (1,271) | | (826) | | (2,344) | | | |
| – of which: UK | 163,338 | | 9,476 | | 1,721 | | 174,535 | | (223) | | (1,230) | | (545) | | (1,998) | | | |
| Asia | 178,175 | | 7,969 | | 1,169 | | 187,313 | | (234) | | (446) | | (241) | | (921) | | | |
| – of which: Hong Kong | 118,252 | | 5,133 | | 206 | | 123,591 | | (102) | | (237) | | (48) | | (387) | | | |
| MENA | 4,879 | | 403 | | 251 | | 5,533 | | (54) | | (112) | | (152) | | (318) | | | |
| North America | 40,387 | | 4,613 | | 1,378 | | 46,378 | | (93) | | (200) | | (132) | | (425) | | | |
| Latin America | 6,573 | | 1,047 | | 302 | | 7,922 | | (199) | | (373) | | (151) | | (723) | | | |
| At 31 Dec 2020 | 430,134 | | 25,064 | | 5,611 | | 460,809 | | (827) | | (2,402) | | (1,502) | | (4,731) | | | |
| | | | | | | | | | | | | | | | | | | | | | | | | | |
| Total personal lending for loans and other credit-related commitments and financial guarantees by stage distribution (continued) |
| Nominal amount | Allowance for ECL |
| Stage 1 | Stage 2 | Stage 3 | Total | Stage 1 | Stage 2 | Stage 3 | Total |
| $m | $m | $m | $m | $m | $m | $m | $m |
| | | | | | | | |
| | | | | | | | |
| Europe | 56,920 | | 719 | | 96 | | 57,735 | | (22) | | (2) | | — | | (24) | |
| – of which: UK | 54,348 | | 435 | | 92 | | 54,875 | | (21) | | (2) | | — | | (23) | |
| Asia | 156,057 | | 790 | | 11 | | 156,858 | | — | | — | | — | | — | |
| – of which: Hong Kong | 118,529 | | 10 | | 10 | | 118,549 | | — | | — | | — | | — | |
| MENA | 2,935 | | 46 | | 8 | | 2,989 | | (1) | | — | | — | | (1) | |
| North America | 15,835 | | 124 | | 38 | | 15,997 | | (11) | | — | | — | | (11) | |
| Latin America | 3,462 | | 28 | | 1 | | 3,491 | | (5) | | — | | — | | (5) | |
| At 31 Dec 2020 | 235,209 | | 1,707 | | 154 | | 237,070 | | (39) | | (2) | | — | | (41) | |
Wholesale lending
This section provides further details on the regions, countries and industries driving the increase in wholesale loans and advances to customers and banks, with the impact of foreign exchange separately identified. Industry granularity is also provided by stage, with geographical data presented for loans and advances to customers, banks, other credit commitments, financial guarantees and similar contracts.
At 30 June 2021, wholesale lending for loans and advances to banks and customers of $677bn increased by $3.5bn since 31 December 2020. This included adverse foreign exchange movements of $2bn.
Excluding foreign exchange movements, the total wholesale lending growth was driven by a $6bn increase in loans and advances to banks, which included a $6.7bn increase in Asia and a $0.6bn decrease in Europe. Growth in loans and advances to banks was partly offset by a decline of $0.5bn in loans and advances to customers.
The primary driver of the decline in corporate and commercial balances of $5.7bn was $11.6bn in Europe, notably $8.2bn in the UK and $1.4bn in France. This was partly offset by growth in Asia of $6.9bn, notably $3.6bn in Hong Kong.
Loans and advances to non-bank financial institutions grew by $5.2bn, including $8bn in Asia, which was partly offset by a decline of $1.7bn in North America and a decline of $0.8bn in Europe.
Loan commitments and financial guarantees grew $8.1bn since 31 December 2020 to $449bn at 30 June 2021, including a $6bn increase related to unsettled reverse repurchase agreements. This also included adverse foreign exchange movements of $3.5bn.
The allowance for ECL attributable to loans and advances to banks and customers of $8.9bn at 30 June 2021 decreased from $9.8bn at 31 December 2020. This included favourable foreign exchange movements of $47m.
Excluding foreign exchange movements, the total decrease in the wholesale ECL allowance for loans and advances to customers and banks was driven by $0.8bn in corporate and commercial balances. The primary driver of the decrease in corporate and commercial allowance for ECL was $0.5bn in Europe, mainly $0.5bn in the UK. Additionally, there were decreases of $0.2bn in each of North America and MENA and an increase of $0.1bn in Asia.
| | | | | | | | | | | | | | | | | | | | | | | | | | | | | | | | |
| Total wholesale lending for loans and advances to banks and customers by stage distribution |
| Gross carrying amount | Allowance for ECL |
| Stage 1 | Stage 2 | Stage 3 | POCI | Total | Stage 1 | Stage 2 | Stage 3 | POCI | Total |
| $m | $m | $m | $m | $m | $m | $m | $m | $m | $m |
| Corporate and commercial | 378,700 | | 128,212 | | 13,073 | | 216 | | 520,201 | | (983) | | (1,970) | | (5,612) | | (75) | | (8,640) | |
| – agriculture, forestry and fishing | 6,575 | | 954 | | 359 | | 1 | | 7,889 | | (24) | | (33) | | (120) | | (1) | | (178) | |
| – mining and quarrying | 7,144 | | 3,248 | | 589 | | 16 | | 10,997 | | (29) | | (71) | | (175) | | (12) | | (287) | |
| – manufacturing | 68,031 | | 20,393 | | 2,094 | | 77 | | 90,595 | | (169) | | (298) | | (972) | | (35) | | (1,474) | |
| – electricity, gas, steam and air-conditioning supply | 12,931 | | 1,945 | | 65 | | — | | 14,941 | | (19) | | (22) | | (25) | | — | | (66) | |
| – water supply, sewerage, waste management and remediation | 2,702 | | 437 | | 50 | | — | | 3,189 | | (7) | | (7) | | (26) | | — | | (40) | |
| – construction | 9,099 | | 4,947 | | 747 | | 1 | | 14,794 | | (41) | | (82) | | (413) | | (1) | | (537) | |
| – wholesale and retail trade, repair of motor vehicles and motorcycles | 68,476 | | 23,002 | | 3,147 | | 8 | | 94,633 | | (150) | | (273) | | (2,012) | | (2) | | (2,437) | |
| – transportation and storage | 19,833 | | 9,305 | | 770 | | 11 | | 29,919 | | (56) | | (138) | | (220) | | — | | (414) | |
| – accommodation and food | 8,319 | | 16,565 | | 833 | | 1 | | 25,718 | | (98) | | (340) | | (129) | | (1) | | (568) | |
| – publishing, audiovisual and broadcasting | 17,760 | | 2,778 | | 151 | | 26 | | 20,715 | | (29) | | (64) | | (35) | | (2) | | (130) | |
| – real estate | 99,380 | | 24,755 | | 1,946 | | 1 | | 126,082 | | (170) | | (233) | | (706) | | — | | (1,109) | |
| – professional, scientific and technical activities | 15,215 | | 5,507 | | 642 | | 32 | | 21,396 | | (49) | | (79) | | (172) | | (7) | | (307) | |
| – administrative and support services | 17,450 | | 7,987 | | 764 | | 42 | | 26,243 | | (59) | | (128) | | (254) | | (14) | | (455) | |
| – public administration and defence, compulsory social security | 1,305 | | 547 | | 4 | | — | | 1,856 | | (3) | | (6) | | (1) | | — | | (10) | |
| – education | 1,447 | | 504 | | 27 | | — | | 1,978 | | (8) | | (15) | | (5) | | — | | (28) | |
| – health and care | 4,234 | | 755 | | 172 | | — | | 5,161 | | (13) | | (18) | | (43) | | — | | (74) | |
| – arts, entertainment and recreation | 1,161 | | 1,928 | | 220 | | — | | 3,309 | | (11) | | (60) | | (46) | | — | | (117) | |
| – other services | 9,902 | | 1,962 | | 492 | | — | | 12,356 | | (45) | | (91) | | (257) | | — | | (393) | |
| – activities of households | 698 | | 118 | | — | | — | | 816 | | — | | — | | — | | — | | — | |
| – extra-territorial organisations and bodies activities | 15 | | — | | — | | — | | 15 | | — | | — | | — | | — | | — | |
| – government | 6,665 | | 561 | | 1 | | — | | 7,227 | | (3) | | (1) | | (1) | | — | | (5) | |
| – asset-backed securities | 358 | | 14 | | — | | — | | 372 | | — | | (11) | | — | | — | | (11) | |
| Non-bank financial institutions | 61,200 | | 7,994 | | 533 | | — | | 69,727 | | (40) | | (68) | | (110) | | — | | (218) | |
| Loans and advances to banks | 85,486 | | 1,419 | | — | | — | | 86,905 | | (16) | | (3) | | — | | — | | (19) | |
| At 30 Jun 2021 | 525,386 | | 137,625 | | 13,606 | | 216 | | 676,833 | | (1,039) | | (2,041) | | (5,722) | | (75) | | (8,877) | |
| By geography | | | | | | | | | | |
| Europe | 144,427 | | 50,606 | | 6,616 | | 74 | | 201,723 | | (580) | | (1,126) | | (1,828) | | (14) | | (3,548) | |
– of which: UK | 96,909 | | 39,863 | | 4,803 | | 26 | | 141,601 | | (517) | | (993) | | (1,087) | | (2) | | (2,599) | |
| Asia | 292,866 | | 64,874 | | 3,806 | | 95 | | 361,641 | | (226) | | (395) | | (2,255) | | (46) | | (2,922) | |
– of which: Hong Kong | 165,097 | | 44,854 | | 1,780 | | 41 | | 211,772 | | (135) | | (263) | | (786) | | (22) | | (1,206) | |
| MENA | 24,197 | | 6,949 | | 1,810 | | 22 | | 32,978 | | (93) | | (129) | | (1,106) | | (13) | | (1,341) | |
| North America | 53,254 | | 10,870 | | 734 | | — | | 64,858 | | (71) | | (218) | | (193) | | — | | (482) | |
| Latin America | 10,642 | | 4,326 | | 640 | | 25 | | 15,633 | | (69) | | (173) | | (340) | | (2) | | (584) | |
| At 30 Jun 2021 | 525,386 | | 137,625 | | 13,606 | | 216 | | 676,833 | | (1,039) | | (2,041) | | (5,722) | | (75) | | (8,877) | |
| | | | | | | | | | | | | | | | | | | | | | | | | | | | | | | | |
|
Total wholesale lending for loans and other credit-related commitments and financial guarantees by stage distribution1 |
| Nominal amount | Allowance for ECL |
| Stage 1 | Stage 2 | Stage 3 | POCI | Total | Stage 1 | Stage 2 | Stage 3 | POCI | Total |
| $m | $m | $m | $m | $m | $m | $m | $m | $m | $m |
| Corporate and commercial | 264,951 | | 44,373 | | 766 | | 3 | | 310,093 | | (165) | | (277) | | (91) | | — | | (533) | |
| Financial | 133,810 | | 5,215 | | 51 | | — | | 139,076 | | (15) | | (17) | | (5) | | — | | (37) | |
| At 30 Jun 2021 | 398,761 | | 49,588 | | 817 | | 3 | | 449,169 | | (180) | | (294) | | (96) | | — | | (570) | |
| By geography | | | | | | | | | | |
| Europe | 209,917 | | 26,144 | | 660 | | 3 | | 236,724 | | (95) | | (145) | | (80) | | — | | (320) | |
| – of which: UK | 79,958 | | 13,912 | | 409 | | 2 | | 94,281 | | (77) | | (115) | | (68) | | — | | (260) | |
| Asia | 69,801 | | 7,635 | | 21 | | — | | 77,457 | | (39) | | (38) | | (6) | | — | | (83) | |
| – of which: Hong Kong | 30,178 | | 3,738 | | 7 | | — | | 33,923 | | (16) | | (14) | | (5) | | — | | (35) | |
| MENA | 5,906 | | 1,564 | | 27 | | — | | 7,497 | | (17) | | (25) | | (4) | | — | | (46) | |
| North America | 111,071 | | 13,910 | | 77 | | — | | 125,058 | | (27) | | (83) | | (1) | | — | | (111) | |
| Latin America | 2,066 | | 335 | | 32 | | — | | 2,433 | | (2) | | (3) | | (5) | | — | | (10) | |
| At 30 Jun 2021 | 398,761 | | 49,588 | | 817 | | 3 | | 449,169 | | (180) | | (294) | | (96) | | — | | (570) | |
1 Included in loans and other credit-related commitments and financial guarantees is $68bn relating to unsettled reverse repurchase agreements, which once drawn are classified as ‘Reverse repurchase agreements – non-trading’.
| | | | | | | | | | | | | | | | | | | | | | | | | | | | | | | | |
| Total wholesale lending for loans and advances to banks and customers by stage distribution (continued) |
| Gross carrying amount | Allowance for ECL |
| Stage 1 | Stage 2 | Stage 3 | POCI | Total | Stage 1 | Stage 2 | Stage 3 | POCI | Total |
| $m | $m | $m | $m | $m | $m | $m | $m | $m | $m |
| Corporate and commercial | 387,563 | | 126,287 | | 12,961 | | 277 | | 527,088 | | (1,101) | | (2,444) | | (5,837) | | (112) | | (9,494) | |
| – agriculture, forestry and fishing | 6,087 | | 1,026 | | 331 | | 1 | | 7,445 | | (12) | | (45) | | (149) | | (1) | | (207) | |
| – mining and quarrying | 7,429 | | 3,705 | | 797 | | 16 | | 11,947 | | (33) | | (112) | | (209) | | (11) | | (365) | |
| – manufacturing | 68,179 | | 23,564 | | 2,076 | | 87 | | 93,906 | | (201) | | (442) | | (905) | | (40) | | (1,588) | |
| – electricity, gas, steam and air-conditioning supply | 14,240 | | 1,907 | | 53 | | — | | 16,200 | | (25) | | (40) | | (8) | | — | | (73) | |
| – water supply, sewerage, waste management and remediation | 2,874 | | 253 | | 47 | | — | | 3,174 | | (8) | | (7) | | (22) | | — | | (37) | |
| – construction | 9,368 | | 4,455 | | 773 | | 4 | | 14,600 | | (42) | | (118) | | (426) | | (4) | | (590) | |
| – wholesale and retail trade, repair of motor vehicles and motorcycles | 65,937 | | 21,518 | | 3,196 | | 12 | | 90,663 | | (174) | | (326) | | (2,029) | | (3) | | (2,532) | |
| – transportation and storage | 19,510 | | 9,143 | | 769 | | 11 | | 29,433 | | (90) | | (163) | | (240) | | — | | (493) | |
| – accommodation and food | 10,616 | | 14,918 | | 536 | | 1 | | 26,071 | | (76) | | (285) | | (129) | | (1) | | (491) | |
| – publishing, audiovisual and broadcasting | 17,019 | | 2,796 | | 131 | | 33 | | 19,979 | | (45) | | (85) | | (39) | | (20) | | (189) | |
| – real estate | 102,933 | | 22,186 | | 1,907 | | 1 | | 127,027 | | (169) | | (260) | | (738) | | — | | (1,167) | |
| – professional, scientific and technical activities | 17,162 | | 6,379 | | 498 | | 33 | | 24,072 | | (56) | | (149) | | (185) | | (8) | | (398) | |
| – administrative and support services | 17,085 | | 8,361 | | 907 | | 70 | | 26,423 | | (66) | | (153) | | (291) | | (24) | | (534) | |
| – public administration and defence, compulsory social security | 1,530 | | 475 | | 3 | | — | | 2,008 | | (2) | | (11) | | (1) | | — | | (14) | |
| – education | 1,402 | | 691 | | 29 | | — | | 2,122 | | (12) | | (20) | | (9) | | — | | (41) | |
| – health and care | 4,049 | | 1,192 | | 261 | | 8 | | 5,510 | | (21) | | (45) | | (120) | | — | | (186) | |
| – arts, entertainment and recreation | 1,631 | | 1,570 | | 236 | | — | | 3,437 | | (9) | | (62) | | (87) | | — | | (158) | |
| – other services | 11,380 | | 1,320 | | 410 | | — | | 13,110 | | (54) | | (105) | | (249) | | — | | (408) | |
| – activities of households | 660 | | 142 | | — | | — | | 802 | | — | | (1) | | — | | — | | (1) | |
| – extra-territorial organisations and bodies activities | 10 | | — | | — | | — | | 10 | | — | | — | | — | | — | | — | |
| – government | 7,866 | | 671 | | 1 | | — | | 8,538 | | (6) | | (2) | | (1) | | — | | (9) | |
| – asset-backed securities | 596 | | 15 | | — | | — | | 611 | | — | | (13) | | — | | — | | (13) | |
| Non-bank financial institutions | 52,223 | | 11,834 | | 523 | | — | | 64,580 | | (46) | | (119) | | (100) | | — | | (265) | |
| Loans and advances to banks | 79,654 | | 2,004 | | — | | — | | 81,658 | | (33) | | (9) | | — | | — | | (42) | |
| At 31 Dec 2020 | 519,440 | | 140,125 | | 13,484 | | 277 | | 673,326 | | (1,180) | | (2,572) | | (5,937) | | (112) | | (9,801) | |
| By geography | | | | | | | | | | |
| Europe | 156,474 | | 51,708 | | 6,531 | | 109 | | 214,822 | | (589) | | (1,400) | | (2,097) | | (51) | | (4,137) | |
| – of which: UK | 104,534 | | 40,454 | | 4,712 | | 53 | | 149,753 | | (536) | | (1,234) | | (1,320) | | (33) | | (3,123) | |
| Asia | 279,985 | | 58,159 | | 3,443 | | 106 | | 341,693 | | (337) | | (383) | | (2,040) | | (43) | | (2,803) | |
| – of which: Hong Kong | 156,817 | | 39,257 | | 1,637 | | 45 | | 197,756 | | (162) | | (260) | | (751) | | (23) | | (1,196) | |
| MENA | 24,753 | | 7,893 | | 1,952 | | 30 | | 34,628 | | (91) | | (216) | | (1,205) | | (12) | | (1,524) | |
| North America | 46,852 | | 18,220 | | 913 | | — | | 65,985 | | (77) | | (302) | | (281) | | — | | (660) | |
| Latin America | 11,376 | | 4,145 | | 645 | | 32 | | 16,198 | | (86) | | (271) | | (314) | | (6) | | (677) | |
| At 31 Dec 2020 | 519,440 | | 140,125 | | 13,484 | | 277 | | 673,326 | | (1,180) | | (2,572) | | (5,937) | | (112) | | (9,801) | |
| | | | | | | | | | | | | | | | | | | | | | | | | | | | | | | | |
Total wholesale lending for loans and other credit-related commitments and financial guarantees by stage distribution1 (continued) |
| Nominal amount | Allowance for ECL |
| Stage 1 | Stage 2 | Stage 3 | POCI | Total | Stage 1 | Stage 2 | Stage 3 | POCI | Total |
| $m | $m | $m | $m | $m | $m | $m | $m | $m | $m |
| Corporate and commercial | 262,598 | | 49,008 | | 1,140 | | 2 | | 312,748 | | (271) | | (392) | | (100) | | (1) | | (764) | |
| Financial | 120,768 | | 7,526 | | 55 | | — | | 128,349 | | (17) | | (33) | | (4) | | — | | (54) | |
| At 31 Dec 2020 | 383,366 | | 56,534 | | 1,195 | | 2 | | 441,097 | | (288) | | (425) | | (104) | | (1) | | (818) | |
| By geography | | | | | | | | | | |
| Europe | 210,141 | | 28,705 | | 851 | | 2 | | 239,699 | | (152) | | (208) | | (83) | | (1) | | (444) | |
| – of which: UK | 81,153 | | 17,048 | | 480 | | 1 | | 98,682 | | (138) | | (176) | | (72) | | (1) | | (387) | |
| Asia | 63,586 | | 6,311 | | 20 | | — | | 69,917 | | (73) | | (43) | | (6) | | — | | (122) | |
| – of which: Hong Kong | 26,502 | | 3,639 | | 4 | | — | | 30,145 | | (24) | | (22) | | (1) | | — | | (47) | |
| MENA | 4,975 | | 1,609 | | 85 | | — | | 6,669 | | (14) | | (44) | | (2) | | — | | (60) | |
| North America | 102,399 | | 19,360 | | 198 | | — | | 121,957 | | (39) | | (124) | | (7) | | — | | (170) | |
| Latin America | 2,265 | | 549 | | 41 | | — | | 2,855 | | (10) | | (6) | | (6) | | — | | (22) | |
| At 31 Dec 2020 | 383,366 | | 56,534 | | 1,195 | | 2 | | 441,097 | | (288) | | (425) | | (104) | | (1) | | (818) | |
1 Included in loans and other credit-related commitments and financial guarantees is $62bn relating to unsettled reverse repurchase agreements, which once drawn are classified as ‘Reverse repurchase agreements – non-trading’.
Supplementary information
The following disclosure presents the gross carrying/nominal amount of financial instruments to which the impairment requirements in IFRS 9 are applied by global business and the associated allowance for ECL.
| | | | | | | | | | | | | | | | | | | | | | | | | | | | | | | | | | |
| Summary of financial instruments to which the impairment requirements in IFRS 9 are applied – by global business | | |
| Gross carrying/nominal amount | Allowance for ECL | | |
| Stage 1 | Stage 2 | Stage 3 | POCI | Total | Stage 1 | Stage 2 | Stage 3 | POCI | Total |
| $m | $m | $m | $m | $m | $m | $m | $m | $m | $m | | |
| Loans and advances to customers at amortised cost | 895,546 | | 157,544 | | 19,069 | | 216 | | 1,072,375 | | (1,770) | | (3,888) | | (7,131) | | (75) | | (12,864) | | | |
| – WPB | 467,295 | | 22,388 | | 5,782 | | — | | 495,465 | | (767) | | (1,868) | | (1,510) | | — | | (4,145) | | | |
| – CMB | 250,725 | | 96,615 | | 10,944 | | 175 | | 358,459 | | (834) | | (1,673) | | (4,945) | | (62) | | (7,514) | | | |
| – GBM | 176,437 | | 38,472 | | 2,343 | | 41 | | 217,293 | | (169) | | (336) | | (676) | | (13) | | (1,194) | | | |
| – Corporate Centre | 1,089 | | 69 | | — | | — | | 1,158 | | — | | (11) | | — | | — | | (11) | | | |
| Loans and advances to banks at amortised cost | 85,486 | | 1,419 | | — | | — | | 86,905 | | (16) | | (3) | | — | | — | | (19) | | | |
| – WPB | 19,713 | | 370 | | — | | — | | 20,083 | | (1) | | (1) | | — | | — | | (2) | | | |
| – CMB | 13,891 | | 245 | | — | | — | | 14,136 | | (1) | | — | | — | | — | | (1) | | | |
| – GBM | 36,402 | | 737 | | — | | — | | 37,139 | | (13) | | (2) | | — | | — | | (15) | | | |
| – Corporate Centre | 15,480 | | 67 | | — | | — | | 15,547 | | (1) | | — | | — | | — | | (1) | | | |
| Other financial assets measured at amortised cost | 848,978 | | 5,200 | | 284 | | 42 | | 854,504 | | (130) | | (38) | | (47) | | (9) | | (224) | | | |
| – WPB | 186,563 | | 1,728 | | 176 | | 41 | | 188,508 | | (92) | | (29) | | (9) | | (9) | | (139) | | | |
| – CMB | 162,532 | | 2,346 | | 59 | | 1 | | 164,938 | | (16) | | (8) | | (30) | | — | | (54) | | | |
| – GBM | 403,116 | | 1,123 | | 43 | | — | | 404,282 | | (22) | | (1) | | (8) | | — | | (31) | | | |
| – Corporate Centre | 96,767 | | 3 | | 6 | | — | | 96,776 | | — | | — | | — | | — | | — | | | |
| Total gross carrying amount on-balance sheet at 30 Jun 2021 | 1,830,010 | | 164,163 | | 19,353 | | 258 | | 2,013,784 | | (1,916) | | (3,929) | | (7,178) | | (84) | | (13,107) | | | |
| Loans and other credit-related commitments | 612,969 | | 47,658 | | 744 | | 2 | | 661,373 | | (184) | | (266) | | (80) | | — | | (530) | | | |
| – WPB | 234,311 | | 2,344 | | 134 | | — | | 236,789 | | (22) | | (1) | | (1) | | — | | (24) | | | |
| – CMB | 114,658 | | 26,479 | | 516 | | 2 | | 141,655 | | (97) | | (155) | | (75) | | — | | (327) | | | |
| – GBM | 263,911 | | 18,835 | | 94 | | — | | 282,840 | | (65) | | (110) | | (4) | | — | | (179) | | | |
| – Corporate Centre | 89 | | — | | — | | — | | 89 | | — | | — | | — | | — | | — | | | |
| Financial guarantees | 23,169 | | 3,883 | | 221 | | 1 | | 27,274 | | (17) | | (30) | | (17) | | — | | (64) | | | |
| – WPB | 1,085 | | 18 | | 1 | | — | | 1,104 | | — | | (1) | | — | | — | | (1) | | | |
| – CMB | 5,469 | | 2,448 | | 118 | | 1 | | 8,036 | | (9) | | (15) | | (7) | | — | | (31) | | | |
| – GBM | 16,614 | | 1,417 | | 102 | | — | | 18,133 | | (7) | | (14) | | (10) | | — | | (31) | | | |
| – Corporate Centre | 1 | | — | | — | | — | | 1 | | (1) | | — | | — | | — | | (1) | | | |
| Total nominal amount off-balance sheet at 30 Jun 2021 | 636,138 | | 51,541 | | 965 | | 3 | | 688,647 | | (201) | | (296) | | (97) | | — | | (594) | | | |
| | | | | | | | | | | | |
| WPB | 140,685 | | 694 | | 105 | | 38 | | 141,522 | | (20) | | (1) | | (16) | | (5) | | (42) | | | |
| CMB | 87,234 | | 422 | | 49 | | 9 | | 87,714 | | (10) | | (2) | | (3) | | (2) | | (17) | | | |
| GBM | 112,919 | | 399 | | 72 | | 1 | | 113,391 | | (12) | | (1) | | (5) | | — | | (18) | | | |
| Corporate Centre | 5,082 | | 398 | | — | | — | | 5,480 | | (23) | | (11) | | — | | — | | (34) | | | |
| Debt instruments measured at FVOCI at 30 Jun 2021 | 345,920 | | 1,913 | | 226 | | 48 | | 348,107 | | (65) | | (15) | | (24) | | (7) | | (111) | | | |
| | | | | | | | | | | | | | | | | | | | | | | | | | | | | | | | | | |
| Summary of financial instruments to which the impairment requirements in IFRS 9 are applied – by global business (continued) | | |
| Gross carrying/nominal amount | Allowance for ECL | | |
| Stage 1 | Stage 2 | Stage 3 | POCI | Total | Stage 1 | Stage 2 | Stage 3 | POCI | Total |
| $m | $m | $m | $m | $m | $m | $m | $m | $m | $m | | |
| Loans and advances to customers at amortised cost | 869,920 | | 163,185 | | 19,095 | | 277 | | 1,052,477 | | (1,974) | | (4,965) | | (7,439) | | (112) | | (14,490) | | | |
| – WPB | 442,641 | | 25,694 | | 5,753 | | — | | 474,088 | | (854) | | (2,458) | | (1,590) | | — | | (4,902) | | | |
| – CMB | 238,517 | | 101,960 | | 10,408 | | 212 | | 351,097 | | (917) | | (2,029) | | (4,874) | | (96) | | (7,916) | | | |
| – GBM | 187,564 | | 35,461 | | 2,934 | | 65 | | 226,024 | | (203) | | (465) | | (975) | | (16) | | (1,659) | | | |
| – Corporate Centre | 1,198 | | 70 | | — | | — | | 1,268 | | — | | (13) | | — | | — | | (13) | | | |
| Loans and advances to banks at amortised cost | 79,654 | | 2,004 | | — | | — | | 81,658 | | (33) | | (9) | | — | | — | | (42) | | | |
| – WPB | 16,837 | | 519 | | — | | — | | 17,356 | | (2) | | (2) | | — | | — | | (4) | | | |
| – CMB | 12,253 | | 222 | | — | | — | | 12,475 | | (2) | | — | | — | | — | | (2) | | | |
| – GBM | 33,361 | | 1,166 | | — | | — | | 34,527 | | (23) | | (7) | | — | | — | | (30) | | | |
| – Corporate Centre | 17,203 | | 97 | | — | | — | | 17,300 | | (6) | | — | | — | | — | | (6) | | | |
| Other financial assets measured at amortised cost | 768,216 | | 3,975 | | 177 | | 40 | | 772,408 | | (80) | | (44) | | (42) | | (9) | | (175) | | | |
| – WPB | 167,053 | | 1,547 | | 50 | | 39 | | 168,689 | | (41) | | (22) | | (7) | | (9) | | (79) | | | |
| – CMB | 111,299 | | 1,716 | | 65 | | 1 | | 113,081 | | (17) | | (19) | | (25) | | — | | (61) | | | |
| – GBM | 391,967 | | 705 | | 56 | | — | | 392,728 | | (22) | | (3) | | (10) | | — | | (35) | | | |
| – Corporate Centre | 97,897 | | 7 | | 6 | | — | | 97,910 | | — | | — | | — | | — | | — | | | |
| Total gross carrying amount on-balance sheet at 31 Dec 2020 | 1,717,790 | | 169,164 | | 19,272 | | 317 | | 1,906,543 | | (2,087) | | (5,018) | | (7,481) | | (121) | | (14,707) | | | |
| Loans and other credit-related commitments | 604,485 | | 54,217 | | 1,080 | | 1 | | 659,783 | | (290) | | (365) | | (78) | | (1) | | (734) | | | |
| – WPB | 232,027 | | 2,591 | | 136 | | — | | 234,754 | | (41) | | (2) | | — | | — | | (43) | | | |
| – CMB | 111,800 | | 29,150 | | 779 | | 1 | | 141,730 | | (157) | | (203) | | (72) | | (1) | | (433) | | | |
| – GBM | 260,527 | | 22,476 | | 165 | | — | | 283,168 | | (92) | | (160) | | (6) | | — | | (258) | | | |
| – Corporate Centre | 131 | | — | | — | | — | | 131 | | — | | — | | — | | — | | — | | | |
| Financial guarantees | 14,090 | | 4,024 | | 269 | | 1 | | 18,384 | | (37) | | (62) | | (26) | | — | | (125) | | | |
| – WPB | 1,048 | | 23 | | 2 | | — | | 1,073 | | — | | — | | — | | — | | — | | | |
| – CMB | 5,556 | | 2,519 | | 146 | | 1 | | 8,222 | | (19) | | (36) | | (12) | | — | | (67) | | | |
| – GBM | 7,482 | | 1,482 | | 121 | | — | | 9,085 | | (17) | | (26) | | (14) | | — | | (57) | | | |
| – Corporate Centre | 4 | | — | | — | | — | | 4 | | (1) | | — | | — | | — | | (1) | | | |
Total nominal amount off-balance sheet at
31 Dec 2020 | 618,575 | | 58,241 | | 1,349 | | 2 | | 678,167 | | (327) | | (427) | | (104) | | (1) | | (859) | | | |
| | | | | | | | | | | | |
| WPB | 159,988 | | 625 | | 154 | | 39 | | 160,806 | | (27) | | (10) | | (15) | | (8) | | (60) | | | |
| CMB | 95,182 | | 313 | | 51 | | 10 | | 95,556 | | (22) | | (3) | | (2) | | (2) | | (29) | | | |
| GBM | 136,909 | | 126 | | 93 | | — | | 137,128 | | (24) | | (1) | | (3) | | — | | (28) | | | |
| Corporate Centre | 5,838 | | 389 | | — | | — | | 6,227 | | (17) | | (6) | | (1) | | — | | (24) | | | |
| Debt instruments measured at FVOCI at 31 Dec 2020 | 397,917 | | 1,453 | | 298 | | 49 | | 399,717 | | (90) | | (20) | | (21) | | (10) | | (141) | | | |
| | | | | | | | | | | | | | | | | | | | | | | | | | |
| Wholesale lending – loans and advances to customers at amortised cost by country/territory |
| Gross carrying amount | Allowance for ECL |
| Corporate and commercial | Of which: real estate1 | Non-bank financial institutions | Total | Corporate and commercial | Of which: real estate1 | Non-bank financial institutions | Total |
| $m | $m | $m | $m | $m | $m | $m | $m |
| Europe | 167,562 | | 25,731 | | 21,437 | | 188,999 | | (3,383) | | (585) | | (150) | | (3,533) | |
– UK | 122,314 | | 18,437 | | 14,715 | | 137,029 | | (2,497) | | (533) | | (95) | | (2,592) | |
| – France | 29,832 | | 5,519 | | 4,290 | | 34,122 | | (611) | | (37) | | (46) | | (657) | |
| – Germany | 7,849 | | 291 | | 1,238 | | 9,087 | | (117) | | — | | (3) | | (120) | |
| – Switzerland | 1,107 | | 560 | | 654 | | 1,761 | | (9) | | — | | — | | (9) | |
| – other | 6,460 | | 924 | | 540 | | 7,000 | | (149) | | (15) | | (6) | | (155) | |
| Asia | 263,512 | | 82,372 | | 39,535 | | 303,047 | | (2,876) | | (132) | | (38) | | (2,914) | |
| – Hong Kong | 165,429 | | 64,274 | | 25,898 | | 191,327 | | (1,191) | | (54) | | (12) | | (1,203) | |
| – Australia | 9,086 | | 2,130 | | 934 | | 10,020 | | (90) | | (2) | | — | | (90) | |
| – India | 7,704 | | 1,800 | | 2,922 | | 10,626 | | (76) | | (16) | | (8) | | (84) | |
| – Indonesia | 3,617 | | 78 | | 236 | | 3,853 | | (237) | | (2) | | — | | (237) | |
| – mainland China | 31,951 | | 6,336 | | 8,362 | | 40,313 | | (188) | | (28) | | (15) | | (203) | |
| – Malaysia | 7,336 | | 1,896 | | 143 | | 7,479 | | (186) | | (26) | | (3) | | (189) | |
| – Singapore | 16,806 | | 4,350 | | 246 | | 17,052 | | (787) | | (4) | | — | | (787) | |
| – Taiwan | 4,986 | | 5 | | 75 | | 5,061 | | — | | — | | — | | — | |
| – other | 16,597 | | 1,503 | | 719 | | 17,316 | | (121) | | — | | — | | (121) | |
| Middle East and North Africa (excluding Saudi Arabia) | 23,529 | | 1,539 | | 365 | | 23,894 | | (1,333) | | (178) | | (7) | | (1,340) | |
| – Egypt | 2,308 | | 38 | | 11 | | 2,319 | | (167) | | (7) | | (3) | | (170) | |
| – UAE | 13,261 | | 1,399 | | 211 | | 13,472 | | (896) | | (169) | | (1) | | (897) | |
| – other | 7,960 | | 102 | | 143 | | 8,103 | | (270) | | (2) | | (3) | | (273) | |
| North America | 53,404 | | 14,855 | | 7,648 | | 61,052 | | (465) | | (66) | | (20) | | (485) | |
| – US | 28,509 | | 7,287 | | 6,043 | | 34,552 | | (231) | | (41) | | (2) | | (233) | |
| – Canada | 24,332 | | 7,468 | | 1,473 | | 25,805 | | (211) | | (18) | | (7) | | (218) | |
| – other | 563 | | 100 | | 132 | | 695 | | (23) | | (7) | | (11) | | (34) | |
| Latin America | 12,194 | | 1,585 | | 742 | | 12,936 | | (583) | | (148) | | (3) | | (586) | |
| – Mexico | 10,255 | | 1,585 | | 737 | | 10,992 | | (533) | | (148) | | (3) | | (536) | |
| – other | 1,939 | | — | | 5 | | 1,944 | | (50) | | — | | — | | (50) | |
| At 30 Jun 2021 | 520,201 | | 126,082 | | 69,727 | | 589,928 | | (8,640) | | (1,109) | | (218) | | (8,858) | |
| | | | | | | | | | | | | | | | | | | | | | | | | | |
|
| | |
| | | | | | | | |
| | | | | | | | |
| Europe | 179,104 | | 26,505 | | 22,176 | | 201,280 | | (3,918) | | (632) | | (185) | | (4,103) | |
– UK | 128,933 | | 18,890 | | 16,165 | | 145,098 | | (2,958) | | (574) | | (147) | | (3,105) | |
| – France | 32,278 | | 5,740 | | 3,557 | | 35,835 | | (645) | | (40) | | (26) | | (671) | |
| – Germany | 8,309 | | 364 | | 1,156 | | 9,465 | | (125) | | — | | (3) | | (128) | |
| – Switzerland | 1,489 | | 576 | | 513 | | 2,002 | | (14) | | — | | — | | (14) | |
| – other | 8,095 | | 935 | | 785 | | 8,880 | | (176) | | (18) | | (9) | | (185) | |
| Asia | 257,942 | | 82,359 | | 31,637 | | 289,579 | | (2,766) | | (162) | | (38) | | (2,804) | |
| – Hong Kong | 162,039 | | 64,216 | | 18,406 | | 180,445 | | (1,180) | | (83) | | (15) | | (1,195) | |
| – Australia | 9,769 | | 1,813 | | 1,348 | | 11,117 | | (95) | | (2) | | — | | (95) | |
| – India | 7,223 | | 1,951 | | 3,075 | | 10,298 | | (90) | | (18) | | (4) | | (94) | |
| – Indonesia | 3,699 | | 81 | | 246 | | 3,945 | | (229) | | (2) | | — | | (229) | |
| – mainland China | 28,443 | | 6,251 | | 7,128 | | 35,571 | | (187) | | (23) | | (18) | | (205) | |
| – Malaysia | 7,228 | | 1,968 | | 123 | | 7,351 | | (86) | | (27) | | — | | (86) | |
| – Singapore | 18,859 | | 4,637 | | 362 | | 19,221 | | (782) | | (2) | | — | | (782) | |
| – Taiwan | 6,115 | | 50 | | 60 | | 6,175 | | — | | — | | — | | — | |
| – other | 14,567 | | 1,392 | | 889 | | 15,456 | | (117) | | (5) | | (1) | | (118) | |
| Middle East and North Africa (excluding Saudi Arabia) | 24,625 | | 1,839 | | 379 | | 25,004 | | (1,512) | | (187) | | (9) | | (1,521) | |
| – Egypt | 2,162 | | 37 | | 13 | | 2,175 | | (157) | | (7) | | (3) | | (160) | |
| – UAE | 13,485 | | 1,690 | | 170 | | 13,655 | | (1,019) | | (176) | | (2) | | (1,021) | |
| – other | 8,978 | | 112 | | 196 | | 9,174 | | (336) | | (4) | | (4) | | (340) | |
| North America | 53,386 | | 14,491 | | 9,292 | | 62,678 | | (637) | | (73) | | (23) | | (660) | |
| – US | 30,425 | | 7,722 | | 7,708 | | 38,133 | | (367) | | (38) | | (3) | | (370) | |
| – Canada | 22,361 | | 6,645 | | 1,440 | | 23,801 | | (243) | | (27) | | (9) | | (252) | |
| – other | 600 | | 124 | | 144 | | 744 | | (27) | | (8) | | (11) | | (38) | |
| Latin America | 12,031 | | 1,833 | | 1,096 | | 13,127 | | (661) | | (113) | | (10) | | (671) | |
| – Mexico | 10,244 | | 1,832 | | 1,083 | | 11,327 | | (589) | | (113) | | (10) | | (599) | |
| – other | 1,787 | | 1 | | 13 | | 1,800 | | (72) | | — | | — | | (72) | |
| At 31 Dec 2020 | 527,088 | | 127,027 | | 64,580 | | 591,668 | | (9,494) | | (1,167) | | (265) | | (9,759) | |
1 Real estate lending within this disclosure corresponds solely to the industry of the borrower.
| | | | | | | | | | | | | | | | | | | | | | | | | | |
| Personal lending – loans and advances to customers at amortised cost by country/territory |
| Gross carrying amount | Allowance for ECL |
| First lien residential mortgages | Other personal | Of which: credit cards | Total | First lien residential mortgages | Other personal | Of which: credit cards | Total |
| $m | $m | $m | $m | $m | $m | $m | $m |
| Europe | 169,403 | | 49,880 | | 8,481 | | 219,283 | | (362) | | (1,607) | | (684) | | (1,969) | |
– UK | 161,816 | | 19,359 | | 8,087 | | 181,175 | | (240) | | (1,406) | | (678) | | (1,646) | |
– France1 | 3,372 | | 23,488 | | 349 | | 26,860 | | (42) | | (102) | | (5) | | (144) | |
| – Germany | — | | 303 | | — | | 303 | | — | | — | | — | | — | |
| – Switzerland | 1,336 | | 6,408 | | — | | 7,744 | | — | | (82) | | — | | (82) | |
| – other | 2,879 | | 322 | | 45 | | 3,201 | | (80) | | (17) | | (1) | | (97) | |
| Asia | 144,930 | | 58,102 | | 10,550 | | 203,032 | | (83) | | (723) | | (474) | | (806) | |
| – Hong Kong | 94,761 | | 44,387 | | 7,392 | | 139,148 | | (1) | | (357) | | (244) | | (358) | |
| – Australia | 20,536 | | 555 | | 472 | | 21,091 | | (7) | | (37) | | (35) | | (44) | |
| – India | 922 | | 522 | | 176 | | 1,444 | | (9) | | (49) | | (37) | | (58) | |
| – Indonesia | 71 | | 260 | | 139 | | 331 | | (1) | | (23) | | (16) | | (24) | |
| – mainland China | 9,969 | | 1,121 | | 602 | | 11,090 | | (7) | | (69) | | (63) | | (76) | |
| – Malaysia | 2,630 | | 2,653 | | 713 | | 5,283 | | (51) | | (82) | | (24) | | (133) | |
| – Singapore | 7,494 | | 6,650 | | 334 | | 14,144 | | — | | (44) | | (12) | | (44) | |
| – Taiwan | 5,521 | | 1,096 | | 216 | | 6,617 | | — | | (15) | | (4) | | (15) | |
| – other | 3,026 | | 858 | | 506 | | 3,884 | | (7) | | (47) | | (39) | | (54) | |
| Middle East and North Africa (excluding Saudi Arabia) | 2,217 | | 3,099 | | 820 | | 5,316 | | (34) | | (228) | | (115) | | (262) | |
| – Egypt | — | | 357 | | 90 | | 357 | | — | | (5) | | (2) | | (5) | |
| – UAE | 1,875 | | 1,170 | | 415 | | 3,045 | | (26) | | (134) | | (74) | | (160) | |
| – other | 342 | | 1,572 | | 315 | | 1,914 | | (8) | | (89) | | (39) | | (97) | |
| North America | 42,549 | | 3,643 | | 997 | | 46,192 | | (161) | | (183) | | (135) | | (344) | |
| – US | 16,529 | | 1,308 | | 710 | | 17,837 | | (21) | | (146) | | (125) | | (167) | |
| – Canada | 24,891 | | 2,166 | | 251 | | 27,057 | | (38) | | (29) | | (10) | | (67) | |
| – other | 1,129 | | 169 | | 36 | | 1,298 | | (102) | | (8) | | — | | (110) | |
| Latin America | 4,523 | | 4,101 | | 1,380 | | 8,624 | | (109) | | (516) | | (207) | | (625) | |
| – Mexico | 4,367 | | 3,557 | | 1,093 | | 7,924 | | (109) | | (481) | | (188) | | (590) | |
| – other | 156 | | 544 | | 287 | | 700 | | — | | (35) | | (19) | | (35) | |
| At 30 Jun 2021 | 363,622 | | 118,825 | | 22,228 | | 482,447 | | (749) | | (3,257) | | (1,615) | | (4,006) | |
| | | | | | | | | | | | | | | | | | | | | | | | | | |
|
| | |
| | | | | | | | |
| | | | | | | | |
| Europe | 162,630 | | 51,033 | | 8,471 | | 213,663 | | (364) | | (1,980) | | (859) | | (2,344) | |
– UK | 154,839 | | 19,696 | | 8,064 | | 174,535 | | (236) | | (1,762) | | (852) | | (1,998) | |
– France1 | 3,623 | | 23,982 | | 358 | | 27,605 | | (43) | | (120) | | (5) | | (163) | |
| – Germany | — | | 368 | | — | | 368 | | — | | — | | — | | — | |
| – Switzerland | 1,195 | | 6,641 | | — | | 7,836 | | — | | (79) | | — | | (79) | |
| – other | 2,973 | | 346 | | 49 | | 3,319 | | (85) | | (19) | | (2) | | (104) | |
| Asia | 141,581 | | 45,732 | | 11,186 | | 187,313 | | (80) | | (841) | | (563) | | (921) | |
| – Hong Kong | 91,997 | | 31,594 | | 7,573 | | 123,591 | | — | | (387) | | (265) | | (387) | |
| – Australia | 20,320 | | 602 | | 514 | | 20,922 | | (12) | | (47) | | (45) | | (59) | |
| – India | 933 | | 544 | | 215 | | 1,477 | | (9) | | (45) | | (34) | | (54) | |
| – Indonesia | 71 | | 288 | | 167 | | 359 | | — | | (37) | | (26) | | (37) | |
| – mainland China | 9,679 | | 1,155 | | 644 | | 10,834 | | (6) | | (81) | | (73) | | (87) | |
| – Malaysia | 2,797 | | 2,964 | | 841 | | 5,761 | | (41) | | (102) | | (35) | | (143) | |
| – Singapore | 7,394 | | 6,537 | | 375 | | 13,931 | | — | | (55) | | (17) | | (55) | |
| – Taiwan | 5,407 | | 1,069 | | 277 | | 6,476 | | — | | (15) | | (5) | | (15) | |
| – other | 2,983 | | 979 | | 580 | | 3,962 | | (12) | | (72) | | (63) | | (84) | |
| Middle East and North Africa (excluding Saudi Arabia) | 2,192 | | 3,341 | | 863 | | 5,533 | | (43) | | (275) | | (142) | | (318) | |
| – Egypt | — | | 360 | | 89 | | 360 | | — | | (8) | | (3) | | (8) | |
| – UAE | 1,841 | | 1,158 | | 432 | | 2,999 | | (37) | | (163) | | (92) | | (200) | |
| – other | 351 | | 1,823 | | 342 | | 2,174 | | (6) | | (104) | | (47) | | (110) | |
| North America | 41,826 | | 4,552 | | 1,373 | | 46,378 | | (159) | | (266) | | (193) | | (425) | |
| – US | 18,430 | | 2,141 | | 1,091 | | 20,571 | | (26) | | (226) | | (182) | | (252) | |
| – Canada | 22,241 | | 2,230 | | 244 | | 24,471 | | (36) | | (31) | | (10) | | (67) | |
| – other | 1,155 | | 181 | | 38 | | 1,336 | | (97) | | (9) | | (1) | | (106) | |
| Latin America | 4,053 | | 3,869 | | 1,406 | | 7,922 | | (109) | | (614) | | (290) | | (723) | |
| – Mexico | 3,901 | | 3,351 | | 1,119 | | 7,252 | | (107) | | (578) | | (268) | | (685) | |
| – other | 152 | | 518 | | 287 | | 670 | | (2) | | (36) | | (22) | | (38) | |
| At 31 Dec 2020 | 352,282 | | 108,527 | | 23,299 | | 460,809 | | (755) | | (3,976) | | (2,047) | | (4,731) | |
1 Included in other personal lending as at 30 June 2021 is $20,336m (31 December 2020: $20,625m) guaranteed by Crédit Logement.
| | | | | |
| Page |
| |
| Overview | |
| Treasury risk management | |
| Capital risk in the first half of 2021 | |
| |
| |
| |
| |
| |
| |
| |
| Liquidity and funding risk in the first half of 2021 | |
| Sources of funding | |
| Interest rate risk in the banking book in the first half of 2021 | |
| |
| |
Overview
Treasury risk is the risk of having insufficient capital, liquidity or funding resources to meet financial obligations and satisfy regulatory requirements, together with the financial risks arising from the provision of pensions and other post-employment benefits to staff and their dependants. Treasury risk also includes the risk to our earnings or capital due to non-trading book foreign exchange exposures and changes in market interest rates.
Treasury risk arises from changes to the respective resources and risk profiles driven by customer behaviour, management decisions or the external environment.
Approach and policy
Our objective in the management of treasury risk is to maintain appropriate levels of capital, liquidity, funding, foreign exchange and market risk to support our business strategy, and meet our regulatory and stress testing-related requirements.
Our approach to treasury management is driven by our strategic and organisational requirements, taking into account the regulatory, economic and commercial environment. We aim to maintain a strong capital and liquidity base to support the risks inherent in our business and invest in accordance with our strategy, meeting both consolidated and local regulatory requirements at all times.
Our policy is underpinned by our risk management framework, our internal capital adequacy assessment process (‘ICAAP’) and our internal liquidity adequacy assessment process (‘ILAAP’). The risk framework incorporates a number of measures aligned to our assessment of risks for both internal and regulatory purposes. These risks include credit, market, operational, pensions, non-trading book foreign exchange risk and interest rate risk in the banking book.
A summary of our current policies and practices regarding the management of treasury risk is set out on pages 169 to 173 of the Annual Report and Accounts 2020.
Treasury risk management
Key developments in the first half of 2021
•We continued to develop the Treasury Risk Management function, which was established in 2020. This function is a dedicated second line of defence, providing independent oversight of treasury activities across capital risk, liquidity and funding risk, non-trading book foreign exchange risk (including structural and other banking book foreign exchange risk), and interest rate risk in the banking book, together with pension risk.
•We announced the next phase of our strategic plan on 23 February 2021. We intend to maintain a common equity tier 1 (‘CET1’) ratio above 14%, managing in the range of 14% to 14.5% in the medium term. Our dividend policy aims to deliver sustainable cash dividends, while retaining the flexibility to invest and grow the business in the future, supplemented by additional shareholder distributions, if appropriate. Reflecting the current improved economic outlook and operating environment in many of our markets, we now expect to move to within our target dividend payout ratio range of 40% to 55% of reported earnings per ordinary share (‘EPS’) in 2021. In line with our dividend policy, we will retain the flexibility to adjust EPS for non-cash significant items.
•We continued to build our recovery and resolution capabilities in line with the Group’s resolution strategy to meet
requirements from the Bank of England (‘BoE’) under its Resolvability Assessment Framework ahead of 1 January 2022. We met our compliance deadline of 31 March 2021 for valuation in resolution requirements, and continue to enhance our capabilities in preparation for the submission of a resolvability self-assessment report to the BoE in October 2021.
•The BoE’s Financial Policy Committee reconfirmed its guidance on the path for the UK countercyclical capital buffer rate. It expects to maintain the rate at 0% until at least December 2021 and, due to the usual 12‐month implementation lag, any subsequent increase would therefore not be expected to take effect until the end of 2022 at the earliest. The Hong Kong Monetary Authority (‘HKMA’) has maintained the countercyclical capital buffer rate at 1% for Hong Kong, but it will continue to monitor credit and economic conditions closely. The countercyclical capital buffer rate will be reviewed on a quarterly basis or more frequently.
•The Group’s CET1 ratio was 15.6% and the leverage ratio, calculated in accordance with the Capital Requirements Regulation, was 5.3% at 30 June 2021. All of the Group’s material operating entities were above capital risk appetite levels. The Group continues to maintain and plan for the appropriate resources required to manage its risks and deliver its strategic objectives, including the potential sale of the retail banking business in France, while supporting local economies.
•All of the Group’s material operating entities were above regulatory minimum levels of liquidity and funding at 30 June 2021. The Group and all entities had significant surplus liquidity, and maintained heightened liquidity coverage ratios throughout the first half of 2021.
•We revised the approach to calculate the Group liquidity coverage ratio (‘LCR’). The new methodology better reflects free transferability of liquidity from third countries (comprising countries other than the UK and those in the EEA) in consideration with currency convertibility and regulatory intra-Group limits. Based on the consolidation methodology, the Group LCR was 134% at 30 June 2021. A risk appetite has been set against the Group LCR.
•Central bank interest rates remain at historically low levels, although a vaccine-led economic recovery and rising inflation indicators have contributed to an increase in interest rate yields and a steepening of yield curves in our major markets in the first half of 2021. Against a backdrop of high and rising asset valuations, monetary policies have generally remained accommodative, but rising inflation is posing a policy dilemma for some central banks. We continued to monitor our risk profile closely in the context of a possible tightening in monetary policy.
•We maintained a significant focus on the switchover from Ibor index curves to RFRs for in-scope currencies. Despite considerable complexity, we are on track to complete changes to our funds transfer pricing, external issuance and hedging by the end of the year across the Group.
For quantitative disclosures on capital ratios, own funds and RWAs, see pages 88 to 89. For quantitative disclosures on liquidity and funding metrics, see pages 91 to 93. For quantitative disclosures on interest rate risk in the banking book, see pages 93 to 94.
Capital, liquidity and funding risk management processes
Assessment and risk appetite
Our capital management policy is underpinned by a global capital management framework and our ICAAP. The framework incorporates key capital risk appetites for CET1, total capital, minimum requirements for own funds and eligible liabilities (‘MREL’), and double leverage. The ICAAP is an assessment of the Group’s capital position, outlining both regulatory and internal capital resources and requirements resulting from HSBC’s business model, strategy, risk profile and management, performance and planning, risks to capital, and the implications of stress testing. Our assessment of capital adequacy is driven by an assessment of risks. These risks include credit, market,
operational, pensions, insurance, structural foreign exchange and interest rate risk in the banking book. Climate risk is also considered as part of the ICAAP, and we are continuing to develop our approach. The Group’s ICAAP supports the determination of the consolidated capital risk appetite and target ratios, as well as enables the assessment and determination of capital requirements by regulators. Subsidiaries prepare ICAAPs in line with global guidance while considering their local regulatory regimes to determine their own risk appetites and ratios.
HSBC Holdings is the provider of equity capital and MREL-eligible debt to its subsidiaries and also provides them with non-equity capital where necessary. These investments are funded by HSBC Holdings’ own equity capital and MREL-eligible debt.
HSBC Holdings seeks to maintain a prudent balance between the composition of its capital and its investments in subsidiaries, including management of double leverage. Double leverage reflects the extent to which equity investments in operating entities are funded by holding company debt. Where Group capital requirements are less than the aggregate of operating entity capital requirements, double leverage can be used to improve Group capital efficiency provided it is managed appropriately and prudently in accordance with risk appetite. Double leverage is a constraint on managing our capital position, given the complexity of the Group’s subsidiary structure and the multiple regulatory regimes under which we operate. As a matter of long-standing policy, the holding company retains a substantial portfolio of high-quality liquid assets (‘HQLA’), which at 30 June 2021 was in excess of $13bn. The portfolio of HQLA helps to mitigate holding company cash flow risk, and underpins the strength of support the holding company can offer its subsidiaries in times of stress. Further mitigation is provided by additional tier 1 (‘AT1’) securities issued in excess of the regulatory requirements of our subsidiaries.
We aim to ensure that management at Group and entity level have oversight of our liquidity and funding risks by maintaining comprehensive policies, metrics and controls. We manage liquidity and funding risk at an operating entity level to make sure that obligations can be met in the jurisdiction where they fall due, generally without reliance on other parts of the Group. Operating entities are required to meet internal minimum requirements and any applicable regulatory requirements at all times. These requirements are assessed through the ILAAP, which ensures that operating entities have robust strategies, policies, processes and systems for the identification, measurement, management and monitoring of liquidity risk over an appropriate set of time horizons, including intra-day. The ILAAP informs the validation of risk tolerance and the setting of risk appetite. It also assesses the capability to manage liquidity and funding effectively in each major entity. These metrics are set and managed locally but are subject to robust global review and challenge to ensure consistency of approach and application of the Group’s policies and controls.
Planning and performance
Capital and risk-weighted asset (‘RWA’) plans form part of the annual operating plan that is approved by the Board. Capital and RWA forecasts are submitted to the Group Executive Committee on a monthly basis, and capital and RWAs are monitored and managed against the plan. The responsibility for global capital allocation principles rests with the Group Chief Financial Officer supported by the Group Capital Management Meeting. This is a specialist forum addressing capital management, reporting into the HSBC Holdings Asset and Liability Management Committee (‘Holdings ALCO’).
Through our internal governance processes, we seek to strengthen discipline over our investment and capital allocation decisions, and to ensure that returns on investment meet management’s objectives. Our strategy is to allocate capital to businesses and entities to support growth objectives where returns above internal hurdle levels have been identified and in order to meet their regulatory and economic capital needs. We evaluate and manage business returns by using a return on average tangible equity measure.
Funding and liquidity plans form part of the annual operating plan that is approved by the Board. The Board-level appetite measures are the LCR and net stable funding ratio (‘NSFR’). An internal liquidity metric (‘ILM’) was introduced in January 2021 to supplement the LCR and NSFR metrics. In addition, we use a wider set of measures to manage an appropriate funding and liquidity profile, including legal entity depositor concentration limits, intra-day liquidity, forward-looking funding assessments and other key measures.
Risks to capital and liquidity
Outside the stress testing framework, other risks may be identified that have the potential to affect our RWAs and/or capital position. Downside and Upside scenarios are assessed against our capital management objectives and mitigating actions are assigned as necessary. We closely monitor future regulatory changes and continue to evaluate the impact of these upon our capital requirements. These include the UK’s implementation of amendments to the Capital Requirements Regulation, the Basel III Reforms, and the regulatory impact from the UK’s withdrawal from the EU, as well as other regulatory statements including changes to IRB modelling requirements.
Regulatory developments
The Prudential Regulation Authority (‘PRA’) has confirmed that software assets will need to be deducted in full from CET1 capital from 1 January 2022. This will reverse the beneficial changes to the treatment of software assets that were implemented as part of the EU’s response to the Covid-19 pandemic. This change was anticipated and is expected to reduce capital resources and RWAs by $2.6bn.
In parallel with regulatory developments in the EU, the PRA is reviewing the requirements for the capitalisation of structural foreign exchange risk to align to a Pillar 1 approach. There remains a significant degree of uncertainty in the impact of the regulatory changes due to the number of national discretions and the need for further supporting technical standards to be developed. Furthermore, the impact does not take into consideration the possibility of offsets against Pillar 2, which may arise as shortcomings within Pillar 1 are addressed.
Overall we expect RWAs to increase by up to 5% as a result of these developments during 2022 and 2023.
Further impacts will occur with the introduction of a modelled RWA output floor under the Basel III reforms that will commence in 2023 with a five-year transitional provision. We estimate that there will be an additional RWA impact as a result of the output floor with effect from 2027.
Potential disposal of retail banking business in France
In relation to the potential sale of our retail banking business in France, we expect a reduction in the Group’s CET1 ratio in the range of 15bps to 20bps, driven by the estimated loss on sale partly offset by the reduction in RWAs upon the estimated completion in 2023.
Regulatory reporting processes and controls
There is an ongoing focus on the quality of regulatory reporting by the PRA and other regulators globally. We continue to strengthen our processes and controls, following the commissioning of independent external reviews of various aspects of regulatory reporting, including at the request of our regulators. As part of the strengthening of our control environment, we are improving global consistency and control standards across a number of our processes. There may be an impact on some of our regulatory ratios such as the CET1 and LCR as a result. We are keeping the PRA and other relevant regulators informed of adverse findings from external and internal reviews.
Stress testing and recovery and resolution planning
The Group uses stress testing to evaluate the robustness of plans and risk portfolios, and to meet the requirements for stress testing set by supervisors. Stress testing also informs the ICAAP and ILAAP and supports recovery planning in many jurisdictions. It is an important output used to evaluate how much capital and
liquidity the Group requires in setting risk appetite for capital and liquidity risk. It is also used to re-evaluate business plans where analysis shows capital, liquidity and/or returns do not meet their target.
In addition to a range of internal stress tests, we are subject to supervisory stress testing in many jurisdictions. These include the programmes of the Bank of England, the US Federal Reserve Board, the European Banking Authority, the European Central Bank and the Hong Kong Monetary Authority, as well as stress tests undertaken in other jurisdictions. The results of regulatory stress testing and our internal stress tests are used when assessing our internal capital requirements through the ICAAP. The outcomes of stress testing exercises carried out by the PRA and other regulators feed into the setting of regulatory minimum ratios and buffers.
The Group and subsidiaries have established recovery plans, which set out potential options management could take in a range of stress scenarios that could result in a breach of our internal capital buffers. This is to help ensure that our capital and liquidity position can be recovered even in an extreme stress event. All entities monitor internal and external triggers that could threaten their capital, liquidity or funding positions. Entities have established recovery plans providing detailed actions that management would consider taking in a stress scenario should their positions deteriorate and threaten to breach risk appetite and regulatory minimum levels.
Recovery and resolution plans form part of the integral framework safeguarding the Group’s financial stability. The Group is committed to developing its recovery and resolution capabilities further in line with the BoE’s Resolvability Assessment Framework requirements.
Measurement of interest rate risk in the banking book processes
Assessment and risk appetite
Interest rate risk in the banking book is the risk of an adverse impact to earnings or capital due to changes in market interest rates. It is generated by our non-traded assets and liabilities, specifically loans, deposits and financial instruments that are not held for trading intent or held in order to hedge positions held with trading intent. Interest rate risk that can be economically hedged may be transferred to the Markets Treasury business. Hedging is generally executed through interest rate derivatives or fixed-rate government bonds. Any interest rate risk that Markets Treasury cannot economically hedge is not transferred and will remain within the global business where the risks originate.
The Asset, Liability and Capital Management (‘ALCM’) function uses a number of measures to monitor and control interest rate risk in the banking book, including:
•net interest income sensitivity;
•economic value of equity sensitivity; and
•hold-to-collect-and-sell stressed value at risk.
Net interest income sensitivity
A principal part of our management of non-traded interest rate risk is to monitor the sensitivity of expected net interest income (‘NII’) under varying interest rate scenarios (i.e. simulation modelling), where all other economic variables are held constant. This monitoring is undertaken at an entity level by local ALCOs, where entities forecast both one-year and five-year NII sensitivities across a range of interest rate scenarios.
Projected NII sensitivity figures represent the effect of pro forma movements in projected yield curves based on a static balance sheet size and structure. The exception to this is where the size of the balances or repricing is deemed interest rate sensitive, for example, non-interest-bearing current account migration and fixed-rate loan early prepayment. These sensitivity calculations do not incorporate actions that would be taken by Markets Treasury or in the business that originates the risk to mitigate the effect of interest rate movements.
The NII sensitivity calculations assume that interest rates of all maturities move by the same amount in the ‘up-shock’ scenario. The sensitivity calculations in the ‘down-shock’ scenarios reflect no floors to the shocked market rates. However, customer product-specific interest rate floors are recognised where applicable.
Economic value of equity sensitivity
Economic value of equity (‘EVE’) represents the present value of the future banking book cash flows that could be distributed to equity providers under a managed run-off scenario. This equates to the current book value of equity plus the present value of future NII in this scenario. EVE can be used to assess the economic capital required to support interest rate risk in the banking book. An EVE sensitivity represents the expected movement in EVE due to pre-specified interest rate shocks, where all other economic variables are held constant. Operating entities are required to monitor EVE sensitivities as a percentage of capital resources.
Hold-to-collect-and-sell stressed value at risk
Hold-to-collect-and-sell stressed value at risk (‘VaR’) is a quantification of the potential losses to a 99% confidence level of the portfolio of securities held under a held-to-collect-and-sell business model in the Markets Treasury business. The portfolio is accounted for at fair value through other comprehensive income together with the derivatives held in designated hedging relationships with these securities. This is quantified based on the worst losses over a one-year period going back to the beginning of 2007 with an assumed holding period of 60 days.
Hold-to-collect-and-sell stressed VaR uses the same models as those used for trading book capitalisation and covers only the portfolio managed by Markets Treasury under this business model.
Capital risk in the first half of 2021
Capital overview
| | | | | | | | | |
| Capital adequacy metrics |
| | At |
| | 30 Jun | 31 Dec |
| | 2021 | 2020 |
| | | |
| Risk-weighted assets (‘RWAs’) ($bn) | | | |
| Credit risk | | 702.9 | | 691.9 | |
| Counterparty credit risk | | 39.3 | | 42.8 | |
| Market risk | | 25.5 | | 28.5 | |
| Operational risk | | 94.6 | | 94.3 | |
| Total RWAs | | 862.3 | | 857.5 | |
| Capital on a transitional basis ($bn) | | | |
| Common equity tier 1 capital | | 134.6 | | 136.1 | |
| Tier 1 capital | | 158.3 | | 160.2 | |
| Total capital | | 181.1 | | 184.4 | |
| Capital ratios on a transitional basis (%) | | | |
| Common equity tier 1 ratio | | 15.6 | | 15.9 | |
| Tier 1 ratio | | 18.4 | | 18.7 | |
| Total capital ratio | | 21.0 | | 21.5 | |
| Capital on an end point basis ($bn) | | | |
| Common equity tier 1 capital | | 134.6 | | 136.1 | |
| Tier 1 capital | | 157.0 | | 158.5 | |
| Total capital | | 170.7 | | 173.2 | |
| Capital ratios on an end point basis (%) | | | |
| Common equity tier 1 ratio | | 15.6 | | 15.9 | |
| Tier 1 ratio | | 18.2 | | 18.5 | |
| Total capital ratio | | 19.8 | | 20.2 | |
| Liquidity coverage ratio (‘LCR’) | | | |
| Total high-quality liquid assets ($bn) | | 659.3 | | 677.9 | |
| Total net cash outflow ($bn) | | 493.7 | | 487.3 | |
| LCR ratio (%) | | 133.5 | | 139.1 | |
Following the end of the transition period following the UK's withdrawal from the EU, any reference to EU regulations and directives (including technical standards) should be read as a reference to the version onshored into UK law under the European Union (Withdrawal) Act 2018, as amended. Capital figures and ratios in the table above are calculated in accordance with the revisions to the Capital Requirements Regulation and Directive, as
implemented (‘CRR II’). The table presents them under the transitional arrangements in CRR II for capital instruments and after their expiry, known as the end point. The end point figures in the table above include the benefit of the regulatory transitional arrangements in CRR II for IFRS 9, which are more fully described below.
Where applicable, they also reflect government relief schemes intended to mitigate the impact of the Covid-19 outbreak.
Regulatory transitional arrangements for IFRS 9 ‘Financial Instruments’
We have adopted the regulatory transitional arrangements in CRR II for IFRS 9, including paragraph four of article 473a. Our capital and ratios are presented under these arrangements throughout the table above, including in the end point figures. Without their application, our CET1 ratio would be 15.5%.
The IFRS 9 regulatory transitional arrangements allow banks to add back to their capital base a proportion of the impact that
IFRS 9 has upon their loan loss allowances during the first five years of use. The impact is defined as:
• the increase in loan loss allowances on day one of IFRS 9 adoption; and
• any subsequent increase in ECL in the non-credit-impaired book thereafter.
Any add-back must be tax affected and accompanied by a recalculation of deferred tax, exposure and RWAs. The impact is calculated separately for portfolios using the standardised (‘STD’) and internal ratings-based (‘IRB’) approaches. For IRB portfolios, there is no add-back to capital unless loan loss allowances exceed regulatory 12-month expected losses.
The EU’s CRR ‘Quick Fix’ relief package enacted in June 2020 increased from 70% to 100% the relief that banks may take for loan loss allowances recognised since 1 January 2020 on the
non-credit-impaired book.
In the current period, the add-back to CET1 capital amounted to $1.0bn under the STD approach with a tax impact of $0.2bn. At 31 December 2020, the add-back to the capital base under the STD approach was $1.6bn with a tax impact of $0.4bn.
Own funds
| | | | | | | | | | | |
| Own funds disclosure |
| | At |
| | 30 Jun | 31 Dec |
| | 2021 | 2020 |
Ref* | | $m | $m |
| 6 | Common equity tier 1 capital before regulatory adjustments1 | 163,705 | | 163,128 | |
| 28 | Total regulatory adjustments to common equity tier 11 | (29,099) | | (27,078) | |
| 29 | Common equity tier 1 capital | 134,606 | | 136,050 | |
| 36 | Additional tier 1 capital before regulatory adjustments | 23,789 | | 24,183 | |
| 43 | Total regulatory adjustments to additional tier 1 capital | (60) | | (60) | |
| 44 | Additional tier 1 capital | 23,729 | | 24,123 | |
| 45 | Tier 1 capital | 158,335 | | 160,173 | |
| 51 | Tier 2 capital before regulatory adjustments | 24,238 | | 25,722 | |
| 57 | Total regulatory adjustments to tier 2 capital | (1,451) | | (1,472) | |
| 58 | Tier 2 capital | 22,787 | | 24,250 | |
| 59 | Total capital | 181,122 | | 184,423 | |
| 60 | Total risk-weighted assets | 862,292 | | 857,520 | |
| Capital ratios | % | % |
| 61 | Common equity tier 1 ratio | 15.6 | | 15.9 | |
| 62 | Tier 1 ratio | 18.4 | | 18.7 | |
| 63 | Total capital ratio | 21.0 | | 21.5 | |
* The references identify the lines prescribed in the EBA template.
1 The figures for 31 December 2020 have been restated to reflect the reclassification of the IFRS 9 transitional adjustment from retained earnings (within row 6) to ‘Total regulatory adjustments to common equity tier 1’ (row 28).
At 30 June 2021, our common equity tier 1 (‘CET1’) capital ratio decreased to 15.6% from 15.9% at 31 December 2020, reflecting an increase in RWAs and a decrease in CET1 capital of $1.5bn including the impact of foreseeable dividends of $3.5bn. The decrease in CET1 capital was mainly a result of:
•a $1.4bn decrease in the fair value through other comprehensive income reserve;
•a $1.3bn higher threshold deduction for investment in financial sector entities;
•a $1.2bn decline in IFRS 9 transitional add-back; and
•$0.6bn unfavourable foreign currency translation differences.
These decreases were partly offset by:
•$2.8bn capital generation through profits, net of foreseeable dividend and dividend paid on other equity instruments.
At 30 June 2021, our Pillar 2A requirement, in accordance with the PRA’s Individual Capital Requirement based on a point-in-time assessment, was equivalent to 2.9% of RWAs, of which 1.7% was met by CET1 capital.
Throughout the first half of 2021, we complied with the PRA’s regulatory capital adequacy requirements.
Risk-weighted assets
| | | | | | | | | | | | | | | | | | |
| RWAs by global business |
| WPB | CMB | GBM | | Corporate
Centre | Total |
| $bn | $bn | $bn | | $bn | $bn |
| Credit risk | 148.3 | | 303.5 | | 166.3 | | | 84.8 | | 702.9 | |
| Counterparty credit risk | 0.9 | | 0.6 | | 36.6 | | | 1.2 | | 39.3 | |
| Market risk | 1.3 | | 0.6 | | 20.3 | | | 3.3 | | 25.5 | |
| Operational risk | 34.5 | | 27.4 | | 32.0 | | | 0.7 | | 94.6 | |
| At 30 Jun 2021 | 185.0 | | 332.1 | | 255.2 | | | 90.0 | | 862.3 | |
| At 31 Dec 2020 | 172.8 | | 327.7 | | 265.1 | | | 91.9 | | 857.5 | |
| | | | | | | | | | | | | | | | | | | | | |
| RWAs by geographical region |
| | Europe | Asia | MENA | North
America | Latin
America | Total |
| | $bn | $bn | $bn | $bn | $bn | $bn |
| Credit risk | | 206.0 | | 326.3 | | 49.9 | | 94.0 | | 26.7 | | 702.9 | |
| Counterparty credit risk | | 20.6 | | 10.7 | | 1.3 | | 4.8 | | 1.9 | | 39.3 | |
Market risk1 | | 17.1 | | 24.7 | | 2.1 | | 4.6 | | 1.2 | | 25.5 | |
| Operational risk | | 26.1 | | 45.4 | | 6.2 | | 11.8 | | 5.1 | | 94.6 | |
| At 30 Jun 2021 | | 269.8 | | 407.1 | | 59.5 | | 115.2 | | 34.9 | | 862.3 | |
| At 31 Dec 2020 | | 284.3 | | 384.2 | | 60.2 | | 117.8 | | 35.2 | | 857.5 | |
1 Market risk RWAs are non-additive across geographical regions due to diversification effects within the Group.
| | | | | | | | | | | | | | | | | | | | | |
| RWA movement by global businesses by key driver |
| Credit risk, counterparty credit risk and operational risk | | |
| WPB | CMB | GBM | | Corporate
Centre | Market
risk | Total
RWAs |
| $bn | $bn | $bn | | $bn | $bn | $bn |
| RWAs at 1 Jan 2021 | 171.2 | | 326.8 | | 242.2 | | | 88.8 | | 28.5 | | 857.5 | |
| Asset size | 10.3 | | 6.7 | | (5.7) | | | 3.3 | | (1.7) | | 12.9 | |
| Asset quality | (1.8) | | (3.0) | | 4.9 | | | (0.6) | | — | | (0.5) | |
| Model updates | 1.9 | | (0.3) | | (0.1) | | | — | | (1.2) | | 0.3 | |
| | | | | | | |
| | | | | | | |
| Methodology and policy | 2.6 | | 2.0 | | (5.2) | | | (4.5) | | (0.1) | | (5.2) | |
| | | | | | | |
| | | | | | | |
| | | | | | | |
| Foreign exchange movements | (0.5) | | (0.7) | | (1.2) | | | (0.3) | | — | | (2.7) | |
| Total RWA movement | 12.5 | | 4.7 | | (7.3) | | | (2.1) | | (3.0) | | 4.8 | |
| RWAs at 30 Jun 2021 | 183.7 | | 331.5 | | 234.9 | | | 86.7 | | 25.5 | | 862.3 | |
| | | | | | | |
| | | | | | | | | | | | | | | | | | | | | | | |
| RWA movement by geographical region by key driver |
| Credit risk, counterparty credit risk and operational risk | | |
| Europe | Asia | MENA | North
America | Latin
America | Market
risk | Total
RWAs |
| $bn | $bn | $bn | $bn | $bn | $bn | $bn |
| RWAs at 1 Jan 2021 | 260.8 | | 363.3 | | 57.8 | | 113.1 | | 34.0 | | 28.5 | | 857.5 | |
| Asset size | (11.7) | | 24.9 | | 0.8 | | — | | 0.6 | | (1.7) | | 12.9 | |
| Asset quality | 5.7 | | (1.7) | | (0.4) | | (3.9) | | (0.2) | | — | | (0.5) | |
| Model updates | — | | 1.7 | | (0.1) | | (0.1) | | — | | (1.2) | | 0.3 | |
| | | | | | | |
| | | | | | | |
| Methodology and policy | (2.2) | | (3.6) | | — | | 0.7 | | — | | (0.1) | | (5.2) | |
| | | | | | | |
| | | | | | | |
| | | | | | | |
| Foreign exchange movements | 0.1 | | (2.2) | | (0.7) | | 0.8 | | (0.7) | | — | | (2.7) | |
| Total RWA movement | (8.1) | | 19.1 | | (0.4) | | (2.5) | | (0.3) | | (3.0) | | 4.8 | |
| RWAs at 30 Jun 2021 | 252.7 | | 382.4 | | 57.4 | | 110.6 | | 33.7 | | 25.5 | | 862.3 | |
At 30 June 2021, our cumulative risk-weighted asset (‘RWA’) saves as part of our reduction programme were $84.5bn. This included accelerated reductions of $9.6bn in 4Q19. As explained on page 12, we have increased our RWA reduction target to $110bn by 2022, reflecting methodology changes around the tracking and reporting of reductions.
RWAs rose by $4.8bn during the first half of the year, including a decrease of $2.7bn due to foreign currency translation differences. The $7.5bn increase (excluding foreign currency translation differences) comprised the movements described by the following comments.
Asset size
The $12.9bn increase in RWAs due to asset size movements comprised growth in WPB, CMB and Corporate Centre, partly offset by reductions in GBM and market risk RWAs.
The $10.3bn increase in WPB RWAs was mostly in Asia, primarily due to short-term lending and mortgage growth in Hong Kong. CMB RWAs grew by $6.7bn, predominantly due to corporate loan growth in mainland China, Hong Kong and India, partly offset by lower lending in Europe.
The $3.3bn rise in Corporate Centre RWAs was across all major regions, and included increases in sovereign exposures, short-term exposures to other banks, Markets Treasury debt securities and loans, and the value of material holdings.
The $5.7bn fall in GBM RWAs included a $3.6bn reduction in counterparty credit risk RWAs, largely due to management actions in Europe and North America, and mark-to-market movements. A further $2.1bn decrease in credit risk RWAs was driven by management actions in Europe, Latin America, North America and
Asia, partly offset by lending growth in Asia.
Market risk RWAs decreased by $1.7bn, largely due to the effects of risk mitigation on the emerging markets bond portfolio and a fall in foreign exchange risk, partly offset by an increase in stressed value at risk.
Asset quality
Changes in asset quality led to an RWA decrease of $0.5bn. The reduction in CMB, WPB and Corporate Centre RWAs was mostly the result of favourable portfolio mix changes in Asia, North America and Europe, partly offset by credit migration in Asia. The $4.9bn rise in GBM RWAs was primarily due to portfolio changes in the UK and credit migration in Asia and Europe.
Model updates
The $0.3bn increase due to model updates included a $1.9bn rise in WPB, mostly as a result of an update to our Australian mortgages model. This was partly offset by a $1.2bn reduction in Market Risk, largely from the implementation of an options risk model, and RWA decreases in CMB and GBM, predominantly due to corporate model updates.
Methodology and policy
The $5.2bn decrease in RWAs from methodology and policy changes was primarily due to risk parameter refinements in GBM and CMB, mainly in Europe and Asia. These movements were partly offset in CMB by a $1.0bn increase relating to updates to the treatment of SMEs, and a $0.7bn increase following an enhancement in the calculation of operational risk RWAs.
Changes to real estate, Markets Treasury and other allocation methodologies were the main cause of the $2.6bn increase in WPB RWAs, with offsets across Corporate Centre, CMB and GBM.
Leverage ratio1
| | | | | | | | | | | |
| | At |
| | 30 Jun | 31 Dec |
| | 2021 | 2020 |
| Ref* | | $bn | $bn |
| 20 | Tier 1 capital | 157.0 | | 158.5 | |
| 21 | Total leverage ratio exposure | 2,968.5 | | 2,897.1 | |
| | % | % |
| 22 | Leverage ratio | 5.3 | | 5.5 | |
| EU-23 | Choice of transitional arrangements for the definition of the capital measure | Fully phased-in | Fully phased-in |
| UK leverage ratio exposure – quarterly average2 | 2,535.1 | | 2,555.5 | |
| | % | % |
| UK leverage ratio – quarterly average2 | 6.3 | | 6.1 | |
| UK leverage ratio – quarter end2 | 6.2 | | 6.2 | |
* The references identify the lines prescribed in the EBA template.
1 The CRR II regulatory transitional arrangements for IFRS 9 are applied in both leverage ratio calculations.
2 UK leverage ratio denotes the Group’s leverage ratio calculated under the PRA’s UK leverage framework. This measure excludes from the calculation of exposure qualifying central bank balances and loans under the UK Bounce Back Loan Scheme.
Our leverage ratio calculated in accordance with the Capital Requirements Regulation was 5.3% at 30 June 2021, down from 5.5% at 31 December 2020, due to a decrease in tier 1 capital and an increase in leverage exposure, primarily due to growth in cash and balances at central banks, customer lending and trading assets, offset by a decrease in financial investments.
At 30 June 2021, our UK minimum leverage ratio requirement of 3.25% was supplemented by an additional leverage ratio buffer of 0.7% and a countercyclical leverage ratio buffer of 0.1%. These additional buffers translated into capital values of $17.7bn and $2.5bn respectively. We exceeded these leverage requirements.
Regulatory disclosures
Pillar 3 disclosure requirements
Pillar 3 of the Basel regulatory framework is related to market discipline and aims to make financial services firms more transparent by requiring publication of wide-ranging information on their risks, capital and management. Our Pillar 3 Disclosures at 30 June 2021 is expected to be published on or around 9 August 2021 at www.hsbc.com/investors.
Liquidity and funding risk in the first half of 2021
Liquidity metrics
At 30 June 2021, all of the Group’s material operating entities were above regulatory minimum levels.
Each entity maintains sufficient unencumbered liquid assets to comply with local and regulatory requirements. The liquidity value of these liquidity assets for each entity is shown in the following table along with the individual LCR levels on a European Commission (‘EC’) basis. This basis may differ from local LCR measures due to differences in the way non-EU regulators have implemented the Basel III standards.
Each entity maintains a sufficient stable funding profile and it is assessed by using the net stable funding ratio (‘NSFR’) or other appropriate metrics.
In addition to regulatory metrics, HSBC enhanced its liquidity framework in 2021 to include an ‘internal liquidity metric’, which is being used to monitor and manage liquidity risk via a low-point measure across a 270-day horizon, taking into account recovery capacity.
The Group liquidity and funding position at 30 June 2021 is analysed in the following sections.
| | | | | | | | | | | | | | | |
| Operating entities’ liquidity |
| | At 30 June 2021 |
| | LCR | HQLA | Net outflows | NSFR |
| | % | $bn | $bn | % |
HSBC UK Bank plc (ring-fenced bank)1 | | 223 | | 145 | | 65 | | 177 | |
HSBC Bank plc (non-ring-fenced bank)2 | | 145 | | 141 | | 97 | | 116 | |
The Hongkong and Shanghai Banking Corporation – Hong Kong branch3 | | 172 | | 120 | | 70 | | 134 | |
The Hongkong and Shanghai Banking Corporation – Singapore branch3 | | 212 | | 14 | | 6 | | 137 | |
| Hang Seng Bank | | 187 | | 41 | | 22 | | 143 | |
| HSBC Bank China | | 198 | | 24 | | 12 | | 149 | |
| HSBC Bank USA | | 126 | | 104 | | 83 | | 145 | |
HSBC Continental Europe4 | | 146 | | 58 | | 40 | | 133 | |
| HSBC Middle East – UAE branch | | 215 | | 11 | | 5 | | 158 | |
HSBC Canada4 | | 129 | | 22 | | 17 | | 125 | |
| HSBC Mexico | | 186 | | 9 | | 5 | | 135 | |
| | | | | | | | | | | | | | | |
| Operating entities’ liquidity (continued) |
| | At 31 December 2020 |
| | LCR | HQLA | Net outflows | NSFR |
| | % | $m
| $m | %
|
HSBC UK Bank plc (ring-fenced bank)1 | | 198 | | 121 | | 61 | | 164 | |
HSBC Bank plc (non-ring-fenced bank)2 | | 136 | | 138 | | 102 | | 124 | |
The Hongkong and Shanghai Banking Corporation – Hong Kong branch3 | | 195 | | 146 | | 75 | | 146 | |
The Hongkong and Shanghai Banking Corporation – Singapore branch3 | | 162 | | 16 | | 10 | | 135 | |
| Hang Seng Bank | | 212 | | 50 | | 24 | | 151 | |
| HSBC Bank China | | 232 | | 24 | | 10 | | 158 | |
| HSBC Bank USA | | 130 | | 106 | | 82 | | 130 | |
HSBC Continental Europe4 | | 143 | | 48 | | 34 | | 130 | |
| HSBC Middle East – UAE branch | | 280 | | 11 | | 4 | | 164 | |
HSBC Canada4 | | 165 | | 30 | | 18 | | 136 | |
| HSBC Mexico | | 198 | | 10 | | 5 | | 139 | |
1 HSBC UK Bank plc refers to the HSBC UK liquidity group, which comprises four legal entities: HSBC UK Bank plc, Marks and Spencer Financial Services plc, HSBC Private Bank (UK) Ltd and HSBC Trust Company (UK) Limited, managed as a single operating entity, in line with the application of UK liquidity regulation as agreed with the PRA.
2 HSBC Bank plc includes overseas branches and special purpose entities consolidated by HSBC for financial statements purposes.
3 The Hongkong and Shanghai Banking Corporation – Hong Kong branch and The Hongkong and Shanghai Banking Corporation – Singapore branch represent the material activities of The Hongkong and Shanghai Banking Corporation. Each branch is monitored and controlled for liquidity and funding risk purposes as a stand-alone operating entity.
4 HSBC Continental Europe and HSBC Canada represent the consolidated banking operations of the Group in France and Canada, respectively. HSBC Continental Europe and HSBC Canada are each managed as single distinct operating entities for liquidity purposes.
At 30 June 2021, all of the Group’s principal operating entities were well above regulatory minimum levels.
The most significant movements in 2021 are explained below:
•HSBC UK Bank plc retained a strong liquidity position, reflecting growth in its commercial surplus primarily due to higher deposits.
•HSBC Bank plc’s liquidity ratio increased to 145%, mainly due to growth in customer deposits and a decline in loans.
•The Hongkong and Shanghai Banking Corporation – Hong Kong branch liquidity position remained strong, although its liquidity ratio decreased to 172%, mainly due to a growth in loans.
•Hang Seng Bank’s liquidity ratio decreased to 187%, mainly due to growth in loans.
•The Hongkong and Shanghai Banking Corporation – Singapore branch increased its liquidity ratio to 212%, mainly due to a change in the maturity profile of the loans.
•HSBC Bank China’s liquidity ratio decreased to 198%, mainly due to growth in loans.
•HSBC Bank USA maintained a strong liquidity ratio of 126%.
•HSBC Continental Europe maintained a strong liquidity position, reflecting growth in deposits.
•HSBC Bank Middle East – UAE Branch retained a strong liquidity position, with a liquidity ratio of 215%.
•HSBC Canada’s liquidity ratio decreased to 129%, mainly driven by the maturity of the funding raised last year during the pandemic and growth in loans.
Consolidated liquidity metrics
Liquidity coverage ratio
At 30 June 2021, the total HQLA held at entity level amounted to $844bn (31 December 2020: $857bn), a decrease of $13bn. During the first half of 2021, HSBC implemented a revised approach to the application of the requirements under the EC Delegated Act. This approach was used to assess the limitations in the fungibility of entity liquidity around the Group and resulted in an adjustment of $185bn to LCR HQLA and $4bn to LCR inflows. This reflected an increase in the adjustment of $42bn compared with the approach used for the disclosure in the Annual Report and Accounts 2020. The change in methodology was designed to better incorporate local regulatory restrictions on the transferability of liquidity.
As a consequence, the Group LCR was 134% at 30 June 2021 (31 December 2020:139%). The $185bn of HQLA and $4bn of inflows remains available to cover liquidity risk in relevant entities.
| | | | | | | | | | | |
| At |
| 30 Jun | 30 Jun | 31 Dec |
| 2021 | 20201 | 20201 |
| $bn | $bn | $bn |
| High-quality liquid assets (in entities) | 844 | 784 | 857 |
| EC Delegated Act adjustment | (189) | (130) | (179) |
| Group LCR HQLA | 659 | 654 | 678 |
| Net outflows | 494 | 443 | 487 |
| Liquidity coverage ratio | 134 | % | 148 | % | 139 | % |
1 Group LCR numbers above for 30 June 2020 and 31 December 2020 are based on the approach used before the methodology was revised.
Liquid assets
After the $185bn adjustment, the Group LCR HQLA of $659bn (31 December 2020: $678bn) was held in a range of asset classes and currencies. Of these, 94% were eligible as level 1 (31 December 2020: 90%).
The following tables reflect the composition of the liquidity pool by asset type and currency at 30 June 2021:
| | | | | | | | | | | | | | |
| Liquidity pool by asset type |
| Liquidity pool | Cash | Level 11 | Level 21 |
| $bn | $bn | $bn | $bn |
| Cash and balance at central bank | 377 | | 377 | | — | | — | |
| Central and local government bonds | 250 | | — | | 220 | | 30 | |
| Regional government and public sector entities | 4 | | — | | 3 | | 1 | |
| International organisation and multilateral development banks | 12 | | — | | 12 | | — | |
| Covered bonds | 4 | | — | | 1 | | 3 | |
| Other | 12 | | — | | 9 | | 3 | |
| Total at 30 Jun 2021 | 659 | | 377 | | 245 | | 37 | |
| Total at 31 Dec 2020 | 678 | 307 | 301 | 70 |
1 As defined in EU regulation, level 1 assets means ‘assets of extremely high liquidity and credit quality’, and level 2 assets means ‘assets of high liquidity and credit quality’.
| | | | | | | | | | | | | | | | | | | | |
| Liquidity pool by currency |
| $ | £ | € | HK$ | Other | Total |
| $bn | $bn | $bn | $bn | $bn | $bn |
| Liquidity pool at 30 Jun 2021 | 151 | | 207 | | 108 | | 54 | | 139 | | 659 | |
| Liquidity pool at 31 Dec 2020 | 218 | 176 | 117 | 74 | 93 | 678 |
Sources of funding
Our primary sources of funding are customer current accounts and savings deposits payable on demand or at short notice. We issue secured and unsecured wholesale securities to supplement customer deposits, meet regulatory obligations and to change the currency mix, maturity profile or location of our liabilities.
The following ‘Funding sources’ and ‘Funding uses’ tables provide a view of how our consolidated balance sheet is funded. In practice, all the principal operating entities are required to manage liquidity and funding risk on a stand-alone basis.
The tables analyse our consolidated balance sheet according to the assets that primarily arise from operating activities and the sources of funding primarily supporting these activities. Assets and liabilities that do not arise from operating activities are presented as a net balancing source or deployment of funds.
In 1H21, the level of customer accounts continued to exceed the level of loans and advances to customers. The positive funding gap was predominantly deployed in liquid assets.
| | | | | | | | | |
| Funding sources |
| | At |
| | 30 Jun | 31 Dec |
| | 2021 | 2020 |
| | $m | $m |
| Customer accounts | | 1,669,091 | | 1,642,780 | |
| Deposits by banks | | 100,448 | | 82,080 | |
| Repurchase agreements – non-trading | | 112,798 | | 111,901 | |
| Debt securities in issue | | 84,218 | | 95,492 | |
| | | |
| Cash collateral, margin and settlement accounts | | 104,215 | | 78,565 | |
| | | |
| Subordinated liabilities | | 20,774 | | 21,951 | |
| Financial liabilities designated at fair value | | 151,686 | | 157,439 | |
| Liabilities under insurance contracts | | 110,572 | | 107,191 | |
| Trading liabilities | | 89,637 | | 75,266 | |
| – repos | | 14,169 | | 11,728 | |
| – stock lending | | 5,616 | | 4,597 | |
| | | |
| – other trading liabilities | | 69,852 | | 58,941 | |
| Total equity | | 206,764 | | 204,995 | |
| Other balance sheet liabilities | | 325,802 | | 406,504 | |
| | 2,976,005 | | 2,984,164 | |
| | | | | | | | | |
| Funding uses |
| | At |
| | 30 Jun | 31 Dec |
| | 2021 | 2020 |
| | $m | $m |
| Loans and advances to customers | | 1,059,511 | | 1,037,987 | |
| Loans and advances to banks | | 86,886 | | 81,616 | |
| Reverse repurchase agreements – non-trading | | 201,714 | | 230,628 | |
| | | |
| Cash collateral, margin and settlement accounts | | 92,074 | | 76,859 | |
| Assets held for sale | | 3,640 | | 299 | |
| Trading assets | | 260,250 | | 231,990 | |
| – reverse repos | | 19,660 | | 13,990 | |
| – stock borrowing | | 9,213 | | 8,286 | |
| | | |
| – other trading assets | | 231,377 | | 209,714 | |
| Financial investments | | 434,576 | | 490,693 | |
| Cash and balances with central banks | | 393,559 | | 304,481 | |
| Other balance sheet assets | | 443,795 | | 529,611 | |
| | 2,976,005 | | 2,984,164 | |
Interest rate risk in the banking book in the first half of 2021
Net interest income sensitivity
The following tables set out the assessed impact to a hypothetical base case projection of our net interest income (‘NII’), excluding insurance, under the following scenarios:
•an immediate shock of 25 basis points (‘bps’) to the current market-implied path of interest rates across all currencies on 1 July 2021 (effects over one year and five years); and
•an immediate shock of 100bps to the current market-implied path of interest rates across all currencies on 1 July 2021 (effects over one year and five years).
The sensitivities shown represent our assessment of the change to a hypothetical base case NII, assuming a static balance sheet and no management actions from Markets Treasury. They incorporate the effect of interest rate behaviouralisation, managed rate product pricing assumptions and customer behaviour, including the prepayment of mortgages or customer migration from non-interest-bearing to interest-bearing deposit accounts. The scenarios represent interest rate shocks to the current market implied path of rates. No floors have been applied to market rates, although flooring on product rates has been retained where applicable.
The one-year and five-year NII sensitivities increased in June 2021 at Group level when compared with December 2020. This was driven by changes in the forecasted yield curves and changes in balance sheet composition.
Immediate interest rate rises of 25bps and 100bps would increase projected NII for the 12 months to 30 June 2022 by $1,502m and $5,772m, respectively. Conversely, falls of 25bps and 100bps would decrease projected NII for the 12 months to 30 June 2022 by $1,605m and $5,190 respectively.
The sensitivity of NII for 12 months has increased by $424m in the plus 100bps and by $336m in the minus 100bps parallel shock comparing June 2021 with December 2020.
The increase in sensitivity of NII for 12 months was mainly driven by the general build-up of liquidity throughout the Group, which has been deployed in short-term investments (predominantly cash, hold-to-collect-and-sell securities and reverse repos), and changes in pass-on assumptions in view of the significant drop in interest rates and changes in portfolio composition.
The change in NII sensitivity for five years is also driven by the factors above.
The structural sensitivity of NII arising within the three global businesses, excluding Markets and Securities Services, is positive in a rising rate environment and negative in a falling rate environment. Markets Treasury has an NII sensitivity profile that offsets this to some degree. The tables do not include potential Markets Treasury management actions or changes in Markets and Securities Services net trading income that may further limit the offset.
| | | | | | | | | | | | | | | | | | | | |
| NII sensitivity to an instantaneous change in yield curves (12 months) |
| US dollar | HK dollar | Sterling | Euro | Other | Total |
| $m | $m | $m | $m | $m | $m |
Change in Jul 2021 to Jun 2022 (based on balance sheet at
30 Jun 2021) | | | | | | |
| +25bps | 114 | | 340 | | 561 | | 113 | | 374 | | 1,502 | |
| -25bps | (122) | | (393) | | (616) | | (83) | | (391) | | (1,605) | |
| +100bps | 369 | | 1,354 | | 2,053 | | 532 | | 1,464 | | 5,772 | |
| -100bps | (224) | | (837) | | (2,257) | | (330) | | (1,542) | | (5,190) | |
| Change in Jan 2021 to Dec 2021 (based on balance sheet at 31 Dec 2020) | | | | | | |
| +25bps | (110) | | (83) | | 6 | | (13) | | 55 | | (145) | |
| -25bps | 105 | | (50) | | (67) | | 5 | | (90) | | (97) | |
| +100bps | (177) | | 87 | | 242 | | 30 | | 242 | | 424 | |
| -100bps | 341 | | (88) | | (351) | | (31) | | (207) | | (336) | |
| | | | | | | | | | | | | | | | | | | | |
| NII sensitivity to an instantaneous change in yield curves (5 years) |
| Year 1 | Year 2 | Year 3 | Year 4 | Year 5 | Total |
| $m | $m | $m | $m | $m | $m |
Change in Jul 2021 to Jun 2026 (based on balance sheet at
30 Jun 2021) | | | | | | |
| +25bps | 1,502 | | 1,806 | | 1,976 | | 2,098 | | 2,158 | | 9,540 | |
| -25bps | (1,605) | | (2,085) | | (2,042) | | (2,152) | | (2,235) | | (10,119) | |
| +100bps | 5,772 | | 7,118 | | 7,778 | | 8,092 | | 8,179 | | 36,939 | |
| -100bps | (5,190) | | (6,924) | | (8,249) | | (8,892) | | (9,243) | | (38,498) | |
| Change in Jan 2021 to Dec 2025 (based on balance sheet at 31 Dec 2020) | | | | | | |
| +25bps | (145) | | (60) | | 46 | | 70 | | 58 | | (31) | |
| -25bps | (97) | | (98) | | 266 | | (107) | | (124) | | (160) | |
| +100bps | 424 | | 580 | | 696 | | 648 | | 441 | | 2,789 | |
| -100bps | (336) | | (751) | | (1,162) | | (1,232) | | (918) | | (4,399) | |
Overview
Market risk is the risk that movements in market factors, such as foreign exchange rates, interest rates, credit spreads, equity prices and commodity prices, will reduce our income or the value of our portfolios.
Market risk in the first half of 2021
There were no material changes to the policies and practices for the management of market risk in the first half of 2021.
A summary of our current policies and practices for the management of market risk is set out in ‘Market risk management’ on page 182 of the Annual Report and Accounts 2020.
Financial markets remained resilient during the first half of 2021, against the backdrop of loose financial conditions, continued fiscal support and acceleration in the roll-out of Covid-19 vaccination programmes to the general population. As the reopening of major economies progressed in 1Q21, rising concerns of inflationary pressures and expectations that the US Federal Reserve could raise interest rates earlier than previously anticipated led to a temporary increase in long-term government bond yields and a pause in the stock market rally. The path of monetary policies remained uncertain in 2Q21, although central banks continued to remain cautious and provide liquidity, highlighting the potentially transitory nature of higher inflation. This provided continued support to risk assets valuations and led to interest rates retracing from the high levels in March, while market volatility remained subdued. In June, major equity markets reached new record highs and credit markets remained strong, with credit benchmark indices for investment grade and high-yield debt close to pre-pandemic levels.
We continued to manage market risk prudently in the first half of 2021. Sensitivity exposures and VaR remained within appetite as the business pursued its core market-making activity in support of our customers. Market risk was managed using a complementary set of risk measures and limits, including stress and scenario analysis.
Trading portfolios
Value at risk of the trading portfolios
Trading VaR was predominantly generated by Markets and Securities Services. Market-making activities in the Global Debt Markets and Foreign Exchange businesses were the main drivers of trading VaR at the end of 1H21, with larger contributions compared with the end of 2020. Trading VaR at 30 June 2021 was lower than at 31 December 2020. The moderate reduction in trading VaR during the first half of the year was due mainly to larger offsetting gains from the Equity business, including lower exposures to dividends and correlation risks. The Group trading VaR for the half-year is shown in the table below.
| | | | | | | | | | | | | | | | | | | | |
| Trading VaR, 99% 1 day |
| Foreign exchange
and commodity | Interest
rate | Equity | Credit
spread | Portfolio diversification1 | Total |
| $m | $m | $m | $m | $m | $m |
| Half-year to 30 Jun 2021 | 13.6 | | 33.5 | | 15.8 | | 18.3 | | (42.5) | | 38.7 | |
| Average | 15.0 | | 33.4 | | 16.5 | | 18.1 | | (46.2) | | 36.8 | |
| Maximum | 31.8 | | 50.4 | | 24.3 | | 29.4 | | 0 | 48.2 | |
| Minimum | 6.9 | | 18.5 | | 12.1 | | 12.2 | | 0 | 31.1 | |
| | | | | | |
| | | | | | |
| Half-year to 30 Jun 2020 | 10.4 | | 36.8 | | 26.3 | | 18.7 | | (47.8) | | 44.4 | |
| Average | 10.6 | | 27.6 | | 25.0 | | 23.1 | | (36.2) | | 50.1 | |
| Maximum | 19.9 | | 43.5 | | 41.3 | | 44.1 | | | 69.3 | |
| Minimum | 5.6 | | 19.1 | | 13.6 | | 13.7 | | | 33.6 | |
| | | | | | |
| | | | | | |
| Half-year to 31 Dec 2020 | 13.7 | | 20.3 | | 21.5 | | 24.3 | | (36.4) | | 43.4 | |
| Average | 11.3 | | 25.5 | | 29.0 | | 20.2 | | (40.2) | | 45.8 | |
| Maximum | 25.7 | | 38.1 | | 40.5 | | 28.6 | | | 62.2 | |
| Minimum | 7.1 | | 19.8 | | 21.1 | | 12.6 | | | 37.2 | |
1 When VaR is calculated at a portfolio level, natural offsets in risk can occur when compared with aggregating VaR at the asset class level. This difference is called portfolio diversification. The asset class VaR maxima and minima reported in the table occurred on different dates within the reporting period. For this reason, we do not report an implied portfolio diversification measure between the maximum (minimum) asset class VaR measures and the maximum (minimum) total VaR measures in this table.
The risk not in VaR (‘RNIV’) framework covers risks from exposures in our trading book that are not fully captured by the VaR model. The VaR-based RNIVs are included within the metrics for each asset class.
Back-testing
In 1H21, the Group experienced one loss exception against hypothetical profit and loss and no exceptions against actual profit and loss.
The hypothetical profit and loss reflects the profit and loss that would be realised if positions were held constant from the end of one trading day to the end of the next. This measure of profit and loss does not align with how risk is dynamically hedged, and is not therefore necessarily indicative of the actual performance of the business. The loss back-testing exception against hypothetical profit and loss observed in March was mainly driven by the effect of lower volatility in the equity markets and by the increase in some emerging markets foreign exchange forward rates volatilities.
Non-trading portfolios
Value at risk of the non-trading portfolios
Non-trading portfolios comprise positions that primarily arise from
the interest rate management of our retail and commercial banking assets and liabilities, financial investments measured at fair value through other comprehensive income, debt instruments measured at amortised cost, and exposures arising from our insurance operations.
The VaR for non-trading activity at 30 June 2021 did not change materially compared with 31 December 2020. The increase in average non-trading VaR was driven primarily by the effect of higher interest rate levels and market volatility observed in February and March 2021, as the markets adjusted to higher economic growth and rising inflation expectations. This led to an increase in VaR, while the size of interest rate exposures remained relatively stable.
Non-trading VaR includes non-trading financial instruments held in portfolios managed by Markets Treasury. The management of interest rate risk in the banking book is described further in ‘Net interest income sensitivity’ on page 88.
The Group non-trading VaR for the half-year is shown in the following table.
| | | | | | | | | | | | | | |
| Non-trading VaR, 99% 1 day |
| Interest
rate | Credit
spread | Portfolio diversification1 | Total |
| $m | $m | $m | $m |
| Half-year to 30 Jun 2021 | 193.7 | | 73.8 | | (18.0) | | 249.5 | |
| Average | 201.1 | | 80.5 | | (31.2) | | 250.4 | |
| Maximum | 248.7 | | 99.3 | | | 298.8 | |
| Minimum | 163.3 | | 64.7 | | | 193.5 | |
| | | | |
| Half-year to 30 Jun 2020 | 184.3 | | 83.2 | | (61.6) | | 205.9 | |
| Average | 122.8 | | 80.9 | | (60.7) | | 143.0 | |
| Maximum | 190.1 | | 133.4 | | | 219.7 | |
| Minimum | 59.0 | | 44.2 | | | 79.7 | |
| | | | |
| Half-year to 31 Dec 2020 | 166.6 | | 87.0 | | (5.7) | | 247.8 | |
| Average | 176.7 | | 84.0 | | (23.7) | | 237.0 | |
| Maximum | 196.4 | | 102.1 | | | 274.6 | |
| Minimum | 159.2 | | 67.5 | | | 179.7 | |
1 When VaR is calculated at a portfolio level, natural offsets in risk can occur when compared with aggregating VaR at the asset class level. This difference is called portfolio diversification. The asset class VaR maxima and minima reported in the table occurred on different dates within the reporting period. For this reason, we do not report an implied portfolio diversification measure between the maximum (minimum) asset class VaR measures and the maximum (minimum) total VaR measures in this table.
Non-trading VaR excludes equity risk on securities held at fair value, structural foreign exchange risk and interest rate risk on fixed-rate securities issued by HSBC Holdings. HSBC’s
management of market risk in the non-trading book is described in the Treasury risk section on page 86.
| | |
| Insurance manufacturing operations risk |
Overview
The majority of the risk in our insurance business derives from manufacturing activities and can be categorised as financial risk and insurance risk. Financial risks include market risk, credit risk and liquidity risk. Insurance risk is the risk, other than financial risk, of loss transferred from the holder of the insurance contract to HSBC, the issuer. The cost of claims and benefits can be influenced by many factors, including mortality and morbidity experience, as well as lapse and surrender rates.
Insurance manufacturing operations risk in the first half of 2021
There have been no material changes to the policies and practices for the management of risks arising in our insurance operations described in the Annual Report and Accounts 2020.
A summary of our policies and practices regarding the risk management of insurance operations, our insurance model and the main contracts we manufacture is provided on page 189 of the Annual Report and Accounts 2020.
The risk profile of our insurance manufacturing operations is assessed in the Group’s ICAAP based on their financial capacity to
support the risks to which they are exposed. Capital adequacy is assessed on both the Group’s economic capital basis, and the relevant local insurance regulatory basis. The Group’s economic capital basis is largely aligned to European Solvency II regulations. Risk appetite buffers are set to ensure that the operations are able to remain solvent on both bases, allowing for business-as-usual volatility and extreme but plausible stress events. In addition, the insurance manufacturing operations also manage their market, liquidity, credit, underwriting and non-financial risk exposures to Board-approved risk appetite limits.
Interest rates and equity values, which are the key risk drivers for the financial strength of the insurance operations, in general rose during the first half of the year. This had a favourable impact on capital positions and financial risk exposures. As a result, at 30 June 2021 the majority of the capital and financial risk positions of our insurance operations were within risk appetite. However, we continue to monitor these risks closely, as lower interest rates impact on margins and increase profit sensitivity on our insurance products.
The following table shows the composition of assets and liabilities by contract type.
| | | | | | | | | | | | | | | | | | | |
| |
| Balance sheet of insurance manufacturing subsidiaries by type of contract |
| | | With
DPF | Unit-
linked | Other contracts1 | Shareholder
assets and
liabilities | Total |
| | | $m | $m | $m | $m | $m |
| Financial assets | | 87,984 | | 9,134 | | 19,402 | | 9,238 | | 125,758 | |
| – trading assets | | 0 | | 0 | | 0 | | 0 | | 0 | |
| – financial assets designated and otherwise mandatorily measured at fair value through profit or loss | | 29,111 | | 8,788 | | 3,651 | | 1,907 | | 43,457 | |
| – derivatives | | 146 | | 1 | | 6 | | 2 | | 155 | |
| – financial investments – at amortised cost | | 41,201 | | 93 | | 14,145 | | 4,391 | | 59,830 | |
| – financial investments – at fair value through other comprehensive income | | 11,851 | | 0 | | 490 | | 1,700 | | 14,041 | |
| – other financial assets2 | | 5,675 | | 252 | | 1,110 | | 1,238 | | 8,275 | |
| Reinsurance assets | | 2,191 | | 77 | | 1,625 | | 1 | | 3,894 | |
| PVIF3 | | 0 | | 0 | | 0 | | 9,449 | | 9,449 | |
| Other assets and investment properties | | 2,551 | | 3 | | 658 | | 717 | | 3,929 | |
| Total assets at June 2021 | | 92,726 | | 9,214 | | 21,685 | | 19,405 | | 143,030 | |
| Liabilities under investment contracts designated at fair value | | 0 | | 2,390 | | 3,941 | | 0 | | 6,331 | |
| Liabilities under insurance contracts | | 87,685 | | 6,726 | | 16,225 | | 0 | | 110,636 | |
| Deferred tax4 | | 180 | | 8 | | 19 | | 1,407 | | 1,614 | |
| Other liabilities | | 0 | | 0 | | 0 | | 8,068 | | 8,068 | |
| Total liabilities | | 87,865 | | 9,124 | | 20,185 | | 9,475 | | 126,649 | |
| Total equity | | 0 | | 0 | | 0 | | 16,381 | | 16,381 | |
| Total liabilities and equity at June 2021 | | 87,865 | | 9,124 | | 20,185 | | 25,856 | | 143,030 | |
| | | | | | | |
| Financial assets | | 84,478 | | 8,802 | | 18,932 | | 8,915 | | 121,127 | |
| – trading assets | | 0 | | 0 | | 0 | | 0 | | 0 | |
| – financial assets designated at fair value | | 26,002 | | 8,558 | | 3,508 | | 1,485 | | 39,553 | |
| – derivatives | | 262 | | 3 | | 13 | | 3 | | 281 | |
| – financial investments at amortised cost | | 39,891 | | 30 | | 13,984 | | 4,521 | | 58,426 | |
| – financial investments at fair value through other comprehensive income | | 12,531 | | 0 | | 459 | | 1,931 | | 14,921 | |
| – other financial assets2 | | 5,792 | | 211 | | 968 | | 975 | | 7,946 | |
| Reinsurance assets | | 2,256 | | 65 | | 1,447 | | 2 | | 3,770 | |
| PVIF3 | | 0 | | 0 | | 0 | | 9,435 | | 9,435 | |
| Other assets and investment properties | | 2,628 | | 1 | | 227 | | 721 | | 3,577 | |
| Total assets at December 2020 | | 89,362 | | 8,868 | | 20,606 | | 19,073 | | 137,909 | |
| Liabilities under investment contracts designated at fair value | | 0 | | 2,285 | | 4,100 | | 0 | | 6,385 | |
| Liabilities under insurance contracts | | 84,931 | | 6,503 | | 15,827 | | 0 | | 107,261 | |
| Deferred tax4 | | 145 | | 5 | | 25 | | 1,400 | | 1,575 | |
| Other liabilities | | 0 | | 0 | | 0 | | 7,244 | | 7,244 | |
| Total liabilities | | 85,076 | | 8,793 | | 19,952 | | 8,644 | | 122,465 | |
| Total equity | | 0 | | 0 | | 0 | | 15,444 | | 15,444 | |
| Total liabilities and equity at December 2020 | | 85,076 | | 8,793 | | 19,952 | | 24,088 | | 137,909 | |
1 Other contracts includes term assurance, credit life insurance, universal life insurance and certain investment contracts not included in the ‘Unit-linked’ or ‘With DPF’ columns.
2 Comprise mainly loans and advances to banks, cash and inter-company balances with other non-insurance legal entities.
3 Present value of in-force long-term insurance business.
4 Deferred tax includes the deferred tax liabilities arising on recognition of PVIF.
Market risk
Description and exposure
Market risk is the risk of changes in market factors affecting HSBC’s capital or profit. Market factors include interest rates, equity and growth assets, and foreign exchange rates.
Our exposure varies depending on the type of contract issued. Our most significant life insurance products are contracts with discretionary participating features (‘DPF’) issued in France and Hong Kong. These products typically include some form of capital guarantee or guaranteed return on the sums invested by the policyholders, to which discretionary bonuses are added if allowed by the overall performance of the funds. These funds are primarily invested in bonds, with a proportion allocated to other asset classes to provide customers with the potential for enhanced returns.
DPF products expose HSBC to the risk of variation in asset returns, which will impact our participation in the investment performance.
In addition, in some scenarios the asset returns can become insufficient to cover the policyholders’ financial guarantees, in which case the shortfall has to be met by HSBC. Amounts are held against the cost of such guarantees, calculated by stochastic modelling.
Where local rules require, these reserves are held as part of liabilities under insurance contracts. Any remainder is accounted for as a deduction from the present value of in-force (‘PVIF’)
long-term insurance business on the relevant product.
For unit-linked contracts, market risk is substantially borne by the policyholder, but some market risk exposure typically remains, as fees earned are related to the market value of the linked assets.
Sensitivities
Changes in financial market factors, from the economic assumptions in place at the start of the year, had a positive impact on reported profit before tax of $413m (1H20: $320m negative). The following table illustrates the effects of selected interest rate, equity price and foreign exchange rate scenarios on our profit for the period and the total equity of our insurance manufacturing subsidiaries.
Where appropriate, the effects of the sensitivity tests on profit after tax and equity incorporate the impact of the stress on the PVIF.
Due in part to the impact of the cost of guarantees and hedging strategies, which may be in place, the relationship between the profit and total equity and the risk factors is non-linear, particularly in a low interest-rate environment.
Therefore, the results disclosed should not be extrapolated to measure sensitivities to different levels of stress. For the same reason, the impact of the stress is not necessarily symmetrical on the upside and downside. The sensitivities are stated before allowance for management actions, which may mitigate the effect of changes in the market environment. The sensitivities presented allow for adverse changes in policyholder behaviour that may arise in response to changes in market rates. The differences between the impacts on profit after tax and equity are driven by the changes in value of the bonds measured at fair value through other comprehensive income, which are only accounted for in equity.
| | | | | | | | | | | | | | |
| Sensitivity of HSBC’s insurance manufacturing subsidiaries to market risk factors |
|
| At 30 Jun 2021 | At 31 Dec 2020 |
| Effect on
profit after tax | Effect on
total equity | Effect on
profit after tax | Effect on
total equity |
| $m | $m | $m | $m |
| +100 basis point parallel shift in yield curves | (42) | | (188) | | (67) | | (188) | |
| -100 basis point parallel shift in yield curves | (53) | | 97 | | (68) | | 58 | |
| 10% increase in equity prices | 366 | | 366 | | 332 | | 332 | |
| 10% decrease in equity prices | (372) | | (372) | | (338) | | (338) | |
| 10% increase in US dollar exchange rate compared with all currencies | 10 | | 10 | | 84 | | 84 | |
| 10% decrease in US dollar exchange rate compared with all currencies | (10) | | (10) | | (84) | | (84) | |
Interim condensed financial statements (unaudited)
| | | | | | | | |
Interim condensed financial statements |
| Page |
| Consolidated income statement | |
| Consolidated statement of comprehensive income | |
| Consolidated balance sheet | |
| Consolidated statement of cash flows | |
| Consolidated statement of changes in equity | |
| | | | | | | | | | | | | | |
| Consolidated income statement |
| | Half-year to |
| | 30 Jun | 30 Jun | 31 Dec |
| | 2021 | 2020 | 2020 |
| Notes* | $m | $m | $m |
| Net interest income | | 13,098 | | 14,509 | | 13,069 | |
| – interest income | | 17,960 | | 23,000 | | 18,756 | |
| – interest expense | | (4,862) | | (8,491) | | (5,687) | |
| Net fee income | 2 | 6,674 | | 5,926 | | 5,948 | |
| – fee income | | 8,458 | | 7,480 | | 7,571 | |
| – fee expense | | (1,784) | | (1,554) | | (1,623) | |
| Net income from financial instruments held for trading or managed on a fair value basis | | 4,184 | | 5,768 | | 3,814 | |
| Net income/(expense) from assets and liabilities of insurance businesses, including related derivatives, measured at fair value through profit or loss | | 2,795 | | (1,290) | | 3,371 | |
| Change in fair value of designated debt and related derivatives | | (67) | | 197 | | 34 | |
| Changes in fair value of other financial instruments mandatorily measured at fair value through profit or loss | | 548 | | 80 | | 375 | |
| Gains less losses from financial investments | | 433 | | 466 | | 187 | |
| Net insurance premium income | | 5,663 | | 5,020 | | 5,073 | |
| Other operating income | | 155 | | 471 | | 56 | |
| Total operating income | | 33,483 | | 31,147 | | 31,927 | |
| Net insurance claims and benefits paid and movement in liabilities to policyholders | | (7,932) | | (4,402) | | (8,243) | |
| Net operating income before change in expected credit losses and other credit impairment charges | | 25,551 | | 26,745 | | 23,684 | |
| Change in expected credit losses and other credit impairment charges | | 719 | | (6,858) | | (1,959) | |
| Net operating income | | 26,270 | | 19,887 | | 21,725 | |
| Employee compensation and benefits | | (9,610) | | (8,514) | | (9,562) | |
| General and administrative expenses | | (5,675) | | (4,918) | | (6,197) | |
| Depreciation and impairment of property, plant and equipment and right-of-use assets | | (1,160) | | (1,209) | | (1,472) | |
| Amortisation and impairment of intangible assets | | (642) | | (1,845) | | (674) | |
| Goodwill impairment | | 0 | | (41) | | 0 | |
| Total operating expenses | | (17,087) | | (16,527) | | (17,905) | |
| Operating profit | | 9,183 | | 3,360 | | 3,820 | |
| Share of profit in associates and joint ventures | | 1,656 | | 958 | | 639 | |
| Profit before tax | | 10,839 | | 4,318 | | 4,459 | |
| Tax expense | | (2,417) | | (1,193) | | (1,485) | |
| Profit for the period | | 8,422 | | 3,125 | | 2,974 | |
| Attributable to: | | | | |
| – ordinary shareholders of the parent company | | 7,276 | | 1,977 | | 1,921 | |
| – preference shareholders of the parent company | | 7 | | 45 | | 45 | |
| – other equity holders | | 666 | | 617 | | 624 | |
| – non-controlling interests | | 473 | | 486 | | 384 | |
| Profit for the period | | 8,422 | | 3,125 | | 2,974 | |
| | $ | $ | $ |
| Basic earnings per ordinary share | 4 | 0.36 | | 0.10 | | 0.10 | |
| Diluted earnings per ordinary share | 4 | 0.36 | | 0.10 | | 0.09 | |
* For Notes on the interim condensed financial statements, see page 104.
| | | | | | | | | | | |
| Consolidated statement of comprehensive income |
| Half-year to |
| 30 Jun | 30 Jun | 31 Dec |
| 2021 | 2020 | 2020 |
| $m | $m | $m |
| Profit for the period | 8,422 | | 3,125 | | 2,974 | |
| Other comprehensive income/(expense) | | | |
| Items that will be reclassified subsequently to profit or loss when specific conditions are met: | | | |
| Debt instruments at fair value through other comprehensive income | (1,368) | | 1,747 | | 3 | |
| – fair value gains/(losses) | (1,392) | | 2,654 | | 293 | |
| – fair value gains transferred to the income statement on disposal | (375) | | (454) | | (214) | |
| – expected credit recoveries/(losses) recognised in the income statement | (26) | | 109 | | (61) | |
| – income taxes | 425 | | (562) | | (15) | |
| Cash flow hedges | (238) | | 476 | | (5) | |
| – fair value gains/(losses) | 877 | | 255 | | (412) | |
| – fair value losses/(gains) reclassified to the income statement | (1,195) | | 364 | | 405 | |
| – income taxes and other movements | 80 | | (143) | | 2 | |
| Share of other comprehensive income/(expense) of associates and joint ventures | 104 | | (115) | | 42 | |
| – share for the period | 104 | | (115) | | 42 | |
| | | |
| | | |
| Exchange differences | (449) | | (4,552) | | 9,407 | |
| | | |
| | | |
| | | |
| Items that will not be reclassified subsequently to profit or loss: | | | |
| Remeasurement of defined benefit asset/(liability) | (747) | | 1,182 | | (348) | |
| – before income taxes | (775) | | 1,703 | | (480) | |
| – income taxes | 28 | | (521) | | 132 | |
| Changes in fair value of financial liabilities designated at fair value upon initial recognition arising from changes in own credit risk | 155 | | 2,354 | | (2,187) | |
| – before income taxes | (2) | | 2,936 | | (2,746) | |
| – income taxes | 157 | | (582) | | 559 | |
| Equity instruments designated at fair value through other comprehensive income | (348) | | (123) | | 335 | |
| – fair value gains/(losses) | (345) | | (122) | | 334 | |
| – income taxes | (3) | | (1) | | 1 | |
| Effects of hyperinflation | 166 | | 72 | | 121 | |
| Other comprehensive income/(expense) for the period, net of tax | (2,725) | | 1,041 | | 7,368 | |
| Total comprehensive income for the period | 5,697 | | 4,166 | | 10,342 | |
| Attributable to: | | | |
| – ordinary shareholders of the parent company | 4,612 | | 3,043 | | 9,103 | |
| – preference shareholders of the parent company | 7 | | 45 | | 45 | |
| – other equity holders | 666 | | 617 | | 624 | |
| – non-controlling interests | 412 | | 461 | | 570 | |
| Total comprehensive income for the period | 5,697 | | 4,166 | | 10,342 | |
Interim condensed financial statements (unaudited)
| | | | | | | | | | | |
| Consolidated balance sheet |
| | At |
| | 30 Jun | 31 Dec |
| | 2021 | 2020 |
| Notes* | $m | $m |
| Assets | | | |
| Cash and balances at central banks | | 393,559 | | 304,481 | |
| Items in the course of collection from other banks | | 9,406 | | 4,094 | |
| Hong Kong Government certificates of indebtedness | | 41,880 | | 40,420 | |
| Trading assets | | 260,250 | | 231,990 | |
| Financial assets designated and otherwise mandatorily measured at fair value through profit or loss | | 49,120 | | 45,553 | |
| Derivatives | 8 | 209,516 | | 307,726 | |
| Loans and advances to banks | | 86,886 | | 81,616 | |
| Loans and advances to customers | | 1,059,511 | | 1,037,987 | |
| Reverse repurchase agreements – non-trading | | 201,714 | | 230,628 | |
| Financial investments | 9 | 434,576 | | 490,693 | |
| Prepayments, accrued income and other assets | 15 | 175,155 | | 156,412 | |
| Current tax assets | | 405 | | 954 | |
| Interests in associates and joint ventures | 10 | 28,709 | | 26,684 | |
| Goodwill and intangible assets | | 20,703 | | 20,443 | |
| Deferred tax assets | | 4,615 | | 4,483 | |
| Total assets | | 2,976,005 | | 2,984,164 | |
| Liabilities and equity | | | |
| Liabilities | | | |
| Hong Kong currency notes in circulation | | 41,880 | | 40,420 | |
| Deposits by banks | | 100,448 | | 82,080 | |
| Customer accounts | | 1,669,091 | | 1,642,780 | |
| Repurchase agreements – non-trading | | 112,798 | | 111,901 | |
| Items in the course of transmission to other banks | | 15,100 | | 4,343 | |
| Trading liabilities | | 89,637 | | 75,266 | |
| Financial liabilities designated at fair value | | 151,686 | | 157,439 | |
| Derivatives | 8 | 200,156 | | 303,001 | |
| Debt securities in issue | | 84,218 | | 95,492 | |
| Accruals, deferred income and other liabilities | 15 | 164,800 | | 128,624 | |
| Current tax liabilities | | 929 | | 690 | |
| Liabilities under insurance contracts | | 110,572 | | 107,191 | |
| Provisions | 11 | 2,814 | | 3,678 | |
| Deferred tax liabilities | | 4,338 | | 4,313 | |
| Subordinated liabilities | | 20,774 | | 21,951 | |
| Total liabilities | | 2,769,241 | | 2,779,169 | |
| Equity | | | |
| Called up share capital | | 10,376 | | 10,347 | |
| Share premium account | | 14,600 | | 14,277 | |
| Other equity instruments | | 22,414 | | 22,414 | |
| Other reserves | | 6,509 | | 8,833 | |
| Retained earnings | | 144,319 | | 140,572 | |
| Total shareholders’ equity | | 198,218 | | 196,443 | |
| Non-controlling interests | | 8,546 | | 8,552 | |
| Total equity | | 206,764 | | 204,995 | |
| Total liabilities and equity | | 2,976,005 | | 2,984,164 | |
* For Notes on the interim condensed financial statements, see page 104.
| | | | | | | | | | | |
| Consolidated statement of cash flows |
| Half-year to |
| 30 Jun | 30 Jun | 31 Dec |
| 2021 | 2020 | 2020 |
| $m | $m | $m |
| Profit before tax | 10,839 | | 4,318 | | 4,459 | |
| Adjustments for non-cash items: | | | |
| Depreciation, amortisation and impairment | 1,802 | | 3,095 | | 2,146 | |
| Net gain from investing activities | (485) | | (405) | | (136) | |
| Share of profits in associates and joint ventures | (1,656) | | (958) | | (639) | |
| | | |
| Change in expected credit losses gross of recoveries and other credit impairment charges | (484) | | 6,875 | | 2,221 | |
| Provisions including pensions | 301 | | 277 | | 887 | |
| Share-based payment expense | 254 | | 195 | | 238 | |
| Other non-cash items included in profit before tax | 205 | | (718) | | (188) | |
| Change in operating assets | (3,811) | | 11,185 | | (23,788) | |
| Change in operating liabilities | 49,015 | | 134,734 | | 68,164 | |
Elimination of exchange differences1 | 5,212 | | 3,775 | | (29,524) | |
| Dividends received from associates | 10 | | 120 | | 641 | |
| Contributions paid to defined benefit plans | (342) | | (335) | | (160) | |
| Tax paid | (997) | | (2,373) | | (1,886) | |
| Net cash from operating activities | 59,863 | | 159,785 | | 22,435 | |
| Purchase of financial investments | (263,198) | | (271,830) | | (224,839) | |
| Proceeds from the sale and maturity of financial investments | 298,596 | | 225,733 | | 251,257 | |
| Net cash flows from the purchase and sale of property, plant and equipment | (375) | | (447) | | (999) | |
| Net cash flows from purchase of customer and loan portfolios | 1,063 | | 244 | | 1,118 | |
| Net investment in intangible assets | (1,011) | | (957) | | (1,107) | |
| Net cash flow on (purchase)/disposal of subsidiaries, businesses, associates and joint ventures | (84) | | (409) | | (194) | |
| Net cash from investing activities | 34,991 | | (47,666) | | 25,236 | |
| Issue of ordinary share capital and other equity instruments | 1,996 | | 0 | | 1,497 | |
| | | |
| Net sales/(purchases) of own shares for market-making and investment purposes | 1 | | (48) | | (133) | |
| | | |
| Redemption of preference shares and other equity instruments | (3,450) | | (398) | | 0 | |
| | | |
| Subordinated loan capital repaid | (852) | | (1,538) | | (2,000) | |
| Dividends paid to shareholders of the parent company and non-controlling interests | (4,121) | | (1,204) | | (819) | |
| Net cash from financing activities | (6,426) | | (3,188) | | (1,455) | |
| Net increase/(decrease) in cash and cash equivalents | 88,428 | | 108,931 | | 46,216 | |
| Cash and cash equivalents at the beginning of the period | 468,323 | | 293,742 | | 395,218 | |
| Exchange differences in respect of cash and cash equivalents | (4,818) | | (7,455) | | 26,889 | |
| Cash and cash equivalents at the end of the period | 551,933 | | 395,218 | | 468,323 | |
Interest received was $19,761m (1H20: $25,159m; 2H20: $20,419m), interest paid was $6,552m (1H20: $10,573m; 2H20: $7,167m) and dividends received (excluding dividends received from associates, which are presented separately above) were $801m (1H20: $447m; 2H20: $711m).
1 Adjustments to bring changes between opening and closing balance sheet amounts to average rates. This is not done on a line-by-line basis, as details cannot be determined without unreasonable expense.
Interim condensed financial statements (unaudited)
| | | | | | | | | | | | | | | | | | | | | | | | | | | | | | | | | |
| Consolidated statement of changes in equity |
|
| | | | | Other reserves | | | |
| Called up share
capital
and share premium | | Other
equity
instru-ments | Retained
earnings |
Financial assets at FVOCI reserve | Cash
flow
hedging
reserve | Foreign
exchange
reserve | Merger and other
reserves | Total share-holders’ equity | Non-
controlling
interests | Total equity |
| $m | | $m | $m | $m | $m | $m | $m | $m | $m | $m |
| | | | | | | | | | | |
| | | | | | | | | | | |
| At 1 Jan 2021 | 24,624 | | | 22,414 | | 140,572 | | 1,816 | | 457 | | (20,375) | | 26,935 | | 196,443 | | 8,552 | | 204,995 | |
| Profit for the period | — | | | — | | 7,949 | | — | | — | | — | | — | | 7,949 | | 473 | | 8,422 | |
| Other comprehensive income (net of tax) | — | | | — | | (337) | | (1,629) | | (234) | | (464) | | — | | (2,664) | | (61) | | (2,725) | |
| – debt instruments at fair value through other comprehensive income | — | | | — | | — | | (1,351) | | — | | — | | — | | (1,351) | | (17) | | (1,368) | |
| – equity instruments designated at fair value through other comprehensive income | — | | | — | | — | | (278) | | — | | — | | — | | (278) | | (70) | | (348) | |
| – cash flow hedges | — | | | — | | — | | — | | (234) | | — | | — | | (234) | | (4) | | (238) | |
| – changes in fair value of financial liabilities designated at fair value upon initial recognition arising from changes in own credit risk | — | | | — | | 155 | | — | | — | | — | | — | | 155 | | — | | 155 | |
| – remeasurement of defined benefit asset/liability | — | | | — | | (762) | | — | | — | | — | | — | | (762) | | 15 | | (747) | |
| – share of other comprehensive income of associates and joint ventures | — | | | — | | 104 | | — | | — | | — | | — | | 104 | | — | | 104 | |
| | | | | | | | | | | |
| | | | | | | | | | | |
| – effects of hyperinflation | — | | | — | | 166 | | — | | — | | — | | — | | 166 | | — | | 166 | |
| – exchange differences | — | | | — | | — | | — | | — | | (464) | | — | | (464) | | 15 | | (449) | |
| Total comprehensive income for the period | — | | | — | | 7,612 | | (1,629) | | (234) | | (464) | | — | | 5,285 | | 412 | | 5,697 | |
| Shares issued under employee remuneration and share plans | 352 | | | — | | (335) | | — | | — | | — | | — | | 17 | | — | | 17 | |
| | | | | | | | | | | |
| | | | | | | | | | | |
Capital securities issued1 | — | | | 2,000 | | (4) | | — | | — | | — | | — | | 1,996 | | — | | 1,996 | |
| Dividends to shareholders | — | | | — | | (3,732) | | — | | — | | — | | — | | (3,732) | | (389) | | (4,121) | |
Redemption of securities2 | — | | | (2,000) | | — | | — | | — | | — | | — | | (2,000) | | — | | (2,000) | |
| Cost of share-based payment arrangements | — | | | — | | 254 | | — | | — | | — | | — | | 254 | | — | | 254 | |
| | | | | | | | | | | |
| | | | | | | | | | | |
| Other movements | — | | | — | | (48) | | 3 | | — | | — | | — | | (45) | | (29) | | (74) | |
| At 30 Jun 2021 | 24,976 | | | 22,414 | | 144,319 | | 190 | | 223 | | (20,839) | | 26,935 | | 198,218 | | 8,546 | | 206,764 | |
| | | | | | | | | | | |
|
| | | | | | | | |
| | | | | | | | | | | |
| | | | | | | | | | | |
| At 1 Jan 2020 | 24,278 | | | 20,871 | | 136,679 | | (108) | | (2) | | (25,133) | | 27,370 | | 183,955 | | 8,713 | | 192,668 | |
| Profit for the period | — | | | — | | 2,639 | | — | | — | | — | | — | | 2,639 | | 486 | | 3,125 | |
| Other comprehensive income (net of tax) | — | | | — | | 3,506 | | 1,654 | | 465 | | (4,559) | | — | | 1,066 | | (25) | | 1,041 | |
| – debt instruments at fair value through other comprehensive income | — | | | — | | — | | 1,735 | | — | | — | | — | | 1,735 | | 12 | | 1,747 | |
| – equity instruments designated at fair value through other comprehensive income | — | | | — | | — | | (81) | | — | | — | | — | | (81) | | (42) | | (123) | |
| – cash flow hedges | — | | | — | | — | | — | | 465 | | — | | — | | 465 | | 11 | | 476 | |
| – changes in fair value of financial liabilities designated at fair value upon initial recognition arising from changes in own credit risk | — | | | — | | 2,354 | | — | | — | | — | | — | | 2,354 | | — | | 2,354 | |
| – remeasurement of defined benefit asset/liability | — | | | — | | 1,195 | | — | | — | | — | | — | | 1,195 | | (13) | | 1,182 | |
| – share of other comprehensive income of associates and joint ventures | — | | | — | | (115) | | — | | — | | — | | — | | (115) | | — | | (115) | |
| | | | | | | | | | | |
| – effects of hyperinflation | — | | | — | | 72 | | — | | — | | — | | — | | 72 | | — | | 72 | |
| – exchange differences | — | | | — | | — | | — | | — | | (4,559) | | — | | (4,559) | | 7 | | (4,552) | |
| Total comprehensive income for the period | — | | | — | | 6,145 | | 1,654 | | 465 | | (4,559) | | — | | 3,705 | | 461 | | 4,166 | |
| Shares issued under employee remuneration and share plans | 336 | | | — | | (329) | | — | | — | | — | | — | | 7 | | — | | 7 | |
| | | | | | | | | | | |
| | | | | | | | | | | |
| | | | | | | | | | | |
| Dividends to shareholders | — | | | — | | (662) | | — | | — | | — | | — | | (662) | | (542) | | (1,204) | |
| | | | | | | | | | | |
| Cost of share-based payment arrangements | — | | | — | | 195 | | — | | — | | — | | — | | 195 | | — | | 195 | |
| | | | | | | | | | | |
| Other movements | — | | | 43 | | (219) | | 12 | | — | | — | | — | | (164) | | (447) | | (611) | |
| At 30 Jun 2020 | 24,614 | | | 20,914 | | 141,809 | | 1,558 | | 463 | | (29,692) | | 27,370 | | 187,036 | | 8,185 | | 195,221 | |
| | | | | | | | | | | | | | | | | | | | | | | | | | | | | | | | | |
| Consolidated statement of changes in equity (continued) |
| | | | | Other reserves | | | |
| Called up
share capital
and share premium | | Other
equity
instru-
ments | Retained
earnings | Financial assets at FVOCI reserve | Cash
flow
hedging
reserve | Foreign exchange reserve | Merger and other reserves | Total
share-
holders’
equity | Non-
controlling
interests | Total
equity |
| $m | | $m | $m | $m | $m | $m | $m | $m | $m | $m |
| At 1 Jul 2020 | 24,614 | | | 20,914 | | 141,809 | | 1,558 | | 463 | | (29,692) | | 27,370 | | 187,036 | | 8,185 | | 195,221 | |
| Profit for the period | — | | | — | | 2,590 | | — | | — | | — | | — | | 2,590 | | 384 | | 2,974 | |
Other comprehensive income
(net of tax) | — | | | — | | (2,388) | | 259 | | (6) | | 9,317 | | — | | 7,182 | | 186 | | 7,368 | |
| – debt instruments at fair value through other comprehensive income | — | | | — | | — | | 11 | | — | | — | | — | | 11 | | (8) | | 3 | |
| – equity instruments designated at fair value through other comprehensive income | — | | | — | | — | | 248 | | — | | — | | — | | 248 | | 87 | | 335 | |
| – cash flow hedges | — | | | — | | — | | — | | (6) | | — | | — | | (6) | | 1 | | (5) | |
| – changes in fair value of financial liabilities designated at fair value upon initial recognition arising from changes in own credit risk | — | | | — | | (2,187) | | — | | — | | — | | — | | (2,187) | | — | | (2,187) | |
| – remeasurement of defined benefit asset/liability | — | | | — | | (364) | | — | | — | | — | | — | | (364) | | 16 | | (348) | |
| – share of other comprehensive income of associates and joint ventures | — | | | — | | 42 | | — | | — | | — | | — | | 42 | | — | | 42 | |
| | | | | | | | | | | |
| – effects of hyperinflation | — | | | — | | 121 | | — | | — | | — | | — | | 121 | | — | | 121 | |
| – exchange differences | — | | | — | | — | | — | | — | | 9,317 | | — | | 9,317 | | 90 | | 9,407 | |
| Total comprehensive income for the period | — | | | — | | 202 | | 259 | | (6) | | 9,317 | | — | | 9,772 | | 570 | | 10,342 | |
| Shares issued under employee remuneration and share plans | 10 | | | — | | (10) | | — | | — | | — | | — | | 0 | | — | | 0 | |
| | | | | | | | | | | |
| | | | | | | | | | | |
Capital securities issued1 | — | | | 1,500 | | (3) | | — | | — | | — | | — | | 1,497 | | — | | 1,497 | |
| Dividends to shareholders | — | | | — | | (669) | | — | | — | | — | | — | | (669) | | (150) | | (819) | |
Redemption of securities2 | — | | | — | | (1,450) | | — | | — | | — | | — | | (1,450) | | — | | (1,450) | |
Transfers3 | — | | | — | | 435 | | — | | — | | — | | (435) | | 0 | | — | | 0 | |
| Cost of share-based payment arrangements | — | | | — | | 239 | | — | | — | | — | | — | | 239 | | — | | 239 | |
| | | | | | | | | | | |
| Other movements | — | | | — | | 19 | | (1) | | — | | — | | — | | 18 | | (53) | | (35) | |
| At 31 Dec 2020 | 24,624 | | | 22,414 | | 140,572 | | 1,816 | | 457 | | (20,375) | | 26,935 | | 196,443 | | 8,552 | | 204,995 | |
1 During 2021, HSBC Holdings issued $2,000m of Additional Tier1 instruments on which there were $4m of external issue costs. In 2020, HSBC Holdings issued $1,500m of perpetual subordinated contingent convertible securities.
2 During 2021, HSBC Holdings redeemed $2,000m 6.875% perpetual subordinated contingent convertible securities. In 2020, HSBC Holdings called and later redeemed $1,450m 6.20% non-cumulative US dollar preference shares.
3 Permitted transfers from the merger reserve to retained earnings were made when the investment in HSBC Overseas Holdings (UK) Limited was previously impaired. In 2020, an additional impairment of $435m was recognised and a permitted transfer of this amount was made from the merger reserve to retained earnings.
Notes on the interim condensed financial statements (unaudited)
| | | | | | | | | | | | | | | | | | | | |
| Notes on the interim condensed financial statements |
| | Page | | | | Page |
| 1 | Basis of preparation and significant accounting policies | | | 10 | Interests in associates and joint ventures | |
| 2 | Net fee income | | | 11 | Provisions | |
| 3 | Dividends | | | 12 | Contingent liabilities, contractual commitments and guarantees | |
| 4 | Earnings per share | | | 13 | Legal proceedings and regulatory matters | |
| 5 | Segmental analysis | | | 14 | Transactions with related parties | |
| 6 | Fair values of financial instruments carried at fair value | | | 15 | Business disposals | |
| 7 | Fair values of financial instruments not carried at fair value | | | 16 | Events after the balance sheet date | |
| 8 | Derivatives | | | 17 | Interim Report 2021 and statutory accounts | |
| 9 | Financial investments | | | | | |
| | | | | |
| 1 | Basis of preparation and significant accounting policies |
(a) Compliance with International Financial Reporting Standards
Our interim condensed financial statements have been prepared on the basis of the policies set out in the 2020 annual financial statements and in accordance with UK adopted IAS 34 ‘Interim Financial Reporting’, IAS 34 ‘Interim Financial Reporting’ as issued by the International Accounting Standards Board (‘IASB’), IAS 34 ‘Interim Financial Reporting’ as adopted by the EU and the Disclosure Guidance and Transparency Rules sourcebook of the UK’s Financial Conduct Authority. Therefore, they include an explanation of events and transactions that are significant to an understanding of the changes in HSBC’s financial position and performance since the end of 2020. These financial statements should be read in conjunction with the Annual Report and Accounts 2020, which were prepared in accordance with international accounting standards in conformity with the requirements of the Companies Act 2006 and international financial reporting standards adopted pursuant to Regulation (EC) No 1606/2002 as it applies in the European Union, and International Financial Reporting Standards (‘IFRSs’) as issued by the IASB, including interpretations issued by the IFRS Interpretations Committee.
At 30 June 2021, there were no unendorsed standards effective for the half-year to 30 June 2021 affecting these financial statements, and there was no difference between IFRSs adopted by the UK, IFRSs as adopted by the EU and IFRSs issued by the IASB in terms of their application to HSBC.
The financial statements for HSBC for the year ended 31 December 2021 will be prepared in accordance with IFRS as adopted by the UK, international financial reporting standards adopted by the EU and IFRSs as issued by the IASB, including interpretations issued by the IFRS Interpretations Committee.
Standards applied during the half-year to 30 June 2021
There were no new standards or amendments to standards that had an effect on these interim condensed financial statements.
(b) Use of estimates and judgements
Management believes that our critical accounting estimates and judgements are those that relate to impairment of amortised cost and FVOCI debt financial assets, the valuation of financial instruments, deferred tax assets, provisions for liabilities, defined benefit obligations, interests in associates, impairment of non-financial assets and post-employment benefits. There were no changes in the current period to the critical accounting estimates and judgements applied in 2020, which are stated on pages 77 and 289 of the Annual Report and Accounts 2020.
(c) Composition of the Group
There were no material changes in the composition of the Group in the half-year to 30 June 2021. For further details of future business disposals, see Note 15 ‘Business disposals’.
(d) Future accounting developments
IFRS 17 ‘Insurance Contracts’ was issued in May 2017, with amendments to the standard issued in June 2020. It has not been adopted for use in the UK or in the EU. The standard sets out the requirements that an entity should apply in accounting for insurance contracts it issues and reinsurance contracts it holds. Following the amendments, IFRS 17 is effective from 1 January 2023. The Group is in the process of implementing IFRS 17. Industry practice and interpretation of the standard are still developing. Therefore, the likely impact of its implementation remains uncertain. However, compared with the Group’s current accounting policy for insurance, there will be no PVIF asset recognised; rather the estimated future profit will be included in the measurement of the insurance contract liability as the contractual service margin and gradually recognised in revenue as services are provided over the duration of the insurance contract.
(e) Going concern
The financial statements are prepared on a going concern basis, as the Directors are satisfied that the Group and parent company have the resources to continue in business for the foreseeable future. In making this assessment, the Directors have considered a wide range of information relating to present and future conditions, including future projections of profitability, cash flows, capital requirements and capital resources. These considerations include stressed scenarios that reflect the continuing uncertainty that the global Covid-19 pandemic has had on HSBC’s operations, as well as considering potential impacts from other top and emerging risks, and the related impact on profitability, capital and liquidity.
(f) Accounting policies
The accounting policies that we applied for these interim condensed consolidated financial statements are consistent with those described on pages 288 to 299 of the Annual Report and Accounts 2020, as are the methods of computation.
| | | | | | | | | | | | | | | | | |
|
| | | | | | | Half-year to |
| | | | | | | 30 Jun | 30 Jun | 31 Dec |
| | | | | | | 2021 | 2020 | 2020 |
| | | | | | | | | |
| | | | | | | $m | $m | $m |
| Net fee income by product | | | | | | | | | |
| Funds under management | | | | | | | 1,304 | | 1,113 | | 1,176 | |
| Cards | | | | | | | 1,035 | | 954 | | 995 | |
| Broking income | | | | | | | 895 | | 743 | | 796 | |
| Credit facilities | | | | | | | 827 | | 726 | | 733 | |
| Account services | | | | | | | 714 | | 649 | | 644 | |
| Unit trusts | | | | | | | 603 | | 455 | | 444 | |
| Underwriting | | | | | | | 576 | | 552 | | 463 | |
| Global custody | | | | | | | 500 | | 446 | | 488 | |
| Remittances | | | | | | | 361 | | 325 | | 352 | |
| Imports/exports | | | | | | | 300 | | 288 | | 289 | |
| Insurance agency commission | | | | | | | 176 | | 171 | | 154 | |
| Other | | | | | | | 1,167 | | 1,058 | | 1,037 | |
| Fee income | | | | | | | 8,458 | | 7,480 | | 7,571 | |
| Less: fee expense | | | | | | | (1,784) | | (1,554) | | (1,623) | |
| Net fee income | | | | | | | 6,674 | | 5,926 | | 5,948 | |
| Net fee income by global business | | | | | | | | | |
| Wealth and Personal Banking | | | | | | | 3,042 | | 2,691 | | 2,717 | |
| Commercial Banking | | | | | | | 1,786 | | 1,630 | | 1,595 | |
| Global Banking and Markets | | | | | | | 1,857 | | 1,608 | | 1,659 | |
| | | | | | | | | |
| Corporate Centre | | | | | | | (11) | | (3) | | (23) | |
On 2 August 2021, the Directors approved an interim dividend for the 2021 half-year of $0.07 per ordinary share in respect of the financial year ending 31 December 2021. This distribution amounts to approximately $1,430m and will be payable on 30 September 2021. No liability is recognised in the financial statements in respect of these dividends.
| | | | | | | | | | | | | | | | | | | | | | | | | | | | | |
| Dividends paid to shareholders of HSBC Holdings plc |
| Half-year to |
| 30 Jun 2021 | 30 Jun 2020 | 31 Dec 2020 |
| Per share | Total | Settled in scrip | Per share | Total | Settled in scrip | Per share | Total | Settled in scrip |
| $ | $m | $m | $ | $m | $m | $ | $m | $m |
| Dividends paid on ordinary shares | | | | | | | | | |
| In respect of previous year: | | | | | | | | | |
| – fourth interim dividend | 0.15 | | 3,059 | | 0 | | 0 | | 0 | | 0 | | 0 | | 0 | | 0 | |
| In respect of current year: | | | | | | | | | |
| – first interim dividend | 0 | | 0 | | 0 | | 0 | | 0 | | 0 | | 0 | | 0 | | 0 | |
| – second interim dividend | 0 | | 0 | | 0 | | 0 | | 0 | | 0 | | 0 | | 0 | | 0 | |
| – third interim dividend | 0 | | 0 | | 0 | | 0 | | 0 | | 0 | | 0 | | 0 | | 0 | |
| Total | 0.15 | | 3,059 | | 0 | | 0 | | 0 | | 0 | | 0 | | 0 | | 0 | |
Total dividends on preference shares classified as equity (paid quarterly)1 | 4.99 | | 7 | | | 31.00 | | 45 | | | 31.00 | | 45 | | |
| Total coupons on capital securities classified as equity | | 666 | | | | 617 | | | | 624 | | |
| Dividends to shareholders | | 3,732 | | | | 662 | | | | 669 | | |
1 HSBC Holdings called $1,450m 6.20% non-cumulative US dollar preference shares on 10 December 2020. The security was redeemed and cancelled on 13 January 2021.
Notes on the interim condensed financial statements (unaudited)
| | | | | | | | | | | | | | | | | | |
| Total coupons on capital securities classified as equity |
| | | | Half-year to |
| | | | 30 Jun | 30 Jun | 31 Dec |
| | | | 2021 | 2020 | 2020 |
| | | | | | |
| | First call date | Per security | $m | $m | $m |
Perpetual subordinated contingent convertible securities1 | | | | | | |
– $2,000m issued at 6.875%2 | | Jun 2021 | $68.750 | 69 | | 69 | | 69 | |
| – $2,250m issued at 6.375% | | Sep 2024 | $63.750 | 72 | | 72 | | 71 | |
| – $2,450m issued at 6.375% | | Mar 2025 | $63.750 | 78 | | 78 | | 78 | |
| – $3,000m issued at 6.000% | | May 2027 | $60.000 | 90 | | 90 | | 90 | |
| – $2,350m issued at 6.250% | | Mar 2023 | $62.500 | 73 | | 73 | | 74 | |
| – $1,800m issued at 6.500% | | Mar 2028 | $65.000 | 59 | | 59 | | 58 | |
– $1,500m issued at 4.600%3 | | Dec 2030 | $46.000 | 35 | | 0 | | 0 | |
– $1,000m issued at 4.000%4 | | Mar 2026 | $40.000 | 0 | | 0 | | 0 | |
– $1,000m issued at 4.700%5 | | Mar 2031 | $47.000 | 0 | | 0 | | 0 | |
| – €1,500m issued at 5.250% | | Sep 2022 | €52.500 | 47 | | 44 | | 46 | |
| – €1,000m issued at 6.000% | | Sep 2023 | €60.000 | 34 | | 33 | | 34 | |
| – €1,250m issued at 4.750% | | July 2029 | €47.500 | 36 | | 33 | | 34 | |
| – £1,000m issued at 5.875% | | Sep 2026 | £58.750 | 41 | | 36 | | 38 | |
| – SGD1,000m issued at 4.700% | | Jun 2022 | SGD47.000 | 18 | | 17 | | 18 | |
| – SGD750m issued at 5.000% | | Sep 2023 | SGD50.000 | 14 | | 13 | | 14 | |
| Total | | | | 666 | | 617 | | 624 | |
1Discretionary coupons are paid twice a year on the perpetual subordinated contingent convertible securities, in denominations of 1,000 per security in each security’s issuance currency.
2This security was called by HSBC Holdings on 15 April 2021 and was redeemed and cancelled on 1 June 2021.
3This security was issued by HSBC Holdings on 17 December 2020. The first call date commences six calendar months prior to the reset date of
17 June 2031.
4This security was issued by HSBC Holdings on 9 March 2021. The first call date commences six calendar months prior to the reset date of 9 September 2026.
5This security was issued by HSBC Holdings on 9 March 2021. The first call date commences six calendar months prior to the reset date of 9 September 2031.
Basic earnings per ordinary share is calculated by dividing the profit attributable to ordinary shareholders of the parent company by the weighted average number of ordinary shares outstanding, excluding own shares held. Diluted earnings per ordinary share is calculated by dividing the basic earnings, which require no adjustment for the effects of dilutive potential ordinary shares, by the weighted average number of ordinary shares outstanding, excluding own shares held, plus the weighted average number of ordinary shares that would be issued on conversion of dilutive potential ordinary shares.
| | | | | | | | | | | |
| Profit attributable to ordinary shareholders of the parent company |
| Half-year to |
| 30 Jun | 30 Jun | 31 Dec |
| 2021 | 2020 | 2020 |
| $m | $m | $m |
| Profit attributable to shareholders of the parent company | 7,949 | | 2,639 | | 2,590 | |
| Dividend payable on preference shares classified as equity | (7) | | (45) | | (45) | |
| Coupon payable on capital securities classified as equity | (666) | | (617) | | (624) | |
| Profit attributable to ordinary shareholders of the parent company | 7,276 | | 1,977 | | 1,921 | |
| | | | | | | | | | | | | | | | | | | | | | | | | | | | | | |
| Basic and diluted earnings per share |
| | Half-year to |
| | 30 Jun 2021 | 30 Jun 2020 | 31 Dec 2020 |
| | Profit | Number
of shares | Amount per share | Profit | Number
of shares | Amount per share | Profit | Number
of shares | Amount per share |
| | $m | (millions) | $ | $m | (millions) | $ | $m | (millions) | $ |
Basic1 | | 7,276 | | 20,211 | | 0.36 | | 1,977 | | 20,162 | | 0.10 | | 1,921 | | 20,176 | | 0.10 | |
| Effect of dilutive potential ordinary shares | | | 97 | | | | 58 | | | | 63 | | |
Diluted1 | | 7,276 | | 20,308 | | 0.36 | | 1,977 | | 20,220 | | 0.10 | | 1,921 | | 20,239 | | 0.09 | |
1Weighted average number of ordinary shares outstanding (basic) or assuming dilution (diluted).
The Group Chief Executive, supported by the rest of the Group Executive Committee (‘GEC’), is considered the Chief Operating Decision Maker (‘CODM’) for the purposes of identifying the Group’s reportable segments. Global business results are assessed by the CODM on the basis of adjusted performance that removes the effects of significant items and currency translation from reported results. Therefore, we present these results on an adjusted basis as required by IFRSs. The 2020 adjusted performance information is presented on a constant currency basis. The income statements for the half-years to 30 June 2020 and 31 December 2020 are converted at the average rates of exchange for 2021, and the balance sheets at 30 June 2020 and 31 December 2020 at the prevailing rates of exchange on 30 June 2021.
Our operations are closely integrated and, accordingly, the presentation of data includes internal allocations of certain items of income and expense. These allocations include the costs of certain support services and global functions to the extent that they can be meaningfully attributed to global businesses. While such allocations have been made on a systematic and consistent basis, they necessarily involve a degree of subjectivity. Costs that are not allocated to global businesses are included in Corporate Centre.
Where relevant, income and expense amounts presented include the results of inter-segment funding along with inter-company and inter-business line transactions. All such transactions are undertaken on arm’s length terms. The intra-Group elimination items for the global businesses are presented in Corporate Centre.
Our global businesses
We provide a comprehensive range of banking and related financial services to our customers in our 3 global businesses. The products and services offered to customers are organised by these global businesses:
•Wealth and Personal Banking (‘WPB’) provides a full range of retail banking and wealth products to our customers from personal banking to ultra high net worth individuals. Typically, customer offerings include retail banking products, such as current and savings accounts, mortgages and personal loans, credit cards, debit cards and local and international payment services. We also provide wealth management services, including insurance and investment products, global asset management services, investment management and Private Wealth Solutions for customers with more sophisticated and international requirements.
•Commercial Banking (‘CMB’) offers a broad range of products and services to serve the needs of our commercial customers, including small and medium-sized enterprises, mid-market enterprises and corporates. These include credit and lending, international trade and receivables finance, treasury management and liquidity solutions (payments and cash management and commercial cards), commercial insurance and investments. CMB also offers customers access to products and services offered by other global businesses, such as Global Banking and Markets, which include foreign exchange products, raising capital on debt and equity markets and advisory services.
•Global Banking and Markets (‘GBM’) provides tailored financial solutions to major government, corporate and institutional clients and private investors worldwide. The client-focused business lines deliver a full range of banking capabilities, including financing, advisory and transaction services, a markets business that provides services in credit, rates, foreign exchange, equities, money markets and securities services, and principal investment activities.
| | | | | | | | | | | | | | | | | | |
| HSBC adjusted profit before tax and balance sheet data |
| | Half-year to 30 Jun 2021 |
| | Wealth and Personal Banking | Commercial
Banking | Global
Banking and
Markets | Corporate Centre | Total |
| | $m | $m | $m | $m | $m |
| | | | | | |
| | | | | | |
| | | | | | |
| | | | | | |
Net operating income/(expense) before change in expected credit losses and other credit impairment charges1 | | 11,401 | | 6,651 | | 7,878 | | (133) | | 25,797 | |
| – external | | 11,168 | | 6,626 | | 8,631 | | (628) | | 25,797 | |
| – inter-segment | | 233 | | 25 | | (753) | | 495 | | 0 | |
| of which: net interest income/(expense) | | 7,067 | | 4,366 | | 2,024 | | (378) | | 13,079 | |
| Change in expected credit losses and other credit impairment (charges)/recoveries | | 52 | | 249 | | 414 | | 4 | | 719 | |
| Net operating income | | 11,453 | | 6,900 | | 8,292 | | (129) | | 26,516 | |
| Total operating expenses | | (7,600) | | (3,525) | | (4,985) | | (112) | | (16,222) | |
| | | | | | |
| Operating profit | | 3,853 | | 3,375 | | 3,307 | | (241) | | 10,294 | |
| Share of profit in associates and joint ventures | | 11 | | 1 | | 0 | | 1,644 | | 1,656 | |
| Adjusted profit before tax | | 3,864 | | 3,376 | | 3,307 | | 1,403 | | 11,950 | |
| | % | % | % | % | % |
| Share of HSBC’s adjusted profit before tax | | 32.3 | | 28.3 | | 27.7 | | 11.7 | | 100.0 | |
| Adjusted cost efficiency ratio | | 66.7 | | 53.0 | | 63.3 | | (84.2) | | 62.9 | |
| | | | | | |
| Adjusted balance sheet data | | $m | $m | $m | $m | $m |
| Loans and advances to customers (net) | | 491,320 | | 350,945 | | 216,098 | | 1,148 | | 1,059,511 | |
| Interests in associates and joint ventures | | 478 | | 15 | | 128 | | 28,088 | | 28,709 | |
| Total external assets | | 912,479 | | 624,042 | | 1,258,694 | | 180,790 | | 2,976,005 | |
| Customer accounts | | 841,257 | | 485,689 | | 341,242 | | 903 | | 1,669,091 | |
| | | | | | |
Notes on the interim condensed financial statements (unaudited)
| | | | | | | | | | | | | | | | | | | |
|
| HSBC adjusted profit before tax and balance sheet data (continued) |
| | Half-year to 30 Jun 2020 |
| | Wealth and Personal Banking | Commercial
Banking | Global
Banking and
Markets | Corporate Centre | | Total |
| | $m | $m | $m | $m | | $m |
| | | | | | | |
| | | | | | | |
| | | | | | | |
| | | | | | | |
Net operating income before change in expected credit losses and other credit impairment charges1 | | 11,694 | | 7,326 | | 8,574 | | 3 | | | 27,597 | |
| – external | | 10,071 | | 7,742 | | 10,511 | | (727) | | | 27,597 | |
| – inter-segment | | 1,623 | | (416) | | (1,937) | | 730 | | | 0 | |
| of which: net interest income/(expense) | | 8,331 | | 5,080 | | 2,435 | | (804) | | | 15,042 | |
| Change in expected credit losses and other credit impairment charges | | (2,328) | | (3,751) | | (1,195) | | (13) | | | (7,287) | |
| Net operating income/(expense) | | 9,366 | | 3,575 | | 7,379 | | (10) | | | 20,310 | |
| Total operating expenses | | (7,695) | | (3,457) | | (4,813) | | 260 | | | (15,705) | |
| Operating profit/(loss) | | 1,671 | | 118 | | 2,566 | | 250 | | | 4,605 | |
| Share of profit in associates and joint ventures | | (8) | | 0 | | 0 | | 1,057 | | | 1,049 | |
| Adjusted profit before tax | | 1,663 | | 118 | | 2,566 | | 1,307 | | | 5,654 | |
| | % | % | % | % | | % |
| Share of HSBC’s adjusted profit before tax | | 29.4 | | 2.1 | | 45.4 | | 23.1 | | | 100.0 | |
| Adjusted cost efficiency ratio | | 65.8 | | 47.2 | | 56.1 | | (8,666.7) | | | 56.9 | |
| | | | | | | |
| Adjusted balance sheet data | | $m | $m | $m | $m | | $m |
| Loans and advances to customers (net) | | 456,263 | | 362,094 | | 254,126 | | 1,365 | | | 1,073,848 | |
| Interests in associates and joint ventures | | 428 | | 15 | | 140 | | 25,659 | | | 26,242 | |
| Total external assets | | 856,599 | | 579,865 | | 1,472,925 | | 173,932 | | | 3,083,321 | |
| Customer accounts | | 810,137 | | 441,427 | | 357,082 | | 738 | | | 1,609,384 | |
| | | | | | | |
| | | | | | | | | | | | | | | | | | | |
|
| | Half-year to 31 Dec 2020 |
| | | | | | | |
| | | | | | | |
Net operating income/(expense) before change in expected credit losses and other credit impairment charges1 | | 11,019 | | 6,489 | | 7,323 | | (308) | | | 24,523 | |
| – external | | 10,534 | | 6,468 | | 8,257 | | (736) | | | 24,523 | |
| – inter-segment | | 485 | | 21 | | (934) | | 428 | | | 0 | |
| of which: net interest income/(expense) | | 7,231 | | 4,545 | | 2,184 | | (533) | | | 13,427 | |
| Change in expected credit losses and other credit impairment (charges)/recoveries | | (685) | | (1,265) | | (95) | | 14 | | | (2,031) | |
| Net operating income/(expense) | | 10,334 | | 5,224 | | 7,228 | | (294) | | | 22,492 | |
| Total operating expenses | | (7,871) | | (3,491) | | (4,916) | | (673) | | | (16,951) | |
| Operating profit/(loss) | | 2,463 | | 1,733 | | 2,312 | | (967) | | | 5,541 | |
| Share of profit in associates and joint ventures | | 15 | | (1) | | 0 | | 1,125 | | | 1,139 | |
| Adjusted profit before tax | | 2,478 | | 1,732 | | 2,312 | | 158 | | | 6,680 | |
| | % | % | % | % | | % |
| Share of HSBC’s adjusted profit before tax | | 37.1 | | 25.9 | | 34.6 | | 2.4 | | | 100.0 | |
| Adjusted cost efficiency ratio | | 71.4 | | 53.8 | | 67.1 | | (218.5) | | | 69.1 | |
| | | | | | | |
| Adjusted balance sheet data | | $m | $m | $m | $m | | $m |
| Loans and advances to customers (net) | | 469,218 | | 342,951 | | 223,395 | | 1,254 | | | 1,036,818 | |
| Interests in associates and joint ventures | | 446 | | 14 | | 141 | | 26,261 | | | 26,862 | |
| Total external assets | | 882,042 | | 570,369 | | 1,342,544 | | 186,633 | | | 2,981,588 | |
| Customer accounts | | 834,376 | | 470,686 | | 335,977 | | 609 | | | 1,641,648 | |
| | | | | | | |
1 Net operating income before change in expected credit losses and other credit impairment charges, also referred to as revenue.
Reported external net operating income is attributed to countries and territories on the basis of the location of the branch responsible for reporting the results or advancing the funds:
| | | | | | | | | | | | |
| | Half-year to |
| | 30 Jun 2021 | 30 Jun 2020 | 31 Dec 2020 |
| | $m | $m | $m |
Reported external net operating income by country/territory1 | | 25,551 | | 26,745 | | 23,684 | |
| – UK | | 5,610 | | 4,166 | | 4,997 | |
| – Hong Kong | | 7,476 | | 8,703 | | 7,080 | |
| – US | | 1,993 | | 2,435 | | 2,039 | |
| – France | | 1,228 | | 697 | | 1,056 | |
| – other countries | | 9,244 | | 10,744 | | 8,512 | |
| | | | |
1 Net operating income before change in expected credit losses and other credit impairment charges, also referred to as revenue.
| | | | | | | | | | | | | | | | | | | | | | | | | | | | | | | | | | | | |
| Adjusted results reconciliation |
| | Half-year to |
| | 30 Jun 2021 | 30 Jun 2020 | 31 Dec 2020 |
| | Adjusted | Significant items | Reported | Adjusted | Currency translation | Significant items | Reported | Adjusted | Currency translation | Significant items | Reported |
| | $m | $m | $m | $m | $m | $m | $m | $m | $m | $m | $m |
Revenue1 | | 25,797 | | (246) | | 25,551 | | 27,597 | | (1,117) | | 265 | | 26,745 | | 24,523 | | (630) | | (209) | | 23,684 | |
| ECL | | 719 | | 0 | | 719 | | (7,287) | | 429 | | 0 | | (6,858) | | (2,031) | | 72 | | 0 | | (1,959) | |
| Operating expenses | | (16,222) | | (865) | | (17,087) | | (15,705) | | 887 | | (1,709) | | (16,527) | | (16,951) | | 471 | | (1,425) | | (17,905) | |
| Share of profit in associates and joint ventures | | 1,656 | | 0 | | 1,656 | | 1,049 | | (91) | | 0 | | 958 | | 1,139 | | (38) | | (462) | | 639 | |
| Profit before tax | | 11,950 | | (1,111) | | 10,839 | | 5,654 | | 108 | | (1,444) | | 4,318 | | 6,680 | | (125) | | (2,096) | | 4,459 | |
1 Net operating income before change in expected credit losses and other credit impairment charges, also referred to as revenue.
| | | | | | | | | | | | | | | |
| Adjusted balance sheet reconciliation |
| | At |
| | 30 Jun 2021 | 31 Dec 2020 |
| | Reported and adjusted | Adjusted | Currency translation | Reported |
| | $m | $m | $m | $m |
| Loans and advances to customers (net) | | 1,059,511 | | 1,036,818 | | 1,169 | | 1,037,987 | |
| Interests in associates and joint ventures | | 28,709 | | 26,862 | | (178) | | 26,684 | |
| Total external assets | | 2,976,005 | | 2,981,588 | | 2,576 | | 2,984,164 | |
| Customer accounts | | 1,669,091 | | 1,641,648 | | 1,132 | | 1,642,780 | |
| | | | | | | | | | | | |
| Adjusted profit reconciliation |
| | Half-year to |
| | 30 Jun 2021 | 30 Jun 2020 | 31 Dec 2020 |
| | $m | $m | $m |
| | | | |
| Adjusted profit before tax | | 11,950 | | 5,654 | | 6,680 | |
| Significant items | | (1,111) | | (1,444) | | (2,096) | |
| – customer redress programmes (revenue) | | 18 | | 26 | | (47) | |
| – disposals, acquisitions and investment in new businesses (revenue) | | 0 | | (8) | | (2) | |
– fair value movements on financial instruments1 | | (194) | | 299 | | (35) | |
– restructuring and other related costs (revenue)2 | | (70) | | (49) | | (121) | |
| | | | |
| – customer redress programmes (operating expenses) | | (17) | | (50) | | 104 | |
| | | | |
| – impairment of goodwill and other intangible assets | | 0 | | (1,025) | | (65) | |
| – past service costs of guaranteed minimum pension benefits equalisation | | 0 | | 0 | | (17) | |
– restructuring and other related costs (operating expenses)3 | | (848) | | (505) | | (1,403) | |
| – settlements and provisions in connection with legal and other regulatory matters | | 0 | | (5) | | (7) | |
– impairment of goodwill (share of profit in associates and joint ventures)4 | | 0 | | 0 | | (462) | |
| – currency translation on significant items | | 0 | (127) | | (41) | |
| Currency translation | | 0 | 108 | | (125) | |
| Reported profit before tax | | 10,839 | | 4,318 | | 4,459 | |
1 Includes fair value movements on non-qualifying hedges and debt valuation adjustments on derivatives.
2 Comprises losses associated with the RWA reduction commitments and gains relating to the business update in February 2020.
3 Includes impairment of software intangible assets of $173m in the six months to 30 June 2020 and $197m for the impairment of tangible assets in the six months to 31 December 2020.
4 During the six months to 31 December 2020, The Saudi British Bank (’SABB’), an associate of HSBC, impaired the goodwill that arose following the merger with Alawwal bank in 2019. HSBC’s post-tax share of the goodwill impairment was $462m.
Notes on the interim condensed financial statements (unaudited)
| | | | | |
| 6 | Fair values of financial instruments carried at fair value |
The accounting policies, control framework and hierarchy used to determine fair values at 30 June 2021 are consistent with those applied for the Annual Report and Accounts 2020.
| | | | | | | | | | | | | | |
| Financial instruments carried at fair value and bases of valuation |
| | Valuation techniques | |
| Quoted
market price
Level 1 | Using
observable
inputs
Level 2 | With significant
unobservable
inputs
Level 3 | Total |
| | | | |
| Recurring fair value measurements | $m | $m | $m | $m |
| At 30 Jun 2021 | | | | |
| Assets | | | | |
| Trading assets | 186,338 | | 71,403 | | 2,509 | | 260,250 | |
| Financial assets designated and otherwise mandatorily measured at fair value through profit or loss | 20,468 | | 15,664 | | 12,988 | | 49,120 | |
| Derivatives | 1,630 | | 205,209 | | 2,677 | | 209,516 | |
| Financial investments | 253,593 | | 93,166 | | 3,243 | | 350,002 | |
| Liabilities | | | | |
| Trading liabilities | 61,676 | | 27,104 | | 857 | | 89,637 | |
| Financial liabilities designated at fair value | 1,365 | | 143,084 | | 7,237 | | 151,686 | |
| Derivatives | 1,098 | | 195,637 | | 3,421 | | 200,156 | |
|
| At 31 Dec 2020 | | | | |
| Assets | | | | |
| Trading assets | 167,980 | | 61,511 | | 2,499 | | 231,990 | |
| Financial assets designated and otherwise mandatorily measured at fair value through profit or loss | 19,711 | | 14,365 | | 11,477 | | 45,553 | |
| Derivatives | 2,602 | | 302,454 | | 2,670 | | 307,726 | |
| Financial investments | 303,654 | | 94,746 | | 3,654 | | 402,054 | |
| Liabilities | | | | |
| Trading liabilities | 53,290 | | 21,814 | | 162 | | 75,266 | |
| Financial liabilities designated at fair value | 1,267 | | 150,866 | | 5,306 | | 157,439 | |
| Derivatives | 1,788 | | 297,025 | | 4,188 | | 303,001 | |
| | | | | | | | | | | | | | | | | | | | | | | |
| Transfers between Level 1 and Level 2 fair values |
| Assets | Liabilities |
| Financial investments | Trading assets | Designated and otherwise mandatorily measured at fair value | Derivatives | Trading liabilities | Designated at fair value | Derivatives |
| $m | $m | $m | $m | $m | $m | $m |
| At 30 Jun 2021 | | | | | | | |
| Transfers from Level 1 to Level 2 | 5,421 | | 3,601 | | 150 | | 103 | | 43 | | 0 | | 212 | |
| Transfers from Level 2 to Level 1 | 4,774 | | 2,381 | | 645 | | 0 | | 530 | | 0 | | 0 | |
| | | | | | | |
| | |
| | | | | | | |
| | | | | | | |
| At 31 Dec 2020 | | | | | | | |
| Transfers from Level 1 to Level 2 | 4,514 | | 3,891 | | 245 | | 0 | | 155 | | 7,414 | | 0 | |
| Transfers from Level 2 to Level 1 | 7,764 | | 5,517 | | 328 | | 1 | | 433 | | 0 | | 0 | |
Transfers between levels of the fair value hierarchy are deemed to occur at the end of each quarterly reporting period. Transfers into and out of levels of the fair value hierarchy are primarily attributable to observability of valuation inputs and price transparency.
Fair value adjustments
We adopt the use of fair value adjustments when we take into consideration additional factors not incorporated within the valuation model that would otherwise be considered by a market participant. We classify fair value adjustments as either ‘risk-related’ or ‘model-related’. The majority of these adjustments relate to GBM. Movements in the level of fair value adjustments do not necessarily result in the recognition of profits or losses within the income statement. For example, as models are enhanced, fair value adjustments may no longer be required. Similarly, fair value adjustments will decrease when the related positions are unwound, but this may not result in profit or loss.
| | | | | | | | | | | | | | | |
| Global Banking and Markets fair value adjustments |
| | At |
| | 30 Jun 2021 | 31 Dec 2020 |
| | GBM | Corporate Centre | GBM | Corporate Centre |
| | $m | $m | $m | $m |
| Type of adjustment | | | | | |
| Risk-related | | 922 | | 23 | | 1,170 | | 28 | |
| – bid-offer | | 445 | | 0 | | 514 | | 0 | |
| – uncertainty | | 68 | | 1 | | 106 | | 1 | |
| – credit valuation adjustment | | 287 | | 22 | | 445 | | 27 | |
| – debt valuation adjustment | | (100) | | 0 | | (120) | | 0 | |
| – funding fair value adjustment | | 220 | | 0 | | 204 | | 0 | |
| – other | | 2 | | 0 | | 21 | | 0 | |
| Model-related | | 87 | | 0 | | 74 | | 0 | |
| – model limitation | | 87 | | 0 | | 70 | | 0 | |
| – other | | 0 | | 0 | | 4 | | 0 | |
Inception profit (Day 1 P&L reserves)1 | | 120 | | 0 | | 104 | | 0 | |
| | 1,129 | | 23 | | 1,348 | | 28 | |
1 See Note 8 on the interim condensed financial statements on page 115.
We continue to observe losses on the disposals of certain uncollateralised over-the-counter (‘OTC’) derivatives as part of our commitments to reduce RWAs in GBM, as set out in our business update in February 2020. Based on our analysis, these losses are not considered to give rise to an adjustment within the IFRS 13 ‘Fair Value Measurement’ framework. We will continue to monitor and analyse disposals as they occur.
The reduction in fair value adjustments was driven by increased liquidity, lower volatility and an improved credit environment.
For further details of our risk-related and model-related adjustments, see pages 315 and 316 of the Annual Report and Accounts 2020.
Fair value valuation bases
| | | | | | | | | | | | | | | | | | | | | | | | | | | | | |
| Financial instruments measured at fair value using a valuation technique with significant unobservable inputs – Level 3 |
| Assets | Liabilities |
| Financial investments | Trading assets | Designated and otherwise mandatorily measured at fair value through profit or loss | Derivatives | Total | Trading liabilities | Designated at fair value | Derivatives | Total |
| $m | $m | $m | $m | $m | $m | $m | $m | $m |
| Private equity including strategic investments | 590 | | 55 | | 12,484 | | 0 | | 13,129 | | 206 | | 0 | | 0 | | 206 | |
| Asset-backed securities | 900 | | 250 | | 17 | | 0 | | 1,167 | | 0 | | 0 | | 0 | | 0 | |
| Loans held for securitisation | 0 | | 0 | | 0 | | 0 | | 0 | | 0 | | 0 | | 0 | | 0 | |
| Structured notes | 0 | | 0 | | 0 | | 0 | | 0 | | 0 | | 7,237 | | 0 | | 7,237 | |
| Derivatives with monolines | 0 | | 0 | | 0 | | 52 | | 52 | | 0 | | 0 | | 0 | | 0 | |
| Other derivatives | 0 | | 0 | | 0 | | 2,625 | | 2,625 | | 0 | | 0 | | 3,421 | | 3,421 | |
| Other portfolios | 1,753 | | 2,204 | | 487 | | 0 | | 4,444 | | 651 | | 0 | | 0 | | 651 | |
| At 30 Jun 2021 | 3,243 | | 2,509 | | 12,988 | | 2,677 | | 21,417 | | 857 | | 7,237 | | 3,421 | | 11,515 | |
| | | | | | | | | |
| Private equity including strategic investments | 930 | | 4 | | 10,971 | | 0 | | 11,905 | | 4 | | 0 | | 0 | | 4 | |
| Asset-backed securities | 1,286 | | 523 | | 25 | | 0 | | 1,834 | | 0 | | 0 | | 0 | | 0 | |
| Loans held for securitisation | 0 | | 0 | | 0 | | 0 | | 0 | | 0 | | 0 | | 0 | | 0 | |
| Structured notes | 0 | | 0 | | 0 | | 0 | | 0 | | 29 | | 5,301 | | 0 | | 5,330 | |
| Derivatives with monolines | 0 | | 0 | | 0 | | 68 | | 68 | | 0 | | 0 | | 0 | | 0 | |
| Other derivatives | 0 | | 0 | | 0 | | 2,602 | | 2,602 | | 0 | | 0 | | 4,187 | | 4,187 | |
| Other portfolios | 1,438 | | 1,972 | | 481 | | 0 | | 3,891 | | 129 | | 5 | | 1 | | 135 | |
| At 31 Dec 2020 | 3,654 | | 2,499 | | 11,477 | | 2,670 | | 20,300 | | 162 | | 5,306 | | 4,188 | | 9,656 | |
The basis for determining the fair value of the financial instruments in the table above is explained on page 317 of the Annual Report and Accounts 2020.
Notes on the interim condensed financial statements (unaudited)
Reconciliation of fair value measurements in Level 3 of the fair value hierarchy
| | | | | | | | | | | | | | | | | | | | | | | | |
| Movement in Level 3 financial instruments |
| | Assets | Liabilities |
| | Financial investments | Trading assets | Designated and otherwise mandatorily measured at fair value through profit or loss | Derivatives | Trading liabilities | Designated at fair value | Derivatives |
| | $m | $m | $m | $m | $m | $m | $m |
| At 1 Jan 2021 | | 3,654 | | 2,499 | | 11,477 | | 2,670 | | 162 | | 5,306 | | 4,188 | |
| Total gains/(losses) recognised in profit or loss | | 2 | | (155) | | 1,038 | | 195 | | 15 | | (456) | | 466 | |
| – net income/(losses) from financial instruments held for trading or managed on a fair value basis | | 0 | | (155) | | 0 | | 195 | | 15 | | 0 | | 466 | |
| | | | | | | | |
| – changes in fair value of other financial instruments mandatorily measured at fair value through profit or loss | | 0 | | 0 | | 1,038 | | 0 | | 0 | | (456) | | 0 | |
| – gains less losses from financial investments held at fair value through other comprehensive income | | 2 | | 0 | | 0 | | 0 | | 0 | | 0 | | 0 | |
| | | | | | | | |
| | | | | | | | |
Total gains/(losses) recognised in other comprehensive income (‘OCI’)1 | | (391) | | 23 | | (114) | | 23 | | (3) | | 2 | | 29 | |
| – financial investments: fair value losses | | (360) | | 0 | | 0 | | 0 | | 0 | | 0 | | 0 | |
| | | | | | | | |
| | | | | | | | |
| – exchange differences | | (31) | | 23 | | (114) | | 23 | | (3) | | 2 | | 29 | |
| Purchases | | 390 | | 1,094 | | 1,631 | | 0 | | 482 | | 0 | | 0 | |
| New issuances | | 0 | | 0 | | 0 | | 0 | | 24 | | 2,725 | | 0 | |
| Sales | | (214) | | (244) | | (499) | | 0 | | 0 | | 0 | | 0 | |
| Settlements | | (177) | | (494) | | (436) | | (359) | | (8) | | (896) | | (1,537) | |
| Transfers out | | (311) | | (512) | | (159) | | (126) | | (1) | | (339) | | (221) | |
| Transfers in | | 290 | | 298 | | 50 | | 274 | | 186 | | 895 | | 496 | |
| At 30 Jun 2021 | | 3,243 | | 2,509 | | 12,988 | | 2,677 | | 857 | | 7,237 | | 3,421 | |
| Unrealised gains/(losses) recognised in profit or loss relating to assets and liabilities held at 30 Jun 2021 | | 0 | | (99) | | 885 | | 175 | | 2 | | 106 | | (4) | |
| – net income/(losses) from financial instruments held for trading or managed on a fair value basis | | 0 | | (99) | | 0 | | 175 | | 2 | | 0 | | (4) | |
| | | | | | | | |
| – changes in fair value of other financial instruments mandatorily measured at fair value through profit or loss | | 0 | | 0 | | 885 | | 0 | | 0 | | 106 | | 0 | |
| | | | | | | | |
| | | | | | | | | | | | | | | | | | | | | | | | |
| At 1 Jan 2020 | | 3,218 | | 4,979 | | 9,476 | | 2,136 | | 53 | | 5,016 | | 2,302 | |
| Total gains/(losses) recognised in profit or loss | | (13) | | (541) | | (106) | | 2,237 | | 0 | | (117) | | 2,105 | |
| – net income/(losses) from financial instruments held for trading or managed on a fair value basis | | 0 | | (541) | | 0 | | 2,237 | | 0 | | 0 | | 2,105 | |
| | | | | | | | |
| – changes in fair value of other financial instruments mandatorily measured at fair value through profit or loss | | 0 | | 0 | | (106) | | 0 | | 0 | | (117) | | 0 | |
| – gains less losses from financial investments held at fair value through other comprehensive income | | (13) | | 0 | | 0 | | 0 | | 0 | | 0 | | 0 | |
| | | | | | | | |
| | | | | | | | |
Total losses recognised in other comprehensive income (‘OCI’)1 | | (29) | | (171) | | (4) | | (147) | | (2) | | (78) | | (162) | |
| – financial investments: fair value losses | | (19) | | 0 | | 0 | | 0 | | 0 | | 0 | | 0 | |
| | | | | | | | |
| | | | | | | | |
| – exchange differences | | (10) | | (171) | | (4) | | (147) | | (2) | | (78) | | (162) | |
| Purchases | | 610 | | 199 | | 1,594 | | 0 | | 63 | | 0 | | 0 | |
| New issuances | | 0 | | 0 | | 0 | | 0 | | 2 | | 1,091 | | 0 | |
| Sales | | (271) | | (577) | | (424) | | 0 | | (1) | | 0 | | 0 | |
| Settlements | | (401) | | (22) | | (170) | | (262) | | (12) | | (853) | | (307) | |
| Transfers out | | (22) | | (797) | | (63) | | (139) | | (5) | | (275) | | (270) | |
| Transfers in | | 247 | | 795 | | 101 | | 30 | | 7 | | 224 | | 57 | |
| At 30 Jun 2020 | | 3,339 | | 3,865 | | 10,404 | | 3,855 | | 105 | | 5,008 | | 3,725 | |
| Unrealised gains/(losses) recognised in profit or loss relating to assets and liabilities held at 30 Jun 2020 | | 0 | | (7) | | (140) | | 529 | | (3) | | 100 | | 1,104 | |
| – net income/(losses) from financial instruments held for trading or managed on a fair value basis | | 0 | | (7) | | 0 | | 529 | | (3) | | 0 | | 1,104 | |
| | | | | | | | |
| – changes in fair value of other financial instruments mandatorily measured at fair value through profit or loss | | 0 | | 0 | | (140) | | 0 | | 0 | | 100 | | 0 | |
| | | | | | | | |
| | | | | | | | | | | | | | | | | | | | | | | | |
| Movement in Level 3 financial instruments (continued) |
| | Assets | Liabilities |
| | Financial investments | Trading assets | Designated and otherwise mandatorily measured at fair value through
profit or loss | Derivatives | Trading liabilities | Designated
at fair value | Derivatives |
| | $m | $m | $m | $m | $m | $m | $m |
| At 1 Jul 2020 | | 3,339 | | 3,865 | | 10,404 | | 3,855 | | 105 | | 5,008 | | 3,725 | |
| Total gains recognised in profit or loss | | 30 | | 535 | | 610 | | 44 | | 307 | | 58 | | 1,293 | |
| – net income from financial instruments held for trading or managed on a fair value basis | | 0 | | 535 | | 0 | | 44 | | 307 | | 0 | | 1,293 | |
| | | | | | | | |
| – changes in fair value of other financial instruments mandatorily measured at fair value through profit or loss | | 0 | | 0 | | 610 | | 0 | | 0 | | 58 | | 0 | |
| – gains less losses from financial investments held at fair value through other comprehensive income | | 30 | | 0 | | 0 | | 0 | | 0 | | 0 | | 0 | |
| | | | | | | | |
| | | | | | | | |
Total gains recognised in other comprehensive income (‘OCI’)1 | | 423 | | 286 | | 290 | | 290 | | 19 | | 282 | | 331 | |
| – financial investments: fair value gains | | 289 | | 0 | | 0 | | 0 | | 0 | | 0 | | 0 | |
| | | | | | | | |
| | | | | | | | |
| – exchange differences | | 134 | | 286 | | 290 | | 290 | | 19 | | 282 | | 331 | |
| Purchases | | 61 | | 488 | | 2,107 | | 0 | | 3 | | 0 | | 0 | |
| New issuances | | 0 | | 0 | | 1 | | 0 | | 4 | | 785 | | 0 | |
| Sales | | (403) | | (1,002) | | (1,618) | | 0 | | (259) | | 0 | | 0 | |
| Settlements | | (129) | | (1,100) | | (265) | | (1,280) | | (14) | | (678) | | (1,155) | |
| Transfers out | | (79) | | (993) | | (77) | | (426) | | (4) | | (502) | | (258) | |
| Transfers in | | 412 | | 420 | | 25 | | 187 | | 1 | | 353 | | 252 | |
| At 31 Dec 2020 | | 3,654 | | 2,499 | | 11,477 | | 2,670 | | 162 | | 5,306 | | 4,188 | |
| Unrealised gains/(losses) recognised in profit or loss relating to assets and liabilities held at 31 Dec 2020 | | 0 | | (32) | | 412 | | 707 | | 1 | | (91) | | (1,621) | |
| – net income/(losses) from financial instruments held for trading or managed on a fair value basis | | 0 | | (32) | | 0 | | 707 | | 1 | | 0 | | (1,621) | |
| | | | | | | | |
| – changes in fair value of other financial instruments mandatorily measured at fair value through profit or loss | | 0 | | 0 | | 412 | | 0 | | 0 | | (91) | | 0 | |
| | | | | | | | |
1 Included in ‘Financial investments: fair value gains/(losses)’ in the current year and ‘Exchange differences’ in the consolidated statement of comprehensive income.
Transfers between levels of the fair value hierarchy are deemed to occur at the end of each quarterly reporting period. Transfers into and out of levels of the fair value hierarchy are primarily attributable to observability of valuation inputs and price transparency.
Effect of changes in significant unobservable assumptions to reasonably possible alternatives
The following table shows the sensitivity of Level 3 fair values to reasonably possible alternative assumptions:
| | | | | | | | | | | | | | | |
| Sensitivity of fair values to reasonably possible alternative assumptions |
| | Reflected in profit or loss | Reflected in OCI |
| | Favourable
changes | Unfavourable
changes | Favourable
changes | Unfavourable
changes |
| | $m | $m | $m | $m |
Derivatives, trading assets and trading liabilities1 | | 179 | | (197) | | 0 | | 0 | |
| Financial assets and liabilities designated and otherwise mandatorily measured at fair value through profit or loss | | 795 | | (793) | | 0 | | 0 | |
| Financial investments | | 24 | | (24) | | 105 | | (104) | |
| At 30 Jun 2021 | | 998 | | (1,014) | | 105 | | (104) | |
|
Derivatives, trading assets and trading liabilities1 | | 271 | | (268) | | 0 | | 0 | |
| Financial assets and liabilities designated and otherwise mandatorily measured at fair value through profit or loss | | 625 | | (625) | | 0 | | 0 | |
| Financial investments | | 28 | | (28) | | 101 | | (104) | |
| At 30 Jun 2020 | | 924 | | (921) | | 101 | | (104) | |
|
Derivatives, trading assets and trading liabilities1 | | 229 | | (244) | | 0 | | 0 | |
| Financial assets and liabilities designated and otherwise mandatorily measured at fair value through profit or loss | | 644 | | (643) | | 0 | | 0 | |
| Financial investments | | 35 | | (35) | | 110 | | (110) | |
| At 31 Dec 2020 | | 908 | | (922) | | 110 | | (110) | |
1 ‘Derivatives, trading assets and trading liabilities’ is presented as 1 category to reflect the manner in which these financial instruments are risk-managed.
The sensitivity analysis aims to measure a range of fair values consistent with the application of a 95% confidence interval. Methodologies take account of the nature of the valuation technique employed, as well as the availability and reliability of observable proxy and historical data.
Notes on the interim condensed financial statements (unaudited)
When the fair value of a financial instrument is affected by more than one unobservable assumption, the table above reflects the most favourable or the most unfavourable change from varying the assumptions individually.
Key unobservable inputs to Level 3 financial instruments
The following table lists key unobservable inputs to Level 3 financial instruments and provides the range of those inputs at 30 June 2021. There has been no change to the key unobservable inputs to Level 3 financial instruments and inter-relationships therein, which are detailed on pages 320 and 321 of the Annual Report and Accounts 2020.
| | | | | | | | | | | | | | | | | | | | | | | | | | |
| Quantitative information about significant unobservable inputs in Level 3 valuations |
| Fair value | Valuation techniques | Key unobservable inputs | 30 Jun 2021 | 31 Dec 2020 |
| Assets | Liabilities | Full range of inputs | Full range of inputs |
| $m | $m | Lower | Higher | Lower | Higher |
| Private equity including strategic investments | 13,129 | | 206 | | See footnote 1 | See footnote 1 | | | | |
| Asset-backed securities | 1,167 | | — | | | | | | | |
| – collateralised loan/debt obligation | 80 | | — | | Market proxy | Prepayment rate | 0 | 0 | 0% | 9% |
| Market proxy | Bid quotes | 0 | 100 | 0 | 100 | |
| – other ABSs | 1,087 | | — | | Market proxy | Bid quotes | 0 | | 172 | | 0 | 101 | |
| Loans held for securitisation | — | | — | | | | | | | |
| Structured notes | — | | 7,237 | | | | | | | |
| – equity-linked notes | — | | 6,067 | | Model – Option model | Equity volatility | 5% | 124% | 6% | 115% |
| Model – Option model | Equity correlation | 7% | 98% | (4)% | 88% |
| – FX-linked notes | — | | 634 | | Model – Option model | FX volatility | 3% | 36% | 0% | 36% |
| – other | — | | 536 | | | | | | | |
| Derivatives with monolines | 52 | | — | | Model – Discounted cash flow | Credit spread | 2% | 2% | 2% | 2% |
| Other derivatives | 2,625 | | 3,421 | | | | | | | |
| – interest rate derivatives | 1,199 | | 999 | | | | | | | |
| securitisation swaps | 335 | | 462 | | Model – Discounted cash flow | Prepayment rate | 5% | 10% | 6% | 6% |
| long-dated swaptions | 436 | | 312 | | Model – Option model | IR volatility | 6% | 25% | 6% | 28% |
| other | 428 | | 225 | | | | | | | |
| – FX derivatives | 471 | | 499 | | | | | | | |
| FX options | 258 | | 315 | | Model – Option model | FX volatility | 1% | 36% | 0% | 43% |
| other | 213 | | 184 | | | | | | | |
| – equity derivatives | 885 | | 1,813 | | | | | | | |
| long-dated single stock options | 465 | | 663 | | Model – Option model | Equity volatility | 2% | 100% | 0% | 120% |
| other | 420 | | 1,150 | | | | | | | |
| – credit derivatives | 70 | | 110 | | | | | | | |
| other | 70 | | 110 | | | | | | | |
| Other portfolios | 4,444 | | 651 | | | | | | | |
| | | | | | | | |
| – repurchase agreements | 707 | | 600 | | Model – Discounted cash flow | IR curve | 0% | 5% | 0% | 5% |
– other2 | 3,737 | | 51 | | | | | | | |
| At 30 Jun 2021 | 21,417 | | 11,515 | | | | | | | |
1 Given the bespoke nature of the analysis in respect of each private equity holding, it is not practical to quote a range of key unobservable inputs.
2 ’Other’ includes a range of smaller asset holdings.
| | | | | |
| 7 | Fair values of financial instruments not carried at fair value |
The bases for measuring the fair values of loans and advances to banks and customers, financial investments, deposits by banks, customer accounts, debt securities in issue, subordinated liabilities and non-trading repurchase and reverse repurchase agreements are explained on page 322 of the Annual Report and Accounts 2020.
| | | | | | | | | | | | | | |
| Fair values of financial instruments not carried at fair value on the balance sheet |
| At 30 Jun 2021 | At 31 Dec 2020 |
| Carrying
amount | Fair
value | Carrying
amount | Fair
value |
| $m | $m | $m | $m |
| Assets | | | | |
| Loans and advances to banks | 86,886 | | 87,029 | | 81,616 | | 81,796 | |
| Loans and advances to customers | 1,059,511 | | 1,058,406 | | 1,037,987 | | 1,035,461 | |
| Reverse repurchase agreements – non-trading | 201,714 | | 201,694 | | 230,628 | | 230,602 | |
| Financial investments – at amortised cost | 84,574 | | 90,065 | | 88,639 | | 96,801 | |
| Liabilities | | | | |
| Deposits by banks | 100,448 | | 100,412 | | 82,080 | | 81,996 | |
| Customer accounts | 1,669,091 | | 1,669,483 | | 1,642,780 | | 1,643,131 | |
| Repurchase agreements – non-trading | 112,798 | | 112,797 | | 111,901 | | 111,901 | |
| Debt securities in issue | 84,218 | | 85,416 | | 95,492 | | 97,028 | |
| Subordinated liabilities | 20,774 | | 26,966 | | 21,951 | | 28,552 | |
Other financial instruments not carried at fair value are typically short term in nature and reprice to current market rates frequently. Accordingly, their carrying amount is a reasonable approximation of fair value.
| | | | | | | | | | | | | | | | | | | | | | | | | | |
| Notional contract amounts and fair values of derivatives by product contract type held by HSBC |
| Notional contract amount | Fair value amount |
| Assets and liabilities | Assets | Liabilities |
| Trading | Hedging | Trading | Hedging | Total | Trading | Hedging | Total |
| $m | $m | $m | $m | $m | $m | $m | $m |
| Foreign exchange | 7,610,890 | | 32,493 | | 71,412 | | 861 | | 72,273 | | 68,509 | | 624 | | 69,133 | |
| Interest rate | 15,063,325 | | 129,369 | | 175,722 | | 1,723 | | 177,445 | | 167,385 | | 1,360 | | 168,745 | |
| Equities | 742,764 | | 0 | | 13,835 | | 0 | | 13,835 | | 15,414 | | 0 | | 15,414 | |
| Credit | 218,085 | | 0 | | 2,259 | | 0 | | 2,259 | | 3,083 | | 0 | | 3,083 | |
| Commodity and other | 96,958 | | 0 | | 1,755 | | 0 | | 1,755 | | 1,832 | | 0 | | 1,832 | |
| Gross total fair values | 23,732,022 | | 161,862 | | 264,983 | | 2,584 | | 267,567 | | 256,223 | | 1,984 | | 258,207 | |
| Offset | | | | | (58,051) | | | | (58,051) | |
| At 30 Jun 2021 | 23,732,022 | | 161,862 | | 264,983 | | 2,584 | | 209,516 | | 256,223 | | 1,984 | | 200,156 | |
| | | | | | | | |
| Foreign exchange | 7,606,446 | | 35,021 | | 106,696 | | 309 | | 107,005 | | 108,903 | | 1,182 | | 110,085 | |
| Interest rate | 15,240,867 | | 157,436 | | 249,204 | | 1,914 | | 251,118 | | 236,594 | | 2,887 | | 239,481 | |
| Equities | 652,288 | | 0 | | 14,043 | | 0 | | 14,043 | | 15,766 | | 0 | | 15,766 | |
| Credit | 269,401 | | 0 | | 2,590 | | 0 | | 2,590 | | 3,682 | | 0 | | 3,682 | |
| Commodity and other | 120,259 | | 0 | | 2,073 | | 0 | | 2,073 | | 3,090 | | 0 | | 3,090 | |
| Gross total fair values | 23,889,261 | | 192,457 | | 374,606 | | 2,223 | | 376,829 | | 368,035 | | 4,069 | | 372,104 | |
| Offset | | | | | (69,103) | | | | (69,103) | |
| At 31 Dec 2020 | 23,889,261 | | 192,457 | | 374,606 | | 2,223 | | 307,726 | | 368,035 | | 4,069 | | 303,001 | |
The notional contract amounts of derivatives held for trading purposes and derivatives designated in qualifying hedge accounting relationships indicate the nominal value of transactions outstanding at the balance sheet date, not amounts at risk. Derivative assets and liabilities decreased during 1H21, reflecting changes in yield curves and the market environment.
Derivatives valued using models with unobservable inputs
The following table shows the difference between the fair value at initial recognition, which is the transaction price, and the value that would have been derived had valuation techniques used for subsequent measurement been applied at initial recognition, less subsequent releases.
| | | | | | | | | | | | |
| Unamortised balance of derivatives valued using models with significant unobservable inputs |
| | Half-year to |
| | 30 Jun | 30 Jun | 31 Dec |
| | 2021 | 2020 | 2020 |
| | $m | $m | $m |
| Unamortised balance at beginning of period | | 104 | | 73 | | 89 | |
| Deferral on new transactions | | 187 | | 106 | | 126 | |
| Recognised in the income statement during the period | | (172) | | (87) | | (118) | |
| – amortisation | | (89) | | (51) | | (65) | |
| – subsequent to unobservable inputs becoming observable | | (3) | | (1) | | (3) | |
| – maturity, termination or offsetting derivative | | (80) | | (35) | | (50) | |
| Exchange differences | | 1 | | (3) | | 7 | |
Unamortised balance at end of period1 | | 120 | | 89 | | 104 | |
1This amount is yet to be recognised in the consolidated income statement.
Hedge accounting derivatives
The notional contract amounts of derivatives held for hedge accounting purposes indicate the nominal value of transactions outstanding at the balance sheet date, not amounts at risk.
| | | | | | | | | | | | | | |
| Notional contract amounts of derivatives held for hedging purposes by product type |
| At 30 Jun 2021 | At 31 Dec 2020 |
| Cash flow
hedges | Fair value
hedges | Cash flow
hedges | Fair value
hedges |
| $m | $m | $m | $m |
| Foreign exchange | 21,672 | | 4 | | 24,506 | | 15 | |
| Interest rate | 31,490 | | 97,879 | | 35,863 | | 121,573 | |
| Total | 53,162 | | 97,883 | | 60,369 | | 121,588 | |
The Group applies hedge accounting in respect of certain consolidated net investments. Hedging is undertaken using forward foreign exchange contracts or by financing with foreign currency borrowings. At 30 June 2021, the notional contract values of outstanding financial instruments designated as hedges of net investments in foreign operations were $10,817m (31 December 2020: $10,500m).
Interest rate benchmark reform: Amendments to IFRS 9 and IAS 39 ‘Financial Instruments’
The Group has cash flow and fair value hedge accounting relationships that are exposed to different Ibors, predominantly US dollar Libor, sterling Libor and Euribor, as well as overnight rates subject to the market-wide benchmarks reform such as the European Overnight Index Average rate (‘Eonia’). Existing financial instruments (such as derivatives, loans and bonds) designated in relationships referencing these benchmarks are expected to transition to RFRs in different ways and at different times. External progress on the transition to RFRs
Notes on the interim condensed financial statements (unaudited)
is being monitored, with the objective of ensuring a smooth transition for the Group’s hedge accounting relationships. The specific issues arising will vary with the details of each hedging relationship, but may arise due to the transition of existing products included in the designation, a change in expected volumes of products to be issued, a change in contractual terms of new products issued, or a combination of these factors. Some hedges may need to be de-designated and new relationships entered into, while others may survive the market-wide benchmarks reform.
The hedged items that are affected by the Phase 2 amendments to the IASB’s Ibor reform are presented in the balance sheet as ‘Financial assets designated and otherwise mandatorily measured at fair value through other comprehensive income’, ‘Loans and advances to customers’, ‘Debt securities in issue’ and ‘Deposits by banks’.
The notional amounts of interest rate derivatives designated in hedge accounting relationships represent the extent of the risk exposure managed by the Group that is expected to be directly affected by market-wide Ibor reform and in scope of the IASB Ibor reform Phase 1 and Phase 2 amendments. The cross-currency swaps designated in hedge accounting relationships and affected by Ibor reform are not significant and have not been presented below:
| | | | | | | | | | | | | | | | | | | | | | | |
| Hedging instrument impacted by Ibor reform |
| Hedging instrument |
| Impacted by Ibor reform | Not impacted by Ibor reform | Notional amount1 |
| € | £ | $ | Other | Total |
| $m | $m | $m | $m | $m | $m | $m |
| Fair value hedges | 9,615 | | 311 | | 25,511 | | 7,024 | | 42,461 | | 55,418 | | 97,879 | |
| Cash flow hedges | 8,662 | | 829 | | 4,201 | | 5,630 | | 19,322 | | 12,168 | | 31,490 | |
| At 30 Jun 2021 | 18,277 | | 1,140 | | 29,712 | | 12,654 | | 61,783 | | 67,586 | | 129,369 | |
| | | | | | | |
| Fair value hedges | 17,792 | | 3,706 | | 32,789 | | 10,128 | | 64,415 | | 57,158 | | 121,573 | |
| Cash flow hedges | 8,344 | | 2,522 | | 8,705 | | 6,797 | | 26,368 | | 9,495 | | 35,863 | |
| At 31 Dec 2020 | 26,136 | | 6,228 | | 41,494 | | 16,925 | | 90,783 | | 66,653 | | 157,436 | |
1 The notional contract amounts of interest rate derivatives designated in qualifying hedge accounting relationships indicate the nominal value of transactions outstanding at the balance sheet date. They do not represent amounts at risk.
2 The notional contract amounts of euro interest rate derivatives impacted by Ibor reform mainly comprise hedges with a Euribor benchmark, which are ‘Fair value hedges’ of $8,793m (31 December 2020: $6,000m) and ‘Cash flow hedges’ of $8,662m (31 December 2020: $8,344m).
| | | | | | | | | |
| Carrying amounts of financial investments |
| | 30 Jun | 31 Dec |
| | 2021 | 2020 |
| | $m | $m |
| | | |
| Financial investments measured at fair value through other comprehensive income | | 350,002 | | 402,054 | |
| – treasury and other eligible bills | | 101,297 | | 118,163 | |
| – debt securities | | 246,728 | | 281,467 | |
| – equity securities | | 1,895 | | 2,337 | |
| – other instruments | | 82 | | 87 | |
| Debt instruments measured at amortised cost | | 84,574 | | 88,639 | |
| – treasury and other eligible bills | | 8,085 | | 11,757 | |
| – debt securities | | 76,489 | | 76,882 | |
| At the end of the period | | 434,576 | | 490,693 | |
| | | | | |
| 10 | Interests in associates and joint ventures |
At 30 June 2021, the carrying amount of HSBC’s interests in associates and joint ventures was $28,709m (31 December 2020: $26,684m).
| | | | | | | | | | | | | | |
| Principal associates of HSBC |
| At |
| 30 Jun 2021 | 31 Dec 2020 |
| Carrying
amount | Fair value1 | Carrying
amount | Fair value1 |
| $m | $m | $m | $m |
| Bank of Communications Co., Limited | 22,857 | | 9,484 | | 21,248 | | 7,457 | |
| The Saudi British Bank | 4,405 | | 5,350 | | 4,215 | | 4,197 | |
1Principal associates are listed on recognised stock exchanges. The fair values are based on the quoted market prices of the shares held (Level 1 in the fair value hierarchy).
Bank of Communications Co., Limited
The Group’s investment in Bank of Communications Co., Limited (‘BoCom’) is classified as an associate. Significant influence in BoCom was established with consideration of all relevant factors, including representation on BoCom’s Board of Directors and participation in a Resource and Experience Sharing agreement (‘RES’). Under the RES, HSBC staff have been seconded to assist in the maintenance of BoCom’s financial and operating policies. Investments in associates are recognised using the equity method of accounting in accordance with IAS 28 whereby the investment is initially recognised at cost and adjusted thereafter for the post-acquisition change in the Group’s share of BoCom’s net assets. An impairment test is required if there is any indication of impairment.
Impairment testing
At 30 June 2021, the fair value of the Group’s investment in BoCom had been below the carrying amount for approximately nine years. As a result, the Group performed an impairment test on the carrying amount, which confirmed that there was 0 impairment at 30 June 2021 as the recoverable amount as determined by a value-in-use (‘VIU’) calculation was higher than the carrying value.
| | | | | | | | | | | | | | | | | | | | |
| At |
| 30 Jun 2021 | 31 Dec 2020 |
| VIU | Carrying
value | Fair
value | VIU | Carrying
value | Fair
value |
| $bn | $bn | $bn | $bn | $bn | $bn |
| BoCom | 23.6 | | 22.9 | | 9.5 | | 21.8 | | 21.2 | | 7.5 | |
In future periods, the VIU may increase or decrease depending on the effect of changes to model inputs. The main model inputs are described below and are based on factors observed at period-end. The factors that could result in a change in the VIU and an impairment include a short-term underperformance by BoCom, a change in regulatory capital requirements, or an increase in uncertainty regarding the future performance of BoCom resulting in a downgrade of the forecast of future asset growth or profitability. An increase in the discount rate as a result of an increase in the risk premium or risk-free rates could also result in a reduction of VIU and an impairment. At the point where the carrying value exceeds the VIU, impairment would be recognised.
If the Group did not have significant influence in BoCom, the investment would be carried at fair value rather than the current carrying value.
Basis of recoverable amount
The impairment test was performed by comparing the recoverable amount of BoCom, determined by a VIU calculation, with its carrying amount. The VIU calculation uses discounted cash flow projections based on management’s best estimates of future earnings available to ordinary shareholders prepared in accordance with IAS 36. Significant management judgement is required in arriving at the best estimate. There are two main components to the VIU calculation. The first component is management’s best estimate of BoCom’s earnings, which is based on explicit forecasts over the short to medium term. This results in forecast earnings growth that is lower than recent historical actual growth and also reflects the uncertainty arising from the current economic outlook. Earnings beyond the short to medium term are then extrapolated into perpetuity using a long-term growth rate to derive a terminal value, which comprises the majority of the VIU. The second component is the capital maintenance charge (‘CMC’), which is management’s forecast of the earnings that need to be withheld in order for BoCom to meet capital requirements over the forecast period (i.e. CMC is deducted when arriving at management’s estimate of future earnings available to ordinary shareholders). The principal inputs to the CMC calculation include estimates of asset growth, the ratio of risk-weighted assets to total assets, and the expected capital requirements. An increase in the CMC as a result of a change to these principal inputs would reduce VIU. Additionally, management considers other factors (including qualitative factors) to ensure that the inputs to the VIU calculation remain appropriate.
Key assumptions in value-in-use calculation
We used a number of assumptions in our VIU calculation, in accordance with the requirements of IAS 36:
•Long-term profit growth rate: 3% (31 December 2020: 3%) for periods after 2024, which does not exceed forecast GDP growth in mainland China and is consistent with forecasts by external analysts.
•Long-term asset growth rate: 3% (31 December 2020: 3%) for periods after 2024, which is the rate that assets are expected to grow to achieve long-term profit growth of 3%.
•Discount rate: 10.59% (31 December 2020: 11.37%), which is based on a capital asset pricing model (‘CAPM’) calculation for BoCom, using market data. Management also compares the rate derived from the CAPM with discount rates from external sources. The discount rate used is within the range of 9.5% to 15.0% (31 December 2020: 10.3% to 15.0%) indicated by external sources. The lower rate reflects the impact of updates to certain components of CAPM arising from a relative reduction in the volatility of Chinese banks, the maturity of the Chinese banking industry, and a decrease in mainland China’s credit risk due to its relatively quick recovery from the impact of the Covid-19 outbreak.
•Expected credit losses (‘ECL’) as a percentage of customer advances: ranges from 0.98% to 1.10% (31 December 2020: 0.98% to 1.22%) in the short to medium term, reflecting a decrease in the upper end of the range due to BoCom's actual results and an improved outlook for ECL following the peak of the Covid-19 outbreak in mainland China. For periods after 2024, the ratio is 0.88% (2020: 0.88%), which is slightly lower than BoCom’s average ECL in recent years prior to the Covid-19 outbreak.
•Risk-weighted assets as a percentage of total assets: ranges from 61% to 62% (31 December 2020: 61% to 62%) in the short to medium term, reflecting increases that may arise from relatively elevated ECL in the short term, followed by reductions that may arise from a subsequent lowering of ECL and a continuation of the trend of strong retail loan growth. For periods after 2024, the ratio is 61% (2020: 61%). These rates are similar to BoCom’s actual results in recent years and are slightly below forecasts disclosed by external analysts.
•Operating income growth rate: ranges from 4.4% to 6.3% (31 December 2020: 3.5% to 6.7%) in the short to medium term, and is lower than BoCom’s actual results in recent years and forecasts disclosed by external analysts, reflecting BoCom’s most recent actual results, global trade tensions and industry developments in mainland China.
•Cost-income ratio: 36.1% (31 December 2020: 36.3% to 36.8%) in the short to medium term. These ratios are similar to BoCom’s actual results in recent years and slightly lower than forecasts disclosed by external analysts.
•Effective tax rate: ranges from 10.0% to 14.3% (31 December 2020: 7.8% to 16.5%) in the short to medium term, reflecting BoCom’s actual results and an expected increase towards the long-term assumption through the forecast period. For periods after 2024, the rate is 16.8% (2020: 16.8%), which is higher than the recent historical average, above the most likely rate within the range of the minimum tax rate as proposed by the OECD/G20 Inclusive Framework on Base Erosion and Profit Shifting, and forecasts for the short to medium term disclosed by external analysts.
•Capital requirements: Capital adequacy ratio: 12.5% (31 December 2020: 11.5%) and tier 1 capital adequacy ratio: 9.5% (31 December 2020: 9.5%), based on BoCom’s capital risk appetite and the minimum regulatory requirements, respectively. The capital adequacy ratio assumption was updated to 12.5% from 11.5%, which was the minimum regulatory requirement, following the recent approval of BoCom’s capital management plan.
Notes on the interim condensed financial statements (unaudited)
The following table shows the change to each key assumption in the VIU calculation that on its own would reduce the headroom to nil:
| | | | | | | | |
| Key assumption | Changes to key assumption to reduce headroom to nil | |
| | |
•Long-term profit growth rate | Decrease by 22 basis points | |
•Long-term asset growth rate | Increase by 19 basis points | |
•Discount rate | Increase by 27 basis points | |
•Expected credit losses as a percentage of customer advances | Increase by 3 basis points | |
•Risk-weighted assets as a percentage of total assets | Increase by 145 basis points | |
•Operating income growth rate | Decrease by 39 basis points
| |
•Cost-income ratio | Increase by 87 basis points | |
•Long-term effective tax rate | Increase by 228 basis points
| |
•Capital requirements – capital adequacy ratio | Increase by 30 basis points
| |
•Capital requirements – tier 1 capital adequacy ratio | Increase by 199 basis points
| |
The following table further illustrates the impact on VIU of reasonably possible changes to key assumptions. This reflects the sensitivity of the VIU to each key assumption on its own and it is possible that more than one favourable and/or unfavourable change may occur at the same time. The selected rates of reasonably possible changes to key assumptions are largely based on external analysts’ forecasts, which can change period to period.
| | | | | | | | | | | | | | | | | | | | | | | |
| Sensitivity of VIU to reasonably possible changes in key assumptions |
| | Favourable change | Unfavourable change |
| | | Increase
in VIU | VIU | | Decrease
in VIU | VIU |
| | bps | $bn | $bn | bps | $bn | $bn |
| At 30 Jun 2021 | | | | | | | |
Long-term asset/profit growth rate1 | | (50) / 0 | 1.9 / 0 | 25.5 / 23.6 | 0 / (50) | 0 / (1.7) | 23.6 / 21.9 |
| | | | | | | |
| Discount rate | | (109) | | 3.8 | | 27.4 | | 31 | | (0.8) | | 22.8 | |
| Expected credit losses as a percentage of customer advances | | 2021 to 2024: 99 2025 onwards: 79 | 1.9 | | 25.5 | | 2021 to 2024: 112 2025 onwards: 102 | (3.0) | | 20.6 | |
| Risk-weighted assets as a percentage of total assets | | (81) | | 0.3 | | 23.9 | | 87 | | (0.6) | | 23.0 | |
| Operating income growth rate | | 16 | | 0.4 | | 24.0 | | (46) | | (0.9) | | 22.7 | |
| Cost-income ratio | | (168) | | 1.7 | | 25.3 | | 287 | | (2.6) | | 21.0 | |
| Long-term effective tax rate | | (180) | | 0.6 | | 24.2 | | 820 | | (2.7) | | 20.9 | |
| Capital requirements – capital adequacy ratio | | 0 | | 0 | | 23.6 | | 254 | | (7.4) | | 16.2 | |
| Capital requirements – tier 1 capital adequacy ratio | | 0 | | 0 | | 23.6 | | 332 | | (4.8) | | 18.8 | |
| | | | | | | |
| At 31 Dec 2020 | | | | | | | |
Long-term asset/profit growth rate1 | | (50) / 0 | 1.4 / 0 | 23.2 / 21.8 | 0 / (50) | 0 / (1.3) | 21.8 / 20.5 |
| | | | | | | |
| Discount rate | | 0 | 1.2 | | 23.0 | | 53 | | (1.2) | | 20.6 | |
| Expected credit losses as a percentage of customer advances | | 2020 to 2024: 96 2025 onwards: 76 | 2.3 | | 24.1 | | 2020 to 2024: 122 2025 onwards: 95 | (2.1) | | 19.7 | |
| Risk-weighted assets as a percentage of total assets | | (40) | | 0.1 | | 21.9 | | 166 | | (0.8) | | 21.0 | |
| Operating income growth rate | | 2 | | 0.2 | | 22.0 | | (69) | | (1.5) | | 20.3 | |
| Cost-income ratio | | (149) | | 1.3 | | 23.1 | | 120 | | (1.2) | | 20.6 | |
| Long-term effective tax rate | | (316) | | 0.9 | | 22.7 | | 820 | | (2.2) | | 19.6 | |
| Capital requirements – capital adequacy ratio | | 0 | | 0 | | 21.8 | | 297 | | (7.8) | | 14.0 | |
| Capital requirements – tier 1 capital adequacy ratio | | 0 | | 0 | | 21.8 | | 263 | | (5.3) | | 16.5 | |
1 The reasonably possible ranges of the long-term profit growth rate and long-term asset growth rate assumptions reflect the close relationship between these assumptions, which would result in offsetting changes to each assumption.
Considering the interrelationship of the changes set out in the table above, management estimates that the reasonably possible range of VIU is $19.6bn to $25.9bn (31 December 2020: $18.2bn to $24.2bn). The range is based on the favourable/unfavourable change in the earnings in the short to medium term and long-term expected credit losses as a percentage of customer advances as set out in the table above. All other long-term assumptions, the discount rate and the basis of the CMC have been kept unchanged when determining the reasonably possible range of the VIU.
The Saudi British Bank
The Group’s investment in The Saudi British Bank (‘SABB’) is classified as an associate. In June 2019, the merger between SABB and Alawwal bank (‘Alawwal’) became effective, which reduced HSBC’s 40% interest in SABB to 29.2%. On 3 December 2020, HSBC purchased additional shares in SABB, which increased the Group’s shareholding to 31%. HSBC remains the largest shareholder in SABB. Significant influence in SABB is established via representation on the Board of Directors. Investments in associates are recognised using the equity method of accounting in accordance with IAS 28, as described previously for BoCom.
Impairment testing
There were no indicators of impairment at 30 June 2021. The fair value of the Group’s investment in SABB of $5.4bn was above the carrying amount of $4.4bn.
| | | | | | | | | | | | | | | | | | |
| | Restructuring
costs | Legal proceedings
and regulatory
matters | Customer
remediation | Other
provisions | Total |
| | $m | $m | $m | $m | $m |
| Provisions (excluding contractual commitments) | | | | | | |
| At 31 Dec 2020 | | 671 | | 756 | | 858 | | 305 | | 2,590 | |
| Additions | | 158 | | 61 | | 92 | | 100 | | 411 | |
| Amounts utilised | | (273) | | (149) | | (298) | | (28) | | (748) | |
| Unused amounts reversed | | (72) | | (14) | | (93) | | (43) | | (222) | |
| | | | | | |
| Exchange and other movements | | 45 | | (27) | | 10 | | (29) | | (1) | |
| At 30 Jun 2021 | | 529 | | 627 | | 569 | | 305 | | 2,030 | |
Contractual commitments1 | | | | | | |
| At 31 Dec 2020 | | | | | | 1,088 | |
| Net change in expected credit loss provision and other movements | | | | | | (304) | |
| At 30 Jun 2021 | | | | | | 784 | |
| Total provisions | | | | | | |
| At 31 Dec 2020 | | | | | | 3,678 | |
| At 30 Jun 2021 | | | | | | 2,814 | |
1 Contractual commitments include the provision for contingent liabilities measured under IFRS 9 ‘Financial Instruments’ in respect of financial guarantees and the expected credit loss provision on off-balance sheet guarantees and commitments.
Further details of ‘Legal proceedings and regulatory matters’ are set out in Note 13. Legal proceedings include civil court, arbitration or tribunal proceedings brought against HSBC companies (whether by way of claim or counterclaim); or civil disputes that may, if not settled, result in court, arbitration or tribunal proceedings. ‘Regulatory matters’ refers to investigations, reviews and other actions carried out by, or in response to, the actions of regulators or law enforcement agencies in connection with alleged wrongdoing by HSBC.
Customer remediation refers to HSBC’s activities to compensate customers for losses or damages associated with a failure to comply with regulations or to treat customers fairly. Customer remediation is often initiated by HSBC in response to customer complaints and/or industry developments in sales practices, and is not necessarily initiated by regulatory action. Further details of customer remediation are set out in this note.
At 30 June 2021, $278m (31 December 2020: $334m) of the customer remediation provision related to the estimated liability for redress in respect of the possible mis-selling of payment protection insurance (‘PPI’) policies in previous years. Payments totalling $74m were made during the first six months of 2021, and the provision was increased by $18m.
At 30 June 2021, a provision of $124m (31 December 2020: $308m) was held relating to the liability for redress payable to customers following a review of collections and recoveries practices in the UK. During the first six months of 2021, redress payments and incurred operating costs totalled $157m, in addition to a net release of $27m of provision. This release takes account of the impact of the estimated cost of redress of the actual number of customers impacted and cost of redress paid.
For further details of the impact of IFRS 9 on undrawn loan commitments and financial guarantees, presented in ‘Contractual commitments’, see Note 12. Further analysis of the movement in the expected credit loss provision is disclosed within the 'Reconciliation of allowances for loans and advances to banks and customers including loan commitments and financial guarantees' table on page 71.
| | | | | |
| 12 | Contingent liabilities, contractual commitments and guarantees |
| | | | | | | | | |
| | At |
| | 30 Jun | 31 Dec |
| | 2021 | 2020 |
| | $m | $m |
| Guarantees and contingent liabilities: | | | |
| – financial guarantees | | 27,274 | | 18,384 | |
| – performance and other guarantees | | 80,641 | | 78,114 | |
| – other contingent liabilities | | 838 | | 1,219 | |
| At the end of the period | | 108,753 | | 97,717 | |
Commitments:1 | | | |
| – documentary credits and short-term trade-related transactions | | 9,201 | | 7,178 | |
| – forward asset purchases and forward deposits placed | | 72,916 | | 66,506 | |
| – standby facilities, credit lines and other commitments to lend | | 764,768 | | 771,086 | |
| At the end of the period | | 846,885 | | 844,770 | |
1 Includes $661,373m of commitments at 30 June 2021 (31 December 2020: $659,783m), to which the impairment requirements in IFRS 9 are applied where HSBC has become party to an irrevocable commitment.
The preceding table discloses the nominal principal amounts of off-balance sheet liabilities and commitments for the Group, which represent the maximum amounts at risk should the contracts be fully drawn upon and the clients default. As a significant portion of guarantees and commitments are expected to expire without being drawn upon, the total of the nominal principal amounts is not indicative of future liquidity requirements. The expected credit loss provision relating to guarantees and commitments under IFRS 9 is disclosed in Note 11.
The majority of the guarantees have a term of less than one year, while guarantees with terms of more than one year are subject to HSBC’s annual credit review process.
Notes on the interim condensed financial statements (unaudited)
Contingent liabilities arising from legal proceedings and regulatory and other matters against Group companies are excluded from this note but are disclosed in Notes 11 and 13.
| | | | | |
| 13 | Legal proceedings and regulatory matters |
HSBC is party to legal proceedings and regulatory matters in a number of jurisdictions arising out of its normal business operations. Apart from the matters described below, HSBC considers that none of these matters are material. The recognition of provisions is determined in accordance with the accounting policies set out in Note 1 of the Annual Report and Accounts 2020. While the outcomes of legal proceedings and regulatory matters are inherently uncertain, management believes that, based on the information available to it, appropriate provisions have been made in respect of these matters as at 30 June 2021 (see Note 11). Where an individual provision is material, the fact that a provision has been made is stated and quantified, except to the extent that doing so would be seriously prejudicial. Any provision recognised does not constitute an admission of wrongdoing or legal liability. It is not practicable to provide an aggregate estimate of potential liability for our legal proceedings and regulatory matters as a class of contingent liabilities.
Bernard L. Madoff Investment Securities LLC
Bernard L. Madoff (‘Madoff’) was arrested in December 2008 and later pleaded guilty to running a Ponzi scheme. His firm, Bernard L. Madoff Investment Securities LLC (‘Madoff Securities’), is being liquidated in the US by a trustee (the ‘Trustee’).
Various non-US HSBC companies provided custodial, administration and similar services to a number of funds incorporated outside the US whose assets were invested with Madoff Securities. Based on information provided by Madoff Securities as at 30 November 2008, the purported aggregate value of these funds was $8.4bn, including fictitious profits reported by Madoff.
Based on information available to HSBC, the funds’ actual transfers to Madoff Securities minus their actual withdrawals from Madoff Securities during the time HSBC serviced the funds are estimated to have totalled approximately $4bn. Various HSBC companies have been named as defendants in lawsuits arising out of Madoff Securities’ fraud.
US litigation: The Trustee has brought lawsuits against various HSBC companies and others in the US Bankruptcy Court for the Southern District of New York (the ‘US Bankruptcy Court’), seeking recovery of transfers from Madoff Securities to HSBC in an amount not yet pleaded or determined. HSBC and other parties to the actions have moved to dismiss the Trustee’s claims. The US Bankruptcy Court granted HSBC’s motion to dismiss with respect to certain of the Trustee’s claims in November 2016. In February 2019, the US Court of Appeals for the Second Circuit (the ‘Second Circuit Court of Appeals’) reversed that dismissal. Following the US Supreme Court’s denial of certiorari in June 2020, the cases were remanded to the US Bankruptcy Court, where they are now pending.
Fairfield Sentry Limited, Fairfield Sigma Limited and Fairfield Lambda Limited (together, ‘Fairfield’) (in liquidation since July 2009) have brought a lawsuit in the US against fund shareholders, including HSBC companies that acted as nominees for clients, seeking restitution of redemption payments. In December 2018, the US Bankruptcy Court issued an opinion, which ruled in favour of the defendants’ motion to dismiss in respect of certain claims by the liquidators for Fairfield and granted a motion by the liquidators to file amended complaints. As a result of that opinion, all claims against one of the HSBC companies, and certain claims against the remaining HSBC defendants, were dismissed. In May 2019, the liquidators appealed certain issues from the US Bankruptcy Court to the US District Court for the Southern District of New York (the ’New York District Court’) and these appeals remain pending.
In January 2020, the liquidators filed amended complaints on the claims remaining in the US Bankruptcy Court. In December 2020, the US Bankruptcy Court granted in part and denied in part motions filed by the defendants, including HSBC, to dismiss the amended complaints. In March 2021, the liquidators and defendants appealed the US Bankruptcy Court’s decision, and these appeals are currently pending. Meanwhile, proceedings before the US Bankruptcy Court with respect to the remaining claims that were not dismissed are ongoing.
UK litigation: The Trustee has filed a claim against various HSBC companies in the High Court of England and Wales, seeking recovery of transfers from Madoff Securities to HSBC in an amount not yet pleaded or determined. The deadline for service of the claim has been extended to September 2021 for UK-based defendants and November 2021 for all other defendants.
Cayman Islands litigation: In February 2013, Primeo Fund (‘Primeo’) (in liquidation since April 2009) brought an action against HSBC Securities Services Luxembourg (‘HSSL’) and Bank of Bermuda (Cayman) Limited (now known as HSBC Cayman Limited), alleging breach of contract and breach of fiduciary duty and claiming damages and equitable compensation. The trial concluded in February 2017 and, in August 2017, the court dismissed all claims against the defendants. In September 2017, Primeo appealed to the Court of Appeal of the Cayman Islands and, in June 2019, the Court of Appeal of the Cayman Islands dismissed Primeo’s appeal. In August 2019, Primeo filed a notice of appeal to the UK Privy Council. The first of two possible hearings before the UK Privy Council took place during April 2021, where judgment is pending.
Luxembourg litigation: In April 2009, Herald Fund SPC (‘Herald’) (in liquidation since July 2013) brought an action against HSSL before the Luxembourg District Court, seeking restitution of cash and securities that Herald purportedly lost because of Madoff Securities’ fraud, or money damages. The Luxembourg District Court dismissed Herald’s securities restitution claim, but reserved Herald’s cash restitution claim and its claim for money damages. Herald has appealed this judgment to the Luxembourg Court of Appeal, where the matter is pending. In late 2018, Herald brought additional claims against HSSL and HSBC Bank plc before the Luxembourg District Court, seeking further restitution and damages.
In October 2009, Alpha Prime Fund Limited (‘Alpha Prime’) brought an action against HSSL before the Luxembourg District Court, seeking the restitution of securities, or the cash equivalent, or money damages. In December 2018, Alpha Prime brought additional claims before the Luxembourg District Court seeking damages against various HSBC companies. These matters are currently pending before the Luxembourg District Court.
In December 2014, Senator Fund SPC (‘Senator’) brought an action against HSSL before the Luxembourg District Court, seeking restitution of securities, or the cash equivalent, or money damages. In April 2015, Senator commenced a separate action against the Luxembourg branch of HSBC Bank plc asserting identical claims before the Luxembourg District Court. In December 2018, Senator brought additional claims against HSSL and HSBC Bank plc Luxembourg branch before the Luxembourg District Court, seeking restitution of Senator’s securities or money damages. These matters are currently pending before the Luxembourg District Court.
Ireland litigation: In November 2013, Defender Limited brought an action against HSBC Institutional Trust Services (Ireland) Limited (‘HTIE’) and others, based on allegations of breach of contract and claiming damages and indemnification for fund losses. The trial commenced in October 2018. In December 2018, the Irish High Court issued a judgment in HTIE’s favour on a preliminary issue, holding
that Defender Limited had no effective claim against HTIE. This judgment concluded the trial without further issues in dispute being heard. In February 2019, Defender Limited appealed the decision. In July 2020, the Irish Supreme Court ruled in part in favour of Defender Limited and returned the case to the High Court for further proceedings. In April 2021, the parties reached an agreement to resolve the dispute and, in May 2021, the action against HTIE was discontinued.
There are many factors that may affect the range of possible outcomes, and any resulting financial impact, of the various Madoff-related proceedings described above, including but not limited to the multiple jurisdictions in which the proceedings have been brought. Based upon the information currently available, management’s estimate of the possible aggregate damages that might arise as a result of all claims in the various Madoff-related proceedings is up to or exceeding $500m, excluding costs and interest. Due to uncertainties and limitations of this estimate, any possible damages that might ultimately arise could differ significantly from this amount.
Anti-money laundering and sanctions-related matters
In December 2012, HSBC Holdings entered into a number of agreements, including an undertaking with the UK Financial Services Authority (replaced with a Direction issued by the UK Financial Conduct Authority (‘FCA’) in 2013 and again in 2020) as well as a cease-and-desist order with the US Federal Reserve Board (‘FRB’), both of which contained certain forward-looking anti-money laundering (‘AML’) and sanctions-related obligations. HSBC also agreed to retain an independent compliance monitor (who was, for FCA purposes, a ‘Skilled Person’ under section 166 of the Financial Services and Markets Act and, for FRB purposes, an ‘Independent Consultant’) to produce periodic assessments of the Group’s AML and sanctions compliance programme. In 2020, HSBC’s engagement with the independent compliance monitor, acting in his roles as both Skilled Person and Independent Consultant, concluded. The role of FCA Skilled Person was assigned to a new individual in the second quarter of 2020. Separately, in early 2021, a new FRB Independent Consultant was appointed pursuant to the cease-and-desist order. The roles of each of the FCA Skilled Person and the FRB Independent Consultant are discussed on page 188 of the Annual Report and Accounts 2020.
The FCA is conducting an investigation into HSBC Bank plc’s and HSBC UK Bank plc’s compliance with UK money laundering regulations and financial crime systems and controls requirements. HSBC continues to cooperate with the FCA’s investigation, which is at or nearing completion.
Since November 2014, a number of lawsuits have been filed in federal courts in the US against various HSBC companies and others on behalf of plaintiffs who are, or are related to, victims of terrorist attacks in the Middle East. In each case, it is alleged that the defendants aided and abetted the unlawful conduct of various sanctioned parties in violation of the US Anti-Terrorism Act. Currently, 9 actions remain pending in federal courts in New York or the District of Columbia. The courts have granted HSBC’s motions to dismiss in 5 of these cases. Appeals remain pending in 2 cases, and the remaining 3 dismissals are also subject to appeal. The 4 remaining actions are at a very early stage.
There are many factors that may affect the range of outcomes, and the resulting financial impact, of these matters, which could be significant.
London interbank offered rates, European interbank offered rates and other benchmark interest rate investigations and litigation
Euro interest rate derivatives: In December 2016, the European Commission (‘EC’) issued a decision finding that HSBC, among other banks, engaged in anti-competitive practices in connection with the pricing of euro interest rate derivatives in early 2007. The EC imposed a fine on HSBC based on a one-month infringement. HSBC appealed the decision and, in September 2019, the General Court of the European Union (the ‘General Court’) issued a decision largely upholding the EC’s findings on liability but annulling the fine. HSBC and the EC both appealed the General Court’s decision to the European Court of Justice (the ‘Court of Justice’). In June 2021, the EC adopted a new fining decision for an amount which was 5% less than the previously annulled fine, and subsequently withdrew its appeal to the Court of Justice. HSBC’s appeal remains pending.
US dollar Libor: Beginning in 2011, HSBC and other panel banks have been named as defendants in a number of private lawsuits filed in the US with respect to the setting of US dollar Libor. The complaints assert claims under various US laws, including US antitrust and racketeering laws, the US Commodity Exchange Act (‘US CEA’) and state law. The lawsuits include individual and putative class actions, most of which have been transferred and/or consolidated for pre-trial purposes before the New York District Court. HSBC has reached class settlements with 5 groups of plaintiffs, and the court has approved these settlements. HSBC has also resolved several of the individual actions, although a number of other US dollar Libor-related actions remain pending against HSBC in the New York District Court and the Second Circuit Court of Appeals.
Intercontinental Exchange (‘ICE’) Libor: Between January and March 2019, HSBC and other panel banks were named as defendants in 3 putative class actions filed in the New York District Court on behalf of persons and entities who purchased instruments paying interest indexed to US dollar ICE Libor from a panel bank. The complaints allege, among other things, misconduct related to the suppression of this benchmark rate in violation of US antitrust and state law. In July 2019, the 3 putative class actions were consolidated, and the plaintiffs filed a consolidated amended complaint. In March 2020, the court granted the defendants’ joint motion to dismiss in its entirety. This matter is on appeal.
Singapore interbank offered rate (‘Sibor’), Singapore swap offer rate (‘SOR’) and Australia bank bill swap rate (‘BBSW’):
In July and August 2016, HSBC and other panel banks were named as defendants in 2 putative class actions filed in the New York District Court on behalf of persons who transacted in products related to the Sibor, SOR and BBSW benchmark rates. The complaints allege, among other things, misconduct related to these benchmark rates in violation of US antitrust, commodities and racketeering laws, and state law.
In the Sibor/SOR litigation, in March 2021, following an appeal by the plaintiffs, the Second Circuit Court of Appeals reversed the dismissal of the plaintiffs’ third amended complaint and remanded the case to the New York District Court where it remains pending against the defendants, including The Hongkong and Shanghai Banking Corporation Limited.
In the BBSW litigation, in November 2018, the court dismissed all foreign defendants, including all the HSBC entities, on personal jurisdiction grounds. In April 2019, the plaintiffs filed an amended complaint, which the defendants moved to dismiss. In February 2020, the court again dismissed the plaintiffs’ amended complaint against all the HSBC entities.
There are many factors that may affect the range of outcomes, and the resulting financial impact, of these matters, which could be significant.
Notes on the interim condensed financial statements (unaudited)
Foreign exchange-related investigations and litigation
Since at least 2014, the EC has been conducting an investigation into trading activities by a number of banks, including HSBC, in the foreign exchange spot market. HSBC is cooperating with this investigation.
In January 2018, following the conclusion of the US Department of Justice’s (‘DoJ’) investigation into HSBC’s historical foreign exchange activities, HSBC Holdings entered into a three-year deferred prosecution agreement with the Criminal Division of the DoJ (the ‘FX DPA’), regarding fraudulent conduct in connection with 2 particular transactions in 2010 and 2011. In January 2021, the FX DPA expired and, in July 2021, the DoJ filed a motion to dismiss the charges deferred by the FX DPA, which remains pending.
In December 2016, Brazil’s Administrative Council of Economic Defense initiated an investigation into the onshore foreign exchange market and identified a number of banks, including HSBC, as subjects of its investigation.
In June 2020, the Competition Commission of South Africa, having initially referred a complaint for proceedings before the South African Competition Tribunal in February 2017, filed a revised complaint against 28 financial institutions, including HSBC Bank plc and HSBC Bank USA, for alleged anti-competitive behaviour in the South African foreign exchange market. In August 2020, HSBC Bank plc and HSBC Bank USA filed an application to dismiss the revised complaint, which remains pending.
Beginning in 2013, various HSBC companies and other banks have been named as defendants in a number of putative class actions filed in, or transferred to, the New York District Court arising from allegations that the defendants conspired to manipulate foreign exchange rates. HSBC has reached class settlements with 2 groups of plaintiffs, including direct and indirect purchasers of foreign exchange products, and the court has granted final approval of these settlements. A putative class action by a group of retail customers of foreign exchange products remains pending.
In September 2018, various HSBC companies and other banks were named as defendants in 2 motions for certification of class actions filed in Israel alleging foreign exchange-related misconduct. In July 2019, the Tel Aviv Court allowed the plaintiffs to consolidate their claims and, in September 2019, the plaintiffs filed a motion for certification of the consolidated class action. In August 2020, HSBC Bank plc filed a motion to dismiss and, in January 2021, HSBC Holdings filed a motion seeking to challenge the service of the motion for certification on defendants outside Israel. These motions remain pending.
In November and December 2018, complaints alleging foreign exchange-related misconduct were filed in the New York District Court and the High Court of England and Wales against HSBC and other defendants by certain plaintiffs that opted out of the direct purchaser class action settlement in the US. These matters remain pending. Additionally, in May 2021, 2 civil actions were filed in Brazil alleging foreign exchange-related misconduct by various banks, including HSBC, for the period from 2007 to 2013. HSBC has not yet been served with these actions. It is possible that additional civil actions will be initiated against HSBC in relation to its historical foreign exchange activities.
There are many factors that may affect the range of outcomes, and the resulting financial impact, of these matters, which could be significant.
Precious metals fix-related litigation
Gold: Beginning in March 2014, numerous putative class actions were filed in the New York District Court and the US District Courts for the District of New Jersey and the Northern District of California, naming HSBC and other members of The London Gold Market Fixing Limited as defendants. The complaints, which were consolidated in the New York District Court, allege that, from January 2004 to June 2013, the defendants conspired to manipulate the price of gold and gold derivatives for their collective benefit in violation of US antitrust laws, the US CEA and New York state law. In October 2020, HSBC reached a settlement in principle with the plaintiffs to resolve the consolidated action. The settlement remains subject to court approval.
Beginning in December 2015, numerous putative class actions under Canadian law were filed in the Ontario and Quebec Superior Courts of Justice against various HSBC companies and other financial institutions. The plaintiffs allege that, among other things, from January 2004 to March 2014, the defendants conspired to manipulate the price of gold and gold derivatives in violation of the Canadian Competition Act and common law. These actions are ongoing.
Silver: Beginning in July 2014, numerous putative class actions were filed in federal district courts in New York, naming HSBC and other members of The London Silver Market Fixing Limited as defendants. The complaints allege that, from January 2007 to December 2013, the defendants conspired to manipulate the price of silver and silver derivatives for their collective benefit in violation of US antitrust laws, the US CEA and New York state law. The actions were consolidated in the New York District Court, and discovery is proceeding.
In April 2016, 2 putative class actions under Canadian law were filed in the Ontario and Quebec Superior Courts of Justice against various HSBC companies and other financial institutions. The plaintiffs in both actions allege that, from January 1999 to August 2014, the defendants conspired to manipulate the price of silver and silver derivatives in violation of the Canadian Competition Act and common law. These actions are ongoing.
Platinum and palladium: Between late 2014 and early 2015, numerous putative class actions were filed in the New York District Court, naming HSBC and other members of The London Platinum and Palladium Fixing Company Limited as defendants. The complaints allege that, from January 2008 to November 2014, the defendants conspired to manipulate the price of platinum group metals (‘PGM’) and PGM-based financial products for their collective benefit in violation of US antitrust laws and the US CEA. In March 2020, the court granted the defendants' motion to dismiss the plaintiffs’ third amended complaint but granted the plaintiffs leave to re-plead certain claims. The plaintiffs have filed an appeal.
Based on the facts currently known, it is not practicable at this time for HSBC to predict the resolution of these matters, including the timing or any possible impact on HSBC, which could be significant.
Film finance litigation
In July and November 2015, 2 actions were brought by individuals against HSBC Private Bank (UK) Limited (‘PBGB’) in the High Court of England and Wales seeking damages on various alleged grounds, including breach of duty to the claimants, in connection with their participation in certain Ingenious film finance schemes. These actions are ongoing.
In December 2018, a separate action was brought against PBGB in the High Court of England and Wales by multiple claimants seeking damages for alleged unlawful means conspiracy and dishonest assistance in connection with lending provided by PBGB to third parties in respect of certain Ingenious film finance schemes in which the claimants participated. In June 2019, a similar claim was issued against PBGB in the High Court of England and Wales by additional claimants. These actions are ongoing.
In June 2020, 2 separate claims were issued against HSBC UK Bank plc (as successor to PBGB’s business) in the High Court of England and Wales by 2 separate groups of investors in Eclipse film finance schemes in connection with PBGB’s role in the development of such schemes. These actions are ongoing.
In April 2021, HSBC UK Bank plc (as successor to PBGB’s business) was served with a claim issued in the High Court of England and Wales in connection with PBGB’s role in the development of the Zeus film finance schemes. This action is at an early stage.
It is possible that additional actions or investigations will be initiated against HSBC UK Bank plc as a result of PBGB’s historical involvement in the provision of certain film finance-related services.
Based on the facts currently known, it is not practicable to predict the resolution of these matters, including the timing or any possible impact on HSBC, which could be significant.
Other regulatory investigations, reviews and litigation
HSBC Holdings and/or certain of its affiliates are subject to a number of other investigations and reviews by various regulators and competition and law enforcement authorities, as well as litigation, in connection with various matters relating to the firm’s businesses and operations, including:
•investigations by tax administration, regulatory and law enforcement authorities in Argentina, India and elsewhere in connection with allegations of tax evasion or tax fraud, money laundering and unlawful cross-border banking solicitation;
•an investigation by the US Commodity Futures Trading Commission regarding interest rate swap transactions related to, among other things, bond issuances;
•an investigation by the FCA in connection with collections and recoveries operations in the UK;
•an investigation by the UK Competition and Markets Authority concerning the financial services sector;
•a putative class action brought in the New York District Court relating to the Mexican government bond market;
•2 group actions pending in the US courts and a claim issued in the High Court of England and Wales in connection with HSBC Bank plc’s role as a correspondent bank to Stanford International Bank Ltd from 2003 to 2009; and
•litigation brought against various HSBC companies in the US courts relating to residential mortgage-backed securities, based primarily on (a) claims brought against HSBC Bank USA in connection with its role as trustee on behalf of various securitisation trusts; and (b) claims against several HSBC companies seeking that the defendants repurchase various mortgage loans.
There are many factors that may affect the range of outcomes, and the resulting financial impact, of these matters, which could be significant.
| | | | | |
| 14 | Transactions with related parties |
There were 0 changes in the related party transactions described in the Annual Report and Accounts 2020 that have had a material effect on the financial position or performance of HSBC in the half-year to 30 June 2021. All related party transactions that took place in the half-year to 30 June 2021 were similar in nature to those disclosed in the Annual Report and Accounts 2020.
In the first half of 2021, we accelerated the pace of execution on our strategic ambition to be the preferred international financial partner for our clients with the announcements of the potential sale of our retail banking businesses in France, as well as the exit of domestic mass market retail banking in the US.
Potential sale of the retail banking business in France
On 18 June 2021, HSBC Continental Europe signed a memorandum of understanding with Promontoria MMB SAS (‘My Money Group’), its subsidiary Banque des Caraïbes SA and My Money Bank, regarding the potential sale of HSBC Continental Europe’s retail banking business in France.
The potential sale includes: HSBC Continental Europe’s French retail banking business; the Crédit Commercial de France (‘CCF’) brand; and, subject to the satisfaction of relevant conditions, HSBC Continental Europe’s 100% ownership interest in HSBC SFH (France) and its 3% ownership interest in Crédit Logement. The sale would generate an estimated loss before tax including related transaction costs for the Group of $2.3bn, together with an additional $0.7bn impairment of goodwill.
There would be no immediate tax benefit recognised in respect of the sale loss nor impairment. The vast majority of the estimated loss for the write-down of the disposal group to fair value less costs to sell will be recognised when it is classified as held for sale in accordance with IFRS 5, which is currently anticipated to be in 2022. Subsequently, the disposal group classified as held for sale will be remeasured at the lower of carrying amount and fair value less costs to sell at each reporting period. Any remaining gain or loss not previously recognised shall be recognised at the date of derecognition, which is currently anticipated to be in the first half of 2023.
At 30 June 2021, the value of the total assets of the business to be sold was $28.2bn, including $25.6bn of loans and advances to customers, and the value of customer accounts was $23.5bn.
US retail banking business
On 26 May 2021, we announced that we will exit our US mass market retail banking business, including our Personal and Advance propositions, as well as retail business banking, and will rebrand approximately 20 to 25 of our retail branches into international wealth centres to serve our Premier and Jade customers. In conjunction with the execution of this strategy, HSBC Bank USA, N.A. has entered into definitive sale agreements with Citizens Bank and Cathay Bank to sell approximately 90 of our retail branches along with substantially all residential mortgage, unsecured and retail business banking loans and all deposits in our branch network not associated with our Premier, Jade and Private Banking customers. Certain assets under management associated with our mass market retail banking business will also be transferred. The remaining branches not sold or rebranded will be closed.
Notes on the interim condensed financial statements (unaudited) I Additional information
The sales are expected to close by the first quarter of 2022, subject to regulatory approval, and are not expected to impact results materially. At 30 June 2021, loans and advances to customers of $2.6bn and customer accounts of $9.9bn related to these transactions met the criteria to be classified as held for sale.
| | | | | |
| 16 | Events after the balance sheet date |
In its assessment of events after the balance sheet date, HSBC has considered and concluded that no material events have occurred resulting in adjustments to the financial statements.
An interim dividend for the 2021 half-year in respect of the financial year ending 31 December 2021 was approved by the Directors on 2 August 2021, as described in Note 3.
| | | | | |
| 17 | Interim Report 2021 and statutory accounts |
The information in this Interim Report 2021 is unaudited and does not constitute statutory accounts within the meaning of section 434 of the Companies Act 2006. This Interim Report 2021 was approved by the Board of Directors on 2 August 2021. The statutory accounts of HSBC Holdings plc for the year ended 31 December 2020 have been delivered to the Registrar of Companies in England and Wales in accordance with section 447 of the Companies Act 2006.
| | | | | | | | | | | | | | | | | | | | |
| Shareholder information | |
| | Page | | | | Page |
| 1 | Directors’ interests | | | 11 | Corporate governance | |
| 2 | Employee share plans | | | 12 | Changes in Directors’ details | |
| 3 | Other equity instruments | | | 13 | Going concern basis | |
| 4 | Notifiable interests in share capital | | | 14 | Telephone and online share dealing service | |
| 5 | Dealings in HSBC Holdings listed securities | | | 15 | Stock symbols | |
| 6 | Interim dividend for the 2021 half-year | | | 16 | Copies of the Interim Report 2021 and shareholder enquiries and communications | |
| 7 | Dividend on preference shares | | |
| 8 | Proposed interim dividends for 2021 | | | | | |
| 9 | Earnings release | | | | | |
| 10 | Final results | | | | | |
| | | | | | |
According to the register of Directors’ interests maintained by HSBC Holdings pursuant to section 352 of the Securities and Futures Ordinance of Hong Kong, at 30 June 2021 (or date of retirement from the Board, if earlier) the Directors of HSBC Holdings had the following interests, all beneficial unless otherwise stated, in the shares or debentures of HSBC and its associates:
| | | | | | | | | | | | | | | | | | | | | |
| Directors’ interests – shares and debentures |
| | | At 30 Jun 2021 |
| | At 1 Jan 2021 | Beneficial
owner | Child
under 18
or spouse | Jointly with another person | Trustee | Total
interests |
| HSBC Holdings ordinary shares | | | | | | | |
Laura Cha1 | | 16,200 | | 16,200 | | — | | — | | — | | 16,200 | |
Henri de Castries1 | | 19,251 | | 19,251 | | — | | — | | — | | 19,251 | |
James Forese2 | | 115,000 | | 115,000 | | — | | — | | — | | 115,000 | |
Steven Guggenheimer2 | | 15,000 | | — | | — | | 15,000 | | — | | 15,000 | |
| Irene Lee | | 11,904 | | 15,000 | | — | | — | | — | | 15,000 | |
José Antonio Meade Kuribreña2 | | 15,000 | | 15,000 | | — | | — | | — | | 15,000 | |
Heidi Miller1,2 | | 15,700 | | 15,700 | | — | | — | | — | | 15,700 | |
Eileen Murray2 | | 75,000 | | 75,000 | | | | | 75,000 | |
| David Nish | | 50,000 | | — | | 50,000 | | — | | — | | 50,000 | |
Noel Quinn3 | | 778,958 | | 986,297 | | — | | — | | — | | 986,297 | |
Ewen Stevenson3 | | 545,731 | | 757,135 | | — | | — | | — | | 757,135 | |
Jackson Tai2,4 | | 66,515 | | 32,800 | | 11,965 | | 21,750 | | — | | 66,515 | |
| Mark Tucker | | 307,352 | | 307,352 | | — | | — | | — | | 307,352 | |
| Pauline van der Meer Mohr | | 15,000 | | 15,000 | | — | | — | | — | | 15,000 | |
1 Laura Cha, Henri de Castries and Heidi Miller retired from the Board on 28 May 2021.
2 James Forese has an interest in 23,000, Steven Guggenheimer has an interest in 3,000, José Antonio Meade Kuribreña has an interest in 3,000, Heidi Miller has an interest in 3,140, Eileen Murray has an interest in 15,000 and Jackson Tai has an interest in 13,303 listed American Depositary Shares (‘ADSs’), which are categorised as equity derivatives under Part XV of the Securities and Futures Ordinance of Hong Kong. Each ADS represents five HSBC Holdings ordinary shares.
3 Executive Directors’ other interests in HSBC Holdings ordinary shares arising from the HSBC Holdings Savings-Related Share Option Plan (UK) and the HSBC Share Plan 2011 are set out on the following pages. At 30 June 2021, the aggregate interests under the Securities and Futures Ordinance of Hong Kong in HSBC Holdings ordinary shares, including interests arising through employee share plans, were: Noel Quinn – 2,585,804 and Ewen Stevenson – 2,377,832. Each Director’s total interests represents around 0.01% of the shares in issue and 0.01% of the shares in issue excluding treasury shares.
4 Jackson Tai’s holding includes a non-beneficial interest in 11,965 shares of which he is custodian.
Savings-Related Share Option Plan
Currently no executive Directors participate in a Savings-Related Share Option Plan. For further details on the Savings-Related Share Option Plan, see page 127.
HSBC Share Plan 2011
Conditional awards of deferred shares
Vesting of deferred share awards is normally subject to the Director remaining an employee on the vesting date. The awards may vest at an earlier date in certain circumstances. Under the Securities and Futures Ordinance of Hong Kong, interests in conditional share awards are categorised as the interests of the beneficial owner.
| | | | | | | | | | | | | | | | | | | | | | | | | | | |
| Deferred share awards |
| | | | HSBC Holdings ordinary shares |
| Date of award | | Year in which
awards may
vest | Awards
held at | Awards made during
the period to 30 Jun 2021 | Awards vested during the period to 30 Jun 2021 | Awards
held at |
| 1 Jan 2021 | Number | Monetary value | Number | Monetary value | 30 Jun
2021 |
| | | | | £000 | | £000 | |
| | | | | | | | | |
| Noel Quinn | 29/2/20161 | | 2021 | 38,910 | | — | | — | | 39,8852 | 169 | | — | |
27/2/20173 | | 2020–2024 | 65,836 | | — | | — | | 14,851 | | 63 | | 52,6472 |
26/2/20184 | | 2021–2025 | 107,523 | | — | | — | | 21,504 | | 91 | | 86,019 | |
25/2/20195 | | 2022–2026 | 140,585 | | — | | — | | — | | — | | 140,585 | |
24/2/20206 | | 2023–2027 | 201,702 | | — | | — | | — | | — | | 201,702 | |
1/3/20217 | | 2021 | — | | 187,470 | | 799 | | 187,470 | | 799 | | — | |
| Ewen Stevenson | 28/5/20198 | | 2020–2025 | 486,802 | | — | | — | | 222,047 | | 948 | | 264,755 |
28/5/20199 | | 2022–2026 | 241,988 | | | | — | | — | | 241,988 | |
1/3/20217 | | 2021 | — | | 105,584 | | 450 | | 105,584 | | 450 | | — | |
1At the date of the award (29 February 2016), the market value per share was £4.6735. The award vested in full on 15 March 2021 at a market value of £4.2464.
2Includes any additional shares arising from dividend equivalents.
3At the date of the award (27 February 2017), the market value per share was £6.5030. The award will vest in five equal annual tranches. The second tranche vested on 12 March 2021 at a market value of £4.2712. Shares equivalent in number to those that vest under the award (net of tax liabilities) must be retained for six months from the vesting date.
4At the date of the award (26 February 2018), the market value per share was £7.2340. Shares equivalent in number to those that vest under the award (net of tax liabilities) must be retained for one year from the vesting date. The award will vest in five equal annual tranches. The first tranche vested on 11 March 2021 at a market value of £4.2538.
5At the date of the award (25 February 2019), the market value per share was £6.2350. Shares equivalent in number to those that vest under the award (net of tax liabilities) must be retained for one year from the vesting date. The award will vest in five equal annual tranches commencing in March 2022.
6At the date of the award (24 February 2020), the market value per share was £5.6220. Shares equivalent in number to those that vest under the award (net of tax liabilities) must be retained for one year from the vesting date. The award will vest in five equal annual tranches commencing in March 2023.
7The non-deferred award vested immediately on 1 March 2021 and was based on the market value of £4.2620. Shares equivalent in number to those that vest under the award (net of tax liabilities) must be retained for one year from the vesting date.
8The award was granted on 28 May 2019 using a market value per share of £6.6430 as at 30 November 2018. Shares equivalent in number to those that vest under the award (net of tax liabilities) must be retained for up to one year from the vesting date. The second tranche vested on
12 March 2021 and was based on a market value of £4.2712. The award replaced the 2015 to 2018 long-term incentive (‘LTI’) plans forfeited by the Royal Bank of Scotland Group plc (‘RBS’) and is subject to any performance adjustments assessed and disclosed in the relevant annual report and accounts of RBS.
9The award was granted on 28 May 2019 using a market value per share of £6.2350 as at 22 February 2019. Shares equivalent in number to those that vest under the award (net of tax liabilities) must be retained for up to one year from the vesting date. The award will vest in five annual tranches commencing in March 2022. The award is in respect of the 2018 performance year granted based on Ewen Stevenson’s maximum opportunity under RBS’s policy and the outcome of the 2018 scorecard as disclosed in RBS's Annual Report and Accounts 2018. The number of shares that vest may be adjusted based on any ‘pre-vest performance test’ assessed and disclosed in RBS’s Annual Report and Accounts.
Long-term incentive awards
The long-term incentive award is an award of shares with a three-year performance period. At the end of this performance period and subject to the award terms, the number of shares that vest will be determined based on an assessment against financial and non-financial measures. Subject to that assessment, the shares will vest in five equal annual instalments. On vesting, awards are subject to a retention period of up to one year. Under the Securities and Futures Ordinance of Hong Kong, interests in share awards are categorised as interests of the beneficial owner.
| | | | | | | | | | | | | | | | | | | | | | | | | | | |
| Long-term incentive awards |
| | | | HSBC Holdings ordinary shares |
| Date of award1 | | Year in which
awards may
vest | Awards
held at | Awards made during
the period to 30 Jun 2021 | Awards vested during
the period to 30 Jun 2021 | Awards
held at |
| 1 Jan 2021 | Number | Monetary
value | Number | Monetary
value | 30 Jun 2021 |
| | | | | | £000 | | £000 | |
| | | | | | | | | |
| | | | | | | | | |
| | | | | | | | | |
| | | | | | | | | |
| Noel Quinn | 1 Mar 2021 | | 2024–2028 | — | | 1,118,554 | | 4,767 | | — | | — | | 1,118,554 | |
| Ewen Stevenson | 24 Feb 2020 | | 2023–2027 | 476,757 | | — | | — | | — | | — | | 476,757 | |
| 1 Mar 2021 | | 2024–2028 | — | | 637,197 | | 2,716 | | — | | — | | 637,197 | |
1 Awards made on 24 February 2020 were based on the market value of £5.6220 and awards made on 1 March 2021 were based on the market value of £4.2620.
No Directors held any short position (as defined in the Securities and Futures Ordinance of Hong Kong) in the shares or debentures of HSBC Holdings and its associated corporations. Save as stated in the tables above, none of the Directors had an interest in any shares or debentures of HSBC Holdings or any associates at the beginning or at the end of the period, and none of the Directors or members of their immediate families were awarded or exercised any right to subscribe for any shares or debentures in any HSBC corporation during the period.
There have been no changes in the shares or debentures of the Directors from 30 June 2021 to the date of this report.
Share options and discretionary awards of shares are granted under HSBC share plans to help align the interests of employees with those of shareholders. The following are particulars of outstanding share options, including those held by employees working under employment contracts that are regarded as ‘continuous contracts’ for the purposes of the Hong Kong Employment Ordinance. The options were granted at nil consideration. No options have been granted to substantial shareholders, suppliers of goods or services, or in excess of the individual limit for each share plan. No options were cancelled by HSBC during the period to 30 June 2021.
A summary of the total number of options granted, exercised or lapsed during the period is shown in the following table. Particulars of options held by Directors of HSBC Holdings are set out on page 125. Further details required to be disclosed pursuant to Chapter 17 of the Rules Governing the Listing of Securities on The Stock Exchange of Hong Kong Limited are available on our website at www.hsbc.com, and on the website of The Stock Exchange of Hong Kong Limited at www.hkex.com.hk. Copies may be obtained upon request from the Group Company Secretary and Chief Governance Officer, 8 Canada Square, London E14 5HQ.
All-employee share plans
The HSBC Holdings Savings-Related Share Option Plan (UK) is an all-employee share plan under which eligible employees have been granted options to acquire HSBC Holdings ordinary shares. The HSBC International Employee Share Purchase Plan was introduced in 2013 and now includes employees based in 27 jurisdictions, although no options are granted under this plan. During 2020, approximately 171,000 employees were offered participation in these plans.
For options granted under the HSBC Holdings Savings-Related Share Option Plan (UK), employees may make contributions of up to £500 each month over a period of three or five years. The contributions may be used within six months following the third or fifth anniversary of the commencement of the relevant savings contract, at the employee’s election, to exercise the options. Alternatively, the employee may elect to have the savings, plus (where applicable) any interest or bonus, repaid in cash. In the case of redundancy, ceasing employment on grounds of injury or disability, retirement, death, the transfer of the employing business to another party, or a change of control of the employing company, options may be exercised before completion of the relevant savings contract. In certain circumstances, the exercise period of options awarded under the all-employee share option plans may be extended; for example, on the death of a participant, the executors may exercise the option up to six months beyond the normal exercise period or, if a participant has chosen to defer up to 12 contributions, the start of the normal exercise period will be delayed by up to 12 months.
Under the HSBC Holdings Savings-Related Share Option Plan (UK), the option exercise price is determined by reference to the average market value of the HSBC Holdings ordinary shares on the five business days immediately preceding the invitation date, then applying a discount of 20%. The HSBC Holdings Savings-Related Share Option Plan (UK) has an expiry date of 24 April 2030 (by which time the plan may be extended with approval from shareholders) unless the Directors resolve to terminate the plan at an earlier date.
| | | | | | | | | | | | | | | | | | | | | | | | | | | | | | | | | |
| HSBC Holdings all-employee share option plan |
| | | | HSBC Holdings ordinary shares |
| Dates of award | Exercise price | Usually exercisable | | 1 Jan 2021 | Granted
in period | Exercised
in period | Lapsed
in period | 30 Jun 2021 |
| from | to | from | to | from | to | |
HSBC Savings-Related Share Option Plan (UK)1 | | | | | | |
| 22 Sep 2015 | 24 Sep
2020 | (£)
2.6270 | (£)
5.9640 | 1 Nov 2019 | 30 April 2026 | | 130,952,539 | | — | | 2,991,699 | | 10,054,766 | | 117,906,074 | |
1The weighted average closing price of the shares immediately before the dates on which options were exercised was £4.3567.
| | | | | |
| 3 | Other equity instruments |
Additional tier 1 capital – contingent convertible securities
HSBC Holdings continues to issue contingent convertible securities that are included in its capital base as fully CRR II-compliant additional tier 1 capital securities on an end point basis. These securities are marketed principally and subsequently allotted to corporate investors and fund managers. The net proceeds of the issuances are typically used for HSBC Holdings’ general corporate purposes and to further strengthen its capital base to meet requirements under CRR II. These securities bear a fixed rate of interest until their initial call dates. After the initial call dates, if they are not redeemed, the securities will bear interest at rates fixed periodically in advance for five-year periods based on credit spreads, fixed at issuance, above prevailing market rates. Interest on the contingent convertible securities will be due and payable only at our sole discretion of HSBC Holdings, and HSBC Holdings has sole and absolute discretion at all times to cancel for any reason (in whole or part) any interest payment that would otherwise be payable on any payment date. Distributions will not be paid if they are prohibited under UK banking regulations or if the Group has insufficient reserves or fails to meet the solvency conditions defined in the securities’ terms.
The contingent convertible securities are undated and are repayable at the option of HSBC Holdings in whole typically at the initial call date or on any fifth anniversary after this date. In addition, the securities are repayable at the option of HSBC in whole for certain regulatory or tax reasons. Any repayments require the prior consent of the PRA. These securities rank pari passu with HSBC Holdings’ sterling preference share and therefore rank ahead of ordinary shares. The contingent convertible securities will be converted into fully paid ordinary shares of HSBC Holdings at a predetermined price, should HSBC’s consolidated non-transitional CET1 ratio fall below 7.0%. Therefore, in accordance with the terms of the securities, if the non-transitional CET1 ratio breaches the 7.0% trigger, the securities will convert into ordinary shares at the fixed contractual conversion prices in the issuance currencies of the relevant securities, equivalent to £2.70 at the prevailing rate of exchange on the issuance date, subject to anti-dilution adjustments. During the first half of 2021, HSBC issued $2,000m of contingent convertible securities across two issuances of $1,000m each.
| | | | | |
| 4 | Notifiable interests in share capital |
Between 1 January 2021 and 30 June 2021, HSBC Holdings had not received any notifications of major holdings of voting rights pursuant to the requirements of Rule 5 of the UK Disclosure Guidance and Transparency Rules.
At 30 June 2021, as recorded in the register maintained by HSBC Holdings pursuant to section 336 of the Securities and Futures Ordinance of Hong Kong:
•BlackRock, Inc. gave notice on 30 June 2021 that on 25 June 2021 it had the following interests in HSBC Holdings ordinary shares:
a long position of 1,658,733,707 shares and a short position of 14,678,994 shares, representing 7.99% and 0.07% respectively, of the ordinary shares in issue at that date.
•Ping An Asset Management Co., Ltd, gave notice on 25 September 2020 that on 23 September 2020 it had a long position of 1,655,479,531 in HSBC Holdings ordinary shares, representing 8.00% of the ordinary shares in issue at that date.
| | | | | |
| 5 | Dealings in HSBC Holdings listed securities |
HSBC has policies and procedures that, except where permitted by statute and regulation, prohibit it undertaking specified transactions in respect of its securities listed on The Stock Exchange of Hong Kong Limited (‘HKEx’). Except for dealings as intermediaries or as trustees by subsidiaries of HSBC Holdings, neither HSBC Holdings nor any of its subsidiaries has purchased, sold or redeemed any of its securities listed on HKEx during the half-year ended 30 June 2021.
| | | | | |
| 6 | Interim dividend for the 2021 half-year |
On 2 August 2021, the Directors approved an interim dividend for the 2021 half-year of $0.07 per ordinary share in respect of the financial year ending 31 December 2021. The dividend will be payable on 30 September 2021 to holders on the Principal Register in the UK, the Hong Kong Overseas Branch Register or the Bermuda Overseas Branch Register on 20 August 2021.
The dividend will be payable in US dollars, or in pounds sterling or Hong Kong dollars at the forward exchange rates quoted by HSBC Bank plc in London at or about 11.00am on 20 September 2021, or a combination of these currencies. Particulars of these arrangements will be sent to shareholders on or about 27 August 2021 and changes to currency elections must be received by 16 September 2021. The ordinary shares in London, Hong Kong and Bermuda, and American Depositary Shares (‘ADSs’) in New York will be quoted ex-dividend on 19 August 2021. As announced on 23 February 2021, the Group has decided to discontinue the scrip dividend option.
The dividend will be payable on ADSs, each of which represents five ordinary shares, on 30 September 2021 to holders of record on
20 August 2021. The dividend of $0.35 per ADS will be payable by the depositary in US dollars. Alternatively, the cash dividend may be invested in additional ADSs by participants in the dividend reinvestment plan operated by the depositary. Elections must be received by 10 September 2021.
Any person who has acquired ordinary shares registered on the Principal Register in the UK, the Hong Kong Overseas Branch Register or the Bermuda Overseas Branch Register but who has not lodged the share transfer with the Principal Registrar in the UK, Hong Kong Overseas Branch Registrar or Bermuda Overseas Branch registrar should do so before 4.00pm local time on 20 August 2021 in order to receive the dividend.
Ordinary shares may not be removed from or transferred to the Principal Register in the UK, the Hong Kong Overseas Branch Register or the Bermuda Overseas Branch Register on 20 August 2021. Any person wishing to remove ordinary shares to or from each register must do so before 4.00pm local time on 19 August 2021.
Transfer of ADSs must be lodged with the depositary by 11.00am on 20 August 2021 in order to receive the dividend. ADS holders who receive a cash dividend will be charged a fee, which will be deducted by the depositary, of $0.005 per ADS per cash dividend.
| | | | | |
| 7 | Dividend on preference share |
A quarterly dividend of £0.01 per Series A sterling preference share is payable on 15 March, 15 June, 15 September and 15 December 2021 for the quarter then ended at the sole and absolute discretion of the Board of HSBC Holdings plc. Accordingly, the Board of HSBC Holdings plc has approved a quarterly dividend to be payable on 15 September 2021 to holders of record on 31 August 2021.
| | | | | |
| 8 | Proposed interim dividends for 2021 |
As announced on 23 February 2021, the Group will not be paying quarterly dividends during 2021 but will consider whether to announce a further interim dividend at the 2021 results announcement in February 2022. The Group will review whether to revert to paying quarterly dividends at or ahead of its 2021 results announcement in February 2022. The Board has adopted a policy designed to provide sustainable cash dividends, while retaining the flexibility to invest and grow the business in the future, supplemented by additional shareholder distributions, if appropriate. Reflecting the current improved economic outlook and operating environment in many of our markets, we now expect to move within our target dividend payout ratio of 40% to 55% of reported earnings per ordinary share (‘EPS’) in 2021, with the flexibility to adjust EPS for non-cash significant items. Additionally, in 2022, we intend to adjust EPS to exclude the forecast loss on the sale of our retail banking operations in France.
Dividends are declared in US dollars and, at the election of the shareholder, paid in cash in one of, or in a combination of, US dollars, pounds sterling and Hong Kong dollars.
An earnings release for the three-month period ending 30 September 2021 is expected to be issued on 25 October 2021.
The results for the year to 31 December 2021 are expected to be announced on 22 February 2022.
We are subject to corporate governance requirements in both the UK and Hong Kong. Throughout the six months ended 30 June 2021, we complied with the applicable provisions of the UK Corporate Governance Code and also the requirements of the Hong Kong Corporate Governance Code. The UK Corporate Governance Code is available at www.frc.org.uk and the Hong Kong Corporate Governance Code is available at www.hkex.com.hk.
Under the Hong Kong Code, the Group Audit Committee should be responsible for the oversight of all risk management and internal control systems, unless expressly addressed by a separate risk committee. Our Group Risk Committee is responsible for oversight of internal control, other than internal financial controls, and risk management systems.
The Board has codified obligations for transactions in Group securities in accordance with the requirements of the Market Abuse Regulation and the rules governing the listing of securities on the HKEx, save that the HKEx has granted waivers from strict compliance with the rules that take into account accepted practices in the UK, particularly in respect of employee share plans.
Following specific enquiries all Directors have confirmed that they have complied with their obligations in respect of transacting in Group securities throughout the period.
There have been no material changes to the information disclosed in the Annual Report and Accounts 2020 in respect of the remuneration of employees, remuneration policies, bonus and share option plans and training schemes. Details of the number of employees are provided on page 31 of the Interim Report 2021.
| | | | | |
| 12 | Changes in Directors’ details |
Changes in current Directors’ details since the date of the Annual Report and Accounts 2020, which are required to be disclosed pursuant to Rule 13.51(2) and Rule 13.51B(1) of the Hong Kong Listing Rules, are set out below.
Henri de Castries
Retired from the Board, Group Remuneration Committee and Nomination & Corporate Governance Committee on 28 May 2021.
Laura Cha, GBM
Retired from the Board and Nomination & Corporate Governance Committee on 28 May 2021.
Irene Lee
Stepped down from the Group Remuneration Committee on 28 May 2021.
José Antonio Meade Kuribreña
Appointed as a member to the Group Remuneration Committee on 28 May 2021.
Heidi Miller
Retired from the Board, Group Risk Committee and Nomination & Corporate Governance Committee on 28 May 2021.
Eileen Murray
Stepped down from the Group Audit Committee on 28 May 2021.
Pauline van der Meer Mohr
Stepped down from the Group Risk Committee on 28 May 2021.
David Nish
Stepped down from the Group Remuneration Committee on 23 February 2021.
As mentioned in Note 1 ‘Basis of preparation and significant accounting policies’ on page 104, the financial statements are prepared on a going concern basis as the Directors are satisfied that the Group and parent company have the resources to continue in business for the foreseeable future. In making this assessment, the Directors considered a wide range of information relating to present and future conditions, including future projections of profitability, cash flows, capital requirements and capital resources. These considerations include stressed scenarios that reflect the increasing uncertainty that the global Covid-19 pandemic has had on HSBC’s operations, as well as the potential impacts from other top and emerging risks, and the related impact on profitability, capital and liquidity.
In particular, HSBC’s principal activities, business and operating models, strategic direction, and top and emerging risks are addressed in the Overview section. A financial summary, including a review of the consolidated income statement and consolidated balance sheet, is provided in the ‘Interim management report’ section. HSBC’s objectives, policies and processes for managing credit, liquidity and market risk are described in the Risk section of the Annual Report and Accounts 2020. HSBC’s approach to capital management and allocation is described in the ‘Treasury risk’ section of the Annual Report and Accounts 2020.
| | | | | |
| 14 | Telephone and online share dealing service |
For shareholders on the Principal Register who are resident in the UK, with a UK postal address, and who hold an HSBC Bank plc personal current account, the HSBC InvestDirect share dealing service is available for buying and selling HSBC Holdings plc ordinary shares. Details are available from: HSBC InvestDirect, Forum 1, Parkway, Whiteley PO15 7PA; or UK telephone: +44 (0) 3456 080848, or from an overseas telephone: +44 (0) 1226 261090; or website: www.hsbc.co.uk/investments/products-and-services/invest-direct.
HSBC Holdings plc ordinary shares trade under the following stock symbols:
| | | | | |
| London Stock Exchange | HSBA* |
| Hong Kong Stock Exchange | 5 |
| New York Stock Exchange (ADS) | HSBC |
| Bermuda Stock Exchange | HSBC.BH |
| *HSBC’s primary market | |
| | | | | |
| 16 | Copies of the Interim Report 2021 and shareholder enquiries and communications |
Further copies of the Interim Report 2021 may be obtained from Global Communications, HSBC Holdings plc, 8 Canada Square, London E14 5HQ, United Kingdom; from Communications (Asia), The Hongkong and Shanghai Banking Corporation Limited, 1 Queen’s Road Central, Hong Kong; or from US Communications, HSBC Bank USA, N.A., 1 West 39th Street, 9th Floor, New York, NY 10018, USA. The Interim Report 2021 may also be downloaded from the HSBC website, www.hsbc.com.
Shareholders may at any time choose to receive corporate communications in printed form or to receive notifications of their availability on HSBC’s website. To receive notifications of the availability of a corporate communication on HSBC’s website by email, or to revoke or amend an instruction to receive such notifications by email, go to www.hsbc.com/ecomms. If you provide an email address to receive electronic communications from HSBC, we will also send notifications of any future dividend entitlements by email. If you received a notification of the availability of this document on HSBC’s website and would like to receive a printed copy or, if you would like to receive future corporate communications in printed form, please write or send an email (quoting your shareholder reference number) to the appropriate Registrar at the address given below. Printed copies will be provided without charge.
Any enquiries relating to your shareholdings on the share register (for example transfers of shares, change of name or address, lost share certificates or dividend cheques) should be sent to the Registrar at the address given below. The Registrars offer an online facility, Investor Centre, which enables shareholders to manage their shareholding electronically.
| | | | | | | | |
| Principal Register | Hong Kong Overseas Branch Register | Bermuda Overseas Branch Register |
Computershare Investor Services PLC The Pavilions Bridgwater Road Bristol BS99 6ZZ United Kingdom | Computershare Hong Kong Investor Services Limited Rooms 1712-1716, 17th Floor Hopewell Centre 183 Queen’s Road East Hong Kong | Investor Relations Team HSBC Bank Bermuda Limited 37 Front Street Hamilton HM 11 Bermuda |
Telephone: +44 (0) 370 702 0137 Email: web.queries@computershare.co.uk Web: www.investorcentre.co.uk/contactus | Telephone: +852 2862 8555 Email: hsbc.ecom@computershare.com.hk Web: www.investorcentre.com/hk | Telephone: +1 441 299 6737 Email: hbbm.shareholder.services@hsbc.bm Web: www.investorcentre.com/bm |
Any enquiries relating to ADSs should be sent to the depositary at:
| | | | | |
The Bank of New York Mellon Shareowner Services PO Box 505000 Louisville, KY 40233-5000 USA | Telephone (US): +1 877 283 5786 Telephone (international): +1 201 680 6825 Email: shrrelations@cpushareownerservices.com Web: www.mybnymdr.com |
A Chinese translation of this and future documents may be obtained on request from the Registrar. Please also contact the Registrar if you have received a Chinese translation of this document and do not wish to receive such translations in future.
Persons whose shares are held on their behalf by another person may have been nominated to receive communications from HSBC pursuant to section 146 of the UK Companies Act 2006 (‘nominated person’). The main point of contact for a nominated person remains the registered shareholder (for example your stockbroker, investment manager, custodian or other person who manages the investment on your behalf). Any changes or queries relating to a nominated person’s personal details and holding (including any administration thereof) must continue to be directed to the registered shareholder and not HSBC’s Registrar. The only exception is where HSBC, in exercising one of its powers under the UK Companies Act 2006, writes to nominated persons directly for a response.

| | | | | |
| Currencies | |
| £ | British pound sterling |
| CA$ | Canadian dollar |
| € | Euro |
| HK$ | Hong Kong dollar |
| RMB | Chinese renminbi |
| SGD | Singapore dollar |
| $ | United States dollar |
| Abbreviation | |
| 1H20 | First half of 2020 |
| 1H21 | First half of 2021 |
| 1Q20 | First quarter of 2020 |
| 1Q21 | First quarter of 2021 |
| 2H20 | Second half of 2020 |
| 2Q20 | Second quarter of 2020 |
| 2Q21 | Second quarter of 2021 |
| 4Q20 | Fourth quarter of 2020 |
| A | |
| ABS | Asset-backed security |
| ADS | American Depositary Share |
| AGM | Annual General Meeting |
| AIEA | Average interest-earning assets |
| ALCM | Asset, Liability and Capital Management |
| ALCO | Asset and Liability Management Committee |
| AML | Anti-money laundering |
| ANP | Annualised new business premiums |
| ASEAN | Association of Southeast Asian Nations |
| AT1 | Additional tier 1 |
| B | |
| Basel | Basel Committee on Banking Supervision |
| Basel III | Basel Committee’s reforms to strengthen global capital and liquidity rules |
| BoCom | Bank of Communications Co., Limited, one of China’s largest banks |
| BoE | Bank of England |
| Bps | Basis points. One basis point is equal to one hundredth of a percentage point |
| BVI | British Virgin Islands |
| C | |
| C&L | Credit and Lending |
| CAPM | Capital asset pricing model |
| CEA | Commodity Exchange Act (US) |
| CET1 | Common equity tier 1 |
| CMB | Commercial Banking, a global business |
| CMC | Capital maintenance charge |
| CODM | Chief Operating Decision Maker |
| CRD IV | Capital Requirements Regulation and Directive |
| CRR | Customer risk rating |
| CRR II | Revised Capital Requirements Regulation and Directive, as implemented |
| D | |
| DoJ | US Department of Justice |
| DPA | Deferred prosecution agreement (US) |
| DPD | Days past due |
| DPF | Discretionary participation feature of insurance and investment contracts |
| DVA | Debt valuation adjustment |
| E | |
| EBA | European Banking Authority |
| EC | European Commission |
| ECB | European Central Bank |
| ECL | Expected credit losses. In the income statement, ECL is recorded as a change in expected credit losses and other credit impairment charges. In the balance sheet, ECL is recorded as an allowance for financial instruments to which only the impairment requirements in IFRS 9 are applied. |
| EEA | European Economic Area |
| Eonia | Euro Overnight Index Average |
| | | | | |
| EPS | Earnings per ordinary share |
| ESG | Environmental, social and governance |
| €STR | Euro short-term rate |
| EU | European Union |
| Euribor | Euro interbank offered rate |
| EVE | Economic value of equity |
| F | |
| FCA | Financial Conduct Authority (UK) |
| FRB | Federal Reserve Board (US) |
| FSTF | Financial Services Task Force |
| FTE | Full-time equivalent staff |
| FVOCI | Fair value through other comprehensive income |
| FX | Foreign exchange |
| FX DPA | Three-year deferred prosecution agreement with the US Department of Justice, entered into in January 2018 |
| G | |
| GAAP | Generally accepted accounting principles |
| GBM | Global Banking and Markets, a global business |
| GDP | Gross domestic product |
| GEC | Group Executive Committee |
| GLCM | Global Liquidity and Cash Management |
| Group | HSBC Holdings together with its subsidiary undertakings |
| GTRF | Global Trade and Receivables Finance |
| H | |
| HKEx | The Stock Exchange of Hong Kong Limited |
| HKMA | Hong Kong Monetary Authority |
| HNAH | HSBC North America Holdings Inc. |
| Holdings ALCO | HSBC Holdings Asset and Liability Management Committee |
| Hong Kong | Hong Kong Special Administrative Region of the People’s Republic of China |
| HQLA | High-quality liquid assets |
| HSBC | HSBC Holdings together with its subsidiary undertakings |
| HSBC Bank | HSBC Bank plc, also known as the non-ring-fenced bank |
| HSBC Bank Middle East | HSBC Bank Middle East Limited |
| HSBC Bank USA | HSBC Bank USA, N.A., HSBC’s retail bank in the US |
| HSBC Canada | The sub-group, HSBC Bank Canada, HSBC Trust Company Canada, HSBC Mortgage Corporation Canada and HSBC Securities Canada, consolidated for liquidity purposes |
| HSBC Continental Europe | HSBC Continental Europe |
| HSBC Finance | HSBC Finance Corporation, the US consumer finance company (formerly Household International, Inc.) |
| HSBC Holdings | HSBC Holdings plc, the parent company of HSBC |
| HSBC Private Bank (Suisse) | HSBC Private Bank (Suisse) SA, HSBC’s private bank in Switzerland |
| HSBC UK | HSBC UK Bank plc, also known as the ring-fenced bank |
| HSBC USA | The sub-group, HSBC USA Inc and HSBC Bank USA, consolidated for liquidity purposes |
| HSI | HSBC Securities (USA) Inc. |
| HSSL | HSBC Securities Services (Luxembourg) |
| HTIE | HSBC Institutional Trust Services (Ireland) Limited |
| I | |
| IAS | International Accounting Standards |
| IASB | International Accounting Standards Board |
| IBA | ICE Benchmark Administration |
| Ibor | Interbank offered rate |
| ICAAP | Internal capital adequacy assessment process |
| IFRSs | International Financial Reporting Standards |
| ILAAP | Internal liquidity adequacy assessment process |
| ILM | Internal liquidity metric |
| IRB | Internal ratings-based |
| ISDA | International Swaps and Derivatives Association |
| |
| L | |
| LCR | Liquidity coverage ratio |
| LGBT+ | Lesbian, gay, bisexual and transgender. The plus sign denotes other non-mainstream groups on the spectrums of sexual orientation and gender identity |
| LGD | Loss given default |
| | | | | |
| Libor | London interbank offered rate |
| LTI | Long-term incentive |
| LTV | Loan to value |
| M | |
| Mainland China | People’s Republic of China excluding Hong Kong
and Macau |
| MENA | Middle East and North Africa |
| MREL | EU minimum requirements for own funds and eligible liabilities |
| MSS | Markets and Securities Services, HSBC’s capital markets and securities services businesses in Global Banking and Markets |
| N | |
| Net operating income | Net operating income before change in expected credit losses and other credit impairment charges/Loan impairment charges and other credit provisions, also referred to as revenue |
| NII | Net interest income |
| NIM | Net interest margin |
| NSFR | Net stable funding ratio |
| NZBA | Net-Zero Banking Alliance |
| O | |
| OCI | Other comprehensive income |
| OECD | Organisation of Economic Co-operation and Development |
| OFAC | Office of Foreign Assets Control |
| OTC | Over-the-counter |
| P | |
| PBT | Profit before tax |
| PD | Probability of default |
| POCI | Purchased or originated credit impaired |
| PPI | Payment protection insurance |
| PRA | Prudential Regulation Authority (UK) |
| Premier | HSBC Premier, HSBC’s premium personal global banking service |
| PVIF | Present value of in-force long-term insurance business |
| PwC | PricewaterhouseCoopers LLP and its network of firms |
| R | |
| RFR | Risk-free rate |
| RNIV | Risk not in VaR |
| RoE | Return on average ordinary shareholders’ equity |
| RoTE | Return on average tangible equity |
| RWA | Risk-weighted asset |
| S | |
| SABB | The Saudi British Bank |
| SEC | Securities and Exchange Commission (US) |
| ServCo group | Separately incorporated group of service companies established in response to UK ring-fencing requirements |
| Sibor | Singapore interbank offered rate |
| SME | Small and medium-sized enterprise |
| SOFR | Secured Overnight Financing Rate |
| Sonia | Sterling Overnight Index Average |
| T | |
| TRLibor | Turkish Lira interbank offered rate |
| U | |
| UAE | United Arab Emirates |
| UK | United Kingdom |
| UN | United Nations |
| US | United States of America |
| V | |
| VaR | Value at risk |
| VIU | Value in use |
| W | |
| WPB | Wealth and Personal Banking, a global business |
This document comprises the Interim Report 2021 and information herein has been filed on Form 6-K with the US Securities and Exchange Commission for HSBC Holdings plc and its subsidiary and associated undertakings.
HSBC Holdings plc
Incorporated in England with limited liability. Registered in England: number 617987
Registered Office and Group Head Office
8 Canada Square, London E14 5HQ, United Kingdom
Web: www.hsbc.com
© Copyright HSBC Holdings plc 2021
All rights reserved
No part of this publication may be reproduced, stored in a retrieval system, or transmitted, in any form or by any means, electronic, mechanical, photocopying, recording, or otherwise, without the prior written permission of HSBC Holdings plc.
Published by Global Finance, HSBC Holdings plc, London
Designed by Superunion, London (cover and ‘Overview’ section) and by Global Finance, HSBC Holdings plc, London (rest of the Interim Report 2021)
SIGNATURE
Pursuant to the requirements of the Securities Exchange Act of 1934, the registrant has duly caused this report to be signed on its behalf by the undersigned, thereunto duly authorized.
| | | | | |
| HSBC Holdings plc |
|
| By: | /s/ Ewen Stevenson |
| Name: Ewen Stevenson |
| Title: Group Chief Financial Officer |
Dated: August 2, 2021