 Investor Presentation May 2011 Exhibit 99.1 |
 2. Forward-Looking Statements This presentation contains “forward-looking statements” which are made pursuant to the safe harbor provisions of the Private Securities Litigation Reform Act of 1995. The forward-looking statements are based on the Company's current expectations and beliefs concerning future developments and their potential effects on the Company. There can be no assurance that actual developments will be those anticipated by the Company. Actual results may differ materially from those projected as a result of significant risks and uncertainties, including non-receipt of the expected payments, changes in interest rates, effect of the performance of financial markets on investment income and fair values of investments, development of claims and the effect on loss reserves, accuracy in projecting loss reserves, the impact of competition and pricing environments, changes in the demand for the Company's products, the effect of general economic conditions, adverse state and federal legislation, regulations and regulatory investigations into industry practices, developments relating to existing agreements, heightened competition, changes in pricing environments, and changes in asset valuations. The Company undertakes no obligation to publicly update any forward-looking statements as a result of events or developments subsequent to the presentation. |
 3. The Argo Group Story The Company Argo Group is an international specialty underwriter of property/casualty insurance and reinsurance focused in niche markets. The Objective To maintain our profitable growth record while maximizing on the opportunities afforded us through our international platform. The Strategy Apply our proven business model to deploy capital in attractive niche markets that offer opportunities for maximum return. |
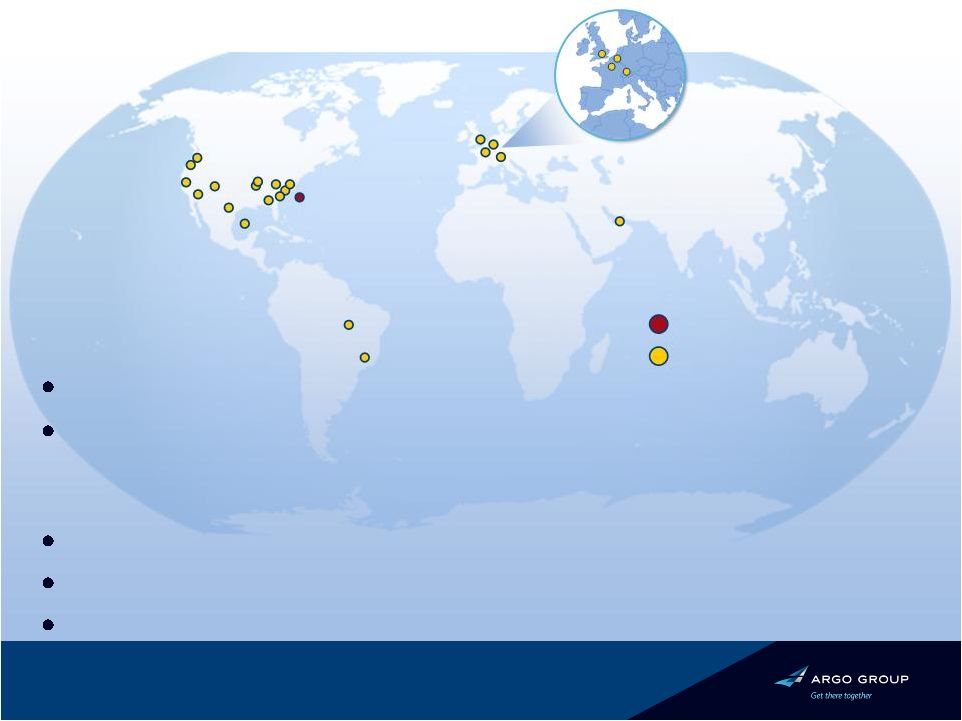 4. Argo Group Today Major business segment locations Bermuda Headquarters Multinational specialty P&C underwriter of insurance and reinsurance Headquarters: Bermuda – Operate internationally in all 50 states – 1,300+ employees across six countries Total capitalization of $2.0 billion Operations conducted through four business segments A.M. Best Rating of A XII (excellent) Brussels London Paris Zurich |
 5. Our Strategy Deploy capital in the international specialty market for maximum return Provide our clients with insurance solutions by continuously focusing on new business development and organic growth Strategically grow our platform and gain access to new markets through acquisitions Dedicated to attracting top tier talent to leverage our platform Manage balance sheet risk by maintaining relatively low financial leverage and a prudent investment portfolio Maximize shareholder value through growth in book value per share |
 6. A Recap of Our Successful Strategic Business Plan 1. Target attractive niche markets 2. Develop leading, differentiated positions 3. Expand position – organically – geographically – selective acquisitions 4. Results: growth in premiums, earnings and book value |
 7. ATTRACTIVE NICHE MARKETS A Different Type of Approach Key Criteria In Selecting Niche Markets Higher margin and return Market leadership in a reasonable time frame Disciplined underwriting Sustained, profitable organic growth |
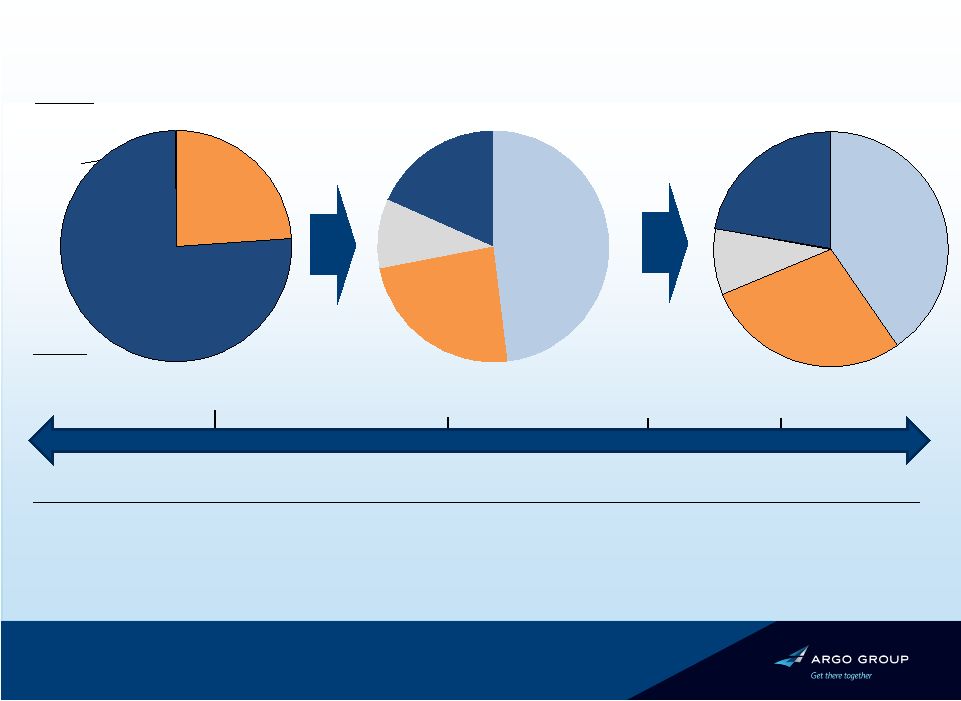 2004 LTM 2011 NEP Split 2000 2001 – Acquires Colony and Rockwood. Founds Trident 2007 – Completes merger with PXRE; Forms Argo Re 2008 – Rebranded Argo Group; Acquired Heritage and its Lloyd’s syndicate 2009 – Introduces Casualty and Professional Risks Division Timeline 8. Financial Highlights ($mm, except per share data) 2000 2004 (1) Q1 2011 (2) Book Value per Share 23.03 30.36 55.59 Total Capital 501.1 716.8 1,522.9 Excess and Surplus Lines 48.1% Specialty Commercial 23.8% Public Entity 9.7% Risk Management 18.3% We have successfully diversified our portfolio and become a global specialty insurance underwriter Notes: 1 Book value per share includes impact of the Series A Mandatory Convertible Preferred Stock on an as if converted basis. 2 Book value per share includes $113 million in catastrophe losses in Q1 2011. Specialty Commercial 23.9% Specialty Workers' Compensation 75.9% Public Entity 0.2% Excess and Surplus Lines 40.4% Commercial Specialty 28.3% International Specialty 9.1% Syndicate 1200 22.2% |
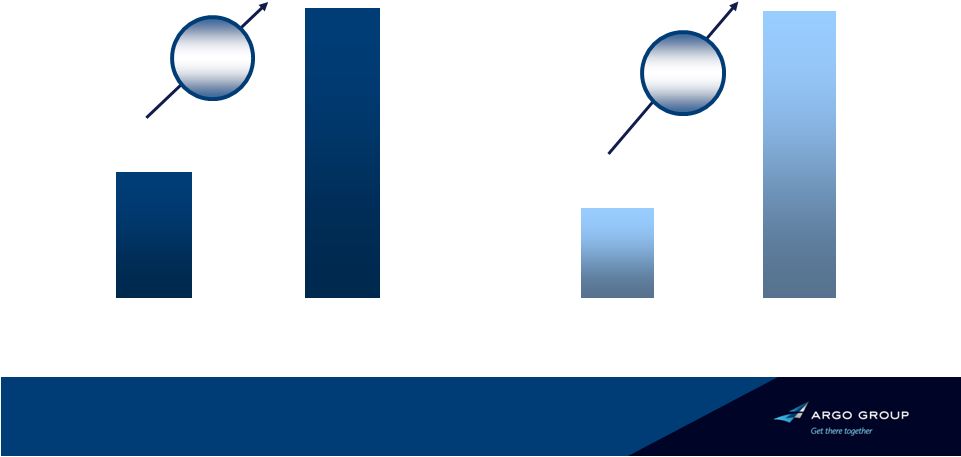 9. Earned Premiums Gross Written Premiums RESULTS: GROWTH An Impressive Growth Record… $622M 2002 2010 $1.5B 11.9% CAGR 2002 2010 15.7% CAGR $1.4B $378M |
 10. Net Income Net Investment Income RESULTS: GROWTH Improved Bottom Line Results… |
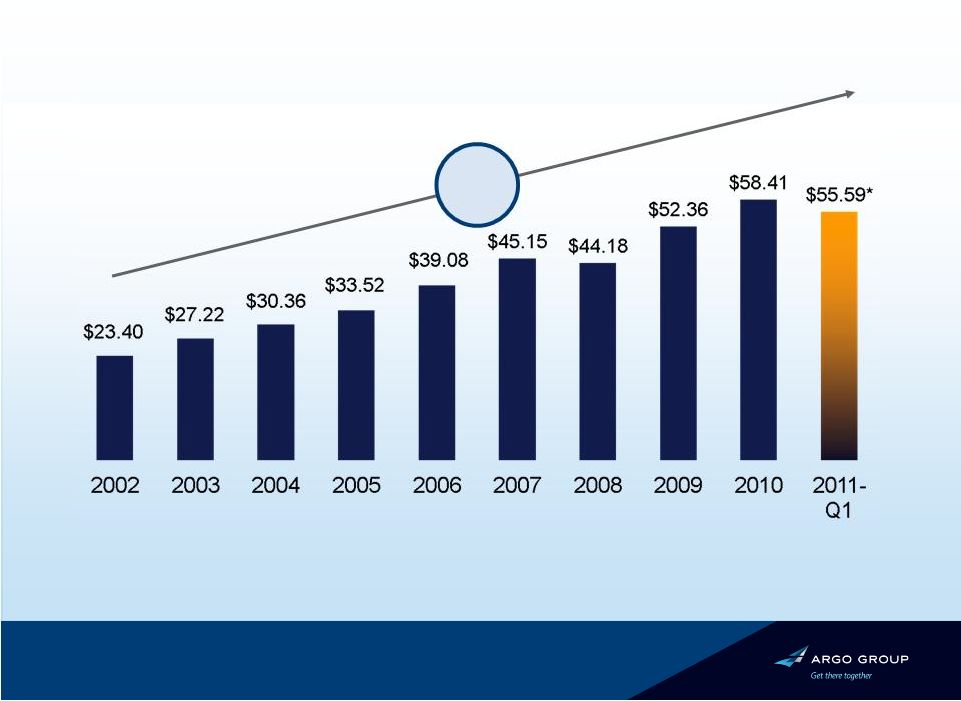 Growth of Book Value BVPS Growth Since 2002 11.1% CAGR *2011-Q1 impacted by catastrophe losses in Japan, New Zealand and Australia totaling $113.1M (net of reinstatement premiums). **Book value per common share - outstanding, includes the impact of the Series A Mandatory Convertible Preferred Stock on an as if converted basis. Preferred stock had fully converted into common shares as of Dec. 31, 2007. 11. |
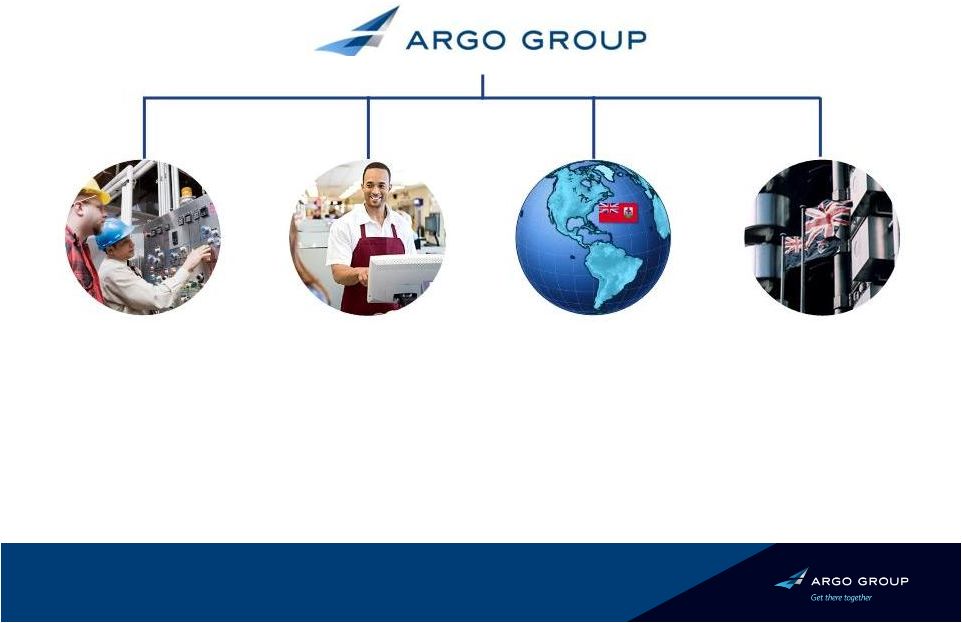 12. Excess & Surplus Lines Syndicate 1200 • 2010 GWP $390M • Lloyd’s Wholesale • Worldwide Property • Non-U.S. Liability • 2010 GWP $523M • Non-Admitted Market • U.S. Wholesale Excess & Surplus Lines International Specialty • 2010 GWP $189M • Reinsurance • Excess Casualty • Non-U.S. Retail Commercial Specialty • 2010 GWP $428M • Admitted Market • U.S. Retail Four Growth Platforms |
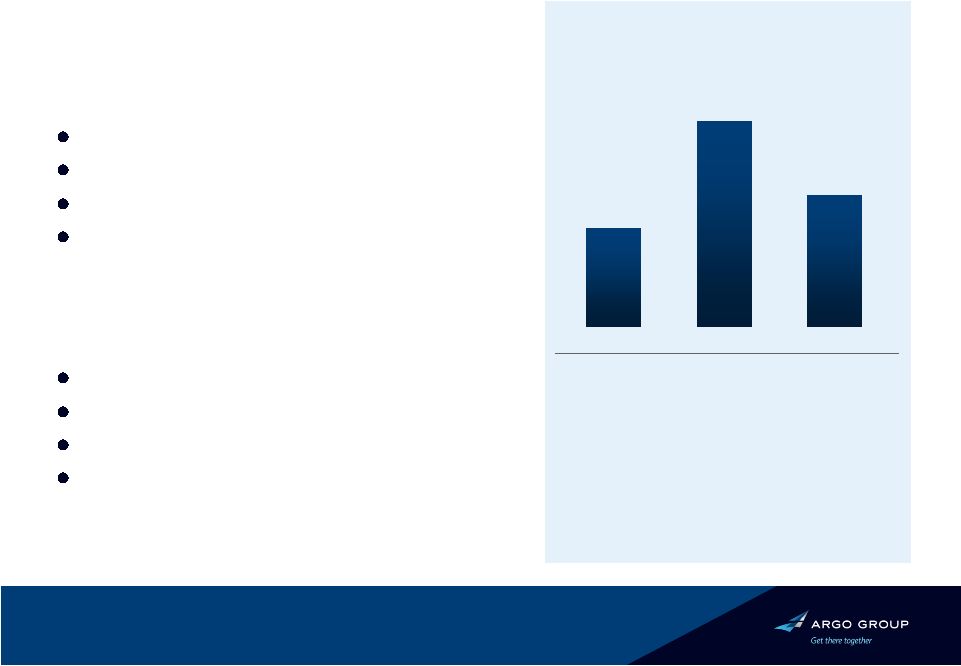
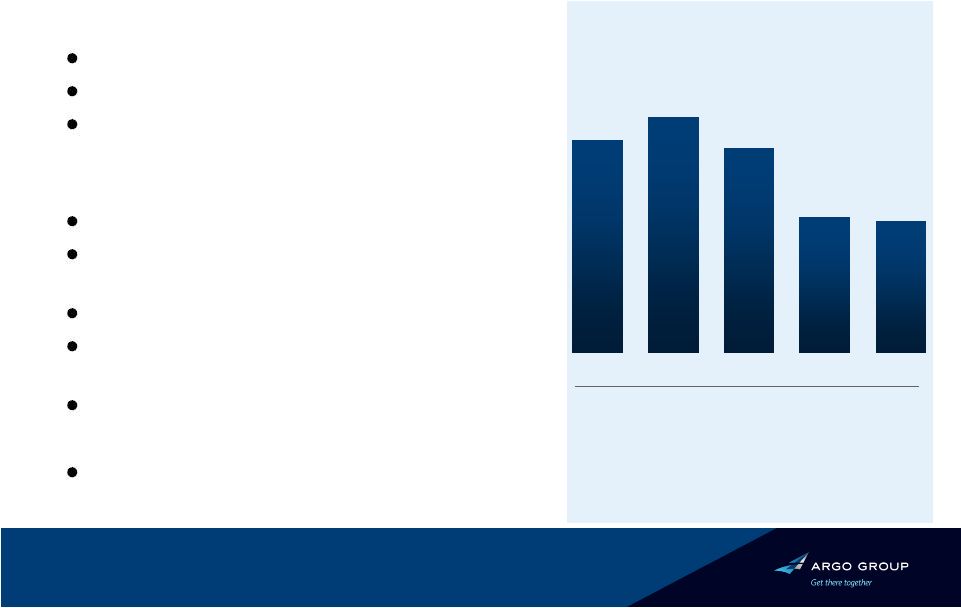 13. EXCESS & SURPLUS LINES: Largest and Most Profitable Segment Status Standard market expanding risk appetite New entrants building market share Argo maintaining underwriting discipline Competitive advantages Colony Specialty & Argo Pro Excellent infrastructure – broad geography Underwriting expertise Broad product portfolio for small acct U/Ws (restaurants, day care, contractors) Controlled distribution – Wholesale agents Benefits from a category XII ‘A’ (Excellent) rating by A.M. Best Pre-Tax Operating Income ($M) Combined ratio * Includes $12.7M of losses from 2008 hurricanes. 88.9% 89.3% 93.3% $102 $113 $98 $65 99.6% $63 97.8% 2006 2007 2008* 2009 2010 2011 Three Months OI: $11.4M 2010 Three Months OI: $12.7M |
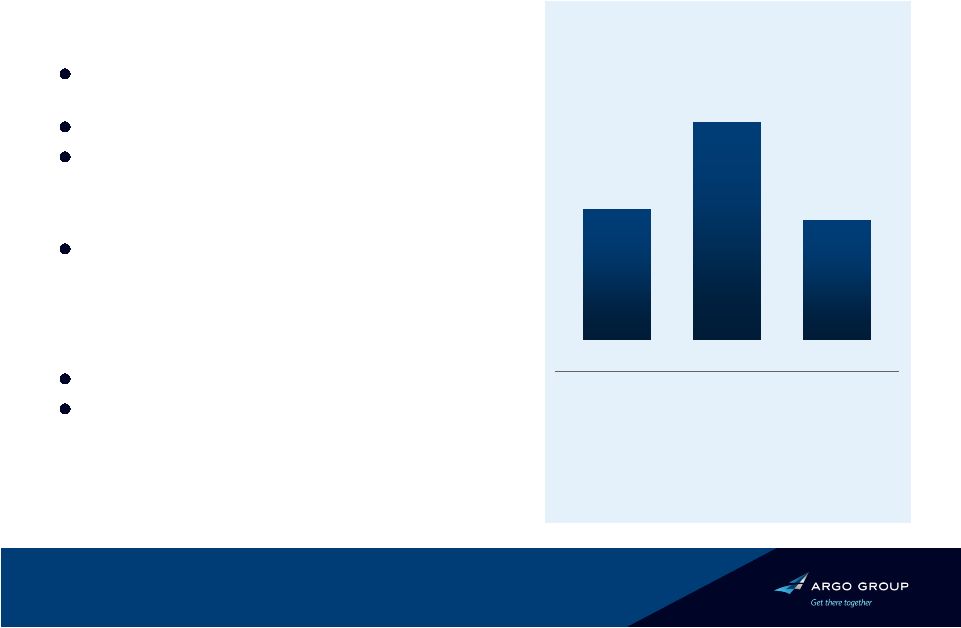
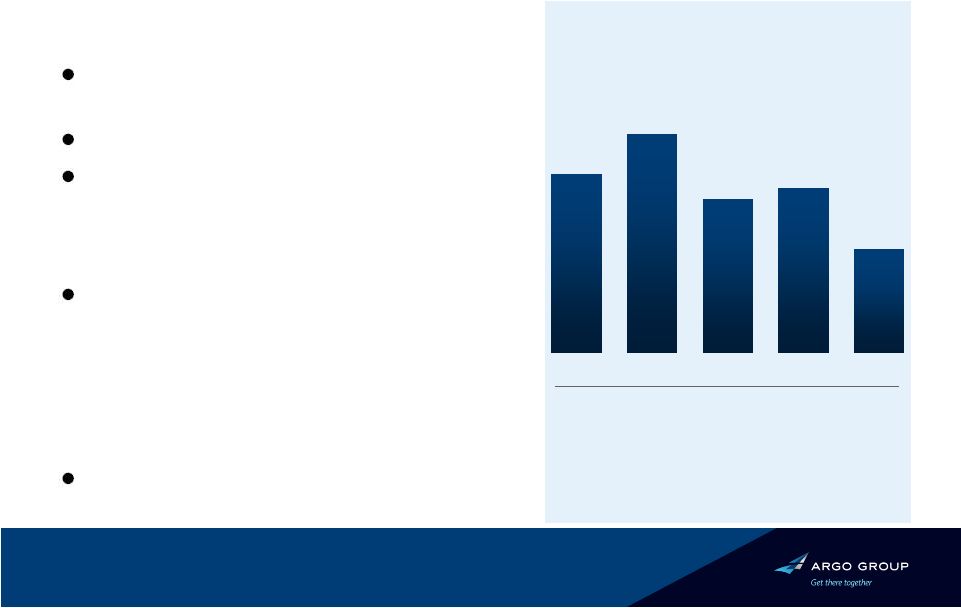 14. COMMERCIAL SPECIALITY: Specialty Niche Segment Status Historical combined ratio in low 90% range Performing well given competition Primarily admitted, retail-driven Competitive advantages Expertise in niche markets – grocery stores – mining operations – laundry & dry cleaners – small/medium-size public entities Benefits from a category XII ‘A’ (Excellent) rating by A.M. Best Pre-Tax Operating Income ($M) Combined ratio * Includes $2.8M of losses from 2008 hurricanes. 89.4% 88.7% 96.5% $50 $61 $43 $46 95.6% $29 99.0% 2006 2007 2008* 2009 2010 2011 Three Months OI: $5.9M 2010 Three Months OI: $7.9M |
 15. Status Underwriting on $1.2 billion of capital Has achieved desired diversification Event-driven businesses Added Casualty and Professional Risks business in 2009 Competitive advantages Utilizes established infrastructure Built diversified book of business Proven record of leadership Benefits from a category XII ‘A’ (Excellent) rating by A.M. Best INTERNATIONAL SPECIALTY: Argo Re – Well Established $24 $50 Pre-Tax Operating Income ($M) 2008 2009 * 2010 includes $30.1M of catastrophe losses (net of reinstatement premium). ** 2011-Q1 includes $68.1M of catastrophe losses (net of reinstatement premium). 2010* $32 77.9% 52.3% Combined ratio 72.8% 2011 Three Months OI: ($52.9M)** 2010 Three Months OI: $7.6M |
 16. Status Acquired Heritage in 2008; rebranded to Argo International Carrier named head of U/W Jan 2011 Worldwide property – Direct and Facultative – North American and International Binding Authority Non-U.S. liability – Professional indemnity – General liability Competitive advantages Specialist knowledge Carries the Lloyd’s market ratings of ‘A’ (Excellent) rating by A.M. Best, and ‘A+’ by S&P SYNDICATE 1200: Argo International (Lloyd’s) Gross Written Premiums ($M) $424 $706 $390 2008 2009 2010 2011 Three Months OI ($46.6M)* 2010 Three Months ($10.7M) * 2011-Q1 includes $44.4M of catastrophe losses. |
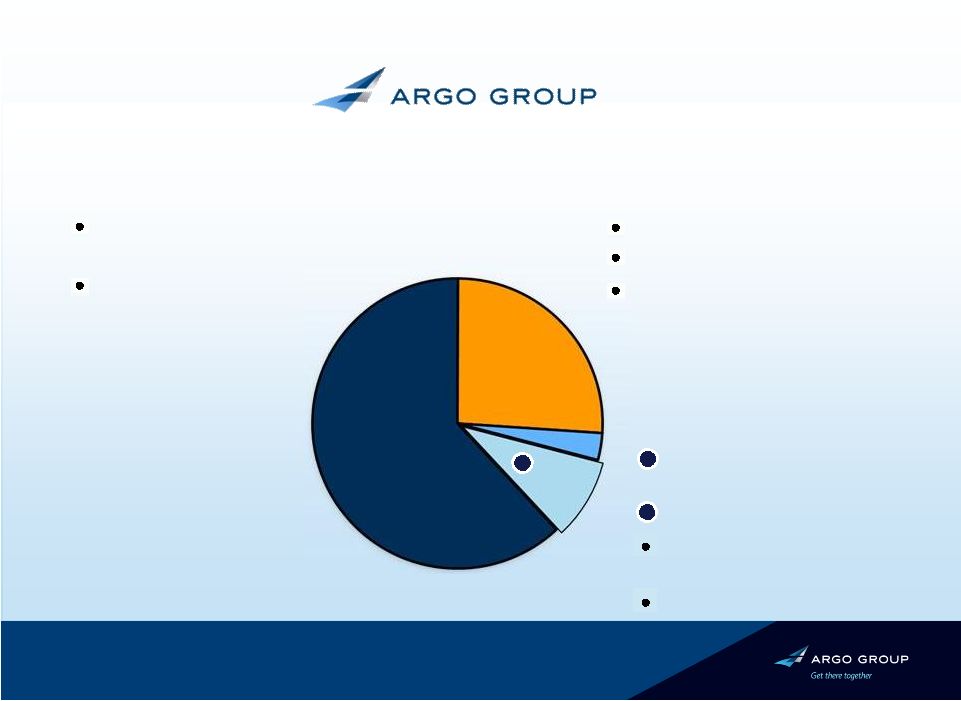 Combined Business Mix – Established platform to write business worldwide and penetrate niche markets Int’l Specialty (Bermuda) ? Quota share reinsurance of business partners ? Property reinsurance Excess casualty and professional liability insurance Non-U.S. retail 62% 9% 26% Based on 2010 gross written premiums Specialty Insurance Platform Excess & Surplus Lines (non-admitted market - wholesale) Commercial Specialty (admitted market - retail) U.S. Operations (New York / San Antonio) Lloyd’s wholesale Worldwide property insurance Non-U.S. liability insurance Syndicate 1200 (London) 3% 17. |
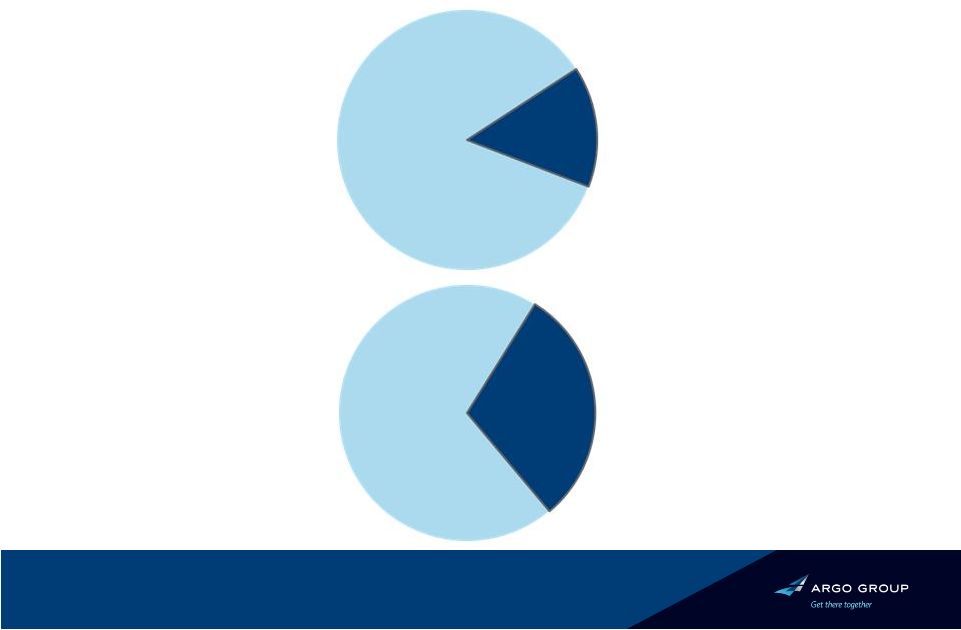 18. Diversified Business Model Reinsurance Insurance 91% 14% Casualty ~70% ~30% Property 9% Based on 2010 gross written premiums |
 19. Argo Group 2010 Results 2009 2010 Change Gross Written Premium 23% Net Earned Premium 14% Total Revenue 11% Net Operating Income Per Share 53% Net Income Per Share 28% * Impacted by $54.9M of losses (net of reinstatement premiums) from catastrophes in 2010. Net Investment Income 8% LTM Growth in Book Value Per Share $ 2.0B $ 1.4B $ 1.5B $ 4.28 $ 3.81 $ 146M 18.5% $ 1.5B $ 1.2B $ 1.4B $ 2.00* $ 2.76 $ 134M 12.5% |
 20. 2010 Three Months 2011 Three Months Change Gross Written Premium $ 405M 14% Net Earned Premium $ 324M 19% Total Revenue $ 372M 20% Net Operating Income Per Share $ 0.32 -- % Argo Group 2011 First Quarter Results $ 348M $ 261M $ 297M ($ 2.82) LTM Growth in Book Value Per Share 19.2% 3.3% Net Investment Income $ 34M 3% $ 33M * Net Income Per Share $ 0.67 -- % ($ 3.34) * * Impacted by $113.1M of losses (net of reinstatement premiums) from catastrophes in the 2011 first quarter. |
 21. Dec 31, 2010 3,152 18.8% 2,003 1,626 6,482 $4,215 377 $58.41 Dec 31, 2009 3,203 19.1% 1,996 1,615 6,897 $4,334 381 $52.36 Strong Balance Sheet and Capital Base Reserves Total Leverage* Total Capital Shareholders’ Equity Total Assets Investment Portfolio Indebtedness* Book Value Per Share * Includes $311mm of Junior Subordinated Debentures Mar 31, 2011 3,347 1,523 6,338 $4,184 $55.59 379 1,902 19.9% In millions except for book value and leverage data |
 Conservative Investment Portfolio Fixed income (92%) Equities (8%) Total: $3.7bn Total: $0.3bn • Internally and externally managed • Conservative focus on large cap • Average Rating of AA • Duration of 2.9 years 26% 17% 17% 30% 11% Governments State / Muni Corporate Structured Short Term Financials Industrial & Other 6% 94% Invested Assets ($mm) 22. $1,181 $1,553 $1,784 $2,173 $2,514 $3,556 $3,995 $4,334 $4,215 $4,184 2002 2003 2004 2005 2006 2007 2008 2009 2010 Q1 2011 As of March 31, 2011 |
 23. Capital Deployment Strategy Support balance sheet, mainly loss reserves Growth of core business – Deploy capital opportunistically across all four segments – Reduce reliance on third-party reinsurance Pursue attractive market opportunities – Selective acquisitions that complement existing business lines – Books of business and companies Repatriate capital depending on capital position and stock price – New $150M authorized stock repurchase program announced Feb. 2011 – Repurchased $123.8M or approx 3.7M shares of common stock Jan. 1 2010 through March 31, 2011 – Paid cash dividend of 12 cents per share the last six quarters |
 24. Key Areas of Focus Today Improve expense structure – Implementing shared services model for our back office, non-core functions – Evaluating outsourcing opportunities Capital management – Constantly evaluating capital structure – Ensure we are adequately and efficiently capitalized Investment portfolio – Analyzing risk-return threshold – Allocating investments accordingly to increase yield New business development – Prudently evaluating new specialty products and new geographies that will be accretive to ROE over time |
 25. I N S U M M A R Y Argo Group: A Strong and Well-Positioned Specialty Underwriter Powerful competitive force in specialty lines market – International platform with U.S., Bermuda and London advantages – Broadly diversified insurance and reinsurance businesses – Deep expertise in small- to mid-size niche markets – Growth though geographic and product diversification Proven and successful strategic business plan – Track record of growth and profitability through insurance cycle – Prudent risk management and controls – Strong, expanded and proven leadership team Focus on profitable growth – Effective capital deployment + high-margin emphasis = ROE-driven focus – Achieved 11.1% CAGR since 2002 in book value per share |
 Thank you |