UNITED STATES
SECURITIES AND EXCHANGE COMMISSION
Washington, D.C. 20549
FORM 10-K
(mark one)
| x | ANNUAL REPORT PURSUANT TO SECTION 13 OR 15(d) OF THE SECURITIES EXCHANGE ACT OF 1934 |
For the fiscal year ended December 31, 2006
or
| ¨ | TRANSITION REPORT PURSUANT TO SECTION 13 OR 15(d) OF THE SECURITIES EXCHANGE ACT OF 1934 |
For the transition period from to
Commission File Number 000-51595
Website Pros, Inc.
(Exact name of registrant as specified in its charter)
| | |
| Delaware | | 94-3327894 |
(State or other jurisdiction of incorporation or organization) | | (I.R.S. Employer Identification No.) |
| | |
| 12735 Gran Bay Parkway West, Building 200, Jacksonville, FL | | 32258 |
| (Address of principal executive offices) | | (Zip Code) |
Registrant’s telephone number, including area code: (904) 680-6600
Securities registered pursuant to Section 12(b) of the Act: None.
Securities registered pursuant to section 12(g) of the Act:
Common Stock, $0.001 par value
(Title of class)
Indicate by check mark if the registrant is a well-known seasoned issuer, as defined in Rule 405 of the Securities Act. ¨ Yes x No
Indicate by check mark if the registrant is not required to file reports pursuant to Section 13 or Section 15(d) of the Act. ¨ Yes x No
Indicate by checkmark whether the registrant (1) has filed all reports required to be filed by Section 13 or 15(d) of the Securities Exchange Act of 1934 during the preceding 12 months (or for such shorter period that the registrant was required to file such reports), and (2) has been subject to such filing requirements for the past 90 days. x Yes ¨ No
Indicate by checkmark if disclosure of delinquent filers pursuant to Item 405 of Regulation S-K(§ 229.405 of this chapter) is not contained herein, and will not be contained, to the best of registrant’s knowledge, in definitive proxy or information statements incorporated by reference in Part III of this Form 10-K or any amendment to this Form 10-K. ¨
Indicate by check mark whether the registrant is a large accelerated filer, an accelerated filer, or a non-accelerated filer. See definition of “accelerated filer and large accelerated filer” in Rule 12b-2 of the Exchange Act. (Check one):
| | | | |
Large accelerated filer ¨ | | Accelerated filer x | | Non-accelerated filer ¨ |
Indicate by check mark whether the registrant is a shell company (as defined in Rule 12b-2 of the Act). ¨ Yes x No
The aggregate market value of the voting and non-voting common equity held by non-affiliates of the registrant was approximately $103,340,587 as of June 30, 2006, based upon the closing sale price of the common stock as quoted by the NASDAQ Global Market reported for such date. Shares of common stock held by each executive officer and each director and by each person who is known by the registrant to own 5% or more of the outstanding common stock have been excluded from this calculation as such persons may be deemed affiliates. This determination of affiliate status is not necessarily a conclusive determination for other purposes.
As of February 28, 2007, the registrant had 17,382,616 shares of common stock outstanding.
DOCUMENTS INCORPORATED BY REFERENCE
Parts of the Proxy Statement for the registrant’s 2007 Annual Meeting of Stockholders, to be filed with the Securities and Exchange Commission pursuant to Regulation 14A not later than 120 days after the end of the fiscal year covered by this Form 10-K, are incorporated by reference in Part III of this Form 10-K.
TABLE OF CONTENTS
PART I
Item 1. Business.
This Form 10-K and the documents incorporated herein by reference contain forward-looking statements that involve risks and uncertainties. Actual results may differ materially from those expressed in forward-looking statements. See Item 1A of Part I—“Risk Factors.”
Website Pros, Inc. (“we,” “Website Pros” or the “Company”) believe we are a leading provider, based on our number of subscribers, of Do-It-For-Me Web services and lead generation products that enable small and medium-sized businesses to establish, maintain, promote, and optimize their Internet presence. Our primary service offerings, eWorks! XL and SmartClicks, are comprehensive performance-based packages that include Website design and publishing, Internet marketing and advertising, search engine optimization, search engine submission, lead generation and easy-to-understand Web analytics. As an application service provider, or ASP, we offer our customers a full range of Web services and products on an affordable subscription basis. In addition to our primary service offerings, we provide a variety of premium services to customers who desire more advanced capabilities; such as e-commerce solutions and other sophisticated Internet marketing services and online lead generation. The breadth and flexibility of our offerings allow us to address the Web services needs of a wide variety of customers, ranging from those just establishing their Websites to those that want to enhance their existing Internet presence with more sophisticated marketing and lead generation services. Additionally, as the Internet continues to evolve, we will refine and expand our service offerings to keep our customers at the forefront.
Through the combination of our proprietary Website publishing and management software, automated workflow processes, and specialized workforce development and management techniques, we believe we achieve production efficiencies that enable us to offer sophisticated Web services at affordable rates. Our technology automates many aspects of creating, maintaining, enhancing, and marketing semi-custom Websites on behalf of our customers. With approximately 74,000 subscribers to our eWorks! XL, SmartClicks, and premium subscription-based services as of December 31, 2006, we believe we are one of the industry’s largest providers of affordable Web services and products that enable small and medium-sized businesses to have an effective Internet presence.
We sell our Web services and products to customers identified primarily through strategic marketing relationships with established brand name companies that have large numbers of small and medium-sized business customers, including Discover Financial Services, LLC, or Discover. We have a direct sales force that utilizes leads generated by our strategic marketing relationships to acquire new customers at our sales centers in Spokane, Washington; Jacksonville, Florida; Manassas, Virginia; Norton, Virginia; and Halifax, Nova Scotia. Our sales force specializes in selling to small and medium-sized businesses across a wide variety of industries throughout the United States.
In September 2006, we acquired substantially all of the assets of, and assumed certain liabilities from 1ShoppingCart.com Canada Corp. and 1ShoppingCart.com Corp. (together, “1ShoppingCart.com”), a leading provider of shopping cart, internet marketing and eCommerce/eBusiness solutions and services based in Barrie, Ontario in exchange for approximately $12.5 million in cash. We believe that the 1ShoppingCart.com acquisition brings a strong group of private-labeled resellers and affiliates that will enable cross- and up-sell opportunities for our complementary Web services, internet marketing and eCommerce solutions, which are all geared to satisfying the needs of small and medium-sized businesses.
In September 2006, we acquired substantially all of the assets of, and assumed certain liabilities from Renex, Inc. (“Renex”) an online lead generation marketplace for contractors and homeowners based in Halifax, Nova Scotia in exchange for $7.0 million in cash. In connection with the transaction if certain requirements are met, we also agreed to issue 277,496 shares of our common stock valued at approximately $3.0 million to Renex to be equally distributed on September 30, 2007 and September 30, 2008 as additional consideration for the acquired assets. In
1
addition, if certain other requirements are met during the twelve months following September 30, 2006, we will pay Renex contingent consideration up to an additional $1.0 million. We believe that the Renex acquisition will enhance our ability to provide a one-stop shop for comprehensive, affordable Website and online advertising solutions for small and medium-sized businesses and is in line with our long-term strategic direction of providing targeted, high value solutions to customers in specific vertical markets.
Our Approach and Solution
We have built our business around a subscription-based ASP model that allows small and medium-sized businesses to affordably outsource their Web service needs to us. The key elements of our business model and approach are:
Providing Comprehensive Solutions for Small and Medium-Sized Businesses. Our goal is to enable small and medium-sized businesses to outsource their Web services needs to us. Our experience is that many small and medium-sized businesses do not have the in-house expertise to effectively design an Internet presence that will generate adequate traffic to their Websites and increase direct consumer interaction. As a result, our customers look to us to provide these services. Our Web services include, among other features, Website design and publishing, local, regional, and national Internet marketing and advertising, search engine optimization, search engine submission, lead generation and Web analytics. We believe this combination provides our customers with a comprehensive solution to their Web services needs.
Offering Affordable Subscription-Based Solutions. Because our customer base is value-driven, we provide our Web services on an affordable subscription basis. Our eWorks! XL and SmartClicks customers typically pay a recurring monthly fee ranging from approximately $60 to over $100, depending on which services and products they purchase. Additionally, we offer a premium Internet marketing service targeted at businesses with significant spending on local print yellow pages advertising. This service is priced at an average of approximately $300 per month, which we believe is significantly less than the typical cost of traditional campaigns such as half- or full-page print yellow pages advertisements. We offer 1ShoppingCart.com eCommerce and online marketing solutions typically on a recurring monthly fee ranging from approximately $29 to $79 per month. Through Renex, we target contractors in the home services businesses with lead packages ranging in price from $50 to $1500, based on the specific trade vertical and geographic area.
Streamlining Operations for Customer Acquisition, Fulfillment, and Support. We utilize proprietary workflow processes and customer relationship management systems, together with a combination of integrated template-driven and specialized Website design tools, to sell, design, and support our Web services and products. We believe this integrated infrastructure has enabled us to significantly reduce the time from initial customer contact to site completion. Our goal is to design a Website and have it complete and visible on the Internet within 72 hours from the time we receive initial information from the customer. Additionally, we have extensive experience promoting, selling, and supporting our Web services and products to small and medium-sized businesses.
Forming and Enhancing Strategic Marketing Relationships. We focus on forming strategic marketing relationships with companies that have large customer bases of small and medium-sized businesses. These companies generate leads for us by providing lists of their customers, conducting e-mail marketing campaigns about our Web services and products, advertising our Web services and products on the Internet, and using other forms of both direct and indirect solicitation. These companies filter the customer lists they provide to us using a number of criteria that we believe indicate when a small or medium-sized business is likely to understand the value of our Web services and products. Our most productive strategic marketing relationship is with Discover.
1ShoppingCart.com and Renex provide additional sales channels for our core Web services products. 1ShoppingCart.com has a network of affiliate and private-label resellers that are prospects for our other services and that can be leveraged to offer our services to their customers. Renex’s growing network of home services contractors is also a source of prospective customers for Website and online promotional services.
2
Our Strategy
Our objective is to enhance our position as a leading provider of Web services and products for small to medium-sized businesses. Key elements of our strategy include:
Continuing to Target the Small and Medium-Sized Business Market Segment. We believe the small and medium-sized business market offers us the best opportunity to continue building a leading national Web services company. We believe this is an attractive market because it is large and because these businesses need a comprehensive, affordable solution to their Web services requirements. Our Web services meet critical business needs of these businesses that they often do not have the time, resources, or technical skills to fulfill themselves.
Developing or Acquiring Complementary Services and Technologies. We sell Web services and products that are essential to an effective Internet presence such as local and regional lead generation, search engine optimization, Website search tools, affiliate marketing networks, and Web analytics. While we currently provide many of these services through our relationships and agreements with other vendors, we will seek opportunities either to internally develop some or all of these services and products or acquire businesses that provide them. Additionally, we may seek to acquire companies with existing customer bases in our target market into which we can cross-sell our Web services and products.
Expanding our Distribution Channels. To sell our Web services and products cost efficiently, we capitalize on the connection those organizations, with which we have strategic marketing relationships, have with their small and medium-sized business customers. We plan both to expand the scope of our current strategic marketing relationships, as well as to develop additional strategic marketing relationships with organizations that have strong brand recognition with small and medium-sized businesses. We also expect to increase our marketing and sales activities so that a larger proportion of our customers are acquired through increased direct sales and new reseller programs. 1ShoppingCart.com and Renex also provide additional opportunities to expand and diversify our distribution channels.
Selling Additional Services and Products to Existing Customers. As of December 31, 2006, we had approximately 74,000 subscribers to our eWorks! XL, SmartClicks, and premium subscription-based services. As customers build their Internet presence, we believe that we can demonstrate the value of the additional premium services and products we offer, which can increase our average revenue per customer and improve our revenue growth. For example, we can provide paid search and e-commerce capabilities to our current customers’ Websites, enabling additional sources of revenue for them while also contributing to a measurable return on their investment.
Strengthening Customer Retention. We are dedicated to enhancing customer retention and building lasting relationships with our customers. We believe it is critical to customer retention to target small and medium-sized businesses that already understand the value of the Internet to their success. Improving customer retention also requires maximizing customer loyalty. Therefore, we are focused on customer satisfaction, consistent communication, Web service and product enhancements, and high quality customer service. Additionally, we believe that by educating our existing and prospective customers about the value of our services to their businesses we can build lasting customer relationships.
Extending Our Position as an Affordable ASP. Through the combination of our operational scale and geographical locations, we believe that we have been able to minimize the cost of delivering our Web services and products. Our template-driven processes enable us to handle orders efficiently. We have strategically located our primary sales and fulfillment facilities in the lower-cost areas of Jacksonville, Florida; Spokane, Washington; and Norton, Virginia, which helps us to better manage our cost of operations even as we expand. In the future, we may look to new international labor markets to further reduce the cost of providing our Web services and products.
3
Our Services and Products
Our goal is to provide a broad range of Web services and products that enable small and medium-sized businesses to establish, maintain, promote, and optimize their Internet presence. By providing a comprehensive performance-based offering, we are able to sell to customers whether or not they have already established an Internet presence. Our Web services and products can be categorized into the following offerings:
eWorks! XL Subscription-Based Services
Using our proprietary software and workflow enabled processes, we develop and support subscription Web service packages that include a 5, 10, 20, or 40 page semi-custom Website and related services. These comprehensive packages include the tools and functionality necessary for a business to create, maintain, enhance, and market a successful and effective online presence. We build, test, and publish the Websites and provide related services for our customers. We also provide tutorials and tools for customers to edit and manage their sites. Alternatively, customers can select from one of several levels of support programs for ongoing management and maintenance of their Websites.
Our primary subscription offering is eWorks! XL, a comprehensive Website design and publishing package targeted at getting small and medium-sized businesses online quickly, effectively, and affordably when they have no Internet presence, or a limited one. The package includes a five-page semi-custom Website built on our proprietary self-editing tool, which allows for easy maintenance by the customer. By using our comprehensive, performance-based package of services, customers eliminate the need to buy, install, or maintain hardware or software to manage their Internet presence. This offering includes a broad set of configuration and customization options using a Web browser.
We build the initial Website for the customer using the content and design information the customer provides. Our goal is to have a customer’s Website visible on the Internet within 72 hours from the time we receive initial information from the customer.
eWorks! XL includes:
| | • | | Initial Site Design. One of our design specialists begins the process by interviewing the customer and collecting data about the customer’s business. Using our NetObjects MatrixBuilder software, we then create a unique Website tailored to the customer’s specific needs using one of our templates. Every site we build goes through an extensive quality review and assurance process prior to being published on the Internet. Additionally, every site undergoes a thorough Website optimization process to enhance search engine placement. |
| | • | | Online Marketing. We offer our customers online marketing capabilities that cost-effectively promote their Websites on a local and national basis. The package includes initial submission and ongoing submissions on a regular basis of the customers’ Websites to many popular search engines. Additionally, eWorks! XL includes listings in online yellow page directories, banner advertisements, search engine optimization tools, and educational guides targeted to small businesses. |
| | • | | Performance Scorecard. Customers receive a detailed report of their Website traffic, including visitors generated through the online marketing and advertising services provided in their eWorks! XL package. |
| | • | | Unique 800 Telephone Number. Customers receive a unique 800 number that is forwarded to their business telephone line. Information about the calls received through the 800 number are tracked and reported on the Performance Scorecard. |
| | • | | E-mail Marketing. We provide an e-mail marketing tool that enables our customers to easily communicate with their customers and prospects. To assist our customers in collecting e-mail addresses, every Website includes a subscription sign-up box for site visitors to provide their e-mail information. |
4
| | • | | Webmail. Every customer receives three e-mail boxes tied to its domain name. Webmail is compatible with Microsoft Outlook and features advanced filtering and search capabilities and automatic mail forwarding and responding. |
| | • | | Online Web Tools. eWorks! XL includes advanced online tools such as a forms manager, polling and survey capabilities, a guest book, and site search features that offer interactive Website management capabilities. |
| | • | | Modifications and Redesign Service. Customers can choose between several different levels of support, which range from having us make ongoing changes to using the self-edit tools we provide. The basic service included with eWorks! XL includes 30 minutes per month of free modification and phone consultation with one of our Web designers. |
| | • | | Domain Name Registration. We obtain, purchase, and register a domain name appropriate for the business selected by the customer. |
| | • | | Hosting and Technical Support. Our hosting platform offers technology and security designed to ensure the reliable daily operation of a customer’s Website. Our secure Web hosting includes disk storage, daily backups, and a monthly data transfer allotment. We also offer technical support, including services to our customers to provide the information and consultation they need to build and manage an effective online presence. |
SmartClicks Subscription-Based Services
In February 2006, we introduced SmartClicks, which is a performance-based service with a higher subscription fee than our eWorks! XL offering. Our SmartClicks offering is targeted at customers that want additional online advertising in their local service areas. SmartClicks includes all of the benefits provided in the eWorks! XL bundle and the added benefit of guaranteed pay-per-click advertising in Google and other major search engines.
SmartClicks customers are guaranteed a minimum of 20 clicks per month through Google pay-per-click advertising. 50-click bundles are also available for certain business categories and geographical markets. An added value of the SmartClicks package is the advertising management function Website Pros performs for these customers. We create the pay-per-click ads, buy appropriate keywords and monitor the programs’ performance.
Premium Subscription-Based Services
In addition to our eWorks! XL and SmartClicks subscription-based Web services, we offer a number of premium subscription-based services and functionalities for an additional fee. These premium subscription-based services are available to our eWorks! XL customers, to customers of our custom Website design services and, in most cases, to customers for whom we have not built a Website but who otherwise require these Web services. These premium subscription-based services include:
| | • | | E-Commerce Solutions. We offer a comprehensive set of services that enable businesses to sell their services and products online. Our service offering includes creating the online store catalog and secure shopping cart, establishing an online merchant account and assisting in setting up online payment and order processing. |
| | • | | Power Marketing Bundles. Our Power Marketing package is an array of services and products we sell to customers that want increased local or national exposure on the Internet. Options include geographically targeted banner advertisements, additional online yellow page listings, and search engine submission tools. |
| | • | | Visibility Online. We bundle a number of different services contained in our eWorks! XL package into our Visibility Online offering, which is designed to enhance the effectiveness of an online marketing program for our non-eWorks! XL customers. These services include initial search engine optimization, |
5
| | search engine inclusion, Yahoo! Site Match paid inclusion, listing in Yahoo! Yellow Pages, AOL Yellow Pages Promotional listing, site submission to many popular search engines, banner advertisements, and search submission tools. |
| | • | | Internet Yellow Pages. We work with customers to design an advertising program using several Internet yellow page directories. This provides our customers the ability to target specific buyers for their own services and products locally, regionally, or nationally. |
| | • | | LEADS.com Total Coverage. We create custom-designed local Internet advertising campaigns for businesses that want to generate business leads in one or more local markets. These Total Coverage campaigns appear on leading local sites such as Yahoo! Yellow Pages, Yahoo! Local Search, Google, Google Local, Switchboard, and Looksmart. |
| | • | | Custom Design Extras. We offer several custom design features and services, including map and directions pages, external links pages, the ability to increase the number of products listed on a customer’s Website, more advanced Website statistics, database applications, password security, expanded e-mail services, and premium hosting services. |
Custom Web Design
We offer complete custom Website design services that provide sophisticated functionality and interactivity beyond those available under eWorks! XL and SmartClicks. These sites are typically built for larger, more established customers that have had an Internet presence in the past, or that are designing the first Website with unique specifications. Customers work directly with our experienced Web designers to build a fully customized Website. Additionally, we are able to sell any of our subscription-based Web services and products to our custom Web design customers.
Our team of custom design professionals includes experienced Web designers, programmers, copywriters, and search engine optimization experts who work together to ensure that the customer’s online business objectives are met. Custom sites are built on our NetObjects Fusion software or other sophisticated design tools that provide the flexibility and functionality to meet advanced business needs. Custom sites can include flash, animation, e-commerce solutions, sophisticated interactivity and database functionality.
Web Authoring Software
We offer NetObjects Fusion, our desktop Web authoring software, for businesses that want to design Websites either for themselves or for others. Combining easy-to-use wizards, drag-and-drop simplicity, and design tools, NetObjects Fusion offers the flexibility to be an intuitive Website building software for novices, as well as an advanced tool for Website development professionals. NetObjects Fusion offers features that allow Website professionals to build Websites quickly, while still enabling these professionals to offer the flexibility and functionality their clients often require. NetObjects Fusion includes e-commerce capabilities, database functionality, and image manipulation tools that Website professionals find useful in building clients’ sites.
Online Business Automation
Through 1ShoppingCart.com, we offer a robust set of sales and marketing tools for businesses selling products and services online. 1ShoppingCart.com offers an ASP, subscription-based shopping cart solution with add-on modules that allow small and medium-sized businesses to create, promote and manage their online presence. Services include a comprehensive affiliate management program, email marketing, auto-responders and ad trackers.
Lead Generation
We offer targeted lead generation services for various business categories through Renex and LEADS.com. Renex is a competitive marketplace that matches homeowners in need of remodeling services with qualified
6
contractors in their local area. Through a subscription-based model, contractors purchase these leads, giving them the opportunity to bid on the homeowner’s project. LEADS.com offers leads in other home services categories such as plumbers, landscapers, roofers and painters.
Operations
We have invested significant time and capital resources in a set of internal processes and proprietary technologies designed to enable high-scale, high-quality mass customization of our Web services.
eWorks! XL
The workflow of our sales and fulfillment process for eWorks! XL is illustrated below.
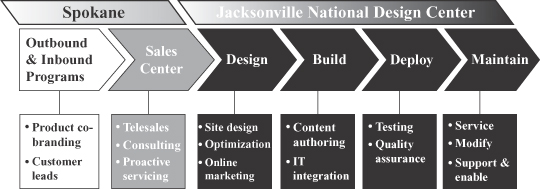
Utilizing leads provided by our strategic marketing relationships, we identify potential customers through a combination of our outbound and inbound telesales programs. Once our sales specialists have determined that a lead is a potential customer, the customer call is transferred directly to a Web services consultant. In most cases, this transfer takes place immediately so that customer contact is not interrupted. The Web services consultant conducts a Web design interview during which we collect information about the customer, request customer-specific content, and proactively help the customer design an effective Internet presence based on the goals for its business. Several discrete quality checks on each sale help us maximize the quality of the sale.
Using our proprietary workflow process and customer relationship management software, the interview notes and content gathered by our Web services consultants are then transmitted to our national design center. At this point, our design specialists use the notes and content collected, our proprietary design tool and one of hundreds of design templates that can be modified using a wide variety of color themes and graphics to design a semi-custom Website for the customer. After completion of the Website, a separate quality assurance process is automatically triggered by our proprietary workflow process and customer relationship management software. This quality assurance process includes testing of the Website, reviewing notes and customer-supplied content, confirming appropriateness of styles used, and generally ensuring that the quality of the resulting Internet presence is consistent with our high standards. Following quality assurance, the Website is published and hosted, and the customer is notified that the Website is complete.
By utilizing our proprietary workflow process and customer relationship management software, specialized design tools, a large database of design templates, and several years of experience, we have been able to decrease the time of development and increase the utilization rate of our sales, design, and support staff. Our goal is to complete this process, from customer call to initial Website deployment, within 72 hours. After the Website is available on the Internet, we help our customers maintain, modify, and upgrade their Internet presence.
For all of our customers, we also provide periodic newsletters and other informational items to increase our number of customer contact events. We actively seek to interact with our customers at a variety of times during
7
the customer life cycle through different media. Through experience and testing, we have found increased contact with customers helps to improve customer loyalty and enhance their understanding of the value of our services and products. We have also initiated several programs to foster customer loyalty, including numerous customer surveys that measure the quality of our service and the effectiveness of our products, a dedicated customer satisfaction team that follows up telephonically with every customer responding negatively to any of our surveys, segmented design experts for handling design changes quickly and professionally, and the introduction of an intensive training curriculum required for all customer care agents.
We maintain two data centers located in Jacksonville, Florida and Spokane, Washington, for most of our internal operations. Servers that provide our customers’ Website data to the Internet are located within a third-party co-location facility located in Jacksonville, Florida. This co-location facility has a secured network infrastructure including intrusion detection at the router level. Our contract obligates our co-location provider to provide us a secured space within their overall data center. The facility is secured through card-key numeric entry and biometric access. Infrared detectors are used throughout the facility. In addition, the co-location facility is staffed 24 hours a day, 7 days a week, with experts to manage and monitor the carrier networks and network access. The co-location facility staff provides 24-hour security through camera-controlled views of our equipment. The co-location facility provides multiple Internet carriers to help ensure bandwidth availability to our customers. The availability of electric power at the co-location facility is provided through multiple uninterruptible power supply and generator systems should power supplied by the Jacksonville Electric Authority fail. We plan to renew our agreement with the co-location facility, which expires on May 1, 2008.
Customer data is redundant through the use of multiple application and Web servers. Customer data is backed up to other disk arrays with fail-over to help ensure high availability. Customer data is also maintained at our national design center and can be republished from archival data at any time through our Oracle 9i database system. Currently, this process could take approximately 24 hours. Our financial system reporting also uses our redundant Oracle systems and can be reconstituted in approximately 12 hours.
We are currently working with our co-location provider to establish a disaster recovery backup operation at one of the provider’s alternative locations. This would provide a working fail-over site to prevent a disruption of our customers’ Websites should the Jacksonville co-location site become unavailable. The facilities are connected by fiber-optic rings to our co-location provider’s other centers.
LEADS.com Internet Marketing Packages and Lead Generation
Potential customers for our Internet Marketing packages are identified primarily using an outbound telesales program based in Manassas, Virginia. This program targets businesses with established traditional print yellow pages advertising campaigns. Customers who purchase our Internet Marketing package offering are interviewed and advertising information is entered into our proprietary publishing system. Local advertisements are then customized for several distribution platforms, such as Yahoo! Yellow Pages and Google search, and then published to these platforms. Customers receive a monthly report that tracks the number of impressions, clicks, and calls generated by each advertisement that we place on their behalf. LEADS.com also offers lead generation products through their outbound telesales efforts to small businesses in a variety of industries including home services. In addition to selling Internet Marketing packages and lead generation, the LEADS.com sales force sells eWorks! XL Websites to their customer base.
1ShoppingCart.com Integrated E-commerce Solution
Prospects for our 1ShoppingCart.com eCommerce product are typically small business customers that are interested in establishing an online business. Our eCommerce engine integrates a variety of marketing and advertising modules that can be purchased as a bundle, or sold individually. In addition to establishing their business online, our customers can market their services through our email marketing system and auto-responders, track the effectiveness of their advertising and marketing efforts and establish, manage and maintain a robust affiliate program.
8
Potential customers can also test our services through a paid online trial. Once a customer downloads the trial of our software, we contact them through a series of email communications and auto-responders to encourage conversion of the trial to a paid subscription and to upsell other services.
Our customer data is stored on systems that are compliant and certified to meet Visa International’s Payment Card Industry Data Standards. We have a highly available redundant infrastructure, which provides disaster recovery backup to prevent a disruption of our customers’ eCommerce presence.
Renex Lead Generation Services
We market our Renex services to homeowners through targeted television and online advertising. Homeowners complete a brief online form describing their remodeling need and their approximate budget. Renex receives the online lead and sends it to up to 60 local contractors in the Renex database. The first 4 qualified contractors that respond are provided the homeowner’s contact information and then work directly with the homeowner to scope the project and provide cost estimates to the homeowner. Renex will also provide the homeowner with financial leads if the homeowner wishes to borrow money to fund the project.
Our services are marketed to contractors online and through our outbound telesales program in Halifax, Nova Scotia. We also offer a Customer Relationship Lead Management system (CRM system) to contractors, free of charge that allows them to manage all of their leads and projects in a comprehensive, easy-to-use system. Contractors utilizing the free CRM system are prime prospects for lead generation services.
Technology
Our hardware and software infrastructure provides an advanced set of integrated tools for design, service, modifications, and billing. NetObjects MatrixBuilder enables Website design, end user modification and administration, and includes a variety of other tools accessible by our customers. Our Oracle-based proprietary workflow processes and customer relationship management software, which we developed internally, helps ensure that our production staff provides timely and efficient design services and helps us to efficiently and cost-effectively manage our customer base.
Our proprietary workflow processes and customer relationship management software enables us to build, maintain, and track large numbers of customer Websites. The configuration of software and hardware includes six key modules:
| | • | | Account Management. The account management module facilitates the creation and maintenance of a customer account and the consolidation, either manually or electronically through external submission, of pertinent customer demographics, product specifics, and billing information. We track critical aspects of customer activity, which allows customer service representatives to have immediate access to a customer’s complete account history. |
| | • | | Design Tool. Our design tool, NetObjects MatrixBuilder, is browser based, supports major Web services standards, and can be easily co-branded or private labeled for an organization with which we have a strategic relationship. NetObjects MatrixBuilder is template-based, yet can provide thousands of different Website styles by using hundreds of design templates that can be modified using a wide variety of color themes and graphics. The design tool generates the HTML code, so that manual coding is not required, and facilitates the generation of domain name registration, an e-commerce storefront, and a number of other extended and value added services that our customers can access from any Web browser. |
| | • | | Workflow Module. The workflow module expedites service and product delivery by automatically determining the required production path, such as design, quality control, or submission to search engines, based on the specific attributes of the customer or service. The workflow module also controls |
9
| | production flow through our organization, enabling our design and customer support staff to individually service our Website customers either by routing their work automatically to the correct department or handling the request themselves. |
| | • | | Billing Module. The billing module enables us to bill our subscription and custom design customers directly or to bill a third party in the aggregate for its end users. The billing module is integrated with a number of transaction processing tools enabling support for many different payment types. |
| | • | | LEADS.com Publishing and Tracking System. We operate a proprietary publishing and tracking system that allows the automated building, publishing, and tracking of advertisement campaigns. These campaigns currently are published on Yahoo!, Google, Idearc (formerly Verizon Superpages), Switchboard, Looksmart and other sites affiliated with these providers. |
| | • | | Renex Telephony Software. Our proprietary software application enables us to systematically manage the relationships and interactions with homeowners and contractors in Renex’s database, enhancing the efficiency and productivity of our sales and account management teams. |
Sales Channels
Sales of Subscription Services
Our sales organization for our subscription Web services and products comprises several distinct sales channels, including:
Outbound Telesales. The organizations with which we have strategic marketing relationships provide us with lists of their small and medium-sized business clients who meet a broad set of criteria. We analyze these customer lists to determine which of these customers best match our criteria for long-term clients. Our sales specialists call these prospective customers during regular business hours to discuss their Web services needs. We believe the brand and affinity relationship these prospective customers have with the parties with which we have strategic marketing relationships enhances our ability to reach a decision maker, make a presentation, have our offer considered, and close the sale during the initial call.
As of December 31, 2006, we had 128 employees in our outbound telesales unit located in our national sales center in Spokane, Washington. Additionally, we had 18, 29 and 10 employees in our outbound LEADS.com telesales units located in Manassas and Norton, Virginia and Jacksonville, Florida, respectively, and 4 employees in our outbound Renex telesales unit in Halifax, Nova Scotia. With the benefit of having conducted several years of outbound telesales activities, we have significant management, business process, training, and product expertise within our sales team. Additionally, we employ practices designed to optimize the management of our employees and increase their sales performance.
Inbound Telesales. We maintain a separate team of sales specialists specifically focused on responding to inbound inquiries generated by programs initiated by us and the organizations with which we have strategic marketing relationships. We and these organizations employ a mix of e-mail, direct mail, Website, and other marketing efforts to help promote our services to prospective clients. As of December 31, 2006, we had 104 employees in our inbound telesales unit.
Reseller Program. Several of the parties with which we have strategic marketing relationships have their own direct sales organizations. We have worked closely with these resellers to develop sales support and fulfillment processes that integrate with the resellers’ sales, service, support, and billing practices. Additionally, we provide these resellers with training and sales materials to support the Web services being offered. Companies that currently resell our services and products through their sales organizations include Yahoo!, Earthlink and Register.com.
Online Channel. We promote our services through the websitepros.com, LEADS.com, RenovationExperts.com and 1ShoppingCart.com Websites. To drive prospects to our sites, we engage in online marketing and advertising
10
campaigns, conduct targeted television campaigns to reach homeowners for Renex and participate in seminars targeting small businesses that wish to sell their services online. Our partners also promote our services by including our products on their Websites and by including our services in their ongoing marketing and promotional efforts with their customers.
Affiliate Network and Private Label Partners. We sell our shopping cart and business automation solutions through direct online channels and through approximately 3,000 affiliate and private-label partners that market our services on our behalf. These partners are provided with ongoing marketing and technical support to ensure a positive customer experience for their end customers.
Sales of NetObjects Fusion
We sell NetObjects Fusion through direct sales, original equipment manufacturers, or OEMs, software bundles, and retail and reseller distribution.
Direct Sales. We sell NetObjects Fusion through strategic e-mail marketing campaigns aimed at users of prior versions of the software, people that use the product on a trial basis, newsletter subscribers, and Website visitors. In Europe, we also utilize magazine covermounts, which European magazines utilize to differentiate themselves. With a covermount, a copy of an older version of NetObjects Fusion is provided free with the purchase of the magazine. We require the recipient of the free version to register with us directly to be able to use the free copy of the software. The new user of the software becomes a prospect for new versions of NetObjects Fusion and for the other software products we offer.
OEM Software Bundles. A number of OEMs are offering NetObjects Fusion as part of their packaged product offerings. As needed, we customize the NetObjects Fusion application to meet the OEM’s specifications and to feature the OEM’s products and brands within the software. Typically, an older version of NetObjects Fusion is offered through OEM bundles, which we believe facilitates later sales of newer versions to these users. The OEMs with which we currently work include Avanquest Deutschland GmbH and Deutsche Telekom AG.
Retail and Reseller Distribution. We work with resellers in the United States, Europe and Australia to sell NetObjects Fusion. These distributors supply smaller resellers, retailers and value added resellers in their markets with NetObjects Fusion.
Strategic Marketing Relationships
A key part of our sales strategy is to leverage the brand and distribution of organizations with which we have strategic marketing relationships to sell our Web services and products. We have developed strategic marketing relationships with well-known, brand name companies, such as Discover. We create sales material with each of these organizations, highlighting our Web services and products while also leveraging their brand. Then, on behalf of these companies, we initiate programs where our sales representatives directly contact their small and medium-sized business customers using telesales solicitation, direct mail, and online contact.
Pursuant to our agreement with Discover, they provide us with customer lists and related billing services, and we share revenue derived from sales of our Web services and products to customers derived from Discover’s lists. Our agreement with Discover is terminable by them or us on short notice, and expires pursuant to its terms in November 2007.
Customers attributable to our strategic marketing relationship with Discover represented approximately 51% of our total revenue during the year ended December 31, 2006. VistaPrint, another strategic marketing partner, also provides customer lists of small businesses in need of Web services. IBM historically has been a key reference for us and has facilitated other strategic marketing relationships, in addition to making its customer list available to us for a sales program.
11
We offer a number of benefits to the companies with whom we have established strategic marketing relationships. First, they are able to increase their revenue through the marketing fees paid by us. Second, we allow these companies to offer a comprehensive solution for delivering Web services to their small and medium-sized business customers. This can result in increased loyalty of their customer base and an overall strengthening of their customer relationships. Third, by providing our Web services to their customers through us, we enable them to differentiate their offering from that of their competitors.
Marketing
We engage in a variety of marketing activities to increase awareness of our services and products, to sell additional services and products to our existing customer base, and to enhance the value we provide to small and medium-sized business entities. Our marketing activities include:
| | • | | Targeted e-mail and direct response campaigns to prospects and customers; |
| | • | | Search engine and other online advertising; |
| | • | | Electronic customer newsletters; |
| | • | | Website Pros, LEADS.com, NetObjects Fusion, 1ShoppingCart and Renex Websites; |
| | • | | Online customer tutorials; and |
Customers
We generally target small and medium-sized businesses having fewer than 100 employees. These customers normally are focused on regional or local markets. We seek to create long-term relationships with our customers, who cover a diverse set of industries and geographies in the United States. Our customers fall into over 80 discrete industry classification categories. As of December 31, 2006, the ten largest categories consisted of restaurants, automobile repair and services, clothing accessories and footwear, salons and barbershops, business and professional services, gift, novelty and promotional items, plumbing and HVAC, health foods and supplements, construction, and jewelry and timepieces. As of December 31, 2006, we had approximately 74,000 subscribers to our eWorks! XL, SmartClicks, and premium subscription-based services.
We also target small and medium-sized businesses with significant monthly spending on local print yellow pages advertising. We seek to create long-term relationships with these businesses by helping them locate new customers at a significantly lower cost per lead compared to traditional print yellow pages marketing campaigns.
12
Third-Party Providers
We offer some of our services to our customers through third-party technology vendors, which helps us to expand our services and create additional revenue opportunities. Some of our current third-party providers are:
| | |
Company | | Technology or Service |
| |
Amacai | | Internet yellow pages |
| |
AOL (Mapquest) | | Mapping services |
| |
Constant Contact | | E-mail marketing |
| |
eBay (Kurant) | | E-commerce storefront software |
| |
eBay (PayPal) | | E-commerce payment systems |
| |
eStara | | 800 telephone numbers |
| |
Google | | Local and national search engine marketing and submission |
| |
Google (Urchin) | | Website analytics |
| |
Network Solutions | | Domain name services and security certificate services |
| |
Switchboard | | Online directory / yellow pages |
| |
Yahoo! | | Yahoo!’s Internet yellow pages and local and national search engine marketing |
| |
Yahoo! (Overture) | | Search engine submission services (Alltheweb, AltaVista, Excite) |
We do not have long-term contracts with any of these third parties. Accordingly, we or any of these providers can terminate the relationship at any time, for any reason or no reason, on short notice, often as little as 30 days. If any of these relationships terminate, we may need to seek an alternative provider of services or develop the covered services independently.
Competition
The market for Web services is highly competitive and evolving. We expect competition to increase from existing competitors as well as new market entrants. Most existing competitors typically offer a limited number of specialized solutions and services, but may provide a more comprehensive set of services in the future. These competitors include, among others, Website designers, Internet service providers, Internet search engine providers, local business directory providers, Website domain name registrars, eCommerce service providers, lead generation companies and hosting companies. These competitors may have greater resources, more brand recognition, and larger installed bases of customers than we do, and we cannot ensure that we will be able to compete favorably against them. Our NetObjects Fusion software has two principal competitors: Macromedia Dreamweaver and Adobe GoLive.
We believe the principal competitive factors in the small and medium-sized business segment of the Web services and online marketing and lead generation industry include:
| | • | | Ability to reference strategic partners; |
| | • | | Value and flexibility of the service offerings; |
| | • | | Brand name and reputation; |
| | • | | Quality of customer support; |
| | • | | Speed of customer service; |
| | • | | Ease of implementation, use, and maintenance; and |
| | • | | Industry expertise and focus. |
13
Intellectual Property
Our success and ability to compete is dependent in significant part on our ability to develop and maintain the proprietary aspects of our technology and operate without infringing upon the proprietary rights of others. We do not own any patents. We currently rely primarily on a combination of copyright, trade secret and trademark laws, confidentiality procedures, contractual provisions, and other similar measures to protect our proprietary information. Due to the rapidly changing nature of applicable technologies, we believe that the improvement of existing offerings, reliance upon trade secrets and unpatented proprietary know-how and development of new offerings generally will continue to be our principal source of proprietary protection. While we have hired third party contractors to help develop our software and to design Websites, we own the intellectual property created by these contractors. Our software is not substantially dependent on any third party software, although our software does utilize open source code. Notwithstanding the use of this open source code, we do not believe our usage requires public disclosure of our own source code nor do we believe the use of open source code is material to our business.
We also have an ongoing service mark and trademark registration program pursuant to which we register some of our product names, slogans and logos in the United States and in some foreign countries. License agreements for our software include restrictions intended to protect our intellectual property. These licenses are generally non-transferable and are perpetual. In addition, we require all of our employees, contractors and many of those with whom we have business relationships to sign non-disclosure and confidentiality agreements and to assign to us in writing all inventions created while working for us. Some of our products also include third-party software that we obtain the rights to use through license agreements. In such cases, we have the right to distribute or sublicense the third-party software with our products.
Employees
As of December 31, 2006, we had a total of 637 full-time employees and 2 part-time employees. Of our full-time employees, 310 are in direct sales, of which 189 are in outbound telesales, 100 are in inbound telesales, and 23 are in management and support functions. In addition, there are two part-time employees in outbound telesales function. Of the remaining full-time employees, 6 are in channel business development, 14 are in marketing and product management, 47 are in general and administration, 55 are in engineering and product development, and 205 are in customer care and Web services production. In addition to our full-time employees, we also had 19 contracted offshore developers and 23 contracted Web services designers and editors. None of our employees are represented by unions. We consider the relationship with our employees to be good and have not experienced interruptions of operations due to labor disagreements.
Corporate Information
Website Pros, Inc. was incorporated under the General Corporate Law of the State of Delaware on March 2, 1999. Our principal offices are located at 12735 Gran Bay Parkway West, Building 200, Jacksonville, Florida 32258. Our telephone number is (904) 680-6600 and our Website is located at www.websitepros.com. Our Website and the information contained therein or connected thereto shall not be deemed to be incorporated into this Form 10-K.
We make available free of charge on or through our Internet Website our annual reports on Form 10-K, quarterly reports on Form 10-Q, current reports on Form 8-K and all amendments to those reports as soon as reasonably practicable after such material is electronically filed with or furnished to the Securities Exchange Commission (SEC).
You may read and copy this Form 10-K at the SEC’s public reference room at 450 Fifth Street, NW, Washington D.C. 20549. Information on the operation of the public reference room can be obtained by calling the SEC at 1-800-SEC-0330. The SEC maintains an Internet site that contains reports, proxy and information statements and other information regarding our filings at www.sec.gov.
14
Item 1A. Risk Factors.
We depend primarily on a small number of strategic marketing relationships—and one key strategic marketing relationship in particular—to identify prospective customers. The loss of one or more of our strategic marketing relationships, or a reduction in the referrals and leads they generate, would significantly reduce our future revenue and increase our expenses.
As a key part of our strategy, we have entered into agreements with a number of companies pursuant to which these parties provide us with access to their customer lists and allow us to use their names in marketing our Web services and products. Approximately 90% and 93% of our new customers in the years ended December 31, 2006 and 2005, respectively, were identified through our strategic marketing relationships. We believe these strategic marketing relationships are critical to our business because they enable us to penetrate our target market with a minimum expenditure of resources. If these strategic marketing relationships are terminated or otherwise fail, our revenue would likely decline significantly and we could be required to devote additional resources to the sale and marketing of our Web services and products. We have no long-term contracts with these organizations, and these organizations are generally not restricted from working with our competitors. Accordingly, our success will depend upon the willingness of these organizations to continue these strategic marketing relationships.
Our strategic marketing relationship with Discover is particularly important to us and accounted for approximately 60% and 73% of our new customers in the years ended December 31, 2006 and 2005, respectively. Customers attributable to our relationship with Discover represented approximately 51% and 57% of our total revenue during the years ended December 31, 2006 and 2005, respectively. We expect that customer relationships enabled by our strategic marketing relationship with Discover will continue to account for a significant portion of our new customers and our revenue in the future. Discover is under no obligation to continue to contract with us or continue this strategic marketing relationship, and either Discover or we can terminate our agreement with short notice and no penalty. Additionally, this agreement expires pursuant to its terms in November 2007, and we cannot ensure that the agreement will be extended or renewed. We therefore cannot ensure that we will continue to have a relationship with Discover. If our strategic marketing relationship with Discover ends, we will need to take remedial measures to generate customer leads, which could be expensive, and if such efforts fail, our business would be materially harmed.
To successfully execute our business plan, we must also establish new strategic marketing relationships with additional organizations that have strong relationships with small and medium-sized businesses that would enable us to identify additional prospective customers. If we are unable to diversify and extend our strategic marketing relationships, our ability to grow our business may be compromised.
Most of our Web services are sold on a month-to-month basis, and if our customers either are unable or choose not to subscribe to our Web services, our revenue may decrease.
Typically, our Web service offerings are sold pursuant to month-to-month subscription agreements, and our customers can generally cancel their subscriptions to our Web services at any time with little or no penalty.
Historically, we have experienced a high turnover rate in our customer base. For the years ended December 31, 2006 and 2005, 47% and 52%, respectively, of our subscribers who were customers at the beginning of the respective year were no longer subscribers at the end of the respective year. Customer turnover does not include the acquisitions of 1ShoppingCart.com and Renex, since they were purchased at the end of the third quarter. While we cannot determine with certainty why our subscription renewal rates are not higher, we believe there are a variety of factors, which have in the past led, and may in the future lead, to a decline in our subscription renewal rates. These factors include the cessation of our customers’ businesses, the overall economic environment in the United States and its impact on small and medium-sized businesses, the services and prices offered by us and our competitors, and the evolving use of the Internet by small and medium-sized businesses. If our renewal rates are low or decline for any reason, or if customers demand renewal terms less favorable to us, our revenue may decrease, which could adversely affect our stock price.
15
If economic or other factors negatively affect the small and medium-sized business sector, our customers may become unwilling or unable to purchase our Web services and products, which could cause our revenue to decline and impair our ability to operate profitably.
Our existing and target customers are small and medium-sized businesses. These businesses are more likely to be significantly affected by economic downturns than larger, more established businesses. Additionally, these customers often have limited discretionary funds, which they may choose to spend on items other than our Web services and products. If small and medium-sized businesses experience economic hardship, they may be unwilling or unable to expend resources to develop their Internet presences, which would negatively affect the overall demand for our services and products and could cause our revenue to decline.
Our growth will be adversely affected if we cannot continue to successfully retain, hire, train, and manage our key employees, particularly in the telesales and customer service areas.
Our ability to successfully pursue our growth strategy will depend on our ability to attract, retain, and motivate key employees across our business. We have many key employees throughout our organization that do not have non-competition agreements and may leave to work for a competitor at any time. In particular, we are substantially dependent on our telesales and customer service employees to obtain and service new customers. Competition for such personnel and others can be intense, and there can be no assurance that we will be able to attract, integrate, or retain additional highly qualified personnel in the future. In addition, our ability to achieve significant growth in revenue will depend, in large part, on our success in effectively training sufficient personnel in these two areas. New hires require significant training and in some cases may take several months before they achieve full productivity if they ever do. Our recent hires and planned hires may not become as productive as we would like, and we may be unable to hire sufficient numbers of qualified individuals in the future in the markets where we have our facilities. If we are not successful in retaining our existing employees, or hiring, training and integrating new employees, or if our current or future employees perform poorly, growth in the sales of our services and products may not materialize and our business will suffer.
We may expand through acquisitions of, or investments in, other companies or technologies, which may result in additional dilution to our stockholders and consume resources that may be necessary to sustain our business.
One of our business strategies is to acquire complementary services, technologies or businesses. In connection with one or more of those transactions, we may:
| | • | | issue additional equity securities that would dilute our stockholders; |
| | • | | use cash that we may need in the future to operate our business; and |
| | • | | incur debt that could have terms unfavorable to us or that we might be unable to repay. |
Business acquisitions also involve the risk of unknown liabilities associated with the acquired business. In addition, we may not realize the anticipated benefits of any acquisition, including securing the services of key employees. Incurring unknown liabilities or the failure to realize the anticipated benefits of an acquisition could seriously harm our business.
We may find it difficult to integrate recent and potential future business combinations, which could disrupt our business, dilute stockholder value, and adversely affect our operating results.
During the course of our history, we have completed several acquisitions of other businesses, and a key element of our strategy is to continue to acquire other businesses in the future. In particular, we completed the 1ShoppingCart.com and Renex acquisitions in September 2006. Integrating these recently acquired businesses and assets and any businesses or assets we may acquire in the future could add significant complexity to our business and additional burdens to the substantial tasks already performed by our management team. In the
16
future, we may not be able to identify suitable acquisition candidates, and if we do, we may not be able to complete these acquisitions on acceptable terms or at all. In connection with our recent and possible future acquisitions, we may need to integrate operations that have different and unfamiliar corporate cultures. Likewise, we may need to integrate disparate technologies and Web service and product offerings, as well as multiple direct and indirect sales channels. The key personnel of the acquired company may decide not to continue to work for us. These integration efforts may not succeed or may distract our management’s attention from existing business operations. Our failure to successfully manage and integrate 1ShoppingCart.com and Renex, or any future acquisitions could seriously harm our business.
Accounting for acquisitions under generally accepted accounting principles could adversely affect our reported financial results.
Under generally accepted accounting principles in the United States, we could be required to record charges for in-process research and development or other charges in connection with future acquisitions, which would reduce any future reported earnings or increase any future reported loss. Acquisitions could also require us to record substantial amounts of goodwill and other intangible assets. For example, in connection with our recent acquisitions of 1ShoppingCart.com and Renex, we recorded $17.9 million of goodwill. Any future impairment of this goodwill, and the ongoing amortization of other intangible assets, could adversely affect our reported financial results.
We have only recently become profitable and may not maintain our level of profitability.
Although we generated net income for the years ended December 31, 2006, 2005 and 2004, we have not historically been profitable and may not be profitable in future periods. As of December 31, 2006, we had an accumulated deficit of approximately $59.2 million. We expect that our expenses relating to the sale and marketing of our Web services, technology improvements and general and administrative functions, as well as the costs of operating and maintaining our technology infrastructure, will increase in the future. Accordingly, we will need to increase our revenue to be able to maintain our profitability. We may not be able to reduce in a timely manner or maintain our expenses in response to any decrease in our revenue, and our failure to do so would adversely affect our operating results and our level of profitability.
Our operating results are difficult to predict and fluctuations in our performance may result in volatility in the market price of our common stock.
Due to our limited operating history, our evolving business model, and the unpredictability of our emerging industry, our operating results are difficult to predict. We expect to experience fluctuations in our operating and financial results due to a number of factors, such as:
| | • | | our ability to retain and increase sales to existing customers, attract new customers, and satisfy our customers’ requirements; |
| | • | | the renewal rates for our services; |
| | • | | changes in our pricing policies; |
| | • | | the introduction of new services and products by us or our competitors; |
| | • | | our ability to hire, train and retain members of our sales force; |
| | • | | the rate of expansion and effectiveness of our sales force; |
| | • | | technical difficulties or interruptions in our services; |
| | • | | general economic conditions; |
| | • | | additional investment in our services or operations; |
17
| | • | | bulk licenses of our software; and |
| | • | | our success in maintaining and adding strategic marketing relationships. |
These factors and others all tend to make the timing and amount of our revenue unpredictable and may lead to greater period-to-period fluctuations in revenue than we have experienced historically.
As a result of these factors, we believe that our quarterly revenue and results of operations are likely to vary significantly in the future and that period-to-period comparisons of our operating results may not be meaningful. The results of one quarter may not be relied on as an indication of future performance. If our quarterly revenue or results of operations fall below the expectations of investors or securities analysts, the price of our common stock could decline substantially.
Our business depends in part on our ability to continue to provide value-added Web services and products, many of which we provide through agreements with third parties, and our business will be harmed if we are unable to provide these Web services and products in a cost-effective manner.
A key element of our strategy is to combine a variety of functionalities in our Web service offerings to provide our customers with comprehensive solutions to their Internet presence needs, such as Internet search optimization, local yellow pages listings, and e-commerce capability. We provide many of these services through arrangements with third parties, and our continued ability to obtain and provide these services at a low cost is central to the success of our business. For example, we currently have agreements with several service providers that enable us to provide, at a low cost, Internet yellow pages advertising. However, these agreements may be terminated on short notice, typically 60 to 90 days, and without penalty. If any of these third parties were to terminate their relationships with us, or to modify the economic terms of these arrangements, we could lose our ability to provide these services at a cost-effective price to our customers, which could cause our revenue to decline or our costs to increase.
Our systems, and those of our co-location provider, are vulnerable to natural disasters and other unexpected problems that could lead to interruptions, delays, loss of data, or the inability to accept and fulfill customer subscriptions.
Our network operating center, containing substantially all of our communications hardware, nearly all of our non-sales staff, and much of our other computer hardware operations is located in Jacksonville, Florida. Likewise, the facilities of our third-party co-location provider are located in Jacksonville, Florida. Additionally, one of our sales centers, from which the majority of our sales are made, is located in Spokane, Washington. Hurricanes, fire, floods, earthquakes, power loss, telecommunications failures, break-ins, computer sabotage, and similar events could damage or destroy these systems and facilities and temporarily stop a majority of our business activities in fulfilling customer orders and in securing new customers. Our business could be seriously harmed, our revenues could decline and we could be required to make significant expenditures if our systems were damaged or destroyed, or if our customer fulfillment were delayed or stopped, by any of these occurrences.
We rely heavily on the reliability, security, and performance of our internally developed systems and operations, and any difficulties in maintaining these systems may result in service interruptions, decreased customer service, or increased expenditures.
The software and workflow processes that underlie our ability to deliver our Web services and products have been developed primarily by our own employees. The reliability and continuous availability of these internal systems are critical to our business, and any interruptions that result in our inability to timely deliver our Web services or products, or that materially impact the efficiency or cost with which we provide these Web services and products, would harm our reputation, profitability, and ability to conduct business. In addition, many of the software systems we currently use will need to be enhanced over time or replaced with equivalent commercial
18
products, either of which could entail considerable effort and expense. If we fail to develop and execute reliable policies, procedures, and tools to operate our infrastructure, we could face a substantial decrease in workflow efficiency and increased costs, as well as a decline in our revenue.
We face intense and growing competition. If we are unable to compete successfully, our business will be seriously harmed.
The market for our Web services and products is competitive and has relatively low barriers to entry. Our competitors vary in size and in the variety of services they offer. We encounter competition from a wide variety of company types, including:
| | • | | Website design and development service and software companies; |
| | • | | Internet service providers and application service providers; |
| | • | | Internet search engine providers; |
| | • | | Local business directory providers; and |
| | • | | Website domain name providers and hosting companies. |
In addition, due to relatively low barriers to entry in our industry, we expect the intensity of competition to increase in the future from other established and emerging companies. Increased competition may result in price reductions, reduced gross margins, and loss of market share, any one of which could seriously harm our business. We also expect that competition will increase as a result of industry consolidations and formations of alliances among industry participants.
Many of our current and potential competitors have longer operating histories, significantly greater financial, technical, marketing and other resources, greater brand recognition and, we believe, a larger installed base of customers. These competitors may be able to adapt more quickly to new or emerging technologies and changes in customer requirements. They may also be able to devote greater resources to the promotion and sale of their services and products than we can. If we fail to compete successfully against current or future competitors, our revenue could increase less than anticipated or decline, and our business could be harmed.
Our failure to build brand awareness quickly could compromise our ability to compete and to grow our business.
As a result of the anticipated increase in competition in our market, and the likelihood that some of this competition will come from companies with established brands, we believe brand name recognition and reputation will become increasingly important. Our strategy of relying significantly on third-party strategic marketing relationships to find new customers may impede our ability to build brand awareness, as our customers may wrongly believe our Web services and products are those of the parties with which we have strategic marketing relationships. If we do not continue to build brand awareness quickly, we could be placed at a competitive disadvantage to companies whose brands are more recognizable than ours.
If our security measures are breached, our services may be perceived as not being secure, and our business and reputation could suffer.
Our Web services involve the storage and transmission of our customers’ proprietary information. Although we employ data encryption processes, an intrusion detection system, and other internal control procedures to assure the security of our customers’ data, we cannot guarantee that these measures will be sufficient for this purpose. If our security measures are breached as a result of third-party action, employee error or otherwise, and as a result our customers’ data becomes available to unauthorized parties, we could incur liability and our reputation would be damaged, which could lead to the loss of current and potential customers. If we experience any breaches of our network security or sabotage, we might be required to expend significant capital and other resources to
19
remedy, protect against or alleviate these and related problems, and we may not be able to remedy these problems in a timely manner, or at all. Because techniques used by outsiders to obtain unauthorized network access or to sabotage systems change frequently and generally are not recognized until launched against a target, we may be unable to anticipate these techniques or implement adequate preventative measures.
If we cannot adapt to technological advances, our Web services and products may become obsolete and our ability to compete would be impaired.
Changes in our industry occur very rapidly, including changes in the way the Internet operates or is used by small and medium-sized businesses and their customers. As a result, our Web services and products could become obsolete quickly. The introduction of competing products employing new technologies and the evolution of new industry standards could render our existing products or services obsolete and unmarketable. To be successful, our Web services and products must keep pace with technological developments and evolving industry standards, address the ever-changing and increasingly sophisticated needs of our customers, and achieve market acceptance. If we are unable to develop new Web services or products, or enhancements to our Web services or products, on a timely and cost-effective basis, or if new Web services or products or enhancements do not achieve market acceptance, our business would be seriously harmed.
Providing Web services and products to small and medium-sized businesses designed to allow them to Internet-enable their businesses is a new and emerging market; if this market fails to develop, we will not be able to grow our business.
Our success depends on a significant number of small and medium-sized business outsourcing Website design, hosting, and management as well as adopting other online business solutions. The market for our Web services and products is relatively new and untested. Custom Website development has been the predominant method of Internet enablement, and small and medium-sized businesses may be slow to adopt our template-based Web services and products. Further, if small or medium-sized businesses determine that having an Internet presence is not giving their businesses an advantage, they would be less likely to purchase our Web services and products. If the market for our Web services and products fails to grow or grows more slowly than we currently anticipate, or if our Web services and products fail to achieve widespread customer acceptance, our business would be seriously harmed.
We are dependent on our executive officers, and the loss of any key member of this team may compromise our ability to successfully manage our business and pursue our growth strategy.
Our future performance depends largely on the continuing service of our executive officers and senior management team, especially those of David Brown, our Chief Executive Officer. Our executives are not contractually obligated to remain employed by us. Accordingly, any of our key employees could terminate their employment with us at any time without penalty and may go to work for one or more of our competitors after the expiration of their non-compete period. The loss of one or more of our executive officers could make it more difficult for us to pursue our business goals and could seriously harm our business.
Our growth could strain our resources and our business may suffer if we fail to implement appropriate controls and procedures to manage our growth.
We are currently experiencing a period of rapid growth in employees and operations, with our employee base increasing from 405 full-time employees as of December 31, 2005 to 637 full-time employees as of December 31, 2006. This growth has placed, and will continue to place, a strain on our management, administrative, and sales and marketing infrastructure. If we fail to successfully manage our growth, our business could be disrupted, and our ability to operate our business profitably could suffer. We anticipate that further growth in our employee base will be required to expand our customer base and to continue to develop and enhance our Web service and product offerings. To manage the growth of our operations and personnel, we will
20
need to enhance our operational, financial, and management controls and our reporting systems and procedures. This will require additional personnel and capital investments, which will increase our cost base. The growth in our fixed cost base may make it more difficult for us to reduce expenses in the short term to offset any shortfalls in revenue.
We may be unable to protect our intellectual property adequately or cost-effectively, which may cause us to lose market share or force us to reduce our prices.
Our success depends, in part, on our ability to protect and preserve the proprietary aspects of our technology, Web services, and products. If we are unable to protect our intellectual property, our competitors could use our intellectual property to market services and products similar to those offered by us, which could decrease demand for our Web services and products. We may be unable to prevent third parties from using our proprietary assets without our authorization. We do not currently rely on patents to protect our core intellectual property, and we have not applied for patents in any jurisdictions inside or outside of the United States. To protect, control access to, and limit distribution of our intellectual property, we generally enter into confidentiality and proprietary inventions agreements with our employees, and confidentiality or license agreements with consultants, third-party developers, and customers. We also rely on copyright, trademark, and trade secret protection. However, these measures afford only limited protection and may be inadequate. Enforcing our rights to our technology could be costly, time-consuming and distracting. Additionally, others may develop non-infringing technologies that are similar or superior to ours. Any significant failure or inability to adequately protect our proprietary assets will harm our business and reduce our ability to compete.
If we fail to maintain an effective system of internal controls, we may not be able to accurately or timely report our financial results, which could cause our stock price to fall or result in our stock being delisted.
Effective internal controls are necessary for us to provide reliable and accurate financial reports. We will need to devote significant resources and time to comply with the requirements of Sarbanes-Oxley with respect to internal control over financial reporting. In addition, Section 404 under Sarbanes-Oxley requires that we assess and our auditors attest to the design and operating effectiveness of our controls over financial reporting. Our ability to comply with the annual internal control report requirement for our fiscal year ending on December 31, 2007, will depend on the effectiveness of our financial reporting and data systems and controls across our company and our operating subsidiaries. We expect these systems and controls to become increasingly complex to the extent that we integrate acquisitions and our business grows. To effectively manage this complexity, we will need to continue to improve our operational, financial, and management controls and our reporting systems and procedures. Any failure to implement required new or improved controls, or difficulties encountered in the implementation or operation of these controls, could harm our operating results or cause us to fail to meet our financial reporting obligations, which could adversely affect our business and jeopardize our listing on the NASDAQ Global Market, either of which would harm our stock price.
We might require additional capital to support business growth, and this capital might not be available on acceptable terms, or at all.
We intend to continue to make investments to support our business growth and may require additional funds to respond to business challenges, including the need to develop new services and products or enhance our existing Web services, enhance our operating infrastructure and acquire complementary businesses and technologies. Accordingly, we may need to engage in equity or debt financings to secure additional funds. If we raise additional funds through further issuances of equity or convertible debt securities, our existing stockholders could suffer significant dilution, and any new equity securities we issue could have rights, preferences and privileges superior to those of holders of our common stock. Any debt financing secured by us in the future could involve restrictive covenants relating to our capital raising activities and other financial and operational matters, which may make it more difficult for us to obtain additional capital and to pursue business opportunities, including potential acquisitions. In addition, we may not be able to obtain additional financing on terms favorable to us, if at all. If we
21
are unable to obtain adequate financing or financing on terms satisfactory to us, when we require it, our ability to continue to support our business growth and to respond to business challenges could be significantly impaired.
Provisions in our amended and restated certificate of incorporation and bylaws or under Delaware law might discourage, delay, or prevent a change of control of our company or changes in our management and, therefore, depress the trading price of our common stock.
Our amended and restated certificate of incorporation and bylaws contain provisions that could depress the trading price of our common stock by acting to discourage, delay, or prevent a change of control of our company or changes in our management that the stockholders of our company may deem advantageous. These provisions:
| | • | | establish a classified board of directors so that not all members of our board are elected at one time; |
| | • | | provide that directors may only be removed for cause and only with the approval of 66 2/3% of our stockholders; |
| | • | | require super-majority voting to amend some provisions in our amended and restated certificate of incorporation and bylaws; |
| | • | | authorize the issuance of blank check preferred stock that our board of directors could issue to increase the number of outstanding shares to discourage a takeover attempt; |
| | • | | prohibit stockholder action by written consent, which requires all stockholder actions to be taken at a meeting of our stockholders; |
| | • | | provide that the board of directors is expressly authorized to make, alter, or repeal our bylaws; and |
| | • | | establish advance notice requirements for nominations for elections to our board or for proposing matters that can be acted upon by stockholders at stockholder meetings. |
Additionally, we are subject to Section 203 of the Delaware General Corporation Law, which generally prohibits a Delaware corporation from engaging in any of a broad range of business combinations with any “interested” stockholder for a period of three years following the date on which the stockholder became an “interested” stockholder and which may discourage, delay, or prevent a change of control of our company.
Item 1B. Unresolved Staff Comments.
None.
Item 2. Properties.
We do not own any real estate. We lease the following principal facilities:
| | | | | | |
| | | Location | | Square
Feet | | Lease Expiration |
Headquarters and principal administrative, finance, and marketing operations | | Jacksonville, FL | | 41,149 | | March 2008 |
Web services sales center | | Spokane, WA | | 15,931 | | June 2007 |
Leads.com sales center | | Manassas, VA | | 24,081 | | September 2014 |
Leads.com sales center | | Norton, VA | | 5,467 | | November 2008 |
1ShoppingCart.com operations center | | Barrie, Ontario,
Canada | | 8,301 | | May 2012 |
RenovationExperts.com operations center | | Halifax, Nova Scotia,
Canada | | 5,104 | | May 2009 |
22
Item 3. Legal Proceedings.
From time to time we may be involved in litigation relating to claims arising out of our operations. We are not currently involved in any material legal proceedings.
Item 4. Submission of Matters to a Vote of Security Holders.
No matters were submitted to a vote of our security holders during the quarter ended December 31, 2006.
23
PART II
Item 5. Market for Registrant’s Common Equity, Related Stockholder Matters and Issuer Purchases of Equity Securities.
Market Information
Since November 1, 2005, our common stock has been listed on the NASDAQ Global Market under the symbol “WSPI”. Prior to such time, there was no public market for our common stock. The following table sets forth the high and low stock prices of our common stock for the last two fiscal years as reported on the NASDAQ Global Market.
| | | | | | | | | | | | |
| | | 2006 | | 2005 |
| | | High | | Low | | High | | Low |
First Quarter | | $ | 14.20 | | $ | 8.56 | | | N/A | | | N/A |
Second Quarter | | $ | 14.21 | | $ | 8.60 | | | N/A | | | N/A |
Third Quarter | | $ | 11.26 | | $ | 8.65 | | | N/A | | | N/A |
Fourth Quarter | | $ | 12.30 | | $ | 7.85 | | $ | 10.50 | | $ | 8.11 |
The closing price for our common stock as reported by the NASDAQ Global Market on February 28, 2007 was $9.20 per share. As of February 28, 2007, there were approximately 110 stockholders of record of our common stock, not including those shares held in street or nominee name.
Dividend Policy
We have never declared or paid any cash dividends on our capital stock. We currently intend to retain any future earnings to fund the development and expansion of our business, and therefore we do not anticipate paying cash dividends on our common stock in the foreseeable future. Any future determination to pay dividends will be at the discretion of our board of directors. None of our outstanding capital stock is entitled to any dividends.
Recent Sales of Unregistered Securities
There were no sales of unregistered equity securities by Website Pros that were not previously included in a quarterly report on Form 10-Q or in a current report on Form 8-K.
24
Item 6. Selected Financial Data.
| | | | | | | | | | | | | | | | | | | |
| | | Year Ended December 31, | |
| | | 2006(1) | | 2005(1) | | | 2004 | | | 2003 | | | 2002 | |
| | | (in thousands, except per share data) | |
Consolidated Statement of Operations Data: | | | | | | | | | | | | | | | | | | | |
Revenues | | $ | 52,041 | | $ | 37,770 | | | $ | 23,402 | | | $ | 16,947 | | | $ | 13,651 | |
Income (loss) from operations | | | 2,997 | | | 425 | | | | 656 | | | | (1,373 | ) | | | (6,188 | ) |
Net income (loss) | | | 8,597 | | | 827 | | | | 924 | | | | (1,532 | ) | | | (6,358 | ) |
Net income (loss) attributable to common stockholders | | | 8,597 | | | (329 | ) | | | (370 | ) | | | (1,578 | ) | | | (6,358 | ) |
Basic net income (loss) attributable per common share | | $ | 0.51 | | $ | (0.05 | ) | | $ | (0.12 | ) | | $ | (0.27 | ) | | $ | (1.22 | ) |
Diluted net income (loss) attributable per common share | | $ | 0.44 | | $ | (0.05 | ) | | $ | (0.12 | ) | | $ | (0.27 | ) | | $ | (1.22 | ) |
Basic weighted average common shares outstanding | | | 16,778 | | | 6,222 | | | | 3,002 | | | | 5,758 | | | | 5,222 | |
Diluted weighted average common shares outstanding | | | 19,430 | | | 6,222 | | | | 3,002 | | | | 5,758 | | | | 5,222 | |
| | | | | | | | | | | | | | | | | | | | |
| | | As of December 31, | |
| | | 2006 | | | 2005 | | | 2004 | | | 2003 | | | 2002 | |
| | | (in thousands) | |
Consolidated Balance Sheet Data: | | | | | | | | | | | | | | | | | | | | |
Cash and cash equivalents | | $ | 42,155 | | | $ | 55,746 | | | $ | 6,621 | | | $ | 6,282 | | | $ | 467 | |
Working capital | | | 39,534 | | | | 51,535 | | | | 4,926 | | | | 2,914 | | | | (4,151 | ) |
Total assets | | | 93,360 | | | | 76,370 | | | | 13,370 | | | | 11,869 | | | | 6,289 | |
Long-term note payable and obligations under capital leases | | | 194 | | | | 241 | | | | — | | | | — | | | | 447 | |
Convertible redeemable preferred stock | | | — | | | | — | | | | 17,454 | | | | 9,233 | | | | — | |
Accumulated deficit | | | (59,162 | ) | | | (67,759 | ) | | | (69,030 | ) | | | (68,485 | ) | | | (66,896 | ) |
Total stockholders’ equity (deficit) | | | 83,956 | | | | 68,355 | | | | (9,191 | ) | | | (3,153 | ) | | | (956 | ) |
| (1) | See Note 6 to the Consolidated Financial Statements for information regarding businesses acquired during the years ended December 31, 2006 and 2005. |
Item 7. Management’s Discussion and Analysis of Financial Condition and Results of Operation.
Safe Harbor
In addition to historical information, this Form 10-K contains forward-looking statements within the meaning of Section 27A of the Securities Act of 1933 and Section 21E of the Securities Exchange Act of 1934. Actual results could differ materially from those projected in the forward-looking statements as a result of a number of factors, risks and uncertainties, including the risk factors set forth in Item 1A. above and the risk factors set forth in this discussion, especially under the captions “Variability of Results” and “Factors That May Affect Future Operating Results” in this Form 10-K. Generally, the words “anticipate”, “expect”, “intend”, “believe” and similar expressions identify forward-looking statements. The forward-looking statements made in this Form 10-K are made as of the filing date of this Form 10-K with the Securities and Exchange Commission, and future events or circumstances could cause results that differ significantly from the forward-looking statements included here. Accordingly, we caution readers not to place undue reliance on these statements. We expressly disclaim any obligation to update or alter our forward-looking statements, whether, as a result of new information, future events or otherwise after the date of this document.
Overview
We believe we are a leading provider, based on our number of subscribers, of Do-It-For-Me Web services and lead generation products that enable small and medium-sized businesses to establish, maintain, promote, and optimize their Internet presence. Our primary service offerings, eWorks! XL and SmartClicks, are comprehensive performance-based packages that include Website design and publishing, Internet marketing and advertising, search engine optimization, search engine submission, lead generation and easy-to-understand Web
25
analytics. As an application service provider, or ASP, we offer our customers a full range of Web services and products on an affordable subscription basis. In addition to our primary service offerings, we provide a variety of premium services to customers who desire more advanced capabilities; such as e-commerce solutions and other sophisticated Internet marketing services and online lead generation. The breadth and flexibility of our offerings allow us to address the Web services needs of a wide variety of customers, ranging from those just establishing their Websites to those that want to enhance their existing Internet presence with more sophisticated marketing and lead generation services. Additionally, as the Internet continues to evolve, we will refine and expand our service offerings to keep our customers at the forefront.
Through the combination of our proprietary Website publishing and management software, automated workflow processes, and specialized workforce development and management techniques, we believe that we achieve production efficiencies that enable us to offer sophisticated Web services at affordable rates. Our technology automates many aspects of creating, maintaining, enhancing, and marketing Websites on behalf of our customers. With approximately 74,000 subscribers to our eWorks! XL, SmartClicks, and premium subscription-based services as of December 31, 2006 (approximately 14,000 can be attributed to our 2006 acquisitions), we believe we are one of the industry’s largest providers of affordable Web services and products enabling small and medium-sized businesses to have an effective Internet presence.
We sell our Web services and products to customers identified primarily through strategic relationships with established brand name companies that have a large number of small and medium-sized business customers, including Discover Financial Services, LLC, or Discover. We have a direct sales force based at our national sales center in Spokane, Washington, that utilizes leads generated by our strategic marketing relationships to acquire new customers. Our sales force specializes in selling to small and medium-sized businesses across a wide variety of industries throughout the United States.
To increase our revenue and take advantage of our market opportunity, we plan to expand our subscriber base as well as increase our revenue from existing subscribers. We intend to continue to invest in hiring additional personnel, particularly in sales and marketing; developing additional services and products; adding to our infrastructure to support our growth; and expanding our operational and financial systems to manage our growing business. As we have in the past, we will continue to evaluate acquisition opportunities to increase the value and breadth of our Web services and product offerings and expand our subscriber base.
Key Business Metrics
Management periodically reviews certain key business metrics to evaluate the effectiveness of our operational strategies, allocate resources and maximize the financial performance of our business. These key business metrics include:
Net Subscriber Additions
We grow our subscriber base through a combination of adding new subscribers and retaining existing subscribers. We define net subscriber additions in a particular period as the gross number of new subscribers added during the period, less subscriber cancellations during the period. For this purpose, we only count as new subscribers those customers whose subscriptions have extended beyond the free trial period. Additionally, we do not treat a subscription as cancelled, even if the customer is not current in its payments, until either we have attempted to contact the subscriber twenty times or 60 days have passed since the most recent failed billing attempt, whichever is sooner. In any event, a subscriber’s account is cancelled if payment is not received within approximately 80 days.
We review this metric to evaluate whether we are performing to our business plan. An increase in net subscriber additions could signal an increase in subscription revenue, higher customer retention, and an increase in the effectiveness of our sales efforts. Similarly, a decrease in net subscriber additions could signal decreased
26
subscription revenue, lower customer retention, and a decrease in the effectiveness of our sales efforts. Net subscriber additions above or below our business plan could have a long-term impact on our operating results due to the subscription nature of our business.
Monthly Turnover
Monthly turnover is a metric we measure each quarter, and which we define as customer cancellations in the quarter divided by the sum of the number of subscribers at the beginning of the quarter and the gross number of new subscribers added during the period, divided by three months. Customer cancellations in the quarter include cancellations from gross subscriber additions, which is why we include gross subscriber additions in the denominator. In measuring monthly turnover, we use the same conventions with respect to free trials and subscribers who are not current in their payments as described above for net subscriber additions. Monthly turnover is the key metric that allows management to evaluate whether we are retaining our existing subscribers in accordance with our business plan. An increase in monthly turnover may signal deterioration in the quality of our service, or it may signal a behavioral change in our subscriber base. Lower monthly turnover signals higher customer retention.
Change in Accounting Principle
Effective January 1, 2006, we adopted Statement of Financial Accounting Standards 123(R) (SFAS No. 123(R)),Share Based Payment. Since we previously adopted the expense recognition provisions of SFAS No. 123, the adoption of SFAS No. 123(R) had no material impact on our financial statements.
Sources of Revenue
We derive our revenue from sales of subscriptions, licenses, and services to our customers. Our revenue generally depends on the sale of a large number of subscriptions to small and medium-sized businesses. Leads provided by a relatively small number of companies with which we have strategic marketing relationships generate most of these sales. Customers acquired through our strategic marketing relationship with Discover accounted for 51%, 57% and 65% of our total revenue in the years ended December 31, 2006, 2005, and 2004, respectively. Customers acquired through our strategic marketing relationship with Discover accounted for 57%, 67%, and 78% of our subscription revenue in the years ended December 31, 2006, 2005, and 2004, respectively.
Subscription Revenue
We currently derive a substantial majority of our revenue from fees associated with our subscription services, which are generally sold through our eWorks! XL, SmartClicks, Visibility Online, Renex and 1ShoppingCart.com offerings. A majority of our subscription contracts include the design of a five-page Website, its hosting, and several additional Web services. In the case of eWorks! XL, upon the completion and initial hosting of the Website, our subscription services are offered free of charge for a 30-day trial period during which the customer can cancel at any time. After the 30-day trial period has ended, the revenue is recognized on a daily basis over the life of the contract. No 30-day free trial period is offered to customers for our Visibility Online services, and revenue is recognized on a daily basis over the life of the contract.
The typical subscription is a monthly contract, although terms range up to 12 months. We bill a majority of our customers on a monthly basis through their credit cards, bank accounts, or business merchant accounts. For the year ended December 31, 2006 subscription revenue accounted for approximately 90% of our total revenue as compared to 86% and 83% for the years ended December 31, 2005 and 2004, respectively. The number of paying subscribers to our Web services and lead generation products drives subscription revenue as well as the subscription price that we charge for these services. The number of paying subscribers is affected both by the number of new customers we acquire in a given period and by the number of existing customers we retain during that period. We expect other sources of revenue to decline as a percentage of total revenue over time.
27
License Revenue
We generate license revenue from the sale of perpetual licenses to use our software products. Our software products enable customers to build Websites either for themselves or for others. License revenue consists of all fees earned from granting customers licenses to use our software products. Software may be delivered indirectly by a channel distributor, through download from our Website, or directly to end users by us. We recognize license revenue from packaged products upon shipment to end-users. We consider delivery of licenses under electronic licensing agreements to have occurred when the related products are shipped and the end user has been electronically provided with the licenses and software activation keys that allow the end user to take immediate possession of the software. In periods during which we release new versions of our software, our license revenue is likely to be higher than in periods during which no new releases occur.
Professional Services Revenue
We also generate professional services revenue from custom Website design and outsourced customer service and sales support. Our custom Website design work is typically billed on a fixed price basis and over very short periods. Our outsourced customer service and sales support services are typically billed on an hourly basis.
Cost of Revenue
Cost of Subscription Revenue
Cost of subscription revenue primarily consists of expenses related to marketing fees we pay to companies with which we have strategic marketing relationships as well as compensation expenses related to our Web page development staff, directory listing fees, customer support costs, domain name and search engine registration fees, allocated overhead costs, billing costs, and hosting expenses. We allocate overhead costs such as rent and utilities to all departments based on headcount. Accordingly, general overhead expenses are reflected in each cost of revenue and operating expense category. As our customer base and Web services usage grows, we intend to continue to invest additional resources in our Website development and support staff.
Cost of License Revenue
Cost of license revenue consists of costs attributable to the manufacture and distribution of the software, compensation expenses related to our quality assurance staff, as well as allocated overhead costs.
Cost of Professional Services Revenue
Cost of professional services revenue primarily consists of compensation expenses related to our Web page development staff and allocated overhead costs. We plan to add additional resources in this area to support the expected growth in our professional services and custom design functions.
Operating Expenses
Sales and Marketing Expense
Sales and marketing expenses are our largest indirect cost and consist primarily of salaries and related expenses for our sales and marketing staff. Sales and marketing expenses also include commissions, marketing programs, including advertising, events, corporate communications, other brand building and product marketing expenses, and allocated overhead costs.
We plan to continue to invest heavily in sales and marketing by increasing the number of direct sales personnel in order to add new subscription customers as well as increase sales of additional and new services and products to our existing customer base. Our investment in this area will also help us to expand our strategic marketing relationships, to build brand awareness, and to sponsor additional marketing events. We expect that, in the future, sales and marketing expenses will increase in absolute dollars and continue to be our largest indirect cost.
28
Research and Development Expense
Research and development expenses consist primarily of salaries and related expenses for our research and development staff, outsourced software development expenses, and allocated overhead costs. We have historically focused our research and development efforts on increasing the functionality of the technologies that enable our Web services and lead generation products. Our technology architecture enables us to provide all of our customers with a service based on a single version of the applications that serve each of our product offerings. As a result, we do not have to maintain multiple versions of our software, which enables us to have lower research and development expenses as a percentage of total revenue. We expect that, in the future, research and development expenses will increase in absolute dollars as we continue to upgrade and extend our service offerings and develop new technologies.
General and Administrative Expense
General and administrative expenses consist of salaries and related expenses for executive, finance, administration, and management information systems personnel, as well as professional fees, other corporate expenses, and allocated overhead costs. We expect that general and administrative expenses will increase in absolute dollars as we continue to add personnel to support the growth of our business.
Depreciation and Amortization Expense
Depreciation and amortization expenses relate primarily to our computer equipment, software and other intangible assets recorded due to the acquisitions we have completed.
Critical Accounting Policies
Our discussion and analysis of our financial condition and results of operations are based on our consolidated financial statements, which have been prepared in accordance with accounting principles generally accepted in the United States. The preparation of these financial statements requires us to make estimates and judgments that affect the reported amounts of assets, liabilities, and expenses and related disclosure of contingent assets and liabilities. We review our estimates on an ongoing basis. We base our estimates on historical experience and on various other assumptions that we believe to be reasonable under the circumstances, the results of which form the basis for making judgments about the carrying values of assets and liabilities. Actual results may differ from these estimates under different assumptions or conditions. While our significant accounting policies are described in more detail in Note 1 to our consolidated financial statements included in this report, we believe the following accounting policies to be critical to the judgments and estimates used in the preparation of our consolidated financial statements.
Revenue Recognition
We recognize revenue in accordance with SEC Staff Accounting Bulletin No. 104 and other related generally accepted accounting principles.
We recognize revenue when all of the following conditions are satisfied: (1) there is persuasive evidence of an arrangement; (2) the service has been provided to the customer; (3) the amount of fees to be paid by the customer is fixed or determinable; and (4) the collection of our fees is probable.
Thus, we recognize subscription revenue on a daily basis, as services are provided. Customers are billed for the subscription on a monthly, quarterly, semi-annual, or annual basis, at the customer’s option. For all of our customers, regardless of their billing method, subscription revenue is recorded as deferred revenue in the accompanying consolidated balance sheets. As services are performed, we recognize subscription revenue on a daily basis over the applicable service period. When we provide a free trial period, we do not begin to recognize subscription revenue until the trial period has ended and the customer has been billed for the services.
29
License revenue is derived from sales of software licenses directly to end-users as well as through value-added resellers and distributors. Software may be delivered indirectly by a distributor, through download from our Website, or directly to end-users by our company. We recognize revenue generated by the distribution of software licenses directly by us in the form of a boxed software product or a digital download upon sale and delivery to the end-user. End-users who purchase a software license online pay for the license at the time of order. We do not offer extended payment terms or make concessions for software license sales. We recognize revenue generated from distribution agreements where the distributor has a right of return as the distributor sells and delivers software license product to the end-user. We recognize revenue from distribution agreements where no right of return exists when a licensed software product is shipped to the distributor. In arrangements where distributors pay us upon shipment of software product to end-customers, we recognize revenue upon payment by the distributor. We are not obligated to provide technical support in connection with software licenses and do not provide technical support services to our software license customers. Our revenue recognition policies are in compliance with Statement of Position, or SOP, 97-2 (as amended by SOP 98-4 and SOP 98-9),Software Revenue Recognition.
Professional services revenue is generated from custom Website designs and outsourced customer service and sales support services. Our professional services revenue from contracts for custom Website design is recorded using a proportional performance model based on labor hours incurred. The extent of progress toward completion is measured by the labor hours incurred as a percentage of total estimated labor hours to complete. Labor hours are the most appropriate measure to allocate revenue among reporting periods, as they are the primary input to the provision of our professional services.
We account for our multi-element arrangements, such as in the instances where we design a custom Website and separately offer other services such as hosting and marketing, in accordance with Emerging Issues Task Force Issue 00-21,Revenue Arrangements with Multiple Deliverables. We identify each element in an arrangement and assign the relative fair value to each element. The additional services provided with a custom Website are recognized separately over the period for which services are performed.
Allowance for Doubtful Accounts
In accordance with our revenue recognition policy, our accounts receivable are based on customers whose payment is reasonably assured. We monitor collections from our customers and maintain an allowance for estimated credit losses based on historical experience and specific customer collection issues. While credit losses have historically been within our expectations and the provisions established in our financial statements, we cannot guarantee that we will continue to experience the same credit loss rates that we have in the past. Because we have a large number of customers, we do not believe a change in liquidity of any one customer or our inability to collect from any one customer would have a material adverse impact on our consolidated financial position.
We also monitor failed direct debit billing transactions and customer refunds and maintain an allowance for estimated losses based upon historical experience. These provisions to our allowance are recorded as an adjustment to revenue. While losses from these items have historically been minimal, we cannot guarantee that we will continue to experience the same loss rates that we have in the past.
Accounting for Stock-Based Compensation
We record compensation expenses for our employee and director stock-based compensation plans based upon the fair value of the award in accordance with SFAS No. 123(R),Share Based Payment, which we adopted on January 1, 2006. Because we previously adopted the expense recognition provisions of SFAS No.123,Accounting for Stock-Based Compensation, the adoption of SFAS No.123(R) had no material impact on our financial statements. Stock-based compensation is amortized over the related vesting periods.
Valuation at the Time of Grant. We granted to our employees options to purchase common stock at exercise prices equal to the quoted market values of the underlying stock at the time of each grant. However, prior to
30
November 2005, we valued the underlying stock at the time of each grant, as determined by our board of directors. Our board determined these values principally based upon valuations performed by management as well as arms-length transactions involving our common and preferred stock. We did not obtain contemporaneous valuations by an unrelated valuation specialist, because prior to December 2003, our efforts were focused on product and business development and the financial and managerial resources for doing so were limited. During and subsequent to December 2003, we completed several arms-length preferred stock and common stock transactions and believed that they represented the best indication of the fair value of our stock.
Reassessment of Fair Value. As described above, at the time we granted stock options, we believed that the per share exercise price of the shares of common stock subject to options represented the fair value of that stock as of the grant date. However, in connection with the preparation of the financial statements for our initial public offering (IPO) and solely for the purposes of accounting for employee stock-based compensation, we reconsidered the fair value of the equity awards. We noted that the fair value of the shares subject to the equity awards granted during this period, as determined by our board of directors, was less than the potential valuations implied by comparable company multiples that our underwriters were identifying for us in connection with our preparations for the offering. We believed we should not ignore the discrepancies in the valuations in determining the fair value of the equity awards. As a result, we applied hindsight to reassess the fair value of our common stock for all equity awards granted in 2004.
In reassessing the fair value of the shares of common stock underlying the equity awards granted in 2004 and 2005, our board of directors considered a combination of valuation methodologies, including income, market, and transaction approaches, that it believed was consistent with the practices recommended by the American Institute of Certified Public Accountant’s Audit and Accounting Practice Aid Series Valuation of Privately-Held-Company Equity Securities Issued as Compensation, or the practice aid.
We used a transaction-based method to reassess the fair value of the common stock underlying the equity awards granted from March 2004 to May 2004, as our board reviewed the guidance set forth in the practice aid and determined that the recently completed arms-length cash transactions with unrelated parties for the issuances and repurchases of our equity securities represented observable prices that serve the same purpose as a quoted market price. Additionally, we employed each of the market and income approaches as set forth in the practice aid for grants made on August 20, 2004, December 1, 2004, April 6, 2005, June 15, 2005 and August 9, 2005, which were the dates on which we made the most significant option grants in the respective quarters. Based upon an analysis of the assumptions required to be made in, and the results of, each of these methods, we concluded that the transaction-based method resulted in the best estimate of fair market value for grants made in November 2003 and in the period from March 2004 through May 2004. We concluded that the market value approach did not yield the best estimate of fair value, as there were no exact market comparables. As there were no recently completed arms-length transactions with unrelated parties involving the same underlying security, we concluded that the income approach yielded the best estimate of fair value during the period from June 2004 through August 2005.
In applying this reassessment methodology to value the shares of common stock underlying the awards granted since March 2004, our board grouped the awards into five categories based on chronology: awards granted in March 2004 through May 2004; awards granted in June 2004 through August 2004; awards granted in September 2004 through December 2004; awards granted in January 2005 through May 2005; and awards granted in June 2005 through August 2005.
Equity awards granted in March 2004 through May 2004. For equity awards granted in March 2004 through May 2004, our board noted that we had completed significant arms-length repurchases of common stock at observable prices. During January 2004, we repurchased an aggregate of 201,207 shares at a price of $1.90 per share. In February and March 2004, we repurchased 2,464,229 shares from 30 stockholders at $2.16 per share. Based upon these transactions, our board determined the fair value of the securities underlying the awards granted in this period to be $2.16 per share.
31
Equity awards granted in June 2004 through August 2004. For equity awards granted in June 2004 through August 2004, our board determined that the income approach yielded the best estimate of fair value. We employed the discounted cash flow method as described in the practice aid based upon financial models reviewed by our board of directors and underlying a 11-year cash flow forecast. We determined the appropriate discount rate by considering our stage of development, venture capital portfolio return, and weighted average cost of capital studies outlined in the practice aid, as well as our own independent calculations of weighted-average cost of capital. We used a discount rate of 32.5%, representing the low end of the range suggested by studies in the practice aid for companies in the second stage or expansion stage of development, as we had not entered the Bridge/IPO stage described in the practice aid but had been delivering services to customers for several years. In each of our discounted cash flow analyses, we used a growth rate implicit in the terminal value of 6%.
Equity awards granted in September 2004 through December 2004. For equity awards granted in September 2004 through December 2004, using the income approach described above, we prepared similar discounted cash flow analyses using a discount rate of 25%, representing the low end of the range suggested by studies referenced in the practice aid for companies in the Bridge/IPO stage of development. As our board of directors had determined to pursue an initial public offering and was actively seeking an additional round of private financing in December 2004, we believe that this discount rate is appropriate.
Equity awards granted in January 2005 through May 2005. For equity awards granted in January 2005 through May 2005, using the income approach described above, we prepared similar discounted cash flow analyses using a discount rate of 22.5%. Based upon our continued performance and the anticipated filing of our registration statement, we determined that a further decrease in the discount rate from 25% to 22.5% was warranted.
Equity awards granted in June 2005 through August 2005. For equity awards granted between June 2005 and August 2005, using the income approach described above, we prepared similar discounted cash flow analyses using a discount rate of 21% for June 2005 and 20.5% for July and August 2005. Based upon our continued performance and advancement of our registration process, we determined that a further decrease in the discount rate from 22.5% was warranted.
For equity awards granted after November 2005, we valued the fair value of each option award, on the date of the grant, using the Black Scholes option valuation model.
32
The table below summarizes our options granted during the years ended December 31, 2004, 2005, and 2006:
| | | | | | | | | |
Month | | Number of Shares | | | Exercise Price Per Share | | Fair Value Per Share |
March 2004 | | 8,700 | | | $ | 2.15 | | $ | 2.15 |
April 2004 | | 1,800 | | | | 2.15 | | | 2.15 |
May 2004 | | 2,400 | | | | 2.15 | | | 2.15 |
June 2004 | | 2,700 | | | | 2.15 | | | 3.55 |
July 2004 | | 1,800 | | | | 3.25 | | | 3.55 |
August 2004 | | 128,600 | | | | 3.25 | | | 3.55 |
September 2004 | | 2,700 | | | | 3.25 | | | 6.00 |
October 2004 | | 4,200 | | | | 4.45 | | | 6.00 |
November 2004 | | 6,800 | | | | 4.45 | | | 6.00 |
December 2004 | | 80,000 | | | | 4.45 | | | 6.00 |
April 2005 | | 728,799 | | | | 9.00 | | | 7.10 |
April 2005 | | 73,241 | (1) | | | 4.50 | | | 7.10 |
May 2005 | | 82,200 | | | | 9.00 | | | 7.10 |
June 2005 | | 47,199 | | | | 9.60 | | | 8.25 |
July 2005 | | 5,700 | | | | 10.10 | | | 8.90 |
August 2005 | | 98,400 | | | | 10.65 | | | 8.90 |
November 2005 | | 76,674 | | | | 10.01 | | | 10.01 |
November 2005 | | 160,000 | | | | 10.00 | | | 10.00 |
December 2005 | | 17,200 | | | | 8.70 | | | 8.70 |
January 2006 | | 120,000 | | | | 10.90 | | | 10.90 |
January 2006 | | 39,000 | | | | 10.38 | | | 10.38 |
February 2006 | | 155,000 | | | | 11.25 | | | 11.25 |
March 2006 | | 16,000 | | | | 14.05 | | | 14.05 |
April 2006 | | 10,000 | | | | 11.45 | | | 11.45 |
May 2006 | | 70,000 | | | | 11.64 | | | 11.64 |
July 2006 | | 20,400 | | | | 10.00 | | | 10.00 |
October 2006 | | 302,350 | | | | 10.98 | | | 10.98 |
| | | | | | | | | |
| | 2,261,863 | | | | | | | |
| | | | | | | | | |
| (1) | Consists of options assumed by us in connection with the LEADS.com acquisition. |
Goodwill and Intangible Assets
In accordance with Statement of Financial Accounting Standards No. 142Goodwill and Other Intangible Assets, we periodically evaluate goodwill and indefinite lived intangible assets for potential impairment. We test for the impairment of goodwill and indefinite lived intangible assets annually, and between annual tests if an event occurs or circumstances change that would more likely than not reduce the fair value of goodwill or indefinite lived intangible assets below its carrying amount. Other intangible assets include, among other items, customer relationships and non-compete agreements, and they are amortized using the straight-line method over the periods benefited, which is up to eight years. Other intangible assets represent long-lived assets and are assessed for potential impairment whenever significant events or changes occur that might impact recovery of recorded costs. While we believe it is unlikely that any significant changes to the useful lives of our tangible and intangible assets will occur in the near term, rapid changes in technology or changes in market conditions could result in revisions to such estimates that could materially affect the carrying value of these assets and our future operating results. See Note 7 “Goodwill and Intangible Assets” in the consolidated financial statements for additional information on goodwill and intangible assets.
33
Accounting for Purchase Business Combinations
All of our acquisitions were accounted for as purchase transactions, and the purchase price was allocated to the assets acquired and liabilities assumed based on the fair value of the assets acquired and liabilities assumed. The excess of the purchase price over the fair value of net assets acquired or net liabilities assumed, was allocated to goodwill. The fair value of amortizable intangibles, primarily consisting of customer relationships, non-compete agreements, trade names, and technical know-how, was determined using valuation studies performed by an independent third-party valuation expert.
In connection with the 1ShoppingCart.com and Renex acquisitions, we recorded intangible assets of $6.0 million and goodwill of $17.9 million. These intangible assets are being amortized over periods ranging from three to eight years, with the exception of the trade name intangible assets that have an indefinite life.
Provision for Income Taxes
We recognize deferred tax assets and liabilities on differences between the book and tax basis of assets and liabilities using currently effective tax rates. Further, deferred tax assets are recognized for the expected realization of available net operating loss carry forwards. A valuation allowance is recorded to reduce a deferred tax asset to an amount that we expect to realize in the future. In prior years, we recorded a full valuation allowance based on our belief that available objective evidence created sufficient uncertainty regarding the realizability of our deferred tax assets. We review the adequacy of the valuation allowance on an ongoing basis and recognize these benefits if a reassessment indicates that it is more likely than not that these benefits will be realized. In addition, we evaluate our tax contingencies on an ongoing basis and recognize a liability when we believe that it is probable that a liability exists and that the liability is measurable.
In accordance with SFAS No. 109Accounting for Income Taxes, the Company reevaluated the need for a full valuation allowance on its deferred tax assets as a result of cumulative profits generated in the most recent three-year period as well as other positive evidence. As a result of this evaluation, the Company recognized tax benefits of $3.2 million in 2006, which was recorded as an income tax benefit.
34
Results of Operations
The following table presents our selected consolidated statement of operations data for the periods indicated (in thousands):
| | | | | | | | | |
| | | Year Ended December 31, |
| | | 2006 | | 2005 | | 2004 |
Revenue: | | | | | | | | | |
Subscription | | $ | 46,789 | | $ | 32,574 | | $ | 19,415 |
License | | | 3,585 | | | 3,858 | | | 3,425 |
Professional services | | | 1,667 | | | 1,338 | | | 562 |
| | | | | | | | | |
Total revenue | | | 52,041 | | | 37,770 | | | 23,402 |
Cost of revenue (excluding depreciation and amortization shown separately below): | | | | | | | | | |
Subscription | | | 20,534 | | | 15,058 | | | 9,901 |
License | | | 958 | | | 1,013 | | | 719 |
Professional services | | | 1,421 | | | 1,085 | | | 620 |
| | | | | | | | | |
Total cost of revenue | | | 22,913 | | | 17,156 | | | 11,240 |
| | | | | | | | | |
Gross profit | | | 29,128 | | | 20,614 | | | 12,162 |
Operating expenses: | | | | | | | | | |
Sales and marketing | | | 12,511 | | | 9,731 | | | 6,846 |
Research and development | | | 2,256 | | | 1,895 | | | 1,150 |
General and administrative | | | 9,652 | | | 6,840 | | | 3,110 |
Depreciation and amortization | | | 1,712 | | | 1,723 | | | 400 |
| | | | | | | | | |
Total operating expenses | | | 26,131 | | | 20,189 | | | 11,506 |
| | | | | | | | | |
Income from operations | | | 2,997 | | | 425 | | | 656 |
Interest, net | | | 2,400 | | | 402 | | | 59 |
| | | | | | | | | |
Income before extraordinary item and income taxes | | | 5,397 | | | 827 | | | 715 |
Extraordinary item | | | — | | | — | | | 209 |
| | | | | | | | | |
Income before income taxes | | | 5,397 | | | 827 | | | 924 |
Income tax benefit | | | 3,200 | | | — | | | — |
| | | | | | | | | |
Net income | | | 8,597 | | | 827 | | | 924 |
| | | | | | | | | |
35
The following table presents our selected consolidated statement of operations data expressed as a percentage of our total revenue for the periods indicated:
| | | | | | | | | |
| | | Year Ended December 31, | |
| | | 2006 | | | 2005 | | | 2004 | |
Revenue: | | | | | | | | | |
Subscription | | 90 | % | | 86 | % | | 83 | % |
License | | 7 | | | 10 | | | 15 | |
Professional services | | 3 | | | 4 | | | 2 | |
| | | | | | | | | |
Total revenue | | 100 | | | 100 | | | 100 | |
Cost of revenue (excluding depreciation and amortization shown separately below): | | | | | | | | | |
Subscription | | 39 | | | 40 | | | 42 | |
License | | 2 | | | 3 | | | 3 | |
Professional services | | 3 | | | 3 | | | 3 | |
| | | | | | | | | |
Total cost of revenue | | 44 | | | 46 | | | 48 | |
| | | | | | | | | |
Gross profit | | 56 | | | 54 | | | 52 | |
Operating expenses: | | | | | | | | | |
Sales and marketing | | 24 | | | 26 | | | 29 | |
Research and development | | 4 | | | 5 | | | 5 | |
General and administrative | | 19 | | | 18 | | | 13 | |
Depreciation and amortization | | 3 | | | 5 | | | 2 | |
| | | | | | | | | |
Total operating expenses | | 50 | | | 54 | | | 49 | |
| | | | | | | | | |
Income from operations | | 6 | | | — | | | 3 | |
Interest, net | | 5 | | | 1 | | | — | |
| | | | | | | | | |
Income before extraordinary item and income taxes | | 11 | | | 1 | | | 3 | |
Extraordinary item | | — | | | — | | | 1 | |
| | | | | | | | | |
Income before income taxes | | 11 | | | 1 | | | 4 | |
Income tax benefit | | 6 | | | — | | | — | |
| | | | | | | | | |
Net income | | 17 | % | | 1 | % | | 4 | % |
| | | | | | | | | |
The following table sets forth, for each component of revenue, the cost of the revenue expressed as a percentage of the related revenue for each of the periods indicated:
| | | | | | | | | |
| | | Year Ended December 31, | |
| | | 2006 | | | 2005 | | | 2004 | |
Cost of subscription revenue | | 44 | % | | 46 | % | | 51 | % |
Cost of license revenue | | 27 | | | 26 | | | 21 | |
Cost of professional services revenue | | 85 | | | 81 | | | 110 | |
Comparison of Years Ended December 31, 2006 and 2005
Total revenue increased 38% to $52.0 million in the year ended December 31, 2006 from $37.8 million in the year ended December 31, 2005.
Subscription Revenue. Subscription revenue increased 44% to $46.8 million in the year ended December 31, 2006 from $32.6 million in the year ended December 31, 2005. The majority of the increase of subscription revenue over the prior year was due to an increase in customer base, an increase in average revenue per customer resulting from price changes and increases in revenue due to our most recent acquisitions. Subscription revenue increased approximately $9.5 million due to an increase in our customer base from approximately 51,000 as of
36
December 31, 2005 to approximately 74,000 as of December 31, 2006, of which approximately 14,000 subscribers can be attributed to our most recent acquisitions. The remaining increase in our total subscriber base can be primarily attributed to an increase in outbound telesales staff to 183 as of December 31, 2006 from 163 as of December 31, 2005. The increase in our average revenue per customer over the prior year resulted in additional revenues of approximately $3.2 million. In addition, the increase in subscription revenue includes a full year of revenue attributable to our Leads.com product offering during 2006 as compared to approximately nine-months of related revenue during 2005, the year of the acquisition, which resulted in approximately $1.5 million of additional revenue.
The consolidated average monthly turnover decreased to 5.4% in the year ended December 31, 2006 from 6.0% in the year ended December 31, 2005, which also had a positive impact on our total subscriber base and our net subscriber additions. We believe that this improvement in monthly turnover was the result of better customer service and the increased effectiveness and breadth of our services. Monthly turnover, excluding acquisitions, would have been 5.8% in the year ended December 31, 2006.
License Revenue. License revenue decreased 7% to $3.6 million in the year ended December 31, 2006 from $3.9 million in the year ended December 31, 2005. This decrease was primarily attributable to the later release of our NetObjects Fusion version 10.0 compared to the timing of the release of version 9.0 in the prior year.
Professional Services Revenue. Professional services revenue increased 25% to $1.7 million in the year ended December 31, 2006 from $1.3 million in the year ended December 31, 2005. This increase was due to the revenue growth of our custom Website development programs that increased professional services revenue approximately $177 thousand in the year ended December 31, 2006. In addition, professional services revenue increased approximately $152 thousand due to the outsourced call center services acquired through our recent acquisitions made during the year.
Cost of Revenue
Cost of Subscription Revenue. Cost of subscription revenue increased 36% to $20.5 million in the year ended December 31, 2006 from $15.1 million in the year ended December 31, 2005. The increase in the cost of subscription revenue of approximately $5.4 million was primarily the result of the costs associated with the increase in our subscriber base during the year ended December 31, 2006. More specifically, during the year ended December 31, 2006, we incurred additional costs of approximately $3.7 million related to the additional subscription revenue from our acquisitions in April 2005 and September 2006. In addition, due to our increased headcount of 205 as of December 31, 2006 from 142 as of December 31, 2005 (with 43 of such personnel related to acquisitions during 2006), our employee compensation expenses increased approximately $794 thousand. Lastly, gross margin increased on subscription revenue to 56% for the year ended December 31, 2006 from 55% for the year ended December 31, 2005, as we continue to leverage our Website development and customer support costs over a growing base of subscribers.
Cost of License Revenue.Cost of license revenue decreased 5% to $958 thousand in the year ended December 31, 2006 from $1.0 million in the year ended December 31, 2005. The decrease in the cost of license revenue for the year ended December 31, 2006 was due primarily to the decrease in license revenue in the year ended December 31, 2006 compared to the year ended December 31, 2005.
Cost of Professional Services Revenue. Cost of professional services revenue increased 31% to $1.4 million in the year ended December 31, 2006 from $1.1 million in the year ended December 31, 2005. An increase in the cost of professional services of approximately $120 thousand was due to increased payroll and subcontractor expenses. In addition, the costs associated with the increase of the outsourced call center services acquired through our recent acquisitions were $142 thousand. The gross margin on professional service revenue decreased to 15% for the year ended December 31, 2006 as compared to 19% for the year ended December 31, 2005. This was caused by an increase in consulting and payroll related costs associated with the development of new products to be sold in future periods. The lower margin associated with the outsourced call center services acquired through our acquisitions also contributed to the decrease in gross margin.
37
Operating Expenses
Sales and Marketing Expenses. Sales and marketing expenses increased 29% to $12.5 million, or 24% of total revenue, during the year ended December 31, 2006 from $9.7 million, or 26% of total revenue, during the year ended December 31, 2005. An increase of sales and marketing expenses of $1.2 million was due to increased employee compensation and benefits expense related to the increase in headcount to 332 as of December 31, 2006 from 203 as of December 31, 2005 (with 37 of such personnel related to acquisitions during 2006). In addition, increases of $1.4 million in sales and marketing expense were attributable to the addition of sales and marketing resources in connection with our acquisitions.
Research and Development Expenses. Research and development expenses increased 19% to $2.3 million, or 4% of total revenue, during the year ended December 31, 2006 from $1.9 million, or 5% of total revenue, during the year ended December 31, 2005. The increase was primarily due to an increase of $351 thousand in additional research and development resources associated with our acquisitions.
General and Administrative Expenses. General and administrative expenses increased 41% to $9.7 million, or 19% of total revenue, during the year ended December 31, 2006 from $6.8 million, or 18% of total revenue, during the year ended December 31, 2005. An increase in general and administrative expenses of $500 thousand was due to employee compensation and benefits related to the increase in headcount to 47 at December 31, 2006 from 30 at December 31, 2005 (with 11 of such personnel related to acquisitions during 2006). In addition, there was an additional $942 thousand related to stock compensation expense in the year ended 2006 than in the prior year due to the increase in the average price per share. Due to our recent acquisitions, there was an increase of approximately $900 thousand of additional general and administrative expenses over the prior year. In addition, general and administrative expenses have increased by approximately $300 thousand due to the additional expenses and fees associated with the reporting and other obligations of being a public company.
Depreciation and Amortization Expense. Depreciation and amortization expense remained unchanged at $1.7 million, or 3% of total revenue, during the year ended December 31, 2006 from $1.7 million, or 5% of total revenue, during the year ended December 31, 2005. Amortization expense decreased to $900 thousand during the year ended December 31, 2006 from $1.2 million for the prior year due to the customer relationship intangible asset from an acquisition in 2005 being completely amortized at the beginning of the fiscal year. Depreciation expense increased to $812 thousand during the year ended December 31, 2006 from $567 thousand for the prior year due to the increase in fixed assets purchased and acquired in the acquisitions in 2006.
Net Interest Income.Net interest income increased 497% to $2.4 million, or 5% of total revenue, during the year ended December 31, 2006 from $402 thousand, or 1% of total revenue, during the year ended December 31, 2005. The increase in interest income was due to the investing of proceeds from our public offerings in money market funds during the year ended December 31, 2006.
Income tax benefit.During the year ended December 31, 2006, the Company reevaluated the need for a full valuation allowance on its deferred tax assets as a result of cumulative profits generated in the most recent three-year period as well as other positive evidence. As a result of this evaluation, the Company recognized a net tax benefit of $3.2 million. There was no release of the deferred tax asset valuation allowance during the year ended December 31, 2005.
Comparison of Years Ended December 31, 2005 and 2004
Total revenue increased 61% to $37.8 million in the year ended December 31, 2005 from $23.4 million in the year ended December 31, 2004.
Subscription Revenue. Subscription revenue increased 68% to $32.6 million in the year ended December 31, 2005 from $19.4 million in the year ended December 31, 2004. Approximately $3.2 million of subscription
38
revenue growth was driven by an expansion of our subscription package to include additional Web services and related price increases to our subscription customers. Approximately $5.4 million of the increase in subscription revenue was attributable to our 2005 acquisitions. Approximately $4.6 million of the increase in subscription revenue was due to an increase of approximately 24% in the total number of subscribers to our eWorks! XL and premium subscription-based services from approximately 41,000 as of December 31, 2004 to over 51,000 as of December 31, 2005. Our net subscriber additions increased 24% from 8,028 for the year ended December 31, 2004 to 9,970 for the year ended December 31, 2005. The increase in our total subscriber base and our net subscriber additions can be primarily attributed to an increase in our Spokane outbound telesales staff from 123 to 135 as of December 31, 2004 and 2005, respectively. The subscribers and net subscriber addition numbers described above exclude customers of services from our 2005 acquisitions that do not also subscribe to our eWorks! XL or other premium subscription-based services.
The average monthly turnover for the last four quarters decreased to 6.0% in the year ended December 31, 2005 from 6.4% in the year ended December 31, 2004, which also had a positive impact on our total subscriber base and our net subscriber additions. We believe that this improvement in monthly turnover was the result of better customer service and the increased effectiveness and breadth of our services. Monthly turnover excluded customer turnover from our 2005 acquisitions.
License Revenue. License revenue increased 13% to approximately $3.9 million in the year ended December 31, 2005 from approximately $3.4 million in the year ended December 31, 2004. The year ended December 31, 2005 included a significant increase in revenue as compared to other periods associated with the release of our NetObjects Fusion version 9.0.
Professional Services Revenue. Professional services revenue increased 138% to $1.3 million in the year ended December 31, 2005 from $562 thousand in the year ended December 31, 2004. This increase was partially due to the implementation of a custom Website development program with additional third parties that generated $175 thousand and self-generated leads that generated $137 thousand in additional professional services revenue in the year ended December 31, 2005. Additionally, the remaining increase was due to revenue growth of $426 thousand in the year ended December 31, 2005 from existing strategic marketing relationships.
Cost of Revenue
Cost of Subscription Revenue. Cost of subscription revenue increased 52% to $15.1 million in the year ended December 31, 2005 from $9.9 million in the year ended December 31, 2004. The increase in costs was primarily the result of the growth in the number of paying subscribers to our eWorks! XL and premium subscription-based services from the year ended December 31, 2004 compared to the year ended December 31, 2005. This subscriber growth resulted in an increase of $1.5 million in the absolute amount of marketing fees that we pay to companies with which we have strategic marketing relationships. Additionally, the growth in our subscriber base resulted in increased compensation and subcontractor expenses of $459 thousand associated with our Website development and customer support staff, an increase of $143 thousand related to call lists and online advertising and an increase of $168 thousand in billing costs. In addition, during the year ended December 31, 2005, cost of subscription revenue increased by $2.9 million related to subscription revenue generated from our 2005 acquisitions. Although our cost of subscription revenue increased from 2004 to 2005, the gross margin on subscription revenue increased from 49% during the year ended December 31, 2004 to 55% during the year ended December 31, 2005, as we continue to leverage our Website development and customer support costs over a growing base of subscribers.
Cost of License Revenue.Cost of license revenue increased 41% to $1.0 million in the year ended December 31, 2005 from $719 thousand in the year ended December 31, 2004. The increase was due to an increase of $101 thousand in manufacturing costs and $120 thousand in marketing services. Gross margin decreased from 79% in the year ended December 31, 2004 to 74% in the year ended December 31, 2005 due to fewer software downloads during 2005 and sales incentives offered during the year ended December 31, 2005.
39
Cost of Professional Services Revenue. Cost of professional services revenue increased 75% to $1.1 million in the year ended December 31, 2005 from $620 thousand in the year ended December 31, 2004. The increase resulted from the addition of personnel to our professional services staff during 2005 to improve our capabilities and drive revenue growth in this area. Compensation related expenses and independent contractor costs increased approximately $433 thousand in the year ended December 31, 2005 from the year ended December 31, 2004. Marketing fees paid to companies with which we have strategic marketing relationships also increased approximately $14 thousand and shipping and handling increased $12 thousand during the year ended December 31, 2005 from the year ended December 31, 2004. Although our costs of professional services revenue increased from 2004 to 2005, the gross margin on professional services revenue increased from a negative 11% during the year December 31, 2004 to a positive 19% during the year ended December 31, 2005. The gross margin improvement is driven by increased revenue on a relatively fixed cost structure.
Operating Expenses
Sales and Marketing Expenses. Sales and marketing expenses increased 42% to $9.7 million, or 26% of total revenue, during the year ended December 31, 2005 from $6.8 million, or 29% of total revenue, during the year ended December 31, 2004. The increase was primarily due to an increase of $1.3 million in employee compensation and subcontractor costs, $110 thousand in recruiting and employee relations costs, and $55 thousand in insurance costs and facility rent expense. In addition, increases of $1.2 million in sales and marketing expense were attributable to the addition of sales and marketing resources in connection with our 2005 acquisitions. We increased our number of sales and marketing personnel by 31% from the year ended December 31, 2004 to the year ended December 31, 2005 so that we could focus on adding new customers, increasing penetration within our existing customer base, and improving customer retention. Additional sales and marketing personnel associated with our 2005 acquisitions represented approximately 60% of the personnel increase.
Research and Development Expenses. Research and development expenses increased 65% to $1.9 million, or 5% of total revenue, during the year ended December 31, 2005 from $1.2 million, or 5% of total revenue, during the year ended December 31, 2004. The increase was primarily due to an increase of $320 thousand in employee compensation expense and $196 thousand in outsourced labor expense. We increased our outsourced development resources from 2004 to 2005 so that we could upgrade and extend our Web service offerings. An increase of $225 thousand was due to additional research and development resources associated with our 2005 acquisitions.
General and Administrative Expenses. General and administrative expenses increased 120% to $6.8 million, or 18% of total revenue, during the year ended December 31, 2005 from $3.1 million, or 13% of total revenue, during the year ended December 31, 2004. Employee compensation costs and professional and outside service costs increased $1.6 million and $453 thousand, respectively. Telephone, bad debt, public relations, franchise tax and currency exchange losses increased $91 thousand, $21 thousand, $57 thousand, $40 thousand and $107 thousand, respectively. Finally, additional resource and facility costs associated with our 2005 acquisitions resulted in an increase of $1.2 million during the year ended December 31, 2005. Our general and administrative headcount increased 131% from December 31, 2004 to December 31, 2005, as we added personnel to support our growth and to prepare our company to meet the additional requirements of being a public company in connection with our recent public offering. Additional general and administrative personnel associated with our recent acquisitions accounted for 82% of the personnel increase.
Depreciation and Amortization Expense. Depreciation and amortization expense increased 331% to $1.7 million or 5% of total revenue, during the year ended December 31, 2005 from $400 thousand, or 2% of total revenue, during the year ended December 31, 2004. The increase was mainly due to additional depreciation and amortization expense of $1.3 million during 2005 related to the 2005 acquisitions.
Net Interest Income.Net interest income increased 581% to $402 thousand or 1% of total revenue, during the year ended December 31, 2005 from $59 thousand, or 0.2% of total revenue, during the year ended December 31, 2004. The increase was due to the net proceeds of our initial public offering, $41.6 million, of which was invested in money market funds during the year ended December 31, 2005.
40
Liquidity and Capital Resources
As of December 31, 2006, we had $42.2 million of cash and cash equivalents and $39.5 million in working capital, as compared to $55.7 million of cash and cash equivalents and $51.5 million in working capital as of December 31, 2005.
Net cash provided by operations for the year ended December 31, 2006 increased 66%, or $2.6 million, to $6.5 million from $3.9 million for the year ended December 31, 2005. This increase was principally due to improved operating performance reflected in a 38% increase in revenue and a resulting $4.6 million net income before extraordinary items and income taxes, while non-cash stock compensation expense increased $1.2 million. This increase in cash was partially offset by a decrease in accounts payable and accrued expenses and an increase in accounts receivable.
Net cash used in investing activities in the year ended December 31, 2006 was $22.0 million as compared to $46 thousand in the year ended December 31, 2005. On September 30, 2006, we made cash payments to acquire substantially all of the assets and select liabilities of 1ShoppingCart.com and Renex totaling approximately $20.5 million, including acquisition expenses. Other investing activities in 2006 consisted of the purchase of fixed assets for approximately $1.5 million.
Net cash provided by financing activities in the year ended December 31, 2006 was $1.9 million as compared to $45.3 million for the year ended December 31, 2005. On August 2, 2006, we completed a secondary offering whereby certain stockholders sold 3,339,126 common shares and we sold 200,000 common shares for net proceeds to us of approximately $1.0 million. During 2006, employees exercised stock options generating $940 thousand in proceeds and we paid debt of $49 thousand. Net cash provided by financing activities during the year ended 2005 included $3.0 million from the issuance of convertible redeemable preferred stock and $44.6 million from the initial public offering, net of underwriting discounts. In addition, in 2005, we also incurred $2.4 million of additional costs related to the initial public offering.
Contractual Obligations and Commitments
Our principal commitments consist of obligations under leases for office space (operating and capital) and a note payable for purchase of the LEADS.com domain name. The following summarizes our long-term contractual obligations as of December 31, 2006:
| | | | | | | | | | | | | | | | | | | | | |
| | | | | Payment Due by Period |
Contractual Obligations | | Total | | 2007 | | 2008 | | 2009 | | 2010 | | 2011 | | thereafter |
| | | | | (in thousands) |
| Operating lease obligations | | $ | 3,232 | | $ | 1,063 | | $ | 548 | | $ | 333 | | $ | 306 | | $ | 312 | | $ | 670 |
| Capital lease obligations | | $ | 92 | | $ | 59 | | $ | 29 | | $ | 4 | | $ | — | | $ | — | | $ | — |
| Note payable | | $ | 280 | | $ | 110 | | $ | 110 | | $ | 60 | | $ | — | | $ | — | | $ | — |
Summary
Our future capital uses and requirements depend on numerous forward-looking factors. These factors include but are not limited to the following:
| | • | | the costs involved in the expansion of our customer base; |
| | • | | the costs involved with investment in our servers, storage and network capacity; |
| | • | | the costs associated with the expansion of our domestic and international activities; |
| | • | | the costs involved with our research and development activities to upgrade and expand our service offerings; and |
| | • | | the extent to which we acquire or invest in other technologies and businesses. |
41
We believe that our existing cash and cash equivalents will be sufficient to meet our projected operating requirements for at least the next 12 months, including our sales and marketing expenses, research and development expenses, capital expenditures, and any acquisitions or investments in complementary businesses, services, products or technologies. As of December 31, 2006 and 2005, we did not have any relationships with unconsolidated entities or financial partnerships, such as entities often referred to as structured finance or special purpose entities, which would have been established for the purpose of facilitating off-balance sheet arrangements or other contractually narrow or limited purposes.
Item 7A. Quantitative and Qualitative Disclosures About Market Risk.
Foreign Currency Exchange Risk
Our results of operations and cash flows are subject to fluctuations due to changes in foreign currency exchange rates, particularly changes in the Euro and the Canadian Dollar. We will analyze our exposure to currency fluctuations and may engage in financial hedging techniques in the future to reduce the effect of these potential fluctuations. We have not entered into any hedging contracts since exchange rate fluctuations have had little impact on our operating results and cash flows. The majority of our subscription agreements are denominated in U.S. dollars. To date, our foreign sales have been primarily in Euros. Sales to customers domiciled outside the United States were approximately 6% of our total revenue in each of the years ended December 31, 2006 and 2005. Sales in Germany represented approximately 61% and 64% of our international revenue in the years ended December 31, 2006 and 2005, respectively.
Interest Rate Sensitivity
We had unrestricted cash and cash equivalents totaling $42.2 million and $55.7 million at December 31, 2006 and 2005, respectively. These amounts were invested primarily in money market funds. The unrestricted cash, cash equivalents and short-term marketable securities are held for working capital purposes. We do not enter into investments for trading or speculative purposes. Due to the short-term nature of these investments, we believe that we do not have any material exposure to changes in the fair value of our investment portfolio as a result of changes in interest rates. Declines in interest rates, however, will reduce future investment income.
42
Item 8. Financial Statements and Supplementary Data.
Quarterly Results of Operations
The following tables set forth selected unaudited quarterly consolidated statement of operations data for the eight most recent quarters. The information for each of these quarters has been prepared on the same basis as the audited consolidated financial statements included in this prospectus and, in the opinion of management, includes all adjustments necessary for the fair presentation of the results of operations for such periods. This data should be read in conjunction with the audited consolidated financial statements and the related notes included in this prospectus. These quarterly operating results are not necessarily indicative of our operating results for any future period.
| | | | | | | | | | | | | | | | | | | | | | | | | | | | |
| | | Three Months Ended |
| | | Mar 31,
2006 | | Jun 30,
2006 | | Sept 30,
2006 | | Dec 31,
2006 | | | Mar 31,
2005 | | | Jun 30,
2005 | | | Sept 30,
2005 | | | Dec 31,
2005 |
| | | (in thousands) |
Total revenue | | $ | 11,613 | | $ | 12,037 | | $ | 12,039 | | $ | 16,352 | | | $ | 7,318 | | | $ | 9,127 | | | $ | 10,103 | | | $ | 11,222 |
Total cost of revenue | | | 5,089 | | | 5,190 | | | 5,382 | | | 7,252 | | | | 3,336 | | | | 4,256 | | | | 4,654 | | | | 4,910 |
| | | | | | | | | | | | | | | | | | | | | | | | | | | | |
Gross profit | | | 6,524 | | | 6,847 | | | 6,657 | | | 9,100 | | | | 3,982 | | | | 4,871 | | | | 5,449 | | | | 6,312 |
Total operating expenses | | | 6,054 | | | 6,116 | | | 5,984 | | | 7,977 | | | | 3,732 | | | | 5,019 | | | | 5,465 | | | | 5,973 |
| | | | | | | | | | | | | | | | | | | | | | | | | | | | |
Income (loss) from operations | | | 470 | | | 731 | | | 673 | | | 1,123 | | | | 250 | | | | (148 | ) | | | (16 | ) | | | 339 |
| | | | | | | | | | | | | | | | | | | | | | | | | | | | |
Net income (loss) | | | 1,021 | | | 1,357 | | | 1,383 | | | 4,836 | (1) | | | 276 | | | | (112 | ) | | | 20 | | | | 643 |
| | | | | | | | | | | | | | | | | | | | | | | | | | | | |
Net income (loss) attributable to common stockholders | | $ | 1,021 | | $ | 1,357 | | $ | 1,383 | | $ | 4,836 | (1) | | $ | (64 | ) | | $ | (452 | ) | | $ | (319 | ) | | $ | 506 |
| | | | | | | | | | | | | | | | | | | | | | | | | | | | |
Net income (loss) attributable per common share: | | | | | | | | | | | | | | | | | | | | | | | | | | | | |
Basic | | $ | .06 | | $ | .08 | | $ | .08 | | $ | .28 | (1) | | $ | (0.02 | ) | | $ | (0.10 | ) | | $ | (0.06 | ) | | $ | 0.04 |
Diluted | | | .05 | | | .07 | | | .07 | | | .25 | (1) | | | (0.02 | ) | | | (0.10 | ) | | | (0.06 | ) | | | 0.03 |
| (1) | Included in the net income for the three months ended December 31, 2006 is a tax benefit of $3.2 million, which was the result of a reduction in the deferred tax asset reserve allowance. |
Item 9. Changes in and Disagreements With Accountants on Accounting and Financial Disclosure.
None.
Item 9A. Controls and Procedures.
Evaluation of disclosure controls and procedures.
Based on their evaluation as of December 31, 2006, our Chief Executive Officer and Chief Financial Officer, have concluded that our disclosure controls and procedures (as defined in Rules 13a-15(e) and 15d-15(e) under the Securities Exchange Act of 1934, as amended) were sufficiently effective to ensure that the information required to be disclosed by us in this Form 10-K was recorded, processed, summarized and reported within the time periods specified in the Securities and Exchange Commission’s rules and forms.
Management’s Report on Internal Control over Financial Reporting.
The management of Website Pros, Inc. is responsible for establishing and maintaining adequate internal control over financial reporting as such term is defined in Rules 13a-15(f) and 15d-15(f) under the Securities Exchange Act of 1934, as amended. The Company’s internal control over financial reporting is designed to provide reasonable assurance, based on an appropriate cost-benefit analysis, regarding the reliability of our financial reporting and the preparation of financial statements for external purposes in accordance with U.S. generally accepted accounting principles. The Company’s internal control over financial reporting includes those policies and procedures that: (i) pertain to the maintenance of records that, in reasonable detail, accurately and fairly
43
reflect the transactions and dispositions of the assets of the Company; (ii) provide reasonable assurance that transactions are recorded as necessary to permit preparation of financial statements in accordance with U.S. generally accepted accounting principles, and that receipts and expenditures of the Company are being made only in accordance with authorizations of management and directors of the Company; and (iii) provide reasonable assurance regarding prevention or timely detection of unauthorized acquisition, use or disposition of the Company’s assets that could have a material effect on the financial statements.
Because of its inherent limitations, internal control over financial reporting may not prevent or detect misstatements. Therefore, even those systems determined to be effective can provide only reasonable assurance with respect to financial statement preparation and presentation. Also, projections of any evaluation of effectiveness to future periods are subject to risk that controls may become inadequate because of changes in conditions, or that the degree of compliance with the policies or procedures may deteriorate.
Management assessed the effectiveness of the Company’s internal control over financial reporting as of December 31, 2006. In making this assessment, management used the criteria set forth by the Committee of Sponsoring Organizations of the Treadway Commission (COSO) inInternal Control-Integrated Framework. Based on management’s assessment and those criteria, management concluded that the Company maintained effective internal control over financial reporting as of December 31, 2006.
Management excluded from its assessment of the effectiveness of the Company’s internal control over financial reporting the internal controls of 1ShoppingCart.com Canada Corp. and 1ShoppingCart.com Corp. (together, “1ShoppingCart.com”) and Renex, Inc. (“Renex”) acquired by the Company during fiscal 2006, which are included in the 2006 consolidated financial statements of the Company and constituted $25.9 million and $23.6 million of total assets and net assets, respectively, as of December 31, 2006. 1ShoppingCart.com and Renex’s revenue and net income was $3.5 million and $604 thousand, respectively, for the year ended December 31, 2006. Collectively, 1ShoppingCart.com and Renex’s total assets and net assets as of December 31, 2006 were 28% of the Company’s total assets and net assets. Collectively, 1ShoppingCart.com and Renex’s revenue and net income for the year ended December 31, 2006 were 7% of the Company’s total revenue and net income. Management will include the internal controls of 1ShoppingCart.com and Renex in its assessment of the effectiveness of the Company’s internal control over financial reporting for fiscal year 2007.
The Company’s independent registered public accounting firm, Ernst & Young LLP, has issued an audit report on management’s assessment and the effectiveness of the Company’s internal control over financial reporting.
Report of Independent Registered Public Accounting Firm on Internal Control over Financial Reporting
The Board of Directors and Shareholders of Website Pros, Inc.
We have audited management’s assessment, included in the accompanying Management’s Report on Internal Control Over Financial Reporting, that Website Pros, Inc. maintained effective internal control over financial reporting as of December 31, 2006 based on criteria established in Internal Control—Integrated Framework issued by the Committee of Sponsoring Organizations of the Treadway Commission (the COSO criteria). Website Pros Inc.’s management is responsible for maintaining effective internal control over financial reporting and for its assessment of the effectiveness of internal control over financial reporting. Our responsibility is to express an opinion on management’s assessment and an opinion on the effectiveness of the company’s internal control over financial reporting based on our audit.
We conducted our audit in accordance with the standards of the Public Company Accounting Oversight Board (United States). Those standards require that we plan and perform the audit to obtain reasonable assurance about whether effective internal control over financial reporting was maintained in all material respects. Our audit included obtaining an understanding of internal control over financial reporting, evaluating management’s assessment, testing and evaluating the design and operating effectiveness of internal control, and performing such other procedures as we considered necessary in the circumstances. We believe that our audit provides a reasonable basis for our opinion.
44
A company’s internal control over financial reporting is a process designed to provide reasonable assurance regarding the reliability of financial reporting and the preparation of financial statements for external purposes in accordance with U.S. generally accepted accounting principles. A company’s internal control over financial reporting includes those policies and procedures that (1) pertain to the maintenance of records that, in reasonable detail, accurately and fairly reflect the transactions and dispositions of the assets of the company; (2) provide reasonable assurance that transactions are recorded as necessary to permit preparation of financial statements in accordance with U.S. generally accepted accounting principles, and that receipts and expenditures of the company are being made only in accordance with authorizations of management and directors of the company; and (3) provide reasonable assurance regarding prevention or timely detection of unauthorized acquisition, use, or disposition of the company’s assets that could have a material effect on the financial statements.
Because of its inherent limitations, internal control over financial reporting may not prevent or detect misstatements. Also, projections of any evaluation of effectiveness to future periods are subject to the risk that controls may become inadequate because of changes in conditions, or that the degree of compliance with the policies or procedures may deteriorate.
As indicated in the accompanying Management’s Report on Internal Control Over Financial Reporting, management’s assessment of and conclusion on the effectiveness of internal control over financial reporting did not include the internal controls of 1ShoppingCart.com Canada Corp and 1ShoppingCart.com Corp. (together, “1ShoppingCart.com”) or Renex, Inc., which are included in the 2006 consolidated financial statements of Website Pros, Inc. and constituted $25.9 million and $23.6 million of total and net assets, respectively, as of December 31, 2006 and $3.5 million and $604 thousand of revenues and net income, respectively, for the year then ended. Our audit of internal control over financial reporting of Website Pros, Inc. also did not include an evaluation of the internal control over financial reporting of 1ShoppingCart.com or Renex, Inc.
In our opinion, management’s assessment that Website Pros, Inc. maintained effective internal control over financial reporting as of December 31, 2006 is fairly stated, in all material respects, based on the COSO criteria. Also, in our opinion, Website Pros, Inc. maintained, in all material respects, effective internal control over financial reporting as of December 31. 2006, based on the COSO criteria.
We have also audited, in accordance with the standards of the Public Company Accounting Oversight Board (United States), the 2006 consolidated financial statements of Website Pros, Inc. and our report dated March 7, 2007 expressed an unqualified opinion thereon.
| | |
| | /s/ Ernst & Young LLP |
| |
Jacksonville, FL March 7, 2007 | | |
Changes in internal control over financial reporting.
There were no changes in our internal controls over financial reporting (as defined in Rules 13a-15(f) and 15d-15(f)) during the year ended December 31, 2006 that have materially affected, or are reasonably likely to materially affect, our internal controls over financial reporting.
Item 9B. Other Information.
None.
45
PART III
Item 10. Directors, Executive Officers and Corporate Governance.
The information required by this item, including such information regarding our directors and executive officers and compliance with Section 16(a) of the Securities Exchange act of 1934, is incorporated herein by reference from the Proxy Statement. We have adopted a written code of ethics that applies to our principal executive officer, principal financial officer and principal accounting officer, or persons performing similar functions. The code of ethics is posted on our Website at http://ir.websitepros.com/sec.cfm. Amendments to, and waivers from, the code of ethics that applies to any of these officers, or persons performing similar functions, and that relates to any element of the code of ethics definition enumerated in Item 406(b) of Regulation S-K, will be disclosed at the Website address provided above and, to the extent required by applicable regulations, on a current report on Form 8-K.
Item 11. Executive Compensation.
The information required by this item is incorporated herein by reference from the section entitled “Executive Compensation” in the Proxy Statement.
Item 12. Security Ownership of Certain Beneficial Owners and Management and Related Stockholder Matters.
The information required by this item is incorporated herein by reference from the sections entitled “Security Ownership of Certain Beneficial Owners and Management” and “Equity Compensation Plan Information” in the Proxy Statement.
Item 13. Certain Relationships and Related Transactions, and Director Independence.
The information required by this item is incorporated herein by reference from the section entitled “Certain Relationships and RelatedTransactions” in the Proxy Statement.
Item 14. Principal Accounting Fees and Services.
The information required by this item is incorporated herein by reference from the section entitled “Proposal 2—Ratification of Selection of Independent Registered Public Accounting Firm” in the Proxy Statement.
46
PART IV
Item 15. Exhibits, Financial Statement Schedules.
The following documents are filed as part of this Form 10-K:
1. Financial Statements
INDEX TO FINANCIAL STATEMENTS
47
Report of Independent Registered Public Accounting Firm
Board of Directors and Shareholders
Website Pros, Inc.
We have audited the accompanying consolidated balance sheets of Website Pros, Inc. as of December 31, 2006 and 2005, and the related consolidated statements of operations, stockholders’ equity (deficit) and convertible redeemable preferred stock, and cash flows for each of the three years in the period ended December 31, 2006. These financial statements are the responsibility of the Company’s management. Our responsibility is to express an opinion on these financial statements based on our audits.
We conducted our audits in accordance with the standards of the Public Company Accounting Oversight Board (United States). Those standards require that we plan and perform the audit to obtain reasonable assurance about whether the financial statements are free of material misstatement. An audit includes examining, on a test basis, evidence supporting the amounts and disclosures in the financial statements. An audit also includes assessing the accounting principles used and significant estimates made by management, and evaluating the overall financial statement presentation. We believe that our audits provide a reasonable basis for our opinion.
In our opinion, the consolidated financial statements referred to above present fairly, in all material respects, the consolidated financial position of Website Pros, Inc. at December 31, 2006 and 2005 and the consolidated results of its operations and its cash flows for each of the three years in the period ended December 31, 2006, in conformity with U.S. generally accepted accounting principles.
We have also audited, in accordance with the Standards of the Public Company Accounting Oversight Board (United States), the effectiveness of Website Pros, Inc.’s internal control over financial reporting as of December 31, 2006, based on criteria established in Internal Control—Integrated Framework issued by the Committee of Sponsoring Organizations of the Treadway Commission and our report dated March 7, 2007 expressed an unqualified opinion thereon.
| | |
| | /s/ Ernst & Young LLP |
| |
Jacksonville, Florida March 7, 2007 | | |
48
Website Pros, Inc.
Consolidated Balance Sheets
(In thousands)
| | | | | | | | |
| | | December 31, | |
| | | 2006 | | | 2005 | |
Assets | | | | | | | | |
Current assets: | | | | | | | | |
Cash and cash equivalents | | $ | 42,155 | | | $ | 55,746 | |
Accounts receivable, net of allowance of $280 and $383, respectively | | | 4,202 | | | | 1,941 | |
Inventories, net of reserves of $48 and $51, respectively | | | 69 | | | | 138 | |
Prepaid expenses | | | 616 | | | | 506 | |
Prepaid marketing fees and other current assets | | | 986 | | | | 770 | |
Deferred taxes | | | 531 | | | | — | |
| | | | | | | | |
Total current assets | | | 48,559 | | | | 59,101 | |
Property and equipment, net | | | 2,337 | | | | 1,068 | |
Goodwill and other intangible assets, net | | | 39,177 | | | | 16,105 | |
Deferred taxes | | | 2,669 | | | | — | |
Other assets | | | 618 | | | | 96 | |
| | | | | | | | |
Total assets | | $ | 93,360 | | | $ | 76,370 | |
| | | | | | | | |
| | |
Liabilities and stockholders’ equity | | | | | | | | |
Current liabilities: | | | | | | | | |
Accounts payable | | $ | 920 | | | $ | 1,280 | |
Accrued expenses | | | 3,028 | | | | 2,391 | |
Deferred revenue | | | 4,594 | | | | 3,193 | |
Accrued marketing fees | | | 234 | | | | 297 | |
Notes payable, current | | | 95 | | | | 65 | |
Obligations under capital leases, current | | | 52 | | | | — | |
Other liabilities | | | 102 | | | | 340 | |
| | | | | | | | |
Total current liabilities | | | 9,025 | | | | 7,566 | |
Accrued rent expense | | | 158 | | | | 177 | |
Notes payable, long term | | | 162 | | | | 241 | |
Obligations under capital leases, long-term | | | 32 | | | | — | |
Other long-term liabilities | | | 27 | | | | 31 | |
| | | | | | | | |
Total liabilities | | | 9,404 | | | | 8,015 | |
| | |
Stockholders’ equity: | | | | | | | | |
Common stock, $0.001 par value; 150,000,000 shares authorized, 17,331,626 and 16,509,602 shares issued and outstanding at December 31, 2006 and 2005 | | | 17 | | | | 17 | |
Additional paid-in capital | | | 143,101 | | | | 136,097 | |
Accumulated deficit | | | (59,162 | ) | | | (67,759 | ) |
| | | | | | | | |
Total stockholders’ equity | | | 83,956 | | | | 68,355 | |
| | | | | | | | |
Total liabilities and stockholders’ equity | | $ | 93,360 | | | $ | 76,370 | |
| | | | | | | | |
See accompanying notes to consolidated financial statements.
49
Website Pros, Inc.
Consolidated Statements of Operations
(In thousands, except per share amounts)
| | | | | | | | | | | | |
| | | Year Ended December 31, | |
| | | 2006 | | | 2005 | | | 2004 | |
Revenue: | | | | | | | | | | | | |
Subscription | | $ | 46,789 | | | $ | 32,574 | | | $ | 19,415 | |
License | | | 3,585 | | | | 3,858 | | | | 3,425 | |
Professional services | | | 1,667 | | | | 1,338 | | | | 562 | |
| | | | | | | | | | | | |
Total revenue | | | 52,041 | | | | 37,770 | | | | 23,402 | |
Cost of revenue (excluding depreciation and amortization shown separately below): | | | | | | | | | | | | |
Subscription (a) | | | 20,534 | | | | 15,058 | | | | 9,901 | |
License | | | 958 | | | | 1,013 | | | | 719 | |
Professional services | | | 1,421 | | | | 1,085 | | | | 620 | |
| | | | | | | | | | | | |
Total cost of revenue | | | 22,913 | | | | 17,156 | | | | 11,240 | |
| | | | | | | | | | | | |
Gross profit | | | 29,128 | | | | 20,614 | | | | 12,162 | |
Operating expenses: | | | | | | | | | | | | |
Sales and marketing (a) | | | 12,511 | | | | 9,731 | | | | 6,846 | |
Research and development (a) | | | 2,256 | | | | 1,895 | | | | 1,150 | |
General and administrative (a) | | | 9,652 | | | | 6,840 | | | | 3,110 | |
Depreciation and amortization | | | 1,712 | | | | 1,723 | | | | 400 | |
| | | | | | | | | | | | |
Total operating expenses | | | 26,131 | | | | 20,189 | | | | 11,506 | |
| | | | | | | | | | | | |
Income from operations | | | 2,997 | | | | 425 | | | | 656 | |
Other income (expense): | | | | | | | | | | | | |
Interest income | | | 2,417 | | | | 423 | | | | 69 | |
Interest expense | | | (17 | ) | | | (21 | ) | | | (10 | ) |
| | | | | | | | | | | | |
Total other income | | | 2,400 | | | | 402 | | | | 59 | |
| | | | | | | | | | | | |
Income before extraordinary item and income tax | | | 5,397 | | | | 827 | | | | 715 | |
Extraordinary item | | | — | | | | — | | | | 209 | |
| | | | | | | | | | | | |
Income before income tax | | | 5,397 | | | | 827 | | | | 924 | |
Income tax benefit | | | 3,200 | | | | — | | | | — | |
| | | | | | | | | | | | |
Net income | | | 8,597 | | | | 827 | | | | 924 | |
Preferred stock dividends | | | — | | | | (1,156 | ) | | | (1,294 | ) |
| | | | | | | | | | | | |
Net income (loss) attributable to common stockholders | | $ | 8,597 | | | $ | (329 | ) | | $ | (370 | ) |
| | | | | | | | | | | | |
Basic net income (loss) attributable per common share | | $ | 0.51 | | | $ | (0.05 | ) | | $ | (0.12 | ) |
| | | | | | | | | | | | |
Diluted net income (loss) attributable per common share | | $ | 0.44 | | | $ | (0.05 | ) | | $ | (0.12 | ) |
| | | | | | | | | | | | |
Basic weighted average common shares outstanding | | | 16,778 | | | | 6,222 | | | | 3,002 | |
| | | | | | | | | | | | |
Diluted weighted average common shares outstanding | | | 19,430 | | | | 6,222 | | | | 3,002 | |
| | | | | | | | | | | | |
(a) Stock based compensation included above | | | | | | | | | | | | |
Subscription (cost of revenue) | | $ | 137 | | | $ | 55 | | | $ | 11 | |
| | | | | | | | | | | | |
Sales and marketing | | $ | 365 | | | $ | 127 | | | $ | 35 | |
Research and development | | | 222 | | | | 139 | | | | 15 | |
General and administrative | | | 1,309 | | | | 474 | | | | 34 | |
| | | | | | | | | | | | |
| | $ | 1,896 | | | $ | 740 | | | $ | 84 | |
| | | | | | | | | | | | |
See accompanying notes to consolidated financial statements.
50
Website Pros, Inc.
Consolidated Statements of Stockholders’ Equity (Deficit) and Convertible Redeemable Preferred Stock
(In thousands, except share amounts)
| | | | | | | | | | | | | | | | | | | | | | | | | | | | |
| | | Convertible Redeemable
Preferred Stock | | | | | Stockholders’ Equity (Deficit) | |
| | | Series A
Convertible
Preferred
Stock | | | Series B
Convertible
Preferred
Stock | | | | | Common Stock | | Treasury
Stock
Amount | | | Additional
Paid-In
Capital | | Accumulated
Deficit | | | Total
Stockholders’
Equity
(Deficit) | |
| | | | | | | Shares | | Amount | | | | |
Balance, December 31, 2003 | | 9,233 | | | — | | | | | 5,780,156 | | $ | 6 | | $ | (669 | ) | | $ | 65,995 | | $ | (68,485 | ) | | $ | (3,153 | ) |
Net income | | — | | | — | | | | | — | | | — | | | — | | | | — | | | 924 | | | | 924 | |
Exercise of stock options | | — | | | — | | | | | 137,851 | | | — | | | — | | | | 115 | | | — | | | | 115 | |
Issuance of preferred stock, net of cost | | 6,752 | | | — | | | | | — | | | — | | | — | | | | — | | | — | | | | — | |
Accretion of Series A issuance costs/redemption price | | 1,469 | | | — | | | | | — | | | — | | | — | | | | — | | | (1,469 | ) | | | (1,469 | ) |
Repurchase of stock | | — | | | — | | | | | — | | | — | | | (5,703 | ) | | | — | | | — | | | | (5,703 | ) |
Stock-based compensation expense | | — | | | — | | | | | — | | | — | | | — | | | | 95 | | | — | | | | 95 | |
| | | | | | | | | | | | | | | | | | | | | | | | | | | | |
Balance, December 31, 2004 | | 17,454 | | | — | | | | | 5,918,007 | | | 6 | | | (6,372 | ) | | | 66,205 | | | (69,030 | ) | | | (9,191 | ) |
Net income | | — | | | — | | | | | — | | | — | | | — | | | | — | | | 827 | | | | 827 | |
Exercise of stock options | | — | | | — | | | | | 67,200 | | | 1 | | | — | | | | 49 | | | — | | | | 50 | |
Issuance of preferred stock, net of issuance cost | | — | | | 2,989 | | | | | — | | | — | | | — | | | | — | | | — | | | | — | |
Accrued dividends | | (2,473 | ) | | — | | | | | — | | | — | | | — | | | | — | | | 2,473 | | | | 2,473 | |
Conversion of preferred stock | | (16,999 | ) | | (3,000 | ) | | | | 6,324,963 | | | 6 | | | — | | | | 19,993 | | | — | | | | 19,999 | |
Accretion of Series A issuance costs/redemption price | | 2,018 | | | — | | | | | — | | | — | | | — | | | | — | | | (2,018 | ) | | | (2,018 | ) |
Accretion of Series B issuance costs | | — | | | 11 | | | | | — | | | — | | | — | | | | — | | | (11 | ) | | | (11 | ) |
Issuance of common stock | | — | | | — | | | | | 1,673,390 | | | 2 | | | 6,372 | | | | 35,273 | | | — | | | | 41,647 | |
Stock-based compensation expense | | — | | | — | | | | | 20,000 | | | — | | | — | | | | 795 | | | — | | | | 795 | |
Options assumed from LEADS.com | | — | | | — | | | | | — | | | — | | | — | | | | 130 | | | — | | | | 130 | |
Issuance of common stock in purchase of LEADS.com | | — | | | — | | | | | 2,320,518 | | | 2 | | | — | | | | 12,598 | | | — | | | | 12,600 | |
Issuance of common stock in purchase of EBOZ | | — | | | — | | | | | 185,524 | | | — | | | — | | | | 1,054 | | | — | | | | 1,054 | |
| | | | | | | | | | | | | | | | | | | | | | | | | | | | |
Balance, December 31, 2005 | | — | | | — | | | | | 16,509,602 | | | 17 | | | — | | | | 136,097 | | | (67,759 | ) | | | 68,355 | |
Net income | | — | | | — | | | | | — | | | — | | | — | | | | — | | | 8,597 | | | | 8,597 | |
Exercise of stock options | | — | | | — | | | | | 550,004 | | | — | | | — | | | | 940 | | | — | | | | 940 | |
Exercise of warrants | | — | | | — | | | | | 72,020 | | | — | | | — | | | | — | | | — | | | | — | |
Issuance of common stock | | — | | | — | | | | | 200,000 | | | — | | | — | | | | 1,018 | | | — | | | | 1,018 | |
Stock-based compensation expense | | — | | | — | | | | | — | | | — | | | — | | | | 2,033 | | | — | | | | 2,033 | |
Issuance of common stock in purchase of Renex | | — | | | — | | | | | — | | | — | | | — | | | | 3,013 | | | — | | | | 3,013 | |
| | | | | | | | | | | | | | | | | | | | | | | | | | | | |
Balance, December 31, 2006 | | — | | | — | | | | | 17,331,626 | | $ | 17 | | $ | — | | | $ | 143,101 | | $ | (59,162 | ) | | $ | 83,956 | |
| | | | | | | | | | | | | | | | | | | | | | | | | | | | |
See accompanying notes to consolidated financial statements.
51
Website Pros, Inc.
Consolidated Statements of Cash Flows
(In thousands)
| | | | | | | | | | | | |
| | | Year Ended December 31, | |
| | | 2006 | | | 2005 | | | 2004 | |
Cash flows from operating activities | | | | | | | | | | | | |
Net income | | $ | 8,597 | | | $ | 827 | | | $ | 924 | |
Adjustments to reconcile net income to net cash provided by operating activities: | | | | | | | | | | | | |
Depreciation and amortization | | | 1,712 | | | | 1,723 | | | | 400 | |
Stock-based compensation expense | | | 2,033 | | | | 795 | | | | 95 | |
Deferred income tax benefit | | | (3,200 | ) | | | — | | | | — | |
Non-cash extraordinary gain | | | — | | | | — | | | | (209 | ) |
Changes in operating assets and liabilities: | | | | | | | | | | | | |
Accounts receivable, net | | | (1,833 | ) | | | 431 | | | | (843 | ) |
Inventories, net | | | 69 | | | | 40 | | | | (95 | ) |
Prepaid expenses and other assets | | | (120 | ) | | | (401 | ) | | | (34 | ) |
Accounts payable, accrued expenses and other liabilities | | | (673 | ) | | | 334 | | | | (269 | ) |
Deferred revenue | | | (115 | ) | | | 141 | | | | 215 | |
| | | | | | | | | | | | |
Net cash provided by operating activities | | | 6,470 | | | | 3,890 | | | | 184 | |
| | | |
Cash flows from investing activities | | | | | | | | | | | | |
Business acquisitions | | | (20,449 | ) | | | 382 | | | | — | |
Investment in intangible assets | | | — | | | | (3 | ) | | | (67 | ) |
Purchase of property and equipment | | | (1,521 | ) | | | (425 | ) | | | (523 | ) |
| | | | | | | | | | | | |
Net cash used in investing activities | | | (21,970 | ) | | | (46 | ) | | | (590 | ) |
| | | |
Cash flows from financing activities | | | | | | | | | | | | |
Stock issuance | | | 1,754 | | | | 44,640 | | | | — | |
Stock issuance costs | | | (736 | ) | | | (2,371 | ) | | | | |
Repayments of debt obligations | | | (49 | ) | | | (27 | ) | | | — | |
Payment of NetObjects Earnout | | | — | | | | — | | | | (419 | ) |
Proceeds from issuance of preferred stock, net | | | — | | | | 2,989 | | | | 6,752 | |
Proceeds from exercise of stock options | | | 940 | | | | 50 | | | | 115 | |
Purchase of treasury stock | | | — | | | | — | | | | (5,703 | ) |
| | | | | | | | | | | | |
Net cash provided by financing activities | | | 1,909 | | | | 45,281 | | | | 745 | |
| | | | | | | | | | | | |
Net (decrease) increase in cash and cash equivalents | | | (13,591 | ) | | | 49,125 | | | | 339 | |
Cash and cash equivalents, beginning of period | | | 55,746 | | | | 6,621 | | | | 6,282 | |
| | | | | | | | | | | | |
Cash and cash equivalents, end of period | | $ | 42,155 | | | $ | 55,746 | | | $ | 6,621 | |
| | | | | | | | | | | | |
Supplemental cash flow information | | | | | | | | | | | | |
Interest paid | | $ | 11 | | | $ | 16 | | | $ | 5 | |
| | | | | | | | | | | | |
Supplemental disclosure of non-cash transactions | | | | | | | | | | | | |
Issuance of equity in connection with acquisitions | | $ | 3,013 | | | $ | — | | | $ | — | |
| | | | | | | | | | | | |
See accompanying notes to consolidated financial statements.
52
Website Pros, Inc.
Notes to Consolidated Financial Statements
December 31, 2006
1. The Company and Summary of Significant Accounting Policies
Description of Company
Website Pros, Inc. (the Company) is a provider of Do-It-For-Me Web services and lead generation products that enable small and medium-sized businesses to establish, maintain, promote, and optimize their Internet presence. The Company’s primary service offerings are comprehensive performance-based packages that include Website design and publishing, Internet marketing and advertising, search engine optimization, search engine submission, lead generation, and easy-to-understand Web analytics. In addition to the Company’s primary service offerings, the Company provides a variety of premium services to customers who desire more advanced capabilities, such as e-commerce solutions and other sophisticated Internet marketing services and online lead generation.
The Company has reviewed the criteria of Statement of Financial Accounting Standards (SFAS) No. 131, Disclosures About Segments of an Enterprise and Related Information, and has determined that the Company is comprised of only one segment, Web services and products.
Certain prior year amounts have been reclassified to conform to current year presentation.
Use of Estimates
The preparation of the consolidated financial statements in conformity with accounting principles generally accepted in the United States requires management to make estimates and assumptions that affect the reported amounts of assets and liabilities and disclosure of contingent assets and liabilities at the date of the financial statements and reported amounts of revenues and expenses during the reporting period. Actual results could differ from those estimates.
Principles of Consolidation
The Company’s consolidated financial statements include the assets, liabilities and the operating results of the Company and its wholly owned subsidiaries. All significant intercompany accounts and transactions have been eliminated.
Revenue Recognition
Substantially all of the Company’s subscription revenue is generated from monthly subscriptions for Website design, hosting and marketing services. The typical subscription contract includes the design of a five-page Website, hosting and marketing services. The individual deliverables are not independent of each other and are not sold or priced on a standalone basis. Costs to complete the Website and ready it for the end customer are minimal and are expensed to cost of revenue as incurred. Upon the completion and initial hosting of the Website, the subscription is offered free of charge for a 30-day trial period during which the customer can cancel at anytime. In accordance with Staff Accounting Bulletin (SAB) No. 104, after the 30-day trial period has ended, revenue is recognized when all of the following conditions are satisfied: (1) there is persuasive evidence of an arrangement; (2) the service has been provided to the customer; (3) the amount of fees to be paid by the customer is fixed or determinable; and (4) the collection of the Company’s fees is probable. These criteria are met monthly as the Company’s service is provided on a month-to-month basis and collections are generally made in advance of the services.
Customers are billed for the subscription on a monthly, quarterly, semi-annual or annual basis, at the customer’s option. As customers are billed, subscription revenue is recorded as deferred revenue in the accompanying
53
balance sheets. As services are performed, the Company recognizes subscription revenue ratably on a daily basis over the service period. There are no undelivered elements at the end of the monthly service period. In addition, subscription revenue is generated from monthly subscription packages for hosting and marketing services for customized Websites. These packages are sold separately from the customized Website.
Professional services revenue reflects revenue generated from custom Website design. Revenue from contracts for custom design is recorded using a proportional performance model based on labor hours incurred. The extent of progress towards completion of the custom Website is measured by the labor hours incurred as a percentage of total estimated labor hours to complete. Labor hours are the most appropriate measure to allocate revenue between reporting periods as they are the primary input to the provision of the Company’s professional services.
The Company accounts for its multi-element arrangements, such as in the instances where it designs a custom Website and separately offer other services such as hosting and marketing, in accordance with Emerging Issues Task Force 00-21,Revenue Arrangements with Multiple Deliverables. Based upon vendor-specific objective evidence, the Company allocates multi-element arrangement consideration to the separate units of accounting based upon their relative fair values. The additional services provided with a custom Website are recognized separately over the period for which services are performed.
In addition, license revenue is generated from the sale of licenses for software which allows a customer to build its own Website. The Company markets and licenses software directly to end customers as well as through value-added resellers and distributors. The Company’s software licenses are perpetual. Software may be delivered indirectly by a distributor, via download from the Company’s Website or directly to end-users by the Company. The Company recognizes revenue generated by the distribution of software licenses directly by the Company in the form of a boxed software product or a digital download upon sale and delivery to the end-user. End-users who purchase a software license online pay for the license at the time of order. Subject to some restrictions, the Company permits physical product returns for sales it makes directly to end-users. However, returns historically have been insignificant, and, as such, the Company has not established a reserve for these product returns. The Company does not offer extended payment terms or make concessions for software license sales. The Company recognizes revenue generated from distribution agreements where the distributor has a right of return as the distributor sells and delivers software license product to the end-user. The Company recognizes revenue from distribution agreements where no right of return exists when licensed software product is shipped to the distributor. In arrangements in which distributors pay the Company upon shipment of software product to end-customers, the Company recognizes revenue upon receipt of payment by the distributor. The Company is not obligated to provide technical support in connection with its software license and does not provide technical support services to the Company’s software license customers. The Company’s revenue recognition policies are in compliance with Statement Of Position (SOP) 97-2 (as amended by SOP 98-4 and SOP 98-9), Software Revenue Recognition.
Cash and Cash Equivalents
Cash and cash equivalents include cash on hand, bank demand deposit accounts, and money market accounts. For purposes of the statement of cash flows, the Company considers all highly liquid investments with a maturity of three months or less when purchased to be cash equivalents.
Concentrations of Credit Risk
Financial instruments that potentially subject the Company to concentration of credit risk consist principally of cash and cash equivalents and trade receivables. The Company invests its cash in credit instruments of highly rated financial institutions; one institution holds 97% of the total investments.
Concentrations of credit risk with respect to trade accounts receivable are limited due to the large number of customers comprising the Company’s customer base and their geographic dispersion. The Company has not incurred any significant credit related losses.
54
Geographic Information
The Company markets its products for sale to customers, including distributors, primarily in the United States and Europe. A summary of revenue by geographic area is as follows:
| | | | | | | | | |
| | | Year Ended December 31, | |
| | | 2006 | | | 2005 | | | 2004 | |
United States | | 94 | % | | 94 | % | | 93 | % |
International | | 6 | % | | 6 | % | | 7 | % |
Customers in Germany accounted for over 61%, 64%, and 90% of international revenue for the fiscal years ended December 31, 2006, 2005, and 2004, respectively.
Accounts Receivable
Trade accounts receivable are recorded on the balance sheet at net realizable value. The Company’s management uses historical collection percentages and customer-specific information, when available, to estimate the amount of trade receivables that are uncollectible and establishes reserves for uncollectible balances based on this information. The Company does not require deposits or other collateral from customers. Bad debt expense reported in operating expenses excludes provisions made to the allowance for doubtful accounts for anticipated refunds, automated clearinghouse returns, and chargebacks that are recorded as an adjustment to revenue.
Fair Value of Financial Instruments
Financial instruments include cash and cash equivalents, accounts receivable, accounts payable, accrued expenses and debt. The respective carrying value of these financial instruments approximates fair value since they are short-term in nature or are receivable or payable on demand. Fair value estimates discussed herein are based upon certain market assumptions and pertinent information available to management as of period end.
Inventories
Inventories are stated at the lower of cost (on a first-in, first-out basis) or market. Reserves for obsolete or slow moving inventory are recorded based on management’s analysis of movement of inventory items during the period and review of facts and circumstances specific to that inventory.
Goodwill and Other Intangible Assets
In accordance with SFAS No. 142, Goodwill and Other Intangible Assets, goodwill determined to have an indefinite useful life is no longer amortized, but is tested for impairment, at least annually or more frequently if indicators of impairment arise. If impairment of the carrying value based on the calculated fair value exists, the Company measures the impairment through the use of discounted cash flows. Intangible assets acquired as part of a business combination are accounted for in accordance with SFAS No. 141, Business Combinations, and are recognized apart from goodwill if the intangible arises from contractual or other legal rights or the asset is capable of being separated from the acquired enterprise.
Definite lived intangible assets are amortized over their useful lives, which are three to eight years.
Research and Development Costs
The Company expenses research and development costs as incurred. The Company has not capitalized any such development costs under SFAS No. 86, Accounting for the Costs of Computer Software to be Sold, Leased or Otherwise Marketed, because the costs incurred between the attainment of technological feasibility for the related software product through the date when the product is available for general release to customers has been insignificant.
55
Property and Equipment
Property and equipment, including software, are stated at cost less accumulated depreciation and amortization. Depreciation and amortization are provided over the estimated useful lives of the assets using the straight-line method. Depreciation expense includes the amortization of assets recorded under capital leases.
The asset lives used are presented in the table below:
| | |
| | | Average Life in
Years |
Computer equipment | | 3 |
Software | | 2-3 |
Furniture and fixtures | | 5 |
Telephone equipment | | 5 |
Leasehold improvements | | Shorter of asset’s life
or life of the lease |
Asset Impairment
When events or circumstances indicate possible impairment, the Company performs an evaluation to determine if an impairment of long-lived assets used in operations exists, using undiscounted estimated future operating cash flows attributable to such assets compared to the assets’ carrying amounts.
If the Company determines that long-lived assets have been impaired, the measurement of impairment will be equal to the excess of the carrying amount of such assets over the discounted estimated future operating cash flows, using a discount rate commensurate with the risks involved. The Company would reflect the impairment through a reduction in the carrying value of the long-lived assets. Long-lived assets to be disposed of are recorded at the lower of carrying amount or estimated fair value less costs to dispose.
Advertising
Advertising costs are charged to operations as incurred. Total advertising expense was $128 thousand, $119 thousand and $71 thousand for the years ending December 31, 2006, 2005 and 2004, respectively.
Income Taxes
The Company accounts for income taxes under the provisions of SFAS No. 109 Accounting for Income Taxes, using the liability method. SFAS No. 109 requires recognition of deferred tax liabilities and assets for the expected future tax consequences of events that have been included in the financial statements or tax returns. Under this method, deferred tax liabilities and assets are determined based on the difference between the financial statement and tax basis of assets and liabilities using enacted tax rates in effect for the year in which the difference is expected to reverse.
Stock-Based Employee Compensation
The Company accounts for stock-based compensation to employees in accordance with SFAS No. 123(R), Share-based Payment. Accordingly, the fair value of all stock options is recognized in compensation expense over the vesting period.
Comprehensive Income (Loss)
Comprehensive income (loss) equals net income (loss) for all periods presented.
56
Net Income (Loss) Attributable Per Common Share
The Company computes net income (loss) attributable per common share in accordance with SFAS No. 128, Earnings Per Share. Basic net income (loss) attributable per common share includes no dilution and is computed by dividing net income (loss) attributable to common stockholders by the weighted average number of common shares outstanding for the period. Diluted net income (loss) attributable per common share includes the potential dilution that could occur if securities or other contracts to issue common stock were exercised or converted into common stock.
Reverse Stock Split
On September 14, 2005, the Board of Directors authorized a one-for-five reverse stock split of the Company’s common stock and convertible redeemable preferred stock. All common stock shares, convertible redeemable preferred stock shares, and amounts and per share data have been retroactively restated to reflect the reverse stock split.
Recent Accounting Pronouncements
In July 2006, the Financial Accounting Standards Board (FASB) issued FASB Interpretation No. 48 (FIN 48),Accounting for Uncertainty in Income Taxes, an Interpretation of FASB Statement No. 109. FIN 48 clarifies the accounting and reporting for income taxes where interpretation of the tax law may be uncertain. FIN 48 prescribes a comprehensive model for the financial statement recognition, measurement, presentation and disclosure of income tax uncertainties with respect to positions taken or expected to be taken in income tax returns. This Interpretation also provides guidance on derecognition, classification, interest and penalties, accounting in interim periods, disclosure, and transition. FIN 48 is effective for fiscal years beginning after December 15, 2006. The Company is currently assessing the impact of FIN 48, but does not expect it to have a material impact on its financial position, results of operations, cash flows and disclosures.
In September 2006, the FASB issued Statement of Financial Accounting Standard No. 157 (SFAS 157),Fair Value Measurements. SFAS 157 establishes a common definition for fair value to be applied to US GAAP guidance requiring use of fair value, establishes a framework for measuring fair value, and expands disclosure about such fair value measurements. SFAS 157 is effective for fiscal years beginning after November 15, 2007. The Company is currently assessing the impact of SFAS 157, but does not expect it to have a material impact on its financial position, results of operations, cash flows and disclosures.
2. Change In Accounting Method for Stock Options
Effective January 1, 2006, the Company adopted SFAS No. 123(R),Share Based Payment. Since the Company previously adopted the expense recognition provisions of SFAS No. 123, the adoption of SFAS No. 123(R) had no material impact on its financial statements.
3. Net Income (Loss) Attributable Per Common Share
Basic net income (loss) attributable per common share is calculated using net income and the weighted-average number of shares outstanding during the reporting period. Diluted net income attributable per common share includes the effect from the potential issuance of common stock, such as common stock issued pursuant to the exercise of stock options or warrants.
57
The following table sets forth the computation of basic and diluted net income (loss) attributable per common share for the year ended December 31, 2006, 2005 and 2004 (in thousands except per share amounts):
| | | | | | | | | | | |
| | | 2006 | | 2005 | | | 2004 | |
Net income (loss) attributable to common stockholders | | $ | 8,597 | | $ | (329 | ) | | $ | (370 | ) |
Weighted average outstanding shares of common stock | | | 16,778 | | | 6,222 | | | | 3,002 | |
Dilutive effect of stock options | | | 2,349 | | | — | | | | — | |
Dilutive effect of warrants | | | 232 | | | — | | | | — | |
Dilutive effect of escrow shares | | | 71 | | | — | | | | — | |
| | | | | | | | | | | |
Common stock and common stock equivalents | | | 19,430 | | | 6,222 | | | | 3,002 | |
| | | | | | | | | | | |
Net income (loss) attributable per common share: | | | | | | | | | | | |
Basic | | $ | 0.51 | | $ | (0.05 | ) | | $ | (0.12 | ) |
Diluted | | $ | 0.44 | | $ | (0.05 | ) | | $ | (0.12 | ) |
Due to the anti-dilutive nature of certain of the Company’s stock options and warrants, 448,535, 7,820,458, and 7,794,285 securities for the year ended December 31, 2006, 2005 and 2004, respectively, have been excluded from the calculation of the weighted average shares for diluted net earnings (loss) attributable per common share.
4. Valuation Accounts
The Company’s accounts receivable allowance is summarized as follows (in thousands):
| | | | |
December 31, 2004 | | $ | 365 | |
Provision | | | 626 | |
Charge-off | | | (608 | ) |
| | | | |
December 31, 2005 | | | 383 | |
Provision | | | 564 | |
Charge-off | | | (667 | ) |
| | | | |
December 31, 2006 | | $ | 280 | |
| | | | |
The Company’s inventory reserves are summarized as follows (in thousands):
| | | | |
December 31, 2004 | | $ | 61 | |
Provision | | | 20 | |
Charge-off | | | (30 | ) |
| | | | |
December 31, 2005 | | | 51 | |
Provision | | | 63 | |
Charge-off | | | (66 | ) |
| | | | |
December 31, 2006 | | $ | 48 | |
| | | | |
58
5. Property and Equipment
The Company’s property and equipment are summarized as follows (in thousands):
| | | | | | | | |
| | | December 31, | |
| | | 2006 | | | 2005 | |
Property and equipment: | | | | | | | | |
Software | | $ | 1,659 | | | $ | 1,527 | |
Computer equipment | | | 2,101 | | | | 1,024 | |
Telephone equipment | | | 515 | | | | 183 | |
Furniture and fixtures | | | 480 | | | | 131 | |
Leasehold improvements | | | 209 | | | | 13 | |
| | | | | | | | |
Total property and equipment | | | 4,964 | | | | 2,878 | |
Accumulated depreciation | | | (2,627 | ) | | | (1,810 | ) |
| | | | | | | | |
Property and equipment, net | | $ | 2,337 | | | $ | 1,068 | |
| | | | | | | | |
Depreciation expense relating to property and equipment amounted to $812 thousand, $567 thousand, and $383 thousand for the years ended December 31, 2006, 2005, and 2004, respectively.
6. Acquisitions
Acquisition of Substantially All of the Assets of and Assumption of Select Liabilities from 1ShoppingCart.com
On September 30, 2006, the Company acquired substantially all of the assets of, and assumed certain liabilities from 1ShoppingCart.com Canada Corp. and 1ShoppingCart.com Corp. (together, “1ShoppingCart.com”), a leading provider of shopping cart, internet marketing and eCommerce/eBusiness solutions and services based in Barrie, Ontario. The Company believes that the 1ShoppingCart.com acquisition brings a strong group of private-labeled resellers and affiliates that will enable cross- and up-sell opportunities for its complementary Web services, internet marketing and eCommerce solutions, which are all geared to satisfying the needs of small and medium-sized businesses. Under the terms of the asset purchase agreement, the Company paid cash consideration of approximately $12.5 million and $0.3 million of transaction costs, subject to certain adjustments based on the final consolidated balance sheet of 1ShoppingCart.com as of September 30, 2006. As of December 31, 2006, the purchase accounting for this acquisition is still subject to final adjustment primarily for amounts allocated to other intangible assets based on preliminary valuation studies performed by a third-party valuation expert and for certain pre-acquisition contingencies.
The results of operations of 1ShoppingCart.com for the period from October 1, 2006 through December 31, 2006 are included in the Company’s consolidated statement of operations for the year ended December 31, 2006.
The following table summarizes the Company’s purchase price allocation as of September 30, 2006 based on the fair values of the assets acquired and liabilities assumed on September 30, 2006 (in thousands):
| | | | | | |
| | | | | | Weighted-average
amortization period |
Tangible current assets | | $ | 584 | | | |
Tangible non-current assets | | | 381 | | | |
Technical know-how | | | 990 | | | 3 years |
Customer relationships | | | 2,321 | | | 8 years |
Non-compete | | | 160 | | | 3 years |
Trade name | | | 677 | | | Indefinite |
Goodwill | | | 9,310 | | | |
Current liabilities | | | (1,512 | ) | | |
Non-current liabilities | | | (102 | ) | | |
| | | | | | |
Net assets acquired | | $ | 12,809 | | | |
| | | | | | |
59
The intangible assets include non-compete agreements, trade name, technical know-how and customer relationships which are being amortized over a three to eight year periods, except for the trade name which has an indefinite life. The goodwill represents business benefits the Company anticipates realizing in future periods.
The financial information in the table below summarizes the combined results of operations of the Company and 1ShoppingCart.com on a pro forma basis as of the year ended December 31, 2006 and 2005, as though the acquisition had occurred at the beginning of the year set forth below. This pro forma financial information is presented for informational purposes only and is not necessarily indicative of the results of operations that would have been achieved had the acquisition actually taken place at the beginning of the twelve month period set forth below.
| | | | | | | |
| | | Year ended
December 31, 2006 | | Year ended
December 31, 2005 | |
Revenue | | $ | 56,933 | | $ | 41,439 | |
Net income (loss) attributable to common stockholders | | | 9,164 | | | (199 | ) |
Basic net income (loss) attributable per common share | | | .55 | | | (.03 | ) |
Diluted net income (loss) attributable per common share | | | .47 | | | (.03 | ) |
Acquisition of Substantially All of the Assets of and Assumption of Select Liabilities from Renex, Inc.
On September 30, 2006, the Company acquired substantially all of the assets of, and assumed certain liabilities from Renex, Inc. (“Renex”) an online lead generation marketplace for contractors and homeowners based in Halifax, Nova Scotia. The Company believes that the Renex acquisition will enhance its ability to provide a one-stop shop for comprehensive, affordable Website and online advertising solutions for small and medium-sized businesses and is in-line with the Company’s long-term strategic direction of providing targeted, high value solutions to customers in specific vertical markets. Under the terms of the asset purchase agreement, the Company paid cash consideration of $7.0 million plus $0.3 million in transaction costs and agreed to issue 277,496 shares of its common stock valued at approximately $3.0 million to Renex to be equally distributed on September 30, 2007 and September 30, 2008 as consideration for the acquired assets if certain compliance with representations and warranties are demonstrated. Those common shares are held in escrow until the representations and warranties period has expired. In addition, if certain requirements are met during the twelve months following September 30, 2006, the Company will pay Renex contingent consideration up to an additional $1.0 million. The Company recorded a liability and increased goodwill for $250 thousand as a result of the contingent conditions for the quarter ended December 31, 2006 being met by Renex, which amount was subsequently paid in January 2007. As of December 31, 2006, the purchase accounting for this acquisition is still subject to final adjustment primarily for amounts allocated to other intangible assets based on preliminary valuation studies performed by a third-party valuation expert and for certain pre-acquisition contingencies.
The results of operations of Renex for the period from October 1, 2006 through December 31, 2006 are included in the Company’s consolidated statement of operations for the year ended December 31, 2006.
The following table summarizes the Company’s purchase price allocation as of September 30, 2006 based on the fair values of the assets acquired and liabilities assumed on September 30, 2006 (in thousands):
| | | | | | |
| | | | | | Weighted-average amortization period |
Tangible current assets | | $ | 195 | | | |
Tangible non-current assets | | | 172 | | | |
Technical know-how | | | 110 | | | 4 years |
Customer relationships | | | 920 | | | 4 years |
Non-compete | | | 220 | | | 3 years |
Trade name | | | 630 | | | Indefinite |
Goodwill | | | 8,377 | | | |
Current liabilities | | | (280 | ) | | |
| | | | | | |
Net assets acquired | | $ | 10,344 | | | |
| | | | | | |
60
The intangible assets include non-compete agreements, trade name, technical know-how and customer relationships which are being amortized over a three to four year period, except for trade name which has an indefinite life. The goodwill represents business benefits the Company anticipates realizing in future periods.
The financial information in the table below summarizes the combined results of operations of the Company and Renex on a pro forma basis as of the year ended December 31, 2006 and 2005, as though the acquisition had occurred at the beginning of the years set forth below. This pro forma financial information is presented for informational purposes only and is not necessarily indicative of the results of operations that would have been achieved had the acquisition actually taken place at the beginning of the twelve month period set forth below.
| | | | | | | |
| | | Year ended
December 31, 2006 | | Year ended
December 31, 2005 | |
Revenue | | $ | 55,902 | | $ | 40,665 | |
Net income (loss) attributable to common stockholders | | | 8,219 | | | (758 | ) |
Basic net income (loss) attributable per common share | | | .49 | | | (.12 | ) |
Diluted net income (loss) attributable per common share | | | .42 | | | (.12 | ) |
Acquisition of Substantially All of the Assets of and Assumption of Select Liabilities from E.B.O.Z., Inc.
On April 19, 2005, the Company acquired the assets of, and assumed certain liabilities from, E.B.O.Z., Inc. (“EBOZ”). The Company believes the EBOZ asset acquisition improves its ability to cost-effectively provide Web traffic generation solutions to its customers through the use of Internet banner advertisements, pay-per-click campaign management, and search engine optimization. The Company issued 185,524 shares of its common stock to EBOZ as consideration for the acquired assets and, under the agreement as originally executed, would have been obligated to issue as contingent consideration up to an additional 185,524 shares (“Contingent Shares”) in the event the EBOZ assets acquired achieved certain revenue targets during the three months ending July 31, 2006 and certain EBOZ shareholder employees of the Company had not resigned their positions with the Company.
On August 12, 2005, the Company and EBOZ amended the asset purchase agreement to eliminate the Company’s obligation to issue the Contingent Shares. As consideration for the amendment, the Company issued an additional 20,000 shares of the Company’s common stock to EBOZ. The Company recorded $178,000 as stock-based compensation during the quarter ending September 30, 2005, based upon the fair value of these shares at the time of issuance.
The results of operations of EBOZ for the period from April 20, 2005 through December 31, 2005 are included in the Company’s consolidated statement of operations for the year ended December 31, 2005.
The following table summarizes the Company’s purchase price allocation based on the fair values of the assets acquired and liabilities assumed on April 19, 2005 (in thousands):
| | | | | | |
| | | | | | Weighted-average
amortization
period |
Tangible current assets | | $ | 71 | | | |
Tangible non-current assets | | | 354 | | | |
Non-compete | | | 124 | | | 3 years |
Goodwill | | | 810 | | | |
Current liabilities | | | (196 | ) | | |
Non-current liabilities | | | (54 | ) | | |
| | | | | | |
Net assets acquired | | $ | 1,109 | | | |
| | | | | | |
The intangible assets include only non-compete agreements, which are being amortized over three years. The goodwill represents business benefits the Company anticipates realizing in future periods.
61
The financial information in the table below summarizes the combined results of operations of the Company and the assets of EBOZ on a pro forma basis as of the years ended December 31, 2005 and 2004 as though the acquisition had occurred at the beginning of the year set forth below. This pro forma financial information is presented for informational purposes only and is not necessarily indicative of the results of operations that would have been achieved had the acquisition actually taken place at December 31, 2005 or 2004.
| | | | | | | | |
| | | December 31, | |
| | | 2005 | | | 2004 | |
Revenue | | $ | 38,042 | | | $ | 24,393 | |
Loss before extraordinary gain attributable to common stockholders | | | (434 | ) | | | (693 | ) |
Basic and diluted net loss attributable per common share | | | (0.07 | ) | | | (0.07 | ) |
Acquisition of LEADS.com
On April 22, 2005, the Company consummated a transaction whereby a wholly owned subsidiary of the Company merged with LEADS.com, Inc. (“LEADS.com”) and LEADS.com became a wholly-owned subsidiary as contemplated by an agreement and plan of merger and reorganization dated April 22, 2005. The Company believes the LEADS.com acquisition enhances its ability to provide customer leads to locally and regionally focused businesses. Under the terms of the LEADS.com merger agreement, the Company issued 2,320,518 shares of its common stock in exchange for 2,217,769 shares of the common stock of LEADS.com, constituting 100% of the outstanding shares of LEADS.com, and assumed options to purchase 73,241 shares of common stock of the Company. In April 2005, the Company valued the shares issued by determining the enterprise value of LEADS.com based upon a discounted cash flow approach. The cash flow model included an 11-year forecast of income and cash flows and assumed a discount rate of 32.5% and a growth rate implicit in the terminal value of 6.0%. The fair value of the LEADS.com options assumed was valued based upon the following assumptions: fair value of common stock of $7.10; risk-free rate of 4.29%; dividend yield of 0%; and an expected life of 7 years. The resulting fair value was allocated between deferred compensation and the purchase price based upon the intrinsic value and the remaining vesting period in accordance with FIN 44,Accounting for Certain Transactions Involving Stock Compensation.
The results of operations of LEADS.com for the period from April 23, 2005 through December 31, 2005 are included in the Company’s consolidated statement of operations for the year ended December 31, 2005.
The following table summarizes the Company’s purchase price allocation based on the fair values of the assets acquired and liabilities assumed on April 22, 2005 (in thousands):
| | | | | | |
| | | | | | Weighted-average amortization
period |
Tangible current assets | | $ | 496 | | | |
Tangible non-current assets | | | 509 | | | |
Customer relationships | | | 810 | | | 9 months |
Non-compete | | | 1,540 | | | 3 years |
Domain name | | | 1,080 | | | Indefinite |
Goodwill | | | 9,907 | | | |
Current liabilities | | | (1,006 | ) | | |
Non-current liabilities | | | (453 | ) | | |
| | | | | | |
Net assets acquired | | $ | 12,883 | | | |
| | | | | | |
Non-compete agreements and customer relationships are being amortized over 36 months and 9 months, respectively. The goodwill represents business benefits the Company anticipates realizing in future periods.
62
The financial information in the table below summarizes the combined results of operations of the Company and LEADS.com on a pro forma basis as of the years ended December 31, 2005 and 2004, as though the acquisition had occurred at the beginning of the years set forth below. This pro forma financial information is presented for informational purposes only and is not necessarily indicative of the results of operations that would have been achieved had the acquisition actually taken place at December 31, 2005 or 2004.
| | | | | | | | |
| | | December 31, | |
| | | 2005 | | | 2004 | |
Revenue | | $ | 39,487 | | | $ | 27,030 | |
Loss before extraordinary gain attributable to common stockholders | | | (1,384 | ) | | | (3,130 | ) |
Basic and diluted net loss attributable per common share | | | (0.20 | ) | | | (0.59 | ) |
7. Goodwill and Intangible Assets
The Company’s intangible assets are summarized as follows (in thousands):
| | | | | | | | | | |
| | | December 31, | | | Weighted-average Amortization
period |
| | | 2006 | | | 2005 | | |
Indefinite lived intangible assets: | | | | | | | | | | |
Goodwill | | $ | 31,587 | | | $ | 13,650 | | | |
Domain/Trade names | | | 2,387 | | | | 1,080 | | | |
Definite lived intangible assets: | | | | | | | | | | |
Non-compete agreements | | | 1,920 | | | | 1,664 | | | 36 months |
Customer relationships | | | 4,175 | | | | 810 | | | 67 months |
Technical know how | | | 1,100 | | | | — | | | 37 months |
Other | | | 83 | | | | 74 | | | |
Accumulated amortization | | | (2,075 | ) | | | (1,173 | ) | | |
| | | | | | | | | | |
| | $ | 39,177 | | | $ | 16,105 | | | |
| | | | | | | | | | |
The weighted-average amortization period for the amortizable intangible assets is approximately 54 months. Total amortization expense was $900 thousand, $1.2 million, and $16 thousand for the years ended December 31, 2006, 2005 and 2004, respectively. At December 31, 2006, non-compete agreements have a useful life of three years, customer relationships have useful lives of between four and eight years, and technical know-how has useful lives of between three and four years. The other intangible assets have useful lives of between two and three years. Expected amortization expense for the next five years is as follows (in thousands):
| | | |
2007 | | $ | 1,610 |
2008 | | | 1,222 |
2009 | | | 933 |
2010 | | | 525 |
2011 | | | 332 |
Thereafter | | | 581 |
| | | |
Total | | $ | 5,203 |
| | | |
The following table summarizes changes in the Company’s goodwill balances as required by SFAS No. 142 for the periods ended (in thousands):
| | | | | | |
| | | December 31, |
| | | 2006 | | 2005 |
Goodwill balance at beginning of period | | $ | 13,650 | | $ | 2,933 |
Goodwill acquired during the period | | | 17,937 | | | 10,717 |
Goodwill impaired during the year | | | — | | | — |
| | | | | | |
Goodwill balance at end of period | | $ | 31,587 | | $ | 13,650 |
| | | | | | |
63
In accordance with SFAS No. 142, the Company reviews goodwill balances for indicators of impairment on an annual basis and between annual tests if an event occurs or circumstances change that would more likely than not reduce the fair value of goodwill below its carrying amount. Upon completion of the annual assessments, the Company determined that goodwill was not impaired.
Other indefinite-lived intangible assets are tested for impairment annually and on an interim basis if events or changes in circumstances between annual tests indicate that the asset might be impaired in accordance with SFAS No. 142. Upon completion of the annual assessments, the Company determined that its indefinite lived intangible assets were not impaired.
8. Operating Leases
The Company rents its principal office in Jacksonville, Florida, under an operating lease that expires on March 31, 2008, with one renewal option for five additional years. The Company recognizes lease expense on a straight-line basis over the lease term. The Company also has an operating lease for a sales office in Spokane, Washington that expires June 30, 2007.
In connection with the acquisition of LEADS.com, the Company assumed the operating lease for LEADS.com’s principal office in Manassas, Virginia that expires September 30, 2014 and the Company also entered into an operating lease for LEADS.com’s secondary office in Norton, Virginia that expires November 30, 2008. In connection with the acquisition of EBOZ, the Company assumed the operating lease for office space in Los Angeles, California that expires in March 2008. In connection with the acquisition of 1ShoppingCart.com, the Company assumed the operating lease for office space in Barrie, Ontario, Canada that expires in March 2007. On December 28, 2006, the Company entered into a operating lease for this space beginning in March 2007 and expiring in May 2012, with one renewal option for five additional years. In connection with the acquisition of Renex, the Company assumed the operating lease for office space in Halifax, Nova Scotia that expires in May 2009.
In addition, the Company leases equipment under non-cancelable operating leases that expire through 2009. Rental expense for the leased facilities and equipment amounted to approximately $1.2 million, $894 thousand and $653 thousand for the years ended December 31, 2006, 2005 and 2004, respectively. Accrued rent expense was $158 thousand and $177 thousand as of December 31, 2006 and 2005, respectively.
As of December 31, 2006, future minimum rental payments required under operating leases that have initial or remaining non-cancelable terms in excess of one year, including the leases described above, are as follows (in thousands):
| | | |
2007 | | $ | 1,063 |
2008 | | | 548 |
2009 | | | 333 |
2010 | | | 306 |
2010 | | | 312 |
Thereafter | | | 670 |
| | | |
| | $ | 3,232 |
| | | |
9. Long-Term Debt and Capital Lease Obligations
Long-Term Debt
To finance the purchase of the domain name, www.leads.com, in August 2004, LEADS.com signed a $500 thousand non-interest bearing note agreement with the owner of the domain name. The collateral for this note is
64
the www.leads.com domain name. The note is payable in quarterly installments over 5 years. The imputed interest rate is 5.25%. The required minimum payments on the note as of December 31, 2006 are (in thousands):
| | | | |
2007 | | $ | 110 | |
2008 | | | 110 | |
2009 | | | 60 | |
| | | | |
Total | | | 280 | |
Less imputed interest | | | (23 | ) |
| | | | |
| | | 257 | |
Less current portion | | | (95 | ) |
| | | | |
Total notes payable, long term | | $ | 162 | |
| | | | |
Capital Lease Obligations
The Company leases various types of computer and office equipment under non-cancelable lease agreements that expire through 2009. The required minimum payments on the capital leases as of December 31, 2006 are (in thousands):
| | | | |
2007 | | $ | 59 | |
2008 | | | 29 | |
2009 | | | 4 | |
| | | | |
Total | | | 92 | |
Less imputed interest | | | (8 | ) |
| | | | |
| | | 84 | |
Less current portion | | | (52 | ) |
| | | | |
Total obligations under capital leases, long term | | $ | 32 | |
| | | | |
10. Stock-Based Compensation
Effective January 1, 2006, the Company adopted SFAS No. 123(R), Share-Based Payment. Previously, the Company expensed share-based payments as permitted under SFAS No. 123, Accounting for Stock-Based Compensation. Since the Company previously adopted the expense recognition provisions of SFAS No. 123 and the Company’s options vest on a monthly basis, the adoption of SFAS No. 123(R) had no material impact on its financial statements. The Company has elected to use the with and without methodology for determining whether an excess tax benefit has been realized.
Equity Incentive Plans
An Equity Incentive Plan (“1999 Plan”) was adopted by the Company’s Board of Directors and approved by its stockholders on April 5, 1999. The 1999 Plan was amended in June 1999, May 2000, May 2002 and November 2003 to increase the number of shares available for awards. The 1999 Plan as amended provides for the grant of incentive stock options, non-statutory stock options, and stock bonuses to the Company’s employees, directors and consultants. As of December 31, 2006, the Company has reserved 4,074,428 shares of common stock for issuance under this plan. Of the total reserved as of December 31, 2006, options to purchase a total of 3,199,470 shares of the Company’s common stock were held by participants under the plan, options to purchase 785,697 shares of common stock have been issued and exercised and options to purchase 89,261 shares of common stock were cancelled and became available under the 2005 Equity Incentive Plan (the “2005 Plan”) and are currently available for future issuance.
The Board of Directors administers the 1999 Plan and determines the terms of options granted, including the exercise price, the number of shares subject to individual option awards and the vesting period of options, within
65
the limits set forth in the 1999 Plan itself. Options under the 1999 Plan have a maximum term of 10 years and vest as determined by the Board of Directors. Options granted under the 1999 Plan generally vest either over 30 or 48 months. All options granted during 2002 vest over 30 months, and in general all other options granted vest over 48 months. The exercise price of non-statutory stock options and incentive stock options granted shall not be less than 85% and 100%, respectively, of the fair market value of the stock subject to the option on the date of grant. No 10% stockholder is eligible for an incentive or non-statutory stock option unless the exercise price of the option is at least 110% of the fair market value of the stock at date of grant. The 1999 Plan terminated upon the Closing of the company’s initial public offering in November 2005.
The Company’s Board of Directors adopted, and its stockholders approved, the 2005 Equity Incentive Plan that became effective November 2005. As of December 31, 2006, the Company has reserved 1,804,357 shares for equity incentives to be granted under the plan. The option exercise price cannot be less than the fair value of the Company’s stock on the date of grant. Options generally vest ratably over the three or four years, are contingent upon continue employment, and generally expire ten years from the grant date. As of December 31, 2006, 1,277,917 shares were reserved for future issuance under the plan and 1,134 shares have been issued and exercised.
The Company’s Board of Directors adopted, and its stockholders approved, the 2005 Non-Employee Directors’ Stock Option Plan (the “2005 Directors Plan”), which became effective November 2005. The 2005 Directors Plan calls for the automatic grant of nonstatutory stock options to purchase shares of common stock to nonemployee directors. The aggregate number of shares of common stock that was authorized pursuant to options granted under this plan is 610,000 shares. As of December 31, 2006, options to purchase a total of 310,000 shares of the Company’s common stock were held by participants under the plan, no options have been exercised and 300,000 shares of common stock were available for future issuance. On January 25, 2007, the Board of Directors approved an amendment to the 2005 Directors Plan to modify, among other things, the initial and annual grants to non-employee directors by providing for restricted stock grants and reducing the size of the option grants. This amendment will be submitted to the stockholders for approval as more fully described in the Proxy Statement.
The Company’s Board of Directors adopted, and its stockholders approved, the 2005 Employee Stock Purchase Plan (the “ESPP”), which became effective November 2005. The ESPP authorizes the issuance of 491,274 shares of common stock pursuant to purchase rights granted to the Company’s employees or to employees of any of its affiliates. The ESPP is intended to qualify as an “employee stock purchase plan” within the meaning of Section 425 of the Internal Revenue Code. As of December 31, 2006, no shares have been issued under the ESPP.
The Board of Directors, or a committee thereof, administers all of the equity incentive plans and determines the terms of options granted, including the exercise price, the number of shares subject to individual option awards and the vesting period of options, within the limits set forth in the stock option plans. Options have a maximum term of 10 years and vest as determined by the Board of Directors.
The fair value of each option award is estimated on the date of the grant using the Black Scholes option valuation model and the assumptions noted in the following table. Expected volatility rates are based on publicly traded industry comparables and their historical volatility on the date of the grant. The expected term of options granted represents the period of time that they are expected to be outstanding. The risk-free rate for periods within the contractual life of the option is based on the U.S. Treasury yield curve in effect at the time of the grant.
| | | | | | | | | |
| | | Year Ended December 31, | |
| | | 2006 | | | 2005 | | | 2004 | |
Risk-free interest rate | | 4.27-5.15 | % | | 3.86-5.10 | % | | 3.21-4.26 | % |
Dividend yield | | 0 | % | | 0 | % | | 0 | % |
Expected life (in years) | | 5 | | | 5-7 | | | 7 | |
Volatility | | 62-70 | % | | 0-83 | %(1) | | N/A | |
| (1) | For options granted prior to April 27, 2005, the filing date of the Company’s registration statement for its initial public offering, the Company used the minimum value method. |
66
Stock Option Activity
The following table summarizes option activity for all of the Company’s stock options:
| | | | | | | | | | | | |
| | | Shares
Covered
by
Options | | | Exercise
Price per
Share | | Weighted
Average
Exercise
Price | | Weighted
Average
Remaining
Contractual Term | | Aggregate
Intrinsic Value
(in thousands) |
Balance, December 31, 2005 | | 4,074,790 | | | 0.50 to 10.65 | | 3.95 | | | | | |
Granted | | 733,050 | | | 10.00 to 14.05 | | 11.10 | | | | | |
Exercised | | (553,506 | ) | | .50 to 10.01 | | 1.69 | | | | | |
Forfeited | | (164,293 | ) | | 2.00 to 14.05 | | 9.79 | | | | | |
Expired | | (17,229 | ) | | 2.00 to 14.05 | | 8.91 | | | | | |
| | | | | | | | | | | | |
Balance, December 31, 2006 | | 4,072,812 | | | .50 to 14.05 | | 5.29 | | 7.43 | | $ | 17,012 |
| | | | | | | | | | | | |
Exercisable at December 31, 2006 | | 2,772,742 | | | .50 to 14.05 | | 3.22 | | 6.77 | | $ | 16,606 |
| | | | | | | | | | | | |
Compensation costs related to the Company’s share-based plans were $2.0 million, $795 thousand, and $95 thousand for the years ended 2006, 2005 and 2004, respectively. Compensation expense is generally recognized on a straight-line basis over the vesting period of grants. As of December 31, 2006, the Company had $4.9 million of unrecognized compensation costs related to share-based payments, which the Company expects to recognize through October 2010.
The total intrinsic value of options exercised during the years ended December 31, 2006, 2005, and 2004 was $4.58 million, $558 thousand, and $385 thousand, respectively. The weighted average grant-date fair value of options granted during the years ended December 31, 2006, 2005 and 2004 was $6.58, $2.79, and $0.51, respectively. The fair value of shares vested during the years ended December 31, 2006, 2005, and 2004 was $2.1 million, $369 thousand, and $81 thousand, respectively.
The following activity occurred under the Company’s equity incentive plans during the year ended December 31, 2006:
| | | | | | |
Unvested Shares | | Shares | | | Weighted
Average
Grant–
Date Fair Value |
Unvested at December 31, 2005 | | 1,448,694 | | | $ | 2.25 |
Granted | | 733,050 | | | | 6.58 |
Vested | | (717,381 | ) | | | 2.86 |
Forfeited | | (164,293 | ) | | | 6.01 |
| | | | | | |
Unvested at December 31, 2006 | | 1,300,070 | | | | 3.88 |
| | | | | | |
Price ranges of outstanding and exercisable options as of December 31, 2006 are summarized below:
| | | | | | | | | | | | |
| | | Outstanding Options | | Exercisable Options |
Exercise Price | | Number
of Options | | Weighted
Average
Remaining
Life (Years) | | Weighted
Average
Exercise
Price | | Number
of Options | | Weighted
Average
Exercise
Price |
$0.50 | | 697,579 | | 5.41 | | $ | .50 | | 697,579 | | $ | .50 |
$2.00 – 2.15 | | 1,385,618 | | 6.63 | | | 2.00 | | 1,385,410 | | | 2.00 |
$3.25 – 4.48 | | 236,095 | | 7.81 | | | 3.82 | | 161,033 | | | 3.72 |
$8.70 – $9.60 | | 826,814 | | 8.29 | | | 9.00 | | 279,599 | | | 9.00 |
$10.00 – $11.64 | | 914,850 | | 9.27 | | | 10.84 | | 246,165 | | | 10.81 |
$14.05 | | 11,856 | | 9.21 | | | 14.05 | | 2,956 | | | 14.05 |
| | | | | | | | | | | | |
| | 4,072,812 | | | | | | | 2,772,742 | | | |
| | | | | | | | | | | | |
67
11. Common Shares Reserved
The Company had reserved the following number of shares of common stock for future issuance:
| | | | | | |
| | | December 31, |
| | | 2006 | | 2005 | | 2004 |
Outstanding stock options | | 4,072,812 | | 4,074,790 | | 2,913,340 |
Options available for future grants and other awards | | 2,069,191 | | 2,272,877 | | 219,519 |
Warrants outstanding | | 281,347 | | 353,675 | | 353,675 |
Escrow shares relating to the Renex acquisition | | 277,496 | | — | | — |
Conversion of Series A convertible redeemable preferred stock | | — | | — | | 5,904,828 |
| | | | | | |
Total common shares reserved | | 6,700,846 | | 6,701,342 | | 9,391,362 |
| | | | | | |
On January 25, 2007, the Board of Directors approved a grant of 568,800 of the Company’s stock options with an exercise price of $8.92, which were awarded to various employees. These options will vest over four years.
In February 2007, 1,451 shares subject to the warrants outstanding above were exercised.
12. Common Stock
In January 2004, the Board of Directors authorized the repurchase of all shares of common stock of the Company held by a stockholder. On January 23, 2004, 201,207 shares at a cost of approximately $382 thousand were repurchased and were held as treasury stock. In February 2004, the Board of Directors approved a common stock repurchase program whereby the Company was authorized to repurchase shares of the Company’s common stock held by certain Company stockholders at a repurchase price of $2.15925 per share. The holders of the Series A convertible redeemable preferred stock approved the repurchase program in all respects. 2,464,247 shares of the Company’s common stock were repurchased under this repurchase program from various stockholders at a cost of approximately $5.3 million.
On November 7, 2005, the Company completed its initial public offering by issuing 4,800,000 shares of its common stock (1,673,390 of new shares and 3,126,610 of treasury stock) at $10.00 per share. The Company received net proceeds of $41.6 million after deducting underwriter commissions and transaction expenses.
On August 2, 2006, the Company completed a secondary offering whereby certain stockholders sold 3,339,126 common shares and the Company sold 200,000 common shares to the public at a price of $9.25 per share. The net proceeds of the offering to the Company were approximately $1.0 million after deducting underwriting discounts and other costs.
See Note 6 for a discussion of escrowed common stock in connection with the Renex acquisition.
13. Preferred Stock and Warrants
Series A Convertible Redeemable Preferred Stock
On February 11, 2004, the Company completed a private offering of 2,431,399 shares of Series A convertible redeemable preferred stock for an aggregate purchase price of approximately $7.0 million less $247 thousand in offering costs. On April 27, 2004, the Company issued a warrant to its placement agent to purchase 72,942 shares of Series A convertible redeemable preferred stock at an exercise price per share of $2.879. This warrant will terminate in April 2009. The fair value of the warrant was calculated on the date of grant with the following assumptions: fair value of preferred stock of $2.879; risk free rate of 3.37%; dividend rate of 8% and expected life of five years. The resulting fair value of the warrant based upon these calculations was zero.
All Series A convertible redeemable preferred stock was converted to common stock in November 2005 in connection with the initial public offering.
68
Dividends
The holders of Series A convertible redeemable preferred stock were entitled to receive cumulative dividends, prior and in preference to any declaration or payment of any dividend on the common stock or any other shares of capital stock of the Company at an annual rate of 8% of the Original Series A Issue Price per share. These dividends accrued (whether or not earned or declared by the Board of Directors) and compounded annually and were cumulative as to any shares of Series A convertible redeemable preferred stock from the date on which such share is first issued and was payable in arrears, when and as declared by the Board of Directors. Upon the determination of the Board of Directors of the Company, including the directors elected by the holders of the Series A convertible redeemable preferred stock, such dividends would have been paid in shares of Series A convertible redeemable preferred stock valued at the Original Series A Issue Price. Accordingly, dividends on the Series A convertible redeemable preferred stock were being accreted annually. However, because the Series A convertible redeemable preferred stock converted into common stock, the accrued and unpaid dividends will not be paid in either cash or stock.
Series B Convertible Redeemable Preferred Stock
In February 2005, the Board of Directors approved amending and restating the Company’s amended and restated certificate of incorporation to authorize the issuance of additional shares of preferred stock and to designate such additional shares as Series B convertible redeemable preferred stock. In February 2005, the Company issued 420,137 shares of Series B convertible redeemable preferred stock to a stockholder of the Company for approximately $3.0 million.
All Series B Convertible Redeemable Preferred Stock was converted to common stock in November 2005 in connection with the initial public offering.
14. Commitments
Registration Rights
Effective February 28, 2007, the holders of an aggregate of 1,851,623 shares of the Company’s common stock and the holder of warrants to purchase an aggregate of 279,896 shares of the Company’s common stock may require the Company, upon written request from holders of a majority of these shares, and on not more than two occasions, to file a registration statement under the Securities Act of 1933 with respect to their shares.
15. Extraordinary Item
The Company had an earnout obligation to Net Objects, Inc., in connection with its asset purchase agreement with Net Objects entered into in October 2001. The earnout obligation was recorded in accordance with SFAS No. 141, “Business Combinations,” based on a three-year forecast of revenues of software products acquired from Net Objects. The term of the earnout ended in September 2004, so the estimated amount due of $628 thousand was classified as a current liability as of December 31, 2003. The actual earnout obligation, determined to be only $419 thousand, was paid in December 2004. As the related acquired assets had zero book value at the time of settlement, the Company recognized an extraordinary gain of $209 thousand (approximately $0.07 per share).
69
16. Income Taxes
The provision (benefit) for income taxes consisted of the following for the years ended December 2006, 2005, and 2004:
| | | | | | | |
| | | 2006 | | | 2005 | | 2004 |
Current expense (benefit): | | | | | | | |
Federal | | 106 | | | — | | — |
State | | — | | | — | | — |
Deferred expense (benefit): | | | | | | | |
Federal | | (3,007 | ) | | — | | — |
State | | (299 | ) | | — | | — |
| | | | | | | |
Total tax expense (benefit) | | (3,200 | ) | | — | | — |
As of December 31, 2006 and 2005, the Company had federal net operating loss carryforwards of approximately $50.6 million and $56.6 million, respectively, which begin to expire in the year 2019. As of December 31, 2006 and 2005, the Company had state net operating loss carryforwards of approximately $50.6 million and $56.6 million, respectively, which begin to expire in the year 2019. The net operating losses at December 31, 2005 include approximately $2.2 million obtained through acquisitions during 2005. The tax benefit of acquired net operating loss carryforwards will reduce goodwill and other acquired intangibles when realized.
During 2004, a change in ownership of more than 50% occurred that, in accordance with provisions of the Internal Revenue Code, limits the amount of net operating losses that may be utilized in subsequent periods. The annual limitation results in a reduction of available net operating loss carryforwards due to expiring net operating losses in subsequent carryforward periods. Accordingly, the Company estimates that at least $36.0 million of net operating loss carryforwards will be available during the carryforward period. An additional amount may be available as a result of recognized built in gains during the five-year period following the change in ownership.
70
Deferred income taxes reflect the net tax effects of temporary differences between the carrying amounts of assets and liabilities for financial reporting purposes and the amounts used for income tax purposes. Significant components of the Company’s deferred tax assets and liabilities are as follows at December 31 (in thousands):
| | | | | | | | |
| | | 2006 | | | 2005 | |
Deferred tax assets: | | | | | | | | |
Current: | | | | | | | | |
Net operating loss carryforwards | | $ | 2,100 | | | $ | — | |
Allowance for doubtful accounts | | | 87 | | | | 145 | |
Deferred rent | | | 40 | | | | 37 | |
Other | | | — | | | | 14 | |
| | | | | | | | |
| | | 2,227 | | | | 196 | |
Less: valuation allowance | | | (1,696 | ) | | | (189 | ) |
| | | | | | | | |
Net current deferred tax assets | | | 531 | | | | 7 | |
Noncurrent: | | | | | | | | |
Fixed assets basis | | | 184 | | | | 276 | |
Intangible basis | | | 2,646 | | | | 3,198 | |
Stock based compensation | | | 383 | | | | 49 | |
Alternative minimum tax credit | | | 129 | | | | — | |
Net operating loss carryforwards | | | 9,530 | | | | 13,647 | |
| | | | | | | | |
| | | 12,872 | | | | 17,170 | |
Less: valuation allowance | | | (9,800 | ) | | | (16,554 | ) |
| | | | | | | | |
Net noncurrent deferred tax assets | | | 3,072 | | | | 616 | |
| | |
Deferred tax liabilities: | | | | | | | | |
Noncurrent: | | | | | | | | |
Acquired intangibles | | | 403 | | | | 623 | |
| | | | | | | | |
Total noncurrent deferred tax liabilities | | | 403 | | | | 623 | |
| | | | | | | | |
Net noncurrent deferred tax asset (liability) | | | 2,669 | | | | (7 | ) |
| | | | | | | | |
Net deferred tax asset (liability) | | $ | 3,200 | | | $ | — | |
| | | | | | | | |
The valuation allowance decreased by approximately $5.2 million and $905 thousand during 2006 and 2005, respectively. The change in the valuation allowance from 2006 to 2005 is primarily attributable to utilization of net operating losses for $2.0 million and the release of valuation reserve of $3.2 million.
The provision (benefit) for income taxes differs from the amount computed by applying the statutory U.S. federal income tax rates as a result of the following:
| | | | | | | | | |
| | | 2006 | | | 2005 | | | 2004 | |
U.S statutory rate | | 34.0 | % | | 34.0 | % | | 34.0 | % |
State income taxes (net of federal tax benefit) | | 4.0 | | | 4.0 | | | 4.0 | |
Incentive stock options | | 2.2 | | | 22.5 | | | — | |
Change in valuation allowance | | (97.2 | ) | | (57.9 | ) | | (38.2 | ) |
Other | | (2.3 | ) | | (2.6 | ) | | 0.2 | |
| | | | | | | | | |
| | (59.3 | )% | | — | % | | — | % |
| | | | | | | | | |
17. Employee Savings Plan
Effective August 1, 2000, the Company established a 401(k) savings plan designed to qualify under Section 401(k) of the Internal Revenue Code. All employees who completed three months of service are eligible
71
to participate in the plan. Each participant may contribute to the plan up to the maximum allowable amount as determined by the Federal Government. Employee 401(k) deferrals are 100% vested. Company contributions are subject to a vesting schedule based on years of service. The Company began making contributions to the plan in 2004. The Company recorded contribution expense of $136 thousand, $81 thousand and $33 thousand for 2006, 2005 and 2004, respectively.
18. Related Party Transactions
An investment fund affiliated with a law firm that provides legal services to the Company was a stockholder of the Company during a portion of 2006. The law firm received $686 thousand, $1.0 million and $191 thousand for professional services provided to the Company during 2006, 2005 and 2004, respectively. The Company had a payable of $15 thousand and $134 thousand to this law firm at December 31, 2006 and 2005, respectively. All shares held by such investment fund were sold in May 2006.
In February 2002, the Company issued warrants to purchase 72,328 shares of common stock as described in Note 12. Of these, a warrant exercisable for 71,428 shares of common stock was issued to a related party. Our Chief Executive Officer owns a beneficial interest in the general partner of the recipient of that warrant and also has voting and investment power with respect to the warrant and the shares of common stock issuable upon exercise of the warrant. On May 17, 2006, this warrant was exercised and the recipient made a distribution of the shares obtained on such exercise. In connection with such distribution, the Chief Executive Officer of the Company received 24,566 shares of our common stock.
In February 2002, in connection with the acquisition of assets from Innuity, Inc., the Company issued 2,816,585 shares of common stock to Innuity. A current director and a former officer of the Company were secured noteholders of Innuity at the time and received distributions of the Company’s common stock from Artesian Management, Inc., agent for the Innuity secured noteholders, in February 2004.
Mr. Still, one of the Company’s directors, is affiliated with Norwest Venture Partners, one of the Company’s major stockholders. Mr. Still shares voting and investment power with respect to the shares owned by the Norwest Venture Partners affiliated entities.
In December 2003, the Company entered into a letter agreement with Insight Venture Management, LLC, or IVM, an affiliate of Insight Venture Partners IV, L.P., whereby the Company received consulting services from IVM for a term of twelve months beginning January 1, 2004. This agreement expired pursuant to its terms on December 31, 2004. The Company paid IVM an aggregate amount of $61 thousand for these services during 2004. At such time, two of the Company’s directors were affiliated with Insight Venture Partners, and entities affiliated with Insight Venture Partners owned more than 5% of the Company’s outstanding capital stock. Currently, only one of the Company's directors is affiliated with Insight Venture Partners and entities affiliated with Insight Venture Partners no longer own greater than 5% of the Company's outstanding capital stock.
In February 2004, the Company repurchased shares of its common stock from certain stockholders, including from one of its directors, his family members, and certain other parties with which he is or, in the past, was affiliated.
2. Financial Statement Schedules
The information required by Schedule II, Valuation and Qualifying Accounts, is included in Note 4 to the Consolidated Financial Statements. All other financial statement schedules are not applicable.
72
3. Exhibits.
| | |
| Exhibit No. | | Description of Document |
| 3.1 | | Amended and Restated Certificate of Incorporation of Website Pros, Inc.* |
| |
| 3.2 | | Amended and Restated Bylaws of Website Pros, Inc.** |
| |
| 4.1 | | Reference is made to Exhibits 3.1 and 3.2 |
| |
| 4.2 | | Specimen Stock Certificate.# |
| |
| 4.3 | | Investors’ Rights Agreement dated December 10, 2003, as amended by the Omnibus Amendment Agreement dated February 14, 2005.# |
| |
| 4.4 | | Warrant dated December 10, 2003, exercisable for 208,405 shares of common stock.***# |
| |
| 4.5 | | Warrant dated April 27, 2004, exercisable for 72,942 shares of common stock.**** # |
| |
| 10.1 | | 1999 Equity Incentive Plan and forms of related agreements.# |
| |
| 10.2 | | 2005 Equity Incentive Plan and forms of related agreements.# |
| |
| 10.3 | | 2005 Non-Employee Directors’ Stock Option Plan and forms of related agreements.# |
| |
| 10.4 | | 2005 Employee Stock Purchase Plan.# |
| |
| 10.5 | | Executive Severance Benefit Plan.+# |
| |
| 10.6 | | Form of Indemnity Agreement entered into between the registrant and certain of its officers and directors.# |
| |
| 10.7 | | Employment Agreement with David L. Brown, dated June 1, 2005.+# |
| |
| 10.8 | | Employment Agreement with Kevin M. Carney, dated June 1, 2005.+# |
| |
| 10.9 | | Partnership Agreement with Discover Financial Services, LLC dated November 3, 2003, as amended to date.†# |
| |
| 10.10 | | Lease by and between Flagler Development Company and the registrant, dated as of January 17, 2003.# |
| |
| 10.11 | | Commercial Rental Agreement by and between Innuity, Inc. and R.I.N. Corporation, and Mountain Real Estate & Property Management, Inc., dated as of April 21, 2000, as amended by Lease addendum to lease dated April 21, 2000 by and between Points North Associates, LLC and the registrant, dated as of May 26, 2004.# |
| |
| 10.12 | | Lease for 10021 Balls Ford Road, Manassas, Virginia, by and between the registrant and GDR Manassas, LLP, dated September 8, 2004.# |
| |
| 14.1 | | Code of Conduct.# |
| |
| 21.1 | | Subsidiaries of the registrant. |
| |
| 23.1 | | Consent of Ernst & Young LLP, Independent Registered Public Accounting Firm. |
| |
| 24.1 | | Power of Attorney (included in the signature page hereto). |
| |
| 31.1 | | CEO Certification required by Rule 13a-14(a) or Rule 15d-14(a). |
| |
| 31.2 | | CFO Certification required by Rule 13a-14(a) or Rule 15d-14(a). |
| |
| 32.1 | | Certification required by Rule 13a-14(b) or Rule 15d-14(b) and Section 1350 of Chapter 63 of Title 18 of the United States Code (18 U.S.C. §1350). |
| |
| 32.2 | | Certification required by Rule 13a-14(b) or Rule 15d-14(b) and Section 1350 of Chapter 63 of Title 18 of the United States Code (18 U.S.C. §1350). |
73
| * | Filed as Exhibit 3.3 to the Registrant’s registration statement on Form S-1 (No. 333-124349), filed with the SEC on April 27, 2005, as amended, and incorporated herein by reference. |
| ** | Filed as Exhibit 3.4 to the Registrant’s registration statement on Form S-1 (No. 333-124349), filed with the SEC on April 27, 2005, as amended, and incorporated herein by reference. |
| *** | Filed as Exhibit 4.6 to the Registrant’s registration statement on Form S-1 (No. 333-124349), filed with the SEC on April 27, 2005, as amended, and incorporated herein by reference. |
| **** | Filed as Exhibit 4.7 to the Registrant’s registration statement on Form S-1 (No. 333-124349), filed with the SEC on April 27, 2005, as amended, and incorporated herein by reference. |
| # | Filed as the like numbered Exhibit to the Registrant’s registration statement on Form S-1 (No. 333-124349), filed with the SEC on April 27, 2005 and as Exhibit 10.14 to the current report on Form 8-K (No. 000-51595), filed with the SEC on November 7, 2006, as amended, and incorporated herein by reference. |
| † | Portions of this exhibit (indicated by asterisks) have been omitted pursuant to a request for confidential treatment and this exhibit has been filed separately with the SEC. |
| + | Indicates management contract or compensatory plan. |
74
SIGNATURES
Pursuant to the requirements of the Securities Exchange Act of 1934, the registrant has duly caused this report to be signed on its behalf by the undersigned thereunto duly authorized.
| | | | |
| | | | Website Pros, Inc. |
| | | | (Registrant) |
| | |
March 9, 2007 | | | | /s/ Kevin M. Carney |
Date | | | | Kevin M. Carney |
| | | | Chief Financial Officer |
| | | | (Principal Financial and Accounting Officer) |
POWER OF ATTORNEY
KNOW ALL PERSONS BY THESE PRESENTS, that each person whose signature appears below constitutes and appoints David L. Brown and Kevin M. Carney, and each of them, as his true and lawful attorneys-in-fact and agents, with full power of substitution for him, and in his name in any and all capacities, to sign any and all amendments to this Form 10-K, and to file the same, with exhibits thereto and other documents in connection therewith, with the Securities and Exchange Commission, granting unto said attorneys-in-fact and agents, and each of them, full power and authority to do and perform each and every act and thing requisite and necessary to be done therewith, as fully to all intents and purposes as he might or could do in person, hereby ratifying and confirming all that said attorneys-in-fact and agents, and any of them or his or her substitute or substitutes, may lawfully do or cause to be done by virtue hereof.
Pursuant to the requirements of the Securities Act of 1934, this report has been signed by the following persons on behalf of the Registrant in the capacities indicated on March 9, 2007:
| | |
Name | | Title |
| |
/s/ David L. Brown David L. Brown | | President, Chief Executive Officer and Chairman of the Board (Principal Executive Officer) |
| |
/s/ Kevin M. Carney Kevin M. Carney | | Chief Financial Officer (Principal Financial and Accounting Officer) |
| |
/s/ Timothy Maudlin Timothy Maudlin | | Lead Director |
| |
G. Harry Durity | | Director |
| |
/s/ Hugh Durden Hugh Durden | | Director |
| |
/s/ Julius Genachowski Julius Genachowski | | Director |
| |
/s/ Deven Parekh Deven Parekh | | Director |
| |
George J. Still, Jr. | | Director |
75
EXHIBIT INDEX
| | |
| Exhibit No. | | Description of Document |
| 3.1 | | Amended and Restated Certificate of Incorporation of Website Pros, Inc.* |
| |
| 3.2 | | Amended and Restated Bylaws of Website Pros, Inc.** |
| |
| 4.1 | | Reference is made to Exhibits 3.1 and 3.2 |
| |
| 4.2 | | Specimen Stock Certificate.# |
| |
| 4.3 | | Investors’ Rights Agreement dated December 10, 2003, as amended by the Omnibus Amendment Agreement dated February 14, 2005.# |
| |
| 4.4 | | Warrant dated December 10, 2003, exercisable for 208,405 shares of common stock.***# |
| |
| 4.5 | | Warrant dated April 27, 2004, exercisable for 72,942 shares of common stock.****# |
| |
| 10.1 | | 1999 Equity Incentive Plan and forms of related agreements.# |
| |
| 10.2 | | 2005 Equity Incentive Plan and forms of related agreements.# |
| |
| 10.3 | | 2005 Non-Employee Directors’ Stock Option Plan and forms of related agreements.# |
| |
| 10.4 | | 2005 Employee Stock Purchase Plan.# |
| |
| 10.5 | | Executive Severance Benefit Plan.+# |
| |
| 10.6 | | Form of Indemnity Agreement entered into between the registrant and certain of its officers and directors.# |
| |
| 10.7 | | Employment Agreement with David L. Brown, dated June 1, 2005.+# |
| |
| 10.8 | | Employment Agreement with Kevin M. Carney, dated June 1, 2005.+# |
| |
| 10.9 | | Partnership Agreement with Discover Financial Services, LLC dated November 3, 2003, as amended to date.†# |
| |
| 10.10 | | Lease by and between Flagler Development Company and the registrant, dated as of January 17, 2003.# |
| |
| 10.11 | | Commercial Rental Agreement by and between Innuity, Inc. and R.I.N. Corporation, and Mountain Real Estate & Property Management, Inc., dated as of April 21, 2000, as amended by Lease addendum to lease dated April 21, 2000 by and between Points North Associates, LLC and the registrant, dated as of May 26, 2004.# |
| |
| 10.12 | | Lease for 10021 Balls Ford Road, Manassas, Virginia, by and between the registrant and GDR Manassas, LLP, dated September 8, 2004.# |
| |
| 14.1 | | Code of Conduct.# |
| |
| 21.1 | | Subsidiaries of the registrant. |
| |
| 23.1 | | Consent of Ernst & Young LLP, Independent Registered Public Accounting Firm. |
| |
| 24.1 | | Power of Attorney (included in the signature page hereto). |
| |
| 31.1 | | CEO Certification required by Rule 13a-14(a) or Rule 15d-14(a). |
| |
| 31.2 | | CFO Certification required by Rule 13a-14(a) or Rule 15d-14(a). |
| |
| 32.1 | | Certification required by Rule 13a-14(b) or Rule 15d-14(b) and Section 1350 of Chapter 63 of Title 18 of the United States Code (18 U.S.C. §1350). |
| |
| 32.2 | | Certification required by Rule 13a-14(b) or Rule 15d-14(b) and Section 1350 of Chapter 63 of Title 18 of the United States Code (18 U.S.C. §1350). |
76
| * | Filed as Exhibit 3.3 to the Registrant’s registration statement on Form S-1 (No. 333-124349), filed with the SEC on April 27, 2005, as amended, and incorporated herein by reference. |
| ** | Filed as Exhibit 3.4 to the Registrant’s registration statement on Form S-1 (No. 333-124349), filed with the SEC on April 27, 2005, as amended, and incorporated herein by reference. |
| *** | Filed as Exhibit 4.6 to the Registrant’s registration statement on Form S-1 (No. 333-124349), filed with the SEC on April 27, 2005, as amended, and incorporated herein by reference. |
| **** | Filed as Exhibit 4.7 to the Registrant’s registration statement on Form S-1 (No. 333-124349), filed with the SEC on April 27, 2005, as amended, and incorporated herein by reference. |
| # | Filed as the like numbered Exhibit to the Registrant’s registration statement on Form S-1 (No. 333-124349), filed with the SEC on April 27, 2005 and as Exhibit 10.14 to the current report on Form 8-K (No. 000-51595), filed with the SEC on November 7, 2006, as amended, and incorporated herein by reference. |
| † | Portions of this exhibit (indicated by asterisks) have been omitted pursuant to a request for confidential treatment and this exhibit has been filed separately with the SEC. |
| + | Indicates management contract or compensatory plan. |
77