UNITED STATES
SECURITIES AND EXCHANGE COMMISSION
Washington, D.C. 20549
FORM N-CSR
CERTIFIED SHAREHOLDER REPORT
OF REGISTERED MANAGEMENT INVESTMENT COMPANIES
Investment Company Act file number 811-09729
iShares Trust
(Exact name of registrant as specified in charter)
c/o: BNY Mellon Investment Servicing (US) Inc.
301 Bellevue Parkway, Wilmington, DE 19809
(Address of principal executive offices) (Zip code)
The Corporation Trust Company
1209 Orange Street, Wilmington, DE 19801
(Name and address of agent for service)
Registrant’s telephone number, including area code: (415) 670-2000
Date of fiscal year end: March 31, 2023
Date of reporting period: March 31, 2023
Item 1. Reports to Stockholders.
(a) The Report to Shareholders is attached herewith.
| | |

| | MARCH 31, 2023 |
iShares Trust
| | |
· | | iShares S&P 100 ETF | OEF | NYSE Arca |
· | | iShares S&P 500 Growth ETF | IVW | NYSE Arca |
· | | iShares S&P 500 Value ETF | IVE | NYSE Arca |
· | | iShares S&P Small-Cap 600 Value ETF | IJS | NYSE Arca |
The Markets in Review
Dear Shareholder,
Significant economic headwinds emerged during the 12-month reporting period ended March 31, 2023, as investors navigated changing economic conditions and volatile markets. The U.S. economy shrank in the first half of 2022 before returning to modest growth in the second half of the year, marking a shift to a more challenging post-reopening economic environment. Changes in consumer spending patterns and a tight labor market led to elevated inflation, which reached a 40-year high before beginning to moderate.
Equity prices fell as interest rates rose, particularly during the first half of the reporting period. Both large- and small-capitalization U.S. stocks declined, although equities began to recover in the second half of the period as inflation eased and economic growth resumed. Emerging market stocks and international equities from developed markets declined overall, pressured by rising interest rates and volatile commodities prices.
The 10-year U.S. Treasury yield rose during the reporting period, driving its price down, as investors reacted to fluctuating inflation data and attempted to anticipate its impact on future interest rate changes. The corporate bond market also faced inflationary headwinds, and higher interest rates led to rising borrowing costs for corporate issuers.
The U.S. Federal Reserve (the “Fed”), acknowledging that inflation has been more persistent than expected, raised interest rates eight times. Furthermore, the Fed wound down its bond-buying programs and accelerated the reduction of its balance sheet.
Restricted labor supply kept inflation elevated even as other inflation drivers, such as goods prices and energy costs, moderated. While economic growth slowed in the last year, we believe that taming inflation requires a more substantial decline that lowers demand to a level more in line with the economy’s productive capacity. Although the Fed has decelerated the pace of interest rate hikes, we believe that it still seems determined to get inflation back to target. With this in mind, we believe the possibility of a U.S. recession in the near-term is high, but the dimming economic outlook has not yet been fully reflected in current market prices. We believe investors should expect a period of higher volatility as markets adjust to the new economic reality and policymakers attempt to adapt to rapidly changing conditions. Turmoil in the banking sector late in the period highlighted the potential for the knock-on effects of substantially higher interest rates to disrupt markets with little warning.
While we favor an overweight to equities in the long term, we prefer an underweight stance on equities overall in the near term. Expectations for corporate earnings remain elevated, which seems inconsistent with the possibility of a recession. Nevertheless, we are overweight on emerging market stocks as we believe a weakening U.S. dollar provides a supportive backdrop. We also see long-term opportunities in credit, where we believe that valuations are appealing and higher yields provide attractive income, although we are neutral on credit in the near term, as we’re concerned about tightening credit and financial conditions. However, we believe there are still some strong opportunities for a six- to twelve-month horizon, particularly short-term U.S. Treasuries, global inflation-linked bonds, and emerging market bonds denominated in local currency.
Overall, our view is that investors need to think globally, position themselves to be prepared for a decarbonizing economy, and be nimble as market conditions change. We encourage you to talk with your financial advisor and visit iShares.com for further insight about investing in today’s markets.
Sincerely,

Rob Kapito
President, BlackRock, Inc.

Rob Kapito
President, BlackRock, Inc.
| | | | | | | | | | |
| Total Returns as of March 31, 2023 |
| | | |
| | | 6-Month
| | 12-Month
|
| | |
U.S. large cap equities (S&P 500® Index) | | | | 15.62 | % | | | | (7.73 | )% |
| | |
U.S. small cap equities (Russell 2000® Index) | | | | 9.14 | | | | | (11.61 | ) |
| | |
International equities (MSCI Europe, Australasia, Far East Index) | | | | 27.27 | | | | | (1.38 | ) |
| | |
Emerging market equities (MSCI Emerging Markets Index) | | | | 14.04 | | | | | (10.70 | ) |
| | |
3-month Treasury bills (ICE BofA 3-Month U.S. Treasury Bill Index) | | | | 1.93 | | | | | 2.52 | |
| | |
U.S. Treasury securities (ICE BofA 10-Year U.S. Treasury Index) | | | | 4.38 | | | | | (6.90 | ) |
| | |
U.S. investment grade bonds (Bloomberg U.S. Aggregate Bond Index) | | | | 4.89 | | | | | (4.78 | ) |
| | |
Tax-exempt municipal bonds (Bloomberg Municipal Bond Index) | | | | 7.00 | | | | | 0.26 | |
| | |
U.S. high yield bonds (Bloomberg U.S. Corporate High Yield 2% Issuer Capped Index) | | | | 7.88 | | | | | (3.35 | ) |
|
Past performance is not an indication of future results. Index performance is shown for illustrative purposes only. You cannot invest directly in an index. | |
| | |
| 2 | | T H I S P A G E I S N O T P A R T O F Y O U R F U N D R E P O R T |
Table of Contents
Market Overview
iShares Trust
Domestic Market Overview
U.S. stocks declined for the 12 months ended March 31, 2023 (“reporting period”), when the Russell 3000® Index, a broad measure of U.S. equity market performance, returned -8.58%. Elevated inflation and rapid tightening of monetary policy dampened growth and weighed on equities. Higher interest rates drove bond yields higher and increased borrowing costs for businesses and consumers. Equities began to recover in the second half of the reporting period, as the broader economy remained resilient and the pace of inflation declined. In March 2023, two banks suddenly failed, representing the second and third largest bank failures in U.S. history by asset value. This drove concern among investors about the resiliency of the financial system in the face of rapidly rising interest rates. However, government agencies acted swiftly to organize a sale of the failed banks’ assets and inject liquidity, and equity prices recovered.
Inflation was a significant driver of the economic outlook. As the reporting period began, the consumer price index, a widely followed measure of inflation, stood at multi-decade highs. Strong consumer spending and a tight labor market, along with continued supply chain disruptions in Asia, combined to drive prices higher. But the rate of inflation began to decline as the reporting period wore on, decelerating for nine consecutive months beginning in July 2022. Nonetheless, inflation remained elevated by historic standards, and higher prices negatively impacted both consumers and businesses.
The U.S. economy recovered from a decline in the first half of 2022 to post modest growth in the third and fourth quarters of 2022. Consumers continued to power the economy with growing spending, despite higher prices for many consumer goods and services. The strong labor market supported spending, as unemployment remained very low, at one point dropping to the lowest recorded level since 1969. Furthermore, the labor force participation rate—which measures the total proportion of employed persons of working age—rose, indicating that more people were being drawn into the labor force. Amid tightening labor supply, wages rose significantly, with the largest gains at the lower end of the wage spectrum.
To contain inflation, the U.S. Federal Reserve (“Fed”) tightened monetary policy rapidly, raising short-term interest rates eight times over the course of the reporting period. The pace of tightening accelerated as the Fed twice stepped up the increment of increase before reducing it again as inflation began to subside. The Fed also started to reduce the size of its balance sheet by reducing the store of U.S. Treasuries it had accumulated to stabilize markets in the early phases of the coronavirus pandemic. While the Fed indicated that more tightening could be needed to achieve its long-term inflation goal, it sounded a more cautious note about the potential for further interest rate increases near the end of the reporting period.
Despite economic headwinds, corporate profits remained robust, and many companies were able to sufficiently raise prices to preserve profit margins even in the face of rising labor and input costs. Nonetheless, profits declined overall in the fourth quarter of 2022, and the yield curve (a graphical representation of U.S. Treasury rates at different maturities) inverted, a sign that markets were concerned about the impact of higher borrowing costs on the economy. Furthermore, dwindling personal savings and rising household debt raised questions about the sustainability of consumer spending as an engine of economic growth.
| | |
| 4 | | 2 0 2 3 I S H A R E S A N N U A L R E P O R T T O S H A R E H O L D E R S |
| | |
| Fund Summary as of March 31, 2023 | | iShares® S&P 100 ETF |
Investment Objective
The iShares S&P100 ETF(the “Fund”) seeks to track the investment results of an index composed of 100 large-capitalization U.S. equities, as represented by the S&P 100® (the “Index”). The Fund invests in a representative sample of securities included in the Index that collectively has an investment profile similar to the Index. Due to the use of representative sampling, the Fund may or may not hold all of the securities that are included in the Index.
Performance
| | | | | | | | | | | | | | | | | | | | | | | | |
| | | Average Annual Total Returns | | | Cumulative Total Returns | |
| | | | | | |
| | | 1 Year | | | 5 Years | | | 10 Years | | | 1 Year | | | 5 Years | | | 10 Years | |
| | | | | | |
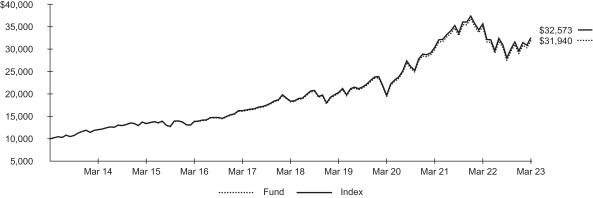
Fund NAV | | | (8.80 | )% | | | 11.88 | % | | | 12.31 | % | | | (8.80 | )% | | | 75.32 | % | | | 219.40 | % |
| | | | | | |
Fund Market | | | (8.93 | ) | | | 11.87 | | | | 12.32 | | | | (8.93 | ) | | | 75.21 | | | | 219.64 | |
| | | | | | |
Index | | | (8.62 | ) | | | 12.11 | | | | 12.53 | | | | (8.62 | ) | | | 77.14 | | | | 225.73 | |
GROWTH OF $10,000 INVESTMENT
(AT NET ASSET VALUE)
Past performance is not an indication of future results. Performance results do not reflect the deduction of taxes that a shareholder would pay on fund distributions or the redemption of sale of fund shares. See “About Fund Performance” for more information.
Expense Example
| | | | | | | | | | | | | | | | | | | | | | | | | | | | | | |
Actual | | | | | | Hypothetical 5% Return | | | | |
| | | | | | | | | | | | | | |
| Beginning
Account Value
(10/01/22) |
| |
| Ending
Account Value
(03/31/23) |
| |
| Expenses
Paid During
the Period |
(a) | | | | | |
| Beginning
Account Value
(10/01/22) |
| |
| Ending
Account Value
(03/31/23) |
| |
| Expenses
Paid During
the Period |
(a) | |
| Annualized
Expense
Ratio |
|
$ | 1,000.00 | | | $ | 1,161.80 | | | $ | 1.08 | | | | | | | $ | 1,000.00 | | | $ | 1,023.93 | | | $ | 1.01 | | | | 0.20 | % |
| (a) | Expenses are equal to the annualized expense ratio, multiplied by the average account value over the period, multiplied by 182/365 (to reflect the one-half year period shown). Other fees, such as brokerage commissions and other fees to financial intermediaries, may be paid which are not reflected in the tables and examples above. See “Disclosure of Expenses” for more information. | |
| | |
| Fund Summary as of March 31, 2023 (continued) | | iShares® S&P 100 ETF |
Portfolio Management Commentary
Mega-capitalization U.S. stocks declined for the reporting period, as high inflation and tighter financial conditions impeded economic growth and weighed on equities. The consumer discretionary sector detracted the most from the Index’s return for the reporting period. While consumer spending continued to grow, rising inflation drove up companies’ costs, and consumers increasingly sought bargains as higher prices eroded personal spending power.
Within the sector, the internet and direct marketing retail industry detracted significantly from the Index’s performance. The sharp rise in e-commerce, which boosted the industry early in the pandemic, waned as more workers returned to the office and brick-and-mortar retailers gained market share. Overbuilding of warehouses during the online shopping surge created excess capacity, which weighed on industry cash flow. Slowing revenue growth from data cloud services further pressured the industry’s profitability. The automobiles industry also declined amid concerns about the market for electric vehicles (“EVs”) in the weakening economy. While EV sales continued to grow, production did not meet analysts’ expectations, and price discounts on some new models negatively impacted revenues. Increased competition from both domestic and international manufacturers also weighed on the industry, as more automakers expanded their EV offerings.
The communication services sector also detracted, as the rising interest rate environment negatively impacted the interactive media and services industry, particularly high-valuation stocks with growth prospects. Demand for online advertisements slowed during the reporting period, as businesses cut back on marketing expenditures in a more challenging economic environment. Stiff competition among companies producing disruptive new artificial intelligence products also pressured the industry.
On the upside, energy sector stocks contributed to the Index’s return. Relatively high average prices of energy commodities following Russia’s invasion of Ukraine supported profitability in the oil, gas, and consumable fuels industry.
Portfolio Information
SECTOR ALLOCATION
| | | | |
Sector | |
| Percent of
Total Investments |
(a) |
Information Technology | | | 31.6 | % |
Health Care | | | 13.4 | |
Financials | | | 12.4 | |
Consumer Discretionary | | | 11.4 | |
Communication Services | | | 11.2 | |
Consumer Staples | | | 7.9 | |
Industrials | | | 5.3 | |
Energy | | | 3.8 | |
Utilities | | | 1.5 | |
Other (each representing less than 1%) | | | 1.5 | |
| (a) | Excludes money market funds. |
TEN LARGEST HOLDINGS
| | | | |
Security | |
| Percent of
Total Investments |
(a) |
Apple Inc. | | | 10.8 | % |
Microsoft Corp. | | | 9.4 | |
Amazon.com, Inc. | | | 4.1 | |
NVIDIA Corp. | | | 3.0 | |
Alphabet, Inc., Class A | | | 2.7 | |
Tesla, Inc. | | | 2.5 | |
Berkshire Hathaway, Inc., Class B | | | 2.4 | |
Alphabet, Inc., Class C, NVS | | | 2.4 | |
Meta Platforms, Inc., Class A | | | 2.1 | |
Exxon Mobil Corp. | | | 2.0 | |
| | |
| 6 | | 2 0 2 3 I S H A R E S A N N U A L R E P O R T T O S H A R E H O L D E R S |
| | |
| Fund Summary as of March 31, 2023 | | iShares® S&P 500 Growth ETF |
Investment Objective
The iShares S&P 500 Growth ETF (the “Fund”) seeks to track the investment results of an index composed of large-capitalization U.S. equities that exhibit growth characteristics, as represented by the S&P 500 Growth Index™ (the “Index”). The Fund invests in a representative sample of securities included in the Index that collectively has an investment profile similar to the Index. Due to the use of representative sampling, the Fund may or may not hold all of the securities that are included in the Index.
Performance
| | | | | | | | | | | | | | | | | | | | | | | | | | | | |
| | | Average Annual Total Returns | | | | | | Cumulative Total Returns | |
| | | | | | | | | | | | |
| | | | | | | |
| | | 1 Year | | | 5 Years | | | 10 Years | | | | | | 1 Year | | | 5 Years | | | 10 Years | |
| | | | | | | |
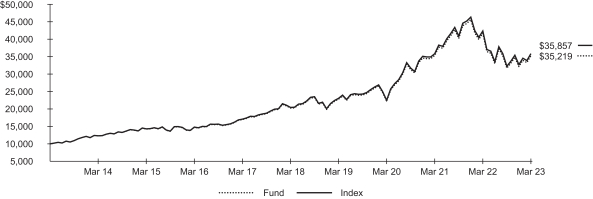
Fund NAV | | | (15.48 | )% | | | 11.70 | % | | | 13.42 | % | | | | | | | (15.48 | )% | | | 73.89 | % | | | 252.19 | % |
| | | | | | | |
Fund Market | | | (15.56 | ) | | | 11.68 | | | | 13.42 | | | | | | | | (15.56 | ) | | | 73.72 | | | | 252.36 | |
| | | | | | | |
Index | | | (15.33 | ) | | | 11.90 | | | | 13.62 | | | | | | | | (15.33 | ) | | | 75.42 | | | | 258.57 | |
GROWTH OF $10,000 INVESTMENT
(AT NET ASSET VALUE)
Past performance is not an indication of future results. Performance results do not reflect the deduction of taxes that a shareholder would pay on fund distributions or the redemption of sale of fund shares. See “About Fund Performance” for more information.
Expense Example
| | | | | | | | | | | | | | | | | | | | | | | | | | | | | | |
| | | |
Actual | | | | | | Hypothetical 5% Return | | | | |
| | | | | | | | | | | | | | |
| | | | | | | |
| Beginning
Account Value
(10/01/22) |
| |
| Ending
Account Value
(03/31/23) |
| |
| Expenses
Paid During
the Period |
(a) | | | | | |
| Beginning
Account Value
(10/01/22) |
| |
| Ending
Account Value
(03/31/23) |
| |
| Expenses
Paid During
the Period |
(a) | |
| Annualized
Expense
Ratio |
|
| | | | | | | |
$ | 1,000.00 | | | $ | 1,111.20 | | | $ | 0.95 | | | | | | | $ | 1,000.00 | | | $ | 1,024.03 | | | $ | 0.91 | | | | 0.18 | % |
| (a) | Expenses are equal to the annualized expense ratio, multiplied by the average account value over the period, multiplied by 182/365 (to reflect the one-half year period shown). Other fees, such as brokerage commissions and other fees to financial intermediaries, may be paid which are not reflected in the tables and examples above. See “Disclosure of Expenses” for more information. | |
| | |
| Fund Summary as of March 31, 2023 (continued) | | iShares® S&P 500 Growth ETF |
Portfolio Management Commentary
Growth-oriented large-capitalization U.S. stocks declined for the reporting period, as high inflation and tighter financial conditions impeded economic growth and weighed on equities. Large-capitalization growth stocks, which derive a significant portion of their price from investors’ expectations of future growth, faced significant headwinds relative to other equities. Growth stocks are particularly sensitive to interest rates, which rose notably as the Fed sharply tightened monetary policy.
The consumer discretionary sector detracted the most from the Index’s return, particularly the internet and direct marketing retail industry. The sharp rise in e-commerce, which boosted the industry early in the pandemic, waned as more workers returned to the office and brick-and-mortar retailers gained market share. Excess warehouse capacity weighed on industry cash flow, and slowing revenue growth from data cloud services pressured profitability. The automobiles industry also declined amid concerns about the market for electric vehicles (“EVs”) in the weakening economy. While EV sales increased, production did not meet analysts expectations.
The information technology sector also detracted significantly from the Index’s return, as sharply higher interest rates reduced the current value of future earnings. Furthermore, increased concerns about economic growth tempered investors’ growth expectations for information technology stocks. The software and services industry declined notably amid high inflation and slow growth, as cuts to corporate information technology budgets reduced revenue growth. Slowing growth in cloud-based software sales further constrained earnings.
The communication services sector also detracted, as the rising interest rate environment negatively impacted the interactive media and services industry, particularly high-valuation stocks with growth prospects. Demand for online advertisements slowed, as businesses cut back on marketing expenditures in a more challenging economic environment. Stiff competition among companies producing disruptive new artificial intelligence products also pressured the industry.
Portfolio Information
| | | | |
|
| SECTOR ALLOCATION | |
| |
| Sector | |
| Percent of
Total Investments |
(a) |
| |
Information Technology | | | 33.9 | % |
| |
Health Care | | | 18.7 | |
| |
Consumer Discretionary | | | 9.8 | |
| |
Financials | | | 7.3 | |
| |
Energy | | | 7.3 | |
| |
Consumer Staples | | | 7.1 | |
| |
Communication Services | | | 7.0 | |
| |
Industrials | | | 5.4 | |
| |
Materials | | | 2.2 | |
| |
Other (each representing less than 1%) | | | 1.3 | |
| | | | |
|
| TEN LARGEST HOLDINGS | |
| |
| Security | |
| Percent of
Total Investments |
(a) |
| |
Apple Inc. | | | 13.4 | % |
| |
Microsoft Corp. | | | 6.8 | |
| |
NVIDIA Corp. | | | 3.7 | |
| |
Alphabet, Inc., Class A | | | 3.4 | |
| |
Tesla, Inc. | | | 3.1 | |
| |
Alphabet, Inc., Class C, NVS | | | 3.0 | |
| |
Exxon Mobil Corp. | | | 2.5 | |
| |
UnitedHealth Group, Inc. | | | 2.4 | |
| |
Amazon.com, Inc. | | | 2.3 | |
| |
Visa, Inc., Class A | | | 2.0 | |
| (a) | Excludes money market funds. | |
| | |
| 8 | | 2 0 2 3 I S H A R E S A N N U A L R E P O R T T O S H A R E H O L D E R S |
| | |
| Fund Summary as of March 31, 2023 | | iShares® S&P 500 Value ETF |
Investment Objective
The iShares S&P 500 Value ETF (the “Fund”) seeks to track the investment results of an index composed of large-capitalization U.S. equities that exhibit value characteristics, as represented by the S&P 500 Value Index™ (the “Index”). The Fund invests in a representative sample of securities included in the Index that collectively has an investment profile similar to the Index. Due to the use of representative sampling, the Fund may or may not hold all of the securities that are included in the Index.
Performance
| | | | | | | | | | | | | | | | | | | | | | | | | | | | |
| | | Average Annual Total Returns | | | | | | Cumulative Total Returns | |
| | | 1 Year | | | 5 Years | | | 10 Years | | | | | | 1 Year | | | 5 Years | | | 10 Years | |
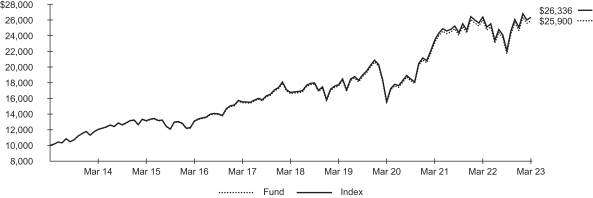
Fund NAV | | | (0.35 | )% | | | 9.29 | % | | | 9.98 | % | | | | | | | (0.35 | )% | | | 55.90 | % | | | 159.00 | % |
Fund Market | | | (0.43 | ) | | | 9.28 | | | | 9.99 | | | | | | | | (0.43 | ) | | | 55.87 | | | | 159.15 | |
Index | | | (0.16 | ) | | | 9.47 | | | | 10.17 | | | | | | | | (0.16 | ) | | | 57.19 | | | | 163.36 | |
GROWTH OF $10,000 INVESTMENT
(AT NET ASSET VALUE)
Past performance is not an indication of future results. Performance results do not reflect the deduction of taxes that a shareholder would pay on fund distributions or the redemption of sale of fund shares. See “About Fund Performance” for more information.
Expense Example
| | | | | | | | | | | | | | | | | | | | | | | | | | | | | | |
Actual | | | | | | Hypothetical 5% Return | | | | |
| | | | | | | | | | | | | | |
| Beginning
Account Value
(10/01/22) |
| |
| Ending
Account Value
(03/31/23) |
| |
| Expenses
Paid During
the Period |
(a) | | | | | |
| Beginning
Account Value
(10/01/22) |
| |
| Ending
Account Value
(03/31/23) |
| |
| Expenses
Paid During
the Period |
(a) | |
| Annualized
Expense
Ratio |
|
$ | 1,000.00 | | | $ | 1,193.70 | | | $ | 0.98 | | | | | | | $ | 1,000.00 | | | $ | 1,024.03 | | | $ | 0.91 | | | | 0.18 | % |
| (a) | Expenses are equal to the annualized expense ratio, multiplied by the average account value over the period, multiplied by 182/365 (to reflect the one-half year period shown). Other fees, such as brokerage commissions and other fees to financial intermediaries, may be paid which are not reflected in the tables and examples above. See “Disclosure of Expenses” for more information. | |
| | |
| Fund Summary as of March 31, 2023 (continued) | | iShares® S&P 500 Value ETF |
Portfolio Management Commentary
Value-oriented large-capitalization U.S. stocks declined marginally for the reporting period, as high inflation and tighter financial conditions impeded economic growth and weighed on equities. The financials sector detracted the most from the Index’s performance amid tightening financial conditions. The banking industry faced significant challenges, as the potential impact of a slowing economy outweighed the benefits of being able to charge more for loans. As the Fed raised interest rates to fight persistently high inflation, investors became concerned about the long-term effect on loan growth and credit losses. Bank stocks were further pressured late in the reporting period after the sudden failure of two regional banks. The financial services industry also faced headwinds, as inflationary pressure and high interest rates reduced the value of many of the industry’s equity holdings. The impact of a large hurricane in 2022 further dented earnings in the industry.
The real estate sector also detracted significantly from the Index’s return, as higher interest rates weighed on the equity real estate investment trusts (“REITs”) industry. REITs typically take on substantial debt in order to finance the purchase of the properties they manage, and higher interest rates make financing more expensive.
On the upside, stocks in the energy sector contributed to the Index’s return despite lower oil prices and a sharp decline in the price of natural gas. The price of oil and natural gas surged in the aftermath of Russia’s invasion of Ukraine. While prices subsequently fell as markets stabilized, the relatively high average prices of energy commodities supported profitability in the oil, gas, and consumable fuels industry. The information technology and consumer discretionary sectors also contributed, as a software company and an internet retailer were added to the Index upon rebalancing in December 2022 and advanced thereafter.
Portfolio Information
SECTOR ALLOCATION
| | | | |
Sector | |
| Percent of
Total Investments |
(a) |
Financials | | | 19.3 | % |
Information Technology | | | 17.2 | |
Industrials | | | 12.3 | |
Consumer Discretionary | | | 10.5 | |
Communication Services | | | 9.4 | |
Health Care | | | 9.1 | |
Consumer Staples | | | 7.4 | |
Utilities | | | 5.5 | |
Real Estate | | | 4.6 | |
Materials | | | 3.1 | |
Energy | | | 1.6 | |
| (a) | Excludes money market funds. | |
TEN LARGEST HOLDINGS
| | | | |
Security | |
| Percent of
Total Investments |
(a) |
Microsoft Corp. | | | 5.6 | % |
Berkshire Hathaway, Inc., Class B | | | 3.5 | |
Amazon.com, Inc. | | | 3.1 | |
Meta Platforms, Inc., Class A | | | 2.9 | |
JPMorgan Chase & Co. | | | 2.4 | |
Cisco Systems, Inc. | | | 1.3 | |
Walmart, Inc. | | | 1.3 | |
Salesforce, Inc. | | | 1.2 | |
Bank of America Corp. | | | 1.2 | |
Walt Disney Co. | | | 1.1 | |
| | |
| 10 | | 2 0 2 3 I S H A R E S A N N U A L R E P O R T T O S H A R E H O L D E R S |
| | |
| Fund Summary as of March 31, 2023 | | iShares® S&P Small-Cap 600 Value ETF |
Investment Objective
The iShares S&P Small-Cap 600 Value ETF (the “Fund”) seeks to track the investment results of an index composed of small-capitalization U.S. equities that exhibit value characteristics, as represented by the S&P SmallCap 600 Value Index™ (the “Index”). The Fund invests in a representative sample of securities included in the Index that collectively has an investment profile similar to the Index. Due to the use of representative sampling, the Fund may or may not hold all of the securities that are included in the Index.
Performance
| | | | | | | | | | | | | | | | | | | | | | | | | | | | |
| | | Average Annual Total Returns | | | | | | Cumulative Total Returns | |
| | | | | | | |
| | | 1 Year | | | 5 Years | | | 10 Years | | | | | | 1 Year | | | 5 Years | | | 10 Years | |
| | | | | | | |
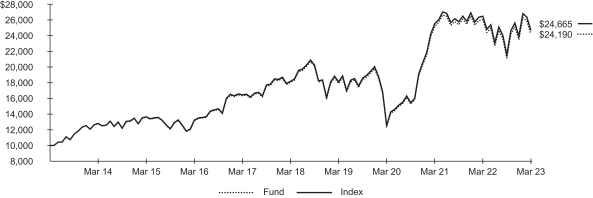
Fund NAV | | | (7.08 | )% | | | 6.05 | % | | | 9.24 | % | | | | | | | (7.08 | )% | | | 34.13 | % | | | 141.90 | % |
| | | | | | | |
Fund Market | | | (7.17 | ) | | | 6.04 | | | | 9.23 | | | | | | | | (7.17 | ) | | | 34.08 | | | | 141.73 | |
| | | | | | | |
Index | | | (6.81 | ) | | | 6.30 | | | | 9.45 | | | | | | | | (6.81 | ) | | | 35.70 | | | | 146.65 | |
GROWTH OF $10,000 INVESTMENT
(AT NET ASSET VALUE)
Past performance is not an indication of future results. Performance results do not reflect the deduction of taxes that a shareholder would pay on fund distributions or on the redemption or sale of fund shares. See “About Fund Performance” for more information.
Expense Example
| | | | | | | | | | | | | | | | | | | | | | | | | | | | | | |
Actual | | | | | | Hypothetical 5% Return | | | | |
| Beginning
Account Value
(10/01/22) |
| |
| Ending
Account Value
(03/31/23) |
| |
| Expenses
Paid During
the Period |
(a) | | | | | |
| Beginning
Account Value
(10/01/22) |
| |
| Ending
Account Value
(03/31/23) |
| |
| Expenses
Paid During
the Period |
(a) | |
| Annualized
Expense
Ratio |
|
$ | 1,000.00 | | | $ | 1,143.80 | | | $ | 0.96 | | | | | | | $ | 1,000.00 | | | $ | 1,024.03 | | | $ | 0.91 | | | | 0.18 | % |
| (a) | Expenses are equal to the annualized expense ratio, multiplied by the average account value over the period, multiplied by 182/365 (to reflect the one-half year period shown). Other fees, such as brokerage commissions and other fees to financial intermediaries, may be paid which are not reflected in the tables and examples above. See “Disclosure of Expenses” for more information. | |
| | |
| Fund Summary as of March 31, 2023 (continued) | | iShares® S&P Small-Cap 600 Value ETF |
Portfolio Management Commentary
Value-oriented small-capitalization U.S. stocks declined for the reporting period, as high inflation and tighter financial conditions impeded economic growth and weighed on equities. The financials sector detracted the most from the Index’s performance amid tightening financial conditions. The banking industry faced significant challenges, as the potential impact of a slowing economy outweighed the benefits of being able to charge more for loans. While bank profitability is typically supported by higher interest rates, persistently high inflation led to significant tightening from the Fed, and investors became concerned about the long-term effect of this tightening on loan growth and credit losses. Bank stocks were further pressured late in the reporting period after the sudden failure of two regional banks led to government intervention to cover depositors and prevent a contagion effect. Despite government actions to contain the impact, these bank failures weighed heavily on the industry, as markets digested the long-term implications of the disruption.
The real estate sector detracted significantly from the Index’s return, as higher interest rates and changing usage patterns weighed on equity real estate investment trusts (“REITs”). REITs typically take on substantial debt to finance the purchase of the properties they manage, and higher interest rates make financing more expensive. Furthermore, higher interest rates also meant increased bond yields, making dividend yields from REITs comparatively less attractive to income-oriented investors. An ongoing oversupply of office space due to the shift toward remote work and more stringent lending standards after the failure of two prominent banks late in the reporting period negatively affected office REITs.
On the upside, industrials stocks contributed to the Index’s return. The capital goods industry benefited from government incentives that encouraged investments in additional industrial capacity.
Portfolio Information
SECTOR ALLOCATION
| | | | |
| | |
Sector | |
| Percent of
Total Investments |
(a) |
Consumer Discretionary | | | 19.8 | % |
Financials | | | 16.7 | |
Industrials | | | 16.3 | |
Real Estate | | | 11.3 | |
Information Technology | | | 8.8 | |
Health Care | | | 8.8 | |
Materials | | | 5.4 | |
Consumer Staples | | | 4.4 | |
Energy | | | 3.7 | |
Communication Services | | | 3.0 | |
Utilities | | | 1.8 | |
(a) Excludes money market funds.
TEN LARGEST HOLDINGS
| | | | |
| | |
Security | |
| Percent of
Total Investments |
(a) |
Insight Enterprises, Inc. | | | 1.0 | % |
Meritage Homes Corp. | | | 1.0 | |
Essential Properties Realty Trust, Inc. | | | 0.8 | |
Signet Jewelers Ltd. | | | 0.8 | |
John Bean Technologies Corp. | | | 0.8 | |
Group 1 Automotive, Inc. | | | 0.7 | |
Rogers Corp. | | | 0.7 | |
ABM Industries, Inc. | | | 0.7 | |
LXP Industrial Trust | | | 0.6 | |
Avista Corp. | | | 0.6 | |
| | |
| 12 | | 2 0 2 3 I S H A R E S A N N U A L R E P O R T T O S H A R E H O L D E R S |
About Fund Performance
Past performance is not an indication of future results. Financial markets have experienced extreme volatility and trading in many instruments has been disrupted. These circumstances may continue for an extended period of time and may continue to affect adversely the value and liquidity of each Fund’s investments. As a result, current performance may be lower or higher than the performance data quoted. Performance data current to the most recent month-end is available at iShares.com. Performance results assume reinvestment of all dividends and capital gain distributions and do not reflect the deduction of taxes that a shareholder would pay on fund distributions or on the redemption or sale of fund shares. The investment return and principal value of shares will vary with changes in market conditions. Shares may be worth more or less than their original cost when they are redeemed or sold in the market. Performance for certain funds may reflect a waiver of a portion of investment advisory fees. Without such a waiver, performance would have been lower.
Net asset value or “NAV” is the value of one share of a fund as calculated in accordance with the standard formula for valuing mutual fund shares. Beginning August 10, 2020, the price used to calculate market return (“Market Price”) is the closing price. Prior to August 10, 2020, Market Price was determined using the midpoint between the highest bid and the lowest ask on the primary stock exchange on which shares of a fund are listed for trading, as of the time that such fund’s NAV is calculated. Market and NAV returns assume that dividends and capital gain distributions have been reinvested at Market Price and NAV, respectively.
An index is a statistical composite that tracks a specified financial market or sector. Unlike a fund, an index does not actually hold a portfolio of securities and therefore does not incur the expenses incurred by a fund. These expenses negatively impact fund performance. Also, market returns do not include brokerage commissions that may be payable on secondary market transactions. If brokerage commissions were included, market returns would be lower.
Disclosure of Expenses
Shareholders of each Fund may incur the following charges: (1) transactional expenses, including brokerage commissions on purchases and sales of fund shares and (2) ongoing expenses, including management fees and other fund expenses. The expense examples shown (which are based on a hypothetical investment of $1,000 invested at the beginning of the period and held through the end of the period) are intended to assist shareholders both in calculating expenses based on an investment in each Fund and in comparing these expenses with similar costs of investing in other funds.
The expense examples provide information about actual account values and actual expenses. Annualized expense ratios reflect contractual and voluntary fee waivers, if any. In order to estimate the expenses a shareholder paid during the period covered by this report, shareholders can divide their account value by $1,000 and then multiply the result by the number under the heading entitled “Expenses Paid During the Period.”
The expense examples also provide information about hypothetical account values and hypothetical expenses based on a fund’s actual expense ratio and an assumed rate of return of 5% per year before expenses. In order to assist shareholders in comparing the ongoing expenses of investing in the Funds and other funds, compare the 5% hypothetical examples with the 5% hypothetical examples that appear in the shareholder reports of the other funds.
The expenses shown in the expense examples are intended to highlight shareholders’ ongoing costs only and do not reflect any transactional expenses, such as brokerage commissions and other fees paid on purchases and sales of fund shares. Therefore, the hypothetical examples are useful in comparing ongoing expenses only and will not help shareholders determine the relative total expenses of owning different funds. If these transactional expenses were included, shareholder expenses would have been higher.
| | |
A B O U T F U N D P E R F O R M A N C E / D I S C L O S U R E O F E X P E N S E S | | 13 |
| | |
Schedule of Investments March 31, 2023 | | iShares® S&P 100 ETF (Percentages shown are based on Net Assets) |
| | | | | | | | |
| Security | | Shares | | | Value | |
|
Common Stocks | |
|
| Aerospace & Defense — 1.8% | |
Boeing Co.(a) | | | 186,200 | | | $ | 39,554,466 | |
General Dynamics Corp. | | | 74,510 | | | | 17,003,927 | |
Lockheed Martin Corp. | | | 75,232 | | | | 35,564,423 | |
Raytheon Technologies Corp. | | | 485,063 | | | | 47,502,220 | |
| | | | | | | | |
| | | | | | | 139,625,036 | |
|
| Air Freight & Logistics — 0.9% | |
FedEx Corp. | | | 76,790 | | | | 17,545,747 | |
United Parcel Service, Inc., Class B | | | 241,653 | | | | 46,878,266 | |
| | | | | | | | |
| | | | | | | 64,424,013 | |
|
| Automobiles — 2.9% | |
Ford Motor Co. | | | 1,296,398 | | | | 16,334,615 | |
General Motors Co. | | | 461,124 | | | | 16,914,028 | |
Tesla, Inc.(a) | | | 890,519 | | | | 184,747,072 | |
| | | | | | | | |
| | | | | | | 217,995,715 | |
|
| Banks — 3.8% | |
Bank of America Corp. | | | 2,310,994 | | | | 66,094,428 | |
Citigroup, Inc. | | | 641,314 | | | | 30,071,213 | |
JPMorgan Chase & Co. | | | 971,217 | | | | 126,559,287 | |
U.S. Bancorp | | | 460,756 | | | | 16,610,254 | |
Wells Fargo & Co. | | | 1,261,696 | | | | 47,162,197 | |
| | | | | | | | |
| | | | | | | 286,497,379 | |
|
| Beverages — 2.2% | |
Coca-Cola Co. | | | 1,288,705 | | | | 79,938,371 | |
PepsiCo, Inc. | | | 456,023 | | | | 83,132,993 | |
| | | | | | | | |
| | | | | | | 163,071,364 | |
|
| Biotechnology — 2.3% | |
AbbVie, Inc. | | | 585,563 | | | | 93,321,175 | |
Amgen, Inc. | | | 176,805 | | | | 42,742,609 | |
Gilead Sciences, Inc. | | | 412,896 | | | | 34,257,981 | |
| | | | | | | | |
| | | | | | | 170,321,765 | |
|
| Broadline Retail — 4.0% | |
Amazon.com, Inc.(a) | | | 2,951,894 | | | | 304,901,131 | |
| | | | | | | | |
|
| Capital Markets — 1.9% | |
Bank of New York Mellon Corp. | | | 244,295 | | | | 11,100,765 | |
BlackRock, Inc.(b) | | | 49,586 | | | | 33,178,984 | |
Charles Schwab Corp. | | | 505,047 | | | | 26,454,362 | |
Goldman Sachs Group, Inc. | | | 112,127 | | | | 36,677,863 | |
Morgan Stanley | | | 432,596 | | | | 37,981,929 | |
| | | | | | | | |
| | | | | | | 145,393,903 | |
|
| Chemicals — 0.9% | |
Dow, Inc. | | | 233,278 | | | | 12,788,300 | |
Linde PLC | | | 163,083 | | | | 57,966,221 | |
| | | | | | | | |
| | | | | | | 70,754,521 | |
|
| Communications Equipment — 0.9% | |
Cisco Systems, Inc. | | | 1,360,238 | | | | 71,106,441 | |
| | | | | | | | |
|
| Consumer Finance — 0.6% | |
American Express Co. | | | 197,129 | | | | 32,516,429 | |
Capital One Financial Corp. | | | 126,482 | | | | 12,162,509 | |
| | | | | | | | |
| | | | | | | 44,678,938 | |
|
| Consumer Staples Distribution & Retail — 2.3% | |
Costco Wholesale Corp. | | | 146,923 | | | | 73,001,631 | |
Target Corp. | | | 152,415 | | | | 25,244,496 | |
Walgreens Boots Alliance, Inc. | | | 237,624 | | | | 8,217,038 | |
Walmart, Inc. | | | 464,329 | | | | 68,465,311 | |
| | | | | | | | |
| | | | | | | 174,928,476 | |
| | | | | | | | |
| Security | | Shares | | | Value | |
|
| Diversified Telecommunication Services — 1.3% | |
AT&T Inc. | | | 2,360,159 | | | $ | 45,433,061 | |
Verizon Communications, Inc. | | | 1,390,627 | | | | 54,081,484 | |
| | | | | | | | |
| | | | | | | 99,514,545 | |
|
| Electric Utilities — 1.5% | |
Duke Energy Corp. | | | 254,955 | | | | 24,595,509 | |
Exelon Corp. | | | 329,359 | | | | 13,796,848 | |
NextEra Energy, Inc. | | | 657,972 | | | | 50,716,482 | |
Southern Co. | | | 360,472 | | | | 25,081,642 | |
| | | | | | | | |
| | | | | | | 114,190,481 | |
|
| Electrical Equipment — 0.2% | |
Emerson Electric Co. | | | 188,915 | | | | 16,462,053 | |
| | | | | | | | |
|
| Entertainment — 1.5% | |
Netflix, Inc.(a) | | | 147,460 | | | | 50,944,481 | |
Walt Disney Co.(a) | | | 604,876 | | | | 60,566,234 | |
| | | | | | | | |
| | | | | | | 111,510,715 | |
|
| Financial Services — 5.8% | |
Berkshire Hathaway, Inc., Class B(a) | | | 596,569 | | | | 184,202,610 | |
Mastercard, Inc., Class A | | | 279,366 | | | | 101,524,398 | |
PayPal Holdings, Inc.(a) | | | 374,609 | | | | 28,447,808 | |
Visa, Inc., Class A | | | 538,040 | | | | 121,306,498 | |
| | | | | | | | |
| | | | | | | 435,481,314 | |
|
| Food Products — 0.6% | |
Kraft Heinz Co. | | | 264,650 | | | | 10,234,015 | |
Mondelez International, Inc., Class A | | | 450,990 | | | | 31,443,023 | |
| | | | | | | | |
| | | | | | | 41,677,038 | |
|
| Ground Transportation — 0.5% | |
Union Pacific Corp. | | | 202,598 | | | | 40,774,873 | |
| | | | | | | | |
|
| Health Care Equipment & Supplies — 1.2% | |
Abbott Laboratories | | | 577,316 | | | | 58,459,018 | |
Medtronic PLC | | | 440,438 | | | | 35,508,112 | |
| | | | | | | | |
| | | | | | | 93,967,130 | |
|
| Health Care Providers & Services — 2.4% | |
CVS Health Corp. | | | 425,183 | | | | 31,595,349 | |
UnitedHealth Group, Inc. | | | 309,372 | | | | 146,206,113 | |
| | | | | | | | |
| | | | | | | 177,801,462 | |
|
| Hotels, Restaurants & Leisure — 1.9% | |
Booking Holdings, Inc.(a) | | | 12,843 | | | | 34,064,902 | |
McDonald’s Corp. | | | 242,515 | | | | 67,809,619 | |
Starbucks Corp. | | | 380,546 | | | | 39,626,255 | |
| | | | | | | | |
| | | | | | | 141,500,776 | |
|
| Household Products — 1.8% | |
Colgate-Palmolive Co. | | | 276,386 | | | | 20,770,408 | |
Procter & Gamble Co. | | | 781,139 | | | | 116,147,558 | |
| | | | | | | | |
| | | | | | | 136,917,966 | |
|
| Industrial Conglomerates — 1.3% | |
3M Co. | | | 182,545 | | | | 19,187,305 | |
General Electric Co. | | | 360,676 | | | | 34,480,626 | |
Honeywell International, Inc. | | | 221,229 | | | | 42,281,286 | |
| | | | | | | | |
| | | | | | | 95,949,217 | |
|
| Insurance — 0.3% | |
American International Group, Inc. | | | 246,147 | | | | 12,395,963 | |
MetLife, Inc. | | | 218,299 | | | | 12,648,244 | |
| | | | | | | | |
| | | | | | | 25,044,207 | |
|
| Interactive Media & Services — 7.1% | |
Alphabet, Inc., Class A(a) | | | 1,972,098 | | | | 204,565,726 | |
| | |
| 14 | | 2 0 2 3 I S H A R E S A N N U A L R E P O R T T O S H A R E H O L D E R S |
| | |
Schedule of Investments (continued) March 31, 2023 | | iShares® S&P 100 ETF (Percentages shown are based on Net Assets) |
| | | | | | | | |
| Security | | Shares | | | Value | |
|
| Interactive Media & Services (continued) | |
Alphabet, Inc., Class C, NVS(a) | | | 1,719,182 | | | $ | 178,794,928 | |
Meta Platforms, Inc., Class A(a) | | | 736,975 | | | | 156,194,481 | |
| | | | | | | | |
| | | | | | | 539,555,135 | |
|
| IT Services — 1.3% | |
Accenture PLC, Class A | | | 208,514 | | | | 59,595,386 | |
International Business Machines Corp. | | | 299,366 | | | | 39,243,889 | |
| | | | | | | | |
| | | | | | | 98,839,275 | |
|
| Life Sciences Tools & Services — 1.7% | |
Danaher Corp. | | | 217,033 | | | | 54,700,997 | |
Thermo Fisher Scientific, Inc. | | | 129,861 | | | | 74,847,985 | |
| | | | | | | | |
| | | | | | | 129,548,982 | |
|
| Machinery — 0.5% | |
Caterpillar, Inc. | | | 172,314 | | | | 39,432,336 | |
| | | | | | | | |
|
| Media — 0.9% | |
Charter Communications, Inc., Class A(a) | | | 34,985 | | | | 12,510,986 | |
Comcast Corp., Class A | | | 1,392,857 | | | | 52,803,209 | |
| | | | | | | | |
| | | | | | | 65,314,195 | |
|
| Oil, Gas & Consumable Fuels — 3.8% | |
Chevron Corp. | | | 589,030 | | | | 96,106,135 | |
ConocoPhillips | | | 405,232 | | | | 40,203,066 | |
Exxon Mobil Corp. | | | 1,363,515 | | | | 149,523,055 | |
| | | | | | | | |
| | | | | | | 285,832,256 | |
|
| Pharmaceuticals — 5.8% | |
Bristol-Myers Squibb Co. | | | 703,995 | | | | 48,793,893 | |
Eli Lilly & Co. | | | 261,129 | | | | 89,676,921 | |
Johnson & Johnson | | | 865,685 | | | | 134,181,175 | |
Merck & Co., Inc. | | | 839,499 | | | | 89,314,299 | |
Pfizer, Inc. | | | 1,858,632 | | | | 75,832,186 | |
| | | | | | | | |
| | | | | | | 437,798,474 | |
|
| Retail REITs — 0.2% | |
Simon Property Group, Inc. | | | 107,983 | | | | 12,090,857 | |
| | | | | | | | |
|
| Semiconductors & Semiconductor Equipment — 6.8% | |
Advanced Micro Devices, Inc.(a) | | | 533,868 | | | | 52,324,403 | |
Broadcom, Inc. | | | 138,367 | | | | 88,767,965 | |
Intel Corp. | | | 1,369,806 | | | | 44,751,562 | |
NVIDIA Corp. | | | 814,534 | | | | 226,253,109 | |
QUALCOMM, Inc. | | | 369,189 | | | | 47,101,133 | |
Texas Instruments, Inc. | | | 300,055 | | | | 55,813,230 | |
| | | | | | | | |
| | | | | | | 515,011,402 | |
|
| Software — 11.7% | |
Adobe, Inc.(a) | | | 151,584 | | | | 58,415,926 | |
| | | | | | | | |
| Security | | Shares | | | Value | |
|
| Software (continued) | |
Microsoft Corp. | | | 2,464,726 | | | $ | 710,580,506 | |
Oracle Corp. | | | 508,872 | | | | 47,284,386 | |
Salesforce, Inc.(a) | | | 331,110 | | | | 66,149,156 | |
| | | | | | | | |
| | | | | | | 882,429,974 | |
|
| Specialized REITs — 0.4% | |
American Tower Corp. | | | 154,167 | | | | 31,502,485 | |
| | | | | | | | |
|
| Specialty Retail — 1.8% | |
Home Depot, Inc. | | | 337,463 | | | | 99,592,081 | |
Lowe’s Cos., Inc. | | | 200,224 | | | | 40,038,793 | |
| | | | | | | | |
| | | | | | | 139,630,874 | |
|
| Technology Hardware, Storage & Peripherals — 10.8% | |
Apple Inc. | | | 4,924,493 | | | | 812,048,896 | |
| | | | | | | | |
|
| Textiles, Apparel & Luxury Goods — 0.7% | |
NIKE, Inc., Class B | | | 412,453 | | | | 50,583,236 | |
| | | | | | | | |
|
| Tobacco — 1.0% | |
Altria Group, Inc. | | | 591,210 | | | | 26,379,790 | |
Philip Morris International, Inc. | | | 513,299 | | | | 49,918,328 | |
| | | | | | | | |
| | | | | | | 76,298,118 | |
|
| Wireless Telecommunication Services — 0.4% | |
T-Mobile U.S., Inc.(a) | | | 196,117 | | | | 28,405,586 | |
| | | | | | | | |
| | |
Total Long-Term Investments — 99.7%
(Cost: $6,642,321,886) | | | | | | | 7,528,812,540 | |
| | | | | | | | |
| | |
| Short-Term Securities | | | | | | |
| | |
| Money Market Funds — 0.2% | | | | | | |
BlackRock Cash Funds: Treasury, SL Agency Shares, 4.73%(b)(c)(d) | | | 14,929,868 | | | | 14,929,868 | |
| | | | | | | | |
| | |
Total Short-Term Securities — 0.2%
(Cost: $14,929,868) | | | | | 14,929,868 | |
| | | | | | | | |
| | |
Total Investments — 99.9%
(Cost: $6,657,251,754) | | | | | 7,543,742,408 | |
Other Assets Less Liabilities — 0.1% | | | | | | | 4,285,132 | |
| | | | | | | | |
Net Assets — 100.0% | | | | | | $ | 7,548,027,540 | |
| | | | | | | | |
| (a) | Non-income producing security. |
| (b) | Affiliate of the Fund. |
| (c) | Annualized 7-day yield as of period end. |
| (d) | All or a portion of this security was purchased with the cash collateral from loaned securities. |
| | |
S C H E D U L E S O F I N V E S T M E N T S | | 15 |
| | |
Schedule of Investments (continued) March 31, 2023 | | iShares® S&P 100 ETF |
Affiliates
Investments in issuers considered to be affiliate(s) of the Fund during the year ended March 31, 2023 for purposes of Section 2(a)(3) of the Investment Company Act of 1940, as amended, were as follows:
| | | | | | | | | | | | | | | | | | | | | | | | | | | | | | | | | | | | |
Affiliated Issuer | | Value at
03/31/22 | | | Purchases
at Cost | | | Proceeds from Sale | | | Net
Realized
Gain (Loss) | | | Change in
Unrealized
Appreciation
(Depreciation) | | | Value at
03/31/23 | | | Shares
Held at
03/31/23 | | | Income | | | Capital Gain
Distributions
from Underlying
Funds | |
BlackRock Cash Funds: Institutional, SL Agency Shares(a) | | $ | 9,415,762 | | | $ | — | | | $ | (9,448,345 | )(b) | | $ | 32,574 | | | $ | 9 | | | $ | — | | | | — | | | $ | 133,167 | (c) | | $ | — | |
BlackRock Cash Funds: Treasury, SL Agency Shares | | | 16,943,000 | | | | — | | | | (2,013,132 | )(b) | | | — | | | | — | | | | 14,929,868 | | | | 14,929,868 | | | | 471,122 | | | | 10 | |
BlackRock, Inc. | | | 37,188,333 | | | | 7,561,373 | | | | (7,250,310 | ) | | | 2,166,228 | | | | (6,486,640 | ) | | | 33,178,984 | | | | 49,586 | | | | 497,404 | | | | — | |
| | | | | | | | | | | | | | | | | | | | | | | | | | | | | | | | | | | | |
| | | | | | | | | | | | | | $ | 2,198,802 | | | $ | (6,486,631 | ) | | $ | 48,108,852 | | | | | | | $ | 1,101,693 | | | $ | 10 | |
| | | | | | | | | | | | | | | | | | | | | | | | | | | | | | | | | | | | |
| | (a) | As of period end, the entity is no longer held. | |
| | (b) | Represents net amount purchased (sold). | |
| | (c) | All or a portion represents securities lending income earned from the reinvestment of cash collateral from loaned securities, net of fees and collateral investment expenses, and other payments to and from borrowers of securities. | |
Derivative Financial Instruments Outstanding as of Period End
Futures Contracts
| | | | | | | | | | | | | | | | |
| |
Description | | Number of
Contracts | | | Expiration
Date | | | Notional
Amount
(000) | | | Value/
Unrealized
Appreciation
(Depreciation) | |
| |
Long Contracts | | | | | | | | | | | | | | | | |
S&P 500 E-mini Index | | | 92 | | | | 06/16/23 | | | $ | 19,034 | | | $ | 1,013,158 | |
| | | | | | | | | | | | | | | | |
Derivative Financial Instruments Categorized by Risk Exposure
As of period end, the fair values of derivative financial instruments located in the Statements of Assets and Liabilities were as follows:
| | | | | | | | | | | | | | | | | | | | | | | | | | | | |
| |
| | | Commodity
Contracts | | | Credit
Contracts | | | Equity
Contracts | | | Foreign
Currency
Exchange
Contracts | | | Interest
Rate
Contracts | | | Other
Contracts | | | Total | |
| |
Assets — Derivative Financial Instruments | | | | | | | | | | | | | | | | | | | | | | | | | | | | |
Futures contracts | | | | | | | | | | | | | | | | | | | | | | | | | | | | |
Unrealized appreciation on futures contracts(a) | | $ | — | | | $ | — | | | $ | 1,013,158 | | | $ | — | | | $ | — | | | $ | — | | | $ | 1,013,158 | |
| | | | | | | | | | | | | | | | | | | | | | | | | | | | |
| | (a) | Net cumulative unrealized appreciation (depreciation) on futures contracts, if any, are reported in the Schedule of Investments. In the Statements of Assets and Liabilities, only current day’s variation margin is reported in receivables or payables and the net cumulative unrealized appreciation (depreciation) is included in accumulated earnings (loss). | |
For the period ended March 31, 2023, the effect of derivative financial instruments in the Statements of Operations was as follows:
| | | | | | | | | | | | | | | | | | | | | | | | | | | | |
| |
| | | Commodity
Contracts | | | Credit
Contracts | | | Equity
Contracts | | | Foreign
Currency
Exchange
Contracts | | | Interest
Rate
Contracts | | | Other
Contracts | | | Total | |
| |
Net Realized Gain (Loss) from | | | | | | | | | | | | | | | | | | | | | | | | | | | | |
Futures contracts | | $ | — | | | $ | — | | | $ | (1,457,413 | ) | | $ | — | | | $ | — | | | $ | — | | | $ | (1,457,413 | ) |
| | | | | | | | | | | | | | | | | | | | | | | | | | | | |
| | | | | | | |
Net Change in Unrealized Appreciation (Depreciation) on | | | | | | | | | | | | | | | | | | | | | | | | | | | | |
Futures contracts | | $ | — | | | $ | — | | | $ | (112,487 | ) | | $ | — | | | $ | — | | | $ | — | | | $ | (112,487 | ) |
| | | | | | | | | | | | | | | | | | | | | | | | | | | | |
| | |
| 16 | | 2 0 2 3 I S H A R E S A N N U A L R E P O R T T O S H A R E H O L D E R S |
| | |
Schedule of Investments (continued) March 31, 2023 | | iShares® S&P 100 ETF |
Average Quarterly Balances of Outstanding Derivative Financial Instruments
| | | | | | | | |
| | | |
Futures contracts | | | | | | | | |
| | |
Average notional value of contracts — long | | | | | | $ | 19,070,550 | |
For more information about the Fund’s investment risks regarding derivative financial instruments, refer to the Notes to Financial Statements.
Fair Value Hierarchy as of Period End
Various inputs are used in determining the fair value of financial instruments. For a description of the input levels and information about the Fund’s policy regarding valuation of financial instruments, refer to the Notes to Financial Statements.
The following table summarizes the Fund’s financial instruments categorized in the fair value hierarchy. The breakdown of the Fund’s financial instruments into major categories is disclosed in the Schedule of Investments above.
| | | | | | | | | | | | | | | | |
| | | Level 1 | | | Level 2 | | | Level 3 | | | Total | |
Assets | | | | | | | | | | | | | | | | |
Investments | | | | | | | | | | | | | | | | |
Long-Term Investments | | | | | | | | | | | | | | | | |
Common Stocks | | $ | 7,528,812,540 | | | $ | — | | | $ | — | | | $ | 7,528,812,540 | |
Short-Term Securities | | | | | | | | | | | | | | | | |
Money Market Funds | | | 14,929,868 | | | | — | | | | — | | | | 14,929,868 | |
| | | | | | | | | | | | | | | | |
| | $ | 7,543,742,408 | | | $ | — | | | $ | — | | | $ | 7,543,742,408 | |
| | | | | | | | | | | | | | | | |
Derivative Financial Instruments(a) | | | | | | | | | | | | | | | | |
Assets | | | | | | | | | | | | | | | | |
Equity Contracts | | $ | 1,013,158 | | | $ | — | | | $ | — | | | $ | 1,013,158 | |
| | | | | | | | | | | | | | | | |
| (a) | Derivative financial instruments are futures contracts. Futures contracts are valued at the unrealized appreciation (depreciation) on the instrument. | |
See notes to financial statements.
| | |
S C H E D U L E S O F I N V E S T M E N T S | | 17 |
| | |
Schedule of Investments March 31, 2023 | | iShares® S&P 500 Growth ETF (Percentages shown are based on Net Assets) |
| | | | | | | | |
| Security | | Shares | | | Value | |
|
Common Stocks | |
|
| Aerospace & Defense — 1.0% | |
General Dynamics Corp. | | | 196,450 | | | $ | 44,831,854 | |
L3Harris Technologies, Inc. | | | 156,703 | | | | 30,751,397 | |
Lockheed Martin Corp. | | | 265,930 | | | | 125,713,089 | |
Northrop Grumman Corp. | | | 170,732 | | | | 78,830,379 | |
TransDigm Group, Inc. | | | 40,094 | | | | 29,551,283 | |
| | | | | | | | |
| | | | | | | 309,678,002 | |
|
| Air Freight & Logistics — 0.1% | |
CH Robinson Worldwide, Inc. | | | 104,022 | | | | 10,336,666 | |
Expeditors International of Washington, Inc. | | | 262,202 | | | | 28,873,684 | |
| | | | | | | | |
| | | | | | | 39,210,350 | |
|
| Automobiles — 3.0% | |
Tesla, Inc.(a) | | | 4,433,837 | | | | 919,843,824 | |
| | | | | | | | |
|
| Beverages — 2.7% | |
Brown-Forman Corp., Class B, NVS | | | 164,649 | | | | 10,581,991 | |
Coca-Cola Co. | | | 4,170,633 | | | | 258,704,365 | |
Constellation Brands, Inc., Class A | | | 149,685 | | | | 33,812,345 | |
Keurig Dr Pepper, Inc. | | | 700,791 | | | | 24,723,906 | |
Monster Beverage Corp.(a) | | | 1,258,178 | | | | 67,954,194 | |
PepsiCo, Inc. | | | 2,270,549 | | | | 413,921,083 | |
| | | | | | | | |
| | | | | | | 809,697,884 | |
|
| Biotechnology — 4.2% | |
AbbVie, Inc. | | | 2,915,476 | | | | 464,639,410 | |
Amgen, Inc. | | | 880,262 | | | | 212,803,339 | |
Biogen, Inc.(a) | | | 111,439 | | | | 30,983,385 | |
Gilead Sciences, Inc. | | | 2,055,791 | | | | 170,568,979 | |
Incyte Corp.(a) | | | 304,623 | | | | 22,015,104 | |
Moderna, Inc.(a) | | | 544,184 | | | | 83,575,779 | |
Regeneron Pharmaceuticals, Inc.(a) | | | 177,259 | | | | 145,648,403 | |
Vertex Pharmaceuticals, Inc.(a) | | | 423,844 | | | | 133,540,529 | |
| | | | | | | | |
| | | | | | | 1,263,774,928 | |
|
| Broadline Retail — 2.4% | |
Amazon.com, Inc.(a) | | | 6,760,671 | | | | 698,309,708 | |
Etsy, Inc.(a)(b) | | | 120,900 | | | | 13,459,797 | |
| | | | | | | | |
| | | | | | | 711,769,505 | |
|
| Building Products — 0.0% | |
Masco Corp. | | | 261,921 | | | | 13,022,712 | |
| | | | | | | | |
|
| Capital Markets — 1.0% | |
Ameriprise Financial, Inc. | | | 173,976 | | | | 53,323,644 | |
Cboe Global Markets, Inc. | | | 117,204 | | | | 15,733,465 | |
Charles Schwab Corp. | | | 1,484,445 | | | | 77,755,229 | |
FactSet Research Systems, Inc. | | | 37,897 | | | | 15,730,666 | |
MarketAxess Holdings, Inc. | | | 30,211 | | | | 11,821,262 | |
Moody’s Corp. | | | 121,946 | | | | 37,317,915 | |
MSCI, Inc., Class A | | | 75,073 | | | | 42,017,607 | |
Nasdaq, Inc. | | | 358,272 | | | | 19,586,730 | |
Raymond James Financial, Inc. | | | 318,972 | | | | 29,750,519 | |
| | | | | | | | |
| | | | | | | 303,037,037 | |
|
| Chemicals — 1.5% | |
Air Products & Chemicals, Inc. | | | 366,145 | | | | 105,160,505 | |
Albemarle Corp. | | | 193,012 | | | | 42,663,373 | |
CF Industries Holdings, Inc. | | | 323,165 | | | | 23,426,231 | |
Corteva, Inc. | | | 810,857 | | | | 48,902,786 | |
FMC Corp. | | | 207,725 | | | | 25,369,454 | |
Linde PLC | | | 495,244 | | | | 176,029,527 | |
Mosaic Co. | | | 561,631 | | | | 25,767,630 | |
| | | | | | | | |
| | | | | | | 447,319,506 | |
| | | | | | | | |
| Security | | Shares | | | Value | |
|
| Commercial Services & Supplies — 0.6% | |
Cintas Corp. | | | 83,852 | | | $ | 38,796,643 | |
Copart, Inc.(a) | | | 705,812 | | | | 53,084,121 | |
Republic Services, Inc. | | | 186,330 | | | | 25,195,543 | |
Rollins, Inc. | | | 384,115 | | | | 14,415,836 | |
Waste Management, Inc. | | | 361,230 | | | | 58,941,899 | |
| | | | | | | | |
| | | | | | | 190,434,042 | |
|
| Communications Equipment — 0.4% | |
Arista Networks, Inc.(a) | | | 407,827 | | | | 68,457,840 | |
Motorola Solutions, Inc. | | | 151,494 | | | | 43,346,978 | |
| | | | | | | | |
| | | | | | | 111,804,818 | |
|
| Construction & Engineering — 0.1% | |
Quanta Services, Inc. | | | 235,378 | | | | 39,223,390 | |
| | | | | | | | |
|
| Construction Materials — 0.1% | |
Vulcan Materials Co. | | | 129,391 | | | | 22,198,320 | |
| | | | | | | | |
|
| Consumer Finance — 0.3% | |
American Express Co. | | | 480,933 | | | | 79,329,899 | |
Discover Financial Services | | | 255,917 | | | | 25,294,836 | |
| | | | | | | | |
| | | | | | | 104,624,735 | |
|
| Consumer Staples Distribution & Retail — 1.2% | |
Costco Wholesale Corp. | | | 482,784 | | | | 239,880,886 | |
Dollar General Corp. | | | 368,524 | | | | 77,559,561 | |
Dollar Tree, Inc.(a)(b) | | | 343,563 | | | | 49,318,469 | |
| | | | | | | | |
| | | | | | | 366,758,916 | |
|
| Distributors — 0.1% | |
Genuine Parts Co. | | | 167,160 | | | | 27,967,539 | |
Pool Corp. | | | 40,286 | | | | 13,795,538 | |
| | | | | | | | |
| | | | | | | 41,763,077 | |
|
| Electric Utilities — 0.2% | |
NRG Energy, Inc. | | | 177,163 | | | | 6,074,919 | |
PG&E Corp.(a)(b) | | | 2,651,589 | | | | 42,876,194 | |
| | | | | | | | |
| | | | | | | 48,951,113 | |
|
| Electrical Equipment — 0.1% | |
AMETEK, Inc. | | | 189,360 | | | | 27,519,689 | |
| | | | | | | | |
|
| Electronic Equipment, Instruments & Components — 0.4% | |
Amphenol Corp., Class A | | | 980,011 | | | | 80,086,499 | |
CDW Corp. | | | 140,657 | | | | 27,412,642 | |
Keysight Technologies, Inc.(a)(b) | | | 159,112 | | | | 25,693,406 | |
| | | | | | | | |
| | | | | | | 133,192,547 | |
|
| Energy Equipment & Services — 0.2% | |
Schlumberger NV | | | 1,241,604 | | | | 60,962,756 | |
| | | | | | | | |
|
| Entertainment — 0.3% | |
Activision Blizzard, Inc. | | | 692,056 | | | | 59,233,073 | |
Electronic Arts, Inc. | | | 291,995 | | | | 35,170,798 | |
| | | | | | | | |
| | | | | | | 94,403,871 | |
|
| Financial Services — 4.1% | |
Fiserv, Inc.(a)(b) | | | 721,664 | | | | 81,569,682 | |
FleetCor Technologies, Inc.(a) | | | 64,865 | | | | 13,676,785 | |
Jack Henry & Associates, Inc. | | | 120,447 | | | | 18,153,772 | |
Mastercard, Inc., Class A | | | 1,390,885 | | | | 505,461,518 | |
Visa, Inc., Class A | | | 2,678,870 | | | | 603,978,030 | |
| | | | | | | | |
| | | | | | | 1,222,839,787 | |
|
| Food Products — 1.1% | |
Archer-Daniels-Midland Co. | | | 440,714 | | | | 35,107,277 | |
Bunge Ltd. | | | 101,294 | | | | 9,675,603 | |
Campbell Soup Co. | | | 193,842 | | | | 10,657,433 | |
General Mills, Inc. | | | 660,967 | | | | 56,486,240 | |
Hershey Co. | | | 242,818 | | | | 61,775,327 | |
| | |
| 18 | | 2 0 2 3 I S H A R E S A N N U A L R E P O R T T O S H A R E H O L D E R S |
| | |
Schedule of Investments (continued) March 31, 2023 | | iShares® S&P 500 Growth ETF (Percentages shown are based on Net Assets) |
| | | | | | | | |
| Security | | Shares | | | Value | |
| | |
| Food Products (continued) | | | | | | |
Hormel Foods Corp. | | | 345,212 | | | $ | 13,767,055 | |
Kellogg Co. | | | 233,078 | | | | 15,606,903 | |
Lamb Weston Holdings, Inc. | | | 237,666 | | | | 24,840,850 | |
McCormick & Co., Inc., NVS | | | 211,575 | | | | 17,605,156 | |
Mondelez International, Inc., Class A | | | 1,213,704 | | | | 84,619,443 | |
| | | | | | | | |
| | | | | | | 330,141,287 | |
|
| Gas Utilities — 0.1% | |
Atmos Energy Corp. | | | 144,293 | | | | 16,212,762 | |
| | | | | | | | |
|
| Ground Transportation — 0.8% | |
CSX Corp. | | | 1,662,035 | | | | 49,761,328 | |
JB Hunt Transport Services, Inc. | | | 136,724 | | | | 23,989,593 | |
Old Dominion Freight Line, Inc.(b) | | | 149,756 | | | | 51,042,835 | |
Union Pacific Corp. | | | 504,302 | | | | 101,495,821 | |
| | | | | | | | |
| | | | | | | 226,289,577 | |
|
| Health Care Equipment & Supplies — 1.6% | |
Abbott Laboratories | | | 1,494,644 | | | | 151,347,651 | |
Boston Scientific Corp.(a)(b) | | | 1,250,361 | | | | 62,555,561 | |
Dexcom, Inc.(a) | | | 637,751 | | | | 74,093,911 | |
Hologic, Inc.(a) | | | 406,450 | | | | 32,800,515 | |
IDEXX Laboratories, Inc.(a)(b) | | | 66,905 | | | | 33,457,852 | |
Insulet Corp.(a)(b) | | | 114,312 | | | | 36,460,956 | |
Intuitive Surgical, Inc.(a)(b) | | | 282,928 | | | | 72,279,616 | |
ResMed, Inc. | | | 131,319 | | | | 28,757,548 | |
| | | | | | | | |
| | | | | | | 491,753,610 | |
|
| Health Care Providers & Services — 3.9% | |
Cigna Group | | | 241,187 | | | | 61,630,514 | |
Elevance Health, Inc. | | | 393,759 | | | | 181,054,326 | |
HCA Healthcare, Inc. | | | 188,601 | | | | 49,730,312 | |
Humana, Inc. | | | 131,785 | | | | 63,976,346 | |
McKesson Corp. | | | 104,101 | | | | 37,065,161 | |
Molina Healthcare, Inc.(a) | | | 96,210 | | | | 25,735,213 | |
Quest Diagnostics, Inc. | | | 121,093 | | | | 17,132,237 | |
UnitedHealth Group, Inc. | | | 1,540,313 | | | | 727,936,521 | |
| | | | | | | | |
| | | | | | | 1,164,260,630 | |
|
| Hotels, Restaurants & Leisure — 1.7% | |
Chipotle Mexican Grill, Inc.(a) | | | 45,558 | | | | 77,826,276 | |
Domino’s Pizza, Inc. | | | 26,620 | | | | 8,781,139 | |
Hilton Worldwide Holdings, Inc. | | | 211,325 | | | | 29,769,353 | |
Marriott International, Inc., Class A | | | 225,963 | | | | 37,518,897 | |
McDonald’s Corp. | | | 748,579 | | | | 209,310,174 | |
Starbucks Corp. | | | 966,249 | | | | 100,615,508 | |
Yum! Brands, Inc. | | | 295,388 | | | | 39,014,847 | |
| | | | | | | | |
| | | | | | | 502,836,194 | |
|
| Household Durables — 0.1% | |
DR Horton, Inc. | | | 258,365 | | | | 25,239,677 | |
| | | | | | | | |
|
| Household Products — 1.4% | |
Clorox Co. | | | 92,190 | | | | 14,588,146 | |
Colgate-Palmolive Co. | | | 756,525 | | | | 56,852,854 | |
Kimberly-Clark Corp. | | | 266,833 | | | | 35,814,325 | |
Procter & Gamble Co. | | | 2,139,113 | | | | 318,064,712 | |
| | | | | | | | |
| | | | | | | 425,320,037 | |
|
| Independent Power and Renewable Electricity Producers — 0.1% | |
AES Corp. | | | 651,856 | | | | 15,696,692 | |
| | | | | | | | |
|
| Insurance — 1.9% | |
Aon PLC, Class A | | | 223,413 | | | | 70,439,885 | |
Arch Capital Group Ltd.(a)(b) | | | 609,054 | | | | 41,336,495 | |
Arthur J. Gallagher & Co. | | | 223,270 | | | | 42,713,783 | |
Brown & Brown, Inc. | | | 230,376 | | | | 13,228,190 | |
| | | | | | | | |
| Security | | Shares | | | Value | |
| | |
| Insurance (continued) | | | | | | |
Chubb Ltd. | | | 389,905 | | | $ | 75,711,753 | |
Everest Re Group Ltd. | | | 37,168 | | | | 13,306,887 | |
Globe Life, Inc. | | | 105,245 | | | | 11,579,055 | |
Marsh & McLennan Cos., Inc. | | | 522,224 | | | | 86,976,407 | |
Principal Financial Group, Inc. | | | 229,537 | | | | 17,059,190 | |
Progressive Corp. | | | 964,230 | | | | 137,942,744 | |
Travelers Cos., Inc. | | | 206,258 | | | | 35,354,684 | |
W R Berkley Corp. | | | 337,195 | | | | 20,993,761 | |
| | | | | | | | |
| | | | | | | 566,642,834 | |
|
| Interactive Media & Services — 6.3% | |
Alphabet, Inc., Class A(a) | | | 9,818,842 | | | | 1,018,508,481 | |
Alphabet, Inc., Class C, NVS(a) | | | 8,559,651 | | | | 890,203,704 | |
| | | | | | | | |
| | | | | | | 1,908,712,185 | |
|
| IT Services — 0.7% | |
Accenture PLC, Class A | | | 508,716 | | | | 145,396,120 | |
EPAM Systems, Inc.(a) | | | 64,568 | | | | 19,305,832 | |
Gartner, Inc.(a) | | | 130,080 | | | | 42,376,161 | |
VeriSign, Inc.(a) | | | 73,911 | | | | 15,619,612 | |
| | | | | | | | |
| | | | | | | 222,697,725 | |
|
| Life Sciences Tools & Services — 2.6% | |
Agilent Technologies, Inc. | | | 292,473 | | | | 40,460,715 | |
Bio-Techne Corp. | | | 123,311 | | | | 9,148,443 | |
Danaher Corp. | | | 1,080,527 | | | | 272,336,025 | |
IQVIA Holdings, Inc.(a) | | | 146,781 | | | | 29,193,273 | |
Mettler-Toledo International, Inc.(a) | | | 23,746 | | | | 36,336,367 | |
Thermo Fisher Scientific, Inc. | | | 646,622 | | | | 372,693,522 | |
Waters Corp.(a) | | | 97,900 | | | | 30,312,777 | |
| | | | | | | | |
| | | | | | | 790,481,122 | |
|
| Machinery — 1.4% | |
Caterpillar, Inc. | | | 514,814 | | | | 117,810,036 | |
Cummins, Inc. | | | 119,315 | | | | 28,501,967 | |
Deere & Co. | | | 445,767 | | | | 184,048,279 | |
IDEX Corp. | | | 71,128 | | | | 16,432,702 | |
Illinois Tool Works, Inc. | | | 233,159 | | | | 56,762,558 | |
Snap-on, Inc. | | | 49,622 | | | | 12,251,176 | |
| | | | | | | | |
| | | | | | | 415,806,718 | |
|
| Metals & Mining — 0.6% | |
Freeport-McMoRan, Inc. | | | 2,358,556 | | | | 96,488,526 | |
Nucor Corp. | | | 416,773 | | | | 64,378,925 | |
Steel Dynamics, Inc. | | | 274,702 | | | | 31,057,808 | |
| | | | | | | | |
| | | | | | | 191,925,259 | |
|
| Multi-Utilities — 0.2% | |
Sempra Energy | | | 310,584 | | | | 46,947,877 | |
WEC Energy Group, Inc. | | | 270,424 | | | | 25,633,491 | |
| | | | | | | | |
| | | | | | | 72,581,368 | |
|
| Oil, Gas & Consumable Fuels — 7.0% | |
APA Corp. | | | 530,674 | | | | 19,136,104 | |
Chevron Corp. | | | 2,932,752 | | | | 478,507,816 | |
ConocoPhillips | | | 2,017,642 | | | | 200,170,263 | |
Coterra Energy, Inc. | | | 1,298,911 | | | | 31,875,276 | |
Devon Energy Corp. | | | 1,079,838 | | | | 54,650,601 | |
Diamondback Energy, Inc. | | | 302,171 | | | | 40,844,454 | |
EOG Resources, Inc. | | | 968,401 | | | | 111,007,807 | |
EQT Corp. | | | 605,976 | | | | 19,336,694 | |
Exxon Mobil Corp. | | | 6,788,776 | | | | 744,457,176 | |
Hess Corp. | | | 457,156 | | | | 60,500,025 | |
Marathon Oil Corp. | | | 1,046,435 | | | | 25,072,583 | |
Marathon Petroleum Corp. | | | 360,129 | | | | 48,556,193 | |
Occidental Petroleum Corp.(b) | | | 1,200,608 | | | | 74,953,957 | |
| | |
S C H E D U L E S O F I N V E S T M E N T S | | 19 |
| | |
Schedule of Investments (continued) March 31, 2023 | | iShares® S&P 500 Growth ETF (Percentages shown are based on Net Assets) |
| | | | | | | | |
| Security | | Shares | | | Value | |
|
| Oil, Gas & Consumable Fuels (continued) | |
ONEOK, Inc. | | | 736,127 | | | $ | 46,773,510 | |
Pioneer Natural Resources Co. | | | 391,357 | | | | 79,930,754 | |
Targa Resources Corp. | | | 373,177 | | | | 27,223,262 | |
Williams Cos., Inc. | | | 2,005,481 | | | | 59,883,663 | |
| | | | | | | | |
| | | | | | | 2,122,880,138 | |
|
| Pharmaceuticals — 6.4% | |
Bristol-Myers Squibb Co. | | | 3,505,079 | | | | 242,937,026 | |
Eli Lilly & Co. | | | 1,300,172 | | | | 446,505,068 | |
Johnson & Johnson | | | 2,672,282 | | | | 414,203,710 | |
Merck & Co., Inc. | | | 4,179,795 | | | | 444,688,390 | |
Pfizer, Inc. | | | 9,253,884 | | | | 377,558,467 | |
| | | | | | | | |
| | | | | | | 1,925,892,661 | |
|
| Professional Services — 1.0% | |
Automatic Data Processing, Inc. | | | 683,044 | | | | 152,066,086 | |
Broadridge Financial Solutions, Inc. | | | 93,375 | | | | 13,685,974 | |
CoStar Group, Inc.(a) | | | 669,760 | | | | 46,112,976 | |
Equifax, Inc.(b) | | | 99,169 | | | | 20,115,440 | |
Leidos Holdings, Inc. | | | 147,205 | | | | 13,551,692 | |
Paychex, Inc. | | | 301,082 | | | | 34,500,986 | |
Verisk Analytics, Inc. | | | 118,770 | | | | 22,787,212 | |
| | | | | | | | |
| | | | | | | 302,820,366 | |
|
| Semiconductors & Semiconductor Equipment — 9.0% | |
Advanced Micro Devices, Inc.(a) | | | 1,435,356 | | | | 140,679,242 | |
Analog Devices, Inc. | | | 392,670 | | | | 77,442,377 | |
Applied Materials, Inc. | | | 1,389,840 | | | | 170,714,047 | |
Broadcom, Inc. | | | 413,373 | | | | 265,195,314 | |
Enphase Energy, Inc.(a) | | | 223,787 | | | | 47,057,930 | |
First Solar, Inc.(a) | | | 163,565 | | | | 35,575,388 | |
KLA Corp. | | | 228,272 | | | | 91,119,334 | |
Lam Research Corp. | | | 222,503 | | | | 117,953,290 | |
Microchip Technology, Inc. | | | 441,413 | | | | 36,981,581 | |
Monolithic Power Systems, Inc. | | | 73,977 | | | | 37,028,448 | |
NVIDIA Corp. | | | 4,055,520 | | | | 1,126,501,790 | |
NXP Semiconductors NV | | | 252,880 | | | | 47,155,798 | |
ON Semiconductor Corp.(a)(b) | | | 712,225 | | | | 58,630,362 | |
QUALCOMM, Inc. | | | 1,838,187 | | | | 234,515,898 | |
SolarEdge Technologies, Inc.(a) | | | 92,047 | | | | 27,977,686 | |
Teradyne, Inc. | | | 125,029 | | | | 13,441,868 | |
Texas Instruments, Inc. | | | 941,219 | | | | 175,076,146 | |
| | | | | | | | |
| | | | | | | 2,703,046,499 | |
|
| Software — 9.9% | |
Adobe, Inc.(a) | | | 354,766 | | | | 136,716,173 | |
Autodesk, Inc.(a) | | | 195,513 | | | | 40,697,986 | |
Cadence Design Systems, Inc.(a)(b) | | | 452,030 | | | | 94,966,983 | |
Fair Isaac Corp.(a)(b) | | | 41,527 | | | | 29,180,608 | |
Fortinet, Inc.(a) | | | 1,068,070 | | | | 70,983,932 | |
Gen Digital, Inc. | | | 502,843 | | | | 8,628,786 | |
Intuit, Inc. | | | 245,455 | | | | 109,431,203 | |
Microsoft Corp. | | | 7,117,532 | | | | 2,051,984,476 | |
Oracle Corp. | | | 1,494,793 | | | | 138,896,166 | |
Paycom Software, Inc.(a)(b) | | | 79,436 | | | | 24,149,338 | |
PTC, Inc.(a) | | | 176,375 | | | | 22,616,566 | |
ServiceNow, Inc.(a)(b) | | | 334,602 | | | | 155,496,241 | |
Synopsys, Inc.(a) | | | 251,315 | | | | 97,070,419 | |
Tyler Technologies, Inc.(a) | | | 32,088 | | | | 11,379,688 | |
| | | | | | | | |
| | | | | | | 2,992,198,565 | |
| | | | | | | | |
| Security | | Shares | | | Value | |
|
| Specialized REITs — 0.8% | |
American Tower Corp. | | | 406,412 | | | $ | 83,046,228 | |
Extra Space Storage, Inc. | | | 110,908 | | | | 18,070,240 | |
Iron Mountain, Inc. | | | 303,628 | | | | 16,064,958 | |
Public Storage | | | 161,421 | | | | 48,771,741 | |
SBA Communications Corp. | | | 99,560 | | | | 25,992,129 | |
VICI Properties, Inc. | | | 945,471 | | | | 30,841,264 | |
Weyerhaeuser Co. | | | 686,101 | | | | 20,672,223 | |
| | | | | | | | |
| | | | | | | 243,458,783 | |
|
| Specialty Retail — 2.5% | |
AutoZone, Inc.(a) | | | 30,898 | | | | 75,951,919 | |
Home Depot, Inc. | | | 890,461 | | | | 262,792,850 | |
Lowe’s Cos., Inc. | | | 687,873 | | | | 137,553,964 | |
O’Reilly Automotive, Inc.(a) | | | 102,806 | | | | 87,280,238 | |
TJX Cos., Inc. | | | 1,219,136 | | | | 95,531,497 | |
Tractor Supply Co. | | | 181,966 | | | | 42,769,289 | |
Ulta Beauty, Inc.(a) | | | 84,099 | | | | 45,890,301 | |
| | | | | | | | |
| | | | | | | 747,770,058 | |
|
| Technology Hardware, Storage & Peripherals — 13.4% | |
Apple Inc. | | | 24,518,598 | | | | 4,043,116,810 | |
| | | | | | | | |
|
| Tobacco — 0.7% | |
Altria Group, Inc. | | | 1,530,637 | | | | 68,297,023 | |
Philip Morris International, Inc. | | | 1,380,032 | | | | 134,208,112 | |
| | | | | | | | |
| | | | | | | 202,505,135 | |
|
| Trading Companies & Distributors — 0.3% | |
Fastenal Co. | | | 459,642 | | | | 24,793,090 | |
WW Grainger, Inc. | | | 74,335 | | | | 51,202,691 | |
| | | | | | | | |
| | | | | | | 75,995,781 | |
|
| Wireless Telecommunication Services — 0.3% | |
T-Mobile U.S., Inc.(a)(b) | | | 663,941 | | | | 96,165,214 | |
| | | | | | | | |
| |
Total Long-Term Investments — 99.8%
(Cost: $22,700,936,556) | | | | 30,104,478,496 | |
| | | | | | | | |
|
Short-Term Securities | |
|
| Money Market Funds — 0.9% | |
BlackRock Cash Funds: Institutional, SL Agency Shares, 5.01%(c)(d)(e) | | | 237,619,273 | | | | 237,690,559 | |
BlackRock Cash Funds: Treasury, SL Agency Shares, 4.73%(c)(d) | | | 41,154,407 | | | | 41,154,407 | |
| | | | | | | | |
| |
Total Short-Term Securities — 0.9%
(Cost: $278,820,244) | | | | 278,844,966 | |
| | | | | | | | |
| |
Total Investments — 100.7%
(Cost: $22,979,756,800) | | | | 30,383,323,462 | |
Liabilities in Excess of Other Assets — (0.7)% | | | | (219,231,977 | ) |
| | | | | | | | |
| |
Net Assets — 100.0% | | | $ | 30,164,091,485 | |
| | | | | | | | |
| (a) | Non-income producing security. |
| (b) | All or a portion of this security is on loan. |
| (c) | Affiliate of the Fund. |
| (d) | Annualized 7-day yield as of period end. |
| (e) | All or a portion of this security was purchased with the cash collateral from loaned securities. |
| | |
| 20 | | 2 0 2 3 I S H A R E S A N N U A L R E P O R T T O S H A R E H O L D E R S |
| | |
Schedule of Investments (continued) March 31, 2023 | | iShares® S&P 500 Growth ETF |
Affiliates
Investments in issuers considered to be affiliate(s) of the Fund during the year ended March 31, 2023 for purposes of Section 2(a)(3) of the Investment Company Act of 1940, as amended, were as follows:
| | | | | | | | | | | | | | | | | | | | | | | | | | | | | | | | | | | | |
Affiliated Issuer | | Value at
03/31/22 | | | Purchases
at Cost | | | Proceeds
from Sale | | | Net Realized
Gain (Loss) | | | Change in
Unrealized
Appreciation
(Depreciation) | | | Value at
03/31/23 | | | Shares
Held at
03/31/23 | | | Income | | | Capital
Gain
Distributions
from Underlying
Funds | |
BlackRock Cash Funds: Institutional, SL Agency Shares | | $ | 67,653,659 | | | $ | 169,841,502 | (a) | | $ | — | | | $ | 186,798 | | | $ | 8,600 | | | $ | 237,690,559 | | | | 237,619,273 | | | $ | 513,312 | (b) | | $ | — | |
BlackRock Cash Funds: Treasury, SL Agency Shares | | | 48,780,000 | | | | — | | | | (7,625,593) | (a) | | | — | | | | — | | | | 41,154,407 | | | | 41,154,407 | | | | 1,128,251 | | | | 33 | |
BlackRock Inc. | | | 107,435,424 | | | | 16,523,814 | | | | (115,599,167) | | | | 18,390,580 | | | | (26,750,651) | | | | — | | | | — | | | | — | | | | — | |
| | | | | | | | | | | | | | | | | | | | | | | | | | | | | | | | | | | | |
| | | | | | | | | | | | | | $ | 18,577,378 | | | $ | (26,742,051) | | | $ | 278,844,966 | | | | | | | $ | 1,641,563 | | | $ | 33 | |
| | | | | | | | | | | | | | | | | | | | | | | | | | | | | | | | | | | | |
| | (a) | Represents net amount purchased (sold). | |
| | (b) | All or a portion represents securities lending income earned from the reinvestment of cash collateral from loaned securities, net of fees and collateral investment expenses, and other payments to and from borrowers of securities. | |
Derivative Financial Instruments Outstanding as of Period End
Futures Contracts
| | | | | | | | | | | | | | | | |
Description | | Number of
Contracts | | | Expiration
Date | | | Notional
Amount
(000) | | | Value/
Unrealized
Appreciation
(Depreciation) | |
| | | | |
Long Contracts | | | | | | | | | | | | | | | | |
S&P 500 E-mini Index | | | 251 | | | | 06/16/23 | | | $ | 51,929 | | | $ | 2,541,292 | |
| | | | | | | | | | | | | | | | |
Derivative Financial Instruments Categorized by Risk Exposure
As of period end, the fair values of derivative financial instruments located in the Statements of Assets and Liabilities were as follows:
| | | | | | | | | | | | | | | | | | | | | | | | | | | | |
| | | Commodity
Contracts | | | Credit
Contracts | | | Equity
Contracts | | | Foreign
Currency
Exchange
Contracts | | | Interest
Rate
Contracts | | | Other
Contracts | | | Total | |
| | | | | | |
Assets — Derivative Financial Instruments | | | | | | | | | | | | | | | | | | | | | | | | | |
Futures contracts | | | | | | | | | | | | | | | | | | | | | | | | | | | | |
Unrealized appreciation on futures contracts(a) | | $ | — | | | $ | — | | | $ | 2,541,292 | | | $ | — | | | $ | — | | | $ | — | | | $ | 2,541,292 | |
| | | | | | | | | | | | | | | | | | | | | | | | | | | | |
| | (a) | Net cumulative unrealized appreciation (depreciation) on futures contracts, if any, are reported in the Schedule of Investments. In the Statements of Assets and Liabilities, only current day’s variation margin is reported in receivables or payables and the net cumulative unrealized appreciation (depreciation) is included in accumulated earnings (loss). | |
For the period ended March 31, 2023, the effect of derivative financial instruments in the Statements of Operations was as follows:
| | | | | | | | | | | | | | | | | | | | | | | | | | | | |
| | | Commodity
Contracts | | | Credit
Contracts | | | Equity
Contracts | | | Foreign
Currency
Exchange
Contracts | | | Interest
Rate
Contracts | | | Other
Contracts | | | Total | |
Net Realized Gain (Loss) from | | | | | | | | | | | | | | | | | | | | | | | | | |
Futures contracts | | $ | — | | | $ | — | | | $ | (5,359,505 | ) | | $ | — | | | $ | — | | | $ | — | | | $ | (5,359,505 | ) |
| | | | | | | | | | | | | | | | | | | | | | | | | | | | |
| | | | | | | |
Net Change in Unrealized Appreciation (Depreciation) on | | | | | | | | | | | | | | | | | | | | | |
Futures contracts | | $ | — | | | $ | — | | | $ | (342,514 | ) | | $ | — | | | $ | — | | | $ | — | | | $ | (342,514 | ) |
| | | | | | | | | | | | | | | | | | | | | | | | | | | | |
| | |
S C H E D U L E S O F I N V E S T M E N T S | | 21 |
| | |
Schedule of Investments (continued) March 31, 2023 | | iShares® S&P 500 Growth ETF |
Average Quarterly Balances of Outstanding Derivative Financial Instruments
| | | | |
| | |
Futures contracts | | | | |
Average notional value of contracts — long | | $ | 59,189,666 | |
For more information about the Fund’s investment risks regarding derivative financial instruments, refer to the Notes to Financial Statements.
Fair Value Hierarchy as of Period End
Various inputs are used in determining the fair value of financial instruments. For a description of the input levels and information about the Fund’s policy regarding valuation of financial instruments, refer to the Notes to Financial Statements.
The following table summarizes the Fund’s financial instruments categorized in the fair value hierarchy. The breakdown of the Fund’s financial instruments into major categories is disclosed in the Schedule of Investments above.
| | | | | | | | | | | | | | | | |
| | | | | |
| | | Level 1 | | | Level 2 | | | Level 3 | | | Total | |
| | | | |
Assets | | | | | | | | | | | | | | | | |
Investments | | | | | | | | | | | | | | | | |
Long-Term Investments | | | | | | | | | | | | | | | | |
Common Stocks | | $ | 30,104,478,496 | | | $ | — | | | $ | — | | | $ | 30,104,478,496 | |
Short-Term Securities | | | | | | | | | | | | | | | | |
Money Market Funds | | | 278,844,966 | | | | — | | | | — | | | | 278,844,966 | |
| | | | | | | | | | | | | | | | |
| | $ | 30,383,323,462 | | | $ | — | | | $ | — | | | $ | 30,383,323,462 | |
| | | | | | | | | | | | | | | | |
Derivative Financial Instruments(a) | | | | | | | | | | | | | | | | |
Assets | | | | | | | | | | | | | | | | |
Equity Contracts | | $ | 2,541,292 | | | $ | — | | | $ | — | | | $ | 2,541,292 | |
| | | | | | | | | | | | | | | | |
| (a) | Derivative financial instruments are futures contracts. Futures contracts are valued at the unrealized appreciation (depreciation) on the instrument. | |
See notes to financial statements.
| | |
| 22 | | 2 0 2 3 I S H A R E S A N N U A L R E P O R T T O S H A R E H O L D E R S |
| | |
Schedule of Investments March 31, 2023 | | iShares® S&P 500 Value ETF (Percentages shown are based on Net Assets) |
| | | | | | | | |
| Security | | Shares | | | Value | |
|
Common Stocks | |
|
| Aerospace & Defense — 2.6% | |
Boeing Co.(a)(b) | | | 853,705 | | | $ | 181,352,553 | |
General Dynamics Corp. | | | 160,996 | | | | 36,740,897 | |
Howmet Aerospace, Inc. | | | 559,665 | | | | 23,713,006 | |
Huntington Ingalls Industries, Inc. | | | 60,062 | | | | 12,434,035 | |
L3Harris Technologies, Inc. | | | 144,272 | | | | 28,311,937 | |
Lockheed Martin Corp. | | | 100,034 | | | | 47,289,073 | |
Northrop Grumman Corp. | | | 61,155 | | | | 28,236,487 | |
Raytheon Technologies Corp. | | | 2,223,974 | | | | 217,793,774 | |
Textron, Inc.(b) | | | 317,310 | | | | 22,411,605 | |
TransDigm Group, Inc. | | | 41,630 | | | | 30,683,392 | |
| | | | | | | | |
| | | | | | | 628,966,759 | |
|
| Air Freight & Logistics — 1.2% | |
CH Robinson Worldwide, Inc. | | | 81,620 | | | | 8,110,579 | |
FedEx Corp. | | | 352,520 | | | | 80,547,295 | |
United Parcel Service, Inc., Class B | | | 1,107,952 | | | | 214,931,609 | |
| | | | | | | | |
| | | | | | | 303,589,483 | |
|
| Automobile Components — 0.3% | |
Aptiv PLC(a) | | | 411,893 | | | | 46,210,276 | |
BorgWarner, Inc. | | | 356,675 | | | | 17,516,309 | |
| | | | | | | | |
| | | | | | | 63,726,585 | |
|
| Automobiles — 0.6% | |
Ford Motor Co. | | | 5,943,963 | | | | 74,893,934 | |
General Motors Co. | | | 2,117,228 | | | | 77,659,923 | |
| | | | | | | | |
| | | | | | | 152,553,857 | |
|
| Banks — 6.7% | |
Bank of America Corp. | | | 10,595,776 | | | | 303,039,194 | |
Citigroup, Inc. | | | 2,940,378 | | | | 137,874,324 | |
Citizens Financial Group, Inc. | | | 747,124 | | | | 22,690,156 | |
Comerica, Inc. | | | 197,314 | | | | 8,567,374 | |
Fifth Third Bancorp | | | 1,037,452 | | | | 27,637,721 | |
First Republic Bank(b) | | | 285,111 | | | | 3,988,703 | |
Huntington Bancshares, Inc. | | | 2,183,344 | | | | 24,453,453 | |
JPMorgan Chase & Co. | | | 4,452,965 | | | | 580,265,869 | |
KeyCorp | | | 1,417,129 | | | | 17,742,455 | |
M&T Bank Corp. | | | 256,517 | | | | 30,671,738 | |
PNC Financial Services Group, Inc. | | | 608,760 | | | | 77,373,396 | |
Regions Financial Corp. | | | 1,417,140 | | | | 26,302,118 | |
Truist Financial Corp. | | | 2,014,287 | | | | 68,687,187 | |
U.S. Bancorp | | | 2,115,061 | | | | 76,247,949 | |
Wells Fargo & Co. | | | 5,784,802 | | | | 216,235,899 | |
Zions Bancorp N.A. | | | 225,392 | | | | 6,745,982 | |
| | | | | | | | |
| | | | | | | 1,628,523,518 | |
|
| Beverages — 0.8% | |
Brown-Forman Corp., Class B, NVS | | | 124,035 | | | | 7,971,729 | |
Coca-Cola Co. | | | 2,068,027 | | | | 128,279,715 | |
Constellation Brands, Inc., Class A | | | 108,377 | | | | 24,481,281 | |
Keurig Dr Pepper, Inc. | | | 645,417 | | | | 22,770,312 | |
Molson Coors Beverage Co., Class B | | | 286,889 | | | | 14,826,423 | |
| | | | | | | | |
| | | | | | | 198,329,460 | |
|
| Biotechnology — 0.1% | |
Biogen, Inc.(a) | | | 115,634 | | | | 32,149,721 | |
| | | | | | | | |
|
| Broadline Retail — 3.3% | |
Amazon.com, Inc.(a) | | | 7,308,505 | | | | 754,895,482 | |
eBay, Inc. | | | 826,646 | | | | 36,678,283 | |
Etsy, Inc.(a)(b) | | | 79,477 | | | | 8,848,174 | |
| | | | | | | | |
| | | | | | | 800,421,939 | |
| | | | | | | | |
| Security | | Shares | | | Value | |
|
| Building Products — 0.9% | |
A O Smith Corp. | | | 191,159 | | | $ | 13,218,645 | |
Allegion PLC | | | 134,013 | | | | 14,303,208 | |
Carrier Global Corp. | | | 1,265,915 | | | | 57,915,611 | |
Johnson Controls International PLC | | | 1,043,293 | | | | 62,827,104 | |
Masco Corp. | | | 98,465 | | | | 4,895,680 | |
Trane Technologies PLC | | | 347,764 | | | | 63,981,621 | |
| | | | | | | | |
| | | | | | | 217,141,869 | |
|
| Capital Markets — 4.9% | |
Bank of New York Mellon Corp. | | | 1,116,636 | | | | 50,739,940 | |
BlackRock, Inc.(c) | | | 227,356 | | | | 152,128,447 | |
Cboe Global Markets, Inc. | | | 52,667 | | | | 7,070,018 | |
Charles Schwab Corp. | | | 951,452 | | | | 49,837,056 | |
CME Group, Inc., Class A | | | 546,114 | | | | 104,591,753 | |
FactSet Research Systems, Inc. | | | 23,472 | | | | 9,742,992 | |
Franklin Resources, Inc. | | | 434,792 | | | | 11,713,296 | |
Goldman Sachs Group, Inc. | | | 514,098 | | | | 168,166,597 | |
Intercontinental Exchange, Inc. | | | 848,409 | | | | 88,480,575 | |
Invesco Ltd. | | | 685,134 | | | | 11,236,198 | |
MarketAxess Holdings, Inc. | | | 28,919 | | | | 11,315,716 | |
Moody’s Corp. | | | 126,521 | | | | 38,717,956 | |
Morgan Stanley | | | 1,983,428 | | | | 174,144,978 | |
MSCI, Inc., Class A | | | 52,233 | | | | 29,234,288 | |
Nasdaq, Inc. | | | 183,852 | | | | 10,051,189 | |
Northern Trust Corp. | | | 315,982 | | | | 27,847,494 | |
S&P Global, Inc. | | | 499,763 | | | | 172,303,289 | |
State Street Corp. | | | 529,517 | | | | 40,079,142 | |
T Rowe Price Group, Inc. | | | 340,166 | | | | 38,404,741 | |
| | | | | | | | |
| | | | | | | 1,195,805,665 | |
|
| Chemicals — 2.1% | |
Celanese Corp., Class A | | | 152,193 | | | | 16,572,296 | |
Corteva, Inc. | | | 333,558 | | | | 20,116,883 | |
Dow, Inc. | | | 1,070,095 | | | | 58,662,608 | |
DuPont de Nemours, Inc. | | | 695,480 | | | | 49,914,599 | |
Eastman Chemical Co. | | | 180,344 | | | | 15,210,213 | |
Ecolab, Inc. | | | 376,187 | | | | 62,270,234 | |
International Flavors & Fragrances, Inc. | | | 388,055 | | | | 35,685,538 | |
Linde PLC | | | 291,619 | | | | 103,653,057 | |
LyondellBasell Industries NV, Class A | | | 387,049 | | | | 36,340,031 | |
PPG Industries, Inc. | | | 357,321 | | | | 47,730,939 | |
Sherwin-Williams Co. | | | 357,791 | | | | 80,420,683 | |
| | | | | | | | |
| | | | | | | 526,577,081 | |
|
| Commercial Services & Supplies — 0.3% | |
Cintas Corp. | | | 53,692 | | | | 24,842,214 | |
Republic Services, Inc. | | | 140,649 | | | | 19,018,558 | |
Waste Management, Inc. | | | 231,177 | | | | 37,721,151 | |
| | | | | | | | |
| | | | | | | 81,581,923 | |
|
| Communications Equipment — 1.6% | |
Cisco Systems, Inc. | | | 6,236,613 | | | | 326,018,944 | |
F5, Inc.(a) | | | 91,678 | | | | 13,356,568 | |
Juniper Networks, Inc. | | | 493,902 | | | | 17,000,107 | |
Motorola Solutions, Inc. | | | 114,179 | | | | 32,670,037 | |
| | | | | | | | |
| | | | | | | 389,045,656 | |
|
| Construction Materials — 0.2% | |
Martin Marietta Materials, Inc. | | | 94,084 | | | | 33,405,465 | |
Vulcan Materials Co. | | | 83,347 | | | | 14,299,011 | |
| | | | | | | | |
| | | | | | | 47,704,476 | |
|
| Consumer Finance — 0.7% | |
American Express Co. | | | 460,944 | | | | 76,032,713 | |
Capital One Financial Corp. | | | 578,872 | | | | 55,664,331 | |
| | |
S C H E D U L E S O F I N V E S T M E N T S | | 23 |
| | |
Schedule of Investments (continued) March 31, 2023 | | iShares® S&P 500 Value ETF (Percentages shown are based on Net Assets) |
| | | | | | | | |
| Security | | Shares | | | Value | |
|
| Consumer Finance (continued) | |
Discover Financial Services | | | 170,964 | | | $ | 16,898,082 | |
Synchrony Financial | | | 666,265 | | | | 19,374,986 | |
| | | | | | | | |
| | | | | | | 167,970,112 | |
| |
| Consumer Staples Distribution & Retail — 2.8% | | | | |
Costco Wholesale Corp. | | | 229,040 | | | | 113,803,105 | |
Kroger Co. | | | 990,424 | | | | 48,897,233 | |
Sysco Corp. | | | 770,605 | | | | 59,513,824 | |
Target Corp. | | | 698,799 | | | | 115,742,078 | |
Walgreens Boots Alliance, Inc. | | | 1,086,341 | | | | 37,565,672 | |
Walmart, Inc. | | | 2,128,924 | | | | 313,909,844 | |
| | | | | | | | |
| | | | | | | 689,431,756 | |
|
| Containers & Packaging — 0.5% | |
Amcor PLC | | | 2,259,553 | | | | 25,713,713 | |
Avery Dennison Corp. | | | 123,073 | | | | 22,021,452 | |
Ball Corp. | | | 476,620 | | | | 26,266,528 | |
International Paper Co. | | | 541,018 | | | | 19,509,109 | |
Packaging Corp. of America | | | 140,831 | | | | 19,551,568 | |
Sealed Air Corp. | | | 217,860 | | | | 10,001,953 | |
Westrock Co. | | | 388,249 | | | | 11,829,947 | |
| | | | | | | | |
| | | | | | | 134,894,270 | |
|
| Distributors — 0.2% | |
Genuine Parts Co. | | | 59,522 | | | | 9,958,626 | |
LKQ Corp. | | | 385,972 | | | | 21,907,770 | |
Pool Corp. | | | 21,729 | | | | 7,440,879 | |
| | | | | | | | |
| | | | | | | 39,307,275 | |
|
| Diversified Telecommunication Services — 1.9% | |
AT&T Inc. | | | 10,821,202 | | | | 208,308,139 | |
Verizon Communications, Inc. | | | 6,375,954 | | | | 247,960,851 | |
| | | | | | | | |
| | | | | | | 456,268,990 | |
|
| Electric Utilities — 3.8% | |
Alliant Energy Corp. | | | 381,732 | | | | 20,384,489 | |
American Electric Power Co., Inc. | | | 780,107 | | | | 70,981,936 | |
Constellation Energy Corp. | | | 497,461 | | | | 39,050,688 | |
Duke Energy Corp. | | | 1,168,965 | | | | 112,770,053 | |
Edison International | | | 578,236 | | | | 40,817,679 | |
Entergy Corp. | | | 310,031 | | | | 33,402,740 | |
Evergy, Inc. | | | 348,925 | | | | 21,326,296 | |
Eversource Energy | | | 528,770 | | | | 41,381,540 | |
Exelon Corp. | | | 1,508,619 | | | | 63,196,050 | |
FirstEnergy Corp. | | | 822,697 | | | | 32,957,242 | |
NextEra Energy, Inc. | | | 3,016,775 | | | | 232,533,017 | |
NRG Energy, Inc. | | | 183,962 | | | | 6,308,057 | |
Pinnacle West Capital Corp. | | | 172,939 | | | | 13,703,686 | |
PPL Corp. | | | 1,115,673 | | | | 31,004,553 | |
Southern Co. | | | 1,652,748 | | | | 114,998,206 | |
Xcel Energy, Inc. | | | 830,781 | | | | 56,027,871 | |
| | | | | | | | |
| | | | | | | 930,844,103 | |
|
| Electrical Equipment — 1.1% | |
AMETEK, Inc. | | | 174,401 | | | | 25,345,697 | |
Eaton Corp. PLC | | | 603,762 | | | | 103,448,581 | |
Emerson Electric Co. | | | 867,458 | | | | 75,590,290 | |
Generac Holdings, Inc.(a)(b) | | | 95,406 | | | | 10,304,802 | |
Rockwell Automation, Inc. | | | 174,559 | | | | 51,224,339 | |
| | | | | | | | |
| | | | | | | 265,913,709 | |
|
| Electronic Equipment, Instruments & Components — 0.9% | |
CDW Corp. | | | 76,437 | | | | 14,896,807 | |
Corning, Inc. | | | 1,152,520 | | | | 40,660,906 | |
Keysight Technologies, Inc.(a) | | | 124,974 | | | | 20,180,801 | |
TE Connectivity Ltd. | | | 480,417 | | | | 63,006,690 | |
| | | | | | | | |
| Security | | Shares | | | Value | |
|
| Electronic Equipment, Instruments & Components (continued) | |
Teledyne Technologies, Inc.(a) | | | 71,125 | | | $ | 31,818,480 | |
Trimble, Inc.(a)(b) | | | 374,998 | | | | 19,657,395 | |
Zebra Technologies Corp., Class A(a)(b) | | | 78,606 | | | | 24,996,708 | |
| | | | | | | | |
| | | | | | | 215,217,787 | |
|
| Energy Equipment & Services — 0.6% | |
Baker Hughes Co., Class A | | | 1,526,603 | | | | 44,057,762 | |
Halliburton Co. | | | 1,372,495 | | | | 43,425,742 | |
Schlumberger NV | | | 1,013,331 | | | | 49,754,552 | |
| | | | | | | | |
| | | | | | | 137,238,056 | |
|
| Entertainment — 2.7% | |
Activision Blizzard, Inc. | | | 442,457 | | | | 37,869,895 | |
Electronic Arts, Inc. | | | 126,475 | | | | 15,233,914 | |
Live Nation Entertainment, Inc.(a)(b) | | | 217,716 | | | | 15,240,120 | |
Netflix, Inc.(a)(b) | | | 676,082 | | | | 233,572,809 | |
Take-Two Interactive Software, Inc.(a) | | | 240,054 | | | | 28,638,442 | |
Walt Disney Co.(a)(b) | | | 2,773,317 | | | | 277,692,231 | |
Warner Bros Discovery, Inc., Class A(a) | | | 3,361,675 | | | | 50,761,293 | |
| | | | | | | | |
| | | | | | | 659,008,704 | |
|
| Financial Services — 4.5% | |
Berkshire Hathaway, Inc., Class B(a) | | | 2,735,238 | | | | 844,559,437 | |
Fidelity National Information Services, Inc. | | | 900,825 | | | | 48,941,822 | |
Fiserv, Inc.(a) | | | 298,387 | | | | 33,726,683 | |
FleetCor Technologies, Inc.(a)(b) | | | 52,329 | | | | 11,033,570 | |
Global Payments, Inc. | | | 399,148 | | | | 42,006,335 | |
PayPal Holdings, Inc.(a) | | | 1,717,557 | | | | 130,431,279 | |
| | | | | | | | |
| | | | | | | 1,110,699,126 | |
|
| Food Products — 1.2% | |
Archer-Daniels-Midland Co. | | | 423,571 | | | | 33,741,666 | |
Bunge Ltd. | | | 134,165 | | | | 12,815,441 | |
Campbell Soup Co. | | | 124,128 | | | | 6,824,557 | |
Conagra Brands, Inc. | | | 721,644 | | | | 27,104,949 | |
General Mills, Inc. | | | 285,924 | | | | 24,435,065 | |
Hormel Foods Corp. | | | 122,094 | | | | 4,869,109 | |
J M Smucker Co. | | | 161,788 | | | | 25,460,578 | |
Kellogg Co. | | | 176,516 | | | | 11,819,511 | |
Kraft Heinz Co. | | | 1,210,017 | | | | 46,791,357 | |
McCormick & Co., Inc., NVS | | | 187,726 | | | | 15,620,680 | |
Mondelez International, Inc., Class A | | | 952,048 | | | | 66,376,787 | |
Tyson Foods, Inc., Class A | | | 433,600 | | | | 25,721,152 | |
| | | | | | | | |
| | | | | | | 301,580,852 | |
|
| Gas Utilities — 0.0% | |
Atmos Energy Corp. | | | 85,140 | | | | 9,566,330 | |
| | | | | | | | |
| | |
| Ground Transportation — 0.9% | | | | | | |
CSX Corp. | | | 1,659,686 | | | | 49,690,999 | |
Norfolk Southern Corp. | | | 345,803 | | | | 73,310,236 | |
Union Pacific Corp. | | | 464,447 | | | | 93,474,603 | |
| | | | | | | �� | |
| | | | | | | 216,475,838 | |
|
| Health Care Equipment & Supplies — 4.2% | |
Abbott Laboratories | | | 1,270,539 | | | | 128,654,779 | |
Align Technology, Inc.(a)(b) | | | 110,443 | | | | 36,903,424 | |
Baxter International, Inc. | | | 768,098 | | | | 31,154,055 | |
Becton Dickinson & Co. | | | 430,994 | | | | 106,688,255 | |
Boston Scientific Corp.(a)(b) | | | 1,021,972 | | | | 51,129,259 | |
Cooper Cos., Inc. | | | 74,981 | | | | 27,994,906 | |
DENTSPLY SIRONA, Inc. | | | 327,626 | | | | 12,869,149 | |
Edwards Lifesciences Corp.(a) | | | 938,428 | | | | 77,636,149 | |
GE HealthCare Technologies, Inc.(a) | | | 551,221 | | | | 45,216,659 | |
IDEXX Laboratories, Inc.(a) | | | 64,108 | | | | 32,059,129 | |
Intuitive Surgical, Inc.(a) | | | 271,294 | | | | 69,307,478 | |
| | |
| 24 | | 2 0 2 3 I S H A R E S A N N U A L R E P O R T T O S H A R E H O L D E R S |
| | |
Schedule of Investments (continued) March 31, 2023 | | iShares® S&P 500 Value ETF (Percentages shown are based on Net Assets) |
| | | | | | | | |
| Security | | Shares | | | Value | |
|
| Health Care Equipment & Supplies (continued) | |
Medtronic PLC | | | 2,019,381 | | | $ | 162,802,496 | |
ResMed, Inc. | | | 102,419 | | | | 22,428,737 | |
STERIS PLC | | | 150,330 | | | | 28,755,122 | |
Stryker Corp. | | | 511,849 | | | | 146,117,534 | |
Teleflex, Inc. | | | 71,482 | | | | 18,107,105 | |
Zimmer Biomet Holdings, Inc. | | | 319,243 | | | | 41,246,196 | |
| | | | | | | | |
| | | | | | | 1,039,070,432 | |
|
| Health Care Providers & Services — 2.1% | |
AmerisourceBergen Corp. | | | 245,195 | | | | 39,258,171 | |
Cardinal Health, Inc. | | | 392,775 | | | | 29,654,513 | |
Centene Corp.(a) | | | 836,122 | | | | 52,851,272 | |
Cigna Group | | | 231,243 | | | | 59,089,524 | |
CVS Health Corp. | | | 1,949,452 | | | | 144,863,778 | |
DaVita, Inc.(a)(b) | | | 83,790 | | | | 6,796,207 | |
HCA Healthcare, Inc. | | | 147,757 | | | | 38,960,566 | |
Henry Schein, Inc.(a)(b) | | | 206,598 | | | | 16,846,001 | |
Humana, Inc. | | | 68,204 | | | | 33,110,314 | |
Laboratory Corp. of America Holdings | | | 134,281 | | | | 30,806,747 | |
McKesson Corp. | | | 112,158 | | | | 39,933,856 | |
Quest Diagnostics, Inc. | | | 56,878 | | | | 8,047,099 | |
Universal Health Services, Inc., Class B(b) | | | 96,763 | | | | 12,298,577 | |
| | | | | | | | |
| | | | | | | 512,516,625 | |
|
| Health Care REITs — 0.4% | |
Healthpeak Properties, Inc. | | | 833,624 | | | | 18,314,719 | |
Ventas, Inc. | | | 606,233 | | | | 26,280,201 | |
Welltower, Inc. | | | 717,348 | | | | 51,426,678 | |
| | | | | | | | |
| | | | | | | 96,021,598 | |
|
| Hotel & Resort REITs — 0.1% | |
Host Hotels & Resorts, Inc. | | | 1,087,838 | | | | 17,938,449 | |
| | | | | | | | |
|
| Hotels, Restaurants & Leisure — 2.6% | |
Booking Holdings, Inc.(a)(b) | | | 58,894 | | | | 156,211,034 | |
Caesars Entertainment, Inc.(a) | | | 326,989 | | | | 15,960,333 | |
Carnival Corp.(a)(b) | | | 1,527,793 | | | | 15,507,099 | |
Darden Restaurants, Inc. | | | 184,386 | | | | 28,609,332 | |
Domino’s Pizza, Inc. | | | 28,788 | | | | 9,496,298 | |
Expedia Group, Inc.(a) | | | 225,362 | | | | 21,866,875 | |
Hilton Worldwide Holdings, Inc. | | | 209,825 | | | | 29,558,048 | |
Las Vegas Sands Corp.(a) | | | 499,026 | | | | 28,669,044 | |
Marriott International, Inc., Class A | | | 199,931 | | | | 33,196,543 | |
McDonald’s Corp. | | | 422,523 | | | | 118,141,656 | |
MGM Resorts International | | | 477,658 | | | | 21,217,568 | |
Norwegian Cruise Line Holdings Ltd.(a)(b) | | | 642,451 | | | | 8,640,966 | |
Royal Caribbean Cruises Ltd.(a)(b) | | | 333,675 | | | | 21,788,977 | |
Starbucks Corp. | | | 854,947 | | | | 89,025,631 | |
Wynn Resorts Ltd.(a) | | | 157,044 | | | | 17,574,794 | |
Yum! Brands, Inc. | | | 152,683 | | | | 20,166,371 | |
| | | | | | | | |
| | | | | | | 635,630,569 | |
|
| Household Durables — 0.6% | |
DR Horton, Inc. | | | 236,982 | | | | 23,150,772 | |
Garmin Ltd. | | | 233,113 | | | | 23,525,764 | |
Lennar Corp., Class A | | | 384,909 | | | | 40,457,785 | |
Mohawk Industries, Inc.(a) | | | 80,391 | | | | 8,056,786 | |
Newell Brands, Inc. | | | 567,005 | | | | 7,053,542 | |
NVR, Inc.(a) | | | 4,594 | | | | 25,598,641 | |
PulteGroup, Inc. | | | 342,476 | | | | 19,959,501 | |
Whirlpool Corp. | | | 82,141 | | | | 10,844,255 | |
| | | | | | | | |
| | | | | | | 158,647,046 | |
|
| Household Products — 1.5% | |
Church & Dwight Co., Inc. | | | 369,690 | | | | 32,684,293 | |
Clorox Co. | | | 103,508 | | | | 16,379,106 | |
| | | | | | | | |
| Security | | Shares | | | Value | |
|
| Household Products (continued) | |
Colgate-Palmolive Co. | | | 571,394 | | | $ | 42,940,259 | |
Kimberly-Clark Corp. | | | 267,315 | | | | 35,879,019 | |
Procter & Gamble Co. | | | 1,611,658 | | | | 239,637,428 | |
| | | | | | | | |
| | | | | | | 367,520,105 | |
|
| Independent Power and Renewable Electricity Producers — 0.0% | |
AES Corp. | | | 412,575 | | | | 9,934,806 | |
| | | | | | | | |
|
| Industrial Conglomerates — 1.8% | |
3M Co. | | | 835,733 | | | | 87,843,896 | |
General Electric Co.(b) | | | 1,653,670 | | | | 158,090,852 | |
Honeywell International, Inc. | | | 1,014,310 | | | | 193,854,927 | |
| | | | | | | | |
| | | | | | | 439,789,675 | |
|
| Industrial REITs — 0.7% | |
Prologis, Inc. | | | 1,401,344 | | | | 174,845,691 | |
| | | | | | | | |
|
| Insurance — 2.5% | |
Aflac, Inc. | | | 849,962 | | | | 54,839,548 | |
Allstate Corp. | | | 399,257 | | | | 44,241,668 | |
American International Group, Inc. | | | 1,127,137 | | | | 56,762,619 | |
Aon PLC, Class A | | | 106,018 | | | | 33,426,415 | |
Arthur J. Gallagher & Co. | | | 116,475 | | | | 22,282,832 | |
Assurant, Inc. | | | 75,135 | | | | 9,021,460 | |
Brown & Brown, Inc. | | | 145,092 | | | | 8,331,183 | |
Chubb Ltd. | | | 270,946 | | | | 52,612,294 | |
Cincinnati Financial Corp. | | | 238,679 | | | | 26,751,142 | |
Everest Re Group Ltd. | | | 24,786 | | | | 8,873,884 | |
Globe Life, Inc. | | | 40,836 | | | | 4,492,777 | |
Hartford Financial Services Group, Inc. | | | 477,527 | | | | 33,278,857 | |
Lincoln National Corp. | | | 233,749 | | | | 5,252,340 | |
Loews Corp. | | | 296,097 | | | | 17,179,548 | |
Marsh & McLennan Cos., Inc. | | | 270,195 | | | | 45,000,977 | |
MetLife, Inc. | | | 1,003,152 | | | | 58,122,627 | |
Principal Financial Group, Inc. | | | 134,715 | | | | 10,012,019 | |
Prudential Financial, Inc. | | | 559,537 | | | | 46,296,091 | |
Travelers Cos., Inc. | | | 162,082 | | | | 27,782,476 | |
Willis Towers Watson PLC | | | 161,907 | | | | 37,623,949 | |
| | | | | | | | |
| | | | | | | 602,184,706 | |
|
| Interactive Media & Services — 3.0% | |
Match Group, Inc.(a) | | | 425,332 | | | | 16,328,495 | |
Meta Platforms, Inc., Class A(a) | | | 3,378,985 | | | | 716,142,081 | |
| | | | | | | | |
| | | | | | | 732,470,576 | |
|
| IT Services — 1.7% | |
Accenture PLC, Class A | | | 487,574 | | | | 139,353,525 | |
Akamai Technologies, Inc.(a) | | | 239,168 | | | | 18,726,854 | |
Cognizant Technology Solutions Corp., Class A | | | 772,618 | | | | 47,075,615 | |
DXC Technology Co.(a) | | | 347,096 | | | | 8,871,774 | |
EPAM Systems, Inc.(a) | | | 27,665 | | | | 8,271,835 | |
International Business Machines Corp. | | | 1,372,573 | | | | 179,930,594 | |
VeriSign, Inc.(a) | | | 70,863 | | | | 14,975,478 | |
| | | | | | | | |
| | | | | | | 417,205,675 | |
|
| Leisure Products — 0.0% | |
Hasbro, Inc. | | | 196,504 | | | | 10,550,300 | |
| | | | | | | | |
|
| Life Sciences Tools & Services — 0.9% | |
Agilent Technologies, Inc. | | | 179,639 | | | | 24,851,259 | |
Bio-Rad Laboratories, Inc., Class A(a) | | | 32,857 | | | | 15,739,160 | |
Bio-Techne Corp. | | | 123,002 | | | | 9,125,518 | |
Charles River Laboratories International, Inc.(a)(b) | | | 77,438 | | | | 15,628,537 | |
Illumina, Inc.(a)(b) | | | 238,805 | | | | 55,534,103 | |
IQVIA Holdings, Inc.(a)(b) | | | 146,511 | | | | 29,139,573 | |
Mettler-Toledo International, Inc.(a) | | | 11,698 | | | | 17,900,397 | |
| | |
S C H E D U L E S O F I N V E S T M E N T S | | 25 |
| | |
Schedule of Investments (continued) March 31, 2023 | | iShares® S&P 500 Value ETF (Percentages shown are based on Net Assets) |
| | | | | | | | |
| Security | | Shares | | | Value | |
|
| Life Sciences Tools & Services (continued) | |
PerkinElmer, Inc. | | | 191,621 | | | $ | 25,535,414 | |
West Pharmaceutical Services, Inc. | | | 112,374 | | | | 38,934,220 | |
| | | | | | | | |
| | | | | | | 232,388,181 | |
|
| Machinery — 2.3% | |
Caterpillar, Inc. | | | 316,022 | | | | 72,318,474 | |
Cummins, Inc. | | | 104,860 | | | | 25,048,957 | |
Dover Corp. | | | 212,883 | | | | 32,345,443 | |
Fortive Corp. | | | 535,747 | | | | 36,521,873 | |
IDEX Corp. | | | 48,910 | | | | 11,299,677 | |
Illinois Tool Works, Inc. | | | 206,505 | | | | 50,273,642 | |
Ingersoll Rand, Inc. | | | 613,665 | | | | 35,703,030 | |
Nordson Corp. | | | 81,886 | | | | 18,199,982 | |
Otis Worldwide Corp. | | | 629,830 | | | | 53,157,652 | |
PACCAR, Inc. | | | 792,454 | | | | 58,007,633 | |
Parker-Hannifin Corp. | | | 194,727 | | | | 65,449,692 | |
Pentair PLC | | | 247,802 | | | | 13,696,017 | |
Snap-on, Inc. | | | 34,385 | | | | 8,489,313 | |
Stanley Black & Decker, Inc. | | | 225,040 | | | | 18,133,723 | |
Westinghouse Air Brake Technologies Corp. | | | 275,853 | | | | 27,877,704 | |
Xylem, Inc. | | | 273,140 | | | | 28,597,758 | |
| | | | | | | | |
| | | | | | | 555,120,570 | |
|
| Media — 1.7% | |
Charter Communications, Inc., Class A(a)(b) | | | 159,894 | | | | 57,179,693 | |
Comcast Corp., Class A | | | 6,386,165 | | | | 242,099,515 | |
DISH Network Corp., Class A(a) | | | 378,055 | | | | 3,527,253 | |
Fox Corp., Class A, NVS | | | 449,849 | | | | 15,317,359 | |
Fox Corp., Class B | | | 210,142 | | | | 6,579,546 | |
Interpublic Group of Cos., Inc. | | | 590,637 | | | | 21,995,322 | |
News Corp., Class A, NVS | | | 575,974 | | | | 9,947,071 | |
News Corp., Class B | | | 176,666 | | | | 3,079,289 | |
Omnicom Group, Inc. | | | 307,321 | | | | 28,992,663 | |
Paramount Global, Class B, NVS | | | 769,856 | | | | 17,175,487 | |
| | | | | | | | |
| | | | | | | 405,893,198 | |
|
| Metals & Mining — 0.2% | |
Newmont Corp. | | | 1,204,991 | | | | 59,068,659 | |
| | | | | | | | |
|
| Multi-Utilities — 1.5% | |
Ameren Corp. | | | 393,944 | | | | 34,032,822 | |
CenterPoint Energy, Inc. | | | 954,542 | | | | 28,120,807 | |
CMS Energy Corp. | | | 444,033 | | | | 27,254,745 | |
Consolidated Edison, Inc. | | | 538,725 | | | | 51,539,821 | |
Dominion Energy, Inc. | | | 1,264,424 | | | | 70,693,946 | |
DTE Energy Co. | | | 293,452 | | | | 32,144,732 | |
NiSource, Inc. | | | 618,857 | | | | 17,303,242 | |
Public Service Enterprise Group, Inc. | | | 757,465 | | | | 47,303,689 | |
Sempra Energy | | | 190,618 | | | | 28,813,817 | |
WEC Energy Group, Inc. | | | 230,167 | | | | 21,817,530 | |
| | | | | | | | |
| | | | | | | 359,025,151 | |
|
| Office REITs — 0.2% | |
Alexandria Real Estate Equities, Inc. | | | 238,527 | | | | 29,956,606 | |
Boston Properties, Inc. | | | 214,728 | | | | 11,621,079 | |
| | | | | | | | |
| | | | | | | 41,577,685 | |
|
| Oil, Gas & Consumable Fuels — 1.0% | |
Kinder Morgan, Inc. | | | 3,003,226 | | | | 52,586,487 | |
Marathon Petroleum Corp. | | | 358,357 | | | | 48,317,275 | |
Phillips 66 | | | 707,456 | | | | 71,721,889 | |
Valero Energy Corp. | | | 585,475 | | | | 81,732,310 | |
| | | | | | | | |
| | | | | | | 254,357,961 | |
|
| Passenger Airlines — 0.4% | |
Alaska Air Group, Inc.(a) | | | 193,596 | | | | 8,123,288 | |
| | | | | | | | |
| Security | | Shares | | | Value | |
|
| Passenger Airlines (continued) | |
American Airlines Group, Inc.(a)(b) | | | 985,114 | | | $ | 14,530,432 | |
Delta Air Lines, Inc.(a) | | | 971,861 | | | | 33,937,386 | |
Southwest Airlines Co. | | | 905,436 | | | | 29,462,887 | |
United Airlines Holdings, Inc.(a) | | �� | 496,407 | | | | 21,966,010 | |
| | | | | | | | |
| | | | | | | 108,020,003 | |
|
| Personal Care Products — 0.4% | |
Estee Lauder Cos., Inc., Class A | | | 351,713 | | | | 86,683,186 | |
| | | | | | | | |
|
| Pharmaceuticals — 1.6% | |
Catalent, Inc.(a) | | | 273,947 | | | | 18,001,057 | |
Johnson & Johnson | | | 1,508,255 | | | | 233,779,525 | |
Organon & Co. | | | 387,804 | | | | 9,121,150 | |
Viatris, Inc. | | | 1,843,998 | | | | 17,739,261 | |
Zoetis, Inc., Class A | | | 707,566 | | | | 117,767,285 | |
| | | | | | | | |
| | | | | | | 396,408,278 | |
|
| Professional Services — 0.5% | |
Broadridge Financial Solutions, Inc. | | | 93,576 | | | | 13,715,434 | |
Equifax, Inc. | | | 95,006 | | | | 19,271,017 | |
Jacobs Solutions, Inc. | | | 192,125 | | | | 22,576,609 | |
Leidos Holdings, Inc. | | | 72,130 | | | | 6,640,288 | |
Paychex, Inc. | | | 209,415 | | | | 23,996,865 | |
Robert Half International, Inc.(b) | | | 163,411 | | | | 13,166,024 | |
Verisk Analytics, Inc. | | | 128,290 | | | | 24,613,719 | |
| | | | | | | | |
| | | | | | | 123,979,956 | |
|
| Real Estate Management & Development — 0.1% | |
CBRE Group, Inc., Class A(a) | | | 480,882 | | | | 35,013,018 | |
| | | | | | | | |
|
| Residential REITs — 0.7% | |
AvalonBay Communities, Inc. | | | 213,036 | | | | 35,802,830 | |
Camden Property Trust | | | 167,910 | | | | 17,603,684 | |
Equity Residential | | | 518,712 | | | | 31,122,720 | |
Essex Property Trust, Inc. | | | 98,386 | | | | 20,576,448 | |
Invitation Homes, Inc. | | | 881,076 | | | | 27,516,004 | |
Mid-America Apartment Communities, Inc. | | | 175,234 | | | | 26,467,343 | |
UDR, Inc. | | | 471,483 | | | | 19,359,092 | |
| | | | | | | | |
| | | | | | | 178,448,121 | |
|
| Retail REITs — 0.7% | |
Federal Realty Investment Trust | | | 112,144 | | | | 11,083,191 | |
Kimco Realty Corp. | | | 940,652 | | | | 18,370,934 | |
Realty Income Corp. | | | 952,107 | | | | 60,287,415 | |
Regency Centers Corp. | | | 235,178 | | | | 14,388,190 | |
Simon Property Group, Inc. | | | 496,339 | | | | 55,575,078 | |
| | | | | | | | |
| | | | | | | 159,704,808 | |
|
| Semiconductors & Semiconductor Equipment — 3.6% | |
Advanced Micro Devices, Inc.(a) | | | 1,125,968 | | | | 110,356,124 | |
Analog Devices, Inc. | | | 407,828 | | | | 80,431,838 | |
Broadcom, Inc. | | | 253,756 | | | | 162,794,624 | |
Intel Corp. | | | 6,280,490 | | | | 205,183,608 | |
Microchip Technology, Inc. | | | 424,111 | | | | 35,532,020 | |
Micron Technology, Inc. | | | 1,656,536 | | | | 99,955,382 | |
NXP Semiconductors NV | | | 161,274 | | | | 30,073,569 | |
Qorvo, Inc.(a) | | | 151,637 | | | | 15,401,770 | |
Skyworks Solutions, Inc. | | | 241,332 | | | | 28,472,350 | |
Teradyne, Inc. | | | 119,729 | | | | 12,872,065 | |
Texas Instruments, Inc. | | | 509,023 | | | | 94,683,368 | |
| | | | | | | | |
| | | | | | | 875,756,718 | |
|
| Software — 8.9% | |
Adobe, Inc.(a) | | | 368,350 | | | | 141,951,039 | |
ANSYS, Inc.(a) | | | 132,132 | | | | 43,973,530 | |
Autodesk, Inc.(a) | | | 147,345 | | | | 30,671,335 | |
Ceridian HCM Holding, Inc.(a)(b) | | | 233,973 | | | | 17,131,503 | |
| | |
| 26 | | 2 0 2 3 I S H A R E S A N N U A L R E P O R T T O S H A R E H O L D E R S |
| | |
Schedule of Investments (continued) March 31, 2023 | | iShares® S&P 500 Value ETF (Percentages shown are based on Net Assets) |
| | | | | | | | |
| Security | | Shares | | | Value | |
|
| Software (continued) | |
Gen Digital, Inc. | | | 410,526 | | | $ | 7,044,626 | |
Intuit, Inc. | | | 200,443 | | | | 89,363,503 | |
Microsoft Corp. | | | 4,746,258 | | | | 1,368,346,181 | |
Oracle Corp. | | | 956,154 | | | | 88,845,830 | |
Roper Technologies, Inc. | | | 160,968 | | | | 70,936,988 | |
Salesforce, Inc.(a) | | | 1,518,118 | | | | 303,289,614 | |
Tyler Technologies, Inc.(a) | | | 33,270 | | | | 11,798,873 | |
| | | | | | | | |
| | | | | | | 2,173,353,022 | |
|
| Specialized REITs — 1.7% | |
American Tower Corp. | | | 332,212 | | | | 67,884,200 | |
Crown Castle, Inc. | | | 657,342 | | | | 87,978,653 | |
Digital Realty Trust, Inc. | | | 436,500 | | | | 42,912,315 | |
Equinix, Inc. | | | 140,474 | | | | 101,287,373 | |
Extra Space Storage, Inc. | | | 102,083 | | | | 16,632,383 | |
Iron Mountain, Inc. | | | 162,090 | | | | 8,576,182 | |
Public Storage | | | 91,205 | | | | 27,556,679 | |
SBA Communications Corp. | | | 72,313 | | | | 18,878,755 | |
VICI Properties, Inc. | | | 657,980 | | | | 21,463,308 | |
Weyerhaeuser Co. | | | 476,517 | | | | 14,357,457 | |
| | | | | | | | |
| | | | | | | 407,527,305 | |
|
| Specialty Retail — 1.8% | |
Advance Auto Parts, Inc. | | | 90,584 | | | | 11,015,920 | |
Bath & Body Works, Inc. | | | 344,085 | | | | 12,586,629 | |
Best Buy Co., Inc. | | | 300,227 | | | | 23,498,767 | |
CarMax, Inc.(a)(b) | | | 240,843 | | | | 15,481,388 | |
Home Depot, Inc. | | | 727,221 | | | | 214,617,462 | |
Lowe’s Cos., Inc. | | | 284,586 | | | | 56,908,663 | |
Ross Stores, Inc. | | | 522,798 | | | | 55,484,552 | |
TJX Cos., Inc. | | | 631,506 | | | | 49,484,810 | |
| | | | | | | | |
| | | | | | | 439,078,191 | |
|
| Technology Hardware, Storage & Peripherals — 0.5% | |
Hewlett Packard Enterprise Co. | | | 1,950,686 | | | | 31,074,428 | |
HP, Inc. | | | 1,310,698 | | | | 38,468,986 | |
NetApp, Inc. | | | 327,275 | | | | 20,896,509 | |
Seagate Technology Holdings PLC | | | 292,750 | | | | 19,356,630 | |
Western Digital Corp.(a) | | | 484,758 | | | | 18,260,834 | |
| | | | | | | | |
| | | | | | | 128,057,387 | |
|
| Textiles, Apparel & Luxury Goods — 1.1% | |
NIKE, Inc., Class B | | | 1,891,083 | | | | 231,922,419 | |
Ralph Lauren Corp., Class A | | | 61,936 | | | | 7,226,073 | |
| | | | | | | | |
| Security | | Shares | | | Value | |
|
| Textiles, Apparel & Luxury Goods (continued) | |
Tapestry, Inc. | | | 359,892 | | | $ | 15,514,944 | |
VF Corp. | | | 497,664 | | | | 11,401,483 | |
| | | | | | | | |
| | | | | | | 266,064,919 | |
|
| Tobacco — 0.7% | |
Altria Group, Inc. | | | 1,301,128 | | | | 58,056,332 | |
Philip Morris International, Inc. | | | 1,082,581 | | | | 105,281,002 | |
| | | | | | | | |
| | | | | | | 163,337,334 | |
|
| Trading Companies & Distributors — 0.3% | |
Fastenal Co. | | | 440,278 | | | | 23,748,595 | |
United Rentals, Inc. | | | 105,289 | | | | 41,669,175 | |
| | | | | | | | |
| | | | | | | 65,417,770 | |
|
| Water Utilities — 0.2% | |
American Water Works Co., Inc. | | | 292,947 | | | | 42,913,806 | |
| | | | | | | | |
|
| Wireless Telecommunication Services — 0.2% | |
T-Mobile U.S., Inc.(a)(b) | | | 287,574 | | | | 41,652,218 | |
| | | | | | | | |
| | |
Total Long-Term Investments — 99.8%
(Cost: $23,909,649,804) | | | | | | | 24,413,708,598 | |
| | | | | | | | |
|
| Short-Term Securities | |
|
| Money Market Funds — 1.0% | |
BlackRock Cash Funds: Institutional,
SL Agency Shares, 5.01%(c)(d)(e) | | | 210,041,981 | | | | 210,104,994 | |
BlackRock Cash Funds: Treasury,
SL Agency Shares, 4.73%(c)(d) | | | 39,913,921 | | | | 39,913,921 | |
| | | | | | | | |
| | |
Total Short-Term Securities — 1.0%
(Cost: $249,960,919) | | | | | | | 250,018,915 | |
| | | | | | | | |
| | |
Total Investments — 100.8%
(Cost: $24,159,610,723) | | | | | | | 24,663,727,513 | |
Liabilities in Excess of Other Assets — (0.8)% | | | | (187,452,265 | ) |
| | | | | | | | |
| | |
| Net Assets — 100.0% | | | | | $ 24,476,275,248 | |
| | | | | | | | |
| (a) | Non-income producing security. |
| (b) | All or a portion of this security is on loan. |
| (c) | Affiliate of the Fund. |
| (d) | Annualized 7-day yield as of period end. |
| (e) | All or a portion of this security was purchased with the cash collateral from loaned securities. |
| | |
S C H E D U L E S O F I N V E S T M E N T S | | 27 |
| | |
Schedule of Investments (continued) March 31, 2023 | | iShares® S&P 500 Value ETF |
Affiliates
Investments in issuers considered to be affiliate(s) of the Fund during the year ended March 31, 2023 for purposes of Section 2(a)(3) of the Investment Company Act of 1940, as amended, were as follows:
| | | | | | | | | | | | | | | | | | | | | | | | | | | | | | | | | | | | |
Affiliated Issuer | | Value at
03/31/22 | | | Purchases at Cost | | | Proceeds
from Sale | | | Net
Realized
Gain (Loss) | | | Change in
Unrealized
Appreciation
(Depreciation) | | | Value at
03/31/23 | | | Shares Held at
03/31/23 | | | Income | | | Capital Gain
Distributions
from Underlying
Funds | |
BlackRock Cash Funds: Institutional, SL Agency Shares | | $ | 121,421,682 | | | $ | 88,575,988 | (a) | | $ | — | | | $ | 65,722 | | | $ | 41,602 | | | $ | 210,104,994 | | | | 210,041,981 | | | $ | 611,881 | (b) | | $ | — | |
BlackRock Cash Funds: Treasury,
SL Agency Shares | | | 38,340,000 | | | | 1,573,921 | (a) | | | — | | | | — | | | | — | | | | 39,913,921 | | | | 39,913,921 | | | | 1,081,962 | | | | 26 | |
BlackRock, Inc. | | | 71,414,743 | | | | 119,884,466 | | | | (26,276,624 | ) | | | 10,063,198 | | | | (22,957,336 | ) | | | 152,128,447 | | | | 227,356 | | | | 2,607,235 | | | | — | |
| | | | | | | | | | | | | | | | | | | | | | | | | | | | | | | | | | | | |
| | | | | | | | | | | | | | $ | 10,128,920 | | | $ | (22,915,734 | ) | | $ | 402,147,362 | | | | | | | $ | 4,301,078 | | | $ | 26 | |
| | | | | | | | | | | | | | | | | | | | | | | | | | | | | | | | | | | | |
| | (a) | Represents net amount purchased (sold). | |
| | (b) | All or a portion represents securities lending income earned from the reinvestment of cash collateral from loaned securities, net of fees and collateral investment expenses, and other payments to and from borrowers of securities. | |
Derivative Financial Instruments Outstanding as of Period End
Futures Contracts
| | | | | | | | | | | | | | | | |
| |
| Description | | Number of
Contracts | | | Expiration
Date | | | Notional
Amount
(000) | | | Value/
Unrealized
Appreciation
(Depreciation) | |
| |
| | | | |
Long Contracts | | | | | | | | | | | | | | | | |
S&P 500 E-mini Index | | | 290 | | | | 06/16/23 | | | $ | 59,997 | | | $ | 3,170,929 | |
| | | | | | | | | | | | | | | | |
Derivative Financial Instruments Categorized by Risk Exposure
As of period end, the fair values of derivative financial instruments located in the Statements of Assets and Liabilities were as follows:
| | | | | | | | | | | | | | | | | | | | | | | | | | | | |
| |
| | | | | | | |
| | | Commodity
Contracts | | | Credit
Contracts | | | Equity
Contracts | | | Foreign
Currency
Exchange
Contracts | | | Interest
Rate
Contracts | | | Other
Contracts | | | Total | |
| |
| | | | | | | |
Assets — Derivative Financial Instruments | | | | | | | | | | | | | | | | | | | | | | | | | | | | |
Futures contracts | | | | | | | | | | | | | | | | | | | | | | | | | | | | |
Unrealized appreciation on futures contracts(a) | | $ | — | | | $ | — | | | $ | 3,170,929 | | | $ | — | | | $ | — | | | $ | — | | | $ | 3,170,929 | |
| | | | | | | | | | | | | | | | | | | | | | | | | | | | |
| | (a) | Net cumulative unrealized appreciation (depreciation) on futures contracts, if any, are reported in the Schedule of Investments. In the Statements of Assets and Liabilities, only current day’s variation margin is reported in receivables or payables and the net cumulative unrealized appreciation (depreciation) is included in accumulated earnings (loss). | |
For the period ended March 31, 2023, the effect of derivative financial instruments in the Statements of Operations was as follows:
| | | | | | | | | | | | | | | | | | | | | | | | | | | | |
| |
| | | | | | | |
| | | Commodity
Contracts | | | Credit
Contracts | | | Equity
Contracts | | | Foreign
Currency
Exchange
Contracts | | | Interest
Rate
Contracts | | | Other
Contracts | | | Total | |
| |
| | | | | | | |
Net Realized Gain (Loss) from | | | | | | | | | | | | | | | | | | | | | | | | | | | | |
Futures contracts | | $ | — | | | $ | — | | | $ | (11,438,758) | | | $ | — | | | $ | — | | | $ | — | | | $ | (11,438,758) | |
| | | | | | | | | | | | | | | | | | | | | | | | | | | | |
| | | | | | | |
Net Change in Unrealized Appreciation (Depreciation) on | | | | | | | | | | | | | | | | | | | | | | | | | | | | |
Futures contracts | | $ | — | | | $ | — | | | $ | (125,415) | | | $ | — | | | $ | — | | | $ | — | | | $ | (125,415) | |
| | | | | | | | | | | | | | | | | | | | | | | | | | | | |
| | |
| 28 | | 2 0 2 3 I S H A R E S A N N U A L R E P O R T T O S H A R E H O L D E R S |
| | |
Schedule of Investments (continued) March 31, 2023 | | iShares® S&P 500 Value ETF |
Average Quarterly Balances of Outstanding Derivative Financial Instruments
| | | | | | | | |
| | | |
Futures contracts | | | | | | | | |
| | |
Average notional value of contracts — long | | | | | | $ | 56,745,800 | |
For more information about the Fund’s investment risks regarding derivative financial instruments, refer to the Notes to Financial Statements.
Fair Value Hierarchy as of Period End
Various inputs are used in determining the fair value of financial instruments. For a description of the input levels and information about the Fund’s policy regarding valuation of financial instruments, refer to the Notes to Financial Statements.
The following table summarizes the Fund’s financial instruments categorized in the fair value hierarchy. The breakdown of the Fund’s financial instruments into major categories is disclosed in the Schedule of Investments above.
| | | | | | | | | | | | | | | | |
| |
| | | | |
| | | Level 1 | | | Level 2 | | | Level 3 | | | Total | |
| |
| | | | |
Assets | | | | | | | | | | | | | | | | |
Investments | | | | | | | | | | | | | | | | |
Long-Term Investments | | | | | | | | | | | | | | | | |
Common Stocks | | $ | 24,413,708,598 | | | $ | — | | | $ | — | | | $ | 24,413,708,598 | |
Short-Term Securities | | | | | | | | | | | | | | | | |
Money Market Funds | | | 250,018,915 | | | | — | | | | — | | | | 250,018,915 | |
| | | | | | | | | | | | | | | | |
| | $ | 24,663,727,513 | | | $ | — | | | $ | — | | | $ | 24,663,727,513 | |
| | | | | | | | | | | | | | | | |
| Derivative Financial Instruments(a) | | | | | | | | | | | | |
Assets | | | | | | | | | | | | | | | | |
Equity Contracts | | $ | 3,170,929 | | | $ | — | | | $ | — | | | $ | 3,170,929 | |
| | | | | | | | | | | | | | | | |
| (a) | Derivative financial instruments are futures contracts. Futures contracts are valued at the unrealized appreciation (depreciation) on the instrument. | |
See notes to financial statements.
| | |
S C H E D U L E S O F I N V E S T M E N T S | | 29 |
| | |
Schedule of Investments March 31, 2023 | | iShares® S&P Small-Cap 600 Value ETF (Percentages shown are based on Net Assets) |
| | | | | | | | |
| Security | | Shares | | | Value | |
|
Common Stocks | |
|
| Aerospace & Defense — 1.0% | |
AAR Corp.(a) | | | 502,160 | | | $ | 27,392,828 | |
Kaman Corp. | | | 427,639 | | | | 9,775,828 | |
Moog, Inc., Class A | | | 171,083 | | | | 17,236,612 | |
National Presto Industries, Inc. | | | 77,659 | | | | 5,598,437 | |
Triumph Group, Inc.(a) | | | 995,973 | | | | 11,543,327 | |
| | | | | | | | |
| | | | | | | 71,547,032 | |
|
| Air Freight & Logistics — 0.3% | |
Hub Group, Inc., Class A(a) | | | 274,485 | | | | 23,040,271 | |
| | | | | | | | |
|
| Automobile Components — 1.1% | |
American Axle & Manufacturing Holdings, Inc.(a) | | | 1,749,183 | | | | 13,661,119 | |
Gentherm, Inc.(a) | | | 198,114 | | | | 11,970,048 | |
LCI Industries | | | 194,306 | | | | 21,348,400 | |
Patrick Industries, Inc. | | | 329,053 | | | | 22,642,137 | |
Standard Motor Products, Inc. | | | 287,495 | | | | 10,611,441 | |
| | | | | | | | |
| | | | | | | 80,233,145 | |
|
| Automobiles — 0.2% | |
Winnebago Industries, Inc.(b) | | | 252,669 | | | | 14,579,001 | |
| | | | | | | | |
|
| Banks — 7.9% | |
Ameris Bancorp | | | 395,790 | | | | 14,477,998 | |
Atlantic Union Bankshares Corp. | | | 614,592 | | | | 21,541,450 | |
Axos Financial, Inc.(a)(b) | | | 380,837 | | | | 14,060,502 | |
Banc of California, Inc. | | | 725,381 | | | | 9,089,024 | |
BankUnited, Inc. | | | 1,061,859 | | | | 23,976,776 | |
Berkshire Hills Bancorp, Inc. | | | 297,000 | | | | 7,442,820 | |
Brookline Bancorp, Inc. | | | 1,362,600 | | | | 14,307,300 | |
Capitol Federal Financial, Inc. | | | 1,809,597 | | | | 12,178,588 | |
Central Pacific Financial Corp. | | | 306,136 | | | | 5,479,834 | |
Community Bank System, Inc. | | | 358,240 | | | | 18,804,018 | |
Customers Bancorp, Inc.(a) | | | 234,869 | | | | 4,349,774 | |
Eagle Bancorp, Inc. | | | 377,077 | | | | 12,620,767 | |
FB Financial Corp. | | | 266,657 | | | | 8,287,699 | |
First Bancorp/Southern Pines NC | | | 257,134 | | | | 9,133,400 | |
First Commonwealth Financial Corp. | | | 711,699 | | | | 8,846,419 | |
First Financial Bancorp | | | 661,663 | | | | 14,404,403 | |
First Hawaiian, Inc. | | | 936,581 | | | | 19,321,666 | |
Hilltop Holdings, Inc. | | | 703,595 | | | | 20,875,664 | |
HomeStreet, Inc. | | | 264,517 | | | | 4,758,661 | |
Hope Bancorp, Inc. | | | 1,784,024 | | | | 17,519,116 | |
Independent Bank Corp. | | | 339,855 | | | | 22,301,285 | |
Independent Bank Group, Inc. | | | 542,702 | | | | 25,154,238 | |
National Bank Holdings Corp., Class A | | | 196,029 | | | | 6,559,130 | |
Northfield Bancorp, Inc. | | | 306,132 | | | | 3,606,235 | |
Northwest Bancshares, Inc. | | | 945,315 | | | | 11,372,139 | |
Pacific Premier Bancorp, Inc. | | | 1,232,118 | | | | 29,595,474 | |
Pathward Financial, Inc. | | | 80,744 | | | | 3,350,069 | |
Provident Financial Services, Inc. | | | 975,615 | | | | 18,712,296 | |
Renasant Corp. | | | 784,030 | | | | 23,975,637 | |
S&T Bancorp, Inc. | | | 192,722 | | | | 6,061,107 | |
Seacoast Banking Corp. of Florida | | | 584,661 | | | | 13,856,466 | |
Simmons First National Corp., Class A | | | 1,798,159 | | | | 31,449,801 | |
Southside Bancshares, Inc. | | | 168,758 | | | | 5,602,766 | |
Tompkins Financial Corp. | | | 68,240 | | | | 4,518,170 | |
Triumph Financial, Inc.(a)(b) | | | 140,568 | | | | 8,161,378 | |
TrustCo Bank Corp. | | | 104,735 | | | | 3,345,236 | |
Trustmark Corp. | | | 301,329 | | | | 7,442,826 | |
United Community Banks, Inc. | | | 625,109 | | | | 17,578,065 | |
Veritex Holdings, Inc. | | | 356,356 | | | | 6,507,060 | |
| | | | | | | | |
| Security | | Shares | | | Value | |
|
| Banks (continued) | |
Washington Federal, Inc. | | | 416,706 | | | $ | 12,551,185 | |
WSFS Financial Corp. | | | 736,523 | | | | 27,700,630 | |
| | | | | | | | |
| | | | | | | 550,877,072 | |
|
| Beverages — 0.1% | |
National Beverage Corp.(a) | | | 114,277 | | | | 6,024,683 | |
| | | | | | | | |
|
| Biotechnology — 1.1% | |
Anika Therapeutics, Inc.(a)(b) | | | 105,839 | | | | 3,039,696 | |
Avid Bioservices, Inc.(a) | | | 295,162 | | | | 5,537,239 | |
Coherus Biosciences, Inc.(a)(b) | | | 477,295 | | | | 3,264,698 | |
Eagle Pharmaceuticals, Inc.(a)(b) | | | 51,884 | | | | 1,471,949 | |
Emergent BioSolutions, Inc.(a)(b) | | | 679,404 | | | | 7,038,626 | |
Enanta Pharmaceuticals, Inc.(a)(b) | | | 182,785 | | | | 7,391,825 | |
Ironwood Pharmaceuticals, Inc., Class A(a) | | | 753,627 | | | | 7,928,156 | |
Myriad Genetics, Inc.(a)(b) | | | 1,241,844 | | | | 28,848,036 | |
Progenics Pharmaceuticals, Inc., CVR(a)(b)(c) | | | 181,178 | | | | 2 | |
Vanda Pharmaceuticals, Inc.(a) | | | 868,910 | | | | 5,899,899 | |
Vericel Corp.(a)(b) | | | 308,681 | | | | 9,050,527 | |
| | | | | | | | |
| | | | | | | 79,470,653 | |
|
| Broadline Retail — 0.1% | |
Big Lots, Inc. | | | 436,987 | | | | 4,789,378 | |
| | | | | | | | |
|
| Building Products — 1.8% | |
American Woodmark Corp.(a)(b) | | | 253,873 | | | | 13,219,167 | |
Apogee Enterprises, Inc. | | | 145,787 | | | | 6,305,288 | |
AZZ, Inc. | | | 380,257 | | | | 15,681,799 | |
Gibraltar Industries, Inc.(a) | | | 473,327 | | | | 22,956,359 | |
Insteel Industries, Inc. | | | 158,483 | | | | 4,408,997 | |
Masterbrand, Inc.(a) | | | 1,958,654 | | | | 15,747,578 | |
Quanex Building Products Corp. | | | 218,971 | | | | 4,714,446 | |
Resideo Technologies, Inc.(a)(b) | | | 2,233,584 | | | | 40,829,915 | |
| | | | | | | | |
| | | | | | | 123,863,549 | |
|
| Capital Markets — 0.4% | |
B Riley Financial, Inc.(b) | | | 123,158 | | | | 3,496,456 | |
Brightsphere Investment Group, Inc. | | | 234,093 | | | | 5,519,913 | |
Donnelley Financial Solutions, Inc.(a)(b) | | | 190,695 | | | | 7,791,798 | |
Virtus Investment Partners, Inc. | | | 52,426 | | | | 9,981,386 | |
WisdomTree, Inc. | | | 789,156 | | | | 4,624,454 | |
| | | | | | | | |
| | | | | | | 31,414,007 | |
|
| Chemicals — 1.8% | |
AdvanSix, Inc. | | | 421,845 | | | | 16,144,008 | |
FutureFuel Corp. | | | 167,515 | | | | 1,236,261 | |
HB Fuller Co. | | | 295,442 | | | | 20,223,005 | |
Koppers Holdings, Inc. | | | 319,071 | | | | 11,157,913 | |
Mativ Holdings, Inc. | | | 840,778 | | | | 18,051,504 | |
Minerals Technologies, Inc. | | | 496,949 | | | | 30,025,658 | |
Rayonier Advanced Materials, Inc.(a) | | | 976,604 | | | | 6,123,307 | |
Stepan Co. | | | 113,228 | | | | 11,665,881 | |
Trinseo PLC | | | 535,804 | | | | 11,171,513 | |
| | | | | | | | |
| | | | | | | 125,799,050 | |
|
| Commercial Services & Supplies — 3.5% | |
ABM Industries, Inc. | | | 1,011,323 | | | | 45,448,856 | |
Brady Corp., Class A, NVS | | | 247,008 | | | | 13,271,740 | |
CoreCivic, Inc.(a) | | | 1,756,391 | | | | 16,158,797 | |
Deluxe Corp. | | | 655,469 | | | | 10,487,504 | |
GEO Group, Inc.(a) | | | 1,899,788 | | | | 14,989,327 | |
Harsco Corp.(a)(b) | | | 1,212,982 | | | | 8,284,667 | |
Healthcare Services Group, Inc. | | | 1,131,590 | | | | 15,695,153 | |
HNI Corp. | | | 631,880 | | | | 17,591,539 | |
Interface, Inc., Class A | | | 886,324 | | | | 7,196,951 | |
KAR Auction Services, Inc.(a)(b) | | | 1,664,318 | | | | 22,767,870 | |
| | |
| 30 | | 2 0 2 3 I S H A R E S A N N U A L R E P O R T T O S H A R E H O L D E R S |
| | |
Schedule of Investments (continued) March 31, 2023 | | iShares® S&P Small-Cap 600 Value ETF (Percentages shown are based on Net Assets) |
| | | | | | | | |
| Security | | Shares | | | Value | |
|
| Commercial Services & Supplies (continued) | |
Liquidity Services, Inc.(a)(b) | | | 162,854 | | | $ | 2,144,787 | |
Matthews International Corp., Class A | | | 465,505 | | | | 16,786,110 | |
MillerKnoll, Inc. | | | 1,155,752 | | | | 23,635,129 | |
Pitney Bowes, Inc. | | | 2,083,630 | | | | 8,105,321 | |
UniFirst Corp. | | | 94,834 | | | | 16,712,596 | |
Viad Corp.(a) | | | 315,311 | | | | 6,571,081 | |
| | | | | | | | |
| | | | | | | 245,847,428 | |
|
| Communications Equipment — 1.1% | |
ADTRAN Holdings, Inc. | | | 334,867 | | | | 5,310,991 | |
Comtech Telecommunications Corp. | | | 425,007 | | | | 5,304,087 | |
NETGEAR, Inc.(a) | | | 441,080 | | | | 8,164,391 | |
Viasat, Inc.(a) | | | 1,170,039 | | | | 39,594,120 | |
Viavi Solutions, Inc.(a) | | | 1,648,220 | | | | 17,850,222 | |
| | | | | | | | |
| | | | | | | 76,223,811 | |
|
| Construction & Engineering — 1.0% | |
Arcosa, Inc. | | | 251,106 | | | | 15,847,300 | |
Dycom Industries, Inc.(a)(b) | | | 144,436 | | | | 13,526,431 | |
Granite Construction, Inc.(b) | | | 670,428 | | | | 27,541,182 | |
MYR Group, Inc.(a) | | | 127,164 | | | | 16,023,936 | |
| | | | | | | | |
| | | | | | | 72,938,849 | |
|
| Consumer Finance — 1.6% | |
Bread Financial Holdings, Inc. | | | 431,035 | | | | 13,068,981 | |
Encore Capital Group, Inc.(a)(b) | | | 357,236 | | | | 18,022,556 | |
Enova International, Inc.(a) | | | 477,097 | | | | 21,197,420 | |
EZCORP, Inc., Class A, NVS(a)(b) | | | 804,045 | | | | 6,914,787 | |
LendingTree, Inc.(a) | | | 164,018 | | | | 4,372,720 | |
PRA Group, Inc.(a) | | | 595,476 | | | | 23,199,745 | |
PROG Holdings, Inc.(a)(b) | | | 764,355 | | | | 18,184,005 | |
World Acceptance Corp.(a)(b) | | | 50,506 | | | | 4,206,645 | |
| | | | | | | | |
| | | | | | | 109,166,859 | |
|
| Consumer Staples Distribution & Retail — 1.2% | |
Andersons, Inc. | | | 267,055 | | | | 11,034,712 | |
Chefs’ Warehouse, Inc.(a)(b) | | | 197,374 | | | | 6,720,585 | |
PriceSmart, Inc. | | | 385,631 | | | | 27,564,904 | |
SpartanNash Co. | | | 538,800 | | | | 13,362,240 | |
United Natural Foods, Inc.(a) | | | 917,045 | | | | 24,164,136 | |
| | | | | | | | |
| | | | | | | 82,846,577 | |
|
| Containers & Packaging — 0.4% | |
O-I Glass, Inc.(a) | | | 1,274,661 | | | | 28,947,551 | |
| | | | | | | | |
|
| Diversified Consumer Services — 0.6% | |
Frontdoor, Inc.(a)(b) | | | 597,500 | | | | 16,658,300 | |
Mister Car Wash, Inc.(a)(b) | | | 595,278 | | | | 5,131,296 | |
Perdoceo Education Corp.(a) | | | 380,748 | | | | 5,113,446 | |
Strategic Education, Inc. | | | 146,139 | | | | 13,127,666 | |
| | | | | | | | |
| | | | | | | 40,030,708 | |
|
| Diversified REITs — 1.6% | |
Alexander & Baldwin, Inc. | | | 1,107,816 | | | | 20,948,801 | |
American Assets Trust, Inc. | | | 799,975 | | | | 14,871,535 | |
Armada Hoffler Properties, Inc. | | | 357,708 | | | | 4,224,531 | |
Essential Properties Realty Trust, Inc. | | | 2,178,948 | | | | 54,146,858 | |
Global Net Lease, Inc. | | | 1,585,955 | | | | 20,395,381 | |
| | | | | | | | |
| | | | | | | 114,587,106 | |
|
| Diversified Telecommunication Services — 0.8% | |
Cogent Communications Holdings, Inc. | | | 268,084 | | | | 17,082,312 | |
Consolidated Communications Holdings, Inc.(a) | | | 1,114,438 | | | | 2,875,250 | |
Lumen Technologies, Inc.(b) | | | 14,116,772 | | | | 37,409,446 | |
| | | | | | | | |
| | | | | | | 57,367,008 | |
| | | | | | | | |
| Security | | Shares | | | Value | |
|
| Electric Utilities — 0.3% | |
Otter Tail Corp. | | | 248,456 | | | $ | 17,955,915 | |
| | | | | | | | |
|
| Electrical Equipment — 0.1% | |
Powell Industries, Inc. | | | 139,445 | | | | 5,938,963 | |
| | | | | | | | |
|
| Electronic Equipment, Instruments & Components — 4.3% | |
Arlo Technologies, Inc.(a)(b) | | | 667,511 | | | | 4,045,117 | |
Benchmark Electronics, Inc. | | | 537,247 | | | | 12,727,381 | |
ePlus, Inc.(a) | | | 212,518 | | | | 10,421,883 | |
FARO Technologies, Inc.(a) | | | 286,192 | | | | 7,043,185 | |
Insight Enterprises, Inc.(a)(b) | | | 463,899 | | | | 66,319,001 | |
Itron, Inc.(a)(b) | | | 691,392 | | | | 38,337,686 | |
Knowles Corp.(a)(b) | | | 1,393,930 | | | | 23,696,810 | |
Methode Electronics, Inc. | | | 265,090 | | | | 11,632,149 | |
OSI Systems, Inc.(a) | | | 117,657 | | | | 12,043,371 | |
PC Connection, Inc. | | | 172,206 | | | | 7,742,382 | |
Rogers Corp.(a) | | | 289,539 | | | | 47,319,359 | |
Sanmina Corp.(a) | | | 482,884 | | | | 29,451,095 | |
ScanSource, Inc.(a) | | | 395,001 | | | | 12,023,830 | |
TTM Technologies, Inc.(a)(b) | | | 1,561,722 | | | | 21,067,630 | |
| | | | | | | | |
| | | | | | | 303,870,879 | |
|
| Energy Equipment & Services — 2.2% | |
Archrock, Inc. | | | 2,051,859 | | | | 20,046,662 | |
Bristow Group, Inc.(a) | | | 359,181 | | | | 8,045,654 | |
Core Laboratories NV(b) | | | 370,124 | | | | 8,161,234 | |
DMC Global, Inc.(a) | | | 283,227 | | | | 6,222,497 | |
Dril-Quip, Inc.(a) | | | 243,013 | | | | 6,972,043 | |
Helix Energy Solutions Group, Inc.(a) | | | 2,179,968 | | | | 16,872,952 | |
Helmerich & Payne, Inc. | | | 673,006 | | | | 24,059,965 | |
Nabors Industries Ltd.(a)(b) | | | 44,039 | | | | 5,368,795 | |
NexTier Oilfield Solutions, Inc.(a)(b) | | | 1,339,688 | | | | 10,650,520 | |
Oceaneering International, Inc.(a) | | | 427,555 | | | | 7,537,795 | |
Oil States International, Inc.(a) | | | 975,306 | | | | 8,124,299 | |
Patterson-UTI Energy, Inc. | | | 1,061,696 | | | | 12,421,843 | |
ProPetro Holding Corp.(a) | | | 1,474,179 | | | | 10,599,347 | |
U.S. Silica Holdings, Inc.(a) | | | 486,562 | | | | 5,809,550 | |
| | | | | | | | |
| | | | | | | 150,893,156 | |
|
| Entertainment — 0.4% | |
Cinemark Holdings, Inc.(a)(b) | | | 1,642,654 | | | | 24,294,853 | |
Marcus Corp.(b) | | | 372,657 | | | | 5,962,512 | |
| | | | | | | | |
| | | | | | | 30,257,365 | |
|
| Financial Services — 1.2% | |
EVERTEC, Inc. | | | 349,615 | | | | 11,799,506 | |
NMI Holdings, Inc., Class A(a)(b) | | | 627,429 | | | | 14,010,490 | |
Payoneer Global, Inc.(a) | | | 1,736,069 | | | | 10,902,513 | |
Radian Group, Inc. | | | 650,066 | | | | 14,366,459 | |
Star Holdings(a) | | | 10,710 | | | | 186,242 | |
Walker & Dunlop, Inc. | | | 469,567 | | | | 35,766,919 | |
| | | | | | | | |
| | | | | | | 87,032,129 | |
|
| Food Products — 1.3% | |
B&G Foods, Inc. | | | 1,094,789 | | | | 17,002,073 | |
Calavo Growers, Inc. | | | 270,421 | | | | 7,780,012 | |
Fresh Del Monte Produce, Inc. | | | 469,132 | | | | 14,125,565 | |
Hain Celestial Group, Inc.(a)(b) | | | 1,366,062 | | | | 23,427,963 | |
John B Sanfilippo & Son, Inc. | | | 53,452 | | | | 5,180,568 | |
Seneca Foods Corp., Class A(a) | | | 81,306 | | | | 4,249,865 | |
TreeHouse Foods, Inc.(a)(b) | | | 409,372 | | | | 20,644,630 | |
| | | | | | | | |
| | | | | | | 92,410,676 | |
| | |
S C H E D U L E S O F I N V E S T M E N T S | | 31 |
| | |
Schedule of Investments (continued) March 31, 2023 | | iShares® S&P Small-Cap 600 Value ETF (Percentages shown are based on Net Assets) |
| | | | | | | | |
| Security | | Shares | | | Value | |
|
| Gas Utilities — 0.3% | |
Chesapeake Utilities Corp. | | | 90,440 | | | $ | 11,575,416 | |
Northwest Natural Holding Co. | | | 192,075 | | | | 9,135,087 | |
| | | | | | | | |
| | | | | | | 20,710,503 | |
|
| Ground Transportation — 1.0% | |
ArcBest Corp. | | | 370,548 | | | | 34,246,046 | |
Heartland Express, Inc. | | | 246,106 | | | | 3,918,008 | |
RXO, Inc.(a) | | | 1,783,668 | | | | 35,031,239 | |
| | | | | | | | |
| | | | | | | 73,195,293 | |
|
| Health Care Equipment & Supplies — 3.5% | |
AngioDynamics, Inc.(a) | | | 597,278 | | | | 6,175,855 | |
Artivion, Inc.(a) | | | 614,065 | | | | 8,044,252 | |
Avanos Medical, Inc.(a) | | | 710,530 | | | | 21,131,162 | |
Cardiovascular Systems, Inc.(a) | | | 642,056 | | | | 12,751,232 | |
CONMED Corp. | | | 238,276 | | | | 24,747,345 | |
Cutera, Inc.(a)(b) | | | 78,152 | | | | 1,845,950 | |
Embecta Corp. | | | 463,000 | | | | 13,019,560 | |
Glaukos Corp.(a)(b) | | | 240,460 | | | | 12,047,046 | |
Heska Corp.(a) | | | 155,446 | | | | 15,174,639 | |
Inogen, Inc.(a) | | | 351,463 | | | | 4,386,258 | |
Integer Holdings Corp.(a)(b) | | | 507,727 | | | | 39,348,843 | |
LeMaitre Vascular, Inc. | | | 91,915 | | | | 4,730,865 | |
Mesa Laboratories, Inc.(b) | | | 29,182 | | | | 5,098,971 | |
NuVasive, Inc.(a) | | | 797,872 | | | | 32,960,092 | |
OraSure Technologies, Inc.(a) | | | 1,106,128 | | | | 6,692,074 | |
Orthofix Medical, Inc.(a) | | | 519,726 | | | | 8,705,411 | |
Tandem Diabetes Care, Inc.(a)(b) | | | 392,872 | | | | 15,954,532 | |
Varex Imaging Corp.(a) | | | 612,018 | | | | 11,132,607 | |
| | | | | | | | |
| | | | | | | 243,946,694 | |
|
| Health Care Providers & Services — 3.1% | |
Agiliti, Inc.(a)(b) | | | 280,918 | | | | 4,489,070 | |
Apollo Medical Holdings, Inc.(a)(b) | | | 601,072 | | | | 21,921,096 | |
Community Health Systems, Inc.(a) | | | 1,903,500 | | | | 9,327,150 | |
CorVel Corp.(a) | | | 48,413 | | | | 9,212,025 | |
Enhabit, Inc.(a)(b) | | | 760,151 | | | | 10,573,700 | |
Fulgent Genetics, Inc.(a)(b) | | | 165,859 | | | | 5,178,118 | |
ModivCare, Inc.(a) | | | 194,371 | | | | 16,342,714 | |
NeoGenomics, Inc.(a) | | | 1,935,505 | | | | 33,697,142 | |
Owens & Minor, Inc.(a) | | | 1,164,314 | | | | 16,940,769 | |
Pediatrix Medical Group, Inc.(a) | | | 1,251,635 | | | | 18,661,878 | |
RadNet, Inc.(a) | | | 747,632 | | | | 18,713,229 | |
Select Medical Holdings Corp. | | | 1,595,231 | | | | 41,236,721 | |
U.S. Physical Therapy, Inc. | | | 77,275 | | | | 7,565,995 | |
| | | | | | | | |
| | | | | | | 213,859,607 | |
|
| Health Care REITs — 0.4% | |
CareTrust REIT, Inc. | | | 576,950 | | | | 11,296,681 | |
Community Healthcare Trust, Inc. | | | 144,009 | | | | 5,270,730 | |
LTC Properties, Inc. | | | 215,872 | | | | 7,583,583 | |
Universal Health Realty Income Trust | | | 67,073 | | | | 3,226,882 | |
| | | | | | | | |
| | | | | | | 27,377,876 | |
|
| Health Care Technology — 0.4% | |
Certara, Inc.(a)(b) | | | 678,432 | | | | 16,356,996 | |
Computer Programs & Systems, Inc.(a) | | | 100,950 | | | | 3,048,690 | |
HealthStream, Inc.(a) | | | 131,242 | | | | 3,556,658 | |
Simulations Plus, Inc.(b) | | | 79,994 | | | | 3,514,936 | |
| | | | | | | | |
| | | | | | | 26,477,280 | |
|
| Hotel & Resort REITs — 2.2% | |
Chatham Lodging Trust | | | 747,780 | | | | 7,844,212 | |
DiamondRock Hospitality Co. | | | 3,205,530 | | | | 26,060,959 | |
Pebblebrook Hotel Trust | | | 1,844,384 | | | | 25,895,151 | |
Service Properties Trust | | | 2,535,851 | | | | 25,257,076 | |
| | | | | | | | |
| Security | | Shares | | | Value | |
|
| Hotel & Resort REITs (continued) | |
Summit Hotel Properties, Inc. | | | 1,631,504 | | | $ | 11,420,528 | |
Sunstone Hotel Investors, Inc. | | | 3,219,858 | | | | 31,812,197 | |
Xenia Hotels & Resorts, Inc. | | | 1,765,054 | | | | 23,104,557 | |
| | | | | | | | |
| | | | | | | 151,394,680 | |
|
| Hotels, Restaurants & Leisure — 2.8% | |
BJ’s Restaurants, Inc.(a) | | | 357,937 | | | | 10,430,284 | |
Bloomin’ Brands, Inc. | | | 563,188 | | | | 14,445,772 | |
Brinker International, Inc.(a)(b) | | | 675,088 | | | | 25,653,344 | |
Cheesecake Factory, Inc. | | | 733,766 | | | | 25,718,498 | |
Chuy’s Holdings, Inc.(a)(b) | | | 126,843 | | | | 4,547,321 | |
Cracker Barrel Old Country Store, Inc. | | | 340,121 | | | | 38,637,746 | |
Dave & Buster’s Entertainment, Inc.(a) | | | 283,198 | | | | 10,418,854 | |
Dine Brands Global, Inc. | | | 95,681 | | | | 6,471,863 | |
El Pollo Loco Holdings, Inc. | | | 296,312 | | | | 2,841,632 | |
Golden Entertainment, Inc.(a) | | | 130,708 | | | | 5,687,105 | |
Ruth’s Hospitality Group, Inc. | | | 219,561 | | | | 3,605,192 | |
Sabre Corp.(a)(b) | | | 3,108,444 | | | | 13,335,225 | |
Shake Shack, Inc., Class A(a)(b) | | | 267,910 | | | | 14,866,326 | |
Six Flags Entertainment Corp.(a) | | | 644,353 | | | | 17,210,669 | |
| | | | | | | | |
| | | | | | | 193,869,831 | |
|
| Household Durables — 4.6% | |
Century Communities, Inc. | | | 433,936 | | | | 27,737,189 | |
Installed Building Products, Inc. | | | 121,829 | | | | 13,892,161 | |
iRobot Corp.(a) | | | 416,019 | | | | 18,155,069 | |
La-Z-Boy, Inc. | | | 659,088 | | | | 19,166,279 | |
LGI Homes, Inc.(a)(b) | | | 313,652 | | | | 35,765,738 | |
M/I Homes, Inc.(a) | | | 420,205 | | | | 26,510,733 | |
MDC Holdings, Inc. | | | 888,665 | | | | 34,542,409 | |
Meritage Homes Corp. | | | 559,807 | | | | 65,363,065 | |
Sonos, Inc.(a)(b) | | | 1,947,885 | | | | 38,217,504 | |
Tri Pointe Homes, Inc.(a) | | | 1,546,374 | | | | 39,154,190 | |
| | | | | | | | |
| | | | | | | 318,504,337 | |
|
| Household Products — 0.4% | |
Central Garden & Pet Co.(a)(b) | | | 75,866 | | | | 3,115,058 | |
Central Garden & Pet Co., Class A, NVS(a)(b) | | | 327,946 | | | | 12,812,850 | |
WD-40 Co.(b) | | | 72,774 | | | | 12,957,411 | |
| | | | | | | | |
| | | | | | | 28,885,319 | |
|
| Industrial REITs — 0.6% | |
LXP Industrial Trust | | | 4,221,975 | | | | 43,528,562 | |
| | | | | | | | |
|
| Insurance — 3.1% | |
Ambac Financial Group, Inc.(a) | | | 683,090 | | | | 10,574,233 | |
American Equity Investment Life Holding Co. | | | 509,075 | | | | 18,576,147 | |
AMERISAFE, Inc. | | | 131,457 | | | | 6,434,820 | |
Assured Guaranty Ltd. | | | 448,985 | | | | 22,570,476 | |
Employers Holdings, Inc. | | | 210,433 | | | | 8,772,952 | |
Genworth Financial, Inc., Class A(a) | | | 7,058,725 | | | | 35,434,799 | |
HCI Group, Inc. | | | 102,477 | | | | 5,492,767 | |
Horace Mann Educators Corp. | | | 573,102 | | | | 19,187,455 | |
James River Group Holdings Ltd. | | | 527,798 | | | | 10,899,029 | |
Mercury General Corp. | | | 406,698 | | | | 12,908,594 | |
ProAssurance Corp. | | | 770,888 | | | | 14,246,010 | |
Safety Insurance Group, Inc. | | | 101,021 | | | | 7,528,085 | |
SiriusPoint Ltd.(a) | | | 1,296,496 | | | | 10,540,512 | |
Stewart Information Services Corp. | | | 395,033 | | | | 15,939,582 | |
United Fire Group, Inc. | | | 340,112 | | | | 9,029,974 | |
Universal Insurance Holdings, Inc. | | | 437,757 | | | | 7,975,933 | |
| | | | | | | | |
| | | | | | | 216,111,368 | |
|
| Interactive Media & Services — 0.5% | |
QuinStreet, Inc.(a) | | | 370,821 | | | | 5,884,929 | |
| | |
| 32 | | 2 0 2 3 I S H A R E S A N N U A L R E P O R T T O S H A R E H O L D E R S |
| | |
Schedule of Investments (continued) March 31, 2023 | | iShares® S&P Small-Cap 600 Value ETF (Percentages shown are based on Net Assets) |
| | | | | | | | |
| Security | | Shares | | | Value | |
|
| Interactive Media & Services (continued) | |
Shutterstock, Inc. | | | 190,681 | | | $ | 13,843,441 | |
Yelp, Inc.(a)(b) | | | 447,153 | | | | 13,727,597 | |
| | | | | | | | |
| | | | | | | 33,455,967 | |
|
| IT Services — 0.2% | |
Perficient, Inc.(a) | | | 227,855 | | | | 16,448,852 | |
| | | | | | | | |
|
| Leisure Products — 0.3% | |
Sturm Ruger & Co., Inc. | | | 105,431 | | | | 6,055,957 | |
Vista Outdoor, Inc.(a)(b) | | | 475,310 | | | | 13,170,840 | |
| | | | | | | | |
| | | | | | | 19,226,797 | |
|
| Machinery — 4.1% | |
3D Systems Corp.(a)(b) | | | 2,004,181 | | | | 21,484,820 | |
Alamo Group, Inc. | | | 42,418 | | | | 7,811,699 | |
Astec Industries, Inc. | | | 346,475 | | | | 14,292,094 | |
Barnes Group, Inc. | | | 774,176 | | | | 31,183,809 | |
CIRCOR International, Inc.(a) | | | 309,626 | | | | 9,635,561 | |
Enerpac Tool Group Corp. | | | 295,645 | | | | 7,538,947 | |
ESCO Technologies, Inc.(b) | | | 126,152 | | | | 12,041,208 | |
Greenbrier Cos., Inc. | | | 501,664 | | | | 16,138,531 | |
John Bean Technologies Corp. | | | 487,539 | | | | 53,283,137 | |
Kennametal, Inc. | | | 1,233,679 | | | | 34,024,867 | |
Proto Labs, Inc.(a)(b) | | | 414,224 | | | | 13,731,526 | |
SPX Technologies, Inc.(a)(b) | | | 263,302 | | | | 18,583,855 | |
Standex International Corp. | | | 58,231 | | | | 7,129,804 | |
Tennant Co. | | | 284,572 | | | | 19,501,719 | |
Trinity Industries, Inc. | | | 509,769 | | | | 12,417,973 | |
Wabash National Corp. | | | 305,008 | | | | 7,500,147 | |
| | | | | | | | |
| | | | | | | 286,299,697 | |
|
| Media — 0.7% | |
AMC Networks, Inc., Class A(a) | | | 427,054 | | | | 7,507,609 | |
EW Scripps Co., Class A, NVS(a)(b) | | | 884,665 | | | | 8,324,698 | |
Gannett Co., Inc.(a)(b) | | | 2,204,370 | | | | 4,122,172 | |
Scholastic Corp., NVS | | | 452,065 | | | | 15,469,664 | |
Thryv Holdings, Inc.(a)(b) | | | 470,062 | | | | 10,839,630 | |
| | | | | | | | |
| | | | | | | 46,263,773 | |
|
| Metals & Mining — 2.7% | |
Arconic Corp.(a)(b) | | | 1,560,563 | | | | 40,933,568 | |
ATI, Inc.(a)(b) | | | 752,607 | | | | 29,697,872 | |
Carpenter Technology Corp. | | | 743,203 | | | | 33,265,766 | |
Century Aluminum Co.(a)(b) | | | 779,460 | | | | 7,794,600 | |
Compass Minerals International, Inc. | | | 521,075 | | | | 17,867,662 | |
Haynes International, Inc. | | | 62,859 | | | | 3,148,607 | |
Materion Corp.(b) | | | 135,075 | | | | 15,668,700 | |
Olympic Steel, Inc. | | | 146,092 | | | | 7,627,464 | |
SunCoke Energy, Inc. | | | 1,274,186 | | | | 11,442,190 | |
TimkenSteel Corp.(a) | | | 344,318 | | | | 6,314,792 | |
Tredegar Corp. | | | 379,687 | | | | 3,466,542 | |
Warrior Met Coal, Inc. | | | 347,102 | | | | 12,742,115 | |
| | | | | | | | |
| | | | | | | 189,969,878 | |
|
| Mortgage Real Estate Investment Trusts (REITs) — 2.0% | |
Apollo Commercial Real Estate Finance, Inc. | | | 1,993,126 | | | | 18,556,003 | |
Ellington Financial, Inc. | | | 967,383 | | | | 11,811,746 | |
Franklin BSP Realty Trust, Inc. | | | 1,263,599 | | | | 15,074,736 | |
Invesco Mortgage Capital, Inc. | | | 294,610 | | | | 3,267,225 | |
KKR Real Estate Finance Trust, Inc. | | | 889,174 | | | | 10,127,692 | |
New York Mortgage Trust, Inc.(b) | | | 1,419,517 | | | | 14,138,389 | |
PennyMac Mortgage Investment Trust | | | 1,360,826 | | | | 16,778,985 | |
Ready Capital Corp. | | | 1,502,362 | | | | 15,279,021 | |
Redwood Trust, Inc. | | | 1,732,067 | | | | 11,674,132 | |
Two Harbors Investment Corp. | | | 1,475,369 | | | | 21,702,678 | |
| | | | | | | | |
| | | | | | | 138,410,607 | |
| | | | | | | | |
| Security | | Shares | | | Value | |
|
| Multi-Utilities — 0.6% | |
Avista Corp. | | | 1,021,610 | | | $ | 43,367,345 | |
| | | | | | | | |
|
| Office REITs — 1.5% | |
Brandywine Realty Trust | | | 2,637,824 | | | | 12,476,908 | |
Easterly Government Properties, Inc.(b) | | | 1,387,431 | | | | 19,063,302 | |
Hudson Pacific Properties, Inc. | | | 1,966,596 | | | | 13,077,863 | |
JBG SMITH Properties | | | 1,511,257 | | | | 22,759,530 | |
Office Properties Income Trust | | | 741,233 | | | | 9,117,166 | |
Orion Office REIT, Inc. | | | 854,526 | | | | 5,725,324 | |
SL Green Realty Corp. | | | 867,821 | | | | 20,411,150 | |
| | | | | | | | |
| | | | | | | 102,631,243 | |
|
| Oil, Gas & Consumable Fuels — 1.5% | |
Callon Petroleum Co.(a)(b) | | | 390,491 | | | | 13,058,019 | |
CVR Energy, Inc. | | | 200,988 | | | | 6,588,387 | |
Green Plains, Inc.(a)(b) | | | 882,757 | | | | 27,356,639 | |
Par Pacific Holdings, Inc.(a) | | | 850,268 | | | | 24,827,826 | |
Talos Energy, Inc.(a)(b) | | | 457,961 | | | | 6,796,141 | |
World Fuel Services Corp. | | | 949,056 | | | | 24,248,381 | |
| | | | | | | | |
| | | | | | | 102,875,393 | |
|
| Paper & Forest Products — 0.3% | |
Clearwater Paper Corp.(a) | | | 255,829 | | | | 8,549,805 | |
Mercer International, Inc. | | | 347,176 | | | | 3,393,646 | |
Sylvamo Corp. | | | 208,766 | | | | 9,657,515 | |
| | | | | | | | |
| | | | | | | 21,600,966 | |
|
| Passenger Airlines — 0.7% | |
Allegiant Travel Co.(a)(b) | | | 238,982 | | | | 21,981,564 | |
Hawaiian Holdings, Inc.(a)(b) | | | 784,261 | | | | 7,183,831 | |
SkyWest, Inc.(a) | | | 774,278 | | | | 17,165,743 | |
| | | | | | | | |
| | | | | | | 46,331,138 | |
|
| Personal Care Products — 0.8% | |
Edgewell Personal Care Co. | | | 408,468 | | | | 17,327,213 | |
Nu Skin Enterprises, Inc., Class A | | | 756,299 | | | | 29,730,114 | |
USANA Health Sciences, Inc.(a) | | | 170,658 | | | | 10,734,388 | |
| | | | | | | | |
| | | | | | | 57,791,715 | |
|
| Pharmaceuticals — 0.5% | |
ANI Pharmaceuticals, Inc.(a)(b) | | | 88,498 | | | | 3,515,141 | |
Ligand Pharmaceuticals, Inc.(a)(b) | | | 112,361 | | | | 8,265,275 | |
Nektar Therapeutics(a) | | | 1,474,705 | | | | 1,036,570 | |
Phibro Animal Health Corp., Class A | | | 311,439 | | | | 4,771,246 | |
Prestige Consumer Healthcare, Inc.(a) | | | 228,367 | | | | 14,302,625 | |
| | | | | | | | |
| | | | | | | 31,890,857 | |
|
| Professional Services — 1.0% | |
Forrester Research, Inc.(a) | | | 171,785 | | | | 5,557,245 | |
Heidrick & Struggles International, Inc. | | | 301,929 | | | | 9,166,564 | |
Kelly Services, Inc., Class A, NVS(b) | | | 527,950 | | | | 8,758,691 | |
Korn Ferry | | | 418,864 | | | | 21,672,023 | |
Resources Connection, Inc. | | | 487,678 | | | | 8,319,787 | |
TrueBlue, Inc.(a)(b) | | | 497,773 | | | | 8,860,359 | |
TTEC Holdings, Inc. | | | 144,510 | | | | 5,380,107 | |
| | | | | | | | |
| | | | | | | 67,714,776 | |
|
| Real Estate Management & Development — 0.9% | |
Anywhere Real Estate, Inc.(a)(b) | | | 1,678,661 | | | | 8,863,330 | |
Cushman & Wakefield PLC(a)(b) | | | 2,309,667 | | | | 24,343,890 | |
Douglas Elliman, Inc. | | | 1,059,430 | | | | 3,294,828 | |
Kennedy-Wilson Holdings, Inc. | | | 1,148,366 | | | | 19,051,392 | |
Marcus & Millichap, Inc.(b) | | | 0 | | | | — | |
RE/MAX Holdings, Inc., Class A | | | 286,524 | | | | 5,375,190 | |
| | | | | | | | |
| | | | | | | 60,928,630 | |
| | |
S C H E D U L E S O F I N V E S T M E N T S | | 33 |
| | |
Schedule of Investments (continued) March 31, 2023 | | iShares® S&P Small-Cap 600 Value ETF (Percentages shown are based on Net Assets) |
| | | | | | | | |
| Security | | Shares | | | Value | |
|
| Residential REITs — 0.7% | |
Centerspace | | | 230,114 | | | $ | 12,571,128 | |
Elme Communities | | | 1,356,828 | | | | 24,232,948 | |
NexPoint Residential Trust, Inc. | | | 162,814 | | | | 7,110,087 | |
Veris Residential, Inc.(a) | | | 532,159 | | | | 7,790,808 | |
| | | | | | | | |
| | | | | | | 51,704,971 | |
|
| Retail REITs — 2.0% | |
Acadia Realty Trust | | | 1,359,767 | | | | 18,968,750 | |
Getty Realty Corp. | | | 234,357 | | | | 8,443,883 | |
Retail Opportunity Investments Corp. | | | 1,909,616 | | | | 26,658,239 | |
RPT Realty | | | 1,321,666 | | | | 12,569,044 | |
Saul Centers, Inc. | | | 83,725 | | | | 3,265,275 | |
SITE Centers Corp. | | | 2,805,290 | | | | 34,448,961 | |
Tanger Factory Outlet Centers, Inc. | | | 718,530 | | | | 14,104,744 | |
Urban Edge Properties | | | 880,546 | | | | 13,261,023 | |
Urstadt Biddle Properties, Inc., Class A | | | 187,953 | | | | 3,302,334 | |
Whitestone REIT | | | 708,532 | | | | 6,518,494 | |
| | | | | | | | |
| | | | | | | 141,540,747 | |
|
| Semiconductors & Semiconductor Equipment — 1.6% | |
CEVA, Inc.(a)(b) | | | 136,469 | | | | 4,152,752 | |
Cohu, Inc.(a) | | | 246,244 | | | | 9,453,307 | |
FormFactor, Inc.(a)(b) | | | 1,178,767 | | | | 37,543,729 | |
Ichor Holdings Ltd.(a)(b) | | | 440,820 | | | | 14,432,447 | |
Semtech Corp.(a) | | | 976,948 | | | | 23,583,525 | |
SMART Global Holdings, Inc.(a)(b) | | | 751,493 | | | | 12,955,739 | |
Ultra Clean Holdings, Inc.(a)(b) | | | 313,658 | | | | 10,400,899 | |
| | | | | | | | |
| | | | | | | 112,522,398 | |
|
| Software — 1.1% | |
8x8, Inc.(a)(b) | | | 933,738 | | | | 3,893,687 | |
Adeia, Inc. | | | 1,604,553 | | | | 14,216,340 | |
Cerence, Inc.(a)(b) | | | 614,433 | | | | 17,259,423 | |
Consensus Cloud Solutions, Inc.(a)(b) | | | 85,219 | | | | 2,905,116 | |
Digital Turbine, Inc.(a)(b) | | | 496,475 | | | | 6,136,431 | |
Ebix, Inc. | | | 359,088 | | | | 4,736,371 | |
LivePerson, Inc.(a) | | | 507,460 | | | | 2,237,899 | |
LiveRamp Holdings, Inc.(a) | | | 442,498 | | | | 9,703,981 | |
N-able, Inc.(a) | | | 327,156 | | | | 4,318,459 | |
OneSpan, Inc.(a) | | | 275,801 | | | | 4,826,517 | |
Xperi, Inc.(a)(b) | | | 640,280 | | | | 6,998,260 | |
| | | | | | | | |
| | | | | | | 77,232,484 | |
|
| Specialized REITs — 1.0% | |
Four Corners Property Trust, Inc. | | | 422,953 | | | | 11,360,518 | |
Outfront Media, Inc. | | | 2,236,363 | | | | 36,296,171 | |
Safehold, Inc.(b) | | | 614,653 | | | | 18,052,348 | |
Uniti Group, Inc. | | | 1,987,376 | | | | 7,055,185 | |
| | | | | | | | |
| | | | | | | 72,764,222 | |
|
| Specialty Retail — 7.5% | |
Aaron’s Co., Inc. | | | 466,123 | | | | 4,502,748 | |
Abercrombie & Fitch Co., Class A(a) | | | 748,719 | | | | 20,776,952 | |
Academy Sports & Outdoors, Inc.(b) | | | 633,601 | | | | 41,342,465 | |
American Eagle Outfitters, Inc. | | | 2,670,585 | | | | 35,892,662 | |
America’s Car-Mart, Inc.(a)(b) | | | 88,475 | | | | 7,008,105 | |
Asbury Automotive Group, Inc.(a)(b) | | | 186,493 | | | | 39,163,530 | |
Boot Barn Holdings, Inc.(a)(b) | | | 177,580 | | | | 13,609,731 | |
Buckle, Inc. | | | 140,193 | | | | 5,003,488 | |
Caleres, Inc. | | | 543,891 | | | | 11,764,362 | |
Chico’s FAS, Inc.(a) | | | 1,908,811 | | | | 10,498,461 | |
Children’s Place, Inc.(a) | | | 186,272 | | | | 7,497,448 | |
Designer Brands, Inc., Class A | | | 766,226 | | | | 6,696,815 | |
Genesco, Inc.(a) | | | 182,667 | | | | 6,736,759 | |
Group 1 Automotive, Inc. | | | 223,367 | | | | 50,574,756 | |
| | | | | | | | |
| Security | | Shares | | | Value | |
|
| Specialty Retail (continued) | |
Guess?, Inc. | | | 465,382 | | | $ | 9,056,334 | |
Haverty Furniture Cos., Inc. | | | 97,872 | | | | 3,123,096 | |
Hibbett, Inc. | | | 91,384 | | | | 5,389,828 | |
Leslie’s, Inc.(a)(b) | | | 791,567 | | | | 8,715,153 | |
MarineMax, Inc.(a)(b) | | | 332,352 | | | | 9,555,120 | |
Monro, Inc.(b) | | | 481,064 | | | | 23,778,994 | |
National Vision Holdings, Inc.(a)(b) | | | 504,099 | | | | 9,497,225 | |
ODP Corp.(a)(b) | | | 616,937 | | | | 27,749,826 | |
PetMed Express, Inc. | | | 322,107 | | | | 5,231,018 | |
Sally Beauty Holdings, Inc.(a)(b) | | | 1,645,821 | | | | 25,641,891 | |
Shoe Carnival, Inc. | | | 257,109 | | | | 6,594,846 | |
Signet Jewelers Ltd. | | | 695,376 | | | | 54,086,345 | |
Sleep Number Corp.(a)(b) | | | 334,334 | | | | 10,167,097 | |
Sonic Automotive, Inc., Class A | | | 254,999 | | | | 13,856,646 | |
Upbound Group, Inc. | | | 765,446 | | | | 18,761,081 | |
Urban Outfitters, Inc.(a)(b) | | | 918,154 | | | | 25,451,229 | |
Zumiez, Inc.(a)(b) | | | 239,054 | | | | 4,408,156 | |
| | | | | | | | |
| | | | | | | 522,132,167 | |
|
| Technology Hardware, Storage & Peripherals — 0.2% | |
Avid Technology, Inc.(a)(b) | | | 207,784 | | | | 6,644,933 | |
Corsair Gaming, Inc.(a) | | | 270,198 | | | | 4,958,133 | |
| | | | | | | | |
| | | | | | | 11,603,066 | |
|
| Textiles, Apparel & Luxury Goods — 2.1% | |
G-III Apparel Group Ltd.(a)(b) | | | 654,781 | | | | 10,181,844 | |
Hanesbrands, Inc. | | | 5,349,489 | | | | 28,138,312 | |
Kontoor Brands, Inc. | | | 755,100 | | | | 36,539,289 | |
Movado Group, Inc. | | | 239,719 | | | | 6,896,716 | |
Oxford Industries, Inc. | | | 67,875 | | | | 7,166,921 | |
Steven Madden Ltd. | | | 1,119,930 | | | | 40,317,480 | |
Wolverine World Wide, Inc. | | | 1,203,354 | | | | 20,517,186 | |
| | | | | | | | |
| | | | | | | 149,757,748 | |
|
| Tobacco — 0.5% | |
Universal Corp. | | | 375,191 | | | | 19,843,852 | |
Vector Group Ltd. | | | 1,127,504 | | | | 13,541,323 | |
| | | | | | | | |
| | | | | | | 33,385,175 | |
|
| Trading Companies & Distributors — 1.3% | |
DXP Enterprises, Inc.(a) | | | 240,557 | | | | 6,475,794 | |
GMS, Inc.(a)(b) | | | 636,550 | | | | 36,849,880 | |
NOW, Inc.(a)(b) | | | 1,687,262 | | | | 18,812,971 | |
Veritiv Corp. | | | 206,756 | | | | 27,941,006 | |
| | | | | | | | |
| | | | | | | 90,079,651 | |
| |
| Water Utilities — 0.6% | | | | |
American States Water Co. | | | 175,536 | | | | 15,603,395 | |
California Water Service Group | | | 318,805 | | | | 18,554,451 | |
Middlesex Water Co. | | | 76,500 | | | | 5,976,180 | |
| | | | | | | | |
| | | | | | | 40,134,026 | |
|
| Wireless Telecommunication Services — 0.5% | |
Gogo, Inc.(a) | | | 347,706 | | | | 5,041,737 | |
Shenandoah Telecommunications Co.(b) | | | 767,505 | | | | 14,597,945 | |
Telephone & Data Systems, Inc. | | | 1,524,716 | | | | 16,024,765 | |
| | | | | | | | |
| | | | | | | 35,664,447 | |
| | | | | | | | |
| | |
Total Long-Term Investments — 97.2%
(Cost: $7,459,997,670) | | | | | | | 6,789,542,907 | |
| | | | | | | | |
| | |
| 34 | | 2 0 2 3 I S H A R E S A N N U A L R E P O R T T O S H A R E H O L D E R S |
| | |
Schedule of Investments (continued) March 31, 2023 | | iShares® S&P Small-Cap 600 Value ETF (Percentages shown are based on Net Assets) |
| | | | | | | | |
| Security | | Shares | | | Value | |
| | |
| Short-Term Securities | | | | | | |
| | |
| Money Market Funds — 8.8% | | | | | | |
BlackRock Cash Funds: Institutional, SL Agency Shares, 5.01%(d)(e)(f) | | | 417,171,709 | | | $ | 417,296,861 | |
BlackRock Cash Funds: Treasury, SL Agency Shares, 4.73%(d)(e) | | | 198,053,688 | | | | 198,053,688 | |
| | | | | | | | |
| | |
Total Short-Term Securities — 8.8%
(Cost: $ 615,220,595) | | | | | | | 615,350,549 | |
| | | | | | | | |
| | |
Total Investments — 106.0%
(Cost: $ 8,075,218,265) | | | | | | | 7,404,893,456 | |
| |
Liabilities in Excess of Other Assets — (6.0)% | | | | (421,545,404 | ) |
| | | | | | | | |
| | |
| Net Assets — 100.0% | | | | | $ 6,983,348,052 | |
| | | | | | | | |
| (a) | Non-income producing security. |
| (b) | All or a portion of this security is on loan. |
| (c) | Security is valued using significant unobservable inputs and is classified as Level 3 in the fair value hierarchy. |
| (d) | Affiliate of the Fund. |
| (e) | Annualized 7-day yield as of period end. |
| (f) | All or a portion of this security was purchased with the cash collateral from loaned securities. |
Affiliates
Investments in issuers considered to be affiliate(s) of the Fund during the year ended March 31, 2023 for purposes of Section 2(a)(3) of the Investment Company Act of 1940, as amended, were as follows:
| | | | | | | | | | | | | | | | | | | | | | | | | | | | | | | | | | | | |
| | | | | | | | | | |
| Affiliated Issuer | | Value at
03/31/22 | | | Purchases
at Cost | | | Proceeds
from Sale | | | Net
Realized
Gain (Loss) | | | Change in
Unrealized
Appreciation
(Depreciation) | | | Value at
03/31/23 | | | Shares Held at
03/31/23 | | | Income | | | Capital Gain
Distributions
from Underlying
Funds | |
| | | | | | | | | |
BlackRock Cash Funds: Institutional, SL Agency Shares | | $ | 274,022,994 | | | $ | 143,172,251 | (a) | | $ | — | | | $ | (18,084 | ) | | $ | 119,700 | | | $ | 417,296,861 | | | | 417,171,709 | | | $ | 1,465,715 | (b) | | $ | — | |
| | | | | | | | | |
BlackRock Cash Funds: Treasury, SL Agency Shares | | | 68,870,000 | | | | 129,183,688 | (a) | | | — | | | | — | | | | — | | | | 198,053,688 | | | | 198,053,688 | | | | 3,886,356 | | | | 219 | |
| | | | | | | | | | | | | | | | | | | | | | | | | | | | | | | | | | | | |
| | | | | | | | | |
| | | | | | | | | | | | | | $ | (18,084 | ) | | $ | 119,700 | | | $ | 615,350,549 | | | | | | | $ | 5,352,071 | | | $ | 219 | |
| | | | | | | | | | | | | | | | | | | | | | | | | | | | | | | | | | | | |
| (a) | Represents net amount purchased (sold). |
| (b) | All or a portion represents securities lending income earned from the reinvestment of cash collateral from loaned securities, net of fees and collateral investment expenses, and other payments to and from borrowers of securities. |
Derivative Financial Instruments Outstanding as of Period End
Futures Contracts
| | | | | | | | | | | | | | | | |
| | | | | | | | | | | | | |
| Description | | Number of
Contracts | | | Expiration
Date | | | Notional
Amount
(000) | | | Value/
Unrealized
Appreciation
(Depreciation) | |
Long Contracts | | | | | | | | | | | | | | | | |
Russel 2000 E-Mini Index | | | 676 | | | | 06/16/23 | | | $ | 61,296 | | | $ | 1,355,348 | |
| | | | | | | | | | | | | | | | |
| | |
S C H E D U L E S O F I N V E S T M E N T S | | 35 |
| | |
Schedule of Investments (continued) March 31, 2023 | | iShares® S&P Small-Cap 600 Value ETF |
OTC Total Return Swaps
| | | | | | | | | | | | | | | | | | | | | | | | | | |
| |
Reference Entity | | Payment
Frequency | | | Counterparty(a) | | Termination
Date | | | Net Notional | | | Accrued
Unrealized
Appreciation
(Depreciation) | | | Net Value of
Reference
Entity | | | Gross Notional
Amount
Net Asset
Percentage | |
| |
Equity Securities Long/Short | | | | | | Goldman Sachs Bank USA(b) | | | 08/19/26 | | | $ | 24,139,889 | | | $ | (956,614 | )(c) | | $ | 23,198,577 | | | | 0.3 | % |
| | | | | | HSBC Bank PLC(d) | | | 02/10/28 | | | | 49,875,811 | | | | (4,630,017 | )(e) | | | 45,382,191 | | | | 0.7 | |
| | | | | | JPMorgan Chase Bank NA(f) | | | 02/08/24 | | | | 62,222,550 | | | | (889,425 | )(g) | | | 61,534,200 | | | | 0.9 | |
| | | | | | | | | | | | | | | | | | | | | | | | | | |
| | | | | | | | | | | | | | | | $ | (6,476,056 | ) | | $ | 130,114,968 | | | | | |
| | | | | | | | | | | | | | | | | | | | | | | | | | |
| | (a) | The Fund receives the total return on a portfolio of long positions underlying the total return swap. The Fund pays the total return on a portfolio of short positions underlying the total return swap. In addition, the Fund pays or receives a variable rate of interest, based on a specified benchmark. The benchmark and spread are determined based upon the country and/or currency of the individual underlying positions. | |
| | (c) | Amount includes $(15,302) of net dividends, payable for referenced securities purchased and financing fees. | |
| | (e) | Amount includes $(136,397) of net dividends, payable for referenced securities purchased and financing fees. | |
| | (g) | Amount includes $(201,075) of net dividends, payable for referenced securities purchased and financing fees. | |
The following are the specified benchmarks (plus or minus a range) used in determining the variable rate of interest:
| | | | | | |
| | (b) | | (d) | | (f) |
Range: | | 40 basis points | | 40 basis points | | 40 basis points |
Benchmarks: | | USD - 1D Overnight Fed Funds Effective Rate | | USD - 1D Overnight Bank Funding Rate | | USD - 1D Overnight Bank Funding Rate |
| | (FEDL01) | | (OBFR01) | | (OBFR01) |
The following table represents the individual long positions and related values of the equity securities underlying the total return swap with Goldman Sachs Bank USA as of period end, termination date February 27, 2023.
| | | | | | | | | | | | |
| |
| | | Shares | | | Value | | | % of
Basket
Value | |
| |
|
Reference Entity — Long | |
| | | |
| Common Stocks | | | | | | | | | |
| | | |
| Banks | | | | | | | | | |
Atlantic Union Bankshares Corp. | | | 1,979 | | | $ | 69,364 | | | | 0.3 | % |
BankUnited, Inc. | | | 96,527 | | | | 2,179,580 | | | | 9.4 | |
HomeStreet, Inc. | | | 8,784 | | | | 158,024 | | | | 0.7 | |
Pacific Premier Bancorp, Inc. | | | 60,456 | | | | 1,452,153 | | | | 6.2 | |
Pathward Financial, Inc. | | | 6,074 | | | | 252,010 | | | | 1.1 | |
Provident Financial Services, Inc. | | | 191,418 | | | | 3,671,397 | | | | 15.8 | |
Renasant Corp. | | | 14,749 | | | | 451,025 | | | | 1.9 | |
Simmons First National Corp., Class A | | | 152,214 | | | | 2,662,223 | | | | 11.5 | |
Southside Bancshares, Inc. | | | 5,520 | | | | 183,264 | | | | 0.8 | |
TrustCo Bank Corp. | | | 571 | | | | 18,238 | | | | 0.1 | |
United Community Banks, Inc. | | | 1,409 | | | | 39,621 | | | | 0.2 | |
Washington Federal, Inc. | | | 1,295 | | | | 39,005 | | | | 0.2 | |
WSFS Financial Corp. | | | 71,016 | | | | 2,670,912 | | | | 11.5 | |
| | | | | | | | | | | | |
| | | | | | | 13,846,816 | | | | | |
| | | |
| Capital Markets | | | | | | | | | |
WisdomTree, Inc. | | | 8,140 | | | | 47,700 | | | | 0.2 | |
| | | | | | | | | | | | |
|
| Commercial Services & Supplies | |
Pitney Bowes, Inc. | | | 2,851 | | | | 11,090 | | | | 0.1 | |
| | | | | | | | | | | | |
| | | |
| Consumer Finance | | | | | | | | | |
Bread Financial Holdings, Inc. | | | 271,545 | | | | 8,233,245 | | | | 35.5 | |
Green Dot Corp. | | | 24,813 | | | | 426,287 | | | | 1.8 | |
| | | | | | | | | | | | |
| | | | | | | 8,659,532 | | | | | |
| | | | | | | | | | | | |
| |
| | | Shares | | | Value | | | % of
Basket
Value | |
| |
| | | |
| Hotel & Resort REITs | | | | | | | | | |
Pebblebrook Hotel Trust | | | 5,238 | | | $ | 73,542 | | | | 0.3 | % |
| | | | | | | | | | | | |
| | | |
| Insurance | | | | | | | | | |
Horace Mann Educators Corp. | | | 1,749 | | | | 58,556 | | | | 0.2 | |
James River Group Holdings Ltd. | | | 24,278 | | | | 501,341 | | | | 2.2 | |
| | | | | | | | | | | | |
| | | | | | | 559,897 | | | | | |
| | | | | | | | | | | | |
| | | |
Net Value of Reference Entity — Goldman Sachs Bank USA | | | | | | $ | 23,198,577 | | | | | |
| | | | | | | | | | | | |
The following table represents the individual long positions and related values of the equity securities underlying the total return swap with HSBC Bank PLC as of period end, termination date February 10, 2023.
| | | | | | | | | | | | |
| |
| | | Shares | | | Value | | | % of
Basket
Value | |
| |
| | | |
Reference Entity — Long | | | | | | | | | | | | |
| | | |
| Common Stocks | | | | | | | | | |
|
| Banks | |
Ameris Bancorp | | | 1,620 | | | $ | 59,259 | | | | 0.1 | % |
Atlantic Union Bankshares Corp. | | | 89,995 | | | | 3,154,325 | | | | 6.9 | |
Banc of California, Inc. | | | 129,235 | | | | 1,619,314 | | | | 3.6 | |
Capitol Federal Financial, Inc. | | | 153,389 | | | | 1,032,308 | | | | 2.3 | |
Central Pacific | | | 27,781 | | | | 497,280 | | | | 1.1 | |
Eagle Bancorp., Inc. | | | 62,534 | | | | 2,093,013 | | | | 4.6 | |
HomeStreet, Inc. | | | 10,339 | | | | 185,999 | | | | 0.4 | |
Hope Bancorp, Inc. | | | 68,578 | | | | 673,436 | | | | 1.5 | |
Independent Bank Corp. | | | 200 | | | | 13,124 | | | | 0.0 | |
Pacific Premier Bancorp, Inc. | | | 140,751 | | | | 3,380,839 | | | | 7.4 | |
Pathward Financial, Inc. | | | 9,594 | | | | 398,055 | | | | 0.9 | |
Renasant Corp. | | | 57,715 | | | | 1,764,925 | | | | 3.9 | |
| | |
| 36 | | 2 0 2 3 I S H A R E S A N N U A L R E P O R T T O S H A R E H O L D E R S |
| | |
Schedule of Investments (continued) March 31, 2023 | | iShares® S&P Small-Cap 600 Value ETF |
| | | | | | | | | | | | |
| |
| | | Shares | | | Value | | | % of
Basket
Value | |
| |
|
Banks (continued) | |
Southside Bancshares, Inc. | | | 13,095 | | | $ | 434,754 | | | | 1.0 | % |
TrustCo Bank Corp. | | | 571 | | | | 18,238 | | | | 0.0 | |
Washington Federal, Inc. | | | 58,658 | | | | 1,766,779 | | | | 3.9 | |
WSFS Financial Corp. | | | 78,216 | | | | 2,941,704 | | | | 6.5 | |
| | | | | | | | | | | | |
| | | | | | | 20,033,352 | | | | | |
|
| Commercial Services & Supplies | |
Pitney Bowes, Inc. | | | 401,926 | | | | 1,563,492 | | | | 3.5 | |
| | | | | | | | | | | | |
|
| Consumer Finance | |
Green Dot Corp., Class A | | | 212,348 | | | | 3,648,139 | | | | 8.0 | |
| | | | | | | | | | | | |
|
| Electronic Equipment, Instruments & Components | |
Rogers Corp. | | | 262 | | | | 42,819 | | | | 0.1 | |
| | | | | | | | | | | | |
|
| Financial Services | |
Radian Group, Inc. | | | 1,395 | | | | 30,829 | | | | 0.1 | |
| | | | | | | | | | | | |
|
| Hotel & Resort REITs | |
Pebblebrook Hotel Trust | | | 162,870 | | | | 2,286,695 | | | | 5.0 | |
| | | | | | | | | | | | |
|
| Insurance | |
Genworth Financial, Inc., Class A | | | 546,450 | | | | 2,743,179 | | | | 6.0 | |
Horace Mann Educators Corp. | | | 45,640 | | | | 1,528,027 | | | | 3.4 | |
James River Group Holdings Ltd. | | | 28,689 | | | | 592,428 | | | | 1.3 | |
ProAssurance Corp. | | | 65,748 | | | | 1,215,023 | | | | 2.7 | |
Stewart Information Services Corp. | | | 25,580 | | | | 1,032,153 | | | | 2.3 | |
| | | | | | | | | | | | |
| | | | | | | 7,110,810 | | | | | |
|
| Multi-Utilities | |
Avista Corp. | | | 111,584 | | | | 4,736,741 | | | | 10.4 | |
| | | | | | | | | | | | |
|
| Office REITs | |
Brandywine Realty Trust | | | 34,494 | | | | 163,157 | | | | 0.4 | |
SL Green Realty Corp. | | | 130,301 | | | | 3,064,679 | | | | 6.7 | |
| | | | | | | | | | | | |
| | | | | | | 3,227,836 | | | | | |
|
| Oil, Gas & Consumable Fuels | |
Green Plains, Inc. | | | 24,848 | | | | 770,039 | | | | 1.7 | |
| | | | | | | | | | | | |
|
| Water Utilities | |
Middlesex Water Co. | | | 24,724 | | | | 1,931,439 | | | | 4.3 | |
| | | | | | | | | | | | |
Net Value of Reference Entity — HSBC Bank PLC | | | | | | $ | 45,382,191 | | | | | |
| | | | | | | | | | | | |
The following table represents the individual long positions and related values of the equity securities underlying the total return swap with JPMorgan Chase Bank NA as of period end, termination date February 8, 2023.
| | | | | | | | | | | | |
| |
| | | Shares | | | Value | | | % of
Basket
Value | |
| |
|
Reference Entity — Long | |
|
| Common Stocks | |
| | | |
| Banks | | | | | | | | | |
Banc of California, Inc. | | | 3,616 | | | $ | 45,309 | | | | 0.1 | % |
| | | | | | | | | | | | |
| |
| | | Shares | | | Value | | | % of
Basket
Value | |
| |
| | | |
| Banks (continued) | | | | | | | | | |
Central Pacific Financial Corp. | | | 96,879 | | | $ | 1,734,134 | | | | 2.8 | % |
Customers Bancorp, Inc. | | | 7,680 | | | | 142,234 | | | | 0.2 | |
Eagle Bancorp, Inc. | | | 46,380 | | | | 1,552,339 | | | | 2.5 | |
National Bank Holdings Corp., Class A | | | 7,805 | | | | 261,155 | | | | 0.4 | |
Pacific Premier Bancorp, Inc. | | | 25,413 | | | | 610,420 | | | | 1.0 | |
Pathward Financial, Inc. | | | 26,603 | | | | 1,103,758 | | | | 1.8 | |
Seacoast Banking Corp. of Florida | | | 11,867 | | | | 281,248 | | | | 0.5 | |
Southside Bancshares, Inc. | | | 13,276 | | | | 440,763 | | | | 0.7 | |
Veritex Holdings, Inc. | | | 82,893 | | | | 1,513,626 | | | | 2.5 | |
WSFS Financial Corp. | | | 60,087 | | | | 2,259,872 | | | | 3.7 | |
| | | | | | | | | | | | |
| | | | | | | 9,944,858 | | | | | |
| | | |
| Consumer Finance | | | | | | | | | |
Bread Financial Holdings, Inc. | | | 70,321 | | | | 2,132,133 | | | | 3.5 | |
Green Dot Corp., Class A | | | 485,589 | | | | 8,342,419 | | | | 13.5 | |
| | | | | | | | | | | | |
| | | | | | | 10,474,552 | | | | | |
| | | |
| Financial Services | | | | | | | | | |
Radian Group, Inc. | | | 1,763,632 | | | | 38,976,267 | | | | 63.3 | |
| | | | | | | | | | | | |
| | | |
| Insurance | | | | | | | | | |
Horace Mann Educators Corp. | | | 13,668 | | | | 457,605 | | | | 0.7 | |
| | | | | | | | | | | | |
| | | |
| Multi-Utilities | | | | | | | | | |
Avista Corp. | | | 1,280 | | | | 54,336 | | | | 0.1 | |
| | | | | | | | | | | | |
| | | |
| Office REITs | | | | | | | | | |
Brandywine Realty Trust | | | 12,366 | | | | 58,491 | | | | 0.1 | |
| | | | | | | | | | | | |
| | | |
| Retail REITs | | | | | | | | | |
Acadia Realty Trust | | | 112,408 | | | | 1,568,092 | | | | 2.6 | |
| | | | | | | | | | | | |
| | |
Net Value of Reference Entity — JPMorgan Chase Bank NA | | | $ | 61,534,201 | | | | | |
| | | | | | | | | | | | |
| | |
S C H E D U L E S O F I N V E S T M E N T S | | 37 |
| | |
Schedule of Investments (continued) March 31, 2023 | | iShares® S&P Small-Cap 600 Value ETF |
Balances Reported in the Statements of Assets and Liabilities for OTC Swaps
| | | | | | | | | | | | | | | | |
| Description | | Swap
Premiums
Paid | | | Swap
Premiums
Received | | | Unrealized
Appreciation | | | Unrealized
Depreciation | |
OTC Swaps | | $ | — | | | $ | — | | | $ | — | | | $ | (6,476,056 | ) |
Derivative Financial Instruments Categorized by Risk Exposure
As of period end, the fair values of derivative financial instruments located in the Statements of Assets and Liabilities were as follows:
| | | | | | | | | | | | | | | | | | | | | | | | | | | | |
| | | Commodity
Contracts | | | Credit
Contracts | | | Equity
Contracts | | | Foreign
Currency
Exchange
Contracts | | | Interest
Rate
Contracts | | | Other
Contracts | | | Total | |
Assets — Derivative Financial Instruments | | | | | | | | | | | | | | | | | | | | | | | | | |
Futures contracts | | | | | | | | | | | | | | | | | | | | | | | | | | | | |
Unrealized appreciation on futures contracts(a) | | $ | — | | | $ | — | | | $ | 1,355,348 | | | $ | — | | | $ | — | | | $ | — | | | $ | 1,355,348 | |
| | | | | | | | | | | | | | | | | | | | | | | | | | | | |
| | | | | | |
| Liabilities — Derivative Financial Instruments | | | | | | | | | | | | | | | | | | | |
Swaps — OTC | | | | | | | | | | | | | | | | | | | | | | | | | | | | |
Unrealized depreciation on OTC swaps; Swap premiums received | | $ | — | | | $ | — | | | $ | 6,476,056 | | | $ | — | | | $ | — | | | $ | — | | | $ | 6,476,056 | |
| | | | | | | | | | | | | | | | | | | | | | | | | | | | |
| | (a) | Net cumulative unrealized appreciation (depreciation) on futures contracts, if any, are reported in the Schedule of Investments. In the Statements of Assets and Liabilities, only current day’s variation margin is reported in receivables or payables and the net cumulative unrealized appreciation (depreciation) is included in accumulated earnings (loss). | |
For the period ended March 31, 2023, the effect of derivative financial instruments in the Statements of Operations was as follows:
| | | | | | | | | | | | | | | | | | | | | | | | | | | | |
| | | Commodity
Contracts | | | Credit
Contracts | | | Equity
Contracts | | | Foreign
Currency
Exchange
Contracts | | | Interest Rate
Contracts | | | Other
Contracts | | | Total | |
Net Realized Gain (Loss) from | | | | | | | | | | | | | | | | | | | | | | | | | |
Futures contracts | | $ | — | | | $ | — | | | $ | (2,830,468 | ) | | $ | — | | | $ | — | | | $ | — | | | $ | (2,830,468 | ) |
Swaps | | | — | | | | — | | | | (31,019,565 | ) | | | — | | | | — | | | | — | | | | (31,019,565 | ) |
| | | | | | | | | | | | | | | | | | | | | | | | | | | | |
| | $ | — | | | $ | — | | | $ | (33,850,033 | ) | | $ | — | | | $ | — | | | $ | — | | | $ | (33,850,033 | ) |
| | | | | | | | | | | | | | | | | | | | | | | | | | | | |
Net Change in Unrealized Appreciation (Depreciation) on | | | | | | | | | | | | | | | | | | | | | | | | | | | | |
Futures contracts | | $ | — | | | $ | — | | | $ | 928,022 | | | $ | — | | | $ | — | | | $ | — | | | $ | 928,022 | |
Swaps | | | — | | | | — | | | | (10,501,868 | ) | | | — | | | | — | | | | — | | | | (10,501,868 | ) |
| | | | | | | | | | | | | | | | | | | | | | | | | | | | |
| | $ | — | | | $ | — | | | $ | (9,573,846 | ) | | $ | — | | | $ | — | | | $ | — | | | $ | (9,573,846 | ) |
| | | | | | | | | | | | | | | | | | | | | | | | | | | | |
Average Quarterly Balances of Outstanding Derivative Financial Instruments
| | | | |
Futures contracts | | | | |
Average notional value of contracts — long | | | $33,340,970 | |
Total return swaps | | | | |
Average notional amount | | | $168,696,908 | |
For more information about the Fund’s investment risks regarding derivative financial instruments, refer to the Notes to Financial Statements.
| | |
| 38 | | 2 0 2 3 I S H A R E S A N N U A L R E P O R T T O S H A R E H O L D E R S |
| | |
Schedule of Investments (continued) March 31, 2023 | | iShares® S&P Small-Cap 600 Value ETF |
Derivative Financial Instruments – Offsetting as of Period End
The Fund’s derivative assets and liabilities (by type) were as follows:
| | | | | | | | |
| |
| | | Assets | | | Liabilities | |
| |
| | |
Derivative Financial Instruments | | | | | | | | |
| | |
Futures contracts | | $ | 1,279,285 | | | $ | — | |
| | |
Swaps — OTC(a) | | | — | | | | 6,476,056 | |
| | | | | | | | |
| | |
Total derivative assets and liabilities in the Statements of Assets and Liabilities | | $ | 1,279,285 | | | $ | 6,476,056 | |
| | | | | | | | |
| | |
Derivatives not subject to a Master Netting Agreement or similar agreement (“MNA”) | | | — | | | | — | |
| | | | | | | | |
| | |
Total derivative assets and liabilities subject to an MNA | | $ | 1,279,285 | | | $ | 6,476,056 | |
| | | | | | | | |
| | (a) | Includes unrealized appreciation (depreciation) on OTC swaps and swap premiums paid/(received) in the Statements of Assets and Liabilities. | |
The following tables present the Fund’s derivative assets and liabilities by counterparty net of amounts available for offset under an MNA and net of the related collateral received and pledged by the Fund:
| | | | | | | | | | | | | | | | | | | | |
| |
| | | | | |
| Counterparty | | Derivative
Liabilities
Subject to
an MNA by
Counterparty | | | Derivatives
Available
for Offset(a) | | | Non-
Cash
Collateral
Pledged(b) | | | Cash
Collateral
Pledged(b) | | | Net
Amount of
Derivative
Liabilities(c) | |
| |
| | | | | |
Goldman Sachs Bank USA | | $ | 956,614 | | | $ | — | | | $ | — | | | $ | (956,614 | ) | | $ | — | |
| | | | | |
HSBC Bank PLC | | | 4,630,017 | | | | — | | | | — | | | | (4,630,017 | ) | | | — | |
| | | | | |
JPMorgan Chase Bank N.A | | | 889,425 | | | | — | | | | — | | | | (889,425 | ) | | | — | |
| | | | | | | | | | | | | | | | | | | | |
| | | | | |
| | $ | 6,476,056 | | | $ | — | | | $ | — | | | $ | (6,476,056 | ) | | $ | — | |
| | | | | | | | | | | | | | | | | | | | |
| | (a) | The amount of derivatives available for offset is limited to the amount of derivative assets and/or liabilities that are subject to an MNA. | |
| | (b) | Excess of collateral received/pledged, if any, from the individual counterparty is not shown for financial reporting purposes. | |
| | (c) | Net amount represents the net amount receivable from the counterparty in the event of default. | |
Fair Value Hierarchy as of Period End
Various inputs are used in determining the fair value of financial instruments. For a description of the input levels and information about the Fund’s policy regarding valuation of financial instruments, refer to the Notes to Financial Statements.
The following table summarizes the Fund’s financial instruments categorized in the fair value hierarchy. The breakdown of the Fund’s financial instruments into major categories is disclosed in the Schedule of Investments above.
| | | | | | | | | | | | | | | | |
| |
| | | | |
| | | Level 1 | | | Level 2 | | | Level 3 | | | Total | |
| |
| | | | |
Assets | | | | | | | | | | | | | | | | |
| | | | |
Investments | | | | | | | | | | | | | | | | |
| | | | |
Long-Term Investments | | | | | | | | | | | | | | | | |
| | | | |
Common Stocks | | $ | 6,789,542,905 | | | $ | — | | | $ | 2 | | | $ | 6,789,542,907 | |
| | | | |
Short-Term Securities | | | | | | | | | | | | | | | | |
| | | | |
Money Market Funds | | | 615,350,549 | | | | — | | | | — | | | | 615,350,549 | |
| | | | | | | | | | | | | | | | |
| | | | |
| | $ | 7,404,893,454 | | | $ | — | | | $ | 2 | | | $ | 7,404,893,456 | |
| | | | | | | | | | | | | | | | |
| | | | |
Derivative Financial Instruments(a) | | | | | | | | | | | | | | | | |
| | | | |
Assets | | | | | | | | | | | | | | | | |
| | | | |
Equity Contracts | | $ | 1,355,348 | | | $ | — | | | $ | — | | | $ | 1,355,348 | |
| | | | |
Liabilities | | | | | | | | | | | | | | | | |
| | | | |
Equity Contracts | | | — | | | | (6,476,056 | ) | | | — | | | | (6,476,056 | ) |
| | | | | | | | | | | | | | | | |
| | | | |
| | $ | 1,355,348 | | | $ | (6,476,056 | ) | | $ | — | | | $ | (5,120,708 | ) |
| | | | | | | | | | | | | | | | |
| | (a) | Derivative financial instruments are futures contracts. Futures contracts are valued at the unrealized appreciation (depreciation) on the instrument. | |
See notes to financial statements.
| | |
S C H E D U L E S O F I N V E S T M E N T S | | 39 |
Statements of Assets and Liabilities
March 31, 2023
| | | | | | | | | | | | | | | | |
| | | | |
| | | iShares S&P 100 ETF | | | iShares S&P 500 Growth ETF | | | iShares S&P 500 Value
ETF | | | iShares S&P Small-Cap 600 Value ETF | |
| | | | |
ASSETS | | | | | | | | | | | | | | | | |
| | | | |
Investments, at value — unaffiliated(a)(b) | | $ | 7,495,633,556 | | | $ | 30,104,478,496 | | | $ | 24,261,580,151 | | | $ | 6,789,542,907 | |
| | | | |
Investments, at value — affiliated(c) | | | 48,108,852 | | | | 278,844,966 | | | | 402,147,362 | | | | 615,350,549 | |
| | | | |
Cash | | | 389 | | | | 1,408,519 | | | | 110,889 | | | | 6,344,986 | |
| | | | |
Cash pledged: | | | | | | | | | | | | | | | | |
| | | | |
Collateral — OTC derivatives | | | — | | | | — | | | | — | | | | 31,690,000 | |
| | | | |
Futures contracts | | | 1,157,640 | | | | 3,123,340 | | | | 3,273,360 | | | | 5,270,000 | |
| | | | |
Receivables: | | | | | | | | | | | | | | | | |
| | | | |
Investments sold | | | — | | | | 22,950,212 | | | | 58,185,671 | | | | 38,331,325 | |
| | | | |
Securities lending income — affiliated | | | 32,648 | | | | 37,603 | | | | 72,854 | | | | 219,837 | |
| | | | |
Swaps | | | — | | | | — | | | | — | | | | 845,612 | |
| | | | |
Capital shares sold | | | — | | | | 15,885,969 | | | | 22,768,585 | | | | — | |
| | | | |
Dividends — unaffiliated | | | 3,989,803 | | | | 17,168,975 | | | | 21,965,895 | | | | 10,990,447 | |
| | | | |
Dividends — affiliated | | | 68,714 | | | | 160,051 | | | | 151,227 | | | | 898,614 | |
| | | | |
Variation margin on futures contracts | | | 268,538 | | | | 724,763 | | | | 799,824 | | | | 1,279,285 | |
| | | | | | | | | | | | | | | | |
| | | | |
Total assets | | | 7,549,260,140 | | | | 30,444,782,894 | | | | 24,771,055,818 | | | | 7,500,763,562 | |
| | | | | | | | | | | | | | | | |
| | | | |
LIABILITIES | | | | | | | | | | | | | | | | |
| | | | |
Bank overdraft | | | — | | | | — | | | | 110,441 | | | | — | |
| | | | |
Collateral on securities loaned | | | — | | | | 237,519,455 | | | | 209,976,583 | | | | 417,275,974 | |
| | | | |
Payables: | | | | | | | | | | | | | | | | |
| | | | |
Investments purchased | | | — | | | | 38,809,211 | | | | 50,616,144 | | | | 60,865,296 | |
| | | | |
Swaps | | | — | | | | — | | | | — | | | | 27,076,128 | |
| | | | |
Capital shares redeemed | | | — | | | | — | | | | 30,358,113 | | | | 4,589,926 | |
| | | | |
Investment advisory fees | | | 1,230,998 | | | | 4,362,743 | | | | 3,719,289 | | | | 1,132,130 | |
| | | | |
Variation margin on futures contracts | | | 1,602 | | | | — | | | | — | | | | — | |
| | | | |
Unrealized depreciation on OTC swaps | | | — | | | | — | | | | — | | | | 6,476,056 | |
| | | | | | | | | | | | | | | | |
| | | | |
Total liabilities | | | 1,232,600 | | | | 280,691,409 | | | | 294,780,570 | | | | 517,415,510 | |
| | | | | | | | | | | | | | | | |
| | | | |
NET ASSETS | | $ | 7,548,027,540 | | | $ | 30,164,091,485 | | | $ | 24,476,275,248 | | | $ | 6,983,348,052 | |
| | | | | | | | | | | | | | | | |
| | | | |
NET ASSETS CONSIST OF: | | | | | | | | | | | | | | | | |
| | | | |
Paid-in capital | | $ | 7,052,102,523 | | | $ | 25,952,679,526 | | | $ | 25,611,306,419 | | | $ | 8,580,648,621 | |
| | | | |
Accumulated earnings (loss) | | | 495,925,017 | | | | 4,211,411,959 | | | | (1,135,031,171 | ) | | | (1,597,300,569 | ) |
| | | | | | | | | | | | | | | | |
| | | | |
NET ASSETS | | $ | 7,548,027,540 | | | $ | 30,164,091,485 | | | $ | 24,476,275,248 | | | $ | 6,983,348,052 | |
| | | | | | | | | | | | | | | | |
| | | | |
NET ASSET VALUE | | | | | | | | | | | | | | | | |
| | | | |
Shares outstanding | | | 40,350,000 | | | | 471,900,000 | | | | 161,250,000 | | | | 74,550,000 | |
| | | | | | | | | | | | | | | | |
| | | | |
Net asset value | | $ | 187.06 | | | $ | 63.92 | | | $ | 151.79 | | | $ | 93.67 | |
| | | | | | | | | | | | | | | | |
| | | | |
Shares authorized | | | Unlimited | | | | Unlimited | | | | Unlimited | | | | Unlimited | |
| | | | | | | | | | | | | | | | |
| | | | |
Par value | | | None | | | | None | | | | None | | | | None | |
| | | | | | | | | | | | | | | | |
| | | | |
(a) Investments, at cost — unaffiliated | | $ | 6,611,617,487 | | | $ | 22,700,936,556 | | | $ | 23,745,040,402 | | | $ | 7,459,997,670 | |
| | | | |
(b) Securities loaned, at value | | $ | — | | | $ | 235,845,800 | | | $ | 208,394,131 | | | $ | 416,044,262 | |
| | | | |
(c) Investments, at cost — affiliated | | $ | 45,634,267 | | | $ | 278,820,244 | | | $ | 414,570,321 | | | $ | 615,220,595 | |
See notes to financial statements.
| | |
| 40 | | 2 0 2 3 I S H A R E S A N N U A L R E P O R T T O S H A R E H O L D E R S |
Statements of Operations
Year Ended March 31, 2023
| | | | | | | | | | | | | | | | |
| | | | |
| | | iShares S&P 100 ETF | | | iShares S&P 500 Growth ETF | | | iShares S&P 500 Value
ETF | | | iShares S&P Small-Cap 600 Value ETF | |
| | | | |
INVESTMENT INCOME | | | | | | | | | | | | | | | | |
| | | | |
Dividends — unaffiliated | | $ | 127,474,233 | | | $ | 332,017,578 | | | $ | 543,087,200 | | | $ | 134,577,557 | |
| | | | |
Dividends — affiliated | | | 968,526 | | | | 1,128,251 | | | | 3,689,197 | | | | 3,886,356 | |
| | | | |
Securities lending income — affiliated — net | | | 133,167 | | | | 513,312 | | | | 611,881 | | | | 1,465,715 | |
| | | | |
Foreign taxes withheld | | | — | | | | (154,613 | ) | | | (76,567 | ) | | | (14,433 | ) |
| | | | | | | | | | | | | | | | |
| | | | |
Total investment income | | | 128,575,926 | | | | 333,504,528 | | | | 547,311,711 | | | | 139,915,195 | |
| | | | | | | | | | | | | | | | |
| | | | |
EXPENSES | | | | | | | | | | | | | | | | |
| | | | |
Investment advisory | | | 15,351,016 | | | | 53,418,961 | | | | 44,024,320 | | | | 13,345,671 | |
| | | | | | | | | | | | | | | | |
| | | | |
Total expenses | | | 15,351,016 | | | | 53,418,961 | | | | 44,024,320 | | | | 13,345,671 | |
| | | | | | | | | | | | | | | | |
| | | | |
Net investment income | | | 113,224,910 | | | | 280,085,567 | | | | 503,287,391 | | | | 126,569,524 | |
| | | | | | | | | | | | | | | | |
| | | | |
REALIZED AND UNREALIZED GAIN (LOSS) | | | | | | | | | | | | | | | | |
| | | | |
Net realized gain (loss) from: | | | | | | | | | | | | | | | | |
| | | | |
Investments — unaffiliated | | | (77,197,960 | ) | | | (2,203,769,845 | ) | | | (397,856,262 | ) | | | (398,010,389 | ) |
| | | | |
Investments — affiliated | | | (47,073 | ) | | | 15,818,525 | | | | (154,825 | ) | | | (18,084 | ) |
| | | | |
Capital gain distributions from underlying funds — affiliated | | | 10 | | | | 33 | | | | 26 | | | | 219 | |
| | | | |
Futures contracts | | | (1,457,413 | ) | | | (5,359,505 | ) | | | (11,438,758 | ) | | | (2,830,468 | ) |
| | | | |
In-kind redemptions — unaffiliated(a) | | | 483,936,002 | | | | 2,382,262,771 | | | | 2,759,205,407 | | | | 472,884,728 | |
| | | | |
In-kind redemptions — affiliated(a) | | | 2,245,875 | | | | 2,758,853 | | | | 10,283,745 | | | | — | |
| | | | |
Swaps | | | — | | | | — | | | | — | | | | (31,019,565 | ) |
| | | | | | | | | | | | | | | | |
| | | | |
| | | 407,479,441 | | | | 191,710,832 | | | | 2,360,039,333 | | | | 41,006,441 | |
| | | | | | | | | | | | | | | | |
| | | | |
Net change in unrealized appreciation (depreciation) on: | | | | | | | | | | | | | | | | |
| | | | |
Investments — unaffiliated | | | (1,338,733,330 | ) | | | (5,966,998,840 | ) | | | (3,109,292,037 | ) | | | (876,381,435 | ) |
| | | | |
Investments — affiliated | | | (6,486,631 | ) | | | (26,742,051 | ) | | | (22,915,734 | ) | | | 119,700 | |
| | | | |
Futures contracts | | | (112,487 | ) | | | (342,514 | ) | | | (125,415 | ) | | | 928,022 | |
| | | | |
Swaps | | | — | | | | — | | | | — | | | | (10,501,868 | ) |
| | | | | | | | | | | | | | | | |
| | | | |
| | | (1,345,332,448 | ) | | | (5,994,083,405 | ) | | | (3,132,333,186 | ) | | | (885,835,581 | ) |
| | | | | | | | | | | | | | | | |
| | | | |
Net realized and unrealized loss | | | (937,853,007 | ) | | | (5,802,372,573 | ) | | | (772,293,853 | ) | | | (844,829,140 | ) |
| | | | | | | | | | | | | | | | |
| | | | |
NET DECREASE IN NET ASSETS RESULTING FROM OPERATIONS | | $ | (824,628,097 | ) | | $ | (5,522,287,006 | ) | | $ | (269,006,462 | ) | | $ | (718,259,616 | ) |
| | | | | | | | | | | | | | | | |
| (a) | See Note 2 of the Notes to Financial Statements. |
See notes to financial statements.
| | |
F I N A N C I A L S T A T E M E N T S | | 41 |
Statements of Changes in Net Assets
| | | | | | | | | | | | | | | | |
| | |
| | | iShares S&P 100 ETF | | | iShares S&P 500 Growth ETF | |
| | | | | | | | |
| | | | |
| | | Year Ended
03/31/23 | | | Year Ended
03/31/22 | | | Year Ended
03/31/23 | | | Year Ended
03/31/22 | |
| | | | |
INCREASE (DECREASE) IN NET ASSETS | | | | | | | | | | | | | | | | |
| | | | |
OPERATIONS | | | | | | | | | | | | | | | | |
| | | | |
Net investment income | | $ | 113,224,910 | | | $ | 98,468,954 | | | $ | 280,085,567 | | | $ | 196,796,622 | |
| | | | |
Net realized gain | | | 407,479,441 | | | | 462,070,579 | | | | 191,710,832 | | | | 3,911,096,585 | |
| | | | |
Net change in unrealized appreciation (depreciation) | | | (1,345,332,448 | ) | | | 623,310,831 | | | | (5,994,083,405 | ) | | | 1,270,127,992 | |
| | | | | | | | | | | | | | | | |
| | | | |
Net increase (decrease) in net assets resulting from operations | | | (824,628,097 | ) | | | 1,183,850,364 | | | | (5,522,287,006 | ) | | | 5,378,021,199 | |
| | | | | | | | | | | | | | | | |
| | | | |
DISTRIBUTIONS TO SHAREHOLDERS(a) | | | | | | | | | | | | | | | | |
| | | | |
Decrease in net assets resulting from distributions to shareholders | | | (113,384,492 | ) | | | (96,979,731 | ) | | | (273,353,269 | ) | | | (197,299,111 | ) |
| | | | | | | | | | | | | | | | |
| | | | |
CAPITAL SHARE TRANSACTIONS | | | | | | | | | | | | | | | | |
| | | | |
Net increase (decrease) in net assets derived from capital share transactions | | | (291,408,168 | ) | | | 713,344,619 | | | | (798,680,236 | ) | | | 402,934,188 | |
| | | | | | | | | | | | | | | | |
| | | | |
NET ASSETS | | | | | | | | | | | | | | | | |
| | | | |
Total increase (decrease) in net assets | | | (1,229,420,757 | ) | | | 1,800,215,252 | | | | (6,594,320,511 | ) | | | 5,583,656,276 | |
| | | | |
Beginning of year | | | 8,777,448,297 | | | | 6,977,233,045 | | | | 36,758,411,996 | | | | 31,174,755,720 | |
| | | | | | | | | | | | | | | | |
| | | | |
End of year | | $ | 7,548,027,540 | | | $ | 8,777,448,297 | | | $ | 30,164,091,485 | | | $ | 36,758,411,996 | |
| | | | | | | | | | | | | | | | |
(a) Distributions for annual periods determined in accordance with U.S. federal income tax regulations.
See notes to financial statements.
| | |
| 42 | | 2 0 2 3 I S H A R E S A N N U A L R E P O R T T O S H A R E H O L D E R S |
Statements of Changes in Net Assets (continued)
| | | | | | | | | | | | | | | | |
| | | iShares S&P 500 Value ETF | | | iShares S&P Small-Cap 600 Value
ETF | |
| | | Year Ended
03/31/23 | | | Year Ended
03/31/22 | | | Year Ended
03/31/23 | | | Year Ended
03/31/22 | |
| | | | |
INCREASE (DECREASE) IN NET ASSETS | | | | | | | | | | | | | | | | |
| | | | |
OPERATIONS | | | | | | | | | | | | | | | | |
| | | | |
Net investment income | | $ | 503,287,391 | | | $ | 444,658,089 | | | $ | 126,569,524 | | | $ | 93,472,980 | |
| | | | |
Net realized gain | | | 2,360,039,333 | | | | 1,639,867,069 | | | | 41,006,441 | | | | 1,376,936,932 | |
| | | | |
Net change in unrealized appreciation (depreciation) | | | (3,132,333,186 | ) | | | 559,126,265 | | | | (885,835,581 | ) | | | (1,236,361,719 | ) |
| | | | | | | | | | | | | | | | |
| | | | |
Net increase (decrease) in net assets resulting from operations | | | (269,006,462 | ) | | | 2,643,651,423 | | | | (718,259,616 | ) | | | 234,048,193 | |
| | | | | | | | | | | | | | | | |
| | | | |
DISTRIBUTIONS TO SHAREHOLDERS(a) | | | | | | | | | | | | | | | | |
| | | | |
Decrease in net assets resulting from distributions to shareholders | | | (505,414,298 | ) | | | (441,547,200 | ) | | | (106,591,690 | ) | | | (131,583,294 | ) |
| | | | | | | | | | | | | | | | |
| | | | |
CAPITAL SHARE TRANSACTIONS | | | | | | | | | | | | | | | | |
| | | | |
Net increase (decrease) in net assets derived from capital share transactions | | | (635,658,997 | ) | | | 2,259,799,358 | | | | (741,070,327 | ) | | | (359,336,301 | ) |
| | | | | | | | | | | | | | | | |
| | | | |
NET ASSETS | | | | | | | | | | | | | | | | |
| | | | |
Total increase (decrease) in net assets | | | (1,410,079,757 | ) | | | 4,461,903,581 | | | | (1,565,921,633 | ) | | | (256,871,402 | ) |
| | | | |
Beginning of year | | | 25,886,355,005 | | | | 21,424,451,424 | | | | 8,549,269,685 | | | | 8,806,141,087 | |
| | | | | | | | | | | | | | | | |
| | | | |
End of year | | $ | 24,476,275,248 | | | $ | 25,886,355,005 | | | $ | 6,983,348,052 | | | $ | 8,549,269,685 | |
| | | | | | | | | | | | | | | | |
| (a) | Distributions for annual periods determined in accordance with U.S. federal income tax regulations. |
See notes to financial statements.
| | |
F I N A N C I A L S T A T E M E N T S | | 43 |
Financial Highlights
(For a share outstanding throughout each period)
| | | | | | | | | | | | | | | | | | | | |
| |
| | | iShares S&P 100 ETF | |
| | | | | |
| | | Year Ended
03/31/23 | | | Year Ended
03/31/22 | | | Year Ended
03/31/21 | | | Year Ended
03/31/20 | | | Year Ended
03/31/19 | |
| | | | | | |
Net asset value, beginning of year | | $ | 208.24 | | | $ | 179.83 | | | $ | 118.50 | | | $ | 125.31 | | | $ | 115.89 | |
| | | | | | | | | | | | | | | | | | | | |
| | | | | |
Net investment income(a) | | | 2.66 | | | | 2.41 | | | | 2.37 | | | | 2.48 | | | | 2.35 | |
| | | | | |
Net realized and unrealized gain(b) | | | (21.16 | ) | | | 28.36 | | | | 61.39 | | | | (6.58 | ) | | | 9.45 | |
| | | | | | | | | | | | | | | | | | | | |
| | | | | |
Net increase from investment operations | | | (18.50 | ) | | | 30.77 | | | | 63.76 | | | | (4.10 | ) | | | 11.80 | |
| | | | | | | | | | | | | | | | | | | | |
| | | | | |
Distributions from net investment income(c) | | | (2.68 | ) | | | (2.36 | ) | | | (2.43 | ) | | | (2.71 | ) | | | (2.38 | ) |
| | | | | | | | | | | | | | | | | | | | |
| | | | | |
Net asset value, end of year | | $ | 187.06 | | | $ | 208.24 | | | $ | 179.83 | | | $ | 118.50 | | | $ | 125.31 | |
| | | | | | | | | | | | | | | | | | | | |
| | | | | |
Total Return(d) | | | | | | | | | | | | | | | | | | | | |
| | | | | |
Based on net asset value | | | (8.80 | )% | | | 17.14 | % | | | 54.11 | % | | | (3.42 | )% | | | 10.25 | % |
| | | | | | | | | | | | | | | | | | | | |
| | | | | |
Ratios to Average Net Assets(e) | | | | | | | | | | | | | | | | | | | | |
| | | | | |
Total expenses | | | 0.20 | % | | | 0.20 | % | | | 0.20 | % | | | 0.20 | % | | | 0.20 | % |
| | | | | | | | | | | | | | | | | | | | |
| | | | | |
Net investment income | | | 1.48 | % | | | 1.19 | % | | | 1.52 | % | | | 1.86 | % | | | 1.94 | % |
| | | | | | | | | | | | | | | | | | | | |
| | | | | |
Supplemental Data | | | | | | | | | | | | | | | | | | | | |
| | | | | |
Net assets, end of year (000) | | $ | 7,548,028 | | | $ | 8,777,448 | | | $ | 6,977,233 | | | $ | 4,852,686 | | | $ | 4,824,336 | |
| | | | | | | | | | | | | | | | | | | | |
| | | | | |
Portfolio turnover rate(f) | | | 3 | % | | | 2 | % | | | 8 | % | | | 4 | % | | | 7 | % |
| | | | | | | | | | | | | | | | | | | | |
| (a) | Based on average shares outstanding. |
| (b) | The amounts reported for a share outstanding may not accord with the change in aggregate gains and losses in securities for the fiscal period due to the timing of capital share transactions in relation to the fluctuating market values of the Fund’s underlying securities. |
| (c) | Distributions for annual periods determined in accordance with U.S. federal income tax regulations. |
| (d) | Where applicable, assumes the reinvestment of distributions. |
| (e) | Excludes fees and expenses incurred indirectly as a result of investments in underlying funds. |
| (f) | Portfolio turnover rate excludes in-kind transactions. |
See notes to financial statements.
| | |
| 44 | | 2 0 2 3 I S H A R E S A N N U A L R E P O R T T O S H A R E H O L D E R S |
Financial Highlights (continued)
(For a share outstanding throughout each period)
| | | | | | | | | | | | | | | | | | | | | | | | |
| |
| | | iShares S&P 500 Growth ETF | |
| | | | | | |
| |
| Year Ended
03/31/23 |
| |
| Year Ended
03/31/22 |
| | | | | |
| Year Ended
03/31/21 |
(a) | |
| Year Ended
03/31/20 |
(a) | |
| Year Ended
03/31/19 |
(a) |
| | | | | | | |
Net asset value, beginning of year | | $ | 76.34 | | | $ | 65.08 | | | | | | | $ | 41.25 | | | $ | 43.10 | | | $ | 38.76 | |
| | | | | | | | | | | | | | | | | | | | | | | | |
| | | | | | |
Net investment income(b) | | | 0.60 | | | | 0.41 | | | | | | | | 0.47 | | | | 0.60 | | | | 0.52 | |
| | | | | | |
Net realized and unrealized gain(c) | | | (12.44 | ) | | | 11.27 | | | | | | | | 23.85 | | | | (1.68 | ) | | | 4.33 | |
| | | | | | | | | | | | | | | | | | | | | | | | |
| | | | | | |
Net increase from investment operations | | | (11.84 | ) | | | 11.68 | | | | | | | | 24.32 | | | | (1.08 | ) | | | 4.85 | |
| | | | | | | | | | | | | | | | | | | | | | | | |
| | | | | | |
Distributions from net investment income(d) | | | (0.58 | ) | | | (0.42 | ) | | | | | | | (0.49 | ) | | | (0.77 | ) | | | (0.51 | ) |
| | | | | | | | | | | | | | | | | | | | | | | | |
| | | | | | |
Net asset value, end of year | | $ | 63.92 | | | $ | 76.34 | | | | | | | $ | 65.08 | | | $ | 41.25 | | | $ | 43.10 | |
| | | | | | | | | | | | | | | | | | | | | | | | |
| | | | | | |
Total Return(e) | | | | | | | | | | | | | | | | | | | | | | | | |
| | | | | | |
Based on net asset value | | | (15.48 | )% | | | 17.94 | % | | | | | | | 59.13 | % | | | (2.65 | )% | | | 12.59 | % |
| | | | | | | | | | | | | | | | | | | | | | | | |
| | | | | | |
Ratios to Average Net Assets(f) | | | | | | | | | | | | | | | | | | | | | | | | |
| | | | | | |
Total expenses | | | 0.18 | % | | | 0.18 | % | | | | | | | 0.18 | % | | | 0.18 | % | | | 0.18 | % |
| | | | | | | | | | | | | | | | | | | | | | | | |
| | | | | | |
Net investment income | | | 0.94 | % | | | 0.55 | % | | | | | | | 0.82 | % | | | 1.30 | % | | | 1.27 | % |
| | | | | | | | | | | | | | | | | | | | | | | | |
| | | | | | |
Supplemental Data | | | | | | | | | | | | | | | | | | | | | | | | |
| | | | | | |
Net assets, end of year (000) | | $ | 30,164,091 | | | $ | 36,758,412 | | | | | | | $ | 31,174,756 | | | $ | 22,307,379 | | | $ | 22,550,900 | |
| | | | | | | | | | | | | | | | | | | | | | | | |
| | | | | | |
Portfolio turnover rate(g) | | | 34 | % | | | 14 | % | | | | | | | 13 | % | | | 27 | % | | | 27 | % |
| | | | | | | | | | | | | | | | | | | | | | | | |
| (a) | Per share amounts reflect a four-for-one stock split effective after the close of trading on October 16, 2020. |
| (b) | Based on average shares outstanding. |
| (c) | The amounts reported for a share outstanding may not accord with the change in aggregate gains and losses in securities for the fiscal period due to the timing of capital share transactions in relation to the fluctuating market values of the Fund’s underlying securities. |
| (d) | Distributions for annual periods determined in accordance with U.S. federal income tax regulations. |
| (e) | Where applicable, assumes the reinvestment of distributions. |
| (f) | Excludes fees and expenses incurred indirectly as a result of investments in underlying funds. |
| (g) | Portfolio turnover rate excludes in-kind transactions. |
See notes to financial statements.
| | |
F I N A N C I A L H I G H L I G H T S | | 45 |
Financial Highlights (continued)
(For a share outstanding throughout each period)
| | | | | | | | | | | | | | | | | | | | |
| | | iShares S&P 500 Value ETF | |
| | | | | |
| | | Year Ended
03/31/23 | | | Year Ended
03/31/22 | | | Year Ended
03/31/21 | | | Year Ended
03/31/20 | | | Year Ended
03/31/19 | |
| | | | | | |
Net asset value, beginning of year | | $ | 155.61 | | | $ | 141.09 | | | $ | 96.29 | | | $ | 112.76 | | | $ | 109.32 | |
| | | | | | | | | | | | | | | | | | | | |
Net investment income(a) | | | 3.00 | | | | 2.89 | | | | 2.83 | | | | 2.86 | | | | 2.69 | |
Net realized and unrealized gain(b) | | | (3.78 | ) | | | 14.48 | | | | 44.86 | | | | (16.41 | ) | | | 3.53 | |
| | | | | | | | | | | | | | | | | | | | |
| | | | | |
Net increase from investment operations | | | (0.78 | ) | | | 17.37 | | | | 47.69 | | | | (13.55 | ) | | | 6.22 | |
| | | | | | | | | | | | | | | | | | | | |
| | | | | |
Distributions from net investment income(c) | | | (3.04 | ) | | | (2.85 | ) | | | (2.89 | ) | | | (2.92 | ) | | | (2.78 | ) |
| | | | | | | | | | | | | | | | | | | | |
| | | | | |
Net asset value, end of year | | $ | 151.79 | | | $ | 155.61 | | | $ | 141.09 | | | $ | 96.29 | | | $ | 112.76 | |
| | | | | | | | | | | | | | | | | | | | |
| | | | | |
Total Return(d) | | | | | | | | | | | | | | | | | | | | |
Based on net asset value | | | (0.35 | )% | | | 12.39 | % | | | 50.10 | % | | | (12.34 | )% | | | 5.79 | % |
| | | | | | | | | | | | | | | | | | | | |
| | | | | |
Ratios to Average Net Assets(e) | | | | | | | | | | | | | | | | | | | | |
Total expenses | | | 0.18 | % | | | 0.18 | % | | | 0.18 | % | | | 0.18 | % | | | 0.18 | % |
| | | | | | | | | | | | | | | | | | | | |
| | | | | |
Net investment income | | | 2.06 | % | | | 1.92 | % | | | 2.39 | % | | | 2.40 | % | | | 2.43 | % |
| | | | | | | | | | | | | | | | | | | | |
| | | | | |
Supplemental Data | | | | | | | | | | | | | | | | | | | | |
Net assets, end of year (000) | | $ | 24,476,275 | | | $ | 25,886,355 | | | $ | 21,424,451 | | | $ | 14,187,829 | | | $ | 15,234,432 | |
| | | | | | | | | | | | | | | | | | | | |
| | | | | |
Portfolio turnover rate(f) | | | 29 | % | | | 18 | % | | | 26 | % | | | 32 | % | | | 31 | % |
| | | | | | | | | | | | | | | | | | | | |
| (a) | Based on average shares outstanding. |
| (b) | The amounts reported for a share outstanding may not accord with the change in aggregate gains and losses in securities for the fiscal period due to the timing of capital share transactions in relation to the fluctuating market values of the Fund’s underlying securities. |
| (c) | Distributions for annual periods determined in accordance with U.S. federal income tax regulations. |
| (d) | Where applicable, assumes the reinvestment of distributions. |
| (e) | Excludes fees and expenses incurred indirectly as a result of investments in underlying funds. |
| (f) | Portfolio turnover rate excludes in-kind transactions. |
See notes to financial statements.
| | |
| 46 | | 2 0 2 3 B L A C K R O C K A N N U A L R E P O R T T O S H A R E H O L D E R S |
Financial Highlights (continued)
(For a share outstanding throughout each period)
| | | | | | | | | | | | | | | | | | | | |
| | | iShares S&P Small-Cap 600 Value ETF | |
| | | | | |
| | |
| Year Ended
03/31/23 |
| |
| Year Ended
03/31/22 |
| |
| Year Ended
03/31/21 |
(a) | |
| Year Ended
03/31/20 |
(a) | |
| Year Ended
03/31/19 |
(a) |
| | | | | |
Net asset value, beginning of year | | $ | 102.39 | | | $ | 100.53 | | | $ | 50.14 | | | $ | 73.81 | | | $ | 75.49 | |
| | | | | | | | | | | | | | | | | | | | |
Net investment income(b) | | | 1.62 | | | | 1.07 | | | | 1.12 | | | | 1.10 | | | | 1.20 | |
Net realized and unrealized gain(c) | | | (8.96 | ) | | | 2.32 | | | | 50.16 | | | | (23.45 | ) | | | (1.71 | ) |
| | | | | | | | | | | | | | | | | | | | |
| | | | | |
Net increase from investment operations | | | (7.34 | ) | | | 3.39 | | | | 51.28 | | | | (22.35 | ) | | | (0.51 | ) |
| | | | | | | | | | | | | | | | | | | | |
| | | | | |
Distributions from net investment income(d) | | | (1.38 | ) | | | (1.53 | ) | | | (0.89 | ) | | | (1.32 | ) | | | (1.17 | ) |
| | | | | | | | | | | | | | | | | | | | |
| | | | | |
Net asset value, end of year | | $ | 93.67 | | | $ | 102.39 | | | $ | 100.53 | | | $ | 50.14 | | | $ | 73.81 | |
| | | | | | | | | | | | | | | | | | | | |
| | | | | |
Total Return(e) | | | | | | | | | | | | | | | | | | | | |
Based on net asset value | | | (7.08 | )% | | | 3.38 | % | | | 103.08 | %(f) | | | (30.75 | )% | | | (0.71 | )% |
| | | | | | | | | | | | | | | | | | | | |
| | | | | |
Ratios to Average Net Assets(g) | | | | | | | | | | | | | | | | | | | | |
Total expenses | | | 0.18 | % | | | 0.18 | % | | | 0.21 | % | | | 0.25 | % | | | 0.25 | % |
| | | | | | | | | | | | | | | | | | | | |
| | | | | |
Net investment income | | | 1.71 | % | | | 1.04 | % | | | 1.56 | % | | | 1.48 | % | | | 1.54 | % |
| | | | | | | | | | | | | | | | | | | | |
| | | | | |
Supplemental Data | | | | | | | | | | | | | | | | | | | | |
Net assets, end of year (000) | | $ | 6,983,348 | | | $ | 8,549,270 | | | $ | 8,806,141 | | | $ | 4,120,917 | | | $ | 6,155,204 | |
| | | | | | | | | | | | | | | | | | | | |
| | | | | |
Portfolio turnover rate(h) | | | 54 | % | | | 42 | % | | | 52 | % | | | 53 | % | | | 38 | % |
| | | | | | | | | | | | | | | | | | | | |
| (a) | Per share amounts reflect a two-for-one stock split effective after the close of trading on October 16, 2020. |
| (b) | Based on average shares outstanding. |
| (c) | The amounts reported for a share outstanding may not accord with the change in aggregate gains and losses in securities for the fiscal period due to the timing of capital share transactions in relation to the fluctuating market values of the Fund’s underlying securities. |
| (d) | Distributions for annual periods determined in accordance with U.S. federal income tax regulations. |
| (e) | Where applicable, assumes the reinvestment of distributions. |
| (f) | Includes a payment received from an affiliate, which had no impact on the Fund’s total return. |
| (g) | Excludes fees and expenses incurred indirectly as a result of investments in underlying funds. |
| (h) | Portfolio turnover rate excludes in-kind transactions. |
See notes to financial statements.
| | |
F I N A N C I A L H I G H L I G H T S | | 47 |
Notes to Financial Statements
iShares Trust (the “Trust”) is registered under the Investment Company Act of 1940, as amended (the “1940 Act”), as an open-end management investment company. The Trust is organized as a Delaware statutory trust and is authorized to have multiple series or portfolios.
These financial statements relate only to the following funds (each, a “Fund” and collectively, the “Funds”):
| | |
| | |
| iShares ETF | | Diversification
Classification |
| |
S&P 100 | | Diversified |
S&P 500 Growth | | Diversified |
| |
S&P 500 Value | | Diversified |
S&P Small-Cap 600 Value | | Diversified |
| 2. | SIGNIFICANT ACCOUNTING POLICIES |
The financial statements are prepared in conformity with accounting principles generally accepted in the United States of America (“U.S. GAAP”), which may require management to make estimates and assumptions that affect the reported amounts of assets and liabilities in the financial statements, disclosure of contingent assets and liabilities at the date of the financial statements and the reported amounts of increases and decreases in net assets from operations during the reporting period. Actual results could differ from those estimates. Each Fund is considered an investment company under U.S. GAAP and follows the accounting and reporting guidance applicable to investment companies. Below is a summary of significant accounting policies:
Investment Transactions and Income Recognition: For financial reporting purposes, investment transactions are recorded on the dates the transactions are executed. Realized gains and losses on investment transactions are determined using the specific identification method. Dividend income and capital gain distributions, if any, are recorded on the ex-dividend date. Non-cash dividends, if any, are recorded on the ex-dividend date at fair value. Dividends from foreign securities where the ex-dividend date may have passed are subsequently recorded when the Funds are informed of the ex-dividend date. Under the applicable foreign tax laws, a withholding tax at various rates may be imposed on capital gains, dividends and interest. Upon notification from issuers or as estimated by management, a portion of the dividend income received from a real estate investment trust may be redesignated as a reduction of cost of the related investment and/or realized gain.
Foreign Taxes: The Funds may be subject to foreign taxes (a portion of which may be reclaimable) on income, stock dividends, capital gains on investments, or certain foreign currency transactions. All foreign taxes are recorded in accordance with the applicable foreign tax regulations and rates that exist in the foreign jurisdiction in which each Fund invests. These foreign taxes, if any, are paid by each Fund and are reflected in its Statements of Operations as follows: foreign taxes withheld at source are presented as a reduction of income, foreign taxes on securities lending income are presented as a reduction of securities lending income, foreign taxes on stock dividends are presented as “Other foreign taxes”, and foreign taxes on capital gains from sales of investments and foreign taxes on foreign currency transactions are included in their respective net realized gain (loss) categories. Foreign taxes payable or deferred as of March 31, 2023, if any, are disclosed in the Statements of Assets and Liabilities.
The Funds file withholding tax reclaims in certain jurisdictions to recover a portion of amounts previously withheld. The Funds may record a reclaim receivable based on collectability, which includes factors such as the jurisdiction’s applicable laws, payment history and market convention. The Statements of Operations includes tax reclaims recorded as well as professional and other fees, if any, associated with recovery of foreign withholding taxes.
Collateralization: If required by an exchange or counterparty agreement, the Funds may be required to deliver/deposit cash and/or securities to/with an exchange, or broker-dealer or custodian as collateral for certain investments.
In-kind Redemptions: For financial reporting purposes, in-kind redemptions are treated as sales of securities resulting in realized capital gains or losses to the Funds. Because such gains or losses are not taxable to the Funds and are not distributed to existing Fund shareholders, the gains or losses are reclassified from accumulated net realized gain (loss) to paid-in capital at the end of the Funds’ tax year. These reclassifications have no effect on net assets or net asset value (“NAV”) per share.
Distributions: Dividends and distributions paid by each Fund are recorded on the ex-dividend dates. Distributions are determined on a tax basis and may differ from net investment income and net realized capital gains for financial reporting purposes. Dividends and distributions are paid in U.S. dollars and cannot be automatically reinvested in additional shares of the Funds.
The character and timing of distributions are determined in accordance with U.S. federal income tax regulations, which may differ from U.S. GAAP.
Indemnifications: In the normal course of business, each Fund enters into contracts that contain a variety of representations that provide general indemnification. The Funds’ maximum exposure under these arrangements is unknown because it involves future potential claims against the Funds, which cannot be predicted with any certainty.
| 3. | INVESTMENT VALUATION AND FAIR VALUE MEASUREMENTS |
Investment Valuation Policies: Each Fund’s investments are valued at fair value (also referred to as “market value” within the financial statements) each day that the Fund’s listing exchange is open and, for financial reporting purposes, as of the report date. U.S. GAAP defines fair value as the price a fund would receive to sell an asset or pay to transfer a liability in an orderly transaction between market participants at the measurement date. The Board of Trustees of the Trust (the “Board”) of each Fund has approved the designation of BlackRock Fund Advisors (“BFA”), the Funds’ investment adviser, as the valuation designee for each Fund. Each Fund determines the fair values of its financial instruments using various independent dealers or pricing services under BFA’s policies. If a security’s market price is not readily available or does not otherwise
| | |
| 48 | | 2 0 2 3 I S H A R E S A N N U A L R E P O R T T O S H A R E H O L D E R S |
Notes to Financial Statements (continued)
accurately represent the fair value of the security, the security will be valued in accordance with BFA’s policies and procedures as reflecting fair value. BFA has formed a committee (the “Valuation Committee”) to develop pricing policies and procedures and to oversee the pricing function for all financial instruments, with assistance from other BlackRock pricing committees.
Fair Value Inputs and Methodologies: The following methods and inputs are used to establish the fair value of each Fund’s assets and liabilities:
| | • | | Equity investments traded on a recognized securities exchange are valued at that day’s official closing price, as applicable, on the exchange where the stock is primarily traded. Equity investments traded on a recognized exchange for which there were no sales on that day are valued at the last traded price. |
| | • | | Investments in open-end U.S. mutual funds (including money market funds) are valued at that day’s published NAV. |
| | • | | Futures contracts are valued based on that day’s last reported settlement or trade price on the exchange where the contract is traded. |
| | • | | Swap agreements are valued utilizing quotes received daily by independent pricing services or through brokers, which are derived using daily swap curves and models that incorporate a number of market data factors, such as discounted cash flows, trades and values of the underlying reference instruments. |
Generally, trading in foreign instruments is substantially completed each day at various times prior to the close of trading on the NYSE. Each business day, the Fund uses current market factors supplied by independent pricing services to value certain foreign instruments (“Systematic Fair Value Price”). The Systematic Fair Value Price is designed to value such foreign securities at fair value as of the close of trading on the NYSE, which follows the close of the local markets.
If events (e.g., market volatility, company announcement or a natural disaster) occur that are expected to materially affect the value of such investment, or in the event that application of these methods of valuation results in a price for an investment that is deemed not to be representative of the market value of such investment, or if a price is not available, the investment will be valued by the Valuation Committee in accordance with the Manager’s policies and procedures as reflecting fair value (“Fair Valued Investments”). The fair valuation approaches that may be used by the Valuation Committee include market approach, income approach and cost approach. Valuation techniques such as discounted cash flow, use of market comparables and matrix pricing are types of valuation approaches and are typically used in determining fair value. When determining the price for Fair Valued Investments, the Valuation Committee seeks to determine the price that each Fund might reasonably expect to receive or pay from the current sale or purchase of that asset or liability in an arm’s-length transaction. Fair value determinations shall be based upon all available factors that the Valuation Committee deems relevant and consistent with the principles of fair value measurement.
Fair value pricing could result in a difference between the prices used to calculate a fund’s NAV and the prices used by the fund’s underlying index, which in turn could result in a difference between the fund’s performance and the performance of the fund’s underlying index.
Fair Value Hierarchy: Various inputs are used in determining the fair value of financial instruments. These inputs to valuation techniques are categorized into a fair value hierarchy consisting of three broad levels for financial reporting purposes as follows:
| | • | | Level 1 – Unadjusted price quotations in active markets/exchanges for identical assets or liabilities that each Fund has the ability to access; |
| | • | | Level 2 – Other observable inputs (including, but not limited to, quoted prices for similar assets or liabilities in markets that are active, quoted prices for identical or similar assets or liabilities in markets that are not active, inputs other than quoted prices that are observable for the assets or liabilities (such as interest rates, yield curves, volatilities, prepayment speeds, loss severities, credit risks and default rates) or other market–corroborated inputs); and |
| | • | | Level 3 – Unobservable inputs based on the best information available in the circumstances, to the extent observable inputs are not available (including the Valuation Committee’s assumptions used in determining the fair value of financial instruments). |
The hierarchy gives the highest priority to unadjusted quoted prices in active markets for identical assets or liabilities (Level 1 measurements) and the lowest priority to unobservable inputs (Level 3 measurements). Accordingly, the degree of judgment exercised in determining fair value is greatest for instruments categorized in Level 3. The inputs used to measure fair value may fall into different levels of the fair value hierarchy. In such cases, for disclosure purposes, the fair value hierarchy classification is determined based on the lowest level input that is significant to the fair value measurement in its entirety. Investments classified within Level 3 have significant unobservable inputs used by the Valuation Committee in determining the price for Fair Valued Investments. Level 3 investments include equity or debt issued by privately held companies or funds that may not have a secondary market and/or may have a limited number of investors. The categorization of a value determined for financial instruments is based on the pricing transparency of the financial instruments and is not necessarily an indication of the risks associated with investing in those securities.
| 4. | SECURITIES AND OTHER INVESTMENTS |
Securities Lending: Each Fund may lend its securities to approved borrowers, such as brokers, dealers and other financial institutions. The borrower pledges and maintains with the Fund collateral consisting of cash, an irrevocable letter of credit issued by an approved bank, or securities issued or guaranteed by the U.S. government. The initial collateral received by each Fund is required to have a value of at least 102% of the current market value of the loaned securities for securities traded on U.S. exchanges and a value of at least 105% for all other securities. The collateral is maintained thereafter at a value equal to at least 100% of the current value of the securities on loan. The market value of the loaned securities is determined at the close of each business day of the Fund and any additional required collateral is delivered to the Fund or excess collateral is returned by the Fund, on the next business day. During the term of the loan, each Fund is entitled to all distributions made on or in respect of the loaned securities but does not receive interest income on securities received as collateral. Loans of securities are terminable at any time and the borrower, after notice, is required to return borrowed securities within the standard time period for settlement of securities transactions.
As of period end, any securities on loan were collateralized by cash and/or U.S. Government obligations. Cash collateral invested in money market funds managed by BFA or its affiliates is disclosed in the Schedule of Investments. Any non-cash collateral received cannot be sold, re-invested or pledged by the Fund, except in the event of borrower default. The securities on loan, if any, are also disclosed in each Fund’s Schedule of Investments. The market value of any securities on loan and the value of any related cash collateral are disclosed in the Statements of Assets and Liabilities.
| | |
N O T E S T O F I N A N C I A L S T A T E M E N T S | | 49 |
Notes to Financial Statements (continued)
Securities lending transactions are entered into by the Funds under Master Securities Lending Agreements (each, an “MSLA”) which provide the right, in the event of default (including bankruptcy or insolvency) for the non-defaulting party to liquidate the collateral and calculate a net exposure to the defaulting party or request additional collateral. In the event that a borrower defaults, the Funds, as lender, would offset the market value of the collateral received against the market value of the securities loaned. When the value of the collateral is greater than that of the market value of the securities loaned, the lender is left with a net amount payable to the defaulting party. However, bankruptcy or insolvency laws of a particular jurisdiction may impose restrictions on or prohibitions against such a right of offset in the event of an MSLA counterparty’s bankruptcy or insolvency. Under the MSLA, absent an event of default, the borrower can resell or re-pledge the loaned securities, and the Funds can reinvest cash collateral received in connection with loaned securities. Upon an event of default, the parties’ obligations to return the securities or collateral to the other party are extinguished, and the parties can resell or re-pledge the loaned securities or the collateral received in connection with the loaned securities in order to satisfy the defaulting party’s net payment obligation for all transactions under the MSLA. The defaulting party remains liable for any deficiency.
As of period end, the following table is a summary of the securities on loan by counterparty which are subject to offset under an MSLA:
| | | | | | | | | | | | | | | | |
| | | | | |
| iShares ETF and Counterparty | |
| Securities
Loaned at Value |
| |
| Cash
Collateral Received |
(a) | |
| Non-Cash
Collateral Received,
at Fair Value |
(a) | |
| Net
Amount |
(b) |
| | | | |
S&P 500 Growth | | | | | | | | | | | | | | | | |
Barclays Bank PLC | | $ | 953,371 | | | $ | (953,371 | ) | | $ | — | | | $ | — | |
BNP Paribas SA | | | 1,820,016 | | | | (1,820,016 | ) | | | — | | | | — | |
Citadel Clearing LLC | | | 9,568,555 | | | | (9,568,555 | ) | | | — | | | | — | |
Citigroup Global Markets, Inc. | | | 61,947,606 | | | | (61,542,354 | ) | | | — | | | | 405,252 | |
Credit Suisse Securities (USA) LLC | | | 3,054 | | | | (3,054 | ) | | | — | | | | — | |
Goldman Sachs & Co. LLC | | | 92,471,629 | | | | (92,471,629 | ) | | | — | | | | — | |
J.P. Morgan Securities LLC | | | 9,362,720 | | | | (9,362,720 | ) | | | — | | | | — | |
Jefferies LLC | | | 255,069 | | | | (255,069 | ) | | | — | | | | — | |
Morgan Stanley | | | 26,497 | | | | (26,418 | ) | | | — | | | | 79 | |
RBC Capital Market LLC | | | 51,154,802 | | | | (51,154,802 | ) | | | — | | | | — | |
Scotia Capital (USA), Inc. | | | 19,428 | | | | (19,409 | ) | | | — | | | | 19 | |
TD Prime Services LLC | | | 89,899 | | | | (89,899 | ) | | | — | | | | — | |
UBS AG | | | 7,695,978 | | | | (7,695,978 | ) | | | — | | | | — | |
UBS Securities LLC | | | 477,176 | | | | (476,420 | ) | | | — | | | | 756 | |
| | | | | | | | | | | | | | | | |
| | | | |
| | $ | 235,845,800 | | | $ | (235,439,694 | ) | | $ | — | | | $ | 406,106 | |
| | | | | | | | | | | | | | | | |
S&P 500 Value | | | | | | | | | | | | | | | | |
Barclays Bank PLC | | $ | 2,697,387 | | | $ | (2,697,387 | ) | | $ | — | | | $ | — | |
BofA Securities, Inc. | | | 2,992,988 | | | | (2,991,402 | ) | | | — | | | | 1,586 | |
Citadel Clearing LLC | | | 2,046,619 | | | | (2,046,619 | ) | | | — | | | | — | |
Citigroup Global Markets, Inc. | | | 22,230,282 | | | | (22,230,282 | ) | | | — | | | | — | |
Credit Suisse Securities (USA) LLC | | | 19,798 | | | | (19,204 | ) | | | — | | | | 594 | |
Goldman Sachs & Co. LLC | | | 26,244,638 | | | | (26,244,638 | ) | | | — | | | | — | |
J.P. Morgan Securities LLC | | | 100,067,101 | | | | (100,067,101 | ) | | | — | | | | — | |
Jefferies LLC | | | 10,156,124 | | | | (10,117,500 | ) | | | — | | | | 38,624 | |
Morgan Stanley | | | 14,201,370 | | | | (14,201,370 | ) | | | — | | | | — | |
Natixis SA | | | 5,371,305 | | | | (5,371,305 | ) | | | — | | | | — | |
RBC Capital Market LLC | | | 169,138 | | | | (169,025 | ) | | | — | | | | 113 | |
Scotia Capital (USA), Inc. | | | 4,082,831 | | | | (4,042,380 | ) | | | — | | | | 40,451 | |
TD Prime Services LLC | | | 11,450,325 | | | | (11,133,250 | ) | | | — | | | | 317,075 | |
UBS AG | | | 1,856,172 | | | | (1,856,172 | ) | | | — | | | | — | |
Virtu Americas LLC | | | 2,886,495 | | | | (2,883,150 | ) | | | — | | | | 3,345 | |
Wells Fargo Securities LLC | | | 1,921,558 | | | | (1,918,093 | ) | | | — | | | | 3,465 | |
| | | | | | | | | | | | | | | | |
| | | | |
| | $ | 208,394,131 | | | $ | (207,988,878 | ) | | $ | — | | | $ | 405,253 | |
| | | | | | | | | | | | | | | | |
S&P Small-Cap 600 Value | | | | | | | | | | | | | | | | |
Barclays Bank PLC | | $ | 5,917,406 | | | $ | (5,917,406 | ) | | $ | — | | | $ | — | |
Barclays Capital, Inc. | | | 1,853,197 | | | | (1,851,200 | ) | | | — | | | | 1,997 | |
BNP Paribas SA | | | 67,861,578 | | | | (67,602,297 | ) | | | — | | | | 259,281 | |
BofA Securities, Inc. | | | 40,798,142 | | | | (40,798,142 | ) | | | — | | | | — | |
Citadel Clearing LLC | | | 566,020 | | | | (562,375 | ) | | | — | | | | 3,645 | |
Citigroup Global Markets, Inc. | | | 2,563,079 | | | | (2,544,879 | ) | | | — | | | | 18,200 | |
Credit Suisse Securities (USA) LLC | | | 199,174 | | | | (199,174 | ) | | | — | | | | — | |
Goldman Sachs & Co. LLC | | | 64,882,315 | | | | (64,882,315 | ) | | | — | | | | — | |
HSBC Bank PLC | | | 5,020,916 | | | | (5,007,375 | ) | | | — | | | | 13,541 | |
J.P. Morgan Securities LLC | | | 79,509,693 | | | | (79,509,693 | ) | | | — | | | | — | |
Jefferies LLC | | | 1,117,467 | | | | (1,117,467 | ) | | | — | | | | — | |
Morgan Stanley | | | 73,903,401 | | | | (73,887,666 | ) | | | — | | | | 15,735 | |
National Financial Services LLC | | | 170,578 | | | | (170,578 | ) | | | — | | | | — | |
Natixis SA | | | 8,814,095 | | | | (8,814,095 | ) | | | — | | | | — | |
Nomura Securities International, Inc. | | | 2,420,422 | | | | (2,420,422 | ) | | | — | | | | — | |
Scotia Capital (USA), Inc. | | | 5,987,728 | | | | (5,987,728 | ) | | | — | | | | — | |
SG Americas Securities LLC | | | 277,269 | | | | (277,269 | ) | | | — | | | | — | |
State Street Bank & Trust Co. | | | 29,701,705 | | | | (29,701,705 | ) | | | — | | | | — | |
TD Prime Services LLC | | | 8,557,942 | | | | (8,557,942 | ) | | | — | | | | — | |
UBS AG | | | 11,058,628 | | | | (11,045,592 | ) | | | — | | | | 13,036 | |
| | |
| 50 | | 2 0 2 3 I S H A R E S A N N U A L R E P O R T T O S H A R E H O L D E R S |
Notes to Financial Statements (continued)
| | | | | | | | | | | | | | | | |
| | | | | |
| iShares ETF and Counterparty | |
| Securities
Loaned at Value |
| |
| Cash
Collateral Received |
(a) | |
| Non-Cash
Collateral Received,
at Fair Value |
(a) | |
| Net
Amount |
(b) |
S&P Small-Cap 600 Value (continued) | | | | | | | | | | | | | | | | |
UBS Securities LLC | | $ | 470,116 | | | $ | (470,116 | ) | | $ | — | | | $ | — | |
Virtu Americas LLC | | | 65,696 | | | | (65,696 | ) | | | — | | | | — | |
Wells Fargo Bank N.A. | | | 1,017,542 | | | | (1,017,542 | ) | | | — | | | | — | |
Wells Fargo Securities LLC | | | 3,310,153 | | | | (3,310,153 | ) | | | — | | | | — | |
| | | | | | | | | | | | | | | | |
| | $ | 416,044,262 | | | $ | (415,718,827 | ) | | $ | — | | | $ | 325,435 | |
| | | | | | | | | | | | | | | | |
| | (a) | Collateral received, if any, in excess of the market value of securities on loan is not presented in this table. The total cash collateral received by each Fund is disclosed in the Funds’ Statements of Assets and Liabilities. | |
| | (b) | The market value of the loaned securities is determined as of March 31, 2023. Additional collateral is delivered to the Fund on the next business day in accordance with the MSLA. The net amount would be subject to the borrower default indemnity in the event of default by the counterparty. | |
The risks of securities lending include the risk that the borrower may not provide additional collateral when required or may not return the securities when due. To mitigate these risks, each Fund benefits from a borrower default indemnity provided by BlackRock, Inc. (“BlackRock”). BlackRock’s indemnity allows for full replacement of the securities loaned to the extent the collateral received does not cover the value of the securities loaned in the event of borrower default. Each Fund could incur a loss if the value of an investment purchased with cash collateral falls below the market value of the loaned securities or if the value of an investment purchased with cash collateral falls below the value of the original cash collateral received. Such losses are borne entirely by each Fund.
| 5. | DERIVATIVE FINANCIAL INSTRUMENTS |
Futures Contracts: Futures contracts are purchased or sold to gain exposure to, or manage exposure to, changes in interest rates (interest rate risk) and changes in the value of equity securities (equity risk) or foreign currencies (foreign currency exchange rate risk).
Futures contracts are exchange-traded agreements between the Funds and a counterparty to buy or sell a specific quantity of an underlying instrument at a specified price and on a specified date. Depending on the terms of a contract, it is settled either through physical delivery of the underlying instrument on the settlement date or by payment of a cash amount on the settlement date. Upon entering into a futures contract, the Funds are required to deposit initial margin with the broker in the form of cash or securities in an amount that varies depending on a contract’s size and risk profile. The initial margin deposit must then be maintained to an established level over the life of the contract. Amounts pledged, which are considered restricted, are included in cash pledged for futures contracts in the Statements of Assets and Liabilities.
Securities deposited as initial margin are designated in the Schedule of Investments and cash deposited, if any, are shown as cash pledged for futures contracts in the Statements of Assets and Liabilities. Pursuant to the contract, the Funds agree to receive from or pay to the broker an amount of cash equal to the daily fluctuation in market value of the contract (“variation margin”). Variation margin is recorded as unrealized appreciation (depreciation) and, if any, shown as variation margin receivable (or payable) on futures contracts in the Statements of Assets and Liabilities. When the contract is closed, a realized gain or loss is recorded in the Statements of Operations equal to the difference between the notional amount of the contract at the time it was opened and the notional amount at the time it was closed. The use of futures contracts involves the risk of an imperfect correlation in the movements in the price of futures contracts and interest rates, foreign currency exchange rates or underlying assets.
Swaps: Swap contracts are entered into to manage exposure to issuers, markets and securities. Such contracts are agreements between the Funds and a counterparty to make periodic net payments on a specified notional amount or a net payment upon termination. Swap agreements are privately negotiated in the OTC market and may be entered into as a bilateral contract (“OTC swaps”) or centrally cleared (“centrally cleared swaps”). For OTC swaps, any upfront premiums paid and any upfront fees received are shown as premiums paid and swap premiums received, respectively, in the Statements of Assets and Liabilities and amortized over the term of the contract. The daily fluctuation in market value is recorded as unrealized appreciation (depreciation) on OTC Swaps in the Statements of Assets and Liabilities. Payments received or paid are recorded on the Statements of Operations as realized gains or losses, respectively. When an OTC swap is terminated, a realized gain or loss is recorded in the Statements of Operations equal to the difference between the proceeds from (or cost of) the closing transaction and the Funds’ basis in the contract, if any. Generally, the basis of the contract is the premium received or paid. Total return swaps are entered into by the iShares EGS Screened S&P Small-Cap ETF to obtain exposure to a security or market without owning such security or investing directly in such market or to exchange the risk/return of one security or market (e.g., fixed-income) with another security or market (e.g., equity or commodity prices) (equity risk, commodity price risk and/or interest rate risk).
Total return swaps are agreements in which there is an exchange of cash flows whereby one party commits to make payments based on the total return (distributions plus capital gains/losses) of an underlying instrument, or basket of underlying instruments, in exchange for fixed or floating rate interest payments. If the total return of the instruments or index underlying the transaction exceeds or falls short of the offsetting fixed or floating interest rate obligation, the Fund receives payment from or makes a payment to the counterparty.
Certain total return swaps are designed to function as a portfolio of direct investments in long and short equity positions. This means that the Fund has the ability to trade in and out of these long and short positions within the swap and will receive the economic benefits and risks equivalent to direct investment in these positions, subject to certain adjustments due to events related to the counterparty. Benefits and risks include capital appreciation (depreciation), corporate actions and dividends received and paid, all of which are reflected in the swap’s market value. The market value also includes interest charges and credits (“financing fees”) related to the notional values of the long and short positions and cash balances within the swap. These interest charges and credits are based on a specified benchmark rate plus or minus a specified spread determined based upon the country and/or currency of the positions in the portfolio.
Positions within the swap and financing fees are reset periodically. During a reset, any unrealized appreciation (depreciation) on positions and accrued financing fees become available for cash settlement between the Fund and the counterparty. The amounts that are available for cash settlement are recorded as realized gains or losses in the Statements of Operations. Cash settlement in and out of the swap may occur at a reset date or any other date, at the discretion of the Fund and the counterparty, over the life of the agreement. Certain swaps have no stated expiration and can be terminated by either party at any time.
| | |
N O T E S T O F I N A N C I A L S T A T E M E N T S | | 51 |
Notes to Financial Statements (continued)
Swap transactions involve, to varying degrees, elements of interest rate, credit and market risks in excess of the amounts recognized in the Statements of Assets and Liabilities. Such risks involve the possibility that there will be no liquid market for these agreements, that the counterparty to the agreements may default on its obligation to perform or disagree as to the meaning of the contractual terms in the agreements, and that there may be unfavorable changes in interest rates and/or market values associated with these transactions.
Master Netting Arrangements: In order to define its contractual rights and to secure rights that will help it mitigate its counterparty risk, a Fund may enter into an International Swaps and Derivatives Association, Inc. Master Agreement (“ISDA Master Agreement”) or similar agreement with its counterparties. An ISDA Master Agreement is a bilateral agreement between a Fund and a counterparty that governs certain OTC derivatives and typically contains, among other things, collateral posting terms and netting provisions in the event of a default and/or termination event. Under an ISDA Master Agreement, a Fund may, under certain circumstances, offset with the counterparty certain derivative financial instruments’ payables and/or receivables with collateral held and/or posted and create one single net payment. The provisions of the ISDA Master Agreement typically permit a single net payment in the event of default including the bankruptcy or insolvency of the counterparty. However, bankruptcy or insolvency laws of a particular jurisdiction may impose restrictions on or prohibitions against the right of offset in bankruptcy, insolvency or other events.
For derivatives traded under an ISDA Master Agreement, the collateral requirements are typically calculated by netting the mark-to-market amount for each transaction under such agreement and comparing that amount to the value of any collateral currently pledged by a Fund and the counterparty.
Cash collateral that has been pledged to cover obligations of the Funds and cash collateral received from the counterparty, if any, is reported separately in the Statements of Assets and Liabilities as cash pledged as collateral and cash received as collateral, respectively. Non-cash collateral pledged by the Funds, if any, is noted in the Schedules of Investments. Generally, the amount of collateral due from or to a counterparty is subject to a certain minimum transfer amount threshold before a transfer is required, which is determined at the close of business of the Funds. Any additional required collateral is delivered to/pledged by the Funds on the next business day. Typically, the counterparty is not permitted to sell, re-pledge or use cash and non-cash collateral it receives. A Fund generally agrees not to use non-cash collateral that it receives but may, absent default or certain other circumstances defined in the underlying ISDA Master Agreement, be permitted to use cash collateral received. In such cases, interest may be paid pursuant to the collateral arrangement with the counterparty. To the extent amounts due to the Funds from the counterparty are not fully collateralized, each Fund bears the risk of loss from counterparty non-performance. Likewise, to the extent the Funds have delivered collateral to a counterparty and stand ready to perform under the terms of the agreement with such counterparty, each Fund bears the risk of loss from a counterparty in the amount of the value of the collateral in the event the counterparty fails to return such collateral. Based on the terms of agreements, collateral may not be required for all derivative contracts.
For financial reporting purposes, each Fund does not offset derivative assets and derivative liabilities that are subject to netting arrangements, if any, in the Statements of Assets and Liabilities.
| 6. | INVESTMENT ADVISORY AGREEMENT AND OTHER TRANSACTIONS WITH AFFILIATES |
Investment Advisory Fees: Pursuant to an Investment Advisory Agreement with the Trust, BFA manages the investment of each Fund’s assets. BFA is a California corporation indirectly owned by BlackRock. Under the Investment Advisory Agreement, BFA is responsible for substantially all expenses of the Funds, except (i) interest and taxes; (ii) brokerage commissions and other expenses connected with the execution of portfolio transactions; (iii) distribution fees; (iv) the advisory fee payable to BFA; and (v) litigation expenses and any extraordinary expenses (in each case as determined by a majority of the independent trustees).
For its investment advisory services to each of the following Funds, BFA is entitled to an annual investment advisory fee, accrued daily and paid monthly by the Funds, based on the average daily net assets of each Fund as follows:
| | | | |
| | |
| iShares ETF | | Investment Advisory Fees | |
| |
S&P 100 | | | 0.20 | % |
S&P 500 Growth | | | 0.18 | |
S&P 500 Value | | | 0.18 | |
| |
S&P Small-Cap 600 Value | | | 0.18 | |
Distributor: BlackRock Investments, LLC (“BRIL”), an affiliate of BFA, is the distributor for each Fund. Pursuant to the distribution agreement, BFA is responsible for any fees or expenses for distribution services provided to the Funds.
ETF Servicing Fees: Each Fund has entered into an ETF Services Agreement with BRIL to perform certain order processing, Authorized Participant communications, and related services in connection with the issuance and redemption of Creation Units (“ETF Services”). BRIL is entitled to a transaction fee from Authorized Participants on each creation or redemption order for the ETF Services provided. The Funds do not pay BRIL for ETF Services.
Prior to April 25, 2022, ETF Services were performed by State Street Bank and Trust Company.
Securities Lending: The U.S. Securities and Exchange Commission (the “SEC”) has issued an exemptive order which permits BlackRock Institutional Trust Company, N.A. (“BTC”), an affiliate of BFA, to serve as securities lending agent for the Funds, subject to applicable conditions. As securities lending agent, BTC bears all operational costs directly related to securities lending, including any custodial costs. Each Fund is responsible for fees in connection with the investment of cash collateral received for securities on loan (the “collateral investment fees”). The cash collateral is invested in a money market fund, BlackRock Cash Funds: Institutional or BlackRock Cash Funds: Treasury, managed by BFA, or its affiliates. However, BTC has agreed to reduce the amount of securities lending income it receives in order to effectively limit the collateral investment fees each Fund bears to an annual rate of 0.04%. The SL Agency Shares of such money market fund will not be subject to a sales load, distribution fee or service fee. The money market fund in which the cash collateral has been invested may, under certain circumstances, impose a liquidity fee of up to 2% of the value redeemed or temporarily restrict redemptions for up to 10 business days during a 90 day period, in the event that the money market fund’s weekly liquid assets fall below certain thresholds.
| | |
| 52 | | 2 0 2 3 I S H A R E S A N N U A L R E P O R T T O S H A R E H O L D E R S |
Notes to Financial Statements (continued)
Securities lending income is equal to the total of income earned from the reinvestment of cash collateral, net of fees and other payments to and from borrowers of securities, and less the collateral investment fees. Each Fund retains a portion of securities lending income and remits the remaining portion to BTC as compensation for its services as securities lending agent.
Pursuant to the current securities lending agreement, each Fund retains 81% of securities lending income (which excludes collateral investment fees) and the amount retained can never be less than 70% of the total of securities lending income plus the collateral investment fees.
In addition, commencing the business day following the date that the aggregate securities lending income plus the collateral investment fees generated across all 1940 Act iShares exchange-traded funds (the “iShares ETF Complex”) in that calendar year exceeds a specified threshold, each Fund, pursuant to the securities lending agreement, will retain for the remainder of that calendar year 81% of securities lending income (which excludes collateral investment fees), and the amount retained can never be less than 70% of the total of securities lending income plus the collateral investment fees.
The share of securities lending income earned by each Fund is shown as securities lending income - affiliated - net in its Statements of Operations. For the year ended March 31, 2023, the Funds paid BTC the following amounts for securities lending agent services:
| | | | |
| | |
| iShares ETF | | Amounts | |
| |
S&P 100 | | $ | 43,471 | |
S&P 500 Growth | | | 206,679 | |
S&P 500 Value | | | 219,463 | |
| |
S&P Small-Cap 600 Value | | | 474,954 | |
Officers and Trustees: Certain officers and/or trustees of the Trust are officers and/or trustees of BlackRock or its affiliates.
Other Transactions: Cross trading is the buying or selling of portfolio securities between funds to which BFA (or an affiliate) serves as investment adviser. At its regularly scheduled quarterly meetings, the Board reviews such transactions as of the most recent calendar quarter for compliance with the requirements and restrictions set forth by Rule 17a-7.
For the year ended March 31, 2023, transactions executed by the Funds pursuant to Rule 17a-7 under the 1940 Act were as follows:
| | | | | | | | | | | | |
| | | | |
| iShares ETF | | Purchases | | | Sales | | | Net Realized
Gain (Loss) | |
S&P 100 | | $ | 41,851,425 | | | $ | 36,786,241 | | | $ | (19,665,381 | ) |
S&P 500 Growth | | | 6,709,318,546 | | | | 7,474,526,018 | | | | (1,731,596,705 | ) |
S&P 500 Value | | | 6,229,418,684 | | | | 5,555,035,930 | | | | (190,503,385 | ) |
S&P Small-Cap 600 Value | | | 1,390,431,185 | | | | 1,569,691,056 | | | | 15,820,837 | |
Each Fund may invest its positive cash balances in certain money market funds managed by BFA or an affiliate. The income earned on these temporary cash investments is shown as dividends - affiliated in the Statements of Operations.
A fund, in order to improve its portfolio liquidity and its ability to track its underlying index, may invest in shares of other iShares funds that invest in securities in the fund’s underlying index.
For the year ended March 31, 2023, purchases and sales of investments, excluding short-term securities, were as follows:
| | | | | | | | |
| | | |
| iShares ETF | | Purchases | | | Sales | |
| | |
S&P 100 | | $ | 235,776,630 | | | $ | 235,903,077 | |
S&P 500 Growth | | | 10,268,502,679 | | | | 10,270,817,853 | |
S&P 500 Value | | | 7,241,816,576 | | | | 7,189,092,927 | |
| | |
S&P Small-Cap 600 Value | | | 3,947,874,629 | | | | 4,081,472,673 | |
For the year ended March 31, 2023, in-kind transactions were as follows:
| | | | | | | | |
| | | |
| iShares ETF | | In-kind
Purchases | | | In-kind
Sales | |
| | |
S&P 100 | | $ | 1,220,226,145 | | | $ | 1,511,748,081 | |
S&P 500 Growth | | | 4,127,856,805 | | | | 4,931,930,719 | |
S&P 500 Value | | | 9,821,369,364 | | | | 10,520,294,992 | |
| | |
S&P Small-Cap 600 Value | | | 3,863,111,989 | | | | 4,602,532,910 | |
| | |
N O T E S T O F I N A N C I A L S T A T E M E N T S | | 53 |
Notes to Financial Statements (continued)
Each Fund is treated as an entity separate from the Trust’s other funds for federal income tax purposes. It is each Fund’s policy to comply with the requirements of the Internal Revenue Code of 1986, as amended, applicable to regulated investment companies, and to distribute substantially all of its taxable income to its shareholders. Therefore, no U.S. federal income tax provision is required.
Management has analyzed tax laws and regulations and their application to the Funds as of March 31, 2023, inclusive of the open tax return years, and does not believe that there are any uncertain tax positions that require recognition of a tax liability in the Funds’ financial statements.
U.S. GAAP requires that certain components of net assets be adjusted to reflect permanent differences between financial and tax reporting. These reclassifications have no effect on net assets or NAV per share. As of March 31, 2023, permanent differences attributable to realized gains (losses) from in-kind redemptions and distributions paid in excess of taxable income were reclassified to the following accounts:
| | | | | | | | |
| iShares ETF | | Paid-in capital | | | Accumulated earnings (loss) | |
S&P 100 | | $ | 481,586,929 | | | $ | (481,586,929 | ) |
S&P 500 Growth | | | 2,381,019,333 | | | | (2,381,019,333 | ) |
S&P 500 Value | | | 2,745,576,484 | | | | (2,745,576,484 | ) |
S&P Small-Cap 600 Value | | | 386,322,454 | | | | (386,322,454 | ) |
The tax character of distributions paid was as follows:
| | | | | | | | |
| iShares ETF | | Year Ended
March 31, 2023 | | | Year Ended
March 31, 2022 | |
S&P 100 | | | | | | | | |
Ordinary income | | $ | 113,384,492 | | | $ | 96,979,731 | |
| | | | | | | | |
S&P 500 Growth | | | | | | | | |
Ordinary income | | $ | 273,353,269 | | | $ | 197,299,111 | |
| | | | | | | | |
S&P 500 Value | | | | | | | | |
Ordinary income | | $ | 505,414,298 | | | $ | 441,547,200 | |
| | | | | | | | |
S&P Small-Cap 600 Value | | | | | | | | |
Ordinary income | | $ | 106,591,690 | | | $ | 131,583,294 | |
| | | | | | | | |
As of March 31, 2023, the tax components of accumulated net earnings (losses) were as follows:
| | | | | | | | | | | | | | | | | | | | |
| iShares ETF | | Undistributed
Ordinary Income | | | Non-expiring
Capital Loss
Carryforwards(a) | | | Net Unrealized
Gains (Losses)(b) | | | Qualified late-year losses(c) | | | Total | |
S&P 100 | | $ | 1,817,826 | | | $ | (362,360,219 | ) | | $ | 856,467,410 | | | $ | — | | | $ | 495,925,017 | |
S&P 500 Growth | | | 6,732,298 | | | | (3,160,067,414 | ) | | | 7,364,747,075 | | | | — | | | | 4,211,411,959 | |
S&P 500 Value | | | 983,982 | | | | (1,566,023,135 | ) | | | 430,007,982 | | | | — | | | | (1,135,031,171 | ) |
S&P Small-Cap 600 Value | | | — | | | | (854,325,126 | ) | | | (716,456,219 | ) | | | (26,519,224 | ) | | | (1,597,300,569 | ) |
| (a) | Amounts available to offset future realized capital gains. |
| (b) | The difference between book-basis and tax-basis unrealized gains (losses) was attributable primarily to the tax deferral of losses on wash sales, the timing and recognition of realized gains / losses for tax purposes, the realization for tax purposes of unrealized gains (losses) on certain futures contracts, accounting for swap agreements and characterization of corporate actions. | |
| (c) | The Fund has elected to defer certain qualified late-year losses and recognize such losses in the next taxable year. |
As of March 31, 2023, gross unrealized appreciation and depreciation based on cost of investments (including short positions and derivatives, if any) for U.S. federal income tax purposes were as follows:
| | | | | | | | | | | | | | | | |
| iShares ETF | | Tax Cost | | | Gross Unrealized
Appreciation | | | Gross Unrealized
Depreciation | | | Net Unrealized
Appreciation
(Depreciation) | |
S&P 100 | | $ | 6,687,274,998 | | | $ | 1,358,149,467 | | | $ | (501,682,057 | ) | | $ | 856,467,410 | |
S&P 500 Growth | | | 23,018,576,387 | | | | 8,162,926,490 | | | | (798,179,415 | ) | | | 7,364,747,075 | |
S&P 500 Value | | | 24,233,719,531 | | | | 2,320,592,756 | | | | (1,890,584,774 | ) | | | 430,007,982 | |
S&P Small-Cap 600 Value | | | 8,121,349,674 | | | | 443,112,876 | | | | (1,159,569,094 | ) | | | (716,456,218 | ) |
In the normal course of business, each Fund invests in securities or other instruments and may enter into certain transactions, and such activities subject the Fund to various risks, including, among others, fluctuations in the market (market risk) or failure of an issuer to meet all of its obligations. The value of securities or other instruments may also be affected by various factors, including, without limitation: (i) the general economy; (ii) the overall market as well as local, regional or global political and/or social instability;
| | |
| 54 | | 2 0 2 3 I S H A R E S A N N U A L R E P O R T T O S H A R E H O L D E R S |
Notes to Financial Statements (continued)
(iii) regulation, taxation or international tax treaties between various countries; or (iv) currency, interest rate or price fluctuations. Local, regional or global events such as war, acts of terrorism, the spread of infectious illness or other public health issues, recessions, or other events could have a significant impact on the Funds and their investments. Each Fund’s prospectus provides details of the risks to which the Fund is subject.
BFA uses a “passive” or index approach to try to achieve each Fund’s investment objective following the securities included in its underlying index during upturns as well as downturns. BFA does not take steps to reduce market exposure or to lessen the effects of a declining market. Divergence from the underlying index and the composition of the portfolio is monitored by BFA.
The Funds may be exposed to additional risks when reinvesting cash collateral in money market funds that do not seek to maintain a stable NAV per share of $1.00, which may be subject to redemption gates or liquidity fees under certain circumstances.
Infectious Illness Risk: An outbreak of an infectious illness, such as the COVID-19 pandemic, may adversely impact the economies of many nations and the global economy, and may impact individual issuers and capital markets in ways that cannot be foreseen. An infectious illness outbreak may result in, among other things, closed international borders, prolonged quarantines, supply chain disruptions, market volatility or disruptions and other significant economic, social and political impacts.
Valuation Risk: The market values of equities, such as common stocks and preferred securities or equity related investments, such as futures and options, may decline due to general market conditions which are not specifically related to a particular company. They may also decline due to factors which affect a particular industry or industries. A fund may invest in illiquid investments. An illiquid investment is any investment that a fund reasonably expects cannot be sold or disposed of in current market conditions in seven calendar days or less without the sale or disposition significantly changing the market value of the investment. A fund may experience difficulty in selling illiquid investments in a timely manner at the price that it believes the investments are worth. Prices may fluctuate widely over short or extended periods in response to company, market or economic news. Markets also tend to move in cycles, with periods of rising and falling prices. This volatility may cause a fund’s NAV to experience significant increases or decreases over short periods of time. If there is a general decline in the securities and other markets, the NAV of a fund may lose value, regardless of the individual results of the securities and other instruments in which a fund invests.
The price each Fund could receive upon the sale of any particular portfolio investment may differ from each Fund’s valuation of the investment, particularly for securities that trade in thin or volatile markets or that are valued using a fair valuation technique or a price provided by an independent pricing service. Changes to significant unobservable inputs and assumptions (i.e., publicly traded company multiples, growth rate, time to exit) due to the lack of observable inputs.
Counterparty Credit Risk: The Funds may be exposed to counterparty credit risk, or the risk that an entity may fail to or be unable to perform on its commitments related to unsettled or open transactions, including making timely interest and/or principal payments or otherwise honoring its obligations. The Funds manage counterparty credit risk by entering into transactions only with counterparties that the Manager believes have the financial resources to honor their obligations and by monitoring the financial stability of those counterparties. Financial assets, which potentially expose the Funds to market, issuer and counterparty credit risks, consist principally of financial instruments and receivables due from counterparties. The extent of the Fund’s exposure to market, issuer and counterparty credit risks with respect to these financial assets is approximately their value recorded in the Statements of Assets and Liabilities, less any collateral held by the Funds.
A derivative contract may suffer a mark-to-market loss if the value of the contract decreases due to an unfavorable change in the market rates or values of the underlying instrument. Losses can also occur if the counterparty does not perform under the contract.
With exchange-traded futures, there is less counterparty credit risk to the Funds since the exchange or clearinghouse, as counterparty to such instruments, guarantees against a possible default. The clearinghouse stands between the buyer and the seller of the contract; therefore, credit risk is limited to failure of the clearinghouse. While offset rights may exist under applicable law, a Fund does not have a contractual right of offset against a clearing broker or clearinghouse in the event of a default (including the bankruptcy or insolvency). Additionally, credit risk exists in exchange-traded futures with respect to initial and variation margin that is held in a clearing broker’s customer accounts. While clearing brokers are required to segregate customer margin from their own assets, in the event that a clearing broker becomes insolvent or goes into bankruptcy and at that time there is a shortfall in the aggregate amount of margin held by the clearing broker for all its clients, typically the shortfall would be allocated on a pro rata basis across all the clearing broker’s customers, potentially resulting in losses to the Funds.
Concentration Risk: A diversified portfolio, where this is appropriate and consistent with a fund’s objectives, minimizes the risk that a price change of a particular investment will have a material impact on the NAV of a fund. The investment concentrations within each Fund’s portfolio are disclosed in its Schedule of Investments.
The Funds invest a significant portion of their assets in securities within a single or limited number of market sectors. When a Fund concentrates its investments in this manner, it assumes the risk that economic, regulatory, political and social conditions affecting such sectors may have a significant impact on the fund and could affect the income from, or the value or liquidity of, the fund’s portfolio. Investment percentages in specific sectors are presented in the Schedule of Investments.
Significant Shareholder Redemption Risk: Certain shareholders may own or manage a substantial amount of fund shares and/or hold their fund investments for a limited period of time. Large redemptions of fund shares by these shareholders may force a fund to sell portfolio securities, which may negatively impact the fund’s NAV, increase the fund’s brokerage costs, and/or accelerate the realization of taxable income/gains and cause the fund to make additional taxable distributions to shareholders.
| 10. | CAPITAL SHARE TRANSACTIONS |
Capital shares are issued and redeemed by each Fund only in aggregations of a specified number of shares or multiples thereof (“Creation Units”) at NAV. Except when aggregated in Creation Units, shares of each Fund are not redeemable.
| | |
N O T E S T O F I N A N C I A L S T A T E M E N T S | | 55 |
Notes to Financial Statements (continued)
Transactions in capital shares were as follows:
| | | | | | | | | | | | | | | | |
| | | Year Ended
03/31/23 | | | Year Ended
03/31/22 | |
| iShares ETF | | Shares | | | Amount | | | Shares | | | Amount | |
S&P 100 | | | | | | | | | | | | | | | | |
Shares sold | | | 6,650,000 | | | $ | 1,223,360,035 | | | | 9,000,000 | | | $ | 1,852,545,063 | |
Shares redeemed | | | (8,450,000 | ) | | | (1,514,768,203 | ) | | | (5,650,000 | ) | | | (1,139,200,444 | ) |
| | | | | | | | | | | | | | | | |
| | | (1,800,000 | ) | | $ | (291,408,168 | ) | | | 3,350,000 | | | $ | 713,344,619 | |
| | | | | | | | | | | | | | | | |
| | | | |
S&P 500 Growth | | | | | | | | | | | | | | | | |
Shares sold | | | 65,500,000 | | | $ | 4,123,265,045 | | | | 97,500,000 | | | $ | 7,705,816,385 | |
Shares redeemed | | | (75,100,000 | ) | | | (4,921,945,281 | ) | | | (95,050,000 | ) | | | (7,302,882,197 | ) |
| | | | | | | | | | | | | | | | |
| | | (9,600,000 | ) | | $ | (798,680,236 | ) | | | 2,450,000 | | | $ | 402,934,188 | |
| | | | | | | | | | | | | | | | |
| | | | |
S&P 500 Value | | | | | | | | | | | | | | | | |
Shares sold | | | 67,300,000 | | | $ | 9,872,676,861 | | | | 46,050,000 | | | $ | 7,005,954,291 | |
Shares redeemed | | | (72,400,000 | ) | | | (10,508,335,858 | ) | | | (31,550,000 | ) | | | (4,746,154,933 | ) |
| | | | | | | | | | | | | | | | |
| | | (5,100,000 | ) | | $ | (635,658,997 | ) | | | 14,500,000 | | | $ | 2,259,799,358 | |
| | | | | | | | | | | | | | | | |
| | | | |
S&P Small-Cap 600 Value | | | | | | | | | | | | | | | | |
Shares sold | | | 39,800,000 | | | $ | 3,828,377,839 | | | | 36,350,000 | | | $ | 3,774,747,013 | |
Shares redeemed | | | (48,750,000 | ) | | | (4,569,448,166 | ) | | | (40,450,000 | ) | | | (4,134,083,314 | ) |
| | | | | | | | | | | | | | | | |
| | | (8,950,000 | ) | | $ | (741,070,327 | ) | | | (4,100,000 | ) | | $ | (359,336,301 | ) |
| | | | | | | | | | | | | | | | |
The consideration for the purchase of Creation Units of a fund in the Trust generally consists of the in-kind deposit of a designated portfolio of securities and a specified amount of cash. Certain funds in the Trust may be offered in Creation Units solely or partially for cash in U.S. dollars. Investors purchasing and redeeming Creation Units may pay a purchase transaction fee and a redemption transaction fee directly to BRIL, to offset transfer and other transaction costs associated with the issuance and redemption of Creation Units, including Creation Units for cash. Investors transacting in Creation Units for cash may also pay an additional variable charge to compensate the relevant fund for certain transaction costs (i.e., stamp taxes, taxes on currency or other financial transactions, and brokerage costs) and market impact expenses relating to investing in portfolio securities. Such variable charges, if any, are included in shares sold in the table above.
From time to time, settlement of securities related to in-kind contributions or in-kind redemptions may be delayed. In such cases, securities related to in-kind transactions are reflected as a receivable or a payable in the Statements of Assets and Liabilities.
Management has evaluated the impact of all subsequent events on the Funds through the date the financial statements were available to be issued and has determined that there were no subsequent events requiring adjustment or additional disclosure in the financial statements.
| | |
| 56 | | 2 0 2 3 I S H A R E S A N N U A L R E P O R T T O S H A R E H O L D E R S |
| | |
Report of Independent Registered Public Accounting Firm | | |
To the Board of Trustees of iShares Trust and
Shareholders of each of the four funds listed in the table below
Opinions on the Financial Statements
We have audited the accompanying statements of assets and liabilities, including the schedules of investments, of each of the funds listed in the table below (four of the funds constituting iShares Trust, hereafter collectively referred to as the “Funds”) as of March 31, 2023, the related statements of operations for the year ended March 31, 2023, the statements of changes in net assets for each of the two years in the period ended March 31, 2023, including the related notes, and the financial highlights for each of the five years in the period ended March 31, 2023 (collectively referred to as the “financial statements”). In our opinion, the financial statements present fairly, in all material respects, the financial position of each of the Funds as of March 31, 2023, the results of each of their operations for the year then ended, the changes in each of their net assets for each of the two years in the period ended March 31, 2023 and each of the financial highlights for each of the five years in the period ended March 31, 2023 in conformity with accounting principles generally accepted in the United States of America.
|
| |
iShares S&P 100 ETF |
| |
iShares S&P 500 Growth ETF |
| |
iShares S&P 500 Value ETF |
| |
iShares S&P Small-Cap 600 Value ETF |
Basis for Opinions
These financial statements are the responsibility of the Funds’ management. Our responsibility is to express an opinion on the Funds’ financial statements based on our audits. We are a public accounting firm registered with the Public Company Accounting Oversight Board (United States) (PCAOB) and are required to be independent with respect to the Funds in accordance with the U.S. federal securities laws and the applicable rules and regulations of the Securities and Exchange Commission and the PCAOB.
We conducted our audits of these financial statements in accordance with the standards of the PCAOB. Those standards require that we plan and perform the audit to obtain reasonable assurance about whether the financial statements are free of material misstatement, whether due to error or fraud.
Our audits included performing procedures to assess the risks of material misstatement of the financial statements, whether due to error or fraud, and performing procedures that respond to those risks. Such procedures included examining, on a test basis, evidence regarding the amounts and disclosures in the financial statements. Our audits also included evaluating the accounting principles used and significant estimates made by management, as well as evaluating the overall presentation of the financial statements. Our procedures included confirmation of securities owned as of March 31, 2023 by correspondence with the custodian, transfer agent and brokers; when replies were not received from brokers, we performed other auditing procedures. We believe that our audits provide a reasonable basis for our opinions.
/s/PricewaterhouseCoopers LLP
Philadelphia, Pennsylvania
May 25, 2023
We have served as the auditor of one or more BlackRock investment companies since 2000.
| | |
R E P O R T O F I N D E P E N D E N T R E G I S T E R E D P U B L I C A C C O U N T I N G F I R M | | 57 |
Important Tax Information (unaudited)
The following amounts, or maximum amounts allowable by law, are hereby designated as qualified dividend income for individuals for the fiscal year ended March 31, 2023:
| | | | |
| iShares ETF | | Qualified Dividend
Income | |
S&P 100 | | $ | 126,077,587 | |
S&P 500 Growth | | | 315,687,175 | |
S&P 500 Value | | | 513,848,045 | |
S&P Small-Cap 600 Value | | | 94,233,144 | |
The following amounts, or maximum amounts allowable by law, are hereby designated as qualified business income for individuals for the fiscal year ended March 31, 2023:
| | | | |
| iShares ETF | | Qualified Business
Income | |
S&P 100 | | $ | 1,131,497 | |
S&P 500 Growth | | | 9,780,525 | |
S&P 500 Value | | | 13,455,367 | |
S&P Small-Cap 600 Value | | | 17,296,558 | |
The following percentages, or maximum percentages allowable by law, of ordinary income distributions paid during the fiscal year ended March 31, 2023 qualified for the dividends-received deduction for corporate shareholders:
| | | | |
| iShares ETF | | Dividends-Received
Deduction | |
S&P 100 | | | 100.00 | % |
S&P 500 Growth | | | 100.00 | |
S&P 500 Value | | | 97.94 | |
S&P Small-Cap 600 Value | | | 87.57 | |
| | |
| 58 | | 2 0 2 3 I S H A R E S A N N U A L R E P O R T T O S H A R E H O L D E R S |
Statement Regarding Liquidity Risk Management Program (unaudited)
In compliance with Rule 22e-4 under the Investment Company Act of 1940, as amended (the “Liquidity Rule”), iShares Trust (the “Trust”) has adopted and implemented a liquidity risk management program (the “Program”) for iShares S&P 100 ETF, iShares S&P 500 Growth ETF, iShares S&P 500 Value ETF and iShares S&P Small-Cap 600 Value ETF (the “Funds” or “ETFs”), each a series of the Trust, which is reasonably designed to assess and manage each Fund’s liquidity risk.
The Board of Trustees (the “Board”) of the Trust, on behalf of the Funds, met on December 9, 2022 (the “Meeting”) to review the Program. The Board previously appointed BlackRock Fund Advisors (“BlackRock”), the investment adviser to the Funds, as the program administrator for each Fund’s Program. BlackRock also previously delegated oversight of the Program to the 40 Act Liquidity Risk Management Committee (the “Committee”). At the Meeting, the Committee, on behalf of BlackRock, provided the Board with a report that addressed the operation of the Program and assessed its adequacy and effectiveness of implementation, including the management of each Fund’s Highly Liquid Investment Minimum (“HLIM”) where applicable, and any material changes to the Program (the “Report”). The Report covered the period from October 1, 2021 through September 30, 2022 (the “Program Reporting Period”).
The Report described the Program’s liquidity classification methodology for categorizing each Fund’s investments (including derivative transactions) into one of four liquidity buckets. It also referenced the methodology used by BlackRock to establish each Fund’s HLIM and noted that the Committee reviews and ratifies the HLIM assigned to each Fund no less frequently than annually. The Report also discussed notable events affecting liquidity over the Program Reporting Period, including extended market holidays, the imposition of capital controls in certain non-U.S. countries, Russian sanctions and the closure of the Russian securities market.
The Report noted that the Program complied with the key factors for consideration under the Liquidity Rule for assessing, managing and periodically reviewing each Fund’s liquidity risk, as follows:
| | a) | The Fund’s investment strategy and liquidity of portfolio investments during both normal and reasonably foreseeable stressed conditions. During the Program Reporting Period, the Committee reviewed whether each Fund’s strategy is appropriate for an open-end fund structure, with a focus on funds with more significant and consistent holdings of less liquid and illiquid assets. The Committee also factored a fund’s concentration in an issuer into the liquidity classification methodology by taking issuer position sizes into account. Derivative exposure was also considered in the calculation of a fund’s liquidity bucketing. Finally, a factor for consideration under the Liquidity Rule is a Fund’s use of borrowings for investment purposes. However, the Funds do not borrow for investment purposes. |
| | b) | Short-term and long-term cash flow projections during both normal and reasonably foreseeable stressed conditions. During the Program Reporting Period, the Committee reviewed historical redemption activity and used this information as a component to establish each ETF’s reasonably anticipated trading size (“RATS”). The Committee may also take into consideration a fund’s shareholder ownership concentration (which, depending on product type and distribution channel, may or may not be available), a fund’s distribution channels, and the degree of certainty associated with a fund’s short-term and long-term cash flow projections. |
| | c) | Holdings of cash and cash equivalents, as well as borrowing arrangements. The Committee considered that ETFs generally do not hold more than de minimis amounts of cash. The Committee also considered that ETFs generally do not engage in borrowing. |
| | d) | The relationship between an ETF’s portfolio liquidity and the way in which, and the prices and spreads at which, ETF shares trade, including the efficiency of the arbitrage function and the level of active participation by market participants, including authorized participants. The Committee monitored the prevailing bid/ask spread and the ETF price premium (or discount) to NAV for all ETFs. However, there were no ETFs with persistent deviations of fund premium/discount or bid/ask spreads from long-term averages over the Program Reporting Period. |
| | e) | The effect of the composition of baskets on the overall liquidity of an ETF’s portfolio. In reviewing the linkage between the composition of custom baskets accepted by an ETF and any significant change in the liquidity profile of such ETF, the Committee reviewed changes in the proportion of each ETF’s portfolio comprised of less liquid and illiquid holdings to determine if applicable thresholds were met requiring enhanced review. |
There were no material changes to the Program during the Program Reporting Period other than the enhancement of certain model components in the Program’s classification methodology. The Report provided to the Board stated that the Committee concluded that based on the operation of the functions, as described in the Report, the Program is operating as intended and is effective in implementing the requirements of the Liquidity Rule.
| | |
| 60 | | 2 0 2 3 I S H A R E S A N N U A L R E P O R T T O S H A R E H O L D E R S |
Supplemental Information (unaudited)
Section 19(a) Notices
The amounts and sources of distributions reported are estimates and are being provided pursuant to regulatory requirements and are not being provided for tax reporting purposes. The actual amounts and sources for tax reporting purposes will depend upon each Fund’s investment experience during the year and may be subject to changes based on tax regulations. Shareholders will receive a Form 1099-DIV each calendar year that will inform them how to report these distributions for federal income tax purposes.
March 31, 2023
| | | | | | | | | | | | | | | | | | | | | | | | | | | | | | | | |
| | | |
| | | Total Cumulative Distributions for the Fiscal Year-to-Date | | | % Breakdown of the Total Cumulative Distributions for the Fiscal Year-to-Date | |
| | | | | | | | |
| | | | | | | | |
| iShares ETF | | Net
Investment
Income | | | Net Realized
Capital Gains | | | Return of
Capital | | | Total Per
Share | | | Net
Investment
Income | | | Net Realized
Capital Gains | | | Return of
Capital | | | Total Per
Share | |
| | | | | | | | |
S&P 100 | | $ | 2.684663 | | | $ | — | | | $ | — | | | $ | 2.684663 | | | | 100 | % | | | — | % | | | — | % | | | 100 | % |
| | | | | | | | |
S&P 500 Value | | | 3.036629 | | | | — | | | | — | | | | 3.036629 | | | | 100 | | | | — | | | | — | | | | 100 | |
| | | | | | | | |
S&P Small-Cap 600 Value | | | 1.381547 | | | | — | | | | — | | | | 1.381547 | | | | 100 | | | | — | | | | — | | | | 100 | |
Premium/Discount Information
Information on the Fund’s net asset value, market price, premiums and discounts, and bid-ask spreads can be found at iShares.com.
| | |
S U P P L E M E N T A L I N F O R M A T I O N | | 61 |
Trustee and Officer Information
The Board of Trustees has responsibility for the overall management and operations of the Funds, including general supervision of the duties performed by BFA and other service providers. Each Trustee serves until he or she resigns, is removed, dies, retires or becomes incapacitated. Each officer shall hold office until his or her successor is elected and qualifies or until his or her death, resignation or removal. Trustees who are not “interested persons” (as defined in the 1940 Act) of the Trust are referred to as independent trustees (“Independent Trustees”).
The registered investment companies advised by BFA or its affiliates (the “BlackRock-advised Funds”) are organized into one complex of open-end equity, multi-asset, index and money market funds and ETFs (the “BlackRock Multi-Asset Complex”), one complex of closed-end funds and open-end non-index fixed-income funds (including ETFs) (the “BlackRock Fixed-Income Complex”) and one complex of ETFs (“Exchange-Traded Fund Complex”) (each, a “BlackRock Fund Complex”). Each Fund is included in the Exchange-Traded Fund Complex. Each Trustee also serves as a Director of iShares, Inc. and a Trustee of iShares U.S. ETF Trust and, as a result, oversees all of the funds within the Exchange-Traded Fund Complex, which consists of 380 funds as of March 31, 2023. With the exception of Robert S. Kapito, Salim Ramji and Charles Park, the address of each Trustee and officer is c/o BlackRock, Inc., 400 Howard Street, San Francisco, CA 94105. The address of Mr. Kapito, Mr. Ramji and Mr. Park is c/o BlackRock, Inc., 50 Hudson Yards, New York, NY 10001. The Board has designated John E. Kerrigan as its Independent Board Chair. Additional information about the Funds’ Trustees and officers may be found in the Funds’ combined Statement of Additional Information, which is available without charge, upon request, by calling toll-free 1-800-iShares (1-800-474-2737).
| | | | | | |
| Interested Trustees |
| | | | |
Name (Year of
Birth) | | Position(s) | | Principal Occupation(s)
During Past 5 Years | | Other Directorships Held by Trustee |
| | | |
Robert S. Kapito(a) (1957) | | Trustee (since 2009). | | President, BlackRock, Inc. (since 2006); Vice Chairman of BlackRock, Inc. and Head of BlackRock’s Portfolio Management Group (since its formation in 1998) and BlackRock, Inc.’s predecessor entities (since 1988); Trustee, University of Pennsylvania (since 2009); President of Board of Directors, Hope & Heroes Children’s Cancer Fund (since 2002). | | Director of BlackRock, Inc. (since 2006); Director of iShares, Inc. (since 2009); Trustee of iShares U.S. ETF Trust (since 2011). |
| | | |
Salim Ramji(b) (1970) | | Trustee (since 2019). | | Senior Managing Director, BlackRock, Inc. (since 2014); Global Head of BlackRock’s ETF and Index Investments Business (since 2019); Head of BlackRock’s U.S. Wealth Advisory Business (2015-2019); Global Head of Corporate Strategy, BlackRock, Inc. (2014-2015); Senior Partner, McKinsey & Company (2010-2014). | | Director of iShares, Inc. (since 2019); Trustee of iShares U.S. ETF Trust (since 2019). |
| (a) | Robert S. Kapito is deemed to be an “interested person” (as defined in the 1940 Act) of the Trust due to his affiliations with BlackRock, Inc. and its affiliates. |
| (b) | Salim Ramji is deemed to be an “interested person” (as defined in the 1940 Act) of the Trust due to his affiliations with BlackRock, Inc. and its affiliates. |
| | | | | | |
| Independent Trustees |
| | | | |
Name (Year of
Birth) | | Position(s) | | Principal Occupation(s)
During Past 5 Years | | Other Directorships Held by Trustee |
| | | |
John E. Kerrigan (1955) | | Trustee (since 2005); Independent Board Chair (since 2022). | | Chief Investment Officer, Santa Clara University (since 2002). | | Director of iShares, Inc. (since 2005); Trustee of iShares U.S. ETF Trust (since 2011); Independent Board Chair of iShares, Inc. and iShares U.S. ETF Trust (since 2022). |
| | | |
Jane D. Carlin (1956) | | Trustee (since 2015); Risk Committee Chair (since 2016). | | Consultant (since 2012); Member of the Audit Committee (2012-2018), Chair of the Nominating and Governance Committee (2017-2018) and Director of PHH Corporation (mortgage solutions) (2012-2018); Managing Director and Global Head of Financial Holding Company Governance & Assurance and the Global Head of Operational Risk Management of Morgan Stanley (2006-2012). | | Director of iShares, Inc. (since 2015); Trustee of iShares U.S. ETF Trust (since 2015); Member of the Audit Committee (since 2016), Chair of the Audit Committee (since 2020) and Director of The Hanover Insurance Group, Inc. (since 2016). |
| | | |
Richard L. Fagnani (1954) | | Trustee (since 2017); Audit Committee Chair (since 2019). | | Partner, KPMG LLP (2002-2016); Director of One Generation Away (since 2021). | | Director of iShares, Inc. (since 2017); Trustee of iShares U.S. ETF Trust (since 2017). |
| | |
| 62 | | 2 0 2 3 I S H A R E S A N N U A L R E P O R T T O S H A R E H O L D E R S |
Trustee and Officer Information (continued)
| | | | | | |
| Independent Trustees |
| | | | |
Name (Year of
Birth) | | Position(s) | | Principal Occupation(s) During Past 5 Years | | Other Directorships Held by Trustee |
| | | |
Cecilia H. Herbert (1949) | | Trustee (since 2005); Nominating and Governance and Equity Plus Committee Chairs (since 2022). | | Chair of the Finance Committee (since 2019) and Trustee and Member of the Finance, Audit and Quality Committees of Stanford Health Care (since 2016); Trustee of WNET, New York’s public media company (since 2011) and Member of the Audit Committee (since 2018), Investment Committee (since 2011) and Personnel Committee (since 2022); Chair (1994-2005) and Member (1992-2021) of the Investment Committee, Archdiocese of San Francisco; Trustee of Forward Funds (14 portfolios) (2009-2018); Trustee of Salient MF Trust (4 portfolios) (2015- 2018); Director (1998-2013) and President (2007-2011) of the Board of Directors, Catholic Charities CYO; Trustee (2002-2011) and Chair of the Finance and Investment Committee (2006-2010) of the Thacher School; Director of the Senior Center of Jackson Hole (since 2020); Director of the Jackson Hole Center for the Arts (since 2021); Member of the Wyoming State Investment Funds Committee (since 2022). | | Director of iShares, Inc. (since 2005); Trustee of iShares U.S. ETF Trust (since 2011). |
| | | |
Drew E. Lawton (1959) | | Trustee (since 2017); 15(c) Committee Chair (since 2017). | | Senior Managing Director of New York Life Insurance Company (2010-2015). | | Director of iShares, Inc. (since 2017); Trustee of iShares U.S. ETF Trust (since 2017); Director of Jackson Financial Inc. (since 2021). |
| | | |
John E. Martinez (1961) | | Trustee (since 2003); Securities Lending Committee Chair (since 2019). | | Director of Real Estate Equity Exchange, Inc. (since 2005); Director of Cloudera Foundation (2017-2020); and Director of Reading Partners (2012-2016). | | Director of iShares, Inc. (since 2003); Trustee of iShares U.S. ETF Trust (since 2011). |
| | | |
Madhav V. Rajan (1964) | | Trustee (since 2011); Fixed Income Plus Committee Chair (since 2019). | | Dean, and George Pratt Shultz Professor of Accounting, University of Chicago Booth School of Business (since 2017); Advisory Board Member (since 2016) and Director (since 2020) of C.M. Capital Corporation; Chair of the Board for the Center for Research in Security Prices, LLC (since 2020); Robert K. Jaedicke Professor of Accounting, Stanford University Graduate School of Business (2001-2017); Professor of Law (by courtesy), Stanford Law School (2005-2017); Senior Associate Dean for Academic Affairs and Head of MBA Program, Stanford University Graduate School of Business (2010-2016). | | Director of iShares, Inc. (since 2011); Trustee of iShares U.S. ETF Trust (since 2011). |
| | | | |
| Officers |
| | | |
Name (Year of
Birth) | | Position(s) | | Principal Occupation(s)
During Past 5 Years |
| | |
Dominik Rohé (1973) | | President (since 2023). | | Managing Director, BlackRock, Inc. (since 2005); Head of Americas ETF and Index Investments (since 2023); Head of Latin America (2019- 2023). |
| | |
Trent Walker (1974) | | Treasurer and Chief Financial Officer (since 2020). | | Managing Director, BlackRock, Inc. (since September 2019); Chief Financial Officer of iShares Delaware Trust Sponsor LLC, BlackRock Funds, BlackRock Funds II, BlackRock Funds IV, BlackRock Funds V and BlackRock Funds VI (since 2021); Executive Vice President of PIMCO (2016-2019); Senior Vice President of PIMCO (2008-2015); Treasurer (2013-2019) and Assistant Treasurer (2007-2017) of PIMCO Funds, PIMCO Variable Insurance Trust, PIMCO ETF Trust, PIMCO Equity Series, PIMCO Equity Series VIT, PIMCO Managed Accounts Trust, 2 PIMCO-sponsored interval funds and 21 PIMCO-sponsored closed-end funds. |
| | |
Charles Park (1967) | | Chief Compliance Officer (since 2006). | | Chief Compliance Officer of BlackRock Advisors, LLC and the BlackRock-advised Funds in the BlackRock Multi-Asset Complex and the BlackRock Fixed-Income Complex (since 2014); Chief Compliance Officer of BFA (since 2006). |
| | |
Marisa Rolland (1980) | | Secretary (since 2022). | | Managing Director, BlackRock, Inc. (since 2023); Director, BlackRock, Inc. (2018-2022); Vice President, BlackRock, Inc. (2010-2017). |
| | |
Rachel Aguirre (1982) | | Executive Vice President (since 2022). | | Managing Director, BlackRock, Inc. (since 2018); Director, BlackRock, Inc. (2009-2018); Head of U.S. iShares Product (since 2022); Head of EII U.S. Product Engineering (since 2021); Co-Head of EII’s Americas Portfolio Engineering (2020-2021); Head of Developed Markets Portfolio Engineering (2016-2019). |
| | |
Jennifer Hsui (1976) | | Executive Vice President (since 2022). | | Managing Director, BlackRock, Inc. (since 2009); Co-Head of Index Equity (since 2022). |
| | |
James Mauro (1970) | | Executive Vice President (since 2022). | | Managing Director, BlackRock, Inc. (since 2010); Head of Fixed Income Index Investments in the Americas and Head of San Francisco Core Portfolio Management (since 2020). |
Effective June 15, 2022, Marisa Rolland replaced Deepa Damre Smith as Secretary.
| | |
T R U S T E E A N D O F F I C E R I N F O R M A T I O N | | 63 |
Trustee and Officer Information (continued)
Effective March 30, 2023, Dominik Rohé replaced Armando Senra as President.
| | |
| 64 | | 2 0 2 3 I S H A R E S A N N U A L R E P O R T T O S H A R E H O L D E R S |
General Information
Electronic Delivery
Shareholders can sign up for e-mail notifications announcing that the shareholder report or prospectus has been posted on the iShares website at iShares.com. Once you have enrolled, you will no longer receive prospectuses and shareholder reports in the mail.
To enroll in electronic delivery:
| | • | | If your brokerage firm is not listed, electronic delivery may not be available. Please contact your broker-dealer or financial advisor. |
Householding
Householding is an option available to certain fund investors. Householding is a method of delivery, based on the preference of the individual investor, in which a single copy of certain shareholder documents and Rule 30e-3 notices can be delivered to investors who share the same address, even if their accounts are registered under different names. Please contact your broker-dealer if you are interested in enrolling in householding and receiving a single copy of prospectuses and other shareholder documents, or if you are currently enrolled in householding and wish to change your householding status.
Availability of Quarterly Schedule of Investments
The Funds file their complete schedule of portfolio holdings with the SEC for the first and third quarters of each fiscal year as an exhibit to their reports on Form N-PORT. The Funds’ Forms N-PORT are available on the SEC’s website at sec.gov. Additionally, each Fund makes its portfolio holdings for the first and third quarters of each fiscal year available at iShares.com/fundreports.
Availability of Proxy Voting Policies and Proxy Voting Records
A description of the policies and procedures that the iShares Funds use to determine how to vote proxies relating to portfolio securities and information about how the iShares Funds voted proxies relating to portfolio securities during the most recent twelve-month period ending June 30 is available without charge, upon request (1) by calling toll-free 1-800-474-2737; (2) on the iShares website at iShares.com; and (3) on the SEC website at sec.gov.
A description of the Trust’s policies and procedures with respect to the disclosure of the Fund’s portfolio securities is available in the Fund Prospectus. The Fund discloses its portfolio holdings daily and provides information regarding its top holdings in Fund fact sheets at iShares.com.
| | |
| 66 | | 2 0 2 3 I S H A R E S A N N U A L R E P O R T T O S H A R E H O L D E R S |
Glossary of Terms Used in this Report
| | |
Portfolio Abbreviation |
| CVR | | Contingent Value Rights |
NVS | | Non-Voting Shares |
REIT | | Real Estate Investment Trust |
| | |
G L O S S A R Y O F T E R M S U S E D I N T H I S R E P O R T | | 67 |
Want to know more?
iShares.com | 1-800-474-2737
This report is intended for the Funds’ shareholders. It may not be distributed to prospective investors unless it is preceded or accompanied by the current prospectus.
Investing involves risk, including possible loss of principal.
The iShares Funds are distributed by BlackRock Investments, LLC (together with its affiliates, “BlackRock”).
The iShares Funds are not sponsored, endorsed, issued, sold or promoted by S&P Dow Jones Indices LLC, nor does this company make any representations regarding the advisability of investing in the iShares Funds. BlackRock is not affiliated with the company listed above.
©2022 BlackRock, Inc. All rights reserved. iSHARES and BLACKROCK are registered trademarks of BlackRock, Inc. or its subsidiaries. All other marks are the property of their respective owners.
iS-AR-301-0323
| | |

| | MARCH 31, 2023 |
iShares Trust
· iShares Preferred and Income Securities ETF | PFF | NASDAQ
The Markets in Review
Dear Shareholder,
Significant economic headwinds emerged during the 12-month reporting period ended March 31, 2023, as investors navigated changing economic conditions and volatile markets. The U.S. economy shrank in the first half of 2022 before returning to modest growth in the second half of the year, marking a shift to a more challenging post-reopening economic environment. Changes in consumer spending patterns and a tight labor market led to elevated inflation, which reached a 40-year high before beginning to moderate.
Equity prices fell as interest rates rose, particularly during the first half of the reporting period. Both large- and small-capitalization U.S. stocks declined, although equities began to recover in the second half of the period as inflation eased and economic growth resumed. Emerging market stocks and international equities from developed markets declined overall, pressured by rising interest rates and volatile commodities prices.
The 10-year U.S. Treasury yield rose during the reporting period, driving its price down, as investors reacted to fluctuating inflation data and attempted to anticipate its impact on future interest rate changes. The corporate bond market also faced inflationary headwinds, and higher interest rates led to rising borrowing costs for corporate issuers.
The U.S. Federal Reserve (the “Fed”), acknowledging that inflation has been more persistent than expected, raised interest rates eight times. Furthermore, the Fed wound down its bond-buying programs and accelerated the reduction of its balance sheet.
Restricted labor supply kept inflation elevated even as other inflation drivers, such as goods prices and energy costs, moderated. While economic growth slowed in the last year, we believe that taming inflation requires a more substantial decline that lowers demand to a level more in line with the economy’s productive capacity. Although the Fed has decelerated the pace of interest rate hikes, we believe that it still seems determined to get inflation back to target. With this in mind, we believe the possibility of a U.S. recession in the near-term is high, but the dimming economic outlook has not yet been fully reflected in current market prices. We believe investors should expect a period of higher volatility as markets adjust to the new economic reality and policymakers attempt to adapt to rapidly changing conditions. Turmoil in the banking sector late in the period highlighted the potential for the knock-on effects of substantially higher interest rates to disrupt markets with little warning.
While we favor an overweight to equities in the long term, we prefer an underweight stance on equities overall in the near term. Expectations for corporate earnings remain elevated, which seems inconsistent with the possibility of a recession. Nevertheless, we are overweight on emerging market stocks as we believe a weakening U.S. dollar provides a supportive backdrop. We also see long-term opportunities in credit, where we believe that valuations are appealing and higher yields provide attractive income, although we are neutral on credit in the near term, as we’re concerned about tightening credit and financial conditions. However, we believe there are still some strong opportunities for a six- to twelve-month horizon, particularly short-term U.S. Treasuries, global inflation-linked bonds, and emerging market bonds denominated in local currency.
Overall, our view is that investors need to think globally, position themselves to be prepared for a decarbonizing economy, and be nimble as market conditions change. We encourage you to talk with your financial advisor and visit iShares.com for further insight about investing in today’s markets.
Sincerely,

Rob Kapito
President, BlackRock, Inc.

Rob Kapito
President, BlackRock, Inc.
| | | | |
| Total Returns as of March 31, 2023 |
| | | |
| | | 6-Month | | 12-Month |
| | |
U.S. large cap equities
(S&P 500® Index) | | 15.62% | | (7.73)% |
| | |
U.S. small cap equities
(Russell 2000® Index) | | 9.14 | | (11.61) |
| | |
International equities
(MSCI Europe, Australasia, Far East Index) | | 27.27 | | (1.38) |
| | |
Emerging market equities
(MSCI Emerging Markets Index) | | 14.04 | | (10.70) |
| | |
3-month Treasury bills
(ICE BofA 3-Month U.S. Treasury Bill Index) | | 1.93 | | 2.52 |
| | |
U.S. Treasury securities
(ICE BofA 10-Year U.S. Treasury Index) | | 4.38 | | (6.90) |
| | |
U.S. investment grade bonds (Bloomberg U.S. Aggregate Bond Index) | | 4.89 | | (4.78) |
| | |
Tax-exempt municipal bonds
(Bloomberg Municipal Bond Index) | | 7.00 | | 0.26 |
| | |
U.S. high yield bonds (Bloomberg U.S. Corporate High Yield 2% Issuer Capped Index) | | 7.88 | | (3.35) |
|
Past performance is not an indication of future results. Index performance is shown for illustrative purposes only. You cannot invest directly in an index. |
| | |
| 2 | | T H I S P A G E I S N O T P A R T O F Y O U R F U N D R E P O R T |
Table of Contents
Market Overview
iShares Trust
Domestic Market Overview
U.S. stocks declined for the 12 months ended March 31, 2023 (“reporting period”), when the Russell 3000® Index, a broad measure of U.S. equity market performance, returned -8.58%. Elevated inflation and rapid tightening of monetary policy dampened growth and weighed on equities. Higher interest rates drove bond yields higher and increased borrowing costs for businesses and consumers. Equities began to recover in the second half of the reporting period, as the broader economy remained resilient and the pace of inflation declined. In March 2023, two banks suddenly failed, representing the second and third largest bank failures in U.S. history by asset value. This drove concern among investors about the resiliency of the financial system in the face of rapidly rising interest rates. However, government agencies acted swiftly to organize a sale of the failed banks’ assets and inject liquidity, and equity prices recovered.
Inflation was a significant driver of the economic outlook. As the reporting period began, the consumer price index, a widely followed measure of inflation, stood at multi-decade highs. Strong consumer spending and a tight labor market, along with continued supply chain disruptions in Asia, combined to drive prices higher. But the rate of inflation began to decline as the reporting period wore on, decelerating for nine consecutive months beginning in July 2022. Nonetheless, inflation remained elevated by historic standards, and higher prices negatively impacted both consumers and businesses.
The U.S. economy recovered from a decline in the first half of 2022 to post modest growth in the third and fourth quarters of 2022. Consumers continued to power the economy with growing spending, despite higher prices for many consumer goods and services. The strong labor market supported spending, as unemployment remained very low, at one point dropping to the lowest recorded level since 1969. Furthermore, the labor force participation rate—which measures the total proportion of employed persons of working age—rose, indicating that more people were being drawn into the labor force. Amid tightening labor supply, wages rose significantly, with the largest gains at the lower end of the wage spectrum.
To contain inflation, the U.S. Federal Reserve (“Fed”) tightened monetary policy rapidly, raising short-term interest rates eight times over the course of the reporting period. The pace of tightening accelerated as the Fed twice stepped up the increment of increase before reducing it again as inflation began to subside. The Fed also started to reduce the size of its balance sheet by reducing the store of U.S. Treasuries it had accumulated to stabilize markets in the early phases of the coronavirus pandemic. While the Fed indicated that more tightening could be needed to achieve its long-term inflation goal, it sounded a more cautious note about the potential for further interest rate increases near the end of the reporting period.
Despite economic headwinds, corporate profits remained robust, and many companies were able to sufficiently raise prices to preserve profit margins even in the face of rising labor and input costs. Nonetheless, profits declined overall in the fourth quarter of 2022, and the yield curve (a graphical representation of U.S. Treasury rates at different maturities) inverted, a sign that markets were concerned about the impact of higher borrowing costs on the economy. Furthermore, dwindling personal savings and rising household debt raised questions about the sustainability of consumer spending as an engine of economic growth.
| | |
| 4 | | 2 0 2 3 B L A C K R O C K A N N U A L R E P O R T T O S H A R E H O L D E R S |
| | |
| Fund Summary as of March 31, 2023 | | iShares® Preferred and Income Securities ETF |
Investment Objective
The iShares Preferred and Income Securities ETF (the “Fund”) seeks to track the investment results of an index composed of U.S. dollar-denominated preferred and hybrid securities, as represented by the ICE Exchange-Listed Preferred & Hybrid Securities Index (the “Index”). The Fund invests in a representative sample of securities included in the Index that collectively has an investment portfolio similar to the index. Due to the use of representative sampling, the Fund may or may not hold all of the securities that are included in the Index.
Performance
| | | | | | | | | | | | | | | | | | | | | | | | |
| | | Average Annual Total Returns | | | Cumulative Total Returns | |
| | | | | | |
| | | 1 Year | | | 5 Years | | | 10 Years | | | 1 Year | | | 5 Years | | | 10 Years | |
| | | | | | |
Fund NAV | | | (8.99 | )% | | | 1.64 | % | | | 3.09 | % | | | (8.99 | )% | | | 8.48 | % | | | 35.53 | % |
| | | | | | |
Fund Market | | | (8.96 | ) | | | 1.65 | | | | 3.08 | | | | (8.96 | ) | | | 8.51 | | | | 35.40 | |
| | | | | | |
Index | | | (8.66 | ) | | | 2.28 | | | | 3.73 | | | | (8.66 | ) | | | 11.93 | | | | 44.17 | |
GROWTH OF $10,000 INVESTMENT
(AT NET ASSET VALUE)
Index performance through January 31, 2019 reflects the performance of the S&P U.S. Preferred Stock Index™. Index performance beginning on February 1, 2019 through October 31, 2019 reflects the performance of the ICE Exchange-Listed Preferred & Hybrid Securities Transition Index, which terminated on October 31, 2019. Index performance beginning on November 1, 2019 reflects the performance of the ICE Exchange-Listed Preferred & Hybrid Securities Index.
Past performance is no guarantee of future results. Performance results do not reflect the deduction of taxes that a shareholder would pay on fund distributions or on the redemption or sale of fund shares. See “About Fund Performance” on page 7 for more information.
Expense Example
| | | | | | | | | | | | | | | | | | | | | | | | | | | | |
| Actual | | | | | | Hypothetical 5% Return | | | |
| | | | | | | | | | | | | | | | | | | | | | |
| | | | | | | |
| Beginning
Account Value (10/01/22) |
| |
| Ending
Account Value (03/31/23) |
| |
| Expenses
Paid During the Period |
(a) | | | | | |
| Beginning
Account Value (10/01/22) |
| |
| Ending
Account Value (03/31/23) |
| |
| Expenses
Paid During the Period |
(a) | | Annualized Expense Ratio |
| | | | | | | |
| | $ 1,000.00 | | | | $ 1,017.30 | | | | $ 2.31 | | | | | | | | $ 1,000.00 | | | | $ 1,022.65 | | | | $ 2.32 | | | 0.46% |
| (a) | Expenses are equal to the annualized expense ratio, multiplied by the average account value over the period, multiplied by 182/365 (to reflect the one-half year period shown). Other fees, such as brokerage commissions and other fees to financial intermediaries, may be paid which are not reflected in the tables and examples above. See “Disclosure of Expenses” for more information. | |
| | |
| Fund Summary as of March 31, 2023 (continued) | | iShares® Preferred and Income Securities ETF |
Portfolio Management Commentary
U.S. dollar-denominated preferred stocks posted a notable decline for the reporting period. Preferred stock typically pays a steady stream of dividends; therefore, its value is sensitive to prevailing interest rates. When interest rates rise, the dividends paid on preferred stock become relatively less attractive to investors, which weighs on its value. During the reporting period, the Fed raised short-term interest rates eight times and bond yields rose substantially. The value of preferred and hybrid securities is also influenced by the financial conditions of the issuing company, and the negative performance of some companies represented in the Index during the reporting period also negatively impacted the Index’s return.
The financials sector, representing approximately 58% of the Index on average for the reporting period, detracted the most from the Index’s return. In particular, preferred stock issued by banks, which tend to issue high levels of preferred stock due to regulatory capital requirements, declined. Because preferred stock is classified as equity rather than debt on balance sheets, it can be a useful tool to meet target capital ratios.
Late in the reporting period, the failure of two banks represented in the Index negatively impacted the Index’s performance. The banks were unable to meet a surge in customer deposit withdrawals and the government intervened to help depositors and provide liquidity in order to maintain the stability of the financial system. While the government arranged for the sale of both banks’ assets to other institutions, the disruption created by the failures led to increased scrutiny of the industry by investors. The information technology sector also declined, primarily due to weakness in the semiconductors and semiconductor equipment industry.
Portfolio Information
SECTOR ALLOCATION
| | |
| Sector | | Percent of
Total Investments(a) |
Financials | | 60.4% |
Utilities | | 13.1 |
Real Estate | | 7.2 |
Communication Services | | 4.6 |
Consumer Discretionary | | 3.3 |
Health Care | | 3.0 |
Industrials | | 2.9 |
Energy | | 2.6 |
Consumer Staples | | 1.4 |
Materials | | 1.1 |
Other (each representing less than 1%) | | 0.4 |
| (a) | Excludes money market funds. |
TEN LARGEST HOLDINGS
| | |
| Security | | Percent of
Total Investments(a) |
Wells Fargo & Co., Series L, NVS | | 1.9% |
Citigroup Capital XIII, (3-mo. USD LIBOR + 6.370%), NVS | | 1.5 |
PG&E Corp. | | 1.3 |
Danaher Corp., Series B, NVS | | 1.3 |
Bank of America Corp., Series L, NVS | | 1.3 |
NextEra Energy, Inc. | | 1.1 |
NextEra Energy, Inc. | | 1.1 |
ArcelorMittal SA | | 1.0 |
JPMorgan Chase & Co., Series EE, NVS | | 1.0 |
JPMorgan Chase & Co., Series DD, NVS | | 0.9 |
| | |
| 6 | | 2 0 2 3 I S H A R E S A N N U A L R E P O R T T O S H A R E H O L D E R S |
About Fund Performance
Past performance is not an indication of future results. Financial markets have experienced extreme volatility and trading in many instruments has been disrupted. These circumstances may continue for an extended period of time and may continue to affect adversely the value and liquidity of the Fund’s investments. As a result, current performance may be lower or higher than the performance data quoted. Performance data current to the most recent month-end is available at iShares.com. Performance results assume reinvestment of all dividends and capital gain distributions and do not reflect the deduction of taxes that a shareholder would pay on fund distributions or on the redemption or sale of fund shares. The investment return and principal value of shares will vary with changes in market conditions. Shares may be worth more or less than their original cost when they are redeemed or sold in the market. Performance for certain funds may reflect a waiver of a portion of investment advisory fees. Without such a waiver, performance would have been lower.
Net asset value or “NAV” is the value of one share of a fund as calculated in accordance with the standard formula for valuing mutual fund shares. Beginning August 10, 2020, the price used to calculate market return (“Market Price”) is the closing price. Prior to August 10, 2020, Market Price was determined using the midpoint between the highest bid and the lowest ask on the primary stock exchange on which shares of a fund are listed for trading, as of the time that such fund’s NAV is calculated. Market and NAV returns assume that dividends and capital gain distributions have been reinvested at Market Price and NAV, respectively.
An index is a statistical composite that tracks a specified financial market or sector. Unlike a fund, an index does not actually hold a portfolio of securities and therefore does not incur the expenses incurred by a fund. These expenses negatively impact fund performance. Also, market returns do not include brokerage commissions that may be payable on secondary market transactions. If brokerage commissions were included, market returns would be lower.
Disclosure of Expenses
Shareholders of the Fund may incur the following charges: (1) transactional expenses, including brokerage commissions on purchases and sales of fund shares and (2) ongoing expenses, including management fees and other fund expenses. The expense example shown (which is based on a hypothetical investment of $1,000 invested at the beginning of the period and held through the end of the period) is intended to assist shareholders both in calculating expenses based on an investment in the Fund and in comparing these expenses with similar costs of investing in other funds.
The expense example provides information about actual account values and actual expenses. Annualized expense ratios reflect contractual and voluntary fee waivers, if any. In order to estimate the expenses a shareholder paid during the period covered by this report, shareholders can divide their account value by $1,000 and then multiply the result by the number under the heading entitled “Expenses Paid During the Period.”
The expense example also provides information about hypothetical account values and hypothetical expenses based on a fund’s actual expense ratio and an assumed rate of return of 5% per year before expenses. In order to assist shareholders in comparing the ongoing expenses of investing in the Fund and other funds, compare the 5% hypothetical example with the 5% hypothetical examples that appear in the shareholder reports of the other funds.
The expenses shown in the expense example are intended to highlight shareholders’ ongoing costs only and do not reflect any transactional expenses, such as brokerage commissions and other fees paid on purchases and sales of fund shares. Therefore, the hypothetical example is useful in comparing ongoing expenses only and will not help shareholders determine the relative total expenses of owning different funds. If these transactional expenses were included, shareholder expenses would have been higher.
| | |
A B O U T F U N D P E R F O R M A N C E / D I S C L O S U R E O F E X P E N S E S | | 7 |
| | |
Schedule of Investments March 31, 2023 | | iShares® Preferred and Income Securities ETF (Percentages shown are based on Net Assets) |
| | | | | | | | |
| Security | | Shares | | | Value | |
| | |
Preferred Securities | | | | | | | | |
| | |
| Preferred Stocks — 98.8% | | | | | | |
| | |
| Automobile Components — 0.8% | | | | | | |
Aptiv PLC, Series A, 5.50%, NVS(a) | | | 869,844 | | | $ | 106,764,653 | |
| | | | | | | | |
| | |
| Automobiles — 1.2% | | | | | | |
Ford Motor Co. | | | | | | | | |
6.00% | | | 2,420,405 | | | | 59,566,167 | |
6.50%, NVS | | | 1,815,445 | | | | 44,387,630 | |
6.20% | | | 2,269,113 | | | | 56,841,281 | |
| | | | | | | | |
| | |
| | | | | | | 160,795,078 | |
| | |
| Banks — 25.3% | | | | | | |
Associated Banc-Corp
(5 year CMT + 2.812%), 6.63%(b) | | | 907,901 | | | | 21,553,570 | |
Series E, 5.88%, NVS(c)(d) | | | 308,000 | | | | 5,753,440 | |
Series F, 5.63%, NVS(c) | | | 308,354 | | | | 6,000,569 | |
Atlantic Union Bankshares Corp., Series A, 6.88%, NVS(c) | | | 515,337 | | | | 11,172,506 | |
Bank of America Corp. | | | | | | | | |
Series 02, (3-mo. USD LIBOR + 0.650%), 5.60%, NVS(b)(c) | | | 539,808 | | | | 11,325,172 | |
Series 4, (3-mo. USD LIBOR + 0.750%), 5.70%, NVS(b)(c) | | | 375,126 | | | | 8,173,996 | |
Series 5, (3-mo. USD LIBOR + 0.500%), 5.42%, NVS(b)(c)(d) | | | 756,493 | | | | 15,417,327 | |
Series E, (3-mo. USD LIBOR + 0.350%), 5.21%, NVS(b)(c) | | | 565,988 | | | | 12,010,265 | |
Series GG, 6.00%(c) | | | 2,460,018 | | | | 60,541,043 | |
Series HH, 5.88%, NVS(c)(d) | | | 1,546,906 | | | | 37,032,930 | |
Series K*, (3-mo. USD LIBOR + 1.327%), 6.45%(b) | | | 1,912,332 | | | | 47,827,423 | |
Series KK, 5.38%, NVS(c) | | | 2,539,023 | | | | 58,321,358 | |
Series L, 7.25%, NVS(a)(c) | | | 140,486 | | | | 164,053,931 | |
Series LL, 5.00%, NVS(c) | | | 2,377,046 | | | | 50,654,850 | |
Series NN, 4.38%, NVS(c) | | | 1,961,127 | | | | 36,418,128 | |
Series PP, 4.13%, NVS(c) | | | 1,656,337 | | | | 29,002,461 | |
Series QQ, 4.25%, NVS(c) | | | 2,361,354 | | | | 42,929,416 | |
Series SS, 4.75%, NVS(c)(d) | | | 1,247,508 | | | | 25,848,366 | |
Bank of Hawaii Corp., Series A, 4.38%, NVS(c) | | | 547,620 | | | | 9,052,159 | |
Bank OZK, Series A, 4.63%, NVS(c) | | | 1,058,891 | | | | 16,878,723 | |
Cadence Bank, Series A, 5.50%, NVS(c) | | | 525,808 | | | | 11,057,742 | |
Citigroup, Inc. | | | | | | | | |
Series J, (3-mo. USD LIBOR + 4.040%), 7.13%(b)(c)(d) | | | 2,874,236 | | | | 71,942,127 | |
Series K, (3-mo. USD LIBOR + 4.130%), 6.88%, NVS(b)(c)(d) | | | 4,523,227 | | | | 112,130,797 | |
Citizens Financial Group, Inc. | | | | | | | | |
Series D, (3-mo. USD LIBOR + 3.642%), 6.35%, NVS(b)(c) | | | 907,685 | | | | 21,366,905 | |
Series E, 5.00%, NVS(c) | | | 1,361,467 | | | | 26,888,973 | |
ConnectOne Bancorp, Inc., Series A, (5 year CMT + 4.420%), 5.25%, NVS(b)(c) | | | 354,466 | | | | 5,685,635 | |
Cullen/Frost Bankers, Inc., Series B, 4.45%, NVS(c) | | | 456,773 | | | | 8,765,474 | |
Dime Community Bancshares, Inc., 5.50%, NVS(c) | | | 400,847 | | | | 7,014,823 | |
Fifth Third Bancorp | | | | | | | | |
Series A, 6.00%, NVS(c)(d) | | | 605,538 | | | | 13,975,817 | |
Series I, (3-mo. USD LIBOR + 3.710%), 6.63%, NVS(b)(c) | | | 1,361,466 | | | | 32,280,359 | |
Series K, 4.95%, NVS(c) | | | 756,360 | | | | 16,420,576 | |
First Citizens BancShares, Inc. | | | | | | | | |
Series A, 5.38%, NVS(c) | | | 1,043,773 | | | | 22,722,938 | |
| | | | | | | | |
| Security | | Shares | | | Value | |
| | |
| Banks (continued) | | | | | | |
First Citizens BancShares, Inc. | | | | | | | | |
Series C, 5.63%, NVS(c) | | | 605,857 | | | $ | 13,038,043 | |
First Horizon Corp.
6.50%, NVS(c) | | | 449,995 | | | | 9,940,390 | |
Series D, (3-mo. USD LIBOR + 3.859%), 6.10%(b)(c) | | | 302,580 | | | | 6,596,244 | |
Series F, 4.70%(c) | | | 449,995 | | | | 8,635,404 | |
First Republic Bank | | | | | | | | |
Series H, 5.13%, NVS(c)(d) | | | 596,244 | | | | 3,708,638 | |
Series I, 5.50%, NVS(c)(d) | | | 900,383 | | | | 5,654,405 | |
Series J, 4.70%, NVS(c) | | | 1,208,629 | | | | 6,889,185 | |
Series K, 4.13%(c)(d) | | | 1,524,903 | | | | 8,127,733 | |
Series L, 4.25%(c) | | | 2,266,498 | | | | 12,080,434 | |
Series M, 4.00%(c)(d) | | | 2,274,773 | | | | 12,147,288 | |
Series N, 4.50%(c) | | | 2,243,500 | | | | 12,496,295 | |
FNB Corp., (3-mo. USD LIBOR + 4.600%), 7.25%, NVS(b)(c)(d) | | | 335,478 | | | | 8,115,213 | |
Fulton Financial Corp., Series A, 5.13%, NVS(c) | | | 607,412 | | | | 10,101,262 | |
Hancock Whitney Corp., 6.25% | | | 517,444 | | | | 12,573,889 | |
Heartland Financial U.S.A., Inc., Series E, (5 year CMT + 6.675%), 7.00%, NVS(b)(c) | | | 350,469 | | | | 8,463,826 | |
Huntington Bancshares, Inc. | | | | | | | | |
Series C, 5.70%, NVS(c) | | | 531,235 | | | | 11,628,734 | |
Series H, 4.50%, NVS(c)(d) | | | 1,512,791 | | | | 27,668,947 | |
Series J, 6.88%, NVS(b)(c) | | | 983,521 | | | | 23,929,066 | |
JPMorgan Chase & Co. | | | | | | | | |
Series DD, 5.75%, NVS(c) | | | 4,534,083 | | | | 112,944,008 | |
Series EE, 6.00%, NVS(c)(d) | | | 5,121,594 | | | | 128,961,737 | |
Series GG, 4.75%, NVS(c) | | | 2,395,315 | | | | 51,762,757 | |
Series JJ, 4.55%, NVS(c) | | | 4,149,524 | | | | 87,637,947 | |
Series LL, 4.63%, NVS(c) | | | 5,119,984 | | | | 108,134,062 | |
Series MM, 4.20%, NVS(c)(d) | | | 5,535,196 | | | | 109,430,825 | |
KeyCorp | | | | | | | | |
(5 year CMT + 3.132%), 6.20%, NVS(b)(c) | | | 1,815,298 | | | | 40,535,604 | |
Series E, (3-mo. USD LIBOR + 3.892%), 6.13%, NVS(b)(c) | | | 1,512,791 | | | | 35,414,437 | |
Series F, 5.65%, NVS(c) | | | 1,285,853 | | | | 26,501,430 | |
Series G, 5.63%, NVS(c) | | | 1,361,466 | | | | 29,870,564 | |
M&T Bank Corp., Series H, (3-mo. USD LIBOR + 4.020%), 5.63%, NVS(b)(c) | | | 756,360 | | | | 18,500,566 | |
Midland States Bancorp, Inc., (5 year CMT + 4.713%), 7.75%, NVS(b)(c) | | | 350,463 | | | | 7,829,343 | |
New York Community Bancorp, Inc., Series A., (3-mo. USD LIBOR + 3.821%), 6.38%, NVS(b)(c)(d) | | | 1,558,122 | | | | 36,054,943 | |
New York Community Capital Trust V, 6.00%, NVS(a) | | | 220,626 | | | | 8,538,226 | |
Old National Bancorp | | | | | | | | |
Series A, 7.00%, NVS(c) | | | 329,722 | | | | 8,015,542 | |
Series C, 7.00%, NVS(c) | | | 372,696 | | | | 9,093,782 | |
PacWest Bancorp, Series A, (5 year CMT + 4.820%), 7.75%, NVS(b)(c) | | | 1,552,844 | | | | 22,997,620 | |
Pinnacle Financial Partners, Inc., Series B, 6.75%, NVS(c) | | | 680,769 | | | | 16,440,571 | |
Popular Capital Trust II, 6.13% | | | 303,068 | | | | 7,867,645 | |
Regions Financial Corp. | | | | | | | | |
Series B, (3-mo. USD LIBOR + 3.536%), 6.38%, NVS(b)(c) | | | 1,512,791 | | | | 35,626,228 | |
Series C, (3-mo. USD LIBOR + 3.148%), 5.70%, NVS(b)(c) | | | 1,512,791 | | | | 32,403,983 | |
Series E, 4.45%, NVS(c) | | | 1,210,191 | | | | 21,359,871 | |
| | |
| 8 | | 2 0 2 3 I S H A R E S A N N U A L R E P O R T T O S H A R E H O L D E R S |
| | |
Schedule of Investments (continued) March 31, 2023 | | iShares® Preferred and Income Securities ETF (Percentages shown are based on Net Assets) |
| | | | | | | | |
| Security | | Shares | | | Value | |
| | |
| Banks (continued) | | | | | | |
Synovus Financial Corp. | | | | | | | | |
Series D, (3-mo. USD LIBOR + 3.352%), 6.30%, NVS(b)(c)(d) | | | 605,498 | | | $ | 13,750,860 | |
Series E, (5 year CMT + 4.127%), 5.88%, NVS(b)(c) | | | 1,058,938 | | | | 22,978,955 | |
Texas Capital Bancshares, Inc., Series B, 5.75%, NVS(c) | | | 907,685 | | | | 17,200,631 | |
Truist Financial Corp. | | | | | | | | |
Series I, (3-mo. USD LIBOR + 0.530%), 5.40%, NVS(b)(c) | | | 523,733 | | | | 10,893,646 | |
Series O, 5.25%, NVS(c) | | | 1,739,636 | | | | 40,133,403 | |
Series R, 4.75%, NVS(c) | | | 2,798,576 | | | | 59,301,825 | |
U.S. Bancorp | | | | | | | | |
Series A, (3-mo. USD LIBOR + 1.020%), 5.85%, NVS(b)(c) | | | 43,477 | | | | 32,607,750 | |
Series B*, (3-mo. USD LIBOR + 0.600%), 5.39%, NVS(b)(c) | | | 3,025,489 | | | | 57,847,350 | |
Series K, 5.50%, NVS(c) | | | 1,739,635 | | | | 42,916,795 | |
Series L, 3.75%, NVS(c) | | | 1,512,791 | | | | 26,927,680 | |
Series M, 4.00%, NVS(c)(d) | | | 2,269,152 | | | | 42,206,227 | |
Series O, 4.50%, NVS(c) | | | 1,361,467 | | | | 28,781,412 | |
United Community Banks, Inc., Series I, 6.88%, NVS(c) | | | 304,694 | | | | 6,767,254 | |
Valley National Bancorp | | | | | | | | |
Series A, (3-mo. USD LIBOR + 3.850%), 6.25%, NVS(b)(c) | | | 351,039 | | | | 7,435,006 | |
Series B, (3-mo. USD LIBOR + 3.578%), 8.83%, NVS(b)(c)(d) | | | 306,328 | | | | 7,057,797 | |
Washington Federal, Inc., Series A, 4.88%, NVS(c) | | | 896,223 | | | | 14,518,813 | |
Webster Financial Corp. | | | | | | | | |
Series F, 5.25%, NVS(c)(d) | | | 449,995 | | | | 7,784,914 | |
Series G, 6.50%(c) | | | 411,345 | | | | 8,457,253 | |
Wells Fargo & Co. | | | | | | | | |
Series AA, 4.70%, NVS(c) | | | 2,344,503 | | | | 44,287,662 | |
Series CC, 4.38%, NVS(c) | | | 2,099,236 | | | | 36,925,561 | |
Series DD, 4.25%, NVS(c) | | | 2,504,013 | | | | 43,069,024 | |
Series L, 7.50%, NVS(a)(c) | | | 204,342 | | | | 240,357,277 | |
Series Q, (3-mo. USD LIBOR + 3.090%), 5.85%, NVS(b)(c) | | | 3,546,392 | | | | 82,489,078 | |
Series R, (3-mo. USD LIBOR + 3.690%), 6.63%, NVS(b)(c)(d) | | | 1,721,765 | | | | 41,838,889 | |
Series Y, 5.63%, NVS(c)(d) | | | 1,411,929 | | | | 32,191,981 | |
Series Z, 4.75%, NVS(c) | | | 4,136,893 | | | | 79,469,715 | |
WesBanco, Inc., Series A, (5 year CMT + 6.557%), 6.75%, NVS(b)(c) | | | 449,995 | | | | 10,390,385 | |
Western Alliance Bancorp, Series A, (5 year CMT + 3.452%), 4.25%, NVS(b)(c) | | | 909,997 | | | | 12,375,959 | |
Wintrust Financial Corp. | | | | | | | | |
Series D, (3-mo. USD LIBOR + 4.060%), 6.50%, NVS(b)(c) | | | 380,452 | | | | 8,963,449 | |
Series E, (5 year CMT + 6.507%), 6.88%, NVS(b)(c)(d) | | | 869,842 | | | | 19,762,810 | |
Zions Bancorp N.A., Series G, (3-mo. USD LIBOR + 4.240%), 9.11%, NVS(b)(c) | | | 420,749 | | | | 10,262,068 | |
| | | | | | | | |
| | |
| | | | | | | 3,287,887,915 | |
| | |
| Broadline Retail — 0.5% | | | | | | |
Dillard’s Capital Trust I, 7.50%(d) | | | 605,107 | | | | 15,599,658 | |
Qurate Retail, Inc., 8.00%(d) | | | 958,602 | | | | 28,096,625 | |
| | | | | | | | |
| Security | | Shares | | | Value | |
| | |
| Broadline Retail (continued) | | | | | | |
QVC, Inc. | | | | | | | | |
6.25% | | | 1,517,797 | | | $ | 12,840,563 | |
6.38% | | | 688,003 | | | | 5,813,625 | |
| | | | | | | | |
| | |
| | | | | | | 62,350,471 | |
| | |
| Capital Markets — 11.4% | | | | | | |
Affiliated Managers Group, Inc.
4.20% | | | 608,349 | | | | 9,715,334 | |
4.75% | | | 832,403 | | | | 14,949,958 | |
5.88% | | | 907,672 | | | | 20,994,453 | |
B Riley Financial, Inc.
6.50% | | | 508,197 | | | | 9,579,513 | |
6.00% | | | 718,971 | | | | 12,121,851 | |
5.50%(d) | | | 647,196 | | | | 12,335,556 | |
5.25% | | | 956,905 | | | | 15,530,568 | |
5.00%(d) | | | 997,988 | | | | 17,574,569 | |
6.75% | | | 336,405 | | | | 7,989,619 | |
6.38% | | | 433,640 | | | | 9,383,970 | |
Brookfield Finance I UK PLC, 4.50%(c) | | | 698,556 | | | | 10,275,759 | |
Brookfield Finance, Inc., Series 50, 4.63%, NVS | | | 1,210,191 | | | | 18,624,839 | |
Carlyle Finance LLC, 4.63%, NVS | | | 1,512,791 | | | | 27,835,354 | |
Charles Schwab Corp. | | | | | | | | |
Series D, 5.95%, NVS(c)(d) | | | 2,269,151 | | | | 52,258,548 | |
Series J, 4.45%, NVS(c) | | | 1,815,298 | | | | 35,071,557 | |
Cowen, Inc., 7.75% | | | 294,707 | | | | 7,432,511 | |
Crescent Capital BDC, Inc., 5.00% | | | 340,611 | | | | 7,823,835 | |
Gladstone Investment Corp.
5.00%, NVS | | | 389,477 | | | | 9,250,079 | |
4.88% | | | 409,082 | | | | 9,682,971 | |
Goldman Sachs Group, Inc. | | | | | | | | |
Series A, (3-mo. USD LIBOR + 0.750%), 5.61%, NVS(b)(c) | | | 2,269,082 | | | | 47,015,379 | |
Series C, (3-mo. USD LIBOR + 0.750%), 6.01%, NVS(b)(c) | | | 599,993 | | | | 12,131,858 | |
Series D, (3-mo. USD LIBOR + 0.670%), 5.53%, NVS(b)(c) | | | 4,084,378 | | | | 84,914,219 | |
Series J, (3-mo. USD LIBOR + 3.640%), 5.50%, NVS(b)(c) | | | 3,025,489 | | | | 75,092,637 | |
Series K, (3-mo. USD LIBOR + 3.550%), 6.38%(b)(c)(d) | | | 2,117,775 | | | | 53,177,330 | |
KKR & Co., Inc., Series C, 6.00%, NVS(a)(d) | | | 1,739,636 | | | | 110,379,904 | |
KKR Group Finance Co. IX LLC, 4.63%, NVS | | | 1,512,654 | | | | 27,984,099 | |
Morgan Stanley | | | | | | | | |
Series A, (3-mo. USD LIBOR + 0.700%), 5.49%(b)(c) | | | 3,328,089 | | | | 68,991,285 | |
Series E, (3-mo. USD LIBOR + 4.320%), 7.13%, NVS(b)(c) | | | 2,609,479 | | | | 65,497,923 | |
Series F, (3-mo. USD LIBOR + 3.940%), 6.88%, NVS(b)(c) | | | 2,571,658 | | | | 63,519,953 | |
Series I, (3-mo. USD LIBOR + 3.708%), 6.38%, NVS(b)(c) | | | 3,025,489 | | | | 74,517,794 | |
Series K, (3-mo. USD LIBOR + 3.491%), 5.85%, NVS(b)(c) | | | 3,025,489 | | | | 74,971,617 | |
Series L, 4.88%, NVS(c) | | | 1,512,791 | | | | 33,644,472 | |
Series O, 4.25%, NVS(c) | | | 3,933,174 | | | | 74,533,647 | |
Series P, 6.50%, NVS(c) | | | 3,025,490 | | | | 76,817,191 | |
NewtekOne, Inc., 5.50% | | | 306,424 | | | | 7,544,159 | |
Northern Trust Corp., Series E, 4.70%, NVS(c) | | | 1,210,191 | | | | 27,846,495 | |
Oaktree Capital Group LLC | | | | | | | | |
Series A, 6.63%, NVS(c) | | | 539,986 | | | | 11,431,504 | |
Series B, 6.55%, NVS(c) | | | 710,992 | | | | 14,802,853 | |
Prospect Capital Corp., Series A, 5.35%(c) | | | 459,664 | | | | 7,354,624 | |
| | |
S C H E D U L E O F I N V E S T M E N T S | | 9 |
| | |
Schedule of Investments (continued) March 31, 2023 | | iShares® Preferred and Income Securities ETF (Percentages shown are based on Net Assets) |
| | | | | | | | |
| Security | | Shares | | | Value | |
| | |
| Capital Markets (continued) | | | | | | |
State Street Corp. | | | | | | | | |
Series D, (3-mo. USD LIBOR + 3.108%), 5.90%, NVS(b)(c)(d) | | | 2,269,151 | | | $ | 52,939,293 | |
Series G, (3-mo. USD LIBOR + 3.709%), 5.35%, NVS(b)(c)(d) | | | 1,512,791 | | | | 37,925,670 | |
Stifel Financial Corp.
5.20% | | | 573,277 | | | | 11,826,704 | |
Series B, 6.25%, NVS(c) | | | 479,978 | | | | 11,394,678 | |
Series C, 6.13%, NVS(c) | | | 680,769 | | | | 16,372,494 | |
Series D, 4.50%, NVS(c) | | | 907,858 | | | | 14,770,850 | |
Trinity Capital, Inc., 7.00% | | | 529,655 | | | | 13,368,492 | |
| | | | | | | | |
| | |
| | | | | | | 1,479,197,968 | |
| | |
| Chemicals — 0.1% | | | | | | |
EIDP, Inc., Series B, 4.50%, NVS(c)(d) | | | 126,887 | | | | 11,904,538 | |
| | | | | | | | |
|
| Commercial Services & Supplies — 0.2% | |
Charah Solutions, Inc., 8.50% | | | 408,894 | | | | 3,843,604 | |
Pitney Bowes, Inc., 6.70% | | | 1,288,379 | | | | 20,343,504 | |
| | | | | | | | |
| | |
| | | | | | | 24,187,108 | |
| | |
| Consumer Finance — 2.4% | | | | | | |
Atlanticus Holdings Corp., 6.13% | | | 455,858 | | | | 10,498,410 | |
Capital One Financial Corp. | | | | | | | | |
Series I, 5.00%, NVS(c) | | | 4,538,281 | | | | 91,446,362 | |
Series J, 4.80%, NVS(c) | | | 3,781,850 | | | | 72,384,609 | |
Series K, 4.63%, NVS(c) | | | 382,228 | | | | 6,845,703 | |
Series L, 4.38%, NVS(c) | | | 2,042,214 | | | | 34,860,593 | |
Series N, 4.25%, NVS(c) | | | 1,285,846 | | | | 21,370,761 | |
Navient Corp., 6.00% | | | 907,685 | | | | 17,954,009 | |
SLM Corp., Series B, (3-mo. USD LIBOR + 1.700%), 6.57%(b)(c) | | | 302,578 | | | | 18,911,125 | |
Synchrony Financial, Series A, 5.63%, NVS(c) | | | 2,269,154 | | | | 38,666,384 | |
| | | | | | | | |
| | |
| | | | | | | 312,937,956 | |
| | |
| Diversified REITs — 0.4% | | | | | | |
Armada Hoffler Properties, Inc., Series A, 6.75%, NVS(c) | | | 513,199 | | | | 10,720,727 | |
EPR Properties | | | | | | | | |
Series C, 5.75%, NVS(a)(c) | | | 410,834 | | | | 7,312,845 | |
Series E, 9.00%, NVS(a)(c) | | | 264,029 | | | | 6,983,567 | |
Gladstone Commercial Corp., Series G, 6.00%, NVS(c)(d) | | | 302,631 | | | | 5,598,674 | |
Global Net Lease, Inc. | | | | | | | | |
Series A, 7.25%, NVS(c) | | | 516,138 | | | | 10,658,250 | |
Series B, 6.88%(c) | | | 358,834 | | | | 7,506,807 | |
LXP Industrial Trust, Series C, 6.50%,
NVS(a)(c)(d) | | | 146,307 | | | | 7,100,279 | |
| | | | | | | | |
| | |
| | | | | | | 55,881,149 | |
|
| Diversified Telecommunication Services — 3.3% | |
AT&T Inc.
5.35% | | | 4,001,276 | | | | 93,989,973 | |
5.63% | | | 2,496,067 | | | | 62,177,029 | |
Series A, 5.00%, NVS(c) | | | 3,630,596 | | | | 82,269,305 | |
Series C, 4.75%, NVS(c) | | | 5,294,641 | | | | 112,617,014 | |
Qwest Corp.
6.75% | | | 1,996,810 | | | | 29,652,629 | |
6.50%, NVS | | | 2,957,412 | | | | 42,172,695 | |
| | | | | | | | |
| | |
| | | | | | | 422,878,645 | |
| | |
| Electric Utilities — 8.4% | | | | | | |
American Electric Power Co., Inc., 6.13%, NVS(a) | | | 1,285,854 | | | | 64,742,749 | |
BIP Bermuda Holdings I Ltd., 5.13%(c) | | | 907,671 | | | | 16,637,609 | |
Brookfield BRP Holdings Canada, Inc.
4.63%, NVS(c) | | | 1,058,894 | | | | 16,254,023 | |
4.88%(c) | | | 788,348 | | | | 11,746,385 | |
| | | | | | | | |
| Security | | Shares | | | Value | |
| | |
| Electric Utilities (continued) | | | | | | |
Brookfield Infrastructure Finance ULC, 5.00% | | | 757,373 | | | $ | 13,822,057 | |
Duke Energy Corp.
5.63% | | | 1,512,791 | | | | 37,895,415 | |
Series A, 5.75%, NVS(c) | | | 3,025,490 | | | | 76,998,721 | |
Entergy Arkansas LLC, 4.88% | | | 1,240,450 | | | | 27,872,912 | |
Entergy Louisiana LLC, 4.88%(d) | | | 816,857 | | | | 19,106,285 | |
Entergy Mississippi LLC, 4.90% | | | 786,597 | | | | 18,154,659 | |
Georgia Power Co., Series 2017, 5.00% | | | 816,857 | | | | 20,494,942 | |
NextEra Energy Capital Holdings, Inc., Series N, 5.65% | | | 2,080,057 | | | | 53,457,465 | |
NextEra Energy, Inc.
6.22%(a) | | | 3,025,496 | | | | 147,765,225 | |
6.93%(a) | | | 3,025,490 | | | | 140,231,461 | |
Pacific Gas & Electric Co., Series A,
6.00%(c)(d) | | | 321,618 | | | | 7,197,811 | |
PG&E Corp., 5.50%(a) | | | 1,210,191 | | | | 172,246,485 | |
SCE Trust II, 5.10%, NVS(c) | | | 666,157 | | | | 13,829,419 | |
SCE Trust III, Series H, (3-mo. USD LIBOR + 2.990%), 5.75%, NVS(b)(c)(d) | | | 832,022 | | | | 17,064,771 | |
SCE Trust IV, Series J, (3-mo. USD LIBOR + 3.132%), 5.38%, NVS(b)(c)(d) | | | 983,276 | | | | 19,960,503 | |
SCE Trust V, Series K, (3-mo. USD LIBOR + 3.790%), 5.45%, NVS(b)(c) | | | 907,685 | | | | 20,332,144 | |
SCE Trust VI, 5.00%, NVS(c) | | | 1,437,129 | | | | 28,713,837 | |
Southern Co.
5.25% | | | 1,361,467 | | | | 33,247,024 | |
Series 2020, 4.95% | | | 3,025,490 | | | | 68,376,074 | |
Series C, 4.20% | | | 2,269,152 | | | | 45,383,040 | |
| | | | | | | | |
| | |
| | | | | | | 1,091,531,016 | |
| | |
| Electrical Equipment — 0.2% | | | | | | |
Babcock & Wilcox Enterprises, Inc.
6.50% | | | 460,444 | | | | 9,977,822 | |
8.13% | | | 485,413 | | | | 11,955,722 | |
Series A, 7.75%, NVS(c) | | | 582,414 | | | | 10,623,231 | |
| | | | | | | | |
| | |
| | | | | | | 32,556,775 | |
|
| Electronic Equipment, Instruments & Components — 0.2% | |
Coherent Corp., Series A, 6.00%, NVS(a) | | | 174,001 | | | | 30,448,435 | |
| | | | | | | | |
| | |
| Entertainment — 0.0% | | | | | | |
Chicken Soup For The Soul Entertainment, Inc., Series A, NVS, 9.75%(c)(d) | | | 310,146 | | | | 4,894,104 | |
| | | | | | | | |
| | |
| Financial Services — 3.5% | | | | | | |
Apollo Asset Management, Inc. | | | | | | | | |
Series A, 6.38%, NVS(c)(d) | | | 832,022 | | | | 17,555,664 | |
Series B, 6.38%, NVS(c) | | | 907,685 | | | | 20,332,144 | |
Citigroup Capital XIII, (3-mo. USD LIBOR + 6.370%), 11.17%, NVS(b) | | | 6,795,264 | | | | 193,936,834 | |
Compass Diversified Holdings | | | | | | | | |
Series A, 7.25%, NVS(c) | | | 306,844 | | | | 7,051,275 | |
Series B, (3-mo. USD LIBOR + 4.985%), 7.88%, NVS(b)(c) | | | 306,378 | | | | 7,598,174 | |
Series C, 7.88%, NVS(c) | | | 350,304 | | | | 8,459,842 | |
Equitable Holdings, Inc. | | | | | | | | |
Series A, 5.25%, NVS(c) | | | 2,420,404 | | | | 52,982,644 | |
Series C, 4.30%(c) | | | 907,487 | | | | 16,879,258 | |
Federal Agricultural Mortgage Corp. | | | | | | | | |
Series D, 5.70%, NVS(c) | | | 301,738 | | | | 7,458,963 | |
Series F, 5.25%, NVS(c)(d) | | | 366,800 | | | | 7,999,908 | |
Series G, 4.88%, NVS(c)(d) | | | 382,594 | | | | 7,908,218 | |
Jackson Financial, Inc., (5 year CMT + 3.728%), 8.00%(b)(c) | | | 1,472,115 | | | | 36,508,452 | |
Merchants Bancorp (5 year CMT + 4.340%), 8.25%, NVS(c) | | | 432,722 | | | | 11,294,044 | |
| | |
| 10 | | 2 0 2 3 I S H A R E S A N N U A L R E P O R T T O S H A R E H O L D E R S |
| | |
Schedule of Investments (continued) March 31, 2023 | | iShares® Preferred and Income Securities ETF (Percentages shown are based on Net Assets) |
| | | | | | | | |
| Security | | Shares | | | Value | |
| | |
| Financial Services (continued) | | | | | | |
Merchants Bancorp | | | | | | | | |
Series B, (3-mo. USD LIBOR + 4.569%), 6.00%, NVS(b)(c) | | | 381,329 | | | $ | 8,015,536 | |
Series C, 6.00%, NVS(c) | | | 595,181 | | | | 11,594,126 | |
National Rural Utilities Cooperative Finance Corp., Series US, 5.50%(d) | | | 756,360 | | | | 17,683,697 | |
Voya Financial, Inc., Series B, (5 year CMT + 3.210%), 5.35%, NVS(b)(c) | | | 907,685 | | | | 21,058,292 | |
| | | | | | | | |
| | |
| | | | | | | 454,317,071 | |
| | |
| Food Products — 1.4% | | | | | | |
CHS, Inc.
8.00%, NVS(c)(d) | | | 928,199 | | | | 27,465,408 | |
Series 1, 7.88%, NVS(c) | | | 1,623,136 | | | | 43,321,500 | |
Series 2, (3-mo. USD LIBOR + 4.298%), 7.10%, NVS(b)(c) | | | 1,270,711 | | | | 31,856,725 | |
Series 3, (3-mo. USD LIBOR + 4.155%), 6.75%, NVS(b)(c) | | | 1,490,044 | | | | 37,251,100 | |
Series 4, 7.50%(c) | | | 1,565,706 | | | | 41,131,097 | |
| | | | | | | | |
| | |
| | | | | | | 181,025,830 | |
| | |
| Gas Utilities — 0.3% | | | | | | |
Entergy New Orleans LLC, 5.50% | | | 335,850 | | | | 8,231,684 | |
Spire, Inc., Series A, 5.90%, NVS(c) | | | 756,360 | | | | 18,190,458 | |
UGI Corp., 7.25%(a)(d) | | | 166,541 | | | | 13,251,667 | |
| | | | | | | | |
| | |
| | | | | | | 39,673,809 | |
|
| Health Care Equipment & Supplies — 1.6% | |
Becton Dickinson & Co., Series B, 6.00%, NVS(a) | | | 2,269,152 | | | | 112,822,237 | |
Boston Scientific Corp., Series A, 5.50%, NVS(a) | | | 761,069 | | | | 92,119,792 | |
| | | | | | | | |
| | |
| | | | | | | 204,942,029 | |
| | |
| Health Care REITs — 0.2% | | | | | | |
Diversified Healthcare Trust
6.25%, NVS | | | 762,389 | | | | 10,200,765 | |
5.63% | | | 1,060,177 | | | | 13,527,858 | |
| | | | | | | | |
| | |
| | | | | | | 23,728,623 | |
| | |
| Health Care Technology — 0.1% | | | | | | |
CareCloud, Inc., Series A, 11.00%, NVS(c) | | | 344,153 | | | | 9,522,713 | |
| | | | | | | | |
| | |
| Hotel & Resort REITs — 1.0% | | | | | | |
Braemar Hotels & Resorts, Inc., Series B, 5.50%, NVS(a)(c) | | | 238,864 | | | | 3,826,601 | |
Chatham Lodging Trust, Series A, 6.63%, NVS(c) | | | 359,152 | | | | 7,362,616 | |
DiamondRock Hospitality Co., 8.25%, NVS(c) | | | 360,007 | | | | 9,367,382 | |
Hersha Hospitality Trust | | | | | | | | |
Series D, 6.50%, NVS(c) | | | 584,304 | | | | 11,341,341 | |
Series E, 6.50%, NVS(c) | | | 304,486 | | | | 6,031,868 | |
Pebblebrook Hotel Trust | | | | | | | | |
Series E, 6.38%, NVS(c) | | | 330,164 | | | | 6,213,686 | |
Series F, 6.30%, NVS(c) | | | 448,168 | | | | 8,425,558 | |
Series G, 6.38%, NVS(c) | | | 687,163 | | | | 12,794,975 | |
Series H, 5.70%, NVS(c) | | | 701,620 | | | | 11,436,406 | |
RLJ Lodging Trust, Series A, 1.95%(a)(c) | | | 974,197 | | | | 24,413,377 | |
Summit Hotel Properties, Inc. | | | | | | | | |
Series E, 6.25%, NVS(c) | | | 487,008 | | | | 9,223,932 | |
Series F, 5.88%, NVS(c) | | | 303,314 | | | | 5,371,691 | |
Sunstone Hotel Investors, Inc. | | | | | | | | |
Series H, 6.13%(c) | | | 341,879 | | | | 6,919,631 | |
Series I, 5.70%, NVS(c) | | | 298,317 | | | | 5,715,754 | |
| | | | | | | | |
| | |
| | | | | | | 128,444,818 | |
| | |
| Hotels, Restaurants & Leisure — 0.1% | | | | | | |
FAT Brands, Inc., Series B, NVS, 8.25%(d) | | | 558,370 | | | | 9,101,431 | |
| | | | | | | | |
| | | | | | | | |
| Security | | Shares | | | Value | |
|
| Independent Power and Renewable Electricity Producers — 0.9% | |
AES Corp., 6.88%(a) | | | 788,976 | | | $ | 70,621,242 | |
Brookfield Renewable Partners LP, Series 17, 5.25%, NVS(c) | | | 606,750 | | | | 11,977,245 | |
Tennessee Valley Authority | | | | | | | | |
Series A, (30 yr. CMT + 0.840%), 2.22%(b)(d) | | | 629,826 | | | | 13,327,118 | |
Series D, (30 yr. CMT + 0.940%), 2.13%(b) | | | 774,522 | | | | 16,737,420 | |
| | | | | | | | |
| | |
| | | | | | | 112,663,025 | |
| | |
| Industrial Conglomerates — 0.1% | | | | | | |
Steel Partners Holdings LP, Series A, 6.00%, NVS | | | 487,119 | | | | 11,281,676 | |
| | | | | | | | |
| | |
| Insurance — 11.7% | | | | | | |
AEGON Funding Co. LLC, 5.10%, NVS | | | 2,798,576 | | | | 60,421,256 | |
Allstate Corp. | | | | | | | | |
(3-mo. USD LIBOR + 3.165%), 8.00%, NVS(b) | | | 1,512,791 | | | | 38,606,426 | |
Series G, 5.63%, NVS(c) | | | 1,739,636 | | | | 43,386,522 | |
Series H, 5.10%, NVS(c) | | | 3,479,343 | | | | 78,180,837 | |
Series I, 4.75%, NVS(c) | | | 907,685 | | | | 20,096,146 | |
American Equity Investment Life Holding Co. | | | | | | | | |
Series A, (5 year CMT + 4.322%), 5.95%, NVS(b)(c) | | | 1,207,878 | | | | 28,348,897 | |
Series B, (5 year CMT + 6.297%), 6.63%, NVS(b)(c) | | | 907,689 | | | | 22,628,687 | |
American Financial Group, Inc. | | | | | | | | |
5.88% | | | 371,878 | | | | 8,006,533 | |
4.50% | | | 596,688 | | | | 11,044,695 | |
5.63% | | | 446,921 | | | | 9,841,200 | |
5.13% | | | 597,412 | | | | 11,553,948 | |
American International Group, Inc., Series A, 5.85%, NVS(c) | | | 1,512,793 | | | | 35,338,844 | |
Arch Capital Group Ltd. | | | | | | | | |
Series F, 5.45%, NVS(c) | | | 998,441 | | | | 22,974,127 | |
Series G, 4.55%(c) | | | 1,512,791 | | | | 29,121,227 | |
Argo Group International Holdings Ltd., (5 year CMT + 6.712%), 7.00%, NVS(b)(c) | | | 454,450 | | | | 10,943,156 | |
Argo Group U.S., Inc., 6.50% | | | 437,096 | | | | 9,690,418 | |
Aspen Insurance Holdings Ltd.
5.63%, NVS(c) | | | 778,146 | | | | 14,255,635 | |
5.63%, NVS(c) | | | 734,869 | | | | 14,013,952 | |
(3-mo. USD LIBOR + 4.060%), 5.95%, NVS(b)(c)(d) | | | 832,022 | | | | 19,136,506 | |
Assurant, Inc., 5.25% | | | 758,991 | | | | 14,815,504 | |
Athene Holding Ltd. | | | | | | | | |
Series A, (3-mo. USD LIBOR + 4.253%), 6.35%, NVS(b)(c) | | | 2,609,479 | | | | 56,756,168 | |
Series B, 5.63%, NVS(c)(d) | | | 1,043,773 | | | | 21,000,713 | |
Series C, (5 year CMT + 5.970%), 6.38%, NVS(b)(c) | | | 1,812,757 | | | | 43,669,316 | |
Series D, 4.88%(c) | | | 1,739,636 | | | | 27,381,871 | |
Series E, (5 year CMT + 3.962%), 7.75%, NVS(b)(c)(d) | | | 1,512,641 | | | | 36,136,994 | |
Axis Capital Holdings Ltd., Series E, 5.50%, NVS(c) | | | 1,664,047 | | | | 35,261,156 | |
Brighthouse Financial, Inc. | | | | | | | | |
6.25% | | | 1,134,529 | | | | 24,868,876 | |
Series A, 6.60%, NVS(c) | | | 1,285,854 | | | | 29,214,603 | |
Series B, 6.75%, NVS(c) | | | 1,217,774 | | | | 29,043,910 | |
Series C, 5.38%(c) | | | 1,739,636 | | | | 29,138,903 | |
Series D, 4.63%, NVS(c) | | | 1,058,938 | | | | 16,900,650 | |
CNO Financial Group, Inc., 5.13% | | | 459,664 | | | | 7,469,540 | |
Enstar Group Ltd. | | | | | | | | |
Series D, (3-mo. USD LIBOR + 4.015%), 7.00%, NVS(b)(c) | | | 1,210,191 | | | | 26,987,259 | |
| | |
S C H E D U L E O F I N V E S T M E N T S | | 11 |
| | |
Schedule of Investments (continued) March 31, 2023 | | iShares® Preferred and Income Securities ETF (Percentages shown are based on Net Assets) |
| | | | | | | | |
| Security | | Shares | | | Value | |
| | |
| Insurance (continued) | | | | | | |
Enstar Group Ltd. | | | | | | | | |
Series E, 7.00%, NVS(c) | | | 335,570 | | | $ | 7,714,754 | |
Globe Life, Inc., 4.25%, NVS | | | 983,276 | | | | 18,780,572 | |
Hartford Financial Services Group, Inc., Series G, 6.00%, NVS(c) | | | 1,043,775 | | | | 26,407,508 | |
Kemper Corp., (5 year CMT + 4.140%), 5.88%(b) | | | 457,029 | | | | 8,793,238 | |
Lincoln National Corp., Series D, 9.00%(c) | | | 1,512,791 | | | | 38,576,171 | |
Maiden Holdings Ltd., 6.63% | | | 333,095 | | | | 4,796,568 | |
Maiden Holdings North America Ltd., 7.75% | | | 465,839 | | | | 7,779,511 | |
MetLife, Inc. | | | | | | | | |
Series A, (3-mo. USD LIBOR + 1.000%), 5.87%, NVS(b)(c) | | | 1,815,258 | | | | 43,293,903 | |
Series E, 5.63%, NVS(c)(d) | | | 2,435,572 | | | | 60,743,166 | |
Series F, 4.75%, NVS(c) | | | 3,025,490 | | | | 65,864,917 | |
PartnerRe Ltd., Series J, 4.88%, NVS(c) | | | 606,125 | | | | 12,383,134 | |
Prudential Financial, Inc.
5.95% | | | 907,684 | | | | 23,009,789 | |
5.63% | | | 1,709,375 | | | | 42,734,375 | |
4.13%, NVS(d) | | | 1,512,791 | | | | 30,346,587 | |
Reinsurance Group of America, Inc. | | | | | | | | |
(3-mo. USD LIBOR + 4.040%), 5.75%, NVS(b)(d) | | | 1,210,191 | | | | 30,980,890 | |
(5 year CMT + 3.456%), 7.13%(b) | | | 2,117,876 | | | | 55,700,139 | |
RenaissanceRe Holdings Ltd. | | | | | | | | |
Series F, 5.75%, NVS(c) | | | 756,360 | | | | 17,487,043 | |
Series G, 4.20%, NVS(c) | | | 1,512,791 | | | | 26,125,901 | |
Selective Insurance Group, Inc., Series B, 4.60%(c)(d) | | | 607,238 | | | | 10,444,494 | |
SiriusPoint Ltd., Series B, (5 year CMT + 7.298%), 8.00%, NVS(b)(c) | | | 599,933 | | | | 13,198,526 | |
Unum Group, 6.25% | | | 905,937 | | | | 22,766,197 | |
W R Berkley Corp.
5.70% | | | 560,580 | | | | 13,700,575 | |
5.10% | | | 907,685 | | | | 19,215,691 | |
4.13% | | | 907,685 | | | | 15,748,335 | |
4.25%(d) | | | 756,630 | | | | 14,655,923 | |
| | | | | | | | |
| | |
| | | | | | | 1,517,482,382 | |
| | |
| IT Services — 0.1% | | | | | | |
Exela Technologies, Inc., Series B,
6.00%(a)(c)(d) | | | 263,903 | | | | 786,431 | |
Sabre Corp., 6.50%, NVS(a) | | | 248,907 | | | | 15,606,469 | |
| | | | | | | | |
| | |
| | | | | | | 16,392,900 | |
| | |
| Leisure Products — 0.3% | | | | | | |
Brunswick Corp.
6.50% | | | 559,954 | | | | 14,194,834 | |
6.63% | | | 379,966 | | �� | | 9,711,931 | |
6.38% | | | 695,863 | | | | 17,709,713 | |
| | | | | | | | |
| | |
| | | | | | | 41,616,478 | |
| | |
| Life Sciences Tools & Services — 1.3% | | | | | | |
Danaher Corp., Series B, 5.00%, NVS(a)(d) | | | 130,097 | | | | 165,789,112 | |
| | | | | | | | |
| | |
| Machinery — 0.6% | | | | | | |
Chart Industries, Inc., Series B, 6.75%, NVS(a) | | | 608,888 | | | | 32,569,419 | |
RBC Bearings, Inc., Series A, 5.00%, NVS(a) | | | 347,932 | | | | 39,211,937 | |
| | | | | | | | |
| | |
| | | | | | | 71,781,356 | |
| | |
| Marine Transportation — 0.1% | | | | | | |
Global Ship Lease, Inc., 8.75%, NVS(c) | | | 331,485 | | | | 8,283,810 | |
| | | | | | | | |
| | |
| Media — 0.3% | | | | | | |
Liberty Broadband Corp., Series A,
7.00%(c) | | | 544,914 | | | | 12,473,082 | |
Paramount Global, Series A, 5.75%,
NVS(a)(d) | | | 756,360 | | | | 22,645,418 | |
| | | | | | | | |
| | |
| | | | | | | 35,118,500 | |
| | | | | | | | |
| Security | | Shares | | | Value | |
| | |
| Metals & Mining — 1.0% | | | | | | |
ArcelorMittal SA, 5.50%(a)(d) | | | 1,839,544 | | | $ | 131,067,510 | |
| | | | | | | | |
|
| Mortgage Real Estate Investment Trusts (REITs) — 5.3% | |
ACRES Commercial Realty Corp. | | | | | | | | |
Series C, (3-mo. USD LIBOR + 5.927%), 8.63%(b)(c) | | | 366,580 | | | | 7,698,180 | |
Series D, 7.88%, NVS(c) | | | 353,760 | | | | 6,880,632 | |
AGNC Investment Corp. | | | | | | | | |
Series C, (3-mo. USD LIBOR + 5.111%), 9.90%, NVS(b)(c)(d) | | | 983,276 | | | | 23,126,652 | |
Series D, (3-mo. USD LIBOR + 4.332%), 6.88%, NVS(b)(c) | | | 711,020 | | | | 14,618,571 | |
Series E, (3-mo. USD LIBOR + 4.993%), 6.50%, NVS(b)(c) | | | 1,217,774 | | | | 24,611,213 | |
Series F, (3-mo. USD LIBOR + 4.697%), 6.13%, NVS(b)(c) | | | 1,739,636 | | | | 33,940,298 | |
Series G, (5 year CMT + 4.390%), 7.75%, NVS(b)(c) | | | 455,663 | | | | 9,938,010 | |
Annaly Capital Management, Inc. | | | | | | | | |
Series F, (3-mo. USD LIBOR + 4.993%), 10.16%, NVS(b)(c)(d) | | | 2,178,396 | | | | 51,431,930 | |
Series G, (3-mo. USD LIBOR + 4.172%), 6.50%, NVS(b)(c)(d) | | | 1,285,854 | | | | 30,616,184 | |
Series I, (3-mo. USD LIBOR + 4.989%), 6.75%, NVS(b)(c) | | | 1,338,791 | | | | 30,055,858 | |
Arbor Realty Trust, Inc. | | | | | | | | |
Series D, 6.38%, NVS(c)(d) | | | 697,363 | | | | 12,168,984 | |
Series E, 6.25%, NVS(c) | | | 434,887 | | | | 7,393,079 | |
Series F, (SOFR + 5.440%), 6.25%,
NVS(b)(c) | | | 857,909 | | | | 14,584,453 | |
ARMOUR Residential REIT, Inc., Series C, 7.00%(c) | | | 520,042 | | | | 10,400,840 | |
Chimera Investment Corp. | | | | | | | | |
Series A, 8.00%, NVS(c) | | | 441,780 | | | | 8,521,936 | |
Series B, (3-mo. USD LIBOR + 5.791%), 8.00%, NVS(b)(c) | | | 983,276 | | | | 18,839,568 | |
Series C, (3-mo. USD LIBOR + 4.743%), 7.75%, NVS(b)(c) | | | 785,288 | | | | 15,101,088 | |
Series D, (3-mo. USD LIBOR + 5.379%), 8.00%, NVS(b)(c) | | | 606,682 | | | | 11,466,290 | |
Dynex Capital, Inc., Series C, (3-mo. USD LIBOR + 5.461%), 6.90%, NVS(b)(c) | | | 337,529 | | | | 7,364,883 | |
Ellington Financial, Inc. | | | | | | | | |
(3-mo. USD LIBOR + 5.196%), 6.75%,
NVS(b)(c) | | | 352,174 | | | | 7,321,697 | |
Series B, (5 year CMT + 4.990%), 6.25%, NVS(b)(c) | | | 367,972 | | | | 7,841,483 | |
Series C, (5 year CMT + 5.130%),
8.63%(b)(c) | | | 305,822 | | | | 6,514,009 | |
Franklin BSP Realty Trust, Inc., Series E, 7.50%, NVS(c)(d) | | | 774,620 | | | | 14,981,151 | |
Granite Point Mortgage Trust, Inc., Series A, | | | | | | | | |
(SOFR + 5.830%), 7.00%, NVS(b)(c) | | | 617,180 | | | | 10,183,470 | |
Great Ajax Corp., 7.25%, NVS(a)(d) | | | 353,068 | | | | 8,540,715 | |
Invesco Mortgage Capital, Inc. | | | | | | | | |
Series B, (3-mo. USD LIBOR + 5.180%), 7.75%, NVS(b)(c) | | | 343,204 | | | | 6,901,832 | |
Series C, (3-mo. USD LIBOR + 5.289%), 7.50%, NVS(b)(c) | | | 592,904 | | | | 10,737,491 | |
KKR Real Estate Finance Trust, Inc., Series A, 6.50%, NVS(c) | | | 991,643 | | | | 15,836,539 | |
MFA Financial, Inc. | | | | | | | | |
Series B, 7.50%, NVS(c) | | | 606,914 | | | | 11,677,025 | |
Series C, (3-mo. USD LIBOR + 5.345%), 6.50%, NVS(b)(c) | | | 832,425 | | | | 14,184,522 | |
| | |
| 12 | | 2 0 2 3 I S H A R E S A N N U A L R E P O R T T O S H A R E H O L D E R S |
| | |
Schedule of Investments (continued) March 31, 2023 | | iShares® Preferred and Income Securities ETF (Percentages shown are based on Net Assets) |
| | | | | | | | |
| Security | | Shares | | | Value | |
|
| Mortgage Real Estate Investment Trusts (REITs) (continued) | |
New York Mortgage Trust, Inc. | | | | | | | | |
Series D, (3-mo. USD LIBOR + 5.695%), 8.00%, NVS(b)(c) | | | 459,236 | | | $ | 8,913,771 | |
Series E, (3-mo. USD LIBOR + 6.429%), 7.88%, NVS(b)(c) | | | 555,805 | | | | 11,360,654 | |
Series F, (SOFR + 6.130%), 6.88%,
NVS(b)(c) | | | 434,887 | | | | 7,571,383 | |
PennyMac Mortgage Investment Trust | | | | | | | | |
Series A, (3-mo. USD LIBOR + 5.831%), 8.13%, NVS(b)(c)(d) | | | 347,932 | | | | 8,291,220 | |
Series B, (3-mo. USD LIBOR + 5.990%), 8.00%, NVS(b)(c) | | | 584,942 | | | | 13,453,666 | |
Series C, 6.75%, NVS(c) | | | 749,920 | | | | 13,873,520 | |
Ready Capital Corp.
7.00%(a) | | | 350,084 | | | | 8,741,598 | |
6.20% | | | 315,391 | | | | 7,443,228 | |
5.75% | | | 609,335 | | | | 14,106,105 | |
Series E, 6.50%, NVS(c) | | | 347,932 | | | | 6,415,866 | |
Rithm Capital Corp. | | | | | | | | |
Series A, (3-mo. USD LIBOR + 5.802%), 7.50%, NVS(b)(c) | | | 471,915 | | | | 10,457,636 | |
Series B, (3-mo. USD LIBOR + 5.640%), 7.13%(b)(c) | | | 854,699 | | | | 18,410,216 | |
Series C, (3-mo. USD LIBOR + 4.969%), 6.38%, NVS(b)(c) | | | 1,204,771 | | | | 22,794,267 | |
Series D, (5 year CMT + 6.223%), 7.00%, NVS(b)(c) | | | 1,406,861 | | | | 27,715,162 | |
TPG RE Finance Trust, Inc., Series C, 6.25%, NVS(c)(d) | | | 610,672 | | | | 10,601,266 | |
Two Harbors Investment Corp. | | | | | | | | |
Series A, (3-mo. USD LIBOR + 5.660%), 8.13%, NVS(b)(c) | | | 431,226 | | | | 9,336,043 | |
Series B, (3-mo. USD LIBOR + 5.352%), 7.63%, NVS(b)(c) | | | 869,832 | | | | 17,727,176 | |
Series C, (3-mo. USD LIBOR + 5.011%), 7.25%, NVS(b)(c)(d) | | | 892,519 | | | | 18,519,769 | |
| | | | | | | | |
| | |
| | | | | | | 689,211,129 | |
| | |
| Multi-Utilities — 3.3% | | | | | | |
Algonquin Power & Utilities Corp.
7.75%(a) | | | 1,739,636 | | | | 51,962,927 | |
(3-mo. USD LIBOR + 3.677%), 6.88%(b) | | | 869,757 | | | | 19,969,621 | |
Series 19-A, (3-mo. USD LIBOR + 4.010%), 6.20%, NVS(b) | | | 1,058,938 | | | | 24,588,540 | |
Brookfield Infrastructure Partners LP | | | | | | | | |
Series 13, 5.13%, NVS(c) | | | 607,030 | | | | 11,357,531 | |
Series 14, 5.00%, NVS(c) | | | 607,313 | | | | 11,283,876 | |
CMS Energy Corp.
5.88% | | | 1,906,056 | | | | 46,298,100 | |
5.88%, NVS | | | 847,116 | | | | 20,440,909 | |
5.63% | | | 605,304 | | | | 14,678,622 | |
Series C, 4.20%, NVS(c) | | | 696,424 | | | | 13,824,016 | |
DTE Energy Co.
4.38%(d) | | | 847,116 | | | | 16,815,253 | |
Series E, 5.25%(d) | | | 1,210,191 | | | | 27,870,699 | |
Series G, 4.38% | | | 696,288 | | | | 14,886,638 | |
NiSource, Inc.
7.75%(a) | | | 652,363 | | | | 68,145,839 | |
Series B, (5 year CMT + 3.632%),
6.50%(b)(c) | | | 1,512,791 | | | | 36,306,984 | |
Sempra Energy, 5.75% | | | 2,291,808 | | | | 56,699,330 | |
| | | | | | | | |
| | |
| | | | | | | 435,128,885 | |
| | |
| Office REITs — 0.8% | | | | | | |
Brookfield DTLA Fund Office Trust Investor, Inc., Series A, 7.63%(c) | | | 747,534 | | | | 1,315,660 | |
| | | | | | | | |
| Security | | Shares | | | Value | |
| | |
| Office REITs (continued) | | | | | | |
City Office REIT, Inc., Series A, 6.63%, NVS(c) | | | 344,925 | | | $ | 6,094,825 | |
Equity Commonwealth, Series D, 6.50%,
NVS(a)(c) | | | 374,309 | | | | 9,353,982 | |
Hudson Pacific Properties, Inc., Series C, 4.75%, NVS(c) | | | 1,285,856 | | | | 12,858,560 | |
Office Properties Income Trust, 6.38% | | | 485,926 | | | | 8,294,757 | |
SL Green Realty Corp., Series I, 6.50%, NVS(c) | | | 687,163 | | | | 12,801,847 | |
Vornado Realty Trust | | | | | | | | |
Series L, 5.40%, NVS(c) | | | 909,967 | | | | 12,721,338 | |
Series M, 5.25%, NVS(c)(d) | | | 968,341 | | | | 13,091,970 | |
Series N, 5.25%, NVS(c) | | | 910,945 | | | | 11,842,285 | |
Series O, 4.45%, NVS(c) | | | 915,205 | | | | 10,424,185 | |
| | | | | | | | |
| | |
| | | | | | | 98,799,409 | |
| | |
| Oil, Gas & Consumable Fuels — 2.6% | | | | | | |
DCP Midstream LP | | | | | | | | |
Series B, (3-mo. USD LIBOR + 4.919%), 7.88%, NVS(b)(c) | | | 488,831 | | | | 12,259,881 | |
Series C, (3-mo. USD LIBOR + 4.882%), 7.95%, NVS(b)(c) | | | 335,102 | | | | 8,404,358 | |
El Paso Energy Capital Trust I, 4.75%(a) | | | 334,335 | | | | 15,369,380 | |
Enbridge, Inc., Series B, (3-mo. USD LIBOR + 3.593%), 6.38%(b) | | | 1,815,298 | | | | 46,090,416 | |
Energy Transfer LP | | | | | | | | |
Series C, (3-mo. USD LIBOR + 4.530%), 7.38%, NVS(b)(c) | | | 1,361,449 | | | | 32,633,933 | |
Series D, (3-mo. USD LIBOR + 4.738%), 7.63%, NVS(b)(c) | | | 1,346,373 | | | | 31,410,882 | |
Series E, (3-mo. USD LIBOR + 5.161%), 7.60%, NVS(b)(c) | | | 2,414,532 | | | | 58,383,384 | |
NGL Energy Partners LP, Series B, (3-mo. USD LIBOR + 7.213%), 12.47%, NVS(b)(c) | | | 951,947 | | | | 20,800,042 | |
NuStar Energy LP | | | | | | | | |
Series A, (3-mo. USD LIBOR + 6.766%), 12.02%, NVS(b)(c) | | | 685,262 | | | | 15,939,194 | |
Series B, (3-mo. USD LIBOR + 5.643%), 10.90%, NVS(b)(c) | | | 1,162,330 | | | | 27,721,571 | |
Series C, (3-mo. USD LIBOR + 6.880%), 11.75%, NVS(b)(c) | | | 521,345 | | | | 14,780,131 | |
NuStar Logistics LP, (3-mo. USD LIBOR + 6.734%), 11.53%(b) | | | 1,217,864 | | | | 30,811,959 | |
Seapeak LLC | | | | | | | | |
9.00%, NVS(c) | | | 376,732 | | | | 9,067,939 | |
Series B, (3-mo. USD LIBOR + 6.241%), 8.50%, NVS(b)(c) | | | 514,587 | | | | 12,514,756 | |
| | | | | | | | |
| | |
| | | | | | | 336,187,826 | |
| | |
| Professional Services — 0.3% | | | | | | |
Clarivate PLC, Series A, 5.25%(a) | | | 1,087,272 | | | | 44,654,261 | |
| | | | | | | | |
|
| Real Estate Management & Development — 0.9% | |
Brookfield Property Partners LP | | | | | | | | |
Series A, 5.75%, NVS(c) | | | 871,726 | | | | 10,852,989 | |
Series A-1, 6.50%, NVS(c) | | | 559,616 | | | | 8,903,491 | |
Series A2, 6.38%, NVS(c) | | | 753,281 | | | | 11,359,478 | |
Brookfield Property Preferred LP, 6.25% | | | 2,030,495 | | | | 32,894,019 | |
DigitalBridge Group, Inc. | | | | | | | | |
Series H, 7.13%, NVS(c) | | | 640,193 | | | | 12,035,628 | |
Series I, 7.15%, NVS(c) | | | 982,491 | | | | 18,844,177 | |
Series J, 7.13%, NVS(c) | | | 884,235 | | | | 16,605,933 | |
| | | | | | | | |
| | |
| | | | | | | 111,495,715 | |
| | |
| Residential REITs — 0.2% | | | | | | |
American Homes 4 Rent | | | | | | | | |
Series G, 5.88%, NVS(c) | | | 350,751 | | | | 8,246,156 | |
| | |
S C H E D U L E O F I N V E S T M E N T S | | 13 |
| | |
Schedule of Investments (continued) March 31, 2023 | | iShares® Preferred and Income Securities ETF (Percentages shown are based on Net Assets) |
| | | | | | | | |
| Security | | Shares | | | Value | |
| | |
| Residential REITs (continued) | | | | | | |
American Homes 4 Rent | | | | | | | | |
Series H, 6.25%, NVS(c) | | | 351,818 | | | $ | 8,545,659 | |
UMH Properties, Inc., Series D, 6.38%,
NVS(c)(d) | | | 689,954 | | | | 15,096,194 | |
| | | | | | | | |
| | |
| | | | | | | 31,888,009 | |
| | |
| Retail REITs — 0.9% | | | | | | |
Agree Realty Corp., Series A, 4.25%,
NVS(c)(d) | | | 532,297 | | | | 9,368,427 | |
Cedar Realty Trust, Inc., Series C, 6.50%, NVS(c) | | | 387,054 | | | | 4,559,496 | |
Federal Realty Investment Trust, Series C, 5.00%, NVS(c)(d) | | | 456,117 | | | | 9,701,608 | |
Kimco Realty Corp. | | | | | | | | |
Series L, 5.13%, NVS(c) | | | 677,232 | | | | 13,294,064 | |
Series M, 5.25%, NVS(c) | | | 793,325 | | | | 16,104,497 | |
Necessity Retail REIT, Inc., Series A, 7.50%, NVS(c) | | | 601,038 | | | | 12,621,798 | |
Saul Centers, Inc., Series E, 6.00%, NVS(c) | | | 336,964 | | | | 7,463,753 | |
SITE Centers Corp., Series A, 6.38%, NVS(c) | | | 530,640 | | | | 12,438,202 | |
Spirit Realty Capital, Inc., Series A, 6.00%, NVS(c) | | | 523,097 | | | | 12,094,003 | |
Urstadt Biddle Properties, Inc. | | | | | | | | |
Series H, 6.25%, NVS(c) | | | 335,703 | | | | 7,298,183 | |
Series K, 5.88%, NVS(c) | | | 321,632 | | | | 6,651,350 | |
| | | | | | | | |
| | |
| | | | | | | 111,595,381 | |
| | |
| Software — 0.0% | | | | | | |
Synchronoss Technologies, Inc., 8.38% | | | 382,766 | | | | 6,633,335 | |
| | | | | | | | |
| | |
| Specialized REITs — 2.7% | | | | | | |
CorEnergy Infrastructure Trust, Inc., Series A, 7.38%, NVS(c) | | | 403,077 | | | | 2,982,770 | |
Digital Realty Trust, Inc. | | | | | | | | |
Series J, 5.25%, NVS(c)(d) | | | 606,047 | | | | 13,023,950 | |
Series K, 5.85%, NVS(c) | | | 635,474 | | | | 14,749,352 | |
Series L, 5.20%, NVS(c) | | | 1,043,773 | | | | 22,441,119 | |
EPR Properties, Series G, 5.75%, NVS(c) | | | 458,427 | | | | 7,674,068 | |
Gladstone Land Corp., Series B, 6.00%(c)(d) | | | 452,158 | | | | 10,512,673 | |
National Storage Affiliates Trust, Series A, 6.00%, NVS(c) | | | 682,053 | | | | 15,694,040 | |
Public Storage | | | | | | | | |
Series F, 5.15%, NVS(c) | | | 847,116 | | | | 20,305,371 | |
Series G, 5.05%, NVS(c)(d) | | | 907,685 | | | | 21,375,982 | |
Series H, 5.60%(c)(d) | | | 862,281 | | | | 21,945,051 | |
Series I, 4.88%, NVS(c)(d) | | | 956,818 | | | | 20,858,632 | |
Series J, 4.70%, NVS(c) | | | 782,817 | | | | 16,885,363 | |
Series K, 4.75%, NVS(c) | | | 695,875 | | | | 15,142,240 | |
Series L, 4.63%, NVS(c) | | | 1,709,377 | | | | 35,725,979 | |
Series M, 4.13%, NVS(c)(d) | | | 696,774 | | | | 12,932,125 | |
Series N, 3.88%, NVS(c)(d) | | | 854,699 | | | | 15,555,522 | |
Series O, 3.90%, NVS(c) | | | 517,136 | | | | 9,427,389 | |
Series P, 4.00%, NVS(c) | | | 1,826,660 | | | | 33,738,410 | |
Series Q, 3.95%, NVS(c) | | | 440,163 | | | | 7,962,549 | |
Series R, 4.00%, NVS(c) | | | 1,316,112 | | | | 24,348,072 | |
Series S, 4.10%, NVS(c)(d) | | | 756,761 | | | | 14,007,646 | |
| | | | | | | | |
| | |
| | | | | | | 357,288,303 | |
| | |
| Specialty Retail — 0.3% | | | | | | |
Franchise Group, Inc., Series A, 7.50%, NVS(c) | | | 347,295 | | | | 7,821,084 | |
TravelCenters of America, Inc.
8.25% | | | 334,989 | | | | 8,424,973 | |
8.00% | | | 364,968 | | | | 9,332,232 | |
8.00% | | | 305,822 | | | | 7,691,423 | |
| | | | | | | | |
| | |
| | | | | | | 33,269,712 | |
| | |
| Textiles, Apparel & Luxury Goods — 0.1% | | | | | | |
Fossil Group, Inc., 7.00% | | | 457,361 | | | | 8,259,940 | |
| | | | | | | | |
| | | | | | | | |
| Security | | Shares | | | Value | |
|
| Trading Companies & Distributors — 1.1% | |
Air Lease Corp., Series A, (3-mo. USD LIBOR + 3.650%), 6.15%, NVS(b)(c)(d) | | | 756,360 | | | $ | 15,626,398 | |
FTAI Aviation Ltd. | | | | | | | | |
Series A, NVS, (3-mo. USD LIBOR + 6.886%), 8.25%(b)(c) | | | 316,690 | | | | 7,511,887 | |
Series B, NVS, (3-mo. USD LIBOR + 6.447%), 8.00%(b)(c) | | | 373,946 | | | | 8,458,658 | |
Series C, NVS, (5 year CMT + 7.378%), 8.25%(b)(c) | | | 319,542 | | | | 7,442,133 | |
Textainer Group Holdings Ltd. | | | | | | | | |
(5 year CMT + 6.134%), 7.00%, NVS(b)(c) | | | 455,314 | | | | 11,018,599 | |
Series B, 6.25%, NVS(c) | | | 456,463 | | | | 9,503,560 | |
Triton International Ltd.
8.00%, NVS(c) | | | 436,523 | | | | 10,825,770 | |
7.38%, NVS(c) | | | 530,416 | | | | 12,348,084 | |
6.88%, NVS(c)(d) | | | 455,793 | | | | 9,749,412 | |
Series E, 5.75%, NVS(c) | | | 529,446 | | | | 11,308,967 | |
WESCO International, Inc., Series A, (5 year CMT + 10.325%), 10.63%, NVS(b)(c) | | | 1,634,642 | | | | 44,315,145 | |
| | | | | | | | |
| | |
| | | | | | | 148,108,613 | |
| | |
| Transportation Infrastructure — 0.3% | | | | | | |
Atlas Corp. | | | | | | | | |
Series D, 7.95%(c) | | | 387,518 | | | | 9,133,799 | |
Series H, 7.88%, NVS(c) | | | 682,624 | | | | 15,256,647 | |
Series I, (3-mo. USD LIBOR + 5.008%), 8.00%(b)(c) | | | 455,230 | | | | 11,144,030 | |
| | | | | | | | |
| | |
| | | | | | | 35,534,476 | |
| |
| Wireless Telecommunication Services — 1.0% | | | | |
Telephone & Data Systems, Inc. | | | | | | | | |
Series UU, 6.63%, NVS(c)(d) | | | 1,270,711 | | | | 18,056,803 | |
Series VV, 6.00%, NVS(c) | | | 2,087,638 | | | | 29,247,809 | |
United States Cellular Corp.
6.25% | | | 1,512,791 | | | | 29,060,715 | |
5.50% | | | 1,512,791 | | | | 25,414,889 | |
5.50% | | | 1,512,791 | | | | 25,823,342 | |
| | | | | | | | |
| | |
| | | | | | | 127,603,558 | |
| | | | | | | | |
| | |
Total Long-Term Investments — 98.8%
(Cost: $15,453,358,302) | | | | | | | 12,822,107,436 | |
| | | | | | | | |
| | |
| 14 | | 2 0 2 3 I S H A R E S A N N U A L R E P O R T T O S H A R E H O L D E R S |
| | |
Schedule of Investments (continued) March 31, 2023 | | iShares® Preferred and Income Securities ETF (Percentages shown are based on Net Assets) |
| | | | | | | | |
| Security | | Shares | | | Value | |
| | |
| Short-Term Securities | | | | | | |
| | |
Money Market Funds — 3.1% | | | | | | | | |
BlackRock Cash Funds: Institutional, SL Agency Shares, 5.01%(e)(f)(g) | | | 175,052,647 | | | $ | 175,105,163 | |
BlackRock Cash Funds: Treasury, SL Agency Shares, 4.73%(e)(f) | | | 231,214,441 | | | | 231,214,441 | |
| | | | | | | | |
| |
Total Short-Term Securities — 3.1%
(Cost: $406,234,362) | | | | 406,319,604 | |
| | | | | | | | |
| |
Total Investments — 101.9%
(Cost: $15,859,592,664) | | | | 13,228,427,040 | |
| |
Liabilities in Excess of Other Assets — (1.9)% | | | | (246,458,175 | ) |
| | | | | | | | |
| | |
Net Assets — 100.0% | | | | | | $ | 12,981,968,865 | |
| | | | | | | | |
| (a) | Convertible security. |
| (b) | Variable rate security. Interest rate resets periodically. The rate shown is the effective interest rate as of period end. Security description also includes the reference rate and spread if published and available. |
| (c) | Perpetual security with no stated maturity date. |
| (d) | All or a portion of this security is on loan. |
| (e) | Affiliate of the Fund. |
| (f) | Annualized 7-day yield as of period end. |
| (g) | All or a portion of this security was purchased with the cash collateral from loaned securities. |
Affiliates
Investments in issuers considered to be affiliate(s) of the Fund during the year ended March 31, 2023 for purposes of Section 2(a)(3) of the Investment Company Act of 1940, as amended, were as follows:
| | | | | | | | | | | | | | | | | | | | | | | | | | | | | | | | | | | | | | | | | | |
| | | | | | | | | | | |
| | | Affiliated Issuer | | Value at 03/31/22 | | | Purchases at Cost | | | Proceeds from Sale | | | Net Realized Gain (Loss) | | | Change in Unrealized Appreciation (Depreciation) | | | Value at 03/31/23 | | | Shares Held at 03/31/23 | | | Income | | | Capital Gain Distributions from Underlying Funds | | | | |
| | BlackRock Cash Funds: Institutional, SL Agency Shares | | $ | 275,720,624 | | | $ | — | | | | $ (100,791,979 | )(a) | | $ | 21,896 | | | $ | 154,622 | | | $ | 175,105,163 | | | | 175,052,647 | | | $ | 3,820,403 | (b) | | $ | — | | | | | |
| | BlackRock Cash Funds: Treasury, SL Agency Shares | | | 190,910,000 | | | | 40,304,441 | (a) | | | — | | | | — | | | | — | | | | 231,214,441 | | | | 231,214,441 | | | | 2,693,104 | | | | 55 | | | | | |
| | | | | | | | | | | | | | | | | | | | | | | | | | | | | | | | | | | | | | | | | | |
| | | | | | | | | | | |
| | | | | | | | | | | | | | | | $ | 21,896 | | | $ | 154,622 | | | $ | 406,319,604 | | | | | | | $ | 6,513,507 | | | $ | 55 | | | | | |
| | | | | | | | | | | | | | | | | | | | | | | | | | | | | | | | | | | | | | | | | | |
| | (a) | Represents net amount purchased (sold). | |
| | (b) | All or a portion represents securities lending income earned from the reinvestment of cash collateral from loaned securities, net of fees and collateral investment expenses, and other payments to and from borrowers of securities. | |
| | |
S C H E D U L E O F I N V E S T M E N T S | | 15 |
| | |
Schedule of Investments (continued) March 31, 2023 | | iShares® Preferred and Income Securities ETF |
Fair Value Hierarchy as of Period End
Various inputs are used in determining the fair value of financial instruments. For a description of the input levels and information about the Fund’s policy regarding valuation of financial instruments, refer to the Notes to Financial Statements.
The following table summarizes the Fund’s financial instruments categorized in the fair value hierarchy. The breakdown of the Fund’s financial instruments into major categories is disclosed in the Schedule of Investments above.
| | | | | | | | | | | | | | | | |
| | | Level 1 | | | Level 2 | | | Level 3 | | | Total | |
Assets | | | | | | | | | | | | | | | | |
Investments | | | | | | | | | | | | | | | | |
Long-Term Investments | | | | | | | | | | | | | | | | |
Preferred Securities | | | | | | | | | | | | | | | | |
Preferred Stocks | | $ | 12,648,885,813 | | | $ | 173,221,623 | | | $ | — | | | $ | 12,822,107,436 | |
Short-Term Securities | | | | | | | | | | | | | | | | |
Money Market Funds | | | 406,319,604 | | | | — | | | | — | | | | 406,319,604 | |
| | | | | | | | | | | | | | | | |
| | $ | 13,055,205,417 | | | $ | 173,221,623 | | | $ | — | | | $ | 13,228,427,040 | |
| | | | | | | | | | | | | | | | |
See notes to financial statements.
| | |
| 16 | | 2 0 2 3 I S H A R E S A N N U A L R E P O R T T O S H A R E H O L D E R S |
Statement of Assets and Liabilities
March 31, 2023
| | | | |
| | | iShares
Preferred and
Income Securities
ETF | |
| |
ASSETS | | | | |
Investments, at value — unaffiliated(a)(b) | | $ | 12,822,107,436 | |
Investments, at value — affiliated(c) | | | 406,319,604 | |
Cash | | | 391,323 | |
Receivables: | | | | |
Investments sold | | | 81,140,469 | |
Securities lending income — affiliated | | | 232,684 | |
Capital shares sold | | | 34,320,962 | |
Dividends — unaffiliated | | | 45,737,434 | |
Dividends — affiliated | | | 523,952 | |
| | | | |
| |
Total assets | | | 13,390,773,864 | |
| | | | |
| |
LIABILITIES | | | | |
Collateral on securities loaned | | | 174,977,132 | |
Payables: | | | | |
Investments purchased | | | 225,700,938 | |
Capital shares redeemed | | | 3,089,986 | |
Investment advisory fees | | | 5,036,943 | |
| | | | |
| |
Total liabilities | | | 408,804,999 | |
| | | | |
| |
NET ASSETS | | $ | 12,981,968,865 | |
| | | | |
| |
NET ASSETS CONSIST OF: | | | | |
Paid-in capital | | $ | 17,531,749,265 | |
Accumulated loss | | | (4,549,780,400 | ) |
| | | | |
| |
NET ASSETS | | $ | 12,981,968,865 | |
| | | | |
| |
NET ASSET VALUE | | | | |
| |
Shares outstanding | | | 416,300,000 | |
| | | | |
| |
Net asset value | | $ | 31.18 | |
| | | | |
| |
Shares authorized | | | Unlimited | |
| | | | |
| |
Par value | | | None | |
| | | | |
| |
(a) Investments, at cost — unaffiliated | | $ | 15,453,358,302 | |
(b) Securities loaned, at value | | $ | 171,053,209 | |
(c) Investments, at cost — affiliated | | $ | 406,234,362 | |
See notes to financial statements.
| | |
F I N A N C I A L S T A T E M E N T S | | 17 |
Statement of Operations
Year Ended March 31, 2023
| | | | |
| | | iShares Preferred and
Income Securities
ETF | |
| |
INVESTMENT INCOME | | | | |
Dividends — unaffiliated | | $ | 913,775,841 | |
Dividends — affiliated | | | 2,693,104 | |
Securities lending income — affiliated — net | | | 3,820,403 | |
Foreign taxes withheld | | | (1,260,997 | ) |
| | | | |
| |
Total investment income | | | 919,028,351 | |
| | | | |
| |
EXPENSES | | | | |
Investment advisory | | | 67,252,112 | |
| | | | |
| |
Total expenses | | | 67,252,112 | |
| | | | |
| |
Net investment income | | | 851,776,239 | |
| | | | |
| |
REALIZED AND UNREALIZED GAIN (LOSS) | | | | |
Net realized gain (loss) from: | | | | |
Investments — unaffiliated | | | (150,884,797 | ) |
Investments — affiliated | | | 21,896 | |
Capital gain distributions from underlying funds — affiliated | | | 55 | |
In-kind redemptions — unaffiliated | | | (98,544,993 | ) |
| | | | |
| |
| | | (249,407,839 | ) |
| | | | |
Net change in unrealized appreciation (depreciation) on: | | | | |
Investments — unaffiliated | | | (2,167,369,030 | ) |
Investments — affiliated | | | 154,622 | |
| | | | |
| |
| | | (2,167,214,408 | ) |
| | | | |
| |
Net realized and unrealized loss | | | (2,416,622,247 | ) |
| | | | |
| |
NET DECREASE IN NET ASSETS RESULTING FROM OPERATIONS | | $ | (1,564,846,008 | ) |
| | | | |
See notes to financial statements.
| | |
| 18 | | 2 0 2 3 B L A C K R O C K A N N U A L R E P O R T T O S H A R E H O L D E R S |
Statements of Changes in Net Assets
| | | | | | | | |
| | | iShares Preferred and Income Securities ETF | |
| | |
| | | Year Ended
03/31/23 | | | Year Ended
03/31/22 | |
| | |
INCREASE (DECREASE) IN NET ASSETS | | | | | | | | |
| | |
OPERATIONS | | | | | | | | |
Net investment income | | $ | 851,776,239 | | | $ | 888,159,729 | |
Net realized gain (loss) | | | (249,407,839 | ) | | | 122,946,775 | |
Net change in unrealized appreciation (depreciation) | | | (2,167,214,408 | ) | | | (1,182,583,024 | ) |
| | | | | | | | |
| | |
Net decrease in net assets resulting from operations | | | (1,564,846,008 | ) | | | (171,476,520 | ) |
| | | | | | | | |
| | |
DISTRIBUTIONS TO SHAREHOLDERS(a) | | | | | | | | |
Decrease in net assets resulting from distributions to shareholders | | | (887,370,473 | ) | | | (853,841,960 | ) |
| | | | | | | | |
| | |
CAPITAL SHARE TRANSACTIONS | | | | | | | | |
Net increase (decrease) in net assets derived from capital share transactions | | | (2,277,562,637 | ) | | | 372,726,191 | |
| | | | | | | | |
| | |
NET ASSETS | | | | | | | | |
Total decrease in net assets | | | (4,729,779,118 | ) | | | (652,592,289 | ) |
Beginning of year | | | 17,711,747,983 | | | | 18,364,340,272 | |
| | | | | | | | |
| | |
End of year | | $ | 12,981,968,865 | | | $ | 17,711,747,983 | |
| | | | | | | | |
| (a) | Distributions for annual periods determined in accordance with U.S. federal income tax regulations. |
See notes to financial statements.
| | |
F I N A N C I A L S T A T E M E N T S | | 19 |
Financial Highlights
(For a share outstanding throughout each period)
| | | | | | | | | | | | | | | | | | | | |
| | | iShares Preferred and Income Securities ETF | |
| | | | |
| | | | | |
| | | Year Ended
03/31/23 | | | Year Ended
03/31/22 | | | Year Ended
03/31/21 | | | Year Ended
03/31/20 | | | Year Ended
03/31/19 | |
| |
| | | | | |
Net asset value, beginning of year | | $ | 36.39 | | | $ | 38.27 | | | $ | 31.50 | | | $ | 36.47 | | | $ | 37.54 | |
| | | | | | | | | | | | | | | | | | | | |
| | | | | |
Net investment income(a) | | | 1.90 | | | | 1.75 | | | | 1.81 | | | | 1.93 | | | | 2.10 | |
Net realized and unrealized gain (loss)(b) | | | (5.13 | ) | | | (1.94 | ) | | | 6.78 | | | | (4.93 | ) | | | (1.02 | ) |
| | | | | | | | | | | | | | | | | | | | |
| | | | | |
Net increase (decrease) from investment operations | | | (3.23 | ) | | | (0.19 | ) | | | 8.59 | | | | (3.00 | ) | | | 1.08 | |
| | | | | | | | | | | | | | | | | | | | |
| | | | | |
Distributions from net investment income(c) | | | (1.98 | ) | | | (1.69 | ) | | | (1.82 | ) | | | (1.97 | ) | | | (2.15 | ) |
| | | | | | | | | | | | | | | | | | | | |
| | | | | |
Net asset value, end of year | | $ | 31.18 | | | $ | 36.39 | | | $ | 38.27 | | | $ | 31.50 | | | $ | 36.47 | |
| | | | | | | | | | | | | | | | | | | | |
| | | | | |
Total Return(d) | | | | | | | | | | | | | | | | | | | | |
Based on net asset value | | | (8.99 | )% | | | (0.67 | )% | | | 27.88 | % | | | (8.90 | )% | | | 3.01 | % |
| | | | | | | | | | | | | | | | | | | | |
| | | | | |
Ratios to Average Net Assets(e) | | | | | | | | | | | | | | | | | | | | |
Total expenses | | | 0.46 | % | | | 0.45 | % | | | 0.46 | % | | | 0.46 | % | | | 0.46 | % |
| | | | | | | | | | | | | | | | | | | | |
| | | | | |
Net investment income | | | 5.80 | % | | | 4.56 | % | | | 4.97 | % | | | 5.25 | % | | | 5.73 | % |
| | | | | | | | | | | | | | | | | | | | |
| | | | | |
Supplemental Data | | | | | | | | | | | | | | | | | | | | |
Net assets, end of year (000) | | $ | 12,981,969 | | | $ | 17,711,748 | | | $ | 18,364,340 | | | $ | 13,816,631 | | | $ | 14,370,721 | |
| | | | | | | | | | | | | | | | | | | | |
| | | | | |
Portfolio turnover rate(f) | | | 16 | % | | | 21 | % | | | 28 | % | | | 46 | % | | | 28 | % |
| | | | | | | | | | | | | | | | | | | | |
| (a) | Based on average shares outstanding. |
| (b) | The amounts reported for a share outstanding may not accord with the change in aggregate gains and losses in securities for the fiscal period due to the timing of capital share transactions in relation to the fluctuating market values of the Fund’s underlying securities. |
| (c) | Distributions for annual periods determined in accordance with U.S. federal income tax regulations. |
| (d) | Where applicable, assumes the reinvestment of distributions. |
| (e) | Excludes fees and expenses incurred indirectly as a result of investments in underlying funds. |
| (f) | Portfolio turnover rate excludes in-kind transactions. |
See notes to financial statements.
| | |
| 20 | | 2 0 2 3 I S H A R E S A N N U A L R E P O R T T O S H A R E H O L D E R S |
Notes to Financial Statements
iShares Trust (the “Trust”) is registered under the Investment Company Act of 1940, as amended (the “1940 Act”), as an open-end management investment company. The Trust is organized as a Delaware statutory trust and is authorized to have multiple series or portfolios.
These financial statements relate only to the following fund (the “Fund”):
| | | | |
| | |
| iShares ETF | | Diversification
Classification | |
| |
Preferred and Income Securities | | | Diversified | |
| 2. | SIGNIFICANT ACCOUNTING POLICIES |
The financial statements are prepared in conformity with accounting principles generally accepted in the United States of America (“U.S. GAAP”), which may require management to make estimates and assumptions that affect the reported amounts of assets and liabilities in the financial statements, disclosure of contingent assets and liabilities at the date of the financial statements and the reported amounts of increases and decreases in net assets from operations during the reporting period. Actual results could differ from those estimates. The Fund is considered an investment company under U.S. GAAP and follows the accounting and reporting guidance applicable to investment companies. Below is a summary of significant accounting policies:
Investment Transactions and Income Recognition: For financial reporting purposes, investment transactions are recorded on the dates the transactions are executed. Realized gains and losses on investment transactions are determined using the specific identification method. Dividend income and capital gain distributions, if any, are recorded on the ex-dividend date. Non-cash dividends, if any, are recorded on the ex-dividend date at fair value. Upon notification from issuers or as estimated by management, a portion of the dividend income received from a real estate investment trust may be redesignated as a reduction of cost of the related investment and/or realized gain.
Foreign Taxes: The Fund may be subject to foreign taxes (a portion of which may be reclaimable) on income, stock dividends, capital gains on investments, or certain foreign currency transactions. All foreign taxes are recorded in accordance with the applicable foreign tax regulations and rates that exist in the foreign jurisdictions in which the Fund invests. These foreign taxes, if any, are paid by the Fund and are reflected in its Statement of Operations as follows: foreign taxes withheld at source are presented as a reduction of income, foreign taxes on securities lending income are presented as a reduction of securities lending income, foreign taxes on stock dividend are presented as “Other foreign taxes”, and foreign taxes on capital gains from sales of investments and foreign taxes on foreign currency transactions are included in their respective net realized gain (loss) categories. Foreign taxes payable or deferred as of March 31, 2023, if any, are disclosed in the Statement of Assets and Liabilities.
The Fund files withholding tax reclaims in certain jurisdictions to recover a portion of amounts previously withheld. The Fund may record a reclaim receivable based on collectability, which includes factors such as the jurisdiction’s applicable tax laws, payment history and market convention. The Statement of Operations include tax reclaims recorded as well as professional and other fees, if any, associated with recovery of foreign withholding taxes.
Collateralization: If required by an exchange or counterparty agreement, the Fund may be required to deliver/deposit cash and/or securities to/with an exchange, or broker-dealer or custodian as collateral for certain investments.
In-kind Redemptions: For financial reporting purposes, in-kind redemptions are treated as sales of securities resulting in realized capital gains and losses to the Fund. Because such gains or losses are not taxable to the Fund and are not distributed to existing Fund shareholders, the gains or losses are reclassified from accumulated net realized gain (loss) to paid-in capital at the end of the Fund’s tax year. These reclassifications have no effect on net assets or net asset value (“NAV”) per share.
Distributions: Dividends and distributions paid by the Fund are recorded on the ex-dividend dates. Distributions are determined on a tax basis and may differ from net investment income and net realized capital gains for financial reporting purposes. Dividend and distributions are paid in U.S. dollars and cannot be automatically reinvested in additional shares of the Fund. The character and timing of distributions are determined in accordance with U.S. federal income tax regulations, which may differ from U.S. GAAP.
Indemnifications: In the normal course of business, the Fund enters into contracts that contain a variety of representations that provide general indemnification. The Fund’s maximum exposure under these arrangements is unknown because it involves future potential claims against the Fund, which cannot be predicted with any certainty.
| 3. | INVESTMENT VALUATION AND FAIR VALUE MEASUREMENTS |
Investment Valuation Policies: The Fund’s investments are valued at fair value (also referred to as “market value” within the financial statements) each day that the Fund’s listing exchange is open and, for financial reporting purposes, as of the report date. U.S. GAAP defines fair value as the price a fund would receive to sell an asset or pay to transfer a liability in an orderly transaction between market participants at the measurement date. The Board of Trustees of the Trust (the “Board”) of the Fund has approved the designation of BlackRock Fund Advisors (“BFA”), the Fund’s investment adviser, as the valuation designee for the Fund. The Fund determines the fair values of its financial instruments using various independent dealers or pricing services under BFA’s policies. If a security’s market price is not readily available or does not otherwise accurately represent the fair value of the security, the security will be valued in accordance with BFA’s policies and procedures as reflecting fair value. BFA has formed a committee (the “Valuation Committee”) to develop pricing policies and procedures and to oversee the pricing function for all financial instruments, with assistance from other BlackRock pricing committees.
| | |
N O T E S T O F I N A N C I A L S T A T E M E N T S | | 21 |
Notes to Financial Statements (continued)
Fair Value Inputs and Methodologies: The following methods and inputs are used to establish the fair value of the Fund’s assets and liabilities:
| | • | | Equity investments traded on a recognized securities exchange are valued at that day’s official closing price, as applicable, on the exchange where the stock is primarily traded. Equity investments traded on a recognized exchange for which there were no sales on that day are valued at the last traded price. |
| | • | | Investments in open-end U.S. mutual funds (including money market funds) are valued at that day’s published NAV. |
If events (e.g., market volatility, company announcement or a natural disaster) occur that are expected to materially affect the value of such investment, or in the event that application of these methods of valuation results in a price for an investment that is deemed not to be representative of the market value of such investment, or if a price is not available, the investment will be valued by the Valuation Committee, in accordance with BFA’s policies and procedures as reflecting fair value (“Fair Valued Investments”). The fair valuation approaches that may be used by the Valuation Committee include market approach, income approach and cost approach. Valuation techniques such as discounted cash flow, use of market comparables and matrix pricing are types of valuation approaches and are typically used in determining fair value. When determining the price for Fair Valued Investments, the Valuation Committee seeks to determine the price that the Fund might reasonably expect to receive or pay from the current sale or purchase of that asset or liability in an arm’s-length transaction. Fair value determinations shall be based upon all available factors that the Valuation Committee deems relevant and consistent with the principles of fair value measurement.
Fair value pricing could result in a difference between the prices used to calculate a fund’s NAV and the prices used by the fund’s underlying index, which in turn could result in a difference between the fund’s performance and the performance of the fund’s underlying index.
Fair Value Hierarchy: Various inputs are used in determining the fair value of financial instruments. These inputs to valuation techniques are categorized into a fair value hierarchy consisting of three broad levels for financial reporting purposes as follows:
| | • | | Level 1 - Unadjusted price quotations in active markets/exchanges for identical assets or liabilities that the Fund has the ability to access; |
| | • | | Level 2 - Other observable inputs (including, but not limited to, quoted prices for similar assets or liabilities in markets that are active, quoted prices for identical or similar assets or liabilities in markets that are not active, inputs other than quoted prices that are observable for the assets or liabilities (such as interest rates, yield curves, volatilities, prepayment speeds, loss severities, credit risks and default rates) or other market-corroborated inputs); and |
| | • | | Level 3 - Unobservable inputs based on the best information available in the circumstances, to the extent observable inputs are not available (including the Global Valuation Committee’s assumptions used in determining the fair value of financial instruments). |
The hierarchy gives the highest priority to unadjusted quoted prices in active markets for identical assets or liabilities (Level 1 measurements) and the lowest priority to unobservable inputs (Level 3 measurements). Accordingly, the degree of judgment exercised in determining fair value is greatest for instruments categorized in Level 3. The inputs used to measure fair value may fall into different levels of the fair value hierarchy. In such cases, for disclosure purposes, the fair value hierarchy classification is determined based on the lowest level input that is significant to the fair value measurement in its entirety. Investments classified within Level 3 have significant unobservable inputs used by the Global Valuation Committee in determining the price for Fair Valued Investments. Level 3 investments include equity or debt issued by privately held companies or funds that may not have a secondary market and/or may have a limited number of investors. The categorization of a value determined for financial instruments is based on the pricing transparency of the financial instruments and is not necessarily an indication of the risks associated with investing in those securities.
| 4. | SECURITIES AND OTHER INVESTMENTS |
Securities Lending: The Fund may lend its securities to approved borrowers, such as brokers, dealers and other financial institutions. The borrower pledges and maintains with the Fund collateral consisting of cash, an irrevocable letter of credit issued by an approved bank, or securities issued or guaranteed by the U.S. government. The initial collateral received by the Fund is required to have a value of at least 102% of the current market value of the loaned securities for securities traded on U.S. exchanges and a value of at least 105% for all other securities. The collateral is maintained thereafter at a value equal to at least 100% of the current value of the securities on loan. The market value of the loaned securities is determined at the close of each business day of the Fund and any additional required collateral is delivered to the Fund or excess collateral is returned by the Fund, on the next business day. During the term of the loan, the Fund is entitled to all distributions made on or in respect of the loaned securities but does not receive interest income on securities received as collateral. Loans of securities are terminable at any time and the borrower, after notice, is required to return borrowed securities within the standard time period for settlement of securities transactions.
As of period end, any securities on loan were collateralized by cash and/or U.S. Government obligations. Cash collateral invested in money market funds managed by BFA or its affiliates is disclosed in the Schedule of Investments. Any non-cash collateral received cannot be sold, re-invested or pledged by the Fund, except in the event of borrower default. The securities on loan, if any, are also disclosed in the Fund’s Schedule of Investments. The market value of any securities on loan and the value of any related cash collateral are disclosed in the Statement of Assets and Liabilities.
Securities lending transactions are entered into by the Fund under Master Securities Lending Agreements (each, an “MSLA”) which provide the right, in the event of default (including bankruptcy or insolvency) for the non-defaulting party to liquidate the collateral and calculate a net exposure to the defaulting party or request additional collateral. In the event that a borrower defaults, the Fund, as lender, would offset the market value of the collateral received against the market value of the securities loaned. When the value of the collateral is greater than that of the market value of the securities loaned, the lender is left with a net amount payable to the defaulting party. However, bankruptcy or insolvency laws of particular jurisdiction may impose restrictions on or prohibitions against such a right of offset in the event of an MSLA counterparty’s bankruptcy or insolvency. Under the MSLA, absent an event of default, the borrower can resell or re-pledge the loaned securities, and the Fund can reinvest cash collateral received in connection with loaned securities. Upon an event of default, the parties’ obligations to return the securities or collateral to the other party are extinguished, and the parties can resell or re-pledge the loaned securities or the collateral received in connection with the loaned securities in order to satisfy the defaulting party’s net payment obligation for all transactions under the MSLA. The defaulting party remains liable for any deficiency.
| | |
| 22 | | 2 0 2 3 I S H A R E S A N N U A L R E P O R T T O S H A R E H O L D E R S |
Notes to Financial Statements (continued)
As of period end, the following table is a summary of the securities on loan by counterparty which are subject to offset under an MSLA:
| | | | | | | | | | | | | | | | |
| iShares ETF and Counterparty | |
| Securities
Loaned at Value |
| |
| Cash
Collateral Received |
(a) | |
| Non-Cash
Collateral Received,
at Fair Value |
(a) | |
| Net
Amount |
(b) |
Barclays Bank PLC | | $ | 449,816 | | | $ | (449,816 | ) | | $ | — | | | $ | — | |
Barclays Capital, Inc. | | | 2,566,625 | | | | (2,566,625 | ) | | | — | | | | — | |
BMO Capital Markets Corp. | | | 23,163 | | | | (23,163 | ) | | | — | | | | — | |
BNP Paribas SA | | | 30,605,667 | | | | (30,605,667 | ) | | | — | | | | — | |
BofA Securities, Inc. | | | 16,948,467 | | | | (16,948,467 | ) | | | — | | | | — | |
Deutsche Bank Securities, Inc. | | | 1,889,609 | | | | (1,889,609 | ) | | | — | | | | — | |
Goldman Sachs & Co. LLC | | | 4,175,339 | | | | (4,175,339 | ) | | | — | | | | — | |
J.P. Morgan Securities LLC | | | 88,657,876 | | | | (88,657,876 | ) | | | — | | | | — | |
Morgan Stanley | | | 2,231,015 | | | | (2,231,015 | ) | | | — | | | | — | |
National Financial Services LLC | | | 3,450,576 | | | | (3,450,576 | ) | | | — | | | | — | |
RBC Capital Market LLC | | | 5,632,000 | | | | (5,632,000 | ) | | | — | | | | — | |
SG Americas Securities LLC | | | 14,655 | | | | (14,125 | ) | | | — | | | | 530 | |
Toronto-Dominion Bank | | | 2,967,778 | | | | (2,967,778 | ) | | | — | | | | — | |
UBS Securities LLC | | | 2,303 | | | | (2,303 | ) | | | — | | | | — | |
Wells Fargo Bank N.A | | | 9,724,516 | | | | (9,724,516 | ) | | | — | | | | — | |
Wells Fargo Securities LLC | | | 1,713,804 | | | | (1,713,804 | ) | | | — | | | | — | |
| | | | | | | | | | | | | | | | |
| | | | |
| | $ | 171,053,209 | | | $ | (171,052,679 | ) | | $ | — | | | $ | 530 | |
| | | | | | | | | | | | | | | | |
| | (a) | Collateral received, if any, in excess of the market value of securities on loan is not presented in this table. The total cash collateral received by the Fund is disclosed in the Fund’s Statement of Assets and Liabilities. | |
| | (b) | The market value of the loaned securities is determined as of March 31, 2023. Additional collateral is delivered to the Fund on the next business day in accordance with the MSLA. The net amount would be subject to the borrower default indemnity in the event of default by the counterparty. | |
The risks of securities lending include the risk that the borrower may not provide additional collateral when required or may not return the securities when due. To mitigate these risks, the Fund benefits from a borrower default indemnity provided by BlackRock, Inc. (“BlackRock”). BlackRock’s indemnity allows for full replacement of the securities loaned to the extent the collateral received does not cover the value of the securities loaned in the event of borrower default. The Fund could incur a loss if the value of an investment purchased with cash collateral falls below the market value of the loaned securities or if the value of an investment purchased with cash collateral falls below the value of the original cash collateral received. Such losses are borne entirely by the Fund.
| 5. | INVESTMENT ADVISORY AGREEMENT AND OTHER TRANSACTIONS WITH AFFILIATES |
Investment Advisory Fees: Pursuant to an Investment Advisory Agreement with the Trust, BFA manages the investment of the Fund’s assets. BFA is a California corporation indirectly owned by BlackRock. Under the Investment Advisory Agreement, BFA is responsible for substantially all expenses of the Fund, except (i) interest and taxes; (ii) brokerage commissions and other expenses connected with the execution of portfolio transactions; (iii) distribution fees; (iv) the advisory fee payable to BFA; and (v) litigation expenses and any extraordinary expenses (in each case as determined by a majority of the independent trustees).
For its investment advisory services to the Fund, BFA is entitled to an annual investment advisory fee, accrued daily and paid monthly by the Fund, based on the Fund’s allocable portion of the aggregate of the average daily net assets of the Fund and certain other iShares funds, as follows:
| | | | |
| | |
| Aggregate Average Daily Net Assets | | Investment Advisory Fees | |
| |
First $46 billion | | | 0.4800 | % |
Over $46 billion, up to and including $81 billion | | | 0.4560 | |
Over $81 billion, up to and including $111 billion | | | 0.4332 | |
Over $111 billion, up to and including $141 billion | | | 0.4116 | |
Over $141 billion, up to and including $171 billion | | | 0.3910 | |
Over $171 billion | | | 0.3714 | |
Distributor: BlackRock Investments, LLC (“BRIL”), an affiliate of BFA, is the distributor for the Fund. Pursuant to the distribution agreement, BFA is responsible for any fees or expenses for distribution services provided to the Fund.
ETF Servicing Fees: The Fund has entered into an ETF Services Agreement with BRIL to perform certain order processing, Authorized Participant communications, and related services in connection with the issuance and redemption of Creation Units (“ETF Services”). BRIL is entitled to a transaction fee from Authorized Participants on each creation or redemption order for the ETF Services provided. The Fund does not pay BRIL for ETF Services.
Prior to April 25, 2022, ETF Services were performed by State Street Bank and Trust Company.
Securities Lending: The U.S. Securities and Exchange Commission (the “SEC”) has issued an exemptive order which permits BlackRock Institutional Trust Company, N.A. (“BTC”), an affiliate of BFA, to serve as securities lending agent for the Fund, subject to applicable conditions. As securities lending agent, BTC bears all operational costs directly related to securities lending, including any custodial costs. The Fund is responsible for fees in connection with the investment of cash collateral received for securities on loan (the “collateral investment fees”). The cash collateral is invested in a money market fund, BlackRock Cash Funds: Institutional or BlackRock Cash Funds: Treasury,
| | |
N O T E S T O F I N A N C I A L S T A T E M E N T S | | 23 |
Notes to Financial Statements (continued)
managed by BFA, or its affiliates. However, BTC has agreed to reduce the amount of securities lending income it receives in order to effectively limit the collateral investment fees the Fund bears to an annual rate of 0.04%. The SL Agency Shares of such money market fund will not be subject to a sales load, distribution fee or service fee. The money market fund in which the cash collateral has been invested may, under certain circumstances, impose a liquidity fee of up to 2% of the value redeemed or temporarily restrict redemptions for up to 10 business days during a 90 day period, in the event that the money market fund’s weekly liquid assets fall below certain thresholds.
Securities lending income is equal to the total of income earned from the reinvestment of cash collateral, net of fees and other payments to and from borrowers of securities, and less the collateral investment fees. The Fund retains a portion of securities lending income and remits the remaining portion to BTC as compensation for its services as securities lending agent.
Pursuant to the current securities lending agreement, the Fund retains 81% of securities lending income (which excludes collateral investment fees) and the amount retained can never be less than 70% of the total of securities lending income plus the collateral investment fees.
In addition, commencing the business day following the date that the aggregate securities lending income plus the collateral investment fees generated across all 1940 Act iShares exchange-traded fund (the “iShares ETF Complex”) in a given calendar year exceeds a specified threshold, the Fund, pursuant to the securities lending agreement, will retain for the remainder of that calendar year 81% of securities lending income (which excludes collateral investment fees), and the amount retained can never be less than 70% of the total of securities lending income plus the collateral investment fees.
The share of securities lending income earned by the Fund is shown as securities lending income - affiliated - net in its Statement of Operations. For the year ended March 31, 2023, the Fund paid BTC $988,273 for securities lending agent services.
Officers and Trustees: Certain officers and/or trustees of the Trust are officers and/or trustees of BlackRock or its affiliates.
The Fund may invest its positive cash balances in certain money market funds managed by BFA or an affiliate. The income earned on these temporary cash investments is shown as dividends - affiliated in the Statement of Operations.
A fund, in order to improve its portfolio liquidity and its ability to track its underlying index, may invest in shares of other iShares funds that invest in securities in the fund’s underlying index.
For the year ended March 31, 2023, purchases and sales of investments, excluding short-term securities and in-kind transactions, were as follows:
| | | | | | | | |
| iShares ETF | | Purchases | | | Sales | |
Preferred and Income Securities | | $ | 2,387,166,905 | | | $ | 2,460,144,621 | |
For the year ended March 31, 2023, in-kind transactions were as follows:
| | | | | | | | |
| iShares ETF | | In-kind
Purchases | | | In-kind
Sales | |
Preferred and Income Securities | | $ | 754,564,310 | | | $ | 3,009,244,301 | |
The Fund is treated as an entity separate from the Trust’s other funds for federal income tax purposes. It is the Fund’s policy to comply with the requirements of the Internal Revenue Code of 1986, as amended, applicable to regulated investment companies, and to distribute all of its taxable income to its shareholders. Therefore, no U.S. federal income tax provision is required.
Management has analyzed tax laws and regulations and their application to the Fund as of March 31, 2023, inclusive of the open tax return years, and does not believe that there are any uncertain tax positions that require recognition of a tax liability in the Fund’s financial statements.
U.S. GAAP requires that certain components of net assets be adjusted to reflect permanent differences between financial and tax reporting. These reclassifications have no effect on net assets or NAV per share. As of March 31, 2023, permanent differences attributable to realized gains (losses) from in-kind redemptions were reclassified to the following accounts:
| | | | | | | | |
| iShares ETF | | Paid-in capital | | | Accumulated earnings (loss) | |
Preferred and Income Securities | | $ | (125,784,518 | ) | | $ | 125,784,518 | |
The tax character of distributions paid was as follows:
| | | | | | | | |
| iShares ETF | | Year Ended
March 31, 2023 | | | Year Ended
March 31, 2022 | |
Preferred and Income Securities
Ordinary income | | $ | 887,370,473 | | | $ | 853,841,960 | |
| | |
| 24 | | 2 0 2 3 I S H A R E S A N N U A L R E P O R T T O S H A R E H O L D E R S |
Notes to Financial Statements (continued)
As of March 31, 2023, the tax components of accumulated earnings (loss) were as follows:
| | | | | | | | | | | | | | | | |
| iShares ETF | | Undistributed
Ordinary Income | | | Non-expiring Capital Loss
Carryforwards(a) | | | Net Unrealized
Gains (Losses)(b) | | | Total | |
Preferred and Income Securities | | $ | 52,616,651 | | | $ | (1,946,804,348 | ) | | $ | (2,655,592,703 | ) | | $ | (4,549,780,400 | ) |
| (a) | Amounts available to offset future realized capital gains. | |
| (b) | The difference between book-basis and tax-basis unrealized gains (losses) was attributable primarily to the amortization methods for premiums and discounts on fixed income securities, tax deferral of losses on wash sales, dividends deemed recognized for tax purposes, the classification of investments, the timing and recognition of partnership income and the realization for tax purposes of unrealized gains on investments in passive foreign investment companies. | |
A fund may own shares in certain foreign investment entities, referred to, under U.S. tax law, as “passive foreign investment companies.” Such fund may elect to mark-to-market annually the shares of each passive foreign investment company and would be required to distribute to shareholders any such marked-to-market gains.
As of March 31, 2023, gross unrealized appreciation and depreciation based on cost of investments (including short positions and derivatives, if any) for U.S. federal income tax purposes were as follows:
| | | | | | | | | | | | | | | | |
| iShares ETF | | Tax Cost | | | Gross Unrealized
Appreciation | | | Gross Unrealized
Depreciation | | | Net Unrealized
Appreciation
(Depreciation) | |
Preferred and Income Securities | | $ | 15,884,019,743 | | | | $ 146,910,198 | | | $ | (2,802,502,901 | ) | | $ | (2,655,592,703 | ) |
In the normal course of business, the Fund invests in securities or other instruments and may enter into certain transactions, and such activities subject the Fund to various risks, including, among others, fluctuations in the market (market risk) or failure of an issuer to meet all of its obligations. The value of securities or other instruments may also be affected by various factors, including, without limitation: (i) the general economy; (ii) the overall market as well as local, regional or global political and/or social instability; (iii) regulation, taxation or international tax treaties between various countries; or (iv) currency, interest rate or price fluctuations. Local, regional or global events such as war, acts of terrorism, the spread of infectious illness or other public health issues, recessions, or other events could have a significant impact on the Fund and its investments. The Fund’s prospectus provides details of the risks to which the Fund is subject.
BFA uses a “passive” or index approach to try to achieve the Fund’s investment objective following the securities included in its underlying index during upturns as well as downturns. BFA does not take steps to reduce market exposure or to lessen the effects of a declining market. Divergence from the underlying index and the composition of the portfolio is monitored by BFA.
The Fund may be exposed to additional risks when reinvesting cash collateral in money market funds that do not seek to maintain a stable NAV per share of $1.00, which may be subject to redemption gates or liquidity fees under certain circumstances.
Infectious Illness Risk: An outbreak of an infectious illness, such as the COVID-19 pandemic, may adversely impact the economies of many nations and the global economy, and may impact individual issuers and capital markets in ways that cannot be foreseen. An infectious illness outbreak may result in, among other things, closed international borders, prolonged quarantines, supply chain disruptions, market volatility or disruptions and other significant economic, social and political impacts.
Valuation Risk: The market values of equities, such as common stocks and preferred securities or equity related investments, such as futures and options, may decline due to general market conditions which are not specifically related to a particular company. They may also decline due to factors which affect a particular industry or industries. A fund may invest in illiquid investments. An illiquid investment is any investment that a fund reasonably expects cannot be sold or disposed of in current market conditions in seven calendar days or less without the sale or disposition significantly changing the market value of the investment. A fund may experience difficulty in selling illiquid investments in a timely manner at the price that it believes the investments are worth. Prices may fluctuate widely over short or extended periods in response to company, market or economic news. Markets also tend to move in cycles, with periods of rising and falling prices. This volatility may cause a fund’s NAV to experience significant increases or decreases over short periods of time. If there is a general decline in the securities and other markets, the NAV of a fund may lose value, regardless of the individual results of the securities and other instruments in which a fund invests.
The price the Fund could receive upon the sale of any particular portfolio investment may differ from the Fund’s valuation of the investment, particularly for securities that trade in thin or volatile markets or that are valued using a fair valuation technique or a price provided by an independent pricing service. Changes to significant unobservable inputs and assumptions (i.e., publicly traded company multiples, growth rate, time to exit) due to the lack of observable inputs.
Counterparty Credit Risk: The Fund may be exposed to counterparty credit risk, or the risk that an entity may fail to or be unable to perform on its commitments related to unsettled or open transactions, including making timely interest and/or principal payments or otherwise honoring its obligations. The Fund manage counterparty credit risk by entering into transactions only with counterparties that the Manager believes have the financial resources to honor their obligations and by monitoring the financial stability of those counterparties. Financial assets, which potentially expose the Fund to market, issuer and counterparty credit risks, consist principally of financial instruments and receivables due from counterparties. The extent of the Fund’s exposure to market, issuer and counterparty credit risks with respect to these financial assets is approximately their value recorded in the Statement of Assets and Liabilities, less any collateral held by the Fund.
Concentration Risk: A diversified portfolio, where this is appropriate and consistent with a fund’s objectives, minimizes the risk that a price change of a particular investment will have a material impact on the NAV of a fund. The investment concentrations within the Fund’s portfolio are disclosed in its Schedule of Investments.
| | |
N O T E S T O F I N A N C I A L S T A T E M E N T S | | 25 |
Notes to Financial Statements (continued)
The Fund invests a significant portion of its assets in securities within a single or limited number of market sectors. When a Fund concentrates its investments in this manner, it assumes the risk that economic, regulatory, political and social conditions affecting such sectors may have a significant impact on the fund and could affect the income from, or the value or liquidity of, the fund’s portfolio. Investment percentages in specific sectors are presented in the Schedule of Investments.
The Fund invests a significant portion of its assets within the financials sector. Performance of companies in the financials sector may be adversely impacted by many factors, including, among others, changes in government regulations, economic conditions, and interest rates, credit rating downgrades, adverse public perception, exposure concentration and decreased liquidity in credit markets. The impact of changes in capital requirements and recent or future regulation of any individual financial company, or of the financials sector as a whole, cannot be predicted, but may negatively impact the Fund.
Significant Shareholder Redemption Risk: Certain shareholders may own or manage a substantial amount of fund shares and/or hold their fund investments for a limited period of time. Large redemptions of fund shares by these shareholders may force a fund to sell portfolio securities, which may negatively impact the fund’s NAV, increase the fund’s brokerage costs, and/or accelerate the realization of taxable income/gains and cause the fund to make additional taxable distributions to shareholders.
LIBOR Transition Risk: The Fund may be exposed to financial instruments that are tied to the London Interbank Offered Rate (“LIBOR”) to determine payment obligations, financing terms, hedging strategies or investment value. The United Kingdom’s Financial Conduct Authority, which regulates LIBOR, announced that a majority of USD LIBOR settings will no longer be published after June 30, 2023. All other LIBOR settings and certain other interbank offered rates ceased to be published after December 31, 2021. The Secured Overnight Financing Rate (“SOFR”) has been used increasingly on a voluntary basis in new instruments and transactions. The Federal Reserve Board adopted regulations that provide a fallback mechanism by identifying benchmark rates based on SOFR that will replace LIBOR in certain financial contracts after June 30, 2023. The ultimate effect of the LIBOR transition process on the Fund is uncertain.
9. CAPITAL SHARE TRANSACTIONS
Capital shares are issued and redeemed by the Fund only in aggregations of a specified number of shares or multiples thereof (“Creation Units”) at NAV. Except when aggregated in Creation Units, shares of the Fund are not redeemable.
Transactions in capital shares were as follows:
| | | | | | | | | | | | | | | | |
| iShares ETF | | Year Ended
03/31/23 | | | Year Ended
03/31/22 | |
| | Shares | | | Amount | | | Shares | | | Amount | |
Preferred and Income Securities | | | | | | | | | | | | | | | | |
Shares sold | | | 19,150,000 | | | $ | 629,044,759 | | | | 85,800,000 | | | $ | 3,332,513,336 | |
Shares redeemed | | | (89,600,000 | ) | | | (2,906,607,396 | ) | | | (78,850,000 | ) | | | (2,959,787,145 | ) |
| | | | | | | | | | | | | | | | |
| | | (70,450,000 | ) | | $ | (2,277,562,637 | ) | | | 6,950,000 | | | $ | 372,726,191 | |
| | | | | | | | | | | | | | | | |
The consideration of the purchase of Creation Units of a fund in the Trust generally consists of the in-kind deposit of a designated portfolio of securities and a specified amount of cash. Certain funds in the Trust may be offered in Creation Units solely or partially for cash in U.S. dollars. Investors purchasing and redeeming Creation Units may pay a purchase transaction fee and a redemption transaction fee directly to BRIL, to offset transfer and other transaction costs associated with the issuance and redemption of Creation Units, including Creation Units for cash. Investors transacting in Creation Units for cash may also pay an additional variable charge to compensate the relevant fund for certain transaction costs (i.e., stamp taxes, taxes on currency or other financial transactions, and brokerage costs) and market impact expenses relating to investing in portfolio securities. Such variable charges, if any, are included in shared sold in the table above.
From time to time, settlement of securities related to in-kind contributions or in-kind redemptions may be delayed. In such cases, securities related to in-kind transactions are reflected as a receivable or a payable in the Statement of Assets and Liabilities.
Management has evaluated the impact of all subsequent events on the Fund through the date the financial statements were available to be issued and has determined that there were no subsequent events requiring adjustment or additional disclosure in the financial statements.
| | |
| 26 | | 2 0 2 3 I S H A R E S A N N U A L R E P O R T T O S H A R E H O L D E R S |
Report of Independent Registered Public Accounting Firm
To the Board of Trustees of iShares Trust and
Shareholders of iShares Preferred and Income Securities ETF
Opinion on the Financial Statements
We have audited the accompanying statement of assets and liabilities, including the schedule of investments, of iShares Preferred and Income Securities ETF (one of the funds constituting iShares Trust, referred to hereafter as the “Fund”) as of March 31, 2023, the related statement of operations for the year ended March 31, 2023, the statements of changes in net assets for each of the two years in the period ended March 31, 2023, including the related notes, and the financial highlights for each of the five years in the period ended March 31, 2023 (collectively referred to as the “financial statements”). In our opinion, the financial statements present fairly, in all material respects, the financial position of the Fund as of March 31, 2023, the results of its operations for the year then ended, the changes in its net assets for each of the two years in the period ended March 31, 2023 and the financial highlights for each of the five years in the period ended March 31, 2023 in conformity with accounting principles generally accepted in the United States of America.
Basis for Opinion
These financial statements are the responsibility of the Fund’s management. Our responsibility is to express an opinion on the Fund’s financial statements based on our audits. We are a public accounting firm registered with the Public Company Accounting Oversight Board (United States) (PCAOB) and are required to be independent with respect to the Fund in accordance with the U.S. federal securities laws and the applicable rules and regulations of the Securities and Exchange Commission and the PCAOB.
We conducted our audits of these financial statements in accordance with the standards of the PCAOB. Those standards require that we plan and perform the audit to obtain reasonable assurance about whether the financial statements are free of material misstatement, whether due to error or fraud.
Our audits included performing procedures to assess the risks of material misstatement of the financial statements, whether due to error or fraud, and performing procedures that respond to those risks. Such procedures included examining, on a test basis, evidence regarding the amounts and disclosures in the financial statements. Our audits also included evaluating the accounting principles used and significant estimates made by management, as well as evaluating the overall presentation of the financial statements. Our procedures included confirmation of securities owned as of March 31, 2023 by correspondence with the custodian, transfer agent and brokers; when replies were not received from brokers, we performed other auditing procedures. We believe that our audits provide a reasonable basis for our opinion.
/s/PricewaterhouseCoopers LLP
Philadelphia, Pennsylvania
May 25, 2023
We have served as the auditor of one or more BlackRock investment companies since 2000.
| | |
R E P O R T O F I N D E P E N D E N T R E G I S T E R E D P U B L I C A C C O U N T I N G F I R M | | 27 |
Important Tax Information (unaudited)
The following amount, or maximum amount allowable by law, is hereby designated as qualified dividend income for individuals for the fiscal year ended March 31, 2023:
| | | | |
| iShares ETF | | Qualified Dividend
Income | |
Preferred and Income Securities | | $ | 547,277,340 | |
The following amount, or maximum amount allowable by law, is hereby designated as qualified business income for individuals for the fiscal year ended March 31, 2023:
| | | | |
| iShares ETF | | Qualified Business
Income | |
Preferred and Income Securities | | $ | 47,050,581 | |
The following percentage, or maximum percentage allowable by law, of ordinary income distributions paid during the fiscal year ended March 31, 2023 qualified for the dividends-received deduction for corporate shareholders:
| | | | |
| iShares ETF | | Dividends-Received
Deduction | |
Preferred and Income Securities | | | 60.45 | % |
The Fund hereby designates the following amount, or maximum amount allowable by law, as interest income eligible to be treated as a Section 163(j) interest dividend for the fiscal year ended March 31, 2023:
| | | | |
| Fund Name | | Interest Dividends | |
Preferred and Income Securities | | $ | 194,645,509 | |
The Fund hereby designates the following amount, or maximum amount allowable by law, as interest-related dividends eligible for exemption from U.S. withholding tax for nonresident aliens and foreign corporations for the fiscal year ended March 31, 2023:
| | | | |
| iShares ETF | | Interest-Related
Dividends | |
Preferred and Income Securities | | $ | 177,617,483 | |
| | |
| 28 | | 2 0 2 3 I S H A R E S A N N U A L R E P O R T T O S H A R E H O L D E R S |
Statement Regarding Liquidity Risk Management Program
In compliance with Rule 22e-4 under the Investment Company Act of 1940, as amended (the “Liquidity Rule”), iShares Trust (the “Trust”) has adopted and implemented a liquidity risk management program (the “Program”) for iShares Preferred and Income Securities ETF (the “Fund” or “ETF”), a series of the Trust, which is reasonably designed to assess and manage the Fund’s liquidity risk.
The Board of Trustees (the “Board”) of the Trust, on behalf of the Fund, met on December 9, 2022 (the “Meeting”) to review the Program. The Board previously appointed BlackRock Fund Advisors (“BlackRock”), the investment adviser to the Fund, as the program administrator for the Fund’s Program. BlackRock also previously delegated oversight of the Program to the 40 Act Liquidity Risk Management Committee (the “Committee”). At the Meeting, the Committee, on behalf of BlackRock, provided the Board with a report that addressed the operation of the Program and assessed its adequacy and effectiveness of implementation, including the management of the Fund’s Highly Liquid Investment Minimum (“HLIM”) where applicable, and any material changes to the Program (the “Report”). The Report covered the period from October 1, 2021 through September 30, 2022 (the “Program Reporting Period”).
The Report described the Program’s liquidity classification methodology for categorizing the Fund’s investments (including derivative transactions) into one of four liquidity buckets. It also referenced the methodology used by BlackRock to establish the Fund’s HLIM and noted that the Committee reviews and ratifies the HLIM assigned to the Fund no less frequently than annually. The Report also discussed notable events affecting liquidity over the Program Reporting Period, including extended market holidays, the imposition of capital controls in certain non-U.S. countries, Russian sanctions and the closure of the Russian securities market.
The Report noted that the Program complied with the key factors for consideration under the Liquidity Rule for assessing, managing and periodically reviewing the Fund’s liquidity risk, as follows:
| | a) | The Fund’s investment strategy and liquidity of portfolio investments during both normal and reasonably foreseeable stressed conditions. During the Program Reporting Period, the Committee reviewed whether the Fund’s strategy is appropriate for an open-end fund structure, with a focus on funds with more significant and consistent holdings of less liquid and illiquid assets. The Committee also factored a fund’s concentration in an issuer into the liquidity classification methodology by taking issuer position sizes into account. Derivative exposure was also considered in the calculation of a fund’s liquidity bucketing. Finally, a factor for consideration under the Liquidity Rule is a Fund’s use of borrowings for investment purposes. However, the Funds do not borrow for investment purposes. |
| | b) | Short-term and long-term cash flow projections during both normal and reasonably foreseeable stressed conditions. During the Program Reporting Period, the Committee reviewed historical redemption activity and used this information as a component to establish each ETF’s reasonably anticipated trading size (“RATS”). The Committee may also take into consideration a fund’s shareholder ownership concentration (which, depending on product type and distribution channel, may or may not be available), a fund’s distribution channels, and the degree of certainty associated with a fund’s short-term and long-term cash flow projections. |
| | c) | Holdings of cash and cash equivalents, as well as borrowing arrangements. The Committee considered that ETFs generally do not hold more than de minimis amounts of cash. The Committee also considered that ETFs generally do not engage in borrowing. |
| | d) | The relationship between an ETF’s portfolio liquidity and the way in which, and the prices and spreads at which, ETF shares trade, including the efficiency of the arbitrage function and the level of active participation by market participants, including authorized participants. The Committee monitored the prevailing bid/ask spread and the ETF price premium (or discount) to NAV for all ETFs. However, there were no ETFs with persistent deviations of fund premium/discount or bid/ask spreads from long-term averages over the Program Reporting Period. |
| | e) | The effect of the composition of baskets on the overall liquidity of an ETF’s portfolio. In reviewing the linkage between the composition of custom baskets accepted by an ETF and any significant change in the liquidity profile of such ETF, the Committee reviewed changes in the proportion of each ETF’s portfolio comprised of less liquid and illiquid holdings to determine if applicable thresholds were met requiring enhanced review. |
There were no material changes to the Program during the Program Reporting Period other than the enhancement of certain model components in the Program’s classification methodology. The Report provided to the Board stated that the Committee concluded that based on the operation of the functions, as described in the Report, the Program is operating as intended and is effective in implementing the requirements of the Liquidity Rule.
| | |
S T A T E M E N T R E G A R D I N G L I Q U I D I T Y R I S K M A N A G E M E N T P R O G R A M | | 29 |
Supplemental Information (unaudited)
Section 19(a) Notices
The amounts and sources of distributions reported are estimates and are being provided pursuant to regulatory requirements and are not being provided for tax reporting purposes. The actual amounts and sources for tax reporting purposes will depend upon the Fund’s investment experience during the year and may be subject to changes based on tax regulations. Shareholders will receive a Form 1099-DIV each calendar year that will inform them how to report these distributions for federal income tax purposes.
March 31, 2023
| | | | | | | | | | | | | | | | | | | | | | | | | | | | | | | | | | | | |
| | | | |
| | | Total Cumulative Distributions
for the Fiscal Year-to-Date | | | | | | % Breakdown of the Total Cumulative
Distributions for the Fiscal Year-to-Date | |
| | | | | | | | | |
| iShares ETF | | Net
Investment
Income | | | Net Realized
Capital Gains | | | Return of
Capital | | | Total Per
Share | | | | | | Net
Investment
Income | | | Net Realized
Capital Gains | | | Return of
Capital | | | Total Per
Share | |
| | | | | | | | | |
Preferred and Income Securities(a) | | $ | 1.844478 | | | $ | — | | | $ | 0.132570 | | | $ | 1.977048 | | | | | | | | 93 | % | | | — | % | | | 7 | % | | | 100 | % |
| (a) | The Fund estimates that it has distributed more than its net investment income and net realized capital gains; therefore, a portion of the distribution may be a return of capital. A return of capital may occur, for example, when some or all of the shareholder’s investment in the Fund is returned to the shareholder. A return of capital does not necessarily reflect the Fund’s investment performance and should not be confused with “yield” or “income”. When distributions exceed total return performance, the difference will incrementally reduce the Fund’s net asset value per share. |
Premium/Discount Information
Information on the Fund’s net asset value, market price, premiums and discounts, and bid-ask spreads can be found at iShares.com.
Regulation under the Alternative Investment Fund Managers Directive
The Alternative Investment Fund Managers Directive, and its United Kingdom (“UK”) equivalent, ( “AIFMD”) impose detailed and prescriptive obligations on fund managers established in the European Union (the “EU”) and the UK. These do not currently apply to managers established outside of the EU or UK, such as BFA (the “Company”). Rather, the Company is only required to comply with certain disclosure, reporting and transparency obligations of AIFMD because it has registered the BFA fund to be marketed to investors in the EU and/or UK.
The Company has registered the iShares Preferred and Income Securities ETF (the “Fund”) to be marketed to United Kingdom and EU investors in the Netherlands, Finland and Sweden.
Report on Remuneration
The Company is required under AIFMD to make quantitative disclosures of remuneration. These disclosures are made in line with BlackRock’s interpretation of currently available regulatory guidance on quantitative remuneration disclosures. As market or regulatory practice develops BlackRock may consider it appropriate to make changes to the way in which quantitative remuneration disclosures are calculated. Where such changes are made, this may result in disclosures in relation to a fund not being comparable to the disclosures made in the prior year, or in relation to other BlackRock fund disclosures in that same year.
Disclosures are provided in relation to (a) the staff of the Company; (b) staff who are senior management; and (c) staff who have the ability to materially affect the risk profile of the Fund.
All individuals included in the aggregated figures disclosed are rewarded in line with BlackRock’s remuneration policy for their responsibilities across the relevant BlackRock business area. As all individuals have a number of areas of responsibilities, only the portion of remuneration for those individuals’ services attributable to the Fund is included in the aggregate figures disclosed.
BlackRock has a clear and well-defined pay-for-performance philosophy, and compensation programs which support that philosophy.
BlackRock operates a total compensation model for remuneration which includes a base salary, which is contractual, and a discretionary bonus scheme. Although all employees are eligible to receive a discretionary bonus, there is no contractual obligation to make a discretionary bonus award to any employees. For senior management and staff who have the ability to materially affect the risk profile of the Fund, a significant percentage of variable remuneration is deferred over time. All employees are subject to a clawback policy.
Remuneration decisions for employees are made once annually in January following the end of the performance year, based on BlackRock’s full-year financial results and other non-financial goals and objectives. Alongside financial performance, individual total compensation is also based on strategic and operating results and other considerations such as management and leadership capabilities. No set formulas are established and no fixed benchmarks are used in determining annual incentive awards.
Annual incentive awards are paid from a bonus pool which is reviewed throughout the year by BlackRock’s independent compensation committee, taking into account both actual and projected financial information together with information provided by the Enterprise Risk and Regulatory Compliance departments in relation to any activities, incidents or events that warrant consideration in making compensation decisions. Individuals are not involved in setting their own remuneration.
| | |
| 30 | | 2 0 2 3 I S H A R E S A N N U A L R E P O R T T O S H A R E H O L D E R S |
Supplemental Information (unaudited)
Each of the control functions (Enterprise Risk, Legal & Compliance, and Internal Audit) each have their own organizational structures which are independent of the business units and therefore staff members in control functions are remunerated independently of the businesses they oversee. Functional bonus pools for those control functions are determined with reference to the performance of each individual function and the remuneration of the senior members of control functions is directly overseen by BlackRock’s independent remuneration committee.
Members of staff and senior management of the Company typically provide both AIFMD and non-AIFMD related services in respect of multiple funds, clients and functions of the Company and across the broader BlackRock group. Conversely, members of staff and senior management of the broader BlackRock group may provide both AIFMD and non-AIFMD related services in respect of multiple funds, clients and functions of the broader BlackRock group and of the Company. Therefore, the figures disclosed are a sum of individuals’ portion of remuneration attributable to the Company according to an objective apportionment methodology which acknowledges the multiple-service nature of the Company and the broader BlackRock group. Accordingly, the figures are not representative of any individual’s actual remuneration or their remuneration structure.
The amount of the total remuneration awarded to the Company’s staff in respect of the Company’s financial year ending December 31, 2022 was USD 4,121 million. This figure is comprised of fixed remuneration of USD 685 million and variable remuneration of USD 3,436 million. There was a total of 8 beneficiaries of the remuneration described above.
The amount of the aggregate remuneration awarded by the Company in respect of the Company’s financial year ending December 31, 2022, to its senior management was USD 2,958 million, and to other members of its staff whose actions potentially have a material impact on the risk profile of the Company or its funds was USD 970 million. These figures relate to the entire Company and not to the Fund.
Disclosures Under the EU Sustainable Finance Disclosure Regulation
The Fund is registered under the Alternative Investment Fund Managers Directive to be marketed to European Union (“EU”) investors, as noted above. As a result, certain disclosures are required under the EU Sustainable Finance Disclosure Regulation (“SFDR”).
The Fund has not been categorized under the SFDR as an “Article 8” or “Article 9” product. In addition, the Fund’s investment strategy does not take into account the criteria for environmentally sustainable economic activities under the EU sustainable investment taxonomy regulation or principal adverse impacts (“PAIs”) on sustainability factors under the SFDR. PAIs are identified under the SFDR as the material impacts of investment decisions on sustainability factors relating to environmental, social and employee matters, respect for human rights, and anti-corruption and anti-bribery matters.
| | |
SUPPLEMENTAL INFORMATION | | 31 |
Trustee and Officer Information
The Board of Trustees has responsibility for the overall management and operations of the Funds, including general supervision of the duties performed by BFA and other service providers. Each Trustee serves until he or she resigns, is removed, dies, retires or becomes incapacitated. Each officer shall hold office until his or her successor is elected and qualifies or until his or her death, resignation or removal. Trustees who are not “interested persons” (as defined in the 1940 Act) of the Trust are referred to as independent trustees (“Independent Trustees”).
The registered investment companies advised by BFA or its affiliates (the “BlackRock-advised Funds”) are organized into one complex of open-end equity, multi-asset, index and money market funds and ETFs (the “BlackRock Multi-Asset Complex”), one complex of closed-end funds and open-end non-index fixed-income funds (including ETFs) (the “BlackRock Fixed-Income Complex”) and one complex of ETFs (“Exchange-Traded Fund Complex”) (each, a “BlackRock Fund Complex”). The Fund is included in the Exchange-Traded Fund Complex. Each Trustee also serves as a Director of iShares, Inc. and a Trustee of iShares U.S. ETF Trust and, as a result, oversees all of the funds within the Exchange-Traded Fund Complex, which consists of 380 funds as of March 31, 2023. With the exception of Robert S. Kapito, Salim Ramji and Charles Park, the address of each Trustee and officer is c/o BlackRock, Inc., 400 Howard Street, San Francisco, CA 94105. The address of Mr. Kapito, Mr. Ramji and Mr. Park is c/o BlackRock, Inc., 50 Hudson Yards, New York, NY 10001. The Board has designated John E. Kerrigan as its Independent Board Chair. Additional information about the Funds’ Trustees and officers may be found in the Funds’ combined Statement of Additional Information, which is available without charge, upon request, by calling toll-free 1-800-iShares (1-800-474-2737).
| | | | | | |
| Interested Trustees |
| | | | |
Name (Year of Birth) | | Position(s) | | Principal Occupation(s)
During Past 5 Years | | Other Directorships Held by Trustee |
| | | |
Robert S. Kapito(a)
(1957) | | Trustee (since 2009). | | President, BlackRock, Inc. (since 2006); Vice Chairman of BlackRock, Inc. and Head of BlackRock’s Portfolio Management Group (since its formation in 1998) and BlackRock, Inc.’s predecessor entities (since 1988); Trustee, University of Pennsylvania (since 2009); President of Board of Directors, Hope & Heroes Children’s Cancer Fund (since 2002). | | Director of BlackRock, Inc. (since 2006); Director of iShares, Inc. (since 2009); Trustee of iShares U.S. ETF Trust (since 2011). |
| | | |
Salim Ramji(b)
(1970) | | Trustee (since 2019). | | Senior Managing Director, BlackRock, Inc. (since 2014); Global Head of BlackRock’s ETF and Index Investments Business (since 2019); Head of BlackRock’s U.S. Wealth Advisory Business (2015-2019); Global Head of Corporate Strategy, BlackRock, Inc. (2014-2015); Senior Partner, McKinsey & Company (2010-2014). | | Director of iShares, Inc. (since 2019); Trustee of iShares U.S. ETF Trust (since 2019). |
|
(a) Robert S. Kapito is deemed to be an “interested person” (as defined in the 1940 Act) of the Trust due to his affiliations with BlackRock, Inc. and its affiliates. (b) Salim Ramji is deemed to be an “interested person” (as defined in the 1940 Act) of the Trust due to his affiliations with BlackRock, Inc. and its affiliates. |
|
| Independent Trustees |
| | | | |
Name (Year of Birth) | | Position(s) | | Principal Occupation(s)
During Past 5 Years | | Other Directorships Held by Trustee |
| | | |
John E. Kerrigan
(1955) | | Trustee (since 2005); Independent Board Chair (since 2022). | | Chief Investment Officer, Santa Clara University (since 2002). | | Director of iShares, Inc. (since 2005); Trustee of iShares U.S. ETF Trust (since 2011); Independent Board Chair of iShares, Inc. and iShares U.S. ETF Trust (since 2022). |
| | | |
Jane D. Carlin
(1956) | | Trustee (since 2015); Risk Committee Chair (since 2016). | | Consultant (since 2012); Member of the Audit Committee (2012-2018), Chair of the Nominating and Governance Committee (2017-2018) and Director of PHH Corporation (mortgage solutions) (2012-2018); Managing Director and Global Head of Financial Holding Company Governance & Assurance and the Global Head of Operational Risk Management of Morgan Stanley (2006-2012). | | Director of iShares, Inc. (since 2015); Trustee of iShares U.S. ETF Trust (since 2015); Member of the Audit Committee (since 2016), Chair of the Audit Committee (since 2020) and Director of The Hanover Insurance Group, Inc. (since 2016). |
| | | |
Richard L. Fagnani
(1954) | | Trustee (since 2017); Audit Committee Chair (since 2019). | | Partner, KPMG LLP (2002-2016); Director of One Generation Away (since 2021). | | Director of iShares, Inc. (since 2017); Trustee of iShares U.S. ETF Trust (since 2017). |
| | |
| 32 | | 2 0 2 3 I S H A R E S A N N U A L R E P O R T T O S H A R E H O L D E R S |
Trustee and Officer Information (continued)
| | | | | | |
| Independent Trustees |
| | | | |
Name (Year of Birth) | | Position(s) | | Principal Occupation(s)
During Past 5 Years | | Other Directorships Held by Trustee |
| | | |
Cecilia H. Herbert
(1949) | | Trustee (since 2005); Nominating and Governance and Equity Plus Committee Chairs (since 2022). | | Chair of the Finance Committee (since 2019) and Trustee and Member of the Finance, Audit and Quality Committees of Stanford Health Care (since 2016); Trustee of WNET, New York’s public media company (since 2011) and Member of the Audit Committee (since 2018), Investment Committee (since 2011) and Personnel Committee (since 2022); Chair (1994-2005) and Member (1992-2021) of the Investment Committee, Archdiocese of San Francisco; Trustee of Forward Funds (14 portfolios) (2009-2018); Trustee of Salient MF Trust (4 portfolios) (2015- 2018); Director (1998-2013) and President (2007-2011) of the Board of Directors, Catholic Charities CYO; Trustee (2002-2011) and Chair of the Finance and Investment Committee (2006-2010) of the Thacher School; Director of the Senior Center of Jackson Hole (since 2020); Director of the Jackson Hole Center for the Arts (since 2021); Member of the Wyoming State Investment Funds Committee (since 2022). | | Director of iShares, Inc. (since 2005); Trustee of iShares U.S. ETF Trust (since 2011). |
| | | |
Drew E. Lawton
(1959) | | Trustee (since 2017); 15(c) Committee Chair (since 2017). | | Senior Managing Director of New York Life Insurance Company (2010-2015). | | Director of iShares, Inc. (since 2017); Trustee of iShares U.S. ETF Trust (since 2017); Director of Jackson Financial Inc. (since 2021). |
| | | |
John E. Martinez
(1961) | | Trustee (since 2003); Securities Lending Committee Chair (since 2019). | | Director of Real Estate Equity Exchange, Inc. (since 2005); Director of Cloudera Foundation (2017-2020); and Director of Reading Partners (2012-2016). | | Director of iShares, Inc. (since 2003); Trustee of iShares U.S. ETF Trust (since 2011). |
| | | |
Madhav V. Rajan
(1964) | | Trustee (since 2011); Fixed Income Plus Committee Chair (since 2019). | | Dean, and George Pratt Shultz Professor of Accounting, University of Chicago Booth School of Business (since 2017); Advisory Board Member (since 2016) and Director (since 2020) of C.M. Capital Corporation; Chair of the Board for the Center for Research in Security Prices, LLC (since 2020); Robert K. Jaedicke Professor of Accounting, Stanford University Graduate School of Business (2001-2017); Professor of Law (by courtesy), Stanford Law School (2005-2017); Senior Associate Dean for Academic Affairs and Head of MBA Program, Stanford University Graduate School of Business (2010-2016). | | Director of iShares, Inc. (since 2011); Trustee of iShares U.S. ETF Trust (since 2011). |
| | |
T R U S T E E A N D O F F I C E R I N F O R M A T I O N | | 33 |
Trustee and Officer Information (continued)
| | | | | | |
| Officers |
| | | |
Name (Year of Birth) | | Position(s) | | Principal Occupation(s)
During Past 5 Years |
| | |
Dominik Rohé
(1973) | | President (since 2023). | | Managing Director, BlackRock, Inc. (since 2005); Head of Americas ETF and Index Investments (since 2023); Head of Latin America (2019- 2023). |
| | |
Trent Walker
(1974) | | Treasurer and Chief Financial Officer (since 2020). | | Managing Director, BlackRock, Inc. (since September 2019); Chief Financial Officer of iShares Delaware Trust Sponsor LLC, BlackRock Funds, BlackRock Funds II, BlackRock Funds IV, BlackRock Funds V and BlackRock Funds VI (since 2021); Executive Vice President of PIMCO (2016-2019); Senior Vice President of PIMCO (2008-2015); Treasurer (2013-2019) and Assistant Treasurer (2007-2017) of PIMCO Funds, PIMCO Variable Insurance Trust, PIMCO ETF Trust, PIMCO Equity Series, PIMCO Equity Series VIT, PIMCO Managed Accounts Trust, 2 PIMCO-sponsored interval funds and 21 PIMCO-sponsored closed-end funds. |
| | |
Charles Park
(1967) | | Chief Compliance Officer (since 2006). | | Chief Compliance Officer of BlackRock Advisors, LLC and the BlackRock-advised Funds in the BlackRock Multi-Asset Complex and the BlackRock Fixed-Income Complex (since 2014); Chief Compliance Officer of BFA (since 2006). |
| | |
Marisa Rolland
(1980) | | Secretary (since 2022). | | Managing Director, BlackRock, Inc. (since 2023); Director, BlackRock, Inc. (2018-2022); Vice President, BlackRock, Inc. (2010-2017). |
| | |
Rachel Aguirre
(1982) | | Executive Vice President (since 2022). | | Managing Director, BlackRock, Inc. (since 2018); Director, BlackRock, Inc. (2009-2018); Head of U.S. iShares Product (since 2022); Head of EII U.S. Product Engineering (since 2021); Co-Head of EII’s Americas Portfolio Engineering (2020-2021); Head of Developed Markets Portfolio Engineering (2016-2019). |
| | |
Jennifer Hsui
(1976) | | Executive Vice President (since 2022). | | Managing Director, BlackRock, Inc. (since 2009); Co-Head of Index Equity (since 2022). |
| | |
James Mauro
(1970) | | Executive Vice President (since 2022). | | Managing Director, BlackRock, Inc. (since 2010); Head of Fixed Income Index Investments in the Americas and Head of San Francisco Core Portfolio Management (since 2020). |
| | | | | |
| |
Effective June 15, 2022, Marisa Rolland replaced Deepa Damre Smith as Secretary. Effective March 30, 2023, Dominik Rohé replaced Armando Senra as President. |
| | |
| 34 | | 2 0 2 3 I S H A R E S A N N U A L R E P O R T T O S H A R E H O L D E R S |
General Information
Electronic Delivery
Shareholders can sign up for e-mail notifications announcing that the shareholder report or prospectus has been posted on the iShares website at iShares.com. Once you have enrolled, you will no longer receive prospectuses and shareholder reports in the mail.
To enroll in electronic delivery:
| | • | | If your brokerage firm is not listed, electronic delivery may not be available. Please contact your broker-dealer or financial advisor. |
Householding
Householding is an option available to certain fund investors. Householding is a method of delivery, based on the preference of the individual investor, in which a single copy of certain shareholder documents and Rule 30e-3 notices can be delivered to investors who share the same address, even if their accounts are registered under different names. Please contact your broker-dealer if you are interested in enrolling in householding and receiving a single copy of prospectuses and other shareholder documents, or if you are currently enrolled in householding and wish to change your householding status.
Availability of Quarterly Schedule of Investments
The Fund files its complete schedule of portfolio holdings with the SEC for the first and third quarters of each fiscal year as an exhibit to their reports on Form N-PORT. The Funds’ Forms N-PORT are available on the SEC’s website at sec.gov. Additionally, the Fund makes its portfolio holdings for the first and third quarters of each fiscal year available at iShares.com/fundreports.
Availability of Proxy Voting Policies and Proxy Voting Records
A description of the policies and procedures that the iShares Funds use to determine how to vote proxies relating to portfolio securities and information about how the iShares Funds voted proxies relating to portfolio securities during the most recent twelve-month period ending June 30 is available without charge, upon request (1) by calling toll-free 1-800-474-2737; (2) on the iShares website at iShares.com; and (3) on the SEC website at sec.gov.
A description of the Trust’s policies and procedures with respect to the disclosure of the Fund’s portfolio securities is available in the Fund Prospectus. The Fund discloses its portfolio holdings daily and provides information regarding its top holdings in Fund fact sheets at iShares.com.
| | |
G E N E R A L I N F O R M A T I O N | | 35 |
Glossary of Terms Used in this Report
| | |
| Portfolio Abbreviation |
| |
| CMT | | Constant Maturity Treasury |
| |
| LIBOR | | London Interbank Offered Rate |
| |
| LP | | Limited Partnership |
| |
| NVS | | Non-Voting Shares |
| |
| REIT | | Real Estate Investment Trust |
| |
| SOFR | | Secured Overnight Financing Rate |
| | |
| 36 | | 2 0 2 3 I S H A R E S A N N U A L R E P O R T T O S H A R E H O L D E R S |
THIS PAGE INTENTIONALLY LEFT BLANK.
THIS PAGE INTENTIONALLY LEFT BLANK.
THIS PAGE INTENTIONALLY LEFT BLANK.
Want to know more?
iShares.com | 1-800-474-2737
This report is intended for the Fund’s shareholders. It may not be distributed to prospective investors unless it is preceded or accompanied by the current prospectus.
Investing involves risk, including possible loss of principal.
The iShares Funds are distributed by BlackRock Investments, LLC (together with its affiliates, “BlackRock”).
The iShares Funds are not sponsored, endorsed, issued, sold or promoted by ICE Data Indices, LLC, nor does this company make any representation regarding the advisability of investing in the iShares Funds. BlackRock is not affiliated with the company listed above.
©2022 BlackRock, Inc. All rights reserved. iSHARES and BLACKROCK are registered trademarks of BlackRock, Inc. or its subsidiaries. All other marks are the property of their respective owners.
iS-AR-309-0323
| | |

| | MARCH 31, 2023 |
iShares Trust
· iShares Core S&P Mid-Cap ETF | IJH | NYSE Arca
· iShares Core S&P Small-Cap ETF | IJR | NYSE Arca
· iShares Core S&P U.S. Growth ETF | IUSG | NASDAQ
· iShares Core S&P U.S. Value ETF | IUSV | NASDAQ
The Markets in Review
Dear Shareholder,
Significant economic headwinds emerged during the 12-month reporting period ended March 31, 2023, as investors navigated changing economic conditions and volatile markets. The U.S. economy shrank in the first half of 2022 before returning to modest growth in the second half of the year, marking a shift to a more challenging post-reopening economic environment. Changes in consumer spending patterns and a tight labor market led to elevated inflation, which reached a 40-year high before beginning to moderate.
Equity prices fell as interest rates rose, particularly during the first half of the reporting period. Both large- and small-capitalization U.S. stocks declined, although equities began to recover in the second half of the period as inflation eased and economic growth resumed. Emerging market stocks and international equities from developed markets declined overall, pressured by rising interest rates and volatile commodities prices.
The 10-year U.S. Treasury yield rose during the reporting period, driving its price down, as investors reacted to fluctuating inflation data and attempted to anticipate its impact on future interest rate changes. The corporate bond market also faced inflationary headwinds, and higher interest rates led to rising borrowing costs for corporate issuers.
The U.S. Federal Reserve (the “Fed”), acknowledging that inflation has been more persistent than expected, raised interest rates eight times. Furthermore, the Fed wound down its bond-buying programs and accelerated the reduction of its balance sheet.
Restricted labor supply kept inflation elevated even as other inflation drivers, such as goods prices and energy costs, moderated. While economic growth slowed in the last year, we believe that taming inflation requires a more substantial decline that lowers demand to a level more in line with the economy’s productive capacity. Although the Fed has decelerated the pace of interest rate hikes, we believe that it still seems determined to get inflation back to target. With this in mind, we believe the possibility of a U.S. recession in the near-term is high, but the dimming economic outlook has not yet been fully reflected in current market prices. We believe investors should expect a period of higher volatility as markets adjust to the new economic reality and policymakers attempt to adapt to rapidly changing conditions. Turmoil in the banking sector late in the period highlighted the potential for the knock-on effects of substantially higher interest rates to disrupt markets with little warning.
While we favor an overweight to equities in the long term, we prefer an underweight stance on equities overall in the near term. Expectations for corporate earnings remain elevated, which seems inconsistent with the possibility of a recession. Nevertheless, we are overweight on emerging market stocks as we believe a weakening U.S. dollar provides a supportive backdrop. We also see long-term opportunities in credit, where we believe that valuations are appealing and higher yields provide attractive income, although we are neutral on credit in the near term, as we’re concerned about tightening credit and financial conditions. However, we believe there are still some strong opportunities for a six- to twelve-month horizon, particularly short-term U.S. Treasuries, global inflation-linked bonds, and emerging market bonds denominated in local currency.
Overall, our view is that investors need to think globally, position themselves to be prepared for a decarbonizing economy, and be nimble as market conditions change. We encourage you to talk with your financial advisor and visit iShares.com for further insight about investing in today’s markets.
Sincerely,

Rob Kapito
President, BlackRock, Inc.

Rob Kapito
President, BlackRock, Inc.
| | | | | | | | |
| Total Returns as of March 31, 2023 | |
| | | 6-Month | | | 12-Month | |
| | |
U.S. large cap equities
(S&P 500® Index) | | | 15.62 | % | | | (7.73 | )% |
| | |
U.S. small cap equities
(Russell 2000® Index) | | | 9.14 | | | | (11.61 | ) |
| | |
International equities
(MSCI Europe, Australasia, Far East Index) | | | 27.27 | | | | (1.38 | ) |
| | |
Emerging market equities
(MSCI Emerging Markets Index) | | | 14.04 | | | | (10.70 | ) |
| | |
3-month Treasury bills
(ICE BofA 3-Month U.S. Treasury Bill Index) | | | 1.93 | | | | 2.52 | |
| | |
U.S. Treasury securities
(ICE BofA 10-Year U.S. Treasury Index) | | | 4.38 | | | | (6.90 | ) |
| | |
U.S. investment grade bonds (Bloomberg U.S. Aggregate Bond Index) | | | 4.89 | | | | (4.78 | ) |
| | |
Tax-exempt municipal bonds (Bloomberg Municipal Bond Index) | | | 7.00 | | | | 0.26 | |
| | |
U.S. high yield bonds (Bloomberg U.S. Corporate High Yield 2% Issuer Capped Index) | | | 7.88 | | | | (3.35 | ) |
|
Past performance is not an indication of future results. Index performance is shown for illustrative purposes only. You cannot invest directly in an index. | |
| | |
| 2 | | T H I S P A G E I S N O T P A R T O F Y O U R F U N D R E P O R T |
Table of Contents
Market Overview
iShares Trust
Domestic Market Overview
U.S. stocks declined for the 12 months ended March 31, 2023 (“reporting period”), when the Russell 3000® Index, a broad measure of U.S. equity market performance, returned -8.58%. Elevated inflation and rapid tightening of monetary policy dampened growth and weighed on equities. Higher interest rates drove bond yields higher and increased borrowing costs for businesses and consumers. Equities began to recover in the second half of the reporting period, as the broader economy remained resilient and the pace of inflation declined. In March 2023, two banks suddenly failed, representing the second and third largest bank failures in U.S. history by asset value. This drove concern among investors about the resiliency of the financial system in the face of rapidly rising interest rates. However, government agencies acted swiftly to organize a sale of the failed banks’ assets and inject liquidity, and equity prices recovered.
Inflation was a significant driver of the economic outlook. As the reporting period began, the consumer price index, a widely followed measure of inflation, stood at multi-decade highs. Strong consumer spending and a tight labor market, along with continued supply chain disruptions in Asia, combined to drive prices higher. But the rate of inflation began to decline as the reporting period wore on, decelerating for nine consecutive months beginning in July 2022. Nonetheless, inflation remained elevated by historic standards, and higher prices negatively impacted both consumers and businesses.
The U.S. economy recovered from a decline in the first half of 2022 to post modest growth in the third and fourth quarters of 2022. Consumers continued to power the economy with growing spending, despite higher prices for many consumer goods and services. The strong labor market supported spending, as unemployment remained very low, at one point dropping to the lowest recorded level since 1969. Furthermore, the labor force participation rate—which measures the total proportion of employed persons of working age—rose, indicating that more people were being drawn into the labor force. Amid tightening labor supply, wages rose significantly, with the largest gains at the lower end of the wage spectrum.
To contain inflation, the U.S. Federal Reserve (“Fed”) tightened monetary policy rapidly, raising short-term interest rates eight times over the course of the reporting period. The pace of tightening accelerated as the Fed twice stepped up the increment of increase before reducing it again as inflation began to subside. The Fed also started to reduce the size of its balance sheet by reducing the store of U.S. Treasuries it had accumulated to stabilize markets in the early phases of the coronavirus pandemic. While the Fed indicated that more tightening could be needed to achieve its long-term inflation goal, it sounded a more cautious note about the potential for further interest rate increases near the end of the reporting period.
Despite economic headwinds, corporate profits remained robust, and many companies were able to sufficiently raise prices to preserve profit margins even in the face of rising labor and input costs. Nonetheless, profits declined overall in the fourth quarter of 2022, and the yield curve (a graphical representation of U.S. Treasury rates at different maturities) inverted, a sign that markets were concerned about the impact of higher borrowing costs on the economy. Furthermore, dwindling personal savings and rising household debt raised questions about the sustainability of consumer spending as an engine of economic growth.
| | |
| 4 | | 2 0 2 3 I SHARES ANNUAL REPORT TO SHAREHOLDERS |
| | |
| Fund Summary as of March 31, 2023 | | iShares® Core S&P Mid-Cap ETF |
Investment Objective
The iShares Core S&P Mid-Cap ETF (the “Fund”) seeks to track the investment results of an index composed of mid-capitalization U.S. equities, as represented by the S&P MidCap 400® (the “Index”). The Fund invests in a representative sample of securities included in the Index that collectively has an investment profile similar to the Index. Due to the use of representative sampling, the Fund may or may not hold all of the securities that are included in the Index.
Performance
| | | | | | | | | | | | | | | | | | | | | | | | |
| | | Average Annual Total Returns | | | Cumulative Total Returns | |
| | | | | | | | | | | | | | | | | | | |
| | | | | | |
| | | 1 Year | | | 5 Years | | | 10 Years | | | 1 Year | | | 5 Years | | | 10 Years | |
| | | | | | |
Fund NAV | | | (5.13 | )% | | | 7.62 | % | | | 9.73 | % | | | (5.13 | )% | | | 44.36 | % | | | 153.14 | % |
| | | | | | |
Fund Market | | | (5.11 | ) | | | 7.61 | | | | 9.74 | | | | (5.11 | ) | | | 44.31 | | | | 153.31 | |
| | | | | | |
Index | | | (5.12 | ) | | | 7.67 | | | | 9.80 | | | | (5.12 | ) | | | 44.72 | | | | 154.67 | |
GROWTH OF $10,000 INVESTMENT
(AT NET ASSET VALUE)
Past performance is not an indication of future results. Performance results do not reflect the deduction of taxes that a shareholder would pay on fund distributions or on the redemption or sale of fund shares. See “About Fund Performance” for more information.
Expense Example
| | | | | | | | | | | | | | | | | | | | | | | | | | | | |
| Actual | | | | | | Hypothetical 5% Return | | | |
| | | | | | | | | | | | | | | | | | | | | | |
| | | | | | | |
| Beginning
Account Value (10/01/22) |
| |
| Ending
Account Value (03/31/23) |
| |
| Expenses
Paid During the Period |
(a) | | | | | |
| Beginning
Account Value (10/01/22) |
| |
| Ending
Account Value (03/31/23) |
| |
| Expenses
Paid During the Period |
(a) | | Annualized Expense Ratio |
| | | | | | | |
| | $ 1,000.00 | | | | $ 1,150.00 | | | | $ 0.27 | | | | | | | | $ 1,000.00 | | | | $ 1,024.68 | | | | $ 0.25 | | | 0.05% |
| (a) | Expenses are equal to the annualized expense ratio, multiplied by the average account value over the period, multiplied by 182/365 (to reflect the one-half year period shown). Other fees, such as brokerage commissions and other fees to financial intermediaries, may be paid which are not reflected in the tables and examples above. See “Disclosure of Expenses” for more information. | |
| | |
| Fund Summary as of March 31, 2023 (continued) | | iShares® Core S&P Mid-Cap ETF |
Portfolio Management Commentary
Mid-capitalization U.S. stocks declined for the reporting period, as high inflation and tighter financial conditions impeded economic growth and weighed on equities. The real estate sector detracted the most from the Index’s return, amid higher interest rates. Equity real estate investment trusts (“REITs”) were the largest source of weakness. REITs typically take on substantial debt to finance the purchase of the properties they manage, and higher interest rates make financing more expensive for REITs. An ongoing oversupply of office space due to the shift toward remote work and more stringent lending standards after the failure of two prominent banks late in the reporting period negatively affected office REITs. In addition, analysts’ concerns about the solvency of several large tenants of medical facilities negatively impacted the healthcare REIT industry.
The financials sector also detracted significantly from the Index’s performance amid tightening financial conditions. The banking industry faced significant challenges, as the potential impact of a slowing economy outweighed the benefits of being able to charge more for loans. Bank stocks were further pressured late in the reporting period after the sudden failure of two regional banks.
The healthcare sector also weighed on performance, primarily due to weakness in the healthcare equipment and supplies industry. Medical device manufacturers faced challenges in meeting demand, as high inflation, supply chain disruptions, and a tight labor market constrained the industry. Healthcare providers also declined amid labor market tightness and higher financing costs.
On the upside, the industrials sector contributed to the Index’s return, as the capital goods industry benefited from government incentives that encouraged investments in additional industrial capacity. Investments in prefabrication capabilities boosted construction and engineering companies, while the machinery industry benefited from increased efficiency and supply chain improvements.
Portfolio Information
SECTOR ALLOCATION
| | |
| Sector | | Percent of
Total Investments(a) |
| |
Industrials | | 21.9% |
| |
Consumer Discretionary | | 15.2 |
| |
Financials | | 14.5 |
| |
Information Technology | | 10.4 |
| |
Health Care | | 9.4 |
| |
Real Estate | | 7.6 |
| |
Materials | | 6.9 |
| |
Consumer Staples | | 4.4 |
| |
Energy | | 3.8 |
| |
Utilities | | 3.8 |
| |
Communication Services | | 2.1 |
| (a) | Excludes money market funds. |
TEN LARGEST HOLDINGS
| | |
| Security | | Percent of
Total Investments(a) |
| |
Axon Enterprise, Inc. | | 0.7% |
| |
Reliance Steel & Aluminum Co. | | 0.7 |
| |
Lattice Semiconductor Corp. | | 0.6 |
| |
Builders FirstSource, Inc. | | 0.6 |
| |
Hubbell, Inc. | | 0.6 |
| |
Graco, Inc. | | 0.6 |
| |
Deckers Outdoor Corp. | | 0.6 |
| |
Jabil, Inc. | | 0.5 |
| |
AECOM | | 0.5 |
| |
Carlisle Cos., Inc. | | 0.5 |
| | |
| 6 | | 2 0 2 3 I SHARES ANNUAL REPORT TO SHAREHOLDERS |
| | |
| Fund Summary as of March 31, 2023 | | iShares® Core S&P Small-Cap ETF |
Investment Objective
The iShares Core S&P Small-Cap ETF (the “Fund”) seeks to track the investment results of an index composed of small-capitalization U.S. equities, as represented by the S&P SmallCap 600® (the “Index”). The Fund invests in a representative sample of securities included in the Index that collectively has an investment profile similar to the Index. Due to the use of representative sampling, the Fund may or may not hold all of the securities that are included in the Index.
Performance
| | | | | | | | | | | | | | | | | | | | | | | | |
| | | Average Annual Total Returns | | | Cumulative Total Returns | |
| | | | | | | | | | | | | | | | | | | |
| | | | | | |
| | | 1 Year | | | 5 Years | | | 10 Years | | | 1 Year | | | 5 Years | | | 10 Years | |
| | | | | | |
Fund NAV | | | (8.90 | )% | | | 6.24 | % | | | 9.83 | % | | | (8.90 | )% | | | 35.32 | % | | | 155.34 | % |
| | | | | | |
Fund Market | | | (8.92 | ) | | | 6.23 | | | | 9.82 | | | | (8.92 | ) | | | 35.30 | | | | 155.28 | |
| | | | | | |
Index | | | (8.82 | ) | | | 6.30 | | | | 9.87 | | | | (8.82 | ) | | | 35.71 | | | | 156.25 | |
GROWTH OF $10,000 INVESTMENT
(AT NET ASSET VALUE)
Past performance is not an indication of future results. Performance results do not reflect the deduction of taxes that a shareholder would pay on fund distributions or on the redemption or sale of fund shares. See “About Fund Performance” for more information.
Expense Example
| | | | | | | | | | | | | | | | | | | | | | | | | | | | |
| Actual | | | | | | Hypothetical 5% Return | | | |
| | | | | | | | | | | | | | | | | | | | | | |
| | | | | | | |
| Beginning
Account Value (10/01/22) |
| |
| Ending
Account Value (03/31/23) |
| |
| Expenses
Paid During the Period |
(a) | | | | | |
| Beginning
Account Value (10/01/22) |
| |
| Ending
Account Value (03/31/23) |
| |
| Expenses
Paid During the Period |
(a) | | Annualized Expense Ratio |
| | | | | | | |
| | $ 1,000.00 | | | | $ 1,119.50 | | | | $ 0.32 | | | | | | | | $ 1,000.00 | | | | $ 1,024.63 | | | | $ 0.30 | | | 0.06% |
| (a) | Expenses are equal to the annualized expense ratio, multiplied by the average account value over the period, multiplied by 182/365 (to reflect the one-half year period shown). Other fees, such as brokerage commissions and other fees to financial intermediaries, may be paid which are not reflected in the tables and examples above. See “Disclosure of Expenses” for more information. | |
| | |
| Fund Summary as of March 31, 2023 (continued) | | iShares® Core S&P Small-Cap ETF |
Portfolio Management Commentary
Small-capitalization U.S. stocks declined for the reporting period, as high inflation and tighter financial conditions impeded economic growth and weighed on equities. The financials sector detracted the most from the Index’s performance amid tightening financial conditions. The banking industry faced significant challenges as the potential impact of a slowing economy outweighed the benefits of being able to charge more for loans. Persistently high inflation led to significant tightening from the Fed, and investors became concerned about the long-term effect on loan growth and credit losses. Bank stocks were further pressured late in the reporting period after the sudden failure of two regional banks.
The real estate sector detracted significantly from the Index’s return, as higher interest rates and changing usage patterns weighed on equity real estate investment trusts (“REITs”). REITs typically take on substantial debt to finance the purchase of the properties they manage. Higher interest rates made financing more expensive for REITs, and increased bond yields made dividend yields from REITs comparatively less attractive to income-oriented investors.
Stocks in the healthcare sector also detracted, primarily due to weakness in the healthcare equipment industry. Staffing shortages, higher financing costs, and significant debt weighed on healthcare providers. Meanwhile, medical device makers faced challenges meeting high demand amid supply chain issues and the tight labor market. The biotechnology industry also declined, constrained by higher interest rates and challenging market conditions. Companies shut down less promising development projects and engaged in layoffs to conserve cash.
On the upside, industrials stocks contributed to the Index’s return, as the capital goods industry benefited from government incentives that encouraged investments in additional industrial capacity. Consumer staples stocks also advanced, as the beverages industry gained amid consumers’ increasing purchases of packaged products relative to fresh foods.
Portfolio Information
SECTOR ALLOCATION
| | |
| | |
| Sector | | Percent of
Total Investments(a) |
| |
Industrials | | 17.8% |
| |
Financials | | 15.8 |
| |
Consumer Discretionary | | 14.3 |
| |
Information Technology | | 13.5 |
| |
Health Care | | 11.1 |
| |
Real Estate | | 7.1 |
| |
Materials | | 5.8 |
| |
Consumer Staples | | 5.5 |
| |
Energy | | 4.6 |
| |
Utilities | | 2.3 |
| |
Communication Services | | 2.2 |
| (a) | Excludes money market funds. |
TEN LARGEST HOLDINGS
| | |
| | |
| Security | | Percent of
Total Investments(a) |
| |
Rambus, Inc. | | 0.6% |
| |
SPS Commerce, Inc. | | 0.6 |
| |
Applied Industrial Technologies, Inc. | | 0.6 |
| |
Ensign Group, Inc. | | 0.6 |
| |
Comfort Systems U.S.A., Inc. | | 0.6 |
| |
ATI, Inc. | | 0.6 |
| |
Academy Sports & Outdoors, Inc. | | 0.6 |
| |
Asbury Automotive Group, Inc. | | 0.5 |
| |
Axcelis Technologies, Inc. | | 0.5 |
| |
Fabrinet | | 0.5 |
| | |
| 8 | | 2 0 2 3 I SHARES ANNUAL REPORT TO SHAREHOLDERS |
| | |
| Fund Summary as of March 31, 2023 | | iShares® Core S&P U.S. Growth ETF |
Investment Objective
The iShares Core S&P U.S. Growth ETF (the “Fund”) seeks to track the investment results of an index composed of large-and mid-capitalization U.S. equities that exhibit growth characteristics, as represented by the S&P 900 Growth Index™ (the “Index”). The Fund invests in a representative sample of securities included in the Index that collectively has an investment profile similar to the Index. Due to the use of representative sampling, the Fund may or may not hold all of the securities that are included in the Index.
Performance
| | | | | | | | | | | | | | | | | | | | | | | | |
| | | Average Annual Total Returns | | | Cumulative Total Returns | |
| | | 1 Year | | | 5 Years | | | 10 Years | | | 1 Year | | | 5 Years | | | 10 Years | |
| | | | | | |
Fund NAV | | | (14.86 | )% | | | 11.52 | % | | | 13.18 | % | | | (14.86 | )% | | | 72.52 | % | | | 244.85 | % |
| | | | | | |
Fund Market | | | (15.06 | ) | | | 11.49 | | | | 13.18 | | | | (15.06 | ) | | | 72.27 | | | | 244.83 | |
| | | | | | |
Index | | | (14.83 | ) | | | 11.59 | | | | 13.26 | | | | (14.83 | ) | | | 73.02 | | | | 247.28 | |
GROWTH OF $10,000 INVESTMENT
(AT NET ASSET VALUE)
Index performance through January 22, 2017 reflects the performance of the Russell 3000® Growth Index. Index performance beginning on January 23, 2017 reflects the performance of the S&P 900 Growth IndexTM.
Past performance is not an indication of future results. Performance results do not reflect the deduction of taxes that a shareholder would pay on fund distributions or on the redemption or sale of fund shares. See “About Fund Performance” for more information.
Expense Example
| | | | | | | | | | | | | | | | | | | | | | | | | | | | |
| Actual | | | | | | Hypothetical 5% Return | | | |
| | | | | | | | | | | | | | | | | | | | | | |
| | | | | | | |
| Beginning
Account Value (10/01/22) |
| |
| Ending
Account Value (03/31/23) |
| |
| Expenses
Paid During the Period |
(a) | | | | | |
| Beginning
Account Value (10/01/22) |
| |
| Ending
Account Value (03/31/23) |
| |
| Expenses
Paid During the Period |
(a) | | Annualized Expense Ratio |
| | | | | | | |
| | $ 1,000.00 | | | | $ 1,113.90 | | | | $ 0.21 | | | | | | | | $ 1,000.00 | | | | $ 1,024.73 | | | | $ 0.20 | | | 0.04% |
| (a) | Expenses are equal to the annualized expense ratio, multiplied by the average account value over the period, multiplied by 182/365 (to reflect the one-half year period shown). Other fees, such as brokerage commissions and other fees to financial intermediaries, may be paid which are not reflected in the tables and examples above. See “Disclosure of Expenses” for more information. | |
| | |
| Fund Summary as of March 31, 2023 (continued) | | iShares® Core S&P U.S. Growth ETF |
Portfolio Management Commentary
Growth-oriented large- and mid-capitalization U.S. stocks declined for the reporting period, as high inflation and tighter financial conditions impeded economic growth and weighed on equities. Large- and mid-capitalization growth stocks, which derive a significant portion of their price from investors’ expectations of future growth, faced significant headwinds relative to other equities. Growth stocks are particularly sensitive to interest rates, which rose notably as the Fed sharply tightened monetary policy.
The consumer discretionary sector detracted the most from the Index’s return, primarily due to weakness in the internet and direct marketing retail industry. The pandemic-related rise in e-commerce waned, as more workers returned to the office and brick-and-mortar retailers gained market share. In addition, excess warehouse capacity weighed on industry cash flow. Slowing revenue growth from data cloud services further pressured industry profitability, as business customers reduced expenditures amid economic uncertainty. The automobiles industry also declined amid concerns about the market for electric vehicles (“EVs”) in the weakening economy. While EV sales grew, production did not meet analysts’ expectations.
The information technology sector detracted significantly from the Index’s return, as rising interest rates reduced the current value of future earnings. The software and services industry declined amid high inflation and slow economic growth, as cuts to corporate information technology budgets reduced revenue growth. Slowing growth in cloud-based software sales, which provide software companies with steady revenue streams, further constrained earnings.
The communication services sector also declined amid rising interest rates, particularly high-valuation stocks with growth prospects in the interactive media and services industry. Demand for online advertisements slowed, as businesses cut back on marketing expenditures in a more challenging economic environment. Heightened competition also worked against large companies in the industry, which lost market share to new players.
Portfolio Information
SECTOR ALLOCATION
| | |
| | |
| Sector | | Percent of
Total Investments(a) |
| |
Information Technology | | 32.5% |
| |
Health Care | | 18.3 |
| |
Consumer Discretionary | | 10.0 |
| |
Financials | | 7.5 |
| |
Energy | | 7.2 |
| |
Consumer Staples | | 6.9 |
| |
Communication Services | | 6.7 |
| |
Industrials | | 6.5 |
| |
Materials | | 2.6 |
| |
Real Estate | | 1.1 |
| |
Other (each representing less than 1%) | | 0.7 |
| (a) | Excludes money market funds. |
TEN LARGEST HOLDINGS
| | |
| | |
| Security | | Percent of
Total Investments(a) |
| |
Apple Inc. | | 12.7% |
| |
Microsoft Corp. | | 6.4 |
| |
NVIDIA Corp. | | 3.5 |
| |
Alphabet, Inc., Class A | | 3.2 |
| |
Tesla, Inc. | | 2.9 |
| |
Alphabet, Inc., Class C, NVS | | 2.8 |
| |
Exxon Mobil Corp. | | 2.3 |
| |
UnitedHealth Group, Inc. | | 2.3 |
| |
Amazon.com, Inc. | | 2.2 |
| |
Visa, Inc., Class A | | 1.9 |
| | |
| 10 | | 2 0 2 3 I SHARES ANNUAL REPORT TO SHAREHOLDERS |
| | |
| Fund Summary as of March 31, 2023 | | iShares® Core S&P U.S. Value ETF |
Investment Objective
The iShares Core S&PU.S.Value ETF(the “Fund”) seeks to track the investment results of an index composed of large- and mid-capitalization U.S. equities that exhibit value characteristics, as represented by the S&P 900 Value Index™ (the “Index”). The Fund invests in a representative sample of securities included in the Index that collectively has an investment profile similar to the Index. Due to the use of representative sampling, the Fund may or may not hold all of the securities that are included in the Index.
Performance
| | | | | | | | | | | | | | | | | | | | | | | | |
| | | Average Annual Total Returns | | | Cumulative Total Returns | |
| | | 1 Year | | | 5 Years | | | 10 Years | | | 1 Year | | | 5 Years | | | 10 Years | |
| | | | | | |
Fund NAV | | | (0.46 | )% | | | 9.37 | % | | | 10.09 | % | | | (0.46 | )% | | | 56.48 | % | | | 161.61 | % |
| | | | | | |
Fund Market | | | (0.55 | ) | | | 9.36 | | | | 10.10 | | | | (0.55 | ) | | | 56.44 | | | | 161.68 | |
| | | | | | |
Index | | | (0.39 | ) | | | 9.39 | | | | 10.15 | | | | (0.39 | ) | | | 56.60 | | | | 162.92 | |
GROWTH OF $10,000 INVESTMENT
(AT NET ASSET VALUE)
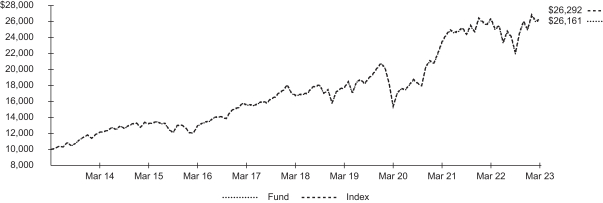
Index performance through January 22, 2017 reflects the performance of the Russell 3000® Value Index. Index performance beginning on January 23, 2017 reflects the performance of the S&P 900 Value IndexTM.
Past performance is not an indication of future results. Performance results do not reflect the deduction of taxes that a shareholder would pay on fund distributions or on the redemption or sale of fund shares. See “About Fund Performance” for more information.
Expense Example
| | | | | | | | | | | | | | | | | | | | | | | | | | | | |
| Actual | | | | | | Hypothetical 5% Return | | | |
| | | | | | | | | | | | | | | | | | | | | | |
| | | | | | | |
| Beginning
Account Value (10/01/22) |
| |
| Ending
Account Value (03/31/23) |
| |
| Expenses
Paid During the Period |
(a) | | | | | |
| Beginning
Account Value (10/01/22) |
| |
| Ending
Account Value (03/31/23) |
| |
| Expenses
Paid During the Period |
(a) | | Annualized Expense Ratio |
| | | | | | | |
| | $ 1,000.00 | | | | $ 1,192.00 | | | | $ 0.22 | | | | | | | | $ 1,000.00 | | | | $ 1,024.73 | | | | $ 0.20 | | | 0.04% |
| (a) | Expenses are equal to the annualized expense ratio, multiplied by the average account value over the period, multiplied by 182/365 (to reflect the one-half year period shown). Other fees, such as brokerage commissions and other fees to financial intermediaries, may be paid which are not reflected in the tables and examples above. See “Disclosure of Expenses” for more information. | |
| | |
| Fund Summary as of March 31, 2023 (continued) | | iShares® Core S&P U.S. Value ETF |
Portfolio Management Commentary
Value-oriented large- and mid-capitalization U.S. stocks declined for the reporting period, as high inflation and tighter financial conditions impeded economic growth and weighed on equities. The financials sector detracted the most from the Index’s performance amid tightening financial conditions. The banking industry faced significant challenges, as the potential impact of a slowing economy outweighed the benefits of being able to charge more for loans. While bank profitability is typically supported by higher interest rates, persistently high inflation led to significant tightening from the Fed, and investors became concerned about the long-term effect of this tightening on loan growth and credit losses. Bank stocks were further pressured late in the reporting period after the sudden failure of two regional banks led to government intervention to cover depositors and prevent a contagion effect.
The real estate sector detracted significantly from the Index’s return, as higher interest rates weighed on equity real estate investment trusts (“REITs”). REITs typically take on substantial debt to finance property purchases, and higher interest rates make financing more expensive. Utilities stocks also declined, as tighter financing and a rise in borrowing costs negatively impacted the highly indebted sector.
On the upside, stocks in the energy sector contributed to the Index’s return, as the price of oil and natural gas surged in the aftermath of Russia’s invasion of Ukraine. While prices subsequently fell as markets stabilized, the relatively high average prices of energy commodities supported profitability in the oil, gas, and consumable fuels industry. The information technology and consumer discretionary sectors also contributed to the Index’s return, as a software company and an internet retailer were added to the Index upon rebalancing in December 2022 and advanced thereafter.
Portfolio Information
SECTOR ALLOCATION
| | |
| | |
| Sector | | Percent of
Total Investments(a) |
| |
Financials | | 19.2% |
| |
Information Technology | | 16.8 |
| |
Industrials | | 12.7 |
| |
Consumer Discretionary | | 10.9 |
| |
Communication Services | | 9.0 |
| |
Health Care | | 9.0 |
| |
Consumer Staples | | 7.2 |
| |
Utilities | | 5.4 |
| |
Real Estate | | 4.9 |
| |
Materials | | 3.3 |
| |
Energy | | 1.6 |
| (a) | Excludes money market funds. |
TEN LARGEST HOLDINGS
| | |
| | |
| Security | | Percent of
Total Investments(a) |
| |
Microsoft Corp. | | 5.3% |
| |
Berkshire Hathaway, Inc., Class B | | 3.3 |
| |
Amazon.com, Inc. | | 2.9 |
| |
Meta Platforms, Inc., Class A | | 2.8 |
| |
JPMorgan Chase & Co. | | 2.2 |
| |
Cisco Systems, Inc. | | 1.3 |
| |
Walmart, Inc. | | 1.2 |
| |
Salesforce, Inc. | | 1.2 |
| |
Bank of America Corp. | | 1.2 |
| |
Walt Disney Co. | | 1.1 |
| | |
| 12 | | 2 0 2 3 I SHARES ANNUAL REPORT TO SHAREHOLDERS |
About Fund Performance
Past performance is not an indication of future results. Financial markets have experienced extreme volatility and trading in many instruments has been disrupted. These circumstances may continue for an extended period of time and may continue to affect adversely the value and liquidity of each Fund’s investments. As a result, current performance may be lower or higher than the performance data quoted. Performance data current to the most recent month-end is available at iShares.com. Performance results assume reinvestment of all dividends and capital gain distributions and do not reflect the deduction of taxes that a shareholder would pay on fund distributions or on the redemption or sale of fund shares. The investment return and principal value of shares will vary with changes in market conditions. Shares may be worth more or less than their original cost when they are redeemed or sold in the market. Performance for certain funds may reflect a waiver of a portion of investment advisory fees. Without such a waiver, performance would have been lower.
Net asset value or “NAV” is the value of one share of a fund as calculated in accordance with the standard formula for valuing mutual fund shares. Beginning August 10, 2020, the price used to calculate market return (“Market Price”) is the closing price. Prior to August 10, 2020, Market Price was determined using the midpoint between the highest bid and the lowest ask on the primary stock exchange on which shares of a fund are listed for trading, as of the time that such fund’s NAV is calculated. Market and NAV returns assume that dividends and capital gain distributions have been reinvested at Market Price and NAV, respectively.
An index is a statistical composite that tracks a specified financial market or sector. Unlike a fund, an index does not actually hold a portfolio of securities and therefore does not incur the expenses incurred by a fund. These expenses negatively impact fund performance. Also, market returns do not include brokerage commissions that may be payable on secondary market transactions. If brokerage commissions were included, market returns would be lower.
Disclosure of Expenses
Shareholders of each Fund may incur the following charges: (1) transactional expenses, including brokerage commissions on purchases and sales of fund shares and (2) ongoing expenses, including management fees and other fund expenses. The expense examples shown (which are based on a hypothetical investment of $1,000 invested at the beginning of the period and held through the end of the period) are intended to assist shareholders both in calculating expenses based on an investment in each Fund and in comparing these expenses with similar costs of investing in other funds.
The expense examples provide information about actual account values and actual expenses. Annualized expense ratios reflect contractual and voluntary fee waivers, if any. In order to estimate the expenses a shareholder paid during the period covered by this report, shareholders can divide their account value by $1,000 and then multiply the result by the number under the heading entitled “Expenses Paid During the Period.”
The expense examples also provide information about hypothetical account values and hypothetical expenses based on a fund’s actual expense ratio and an assumed rate of return of 5% per year before expenses. In order to assist shareholders in comparing the ongoing expenses of investing in the Funds and other funds, compare the 5% hypothetical examples with the 5% hypothetical examples that appear in the shareholder reports of the other funds.
The expenses shown in the expense examples are intended to highlight shareholders’ ongoing costs only and do not reflect any transactional expenses, such as brokerage commissions and other fees paid on purchases and sales of fund shares. Therefore, the hypothetical examples are useful in comparing ongoing expenses only and will not help shareholders determine the relative total expenses of owning different funds. If these transactional expenses were included, shareholder expenses would have been higher.
| | |
ABOUT FUND PERFORMANCE / DISCLOSURE OF EXPENSES | | 13 |
| | |
Schedule of Investments March 31, 2023 | | iShares® Core S&P Mid-Cap ETF (Percentages shown are based on Net Assets) |
| | | | | | | | |
| Security | | Shares | | | Value | |
| | |
Common Stocks | | | | | | | | |
| | |
| Aerospace & Defense — 1.7% | | | | | | |
Axon Enterprise, Inc.(a)(b) | | | 2,088,426 | | | $ | 469,582,586 | |
Curtiss-Wright Corp.(b) | | | 1,183,368 | | | | 208,580,444 | |
Hexcel Corp.(b) | | | 2,603,648 | | | | 177,698,976 | |
Mercury Systems, Inc.(a)(b) | | | 1,794,956 | | | | 91,758,151 | |
Woodward, Inc. | | | 1,845,038 | | | | 179,651,350 | |
| | | | | | | | |
| | |
| | | | | | | 1,127,271,507 | |
| | |
| Air Freight & Logistics — 0.3% | | | | | | |
GXO Logistics, Inc.(a)(b) | | | 3,664,874 | | | | 184,929,542 | |
| | | | | | | | |
| | |
| Automobile Components — 1.9% | | | | | | |
Adient PLC(a)(b) | | | 2,946,445 | | | | 120,686,387 | |
Autoliv, Inc. | | | 2,396,254 | | | | 223,714,274 | |
Dana, Inc. | | | 3,940,927 | | | | 59,310,951 | |
Fox Factory Holding Corp.(a)(b) | | | 1,305,669 | | | | 158,469,047 | |
Gentex Corp. | | | 7,246,461 | | | | 203,118,302 | |
Goodyear Tire & Rubber Co.(a)(b) | | | 8,737,821 | | | | 96,290,787 | |
Lear Corp. | | | 1,826,598 | | | | 254,792,155 | |
Visteon Corp.(a)(b) | | | 869,387 | | | | 136,345,963 | |
| | | | | | | | |
| | |
| | | | | | | 1,252,727,866 | |
| | |
| Automobiles — 0.4% | | | | | | |
Harley-Davidson, Inc. | | | 4,109,358 | | | | 156,032,323 | |
Thor Industries, Inc. | | | 1,653,265 | | | | 131,666,025 | |
| | | | | | | | |
| | |
| | | | | | | 287,698,348 | |
| | |
| Banks — 6.1% | | | | | | |
Associated Banc-Corp. | | | 4,644,725 | | | | 83,512,155 | |
Bank of Hawaii Corp.(b) | | | 1,230,540 | | | | 64,086,523 | |
Bank OZK | | | 3,402,520 | | | | 116,366,184 | |
Cadence Bank | | | 4,677,987 | | | | 97,115,010 | |
Cathay General Bancorp | | | 2,247,063 | | | | 77,568,615 | |
Columbia Banking System, Inc. | | | 6,424,245 | | | | 137,607,328 | |
Commerce Bancshares, Inc. | | | 3,513,814 | | | | 205,031,047 | |
Cullen/Frost Bankers, Inc. | | | 1,988,129 | | | | 209,429,509 | |
East West Bancorp, Inc. | | | 4,353,973 | | | | 241,645,501 | |
First Financial Bankshares, Inc.(b) | | | 4,009,753 | | | | 127,911,121 | |
First Horizon Corp. | | | 16,576,382 | | | | 294,728,072 | |
FNB Corp. | | | 11,135,235 | | | | 129,168,726 | |
Fulton Financial Corp. | | | 5,177,301 | | | | 71,550,300 | |
Glacier Bancorp, Inc. | | | 3,422,030 | | | | 143,759,480 | |
Hancock Whitney Corp. | | | 2,647,144 | | | | 96,356,042 | |
Home BancShares, Inc. | | | 5,844,366 | | | | 126,881,186 | |
International Bancshares Corp. | | | 1,630,957 | | | | 69,837,579 | |
New York Community Bancorp, Inc., Class A | | | 21,043,420 | | | | 190,232,517 | |
Old National Bancorp | | | 9,048,033 | | | | 130,472,636 | |
PacWest Bancorp(b) | | | 3,636,269 | | | | 35,380,897 | |
Pinnacle Financial Partners, Inc. | | | 2,363,124 | | | | 130,349,920 | |
Prosperity Bancshares, Inc. | | | 2,820,786 | | | | 173,534,755 | |
SouthState Corp. | | | 2,338,388 | | | | 166,633,529 | |
Synovus Financial Corp. | | | 4,494,223 | | | | 138,556,895 | |
Texas Capital Bancshares, Inc.(a)(b) | | | 1,489,783 | | | | 72,939,776 | |
UMB Financial Corp. | | | 1,343,360 | | | | 77,538,739 | |
United Bankshares, Inc. | | | 4,151,687 | | | | 146,139,382 | |
Valley National Bancorp | | | 12,983,161 | | | | 119,964,408 | |
Webster Financial Corp. | | | 5,375,253 | | | | 211,892,473 | |
Wintrust Financial Corp. | | | 1,877,073 | | | | 136,932,475 | |
| | | | | | | | |
| | |
| | | | | | | 4,023,122,780 | |
| | |
| Beverages — 0.4% | | | | | | |
Boston Beer Co., Inc., Class A, NVS(a)(b) | | | 291,200 | | | | 95,717,440 | |
| | | | | | | | |
| Security | | Shares | | | Value | |
| | |
| Beverages (continued) | | | | | | |
Celsius Holdings, Inc.(a)(b) | | | 1,247,971 | | | $ | 115,986,425 | |
Coca-Cola Consolidated, Inc. | | | 142,192 | | | | 76,084,095 | |
| | | | | | | | |
| | |
| | | | | | | 287,787,960 | |
| | |
| Biotechnology — 1.6% | | | | | | |
Arrowhead Pharmaceuticals, Inc.(a)(b) | | | 3,345,792 | | | | 84,983,117 | |
Exelixis, Inc.(a)(b) | | | 10,011,330 | | | | 194,319,915 | |
Halozyme Therapeutics, Inc.(a)(b) | | | 4,176,872 | | | | 159,514,742 | |
Neurocrine Biosciences, Inc.(a) | | | 2,983,677 | | | | 302,007,786 | |
United Therapeutics Corp.(a) | | | 1,407,922 | | | | 315,318,211 | |
| | | | | | | | |
| | |
| | | | | | | 1,056,143,771 | |
| | |
| Broadline Retail — 0.6% | | | | | | |
Kohl’s Corp. | | | 3,412,949 | | | | 80,340,819 | |
Macy’s, Inc. | | | 8,374,906 | | | | 146,477,106 | |
Nordstrom, Inc.(b) | | | 3,461,429 | | | | 56,317,450 | |
Ollie’s Bargain Outlet Holdings, Inc.(a)(b) | | | 1,788,022 | | | | 103,597,995 | |
| | | | | | | | |
| | |
| | | | | | | 386,733,370 | |
| | |
| Building Products — 3.2% | | | | | | |
Advanced Drainage Systems, Inc.(b) | | | 1,932,234 | | | | 162,713,425 | |
Builders FirstSource, Inc.(a)(b) | | | 4,546,399 | | | | 403,629,303 | |
Carlisle Cos., Inc. | | | 1,597,535 | | | | 361,154,738 | |
Fortune Brands Innovations, Inc. | | | 3,961,523 | | | | 232,660,246 | |
Lennox International, Inc. | | | 997,115 | | | | 250,555,057 | |
Owens Corning | | | 2,886,958 | | | | 276,570,577 | |
Simpson Manufacturing Co., Inc. | | | 1,315,863 | | | | 144,271,219 | |
Trex Co., Inc.(a)(b) | | | 3,389,902 | | | | 164,986,530 | |
UFP Industries, Inc. | | | 1,904,042 | | | | 151,314,218 | |
| | | | | | | | |
| | |
| | | | | | | 2,147,855,313 | |
| | |
| Capital Markets — 2.0% | | | | | | |
Affiliated Managers Group, Inc. | | | 1,163,629 | | | | 165,724,042 | |
Evercore, Inc., Class A | | | 1,103,758 | | | | 127,351,598 | |
Federated Hermes, Inc., Class B | | | 2,611,426 | | | | 104,822,640 | |
Interactive Brokers Group, Inc., Class A | | | 3,177,834 | | | | 262,361,975 | |
Janus Henderson Group PLC | | | 4,093,845 | | | | 109,060,031 | |
Jefferies Financial Group, Inc. | | | 5,589,075 | | | | 177,397,241 | |
SEI Investments Co. | | | 3,149,726 | | | | 181,266,731 | |
Stifel Financial Corp. | | | 3,254,290 | | | | 192,295,996 | |
| | | | | | | | |
| | |
| | | | | | | 1,320,280,254 | |
| | |
| Chemicals — 2.9% | | | | | | |
Ashland, Inc. | | | 1,542,403 | | | | 158,420,212 | |
Avient Corp. | | | 2,640,791 | | | | 108,694,958 | |
Axalta Coating Systems Ltd.(a)(b) | | | 6,814,705 | | | | 206,417,414 | |
Cabot Corp. | | | 1,739,884 | | | | 133,344,710 | |
Chemours Co. | | | 4,582,232 | | | | 137,192,026 | |
Ingevity Corp.(a)(b) | | | 1,085,186 | | | | 77,612,503 | |
NewMarket Corp. | | | 206,801 | | | | 75,478,229 | |
Olin Corp. | | | 3,800,796 | | | | 210,944,178 | |
RPM International, Inc. | | | 3,987,723 | | | | 347,888,955 | |
Scotts Miracle-Gro Co. | | | 1,261,833 | | | | 88,000,233 | |
Sensient Technologies Corp. | | | 1,298,598 | | | | 99,420,663 | |
Valvoline, Inc. | | | 5,311,245 | | | | 185,574,900 | |
Westlake Corp.(b) | | | 1,063,734 | | | | 123,371,869 | |
| | | | | | | | |
| | |
| | | | | | | 1,952,360,850 | |
| | |
| Commercial Services & Supplies — 1.3% | | | | | | |
Brink’s Co.(b) | �� | | 1,434,891 | | | | 95,850,719 | |
Clean Harbors, Inc.(a)(b) | | | 1,553,445 | | | | 221,459,119 | |
MSA Safety, Inc. | | | 1,138,210 | | | | 151,951,035 | |
Stericycle, Inc.(a)(b) | | | 2,847,662 | | | | 124,186,540 | |
Tetra Tech, Inc.(b) | | | 1,644,181 | | | | 241,546,630 | |
| | | | | | | | |
| | |
| | | | | | | 834,994,043 | |
| | |
| 14 | | 2 0 2 3 I SHARES ANNUAL REPORT TO SHAREHOLDERS |
| | |
Schedule of Investments (continued) March 31, 2023 | | iShares® Core S&P Mid-Cap ETF (Percentages shown are based on Net Assets) |
| | | | | | | | |
| Security | | Shares | | | Value | |
| | |
| Communications Equipment — 0.7% | | | | | | |
Calix, Inc.(a)(b) | | | 1,758,750 | | | $ | 94,251,412 | |
Ciena Corp.(a)(b) | | | 4,584,675 | | | | 240,787,131 | |
Lumentum Holdings, Inc.(a)(b) | | | 2,115,951 | | | | 114,282,514 | |
| | | | | | | | |
| | |
| | | | | | | 449,321,057 | |
| | |
| Construction & Engineering — 2.0% | | | | | | |
AECOM | | | 4,292,283 | | | | 361,925,303 | |
EMCOR Group, Inc.(b) | | | 1,472,115 | | | | 239,351,178 | |
Fluor Corp.(a)(b) | | | 4,389,253 | | | | 135,671,810 | |
MasTec, Inc.(a)(b) | | | 1,830,296 | | | | 172,853,154 | |
MDU Resources Group, Inc. | | | 6,281,680 | | | | 191,465,606 | |
Valmont Industries, Inc. | | | 658,980 | | | | 210,399,135 | |
| | | | | | | | |
| | |
| | | | | | | 1,311,666,186 | |
| | |
| Construction Materials — 0.2% | | | | | | |
Eagle Materials, Inc. | | | 1,113,680 | | | | 163,432,540 | |
| | | | | | | | |
| | |
| Consumer Finance — 0.4% | | | | | | |
FirstCash Holdings, Inc. | | | 1,158,326 | | | | 110,469,550 | |
Navient Corp. | | | 3,132,329 | | | | 50,085,941 | |
SLM Corp. | | | 7,435,425 | | | | 92,124,916 | |
| | | | | | | | |
| | |
| | | | | | | 252,680,407 | |
|
| Consumer Staples Distribution & Retail — 1.9% | |
BJ’s Wholesale Club Holdings, Inc.(a)(b) | | | 4,152,775 | | | | 315,901,594 | |
Casey’s General Stores, Inc. | | | 1,150,967 | | | | 249,138,317 | |
Grocery Outlet Holding Corp.(a)(b) | | | 2,734,563 | | | | 77,278,750 | |
Performance Food Group Co.(a)(b) | | | 4,823,314 | | | | 291,038,767 | |
Sprouts Farmers Market, Inc.(a)(b) | | | 3,269,859 | | | | 114,543,161 | |
U.S. Foods Holding Corp.(a)(b) | | | 6,321,971 | | | | 233,533,609 | |
| | | | | | | | |
| | |
| | | | | | | 1,281,434,198 | |
| | |
| Containers & Packaging — 0.9% | | | | | | |
AptarGroup, Inc.(b) | | | 2,016,675 | | | | 238,350,818 | |
Greif, Inc., Class A, NVS | | | 790,945 | | | | 50,122,185 | |
Silgan Holdings, Inc. | | | 2,584,343 | | | | 138,701,689 | |
Sonoco Products Co. | | | 3,012,253 | | | | 183,747,433 | |
| | | | | | | | |
| | |
| | | | | | | 610,922,125 | |
| | |
| Diversified Consumer Services — 1.0% | | | | | | |
Graham Holdings Co., Class B(b) | | | 118,564 | | | | 70,645,174 | |
Grand Canyon Education, Inc.(a)(b) | | | 947,450 | | | | 107,914,555 | |
H&R Block, Inc.(b) | | | 4,703,976 | | | | 165,815,154 | |
Service Corp. International | | | 4,751,209 | | | | 326,788,155 | |
| | | | | | | | |
| | |
| | | | | | | 671,163,038 | |
|
| Diversified Telecommunication Services — 0.6% | |
Frontier Communications Parent, Inc.(a)(b) | | | 6,887,241 | | | | 156,822,478 | |
Iridium Communications, Inc.(b) | | | 3,881,239 | | | | 240,365,131 | |
| | | | | | | | |
| | |
| | | | | | | 397,187,609 | |
| | |
| Electric Utilities — 1.4% | | | | | | |
ALLETE, Inc. | | | 1,765,770 | | | | 113,662,615 | |
Hawaiian Electric Industries, Inc. | | | 3,381,625 | | | | 129,854,400 | |
IDACORP, Inc. | | | 1,561,917 | | | | 169,202,469 | |
OGE Energy Corp. | | | 6,184,431 | | | | 232,905,671 | |
PNM Resources, Inc. | | | 2,651,530 | | | | 129,076,480 | |
Portland General Electric Co. | | | 2,757,736 | | | | 134,825,713 | |
| | | | | | | | |
| | |
| | | | | | | 909,527,348 | |
| | |
Electrical Equipment — 2.1% | | | | | | | | |
Acuity Brands, Inc.(b) | | | 990,081 | | | | 180,917,501 | |
EnerSys | | | 1,261,930 | | | | 109,636,478 | |
Hubbell, Inc. | | | 1,655,766 | | | | 402,864,425 | |
nVent Electric PLC | | | 5,146,039 | | | | 220,970,915 | |
Regal Rexnord Corp. | | | 2,043,458 | | | | 287,575,844 | |
SunPower Corp.(a)(b) | | | 2,636,328 | | | | 36,486,780 | |
| | | | | | | | |
| Security | | Shares | | | Value | |
| | |
| Electrical Equipment (continued) | | | | | | |
Sunrun, Inc.(a)(b) | | | 6,582,967 | | | $ | 132,646,785 | |
Vicor Corp.(a)(b) | | | 688,491 | | | | 32,317,768 | |
| | | | | | | | |
| | |
| | | | | | | 1,403,416,496 | |
|
| Electronic Equipment, Instruments & Components — 3.5% | |
Arrow Electronics, Inc.(a)(b) | | | 1,800,463 | | | | 224,823,815 | |
Avnet, Inc. | | | 2,822,796 | | | | 127,590,379 | |
Belden, Inc.(b) | | | 1,322,320 | | | | 114,737,706 | |
Cognex Corp.(b) | | | 5,341,986 | | | | 264,695,406 | |
Coherent Corp.(a)(b) | | | 4,292,685 | | | | 163,465,445 | |
IPG Photonics Corp.(a)(b) | | | 993,175 | | | | 122,468,409 | |
Jabil, Inc.(b) | | | 4,116,972 | | | | 362,952,252 | |
Littelfuse, Inc. | | | 764,758 | | | | 205,023,972 | |
National Instruments Corp. | | | 4,033,410 | | | | 211,391,018 | |
Novanta, Inc.(a)(b) | | | 1,102,497 | | | | 175,396,248 | |
TD SYNNEX Corp. | | | 1,296,259 | | | | 125,464,909 | |
Vishay Intertechnology, Inc. | | | 4,002,489 | | | | 90,536,301 | |
Vontier Corp.(b) | | | 4,880,555 | | | | 133,434,374 | |
| | | | | | | | |
| | |
| | | | | | | 2,321,980,234 | |
| | |
| Energy Equipment & Services — 0.8% | | | | | | |
ChampionX Corp. | | | 6,136,089 | | | | 166,472,094 | |
NOV, Inc. | | | 12,134,088 | | | | 224,601,969 | |
Valaris Ltd.(a)(b) | | | 1,857,363 | | | | 120,840,037 | |
| | | | | | | | |
| | |
| | | | | | | 511,914,100 | |
| | |
| Entertainment — 0.2% | | | | | | |
World Wrestling Entertainment, Inc., Class A(b) | | | 1,339,033 | | | | 122,200,152 | |
| | | | | | | | |
| | |
| Financial Services — 1.5% | | | | | | |
Essent Group Ltd. | | | 3,326,420 | | | | 133,223,121 | |
Euronet Worldwide, Inc.(a)(b) | | | 1,455,411 | | | | 162,860,491 | |
MGIC Investment Corp. | | | 9,085,174 | | | | 121,923,035 | |
Voya Financial, Inc. | | | 2,996,437 | | | | 214,125,388 | |
Western Union Co. | | | 9,027,770 | | | | 100,659,636 | |
WEX, Inc.(a)(b) | | | 1,346,635 | | | | 247,632,710 | |
| | | | | | | | |
| | |
| | | | | | | 980,424,381 | |
| | |
| Food Products — 1.5% | | | | | | |
Darling Ingredients, Inc.(a)(b) | | | 4,950,928 | | | | 289,134,195 | |
Flowers Foods, Inc. | | | 5,935,109 | | | | 162,681,338 | |
Ingredion, Inc. | | | 2,029,372 | | | | 206,448,014 | |
Lancaster Colony Corp. | | | 613,204 | | | | 124,406,827 | |
Pilgrim’s Pride Corp.(a)(b) | | | 1,387,803 | | | | 32,169,273 | |
Post Holdings, Inc.(a)(b) | | | 1,656,269 | | | | 148,848,895 | |
| | | | | | | | |
| | |
| | | | | | | 963,688,542 | |
| | |
| Gas Utilities — 1.4% | | | | | | |
National Fuel Gas Co. | | | 2,835,614 | | | | 163,728,353 | |
New Jersey Resources Corp. | | | 2,992,909 | | | | 159,222,759 | |
ONE Gas, Inc. | | | 1,672,478 | | | | 132,510,432 | |
Southwest Gas Holdings, Inc. | | | 2,007,385 | | | | 125,361,193 | |
Spire, Inc. | | | 1,623,174 | | | | 113,849,424 | |
UGI Corp. | | | 6,473,395 | | | | 225,015,210 | |
| | | | | | | | |
| | |
| | | | | | | 919,687,371 | |
| | |
| Ground Transportation — 1.9% | | | | | | |
Avis Budget Group, Inc.(a)(b) | | | 768,575 | | | | 149,718,410 | |
Hertz Global Holdings, Inc.(a)(b) | | | 4,986,731 | | | | 81,233,848 | |
Knight-Swift Transportation Holdings, Inc.(b) | | | 4,964,054 | | | | 280,866,175 | |
Landstar System, Inc.(b) | | | 1,109,815 | | | | 198,945,437 | |
Ryder System, Inc. | | | 1,552,311 | | | | 138,528,234 | |
Saia, Inc.(a)(b) | | | 817,459 | | | | 222,414,245 | |
Werner Enterprises, Inc. | | | 1,816,323 | | | | 82,624,533 | |
XPO, Inc.(a)(b) | | | 3,552,458 | | | | 113,323,410 | |
| | | | | | | | |
| | |
| | | | | | | 1,267,654,292 | |
| | |
SCHEDULES OF INVESTMENTS | | 15 |
| | |
Schedule of Investments (continued) March 31, 2023 | | iShares® Core S&P Mid-Cap ETF (Percentages shown are based on Net Assets) |
| | | | | | | | |
| Security | | Shares | | | Value | |
|
| Health Care Equipment & Supplies — 3.6% | |
Enovis Corp.(a)(b) | | | 1,471,968 | | | $ | 78,735,568 | |
Envista Holdings Corp.(a)(b) | | | 5,041,375 | | | | 206,091,410 | |
Globus Medical, Inc., Class A(a)(b) | | | 2,405,039 | | | | 136,221,409 | |
Haemonetics Corp.(a)(b) | | | 1,558,397 | | | | 128,957,352 | |
ICU Medical, Inc.(a)(b) | | | 622,278 | | | | 102,650,979 | |
Inari Medical, Inc.(a)(b) | | | 1,491,659 | | | | 92,095,027 | |
Integra LifeSciences Holdings Corp.(a)(b) | | | 2,244,553 | | | | 128,859,788 | |
Lantheus Holdings, Inc.(a)(b) | | | 2,126,277 | | | | 175,545,429 | |
LivaNova PLC(a) | | | 1,653,284 | | | | 72,050,117 | |
Masimo Corp.(a)(b) | | | 1,493,888 | | | | 275,682,092 | |
Neogen Corp.(a)(b) | | | 6,677,185 | | | | 123,661,466 | |
Omnicell, Inc.(a)(b) | | | 1,379,253 | | | | 80,920,773 | |
Penumbra, Inc.(a)(b) | | | 1,173,205 | | | | 326,960,501 | |
QuidelOrtho Corp.(a)(b) | | | 1,652,568 | | | | 147,227,283 | |
Shockwave Medical, Inc.(a)(b) | | | 1,116,458 | | | | 242,081,588 | |
STAAR Surgical Co.(a)(b) | | | 1,489,138 | | | | 95,230,375 | |
| | | | | | | | |
| | |
| | | | | | | 2,412,971,157 | |
|
| Health Care Providers & Services — 2.1% | |
Acadia Healthcare Co., Inc.(a)(b) | | | 2,810,375 | | | | 203,049,594 | |
Amedisys, Inc.(a)(b) | | | 1,003,702 | | | | 73,822,282 | |
Chemed Corp. | | | 459,329 | | | | 247,004,170 | |
Encompass Health Corp. | | | 3,082,564 | | | | 166,766,712 | |
HealthEquity, Inc.(a)(b) | | | 2,614,615 | | | | 153,504,047 | |
Option Care Health, Inc.(a)(b) | | | 5,169,544 | | | | 164,236,413 | |
Patterson Cos., Inc. | | | 2,668,692 | | | | 71,440,885 | |
Progyny, Inc.(a)(b) | | | 2,324,086 | | | | 74,649,642 | |
R1 RCM, Inc.(a)(b) | | | 4,245,655 | | | | 63,684,825 | |
Tenet Healthcare Corp.(a)(b) | | | 3,340,015 | | | | 198,463,691 | |
| | | | | | | | |
| | |
| | | | | | | 1,416,622,261 | |
| | |
| Health Care REITs — 1.2% | | | | | | |
Healthcare Realty Trust, Inc. | | | 11,756,222 | | | | 227,247,771 | |
Medical Properties Trust, Inc. | | | 18,503,131 | | | | 152,095,737 | |
Omega Healthcare Investors, Inc. | | | 7,236,267 | | | | 198,346,079 | |
Physicians Realty Trust | | | 7,051,195 | | | | 105,274,341 | |
Sabra Health Care REIT, Inc. | | | 7,135,096 | | | | 82,053,604 | |
| | | | | | | | |
| | |
| | | | | | | 765,017,532 | |
| | |
| Hotel & Resort REITs — 0.1% | | | | | | |
Park Hotels & Resorts, Inc. | | | 6,945,607 | | | | 85,847,702 | |
| | | | | | | | |
| | |
| Hotels, Restaurants & Leisure — 3.4% | | | | | | |
Aramark | | | 8,047,655 | | | | 288,106,049 | |
Boyd Gaming Corp. | | | 2,450,425 | | | | 157,121,251 | |
Choice Hotels International, Inc.(b) | | | 856,147 | | | | 100,331,867 | |
Churchill Downs, Inc.(b) | | | 1,016,760 | | | | 261,358,158 | |
Hilton Grand Vacations, Inc.(a) | | | 2,451,325 | | | | 108,912,370 | |
Light & Wonder, Inc., Class A(a)(b) | | | 2,893,659 | | | | 173,764,223 | |
Marriott Vacations Worldwide Corp. | | | 1,183,739 | | | | 159,639,042 | |
Papa John’s International, Inc.(b) | | | 993,090 | | | | 74,412,234 | |
Penn Entertainment, Inc.(a)(b) | | | 4,791,743 | | | | 142,123,097 | |
Texas Roadhouse, Inc. | | | 2,067,057 | | | | 223,366,179 | |
Travel + Leisure Co. | | | 2,510,851 | | | | 98,425,359 | |
Wendy’s Co. | | | 5,264,464 | | | | 114,660,026 | |
Wingstop, Inc.(b) | | | 924,125 | | | | 169,650,867 | |
Wyndham Hotels & Resorts, Inc. | | | 2,728,387 | | | | 185,121,058 | |
| | | | | | | | |
| | |
| | | | | | | 2,256,991,780 | |
| | |
| Household Durables — 1.6% | | | | | | |
Helen of Troy Ltd.(a)(b) | | | 741,124 | | | | 70,532,771 | |
KB Home | | | 2,521,521 | | | | 101,314,714 | |
Leggett & Platt, Inc. | | | 4,096,121 | | | | 130,584,338 | |
Taylor Morrison Home Corp., Class A(a)(b) | | | 3,346,936 | | | | 128,053,771 | |
Tempur Sealy International, Inc. | | | 5,263,796 | | | | 207,867,304 | |
| | | | | | | | |
| Security | | Shares | | | Value | |
| | |
| Household Durables (continued) | | | | | | |
Toll Brothers, Inc. | | | 3,176,538 | | | $ | 190,687,576 | |
TopBuild Corp.(a)(b) | | | 987,638 | | | | 205,566,973 | |
| | | | | | | | |
| | |
| | | | | | | 1,034,607,447 | |
| | |
| Household Products — 0.1% | | | | | | |
Energizer Holdings, Inc. | | | 2,051,881 | | | | 71,200,271 | |
| | | | | | | | |
|
| Independent Power and Renewable Electricity Producers — 0.2% | |
Ormat Technologies, Inc.(b) | | | 1,621,222 | | | | 137,430,989 | |
| | | | | | | | |
| | |
| Industrial REITs — 1.2% | | | | | | |
EastGroup Properties, Inc. | | | 1,346,109 | | | | 222,538,740 | |
First Industrial Realty Trust, Inc. | | | 4,081,788 | | | | 217,151,122 | |
Rexford Industrial Realty, Inc. | | | 5,841,904 | | | | 348,469,573 | |
| | | | | | | | |
| | |
| | | | | | | 788,159,435 | |
| | |
| Insurance — 3.9% | | | | | | |
American Financial Group, Inc. | | | 2,146,383 | | | | 260,785,535 | |
Brighthouse Financial, Inc.(a)(b) | | | 2,109,162 | | | | 93,035,136 | |
CNO Financial Group, Inc. | | | 3,532,163 | | | | 78,378,697 | |
First American Financial Corp. | | | 3,201,611 | | | | 178,201,668 | |
Hanover Insurance Group, Inc. | | | 1,099,714 | | | | 141,313,249 | |
Kemper Corp. | | | 1,975,806 | | | | 107,997,556 | |
Kinsale Capital Group, Inc.(b) | | | 670,170 | | | | 201,151,526 | |
Old Republic International Corp. | | | 8,521,013 | | | | 212,769,695 | |
Primerica, Inc.(b) | | | 1,139,814 | | | | 196,321,563 | |
Reinsurance Group of America, Inc.(b) | | | 2,059,677 | | | | 273,442,719 | |
RenaissanceRe Holdings Ltd.(b) | | | 1,350,557 | | | | 270,570,589 | |
RLI Corp. | | | 1,250,106 | | | | 166,151,588 | |
Selective Insurance Group, Inc.(b) | | | 1,863,946 | | | | 177,689,972 | |
Unum Group | | | 5,776,743 | | | | 228,527,953 | |
| | | | | | | | |
| | |
| | | | | | | 2,586,337,446 | |
| | |
| Interactive Media & Services — 0.3% | | | | | | |
TripAdvisor, Inc.(a)(b) | | | 3,236,671 | | | | 64,280,286 | |
Ziff Davis, Inc.(a)(b) | | | 1,457,814 | | | | 113,782,383 | |
| | | | | | | | |
| | |
| | | | | | | 178,062,669 | |
| | |
| IT Services — 0.1% | | | | | | |
Kyndryl Holdings, Inc.(a)(b) | | | 6,324,823 | | | | 93,354,387 | |
| | | | | | | | |
| | |
| Leisure Products — 1.2% | | | | | | |
Brunswick Corp.(b) | | | 2,239,806 | | | | 183,664,092 | |
Mattel, Inc.(a)(b) | | | 10,947,782 | | | | 201,548,667 | |
Polaris, Inc.(b) | | | 1,682,996 | | | | 186,189,847 | |
Topgolf Callaway Brands Corp.(a)(b) | | | 4,282,584 | | | | 92,589,466 | |
YETI Holdings, Inc.(a)(b) | | | 2,664,290 | | | | 106,571,600 | |
| | | | | | | | |
| | |
| | | | | | | 770,563,672 | |
| | |
Life Sciences Tools & Services — 1.4% | | | | | | | | |
Azenta, Inc.(a) | | | 2,134,652 | | | | 95,248,172 | |
Bruker Corp. | | | 3,089,588 | | | | 243,583,118 | |
Medpace Holdings, Inc.(a)(b) | | | 778,163 | | | | 146,333,552 | |
Repligen Corp.(a)(b) | | | 1,595,137 | | | | 268,557,266 | |
Sotera Health Co.(a)(b) | | | 3,050,000 | | | | 54,625,500 | |
Syneos Health, Inc.(a) | | | 3,178,789 | | | | 113,228,464 | |
| | | | | | | | |
| | |
| | | | | | | 921,576,072 | |
| | |
| Machinery — 4.7% | | | | | | |
AGCO Corp. | | | 1,912,674 | | | | 258,593,525 | |
Chart Industries, Inc.(a)(b) | | | 1,314,661 | | | | 164,858,489 | |
Crane NXT Co. | | | 1,474,164 | | | | 167,317,614 | |
Donaldson Co., Inc. | | | 3,759,031 | | | | 245,615,085 | |
Esab Corp.(b) | | | 1,595,996 | | | | 94,275,484 | |
Flowserve Corp. | | | 4,037,302 | | | | 137,268,268 | |
Graco, Inc. | | | 5,205,998 | | | | 380,089,914 | |
ITT, Inc.(b) | | | 2,554,653 | | | | 220,466,554 | |
| | |
| 16 | | 2 0 2 3 I SHARES ANNUAL REPORT TO SHAREHOLDERS |
| | |
Schedule of Investments (continued) March 31, 2023 | | iShares® Core S&P Mid-Cap ETF (Percentages shown are based on Net Assets) |
| | | | | | | | |
| Security | | Shares | | | Value | |
| | |
| Machinery (continued) | | | | | | |
Lincoln Electric Holdings, Inc. | | | 1,783,566 | | | $ | 301,601,011 | |
Middleby Corp.(a)(b) | | | 1,664,507 | | | | 244,033,371 | |
Oshkosh Corp. | | | 2,020,071 | | | | 168,029,506 | |
Terex Corp. | | | 2,085,130 | | | | 100,878,589 | |
Timken Co. | | | 2,044,912 | | | | 167,110,209 | |
Toro Co. | | | 3,233,593 | | | | 359,446,198 | |
Watts Water Technologies, Inc., Class A | | | 843,809 | | | | 142,029,931 | |
| | | | | | | | |
| | |
| | | | | | | 3,151,613,748 | |
| | |
| Marine Transportation — 0.2% | | | | | | |
Kirby Corp.(a)(b) | | | 1,850,228 | | | | 128,960,892 | |
| | | | | | | | |
| | |
| Media — 1.0% | | | | | | |
Cable One, Inc. | | | 148,944 | | | | 104,558,688 | |
John Wiley & Sons, Inc., Class A | | | 1,322,369 | | | | 51,268,246 | |
New York Times Co., Class A(b) | | | 5,085,799 | | | | 197,735,865 | |
Nexstar Media Group, Inc., Class A(b) | | | 1,164,835 | | | | 201,120,411 | |
TEGNA, Inc. | | | 6,892,102 | | | | 116,545,445 | |
| | | | | | | | |
| | |
| | | | | | | 671,228,655 | |
| | |
| Metals & Mining — 2.6% | | | | | | |
Alcoa Corp. | | | 5,466,725 | | | | 232,663,816 | |
Cleveland-Cliffs, Inc.(a)(b) | | | 15,918,139 | | | | 291,779,488 | |
Commercial Metals Co. | | | 3,618,008 | | | | 176,920,591 | |
MP Materials Corp., Class A(a)(b) | | | 2,851,905 | | | | 80,395,202 | |
Reliance Steel & Aluminum Co. | | | 1,813,003 | | | | 465,470,390 | |
Royal Gold, Inc.(b) | | | 2,027,796 | | | | 263,025,419 | |
United States Steel Corp. | | | 7,000,004 | | | | 182,700,104 | |
Worthington Industries, Inc. | | | 936,595 | | | | 60,550,867 | |
| | | | | | | | |
| | |
| | | | | | | 1,753,505,877 | |
|
| Mortgage Real Estate Investment Trusts (REITs) — 0.6% | |
Annaly Capital Management, Inc. | | | 14,466,540 | | | | 276,455,579 | |
Starwood Property Trust, Inc. | | | 8,681,247 | | | | 153,571,260 | |
| | | | | | | | |
| | |
| | | | | | | 430,026,839 | |
| | |
| Multi-Utilities — 0.3% | | | | | | |
Black Hills Corp. | | | 2,010,310 | | | | 126,850,561 | |
NorthWestern Corp. | | | 1,784,863 | | | | 103,272,173 | |
| | | | | | | | |
| | |
| | | | | | | 230,122,734 | |
| | |
| Office REITs — 0.8% | | | | | | |
Corporate Office Properties Trust | | | 3,472,850 | | | | 82,341,274 | |
Cousins Properties, Inc. | | | 4,486,240 | | | | 95,915,811 | |
Douglas Emmett, Inc. | | | 5,429,958 | | | | 66,951,382 | |
Highwoods Properties, Inc. | | | 3,250,058 | | | | 75,368,845 | |
Kilroy Realty Corp. | | | 3,255,226 | | | | 105,469,322 | |
Vornado Realty Trust | | | 4,977,349 | | | | 76,501,854 | |
| | | | | | | | |
| | |
| | | | | | | 502,548,488 | |
| | |
| Oil, Gas & Consumable Fuels — 3.0% | | | | | | |
Antero Midstream Corp. | | | 10,346,584 | | | | 108,535,666 | |
Antero Resources Corp.(a)(b) | | | 8,529,736 | | | | 196,951,604 | |
Chord Energy Corp. | | | 1,285,285 | | | | 172,999,361 | |
CNX Resources Corp.(a)(b) | | | 5,255,364 | | | | 84,190,931 | |
DT Midstream, Inc. | | | 2,988,713 | | | | 147,552,761 | |
Equitrans Midstream Corp. | | | 13,368,986 | | | | 77,272,739 | |
HF Sinclair Corp. | | | 4,154,499 | | | | 200,994,662 | |
Matador Resources Co.(b) | | | 3,467,626 | | | | 165,232,379 | |
Murphy Oil Corp. | | | 4,514,014 | | | | 166,928,238 | |
PBF Energy, Inc., Class A | | | 3,530,664 | | | | 153,089,591 | |
PDC Energy, Inc. | | | 2,846,426 | | | | 182,683,621 | |
Range Resources Corp. | | | 7,464,341 | | | | 197,581,106 | |
Southwestern Energy Co.(a)(b) | | | 34,090,576 | | | | 170,452,880 | |
| | | | | | | | |
| | |
| | | | | | | 2,024,465,539 | |
| | | | | | | | |
| Security | | Shares | | | Value | |
| | |
| Paper & Forest Products — 0.2% | | | | | | |
Louisiana-Pacific Corp. | | | 2,214,754 | | | $ | 120,061,814 | |
| | | | | | | | |
| | |
| Passenger Airlines — 0.1% | | | | | | |
JetBlue Airways Corp.(a)(b) | | | 10,004,908 | | | | 72,835,730 | |
| | | | | | | | |
| | |
| Personal Care Products — 0.4% | | | | | | |
BellRing Brands, Inc.(a)(b) | | | 4,126,177 | | | | 140,290,018 | |
Coty, Inc., Class A(a)(b) | | | 11,325,104 | | | | 136,580,754 | |
| | | | | | | | |
| | |
| | | | | | | 276,870,772 | |
| | |
| Pharmaceuticals — 0.7% | | | | | | |
Jazz Pharmaceuticals PLC(a)(b) | | | 1,945,065 | | | | 284,621,361 | |
Perrigo Co. PLC | | | 4,159,139 | | | | 149,188,316 | |
| | | | | | | | |
| | |
| | | | | | | 433,809,677 | |
| | |
| Professional Services — 3.2% | | | | | | |
ASGN, Inc.(a)(b) | | | 1,541,468 | | | | 127,433,159 | |
CACI International, Inc., Class A(a)(b) | | | 726,203 | | | | 215,159,425 | |
Concentrix Corp.(b) | | | 1,318,907 | | | | 160,313,146 | |
ExlService Holdings, Inc.(a) | | | 1,021,404 | | | | 165,293,809 | |
Exponent, Inc. | | | 1,564,232 | | | | 155,938,288 | |
FTI Consulting, Inc.(a)(b) | | | 1,063,355 | | | | 209,853,109 | |
Genpact Ltd. | | | 5,198,650 | | | | 240,281,603 | |
Insperity, Inc. | | | 1,099,123 | | | | 133,598,401 | |
KBR, Inc. | | | 4,238,098 | | | | 233,307,295 | |
ManpowerGroup, Inc. | | | 1,561,763 | | | | 128,892,300 | |
Maximus, Inc. | | | 1,877,321 | | | | 147,745,163 | |
Science Applications International Corp. | | | 1,687,523 | | | | 181,341,222 | |
| | | | | | | | |
| | |
| | | | | | | 2,099,156,920 | |
|
| Real Estate Management & Development — 0.3% | |
Jones Lang LaSalle, Inc.(a)(b) | | | 1,466,183 | | | | 213,314,965 | |
| | | | | | | | |
| | |
| Residential REITs — 0.4% | | | | | | |
Apartment Income REIT Corp. | | | 4,570,275 | | | | 163,661,548 | |
Independence Realty Trust, Inc. | | | 6,914,619 | | | | 110,841,342 | |
| | | | | | | | |
| | |
| | | | | | | 274,502,890 | |
| | |
| Retail REITs — 1.5% | | | | | | |
Agree Realty Corp. | | | 2,736,112 | | | | 187,724,644 | |
Brixmor Property Group, Inc. | | | 9,264,554 | | | | 199,373,202 | |
Kite Realty Group Trust | | | 6,768,162 | | | | 141,589,949 | |
Macerich Co. | | | 6,693,215 | | | | 70,948,079 | |
National Retail Properties, Inc.(b) | | | 5,605,492 | | | | 247,482,472 | |
Spirit Realty Capital, Inc. | | | 4,314,217 | | | | 171,878,405 | |
| | | | | | | | |
| | |
| | | | | | | 1,018,996,751 | |
|
| Semiconductors & Semiconductor Equipment — 3.0% | |
Allegro MicroSystems, Inc.(a)(b) | | | 2,011,384 | | | | 96,526,318 | |
Amkor Technology, Inc. | | | 3,102,697 | | | | 80,732,176 | |
Cirrus Logic, Inc.(a)(b) | | | 1,706,921 | | | | 186,703,019 | |
Lattice Semiconductor Corp.(a)(b) | | | 4,233,867 | | | | 404,334,298 | |
MACOM Technology Solutions Holdings,
Inc.(a)(b) | | | 1,595,113 | | | | 112,997,805 | |
MKS Instruments, Inc.(b) | | | 1,766,822 | | | | 156,575,766 | |
Power Integrations, Inc. | | | 1,760,364 | | | | 148,997,209 | |
Silicon Laboratories, Inc.(a)(b) | | | 985,386 | | | | 172,531,235 | |
SiTime Corp.(a)(b) | | | 496,685 | | | | 70,643,507 | |
Synaptics, Inc.(a)(b) | | | 1,216,980 | | | | 135,267,327 | |
Universal Display Corp. | | | 1,342,432 | | | | 208,251,476 | |
Wolfspeed, Inc.(a)(b) | | | 3,843,365 | | | | 249,626,557 | |
| | | | | | | | |
| | |
| | | | | | | 2,023,186,693 | |
| | |
| Software — 2.6% | | | | | | |
ACI Worldwide, Inc.(a) | | | 3,471,335 | | | | 93,656,618 | |
Aspen Technology, Inc.(a)(b) | | | 900,370 | | | | 206,067,682 | |
Blackbaud, Inc.(a)(b) | | | 1,377,788 | | | | 95,480,709 | |
| | |
SCHEDULES OF INVESTMENTS | | 17 |
| | |
Schedule of Investments (continued) March 31, 2023 | | iShares® Core S&P Mid-Cap ETF (Percentages shown are based on Net Assets) |
| | | | | | | | |
| Security | | Shares | | | Value | |
| | |
| Software (continued) | | | | | | |
CommVault Systems, Inc.(a) | | | 1,376,289 | | | $ | 78,090,638 | |
Dynatrace, Inc.(a)(b) | | | 6,696,835 | | | | 283,276,121 | |
Envestnet, Inc.(a)(b) | | | 1,406,051 | | | | 82,493,012 | |
Manhattan Associates, Inc.(a)(b) | | | 1,930,547 | | | | 298,945,203 | |
NCR Corp.(a)(b) | | | 4,262,829 | | | | 100,560,136 | |
Paylocity Holding Corp.(a) | | | 1,274,864 | | | | 253,417,466 | |
Qualys, Inc.(a)(b) | | | 1,067,867 | | | | 138,844,067 | |
Teradata Corp.(a)(b) | | | 3,144,687 | | | | 126,667,992 | |
| | | | | | | | |
| | |
| | | | | | | 1,757,499,644 | |
| | |
| Specialized REITs — 2.1% | | | | | | |
CubeSmart | | | 6,937,325 | | | | 320,643,161 | |
EPR Properties | | | 2,317,467 | | | | 88,295,493 | |
Lamar Advertising Co., Class A | | | 2,695,645 | | | | 269,267,979 | |
Life Storage, Inc. | | | 2,625,674 | | | | 344,199,605 | |
National Storage Affiliates Trust | | | 2,610,428 | | | | 109,063,682 | |
PotlatchDeltic Corp. | | | 2,495,282 | | | | 123,516,459 | |
Rayonier, Inc. | | | 4,549,597 | | | | 151,319,596 | |
| | | | | | | | |
| | |
| | | | | | | 1,406,305,975 | |
| | |
| Specialty Retail — 2.9% | | | | | | |
AutoNation, Inc.(a)(b) | | | 1,056,609 | | | | 141,965,985 | |
Dick’s Sporting Goods, Inc. | | | 1,848,562 | | | | 262,292,462 | |
Five Below, Inc.(a)(b) | | | 1,714,893 | | | | 353,216,511 | |
Foot Locker, Inc. | | | 2,450,332 | | | | 97,253,677 | |
GameStop Corp., Class A(a)(b) | | | 7,809,204 | | | | 179,767,876 | |
Gap, Inc. | | | 6,540,227 | | | | 65,663,879 | |
Lithia Motors, Inc., Class A(b) | | | 844,485 | | | | 193,327,951 | |
Murphy U.S.A., Inc.(b) | | | 618,112 | | | | 159,503,802 | |
RH(a)(b) | | | 577,114 | | | | 140,556,115 | |
Victoria’s Secret & Co.(a)(b) | | | 2,496,823 | | | | 85,266,506 | |
Williams-Sonoma, Inc.(b) | | | 2,056,306 | | | | 250,170,188 | |
| | | | | | | | |
| | |
| | | | | | | 1,928,984,952 | |
|
| Technology Hardware, Storage & Peripherals — 0.3% | |
Super Micro Computer, Inc.(a)(b) | | | 1,442,780 | | | | 153,728,209 | |
Xerox Holdings Corp. | | | 3,464,584 | | | | 53,354,594 | |
| | | | | | | | |
| | |
| | | | | | | 207,082,803 | |
|
| Textiles, Apparel & Luxury Goods — 2.2% | |
Capri Holdings Ltd.(a)(b) | | | 3,883,276 | | | | 182,513,972 | |
Carter’s, Inc. | | | 1,178,858 | | | | 84,783,467 | |
Columbia Sportswear Co.(b) | | | 1,093,689 | | | | 98,694,495 | |
| | | | | | | | |
| Security | | Shares | | | Value | |
|
| Textiles, Apparel & Luxury Goods (continued) | |
Crocs, Inc.(a)(b) | | | 1,907,381 | | | $ | 241,169,254 | |
Deckers Outdoor Corp.(a)(b) | | | 814,244 | | | | 366,043,390 | |
PVH Corp.(b) | | | 1,957,578 | | | | 174,537,655 | |
Skechers U.S.A., Inc., Class A(a)(b) | | | 4,145,950 | | | | 197,015,544 | |
Under Armour, Inc., Class A(a)(b) | | | 5,828,822 | | | | 55,315,521 | |
Under Armour, Inc., Class C, NVS(a)(b) | | | 5,856,059 | | | | 49,952,183 | |
| | | | | | | | |
| | |
| | | | | | | 1,450,025,481 | |
|
| Trading Companies & Distributors — 1.1% | |
GATX Corp.(b) | | | 1,087,391 | | | | 119,634,758 | |
MSC Industrial Direct Co., Inc., Class A | | | 1,461,705 | | | | 122,783,220 | |
Univar Solutions, Inc.(a)(b) | | | 5,040,390 | | | | 176,564,862 | |
Watsco, Inc.(b) | | | 1,027,522 | | | | 326,916,399 | |
| | | | | | | | |
| | |
| | | | | | | 745,899,239 | |
| | |
| Water Utilities — 0.5% | | | | | | |
Essential Utilities, Inc. | | | 7,373,203 | | | | 321,840,311 | |
| | | | | | | | |
| |
Total Long-Term Investments — 99.5%
(Cost: $59,478,123,663) | | | | 66,161,795,889 | |
| | | | | | | | |
| | |
Short-Term Securities | | | | | | | | |
| | |
| Money Market Funds — 6.4% | | | | | | |
BlackRock Cash Funds: Institutional, SL Agency Shares, 5.01%(c)(d)(e) | | | 4,067,483,080 | | | | 4,068,703,325 | |
BlackRock Cash Funds: Treasury, SL Agency Shares, 4.73%(c)(d) | | | 225,712,057 | | | | 225,712,057 | |
| | | | | | | | |
| |
Total Short-Term Securities — 6.4%
(Cost: $4,292,393,953) | | | | 4,294,415,382 | |
| | | | | | | | |
| | |
Total Investments — 105.9%
(Cost: $63,770,517,616) | | | | | | | 70,456,211,271 | |
| |
Liabilities in Excess of Other Assets — (5.9)% | | | | (3,947,934,669 | ) |
| | | | | | | | |
| | |
Net Assets — 100.0% | | | | | | $ | 66,508,276,602 | |
| | | | | | | | |
| (a) | Non-income producing security. |
| (b) | All or a portion of this security is on loan. |
| (c) | Affiliate of the Fund. |
| (d) | Annualized 7-day yield as of period end. |
| (e) | All or a portion of this security was purchased with the cash collateral from loaned securities. |
| | |
| 18 | | 2 0 2 3 I SHARES ANNUAL REPORT TO SHAREHOLDERS |
| | |
Schedule of Investments (continued) March 31, 2023 | | iShares® Core S&P Mid-Cap ETF |
Affiliates
Investments in issuers considered to be affiliate(s) of the Fund during the year ended March 31, 2023 for purposes of Section 2(a)(3) of the Investment Company Act of 1940, as amended, were as follows:
| | | | | | | | | | | | | | | | | | | | | | | | | | | | | | | | | | | | | | | | | | |
| | | | | | | | | | | |
| | | Affiliated Issuer | | Value at 03/31/22 | | | Purchases at Cost | | | Proceeds from Sale | | | Net Realized Gain (Loss) | | | Change in Unrealized Appreciation (Depreciation) | | | Value at 03/31/23 | | | Shares Held at 03/31/23 | | | Income | | | Capital Gain Distributions from Underlying Funds | | | | |
| | BlackRock Cash Funds: Institutional, SL Agency Shares | | $ | 2,422,524,094 | | | $ | 1,644,458,653 | (a) | | $ | — | | | $ | (212,973 | ) | | $ | 1,933,551 | | | $ | 4,068,703,325 | | | | 4,067,483,080 | | | $ | 30,583,184 | (b) | | $ | — | | | | | |
| | BlackRock Cash Funds: Treasury, SL Agency Shares | | | 169,480,000 | | | | 56,232,057 | (a) | | | — | | | | — | | | | — | | | | 225,712,057 | | | | 225,712,057 | | | | 4,594,053 | | | | 117 | | | | | |
| | | | | | | | | | | | | | | | | | | | | | | | | | | | | | | | | | | | | | | | | | |
| | | | | | | | | | | |
| | | | | | | | | | | | | | | | $ | (212,973 | ) | | $ | 1,933,551 | | | $ | 4,294,415,382 | | | | | | | $ | 35,177,237 | | | $ | 117 | | | | | |
| | | | | | | | | | | | | | | | | | | | | | | | | | | | | | | | | | | | | | | | | | |
| | (a) | Represents net amount purchased (sold). | |
| | (b) | All or a portion represents securities lending income earned from the reinvestment of cash collateral from loaned securities, net of fees and collateral investment expenses, and other payments to and from borrowers of securities. | |
Derivative Financial Instruments Outstanding as of Period End
Futures Contracts
| | | | | | | | | | | | | | | | |
| Description | | Number of Contracts | | | Expiration Date | | | Notional Amount (000) | | | Value/ Unrealized Appreciation (Depreciation) | |
Long Contracts | | | | | | | | | | | | | | | | |
S&P MidCap 400 E-Mini Index | | | 949 | | | | 06/16/23 | | | $ | 240,068 | | | $ | 7,511,324 | |
| | | | | | | | | | | | | | | | |
OTC Total Return Swaps
| | | | | | | | | | | | | | | | | | | | | | | | |
| |
| | | | | | | |
| Reference Entity | | Payment Frequency | | Counterparty(a) | | Termination Date | | | Net Notional | | | Accrued Unrealized Appreciation (Depreciation) | | | Net Value of Reference Entity | | | Gross Notional Amount Net Asset Percentage | |
| |
| | | | | | | |
Equity Securities Long/Short | | Monthly | | Goldman Sachs Bank USA(b) | | | 08/19/26 | | | $ | 12,877,006 | | | $ | 773,580 | (c) | | $ | 13,623,093 | | | | 0.0 | % (d) |
| | Monthly | | HSBC Bank PLC(e) | | | 02/10/28 | | | | 25,832,160 | | | | (310,055 | )(f) | | | 25,121,269 | | | | 0.0 | (d) |
| | Monthly | | JPMorgan Chase Bank NA(g) | | | 02/08/24 | | | | 49,451,405 | | | | (2,864,266 | )(h) | | | 46,510,806 | | | | 0.1 | |
| | | | | | | | | | | | | | | | | | | | | | | | |
| | | | | | | |
| | | | | | | | | | | | | | $ | (2,400,741 | ) | | $ | 85,255,168 | | | | | |
| | | | | | | | | | | | | | | | | | | | | | | | |
| | (a) | The Fund receives the total return on a portfolio of long positions underlying the total return swap. The Fund pays the total return on a portfolio of short positions underlying the total return swap. In addition, the Fund pays or receives a variable rate of interest, based on a specified benchmark. The benchmark and spread are determined based upon the country and/or currency of the individual underlying positions. | |
| | (c) | Amount includes $27,493 of net dividends, payable for referenced securities purchased and financing fees. | |
| | (d) | Rounds to less than 0.1%. | |
| | (f) | Amount includes $400,836 of net dividends, payable for referenced securities purchased and financing fees. | |
| | (h) | Amount includes $76,333 of net dividends, payable for referenced securities purchased and financing fees. | |
The following are the specified benchmarks (plus or minus a range) used in determining the variable rate of interest:
| | | | | | | | | | |
| | | | (b) | | (e) | | (g) | | |
| | Range: | | 40 basis points | | 40 basis points | | 40 basis points | | |
| | Benchmarks: | | USD - 1D Overnight Fed Funds Effective Rate | | USD - 1D Overnight Bank Funding Rate | | USD - 1D Overnight Bank Funding Rate | | |
| | | | (FEDL01) | | (OBFR01) | | (OBFR01) | | |
| | |
SCHEDULES OF INVESTMENTS | | 19 |
| | |
Schedule of Investments (continued) March 31, 2023 | | iShares® Core S&P Mid-Cap ETF |
The following table represents the individual long positions and related values of the equity securities underlying the total return swap with Goldman Sachs Bank USA as of period end, termination date August 19, 2026.
| | | | | | | | | | | | | | | | |
| |
| | | |
| | | Shares | | | Value | | | % of Basket Value | |
| |
| | | | |
Reference Entity — Long | | | | | | | | | | | | | | | | |
| | | | |
| Common Stocks | | | | | | | | | | | | |
| | | | |
| Banks | | | | | | | | | | | | |
Cadence Bank | | | 233,735 | | | $ | 4,852,339 | | | | | | | | 35.6 | % |
| | | | | | | | | | | | | | | | |
| | | | |
| Software | | | | | | | | | | | | |
Envestnet, Inc. | | | 149,493 | | | | 8,770,754 | | | | | | | | 64.4 | |
| | | | | | | | | | | | | | | | |
| | | | |
Net Value of Reference Entity —
Goldman Sachs Bank USA | | | | | | $ | 13,623,093 | | | | | | | | | |
| | | | | | | | | | | | | | | | |
The following table represents the individual long positions and related values of the equity securities underlying the total return swap with HSBC Bank PLC as of period end, termination date February 10, 2028.
| | | | | | | | | | | | | | | | |
| |
| | | |
| | | Shares | | | Value | | | % of Basket Value | |
| |
|
Reference Entity — Long | |
| | | | |
| Common Stocks | | | | | | | | | | | | |
| | | | |
| Banks | | | | | | | | | | | | |
Cadence Bank | | | 163,096 | | | $ | 3,385,873 | | | | | | | | 13.5 | % |
| | | | | | | | | | | | | | | | |
| | | | |
| Mortgage Real Estate Investment Trusts (REITs) | | | | | | | | | | | | |
Starwood Property Trust, Inc. | | | 891,368 | | | | 15,768,300 | | | | | | | | 62.8 | |
| | | | | | | | | | | | | | | | |
| | | | | | | | | | | | | | | | |
| |
| | | |
| | | Shares | | | Value | | | % of Basket Value | |
| |
| | | | |
| Office REITs | | | | | | | | | | | | |
Cousins Properties, Inc. | | | 199,234 | | | $ | 4,259,623 | | | | | | | | 16.9 | % |
| | | | | | | | | | | | | | | | |
| | | | |
| Software | | | | | | | | | | | | |
Envestnet, Inc. | | | 29,103 | | | | 1,707,473 | | | | | | | | 6.8 | |
| | | | | | | | | | | | | | | | |
| | | | |
Net Value of Reference Entity — HSBC Bank PLC | | | | | | $ | 25,121,269 | | | | | | | | | |
| | | | | | | | | | | | | | | | |
The following table represents the individual long positions and related values of the equity securities underlying the total return swap with JPMorgan Chase Bank NA as of period end, termination date February 8, 2024.
| | | | | | | | | | | | | | | | |
| |
| | | |
| | | Shares | | | Value | | | % of Basket Value | |
| |
| | | | |
Reference Entity — Long | | | | | | | | | | | | | | | | |
| | | | |
| Common Stocks | | | | | | | | | | | | |
| | | | |
| Banks | | | | | | | | | | | | |
Cadence Bank | | | 566,297 | | | $ | 11,756,325 | | | | | | | | 25.3 | % |
| | | | | | | | | | | | | | | | |
| | | | |
| Financial Services | | | | | | | | | | | | |
Western Union Co. | | | 2,453,565 | | | | 27,357,250 | | | | | | | | 58.8 | |
| | | | | | | | | | | | | | | | |
| | | | |
| Software | | | | | | | | | | | | |
Envestnet, Inc. | | | 126,082 | | | | 7,397,231 | | | | | | | | 15.9 | |
| | | | | | | | | | | | | | | | |
Net Value of Reference Entity —
JPMorgan Chase Bank NA | | | $ | 46,510,806 | | | | | | | | | |
| | | | | | | | | | | | | | | | |
Balances Reported in the Statements of Assets and Liabilities for OTC Swaps
| | | | | | | | | | | | | | | | |
| Description | | Swap Premiums Paid | | | Swap Premiums Received | | | Unrealized Appreciation | | | Unrealized Depreciation | |
| | | | |
OTC Swaps | | $ | — | | | $ | — | | | $ | 773,580 | | | $ | (3,174,321 | ) |
| | |
| 20 | | 2 0 2 3 I SHARES ANNUAL REPORT TO SHAREHOLDERS |
| | |
Schedule of Investments (continued) March 31, 2023 | | iShares® Core S&P Mid-Cap ETF |
Derivative Financial Instruments Categorized by Risk Exposure
As of period end, the fair values of derivative financial instruments located in the Statements of Assets and Liabilities were as follows:
| | | | | | | | | | | | | | | | | | | | | | | | | | | | |
| | | Commodity
Contracts | | | Credit
Contracts | | | Equity
Contracts | | | Foreign
Currency
Exchange
Contracts | | | Interest
Rate
Contracts | | | Other
Contracts | | | Total | |
Assets — Derivative Financial Instruments | | | | | | | | | | | | | | | | | | | | | | | | | | | | |
Futures contracts | | | | | | | | | | | | | | | | | | | | | | | | | | | | |
Unrealized appreciation on futures contracts(a) | | $ | — | | | $ | — | | | $ | 7,511,324 | | | $ | — | | | $ | — | | | $ | — | | | $ | 7,511,324 | |
Swaps — OTC | | | | | | | | | | | | | | | | | | | | | | | | | | | | |
Unrealized appreciation on OTC swaps; | | | | | | | | | | | | | | | | | | | | | | | | | | | | |
Swap premiums paid | | | — | | | | — | | | | 773,580 | | | | — | | | | — | | | | — | | | | 773,580 | |
| | | | | | | | | | | | | | | | | | | | | | | | | | | | |
| | $ | — | | | $ | — | | | $ | 8,284,904 | | | $ | — | | | $ | — | | | $ | — | | | $ | 8,284,904 | |
| | | | | | | | | | | | | | | | | | | | | | | | | | | | |
Liabilities — Derivative Financial Instruments | | | | | | | | | | | | | | | | | | | | | | | | | | | | |
Swaps — OTC | | | | | | | | | | | | | | | | | | | | | | | | | | | | |
Unrealized depreciation on OTC swaps; | | | | | | | | | | | | | | | | | | | | | | | | | | | | |
Swap premiums received | | $ | — | | | $ | — | | | $ | 3,174,321 | | | $ | — | | | $ | — | | | $ | — | | | $ | 3,174,321 | |
| | | | | | | | | | | | | | | | | | | | | | | | | | | | |
| | (a) | Net cumulative unrealized appreciation (depreciation) on futures contracts, if any, are reported in the Schedule of Investments. In the Statements of Assets and Liabilities, only current day’s variation margin is reported in receivables or payables and the net cumulative unrealized appreciation (depreciation) is included in accumulated earnings (loss). | |
For the period ended March 31, 2023, the effect of derivative financial instruments in the Statements of Operations was as follows:
| | | | | | | | | | | | | | | | | | | | | | | | | | | | |
| | | Commodity
Contracts | | | Credit
Contracts | | | Equity
Contracts | | | Foreign
Currency
Exchange
Contracts | | | Interest
Rate
Contracts | | | Other
Contracts | | | Total | |
Net Realized Gain (Loss) from | | | | | | | | | | | | | | | | | | | | | | | | | | | | |
Futures contracts | | $ | — | | | $ | — | | | $ | (10,172,728 | ) | | $ | — | | | $ | — | | | $ | — | | | $ | (10,172,728 | ) |
Swaps | | | — | | | | — | | | | (11,115,927 | ) | | | — | | | | — | | | | — | | | | (11,115,927 | ) |
| | | | | | | | | | | | | | | | | | | | | | | | | | | | |
| | $ | — | | | $ | — | | | $ | (21,288,655 | ) | | $ | — | | | $ | — | | | $ | — | | | $ | (21,288,655 | ) |
| | | | | | | | | | | | | | | | | | | | | | | | | | | | |
Net Change in Unrealized Appreciation (Depreciation) on | | | | | | | | | | | | | | | | | | | | | | | | | | | | |
Futures contracts | | $ | — | | | $ | — | | | $ | 1,487,803 | | | $ | — | | | $ | — | | | $ | — | | | $ | 1,487,803 | |
Swaps | | | — | | | | — | | | | (3,883,244 | ) | | | — | | | | — | | | | — | | | | (3,883,244 | ) |
| | | | | | | | | | | | | | | | | | | | | | | | | | | | |
| | $ | — | | | $ | — | | | $ | (2,395,441 | ) | | $ | — | | | $ | — | | | $ | — | | | $ | (2,395,441 | ) |
| | | | | | | | | | | | | | | | | | | | | | | | | | | | |
Average Quarterly Balances of Outstanding Derivative Financial Instruments
| | | | |
Futures contracts | | | | |
Average notional value of contracts — long | | | $174,717,858 | |
Total return swaps | | | | |
Average notional amount | | | $63,687,022 | |
For more information about the Fund’s investment risks regarding derivative financial instruments, refer to the Notes to Financial Statements.
Derivative Financial Instruments – Offsetting as of Period End
The Fund’s derivative assets and liabilities (by type) were as follows:
| | | | | | | | |
| | | Assets | | | Liabilities | |
Derivative Financial Instruments | | | | | | | | |
Futures contracts | | $ | 4,223,050 | | | $ | — | |
Swaps — OTC(a) | | | 773,580 | | | | 3,174,321 | |
| | | | | | | | |
Total derivative assets and liabilities in the Statements of Assets and Liabilities | | $ | 4,996,630 | | | $ | 3,174,321 | |
| | | | | | | | |
Derivatives not subject to a Master Netting Agreement or similar agreement (“MNA”) | | | (4,223,050 | ) | | | — | |
| | | | | | | | |
Total derivative assets and liabilities subject to an MNA | | $ | 773,580 | | | $ | 3,174,321 | |
| | | | | | | | |
| | (a) | Includes unrealized appreciation (depreciation) on OTC swaps and swap premiums paid/(received) in the Statements of Assets and Liabilities. | |
| | |
SCHEDULES OF INVESTMENTS | | 21 |
| | |
Schedule of Investments (continued) March 31, 2023 | | iShares® Core S&P Mid-Cap ETF |
The following table presents the Fund’s derivative assets and liabilities by counterparty net of amounts available for offset under an MNA and net of the related collateral received and pledged by the Fund:
| | | | | | | | | | | | | | | | | | | | |
| Counterparty | |
| Derivative
Assets
Subject to
an MNA by
Counterparty |
| |
| Derivatives
Available
for Offset(a) |
| |
| Non-
Cash
Collateral
Received |
| |
| Cash
Collateral
Received(b) |
| |
| Net
Amount of
Derivative
Assets(c) |
|
Goldman Sachs Bank USA | | $ | 773,580 | | | $ | — | | | $ | — | | | $ | (560,000 | ) | | $ | 213,580 | |
| | | | | | | | | | | | | | | | | | | | |
| | | | | |
| Counterparty | | Derivative
Liabilities
Subject to
an MNA by
Counterparty | | | Derivatives
Available
for Offset(a) | | | Non-
Cash
Collateral
Pledged | | | Cash
Collateral
Pledged(b) | | | Net
Amount of
Derivative
Liabilities(d) | |
HSBC Bank PLC | | $ | 310,055 | | | $ | — | | | $ | — | | | $ | (310,055 | ) | | $ | — | |
JPMorgan Chase Bank N.A | | | 2,864,266 | | | | — | | | | — | | | | (2,864,266 | ) | | | — | |
| | | | | | | | | | | | | | | | | | | | |
| | $ | 3,174,321 | | | $ | — | | | $ | — | | | $ | (3,174,321 | ) | | $ | — | |
| | | | | | | | | | | | | | | | | | | | |
| | (a) | The amount of derivatives available for offset is limited to the amount of derivative assets and/or liabilities that are subject to an MNA. | |
| | (b) | Excess of collateral received/pledged, if any, from the individual counterparty is not shown for financial reporting purposes. | |
| | (c) | Net amount represents the net amount receivable from the counterparty in the event of default. | |
| | (d) | Net amount represents the net amount payable due to the counterparty in the event of default. | |
Fair Value Hierarchy as of Period End
Various inputs are used in determining the fair value of financial instruments. For a description of the input levels and information about the Fund’s policy regarding valuation of financial instruments, refer to the Notes to Financial Statements.
The following table summarizes the Fund’s financial instruments categorized in the fair value hierarchy. The breakdown of the Fund’s financial instruments into major categories is disclosed in the Schedule of Investments above.
| | | | | | | | | | | | | | | | |
| | | Level 1 | | | Level 2 | | | Level 3 | | | Total | |
Assets | | | | | | | | | | | | | | | | |
Investments | | | | | | | | | | | | | | | | |
Long-Term Investments | | | | | | | | | | | | | | | | |
Common Stocks | | $ | 66,161,795,889 | | | $ | — | | | $ | — | | | $ | 66,161,795,889 | |
Short-Term Securities | | | | | | | | | | | | | | | | |
Money Market Funds | | | 4,294,415,382 | | | | — | | | | — | | | | 4,294,415,382 | |
| | | | | | | | | | | | | | | | |
| | $ | 70,456,211,271 | | | $ | — | | | $ | — | | | $ | 70,456,211,271 | |
| | | | | | | | | | | | | | | | |
Derivative Financial Instruments(a) | | | | | | | | | | | | | | | | |
Assets | | | | | | | | | | | | | | | | |
Equity Contracts | | $ | 7,511,324 | | | $ | 773,580 | | | $ | — | | | $ | 8,284,904 | |
Liabilities | | | | | | | | | | | | | | | | |
Equity Contracts | | | — | | | | (3,174,321 | ) | | | — | | | | (3,174,321 | ) |
| | | | | | | | | | | | | | | | |
| | $ | 7,511,324 | | | $ | (2,400,741 | ) | | $ | — | | | $ | 5,110,583 | |
| | | | | | | | | | | | | | | | |
| | (a) | Derivative financial instruments are swaps and futures contracts. Swaps and futures contracts are valued at the unrealized appreciation (depreciation) on the instrument. | |
See notes to financial statements.
| | |
| 22 | | 2 0 2 3 I SHARES ANNUAL REPORT TO SHAREHOLDERS |
| | |
Schedule of Investments March 31, 2023 | | iShares® Core S&P Small-Cap ETF (Percentages shown are based on Net Assets) |
| | | | | | | | |
| Security | | Shares | | | Value | |
| | |
Common Stocks | | | | | | | | |
|
| Aerospace & Defense — 1.4% | |
AAR Corp.(a)(b) | | | 2,385,521 | | | $ | 130,130,171 | |
Aerojet Rocketdyne Holdings, Inc.(a)(b)(c) | | | 5,517,723 | | | | 309,930,501 | |
AeroVironment, Inc.(a)(b)(c) | | | 1,829,332 | | | | 167,676,570 | |
Kaman Corp.(a) | | | 2,053,147 | | | | 46,934,940 | |
Moog, Inc., Class A(a) | | | 2,090,257 | | | | 210,593,393 | |
National Presto Industries, Inc.(a) | | | 367,786 | | | | 26,513,693 | |
Triumph Group, Inc.(a)(b)(c) | | | 4,076,599 | | | | 47,247,782 | |
| | | | | | | | |
| | |
| | | | | | | 939,027,050 | |
|
| Air Freight & Logistics — 0.6% | |
Forward Air Corp.(a) | | | 1,938,160 | | | | 208,856,122 | |
Hub Group, Inc., Class A(a)(b)(c) | | | 2,380,144 | | | | 199,789,287 | |
| | | | | | | | |
| | |
| | | | | | | 408,645,409 | |
|
| Automobile Components — 1.3% | |
American Axle & Manufacturing Holdings, Inc.(a)(b)(c) | | | 8,346,915 | | | | 65,189,406 | |
Dorman Products, Inc.(a)(b)(c) | | | 2,061,039 | | | | 177,785,224 | |
Gentherm, Inc.(a)(b) | | | 2,413,674 | | | | 145,834,183 | |
LCI Industries(a) | | | 1,853,604 | | | | 203,655,472 | |
Patrick Industries, Inc.(a) | | | 1,564,952 | | | | 107,684,347 | |
Standard Motor Products, Inc.(a) | | | 1,363,712 | | | | 50,334,610 | |
XPEL, Inc.(a)(b)(c) | | | 1,424,895 | | | | 96,821,615 | |
| | | | | | | | |
| | |
| | | | | | | 847,304,857 | |
|
| Automobiles — 0.2% | |
Winnebago Industries, Inc.(a)(c) | | | 2,225,893 | | | | 128,434,026 | |
| | | | | | | | |
|
| Banks — 9.0% | |
Ameris Bancorp(a) | | | 4,751,617 | | | | 173,814,150 | |
Atlantic Union Bankshares Corp.(a) | | | 4,585,955 | | | | 160,737,723 | |
Axos Financial, Inc.(a)(b) | | | 3,889,355 | | | | 143,594,987 | |
Banc of California, Inc.(a) | | | 4,000,843 | | | | 50,130,563 | |
BancFirst Corp. | | | 1,269,801 | | | | 105,520,463 | |
Bancorp, Inc.(a)(b)(c) | | | 3,982,366 | | | | 110,908,893 | |
BankUnited, Inc.(a) | | | 5,257,459 | | | | 118,713,424 | |
Banner Corp.(a) | | | 2,410,436 | | | | 131,055,405 | |
Berkshire Hills Bancorp, Inc.(a) | | | 3,091,585 | | | | 77,475,120 | |
Brookline Bancorp, Inc.(a) | | | 5,881,816 | | | | 61,759,068 | |
Capitol Federal Financial, Inc.(a) | | | 9,228,673 | | | | 62,108,969 | |
Central Pacific Financial Corp.(a) | | | 1,597,517 | | | | 28,595,554 | |
City Holding Co.(a) | | | 1,022,399 | | | | 92,915,621 | |
Community Bank System, Inc.(a) | | | 3,701,570 | | | | 194,295,409 | |
Customers Bancorp, Inc.(a)(b)(c) | | | 2,147,637 | | | | 39,774,237 | |
CVB Financial Corp.(a) | | | 9,579,628 | | | | 159,788,194 | |
Dime Community Bancshares, Inc.(a) | | | 2,344,663 | | | | 53,270,743 | |
Eagle Bancorp, Inc.(a) | | | 2,228,316 | | | | 74,581,737 | |
FB Financial Corp.(a) | | | 2,554,185 | | | | 79,384,070 | |
First BanCorp/Puerto Rico(a) | | | 12,859,298 | | | | 146,853,183 | |
First Bancorp/Southern Pines NC(a) | | | 2,863,783 | | | | 101,721,572 | |
First Commonwealth Financial Corp.(a) | | | 7,130,256 | | | | 88,629,082 | |
First Financial Bancorp(a) | | | 6,560,881 | | | | 142,830,379 | |
First Hawaiian, Inc.(a) | | | 9,270,753 | | | | 191,255,634 | |
Hanmi Financial Corp.(a) | | | 2,085,047 | | | | 38,719,323 | |
Heritage Financial Corp.(a) | | | 2,518,770 | | | | 53,901,678 | |
Hilltop Holdings, Inc.(a) | | | 3,324,324 | | | | 98,632,693 | |
HomeStreet, Inc.(a) | | | 1,312,088 | | | | 23,604,463 | |
Hope Bancorp, Inc.(a) | | | 8,142,201 | | | | 79,956,414 | |
Independent Bank Corp.(a) | | | 3,141,549 | | | | 206,148,445 | |
Independent Bank Group, Inc.(a) | | | 2,581,671 | | | | 119,660,451 | |
Lakeland Financial Corp.(a)(c) | | | 1,848,058 | | | | 115,762,353 | |
National Bank Holdings Corp., Class A(a) | | | 2,715,233 | | | | 90,851,696 | |
NBT Bancorp, Inc.(a) | | | 2,973,455 | | | | 100,235,168 | |
| | | | | | | | |
| Security | | Shares | | | Value | |
|
| Banks (continued) | |
Northfield Bancorp, Inc.(a) | | | 3,067,289 | | | $ | 36,132,664 | |
Northwest Bancshares, Inc.(a) | | | 8,711,034 | | | | 104,793,739 | |
OFG Bancorp(a) | | | 3,329,311 | | | | 83,033,016 | |
Pacific Premier Bancorp, Inc.(a) | | | 6,649,873 | | | | 159,729,950 | |
Park National Corp.(a) | | | 1,052,330 | | | | 124,774,768 | |
Pathward Financial, Inc.(a) | | | 1,974,466 | | | | 81,920,594 | |
Preferred Bank | | | 615,879 | | | | 33,756,328 | |
Provident Financial Services, Inc.(a) | | | 5,217,018 | | | | 100,062,405 | |
Renasant Corp.(a) | | | 3,912,785 | | | | 119,652,965 | |
S&T Bancorp, Inc.(a) | | | 2,759,695 | | | | 86,792,408 | |
Seacoast Banking Corp. of Florida(a) | | | 5,690,776 | | | | 134,871,391 | |
ServisFirst Bancshares, Inc.(a) | | | 3,559,028 | | | | 194,429,700 | |
Simmons First National Corp., Class A(a) | | | 8,787,556 | | | | 153,694,354 | |
Southside Bancshares, Inc.(a) | | | 2,184,421 | | | | 72,522,777 | |
Stellar Bancorp, Inc.(a) | | | 3,279,825 | | | | 80,716,493 | |
Tompkins Financial Corp.(a)(c) | | | 908,368 | | | | 60,143,045 | |
Triumph Financial, Inc.(a)(b)(c) | | | 1,648,474 | | | | 95,710,400 | |
TrustCo Bank Corp.(a) | | | 1,282,267 | | | | 40,955,608 | |
Trustmark Corp.(a) | | | 4,016,549 | | | | 99,208,760 | |
United Community Banks, Inc.(a) | | | 7,956,991 | | | | 223,750,587 | |
Veritex Holdings, Inc.(a) | | | 3,748,074 | | | | 68,439,831 | |
Washington Federal, Inc.(a) | | | 3,946,748 | | | | 118,876,050 | |
Westamerica BanCorp(a) | | | 1,929,762 | | | | 85,488,457 | |
WSFS Financial Corp.(a) | | | 4,251,315 | | | | 159,891,957 | |
| | | | | | | | |
| | |
| | | | | | | 6,036,535,111 | |
|
| Beverages — 0.3% | |
MGP Ingredients, Inc.(a)(c) | | | 1,118,994 | | | | 108,229,100 | |
National Beverage Corp.(b) | | | 1,700,608 | | | | 89,656,054 | |
| | | | | | | | |
| | |
| | | | | | | 197,885,154 | |
|
| Biotechnology — 2.3% | |
Anika Therapeutics, Inc.(a)(b)(c) | | | 1,064,684 | | | | 30,577,724 | |
Arcus Biosciences, Inc.(a)(b)(c) | | | 3,800,085 | | | | 69,313,550 | |
Avid Bioservices, Inc.(a)(b)(c) | | | 4,527,474 | | | | 84,935,412 | |
Catalyst Pharmaceuticals, Inc.(a)(b)(c) | | | 6,977,592 | | | | 115,688,475 | |
Coherus Biosciences, Inc.(a)(b)(c) | | | 4,703,384 | | | | 32,171,147 | |
Cytokinetics, Inc.(a)(b)(c) | | | 6,887,293 | | | | 242,363,841 | |
Dynavax Technologies Corp.(a)(b)(c) | | | 8,621,686 | | | | 84,578,740 | |
Eagle Pharmaceuticals, Inc.(a)(b)(c) | | | 761,001 | | | | 21,589,598 | |
Emergent BioSolutions, Inc.(a)(b)(c) | | | 3,237,688 | | | | 33,542,448 | |
Enanta Pharmaceuticals, Inc.(a)(b)(c) | | | 1,426,595 | | | | 57,691,502 | |
Ironwood Pharmaceuticals, Inc.,
Class A(a)(b)(c) | | | 9,699,220 | | | | 102,035,794 | |
iTeos Therapeutics, Inc.(a)(b)(c) | | | 1,790,601 | | | | 24,370,080 | |
Myriad Genetics, Inc.(a)(b)(c) | | | 5,905,915 | | | | 137,194,406 | |
REGENXBIO, Inc.(a)(b)(c) | | | 2,736,802 | | | | 51,752,926 | |
uniQure NV(a)(b)(c) | | | 2,993,447 | | | | 60,288,023 | |
Vanda Pharmaceuticals, Inc.(a)(b)(c) | | | 4,139,500 | | | | 28,107,205 | |
Vericel Corp.(a)(b)(c) | | | 3,441,268 | | | | 100,897,978 | |
Vir Biotechnology, Inc.(b)(c) | | | 5,529,864 | | | | 128,679,935 | |
Xencor, Inc.(a)(b)(c) | | | 4,367,211 | | | | 121,801,515 | |
| | | | | | | | |
| | |
| | | | | | | 1,527,580,299 | |
|
| Broadline Retail — 0.0% | |
Big Lots, Inc.(a) | | | 2,095,645 | | | | 22,968,269 | |
| | | | | | | | |
|
| Building Products — 1.8% | |
AAON, Inc.(a) | | | 3,063,656 | | | | 296,224,899 | |
American Woodmark Corp.(a)(b)(c) | | | 1,211,154 | | | | 63,064,789 | |
Apogee Enterprises, Inc.(a) | | | 1,614,042 | | | | 69,807,317 | |
AZZ, Inc.(a) | | | 1,808,865 | | | | 74,597,593 | |
Gibraltar Industries, Inc.(a)(b)(c) | | | 2,256,992 | | | | 109,464,112 | |
Griffon Corp.(a) | | | 3,449,806 | | | | 110,428,290 | |
Insteel Industries, Inc.(a)(c) | | | 1,417,298 | | | | 39,429,230 | |
Masterbrand, Inc.(a)(b) | | | 9,344,343 | | | | 75,128,518 | |
| | |
SCHEDULES OF INVESTMENTS | | 23 |
| | |
Schedule of Investments (continued) March 31, 2023 | | iShares® Core S&P Small-Cap ETF (Percentages shown are based on Net Assets) |
| | | | | | | | |
| Security | | Shares | | | Value | |
|
Building Products (continued) | |
PGT Innovations, Inc.(a)(b)(c) | | | 4,360,171 | | | $ | 109,483,894 | |
Quanex Building Products Corp.(a) | | | 2,415,167 | | | | 51,998,546 | |
Resideo Technologies, Inc.(a)(b)(c) | | | 10,630,351 | | | | 194,322,816 | |
| | | | | | | | |
| | |
| | | | | | | 1,193,950,004 | |
|
| Capital Markets — 1.0% | |
Avantax, Inc.(a)(b)(c) | | | 2,900,816 | | | | 76,349,477 | |
B Riley Financial, Inc.(c) | | | 1,158,264 | | | | 32,883,115 | |
Brightsphere Investment Group, Inc.(a)(c) | | | 2,354,855 | | | | 55,527,481 | |
Donnelley Financial Solutions, Inc.(a)(b)(c) | | | 1,823,772 | | | | 74,519,324 | |
Piper Sandler Cos.(a) | | | 998,498 | | | | 138,401,808 | |
StoneX Group, Inc.(a)(b)(c) | | | 1,279,161 | | | | 132,431,538 | |
Virtus Investment Partners, Inc.(a) | | | 495,497 | | | | 94,337,674 | |
WisdomTree, Inc.(a) | | | 8,181,079 | | | | 47,941,123 | |
| | | | | | | | |
| | |
| | | | | | | 652,391,540 | |
|
| Chemicals — 2.9% | |
AdvanSix, Inc.(a) | | | 2,003,039 | | | | 76,656,303 | |
American Vanguard Corp.(a) | | | 2,026,144 | | | | 44,332,031 | |
Balchem Corp.(a)(c) | | | 2,338,858 | | | | 295,818,759 | |
FutureFuel Corp.(c) | | | 1,929,365 | | | | 14,238,714 | |
Hawkins, Inc.(a)(c) | | | 1,380,556 | | | | 60,440,742 | |
HB Fuller Co.(a) | | | 3,909,578 | | | | 267,610,614 | |
Innospec, Inc.(a) | | | 1,802,353 | | | | 185,047,583 | |
Koppers Holdings, Inc.(a) | | | 1,518,472 | | | | 53,100,966 | |
Livent Corp.(a)(b)(c) | | | 13,057,295 | | | | 283,604,447 | |
Mativ Holdings, Inc.(a) | | | 3,992,232 | | | | 85,713,221 | |
Minerals Technologies, Inc.(a) | | | 2,365,017 | | | | 142,894,327 | |
Quaker Chemical Corp.(a)(c) | | | 991,851 | | | | 196,336,906 | |
Rayonier Advanced Materials, Inc.(a)(b)(c) | | | 4,629,024 | | | | 29,023,980 | |
Stepan Co.(a) | | | 1,535,383 | | | | 158,190,511 | |
Trinseo PLC(a) | | | 2,541,250 | | | | 52,985,063 | |
| | | | | | | | |
| | |
| | | | | | | 1,945,994,167 | |
|
| Commercial Services & Supplies — 2.1% | |
ABM Industries, Inc.(a) | | | 4,810,506 | | | | 216,184,140 | |
Brady Corp., Class A, NVS | | | 3,367,483 | | | | 180,934,862 | |
CoreCivic, Inc.(a)(b) | | | 8,355,107 | | | | 76,866,984 | |
Deluxe Corp.(a) | | | 3,143,083 | | | | 50,289,328 | |
GEO Group, Inc.(a)(b)(c) | | | 9,046,095 | | | | 71,373,690 | |
Harsco Corp.(a)(b)(c) | | | 5,790,875 | | | | 39,551,676 | |
Healthcare Services Group, Inc.(a) | | | 5,383,256 | | | | 74,665,761 | |
HNI Corp.(a) | | | 3,014,047 | | | | 83,911,068 | |
Interface, Inc., Class A(a) | | | 4,209,358 | | | | 34,179,987 | |
KAR Auction Services, Inc.(a)(b)(c) | | | 7,936,472 | | | | 108,570,937 | |
Liquidity Services, Inc.(a)(b)(c) | | | 1,736,364 | | | | 22,867,914 | |
Matthews International Corp., Class A(a) | | | 2,210,318 | | | | 79,704,067 | |
MillerKnoll, Inc.(a) | | | 5,494,367 | | | | 112,359,805 | |
Pitney Bowes, Inc. | | | 7,894,604 | | | | 30,710,010 | |
UniFirst Corp.(a)(c) | | | 1,100,519 | | | | 193,944,463 | |
Viad Corp.(a)(b) | | | 1,506,129 | | | | 31,387,728 | |
| | | | | | | | |
| | |
| | | | | | | 1,407,502,420 | |
|
| Communications Equipment — 1.5% | |
ADTRAN Holdings, Inc.(a) | | | 5,134,740 | | | | 81,436,976 | |
Clearfield, Inc.(a)(b)(c) | | | 920,469 | | | | 42,875,446 | |
Comtech Telecommunications Corp.(a) | | | 2,009,964 | | | | 25,084,350 | |
Digi International, Inc.(a)(b)(c) | | | 2,604,545 | | | | 87,721,076 | |
Extreme Networks, Inc.(b)(c) | | | 5,838,562 | | | | 111,633,305 | |
Harmonic, Inc.(a)(b)(c) | | | 7,985,438 | | | | 116,507,540 | |
NETGEAR, Inc.(a)(b)(c) | | | 2,091,242 | | | | 38,708,889 | |
NetScout Systems, Inc.(a)(b)(c) | | | 4,913,285 | | | | 140,765,615 | |
| | | | | | | | |
| Security | | Shares | | | Value | |
|
Communications Equipment (continued) | |
Viasat, Inc.(a)(b)(c) | | | 5,566,713 | | | $ | 188,377,568 | |
Viavi Solutions, Inc.(a)(b) | | | 16,383,443 | | | | 177,432,688 | |
| | | | | | | | |
| | |
| | | | | | | 1,010,543,453 | |
|
| Construction & Engineering — 1.6% | |
Arcosa, Inc.(a) | | | 3,519,193 | | | | 222,096,270 | |
Comfort Systems U.S.A., Inc.(a) | | | 2,603,262 | | | | 379,972,122 | |
Dycom Industries, Inc.(a)(b)(c) | | | 2,154,435 | | | | 201,762,838 | |
Granite Construction, Inc.(a)(c) | | | 3,187,054 | | | | 130,924,178 | |
MYR Group, Inc.(a)(b) | | | 1,207,052 | | | | 152,100,623 | |
| | | | | | | | |
| | |
| | | | | | | 1,086,856,031 | |
|
| Consumer Finance — 0.9% | |
Bread Financial Holdings, Inc. | | | 1,729,161 | | | | 52,428,162 | |
Encore Capital Group, Inc.(a)(b)(c) | | | 1,699,308 | | | | 85,730,089 | |
Enova International, Inc.(a)(b)(c) | | | 2,268,948 | | | | 100,809,360 | |
EZCORP, Inc., Class A, NVS(b)(c) | | | 3,812,056 | | | | 32,783,682 | |
Green Dot Corp., Class A(a)(b)(c) | | | 3,437,389 | | | | 59,054,343 | |
LendingTree, Inc.(a)(b)(c) | | | 786,477 | | | | 20,967,477 | |
PRA Group, Inc.(a)(b)(c) | | | 2,833,129 | | | | 110,378,706 | |
PROG Holdings, Inc.(a)(b)(c) | | | 3,645,701 | | | | 86,731,227 | |
World Acceptance Corp.(b)(c) | | | 242,063 | | | | 20,161,427 | |
| | | | | | | | |
| | |
| | | | | | | 569,044,473 | |
|
| Consumer Staples Distribution & Retail — 0.7% | |
Andersons, Inc.(a) | | | 2,261,919 | | | | 93,462,493 | |
Chefs’ Warehouse, Inc.(a)(b)(c) | | | 2,474,982 | | | | 84,273,137 | |
PriceSmart, Inc.(a) | | | 1,833,024 | | | | 131,024,556 | |
SpartanNash Co.(a) | | | 2,563,109 | | | | 63,565,103 | |
United Natural Foods, Inc.(a)(b) | | | 4,360,234 | | | | 114,892,166 | |
| | | | | | | | |
| | |
| | | | | | | 487,217,455 | |
|
| Containers & Packaging — 0.5% | |
Myers Industries, Inc.(a) | | | 2,651,952 | | | | 56,831,331 | |
O-I Glass, Inc.(a)(b)(c) | | | 11,251,777 | | | | 255,527,856 | |
| | | | | | | | |
| | |
| | | | | | | 312,359,187 | |
|
| Diversified Consumer Services — 1.0% | |
Adtalem Global Education, Inc.(a)(b)(c) | | | 3,312,437 | | | | 127,926,317 | |
Frontdoor, Inc.(a)(b)(c) | | | 5,925,476 | | | | 165,202,271 | |
Mister Car Wash, Inc.(b)(c) | | | 5,761,725 | | | | 49,666,070 | |
Perdoceo Education Corp.(a)(b)(c) | | | 4,894,320 | | | | 65,730,718 | |
Strategic Education, Inc.(a)(c) | | | 1,621,888 | | | | 145,694,199 | |
Stride, Inc.(a)(b)(c) | | | 2,977,003 | | | | 116,847,368 | |
| | | | | | | | |
| | |
| | | | | | | 671,066,943 | |
|
| Diversified REITs — 0.9% | |
Alexander & Baldwin, Inc.(a) | | | 5,268,673 | | | | 99,630,606 | |
American Assets Trust, Inc.(a) | | | 3,806,082 | | | | 70,755,064 | |
Armada Hoffler Properties, Inc.(a) | | | 4,932,109 | | | | 58,248,207 | |
Essential Properties Realty Trust, Inc.(a) | | | 10,378,407 | | | | 257,903,414 | |
Global Net Lease, Inc.(a) | | | 7,542,835 | | | | 97,000,858 | |
| | | | | | | | |
| | |
| | | | | | | 583,538,149 | |
|
| Diversified Telecommunication Services — 0.6% | |
ATN International, Inc. | | | 775,829 | | | | 31,746,923 | |
Cogent Communications Holdings, Inc.(a) | | | 3,114,495 | | | | 198,455,621 | |
Consolidated Communications Holdings, Inc.(b)(c) | | | 5,518,369 | | | | 14,237,392 | |
Lumen Technologies, Inc.(c) | | | 47,061,267 | | | | 124,712,358 | |
| | | | | | | | |
| | |
| | | | | | | 369,152,294 | |
|
| Electric Utilities — 0.3% | |
Otter Tail Corp.(a) | | | 3,029,898 | | | | 218,970,729 | |
| | | | | | | | |
| | |
| 24 | | 2 0 2 3 I SHARES ANNUAL REPORT TO SHAREHOLDERS |
| | |
Schedule of Investments (continued) March 31, 2023 | | iShares® Core S&P Small-Cap ETF (Percentages shown are based on Net Assets) |
| | | | | | | | |
| Security | | Shares | | | Value | |
|
Electrical Equipment — 0.4% | |
Encore Wire Corp.(a)(c) | | | 1,337,086 | | | $ | 247,802,148 | |
Powell Industries, Inc.(a) | | | 659,477 | | | | 28,087,125 | |
| | | | | | | | |
| | |
| | | | | | | 275,889,273 | |
|
| Electronic Equipment, Instruments & Components — 4.4% | |
Advanced Energy Industries, Inc.(a)(c) | | | 2,721,235 | | | | 266,681,030 | |
Arlo Technologies, Inc.(a)(b) | | | 6,446,461 | | | | 39,065,554 | |
Badger Meter, Inc.(a)(c) | | | 2,130,665 | | | | 259,557,610 | |
Benchmark Electronics, Inc.(a) | | | 2,563,077 | | | | 60,719,294 | |
CTS Corp.(a)(c) | | | 2,317,106 | | | | 114,604,063 | |
ePlus, Inc.(a)(b)(c) | | | 1,957,811 | | | | 96,011,051 | |
Fabrinet(a)(b) | | | 2,668,674 | | | | 316,931,724 | |
FARO Technologies, Inc.(a)(b)(c) | | | 1,358,997 | | | | 33,444,916 | |
Insight Enterprises, Inc.(a)(b)(c) | | | 2,205,528 | | | | 315,302,283 | |
Itron, Inc.(a)(b)(c) | | | 3,292,907 | | | | 182,591,693 | |
Knowles Corp.(a)(b)(c) | | | 6,631,181 | | | | 112,730,077 | |
Methode Electronics, Inc.(a)(c) | | | 2,623,342 | | | | 115,112,247 | |
OSI Systems, Inc.(a)(b) | | | 1,142,222 | | | | 116,917,844 | |
PC Connection, Inc. | | | 818,155 | | | | 36,784,249 | |
Plexus Corp.(a)(b)(c) | | | 2,019,198 | | | | 197,013,149 | |
Rogers Corp.(a)(b)(c) | | | 1,370,184 | | | | 223,929,171 | |
Sanmina Corp.(a)(b)(c) | | | 4,247,353 | | | | 259,046,060 | |
ScanSource, Inc.(a)(b)(c) | | | 1,852,381 | | | | 56,386,478 | |
TTM Technologies, Inc.(a)(b)(c) | | | 7,427,237 | | | | 100,193,427 | |
| | | | | | | | |
| | |
| | | | | | | 2,903,021,920 | |
|
| Energy Equipment & Services — 2.0% | |
Archrock, Inc.(a) | | | 9,725,232 | | | | 95,015,517 | |
Bristow Group, Inc.(a)(b)(c) | | | 1,714,769 | | | | 38,410,826 | |
Core Laboratories NV(a)(c) | | | 3,388,493 | | | | 74,716,271 | |
DMC Global, Inc.(a)(b)(c) | | | 1,351,898 | | | | 29,701,199 | |
Dril-Quip, Inc.(a)(b)(c) | | | 2,464,709 | | | | 70,712,501 | |
Helix Energy Solutions Group, Inc.(a)(b)(c) | | | 10,398,737 | | | | 80,486,224 | |
Helmerich & Payne, Inc.(a) | | | 7,606,317 | | | | 271,925,833 | |
Nabors Industries Ltd.(a)(b)(c) | | | 652,751 | | | | 79,576,874 | |
NexTier Oilfield Solutions, Inc.(b)(c) | | | 11,629,421 | | | | 92,453,897 | |
Oceaneering International, Inc.(a)(b)(c) | | | 7,306,891 | | | | 128,820,488 | |
Oil States International, Inc.(a)(b)(c) | | | 4,656,170 | | | | 38,785,896 | |
Patterson-UTI Energy, Inc.(a) | | | 15,803,836 | | | | 184,904,881 | |
ProPetro Holding Corp.(a)(b)(c) | | | 6,991,709 | | | | 50,270,388 | |
RPC, Inc.(c) | | | 6,047,329 | | | | 46,503,960 | |
U.S. Silica Holdings, Inc.(a)(b)(c) | | | 5,500,971 | | | | 65,681,594 | |
| | | | | | | | |
| | |
| | | | | | | 1,347,966,349 | |
|
| Entertainment — 0.2% | |
Cinemark Holdings, Inc.(a)(b)(c) | | | 7,789,339 | | | | 115,204,324 | |
Marcus Corp.(a)(c) | | | 1,765,497 | | | | 28,247,952 | |
| | | | | | | | |
| | |
| | | | | | | 143,452,276 | |
|
| Financial Services — 1.2% | |
EVERTEC, Inc.(a) | | | 4,740,969 | | | | 160,007,704 | |
Mr. Cooper Group, Inc.(a)(b)(c) | | | 4,710,088 | | | | 192,972,305 | |
NMI Holdings, Inc., Class A(a)(b)(c) | | | 6,091,444 | | | | 136,021,945 | |
Payoneer Global, Inc.(b) | | | 14,524,817 | | | | 91,215,851 | |
Radian Group, Inc. | | | 2,539,714 | | | | 56,127,679 | |
Star Holdings(b) | | | 51,320 | | | | 892,450 | |
Walker & Dunlop, Inc.(a) | | | 2,232,515 | | | | 170,050,668 | |
| | | | | | | | |
| | |
| | | | | | | 807,288,602 | |
|
| Food Products — 2.2% | |
B&G Foods, Inc.(a)(c) | | | 5,207,551 | | | | 80,873,267 | |
Calavo Growers, Inc.(a) | | | 1,283,291 | | | | 36,920,281 | |
Cal-Maine Foods, Inc.(a) | | | 2,759,453 | | | | 168,023,093 | |
Fresh Del Monte Produce, Inc. | | | 2,231,256 | | | | 67,183,118 | |
Hain Celestial Group, Inc.(a)(b)(c) | | | 6,499,264 | | | | 111,462,378 | |
| | | | | | | | |
| Security | | Shares | | | Value | |
|
Food Products (continued) | |
Hostess Brands, Inc., Class A(a)(b)(c) | | | 9,745,961 | | | $ | 242,479,510 | |
J & J Snack Foods Corp.(a)(c) | | | 1,090,581 | | | | 161,645,916 | |
John B Sanfilippo & Son, Inc.(a) | | | 652,728 | | | | 63,262,398 | |
Seneca Foods Corp., Class A(a)(b)(c) | | | 383,559 | | | | 20,048,629 | |
Simply Good Foods Co.(a)(b)(c) | | | 6,155,847 | | | | 244,818,035 | |
Tootsie Roll Industries, Inc.(c) | | | 1,377,770 | | | | 61,875,651 | |
TreeHouse Foods, Inc.(a)(b)(c) | | | 3,673,376 | | | | 185,248,352 | |
| | | | | | | | |
| | |
| | | | | | | 1,443,840,628 | |
|
| Gas Utilities — 0.4% | |
Chesapeake Utilities Corp.(a)(c) | | | 1,160,005 | | | | 148,469,039 | |
Northwest Natural Holding Co.(a) | | | 2,559,166 | | | | 121,713,935 | |
| | | | | | | | |
| | |
| | | | | | | 270,182,974 | |
|
| Ground Transportation — 0.7% | |
ArcBest Corp.(a)(c) | | | 1,761,754 | | | | 162,821,305 | |
Heartland Express, Inc.(c) | | | 3,386,063 | | | | 53,906,123 | |
Marten Transport Ltd.(a) | | | 4,196,504 | | | | 87,916,759 | |
RXO, Inc.(a)(b)(c) | | | 8,483,909 | | | | 166,623,973 | |
| | | | | | | | |
| | |
| | | | | | | 471,268,160 | |
|
| Health Care Equipment & Supplies — 3.0% | |
AngioDynamics, Inc.(a)(b)(c) | | | 2,851,478 | | | | 29,484,283 | |
Artivion, Inc.(a)(b)(c) | | | 2,938,557 | | | | 38,495,097 | |
Avanos Medical, Inc.(a)(b)(c) | | | 3,379,152 | | | | 100,495,981 | |
Cardiovascular Systems, Inc.(a)(b)(c) | | | 3,057,311 | | | | 60,718,195 | |
CONMED Corp.(a)(c) | | | 2,218,834 | | | | 230,448,099 | |
Cutera, Inc.(a)(b)(c) | | | 1,300,608 | | | | 30,720,361 | |
Embecta Corp.(a) | | | 4,169,266 | | | | 117,239,760 | |
Glaukos Corp.(a)(b)(c) | | | 3,476,948 | | | | 174,195,095 | |
Heska Corp.(a)(b)(c) | | | 739,469 | | | | 72,186,964 | |
Inogen, Inc.(a)(b) | | | 1,658,604 | | | | 20,699,378 | |
Integer Holdings Corp.(a)(b)(c) | | | 2,411,218 | | | | 186,869,395 | |
LeMaitre Vascular, Inc.(a)(c) | | | 1,406,772 | | | | 72,406,555 | |
Merit Medical Systems, Inc.(a)(b) | | | 4,149,178 | | | | 306,831,713 | |
Mesa Laboratories, Inc.(a)(c) | | | 366,162 | | | | 63,979,486 | |
NuVasive, Inc.(a)(b)(c) | | | 3,799,710 | | | | 156,966,020 | |
OraSure Technologies, Inc.(a)(b) | | | 5,255,125 | | | | 31,793,506 | |
Orthofix Medical, Inc.(a)(b)(c) | | | 2,485,421 | | | | 41,630,802 | |
Tandem Diabetes Care, Inc.(a)(b)(c) | | | 4,686,729 | | | | 190,328,065 | |
Varex Imaging Corp.(a)(b)(c) | | | 2,913,645 | | | | 52,999,203 | |
Zynex, Inc.(b)(c) | | | 1,623,150 | | | | 19,477,800 | |
| | | | | | | | |
| | |
| | | | | | | 1,997,965,758 | |
|
| Health Care Providers & Services — 3.1% | |
AdaptHealth Corp.(b)(c) | | | 5,580,124 | | | | 69,360,941 | |
Addus HomeCare Corp.(a)(b)(c) | | | 1,171,034 | | | | 125,019,590 | |
Agiliti, Inc.(b)(c) | | | 2,428,911 | | | | 38,813,998 | |
AMN Healthcare Services, Inc.(a)(b)(c) | | | 3,154,567 | | | | 261,702,877 | |
Apollo Medical Holdings, Inc.(b)(c) | | | 2,858,424 | | | | 104,246,723 | |
Community Health Systems, Inc.(a)(b)(c) | | | 9,105,358 | | | | 44,616,254 | |
CorVel Corp.(b)(c) | | | 662,801 | | | | 126,117,774 | |
Cross Country Healthcare, Inc.(a)(b)(c) | | | 2,581,607 | | | | 57,621,468 | |
Enhabit, Inc.(a)(b)(c) | | | 3,605,221 | | | | 50,148,624 | |
Ensign Group, Inc.(a)(c) | | | 4,057,063 | | | | 387,611,799 | |
Fulgent Genetics, Inc.(b)(c) | | | 1,437,155 | | | | 44,867,979 | |
ModivCare, Inc.(a)(b)(c) | | | 924,539 | | | | 77,735,239 | |
NeoGenomics, Inc.(a)(b)(c) | | | 9,205,740 | | | | 160,271,933 | |
Owens & Minor, Inc.(a)(b) | | | 5,539,213 | | | | 80,595,549 | |
Pediatrix Medical Group, Inc.(a)(b)(c) | | | 5,952,910 | | | | 88,757,888 | |
RadNet, Inc.(b)(c) | | | 2,484,582 | | | | 62,189,087 | |
Select Medical Holdings Corp.(a)(c) | | | 7,589,754 | | | | 196,195,141 | |
U.S. Physical Therapy, Inc.(a)(c) | | | 947,448 | | | | 92,764,634 | |
| | | | | | | | |
| | |
| | | | | | | 2,068,637,498 | |
| | |
SCHEDULES OF INVESTMENTS | | 25 |
| | |
Schedule of Investments (continued) March 31, 2023 | | iShares® Core S&P Small-Cap ETF (Percentages shown are based on Net Assets) |
| | | | | | | | |
| Security | | Shares | | | Value | |
|
Health Care REITs — 0.5% | |
CareTrust REIT, Inc.(a) | | | 7,252,619 | | | $ | 142,006,280 | |
Community Healthcare Trust, Inc.(a) | | | 1,714,377 | | | | 62,746,198 | |
LTC Properties, Inc.(a) | | | 2,943,742 | | | | 103,413,657 | |
Universal Health Realty Income Trust(a) | | | 922,933 | | | | 44,402,307 | |
| | | | | | | | |
| | |
| | | | | | | 352,568,442 | |
|
| Health Care Technology — 0.7% | |
Certara, Inc.(b)(c) | | | 7,670,848 | | | | 184,944,145 | |
Computer Programs & Systems,
Inc.(a)(b)(c) | | | 1,029,591 | | | | 31,093,648 | |
HealthStream, Inc.(a)(b)(c) | | | 1,759,859 | | | | 47,692,179 | |
NextGen Healthcare, Inc.(a)(b) | | | 3,885,672 | | | | 67,649,550 | |
Simulations Plus, Inc.(a)(c) | | | 1,166,987 | | | | 51,277,409 | |
Veradigm, Inc.(a)(b)(c) | | | 7,941,138 | | | | 103,631,851 | |
| | | | | | | | |
| | |
| | | | | | | 486,288,782 | |
|
| Hotel & Resort REITs — 1.1% | |
Chatham Lodging Trust(a) | | | 3,536,599 | | | | 37,098,924 | |
DiamondRock Hospitality Co.(a) | | | 15,238,713 | | | | 123,890,737 | |
Pebblebrook Hotel Trust(a)(c) | | | 7,891,706 | | | | 110,799,552 | |
Service Properties Trust(a) | | | 12,057,714 | | | | 120,094,831 | |
Summit Hotel Properties, Inc.(a) | | | 7,788,908 | | | | 54,522,356 | |
Sunstone Hotel Investors, Inc.(a) | | | 15,314,048 | | | | 151,302,794 | |
Xenia Hotels & Resorts, Inc.(a) | | | 8,364,392 | | | | 109,489,891 | |
| | | | | | | | |
| | |
| | | | | | | 707,199,085 | |
|
| Hotels, Restaurants & Leisure — 2.4% | |
BJ’s Restaurants, Inc.(a)(b)(c) | | | 1,699,711 | | | | 49,529,579 | |
Bloomin’ Brands, Inc.(a) | | | 6,398,965 | | | | 164,133,452 | |
Brinker International, Inc.(a)(b)(c) | | | 3,211,202 | | | | 122,025,676 | |
Cheesecake Factory, Inc.(a)(c) | | | 3,485,092 | | | | 122,152,475 | |
Chuy’s Holdings, Inc.(a)(b)(c) | | | 1,311,281 | | | | 47,009,424 | |
Cracker Barrel Old Country Store, Inc.(a) | | | 1,615,744 | | | | 183,548,518 | |
Dave & Buster’s Entertainment, Inc.(a)(b)(c) | | | 3,053,603 | | | | 112,342,054 | |
Dine Brands Global, Inc.(a) | | | 1,139,217 | | | | 77,056,638 | |
El Pollo Loco Holdings, Inc.(c) | | | 1,421,057 | | | | 13,627,937 | |
Golden Entertainment, Inc.(a)(b) | | | 1,599,305 | | | | 69,585,761 | |
Jack in the Box, Inc.(a) | | | 1,501,183 | | | | 131,488,619 | |
Monarch Casino & Resort, Inc.(a) | | | 964,416 | | | | 71,511,446 | |
Ruth’s Hospitality Group, Inc.(a) | | | 2,208,544 | | | | 36,264,292 | |
Sabre Corp.(a)(b)(c) | | | 23,862,103 | | | | 102,368,422 | |
Shake Shack, Inc., Class A(a)(b)(c) | | | 2,719,732 | | | | 150,917,929 | |
Six Flags Entertainment Corp.(a)(b) | | | 5,393,932 | | | | 144,071,924 | |
| | | | | | | | |
| | |
| | | | | | | 1,597,634,146 | |
|
| Household Durables — 2.9% | |
Cavco Industries, Inc.(a)(b)(c) | | | 589,341 | | | | 187,257,209 | |
Century Communities, Inc.(a)(c) | | | 2,060,874 | | | | 131,731,066 | |
Ethan Allen Interiors, Inc.(a) | | | 1,662,264 | | | | 45,645,769 | |
Green Brick Partners, Inc.(b)(c) | | | 1,988,191 | | | | 69,705,976 | |
Installed Building Products, Inc.(a) | | | 1,709,574 | | | | 194,942,723 | |
iRobot Corp.(a)(b)(c) | | | 1,978,690 | | | | 86,350,032 | |
La-Z-Boy, Inc.(a) | | | 3,134,583 | | | | 91,153,674 | |
LGI Homes, Inc.(a)(b)(c) | | | 1,490,285 | | | | 169,937,199 | |
M/I Homes, Inc.(a)(b)(c) | | | 1,993,911 | | | | 125,795,845 | |
MDC Holdings, Inc.(a) | | | 4,222,321 | | | | 164,121,617 | |
Meritage Homes Corp.(a) | | | 2,663,289 | | | | 310,965,624 | |
Sonos, Inc.(a)(b)(c) | | | 9,282,137 | | | | 182,115,528 | |
Tri Pointe Homes, Inc.(a)(b)(c) | | | 7,344,307 | | | | 185,957,853 | |
| | | | | | | | |
| | |
| | | | | | | 1,945,680,115 | |
|
| Household Products — 0.5% | |
Central Garden & Pet Co.(a)(b)(c) | | | 706,087 | | | | 28,991,932 | |
Central Garden & Pet Co., Class A, NVS(b)(c) | | | 3,000,883 | | | | 117,244,499 | |
WD-40 Co.(a)(c) | | | 990,404 | | | | 176,341,432 | |
| | | | | | | | |
| | |
| | | | | | | 322,577,863 | |
| | | | | | | | |
| Security | | Shares | | | Value | |
|
Industrial REITs — 0.5% | |
Innovative Industrial Properties, Inc.(a) | | | 2,033,597 | | | $ | 154,533,036 | |
LXP Industrial Trust(a) | | | 20,097,481 | | | | 207,205,029 | |
| | | | | | | | |
| | |
| | | | | | | 361,738,065 | |
|
| Insurance — 2.3% | |
Ambac Financial Group, Inc.(b)(c) | | | 2,217,455 | | | | 34,326,203 | |
American Equity Investment Life Holding Co.(a) | | | 5,059,804 | | | | 184,632,248 | |
AMERISAFE, Inc.(a) | | | 1,395,793 | | | | 68,324,067 | |
Assured Guaranty Ltd.(a) | | | 4,364,410 | | | | 219,398,891 | |
Employers Holdings, Inc.(a) | | | 1,733,257 | | | | 72,259,484 | |
Genworth Financial, Inc., Class A(a)(b)(c) | | | 31,035,879 | | | | 155,800,113 | |
HCI Group, Inc.(a) | | | 491,626 | | | | 26,351,154 | |
Horace Mann Educators Corp.(a) | | | 2,732,195 | | | | 91,473,889 | |
James River Group Holdings Ltd.(a) | | | 2,635,146 | | | | 54,415,765 | |
Mercury General Corp. | | | 1,936,611 | | | | 61,468,033 | |
Palomar Holdings, Inc.(a)(b)(c) | | | 1,838,781 | | | | 101,500,711 | |
ProAssurance Corp.(a) | | | 3,525,618 | | | | 65,153,421 | |
Safety Insurance Group, Inc.(a) | | | 1,005,684 | | | | 74,943,572 | |
SiriusPoint Ltd.(b)(c) | | | 6,189,635 | | | | 50,321,733 | |
Stewart Information Services Corp.(a) | | | 1,886,670 | | | | 76,127,135 | |
Trupanion, Inc.(a)(b)(c) | | | 2,556,251 | | | | 109,637,605 | |
United Fire Group, Inc.(a) | | | 1,609,372 | | | | 42,728,827 | |
Universal Insurance Holdings, Inc.(a) | | | 1,999,930 | | | | 36,438,725 | |
| | | | | | | | |
| | |
| | | | | | | 1,525,301,576 | |
|
| Interactive Media & Services — 0.6% | |
Cars.com, Inc.(a)(b)(c) | | | 4,501,303 | | | | 86,875,148 | |
QuinStreet, Inc.(a)(b)(c) | | | 3,674,970 | | | | 58,321,774 | |
Shutterstock, Inc. | | | 1,749,501 | | | | 127,013,773 | |
Yelp, Inc.(a)(b)(c) | | | 5,068,002 | | | | 155,587,661 | |
| | | | | | | | |
| | |
| | | | | | | 427,798,356 | |
|
| IT Services — 0.3% | |
Perficient, Inc.(a)(b)(c) | | | 2,523,946 | | | | 182,203,662 | |
| | | | | | | | |
|
| Leisure Products — 0.3% | |
Sturm Ruger & Co., Inc.(a) | | | 1,283,727 | | | | 73,737,279 | |
Vista Outdoor, Inc.(a)(b)(c) | | | 4,112,693 | | | | 113,962,723 | |
| | | | | | | | |
| | |
| | | | | | | 187,700,002 | |
|
| Life Sciences Tools & Services — 0.1% | |
BioLife Solutions, Inc.(a)(b)(c) | | | 2,485,868 | | | | 54,067,629 | |
OmniAb, Inc., 12.50 Earnout Shares(d) | | | 450,637 | | | | — | |
OmniAb, Inc., 15.00 Earnout Shares(d) | | | 450,637 | | | | — | |
| | | | | | | | |
| | |
| | | | | | | 54,067,629 | |
|
| Machinery — 5.4% | |
3D Systems Corp.(a)(b)(c) | | | 9,531,942 | | | | 102,182,418 | |
Alamo Group, Inc.(a) | | | 750,019 | | | | 138,123,499 | |
Albany International Corp., Class A(a)(c) | | | 2,263,875 | | | | 202,299,869 | |
Astec Industries, Inc.(a) | | | 1,654,898 | | | | 68,264,543 | |
Barnes Group, Inc.(a) | | | 3,685,618 | | | | 148,456,693 | |
CIRCOR International, Inc.(a)(b)(c) | | | 1,483,729 | | | | 46,173,646 | |
Enerpac Tool Group Corp.(a)(c) | | | 4,151,927 | | | | 105,874,139 | |
EnPro Industries, Inc.(a) | | | 1,512,570 | | | | 157,140,897 | |
ESCO Technologies, Inc.(a)(c) | | | 1,880,857 | | | | 179,527,801 | |
Federal Signal Corp.(a) | | | 4,419,990 | | | | 239,607,658 | |
Franklin Electric Co., Inc.(a) | | | 2,832,236 | | | | 266,513,408 | |
Greenbrier Cos., Inc.(a) | | | 2,382,067 | | | | 76,631,095 | |
Hillenbrand, Inc.(a) | | | 5,050,735 | | | | 240,061,435 | |
John Bean Technologies Corp.(a) | | | 2,319,037 | | | | 253,447,554 | |
Kennametal, Inc.(a) | | | 5,869,193 | | | | 161,872,343 | |
Lindsay Corp.(a)(c) | | | 800,100 | | | | 120,919,113 | |
Mueller Industries, Inc.(a)(c) | | | 4,139,447 | | | | 304,166,566 | |
Proto Labs, Inc.(a)(b)(c) | | | 1,975,889 | | | | 65,500,720 | |
SPX Technologies, Inc.(a)(b)(c) | | | 3,288,717 | | | | 232,117,646 | |
| | |
| 26 | | 2 0 2 3 I SHARES ANNUAL REPORT TO SHAREHOLDERS |
| | |
Schedule of Investments (continued) March 31, 2023 | | iShares® Core S&P Small-Cap ETF (Percentages shown are based on Net Assets) |
| | | | | | | | |
| Security | | Shares | | | Value | |
|
Machinery (continued) | |
Standex International Corp.(a) | | | 868,067 | | | $ | 106,286,124 | |
Tennant Co.(a)(c) | | | 1,351,295 | | | | 92,604,246 | |
Titan International, Inc.(a)(b)(c) | | | 3,709,063 | | | | 38,870,980 | |
Trinity Industries, Inc.(a) | | | 5,932,852 | | | | 144,524,275 | |
Wabash National Corp.(a) | | | 3,473,963 | | | | 85,424,750 | |
| | | | | | | | |
| | |
| | | | | | | 3,576,591,418 | |
|
| Marine Transportation — 0.3% | |
Matson, Inc.(a)(c) | | | 2,753,727 | | | | 164,314,890 | |
| | | | | | | | |
|
| Media — 0.4% | |
AMC Networks, Inc., Class A(a)(b) | | | 2,028,379 | | | | 35,658,903 | |
EW Scripps Co., Class A, NVS(a)(b)(c) | | | 4,223,432 | | | | 39,742,495 | |
Gannett Co., Inc.(a)(b)(c) | | | 10,708,383 | | | | 20,024,676 | |
Scholastic Corp., NVS(a) | | | 2,156,368 | | | | 73,790,913 | |
TechTarget, Inc.(a)(b)(c) | | | 1,940,097 | | | | 70,076,304 | |
Thryv Holdings, Inc.(a)(b)(c) | | | 2,229,412 | | | | 51,410,241 | |
| | | | | | | | |
| | |
| | | | | | | 290,703,532 | |
|
| Metals & Mining — 2.1% | |
Arconic Corp.(a)(b)(c) | | | 7,403,233 | | | | 194,186,802 | |
ATI, Inc.(a)(b)(c) | | | 9,421,069 | | | | 371,755,383 | |
Carpenter Technology Corp.(a) | | | 3,526,815 | | | | 157,860,239 | |
Century Aluminum Co.(b)(c) | | | 3,701,693 | | | | 37,016,930 | |
Compass Minerals International, Inc.(a) | | | 2,485,628 | | | | 85,232,184 | |
Haynes International, Inc.(a)(c) | | | 919,330 | | | | 46,049,240 | |
Kaiser Aluminum Corp.(a) | | | 1,161,561 | | | | 86,687,297 | |
Materion Corp.(a)(c) | | | 1,492,687 | | | | 173,151,692 | |
Olympic Steel, Inc.(a) | | | 692,690 | | | | 36,165,345 | |
SunCoke Energy, Inc.(a) | | | 6,077,667 | | | | 54,577,450 | |
TimkenSteel Corp.(a)(b)(c) | | | 2,883,789 | | | | 52,888,690 | |
Tredegar Corp.(a) | | | 1,820,805 | | | | 16,623,950 | |
Warrior Met Coal, Inc. | | | 2,470,246 | | | | 90,682,731 | |
| | | | | | | | |
| | |
| | | | | | | 1,402,877,933 | |
|
| Mortgage Real Estate Investment Trusts (REITs) — 1.1% | |
Apollo Commercial Real Estate Finance, Inc.(a) | | | 9,470,207 | | | | 88,167,627 | |
ARMOUR Residential REIT, Inc.(a) | | | 11,870,452 | | | | 62,319,873 | |
Ellington Financial, Inc.(a) | | | 4,606,520 | | | | 56,245,609 | |
Franklin BSP Realty Trust, Inc.(a) | | | 6,006,880 | | | | 71,662,078 | |
Invesco Mortgage Capital, Inc.(a) | | | 2,568,921 | | | | 28,489,334 | |
KKR Real Estate Finance Trust, Inc.(a) | | | 4,229,012 | | | | 48,168,447 | |
New York Mortgage Trust, Inc.(a)(c) | | | 6,967,441 | | | | 69,395,712 | |
PennyMac Mortgage Investment Trust(a) | | | 6,461,543 | | | | 79,670,825 | |
Ready Capital Corp.(a) | | | 7,166,679 | | | | 72,885,125 | |
Redwood Trust, Inc.(a) | | | 8,245,868 | | | | 55,577,150 | |
Two Harbors Investment Corp.(a) | | | 7,016,686 | | | | 103,215,451 | |
| | | | | | | | |
| | |
| | | | | | | 735,797,231 | |
|
| Multi-Utilities — 0.4% | |
Avista Corp.(a) | | | 5,307,363 | | | | 225,297,559 | |
Unitil Corp.(a) | | | 1,168,382 | | | | 66,644,509 | |
| | | | | | | | |
| | |
| | | | | | | 291,942,068 | |
|
| Office REITs — 0.7% | |
Brandywine Realty Trust(a) | | | 12,505,353 | | | | 59,150,320 | |
Easterly Government Properties, Inc.(a)(c) | | | 6,284,213 | | | | 86,345,087 | |
Hudson Pacific Properties, Inc.(a) | | | 9,353,401 | | | | 62,200,117 | |
JBG SMITH Properties(a) | | | 7,214,172 | | | | 108,645,430 | |
Office Properties Income Trust(a) | | | 3,538,732 | | | | 43,526,404 | |
Orion Office REIT, Inc.(a) | | | 4,098,401 | | | | 27,459,287 | |
SL Green Realty Corp.(a) | | | 3,526,164 | | | | 82,935,377 | |
| | | | | | | | |
| | |
| | | | | | | 470,262,022 | |
|
| Oil, Gas & Consumable Fuels — 2.5% | |
Callon Petroleum Co.(a)(b)(c) | | | 3,726,637 | | | | 124,618,741 | |
| | | | | | | | |
| Security | | Shares | | | Value | |
|
Oil, Gas & Consumable Fuels (continued) | |
Civitas Resources, Inc. | | | 3,778,628 | | | $ | 258,231,438 | |
Comstock Resources, Inc.(c) | | | 6,654,000 | | | | 71,796,660 | |
CONSOL Energy, Inc.(a) | | | 2,380,446 | | | | 138,708,588 | |
CVR Energy, Inc. | | | 2,127,057 | | | | 69,724,928 | |
Dorian LPG Ltd.(a) | | | 2,322,733 | | | | 46,315,296 | |
Green Plains, Inc.(a)(b)(c) | | | 3,655,598 | | | | 113,286,982 | |
Northern Oil & Gas, Inc.(a) | | | 5,392,658 | | | | 163,667,170 | |
Par Pacific Holdings, Inc.(b)(c) | | | 2,888,579 | | | | 84,346,507 | |
Ranger Oil Corp., Class A(a)(c) | | | 1,389,341 | | | | 56,740,686 | |
REX American Resources Corp.(a)(b)(c) | | | 1,107,355 | | | | 31,659,279 | |
SM Energy Co.(a)(c) | | | 8,951,013 | | | | 252,060,526 | |
Talos Energy, Inc.(b)(c) | | | 4,752,977 | | | | 70,534,179 | |
Vital Energy, Inc.(a)(b)(c) | | | 1,221,732 | | | | 55,637,675 | |
World Fuel Services Corp.(a) | | | 4,500,543 | | | | 114,988,874 | |
| | | | | | | | |
| | |
| | | | | | | 1,652,317,529 | |
|
| Paper & Forest Products — 0.3% | |
Clearwater Paper Corp.(a)(b)(c) | | | 1,221,354 | | | | 40,817,651 | |
Mercer International, Inc. | | | 2,920,751 | | | | 28,550,341 | |
Sylvamo Corp.(a) | | | 2,322,212 | | | | 107,425,527 | |
| | | | | | | | |
| | |
| | | | | | | 176,793,519 | |
|
| Passenger Airlines — 0.4% | |
Allegiant Travel Co.(a)(b)(c) | | | 1,136,531 | | | | 104,538,121 | |
Hawaiian Holdings, Inc.(a)(b)(c) | | | 3,720,289 | | | | 34,077,847 | |
SkyWest, Inc.(a)(b) | | | 3,676,480 | | | | 81,507,562 | |
Sun Country Airlines Holdings, Inc.(b)(c) | | | 2,373,457 | | | | 48,655,869 | |
| | | | | | | | |
| | |
| | | | | | | 268,779,399 | |
|
| Personal Care Products — 1.4% | |
Edgewell Personal Care Co.(a) | | | 3,738,555 | | | | 158,589,503 | |
elf Beauty, Inc.(a)(b) | | | 3,685,577 | | | | 303,507,266 | |
Inter Parfums, Inc. | | | 1,301,113 | | | | 185,070,313 | |
Medifast, Inc.(a) | | | 796,210 | | | | 82,543,091 | |
Nu Skin Enterprises, Inc., Class A(a) | | | 3,601,878 | | | | 141,589,824 | |
USANA Health Sciences, Inc.(b)(c) | | | 809,397 | | | | 50,911,071 | |
| | | | | | | | |
| | |
| | | | | | | 922,211,068 | |
|
| Pharmaceuticals — 1.7% | |
Amphastar Pharmaceuticals, Inc.(a)(b)(c) | | | 2,739,841 | | | | 102,744,038 | |
ANI Pharmaceuticals, Inc.(a)(b)(c) | | | 890,241 | | | | 35,360,373 | |
Cara Therapeutics, Inc.(a)(b)(c) | | | 3,266,135 | | | | 16,036,723 | |
Collegium Pharmaceutical, Inc.(a)(b)(c) | | | 2,446,234 | | | | 58,685,154 | |
Corcept Therapeutics, Inc.(a)(b)(c) | | | 6,965,943 | | | | 150,882,325 | |
Harmony Biosciences Holdings, Inc.(b)(c) | | | 2,155,200 | | | | 70,367,280 | |
Innoviva, Inc.(a)(b)(c) | | | 4,563,339 | | | | 51,337,564 | |
Ligand Pharmaceuticals, Inc.(a)(b)(c) | | | 1,169,457 | | | | 86,025,257 | |
Nektar Therapeutics(a)(b)(c) | | | 14,092,889 | | | | 9,905,892 | |
Pacira BioSciences, Inc.(a)(b)(c) | | | 3,343,934 | | | | 136,465,947 | |
Phibro Animal Health Corp., Class A(a) | | | 1,471,681 | | | | 22,546,153 | |
Prestige Consumer Healthcare, Inc.(a)(b)(c) | | | 3,621,865 | | | | 226,837,405 | |
Supernus Pharmaceuticals, Inc.(a)(b)(c) | | | 3,939,911 | | | | 142,742,976 | |
| | | | | | | | |
| | |
| | | | | | | 1,109,937,087 | |
|
| Professional Services — 1.2% | |
CSG Systems International, Inc.(a) | | | 2,186,343 | | | | 117,406,619 | |
Forrester Research, Inc.(b)(c) | | | 813,515 | | | | 26,317,210 | |
Heidrick & Struggles International, Inc.(a) | | | 1,447,167 | | | | 43,935,990 | |
Kelly Services, Inc., Class A, NVS | | | 2,520,454 | | | | 41,814,332 | |
Korn Ferry(a) | | | 3,842,025 | | | | 198,786,374 | |
NV5 Global, Inc.(a)(b)(c) | | | 904,619 | | | | 94,053,237 | |
Resources Connection, Inc.(a) | | | 2,328,185 | | | | 39,718,836 | |
TrueBlue, Inc.(a)(b)(c) | | | 2,384,057 | | | | 42,436,215 | |
| | |
SCHEDULES OF INVESTMENTS | | 27 |
| | |
Schedule of Investments (continued) March 31, 2023 | | iShares® Core S&P Small-Cap ETF (Percentages shown are based on Net Assets) |
| | | | | | | | |
| Security | | Shares | | | Value | |
|
Professional Services (continued) | |
TTEC Holdings, Inc. | | | 1,372,533 | | | $ | 51,099,404 | |
Verra Mobility Corp., Class A(a)(b)(c) | | | 10,159,371 | | | | 171,896,557 | |
| | | | | | | | |
| | |
| | | | | | | 827,464,774 | |
|
| Real Estate Management & Development — 0.7% | |
Anywhere Real Estate, Inc.(a)(b)(c) | | | 8,313,853 | | | | 43,897,144 | |
Cushman & Wakefield PLC(b)(c) | | | 8,981,723 | | | | 94,667,360 | |
Douglas Elliman, Inc.(a) | | | 5,044,597 | | | | 15,688,697 | |
Kennedy-Wilson Holdings, Inc.(a) | | | 8,536,148 | | | | 141,614,695 | |
Marcus & Millichap, Inc.(c) | | | 1,858,376 | | | | 59,672,453 | |
RE/MAX Holdings, Inc., Class A(a) | | | 1,367,991 | | | | 25,663,511 | |
St. Joe Co.(c) | | | 2,458,996 | | | | 102,318,824 | |
| | | | | | | | |
| | |
| | | | | | | 483,522,684 | |
|
| Residential REITs — 0.5% | |
Centerspace(a) | | | 1,097,987 | | | | 59,983,030 | |
Elme Communities(a) | | | 6,373,950 | | | | 113,838,747 | |
NexPoint Residential Trust, Inc.(a) | | | 1,370,673 | | | | 59,857,290 | |
Veris Residential, Inc.(a)(b) | | | 5,774,150 | | | | 84,533,556 | |
| | | | | | | | |
| | |
| | | | | | | 318,212,623 | |
|
| Retail REITs — 1.3% | |
Acadia Realty Trust(a) | | | 6,879,130 | | | | 95,963,864 | |
Getty Realty Corp.(a)(c) | | | 2,962,711 | | | | 106,746,477 | |
Retail Opportunity Investments Corp.(a) | | | 9,116,025 | | | | 127,259,709 | |
RPT Realty(a) | | | 6,257,928 | | | | 59,512,895 | |
Saul Centers, Inc. | | | 933,729 | | | | 36,415,431 | |
SITE Centers Corp. | | | 9,273,175 | | | | 113,874,589 | |
Tanger Factory Outlet Centers, Inc.(a) | | | 7,605,109 | | | | 149,288,290 | |
Urban Edge Properties(a)(c) | | | 8,536,716 | | | | 128,562,943 | |
Urstadt Biddle Properties, Inc.,
Class A(a)(c) | | | 1,947,702 | | | | 34,221,124 | |
Whitestone REIT(a) | | | 3,359,402 | | | | 30,906,498 | |
| | | | | | | | |
| | |
| | | | | | | 882,751,820 | |
|
| Semiconductors & Semiconductor Equipment — 4.1% | |
Alpha & Omega Semiconductor Ltd.(a)(b)(c) | | | 1,630,800 | | | | 43,950,060 | |
Axcelis Technologies, Inc.(a)(b)(c) | | | 2,385,852 | | | | 317,914,779 | |
CEVA, Inc.(a)(b)(c) | | | 1,689,596 | | | | 51,414,406 | |
Cohu, Inc.(a)(b)(c) | | | 3,471,278 | | | | 133,262,362 | |
Diodes, Inc.(a)(b)(c) | | | 3,311,198 | | | | 307,146,726 | |
FormFactor, Inc.(a)(b)(c) | | | 5,614,111 | | | | 178,809,435 | |
Ichor Holdings Ltd.(a)(b)(c) | | | 2,103,036 | | | | 68,853,399 | |
Kulicke & Soffa Industries, Inc.(a)(c) | | | 4,125,732 | | | | 217,384,819 | |
MaxLinear, Inc.(a)(b)(c) | | | 5,272,494 | | | | 185,644,514 | |
Onto Innovation, Inc.(a)(b)(c) | | | 3,604,573 | | | | 316,769,875 | |
PDF Solutions, Inc.(a)(b)(c) | | | 2,151,966 | | | | 91,243,358 | |
Photronics, Inc.(a)(b)(c) | | | 4,485,956 | | | | 74,377,150 | |
Rambus, Inc.(a)(b)(c) | | | 7,824,230 | | | | 401,070,030 | |
Semtech Corp.(a)(b)(c) | | | 4,646,651 | | | | 112,170,155 | |
SMART Global Holdings, Inc.(a)(b)(c) | | | 3,575,268 | | | | 61,637,620 | |
Ultra Clean Holdings, Inc.(a)(b)(c) | | | 3,306,718 | | | | 109,650,769 | |
Veeco Instruments, Inc.(a)(b)(c) | | | 3,736,621 | | | | 78,954,802 | |
| | | | | | | | |
| | |
| | | | | | | 2,750,254,259 | |
|
| Software — 2.8% | |
8x8, Inc.(a)(b)(c) | | | 8,237,171 | | | | 34,349,003 | |
A10 Networks, Inc.(a) | | | 4,674,392 | | | | 72,406,332 | |
Adeia, Inc.(a) | | | 7,007,031 | | | | 62,082,295 | |
Agilysys, Inc.(a)(b)(c) | | | 1,451,355 | | | | 119,751,301 | |
Alarm.com Holdings, Inc.(a)(b)(c) | | | 3,637,926 | | | | 182,914,919 | |
Cerence, Inc.(a)(b)(c) | | | 2,922,879 | | | | 82,103,671 | |
Consensus Cloud Solutions, Inc.(a)(b)(c) | | | 1,283,344 | | | | 43,749,197 | |
Digital Turbine, Inc.(a)(b)(c) | | | 6,559,083 | | | | 81,070,266 | |
DoubleVerify Holdings, Inc.(b)(c) | | | 6,358,731 | | | | 191,715,740 | |
Ebix, Inc.(a)(c) | | | 1,714,112 | | | | 22,609,137 | |
| | | | | | | | |
| Security | | Shares | | | Value | |
|
Software (continued) | |
InterDigital, Inc.(a)(c) | | | 1,957,466 | | | $ | 142,699,271 | |
LivePerson, Inc.(a)(b)(c) | | | 5,069,307 | | | | 22,355,644 | |
LiveRamp Holdings, Inc.(a)(b) | | | 4,715,966 | | | | 103,421,134 | |
N-able, Inc.(b) | | | 4,864,706 | | | | 64,214,119 | |
OneSpan, Inc.(a)(b)(c) | | | 2,565,332 | | | | 44,893,310 | |
Progress Software Corp.(a)(c) | | | 3,159,351 | | | | 181,504,715 | |
SPS Commerce, Inc.(a)(b)(c) | | | 2,623,723 | | | | 399,593,013 | |
Xperi, Inc.(a)(b)(c) | | | 3,040,967 | | | | 33,237,769 | |
| | | | | | | | |
| | |
| | | | | | | 1,884,670,836 | |
|
| Specialized REITs — 0.7% | |
Four Corners Property Trust, Inc.(a) | | | 6,099,726 | | | | 163,838,640 | |
Outfront Media, Inc.(a) | | | 9,887,688 | | | | 160,477,176 | |
Safehold, Inc.(c) | | | 2,923,529 | | | | 85,864,036 | |
Uniti Group, Inc.(a) | | | 17,283,393 | | | | 61,356,045 | |
| | | | | | | | |
| | |
| | | | | | | 471,535,897 | |
|
| Specialty Retail — 4.7% | |
Aaron’s Co., Inc.(a) | | | 2,309,643 | | | | 22,311,151 | |
Abercrombie & Fitch Co., Class A(a)(b)(c) | | | 3,561,007 | | | | 98,817,944 | |
Academy Sports & Outdoors, Inc.(a)(c) | | | 5,688,621 | | | | 371,182,519 | |
American Eagle Outfitters, Inc.(a) | | | 12,703,197 | | | | 170,730,968 | |
America’s Car-Mart, Inc.(a)(b)(c) | | | 419,486 | | | | 33,227,486 | |
Asbury Automotive Group, Inc.(a)(b)(c) | | | 1,610,911 | | | | 338,291,310 | |
Boot Barn Holdings, Inc.(a)(b)(c) | | | 2,173,103 | | | | 166,546,614 | |
Buckle, Inc. | | | 2,147,447 | | | | 76,642,383 | |
Caleres, Inc.(a)(c) | | | 2,595,140 | | | | 56,132,878 | |
Chico’s FAS, Inc.(a)(b)(c) | | | 9,089,694 | | | | 49,993,317 | |
Children’s Place, Inc.(a)(b)(c) | | | 890,986 | | | | 35,862,187 | |
Designer Brands, Inc., Class A(a)(c) | | | 3,665,806 | | | | 32,039,144 | |
Genesco, Inc.(a)(b)(c) | | | 872,907 | | | | 32,192,810 | |
Group 1 Automotive, Inc.(a)(c) | | | 1,061,213 | | | | 240,279,848 | |
Guess?, Inc.(c) | | | 2,216,815 | | | | 43,139,220 | |
Haverty Furniture Cos., Inc.(a) | | | 957,319 | | | | 30,548,049 | |
Hibbett, Inc.(a)(c) | | | 927,421 | | | | 54,699,291 | |
Leslie’s, Inc.(a)(b)(c) | | | 10,821,303 | | | | 119,142,546 | |
MarineMax, Inc.(a)(b)(c) | | | 1,592,394 | | | | 45,781,328 | |
Monro, Inc.(a)(c) | | | 2,282,040 | | | | 112,801,237 | |
National Vision Holdings, Inc.(a)(b)(c) | | | 5,735,145 | | | | 108,050,132 | |
ODP Corp.(a)(b)(c) | | | 2,938,114 | | | | 132,156,368 | |
PetMed Express, Inc.(a) | | | 1,525,680 | | | | 24,777,043 | |
Sally Beauty Holdings, Inc.(a)(b)(c) | | | 7,801,684 | | | | 121,550,237 | |
Shoe Carnival, Inc.(c) | | | 1,227,489 | | | | 31,485,093 | |
Signet Jewelers Ltd.(a)(c) | | | 3,312,064 | | | | 257,612,338 | |
Sleep Number Corp.(a)(b)(c) | | | 1,603,114 | | | | 48,750,697 | |
Sonic Automotive, Inc., Class A(a) | | | 1,216,306 | | | | 66,094,068 | |
Upbound Group, Inc.(a) | | | 3,650,830 | | | | 89,481,843 | |
Urban Outfitters, Inc.(b)(c) | | | 4,366,392 | | | | 121,036,386 | |
Zumiez, Inc.(a)(b)(c) | | | 1,128,386 | | | | 20,807,438 | |
| | | | | | | | |
| | |
| | | | | | | 3,152,163,873 | |
|
| Technology Hardware, Storage & Peripherals — 0.2% | |
Avid Technology, Inc.(a)(b)(c) | | | 2,412,724 | | | | 77,158,914 | |
Corsair Gaming, Inc.(b)(c) | | | 2,930,154 | | | | 53,768,326 | |
| | | | | | | | |
| | |
| | | | | | | 130,927,240 | |
|
| Textiles, Apparel & Luxury Goods — 1.2% | |
G-III Apparel Group Ltd.(a)(b)(c) | | | 3,114,235 | | | | 48,426,354 | |
Hanesbrands, Inc.(a) | | | 25,466,137 | | | | 133,951,881 | |
Kontoor Brands, Inc.(a) | | | 3,598,072 | | | | 174,110,704 | |
Movado Group, Inc.(a) | | | 1,144,431 | | | | 32,925,280 | |
Oxford Industries, Inc.(a) | | | 1,080,262 | | | | 114,064,865 | |
| | |
| 28 | | 2 0 2 3 I SHARES ANNUAL REPORT TO SHAREHOLDERS |
| | |
Schedule of Investments (continued) March 31, 2023 | | iShares® Core S&P Small-Cap ETF (Percentages shown are based on Net Assets) |
| | | | | | | | |
| Security | | Shares | | | Value | |
|
Textiles, Apparel & Luxury Goods (continued) | |
Steven Madden Ltd.(a) | | | 5,336,227 | | | $ | 192,104,172 | |
Wolverine World Wide, Inc.(a) | | | 5,723,277 | | | | 97,581,873 | |
| | | | | | | | |
| | |
| | | | | | | 793,165,129 | |
|
| Tobacco — 0.3% | |
Universal Corp.(a) | | | 1,784,417 | | | | 94,377,815 | |
Vector Group Ltd.(a) | | | 9,563,830 | | | | 114,861,598 | |
| | | | | | | | |
| | |
| | | | | | | 209,239,413 | |
|
| Trading Companies & Distributors — 1.5% | |
Applied Industrial Technologies, Inc.(a) | | | 2,809,934 | | | | 399,375,919 | |
Boise Cascade Co.(a) | | | 2,875,284 | | | | 181,861,713 | |
DXP Enterprises, Inc.(a)(b)(c) | | | 1,140,717 | | | | 30,708,102 | |
GMS, Inc.(a)(b)(c) | | | 3,033,684 | | | | 175,619,967 | |
NOW, Inc.(a)(b) | | | 8,047,443 | | | | 89,728,989 | |
Veritiv Corp.(a)(c) | | | 980,143 | | | | 132,456,525 | |
| | | | | | | | |
| | |
| | | | | | | 1,009,751,215 | |
|
| Water Utilities — 1.1% | |
American States Water Co.(a)(c) | | | 2,694,199 | | | | 239,487,349 | |
California Water Service Group(a)(c) | | | 3,996,261 | | | | 232,582,390 | |
Middlesex Water Co.(a) | | | 1,154,264 | | | | 90,171,104 | |
SJW Group(a)(c) | | | 1,939,932 | | | | 147,687,023 | |
| | | | | | | | |
| | |
| | | | | | | 709,927,866 | |
|
| Wireless Telecommunication Services — 0.3% | |
Gogo, Inc.(b)(c) | | | 4,716,168 | | | | 68,384,436 | |
Shenandoah Telecommunications Co.(a)(c) | | | 3,638,133 | | | | 69,197,290 | |
Telephone & Data Systems, Inc.(a) | | | 7,252,345 | | | | 76,222,146 | |
| | | | | | | | |
| | |
| | | | | | | 213,803,872 | |
| | | | | | | | |
| | |
Total Long-Term Investments — 98.0%
(Cost: $62,632,365,862) | | | | | | | 65,397,157,378 | |
| | | | | | | | |
| | | | | | | | |
| Security | | Shares | | | Value | |
|
Short-Term Securities | |
| | |
Money Market Funds — 8.0% | | | | | | | | |
BlackRock Cash Funds: Institutional, SL Agency Shares, 5.01%(a)(e)(f) | | | 4,008,224,675 | | | $ | 4,009,427,142 | |
BlackRock Cash Funds: Treasury, SL Agency Shares, 4.73%(a)(e) | | | 1,360,595,186 | | | | 1,360,595,186 | |
| | | | | | | | |
| |
Total Short-Term Securities — 8.0%
(Cost: $5,368,330,986) | | | | 5,370,022,328 | |
| | | | | | | | |
| | |
Total Investments — 106.0%
(Cost: $68,000,696,848) | | | | | | | 70,767,179,706 | |
| |
Liabilities in Excess of Other Assets — (6.0)% | | | | (4,010,353,638 | ) |
| | | | | | | | |
| | |
Net Assets — 100.0% | | | | | | $ | 66,756,826,068 | |
| | | | | | | | |
| (a) | Affiliate of the Fund. |
| (b) | Non-income producing security. |
| (c) | All or a portion of this security is on loan. |
| (d) | Security is valued using significant unobservable inputs and is classified as Level 3 in the fair value hierarchy. |
| (e) | Annualized 7-day yield as of period end. |
| (f) | All or a portion of this security was purchased with the cash collateral from loaned securities. |
Affiliates
Investments in issuers considered to be affiliate(s) of the Fund during the year ended March 31, 2023 for purposes of Section 2(a)(3) of the Investment Company Act of 1940, as amended, were as follows:
| | | | | | | | | | | | | | | | | | | | | | | | | | | | | | | | | | | | |
| Affiliated Issuer | | Value at
03/31/22 | | | Purchases
at Cost | | | Proceeds
from Sale | | | Net
Realized
Gain (Loss) | | | Change in
Unrealized
Appreciation
(Depreciation) | | | Value at
03/31/23 | | | Shares
Held at
03/31/23 | | | Income | | | Capital
Gain
Distributions
from Underlying
Funds | |
3D Systems Corp. | | $ | 152,404,409 | | | $ | 24,662,984 | | | $ | (19,480,285 | ) | | $ | (11,227,169 | ) | | $ | (44,177,521 | ) | | $ | 102,182,418 | | | | 9,531,942 | | | $ | — | | | $ | — | |
8x8, Inc. | | | 106,604,327 | | | | 11,767,591 | | | | (12,723,576 | ) | | | (30,574,050 | ) | | | (40,725,289 | ) | | | 34,349,003 | | | | 8,237,171 | | | | — | | | | — | |
A10 Networks, Inc. | | | — | | | | 86,781,273 | | | | (38,928,595 | ) | | | 21,173,542 | | | | 3,380,112 | | | | 72,406,332 | | | | 4,674,392 | | | | 585,505 | | | | — | |
AAON, Inc. | | | 165,097,728 | | | | 44,845,794 | | | | (40,417,189 | ) | | | 9,842,014 | | | | 116,856,552 | | | | 296,224,899 | | | | 3,063,656 | | | | 1,687,373 | | | | — | |
AAR Corp. | | | 115,530,346 | | | | 25,837,586 | | | | (26,266,391 | ) | | | 4,598,418 | | | | 10,430,212 | | | | 130,130,171 | | | | 2,385,521 | | | | — | | | | — | |
Aaron’s Co., Inc. | | | 45,249,919 | | | | 6,443,087 | | | | (5,879,674 | ) | | | (1,132,941 | ) | | | (22,369,240 | ) | | | 22,311,151 | | | | 2,309,643 | | | | 1,055,697 | | | | — | |
Abercrombie & Fitch Co., Class A | | | 129,296,574 | | | | 19,848,577 | | | | (30,567,385 | ) | | | (2,198,429 | ) | | | (17,561,393 | ) | | | 98,817,944 | | | | 3,561,007 | | | | — | | | | — | |
ABM Industries, Inc. | | | 222,000,552 | | | | 48,632,477 | | | | (47,797,854 | ) | | | 4,298,724 | | | | (10,949,759 | ) | | | 216,184,140 | | | | 4,810,506 | | | | 3,888,432 | | | | — | |
Academy Sports & Outdoors, Inc. | | | 247,233,030 | | | | 61,399,958 | | | | (92,958,501 | ) | | | 11,206,490 | | | | 144,301,542 | | | | 371,182,519 | | | | 5,688,621 | | | | 1,891,899 | | | | — | |
Acadia Realty Trust | | | 137,120,154 | | | | 15,195,178 | | | | (7,019,605 | ) | | | 1,222,829 | | | | (50,554,692 | ) | | | 95,963,864 | | | | 6,879,130 | | | | 4,879,964 | | | | — | |
Addus HomeCare Corp. | | | 106,333,341 | | | | 25,381,144 | | | | (21,779,949 | ) | | | 1,671,593 | | | | 13,413,461 | | | | 125,019,590 | | | | 1,171,034 | | | | — | | | | — | |
Adeia, Inc.(a) | | | 115,255,905 | | | | 82,872,361 | | | | (160,716,178 | ) | | | 721,219 | | | | 23,948,988 | | | | 62,082,295 | | | | 7,007,031 | | | | 1,356,882 | | | | — | |
Adtalem Global Education, Inc. | | | 105,883,558 | | | | 28,909,504 | | | | (34,876,964 | ) | | | (1,070,211 | ) | | | 29,080,430 | | | | 127,926,317 | | | | 3,312,437 | | | | — | | | | — | |
ADTRAN Holdings, Inc. | | | 64,475,720 | | | | 62,658,835 | | | | (27,099,355 | ) | | | (810,701 | ) | | | (17,787,523 | ) | | | 81,436,976 | | | | 5,134,740 | | | | 1,787,579 | | | | — | |
Advanced Energy Industries, Inc. | | | 232,148,377 | | | | 51,281,270 | | | | (48,584,909 | ) | | | 9,017,805 | | | | 22,818,487 | | | | 266,681,030 | | | | 2,721,235 | | | | 1,103,075 | | | | — | |
AdvanSix, Inc. | | | 103,129,764 | | | | 18,373,211 | | | | (18,753,755 | ) | | | 3,805,480 | | | | (29,898,397 | ) | | | 76,656,303 | | | | 2,003,039 | | | | 1,159,906 | | | | — | |
| | |
SCHEDULES OF INVESTMENTS | | 29 |
| | |
Schedule of Investments (continued) March 31, 2023 | | iShares® Core S&P Small-Cap ETF |
Affiliates (continued)
| | | | | | | | | | | | | | | | | | | | | | | | | | | | | | | | | | | | |
| Affiliated Issuer | | Value at
03/31/22 | | | Purchases
at Cost | | | Proceeds
from Sale | | | Net
Realized
Gain (Loss) | | | Change in
Unrealized
Appreciation
(Depreciation) | | | Value at
03/31/23 | | | Shares
Held at
03/31/23 | | | Income | | | Capital
Gain
Distributions
from Underlying
Funds | |
Aerojet Rocketdyne Holdings, Inc. | | $ | 210,898,884 | | | $ | 62,588,133 | | | $ | (56,504,377 | ) | | $ | 13,578,054 | | | $ | 79,369,807 | | | $ | 309,930,501 | | | | 5,517,723 | | | $ | — | | | $ | — | |
AeroVironment, Inc. | | | 155,389,744 | | | | 44,558,234 | | | | (28,421,745 | ) | | | 9,246,380 | | | | (13,096,043 | ) | | | 167,676,570 | | | | 1,829,332 | | | | — | | | | — | |
Agilysys, Inc. | | | 55,832,998 | | | | 19,684,622 | | | | (16,669,235 | ) | | | 7,384,983 | | | | 53,517,933 | | | | 119,751,301 | | | | 1,451,355 | | | | — | | | | — | |
Agree Realty Corp.(b) | | | 338,698,786 | | | | 154,634,325 | | | | (539,404,770 | ) | | | 55,502,755 | | | | (9,431,096 | ) | | | — | | | | — | | | | 12,347,293 | | | | — | |
Alamo Group, Inc. | | | 102,110,887 | | | | 25,382,731 | | | | (20,752,847 | ) | | | 5,282,379 | | | | 26,100,349 | | | | 138,123,499 | | | | 750,019 | | | | 558,384 | | | | — | |
Alarm.com Holdings, Inc. | | | 219,126,130 | | | | 61,863,054 | | | | (36,756,730 | ) | | | 421,277 | | | | (61,738,812 | ) | | | 182,914,919 | | | | 3,637,926 | | | | — | | | | — | |
Albany International Corp., Class A | | | 195,263,787 | | | | 45,802,941 | | | | (48,114,029 | ) | | | 7,680,594 | | | | 1,666,576 | | | | 202,299,869 | | | | 2,263,875 | | | | 2,137,028 | | | | — | |
Alexander & Baldwin, Inc. | | | 120,333,884 | | | | 22,078,056 | | | | (20,280,445 | ) | | | (990,277 | ) | | | (21,510,612 | ) | | | 99,630,606 | | | | 5,268,673 | | | | 4,595,907 | | | | — | |
Allegiance Bancshares, Inc.(c) | | | 59,587,214 | | | | 1,191,015 | | | | (1,714,036 | ) | | | (240,815 | ) | | | (14,481,640 | ) | | | N/A | | | | N/A | | | | 374,576 | | | | — | |
Allegiant Travel Co. | | | 176,482,366 | | | | 28,135,547 | | | | (22,500,888 | ) | | | (8,585,147 | ) | | | (68,993,757 | ) | | | 104,538,121 | | | | 1,136,531 | | | | — | | | | — | |
Alpha & Omega Semiconductor Ltd. | | | — | | | | 74,656,037 | | | | (20,008,320 | ) | | | 9,499,187 | | | | (20,196,844 | ) | | | 43,950,060 | | | | 1,630,800 | | | | — | | | | — | |
AMC Networks, Inc., Class A | | | 84,999,626 | | | | 15,358,452 | | | | (15,557,823 | ) | | | (6,543,847 | ) | | | (42,597,505 | ) | | | 35,658,903 | | | | 2,028,379 | | | | — | | | | — | |
American Assets Trust, Inc. | | | 143,001,293 | | | | 11,882,786 | | | | (12,371,095 | ) | | | (569,277 | ) | | | (71,188,643 | ) | | | 70,755,064 | | | | 3,806,082 | | | | 4,952,409 | | | | — | |
American Axle & Manufacturing Holdings, Inc. | | | 63,354,402 | | | | 17,679,019 | | | | (14,898,379 | ) | | | (6,193,534 | ) | | | 5,247,898 | | | | 65,189,406 | | | | 8,346,915 | | | | — | | | | — | |
American Eagle Outfitters, Inc. | | | — | | | | 161,173,977 | | | | (16,807,269 | ) | | | (313,181 | ) | | | 26,677,441 | | | | 170,730,968 | | | | 12,703,197 | | | | — | | | | — | |
American Equity Investment Life Holding Co. | | | 235,483,048 | | | | 49,749,323 | | | | (77,744,401 | ) | | | 5,623,606 | | | | (28,479,328 | ) | | | 184,632,248 | | | | 5,059,804 | | | | 1,902,706 | | | | — | |
American Public Education,
Inc.(b) | | | 28,333,714 | | | | 2,755,480 | | | | (13,022,878 | ) | | | (30,408,883 | ) | | | 12,342,567 | | | | — | | | | — | | | | — | | | | — | |
American States Water Co. | | | 235,397,633 | | | | 52,600,483 | | | | (47,081,714 | ) | | | 10,480,384 | | | | (11,909,437 | ) | | | 239,487,349 | | | | 2,694,199 | | | | 4,247,935 | | | | — | |
American Vanguard Corp. | | | 38,992,028 | | | | 13,351,380 | | | | (11,014,973 | ) | | | 1,431,252 | | | | 1,572,344 | | | | 44,332,031 | | | | 2,026,144 | | | | 222,639 | | | | — | |
American Woodmark Corp. | | | 58,267,437 | | | | 15,250,232 | | | | (13,999,614 | ) | | | (4,704,625 | ) | | | 8,251,359 | | | | 63,064,789 | | | | 1,211,154 | | | | — | | | | — | |
America’s Car-Mart, Inc. | | | 34,900,525 | | | | 9,448,035 | | | | (9,269,577 | ) | | | (3,056,013 | ) | | | 1,204,516 | | | | 33,227,486 | | | | 419,486 | | | | — | | | | — | |
Ameris Bancorp | | | 205,685,482 | | | | 12,353,637 | | | | (8,951,488 | ) | | | (1,988,069 | ) | | | (33,285,412 | ) | | | 173,814,150 | | | | 4,751,617 | | | | 2,828,491 | | | | — | |
AMERISAFE, Inc. | | | 68,577,780 | | | | 18,761,911 | | | | (17,388,388 | ) | | | (1,269,439 | ) | | | (357,797 | ) | | | 68,324,067 | | | | 1,395,793 | | | | 7,682,001 | | | | — | |
AMN Healthcare Services, Inc. | | | 353,146,095 | | | | 76,971,591 | | | | (92,599,911 | ) | | | 12,930,004 | | | | (88,744,902 | ) | | | 261,702,877 | | | | 3,154,567 | | | | — | | | | — | |
Amphastar Pharmaceuticals, Inc. | | | 94,656,884 | | | | 22,616,892 | | | | (19,129,884 | ) | | | 4,145,405 | | | | 454,741 | | | | 102,744,038 | | | | 2,739,841 | | | | — | | | | — | |
Andersons, Inc. | | | 109,438,184 | | | | 21,830,262 | | | | (19,021,154 | ) | | | 2,476,072 | | | | (21,260,871 | ) | | | 93,462,493 | | | | 2,261,919 | | | | 1,662,052 | | | | — | |
AngioDynamics, Inc. | | | 59,765,035 | | | | 12,919,169 | | | | (10,674,241 | ) | | | (1,369,948 | ) | | | (31,155,732 | ) | | | 29,484,283 | | | | 2,851,478 | | | | — | | | | — | |
ANI Pharmaceuticals, Inc. | | | 25,597,584 | | | | 7,637,563 | | | | (8,360,800 | ) | | | (2,415,811 | ) | | | 12,901,837 | | | | 35,360,373 | | | | 890,241 | | | | — | | | | — | |
Anika Therapeutics, Inc. | | | 26,046,427 | | | | 6,425,293 | | | | (5,779,803 | ) | | | (1,642,180 | ) | | | 5,527,987 | | | | 30,577,724 | | | | 1,064,684 | | | | — | | | | — | |
Anywhere Real Estate, Inc.(d) | | | 130,770,667 | | | | 20,489,257 | | | | (19,048,491 | ) | | | (7,300,539 | ) | | | (81,013,750 | ) | | | 43,897,144 | | | | 8,313,853 | | | | — | | | | — | |
Apogee Enterprises, Inc. | | | 84,458,297 | | | | 17,698,554 | | | | (23,069,440 | ) | | | (575,155 | ) | | | (8,704,939 | ) | | | 69,807,317 | | | | 1,614,042 | | | | 1,491,824 | | | | — | |
Apollo Commercial Real Estate Finance, Inc. | | | 131,414,687 | | | | 23,099,636 | | | | (33,427,342 | ) | | | (6,668,246 | ) | | | (26,251,108 | ) | | | 88,167,627 | | | | 9,470,207 | | | | 13,212,500 | | | | — | |
Apollo Medical Holdings,
Inc.(c) | | | — | | | | 28,747,362 | | | | (41,852,212 | ) | | | 9,472,847 | | | | — | | | | N/A | | | | N/A | | | | — | | | | — | |
Applied Industrial Technologies, Inc. | | | 282,658,706 | | | | 69,869,998 | | | | (64,089,898 | ) | | | 16,236,890 | | | | 94,700,223 | | | | 399,375,919 | | | | 2,809,934 | | | | 3,888,544 | | | | — | |
ArcBest Corp. | | | 143,182,130 | | | | 33,295,412 | | | | (33,239,385 | ) | | | 7,562,075 | | | | 12,021,073 | | | | 162,821,305 | | | | 1,761,754 | | | | 870,197 | | | | — | |
Archrock, Inc. | | | 88,793,680 | | | | 24,175,239 | | | | (31,321,180 | ) | | �� | 661,753 | | | | 12,706,025 | | | | 95,015,517 | | | | 9,725,232 | | | | 2,836,469 | | | | — | |
| | |
| 30 | | 2 0 2 3 I SHARES ANNUAL REPORT TO SHAREHOLDERS |
| | |
Schedule of Investments (continued) March 31, 2023 | | iShares® Core S&P Small-Cap ETF |
Affiliates (continued)
| | | | | | | | | | | | | | | | | | | | | | | | | | | | | | | | | | | | |
| Affiliated Issuer | | Value at
03/31/22 | | | Purchases
at Cost | | | Proceeds
from Sale | | | Net
Realized
Gain (Loss) | | | Change in
Unrealized
Appreciation
(Depreciation) | | | Value at
03/31/23 | | | Shares
Held at
03/31/23 | | | Income | | | Capital
Gain
Distributions
from Underlying
Funds | |
Arconic Corp. | | $ | 195,119,102 | | | $ | 32,892,803 | | | $ | (35,328,069 | ) | | $ | 1,597,707 | | | $ | (94,741 | ) | | $ | 194,186,802 | | | | 7,403,233 | | | $ | — | | | $ | — | |
Arcosa, Inc. | | | 198,075,840 | | | | 42,982,430 | | | | (40,189,854 | ) | | | 9,612,960 | | | | 11,614,894 | | | | 222,096,270 | | | | 3,519,193 | | | | 701,072 | | | | — | |
Arcus Biosciences, Inc. | | | — | | | | 146,007,948 | | | | (22,995,254 | ) | | | 2,951,290 | | | | (56,650,434 | ) | | | 69,313,550 | | | | 3,800,085 | | | | — | | | | — | |
Arlo Technologies, Inc. | | | 53,460,460 | | | | 10,117,741 | | | | (7,510,145 | ) | | | (242,606 | ) | | | (16,759,896 | ) | | | 39,065,554 | | | | 6,446,461 | | | | — | | | | — | |
Armada Hoffler Properties, Inc. | | | 70,086,380 | | | | 16,197,943 | | | | (16,629,053 | ) | | | (1,230,678 | ) | | | (10,176,385 | ) | | | 58,248,207 | | | | 4,932,109 | | | | 2,953,496 | | | | — | |
ARMOUR Residential REIT, Inc. | | | 53,925,690 | | | | 47,282,573 | | | | (32,735,236 | ) | | | (5,681,406 | ) | | | (471,748 | ) | | | 62,319,873 | | | | 11,870,452 | | | | 5,282,344 | | | | — | |
Artivion, Inc. | | | 60,418,875 | | | | 12,329,107 | | | | (9,951,756 | ) | | | (2,773,688 | ) | | | (21,527,441 | ) | | | 38,495,097 | | | | 2,938,557 | | | | — | | | | — | |
Asbury Automotive Group, Inc. | | | 265,364,091 | | | | 62,255,621 | | | | (68,435,225 | ) | | | 16,639,812 | | | | 62,467,011 | | | | 338,291,310 | | | | 1,610,911 | | | | — | | | | — | |
Assured Guaranty Ltd. | | | 318,170,834 | | | | 41,988,544 | | | | (90,349,449 | ) | | | 9,683,149 | | | | (60,094,187 | ) | | | 219,398,891 | | | | 4,364,410 | | | | 4,863,472 | | | | — | |
Astec Industries, Inc. | | | 69,718,136 | | | | 18,126,708 | | | | (15,704,104 | ) | | | (4,055,621 | ) | | | 179,424 | | | | 68,264,543 | | | | 1,654,898 | | | | 846,534 | | | | — | |
ATI, Inc.(e) | | | 244,513,581 | | | | 69,679,893 | | | | (60,450,699 | ) | | | 17,173,459 | | | | 100,839,149 | | | | 371,755,383 | | | | 9,421,069 | | | | — | | | | — | |
Atlantic Union Bankshares Corp. | | | — | | | | 160,269,742 | | | | — | | | | — | | | | 467,981 | | | | 160,737,723 | | | | 4,585,955 | | | | — | | | | — | |
Atlas Air Worldwide Holdings, Inc.(b) | | | 166,773,819 | | | | 42,122,389 | | | | (240,052,009 | ) | | | 89,824,991 | | | | (58,669,190 | ) | | | — | | | | — | | | | — | | | | — | |
ATN International, Inc.(c) | | | — | | | | 8,028,245 | | | | (24,607,848 | ) | | | 15,176,156 | | | | — | | | | N/A | | | | N/A | | | | 463,707 | | | | — | |
Avanos Medical, Inc. | | | 115,498,754 | | | | 22,157,026 | | | | (23,245,733 | ) | | | (5,842,420 | ) | | | (8,071,646 | ) | | | 100,495,981 | | | | 3,379,152 | | | | — | | | | — | |
Avantax, Inc.(f) | | | 68,374,913 | | | | 20,435,701 | | | | (36,525,939 | ) | | | 2,829,652 | | | | 21,235,150 | | | | 76,349,477 | | | | 2,900,816 | | | | — | | | | — | |
Avid Bioservices, Inc. | | | 89,677,316 | | | | 18,495,816 | | | | (15,476,258 | ) | | | (5,171,043 | ) | | | (2,590,419 | ) | | | 84,935,412 | | | | 4,527,474 | | | | — | | | | — | |
Avid Technology, Inc. | | | — | | | | 79,174,939 | | | | (12,573,677 | ) | | | (555,562 | ) | | | 11,113,214 | | | | 77,158,914 | | | | 2,412,724 | | | | — | | | | — | |
Avista Corp. | | | 227,402,896 | | | | 17,823,617 | | | | (6,971,692 | ) | | | (1,248,856 | ) | | | (11,708,406 | ) | | | 225,297,559 | | | | 5,307,363 | | | | 9,214,387 | | | | — | |
Axcelis Technologies, Inc. | | | 179,950,376 | | | | 41,442,034 | | | | (43,908,344 | ) | | | 13,793,707 | | | | 126,637,006 | | | | 317,914,779 | | | | 2,385,852 | | | | — | | | | — | |
Axos Financial, Inc. | | | 173,668,573 | | | | 25,618,459 | | | | (18,541,445 | ) | | | 157,102 | | | | (37,307,702 | ) | | | 143,594,987 | | | | 3,889,355 | | | | — | | | | — | |
AZZ, Inc. | | | 85,248,715 | | | | 18,653,608 | | | | (16,496,162 | ) | | | (1,588,271 | ) | | | (11,220,297 | ) | | | 74,597,593 | | | | 1,808,865 | | | | 1,225,359 | | | | — | |
B&G Foods, Inc. | | | 125,617,072 | | | | 38,558,129 | | | | (36,640,710 | ) | | | (3,011,858 | ) | | | (43,649,366 | ) | | | 80,873,267 | | | | 5,207,551 | | | | 2,283,632 | | | | — | |
Badger Meter, Inc. | | | 208,791,145 | | | | 46,765,888 | | | | (42,683,031 | ) | | | 12,677,695 | | | | 34,005,913 | | | | 259,557,610 | | | | 2,130,665 | | | | 1,886,157 | | | | — | |
Balchem Corp. | | | 316,937,446 | | | | 64,726,216 | | | | (58,953,764 | ) | | | 5,878,853 | | | | (32,769,992 | ) | | | 295,818,759 | | | | 2,338,858 | | | | 1,691,144 | | | | — | |
Banc of California, Inc. | | | 75,436,879 | | | | 11,424,864 | | | | (9,106,841 | ) | | | (140,271 | ) | | | (27,484,068 | ) | | | 50,130,563 | | | | 4,000,843 | | | | 1,122,541 | | | | — | |
Bancorp, Inc. | | | 112,651,582 | | | | 1,191,754 | | | | (783,852 | ) | | | (491,079 | ) | | | (1,659,512 | ) | | | 110,908,893 | | | | 3,982,366 | | | | — | | | | — | |
BankUnited, Inc. | | | 243,143,815 | | | | 9,501,842 | | | | (19,441,242 | ) | | | 3,516,486 | | | | (118,007,477 | ) | | | 118,713,424 | | | | 5,257,459 | | | | 5,457,772 | | | | — | |
Banner Corp. | | | 130,580,723 | | | | 11,143,078 | | | | — | | | | — | | | | (10,668,396 | ) | | | 131,055,405 | | | | 2,410,436 | | | | 4,175,687 | | | | — | |
Barnes Group, Inc. | | | 133,984,216 | | | | 36,726,133 | | | | (24,863,435 | ) | | | (2,935,009 | ) | | | 5,544,788 | | | | 148,456,693 | | | | 3,685,618 | | | | 2,291,250 | | | | — | |
Bed Bath & Beyond,
Inc.(b) | | | 155,271,105 | | | | 8,995,978 | | | | (25,699,438 | ) | | | (53,283,154 | ) | | | (85,284,491 | ) | | | — | | | | — | | | | — | | | | — | |
Benchmark Electronics, Inc. | | | 63,315,343 | | | | 16,420,802 | | | | (15,033,162 | ) | | | (390,181 | ) | | | (3,593,508 | ) | | | 60,719,294 | | | | 2,563,077 | | | | 1,682,249 | | | | — | |
Berkshire Hills Bancorp, Inc. | | | 92,929,531 | | | | — | | | | (3,082,907 | ) | | | (1,914,274 | ) | | | (10,457,230 | ) | | | 77,475,120 | | | | 3,091,585 | | | | 1,868,895 | | | | — | |
Big Lots, Inc. | | | 75,631,586 | | | | 10,841,890 | | | | (12,433,659 | ) | | | (7,830,164 | ) | | | (43,241,384 | ) | | | 22,968,269 | | | | 2,095,645 | | | | 2,590,058 | | | | — | |
BioLife Solutions, Inc. | | | 48,785,285 | | | | 16,629,644 | | | | (8,660,439 | ) | | | (4,683,407 | ) | | | 1,996,546 | | | | 54,067,629 | | | | 2,485,868 | | | | — | | | | — | |
BJ’s Restaurants, Inc. | | | 47,205,475 | | | | 11,207,975 | | | | (10,375,001 | ) | | | (2,597,118 | ) | | | 4,088,248 | | | | 49,529,579 | | | | 1,699,711 | | | | — | | | | — | |
BlackRock Cash Funds: Institutional, SL Agency Shares | | | 2,943,104,221 | | | | 1,064,562,774 | (g) | | | — | | | | (66,802 | ) | | | 1,826,949 | | | | 4,009,427,142 | | | | 4,008,224,675 | | | | 12,809,798 | (h) | | | — | |
BlackRock Cash Funds: Treasury, SL Agency Shares | | | 1,155,360,000 | | | | 205,235,186 | (g) | | | — | | | | — | | | | — | | | | 1,360,595,186 | | | | 1,360,595,186 | | | | 29,490,764 | | | | 976 | |
Bloomin’ Brands, Inc. | | | 127,477,631 | | | | 42,790,274 | | | | (31,124,369 | ) | | | 354,190 | | | | 24,635,726 | | | | 164,133,452 | | | | 6,398,965 | | | | 4,176,864 | | | | — | |
Boise Cascade Co. | | | 195,603,483 | | | | 44,434,679 | | | | (39,554,565 | ) | | | 9,440,188 | | | | (28,062,072 | ) | | | 181,861,713 | | | | 2,875,284 | | | | 11,387,967 | | | | — | |
Boot Barn Holdings, Inc. | | | 201,268,176 | | | | 35,619,541 | | | | (31,897,503 | ) | | | 3,946,378 | | | | (42,389,978 | ) | | | 166,546,614 | | | | 2,173,103 | | | | — | | | | — | |
Bottomline Technologies DE, Inc.(b) | | | 156,807,601 | | | | 2,758,945 | | | | (160,448,424 | ) | | | 42,629,208 | | | | (41,747,330 | ) | | | — | | | | — | | | | — | | | | — | |
Brandywine Realty Trust | | | 173,075,481 | | | | 20,383,894 | | | | (17,326,310 | ) | | | (4,632,236 | ) | | | (112,350,509 | ) | | | 59,150,320 | | | | 12,505,353 | | | | 9,453,974 | | | | — | |
Brightsphere Investment Group, Inc. | | | 60,793,028 | | | | 12,640,074 | | | | (15,100,322 | ) | | | 2,003,073 | | | | (4,808,372 | ) | | | 55,527,481 | | | | 2,354,855 | | | | 97,722 | | | | — | |
| | |
SCHEDULES OF INVESTMENTS | | 31 |
| | |
Schedule of Investments (continued) March 31, 2023 | | iShares® Core S&P Small-Cap ETF |
Affiliates (continued)
| | | | | | | | | | | | | | | | | | | | | | | | | | | | | | | | | | | | |
| Affiliated Issuer | | Value at
03/31/22 | | | Purchases
at Cost | | | Proceeds
from Sale | | | Net
Realized
Gain (Loss) | | | Change in
Unrealized
Appreciation
(Depreciation) | | | Value at
03/31/23 | | | Shares
Held at
03/31/23 | | | Income | | | Capital
Gain
Distributions
from Underlying
Funds | |
Brinker International, Inc. | | $ | 121,764,897 | | | $ | 24,129,039 | | | $ | (23,516,968 | ) | | $ | (2,984,702 | ) | | $ | 2,633,410 | | | $ | 122,025,676 | | | | 3,211,202 | | | $ | — | | | $ | — | |
Bristow Group, Inc. | | | 61,342,705 | | | | 10,639,395 | | | | (8,759,598 | ) | | | (400,902 | ) | | | (24,410,774 | ) | | | 38,410,826 | | | | 1,714,769 | | | | — | | | | — | |
Brookline Bancorp, Inc. | | | 80,283,225 | | | | 11,029,944 | | | | — | | | | — | | | | (29,554,101 | ) | | | 61,759,068 | | | | 5,881,816 | | | | 2,830,623 | | | | — | |
CalAmp Corp.(b) | | | 18,844,288 | | | | 1,530,954 | | | | (14,677,731 | ) | | | (23,125,724 | ) | | | 17,428,213 | | | | — | | | | — | | | | — | | | | — | |
Calavo Growers, Inc. | | | 46,121,825 | | | | 11,709,534 | | | | (9,401,590 | ) | | | (6,203,977 | ) | | | (5,305,511 | ) | | | 36,920,281 | | | | 1,283,291 | | | | 508,739 | | | | — | |
Caleres, Inc. | | | 52,700,056 | | | | 17,669,337 | | | | (19,414,433 | ) | | | (725,532 | ) | | | 5,903,450 | | | | 56,132,878 | | | | 2,595,140 | | | | 756,468 | | | | — | |
California Water Service Group | | | 223,030,745 | | | | 52,461,448 | | | | (38,052,521 | ) | | | 7,379,000 | | | | (12,236,282 | ) | | | 232,582,390 | | | | 3,996,261 | | | | 3,997,865 | | | | — | |
Callon Petroleum Co. | | | 199,652,943 | | | | 45,949,801 | | | | (29,272,331 | ) | | | (2,057,202 | ) | | | (89,654,470 | ) | | | 124,618,741 | | | | 3,726,637 | | | | — | | | | — | |
Cal-Maine Foods, Inc. | | | 147,935,153 | | | | 36,158,991 | | | | (31,387,217 | ) | | | 4,379,393 | | | | 10,936,773 | | | | 168,023,093 | | | | 2,759,453 | | | | 8,586,110 | | | | — | |
Capitol Federal Financial, Inc. | | | 98,848,924 | | | | 6,782,221 | | | | (4,730,341 | ) | | | (1,615,961 | ) | | | (37,175,874 | ) | | | 62,108,969 | | | | 9,228,673 | | | | 7,634,868 | | | | — | |
Cara Therapeutics, Inc. | | | 36,412,748 | | | | 9,277,738 | | | | (5,789,751 | ) | | | (3,614,887 | ) | | | (20,249,125 | ) | | | 16,036,723 | | | | 3,266,135 | | | | — | | | | — | |
Cardiovascular Systems, Inc. | | | 65,640,819 | | | | 12,589,768 | | | | (10,332,173 | ) | | | (5,494,751 | ) | | | (1,685,468 | ) | | | 60,718,195 | | | | 3,057,311 | | | | — | | | | — | |
CareTrust REIT, Inc. | | | 133,977,821 | | | | 32,375,443 | | | | (30,360,845 | ) | | | 3,632,025 | | | | 2,381,836 | | | | 142,006,280 | | | | 7,252,619 | | | | 4,542,833 | | | | — | |
Carpenter Technology Corp. | | | 144,959,501 | | | | 29,528,811 | | | | (26,465,769 | ) | | | 3,396,814 | | | | 6,440,882 | | | | 157,860,239 | | | | 3,526,815 | | | | 2,841,067 | | | | — | |
Cars.com, Inc. | | | 67,090,063 | | | | 14,642,775 | | | | (16,593,949 | ) | | | (1,967,302 | ) | | | 23,703,561 | | | | 86,875,148 | | | | 4,501,303 | | | | — | | | | — | |
Catalyst Pharmaceuticals, Inc. | | | — | | | | 121,608,719 | | | | (13,113,755 | ) | | | (114,886 | ) | | | 7,308,397 | | | | 115,688,475 | | | | 6,977,592 | | | | — | | | | — | |
Cato Corp., Class A(b) | | | 19,984,703 | | | | 2,789,239 | | | | (14,592,353 | ) | | | (11,952,833 | ) | | | 3,771,244 | | | | — | | | | — | | | | 450,518 | | | | — | |
Cavco Industries, Inc. | | | 146,793,258 | | | | 32,518,145 | | | | (37,894,751 | ) | | | 7,145,157 | | | | 38,695,400 | | | | 187,257,209 | | | | 589,341 | | | | — | | | | — | |
Centerspace | | | 105,322,106 | | | | 23,129,705 | | | | (22,351,283 | ) | | | (2,841,661 | ) | | | (43,275,837 | ) | | | 59,983,030 | | | | 1,097,987 | | | | 1,868,148 | | | | — | |
Central Garden & Pet Co. | | | 30,929,728 | | | | 6,637,986 | | | | (6,298,255 | ) | | | 716,729 | | | | (2,994,256 | ) | | | 28,991,932 | | | | 706,087 | | | | — | | | | — | |
Central Pacific Financial Corp. | | | 44,570,724 | | | | — | | | | — | | | | — | | | | (15,975,170 | ) | | | 28,595,554 | | | | 1,597,517 | | | | 1,661,418 | | | | — | |
Century Communities, Inc. | | | 113,868,713 | | | | 25,418,290 | | | | (28,344,920 | ) | | | 1,278,517 | | | | 19,510,466 | | | | 131,731,066 | | | | 2,060,874 | | | | 1,770,687 | | | | — | |
Cerence, Inc. | | | 101,172,885 | | | | 17,320,760 | | | | (14,095,234 | ) | | | (1,793,628 | ) | | | (20,501,112 | ) | | | 82,103,671 | | | | 2,922,879 | | | | — | | | | — | |
CEVA, Inc. | | | 67,094,410 | | | | 13,618,939 | | | | (11,446,635 | ) | | | (1,759,948 | ) | | | (16,092,360 | ) | | | 51,414,406 | | | | 1,689,596 | | | | — | | | | — | |
Chatham Lodging Trust | | | 48,136,215 | | | | 10,249,999 | | | | (10,699,705 | ) | | | (2,614,330 | ) | | | (7,973,255 | ) | | | 37,098,924 | | | | 3,536,599 | | | | 502,609 | | | | — | |
Cheesecake Factory, Inc. | | | 138,105,122 | | | | 27,990,648 | | | | (27,822,161 | ) | | | (3,089,212 | ) | | | (13,031,922 | ) | | | 122,152,475 | | | | 3,485,092 | | | | 3,886,467 | | | | — | |
Chefs’ Warehouse, Inc. | | | 76,019,288 | | | | 23,356,212 | | | | (17,308,764 | ) | | | 3,670,008 | | | | (1,463,607 | ) | | | 84,273,137 | | | | 2,474,982 | | | | — | | | | — | |
Chesapeake Utilities Corp. | | | 159,802,289 | | | | — | | | | — | | | | — | | | | (11,333,250 | ) | | | 148,469,039 | | | | 1,160,005 | | | | 2,482,411 | | | | — | |
Chico’s FAS, Inc. | | | 42,101,966 | | | | 10,641,552 | | | | (8,590,421 | ) | | | 1,280,044 | | | | 4,560,176 | | | | 49,993,317 | | | | 9,089,694 | | | | — | | | | — | |
Children’s Place, Inc. | | | 48,144,408 | | | | 10,408,160 | | | | (13,423,256 | ) | | | (10,359,055 | ) | | | 1,091,930 | | | | 35,862,187 | | | | 890,986 | | | | — | | | | — | |
Chuy’s Holdings, Inc. | | | 38,410,416 | | | | 8,301,583 | | | | (11,287,162 | ) | | | (860,937 | ) | | | 12,445,524 | | | | 47,009,424 | | | | 1,311,281 | | | | — | | | | — | |
Cinemark Holdings, Inc. | | | 131,621,622 | | | | 26,167,179 | | | | (21,642,612 | ) | | | (3,595,105 | ) | | | (17,346,760 | ) | | | 115,204,324 | | | | 7,789,339 | | | | — | | | | — | |
CIRCOR International, Inc. | | | 38,868,368 | | | | 7,254,637 | | | | (7,478,710 | ) | | | (3,281,510 | ) | | | 10,810,861 | | | | 46,173,646 | | | | 1,483,729 | | | | — | | | | — | |
City Holding Co. | | | 77,952,035 | | | | 2,923,573 | | | | — | | | | — | | | | 12,040,013 | | | | 92,915,621 | | | | 1,022,399 | | | | 2,476,903 | | | | — | |
Civitas Resources, Inc.(c) | | | 308,128,260 | | | | 59,164,817 | | | | (145,572,223 | ) | | | 25,443,471 | | | | (70,286,984 | ) | | | N/A | | | | N/A | | | | 32,346,766 | | | | — | |
Clearfield, Inc. | | | — | | | | 107,326,557 | | | | (7,097,010 | ) | | | (200,130 | ) | | | (57,153,971 | ) | | | 42,875,446 | | | | 920,469 | | | | — | | | | — | |
Clearwater Paper Corp. | | | 33,601,467 | | | | 10,985,514 | | | | (9,729,228 | ) | | | 147,864 | | | | 5,812,034 | | | | 40,817,651 | | | | 1,221,354 | | | | — | | | | — | |
Cogent Communications Holdings, Inc. | | | 201,346,904 | | | | 47,527,534 | | | | (59,329,294 | ) | | | 7,701,664 | | | | 1,208,813 | | | | 198,455,621 | | | | 3,114,495 | | | | 5,528,743 | | | | — | |
Coherus Biosciences, Inc. | | | 59,117,394 | | | | 9,614,736 | | | | (8,220,138 | ) | | | (4,439,144 | ) | | | (23,901,701 | ) | | | 32,171,147 | | | | 4,703,384 | | | | — | | | | — | |
Cohu, Inc. | | | 103,114,057 | | | | 24,414,264 | | | | (24,857,247 | ) | | | 3,460,686 | | | | 27,130,602 | | | | 133,262,362 | | | | 3,471,278 | | | | — | | | | — | |
Collegium Pharmaceutical, Inc. | | | 50,377,440 | | | | 11,718,696 | | | | (12,110,084 | ) | | | (1,119,421 | ) | | | 9,818,523 | | | | 58,685,154 | | | | 2,446,234 | | | | — | | | | — | |
Columbia Banking | | | | | | | | | | | | | | | | | | | | | | | | | | | | | | | | | | | | |
System, Inc.(b) | | | 169,115,195 | | | | 10,183,552 | | | | (165,475,980 | ) | | | (37,652,919 | ) | | | 23,830,152 | | | | — | | | | — | | | | 6,562,672 | | | | — | |
Comfort Systems U.S.A., Inc. | | | 229,414,018 | | | | 61,123,173 | | | | (59,595,472 | ) | | | 19,307,551 | | | | 129,722,852 | | | | 379,972,122 | | | | 2,603,262 | | | | 1,610,062 | | | | — | |
| | |
| 32 | | 2 0 2 3 I SHARES ANNUAL REPORT TO SHAREHOLDERS |
| | |
Schedule of Investments (continued) March 31, 2023 | | iShares® Core S&P Small-Cap ETF |
Affiliates (continued)
| | | | | | | | | | | | | | | | | | | | | | | | | | | | | | | | | | | | |
| Affiliated Issuer | | Value at
03/31/22 | | | Purchases
at Cost | | | Proceeds
from Sale | | | Net
Realized
Gain (Loss) | | | Change in
Unrealized
Appreciation
(Depreciation) | | | Value at
03/31/23 | | | Shares
Held at
03/31/23 | | | Income | | | Capital
Gain
Distributions
from Underlying
Funds | |
Community Bank System, Inc. | | $ | 251,364,076 | | | $ | 7,381,735 | | | $ | — | | | $ | — | | | $ | (64,450,402 | ) | | $ | 194,295,409 | | | | 3,701,570 | | | $ | 6,426,012 | | | $ | — | |
Community Health Systems, Inc. | | | 105,476,808 | | | | 10,552,850 | | | | (9,947,332 | ) | | | (4,919,684 | ) | | | (56,546,388 | ) | | | 44,616,254 | | | | 9,105,358 | | | | — | | | | — | |
Community Healthcare Trust, Inc. | | | 70,949,649 | | | | 15,215,811 | | | | (15,189,012 | ) | | | 514,535 | | | | (8,744,785 | ) | | | 62,746,198 | | | | 1,714,377 | | | | 2,845,969 | | | | — | |
Compass Minerals International, Inc. | | | 153,003,847 | | | | 24,701,894 | | | | (22,095,599 | ) | | | (4,560,191 | ) | | | (65,817,767 | ) | | | 85,232,184 | | | | 2,485,628 | | | | 1,513,731 | | | | — | |
Computer Programs & Systems, Inc. | | | 36,313,263 | | | | 7,673,914 | | | | (7,919,233 | ) | | | (708,439 | ) | | | (4,265,857 | ) | | | 31,093,648 | | | | 1,029,591 | | | | — | | | | — | |
Comtech Telecommunications Corp. | | | 29,701,641 | | | | 5,191,502 | | | | (3,925,696 | ) | | | (1,131,720 | ) | | | (4,751,377 | ) | | | 25,084,350 | | | | 2,009,964 | | | | 784,087 | | | | — | |
CONMED Corp. | | | 311,068,602 | | | | 54,123,580 | | | | (41,909,953 | ) | | | 5,319,254 | | | | (98,153,384 | ) | | | 230,448,099 | | | | 2,218,834 | | | | 1,764,178 | | | | — | |
Conn’s, Inc.(b) | | | 21,217,289 | | | | 2,068,769 | | | | (11,358,214 | ) | | | (19,041,743 | ) | | | 7,113,899 | | | | — | | | | — | | | | — | | | | — | |
Consensus Cloud Solutions, Inc. | | | 68,526,794 | | | | 20,266,303 | | | | (11,443,027 | ) | | | (2,383,468 | ) | | | (31,217,405 | ) | | | 43,749,197 | | | | 1,283,344 | | | | — | | | | — | |
CONSOL Energy, Inc. | | | 85,687,461 | | | | 32,392,344 | | | | (25,127,720 | ) | | | 11,565,676 | | | | 34,190,827 | | | | 138,708,588 | | | | 2,380,446 | | | | 7,645,868 | | | | — | |
Corcept Therapeutics, Inc. | | | 153,670,670 | | | | 37,665,270 | | | | (30,907,627 | ) | | | 4,044,409 | | | | (13,590,397 | ) | | | 150,882,325 | | | | 6,965,943 | | | | — | | | | — | |
Core Laboratories NV | | | 104,744,833 | | | | 17,336,189 | | | | (15,432,350 | ) | | | (2,358,129 | ) | | | (29,574,272 | ) | | | 74,716,271 | | | | 3,388,493 | | | | 136,466 | | | | — | |
CoreCivic, Inc. | | | 96,164,194 | | | | 22,626,812 | | | | (24,345,043 | ) | | | 171,471 | | | | (17,750,450 | ) | | | 76,866,984 | | | | 8,355,107 | | | | — | | | | — | |
Covetrus, Inc.(b) | | | 124,128,789 | | | | 22,527,877 | | | | (177,176,728 | ) | | | 43,957,134 | | | | (13,437,072 | ) | | | — | | | | — | | | | — | | | | — | |
Cracker Barrel Old Country Store, Inc. | | | — | | | | 181,739,606 | | | | (2,862,059 | ) | | | 23,171 | | | | 4,647,800 | | | | 183,548,518 | | | | 1,615,744 | | | | — | | | | — | |
Cross Country Healthcare, Inc. | | | 54,819,683 | | | | 17,909,447 | | | | (14,692,065 | ) | | | 2,597,050 | | | | (3,012,647 | ) | | | 57,621,468 | | | | 2,581,607 | | | | — | | | | — | |
CSG Systems International, Inc. | | | 147,766,049 | | | | 34,220,822 | | | | (40,004,801 | ) | | | 2,670,843 | | | | (27,246,294 | ) | | | 117,406,619 | | | | 2,186,343 | | | | 2,496,713 | | | | — | |
CTS Corp. | | | 81,370,986 | | | | 21,564,260 | | | | (21,250,590 | ) | | | 5,433,912 | | | | 27,485,495 | | | | 114,604,063 | | | | 2,317,106 | | | | 371,367 | | | | — | |
Customers Bancorp, Inc. | | | 111,384,075 | | | | 3,407,654 | | | | (2,789,620 | ) | | | (2,654,213 | ) | | | (69,573,659 | ) | | | 39,774,237 | | | | 2,147,637 | | | | — | | | | — | |
Cutera, Inc. | | | 80,707,782 | | | | 17,424,903 | | | | (10,716,638 | ) | | | 2,393,038 | | | | (59,088,724 | ) | | | 30,720,361 | | | | 1,300,608 | | | | — | | | | — | |
CVB Financial Corp. | | | 214,747,136 | | | | 18,492,300 | | | | (9,171,606 | ) | | | (444,909 | ) | | | (63,834,727 | ) | | | 159,788,194 | | | | 9,579,628 | | | | 7,253,683 | | | | — | |
Cytokinetics, Inc. | | | 220,819,914 | | | | 93,335,286 | | | | (47,152,807 | ) | | | 16,525,396 | | | | (41,163,948 | ) | | | 242,363,841 | | | | 6,887,293 | | | | — | | | | — | |
Dave & Buster’s Entertainment, Inc. | | | 136,001,746 | | | | 35,619,218 | | | | (23,900,938 | ) | | | 5,466,103 | | | | (40,844,075 | ) | | | 112,342,054 | | | | 3,053,603 | | | | — | | | | — | |
Deluxe Corp. | | | 92,194,563 | | | | 16,622,439 | | | | (13,297,060 | ) | | | (6,335,823 | ) | | | (38,894,791 | ) | | | 50,289,328 | | | | 3,143,083 | | | | 3,807,168 | | | | — | |
Designer Brands, Inc., Class A | | | 59,732,195 | | | | 14,253,783 | | | | (22,819,298 | ) | | | (7,945,571 | ) | | | (11,181,965 | ) | | | 32,039,144 | | | | 3,665,806 | | | | 1,033,628 | | | | — | |
DiamondRock Hospitality Co. | | | 152,168,570 | | | | 28,690,405 | | | | (26,678,626 | ) | | | (1,257,554 | ) | | | (29,032,058 | ) | | | 123,890,737 | | | | 15,238,713 | | | | 1,851,060 | | | | — | |
Diebold Nixdorf,
Inc.(b) | | | 35,237,668 | | | | 3,054,439 | | | | (11,406,395 | ) | | | (46,947,307 | ) | | | 20,061,595 | | | | — | | | | — | | | | — | | | | — | |
Digi International, Inc. | | | 53,901,058 | | | | 18,923,432 | | | | (15,649,237 | ) | | | 5,232,216 | | | | 25,313,607 | | | | 87,721,076 | | | | 2,604,545 | | | | — | | | | — | |
Digital Turbine, Inc. | | | — | | | | 127,192,250 | | | | (16,615,225 | ) | | | 706,781 | | | | (30,213,540 | ) | | | 81,070,266 | | | | 6,559,083 | | | | — | | | | — | |
Dime Community Bancshares, Inc. | | | 80,909,910 | | | | 17,848,268 | | | | (16,206,117 | ) | | | 165,300 | | | | (29,446,618 | ) | | | 53,270,743 | | | | 2,344,663 | | | | 2,261,868 | | | | — | |
Dine Brands Global, Inc. | | | 96,314,786 | | | | 20,889,710 | | | | (26,968,442 | ) | | | (2,073,189 | ) | | | (11,106,227 | ) | | | 77,056,638 | | | | 1,139,217 | | | | 2,411,060 | | | | — | |
Diodes, Inc. | | | 280,383,123 | | | | 56,274,742 | | | | (48,945,007 | ) | | | 13,621,000 | | | | 5,812,868 | | | | 307,146,726 | | | | 3,311,198 | | | | — | | | | — | |
Diversified Healthcare Trust(b) | | | 54,951,898 | | | | 5,350,724 | | | | (17,433,181 | ) | | | (65,405,814 | ) | | | 22,536,373 | | | | — | | | | — | | | | 344,671 | | | | — | |
DMC Global, Inc. | | | 42,079,172 | | | | 7,424,049 | | | | (7,748,067 | ) | | | (9,083,218 | ) | | | (2,970,737 | ) | | | 29,701,199 | | | | 1,351,898 | | | | — | | | | — | |
Donnelley Financial Solutions, Inc. | | | 69,434,773 | | | | 18,450,072 | | | | (26,867,484 | ) | | | 3,315,927 | | | | 10,186,036 | | | | 74,519,324 | | | | 1,823,772 | | | | — | | | | — | |
Dorian LPG Ltd.(i) | | | N/A | | | | 9,133,531 | | | | (5,471,022 | ) | | | 870,142 | | | | 12,162,250 | | | | 46,315,296 | | | | 2,322,733 | | | | 4,745,964 | | | | — | |
Dorman Products, Inc. | | | 193,436,796 | | | | 44,453,726 | | | | (38,849,049 | ) | | | 2,544,167 | | | | (23,800,416 | ) | | | 177,785,224 | | | | 2,061,039 | | | | — | | | | — | |
Douglas Elliman, Inc. | | | 34,298,451 | | | | 6,903,546 | | | | (4,650,205 | ) | | | (1,754,488 | ) | | | (19,108,607 | ) | | | 15,688,697 | | | | 5,044,597 | | | | 994,743 | | | | — | |
Dril-Quip, Inc. | | | 94,584,206 | | | | 16,254,384 | | | | (17,577,508 | ) | | | (2,747,493 | ) | | | (19,801,088 | ) | | | 70,712,501 | | | | 2,464,709 | | | | — | | | | — | |
DXP Enterprises, Inc. | | | 33,255,223 | | | | 8,528,233 | | | | (10,214,163 | ) | | | (2,284,923 | ) | | | 1,423,732 | | | | 30,708,102 | | | | 1,140,717 | | | | — | | | | — | |
| | |
SCHEDULES OF INVESTMENTS | | 33 |
| | |
Schedule of Investments (continued) March 31, 2023 | | iShares® Core S&P Small-Cap ETF |
Affiliates (continued)
| | | | | | | | | | | | | | | | | | | | | | | | | | | | | | | | | | | | |
| Affiliated Issuer | | Value at
03/31/22 | | | Purchases
at Cost | | | Proceeds
from Sale | | | Net
Realized
Gain (Loss) | | | Change in
Unrealized
Appreciation
(Depreciation) | | | Value at
03/31/23 | | | Shares
Held at
03/31/23 | | | Income | | | Capital
Gain
Distributions
from Underlying
Funds | |
Dycom Industries, Inc. | | $ | — | | | $ | 208,426,936 | | | $ | (2,896,680 | ) | | $ | (1,135 | ) | | $ | (3,766,283 | ) | | $ | 201,762,838 | | | | 2,154,435 | | | $ | — | | | $ | — | |
Dynavax Technologies Corp. | | | — | | | | 105,129,901 | | | | (25,124,329 | ) | | | 6,619,436 | | | | (2,046,268 | ) | | | 84,578,740 | | | | 8,621,686 | | | | — | | | | — | |
Eagle Bancorp, Inc. | | | 124,915,124 | | | | 4,226,482 | | | | (2,621,675 | ) | | | (772,938 | ) | | | (51,165,256 | ) | | | 74,581,737 | | | | 2,228,316 | | | | 3,922,326 | | | | — | |
Eagle Pharmaceuticals, Inc. | | | 40,256,354 | | | | 7,631,017 | | | | (8,707,393 | ) | | | (3,890,995 | ) | | | (13,699,385 | ) | | | 21,589,598 | | | | 761,001 | | | | — | | | | — | |
Easterly Government Properties, Inc. | | | 125,341,047 | | | | 22,507,895 | | | | (23,272,478 | ) | | | (1,116,758 | ) | | | (37,114,619 | ) | | | 86,345,087 | | | | 6,284,213 | | | | 3,883,735 | | | | — | |
Ebix, Inc. | | | 56,751,142 | | | | 9,324,876 | | | | (9,088,725 | ) | | | (5,477,929 | ) | | | (28,900,227 | ) | | | 22,609,137 | | | | 1,714,112 | | | | 389,237 | | | | — | |
Edgewell Personal Care Co. | | | 141,845,574 | | | | 34,874,409 | | | | (38,441,996 | ) | | | (2,280,860 | ) | | | 22,592,376 | | | | 158,589,503 | | | | 3,738,555 | | | | 2,329,466 | | | | — | |
eHealth, Inc.(b) | | | 21,176,573 | | | | 1,910,217 | | | | (11,057,983 | ) | | | (79,595,216 | ) | | | 67,566,409 | | | | — | | | | — | | | | — | | | | — | |
elf Beauty, Inc. | | | 88,757,898 | | | | 39,561,801 | | | | (30,413,617 | ) | | | 6,284,962 | | | | 199,316,222 | | | | 303,507,266 | | | | 3,685,577 | | | | — | | | | — | |
Ellington Financial, Inc. | | | 69,516,047 | | | | 20,451,884 | | | | (13,439,598 | ) | | | (990,184 | ) | | | (19,292,540 | ) | | | 56,245,609 | | | | 4,606,520 | | | | 5,213,069 | | | | — | |
Elme Communities(j) | | | 154,813,024 | | | | 33,728,265 | | | | (34,107,815 | ) | | | (3,327,770 | ) | | | (37,266,957 | ) | | | 113,838,747 | | | | 6,373,950 | | | | 2,888,304 | | | | — | |
Embecta Corp. | | | — | | | | 152,676,182 | | | | (42,245,220 | ) | | | 16,010,035 | | | | (9,201,237 | ) | | | 117,239,760 | | | | 4,169,266 | | | | 1,298,433 | | | | — | |
Emergent BioSolutions, Inc. | | | 140,635,920 | | | | 19,460,106 | | | | (22,142,283 | ) | | | (13,455,412 | ) | | | (90,955,883 | ) | | | 33,542,448 | | | | 3,237,688 | | | | — | | | | — | |
Employers Holdings, Inc. | | | 70,663,431 | | | | 446,514 | | | | — | | | | — | | | | 1,149,539 | | | | 72,259,484 | | | | 1,733,257 | | | | 5,670,300 | | | | — | |
Enanta Pharmaceuticals, Inc. | | | 92,972,184 | | | | 20,704,764 | | | | (13,530,090 | ) | | | (1,473,692 | ) | | | (40,981,664 | ) | | | 57,691,502 | | | | 1,426,595 | | | | — | | | | — | |
Encore Capital Group, Inc. | | | 111,610,910 | | | | 27,314,026 | | | | (28,822,289 | ) | | | (49,960 | ) | | | (24,322,598 | ) | | | 85,730,089 | | | | 1,699,308 | | | | — | | | | — | |
Encore Wire Corp. | | | 165,403,097 | | | | 41,876,681 | | | | (57,003,606 | ) | | | 13,106,501 | | | | 84,419,475 | | | | 247,802,148 | | | | 1,337,086 | | | | 82,515 | | | | — | |
Endo International PLC(b) | | | 38,829,938 | | | | 757,788 | | | | (6,841,898 | ) | | | (106,485,147 | ) | | | 73,739,319 | | | | — | | | | — | | | | — | | | | — | |
Enerpac Tool Group Corp. | | | 94,213,093 | | | | 23,451,047 | | | | (26,145,994 | ) | | | (908,365 | ) | | | 15,264,358 | | | | 105,874,139 | | | | 4,151,927 | | | | 170,039 | | | | — | |
Enhabit, Inc. | | | — | | | | 91,130,457 | | | | (9,437,408 | ) | | | (2,133,165 | ) | | | (29,411,260 | ) | | | 50,148,624 | | | | 3,605,221 | | | | — | | | | — | |
Enova International, Inc. | | | 92,782,239 | | | | 21,442,532 | | | | (26,428,284 | ) | | | 4,140,213 | | | | 8,872,660 | | | | 100,809,360 | | | | 2,268,948 | | | | — | | | | — | |
EnPro Industries, Inc. | | | 144,434,581 | | | | 33,861,312 | | | | (29,668,964 | ) | | | 4,395,011 | | | | 4,118,957 | | | | 157,140,897 | | | | 1,512,570 | | | | 1,727,643 | | | | — | |
Ensign Group, Inc. | | | 337,254,869 | | | | 84,055,484 | | | | (58,109,264 | ) | | | 26,065,121 | | | | (1,654,411 | ) | | | 387,611,799 | | | | 4,057,063 | | | | 894,575 | | | | — | |
ePlus, Inc. | | | 107,854,675 | | | | 23,543,849 | | | | (21,115,266 | ) | | | 4,252,775 | | | | (18,524,982 | ) | | | 96,011,051 | | | | 1,957,811 | | | | — | | | | — | |
ESCO Technologies, Inc. | | | 130,009,877 | | | | 33,428,795 | | | | (30,932,332 | ) | | | 2,648,933 | | | | 44,372,528 | | | | 179,527,801 | | | | 1,880,857 | | | | 750,020 | | | | — | |
Essential Properties Realty Trust, Inc. | | | 220,199,764 | | | | 79,119,740 | | | | (45,142,321 | ) | | | (664,614 | ) | | | 4,390,845 | | | | 257,903,414 | | | | 10,378,407 | | | | 9,597,829 | | | | — | |
Ethan Allen Interiors, Inc. | | | 41,074,589 | | | | 10,422,985 | | | | (8,184,333 | ) | | | 783,857 | | | | 1,548,671 | | | | 45,645,769 | | | | 1,662,264 | | | | 2,944,550 | | | | — | |
EVERTEC, Inc. | | | 175,019,955 | | | | 51,884,844 | | | | (33,860,424 | ) | | | 5,365,482 | | | | (38,402,153 | ) | | | 160,007,704 | | | | 4,740,969 | | | | 924,349 | | | | — | |
EW Scripps Co., Class A, NVS(i) | | | N/A | | | | 14,716,323 | | | | (61,448,764 | ) | | | 47,148,440 | | | | (30,883,909 | ) | | | 39,742,495 | | | | 4,223,432 | | | | — | | | | — | |
ExlService Holdings, Inc.(b) | | | 341,620,008 | | | | 45,177,268 | | | | (395,926,948 | ) | | | 182,593,664 | | | | (173,463,992 | ) | | | — | | | | — | | | | — | | | | — | |
Exponent, Inc.(b) | | | 403,165,884 | | | | 75,084,866 | | | | (438,543,442 | ) | | | 135,033,657 | | | | (174,740,965 | ) | | | — | | | | — | | | | 3,716,803 | | | | — | |
Fabrinet | | | 278,453,731 | | | | 59,706,708 | | | | (56,448,124 | ) | | | 14,772,043 | | | | 20,447,366 | | | | 316,931,724 | | | | 2,668,674 | | | | — | | | | — | |
FARO Technologies, Inc. | | | 67,909,750 | | | | 10,982,364 | | | | (8,852,849 | ) | | | (5,742,074 | ) | | | (30,852,275 | ) | | | 33,444,916 | | | | 1,358,997 | | | | — | | | | — | |
FB Financial Corp. | | | 113,334,609 | | | | 24,889,366 | | | | (22,955,572 | ) | | | 414,395 | | | | (36,298,728 | ) | | | 79,384,070 | | | | 2,554,185 | | | | 1,406,987 | | | | — | |
Federal Signal Corp. | | | 147,847,950 | | | | 42,709,350 | | | | (40,030,477 | ) | | | 10,708,564 | | | | 78,372,271 | | | | 239,607,658 | | | | 4,419,990 | | | | 1,612,854 | | | | — | |
Ferro Corp.(b) | | | 129,049,292 | | | | 1,038,682 | | | | (131,634,077 | ) | | | 11,490,943 | | | | (9,944,840 | ) | | | — | | | | — | | | | — | | | | — | |
First BanCorp/Puerto Rico | | | 178,203,187 | | | | 2,104,640 | | | | (12,881,361 | ) | | | 2,831,780 | | | | (23,405,063 | ) | | | 146,853,183 | | | | 12,859,298 | | | | 6,576,488 | | | | — | |
First Bancorp/Southern Pines NC | | | 102,724,794 | | | | 19,233,581 | | | | (3,252,654 | ) | | | (873,412 | ) | | | (16,110,737 | ) | | | 101,721,572 | | | | 2,863,783 | | | | 2,244,755 | | | | — | |
First Commonwealth Financial Corp. | | | 93,056,143 | | | | 15,668,002 | | | | — | | | | — | | | | (20,095,063 | ) | | | 88,629,082 | | | | 7,130,256 | | | | 2,946,368 | | | | — | |
First Financial Bancorp | | | 140,160,135 | | | | 10,828,867 | | | | — | | | | — | | | | (8,158,623 | ) | | | 142,830,379 | | | | 6,560,881 | | | | 5,926,827 | | | | — | |
First Hawaiian, Inc. | | | 254,293,155 | | | | 55,904,432 | | | | (49,549,348 | ) | | | 1,832,828 | | | | (71,225,433 | ) | | | 191,255,634 | | | | 9,270,753 | | | | 9,808,037 | | | | — | |
Flagstar Bancorp, Inc.(b) | | | 152,382,971 | | | | 5,672,270 | | | | (140,533,253 | ) | | | 12,825,099 | | | | (30,347,087 | ) | | | — | | | | — | | | | 10,017,050 | | | | — | |
FormFactor, Inc. | | | 235,326,769 | | | | 40,940,451 | | | | (38,314,853 | ) | | | 3,669,006 | | | | (62,811,938 | ) | | | 178,809,435 | | | | 5,614,111 | | | | — | | | | — | |
Forward Air Corp. | | | 188,702,200 | | | | 44,541,227 | | | | (42,631,291 | ) | | | 8,799,063 | | | | 9,444,923 | | | | 208,856,122 | | | | 1,938,160 | | | | 1,892,643 | | | | — | |
| | |
| 34 | | 2 0 2 3 I SHARES ANNUAL REPORT TO SHAREHOLDERS |
| | |
Schedule of Investments (continued) March 31, 2023 | | iShares® Core S&P Small-Cap ETF |
Affiliates (continued)
| | | | | | | | | | | | | | | | | | | | | | | | | | | | | | | | | | | | |
| Affiliated Issuer | | Value at
03/31/22 | | | Purchases
at Cost | | | Proceeds
from Sale | | | Net
Realized
Gain (Loss) | | | Change in
Unrealized
Appreciation
(Depreciation) | | | Value at
03/31/23 | | | Shares
Held at
03/31/23 | | | Income | | | Capital
Gain
Distributions
from Underlying
Funds | |
Fossil Group, Inc.(b) | | $ | 32,867,927 | | | $ | 2,886,111 | | | $ | (16,614,395 | ) | | $ | (34,896,506 | ) | | $ | 15,756,863 | | | $ | — | | | | — | | | $ | — | | | $ | — | |
Four Corners Property Trust, Inc. | | | 149,620,540 | | | | 44,382,916 | | | | (32,210,609 | ) | | | 3,987,541 | | | | (1,941,748 | ) | | | 163,838,640 | | | | 6,099,726 | | | | 7,791,988 | | | | — | |
Franklin BSP Realty Trust, Inc. | | | 44,145,890 | | | | 57,254,090 | | | | (15,888,429 | ) | | | (2,300,851 | ) | | | (11,548,622 | ) | | | 71,662,078 | | | | 6,006,880 | | | | 8,563,780 | | | | — | |
Franklin Electric Co., Inc. | | | 231,867,527 | | | | 53,222,416 | | | | (48,440,567 | ) | | | 10,661,351 | | | | 19,202,681 | | | | 266,513,408 | | | | 2,832,236 | | | | 2,316,077 | | | | — | |
Franklin Street Properties Corp.(b) | | | 40,000,513 | | | | 5,091,167 | | | | (19,177,186 | ) | | | (45,625,243 | ) | | | 19,710,749 | | | | — | | | | — | | | | 682,012 | | | | — | |
Frontdoor, Inc. | | | — | | | | 168,532,858 | | | | (22,470,095 | ) | | | (716,554 | ) | | | 19,856,062 | | | | 165,202,271 | | | | 5,925,476 | | | | — | | | | — | |
Gannett Co., Inc. | | | 45,945,323 | | | | 6,026,718 | | | | (7,812,889 | ) | | | (5,913,630 | ) | | | (18,220,846 | ) | | | 20,024,676 | | | | 10,708,383 | | | | — | | | | — | |
GCP Applied Technologies, Inc.(b) | | | 120,964,078 | | | | 17,487,257 | | | | (140,670,193 | ) | | | 36,471,313 | | | | (34,252,455 | ) | | | — | | | | — | | | | — | | | | — | |
Genesco, Inc. | | | 62,518,516 | | | | 12,409,991 | | | | (16,255,350 | ) | | | (1,028,304 | ) | | | (25,452,043 | ) | | | 32,192,810 | | | | 872,907 | | | | — | | | | — | |
Gentherm, Inc. | | | 173,591,392 | | | | 34,666,127 | | | | (31,200,844 | ) | | | 2,995,033 | | | | (34,217,525 | ) | | | 145,834,183 | | | | 2,413,674 | | | | — | | | | — | |
Genworth Financial, Inc., Class A | | | 114,343,065 | | | | 2,980,583 | | | | — | | | | — | | | | 38,476,465 | | | | 155,800,113 | | | | 31,035,879 | | | | — | | | | — | |
GEO Group, Inc. | | | 53,377,997 | | | | 9,825,006 | | | | (2,946,703 | ) | | | 61,811 | | | | 11,055,579 | | | | 71,373,690 | | | | 9,046,095 | | | | — | | | | — | |
Getty Realty Corp. | | | 80,332,906 | | | | 9,556,019 | | | | (5,991,199 | ) | | | 584,685 | | | | 22,264,066 | | | | 106,746,477 | | | | 2,962,711 | | | | 4,432,345 | | | | — | |
Gibraltar Industries, Inc. | | | 100,423,328 | | | | 25,566,318 | | | | (27,846,271 | ) | | | (7,362,607 | ) | | | 18,683,344 | | | | 109,464,112 | | | | 2,256,992 | | | | — | | | | — | |
G-III Apparel Group Ltd. | | | 84,612,968 | | | | 16,004,532 | | | | (15,107,924 | ) | | | (7,200,899 | ) | | | (29,882,323 | ) | | | 48,426,354 | | | | 3,114,235 | | | | — | | | | — | |
Glatfelter
Corp.(b) | | | 39,207,113 | | | | 3,243,120 | | | | (16,125,248 | ) | | | (46,153,571 | ) | | | 19,828,586 | | | | — | | | | — | | | | 436,862 | | | | — | |
Glaukos Corp. | | | 193,909,720 | | | | 38,819,395 | | | | (31,093,647 | ) | | | (4,149,628 | ) | | | (23,290,745 | ) | | | 174,195,095 | | | | 3,476,948 | | | | — | | | | — | |
Global Net Lease, Inc. | | | 116,604,068 | | | | 30,325,060 | | | | (53,312,287 | ) | | | (1,805,677 | ) | | | 5,189,694 | | | | 97,000,858 | | | | 7,542,835 | | | | 7,724,170 | | | | — | |
GMS, Inc. | | | 153,272,040 | | | | 36,335,112 | | | | (37,767,786 | ) | | | 7,712,065 | | | | 16,068,536 | | | | 175,619,967 | | | | 3,033,684 | | | | — | | | | — | |
Golden Entertainment, Inc. | | | 84,531,744 | | | | 20,129,633 | | | | (14,314,319 | ) | | | (2,086,265 | ) | | | (18,675,032 | ) | | | 69,585,761 | | | | 1,599,305 | | | | — | | | | — | |
Granite Construction, Inc. | | | 107,549,527 | | | | 26,544,824 | | | | (29,190,474 | ) | | | (1,023,173 | ) | | | 27,043,474 | | | | 130,924,178 | | | | 3,187,054 | | | | 1,665,712 | | | | — | |
Granite Point Mortgage Trust, Inc.(b) | | | 43,005,744 | | | | 7,762,222 | | | | (28,851,319 | ) | | | (45,002,051 | ) | | | 23,085,404 | | | | — | | | | — | | | | 947,147 | | | | — | |
Green Dot Corp., Class A | | | 99,087,274 | | | | — | | | | (3,246,864 | ) | | | (6,427,421 | ) | | | (30,358,646 | ) | | | 59,054,343 | | | | 3,437,389 | | | | — | | | | — | |
Green Plains, Inc. | | | 85,196,657 | | | | 31,531,616 | | | | — | | | | — | | | | (3,441,291 | ) | | | 113,286,982 | | | | 3,655,598 | | | | — | | | | — | |
Greenbrier Cos., Inc. | | | 120,280,486 | | | | 19,229,383 | | | | (17,444,525 | ) | | | (2,385,427 | ) | | | (43,048,822 | ) | | | 76,631,095 | | | | 2,382,067 | | | | 2,586,489 | | | | — | |
Greenhill & Co., Inc.(b) | | | 14,881,274 | | | | 305,652 | | | | (9,420,284 | ) | | | (8,620,414 | ) | | | 2,853,772 | | | | — | | | | — | | | | 92,690 | | | | — | |
Griffon Corp. | | | 67,803,473 | | | | 26,355,810 | | | | (23,599,285 | ) | | | 3,716,888 | | | | 36,151,404 | | | | 110,428,290 | | | | 3,449,806 | | | | 8,089,530 | | | | — | |
Group 1 Automotive, Inc. | | | 206,661,331 | | | | 46,707,732 | | | | (75,475,246 | ) | | | 12,109,504 | | | | 50,276,527 | | | | 240,279,848 | | | | 1,061,213 | | | | 1,867,082 | | | | — | |
Hain Celestial Group, Inc. | | | — | | | | 122,355,739 | | | | (11,569,621 | ) | | | (949,859 | ) | | | 1,626,119 | | | | 111,462,378 | | | | 6,499,264 | | | | — | | | | — | |
Hanesbrands, Inc. | | | — | | | | 131,690,219 | | | | (1,952,200 | ) | | | 823 | | | | 4,213,039 | | | | 133,951,881 | | | | 25,466,137 | | | | — | | | | — | |
Hanger, Inc.(b) | | | 48,111,118 | | | | 8,795,805 | | | | (58,401,501 | ) | | | (6,919,847 | ) | | | 8,414,425 | | | | — | | | | — | | | | — | | | | — | |
Hanmi Financial Corp. | | | 48,873,245 | | | | 2,216,853 | | | | — | | | | — | | | | (12,370,775 | ) | | | 38,719,323 | | | | 2,085,047 | | | | 1,985,605 | | | | — | |
Harmonic, Inc. | | | 68,730,495 | | | | 22,052,312 | | | | (14,589,719 | ) | | | 5,298,593 | | | | 35,015,859 | | | | 116,507,540 | | | | 7,985,438 | | | | — | | | | — | |
Harsco Corp. | | | 69,390,518 | | | | 9,230,774 | | | | (8,553,211 | ) | | | (8,193,874 | ) | | | (22,322,531 | ) | | | 39,551,676 | | | | 5,790,875 | | | | — | | | | — | |
Haverty Furniture Cos., Inc. | | | 29,103,177 | | | | 5,132,232 | | | | (7,892,455 | ) | | | (133,733 | ) | | | 4,338,828 | | | | 30,548,049 | | | | 957,319 | | | | 2,150,974 | | | | — | |
Hawaiian Holdings, Inc. | | | 72,214,172 | | | | 13,310,273 | | | | (11,239,602 | ) | | | (9,723,097 | ) | | | (30,483,899 | ) | | | 34,077,847 | | | | 3,720,289 | | | | — | | | | — | |
Hawkins, Inc. | | | 61,618,363 | | | | 12,958,801 | | | | (11,432,387 | ) | | | 2,881,229 | | | | (5,585,264 | ) | | | 60,440,742 | | | | 1,380,556 | | | | 795,251 | | | | — | |
Haynes International, Inc. | | | 37,978,922 | | | | 6,948,567 | | | | (5,895,368 | ) | | | 941,592 | | | | 6,075,527 | | | | 46,049,240 | | | | 919,330 | | | | 802,938 | | | | — | |
HB Fuller Co. | | | 249,889,293 | | | | 61,539,518 | | | | (52,076,013 | ) | | | 5,989,340 | | | | 2,268,476 | | | | 267,610,614 | | | | 3,909,578 | | | | 2,940,298 | | | | — | |
HCI Group, Inc. | | | 39,375,177 | | | | 7,378,769 | | | | (11,252,775 | ) | | | (5,128,187 | ) | | | (4,021,830 | ) | | | 26,351,154 | | | | 491,626 | | | | 890,214 | | | | — | |
Healthcare Services Group, Inc. | | | 99,054,646 | | | | 19,863,501 | | | | (18,886,860 | ) | | | (6,348,564 | ) | | | (19,016,962 | ) | | | 74,665,761 | | | | 5,383,256 | | | | 3,470,319 | | | | — | |
HealthStream, Inc. | | | 35,773,989 | | | | 10,002,386 | | | | (10,507,239 | ) | | | (873,014 | ) | | | 13,296,057 | | | | 47,692,179 | | | | 1,759,859 | | | | — | | | | — | |
Heidrick & Struggles International, Inc. | | | 55,504,301 | | | | 10,959,322 | | | | (9,232,780 | ) | | | (224,516 | ) | | | (13,070,337 | ) | | | 43,935,990 | | | | 1,447,167 | | | | 875,092 | | | | — | |
Helix Energy Solutions Group, Inc. | | | 48,527,827 | | | | 12,674,268 | | | | (12,218,580 | ) | | | 625,191 | | | | 30,877,518 | | | | 80,486,224 | | | | 10,398,737 | | | | — | | | | — | |
Helmerich & Payne, Inc. | | | 323,158,452 | | | | 73,284,835 | | | | (66,450,841 | ) | | | 13,915,911 | | | | (71,982,524 | ) | | | 271,925,833 | | | | 7,606,317 | | | | 11,467,826 | | | | — | |
Heritage Financial Corp. | | | 56,793,829 | | | | 6,552,595 | | | | — | | | | — | | | | (9,444,746 | ) | | | 53,901,678 | | | | 2,518,770 | | | | 2,000,816 | | | | — | |
| | |
SCHEDULES OF INVESTMENTS | | 35 |
| | |
Schedule of Investments (continued) March 31, 2023 | | iShares® Core S&P Small-Cap ETF |
Affiliates (continued)
| | | | | | | | | | | | | | | | | | | | | | | | | | | | | | | | | | | | |
| Affiliated Issuer | | Value at
03/31/22 | | | Purchases
at Cost | | | Proceeds
from Sale | | | Net
Realized
Gain (Loss) | | | Change in
Unrealized
Appreciation
(Depreciation) | | | Value at
03/31/23 | | | Shares
Held at
03/31/23 | | | Income | | | Capital
Gain
Distributions
from Underlying
Funds | |
Hersha Hospitality Trust, Class A(b) | | $ | 21,546,077 | | | $ | 4,860,492 | | | $ | (21,849,608 | ) | | $ | (20,879,320 | ) | | $ | 16,322,359 | | | $ | — | | | | — | | | $ | 1,478,352 | | | $ | — | |
Heska Corp. | | | 105,969,219 | | | | 15,926,768 | | | | (18,255,476 | ) | | | (13,336,860 | ) | | | (18,116,687 | ) | | | 72,186,964 | | | | 739,469 | | | | — | | | | — | |
Hibbett, Inc. | | | 40,842,195 | | | | 14,863,143 | | | | (14,009,786 | ) | | | 3,236,329 | | | | 9,767,410 | | | | 54,699,291 | | | | 927,421 | | | | 938,903 | | | | — | |
Hillenbrand, Inc. | | | 230,251,717 | | | | 50,060,400 | | | | (54,656,813 | ) | | | 3,271,901 | | | | 11,134,230 | | | | 240,061,435 | | | | 5,050,735 | | | | 4,569,774 | | | | — | |
Hilltop Holdings, Inc. | | | 115,984,411 | | | | — | | | | (18,052,430 | ) | | | (2,866,813 | ) | | | 3,567,525 | | | | 98,632,693 | | | | 3,324,324 | | | | 2,141,627 | | | | — | |
HNI Corp. | | | 115,782,139 | | | | 24,101,628 | | | | (26,453,181 | ) | | | (4,854,343 | ) | | | (24,665,175 | ) | | | 83,911,068 | | | | 3,014,047 | | | | 3,971,896 | | | | — | |
HomeStreet, Inc. | | | 61,438,925 | | | | 1,520,308 | | | | (1,787,123 | ) | | | 581,023 | | | | (38,148,670 | ) | | | 23,604,463 | | | | 1,312,088 | | | | 1,778,794 | | | | — | |
Hope Bancorp, Inc. | | | 125,113,560 | | | | 4,714,717 | | | | — | | | | — | | | | (49,871,863 | ) | | | 79,956,414 | | | | 8,142,201 | | | | 4,470,518 | | | | — | |
Horace Mann Educators Corp. | | | 112,526,716 | | | | 1,652,019 | | | | — | | | | — | | | | (22,704,846 | ) | | | 91,473,889 | | | | 2,732,195 | | | | 3,524,531 | | | | — | |
Hostess Brands, Inc., Class A | | | 217,127,718 | | | | 54,051,465 | | | | (57,983,154 | ) | | | 1,945,616 | | | | 27,337,865 | | | | 242,479,510 | | | | 9,745,961 | | | | — | | | | — | |
Hub Group, Inc., Class A | | | 187,277,719 | | | | 36,712,307 | | | | (39,739,192 | ) | | | 6,652,425 | | | | 8,886,028 | | | | 199,789,287 | | | | 2,380,144 | | | | — | | | | — | |
Hudson Pacific Properties, Inc. | | | — | | | | 135,185,842 | | | | (12,198,801 | ) | | | (4,347,030 | ) | | | (56,439,894 | ) | | | 62,200,117 | | | | 9,353,401 | | | | 3,474,359 | | | | — | |
Ichor Holdings Ltd. | | | 72,429,744 | | | | 14,865,523 | | | | (12,386,641 | ) | | | (1,437,398 | ) | | | (4,617,829 | ) | | | 68,853,399 | | | | 2,103,036 | | | | — | | | | — | |
Independence Realty Trust, Inc.(b) | | | 417,778,942 | | | | 5,945,068 | | | | (359,190,702 | ) | | | 42,448,439 | | | | (106,981,747 | ) | | | — | | | | — | | | | — | | | | — | |
Independent Bank Corp. | | | 258,508,413 | | | | 4,536,977 | | | | (6,894,262 | ) | | | 280,439 | | | | (50,283,122 | ) | | | 206,148,445 | | | | 3,141,549 | | | | 6,700,629 | | | | — | |
Independent Bank Group, Inc. | | | 187,312,547 | | | | 38,876,803 | | | | (39,678,651 | ) | | | 2,162,521 | | | | (69,012,769 | ) | | | 119,660,451 | | | | 2,581,671 | | | | 4,014,978 | | | | — | |
Industrial Logistics Properties Trust(b) | | | 106,399,151 | | | | 10,069,032 | | | | (25,949,740 | ) | | | (88,148,726 | ) | | | (2,369,717 | ) | | | — | | | | — | | | | 1,595,544 | | | | — | |
Innospec, Inc. | | | 163,608,317 | | | | 39,362,163 | | | | (35,246,004 | ) | | | 6,611,990 | | | | 10,711,117 | | | | 185,047,583 | | | | 1,802,353 | | | | 2,307,991 | | | | — | |
Innovative Industrial Properties, Inc. | | | 376,860,731 | | | | 73,740,167 | | | | (40,205,830 | ) | | | (11,547,915 | ) | | | (244,314,117 | ) | | | 154,533,036 | | | | 2,033,597 | | | | 14,489,670 | | | | — | |
Innoviva, Inc. | | | 86,614,896 | | | | 16,213,464 | | | | (14,408,778 | ) | | | (312,901 | ) | | | (36,769,117 | ) | | | 51,337,564 | | | | 4,563,339 | | | | — | | | | — | |
Inogen, Inc. | | | 47,300,748 | | | | 13,215,527 | | | | (6,620,363 | ) | | | (4,293,171 | ) | | | (28,903,363 | ) | | | 20,699,378 | | | | 1,658,604 | | | | — | | | | — | |
Insight Enterprises, Inc. | | | 267,725,516 | | | | 54,650,687 | | | | (81,828,430 | ) | | | 13,463,987 | | | | 61,290,523 | | | | 315,302,283 | | | | 2,205,528 | | | | — | | | | — | |
Installed Building Products, Inc. | | | 141,821,788 | | | | 37,593,588 | | | | (33,962,168 | ) | | | 5,466,501 | | | | 44,023,014 | | | | 194,942,723 | | | | 1,709,574 | | | | 3,813,816 | | | | — | |
Insteel Industries, Inc. | | | 51,401,526 | | | | 11,156,972 | | | | (10,163,994 | ) | | | 612,600 | | | | (13,577,874 | ) | | | 39,429,230 | | | | 1,417,298 | | | | 3,093,528 | | | | — | |
Integer Holdings Corp. | | | 190,269,761 | | | | 38,441,205 | | | | (35,037,769 | ) | | | 4,584,140 | | | | (11,387,942 | ) | | | 186,869,395 | | | | 2,411,218 | | | | — | | | | — | |
InterDigital, Inc. | | | 140,008,526 | | | | 29,808,461 | | | | (45,209,094 | ) | | | (3,170,927 | ) | | | 21,262,305 | | | | 142,699,271 | | | | 1,957,466 | | | | 3,066,943 | | | | — | |
Interface, Inc., Class A | | | 57,147,545 | | | | 12,388,180 | | | | (10,676,758 | ) | | | (4,085,533 | ) | | | (20,593,447 | ) | | | 34,179,987 | | | | 4,209,358 | | | | 171,870 | | | | — | |
Invesco Mortgage Capital, Inc. | | | 51,136,777 | | | | 16,709,929 | | | | (27,431,127 | ) | | | (24,299,932 | ) | | | 12,373,687 | | | | 28,489,334 | | | | 2,568,921 | | | | 7,750,384 | | | | — | |
Investors Bancorp.,
Inc.(b) | | | 241,223,189 | | | | 1,159,138 | | | | (225,120,862 | ) | | | 8,155,739 | | | | (25,417,204 | ) | | | — | | | | — | | | | — | | | | — | |
iRobot Corp. | | | 122,285,983 | | | | 23,549,332 | | | | (21,386,735 | ) | | | (2,866,880 | ) | | | (35,231,668 | ) | | | 86,350,032 | | | | 1,978,690 | | | | — | | | | — | |
Ironwood Pharmaceuticals, Inc., Class A | | | — | | | | 146,439,681 | | | | (38,208,627 | ) | | | 2,590,929 | | | | (8,786,189 | ) | | | 102,035,794 | | | | 9,699,220 | | | | — | | | | — | |
iStar, Inc.(c) | | | 116,402,831 | | | | 31,668,354 | | | | (14,364,100 | ) | | | (1,813,963 | ) | | | (52,211,116 | ) | | | N/A | | | | N/A | | | | 32,661,562 | | | | — | |
iTeos Therapeutics, Inc.(i) | | | N/A | | | | 14,964,262 | | | | (22,567,971 | ) | | | 11,936,489 | | | | (40,142,120 | ) | | | 24,370,080 | | | | 1,790,601 | | | | — | | | | — | |
Itron, Inc. | | | 170,586,111 | | | | 38,128,911 | | | | (33,741,363 | ) | | | (11,142,967 | ) | | | 18,761,001 | | | | 182,591,693 | | | | 3,292,907 | | | | — | | | | — | |
J & J Snack Foods Corp. | | | 165,416,632 | | | | 35,087,691 | | | | (31,148,833 | ) | | | 1,187,336 | | | | (8,896,910 | ) | | | 161,645,916 | | | | 1,090,581 | | | | 2,985,371 | | | | — | |
Jack in the Box, Inc. | | | 141,010,428 | | | | 27,668,619 | | | | (29,032,749 | ) | | | (1,505,589 | ) | | | (6,652,090 | ) | | | 131,488,619 | | | | 1,501,183 | | | | 2,746,443 | | | | — | |
James River Group Holdings Ltd. | | | 62,174,341 | | | | 2,859,759 | | | | (3,941,024 | ) | | | — | | | | (6,677,311 | ) | | | 54,415,765 | | | | 2,635,146 | | | | 266,596 | | | | — | |
JBG SMITH Properties | | | — | | | | 104,973,625 | | | | (1,620,949 | ) | | | 7,302 | | | | 5,285,452 | | | | 108,645,430 | | | | 7,214,172 | | | | — | | | | — | |
John B Sanfilippo & Son, Inc. | | | 53,243,648 | | | | 12,549,205 | | | | (11,686,116 | ) | | | 735,277 | | | | 8,420,384 | | | | 63,262,398 | | | | 652,728 | | | | 2,166,849 | | | | — | |
John Bean Technologies Corp. | | | 269,450,300 | | | | 54,702,888 | | | | (47,936,707 | ) | | | (1,754,290 | ) | | | (21,014,637 | ) | | | 253,447,554 | | | | 2,319,037 | | | | 938,572 | | | | — | |
Joint Corp.(b) | | | 36,767,591 | | | | 3,642,888 | | | | (17,635,834 | ) | | | (60,128,738 | ) | | | 37,354,093 | | | | — | | | | — | | | | — | | | | — | |
Kaiser Aluminum Corp. | | | 106,874,519 | | | | 21,892,614 | | | | (19,084,885 | ) | | | (2,293,647 | ) | | | (20,701,304 | ) | | | 86,687,297 | | | | 1,161,561 | | | | 3,580,419 | | | | — | |
Kaman Corp. | | | 86,916,564 | | | | 13,827,163 | | | | (11,794,914 | ) | | | (5,785,690 | ) | | | (36,228,183 | ) | | | 46,934,940 | | | | 2,053,147 | | | | 1,632,603 | | | | — | |
| | |
| 36 | | 2 0 2 3 I SHARES ANNUAL REPORT TO SHAREHOLDERS |
| | |
Schedule of Investments (continued) March 31, 2023 | | iShares® Core S&P Small-Cap ETF |
Affiliates (continued)
| | | | | | | | | | | | | | | | | | | | | | | | | | | | | | | | | | | | |
| Affiliated Issuer | | Value at
03/31/22 | | | Purchases
at Cost | | | Proceeds
from Sale | | | Net
Realized
Gain (Loss) | | | Change in
Unrealized
Appreciation
(Depreciation) | | | Value at
03/31/23 | | | Shares
Held at
03/31/23 | | | Income | | | Capital
Gain
Distributions
from Underlying
Funds | |
KAR Auction Services, Inc. | | $ | 156,418,231 | | | $ | 29,550,205 | | | $ | (36,679,994 | ) | | $ | (4,681,981 | ) | | $ | (36,035,524 | ) | | $ | 108,570,937 | | | | 7,936,472 | | | $ | — | | | $ | — | |
Kennametal, Inc. | | | — | | | | 147,697,167 | | | | (2,185,181 | ) | | | 49,217 | | | | 16,311,140 | | | | 161,872,343 | | | | 5,869,193 | | | | — | | | | — | |
Kennedy-Wilson Holdings, Inc. | | | — | | | | 141,799,813 | | | | (2,062,085 | ) | | | (4,642 | ) | | | 1,881,609 | | | | 141,614,695 | | | | 8,536,148 | | | | 2,049,868 | | | | — | |
KKR Real Estate Finance Trust, Inc.(i) | | | N/A | | | | 34,235,834 | | | | (62,438,089 | ) | | | 46,393,097 | | | | (35,288,307 | ) | | | 48,168,447 | | | | 4,229,012 | | | | 5,469,231 | | | | — | |
Knowles Corp. | | | 141,406,715 | | | | 27,199,104 | | | | (25,034,348 | ) | | | (69,844 | ) | | | (30,771,550 | ) | | | 112,730,077 | | | | 6,631,181 | | | | — | | | | — | |
Kontoor Brands, Inc. | | | 140,711,238 | | | | 38,109,806 | | | | (31,229,627 | ) | | | (2,235,679 | ) | | | 28,754,966 | | | | 174,110,704 | | | | 3,598,072 | | | | 6,707,335 | | | | — | |
Koppers Holdings, Inc. | | | 42,128,249 | | | | 9,573,447 | | | | (10,057,338 | ) | | | (1,730,404 | ) | | | 13,187,012 | | | | 53,100,966 | | | | 1,518,472 | | | | 327,489 | | | | — | |
Korn Ferry | | | 252,987,602 | | | | 52,510,668 | | | | (50,719,703 | ) | | | 2,643,187 | | | | (58,635,380 | ) | | | 198,786,374 | | | | 3,842,025 | | | | 2,344,354 | | | | — | |
Kulicke & Soffa Industries, Inc. | | | 249,869,703 | | | | 46,054,568 | | | | (60,415,340 | ) | | | 9,295,877 | | | | (27,419,989 | ) | | | 217,384,819 | | | | 4,125,732 | | | | 3,028,827 | | | | — | |
Lakeland Financial Corp. | | | 131,628,490 | | | | 5,881,534 | | | | (2,732,340 | ) | | | (680,473 | ) | | | (18,334,858 | ) | | | 115,762,353 | | | | 1,848,058 | | | | 3,004,808 | | | | — | |
Lantheus Holdings,
Inc.(b) | | | 268,045,866 | | | | 46,794,992 | | | | (370,513,319 | ) | | | 235,299,311 | | | | (179,626,850 | ) | | | — | | | | — | | | | — | | | | — | |
La-Z-Boy, Inc. | | | 82,855,859 | | | | 21,251,889 | | | | (20,737,741 | ) | | | (3,555,464 | ) | | | 11,339,131 | | | | 91,153,674 | | | | 3,134,583 | | | | 2,230,380 | | | | — | |
LCI Industries | | | 187,813,675 | | | | 47,452,581 | | | | (39,726,352 | ) | | | (105,943 | ) | | | 8,221,511 | | | | 203,655,472 | | | | 1,853,604 | | | | 7,882,843 | | | | — | |
LeMaitre Vascular, Inc. | | | 63,919,764 | | | | 16,288,245 | | | | (14,681,086 | ) | | | 1,693,241 | | | | 5,186,391 | | | | 72,406,555 | | | | 1,406,772 | | | | 741,429 | | | | — | |
LendingTree, Inc. | | | 98,208,861 | | | | 8,869,450 | | | | (9,787,670 | ) | | | (14,059,595 | ) | | | (62,263,569 | ) | | | 20,967,477 | | | | 786,477 | | | | — | | | | — | |
Leslie’s, Inc. | | | — | | | | 168,951,077 | | | | (12,648,530 | ) | | | (2,109,981 | ) | | | (35,050,020 | ) | | | 119,142,546 | | | | 10,821,303 | | | | — | | | | — | |
LGI Homes, Inc. | | | 149,225,443 | | | | 33,692,150 | | | | (35,282,785 | ) | | | 1,680,301 | | | | 20,622,090 | | | | 169,937,199 | | | | 1,490,285 | | | | — | | | | — | |
Ligand Pharmaceuticals, Inc. | | | 134,490,007 | | | | 24,319,061 | | | | (71,980,877 | ) | | | (6,885,428 | ) | | | 6,082,494 | | | | 86,025,257 | | | | 1,169,457 | | | | — | | | | — | |
Lindsay Corp. | | | 123,302,622 | | | | 27,590,513 | | | | (24,381,581 | ) | | | 4,658,386 | | | | (10,250,827 | ) | | | 120,919,113 | | | | 800,100 | | | | 1,093,847 | | | | — | |
Liquidity Services, Inc. | | | 32,694,355 | | | | 7,518,862 | | | | (8,863,584 | ) | | | (597,484 | ) | | | (7,884,235 | ) | | | 22,867,914 | | | | 1,736,364 | | | | — | | | | — | |
Livent Corp. | | | 301,581,149 | | | | 107,583,869 | | | | (56,943,807 | ) | | | 8,962,403 | | | | (77,579,167 | ) | | | 283,604,447 | | | | 13,057,295 | | | | — | | | | — | |
LivePerson, Inc. | | | 117,865,230 | | | | 17,880,667 | | | | (11,684,031 | ) | | | (18,741,230 | ) | | | (82,964,992 | ) | | | 22,355,644 | | | | 5,069,307 | | | | — | | | | — | |
LiveRamp Holdings, Inc. | | | — | | | | 149,226,007 | | | | (24,834,059 | ) | | | (155,578 | ) | | | (20,815,236 | ) | | | 103,421,134 | | | | 4,715,966 | | | | — | | | | — | |
LL Flooring Holdings,
Inc.(b) | | | 29,300,033 | | | | 3,663,587 | | | | (15,993,753 | ) | | | (23,292,592 | ) | | | 6,322,725 | | | | — | | | | — | | | | — | | | | — | |
Loyalty Ventures, Inc.(b) | | | 23,666,877 | | | | 540,221 | | | | (5,925,178 | ) | | | (62,381,063 | ) | | | 44,099,143 | | | | — | | | | — | | | | — | | | | — | |
LTC Properties, Inc. | | | 108,384,839 | | | | 31,935,335 | | | | (26,006,040 | ) | | | (714,109 | ) | | | (10,186,368 | ) | | | 103,413,657 | | | | 2,943,742 | | | | 7,178,309 | | | | — | |
LXP Industrial Trust | | | 317,911,153 | | | | 54,326,344 | | | | (59,188,686 | ) | | | (8,596,537 | ) | | | (97,247,245 | ) | | | 207,205,029 | | | | 20,097,481 | | | | 9,383,348 | | | | — | |
M/I Homes, Inc. | | | 92,345,659 | | | | 22,250,550 | | | | (26,004,146 | ) | | | 1,723,037 | | | | 35,480,745 | | | | 125,795,845 | | | | 1,993,911 | | | | — | | | | — | |
ManTech International Corp./VA, Class A(b) | | | 169,913,587 | | | | 22,709,117 | | | | (211,831,058 | ) | | | 67,898,210 | | | | (48,689,856 | ) | | | — | | | | — | | | | 796,350 | | | | — | |
Marcus Corp. | | | 27,951,362 | | | | 8,519,448 | | | | (5,357,452 | ) | | | (2,412,561 | ) | | | (452,845 | ) | | | 28,247,952 | | | | 1,765,497 | | | | 268,552 | | | | — | |
MarineMax, Inc. | | | 63,060,808 | | | | 13,341,053 | | | | (11,821,619 | ) | | | 928,826 | | | | (19,727,740 | ) | | | 45,781,328 | | | | 1,592,394 | | | | — | | | | — | |
Marten Transport Ltd. | | | 76,128,648 | | | | 20,569,407 | | | | (21,393,222 | ) | | | 4,308,413 | | | | 8,303,513 | | | | 87,916,759 | | | | 4,196,504 | | | | 1,037,444 | | | | — | |
Masterbrand, Inc. | | | — | | | | 93,508,443 | | | | (6,331,087 | ) | | | (703,538 | ) | | | (11,345,300 | ) | | | 75,128,518 | | | | 9,344,343 | | | | — | | | | — | |
Matador Resources
Co.(b) | | | 418,406,106 | | | | — | | | | (440,317,505 | ) | | | 319,326,556 | | | | (297,415,157 | ) | | | — | | | | — | | | | — | | | | — | |
Materion Corp. | | | 125,367,742 | | | | 28,894,185 | | | | (27,455,533 | ) | | | 8,259,549 | | | | 38,085,749 | | | | 173,151,692 | | | | 1,492,687 | | | | 754,235 | | | | — | |
Mativ Holdings, Inc.(k) | | | 62,022,758 | | | | 97,866,424 | | | | (17,467,146 | ) | | | (10,311,107 | ) | | | (46,397,708 | ) | | | 85,713,221 | | | | 3,992,232 | | | | 5,918,483 | | | | — | |
Matson, Inc. | | | 363,006,855 | | | | 49,042,386 | | | | (62,823,644 | ) | | | 1,869,700 | | | | (186,780,407 | ) | | | 164,314,890 | | | | 2,753,727 | | | | 3,605,485 | | | | — | |
Matthews International Corp., Class A | | | 73,073,863 | | | | 16,823,271 | | | | (18,148,499 | ) | | | (6,288,982 | ) | | | 14,244,414 | | | | 79,704,067 | | | | 2,210,318 | | | | 2,062,174 | | | | — | |
MaxLinear, Inc. | | | 295,124,147 | | | | 45,018,528 | | | | (35,831,180 | ) | | | (2,291,912 | ) | | | (116,375,069 | ) | | | 185,644,514 | | | | 5,272,494 | | | | — | | | | — | |
MDC Holdings, Inc. | | | 153,007,137 | | | | 34,035,574 | | | | (27,291,638 | ) | | | 1,635,645 | | | | 2,734,899 | | | | 164,121,617 | | | | 4,222,321 | | | | 8,394,918 | | | | — | |
Medifast, Inc. | | | 141,901,102 | | | | 27,031,248 | | | | (29,285,387 | ) | | | (76,275 | ) | | | (57,027,597 | ) | | | 82,543,091 | | | | 796,210 | | | | 5,285,592 | | | | — | |
Meridian Bioscience, Inc.(b) | | | 80,791,829 | | | | 20,202,371 | | | | (125,870,510 | ) | | | 49,625,851 | | | | (24,749,541 | ) | | | — | | | | — | | | | — | | | | — | |
Merit Medical Systems, Inc. | | | 241,720,177 | | | | 75,891,868 | | | | (46,731,546 | ) | | | 14,406,550 | | | | 21,544,664 | | | | 306,831,713 | | | | 4,149,178 | | | | — | | | | — | |
Meritage Homes Corp. | | | 211,633,392 | | | | 50,085,483 | | | | (50,714,122 | ) | | | 8,776,250 | | | | 91,184,621 | | | | 310,965,624 | | | | 2,663,289 | | | | 755,268 | | | | — | |
Meritor, Inc.(b) | | | 180,216,010 | | | | 18,416,851 | | | | (203,316,665 | ) | | | 49,989,966 | | | | (45,306,162 | ) | | | — | | | | — | | | | — | | | | — | |
Mesa Laboratories, Inc. | | | 95,859,603 | | | | 16,681,342 | | | | (17,380,764 | ) | | | (7,261,536 | ) | | | (23,919,159 | ) | | | 63,979,486 | | | | 366,162 | | | | 241,562 | | | | — | |
Methode Electronics, Inc. | | | 115,328,504 | | | | 26,141,134 | | | | (27,501,689 | ) | | | 2,141,609 | | | | (997,311 | ) | | | 115,112,247 | | | | 2,623,342 | | | | 1,497,737 | | | | — | |
| | |
SCHEDULES OF INVESTMENTS | | 37 |
| | |
Schedule of Investments (continued) March 31, 2023 | | iShares® Core S&P Small-Cap ETF |
Affiliates (continued)
| | | | | | | | | | | | | | | | | | | | | | | | | | | | | | | | | | | | |
| Affiliated Issuer | | Value at
03/31/22 | | | Purchases
at Cost | | | Proceeds
from Sale | | | Net
Realized
Gain (Loss) | | | Change in
Unrealized
Appreciation
(Depreciation) | | | Value at
03/31/23 | | | Shares
Held at
03/31/23 | | | Income | | | Capital
Gain
Distributions
from Underlying
Funds | |
MGP Ingredients, Inc.(i) | | $ | N/A | | | $ | 46,141,344 | | | $ | (48,029,283 | ) | | $ | 31,881,116 | | | $ | 9,621,954 | | | $ | 108,229,100 | | | | 1,118,994 | | | $ | 278,429 | | | $ | — | |
Middlesex Water Co. | | | 121,393,945 | | | | — | | | | — | | | | — | | | | (31,222,841 | ) | | | 90,171,104 | | | | 1,154,264 | | | | 1,390,888 | | | | — | |
MillerKnoll, Inc. | | | — | | | | 110,106,707 | | | | (11,356,468 | ) | | | (271,372 | ) | | | 13,880,938 | | | | 112,359,805 | | | | 5,494,367 | | | | 2,142,420 | | | | — | |
Minerals Technologies, Inc. | | | — | | | | 146,721,004 | | | | (15,693,223 | ) | | | (411,406 | ) | | | 12,277,952 | | | | 142,894,327 | | | | 2,365,017 | | | | 243,053 | | | | — | |
ModivCare, Inc. | | | 101,725,170 | | | | 22,034,762 | | | | (16,912,296 | ) | | | 1,603,652 | | | | (30,716,049 | ) | | | 77,735,239 | | | | 924,539 | | | | — | | | | — | |
Monarch Casino & Resort, Inc.(i) | | | N/A | | | | 16,120,988 | | | | (42,968,837 | ) | | | 33,017,591 | | | | 21,864,476 | | | | 71,511,446 | | | | 964,416 | | | | 5,018,330 | | | | — | |
Monro, Inc. | | | 106,431,874 | | | | 25,875,536 | | | | (30,322,464 | ) | | | (7,407,992 | ) | | | 18,224,283 | | | | 112,801,237 | | | | 2,282,040 | | | | 2,704,062 | | | | — | |
Moog, Inc., Class A | | | 182,438,303 | | | | 35,022,720 | | | | (33,779,904 | ) | | | 3,564,616 | | | | 23,347,658 | | | | 210,593,393 | | | | 2,090,257 | | | | 2,245,141 | | | | — | |
Motorcar Parts of America, Inc.(b) | | | 24,415,724 | | | | 4,706,169 | | | | (14,842,369 | ) | | | (22,381,118 | ) | | | 8,101,594 | | | | — | | | | — | | | | — | | | | — | |
Movado Group, Inc. | | | 45,775,699 | | | | 9,726,177 | | | | (10,285,988 | ) | | | 1,285,723 | | | | (13,576,331 | ) | | | 32,925,280 | | | | 1,144,431 | | | | 1,655,236 | | | | — | |
Mr. Cooper Group, Inc. | | | 191,220,336 | | | | 20,671,352 | | | | — | | | | — | | | | (18,919,383 | ) | | | 192,972,305 | | | | 4,710,088 | | | | — | | | | — | |
Mueller Industries, Inc. | | | 222,475,811 | | | | 57,874,727 | | | | (54,373,814 | ) | | | 12,482,670 | | | | 65,707,172 | | | | 304,166,566 | | | | 4,139,447 | | | | 4,422,507 | | | | — | |
Myers Industries, Inc. | | | 55,670,695 | | | | 14,266,618 | | | | (12,051,495 | ) | | | 1,372,791 | | | | (2,427,278 | ) | | | 56,831,331 | | | | 2,651,952 | | | | 1,454,130 | | | | — | |
MYR Group, Inc. | | | 113,820,468 | | | | 26,828,026 | | | | (27,739,676 | ) | | | 8,471,346 | | | | 30,720,459 | | | | 152,100,623 | | | | 1,207,052 | | | | — | | | | — | |
Myriad Genetics, Inc. | | | 143,948,675 | | | | 28,381,301 | | | | (23,712,646 | ) | | | (502,834 | ) | | | (10,920,090 | ) | | | 137,194,406 | | | | 5,905,915 | | | | — | | | | — | |
Nabors Industries Ltd. | | | 84,919,956 | | | | 30,594,033 | | | | (16,341,301 | ) | | | 1,710,959 | | | | (21,306,773 | ) | | | 79,576,874 | | | | 652,751 | | | | — | | | | — | |
National Bank Holdings Corp., Class A | | | 81,266,914 | | | | 29,848,426 | | | | (2,093,559 | ) | | | 191,493 | | | | (18,361,578 | ) | | | 90,851,696 | | | | 2,715,233 | | | | 2,149,698 | | | | — | |
National Presto Industries, Inc. | | | 27,917,614 | | | | 5,864,782 | | | | (5,553,619 | ) | | | (932,982 | ) | | | (782,102 | ) | | | 26,513,693 | | | | 367,786 | | | | 1,539,404 | | | | — | |
National Vision Holdings, Inc. | | | — | | | | 197,435,664 | | | | (38,388,123 | ) | | | 1,255,544 | | | | (52,252,953 | ) | | | 108,050,132 | | | | 5,735,145 | | | | — | | | | — | |
Natus Medical, Inc.(b) | | | 64,241,145 | | | | 7,114,910 | | | | (89,136,027 | ) | | | 6,525,152 | | | | 11,254,820 | | | | — | | | | — | | | | — | | | | — | |
NBT Bancorp, Inc. | | | 103,252,531 | | | | 4,894,521 | | | | — | | | | — | | | | (7,911,884 | ) | | | 100,235,168 | | | | 2,973,455 | | | | 3,445,871 | | | | — | |
Neenah, Inc.(b) | | | 47,271,785 | | | | 3,013,196 | | | | (80,307,882 | ) | | | (93,409 | ) | | | 30,116,310 | | | | — | | | | — | | | | 568,538 | | | | — | |
Nektar Therapeutics | | | 71,195,578 | | | | 11,878,719 | | | | (8,016,054 | ) | | | (8,040,501 | ) | | | (57,111,850 | ) | | | 9,905,892 | | | | 14,092,889 | | | | — | | | | — | |
NeoGenomics, Inc. | | | 107,000,980 | | | | 22,645,804 | | | | (21,263,926 | ) | | | (17,988,040 | ) | | | 69,877,115 | | | | 160,271,933 | | | | 9,205,740 | | | | — | | | | — | |
NETGEAR, Inc. | | | 51,698,232 | | | | 9,889,168 | | | | (9,501,777 | ) | | | (3,416,264 | ) | | | (9,960,470 | ) | | | 38,708,889 | | | | 2,091,242 | | | | — | | | | — | |
NetScout Systems, Inc. | | | 169,405,690 | | | | 39,996,977 | | | | (50,124,291 | ) | | | (1,960,618 | ) | | | (16,552,143 | ) | | | 140,765,615 | | | | 4,913,285 | | | | — | | | | — | |
New York Mortgage Trust, Inc. | | | 99,064,584 | | | | 25,931,735 | | | | (34,187,990 | ) | | | 11,069,655 | | | | (32,482,272 | ) | | | 69,395,712 | | | | 6,967,441 | | | | 7,319,082 | | | | — | |
NexPoint Residential Trust, Inc. | | | 122,018,834 | | | | 2,882,939 | | | | (4,671,555 | ) | | | — | | | | (60,372,928 | ) | | | 59,857,290 | | | | 1,370,673 | | | | 1,267,504 | | | | — | |
NextGen Healthcare, Inc. | | | 84,060,458 | | | | 18,803,378 | | | | (20,528,622 | ) | | | 2,084,943 | | | | (16,770,607 | ) | | | 67,649,550 | | | | 3,885,672 | | | | — | | | | — | |
NMI Holdings, Inc., Class A | | | 126,486,977 | | | | 28,866,679 | | | | (29,492,787 | ) | | | 2,296,270 | | | | 7,864,806 | | | | 136,021,945 | | | | 6,091,444 | | | | — | | | | — | |
Northern Oil & Gas, Inc. | | | — | | | | 179,190,353 | | | | (3,081,971 | ) | | | 65,442 | | | | (12,506,654 | ) | | | 163,667,170 | | | | 5,392,658 | | | | 1,835,013 | | | | — | |
Northfield Bancorp, Inc. | | | 44,128,998 | | | | 2,694,249 | | | | (2,729,839 | ) | | | 331,332 | | | | (8,292,076 | ) | | | 36,132,664 | | | | 3,067,289 | | | | 1,597,878 | | | | — | |
Northwest Bancshares, Inc. | | | 110,620,029 | | | | 7,083,947 | | | | — | | | | — | | | | (12,910,237 | ) | | | 104,793,739 | | | | 8,711,034 | | | | 6,834,576 | | | | — | |
Northwest Natural Holding Co. | | | 114,034,325 | | | | 40,959,851 | | | | (22,192,145 | ) | | | (1,132,943 | ) | | | (9,955,153 | ) | | | 121,713,935 | | | | 2,559,166 | | | | 4,775,245 | | | | — | |
NOW, Inc. | | | 87,533,937 | | | | 21,199,002 | | | | (19,141,693 | ) | | | 953,346 | | | | (815,603 | ) | | | 89,728,989 | | | | 8,047,443 | | | | — | | | | — | |
Nu Skin Enterprises, Inc., Class A | | | — | | | | 164,841,602 | | | | (13,782,498 | ) | | | (808,533 | ) | | | (8,660,747 | ) | | | 141,589,824 | | | | 3,601,878 | | | | 1,455,687 | | | | — | |
NuVasive, Inc. | | | — | | | | 165,195,640 | | | | (10,422,933 | ) | | | (1,372,821 | ) | | | 3,566,134 | | | | 156,966,020 | | | | 3,799,710 | | | | — | | | | — | |
NV5 Global, Inc. | | | 113,096,919 | | | | 29,213,058 | | | | (20,111,202 | ) | | | (1,553,801 | ) | | | (26,591,737 | ) | | | 94,053,237 | | | | 904,619 | | | | — | | | | — | |
Oceaneering International, Inc. | | | 108,248,797 | | | | 21,856,842 | | | | (19,813,118 | ) | | | (75,338 | ) | | | 18,603,305 | | | | 128,820,488 | | | | 7,306,891 | | | | — | | | | — | |
ODP Corp. | | | 150,472,218 | | | | 29,858,248 | | | | (43,678,744 | ) | | | 3,993,808 | | | | (8,489,162 | ) | | | 132,156,368 | | | | 2,938,114 | | | | — | | | | — | |
Office Properties Income Trust | | | 89,434,675 | | | | 15,924,420 | | | | (18,607,101 | ) | | | (10,768,779 | ) | | | (32,456,811 | ) | | | 43,526,404 | | | | 3,538,732 | | | | 3,840,941 | | | | — | |
OFG Bancorp | | | 86,662,184 | | | | 2,839,418 | | | | (781,787 | ) | | | (83,288 | ) | | | (5,603,511 | ) | | | 83,033,016 | | | | 3,329,311 | | | | 2,514,855 | | | | — | |
O-I Glass, Inc. | | | 146,725,678 | | | | 40,741,881 | | | | (39,788,997 | ) | | | 2,760,460 | | | | 105,088,834 | | | | 255,527,856 | | | | 11,251,777 | | | | — | | | | — | |
| | |
| 38 | | 2 0 2 3 I SHARES ANNUAL REPORT TO SHAREHOLDERS |
| | |
Schedule of Investments (continued) March 31, 2023 | | iShares® Core S&P Small-Cap ETF |
Affiliates (continued)
| | | | | | | | | | | | | | | | | | | | | | | | | | | | | | | | | | | | |
| Affiliated Issuer | | Value at
03/31/22 | | | Purchases
at Cost | | | Proceeds
from Sale | | | Net
Realized
Gain (Loss) | | | Change in
Unrealized
Appreciation
(Depreciation) | | | Value at
03/31/23 | | | Shares
Held at
03/31/23 | | | Income | | | Capital
Gain
Distributions
from Underlying
Funds | |
Oil States International, Inc. | | $ | 30,532,455 | | | $ | 7,343,354 | | | $ | (6,139,661 | ) | | $ | (2,695,961 | ) | | $ | 9,745,709 | | | $ | 38,785,896 | | | | 4,656,170 | | | $ | — | | | $ | — | |
Olympic Steel, Inc. | | | 25,713,971 | | | | 4,892,715 | | | | (4,813,727 | ) | | | 1,912,210 | | | | 8,460,176 | | | | 36,165,345 | | | | 692,690 | | | | 277,914 | | | | — | |
Omnicell,
Inc.(b) | | | 407,429,926 | | | | 17,797,448 | | | | (380,212,794 | ) | | | 105,673,887 | | | | (150,688,467 | ) | | | — | | | | — | | | | — | | | | — | |
OneSpan, Inc. | | | 35,579,568 | | | | 7,349,635 | | | | (6,768,569 | ) | | | (289,557 | ) | | | 9,022,233 | | | | 44,893,310 | | | | 2,565,332 | | | | — | | | | — | |
Onto Innovation, Inc. | | | 306,564,777 | | | | 59,392,830 | | | | (52,812,493 | ) | | | 16,634,023 | | | | (13,009,262 | ) | | | 316,769,875 | | | | 3,604,573 | | | | — | | | | — | |
OptimizeRx Corp.(b) | | | 47,963,311 | | | | 7,062,437 | | | | (22,238,030 | ) | | | (91,339,044 | ) | | | 58,551,326 | | | | — | | | | — | | | | — | | | | — | |
OraSure Technologies, Inc. | | | 35,093,429 | | | | 4,979,402 | | | | (5,639,196 | ) | | | (3,523,709 | ) | | | 883,580 | | | | 31,793,506 | | | | 5,255,125 | | | | — | | | | — | |
Orion Office REIT, Inc. | | | 56,739,102 | | | | 10,372,603 | | | | (10,235,957 | ) | | | (5,601,020 | ) | | | (23,815,441 | ) | | | 27,459,287 | | | | 4,098,401 | | | | 430,871 | | | | — | |
Orthofix Medical, Inc. | | | 46,236,230 | | | | 29,783,981 | | | | (7,278,725 | ) | | | (5,285,645 | ) | | | (21,825,039 | ) | | | 41,630,802 | | | | 2,485,421 | | | | — | | | | — | |
OSI Systems, Inc. | | | 99,778,004 | | | | 14,933,646 | | | | (16,877,929 | ) | | | 75,135 | | | | 19,008,988 | | | | 116,917,844 | | | | 1,142,222 | | | | — | | | | — | |
Otter Tail Corp. | | | — | | | | 230,555,251 | | | | (12,122,431 | ) | | | (290,270 | ) | | | 828,179 | | | | 218,970,729 | | | | 3,029,898 | | | | — | | | | — | |
Outfront Media, Inc. | | | — | | | | 176,700,590 | | | | (211,802 | ) | | | 7,465 | | | | (16,019,077 | ) | | | 160,477,176 | | | | 9,887,688 | | | | 5,171,334 | | | | — | |
Owens & Minor, Inc. | | | 237,798,945 | | | | 33,829,638 | | | | (25,999,905 | ) | | | 3,029,336 | | | | (168,062,465 | ) | | | 80,595,549 | | | | 5,539,213 | | | | — | | | | — | |
Oxford Industries, Inc. | | | 102,821,032 | | | | 25,688,454 | | | | (30,404,478 | ) | | | 3,700,019 | | | | 12,259,838 | | | | 114,064,865 | | | | 1,080,262 | | | | 2,442,390 | | | | — | |
Pacific Premier Bancorp, Inc. | | | 228,019,766 | | | | 8,067,514 | | | | (1,293,032 | ) | | | (640,946 | ) | | | (74,423,352 | ) | | | 159,729,950 | | | | 6,649,873 | | | | 8,759,187 | | | | — | |
Pacira BioSciences, Inc. | | | 243,118,352 | | | | 41,581,012 | | | | (31,280,389 | ) | | | (490,334 | ) | | | (116,462,694 | ) | | | 136,465,947 | | | | 3,343,934 | | | | — | | | | — | |
Palomar Holdings, Inc. | | | 110,545,925 | | | | 33,007,717 | | | | (22,645,558 | ) | | | (5,366,726 | ) | | | (14,040,647 | ) | | | 101,500,711 | | | | 1,838,781 | | | | — | | | | — | |
Park Aerospace Corp.(b) | | | 18,232,507 | | | | 3,943,441 | | | | (21,125,740 | ) | | | (6,958,260 | ) | | | 5,908,052 | | | | — | | | | — | | | | 1,900,963 | | | | — | |
Park National Corp. | | | 135,674,418 | | | | 29,368,106 | | | | (26,121,146 | ) | | | 3,696,901 | | | | (17,843,511 | ) | | | 124,774,768 | | | | 1,052,330 | | | | 4,972,532 | | | | — | |
Pathward Financial, Inc.(l) | | | 112,957,040 | | | | 1,486,571 | | | | (5,525,322 | ) | | | 326,736 | | | | (27,324,431 | ) | | | 81,920,594 | | | | 1,974,466 | | | | 407,393 | | | | — | |
Patrick Industries, Inc. | | | 96,958,481 | | | | 22,597,535 | | | | (24,968,379 | ) | | | (1,430,234 | ) | | | 14,526,944 | | | | 107,684,347 | | | | 1,564,952 | | | | 2,518,104 | | | | — | |
Patterson-UTI Energy, Inc. | | | 238,134,784 | | | | 52,482,472 | | | | (42,887,636 | ) | | | 14,213,194 | | | | (77,037,933 | ) | | | 184,904,881 | | | | 15,803,836 | | | | 3,847,848 | | | | — | |
PBF Energy, Inc., Class A(b) | | | 166,060,470 | | | | 58,685,185 | | | | (341,045,680 | ) | | | 225,806,605 | | | | (109,506,580 | ) | | | — | | | | — | | | | 1,588,171 | | | | — | |
PDF Solutions, Inc. | | | 59,598,908 | | | | 14,139,898 | | | | (14,297,236 | ) | | | 3,494,887 | | | | 28,306,901 | | | | 91,243,358 | | | | 2,151,966 | | | | — | | | | — | |
Pebblebrook Hotel Trust | | | — | | | | 104,223,030 | | | | — | | | | — | | | | 6,576,522 | | | | 110,799,552 | | | | 7,891,706 | | | | 78,338 | | | | — | |
Pediatrix Medical Group,
Inc.(m) | | | 143,173,761 | | | | 27,431,751 | | | | (26,690,229 | ) | | | (8,043,584 | ) | | | (47,113,811 | ) | | | 88,757,888 | | | | 5,952,910 | | | | — | | | | — | |
Pennant Group,
Inc.(b) | | | 35,999,327 | | | | 6,705,850 | | | | (29,173,124 | ) | | | (8,875,497 | ) | | | (4,656,556 | ) | | | — | | | | — | | | | — | | | | — | |
PennyMac Mortgage Investment Trust(i) | | | N/A | | | | 23,240,323 | | | | (30,846,025 | ) | | | (7,863,188 | ) | | | (31,795,772 | ) | | | 79,670,825 | | | | 6,461,543 | | | | 10,687,138 | | | | — | |
Perdoceo Education Corp. | | | 57,606,112 | | | | 15,743,868 | | | | (16,376,972 | ) | | | (40,962 | ) | | | 8,798,672 | | | | 65,730,718 | | | | 4,894,320 | | | | — | | | | — | |
Perficient, Inc. | | | 259,611,926 | | | | 54,675,656 | | | | (37,298,875 | ) | | | 8,573,899 | | | | (103,358,944 | ) | | | 182,203,662 | | | | 2,523,946 | | | | — | | | | — | |
PetMed Express, Inc. | | | 38,966,720 | | | | 7,241,666 | | | | (6,597,905 | ) | | | (1,425,252 | ) | | | (13,408,186 | ) | | | 24,777,043 | | | | 1,525,680 | | | | 1,858,621 | | | | — | |
PGT Innovations, Inc. | | | 76,723,141 | | | | 21,108,658 | | | | (19,029,718 | ) | | | 3,798,872 | | | | 26,882,941 | | | | 109,483,894 | | | | 4,360,171 | | | | — | | | | — | |
Phibro Animal Health Corp., Class A | | | 29,130,392 | | | | 5,716,235 | | | | (4,986,552 | ) | | | (2,609,609 | ) | | | (4,704,313 | ) | | | 22,546,153 | | | | 1,471,681 | | | | 726,302 | | | | — | |
Photronics, Inc. | | | 74,493,294 | | | | 21,350,933 | | | | (17,364,994 | ) | | | 2,300,749 | | | | (6,402,832 | ) | | | 74,377,150 | | | | 4,485,956 | | | | — | | | | — | |
Piper Sandler Cos | | | 132,389,775 | | | | 33,433,183 | | | | (33,697,731 | ) | | | 4,755,881 | | | | 1,520,700 | | | | 138,401,808 | | | | 998,498 | | | | 3,827,756 | | | | — | |
Plantronics, Inc.(b) | | | 120,668,371 | | | | 15,230,749 | | | | (137,743,925 | ) | | | 39,460,421 | | | | (37,615,616 | ) | | | — | | | | — | | | | — | | | | — | |
Plexus Corp. | | | 164,407,748 | | | | 42,193,932 | | | | (40,372,906 | ) | | | 7,824,316 | | | | 22,960,059 | | | | 197,013,149 | | | | 2,019,198 | | | | — | | | | — | |
Powell Industries, Inc. | | | 12,559,186 | | | | 4,018,765 | | | | (4,225,818 | ) | | | 596,496 | | | | 15,138,496 | | | | 28,087,125 | | | | 659,477 | | | | 703,306 | | | | — | |
PRA Group, Inc. | | | 141,038,099 | | | | 26,558,994 | | | | (36,973,511 | ) | | | (1,228,469 | ) | | | (19,016,407 | ) | | | 110,378,706 | | | | 2,833,129 | | | | — | | | | — | |
Prestige Consumer Healthcare, Inc. | | | 190,225,543 | | | | 46,563,085 | | | | (44,167,832 | ) | | | 5,338,613 | | | | 28,877,996 | | | | 226,837,405 | | | | 3,621,865 | | | | — | | | | — | |
PriceSmart, Inc. | | | 135,818,557 | | | | 31,608,226 | | | | (24,374,664 | ) | | | (2,027,924 | ) | | | (9,999,639 | ) | | | 131,024,556 | | | | 1,833,024 | | | | 1,636,731 | | | | — | |
ProAssurance Corp. | | | 92,923,542 | | | | 1,499,669 | | | | — | | | | — | | | | (29,269,790 | ) | | | 65,153,421 | | | | 3,525,618 | | | | 705,124 | | | | — | |
PROG Holdings, Inc. | | | — | | | | 131,002,792 | | | | (68,671,536 | ) | | | 34,733,470 | | | | (10,333,499 | ) | | | 86,731,227 | | | | 3,645,701 | | | | — | | | | — | |
Progress Software Corp. | | | 148,916,992 | | | | 36,160,182 | | | | (36,284,478 | ) | | | 7,233,576 | | | | 25,478,443 | | | | 181,504,715 | | | | 3,159,351 | | | | 2,250,759 | | | | — | |
ProPetro Holding Corp. | | | 84,754,257 | | | | 22,490,824 | | | | (13,058,917 | ) | | | (3,377,382 | ) | | | (40,538,394 | ) | | | 50,270,388 | | | | 6,991,709 | | | | — | | | | — | |
Proto Labs, Inc. | | | 104,431,636 | | | | 19,486,501 | | | | (17,594,033 | ) | | | (19,393,828 | ) | | | (21,429,556 | ) | | | 65,500,720 | | | | 1,975,889 | | | | — | | | | — | |
Provident Financial Services, Inc. | | | 119,936,396 | | | | 1,846,195 | | | | — | | | | — | | | | (21,720,186 | ) | | | 100,062,405 | | | | 5,217,018 | | | | 4,964,403 | | | | — | |
| | |
SCHEDULES OF INVESTMENTS | | 39 |
| | |
Schedule of Investments (continued) March 31, 2023 | | iShares® Core S&P Small-Cap ETF |
Affiliates (continued)
| | | | | | | | | | | | | | | | | | | | | | | | | | | | | | | | | | | | |
| Affiliated Issuer | | Value at
03/31/22 | | | Purchases
at Cost | | | Proceeds
from Sale | | | Net
Realized
Gain (Loss) | | | Change in
Unrealized
Appreciation
(Depreciation) | | | Value at
03/31/23 | | | Shares
Held at
03/31/23 | | | Income | | | Capital
Gain
Distributions
from Underlying
Funds | |
Quaker Chemical Corp. | | $ | 165,876,863 | | | $ | 37,263,721 | | | $ | (30,774,772 | ) | | $ | (1,019,302 | ) | | $ | 24,990,396 | | | $ | 196,336,906 | | | | 991,851 | | | $ | 1,669,251 | | | $ | — | |
Quanex Building Products Corp. | | | 50,273,695 | | | | 13,566,722 | | | | (11,861,539 | ) | | | (178,593 | ) | | | 198,261 | | | | 51,998,546 | | | | 2,415,167 | | | | 788,827 | | | | — | |
QuinStreet, Inc. | | | 41,592,937 | | | | 10,703,393 | | | | (9,804,165 | ) | | | 45,715 | | | | 15,783,894 | | | | 58,321,774 | | | | 3,674,970 | | | | — | | | | — | |
Rambus, Inc. | | | 249,695,511 | | | | 52,623,816 | | | | (57,502,714 | ) | | | 16,247,757 | | | | 140,005,660 | | | | 401,070,030 | | | | 7,824,230 | | | | — | | | | — | |
Ranger Oil Corp., Class A | | | 52,271,514 | | | | 12,961,565 | | | | (17,221,132 | ) | | | (7,770,491 | ) | | | 16,499,230 | | | | 56,740,686 | | | | 1,389,341 | | | | 334,993 | | | | — | |
Rayonier Advanced Materials, Inc. | | | 30,075,292 | | | | 5,169,682 | | | | (6,101,188 | ) | | | (3,313,053 | ) | | | 3,193,247 | | | | 29,023,980 | | | | 4,629,024 | | | | — | | | | — | |
RE/MAX Holdings, Inc., Class A | | | 37,066,442 | | | | 8,856,862 | | | | (8,633,377 | ) | | | (4,342,548 | ) | | | (7,283,868 | ) | | | 25,663,511 | | | | 1,367,991 | | | | 641,897 | | | | — | |
Ready Capital
Corp.(i) | | | N/A | | | | 52,063,839 | | | | (72,854,545 | ) | | | 46,053,877 | | | | (24,279,157 | ) | | | 72,885,125 | | | | 7,166,679 | | | | 5,719,096 | | | | — | |
Red Robin Gourmet Burgers, Inc.(b) | | | 19,037,149 | | | | 344,178 | | | | (9,882,769 | ) | | | (29,592,094 | ) | | | 20,093,536 | | | | — | | | | — | | | | — | | | | — | |
Redwood Trust, Inc. | | | 86,418,394 | | | | 18,915,781 | | | | (23,994,407 | ) | | | (9,775,012 | ) | | | (15,987,606 | ) | | | 55,577,150 | | | | 8,245,868 | | | | 7,731,381 | | | | — | |
REGENXBIO, Inc. | | | 89,410,873 | | | | 17,633,899 | | | | (14,830,980 | ) | | | (7,666,443 | ) | | | (32,794,423 | ) | | | 51,752,926 | | | | 2,736,802 | | | | — | | | | — | |
Renasant Corp. | | | 122,659,043 | | | | 8,141,752 | | | | — | | | | — | | | | (11,147,830 | ) | | | 119,652,965 | | | | 3,912,785 | | | | 3,383,868 | | | | — | |
Renewable Energy Group, Inc.(b) | | | 218,275,772 | | | | 2,502,921 | | | | (223,831,696 | ) | | | 101,187,403 | | | | (98,134,400 | ) | | | — | | | | — | | | | — | | | | — | |
Resideo Technologies, Inc. | | | 246,333,903 | | | | 47,478,809 | | | | (39,391,885 | ) | | | 3,300,331 | | | | (63,398,342 | ) | | | 194,322,816 | | | | 10,630,351 | | | | — | | | | — | |
Resources Connection, Inc. | | | 37,511,987 | | | | 10,756,772 | | | | (7,631,853 | ) | | | 944,391 | | | | (1,862,461 | ) | | | 39,718,836 | | | | 2,328,185 | | | | 1,303,888 | | | | — | |
Retail Opportunity Investments Corp. | | | 165,489,597 | | | | 8,298,042 | | | | (2,111,609 | ) | | | (69,849 | ) | | | (44,346,472 | ) | | | 127,259,709 | | | | 9,116,025 | | | | 4,935,471 | | | | — | |
REX American Resources Corp. | | | 37,138,350 | | | | 8,075,407 | | | | (8,191,639 | ) | | | 803,625 | | | | (6,166,464 | ) | | | 31,659,279 | | | | 1,107,355 | | | | — | | | | — | |
Rogers Corp. | | | 364,370,893 | | | | 54,797,830 | | | | (45,428,804 | ) | | | 13,376,353 | | | | (163,187,101 | ) | | | 223,929,171 | | | | 1,370,184 | | | | — | | | | — | |
RPT Realty | | | 83,319,640 | | | | 13,874,332 | | | | (12,255,260 | ) | | | (812,334 | ) | | | (24,613,483 | ) | | | 59,512,895 | | | | 6,257,928 | | | | 3,851,288 | | | | — | |
Ruth’s Hospitality Group, Inc. | | | 51,970,044 | | | | 10,101,050 | | | | (10,945,367 | ) | | | (811,884 | ) | | | (14,049,551 | ) | | | 36,264,292 | | | | 2,208,544 | | | | 1,335,424 | | | | — | |
RXO, Inc. | | | — | | | | 153,631,057 | | | | (9,266,147 | ) | | | 200,128 | | | | 22,058,935 | | | | 166,623,973 | | | | 8,483,909 | | | | — | | | | — | |
S&T Bancorp, Inc. | | | 70,123,531 | | | | 11,199,187 | | | | (111,592 | ) | | | (57,690 | ) | | | 5,638,972 | | | | 86,792,408 | | | | 2,759,695 | | | | 3,362,984 | | | | — | |
Sabre Corp. | | | — | | | | 157,734,917 | | | | (8,913,371 | ) | | | (3,105,337 | ) | | | (43,347,787 | ) | | | 102,368,422 | | | | 23,862,103 | | | | — | | | | — | |
Safety Insurance Group, Inc. | | | 86,228,006 | | | | 4,711,761 | | | | — | | | | — | | | | (15,996,195 | ) | | | 74,943,572 | | | | 1,005,684 | | | | 3,529,361 | | | | — | |
Sally Beauty Holdings, Inc. | | | 123,084,093 | | | | 25,316,360 | | | | (25,838,890 | ) | | | 906,573 | | | | (1,917,899 | ) | | | 121,550,237 | | | | 7,801,684 | | | | — | | | | — | |
Sanmina Corp. | | | 183,729,393 | | | | 49,444,273 | | | | (60,969,623 | ) | | | 10,390,500 | | | | 76,451,517 | | | | 259,046,060 | | | | 4,247,353 | | | | — | | | | — | |
ScanSource, Inc. | | | 63,970,113 | | | | 7,113,446 | | | | (6,748,847 | ) | | | 118,805 | | | | (8,067,039 | ) | | | 56,386,478 | | | | 1,852,381 | | | | — | | | | — | |
Scholastic Corp.(i) | | | N/A | | | | 21,308,776 | | | | (75,516,942 | ) | | | 55,209,281 | | | | (9,150,273 | ) | | | 73,790,913 | | | | 2,156,368 | | | | 886,736 | | | | — | |
Seacoast Banking Corp. of Florida | | | 146,555,548 | | | | 44,235,823 | | | | (7,459,523 | ) | | | 1,916,537 | | | | (50,376,994 | ) | | | 134,871,391 | | | | 5,690,776 | | | | 2,885,616 | | | | — | |
Select Medical Holdings Corp. | | | 181,828,319 | | | | 43,481,046 | | | | (40,613,528 | ) | | | 3,764,808 | | | | 7,734,496 | | | | 196,195,141 | | | | 7,589,754 | | | | 3,844,996 | | | | — | |
Selectquote, Inc.(b) | | | 24,980,028 | | | | 2,574,999 | | | | (8,975,536 | ) | | | (136,659,483 | ) | | | 118,079,992 | | | | — | | | | — | | | | — | | | | — | |
Semtech Corp. | | | — | | | | 142,291,192 | | | | (5,283,192 | ) | | | (167,989 | ) | | | (24,669,856 | ) | | | 112,170,155 | | | | 4,646,651 | | | | — | | | | — | |
Seneca Foods Corp., Class A | | | 22,360,474 | | | | 5,642,445 | | | | (8,044,144 | ) | | | 1,038,687 | | | | (948,833 | ) | | | 20,048,629 | | | | 383,559 | | | | — | | | | — | |
Service Properties Trust | | | 103,192,254 | | | | 19,838,183 | | | | (19,865,936 | ) | | | (5,119,656 | ) | | | 22,049,986 | | | | 120,094,831 | | | | 12,057,714 | | | | 2,459,705 | | | | — | |
ServisFirst Bancshares, Inc. | | | 332,974,896 | | | | 58,827,538 | | | | (49,457,927 | ) | | | 11,962,932 | | | | (159,877,739 | ) | | | 194,429,700 | | | | 3,559,028 | | | | 3,617,536 | | | | — | |
Shake Shack, Inc., Class A | | | 190,071,451 | | | | 33,152,769 | | | | (36,362,664 | ) | | | (13,574,266 | ) | | | (22,369,361 | ) | | | 150,917,929 | | | | 2,719,732 | | | | — | | | | — | |
Shenandoah Telecommunications Co. | | | 84,576,037 | | | | 17,312,927 | | | | (15,790,113 | ) | | | (8,583,628 | ) | | | (8,317,933 | ) | | | 69,197,290 | | | | 3,638,133 | | | | 299,742 | | | | — | |
Signet Jewelers Ltd. | | | 273,905,174 | | | | 49,569,749 | | | | (77,061,842 | ) | | | 7,957,772 | | | | 3,241,485 | | | | 257,612,338 | | | | 3,312,064 | | | | 2,820,953 | | | | — | |
| | |
| 40 | | 2 0 2 3 I SHARES ANNUAL REPORT TO SHAREHOLDERS |
| | |
Schedule of Investments (continued) March 31, 2023 | | iShares® Core S&P Small-Cap ETF |
Affiliates (continued)
| | | | | | | | | | | | | | | | | | | | | | | | | | | | | | | | | | | | |
| Affiliated Issuer | | Value at
03/31/22 | | | Purchases
at Cost | | | Proceeds
from Sale | | | Net
Realized
Gain (Loss) | | | Change in
Unrealized
Appreciation
(Depreciation) | | | Value at
03/31/23 | | | Shares
Held at
03/31/23 | | | Income | | | Capital
Gain
Distributions
from Underlying
Funds | |
Simmons First National Corp., Class A | | $ | 190,104,518 | | | $ | 39,195,347 | | | $ | — | | | $ | — | | | $ | (75,605,511 | ) | | $ | 153,694,354 | | | | 8,787,556 | | | $ | 6,766,418 | | | $ | — | |
Simply Good Foods Co. | | | 229,837,648 | | | | 58,087,000 | | | | (52,815,524 | ) | | | 464,274 | | | | 9,244,637 | | | | 244,818,035 | | | | 6,155,847 | | | | — | | | | — | |
Simulations Plus, Inc. | | | 57,561,518 | | | | 14,282,217 | | | | (11,377,236 | ) | | | (1,383,038 | ) | | | (7,806,052 | ) | | | 51,277,409 | | | | 1,166,987 | | | | 278,588 | | | | — | |
Six Flags Entertainment Corp. | | | — | | | | 149,861,643 | | | | (23,611,982 | ) | | | 225,892 | | | | 17,596,371 | | | | 144,071,924 | | | | 5,393,932 | | | | — | | | | — | |
SJW Group | | | — | | | | 160,696,833 | | | | (11,664,214 | ) | | | (221,291 | ) | | | (1,124,305 | ) | | | 147,687,023 | | | | 1,939,932 | | | | 755,252 | | | | — | |
SkyWest, Inc. | | | 104,003,904 | | | | 18,856,615 | | | | (16,824,781 | ) | | | (9,666,487 | ) | | | (14,861,689 | ) | | | 81,507,562 | | | | 3,676,480 | | | | — | | | | — | |
SL Green Realty Corp. | | | — | | | | 83,121,044 | | | | — | | | | — | | | | (185,667 | ) | | | 82,935,377 | | | | 3,526,164 | | | | 954,344 | | | | — | |
Sleep Number Corp. | | | 82,168,963 | | | | 15,218,284 | | | | (15,131,234 | ) | | | (3,375,383 | ) | | | (30,129,933 | ) | | | 48,750,697 | | | | 1,603,114 | | | | — | | | | — | |
SM Energy Co. | | | 338,768,910 | | | | 72,439,718 | | | | (57,667,894 | ) | | | 16,645,392 | | | | (118,125,600 | ) | | | 252,060,526 | | | | 8,951,013 | | | | 2,802,285 | | | | — | |
SMART Global Holdings, Inc. | | | 86,032,317 | | | | 19,304,439 | | | | (14,620,466 | ) | | | (1,903,098 | ) | | | (27,175,572 | ) | | | 61,637,620 | | | | 3,575,268 | | | | — | | | | — | |
Sonic Automotive, Inc., Class A | | | 63,134,619 | | | | 16,269,249 | | | | (28,219,260 | ) | | | 2,886,031 | | | | 12,023,429 | | | | 66,094,068 | | | | 1,216,306 | | | | 1,474,422 | | | | — | |
Sonos, Inc. | | | 258,040,886 | | | | 40,930,830 | | | | (37,270,603 | ) | | | (12,520,550 | ) | | | (67,065,035 | ) | | | 182,115,528 | | | | 9,282,137 | | | | — | | | | — | |
South Jersey Industries,
Inc.(b) | | | 277,815,513 | | | | 75,956,173 | | | | (367,243,329 | ) | | | 61,567,197 | | | | (48,095,554 | ) | | | — | | | | — | | | | 9,457,553 | | | | — | |
Southside Bancshares, Inc. | | | 88,968,366 | | | | 1,414,741 | | | | (1,116,311 | ) | | | (371,640 | ) | | | (16,372,379 | ) | | | 72,522,777 | | | | 2,184,421 | | | | 3,100,859 | | | | — | |
Southwestern Energy Co.(b) | | | 572,104,123 | | | | 29,177,779 | | | | (502,896,112 | ) | | | 177,290,495 | | | | (275,676,285 | ) | | | — | | | | — | | | | — | | | | — | |
SpartanNash Co. | | | 85,110,307 | | | | 20,603,298 | | | | (20,029,122 | ) | | | 3,165,362 | | | | (25,284,742 | ) | | | 63,565,103 | | | | 2,563,109 | | | | 2,247,942 | | | | — | |
SPS Commerce, Inc. | | | 337,838,163 | | | | 69,127,442 | | | | (62,543,572 | ) | | | 21,825,173 | | | | 33,345,807 | | | | 399,593,013 | | | | 2,623,723 | | | | — | | | | — | |
SPX FLOW,
Inc.(b) | | | 259,082,047 | | | | 1,269,690 | | | | (261,195,167 | ) | | | 118,154,523 | | | | (117,311,093 | ) | | | — | | | | — | | | | — | | | | — | |
SPX Technologies, Inc.(n) | | | 160,498,750 | | | | 45,002,518 | | | | (41,217,106 | ) | | | 10,545,856 | | | | 57,287,628 | | | | 232,117,646 | | | | 3,288,717 | | | | — | | | | — | |
Standard Motor Products, Inc. | | | 59,270,564 | | | | 14,312,117 | | | | (13,553,381 | ) | | | (2,199,953 | ) | | | (7,494,737 | ) | | | 50,334,610 | | | | 1,363,712 | | | | 1,536,444 | | | | — | |
Standex International Corp. | | | 87,658,417 | | | | 21,211,840 | | | | (22,001,908 | ) | | | 1,499,475 | | | | 17,918,300 | | | | 106,286,124 | | | | 868,067 | | | | 962,784 | | | | — | |
Stellar Bancorp, Inc. | | | — | | | | 95,243,875 | | | | (9,083,657 | ) | | | 438,385 | | | | (5,882,110 | ) | | | 80,716,493 | | | | 3,279,825 | | | | 881,144 | | | | — | |
Stepan Co. | | | 150,510,653 | | | | 36,492,540 | | | | (33,832,941 | ) | | | 1,742,542 | | | | 3,277,717 | | | | 158,190,511 | | | | 1,535,383 | | | | 2,189,690 | | | | — | |
Steven Madden Ltd. | | | 211,645,113 | | | | 42,562,983 | | | | (46,877,537 | ) | | | 4,451 | | | | (15,230,838 | ) | | | 192,104,172 | | | | 5,336,227 | | | | 4,638,895 | | | | — | |
Stewart Information Services Corp. | | | 108,673,669 | | | | 4,637,916 | | | | — | | | | — | | | | (37,184,450 | ) | | | 76,127,135 | | | | 1,886,670 | | | | 3,228,834 | | | | — | |
StoneX Group, Inc. | | | 90,898,940 | | | | 26,702,567 | | | | (21,242,313 | ) | | | 6,327,301 | | | | 29,745,043 | | | | 132,431,538 | | | | 1,279,161 | | | | — | | | | — | |
Strategic Education, Inc. | | | 107,496,569 | | | | 28,479,430 | | | | (27,943,347 | ) | | | 574,145 | | | | 37,087,402 | | | | 145,694,199 | | | | 1,621,888 | | | | 3,993,026 | | | | — | |
Stride, Inc. | | | — | | | | 146,780,897 | | | | (26,227,466 | ) | | | 2,442,404 | | | | (6,148,467 | ) | | | 116,847,368 | | | | 2,977,003 | | | | — | | | | — | |
Sturm Ruger & Co., Inc. | | | 87,670,726 | | | | 18,962,007 | | | | (17,033,945 | ) | | | (568,014 | ) | | | (15,293,495 | ) | | | 73,737,279 | | | | 1,283,727 | | | | 9,178,361 | | | | — | |
Summit Hotel Properties, Inc. | | | 75,886,774 | | | | 15,576,032 | | | | (14,009,996 | ) | | | (4,888,927 | ) | | | (18,041,527 | ) | | | 54,522,356 | | | | 7,788,908 | | | | 963,386 | | | | — | |
SunCoke Energy, Inc. | | | 52,991,824 | | | | 11,855,423 | | | | (10,820,087 | ) | | | (498,579 | ) | | | 1,048,869 | | | | 54,577,450 | | | | 6,077,667 | | | | 1,854,478 | | | | — | |
Sunstone Hotel Investors, Inc. | | | — | | | | 179,538,776 | | | | (16,384,497 | ) | | | (1,108,668 | ) | | | (10,742,817 | ) | | | 151,302,794 | | | | 15,314,048 | | | | 2,199,949 | | | | — | |
Supernus | | | | | | | | | | | | | | | | | | | | | | | | | | | | | | | | | | | | |
Pharmaceuticals, Inc. | | | 122,972,590 | | | | 30,155,156 | | | | (25,094,039 | ) | | | 3,098,711 | | | | 11,610,558 | | | | 142,742,976 | | | | 3,939,911 | | | | — | | | | — | |
Surmodics,
Inc.(b) | | | 45,178,643 | | | | 8,039,725 | | | | (24,068,595 | ) | | | (22,894,213 | ) | | | (6,255,560 | ) | | | — | | | | — | | | | — | | | | — | |
Sylvamo Corp. | | | 84,035,262 | | | | 24,938,333 | | | | (33,524,445 | ) | | | 2,957,112 | | | | 29,019,265 | | | | 107,425,527 | | | | 2,322,212 | | | | 1,164,246 | | | | — | |
Tactile Systems Technology, Inc.(b) | | | 28,711,529 | | | | 493,892 | | | | (10,817,864 | ) | | | (48,778,697 | ) | | | 30,391,140 | | | | — | | | | — | | | | — | | | | — | |
Talos Energy, Inc.(c) | | | — | | | | 51,443,117 | | | | (50,711,173 | ) | | | 38,326,136 | | | | — | | | | N/A | | | | N/A | | | | — | | | | — | |
Tandem Diabetes Care, Inc. | | | — | | | | 195,611,489 | | | | (2,756,601 | ) | | | 11,506 | | | | (2,538,329 | ) | | | 190,328,065 | | | | 4,686,729 | | | | — | | | | — | |
Tanger Factory Outlet Centers, Inc. | | | 127,881,154 | | | | 35,137,544 | | | | (31,196,564 | ) | | | 1,735,900 | | | | 15,730,256 | | | | 149,288,290 | | | | 7,605,109 | | | | 7,709,789 | | | | — | |
TechTarget, Inc. | | | 155,056,230 | | | | 27,787,119 | | | | (22,821,568 | ) | | | 395,852 | | | | (90,341,329 | ) | | | 70,076,304 | | | | 1,940,097 | | | | — | | | | — | |
Telephone & Data Systems, Inc. | | | 133,432,927 | | | | 28,828,471 | | | | (24,631,147 | ) | | | (4,846,811 | ) | | | (56,561,294 | ) | | | 76,222,146 | | | | 7,252,345 | | | | 5,325,298 | | | | — | |
| | |
SCHEDULES OF INVESTMENTS | | 41 |
| | |
Schedule of Investments (continued) March 31, 2023 | | iShares® Core S&P Small-Cap ETF |
Affiliates (continued)
| | | | | | | | | | | | | | | | | | | | | | | | | | | | | | | | | | | | |
| Affiliated Issuer | | Value at
03/31/22 | | | Purchases
at Cost | | | Proceeds
from Sale | | | Net
Realized
Gain (Loss) | | | Change in
Unrealized
Appreciation
(Depreciation) | | | Value at
03/31/23 | | | Shares
Held at
03/31/23 | | | Income | | | Capital
Gain
Distributions
from Underlying
Funds | |
Tennant Co. | | $ | 104,301,650 | | | $ | 21,142,973 | | | $ | (19,038,473 | ) | | $ | (1,707,063 | ) | | $ | (12,094,841 | ) | | $ | 92,604,246 | | | | 1,351,295 | | | $ | 1,417,304 | | | $ | — | |
Thryv Holdings, Inc.(i) | | | N/A | | | | 32,796,605 | | | | (21,970,716 | ) | | | 11,827,775 | | | | (15,870,566 | ) | | | 51,410,241 | | | | 2,229,412 | | | | — | | | | — | |
TimkenSteel Corp. | | | 64,404,568 | | | | 13,886,868 | | | | (14,283,329 | ) | | | 3,617,098 | | | | (14,736,515 | ) | | | 52,888,690 | | | | 2,883,789 | | | | — | | | | — | |
Titan International, Inc. | | | 53,931,214 | | | | 13,436,093 | | | | (11,709,938 | ) | | | 3,751,975 | | | | (20,538,364 | ) | | | 38,870,980 | | | | 3,709,063 | | | | — | | | | — | |
Tivity Health,
Inc.(b) | | | 102,231,306 | | | | 4,597,360 | | | | (107,819,062 | ) | | | 34,087,411 | | | | (33,097,015 | ) | | | — | | | | — | | | | — | | | | — | |
Tompkins Financial Corp. | | | 66,250,624 | | | | 14,508,818 | | | | (9,528,856 | ) | | | 351,376 | | | | (11,438,917 | ) | | | 60,143,045 | | | | 908,368 | | | | 2,099,018 | | | | — | |
Tredegar Corp. | | | 22,063,926 | | | | 4,501,562 | | | | (4,505,789 | ) | | | (2,275,958 | ) | | | (3,159,791 | ) | | | 16,623,950 | | | | 1,820,805 | | | | 950,482 | | | | — | |
TreeHouse Foods, Inc. | | | 128,739,659 | | | | 39,402,801 | | | | (52,317,978 | ) | | | 1,789,594 | | | | 67,634,276 | | | | 185,248,352 | | | | 3,673,376 | | | | — | | | | — | |
Tri Pointe Homes, Inc. | | | — | | | | 196,025,680 | | | | (132,557,714 | ) | | | 87,582,240 | | | | 34,907,647 | | | | 185,957,853 | | | | 7,344,307 | | | | — | | | | — | |
Trinity Industries, Inc. | | | — | | | | 159,185,507 | | | | (23,674,356 | ) | | | 1,742,149 | | | | 7,270,975 | | | | 144,524,275 | | | | 5,932,852 | | | | 2,951,755 | | | | — | |
Trinseo PLC | | | 133,136,232 | | | | 20,529,052 | | | | (26,469,130 | ) | | | (11,501,329 | ) | | | (62,709,762 | ) | | | 52,985,063 | | | | 2,541,250 | | | | 3,339,896 | | | | — | |
Triumph Financial,
Inc.(o) | | | 159,258,692 | | | | 14,724,392 | | | | (16,889,700 | ) | | | (2,868,649 | ) | | | (58,514,335 | ) | | | 95,710,400 | | | | 1,648,474 | | | | — | | | | — | |
Triumph Group, Inc. | | | 93,800,075 | | | | 10,248,971 | | | | (6,323,685 | ) | | | 450,914 | | | | (50,928,493 | ) | | | 47,247,782 | | | | 4,076,599 | | | | — | | | | — | |
TrueBlue, Inc. | | | 73,580,548 | | | | 12,150,898 | | | | (14,668,709 | ) | | | (3,211,860 | ) | | | (25,414,662 | ) | | | 42,436,215 | | | | 2,384,057 | | | | — | | | | — | |
Trupanion, Inc. | | | 218,695,578 | | | | 35,773,134 | | | | (27,808,258 | ) | | | (7,871,783 | ) | | | (109,151,066 | ) | | | 109,637,605 | | | | 2,556,251 | | | | — | | | | — | |
TrustCo Bank Corp. | | | 38,574,952 | | | | 2,504,040 | | | | — | | | | — | | | | (123,384 | ) | | | 40,955,608 | | | | 1,282,267 | | | | 1,742,513 | | | | — | |
Trustmark Corp. | | | 114,546,413 | | | | 8,087,875 | | | | — | | | | — | | | | (23,425,528 | ) | | | 99,208,760 | | | | 4,016,549 | | | | 3,559,217 | | | | — | |
TTM Technologies, Inc. | | | 110,982,608 | | | | 24,831,416 | | | | (24,567,598 | ) | | | 484,645 | | | | (11,537,644 | ) | | | 100,193,427 | | | | 7,427,237 | | | | — | | | | — | |
Tupperware Brands
Corp.(b) | | | 68,309,820 | | | | 4,974,081 | | | | (22,557,661 | ) | | | (43,292,638 | ) | | | (7,433,602 | ) | | | — | | | | — | | | | — | | | | — | |
Two Harbors Investment Corp. | | | 136,053,578 | | | | 46,393,515 | | | | (29,783,958 | ) | | | (2,715,454 | ) | | | (46,732,230 | ) | | | 103,215,451 | | | | 7,016,686 | | | | 12,187,345 | | | | — | |
U.S. Ecology, Inc.(b) | | | 107,128,388 | | | | 1,442,682 | | | | (108,839,944 | ) | | | 7,170,326 | | | | (6,901,452 | ) | | | — | | | | — | | | | — | | | | — | |
U.S. Physical Therapy, Inc. | | | 91,860,274 | | | | 22,565,365 | | | | (18,837,678 | ) | | | 2,159,044 | | | | (4,982,371 | ) | | | 92,764,634 | | | | 947,448 | | | | 1,597,619 | | | | — | |
U.S. Silica Holdings, Inc. | | | 99,876,624 | | | | 17,069,625 | | | | (15,317,185 | ) | | | 1,911,488 | | | | (37,858,958 | ) | | | 65,681,594 | | | | 5,500,971 | | | | — | | | | — | |
UFP Industries, Inc.(b) | | | 341,909,849 | | | | 72,972,500 | | | | (442,401,368 | ) | | | 169,131,979 | | | | (141,612,960 | ) | | | — | | | | — | | | | 3,389,361 | | | | — | |
Ultra Clean Holdings, Inc. | | | 136,152,483 | | | | 24,833,741 | | | | (20,585,082 | ) | | | 70,788 | | | | (30,821,161 | ) | | | 109,650,769 | | | | 3,306,718 | | | | — | | | | — | |
Unifi, Inc.(b) | | | 17,937,480 | | | | 2,060,898 | | | | (10,886,912 | ) | | | (17,680,113 | ) | | | 8,568,647 | | | | — | | | | — | | | | — | | | | — | |
UniFirst Corp. | | | 200,629,322 | | | | 47,100,291 | | | | (43,061,273 | ) | | | 2,279,886 | | | | (13,003,763 | ) | | | 193,944,463 | | | | 1,100,519 | | | | 1,370,191 | | | | — | |
uniQure NV | | | 46,786,302 | | | | 20,367,318 | | | | (11,260,036 | ) | | | (2,808,874 | ) | | | 7,203,313 | | | | 60,288,023 | | | | 2,993,447 | | | | — | | | | — | |
Unisys Corp.(b) | | | 103,901,420 | | | | 12,319,330 | | | | (25,990,263 | ) | | | (73,165,092 | ) | | | (17,065,395 | ) | | | — | | | | — | | | | — | | | | — | |
United Community Banks, Inc. | | | 254,860,619 | | | | 22,185,561 | | | | (903,310 | ) | | | (178,300 | ) | | | (52,213,983 | ) | | | 223,750,587 | | | | 7,956,991 | | | | 6,612,346 | | | | — | |
United Fire Group, Inc. | | | 47,725,571 | | | | 6,382,954 | | | | (3,875,392 | ) | | | 482,584 | | | | (7,986,890 | ) | | | 42,728,827 | | | | 1,609,372 | | | | 1,013,765 | | | | — | |
United Natural Foods, Inc. | | | 171,786,549 | | | | 39,836,675 | | | | (28,628,633 | ) | | | 8,817,275 | | | | (76,919,700 | ) | | | 114,892,166 | | | | 4,360,234 | | | | — | | | | — | |
Uniti Group, Inc. | | | 232,300,985 | | | | 33,809,755 | | | | (26,272,503 | ) | | | (8,818,464 | ) | | | (169,663,728 | ) | | | 61,356,045 | | | | 17,283,393 | | | | 10,369,710 | | | | — | |
Unitil Corp. | | | 57,003,513 | | | | 15,481,457 | | | | (13,788,798 | ) | | | 435,706 | | | | 7,512,631 | | | | 66,644,509 | | | | 1,168,382 | | | | 1,874,082 | | | | — | |
Universal Corp. | | | 102,545,813 | | | | 23,717,081 | | | | (22,385,585 | ) | | | 316,064 | | | | (9,815,558 | ) | | | 94,377,815 | | | | 1,784,417 | | | | 5,606,451 | | | | — | |
Universal Electronics, Inc.(b) | | | 29,321,395 | | | | 4,891,866 | | | | (13,740,005 | ) | | | (34,947,730 | ) | | | 14,474,474 | | | | — | | | | — | | | | — | | | | — | |
Universal Health Realty Income Trust | | | 53,217,155 | | | | 11,581,297 | | | | (11,465,604 | ) | | | (2,691,196 | ) | | | (6,239,345 | ) | | | 44,402,307 | | | | 922,933 | | | | 2,166,960 | | | | — | |
Universal Insurance Holdings, Inc. | | | 27,029,508 | | | | 2,487,530 | | | | (2,824,035 | ) | | | (248,554 | ) | | | 9,994,276 | | | | 36,438,725 | | | | 1,999,930 | | | | 1,555,855 | | | | — | |
Upbound Group, Inc.(p) | | | 108,999,473 | | | | 22,204,922 | | | | (36,131,597 | ) | | | (28,007,390 | ) | | | 22,416,435 | | | | 89,481,843 | | | | 3,650,830 | | | | 5,502,930 | | | | — | |
Urban Edge Properties | | | 150,439,087 | | | | 37,957,688 | | | | (26,915,287 | ) | | | (2,831,421 | ) | | | (30,087,124 | ) | | | 128,562,943 | | | | 8,536,716 | | | | 5,400,486 | | | | — | |
Urstadt Biddle Properties, Inc., Class A | | | 36,636,275 | | | | — | | | | (1,789,196 | ) | | | — | | | | (625,955 | ) | | | 34,221,124 | | | | 1,947,702 | | | | 1,871,469 | | | | — | |
Vanda Pharmaceuticals, Inc. | | | 45,100,344 | | | | 10,158,713 | | | | (7,896,451 | ) | | | (4,351,277 | ) | | | (14,904,124 | ) | | | 28,107,205 | | | | 4,139,500 | | | | — | | | | — | |
Varex Imaging Corp. | | | 60,217,722 | | | | 15,237,886 | | | | (12,815,665 | ) | | | (2,702,106 | ) | | | (6,938,634 | ) | | | 52,999,203 | | | | 2,913,645 | | | | — | | | | — | |
Vector Group Ltd. | | | 112,743,909 | | | | 25,347,711 | | | | (22,727,383 | ) | | | 2,406,935 | | | | (2,909,574 | ) | | | 114,861,598 | | | | 9,563,830 | | | | 7,796,398 | | | | — | |
Veeco Instruments, Inc. | | | 98,540,068 | | | | 18,755,842 | | | | (16,408,187 | ) | | | 3,907,694 | | | | (25,840,615 | ) | | | 78,954,802 | | | | 3,736,621 | | | | — | | | | — | |
Vera Bradley, Inc.(b) | | | 13,955,166 | | | | 240,570 | | | | (8,795,020 | ) | | | (11,624,937 | ) | | | 6,224,221 | | | | — | | | | — | | | | — | | | | — | |
Veradigm, Inc.(q) | | | 195,223,043 | | | | 24,105,308 | | | | (34,898,271 | ) | | | 1,495,983 | | | | (82,294,212 | ) | | | 103,631,851 | | | | 7,941,138 | | | | — | | | | — | |
Vericel Corp. | | | 128,020,145 | | | | 22,439,169 | | | | (19,542,724 | ) | | | (8,853,466 | ) | | | (21,165,146 | ) | | | 100,897,978 | | | | 3,441,268 | | | | — | | | | — | |
| | |
| 42 | | 2 0 2 3 I SHARES ANNUAL REPORT TO SHAREHOLDERS |
| | |
Schedule of Investments (continued) March 31, 2023 | | iShares® Core S&P Small-Cap ETF |
Affiliates (continued)
| | | | | | | | | | | | | | | | | | | | | | | | | | | | | | | | | | | | |
| Affiliated Issuer | | Value at
03/31/22 | | | Purchases
at Cost | | | Proceeds
from Sale | | | Net
Realized
Gain (Loss) | | | Change in
Unrealized
Appreciation
(Depreciation) | | | Value at
03/31/23 | | | Shares
Held at
03/31/23 | | | Income | | | Capital
Gain
Distributions
from Underlying
Funds | |
Veris Residential, Inc. | | $ | 99,880,230 | | | $ | 21,573,190 | | | $ | (20,817,999 | ) | | $ | (1,066,328 | ) | | $ | (15,035,537 | ) | | $ | 84,533,556 | | | | 5,774,150 | | | $ | — | | | $ | — | |
Veritex Holdings, Inc. | | | 134,887,513 | | | | 12,960,548 | | | | (6,357,625 | ) | | | 2,894,692 | | | | (75,945,297 | ) | | | 68,439,831 | | | | 3,748,074 | | | | 2,954,516 | | | | — | |
Veritiv Corp. | | | 132,495,898 | | | | 29,238,992 | | | | (30,697,680 | ) | | | 11,130,778 | | | | (9,711,463 | ) | | | 132,456,525 | | | | 980,143 | | | | 1,302,773 | | | | — | |
Verra Mobility Corp., Class A | | | — | | | | 184,793,832 | | | | (9,512,510 | ) | | | (155,584 | ) | | | (3,229,181 | ) | | | 171,896,557 | | | | 10,159,371 | | | | — | | | | — | |
Viad Corp. | | | 52,372,980 | | | | 11,372,852 | | | | (9,519,449 | ) | | | (3,178,061 | ) | | | (19,660,594 | ) | | | 31,387,728 | | | | 1,506,129 | | | | — | | | | — | |
Viasat, Inc. | | | — | | | | 195,637,282 | | | | (2,702,204 | ) | | | (27,035 | ) | | | (4,530,475 | ) | | | 188,377,568 | | | | 5,566,713 | | | | — | | | | — | |
Viavi Solutions, Inc. | | | 264,487,828 | | | | 48,804,324 | | | | (46,274,314 | ) | | | 1,339,169 | | | | (90,924,319 | ) | | | 177,432,688 | | | | 16,383,443 | | | | — | | | | — | |
Virtus Investment Partners, Inc. | | | 122,805,763 | | | | 22,793,773 | | | | (24,150,802 | ) | | | (2,566,100 | ) | | | (24,544,960 | ) | | | 94,337,674 | | | | 495,497 | | | | 3,206,873 | | | | — | |
Vista Outdoor, Inc. | | | 143,628,159 | | | | 28,258,918 | | | | (25,543,833 | ) | | | 4,042,176 | | | | (36,422,697 | ) | | | 113,962,723 | | | | 4,112,693 | | | | — | | | | — | |
Vital Energy, Inc.(r) | | | 81,468,140 | | | | 30,844,673 | | | | (15,507,944 | ) | | | (8,845,432 | ) | | | (32,321,762 | ) | | | 55,637,675 | | | | 1,221,732 | | | | — | | | | — | |
Wabash National Corp. | | | 51,999,241 | | | | 17,010,510 | | | | (17,301,526 | ) | | | 720,644 | | | | 32,995,881 | | | | 85,424,750 | | | | 3,473,963 | | | | 1,125,156 | | | | — | |
Walker & Dunlop, Inc. | | | 273,111,920 | | | | 53,363,616 | | | | (38,541,845 | ) | | | 6,217,118 | | | | (124,100,141 | ) | | | 170,050,668 | | | | 2,232,515 | | | | 5,474,779 | | | | — | |
Washington Federal, Inc. | | | — | | | | 118,912,720 | | | | — | | | | — | | | | (36,670 | ) | | | 118,876,050 | | | | 3,946,748 | | | | — | | | | — | |
WD-40 Co. | | | 179,528,754 | | | | 39,793,978 | | | | (37,281,150 | ) | | | 1,322,289 | | | | (7,022,439 | ) | | | 176,341,432 | | | | 990,404 | | | | 3,138,174 | | | | — | |
Westamerica BanCorp | | | 106,501,356 | | | | 9,241,555 | | | | — | | | | — | | | | (30,254,454 | ) | | | 85,488,457 | | | | 1,929,762 | | | | 3,080,108 | | | | — | |
Whitestone REIT | | | 43,783,817 | | | | 8,446,309 | | | | (9,110,027 | ) | | | (251,724 | ) | | | (11,961,877 | ) | | | 30,906,498 | | | | 3,359,402 | | | | 1,700,308 | | | | — | |
Winnebago Industries, Inc. | | | 128,875,490 | | | | 31,281,228 | | | | (38,161,921 | ) | | | 1,727,411 | | | | 4,711,818 | | | | 128,434,026 | | | | 2,225,893 | | | | 2,117,910 | | | | — | |
WisdomTree, Inc.(s) | | | 45,910,215 | | | | 6,961,322 | | | | (5,269,862 | ) | | | (396,308 | ) | | | 735,756 | | | | 47,941,123 | | | | 8,181,079 | | | | 975,158 | | | | — | |
Wolverine World Wide, Inc. | | | 132,926,995 | | | | 25,531,032 | | | | (27,188,598 | ) | | | (10,643,473 | ) | | | (23,044,083 | ) | | | 97,581,873 | | | | 5,723,277 | | | | 2,300,647 | | | | — | |
World Fuel Services Corp. | | | 122,548,498 | | | | 26,729,131 | | | | (26,802,178 | ) | | | (3,855,268 | ) | | | (3,631,309 | ) | | | 114,988,874 | | | | 4,500,543 | | | | 1,808,531 | | | | — | |
WSFS Financial Corp. | | | 193,477,522 | | | | 8,533,208 | | | | (5,287,841 | ) | | | (1,056,555 | ) | | | (35,774,377 | ) | | | 159,891,957 | | | | 4,251,315 | | | | 2,470,845 | | | | — | |
WW International, Inc.(b) | | | 39,112,420 | | | | 5,586,527 | | | | (21,698,487 | ) | | | (62,699,326 | ) | | | 39,698,866 | | | | — | | | | — | | | | — | | | | — | |
Xencor, Inc. | | | 111,628,239 | | | | 29,445,208 | | | | (22,795,961 | ) | | | (5,050,959 | ) | | | 8,574,988 | | | | 121,801,515 | | | | 4,367,211 | | | | — | | | | — | |
Xenia Hotels & Resorts, Inc. | | | 157,588,903 | | | | 26,937,658 | | | | (26,886,987 | ) | | | (1,976,755 | ) | | | (46,172,928 | ) | | | 109,489,891 | | | | 8,364,392 | | | | 2,516,512 | | | | — | |
XPEL, Inc.(i) | | | N/A | | | | 32,972,288 | | | | (38,245,351 | ) | | | 20,818,367 | | | | 7,023,811 | | | | 96,821,615 | | | | 1,424,895 | | | | — | | | | — | |
Xperi, Inc. | | | — | | | | 166,538,459 | | | | (79,914,749 | ) | | | (4,466,522 | ) | | | (48,919,419 | ) | | | 33,237,769 | | | | 3,040,967 | | | | — | | | | — | |
Yelp, Inc. | | | — | | | | 169,862,275 | | | | (25,340,087 | ) | | | 1,561,593 | | | | 9,503,880 | | | | 155,587,661 | | | | 5,068,002 | | | | — | | | | — | |
Zimvie, Inc.(b) | | | 34,275,851 | | | | 5,279,127 | | | | (14,277,169 | ) | | | (29,294,344 | ) | | | 4,016,535 | | | | — | | | | — | | | | — | | | | — | |
Zumiez, Inc. | | | 53,421,286 | | | | 8,504,169 | | | | (15,075,791 | ) | | | (4,423,193 | ) | | | (21,619,033 | ) | | | 20,807,438 | | | | 1,128,386 | | | | — | | | | — | |
| | | | | | | | | | | | | | | | | | | | | | | | | | | | | | | | | | | | |
| | | | | | | | | | | | | | $ | 1,554,758,817 | | | $ | (7,948,624,486 | ) | | $ | 65,754,443,738 | | | | | | | $ | 1,078,629,250 | | | $ | 976 | |
| | | | | | | | | | | | | | | | | | | | | | | | | | | | | | | | | | | | |
| | (a) | Formerly the Xperi Holding Corp. | |
| | (b) | As of period end, the entity is no longer held. | |
| | (c) | As of period end, the entity was not considered an affiliate. | |
| | (d) | Formerly the Realogy Holdings Corp. | |
| | (e) | Formerly the Allegheny Technologies, Inc. | |
| | (f) | Formerly the Blucora, Inc. | |
| | (g) | Represents net amount purchased (sold). | |
| | (h) | All or a portion represents securities lending income earned from the reinvestment of cash collateral from loaned securities, net of fees and collateral investment expenses, and other payments to and from borrowers of securities. | |
| | (i) | As of the beginning of the period, the entity was not considered an affiliate. | |
| | (j) | Formerly the Washington Real Estate Investment Trust. | |
| | (k) | Formerly the Schweitzer-Mauduit International, Inc. | |
| | (l) | Formerly the Meta Financial Group, Inc. | |
| | (m) | Formerly the MEDNAX, Inc. | |
| | (n) | Formerly the SPX Corp. | |
| | (o) | Formerly the Triumph Bancorp, Inc. | |
| | (p) | Formerly the Rent-A-Center, Inc. | |
| | (q) | Formerly the Allscripts Healthcare Solutions, Inc. | |
| | (r) | Formerly the Laredo Petroleum, Inc. | |
| | (s) | Formerly the WisdomTree Investments, Inc. | |
| | |
SCHEDULES OF INVESTMENTS | | 43 |
| | |
Schedule of Investments (continued) March 31, 2023 | | iShares® Core S&P Small-Cap ETF |
Derivative Financial Instruments Outstanding as of Period End
Futures Contracts
| | | | | | | | | | | | | | | | |
| | | | | |
| Description | | Number of
Contracts | | | Expiration
Date | | | Notional
Amount
(000) | | | Value/
Unrealized
Appreciation
(Depreciation) | |
| | | | |
Long Contracts | | | | | | | | | | | | | | | | |
Russel 2000 E-Mini Index | | | 3,160 | | | | 06/16/23 | | | $ | 286,533 | | | $ | 7,097,042 | |
| | | | | | | | | | | | | | | | |
OTC Total Return Swaps
| | | | | | | | | | | | | | | | | | | | | | | | | | | | |
| | | |
| | | | | | | | |
| | | Reference Entity | | Payment
Frequency | | Counterparty(a) | | | Termination
Date | | | Net Notional | | | Accrued
Unrealized
Appreciation
(Depreciation) | | | Net Value of
Reference Entity | | | Gross Notional
Amount
Net Asset
Percentage | |
| | | |
| | Equity Securities Long/Short | | Monthly | | | Goldman Sachs Bank USA(b) | | | | 08/19/26 | | | $ | 229,671,549 | | | $ | 6,460,668 | (c) | | $ | 236,226,572 | | | | 0.3% | |
| | | | Monthly | | | HSBC Bank PLC(d) | | | | 02/10/28 | | | | 472,657,434 | | | | (29,074,107 | )(e) | | | 444,493,468 | | | | 0.7 | |
| | | | Monthly | | | JPMorgan Chase Bank NA(f) | | | | 02/08/24 | | | | 380,751,642 | | | | (1,233,424 | )(g) | | | 380,300,874 | | | | 0.6 | |
| | | | | | | | | | | | | | | | | | | | | | | | | | | | |
| | | | | | | | |
| | | | | | | | | | | | | | | | | | $ | (23,846,863 | ) | | $ | 1,061,020,914 | | | | | |
| | | | | | | | | | | | | | | | | | | | | | | | | | | | |
| | (a) | The Fund receives the total return on a portfolio of long positions underlying the total return swap. The Fund pays the total return on a portfolio of short positions underlying the total return swap. In addition, the Fund pays or receives a variable rate of interest, based on a specified benchmark. The benchmark and spread are determined based upon the country and/or currency of the individual underlying positions. | |
| | (c) | Amount includes $(94,355) of net dividends, payable for referenced securities purchased and financing fees. | |
| | (e) | Amount includes $(910,141) of net dividends, payable for referenced securities purchased and financing fees. | |
| | (g) | Amount includes $(782,656) of net dividends, payable for referenced securities purchased and financing fees. | |
The following are the specified benchmarks (plus or minus a range) used in determining the variable rate of interest:
| | | | | | | | |
| | (b) | | (d) | | (f) | | |
Range: | | 40 basis points | | 40 basis points | | 40 basis points | | |
Benchmarks: | | USD - 1D Overnight Fed Funds Effective Rate | | USD - 1D Overnight Bank Funding Rate | | USD - 1D Overnight Bank Funding Rate | | |
| | (FEDL01) | | (OBFR01) | | (OBFR01) | | |
The following table represents the individual long positions and related values of the equity securities underlying the total return swap with Goldman Sachs Bank USA as of period end, termination date August 19, 2026.
| | | | | | | | | | | | | | | | |
| |
| | | |
| | | Shares | | | Value | | | % of
Basket
Value | |
| |
| | | | |
Reference Entity — Long | | | | | | | | | | | | | | | | |
| | | | |
| Common Stocks | | | | | | | | | | | | |
| | | | |
| Aerospace & Defense | | | | | | | | | | | | |
Triumph Group, Inc. | | | 541,664 | | | $ | 6,277,886 | | | | | | | | 2.7 | % |
| | | | | | | | | | | | | | | | |
| | | | |
| Banks | | | | | | | | | | | | |
Bancorp, Inc. | | | 82,356 | | | | 2,293,615 | | | | | | | | 1.0 | |
BankUnited, Inc. | | | 202,957 | | | | 4,582,769 | | | | | | | | 1.9 | |
Banner Corp. | | | 35,433 | | | | 1,926,492 | | | | | | | | 0.8 | |
Berkshire Hills Bancorp, Inc. | | | 71,046 | | | | 1,780,413 | | | | | | | | 0.8 | |
Brookline Bancorp, Inc. | | | 223,843 | | | | 2,350,352 | | | | | | | | 1.0 | |
Central Pacific Financial Corp. | | | 108,720 | | | | 1,946,088 | | | | | | | | 0.8 | |
City Holding Co. | | | 62,561 | | | | 5,685,544 | | | | | | | | 2.4 | |
Community Bank System, Inc. | | | 153,971 | | | | 8,081,938 | | | | | | | | 3.4 | |
First Financial Bancorp | | | 148,909 | | | | 3,241,749 | | | | | | | | 1.4 | |
Hanmi Financial Corp. | | | 54,391 | | | | 1,010,041 | | | | | | | | 0.4 | |
Hilltop Holdings, Inc. | | | 23,821 | | | | 706,769 | | | | | | | | 0.3 | |
| | | | | | | | | | | | | | | | |
| |
| | | |
| | | Shares | | | Value | | | % of Basket
Value | |
| |
| | | | |
| Banks (continued) | | | | | | | | | | | | |
Hope Bancorp, Inc. | | | 211,207 | | | $ | 2,074,053 | | | | | | | | 0.9 | % |
NBT Bancorp, Inc. | | | 20,084 | | | | 677,032 | | | | | | | | 0.3 | |
Northwest Bancshares, Inc. | | | 543,185 | | | | 6,534,516 | | | | | | | | 2.8 | |
Pacific Premier Bancorp, Inc. | | | 277,468 | | | | 6,664,781 | | | | | | | | 2.8 | |
Pathward Financial, Inc. | | | 34,800 | | | | 1,443,852 | | | | | | | | 0.6 | |
Preferred Bank | | | 32,639 | | | | 1,788,944 | | | | | | | | 0.8 | |
Provident Financial Services, Inc. | | | 201,258 | | | | 3,860,128 | | | | | | | | 1.6 | |
Renasant Corp. | | | 3,211 | | | | 98,192 | | | | | | | | 0.0 | |
S&T Bancorp, Inc. | | | 37,801 | | | | 1,188,841 | | | | | | | | 0.5 | |
Simmons First National Corp., Class A | | | 206,805 | | | | 3,617,019 | | | | | | | | 1.5 | |
TrustCo Bank Corp. | | | 54,564 | | | | 1,742,774 | | | | | | | | 0.7 | |
Trustmark Corp. | | | 170,656 | | | | 4,215,203 | | | | | | | | 1.8 | |
United Community Banks, Inc. | | | 45,836 | | | | 1,288,908 | | | | | | | | 0.6 | |
Westamerica BanCorp | | | 14,418 | | | | 638,717 | | | | | | | | 0.3 | |
WSFS Financial Corp. | | | 162,245 | | | | 6,102,035 | | | | | | | | 2.6 | |
| | | | | | | | | | | | | | | | |
| | | | |
| | | | | | | 75,540,765 | | | | | | | | | |
| | | | |
| Commercial Services & Supplies | | | | | | | | | | | | |
Pitney Bowes, Inc. | | | 3,524,141 | | | | 13,708,908 | | | | | | | | 5.8 | |
| | | | | | | | | | | | | | | | |
| | | | |
| Communications Equipment | | | | | | | | | | | | |
Extreme Networks, Inc. | | | 2,371,399 | | | | 45,341,149 | | | | | | | | 19.2 | |
| | | | | | | | | | | | | | | | |
| | |
| 44 | | 2 0 2 3 I SHARES ANNUAL REPORT TO SHAREHOLDERS |
| | |
Schedule of Investments (continued) March 31, 2023 | | iShares® Core S&P Small-Cap ETF |
| | | | | | | | | | | | |
| | | Shares | | | Value | | | % of
Basket
Value | |
| | | |
| Health Care Providers & Services | | | | | | | | | |
RadNet, Inc. | | | 754,117 | | | $ | 18,875,548 | | | | 8.0 | % |
| | | | | | | | | | | | |
| | | |
| Insurance | | | | | | | | | |
Ambac Financial Group, Inc. | | | 141,562 | | | | 2,191,380 | | | | 0.9 | |
Employers Holdings, Inc. | | | 32,977 | | | | 1,374,811 | | | | 0.6 | |
Genworth Financial, Inc., Class A | | | 688,711 | | | | 3,457,329 | | | | 1.4 | |
Horace Mann Educators Corp. | | | 34,203 | | | | 1,145,117 | | | | 0.5 | |
ProAssurance Corp. | | | 141,836 | | | | 2,621,129 | | | | 1.1 | |
Safety Insurance Group, Inc. | | | 28,186 | | | | 2,100,421 | | | | 0.9 | |
United Fire Group, Inc. | | | 7,057 | | | | 187,363 | | | | 0.1 | |
| | | | | | | | | | | | |
| | | |
| | | | | | | 13,077,550 | | | | | |
| | | |
| Metals & Mining | | | | | | | | | |
Warrior Met Coal, Inc. | | | 44,878 | | | | 1,647,471 | | | | 0.7 | |
| | | | | | | | | | | | |
| | | |
| Oil, Gas & Consumable Fuels | | | | | | | | | |
Par Pacific Holdings, Inc. | | | 474,661 | | | | 13,860,101 | | | | 5.9 | |
| | | | | | | | | | | | |
| | | |
| Residential REITs | | | | | | | | | |
NexPoint Residential Trust, Inc. | | | 172,880 | | | | 7,549,670 | | | | 3.2 | |
| | | | | | | | | | | | |
| | | |
| Retail REITs | | | | | | | | | |
Getty Realty Corp. | | | 127,605 | | | | 4,597,608 | | | | 1.9 | |
SITE Centers Corp. | | | 1,468,747 | | | | 18,036,213 | | | | 7.6 | |
Urstadt Biddle Properties, Inc., Class A | | | 76,778 | | | | 1,348,990 | | | | 0.6 | |
| | | | | | | | | | | | |
| | | |
| | | | | | | 23,982,811 | | | | | |
| | | |
| Software | | | | | | | | | |
Adeia, Inc. | | | 123,069 | | | | 1,090,391 | | | | 0.5 | |
| | | | | | | | | | | | |
| | | |
| Specialized REITs | | | | | | | | | |
Outfront Media, Inc. | | | 745,908 | | | | 12,106,087 | | | | 5.1 | |
| | | | | | | | | | | | |
| | | |
| Water Utilities | | | | | | | | | |
Middlesex Water Co. | | | 40,556 | | | | 3,168,235 | | | | 1.3 | |
| | | | | | | | | | | | |
| | | |
Net Value of Reference Entity —
Goldman Sachs Bank USA | | | | | | $ | 236,226,572 | | | | | |
| | | | | | | | | | | | |
The following table represents the individual long positions and related values of the equity securities underlying the total return swap with HSBC Bank PLC as of period end, termination date February 10, 2028.
| | | | | | | | | | | | |
| | | Shares | | | Value | | | % of
Basket
Value | |
| | | |
Reference Entity — Long | | | | | | | | | | | | |
| | | |
| Common Stocks | | | | | | | | | |
| | | |
| Aerospace & Defense | | | | | | | | | |
Triumph Group, Inc. | | | 119,676 | | | $ | 1,387,045 | | | | 0.3 | % |
| | | | | | | | | | | | |
| | | |
| Banks | | | | | | | | | |
Atlantic Union Bankshares Corp. | | | 860,736 | | | | 30,168,797 | | | | 6.8 | |
BankUnited, Inc. | | | 56,480 | | | | 1,275,318 | | | | 0.3 | |
Banner Corp. | | | 42,334 | | | | 2,301,700 | | | | 0.5 | |
Berkshire Hills Bancorp, Inc. | | | 71,396 | | | | 1,789,184 | | | | 0.4 | |
Brookline Bancorp, Inc. | | | 293,602 | | | | 3,082,821 | | | | 0.7 | |
City Holding Co. | | | 1,848 | | | | 167,946 | | | | 0.0 | |
Community Bank System, Inc. | | | 22,002 | | | | 1,154,885 | | | | 0.3 | |
Customers Bancorp, Inc. | | | 26,537 | | | | 491,465 | | | | 0.1 | |
First Bancorp/Southern Pines NC | | | 104,588 | | | | 3,714,966 | | | | 0.8 | |
| | | | | | | | | | | | |
| | | Shares | | | Value | | | % of
Basket
Value | |
| | | |
| Banks (continued) | | | | | | | | | |
First Commonwealth Financial Corp. | | | 367,765 | | | $ | 4,571,319 | | | | 1.0 | % |
First Financial Bancorp | | | 218,057 | | | | 4,747,101 | | | | 1.1 | |
Hanmi Financial Corp. | | | 82,618 | | | | 1,534,216 | | | | 0.3 | |
Heritage Financial Corp. | | | 40,618 | | | | 869,225 | | | | 0.2 | |
Hope Bancorp, Inc. | | | 230,536 | | | | 2,263,864 | | | | 0.5 | |
NBT Bancorp, Inc. | | | 129,604 | | | | 4,368,951 | | | | 1.0 | |
Northwest Bancshares, Inc. | | | 6,512 | | | | 78,339 | | | | 0.0 | |
OFG Bancorp | | | 139,463 | | | | 3,478,207 | | | | 0.8 | |
Preferred Bank | | | 264,460 | | | | 14,495,053 | | | | 3.3 | |
Provident Financial Services, Inc. | | | 69,459 | | | | 1,332,224 | | | | 0.3 | |
Renasant Corp. | | | 180,804 | | | | 5,528,986 | | | | 1.2 | |
S&T Bancorp, Inc. | | | 45,701 | | | | 1,437,297 | | | | 0.3 | |
Simmons First National Corp., Class A | | | 267,682 | | | | 4,681,758 | | | | 1.1 | |
TrustCo Bank Corp. | | | 38,026 | | | | 1,214,550 | | | | 0.3 | |
Trustmark Corp. | | | 258,243 | | | | 6,378,602 | | | | 1.4 | |
United Community Banks, Inc. | | | 376,658 | | | | 10,591,623 | | | | 2.4 | |
Washington Federal, Inc. | | | 822,169 | | | | 24,763,730 | | | | 5.6 | |
Westamerica BanCorp | | | 17,845 | | | | 790,534 | | | | 0.2 | |
WSFS Financial Corp. | | | 76,512 | | | | 2,877,616 | | | | 0.6 | |
| | | | | | | | | | | | |
| | | |
| | | | | | | 140,150,277 | | | | | |
| | | |
| Commercial Services & Supplies | | | | | | | | | |
Pitney Bowes, Inc. | | | 470,415 | | | | 1,829,914 | | | | 0.4 | |
| | | | | | | | | | | | |
| | | |
| Consumer Finance | | | | | | | | | |
Bread Financial Holdings, Inc. | | | 1,905,247 | | | | 57,767,089 | | | | 13.0 | |
| | | | | | | | | | | | |
|
| Diversified Telecommunication Services | |
Lumen Technologies, Inc. | | | 20,115,198 | | | | 53,305,275 | | | | 12.0 | |
| | | | | | | | | | | | |
| | | |
| Financial Services | | | | | | | | | |
Mr. Cooper Group, Inc. | | | 342,055 | | | | 14,013,993 | | | | 3.2 | |
| | | | | | | | | | | | |
| | | |
| Gas Utilities | | | | | | | | | |
Chesapeake Utilities Corp. | | | 133,358 | | | | 17,068,491 | | | | 3.8 | |
| | | | | | | | | | | | |
| | | |
| Hotel & Resort REITs | | | | | | | | | |
Pebblebrook Hotel Trust | | | 1,692,931 | | | | 23,768,751 | | | | 5.3 | |
| | | | | | | | | | | | |
| | | |
| Insurance | | | | | | | | | |
Ambac Financial Group, Inc. | | | 229,674 | | | | 3,555,353 | | | | 0.8 | |
Employers Holdings, Inc. | | | 216,495 | | | | 9,025,677 | | | | 2.0 | |
Genworth Financial, Inc., Class A | | | 1,849,410 | | | | 9,284,038 | | | | 2.1 | |
Horace Mann Educators Corp. | | | 215,606 | | | | 7,218,489 | | | | 1.6 | |
James River Group Holdings Ltd. | | | 118,051 | | | | 2,437,753 | | | | 0.6 | |
ProAssurance Corp. | | | 266,656 | | | | 4,927,803 | | | | 1.1 | |
Safety Insurance Group, Inc. | | | 40,567 | | | | 3,023,053 | | | | 0.7 | |
Stewart Information Services Corp. | | | 91,175 | | | | 3,678,911 | | | | 0.8 | |
| | | | | | | | | | | | |
| | | |
| | | | | | | 43,151,077 | | | | | |
| | | |
| Metals & Mining | | | | | | | | | |
Arconic Corp. | | | 6,219 | | | | 163,124 | | | | 0.0 | |
Warrior Met Coal, Inc. | | | 138,442 | | | | 5,082,206 | | | | 1.2 | |
| | | | | | | | | | | | |
| | | |
| | | | | | | 5,245,330 | | | | | |
| | | |
| Multi-Utilities | | | | | | | | | |
Avista Corp. | | | 71,091 | | | | 3,017,813 | | | | 0.7 | |
| | | | | | | | | | | | |
| | | |
| Office REITs | | | | | | | | | |
Easterly Government Properties, Inc. | | | 209,620 | | | | 2,880,179 | | | | 0.6 | |
SL Green Realty Corp. | | | 1,167,298 | | | | 27,454,849 | | | | 6.2 | |
| | | | | | | | | | | | |
| | | |
| | | | | | | 30,335,028 | | | | | |
| | |
SCHEDULES OF INVESTMENTS | | 45 |
| | |
Schedule of Investments (continued) March 31, 2023 | | iShares® Core S&P Small-Cap ETF |
| | | | | | | | | | | | |
| | | Shares | | | Value | | | % of
Basket
Value | |
| | | |
| Oil, Gas & Consumable Fuels | | | | | | | | | |
Green Plains, Inc. | | | 666,937 | | | $ | 20,668,378 | | | | 4.7 | % |
Par Pacific Holdings, Inc. | | | 229,278 | | | | 6,694,917 | | | | 1.5 | |
| | | | | | | | | | | | |
| | | |
| | | | | | | 27,363,295 | | | | | |
|
| Retail REITs | |
SITE Centers Corp. | | | 1,052,703 | | | | 12,927,193 | | | | 2.9 | |
Urstadt Biddle Properties, Inc., Class A | | | 103,941 | | | | 1,826,243 | | | | 0.4 | |
| | | | | | | | | | | | |
| | | |
| | | | | | | 14,753,436 | | | | | |
|
| Software | |
Adeia, Inc. | | | 435,896 | | | | 3,862,039 | | | | 0.9 | |
| | | | | | | | | | | | |
| | | |
| Specialized REITs | | | | | | | | | |
Outfront Media, Inc. | | | 22,017 | | | | 357,336 | | | | 0.1 | |
| | | | | | | | | | | | |
| | | |
| Water Utilities | | | | | | | | | |
Middlesex Water Co. | | | 91,107 | | | | 7,117,279 | | | | 1.6 | |
| | | | | | | | | | | | |
| | | |
Net Value of Reference Entity —
HSBC Bank PLC | | | | | | $ | 444,493,468 | | | | | |
| | | | | | | | | | | | |
The following table represents the individual long positions and related values of the equity securities underlying the total return swap with JPMorgan Chase Bank NA as of period end, termination date February 8, 2024.
| | | | | | | | | | | | |
| | | Shares | | | Value | | | % of
Basket
Value | |
|
Reference Entity — Long | |
|
| Common Stocks | |
|
| Banks | |
Banner Corp. | | | 4,625 | | | $ | 251,461 | | | | 0.1 | % |
Central Pacific Financial Corp. | | | 279,285 | | | | 4,999,202 | | | | 1.3 | |
Community Bank System, Inc. | | | 40,018 | | | | 2,100,545 | | | | 0.6 | |
Customers Bancorp, Inc. | | | 43,914 | | | | 813,287 | | | | 0.2 | |
Eagle Bancorp, Inc. | | | 56,958 | | | | 1,906,384 | | | | 0.5 | |
First BanCorp/Puerto Rico | | | 460,644 | | | | 5,260,554 | | | | 1.4 | |
Hope Bancorp, Inc. | | | 127,539 | | | | 1,252,433 | | | | 0.3 | |
Independent Bank Corp. | | | 185,867 | | | | 12,196,593 | | | | 3.2 | |
National Bank Holdings Corp., Class A | | | 26,557 | | | | 888,597 | | | | 0.2 | |
Preferred Bank | | | 49,950 | | | | 2,737,760 | | | | 0.7 | |
Seacoast Banking Corp. of Florida | | | 407,507 | | | | 9,657,916 | | | | 2.6 | |
TrustCo Bank Corp. | | | 11,760 | | | | 375,614 | | | | 0.1 | |
| | | | | | | | | | | | |
| | | Shares | | | Value | | | % of
Basket
Value | |
| | | |
| Banks (continued) | | | | | | | | | |
Veritex Holdings, Inc. | | | 190,848 | | | $ | 3,484,884 | | | | 0.9 | % |
WSFS Financial Corp. | | | 1,596 | | | | 60,026 | | | | 0.0 | |
| | | | | | | | | | | | |
| | | |
| | | | | | | 45,985,256 | | | | | |
| | | |
| Communications Equipment | | | | | | | | | |
Extreme Networks, Inc. | | | 1,207,729 | | | | 23,091,778 | | | | 6.1 | |
| | | | | | | | | | | | |
| | | |
| Electronic Equipment, Instruments & Components | | | | | | | | | |
ScanSource, Inc. | | | 20,000 | | | | 608,800 | | | | 0.2 | |
| | | | | | | | | | | | |
| | | |
| Financial Services | | | | | | | | | |
Radian Group, Inc. | | | 8,910,060 | | | | 196,912,326 | | | | 51.8 | |
| | | | | | | | | | | | |
| | | |
| Health Care Providers & Services | | | | | | | | | |
RadNet, Inc. | | | 322,653 | | | | 8,076,004 | | | | 2.1 | |
| | | | | | | | | | | | |
| | | |
| Insurance | | | | | | | | | |
Ambac Financial Group, Inc. | | | 688,752 | | | | 10,661,881 | | | | 2.8 | |
Genworth Financial, Inc., Class A | | | 2,541,895 | | | | 12,760,313 | | | | 3.4 | |
| | | | | | | | | | | | |
| | | |
| | | | | | | 23,422,194 | | | | | |
| | | |
| Metals & Mining | | | | | | | | | |
Warrior Met Coal, Inc. | | | 1,112,139 | | | | 40,826,623 | | | | 10.7 | |
| | | | | | | | | | | | |
| | | |
| Office REITs | | | | | | | | | |
Easterly Government Properties, Inc. | | | 124,603 | | | | 1,712,045 | | | | 0.4 | |
| | | | | | | | | | | | |
| | | |
| Oil, Gas & Consumable Fuels | | | | | | | | | |
Par Pacific Holdings, Inc. | | | 453,028 | | | | 13,228,418 | | | | 3.5 | |
| | | | | | | | | | | | |
| | | |
| Residential REITs | | | | | | | | | |
NexPoint Residential Trust, Inc. | | | 114,148 | | | | 4,984,843 | | | | 1.3 | |
| | | | | | | | | | | | |
| | | |
| Retail REITs | | | | | | | | | |
Acadia Realty Trust | | | 43,472 | | | | 606,435 | | | | 0.1 | |
Getty Realty Corp. | | | 10,077 | | | | 363,074 | | | | 0.1 | |
SITE Centers Corp. | | | 1,578,762 | | | | 19,387,197 | | | | 5.1 | |
| | | | | | | | | | | | |
| | | |
| | | | | | | 20,356,706 | | | | | |
| | | |
| Software | | | | | | | | | |
Adeia, Inc. | | | 100,602 | | | | 891,334 | | | | 0.2 | |
| | | | | | | | | | | | |
| | | |
| Specialized REITs | | | | | | | | | |
Outfront Media, Inc. | | | 12,603 | | | | 204,547 | | | | 0.1 | |
| | | | | | | | | | | | |
| | | |
Net Value of Reference Entity —
JPMorgan Chase Bank NA | | | | | | $ | 380,300,874 | | | | | |
| | | | | | | | | | | | |
Balances Reported in the Statements of Assets and Liabilities for OTC Swaps
| | | | | | | | | | | | | | | | |
| Description | | Swap
Premiums
Paid | | | Swap
Premiums
Received | | | Unrealized
Appreciation | | | Unrealized
Depreciation | |
| | | | |
OTC Swaps | | $ | — | | | $ | — | | | $ | 6,460,668 | | | $ | (30,307,531 | ) |
| | |
| 46 | | 2 0 2 3 I SHARES ANNUAL REPORT TO SHAREHOLDERS |
| | |
Schedule of Investments (continued) March 31, 2023 | | iShares® Core S&P Small-Cap ETF |
Derivative Financial Instruments Categorized by Risk Exposure
As of period end, the fair values of derivative financial instruments located in the Statements of Assets and Liabilities were as follows:
| | | | | | | | | | | | | | | | | | | | | | | | | | | | |
| | | Commodity
Contracts | | | Credit
Contracts | | | Equity
Contracts | | | Foreign
Currency
Exchange
Contracts | | | Interest
Rate
Contracts | | | Other
Contracts | | | Total | |
| | | | | | | |
Assets — Derivative Financial Instruments | | | | | | | | | | | | | | | | | | | | | | | | | | | | |
Futures contracts | | | | | | | | | | | | | | | | | | | | | | | | | | | | |
Unrealized appreciation on futures contracts(a) | | $ | — | | | $ | — | | | $ | 7,097,042 | | | $ | — | | | $ | — | | | $ | — | | | $ | 7,097,042 | |
Swaps — OTC | | | | | | | | | | | | | | | | | | | | | | | | | | | | |
Unrealized appreciation on OTC swaps; Swap premiums paid | | | — | | | | — | | | | 6,460,668 | | | | — | | | | — | | | | — | | | | 6,460,668 | |
| | | | | | | | | | | | | | | | | | | | | | | | | | | | |
| | $ | — | | | $ | — | | | $ | 13,557,710 | | | $ | — | | | $ | — | | | $ | — | | | $ | 13,557,710 | |
| | | | | | | | | | | | | | | | | | | | | | | | | | | | |
Liabilities — Derivative Financial Instruments | | | | | | | | | | | | | | | | | | | | | | | | | | | | |
Swaps — OTC | | | | | | | | | | | | | | | | | | | | | | | | | | | | |
Unrealized depreciation on OTC swaps; Swap premiums received | | $ | — | | | $ | — | | | $ | 30,307,531 | | | $ | — | | | $ | — | | | $ | — | | | $ | 30,307,531 | |
| | | | | | | | | | | | | | | | | | | | | | | | | | | | |
| | (a) | Net cumulative unrealized appreciation (depreciation) on futures contracts, if any, are reported in the Schedule of Investments. In the Statements of Assets and Liabilities, only current day’s variation margin is reported in receivables or payables and the net cumulative unrealized appreciation (depreciation) is included in accumulated earnings (loss). | |
For the period ended March 31, 2023, the effect of derivative financial instruments in the Statements of Operations was as follows:
| | | | | | | | | | | | | | | | | | | | | | | | | | | | |
| | | Commodity
Contracts | | | Credit
Contracts | | | Equity
Contracts | | | Foreign
Currency
Exchange
Contracts | | | Interest
Rate
Contracts | | | Other
Contracts | | | Total | |
Net Realized Gain (Loss) from | | | | | | | | | | | | | | | | | | | | | | | | | | | | |
Futures contracts | | $ | — | | | $ | — | | | $ | (12,826,306 | ) | | $ | — | | | $ | — | | | $ | — | | | $ | (12,826,306 | ) |
Swaps | | | — | | | | — | | | | (144,078,571 | ) | | | — | | | | — | | | | — | | | | (144,078,571 | ) |
| | | | | | | | | | | | | | | | | | | | | | | | | | | | |
| | $ | — | | | $ | — | | | $ | (156,904,877 | ) | | $ | — | | | $ | — | | | $ | — | | | $ | (156,904,877 | ) |
| | | | | | | | | | | | | | | | | | | | | | | | | | | | |
| | | | | | | |
Net Change in Unrealized Appreciation
(Depreciation) on | | | | | | | | | | | | | | | | | | | | | |
Futures contracts | | $ | — | | | $ | — | | | $ | 5,839,004 | | | $ | — | | | $ | — | | | $ | — | | | $ | 5,839,004 | |
Swaps | | | — | | | | — | | | | (34,438,561 | ) | | | — | | | | — | | | | — | | | | (34,438,561 | ) |
| | | | | | | | | | | | | | | | | | | | | | | | | | | | |
| | $ | — | | | $ | — | | | $ | (28,599,557 | ) | | $ | — | | | $ | — | | | $ | — | | | $ | (28,599,557 | ) |
| | | | | | | | | | | | | | | | | | | | | | | | | | | | |
Average Quarterly Balances of Outstanding Derivative Financial Instruments
| | | | |
Futures contracts | | | | |
Average notional value of contracts — long | | $ | 226,670,576 | |
Total return swaps | | | | |
Average notional amount | | $ | 926,318,975 | |
For more information about the Fund’s investment risks regarding derivative financial instruments, refer to the Notes to Financial Statements.
Derivative Financial Instruments – Offsetting as of Period End
The Fund’s derivative assets and liabilities (by type) were as follows:
| | | | | | | | |
| | | Assets | | | Liabilities | |
Derivative Financial Instruments | | | | | | | | |
Futures contracts | | $ | 6,184,460 | | | $ | — | |
Swaps — OTC(a) | | | 6,460,668 | | | | 30,307,531 | |
| | | | | | | | |
Total derivative assets and liabilities in the Statements of Assets and Liabilities | | $ | 12,645,128 | | | $ | 30,307,531 | |
| | | | | | | | |
Derivatives not subject to a Master Netting Agreement or similar agreement (“MNA”) | | | (6,184,460 | ) | | | — | |
| | | | | | | | |
Total derivative assets and liabilities subject to an MNA | | $ | 6,460,668 | | | $ | 30,307,531 | |
| | | | | | | | |
| | (a) | Includes unrealized appreciation (depreciation) on OTC swaps and swap premiums paid/(received) in the Statements of Assets and Liabilities. | |
| | |
SCHEDULES OF INVESTMENTS | | 47 |
| | |
Schedule of Investments (continued) March 31, 2023 | | iShares® Core S&P Small-Cap ETF |
The following table presents the Fund’s derivative assets and liabilities by counterparty net of amounts available for offset under an MNA and net of the related collateral received and pledged by the Fund:
| | | | | | | | | | | | | | | | | | | | |
| Counterparty | | Derivative
Assets
Subject to
an MNA by
Counterparty | | | Derivatives
Available
for Offset(a) | | | Non-
Cash
Collateral
Received | | | Cash Collateral
Received(b) | | | Net Amount
of Derivative
Assets(c) | |
| | | | | |
Goldman Sachs Bank USA | | $ | 6,460,668 | | | $ | — | | | $ | — | | | $ | — | | | $ | 6,460,668 | |
| | | | | | | | | | | | | | | | | | | | |
| | | | | |
| Counterparty | | Derivative
Liabilities
Subject to
an MNA by
Counterparty | | | Derivatives
Available
for Offset(a) | | | Non-Cash
Collateral
Pledged | | | Cash Collateral
Pledged(b) | | | Net Amount
of Derivative
Liabilities(d) | |
| | | | | |
HSBC Bank PLC | | $ | 29,074,107 | | | $ | — | | | $ | — | | | $ | (29,074,107 | ) | | $ | — | |
JPMorgan Chase Bank N.A | | | 1,233,424 | | | | — | | | | — | | | | (1,233,424 | ) | | | — | |
| | | | | | | | | | | | | | | | | | | | |
| | $ | 30,307,531 | | | $ | — | | | $ | — | | | $ | (30,307,531 | ) | | $ | — | |
| | | | | | | | | | | | | | | | | | | | |
| | (a) | The amount of derivatives available for offset is limited to the amount of derivative assets and/or liabilities that are subject to an MNA. | |
| | (b) | Excess of collateral received/pledged, if any, from the individual counterparty is not shown for financial reporting purposes. | |
| | (c) | Net amount represents the net amount receivable from the counterparty in the event of default. | |
| | (d) | Net amount represents the net amount payable due to the counterparty in the event of default. | |
Fair Value Hierarchy as of Period End
Various inputs are used in determining the fair value of financial instruments. For a description of the input levels and information about the Fund’s policy regarding valuation of financial instruments, refer to the Notes to Financial Statements.
The following table summarizes the Fund’s financial instruments categorized in the fair value hierarchy. The breakdown of the Fund’s financial instruments into major categories is disclosed in the Schedule of Investments above.
| | | | | | | | | | | | | | | | |
| | | Level 1 | | | Level 2 | | | Level 3 | | | Total | |
Assets | | | | | | | | | | | | | | | | |
Investments | | | | | | | | | | | | | | | | |
Long-Term Investments | | | | | | | | | | | | | | | | |
Common Stocks | | $ | 65,397,157,378 | | | $ | — | | | $ | — | | | $ | 65,397,157,378 | |
Short-Term Securities | | | | | | | | | | | | | | | | |
Money Market Funds | | | 5,370,022,328 | | | | — | | | | — | | | | 5,370,022,328 | |
| | | | | | | | | | | | | | | | |
| | $ | 70,767,179,706 | | | $ | — | | | $ | — | | | $ | 70,767,179,706 | |
| | | | | | | | | | | | | | | | |
Derivative Financial Instruments(a) | | | | | | | | | | | | | | | | |
Assets | | | | | | | | | | | | | | | | |
Equity Contracts | | $ | 7,097,042 | | | $ | 6,460,668 | | | $ | — | | | $ | 13,557,710 | |
Liabilities | | | | | | | | | | | | | | | | |
Equity Contracts | | | — | | | | (30,307,531 | ) | | | — | | | | (30,307,531 | ) |
| | | | | | | | | | | | | | | | |
| | $ | 7,097,042 | | | $ | (23,846,863 | ) | | $ | — | | | $ | (16,749,821 | ) |
| | | | | | | | | | | | | | | | |
| (a) | Derivative financial instruments are swaps and futures contracts. Swaps and futures contracts are valued at the unrealized appreciation (depreciation) on the instrument. | |
See notes to financial statements.
| | |
| 48 | | 2 0 2 3 I SHARES ANNUAL REPORT TO SHAREHOLDERS |
| | |
Schedule of Investments March 31, 2023 | | iShares® Core S&P U.S. Growth ETF (Percentages shown are based on Net Assets) |
| | | | | | | | |
| Security | | Shares | | | Value | |
|
Common Stocks | |
|
| Aerospace & Defense — 1.1% | |
Axon Enterprise, Inc.(a) | | | 42,920 | | | $ | 9,650,562 | |
Curtiss-Wright Corp. | | | 24,275 | | | | 4,278,711 | |
General Dynamics Corp. | | | 75,541 | | | | 17,239,212 | |
L3Harris Technologies, Inc. | | | 60,443 | | | | 11,861,334 | |
Lockheed Martin Corp. | | | 102,459 | | | | 48,435,443 | |
Mercury Systems, Inc.(a) | | | 21,312 | | | | 1,089,469 | |
Northrop Grumman Corp. | | | 65,791 | | | | 30,377,021 | |
TransDigm Group, Inc. | | | 15,594 | | | | 11,493,558 | |
| | | | | | | | |
| | |
| | | | | | | 134,425,310 | |
|
| Air Freight & Logistics — 0.1% | |
CH Robinson Worldwide, Inc. | | | 40,279 | | | | 4,002,524 | |
Expeditors International of Washington, Inc. | | | 101,057 | | | | 11,128,397 | |
| | | | | | | | |
| | |
| | | | | | | 15,130,921 | |
|
| Automobile Components — 0.1% | |
Autoliv, Inc. | | | 15,771 | | | | 1,472,380 | |
Fox Factory Holding Corp.(a)(b) | | | 26,851 | | | | 3,258,906 | |
Gentex Corp. | | | 68,561 | | | | 1,921,765 | |
Visteon Corp.(a) | | | 17,818 | | | | 2,794,397 | |
| | | | | | | | |
| | |
| | | | | | | 9,447,448 | |
|
| Automobiles — 2.9% | |
Harley-Davidson, Inc. | | | 53,089 | | | | 2,015,789 | |
Tesla, Inc.(a) | | | 1,708,150 | | | | 354,372,799 | |
| | | | | | | | |
| | |
| | | | | | | 356,388,588 | |
|
| Banks — 0.2% | |
Bank of Hawaii Corp. | | | 13,545 | | | | 705,424 | |
Cathay General Bancorp | | | 24,407 | | | | 842,530 | |
Columbia Banking System, Inc. | | | 68,643 | | | | 1,470,333 | |
Commerce Bancshares, Inc. | | | 49,224 | | | | 2,872,220 | |
Cullen/Frost Bankers, Inc. | | | 27,350 | | | | 2,881,049 | |
East West Bancorp, Inc. | | | 45,744 | | | | 2,538,792 | |
First Financial Bankshares, Inc. | | | 43,788 | | | | 1,396,837 | |
First Horizon Corp. | | | 224,366 | | | | 3,989,227 | |
Fulton Financial Corp. | | | 51,999 | | | | 718,626 | |
Glacier Bancorp, Inc. | | | 38,075 | | | | 1,599,531 | |
Hancock Whitney Corp. | | | 27,813 | | | | 1,012,393 | |
International Bancshares Corp. | | | 20,394 | | | | 873,271 | |
SouthState Corp. | | | 27,408 | | | | 1,953,094 | |
United Bankshares, Inc. | | | 40,578 | | | | 1,428,346 | |
| | | | | | | | |
| | |
| | | | | | | 24,281,673 | |
|
| Beverages — 2.6% | |
Boston Beer Co., Inc., Class A, NVS(a) | | | 4,207 | | | | 1,382,841 | |
Brown-Forman Corp., Class B, NVS | | | 63,712 | | | | 4,094,770 | |
Celsius Holdings, Inc.(a)(b) | | | 25,647 | | | | 2,383,632 | |
Coca-Cola Co. | | | 1,606,752 | | | | 99,666,827 | |
Constellation Brands, Inc., Class A | | | 57,594 | | | | 13,009,909 | |
Keurig Dr Pepper, Inc. | | | 269,459 | | | | 9,506,513 | |
Monster Beverage Corp.(a) | | | 483,202 | | | | 26,097,740 | |
PepsiCo, Inc. | | | 874,720 | | | | 159,461,456 | |
| | | | | | | | |
| | |
| | | | | | | 315,603,688 | |
|
| Biotechnology — 4.1% | |
AbbVie, Inc. | | | 1,123,200 | | | | 179,004,384 | |
Amgen, Inc. | | | 339,139 | | | | 81,986,853 | |
Arrowhead Pharmaceuticals, Inc.(a) | | | 32,359 | | | | 821,919 | |
Biogen, Inc.(a) | | | 42,869 | | | | 11,918,868 | |
Exelixis, Inc.(a) | | | 204,610 | | | | 3,971,480 | |
Gilead Sciences, Inc. | | | 791,994 | | | | 65,711,742 | |
Halozyme Therapeutics, Inc.(a) | | | 85,871 | | | | 3,279,414 | |
Incyte Corp.(a)(b) | | | 118,631 | | | | 8,573,463 | |
| | | | | | | | |
| Security | | Shares | | | Value | |
|
| Biotechnology (continued) | |
Moderna, Inc.(a)(b) | | | 209,842 | | | $ | 32,227,534 | |
Neurocrine Biosciences, Inc.(a) | | | 61,038 | | | | 6,178,266 | |
Regeneron Pharmaceuticals, Inc.(a) | | | 68,282 | | | | 56,105,271 | |
United Therapeutics Corp.(a) | | | 28,899 | | | | 6,472,220 | |
Vertex Pharmaceuticals, Inc.(a) | | | 163,284 | | | | 51,445,890 | |
| | | | | | | | |
| | |
| | | | | | | 507,697,304 | |
|
| Broadline Retail — 2.2% | |
Amazon.com, Inc.(a) | | | 2,604,601 | | | | 269,029,237 | |
Etsy, Inc.(a)(b) | | | 46,389 | | | | 5,164,488 | |
Ollie’s Bargain Outlet Holdings, Inc.(a)(b) | | | 18,081 | | | | 1,047,613 | |
| | | | | | | | |
| | |
| | | | | | | 275,241,338 | |
|
| Building Products — 0.3% | |
Advanced Drainage Systems, Inc.(b) | | | 30,593 | | | | 2,576,236 | |
Builders FirstSource, Inc.(a) | | | 93,486 | | | | 8,299,687 | |
Carlisle Cos., Inc. | | | 32,845 | | | | 7,425,269 | |
Lennox International, Inc. | | | 12,708 | | | | 3,193,266 | |
Masco Corp. | | | 101,619 | | | | 5,052,497 | |
Owens Corning | | | 31,982 | | | | 3,063,876 | |
Simpson Manufacturing Co., Inc. | | | 27,059 | | | | 2,966,749 | |
Trex Co., Inc.(a)(b) | | | 37,006 | | | | 1,801,082 | |
UFP Industries, Inc. | | | 39,145 | | | | 3,110,853 | |
| | | | | | | | |
| | |
| | | | | | | 37,489,515 | |
|
| Capital Markets — 1.1% | |
Affiliated Managers Group, Inc. | | | 15,818 | | | | 2,252,800 | |
Ameriprise Financial, Inc. | | | 67,053 | | | | 20,551,744 | |
Cboe Global Markets, Inc. | | | 44,636 | | | | 5,991,937 | |
Charles Schwab Corp. | | | 571,262 | | | | 29,922,703 | |
Evercore, Inc., Class A | | | 11,370 | | | | 1,311,871 | |
FactSet Research Systems, Inc. | | | 14,512 | | | | 6,023,786 | |
Federated Hermes, Inc., Class B | | | 37,004 | | | | 1,485,341 | |
Interactive Brokers Group, Inc., Class A | | | 36,587 | | | | 3,020,623 | |
Jefferies Financial Group, Inc. | | | 117,311 | | | | 3,723,451 | |
MarketAxess Holdings, Inc. | | | 11,708 | | | | 4,581,223 | |
Moody’s Corp. | | | 47,075 | | | | 14,405,891 | |
MSCI, Inc., Class A | | | 28,988 | | | | 16,224,294 | |
Nasdaq, Inc. | | | 137,857 | | | | 7,536,642 | |
Raymond James Financial, Inc. | | | 122,815 | | | | 11,454,955 | |
SEI Investments Co. | | | 64,995 | | | | 3,740,462 | |
| | | | | | | | |
| | |
| | | | | | | 132,227,723 | |
|
| Chemicals — 1.6% | |
Air Products & Chemicals, Inc. | | | 141,280 | | | | 40,577,029 | |
Albemarle Corp. | | | 74,343 | | | | 16,432,777 | |
Ashland, Inc. | | | 21,180 | | | | 2,175,398 | |
Axalta Coating Systems Ltd.(a) | | | 63,059 | | | | 1,910,057 | |
Cabot Corp. | | | 35,638 | | | | 2,731,296 | |
CF Industries Holdings, Inc. | | | 124,214 | | | | 9,004,273 | |
Chemours Co. | | | 54,505 | | | | 1,631,880 | |
Corteva, Inc. | | | 312,183 | | | | 18,827,757 | |
FMC Corp. | | | 79,724 | | | | 9,736,692 | |
Ingevity Corp.(a)(b) | | | 22,284 | | | | 1,593,752 | |
Linde PLC | | | 190,820 | | | | 67,825,061 | |
Mosaic Co. | | | 215,495 | | | | 9,886,910 | |
NewMarket Corp. | | | 2,334 | | | | 851,863 | |
Olin Corp. | | | 78,356 | | | | 4,348,758 | |
RPM International, Inc. | | | 81,900 | | | | 7,144,956 | |
Valvoline, Inc. | | | 51,872 | | | | 1,812,408 | |
Westlake Corp.(b) | | | 21,818 | | | | 2,530,451 | |
| | | | | | | | |
| | |
| | | | | | | 199,021,318 | |
|
| Commercial Services & Supplies — 0.7% | |
Brink’s Co. | | | 13,831 | | | | 923,911 | |
| | |
SCHEDULES OF INVESTMENTS | | 49 |
| | |
Schedule of Investments (continued) March 31, 2023 | | iShares® Core S&P U.S. Growth ETF (Percentages shown are based on Net Assets) |
| | | | | | | | |
| Security | | Shares | | | Value | |
|
| Commercial Services & Supplies (continued) | |
Cintas Corp. | | | 32,330 | | | $ | 14,958,444 | |
Clean Harbors, Inc.(a) | | | 31,950 | | | | 4,554,792 | |
Copart, Inc.(a) | | | 271,946 | | | | 20,453,059 | |
MSA Safety, Inc. | | | 13,323 | | | | 1,778,621 | |
Republic Services, Inc. | | | 71,710 | | | | 9,696,626 | |
Rollins, Inc. | | | 146,791 | | | | 5,509,066 | |
Tetra Tech, Inc. | | | 19,218 | | | | 2,823,316 | |
Waste Management, Inc. | | | 139,125 | | | | 22,701,026 | |
| | | | | | | | |
| | |
| | | | | | | 83,398,861 | |
|
| Communications Equipment — 0.4% | |
Arista Networks, Inc.(a) | | | 157,203 | | | | 26,388,096 | |
Calix, Inc.(a) | | | 36,158 | | | | 1,937,707 | |
Motorola Solutions, Inc. | | | 58,408 | | | | 16,712,281 | |
| | | | | | | | |
| | |
| | | | | | | 45,038,084 | |
|
| Construction & Engineering — 0.2% | |
AECOM | | | 47,768 | | | | 4,027,798 | |
EMCOR Group, Inc. | | | 30,193 | | | | 4,909,080 | |
Quanta Services, Inc. | | | 90,657 | | | | 15,107,082 | |
Valmont Industries, Inc. | | | 13,554 | | | | 4,327,521 | |
| | | | | | | | |
| | |
| | | | | | | 28,371,481 | |
|
| Construction Materials — 0.1% | |
Eagle Materials, Inc. | | | 23,391 | | | | 3,432,629 | |
Vulcan Materials Co. | | | 49,775 | | | | 8,539,399 | |
| | | | | | | | |
| | |
| | | | | | | 11,972,028 | |
|
| Consumer Finance — 0.4% | |
American Express Co. | | | 185,046 | | | | 30,523,338 | |
Discover Financial Services | | | 98,625 | | | | 9,748,095 | |
FirstCash Holdings, Inc. | | | 23,778 | | | | 2,267,708 | |
SLM Corp. | | | 158,887 | | | | 1,968,610 | |
| | | | | | | | |
| | |
| | | | | | | 44,507,751 | |
|
| Consumer Staples Distribution & Retail — 1.3% | |
BJ’s Wholesale Club Holdings, Inc.(a) | | | 48,783 | | | | 3,710,923 | |
Casey’s General Stores, Inc. | | | 23,620 | | | | 5,112,785 | |
Costco Wholesale Corp. | | | 186,002 | | | | 92,418,814 | |
Dollar General Corp. | | | 141,807 | | | | 29,844,701 | |
Dollar Tree, Inc.(a) | | | 132,407 | | | | 19,007,025 | |
Fresh Market, Inc. Escrow(a)(c) | | | 3,194 | | | | — | |
Performance Food Group Co.(a) | | | 44,379 | | | | 2,677,829 | |
Sprouts Farmers Market, Inc.(a)(b) | | | 36,210 | | | | 1,268,436 | |
U.S. Foods Holding Corp.(a) | | | 36,397 | | | | 1,344,505 | |
| | | | | | | | |
| | |
| | | | | | | 155,385,018 | |
|
| Containers & Packaging — 0.1% | |
AptarGroup, Inc. | | | 19,486 | | | | 2,303,051 | |
Silgan Holdings, Inc. | | | 52,996 | | | | 2,844,295 | |
Sonoco Products Co. | | | 31,496 | | | | 1,921,256 | |
| | | | | | | | |
| | |
| | | | | | | 7,068,602 | |
|
| Distributors — 0.1% | |
Genuine Parts Co. | | | 64,285 | | | | 10,755,524 | |
Pool Corp. | | | 15,655 | | | | 5,360,898 | |
| | | | | | | | |
| | |
| | | | | | | 16,116,422 | |
|
| Diversified Consumer Services — 0.1% | |
Grand Canyon Education, Inc.(a) | | | 19,430 | | | | 2,213,077 | |
H&R Block, Inc. | | | 98,616 | | | | 3,476,214 | |
Service Corp. International | | | 97,679 | | | | 6,718,362 | |
| | | | | | | | |
| | |
| | | | | | | 12,407,653 | |
|
| Diversified Telecommunication Services — 0.0% | |
Iridium Communications, Inc. | | | 79,705 | | | | 4,936,131 | |
| | | | | | | | |
| | | | | | | | |
| Security | | Shares | | | Value | |
|
| Electric Utilities — 0.2% | |
IDACORP, Inc. | | | 16,974 | | | $ | 1,838,793 | |
NRG Energy, Inc. | | | 68,969 | | | | 2,364,947 | |
OGE Energy Corp. | | | 126,950 | | | | 4,780,937 | |
PG&E Corp.(a)(b) | | | 1,019,912 | | | | 16,491,977 | |
PNM Resources, Inc. | | | 33,710 | | | | 1,641,003 | |
| | | | | | | | |
| | |
| | | | | | | 27,117,657 | |
|
| Electrical Equipment — 0.2% | |
Acuity Brands, Inc.(b) | | | 10,242 | | | | 1,871,521 | |
AMETEK, Inc. | | | 72,717 | | | | 10,567,961 | |
Hubbell, Inc. | | | 34,058 | | | | 8,286,652 | |
nVent Electric PLC | | | 105,682 | | | | 4,537,985 | |
SunPower Corp.(a)(b) | | | 30,413 | | | | 420,916 | |
Vicor Corp.(a) | | | 6,097 | | | | 286,193 | |
| | | | | | | | |
| | |
| | | | | | | 25,971,228 | |
|
| Electronic Equipment, Instruments & Components — 0.5% | |
Amphenol Corp., Class A | | | 377,460 | | | | 30,846,031 | |
Belden, Inc. | | | 27,123 | | | | 2,353,463 | |
CDW Corp. | | | 54,174 | | | | 10,557,971 | |
Cognex Corp. | | | 57,152 | | | | 2,831,882 | |
Keysight Technologies, Inc.(a) | | | 61,373 | | | | 9,910,512 | |
Littelfuse, Inc. | | | 9,760 | | | | 2,616,558 | |
National Instruments Corp. | | | 47,457 | | | | 2,487,221 | |
Novanta, Inc.(a) | | | 22,642 | | | | 3,602,116 | |
| | | | | | | | |
| | |
| | | | | | | 65,205,754 | |
|
| Energy Equipment & Services — 0.3% | |
ChampionX Corp. | | | 126,451 | | | | 3,430,616 | |
NOV, Inc. | | | 248,851 | | | | 4,606,232 | |
Schlumberger NV | | | 478,443 | | | | 23,491,551 | |
Valaris Ltd.(a) | | | 38,206 | | | | 2,485,682 | |
| | | | | | | | |
| | |
| | | | | | | 34,014,081 | |
|
| Entertainment — 0.3% | |
Activision Blizzard, Inc. | | | 266,218 | | | | 22,785,599 | |
Electronic Arts, Inc. | | | 112,991 | | | | 13,609,766 | |
World Wrestling Entertainment, Inc., Class A | | | 27,475 | | | | 2,507,368 | |
| | | | | | | | |
| | |
| | | | | | | 38,902,733 | |
|
| Financial Services — 3.9% | |
Euronet Worldwide, Inc.(a) | | | 14,642 | | | | 1,638,440 | |
Fiserv, Inc.(a) | | | 278,692 | | | | 31,500,557 | |
FleetCor Technologies, Inc.(a) | | | 24,744 | | | | 5,217,272 | |
Jack Henry & Associates, Inc. | | | 46,869 | | | | 7,064,096 | |
Mastercard, Inc., Class A | | | 535,864 | | | | 194,738,336 | |
Visa, Inc., Class A(b) | | | 1,032,042 | | | | 232,684,189 | |
WEX, Inc.(a) | | | 27,647 | | | | 5,084,007 | |
| | | | | | | | |
| | |
| | | | | | | 477,926,897 | |
|
| Food Products — 1.1% | |
Archer-Daniels-Midland Co. | | | 170,253 | | | | 13,562,354 | |
Bunge Ltd. | | | 39,045 | | | | 3,729,578 | |
Campbell Soup Co. | | | 75,065 | | | | 4,127,074 | |
Darling Ingredients, Inc.(a) | | | 101,794 | | | | 5,944,770 | |
Flowers Foods, Inc. | | | 76,690 | | | | 2,102,073 | |
General Mills, Inc. | | | 255,328 | | | | 21,820,331 | |
Hershey Co. | | | 93,214 | | | | 23,714,574 | |
Hormel Foods Corp. | | | 132,051 | | | | 5,266,194 | |
Kellogg Co. | | | 89,180 | | | | 5,971,493 | |
Lamb Weston Holdings, Inc. | | | 91,118 | | | | 9,523,653 | |
Lancaster Colony Corp. | | | 12,591 | | | | 2,554,462 | |
McCormick & Co., Inc., NVS | | | 80,961 | | | | 6,736,765 | |
Mondelez International, Inc., Class A | | | 467,220 | | | | 32,574,578 | |
| | | | | | | | |
| | |
| | | | | | | 137,627,899 | |
| | |
| 50 | | 2 0 2 3 I SHARES ANNUAL REPORT TO SHAREHOLDERS |
| | |
Schedule of Investments (continued) March 31, 2023 | | iShares® Core S&P U.S. Growth ETF (Percentages shown are based on Net Assets) |
| | | | | | | | |
| Security | | Shares | | | Value | |
|
| Gas Utilities — 0.1% | |
Atmos Energy Corp. | | | 56,130 | | | $ | 6,306,767 | |
National Fuel Gas Co. | | | 40,648 | | | | 2,347,016 | |
New Jersey Resources Corp. | | | 39,617 | | | | 2,107,624 | |
ONE Gas, Inc. | | | 34,289 | | | | 2,716,717 | |
Spire, Inc. | | | 16,298 | | | | 1,143,142 | |
| | | | | | | | |
| | |
| | | | | | | 14,621,266 | |
|
| Ground Transportation — 0.8% | |
Avis Budget Group, Inc.(a)(b) | | | 15,811 | | | | 3,079,983 | |
CSX Corp. | | | 638,852 | | | | 19,127,229 | |
JB Hunt Transport Services, Inc. | | | 53,180 | | | | 9,330,963 | |
Knight-Swift Transportation Holdings, Inc. | | | 50,892 | | | | 2,879,469 | |
Landstar System, Inc. | | | 22,789 | | | | 4,085,156 | |
Old Dominion Freight Line, Inc.(b) | | | 57,544 | | | | 19,613,297 | |
Saia, Inc.(a)(b) | | | 9,586 | | | | 2,608,159 | |
Union Pacific Corp. | | | 194,196 | | | | 39,083,887 | |
| | | | | | | | |
| | |
| | | | | | | 99,808,143 | |
|
| Health Care Equipment & Supplies — 1.7% | |
Abbott Laboratories | | | 575,765 | | | | 58,301,964 | |
Boston Scientific Corp.(a)(b) | | | 483,415 | | | | 24,185,252 | |
Dexcom, Inc.(a) | | | 245,296 | | | | 28,498,489 | |
Globus Medical, Inc., Class A(a) | | | 49,121 | | | | 2,782,213 | |
Haemonetics Corp.(a) | | | 32,071 | | | | 2,653,875 | |
Hologic, Inc.(a) | | | 156,591 | | | | 12,636,894 | |
IDEXX Laboratories, Inc.(a) | | | 25,791 | | | | 12,897,563 | |
Inari Medical, Inc.(a) | | | 30,662 | | | | 1,893,072 | |
Insulet Corp.(a) | | | 44,060 | | | | 14,053,378 | |
Intuitive Surgical, Inc.(a) | | | 108,849 | | | | 27,807,654 | |
Lantheus Holdings, Inc.(a) | | | 43,678 | | | | 3,606,056 | |
Masimo Corp.(a) | | | 19,374 | | | | 3,575,278 | |
Penumbra, Inc.(a)(b) | | | 15,206 | | | | 4,237,760 | |
QuidelOrtho Corp.(a) | | | 18,731 | | | | 1,668,745 | |
ResMed, Inc. | | | 50,236 | | | | 11,001,182 | |
Shockwave Medical, Inc.(a)(b) | | | 22,944 | | | | 4,974,948 | |
STAAR Surgical Co.(a)(b) | | | 20,851 | | | | 1,333,421 | |
| | | | | | | | |
| | |
| | | | | | | 216,107,744 | |
|
| Health Care Providers & Services — 3.8% | |
Acadia Healthcare Co., Inc.(a) | | | 33,427 | | | | 2,415,101 | |
Chemed Corp. | | | 6,410 | | | | 3,446,977 | |
Cigna Group | | | 93,206 | | | | 23,816,929 | |
Elevance Health, Inc. | | | 151,623 | | | | 69,717,772 | |
Encompass Health Corp. | | | 29,067 | | | | 1,572,525 | |
HCA Healthcare, Inc. | | | 72,725 | | | | 19,176,128 | |
HealthEquity, Inc.(a) | | | 53,627 | | | | 3,148,441 | |
Humana, Inc. | | | 50,696 | | | | 24,610,880 | |
McKesson Corp. | | | 40,113 | | | | 14,282,234 | |
Molina Healthcare, Inc.(a) | | | 36,999 | | | | 9,896,862 | |
Option Care Health, Inc.(a) | | | 106,451 | | | | 3,381,948 | |
Progyny, Inc.(a)(b) | | | 17,698 | | | | 568,460 | |
Quest Diagnostics, Inc. | | | 46,656 | | | | 6,600,891 | |
UnitedHealth Group, Inc. | | | 593,424 | | | | 280,446,248 | |
| | | | | | | | |
| | |
| | | | | | | 463,081,396 | |
|
| Health Care REITs — 0.0% | |
Omega Healthcare Investors, Inc. | | | 72,689 | | | | 1,992,406 | |
| | | | | | | | |
|
| Hotels, Restaurants & Leisure — 1.8% | |
Aramark | | | 67,841 | | | | 2,428,708 | |
Boyd Gaming Corp. | | | 29,783 | | | | 1,909,686 | |
Chipotle Mexican Grill, Inc.(a) | | | 17,510 | | | | 29,912,158 | |
Choice Hotels International, Inc. | | | 10,396 | | | | 1,218,307 | |
Churchill Downs, Inc. | | | 20,918 | | | | 5,376,972 | |
Domino’s Pizza, Inc. | | | 10,359 | | | | 3,417,123 | |
| | | | | | | | |
| Security | | Shares | | | Value | |
|
| Hotels, Restaurants & Leisure (continued) | |
Hilton Grand Vacations, Inc.(a)(b) | | | 25,716 | | | $ | 1,142,562 | |
Hilton Worldwide Holdings, Inc. | | | 81,447 | | | | 11,473,439 | |
Light & Wonder, Inc., Class A(a) | | | 27,446 | | | | 1,648,132 | |
Marriott International, Inc., Class A | | | 86,922 | | | | 14,432,529 | |
McDonald’s Corp. | | | 288,410 | | | | 80,642,320 | |
Papa John’s International, Inc. | | | 9,205 | | | | 689,731 | |
Starbucks Corp. | | | 372,909 | | | | 38,831,014 | |
Texas Roadhouse, Inc. | | | 42,444 | | | | 4,586,499 | |
Wendy’s Co. | | | 108,103 | | | | 2,354,484 | |
Wingstop, Inc. | | | 19,004 | | | | 3,488,754 | |
Wyndham Hotels & Resorts, Inc. | | | 29,199 | | | | 1,981,152 | |
Yum! Brands, Inc. | | | 113,477 | | | | 14,988,042 | |
| | | | | | | | |
| | |
| | | | | | | 220,521,612 | |
|
| Household Durables — 0.1% | |
DR Horton, Inc. | | | 99,407 | | | | 9,711,070 | |
Tempur Sealy International, Inc. | | | 108,588 | | | | 4,288,140 | |
TopBuild Corp.(a) | | | 10,786 | | | | 2,244,998 | |
| | | | | | | | |
| | |
| | | | | | | 16,244,208 | |
|
| Household Products — 1.3% | |
Clorox Co. | | | 35,182 | | | | 5,567,200 | |
Colgate-Palmolive Co. | | | 292,495 | | | | 21,980,999 | |
Kimberly-Clark Corp. | | | 102,609 | | | | 13,772,180 | |
Procter & Gamble Co. | | | 824,088 | | | | 122,533,645 | |
| | | | | | | | |
| | |
| | | | | | | 163,854,024 | |
|
| Independent Power and Renewable Electricity Producers — 0.1% | |
AES Corp. | | | 254,003 | | | | 6,116,392 | |
Ormat Technologies, Inc.(b) | | | 19,669 | | | | 1,667,341 | |
| | | | | | | | |
| | |
| | | | | | | 7,783,733 | |
|
| Industrial REITs — 0.1% | |
EastGroup Properties, Inc. | | | 15,230 | | | | 2,517,823 | |
First Industrial Realty Trust, Inc. | | | 42,819 | | | | 2,277,971 | |
Rexford Industrial Realty, Inc. | | | 68,643 | | | | 4,094,555 | |
| | | | | | | | |
| | |
| | | | | | | 8,890,349 | |
|
| Insurance — 1.9% | |
American Financial Group, Inc. | | | 19,900 | | | | 2,417,850 | |
Aon PLC, Class A | | | 86,099 | | | | 27,146,154 | |
Arch Capital Group Ltd.(a) | | | 234,581 | | | | 15,921,012 | |
Arthur J. Gallagher & Co. | | | 86,438 | | | | 16,536,454 | |
Brown & Brown, Inc. | | | 88,117 | | | | 5,059,678 | |
Chubb Ltd. | | | 150,417 | | | | 29,207,973 | |
Everest Re Group Ltd. | | | 14,386 | | | | 5,150,476 | |
Globe Life, Inc. | | | 40,104 | | | | 4,412,242 | |
Hanover Insurance Group, Inc. | | | 13,297 | | | | 1,708,664 | |
Kinsale Capital Group, Inc. | | | 13,690 | | | | 4,109,053 | |
Marsh & McLennan Cos., Inc. | | | 201,208 | | | | 33,511,192 | |
Primerica, Inc. | | | 16,498 | | | | 2,841,616 | |
Principal Financial Group, Inc. | | | 87,298 | | | | 6,487,987 | |
Progressive Corp. | | | 371,482 | | | | 53,144,215 | |
RenaissanceRe Holdings Ltd. | | | 15,514 | | | | 3,108,075 | |
RLI Corp. | | | 25,615 | | | | 3,404,490 | |
Selective Insurance Group, Inc. | | | 38,190 | | | | 3,640,653 | |
Travelers Cos., Inc. | | | 79,477 | | | | 13,623,153 | |
W R Berkley Corp. | | | 129,246 | | | | 8,046,856 | |
| | | | | | | | |
| | |
| | | | | | | 239,477,793 | |
|
| Interactive Media & Services — 6.0% | |
Alphabet, Inc., Class A(a) | | | 3,782,778 | | | | 392,387,562 | |
Alphabet, Inc., Class C, NVS(a) | | | 3,297,647 | | | | 342,955,288 | |
| | | | | | | | |
| | |
| | | | | | | 735,342,850 | |
| | |
SCHEDULES OF INVESTMENTS | | 51 |
| | |
Schedule of Investments (continued) March 31, 2023 | | iShares® Core S&P U.S. Growth ETF (Percentages shown are based on Net Assets) |
| | | | | | | | |
| Security | | Shares | | | Value | |
|
| IT Services — 0.7% | |
Accenture PLC, Class A | | | 195,982 | | | $ | 56,013,616 | |
EPAM Systems, Inc.(a) | | | 24,867 | | | | 7,435,233 | |
Gartner, Inc.(a) | | | 50,181 | | | | 16,347,464 | |
VeriSign, Inc.(a) | | | 28,689 | | | | 6,062,846 | |
| | | | | | | | |
| | |
| | | | | | | 85,859,159 | |
|
| Leisure Products — 0.0% | |
Brunswick Corp. | | | 27,220 | | | | 2,232,040 | |
Polaris, Inc.(b) | | | 18,476 | | | | 2,044,000 | |
YETI Holdings, Inc.(a) | | | 30,187 | | | | 1,207,480 | |
| | | | | | | | |
| | |
| | | | | | | 5,483,520 | |
|
| Life Sciences Tools & Services — 2.6% | |
Agilent Technologies, Inc. | | | 112,813 | | | | 15,606,550 | |
Bio-Techne Corp. | | | 48,247 | | | | 3,579,445 | |
Bruker Corp. | | | 37,552 | | | | 2,960,600 | |
Danaher Corp. | | | 416,302 | | | | 104,924,756 | |
IQVIA Holdings, Inc.(a) | | | 56,681 | | | | 11,273,284 | |
Medpace Holdings, Inc.(a) | | | 16,001 | | | | 3,008,988 | |
Mettler-Toledo International, Inc.(a) | | | 9,116 | | | | 13,949,394 | |
Repligen Corp.(a)(b) | | | 32,796 | | | | 5,521,535 | |
Thermo Fisher Scientific, Inc. | | | 249,092 | | | | 143,569,156 | |
Waters Corp.(a) | | | 37,712 | | | | 11,676,767 | |
| | | | | | | | |
| | |
| | | | | | | 316,070,475 | |
|
| Machinery — 1.6% | |
AGCO Corp. | | | 20,388 | | | | 2,756,458 | |
Caterpillar, Inc. | | | 198,253 | | | | 45,368,216 | |
Chart Industries, Inc.(a)(b) | | | 11,949 | | | | 1,498,405 | |
Crane NXT Co. | | | 15,141 | | | | 1,718,503 | |
Cummins, Inc. | | | 46,068 | | | | 11,004,724 | |
Deere & Co. | | | 171,745 | | | | 70,910,076 | |
Donaldson Co., Inc. | | | 49,749 | | | | 3,250,600 | |
Graco, Inc. | | | 69,552 | | | | 5,077,991 | |
IDEX Corp. | | | 27,287 | | | | 6,304,116 | |
Illinois Tool Works, Inc. | | | 89,921 | | | | 21,891,267 | |
ITT, Inc. | | | 24,180 | | | | 2,086,734 | |
Lincoln Electric Holdings, Inc. | | | 36,627 | | | | 6,193,626 | |
Middleby Corp.(a) | | | 16,441 | | | | 2,410,415 | |
Snap-on, Inc. | | | 19,196 | | | | 4,739,300 | |
Timken Co. | | | 20,538 | | | | 1,678,365 | |
Toro Co. | | | 66,177 | | | | 7,356,235 | |
Watts Water Technologies, Inc., Class A | | | 9,024 | | | | 1,518,920 | |
| | | | | | | | |
| | |
| | | | | | | 195,763,951 | |
|
| Media — 0.0% | |
New York Times Co., Class A | | | 52,304 | | | | 2,033,580 | |
Nexstar Media Group, Inc., Class A | | | 23,934 | | | | 4,132,444 | |
| | | | | | | | |
| | |
| | | | | | | 6,166,024 | |
|
| Metals & Mining — 0.8% | |
Commercial Metals Co. | | | 41,629 | | | | 2,035,658 | |
Freeport-McMoRan, Inc. | | | 909,041 | | | | 37,188,867 | |
MP Materials Corp., Class A(a)(b) | | | 58,628 | | | | 1,652,723 | |
Nucor Corp. | | | 160,333 | | | | 24,766,639 | |
Reliance Steel & Aluminum Co. | | | 37,252 | | | | 9,564,078 | |
Royal Gold, Inc. | | | 41,646 | | | | 5,401,903 | |
Steel Dynamics, Inc. | | | 105,931 | | | | 11,976,559 | |
Worthington Industries, Inc. | | | 9,403 | | | | 607,904 | |
| | | | | | | | |
| | |
| | | | | | | 93,194,331 | |
|
| Mortgage Real Estate Investment Trusts (REITs) — 0.0% | |
Annaly Capital Management, Inc. | | | 295,822 | | | | 5,653,158 | |
| | | | | | | | |
|
| Multi-Utilities — 0.2% | |
Black Hills Corp. | | | 21,445 | | | | 1,353,179 | |
| | | | | | | | |
| Security | | Shares | | | Value | |
|
| Multi-Utilities (continued) | |
Sempra Energy | | | 120,210 | | | $ | 18,170,944 | |
WEC Energy Group, Inc. | | | 103,863 | | | | 9,845,174 | |
| | | | | | | | |
| | |
| | | | | | | 29,369,297 | |
|
| Office REITs — 0.0% | |
Corporate Office Properties Trust | | | 37,026 | | | | 877,887 | |
| | | | | | | | |
|
| Oil, Gas & Consumable Fuels — 6.9% | |
Antero Midstream Corp. | | | 212,720 | | | | 2,231,433 | |
Antero Resources Corp.(a) | | | 175,171 | | | | 4,044,698 | |
APA Corp. | | | 204,000 | | | | 7,356,240 | |
Chevron Corp. | | | 1,129,845 | | | | 184,345,510 | |
Chord Energy Corp. | | | 20,083 | | | | 2,703,172 | |
CNX Resources Corp.(a)(b) | | | 106,899 | | | | 1,712,522 | |
ConocoPhillips | | | 777,296 | | | | 77,115,536 | |
Coterra Energy, Inc. | | | 499,495 | | | | 12,257,607 | |
Devon Energy Corp. | | | 415,147 | | | | 21,010,590 | |
Diamondback Energy, Inc. | | | 117,016 | | | | 15,817,053 | |
DT Midstream, Inc. | | | 61,350 | | | | 3,028,850 | |
EOG Resources, Inc. | | | 373,426 | | | | 42,805,822 | |
EQT Corp. | | | 232,097 | | | | 7,406,215 | |
Equitrans Midstream Corp. | | | 126,106 | | | | 728,893 | |
Exxon Mobil Corp. | | | 2,615,425 | | | | 286,807,506 | |
Hess Corp. | | | 176,126 | | | | 23,308,515 | |
HF Sinclair Corp. | | | 37,500 | | | | 1,814,250 | |
Marathon Oil Corp. | | | 401,428 | | | | 9,618,215 | |
Marathon Petroleum Corp. | | | 138,788 | | | | 18,712,786 | |
Matador Resources Co.(b) | | | 71,296 | | | | 3,397,255 | |
Murphy Oil Corp. | | | 92,785 | | | | 3,431,189 | |
Occidental Petroleum Corp.(b) | | | 462,866 | | | | 28,896,724 | |
ONEOK, Inc. | | | 283,271 | | | | 17,999,039 | |
PBF Energy, Inc., Class A | | | 72,403 | | | | 3,139,394 | |
PDC Energy, Inc. | | | 58,523 | | | | 3,756,006 | |
Pioneer Natural Resources Co. | | | 151,201 | | | | 30,881,292 | |
Range Resources Corp. | | | 153,337 | | | | 4,058,830 | |
Southwestern Energy Co.(a) | | | 700,224 | | | | 3,501,120 | |
Targa Resources Corp. | | | 143,765 | | | | 10,487,657 | |
Williams Cos., Inc. | | | 775,114 | | | | 23,144,904 | |
| | | | | | | | |
| | |
| | | | | | | 855,518,823 | |
|
| Paper & Forest Products — 0.0% | |
Louisiana-Pacific Corp. | | | 45,524 | | | | 2,467,856 | |
| | | | | | | | |
|
| Personal Care Products — 0.0% | |
BellRing Brands, Inc.(a)(b) | | | 35,188 | | | | 1,196,392 | |
| | | | | | | | |
|
| Pharmaceuticals — 6.1% | |
Bristol-Myers Squibb Co. | | | 1,350,369 | | | | 93,594,075 | |
Eli Lilly & Co. | | | 500,885 | | | | 172,013,927 | |
Jazz Pharmaceuticals PLC(a) | | | 39,880 | | | | 5,835,640 | |
Johnson & Johnson | | | 1,029,518 | | | | 159,575,290 | |
Merck & Co., Inc. | | | 1,610,281 | | | | 171,317,796 | |
Pfizer, Inc. | | | 3,565,132 | | | | 145,457,386 | |
| | | | | | | | |
| | |
| | | | | | | 747,794,114 | |
|
| Professional Services — 1.2% | |
Automatic Data Processing, Inc. | | | 263,164 | | | | 58,588,201 | |
Broadridge Financial Solutions, Inc. | | | 35,857 | | | | 5,255,561 | |
CACI International, Inc., Class A(a)(b) | | | 9,516 | | | | 2,819,400 | |
Concentrix Corp. | | | 26,915 | | | | 3,271,518 | |
CoStar Group, Inc.(a)(b) | | | 257,840 | | | | 17,752,284 | |
Equifax, Inc. | | | 38,208 | | | | 7,750,111 | |
ExlService Holdings, Inc.(a) | | | 21,012 | | | | 3,400,372 | |
Exponent, Inc. | | | 22,246 | | | | 2,217,704 | |
FTI Consulting, Inc.(a)(b) | | | 21,865 | | | | 4,315,058 | |
Genpact Ltd. | | | 61,055 | | | | 2,821,962 | |
| | |
| 52 | | 2 0 2 3 I SHARES ANNUAL REPORT TO SHAREHOLDERS |
| | |
Schedule of Investments (continued) March 31, 2023 | | iShares® Core S&P U.S. Growth ETF (Percentages shown are based on Net Assets) |
| | | | | | | | |
| Security | | Shares | | | Value | |
|
| Professional Services (continued) | |
Insperity, Inc. | | | 22,640 | | | $ | 2,751,892 | |
KBR, Inc. | | | 87,044 | | | | 4,791,772 | |
Leidos Holdings, Inc. | | | 56,279 | | | | 5,181,045 | |
Paychex, Inc. | | | 116,094 | | | | 13,303,211 | |
Science Applications International Corp. | | | 23,388 | | | | 2,513,274 | |
Verisk Analytics, Inc.(b) | | | 45,689 | | | | 8,765,892 | |
| | | | | | | | |
| | |
| | | | | | | 145,499,257 | |
|
| Retail REITs — 0.1% | |
Agree Realty Corp. | | | 38,891 | | | | 2,668,312 | |
Brixmor Property Group, Inc. | | | 93,361 | | | | 2,009,129 | |
National Retail Properties, Inc. | | | 62,809 | | | | 2,773,017 | |
| | | | | | | | |
| | |
| | | | | | | 7,450,458 | |
|
| Semiconductors & Semiconductor Equipment — 8.7% | |
Advanced Micro Devices, Inc.(a) | | | 552,842 | | | | 54,184,044 | |
Allegro MicroSystems, Inc.(a)(b) | | | 16,076 | | | | 771,487 | |
Amkor Technology, Inc. | | | 63,696 | | | | 1,657,370 | |
Analog Devices, Inc. | | | 151,070 | | | | 29,794,025 | |
Applied Materials, Inc. | | | 535,455 | | | | 65,769,938 | |
Broadcom, Inc. | | | 159,245 | | | | 102,162,037 | |
Cirrus Logic, Inc.(a)(b) | | | 34,934 | | | | 3,821,081 | |
Enphase Energy, Inc.(a) | | | 86,317 | | | | 18,150,739 | |
First Solar, Inc.(a) | | | 62,907 | | | | 13,682,272 | |
KLA Corp. | | | 87,886 | | | | 35,081,455 | |
Lam Research Corp. | | | 85,694 | | | | 45,428,103 | |
Lattice Semiconductor Corp.(a) | | | 87,030 | | | | 8,311,365 | |
MACOM Technology Solutions Holdings,
Inc.(a)(b) | | | 32,439 | | | | 2,297,979 | |
Microchip Technology, Inc. | | | 171,151 | | | | 14,339,031 | |
Monolithic Power Systems, Inc. | | | 28,555 | | | | 14,292,920 | |
NVIDIA Corp. | | | 1,562,397 | | | | 433,987,015 | |
NXP Semiconductors NV(b) | | | 97,116 | | | | 18,109,706 | |
ON Semiconductor Corp.(a) | | | 274,352 | | | | 22,584,657 | |
Power Integrations, Inc. | | | 36,324 | | | | 3,074,463 | |
QUALCOMM, Inc. | | | 708,159 | | | | 90,346,925 | |
Silicon Laboratories, Inc.(a) | | | 10,549 | | | | 1,847,024 | |
SiTime Corp.(a)(b) | | | 5,525 | | | | 785,821 | |
SolarEdge Technologies, Inc.(a)(b) | | | 35,482 | | | | 10,784,754 | |
Teradyne, Inc. | | | 48,609 | | | | 5,225,954 | |
Texas Instruments, Inc. | | | 362,597 | | | | 67,446,668 | |
Universal Display Corp. | | | 17,404 | | | | 2,699,883 | |
Wolfspeed, Inc.(a) | | | 35,518 | | | | 2,306,894 | |
| | | | | | | | |
| | |
| | | | | | | 1,068,943,610 | |
|
| Software — 9.5% | |
Adobe, Inc.(a) | | | 136,655 | | | | 52,662,737 | |
Autodesk, Inc.(a) | | | 75,424 | | | | 15,700,260 | |
Blackbaud, Inc.(a) | | | 13,053 | | | | 904,573 | |
Cadence Design Systems, Inc.(a) | | | 174,224 | | | | 36,602,720 | |
CommVault Systems, Inc.(a) | | | 18,954 | | | | 1,075,450 | |
Dynatrace, Inc.(a) | | | 137,303 | | | | 5,807,917 | |
Envestnet, Inc.(a)(b) | | | 9,413 | | | | 552,261 | |
Fair Isaac Corp.(a) | | | 16,024 | | | | 11,259,905 | |
Fortinet, Inc.(a) | | | 411,786 | | | | 27,367,297 | |
Gen Digital, Inc. | | | 194,637 | | | | 3,339,971 | |
Intuit, Inc. | | | 94,563 | | | | 42,159,022 | |
Manhattan Associates, Inc.(a) | | | 23,016 | | | | 3,564,028 | |
Microsoft Corp. | | | 2,742,073 | | | | 790,539,646 | |
Oracle Corp. | | | 575,897 | | | | 53,512,349 | |
Paycom Software, Inc.(a)(b) | | | 30,704 | | | | 9,334,323 | |
Paylocity Holding Corp.(a) | | | 26,155 | | | | 5,199,091 | |
PTC, Inc.(a) | | | 67,944 | | | | 8,712,459 | |
Qualys, Inc.(a)(b) | | | 21,956 | | | | 2,854,719 | |
ServiceNow, Inc.(a) | | | 128,929 | | | | 59,915,885 | |
| | | | | | | | |
| Security | | Shares | | | Value | |
|
| Software (continued) | |
Synopsys, Inc.(a) | | | 96,804 | | | $ | 37,390,545 | |
Teradata Corp.(a) | | | 29,829 | | | | 1,201,512 | |
Tyler Technologies, Inc.(a) | | | 12,428 | | | | 4,407,466 | |
| | | | | | | | |
| | |
| | | | | | | 1,174,064,136 | |
|
| Specialized REITs — 0.9% | |
American Tower Corp. | | | 156,662 | | | | 32,012,313 | |
CubeSmart | | | 76,833 | | | | 3,551,221 | |
Extra Space Storage, Inc. | | | 42,617 | | | | 6,943,588 | |
Iron Mountain, Inc. | | | 116,306 | | | | 6,153,751 | |
Lamar Advertising Co., Class A | | | 31,044 | | | | 3,100,985 | |
Life Storage, Inc. | | | 32,982 | | | | 4,323,610 | |
National Storage Affiliates Trust | | | 25,291 | | | | 1,056,658 | |
PotlatchDeltic Corp. | | | 29,234 | | | | 1,447,083 | |
Public Storage | | | 62,222 | | | | 18,799,755 | |
Rayonier, Inc. | | | 51,140 | | | | 1,700,916 | |
SBA Communications Corp. | | | 38,403 | | | | 10,025,871 | |
VICI Properties, Inc. | | | 364,290 | | | | 11,883,140 | |
Weyerhaeuser Co. | | | 266,228 | | | | 8,021,450 | |
| | | | | | | | |
| | |
| | | | | | | 109,020,341 | |
|
| Specialty Retail — 2.5% | |
AutoNation, Inc.(a) | | | 10,008 | | | | 1,344,675 | |
AutoZone, Inc.(a) | | | 11,945 | | | | 29,362,602 | |
Dick’s Sporting Goods, Inc. | | | 19,049 | | | | 2,702,863 | |
Five Below, Inc.(a)(b) | | | 24,353 | | | | 5,015,987 | |
Home Depot, Inc. | | | 343,073 | | | | 101,247,704 | |
Lowe’s Cos., Inc. | | | 265,000 | | | | 52,992,050 | |
Murphy U.S.A., Inc. | | | 12,691 | | | | 3,274,912 | |
O’Reilly Automotive, Inc.(a) | | | 39,556 | | | | 33,582,253 | |
TJX Cos., Inc. | | | 469,686 | | | | 36,804,595 | |
Tractor Supply Co. | | | 70,147 | | | | 16,487,351 | |
Ulta Beauty, Inc.(a) | | | 32,266 | | | | 17,606,588 | |
Williams-Sonoma, Inc. | | | 20,386 | | | | 2,480,161 | |
| | | | | | | | |
| | |
| | | | | | | 302,901,741 | |
|
| Technology Hardware, Storage & Peripherals — 12.7% | |
Apple Inc. | | | 9,445,912 | | | | 1,557,630,889 | |
Super Micro Computer, Inc.(a) | | | 23,464 | | | | 2,500,089 | |
| | | | | | | | |
| | |
| | | | | | | 1,560,130,978 | |
|
| Textiles, Apparel & Luxury Goods — 0.1% | |
Crocs, Inc.(a) | | | 39,209 | | | | 4,957,586 | |
Deckers Outdoor Corp.(a) | | | 16,808 | | | | 7,556,036 | |
| | | | | | | | |
| | |
| | | | | | | 12,513,622 | |
|
| Tobacco — 0.6% | |
Altria Group, Inc. | | | 589,699 | | | | 26,312,369 | |
Philip Morris International, Inc. | | | 531,392 | | | | 51,677,872 | |
| | | | | | | | |
| | |
| | | | | | | 77,990,241 | |
|
| Trading Companies & Distributors — 0.3% | |
Fastenal Co. | | | 178,218 | | | | 9,613,079 | |
GATX Corp. | | | 11,591 | | | | 1,275,242 | |
MSC Industrial Direct Co., Inc., Class A | | | 14,947 | | | | 1,255,548 | |
Watsco, Inc. | | | 21,118 | | | | 6,718,903 | |
WW Grainger, Inc. | | | 28,513 | | | | 19,640,039 | |
| | | | | | | | |
| | |
| | | | | | | 38,502,811 | |
|
| Water Utilities — 0.1% | |
Essential Utilities, Inc. | | | 151,454 | | | | 6,610,967 | |
| | | | | | | | |
|
| Wireless Telecommunication Services — 0.3% | |
T-Mobile U.S., Inc.(a)(b) | | | 255,657 | | | | 37,029,360 | |
| | | | | | | | |
| |
Total Long-Term Investments — 99.8%
(Cost: $9,927,871,648) | | | | 12,296,721,139 | |
| | | | | | | | |
| | |
SCHEDULES OF INVESTMENTS | | 53 |
| | |
Schedule of Investments (continued) March 31, 2023 | | iShares® Core S&P U.S. Growth ETF (Percentages shown are based on Net Assets) |
| | | | | | | | |
| Security | | Shares | | | Value | |
|
Short-Term Securities | |
|
| Money Market Funds — 1.0% | |
BlackRock Cash Funds: Institutional, SL Agency Shares, 5.01%(d)(e)(f) | | | 113,471,356 | | | $ | 113,505,398 | |
BlackRock Cash Funds: Treasury, SL Agency Shares, 4.73%(d)(e) | | | 17,496,613 | | | | 17,496,613 | |
| | | | | | | | |
| | |
Total Short-Term Securities — 1.0%
(Cost: $130,976,315) | | | | | | | 131,002,011 | |
| | | | | | | | |
Total Investments — 100.8%
(Cost: $10,058,847,963) | | | | | | | 12,427,723,150 | |
| |
Liabilities in Excess of Other Assets — (0.8)% | | | | (104,260,702 | ) |
| | | | | | | | |
| |
Net Assets — 100.0% | | | $ | 12,323,462,448 | |
| | | | | | | | |
| (a) | Non-income producing security. |
| (b) | All or a portion of this security is on loan. |
| (c) | Security is valued using significant unobservable inputs and is classified as Level 3 in the fair value hierarchy. |
| (d) | Affiliate of the Fund. |
| (e) | Annualized 7-day yield as of period end. |
| (f) | All or a portion of this security was purchased with the cash collateral from loaned securities. |
Affiliates
Investments in issuers considered to be affiliate(s) of the Fund during the year ended March 31, 2023 for purposes of Section 2(a)(3) of the Investment Company Act of 1940, as amended, were as follows:
| | | | | | | | | | | | | | | | | | | | | | | | | | | | | | | | | | | | | | |
| | | Affiliated Issuer | | Value at
03/31/22 | | | Purchases
at Cost | | | Proceeds
from Sale | | | Net
Realized
Gain (Loss) | | | Change in
Unrealized
Appreciation
(Depreciation) | | | Value at
03/31/23 | | | Shares
Held at
03/31/23 | | | Income | | | Capital
Gain
Distributions
from Underlying
Funds | |
| | BlackRock Cash Funds: Institutional, SL Agency Shares | | $ | 58,826,169 | | | $ | 54,610,758 | (a) | | $ | — | | | $ | 56,324 | | | $ | 12,147 | | | $ | 113,505,398 | | | | 113,471,356 | | | $ | 663,645 | (b) | | $ | — | |
| | BlackRock Cash Funds: Treasury, SL Agency Shares | | | 18,116,000 | | | | — | | | | (619,387 | )(a) | | | — | | | | — | | | | 17,496,613 | | | | 17,496,613 | | | | 442,612 | | | | 4 | |
| | BlackRock, Inc.(c) | | | 35,500,282 | | | | 7,890,408 | | | | (40,836,980 | ) | | | 4,263,812 | | | | (6,817,522 | ) | | | — | | | | — | | | | 733,537 | | | | — | |
| | | | | | | | | | | | | | | | | | | | | | | | | | | | | | | | | | | | | | |
| | | | | | | | | | | | | | | | $ | 4,320,136 | | | $ | (6,805,375 | ) | | $ | 131,002,011 | | | | | | | $ | 1,839,794 | | | $ | 4 | |
| | | | | | | | | | | | | | | | | | | | | | | | | | | | | | | | | | | | | | |
| | (a) | Represents net amount purchased (sold). | |
| | (b) | All or a portion represents securities lending income earned from the reinvestment of cash collateral from loaned securities, net of fees and collateral investment expenses, and other payments to and from borrowers of securities. | |
| | (c) | As of period end, the entity is no longer held. | |
Derivative Financial Instruments Outstanding as of Period End
Futures Contracts
| | | | | | | | | | | | | | | | |
| Description | | Number of
Contracts | | | Expiration
Date | | | Notional
Amount
(000) | | | Value/
Unrealized
Appreciation
(Depreciation) | |
| | | | |
Long Contracts | | | | | | | | | | | | | | | | |
E-mini Technology Select Sector Index | | | 26 | | | | 06/16/23 | | | $ | 3,993 | | | $ | 332,338 | |
S&P 500 E-mini Index | | | 93 | | | | 06/16/23 | | | | 19,241 | | | | 1,057,845 | |
| | | | | | | | | | | | | | | | |
| | | | | | | | | | | | | | $ | 1,390,183 | |
| | | | | | | | | | | | | | | | |
| | |
| 54 | | 2 0 2 3 I SHARES ANNUAL REPORT TO SHAREHOLDERS |
| | |
Schedule of Investments (continued) March 31, 2023 | | iShares® Core S&P U.S. Growth ETF |
Derivative Financial Instruments Categorized by Risk Exposure
As of period end, the fair values of derivative financial instruments located in the Statements of Assets and Liabilities were as follows:
| | | | | | | | | | | | | | | | | | | | | | | | | | | | |
| | | Commodity
Contracts | | | Credit
Contracts | | | Equity
Contracts | | | Foreign
Currency
Exchange
Contracts | | | Interest
Rate
Contracts | | | Other
Contracts | | | Total | |
Assets — Derivative Financial Instruments | | | | | | | | | | | | | | | | | | | | | | | | | | | | |
Futures contracts | | | | | | | | | | | | | | | | | | | | | | | | | | | | |
Unrealized appreciation on futures contracts(a) | | $ | — | | | $ | — | | | $ | 1,390,183 | | | $ | — | | | $ | — | | | $ | — | | | $ | 1,390,183 | |
| | | | | | | | | | | | | | | | | | | | | | | | | | | | |
| | (a) | Net cumulative unrealized appreciation (depreciation) on futures contracts, if any, are reported in the Schedule of Investments. In the Statements of Assets and Liabilities, only current day’s variation margin is reported in receivables or payables and the net cumulative unrealized appreciation (depreciation) is included in accumulated earnings (loss). | |
For the period ended March 31, 2023, the effect of derivative financial instruments in the Statements of Operations was as follows:
| | | | | | | | | | | | | | | | | | | | | | | | | | | | |
| | | Commodity
Contracts | | | Credit
Contracts | | | Equity
Contracts | | | Foreign
Currency
Exchange
Contracts | | | Interest
Rate
Contracts | | | Other
Contracts | | | Total | |
Net Realized Gain (Loss) from | | | | | | | | | | | | | | | | | | | | | | | | | | | | |
Futures contracts | | $ | — | | | $ | — | | | $ | (4,567,797 | ) | | $ | — | | | $ | — | | | $ | — | | | $ | (4,567,797 | ) |
| | | | | | | | | | | | | | | | | | | | | | | | | | | | |
Net Change in Unrealized Appreciation (Depreciation) on | | | | | | | | | | | | | | | | | | | | | | | | | | | | |
Futures contracts | | $ | — | | | $ | — | | | $ | (46,777 | ) | | $ | — | | | $ | — | | | $ | — | | | $ | (46,777 | ) |
| | | | | | | | | | | | | | | | | | | | | | | | | | | | |
Average Quarterly Balances of Outstanding Derivative Financial Instruments
| | | | |
Futures contracts | | | | |
Average notional value of contracts — long | | $ | 19,560,256 | |
For more information about the Fund’s investment risks regarding derivative financial instruments, refer to the Notes to Financial Statements.
Fair Value Hierarchy as of Period End
Various inputs are used in determining the fair value of financial instruments. For a description of the input levels and information about the Fund’s policy regarding valuation of financial instruments, refer to the Notes to Financial Statements.
The following table summarizes the Fund’s financial instruments categorized in the fair value hierarchy. The breakdown of the Fund’s financial instruments into major categories is disclosed in the Schedule of Investments above.
| | | | | | | | | | | | | | | | |
| | | Level 1 | | | Level 2 | | | Level 3 | | | Total | |
Assets | | | | | | | | | | | | | | | | |
Investments | | | | | | | | | | | | | | | | |
Long-Term Investments | | | | | | | | | | | | | | | | |
Common Stocks | | $ | 12,296,721,139 | | | $ | — | | | $ | — | | | $ | 12,296,721,139 | |
Short-Term Securities | | | | | | | | | | | | | | | | |
Money Market Funds | | | 131,002,011 | | | | — | | | | — | | | | 131,002,011 | |
| | | | | | | | | | | | | | | | |
| | $ | 12,427,723,150 | | | $ | — | | | $ | — | | | $ | 12,427,723,150 | |
| | | | | | | | | | | | | | | | |
Derivative Financial Instruments(a) | | | | | | | | | | | | | | | | |
Assets | | | | | | | | | | | | | | | | |
Equity Contracts | | $ | 1,390,183 | | | $ | — | | | $ | — | | | $ | 1,390,183 | |
| | | | | | | | | | | | | | | | |
| | (a) | Derivative financial instruments are futures contracts. Futures contracts are valued at the unrealized appreciation (depreciation) on the instrument. | |
See notes to financial statements.
| | |
SCHEDULES OF INVESTMENTS | | 55 |
| | |
Schedule of Investments March 31, 2023 | | iShares® Core S&P U.S. Value ETF (Percentages shown are based on Net Assets) |
| | | | | | | | |
| Security | | Shares | | | Value | |
|
Common Stocks | |
|
| Aerospace & Defense — 2.5% | |
Boeing Co.(a) | | | 434,935 | | | $ | 92,393,242 | |
General Dynamics Corp. | | | 82,099 | | | | 18,735,813 | |
Hexcel Corp. | | | 66,040 | | | | 4,507,230 | |
Howmet Aerospace, Inc. | | | 284,374 | | | | 12,048,926 | |
Huntington Ingalls Industries, Inc. | | | 31,003 | | | | 6,418,241 | |
L3Harris Technologies, Inc. | | | 73,378 | | | | 14,399,699 | |
Lockheed Martin Corp. | | | 50,905 | | | | 24,064,321 | |
Mercury Systems, Inc.(a) | | | 18,586 | | | | 950,116 | |
Northrop Grumman Corp. | | | 31,162 | | | | 14,388,119 | |
Raytheon Technologies Corp. | | | 1,133,040 | | | | 110,958,607 | |
Textron, Inc. | | | 161,166 | | | | 11,383,155 | |
TransDigm Group, Inc. | | | 21,309 | | | | 15,705,798 | |
Woodward, Inc. | | | 45,935 | | | | 4,472,691 | |
| | | | | | | | |
| | |
| | | | | | | 330,425,958 | |
|
| Air Freight & Logistics — 1.2% | |
CH Robinson Worldwide, Inc. | | | 41,322 | | | | 4,106,167 | |
FedEx Corp. | | | 179,595 | | | | 41,035,662 | |
GXO Logistics, Inc.(a)(b) | | | 93,162 | | | | 4,700,955 | |
United Parcel Service, Inc., Class B | | | 564,465 | | | | 109,500,565 | |
| | | | | | | | |
| | |
| | | | | | | 159,343,349 | |
|
| Automobile Components — 0.4% | |
Adient PLC(a)(b) | | | 73,038 | | | | 2,991,636 | |
Aptiv PLC(a) | | | 210,042 | | | | 23,564,612 | |
Autoliv, Inc. | | | 40,962 | | | | 3,824,212 | |
BorgWarner, Inc. | | | 181,879 | | | | 8,932,078 | |
Dana, Inc. | | | 104,482 | | | | 1,572,454 | |
Gentex Corp. | | | 96,706 | | | | 2,710,669 | |
Goodyear Tire & Rubber Co.(a) | | | 226,984 | | | | 2,501,364 | |
Lear Corp. | | | 46,136 | | | | 6,435,511 | |
| | | | | | | | |
| | |
| | | | | | | 52,532,536 | |
|
| Automobiles — 0.6% | |
Ford Motor Co. | | | 3,028,228 | | | | 38,155,673 | |
General Motors Co. | | | 1,078,656 | | | | 39,565,102 | |
Harley-Davidson, Inc. | | | 37,563 | | | | 1,426,267 | |
Thor Industries, Inc. | | | 40,971 | | | | 3,262,930 | |
| | | | | | | | |
| | |
| | | | | | | 82,409,972 | |
|
| Banks — 6.8% | |
Associated Banc-Corp. | | | 121,001 | | | | 2,175,598 | |
Bank of America Corp. | | | 5,398,138 | | | | 154,386,747 | |
Bank of Hawaii Corp. | | | 14,963 | | | | 779,273 | |
Bank OZK | | | 87,688 | | | | 2,998,930 | |
Cadence Bank | | | 42,877 | | | | 890,127 | |
Cathay General Bancorp | | | 27,842 | | | | 961,106 | |
Citigroup, Inc. | | | 1,498,013 | | | | 70,241,830 | |
Citizens Financial Group, Inc. | | | 382,913 | | | | 11,629,068 | |
Columbia Banking System, Inc. | | | 78,840 | | | | 1,688,753 | |
Comerica, Inc. | | | 101,936 | | | | 4,426,061 | |
Commerce Bancshares, Inc. | | | 27,866 | | | | 1,625,981 | |
Cullen/Frost Bankers, Inc. | | | 16,176 | | | | 1,703,980 | |
East West Bancorp, Inc. | | | 54,718 | | | | 3,036,849 | |
Fifth Third Bancorp | | | 528,393 | | | | 14,076,390 | |
First Financial Bankshares, Inc. | | | 46,575 | | | | 1,485,742 | |
First Horizon Corp. | | | 139,288 | | | | 2,476,541 | |
First Republic Bank(b) | | | 146,182 | | | | 2,045,086 | |
FNB Corp. | | | 287,999 | | | | 3,340,788 | |
Fulton Financial Corp. | | | 65,208 | | | | 901,175 | |
Glacier Bancorp, Inc. | | | 38,902 | | | | 1,634,273 | |
Hancock Whitney Corp. | | | 33,800 | | | | 1,230,320 | |
Home BancShares, Inc. | | | 150,424 | | | | 3,265,705 | |
| | | | | | | | |
| Security | | Shares | | | Value | |
|
| Banks (continued) | |
Huntington Bancshares, Inc. | | | 1,121,488 | | | $ | 12,560,666 | |
International Bancshares Corp. | | | 15,709 | | | | 672,659 | |
JPMorgan Chase & Co. | | | 2,268,618 | | | | 295,623,612 | |
KeyCorp | | | 726,757 | | | | 9,098,998 | |
M&T Bank Corp. | | | 130,925 | | | | 15,654,702 | |
New York Community Bancorp, Inc., Class A | | | 533,708 | | | | 4,824,720 | |
Old National Bancorp | | | 226,546 | | | | 3,266,793 | |
PacWest Bancorp(b) | | | 94,780 | | | | 922,209 | |
Pinnacle Financial Partners, Inc. | | | 60,140 | | | | 3,317,322 | |
PNC Financial Services Group, Inc. | | | 310,143 | | | | 39,419,175 | |
Prosperity Bancshares, Inc. | | | 71,537 | | | | 4,400,956 | |
Regions Financial Corp. | | | 726,415 | | | | 13,482,262 | |
SouthState Corp. | | | 25,282 | | | | 1,801,595 | |
Synovus Financial Corp. | | | 114,547 | | | | 3,531,484 | |
Texas Capital Bancshares, Inc.(a) | | | 37,297 | | | | 1,826,061 | |
Truist Financial Corp. | | | 1,029,037 | | | | 35,090,162 | |
U.S. Bancorp | | | 1,077,543 | | | | 38,845,425 | |
UMB Financial Corp. | | | 34,808 | | | | 2,009,118 | |
United Bankshares, Inc. | | | 53,069 | | | | 1,868,029 | |
Valley National Bancorp | | | 325,069 | | | | 3,003,638 | |
Webster Financial Corp. | | | 135,662 | | | | 5,347,796 | |
Wells Fargo & Co. | | | 2,947,128 | | | | 110,163,645 | |
Wintrust Financial Corp. | | | 47,950 | | | | 3,497,952 | |
Zions Bancorp N.A | | | 116,939 | | | | 3,499,984 | |
| | | | | | | | |
| | |
| | | | | | | 900,729,286 | |
|
| Beverages — 0.8% | |
Boston Beer Co., Inc., Class A, NVS(a) | | | 2,241 | | | | 736,617 | |
Brown-Forman Corp., Class B, NVS | | | 64,831 | | | | 4,166,688 | |
Coca-Cola Co. | | | 1,053,582 | | | | 65,353,692 | |
Coca-Cola Consolidated, Inc. | | | 3,514 | | | | 1,880,271 | |
Constellation Brands, Inc., Class A | | | 55,072 | | | | 12,440,214 | |
Keurig Dr Pepper, Inc. | | | 327,823 | | | | 11,565,595 | |
Molson Coors Beverage Co., Class B | | | 145,976 | | | | 7,544,040 | |
| | | | | | | | |
| | |
| | | | | | | 103,687,117 | |
|
| Biotechnology — 0.1% | |
Arrowhead Pharmaceuticals, Inc.(a) | | | 42,027 | | | | 1,067,486 | |
Biogen, Inc.(a) | | | 58,846 | | | | 16,360,953 | |
| | | | | | | | |
| | |
| | | | | | | 17,428,439 | |
|
| Broadline Retail — 3.1% | |
Amazon.com, Inc.(a) | | | 3,723,399 | | | | 384,589,883 | |
eBay, Inc. | | | 418,222 | | | | 18,556,510 | |
Etsy, Inc.(a)(b) | | | 41,380 | | | | 4,606,835 | |
Kohl’s Corp. | | | 89,048 | | | | 2,096,190 | |
Macy’s, Inc. | | | 212,809 | | | | 3,722,030 | |
Nordstrom, Inc. | | | 90,223 | | | | 1,467,928 | |
Ollie’s Bargain Outlet Holdings, Inc.(a) | | | 22,655 | | | | 1,312,631 | |
| | | | | | | | |
| | |
| | | | | | | 416,352,007 | |
|
| Building Products — 0.9% | |
A O Smith Corp. | | | 99,097 | | | | 6,852,558 | |
Advanced Drainage Systems, Inc.(b) | | | 11,172 | | | | 940,794 | |
Allegion PLC | | | 68,274 | | | | 7,286,884 | |
Carrier Global Corp. | | | 645,035 | | | | 29,510,351 | |
Fortune Brands Innovations, Inc. | | | 100,096 | | | | 5,878,638 | |
Johnson Controls International PLC | | | 530,869 | | | | 31,968,931 | |
Lennox International, Inc. | | | 9,366 | | | | 2,353,489 | |
Masco Corp. | | | 49,932 | | | | 2,482,619 | |
Owens Corning | | | 32,815 | | | | 3,143,677 | |
Trane Technologies PLC | | | 177,171 | | | | 32,595,921 | |
Trex Co., Inc.(a)(b) | | | 39,375 | | | | 1,916,381 | |
| | | | | | | | |
| | |
| | | | | | | 124,930,243 | |
| | |
| 56 | | 2 0 2 3 I SHARES ANNUAL REPORT TO SHAREHOLDERS |
| | |
Schedule of Investments (continued) March 31, 2023 | | iShares® Core S&P U.S. Value ETF (Percentages shown are based on Net Assets) |
| | | | | | | | |
| Security | | Shares | | | Value | |
|
| Capital Markets — 4.7% | |
Affiliated Managers Group, Inc. | | | 9,785 | | | $ | 1,393,580 | |
Bank of New York Mellon Corp. | | | 569,940 | | | | 25,898,074 | |
BlackRock, Inc.(c) | | | 115,823 | | | | 77,499,486 | |
Cboe Global Markets, Inc. | | | 26,413 | | | | 3,545,681 | |
Charles Schwab Corp. | | | 483,679 | | | | 25,335,106 | |
CME Group, Inc., Class A | | | 278,148 | | | | 53,270,905 | |
Evercore, Inc., Class A | | | 13,643 | | | | 1,574,129 | |
FactSet Research Systems, Inc. | | | 11,919 | | | | 4,947,458 | |
Federated Hermes, Inc., Class B | | | 20,017 | | | | 803,482 | |
Franklin Resources, Inc. | | | 221,728 | | | | 5,973,352 | |
Goldman Sachs Group, Inc. | | | 261,913 | | | | 85,674,362 | |
Interactive Brokers Group, Inc., Class A | | | 34,804 | | | | 2,873,418 | |
Intercontinental Exchange, Inc. | | | 433,246 | | | | 45,183,225 | |
Invesco Ltd. | | | 354,004 | | | | 5,805,666 | |
Janus Henderson Group PLC | | | 106,410 | | | | 2,834,762 | |
MarketAxess Holdings, Inc. | | | 15,100 | | | | 5,908,479 | |
Moody’s Corp. | | | 64,406 | | | | 19,709,524 | |
Morgan Stanley | | | 1,010,487 | | | | 88,720,759 | |
MSCI, Inc., Class A | | | 26,506 | | | | 14,835,143 | |
Nasdaq, Inc. | | | 95,226 | | | | 5,206,006 | |
Northern Trust Corp. | | | 160,640 | | | | 14,157,203 | |
S&P Global, Inc. | | | 254,616 | | | | 87,783,958 | |
State Street Corp. | | | 269,421 | | | | 20,392,476 | |
Stifel Financial Corp. | | | 81,180 | | | | 4,796,926 | |
T Rowe Price Group, Inc. | | | 173,457 | | | | 19,583,295 | |
| | | | | | | | |
| | |
| | | | | | | 623,706,455 | |
|
| Chemicals — 2.1% | |
Ashland, Inc. | | | 12,535 | | | | 1,287,470 | |
Avient Corp. | | | 65,257 | | | | 2,685,978 | |
Axalta Coating Systems Ltd.(a)(b) | | | 94,238 | | | | 2,854,469 | |
Celanese Corp., Class A | | | 77,379 | | | | 8,425,799 | |
Chemours Co. | | | 49,546 | | | | 1,483,407 | |
Corteva, Inc. | | | 171,191 | | | | 10,324,529 | |
Dow, Inc. | | | 545,101 | | | | 29,882,437 | |
DuPont de Nemours, Inc. | | | 353,992 | | | | 25,406,006 | |
Eastman Chemical Co. | | | 93,119 | | | | 7,853,656 | |
Ecolab, Inc. | | | 191,963 | | | | 31,775,635 | |
International Flavors & Fragrances, Inc. | | | 197,830 | | | | 18,192,447 | |
Linde PLC | | | 148,563 | | | | 52,805,233 | |
LyondellBasell Industries NV, Class A | | | 195,850 | | | | 18,388,356 | |
NewMarket Corp. | | | 2,400 | | | | 875,952 | |
PPG Industries, Inc. | | | 182,308 | | | | 24,352,703 | |
Scotts Miracle-Gro Co. | | | 30,888 | | | | 2,154,129 | |
Sensient Technologies Corp. | | | 32,094 | | | | 2,457,117 | |
Sherwin-Williams Co. | | | 182,345 | | | | 40,985,686 | |
Valvoline, Inc. | | | 72,966 | | | | 2,549,432 | |
| | | | | | | | |
| | |
| | | | | | | 284,740,441 | |
|
| Commercial Services & Supplies — 0.4% | |
Brink’s Co. | | | 18,788 | | | | 1,255,039 | |
Cintas Corp. | | | 27,309 | | | | 12,635,328 | |
MSA Safety, Inc. | | | 12,670 | | | | 1,691,445 | |
Republic Services, Inc. | | | 71,522 | | | | 9,671,205 | |
Stericycle, Inc.(a) | | | 73,912 | | | | 3,223,302 | |
Tetra Tech, Inc. | | | 17,396 | | | | 2,555,646 | |
Waste Management, Inc. | | | 117,783 | | | | 19,218,652 | |
| | | | | | | | |
| | |
| | | | | | | 50,250,617 | |
|
| Communications Equipment — 1.6% | |
Ciena Corp.(a) | | | 115,675 | | | | 6,075,251 | |
Cisco Systems, Inc. | | | 3,177,309 | | | | 166,093,828 | |
F5, Inc.(a) | | | 46,573 | | | | 6,785,220 | |
Juniper Networks, Inc. | | | 251,715 | | | | 8,664,030 | |
| | | | | | | | |
| Security | | Shares | | | Value | |
|
| Communications Equipment (continued) | |
Lumentum Holdings, Inc.(a)(b) | | | 52,051 | | | $ | 2,811,275 | |
Motorola Solutions, Inc. | | | 58,044 | | | | 16,608,130 | |
| | | | | | | | |
| | |
| | | | | | | 207,037,734 | |
|
| Construction & Engineering — 0.1% | |
AECOM | | | 49,049 | | | | 4,135,812 | |
Fluor Corp.(a) | | | 108,466 | | | | 3,352,684 | |
MasTec, Inc.(a) | | | 46,329 | | | | 4,375,311 | |
MDU Resources Group, Inc. | | | 159,525 | | | | 4,862,322 | |
| | | | | | | | |
| | |
| | | | | | | 16,726,129 | |
|
| Construction Materials — 0.2% | |
Martin Marietta Materials, Inc. | | | 47,875 | | | | 16,998,497 | |
Vulcan Materials Co. | | | 42,316 | | | | 7,259,733 | |
| | | | | | | | |
| | |
| | | | | | | 24,258,230 | |
|
| Consumer Finance — 0.7% | |
American Express Co. | | | 234,834 | | | | 38,735,868 | |
Capital One Financial Corp. | | | 294,329 | | | | 28,302,677 | |
Discover Financial Services | | | 86,732 | | | | 8,572,591 | |
Navient Corp. | | | 80,740 | | | | 1,291,032 | |
Synchrony Financial | | | 338,022 | | | | 9,829,680 | |
| | | | | | | | |
| | |
| | | | | | | 86,731,848 | |
|
| Consumer Staples Distribution & Retail — 2.8% | |
BJ’s Wholesale Club Holdings, Inc.(a) | | | 44,329 | | | | 3,372,107 | |
Costco Wholesale Corp. | | | 116,680 | | | | 57,974,792 | |
Grocery Outlet Holding Corp.(a)(b) | | | 68,470 | | | | 1,934,962 | |
Kroger Co. | | | 505,150 | | | | 24,939,255 | |
Performance Food Group Co.(a)(b) | | | 65,358 | | | | 3,943,702 | |
Sprouts Farmers Market, Inc.(a)(b) | | | 37,163 | | | | 1,301,820 | |
Sysco Corp. | | | 392,558 | | | | 30,317,254 | |
Target Corp. | | | 356,017 | | | | 58,967,096 | |
U.S. Foods Holding Corp.(a) | | | 114,457 | | | | 4,228,042 | |
Walgreens Boots Alliance, Inc. | | | 553,385 | | | | 19,136,053 | |
Walmart, Inc. | | | 1,084,600 | | | | 159,924,270 | |
| | | | | | | | |
| | |
| | | | | | | 366,039,353 | |
|
| Containers & Packaging — 0.6% | |
Amcor PLC | | | 1,149,433 | | | | 13,080,547 | |
AptarGroup, Inc. | | | 26,405 | | | | 3,120,807 | |
Avery Dennison Corp. | | | 62,505 | | | | 11,184,020 | |
Ball Corp. | | | 242,093 | | | | 13,341,745 | |
Greif, Inc., Class A, NVS | | | 19,798 | | | | 1,254,599 | |
International Paper Co. | | | 275,029 | | | | 9,917,546 | |
Packaging Corp. of America | | | 71,608 | | | | 9,941,339 | |
Sealed Air Corp. | | | 112,922 | | | | 5,184,249 | |
Sonoco Products Co. | | | 36,472 | | | | 2,224,792 | |
Westrock Co. | | | 197,709 | | | | 6,024,193 | |
| | | | | | | | |
| | |
| | | | | | | 75,273,837 | |
|
| Distributors — 0.2% | |
Genuine Parts Co. | | | 30,833 | | | | 5,158,669 | |
LKQ Corp. | | | 196,142 | | | | 11,133,020 | |
Pool Corp. | | | 11,029 | | | | 3,776,771 | |
| | | | | | | | |
| | |
| | | | | | | 20,068,460 | |
|
| Diversified Consumer Services — 0.0% | |
Graham Holdings Co., Class B | | | 2,935 | | | | 1,748,790 | |
| | | | | | | | |
|
| Diversified Telecommunication Services — 1.8% | |
AT&T Inc. | | | 5,512,983 | | | | 106,124,923 | |
Frontier Communications Parent, Inc.(a) | | | 174,812 | | | | 3,980,469 | |
Verizon Communications, Inc. | | | 3,248,299 | | | | 126,326,348 | |
| | | | | | | | |
| | |
| | | | | | | 236,431,740 | |
| | |
SCHEDULES OF INVESTMENTS | | 57 |
| | |
Schedule of Investments (continued) March 31, 2023 | | iShares® Core S&P U.S. Value ETF (Percentages shown are based on Net Assets) |
| | | | | | | | |
| Security | | Shares | | | Value | |
|
| Electric Utilities — 3.7% | |
ALLETE, Inc. | | | 43,634 | | | $ | 2,808,721 | |
Alliant Energy Corp. | | | 193,925 | | | | 10,355,595 | |
American Electric Power Co., Inc. | | | 397,431 | | | | 36,162,247 | |
Constellation Energy Corp. | | | 253,590 | | | | 19,906,815 | |
Duke Energy Corp. | | | 595,533 | | | | 57,451,069 | |
Edison International | | | 296,481 | | | | 20,928,594 | |
Entergy Corp. | | | 156,931 | | | | 16,907,746 | |
Evergy, Inc. | | | 177,255 | | | | 10,833,826 | |
Eversource Energy | | | 270,118 | | | | 21,139,435 | |
Exelon Corp. | | | 768,581 | | | | 32,195,858 | |
FirstEnergy Corp. | | | 418,839 | | | | 16,778,690 | |
Hawaiian Electric Industries, Inc. | | | 87,786 | | | | 3,370,982 | |
IDACORP, Inc. | | | 18,140 | | | | 1,965,106 | |
NextEra Energy, Inc. | | | 1,536,928 | | | | 118,466,410 | |
NRG Energy, Inc. | | | 93,216 | | | | 3,196,377 | |
Pinnacle West Capital Corp. | | | 87,977 | | | | 6,971,297 | |
PNM Resources, Inc. | | | 24,902 | | | | 1,212,229 | |
Portland General Electric Co. | | | 68,153 | | | | 3,332,000 | |
PPL Corp. | | | 567,871 | | | | 15,781,135 | |
Southern Co. | | | 842,011 | | | | 58,587,125 | |
Xcel Energy, Inc. | | | 423,262 | | | | 28,544,789 | |
| | | | | | | | |
| | |
| | | | | | | 486,896,046 | |
|
| Electrical Equipment — 1.1% | |
Acuity Brands, Inc. | | | 12,264 | | | | 2,241,001 | |
AMETEK, Inc. | | | 88,570 | | | | 12,871,878 | |
Eaton Corp. PLC | | | 307,586 | | | | 52,701,785 | |
Emerson Electric Co. | | | 441,939 | | | | 38,510,564 | |
EnerSys | | | 31,178 | | | | 2,708,745 | |
Generac Holdings, Inc.(a)(b) | | | 49,655 | | | | 5,363,236 | |
Regal Rexnord Corp. | | | 51,588 | | | | 7,259,979 | |
Rockwell Automation, Inc. | | | 88,580 | | | | 25,993,801 | |
SunPower Corp.(a)(b) | | | 28,669 | | | | 396,779 | |
Sunrun, Inc.(a)(b) | | | 162,677 | | | | 3,277,942 | |
Vicor Corp.(a) | | | 9,707 | | | | 455,647 | |
| | | | | | | | |
| | |
| | | | | | | 151,781,357 | |
|
| Electronic Equipment, Instruments & Components — 1.1% | |
Arrow Electronics, Inc.(a) | | | 45,282 | | | | 5,654,363 | |
Avnet, Inc. | | | 69,853 | | | | 3,157,356 | |
CDW Corp. | | | 38,942 | | | | 7,589,406 | |
Cognex Corp. | | | 63,377 | | | | 3,140,330 | |
Coherent Corp.(a)(b) | | | 105,864 | | | | 4,031,301 | |
Corning, Inc. | | | 590,801 | | | | 20,843,459 | |
IPG Photonics Corp.(a) | | | 24,549 | | | | 3,027,137 | |
Jabil, Inc. | | | 103,049 | | | | 9,084,800 | |
Keysight Technologies, Inc.(a) | | | 63,507 | | | | 10,255,110 | |
Littelfuse, Inc. | | | 7,275 | | | | 1,950,355 | |
National Instruments Corp. | | | 41,873 | | | | 2,194,564 | |
TD SYNNEX Corp. | | | 32,097 | | | | 3,106,669 | |
TE Connectivity Ltd. | | | 244,756 | | | | 32,099,750 | |
Teledyne Technologies, Inc.(a) | | | 36,143 | | | | 16,168,933 | |
Trimble, Inc.(a) | | | 190,786 | | | | 10,001,002 | |
Vishay Intertechnology, Inc. | | | 100,218 | | | | 2,266,931 | |
Vontier Corp. | | | 122,201 | | | | 3,340,975 | |
Zebra Technologies Corp., Class A(a) | | | 39,918 | | | | 12,693,924 | |
| | | | | | | | |
| | |
| | | | | | | 150,606,365 | |
|
| Energy Equipment & Services — 0.5% | |
Baker Hughes Co., Class A | | | 776,811 | | | | 22,418,765 | |
Halliburton Co. | | | 699,237 | | | | 22,123,859 | |
Schlumberger NV | | | 516,327 | | | | 25,351,656 | |
| | | | | | | | |
| | |
| | | | | | | 69,894,280 | |
| | | | | | | | |
| Security | | Shares | | | Value | |
|
| Entertainment — 2.5% | |
Activision Blizzard, Inc. | | | 225,231 | | | $ | 19,277,521 | |
Electronic Arts, Inc. | | | 65,104 | | | | 7,841,777 | |
Live Nation Entertainment, Inc.(a) | | | 110,850 | | | | 7,759,500 | |
Netflix, Inc.(a) | | | 344,448 | | | | 118,999,895 | |
Take-Two Interactive Software, Inc.(a)(b) | | | 122,803 | | | | 14,650,398 | |
Walt Disney Co.(a) | | | 1,412,895 | | | | 141,473,176 | |
Warner Bros Discovery, Inc., Class A(a) | | | 1,712,855 | | | | 25,864,111 | |
| | | | | | | | |
| | |
| | | | | | | 335,866,378 | |
|
| Financial Services — 4.4% | |
Berkshire Hathaway, Inc., Class B(a) | | | 1,393,499 | | | | 430,270,686 | |
Essent Group Ltd. | | | 85,568 | | | | 3,426,998 | |
Euronet Worldwide, Inc.(a)(b) | | | 18,341 | | | | 2,052,358 | |
Fidelity National Information Services, Inc. | | | 459,456 | | | | 24,962,245 | |
Fiserv, Inc.(a) | | | 152,923 | | | | 17,284,887 | |
FleetCor Technologies, Inc.(a) | | | 27,154 | | | | 5,725,421 | |
Global Payments, Inc. | | | 203,085 | | | | 21,372,665 | |
MGIC Investment Corp. | | | 225,110 | | | | 3,020,976 | |
PayPal Holdings, Inc.(a) | | | 875,033 | | | | 66,450,006 | |
Voya Financial, Inc. | | | 75,134 | | | | 5,369,076 | |
Western Union Co. | | | 262,962 | | | | 2,932,026 | |
| | | | | | | | |
| | |
| | | | | | | 582,867,344 | |
|
| Food Products — 1.2% | |
Archer-Daniels-Midland Co. | | | 215,791 | | | | 17,189,911 | |
Bunge Ltd. | | | 68,440 | | | | 6,537,389 | |
Campbell Soup Co. | | | 62,849 | | | | 3,455,438 | |
Conagra Brands, Inc. | | | 368,630 | | | | 13,845,743 | |
Flowers Foods, Inc. | | | 54,267 | | | | 1,487,459 | |
General Mills, Inc. | | | 146,461 | | | | 12,516,557 | |
Hormel Foods Corp. | | | 61,873 | | | | 2,467,495 | |
Ingredion, Inc. | | | 51,410 | | | | 5,229,939 | |
J M Smucker Co. | | | 82,173 | | | | 12,931,565 | |
Kellogg Co. | | | 89,684 | | | | 6,005,241 | |
Kraft Heinz Co. | | | 617,038 | | | | 23,860,859 | |
McCormick & Co., Inc., NVS | | | 95,239 | | | | 7,924,837 | |
Mondelez International, Inc., Class A | | | 484,441 | | | | 33,775,227 | |
Pilgrim’s Pride Corp.(a) | | | 37,969 | | | | 880,121 | |
Post Holdings, Inc.(a) | | | 41,525 | | | | 3,731,852 | |
Tyson Foods, Inc., Class A | | | 220,901 | | | | 13,103,847 | |
| | | | | | | | |
| | |
| | | | | | | 164,943,480 | |
|
| Gas Utilities — 0.1% | |
Atmos Energy Corp. | | | 42,837 | | | | 4,813,165 | |
National Fuel Gas Co. | | | 20,955 | | | | 1,209,942 | |
New Jersey Resources Corp. | | | 25,707 | | | | 1,367,612 | |
Southwest Gas Holdings, Inc. | | | 50,266 | | | | 3,139,112 | |
Spire, Inc. | | | 20,446 | | | | 1,434,083 | |
UGI Corp. | | | 163,250 | | | | 5,674,570 | |
| | | | | | | | |
| | |
| | | | | | | 17,638,484 | |
|
| Ground Transportation — 1.0% | |
CSX Corp. | | | 847,303 | | | | 25,368,252 | |
Hertz Global Holdings, Inc.(a) | | | 125,220 | | | | 2,039,834 | |
Knight-Swift Transportation Holdings, Inc. | | | 61,336 | | | | 3,470,391 | |
Norfolk Southern Corp. | | | 176,173 | | | | 37,348,676 | |
Ryder System, Inc. | | | 38,370 | | | | 3,424,139 | |
Saia, Inc.(a)(b) | | | 8,676 | | | | 2,360,566 | |
Union Pacific Corp. | | | 236,623 | | | | 47,622,745 | |
Werner Enterprises, Inc. | | | 45,483 | | | | 2,069,022 | |
XPO, Inc.(a) | | | 87,904 | | | | 2,804,137 | |
| | | | | | | | |
| | |
| | | | | | | 126,507,762 | |
|
| Health Care Equipment & Supplies — 4.2% | |
Abbott Laboratories | | | 647,295 | | | | 65,545,092 | |
| | |
| 58 | | 2 0 2 3 I SHARES ANNUAL REPORT TO SHAREHOLDERS |
| | |
Schedule of Investments (continued) March 31, 2023 | | iShares® Core S&P U.S. Value ETF (Percentages shown are based on Net Assets) |
| | | | | | | | |
| Security | | Shares | | | Value | |
|
| Health Care Equipment & Supplies (continued) | |
Align Technology, Inc.(a) | | | 56,089 | | | $ | 18,741,578 | |
Baxter International, Inc. | | | 391,441 | | | | 15,876,847 | |
Becton Dickinson & Co. | | | 219,577 | | | | 54,354,090 | |
Boston Scientific Corp.(a) | | | 522,026 | | | | 26,116,961 | |
Cooper Cos., Inc. | | | 38,079 | | | | 14,217,175 | |
DENTSPLY SIRONA, Inc. | | | 168,182 | | | | 6,606,189 | |
Edwards Lifesciences Corp.(a)(b) | | | 478,181 | | | | 39,559,914 | |
Enovis Corp.(a) | | | 36,373 | | | | 1,945,592 | |
Envista Holdings Corp.(a) | | | 127,726 | | | | 5,221,439 | |
GE HealthCare Technologies, Inc.(a) | | | 281,298 | | | | 23,074,875 | |
ICU Medical, Inc.(a)(b) | | | 15,371 | | | | 2,535,600 | |
IDEXX Laboratories, Inc.(a) | | | 32,602 | | | | 16,303,608 | |
Integra LifeSciences Holdings Corp.(a)(b) | | | 55,458 | | | | 3,183,844 | |
Intuitive Surgical, Inc.(a) | | | 138,206 | | | | 35,307,487 | |
LivaNova PLC(a) | | | 40,850 | | | | 1,780,243 | |
Masimo Corp.(a) | | | 13,665 | | | | 2,521,739 | |
Medtronic PLC | | | 1,028,800 | | | | 82,941,856 | |
Neogen Corp.(a) | | | 164,980 | | | | 3,055,430 | |
Omnicell, Inc.(a) | | | 34,073 | | | | 1,999,063 | |
Penumbra, Inc.(a) | | | 10,728 | | | | 2,989,786 | |
QuidelOrtho Corp.(a) | | | 18,375 | | | | 1,637,029 | |
ResMed, Inc. | | | 52,028 | | | | 11,393,612 | |
STAAR Surgical Co.(a) | | | 11,769 | | | | 752,627 | |
STERIS PLC | | | 76,785 | | | | 14,687,435 | |
Stryker Corp. | | | 260,763 | | | | 74,440,014 | |
Teleflex, Inc. | | | 36,316 | | | | 9,199,206 | |
Zimmer Biomet Holdings, Inc. | | | 162,859 | | | | 21,041,383 | |
| | | | | | | | |
| | |
| | | | | | | 557,029,714 | |
|
| Health Care Providers & Services — 2.1% | |
Acadia Healthcare Co., Inc.(a) | | | 29,167 | | | | 2,107,316 | |
Amedisys, Inc.(a) | | | 26,400 | | | | 1,941,720 | |
AmerisourceBergen Corp. | | | 124,854 | | | | 19,990,374 | |
Cardinal Health, Inc. | | | 199,263 | | | | 15,044,357 | |
Centene Corp.(a)(b) | | | 425,818 | | | | 26,915,956 | |
Chemed Corp. | | | 3,632 | | | | 1,953,108 | |
Cigna Group | | | 117,817 | | | | 30,105,778 | |
CVS Health Corp. | | | 993,169 | | | | 73,802,388 | |
DaVita, Inc.(a)(b) | | | 41,966 | | | | 3,403,862 | |
Encompass Health Corp. | | | 41,125 | | | | 2,224,863 | |
HCA Healthcare, Inc. | | | 75,752 | | | | 19,974,287 | |
Henry Schein, Inc.(a)(b) | | | 105,034 | | | | 8,564,472 | |
Humana, Inc. | | | 34,803 | | | | 16,895,464 | |
Laboratory Corp. of America Holdings | | | 68,323 | | | | 15,674,663 | |
McKesson Corp. | | | 57,069 | | | | 20,319,417 | |
Patterson Cos., Inc. | | | 69,571 | | | | 1,862,416 | |
Progyny, Inc.(a)(b) | | | 36,182 | | | | 1,162,166 | |
Quest Diagnostics, Inc. | | | 29,554 | | | | 4,181,300 | |
R1 RCM, Inc.(a) | | | 104,924 | | | | 1,573,860 | |
Tenet Healthcare Corp.(a)(b) | | | 84,757 | | | | 5,036,261 | |
Universal Health Services, Inc., Class B | | | 49,908 | | | | 6,343,307 | |
| | | | | | | | |
| | |
| | | | | | | 279,077,335 | |
|
| Health Care REITs — 0.5% | |
Healthcare Realty Trust, Inc. | | | 297,316 | | | | 5,747,118 | |
Healthpeak Properties, Inc. | | | 424,711 | | | | 9,330,901 | |
Medical Properties Trust, Inc. | | | 467,112 | | | | 3,839,661 | |
Omega Healthcare Investors, Inc. | | | 91,166 | | | | 2,498,860 | |
Physicians Realty Trust | | | 176,548 | | | | 2,635,862 | |
Sabra Health Care REIT, Inc. | | | 176,327 | | | | 2,027,760 | |
Ventas, Inc. | | | 308,045 | | | | 13,353,751 | |
Welltower, Inc. | | | 364,360 | | | | 26,120,968 | |
| | | | | | | | |
| | | | | | | 65,554,881 | |
| | | | | | | | |
| Security | | Shares | | | Value | |
|
| Hotel & Resort REITs — 0.1% | |
Host Hotels & Resorts, Inc. | | | 553,237 | | | $ | 9,122,878 | |
Park Hotels & Resorts, Inc. | | | 177,812 | | | | 2,197,756 | |
| | | | | | | | |
| | |
| | | | | | | 11,320,634 | |
|
| Hotels, Restaurants & Leisure — 2.6% | |
Aramark | | | 119,384 | | | | 4,273,947 | |
Booking Holdings, Inc.(a) | | | 29,995 | | | | 79,559,038 | |
Boyd Gaming Corp. | | | 24,831 | | | | 1,592,164 | |
Caesars Entertainment, Inc.(a) | | | 166,443 | | | | 8,124,083 | |
Carnival Corp.(a)(b) | | | 779,326 | | | | 7,910,159 | |
Choice Hotels International, Inc.(b) | | | 8,664 | | | | 1,015,334 | |
Darden Restaurants, Inc. | | | 94,127 | | | | 14,604,745 | |
Domino’s Pizza, Inc. | | | 14,944 | | | | 4,929,577 | |
Expedia Group, Inc.(a) | | | 114,335 | | | | 11,093,925 | |
Hilton Grand Vacations, Inc.(a)(b) | | | 30,207 | | | | 1,342,097 | |
Hilton Worldwide Holdings, Inc. | | | 107,165 | | | | 15,096,334 | |
Las Vegas Sands Corp.(a) | | | 253,373 | | | | 14,556,279 | |
Light & Wonder, Inc., Class A(a) | | | 38,623 | | | | 2,319,311 | |
Marriott International, Inc., Class A | | | 101,662 | | | | 16,879,958 | |
Marriott Vacations Worldwide Corp. | | | 29,250 | | | | 3,944,655 | |
McDonald’s Corp. | | | 215,264 | | | | 60,189,967 | |
MGM Resorts International | | | 243,361 | | | | 10,810,096 | |
Norwegian Cruise Line Holdings Ltd.(a)(b) | | | 329,897 | | | | 4,437,115 | |
Papa John’s International, Inc.(b) | | | 13,505 | | | | 1,011,930 | |
Penn Entertainment, Inc.(a) | | | 118,419 | | | | 3,512,307 | |
Royal Caribbean Cruises Ltd.(a) | | | 169,886 | | | | 11,093,556 | |
Starbucks Corp. | | | 436,266 | | | | 45,428,379 | |
Travel + Leisure Co. | | | 62,043 | | | | 2,432,086 | |
Wyndham Hotels & Resorts, Inc. | | | 32,365 | | | | 2,195,965 | |
Wynn Resorts Ltd.(a) | | | 80,175 | | | | 8,972,384 | |
Yum! Brands, Inc. | | | 78,380 | | | | 10,352,430 | |
| | | | | | | | |
| | |
| | | | | | | 347,677,821 | |
|
| Household Durables — 0.7% | |
DR Horton, Inc. | | | 121,072 | | | | 11,827,524 | |
Garmin Ltd. | | | 118,437 | | | | 11,952,662 | |
Helen of Troy Ltd.(a)(b) | | | 18,312 | | | | 1,742,753 | |
KB Home | | | 63,141 | | | | 2,537,005 | |
Leggett & Platt, Inc. | | | 101,205 | | | | 3,226,415 | |
Lennar Corp., Class A | | | 196,088 | | | | 20,610,810 | |
Mohawk Industries, Inc.(a) | | | 40,251 | | | | 4,033,955 | |
Newell Brands, Inc. | | | 287,328 | | | | 3,574,360 | |
NVR, Inc.(a) | | | 2,355 | | | | 13,122,508 | |
PulteGroup, Inc. | | | 174,307 | | | | 10,158,612 | |
Taylor Morrison Home Corp., Class A(a) | | | 82,712 | | | | 3,164,561 | |
Toll Brothers, Inc. | | | 79,533 | | | | 4,774,366 | |
TopBuild Corp.(a) | | | 11,467 | | | | 2,386,741 | |
Whirlpool Corp. | | | 42,484 | | | | 5,608,738 | |
| | | | | | | | |
| | |
| | | | | | | 98,721,010 | |
|
| Household Products — 1.4% | |
Church & Dwight Co., Inc. | | | 188,050 | | | | 16,625,500 | |
Clorox Co. | | | 52,672 | | | | 8,334,817 | |
Colgate-Palmolive Co. | | | 291,457 | | | | 21,902,994 | |
Energizer Holdings, Inc. | | | 51,376 | | | | 1,782,747 | |
Kimberly-Clark Corp. | | | 135,331 | | | | 18,164,127 | |
Procter & Gamble Co. | | | 821,082 | | | | 122,086,683 | |
| | | | | | | | |
| | |
| | | | | | | 188,896,868 | |
|
| Independent Power and Renewable Electricity Producers — 0.1% | |
AES Corp. | | | 213,485 | | | | 5,140,719 | |
Ormat Technologies, Inc. | | | 16,650 | | | | 1,411,420 | |
| | | | | | | | |
| | |
| | | | | | | 6,552,139 | |
| | |
SCHEDULES OF INVESTMENTS | | 59 |
| | |
Schedule of Investments (continued) March 31, 2023 | | iShares® Core S&P U.S. Value ETF (Percentages shown are based on Net Assets) |
| | | | | | | | |
| Security | | Shares | | | Value | |
|
| Industrial Conglomerates — 1.7% | |
3M Co. | | | 425,768 | | | $ | 44,752,475 | |
General Electric Co.(b) | | | 842,484 | | | | 80,541,470 | |
Honeywell International, Inc. | | | 516,764 | | | | 98,763,936 | |
| | | | | | | | |
| | |
| | | | | | | 224,057,881 | |
|
| Industrial REITs — 0.7% | |
EastGroup Properties, Inc. | | | 14,965 | | | | 2,474,014 | |
First Industrial Realty Trust, Inc. | | | 49,434 | | | | 2,629,889 | |
Prologis, Inc. | | | 713,930 | | | | 89,077,046 | |
Rexford Industrial Realty, Inc. | | | 63,175 | | | | 3,768,388 | |
| | | | | | | | |
| | |
| | | | | | | 97,949,337 | |
|
| Insurance — 2.6% | |
Aflac, Inc. | | | 433,027 | | | | 27,938,902 | |
Allstate Corp. | | | 203,405 | | | | 22,539,308 | |
American Financial Group, Inc. | | | 29,382 | | | | 3,569,913 | |
American International Group, Inc. | | | 574,914 | | | | 28,952,669 | |
Aon PLC, Class A | | | 54,013 | | | | 17,029,759 | |
Arthur J. Gallagher & Co. | | | 58,612 | | | | 11,213,062 | |
Assurant, Inc. | | | 34,810 | | | | 4,179,637 | |
Brighthouse Financial, Inc.(a) | | | 55,294 | | | | 2,439,018 | |
Brown & Brown, Inc. | | | 75,830 | | | | 4,354,159 | |
Chubb Ltd. | | | 138,202 | | | | 26,836,064 | |
Cincinnati Financial Corp. | | | 121,261 | | | | 13,590,933 | |
CNO Financial Group, Inc. | | | 91,585 | | | | 2,032,271 | |
Everest Re Group Ltd. | | | 12,944 | | | | 4,634,211 | |
First American Financial Corp. | | | 77,790 | | | | 4,329,791 | |
Globe Life, Inc. | | | 21,798 | | | | 2,398,216 | |
Hanover Insurance Group, Inc. | | | 11,128 | | | | 1,429,948 | |
Hartford Financial Services Group, Inc. | | | 243,713 | | | | 16,984,359 | |
Kemper Corp. | | | 49,474 | | | | 2,704,249 | |
Lincoln National Corp. | | | 121,860 | | | | 2,738,194 | |
Loews Corp. | | | 150,392 | | | | 8,725,744 | |
Marsh & McLennan Cos., Inc. | | | 137,679 | | | | 22,930,437 | |
MetLife, Inc. | | | 509,958 | | | | 29,546,967 | |
Old Republic International Corp. | | | 213,343 | | | | 5,327,175 | |
Primerica, Inc. | | | 8,721 | | | | 1,502,105 | |
Principal Financial Group, Inc. | | | 69,220 | | | | 5,144,430 | |
Prudential Financial, Inc. | | | 285,239 | | | | 23,600,675 | |
Reinsurance Group of America, Inc. | | | 51,930 | | | | 6,894,227 | |
RenaissanceRe Holdings Ltd. | | | 14,677 | | | | 2,940,390 | |
Travelers Cos., Inc. | | | 82,222 | | | | 14,093,673 | |
Unum Group | | | 145,981 | | | | 5,775,008 | |
Willis Towers Watson PLC | | | 82,569 | | | | 19,187,384 | |
| | | | | | | | |
| | |
| | | | | | | 345,562,878 | |
|
| Interactive Media & Services — 2.8% | |
Match Group, Inc.(a)(b) | | | 216,208 | | | | 8,300,225 | |
Meta Platforms, Inc., Class A(a) | | | 1,721,462 | | | | 364,846,656 | |
TripAdvisor, Inc.(a) | | | 79,986 | | | | 1,588,522 | |
Ziff Davis, Inc.(a) | | | 36,026 | | | | 2,811,830 | |
| | | | | | | | |
| | |
| | | | | | | 377,547,233 | |
|
| IT Services — 1.6% | |
Accenture PLC, Class A | | | 248,399 | | | | 70,994,918 | |
Akamai Technologies, Inc.(a) | | | 121,513 | | | | 9,514,468 | |
Cognizant Technology Solutions Corp., Class A | | | 393,672 | | | | 23,986,435 | |
DXC Technology Co.(a)(b) | | | 180,274 | | | | 4,607,803 | |
EPAM Systems, Inc.(a) | | | 14,416 | | | | 4,310,384 | |
International Business Machines Corp. | | | 699,272 | | | | 91,667,567 | |
Kyndryl Holdings, Inc.(a) | | | 158,368 | | | | 2,337,512 | |
VeriSign, Inc.(a) | | | 36,534 | | | | 7,720,730 | |
| | | | | | | | |
| | |
| | | | | | | 215,139,817 | |
| | | | | | | | |
| Security | | Shares | | | Value | |
|
| Leisure Products — 0.1% | |
Brunswick Corp. | | | 22,686 | | | $ | 1,860,252 | |
Hasbro, Inc. | | | 101,396 | | | | 5,443,951 | |
Mattel, Inc.(a) | | | 277,123 | | | | 5,101,835 | |
Polaris, Inc.(b) | | | 19,975 | | | | 2,209,834 | |
Topgolf Callaway Brands Corp.(a)(b) | | | 107,230 | | | | 2,318,313 | |
YETI Holdings, Inc.(a) | | | 29,623 | | | | 1,184,920 | |
| | | | | | | | |
| | |
| | | | | | | 18,119,105 | |
|
| Life Sciences Tools & Services — 1.0% | |
Agilent Technologies, Inc. | | | 91,308 | | | | 12,631,549 | |
Azenta, Inc.(a) | | | 53,450 | | | | 2,384,939 | |
Bio-Rad Laboratories, Inc., Class A(a) | | | 16,755 | | | | 8,025,980 | |
Bio-Techne Corp.(b) | | | 63,833 | | | | 4,735,770 | |
Bruker Corp. | | | 31,312 | | | | 2,468,638 | |
Charles River Laboratories International,
Inc.(a) | | | 39,427 | | | | 7,957,157 | |
Illumina, Inc.(a) | | | 121,912 | | | | 28,350,636 | |
IQVIA Holdings, Inc.(a) | | | 75,116 | | | | 14,939,821 | |
Mettler-Toledo International, Inc.(a) | | | 5,968 | | | | 9,132,293 | |
PerkinElmer, Inc. | | | 97,335 | | | | 12,970,862 | |
Sotera Health Co.(a) | | | 75,379 | | | | 1,350,038 | |
Syneos Health, Inc.(a) | | | 78,561 | | | | 2,798,343 | |
West Pharmaceutical Services, Inc. | | | 57,198 | | | | 19,817,391 | |
| | | | | | | | |
| | | | | | | 127,563,417 | |
|
| Machinery — 2.4% | |
AGCO Corp. | | | 22,680 | | | | 3,066,336 | |
Caterpillar, Inc. | | | 161,002 | | | | 36,843,698 | |
Chart Industries, Inc.(a)(b) | | | 17,778 | | | | 2,229,361 | |
Crane NXT Co. | | | 18,214 | | | | 2,067,289 | |
Cummins, Inc. | | | 53,805 | | | | 12,852,938 | |
Donaldson Co., Inc. | | | 33,646 | | | | 2,198,430 | |
Dover Corp. | | | 108,231 | | | | 16,444,618 | |
Esab Corp. | | | 39,443 | | | | 2,329,898 | |
Flowserve Corp. | | | 104,570 | | | | 3,555,380 | |
Fortive Corp. | | | 272,829 | | | | 18,598,753 | |
Graco, Inc. | | | 45,042 | | | | 3,288,517 | |
IDEX Corp. | | | 25,310 | | | | 5,847,369 | |
Illinois Tool Works, Inc. | | | 105,205 | | | | 25,612,157 | |
Ingersoll Rand, Inc. | | | 314,480 | | | | 18,296,446 | |
ITT, Inc. | | | 34,079 | | | | 2,941,018 | |
Middleby Corp.(a) | | | 21,392 | | | | 3,136,281 | |
Nordson Corp. | | | 41,584 | | | | 9,242,460 | |
Oshkosh Corp. | | | 51,227 | | | | 4,261,062 | |
Otis Worldwide Corp. | | | 320,870 | | | | 27,081,428 | |
PACCAR, Inc. | | | 403,728 | | | | 29,552,890 | |
Parker-Hannifin Corp. | | | 99,040 | | | | 33,288,334 | |
Pentair PLC | | | 128,471 | | | | 7,100,592 | |
Snap-on, Inc. | | | 17,453 | | | | 4,308,971 | |
Stanley Black & Decker, Inc. | | | 114,579 | | | | 9,232,776 | |
Terex Corp. | | | 51,521 | | | | 2,492,586 | |
Timken Co. | | | 25,768 | | | | 2,105,761 | |
Watts Water Technologies, Inc., Class A | | | 10,004 | | | | 1,683,873 | |
Westinghouse Air Brake Technologies Corp. | | | 140,244 | | | | 14,173,059 | |
Xylem, Inc. | | | 140,152 | | | | 14,673,914 | |
| | | | | | | | |
| | |
| | | | | | | 318,506,195 | |
|
| Marine Transportation — 0.0% | |
Kirby Corp.(a) | | | 46,299 | | | | 3,227,040 | |
| | | | | | | | |
|
| Media — 1.6% | |
Cable One, Inc. | | | 3,680 | | | | 2,583,360 | |
Charter Communications, Inc., Class A(a) | | | 81,455 | | | | 29,129,123 | |
Comcast Corp., Class A | | | 3,253,496 | | | | 123,340,033 | |
DISH Network Corp., Class A(a) | | | 201,604 | | | | 1,880,965 | |
Fox Corp., Class A, NVS | | | 229,648 | | | | 7,819,514 | |
| | |
| 60 | | 2 0 2 3 I SHARES ANNUAL REPORT TO SHAREHOLDERS |
| | |
Schedule of Investments (continued) March 31, 2023 | | iShares® Core S&P U.S. Value ETF (Percentages shown are based on Net Assets) |
| | | | | | | | |
| Security | | Shares | | | Value | |
|
| Media (continued) | |
Fox Corp., Class B | | | 106,614 | | | $ | 3,338,084 | |
Interpublic Group of Cos., Inc. | | | 300,451 | | | | 11,188,795 | |
John Wiley & Sons, Inc., Class A | | | 32,777 | | | | 1,270,764 | |
New York Times Co., Class A | | | 62,830 | | | | 2,442,830 | |
News Corp., Class A, NVS | | | 298,776 | | | | 5,159,862 | |
News Corp., Class B | | | 90,495 | | | | 1,577,328 | |
Omnicom Group, Inc. | | | 157,296 | | | | 14,839,305 | |
Paramount Global, Class B, NVS | | | 392,782 | | | | 8,762,967 | |
TEGNA, Inc. | | | 170,313 | | | | 2,879,993 | |
| | | | | | | | |
| | |
| | | | | | | 216,212,923 | |
|
| Metals & Mining — 0.4% | |
Alcoa Corp. | | | 138,012 | | | | 5,873,791 | |
Cleveland-Cliffs, Inc.(a) | | | 401,672 | | | | 7,362,648 | |
Commercial Metals Co. | | | 39,416 | | | | 1,927,442 | |
Newmont Corp. | | | 614,550 | | | | 30,125,241 | |
United States Steel Corp. | | | 175,270 | | | | 4,574,547 | |
Worthington Industries, Inc. | | | 11,799 | | | | 762,805 | |
| | | | | | | | |
| | |
| | | | | | | 50,626,474 | |
|
| Mortgage Real Estate Investment Trusts (REITs) — 0.0% | |
Starwood Property Trust, Inc. | | | 217,438 | | | | 3,846,478 | |
| | | | | | | | |
|
| Multi-Utilities — 1.4% | |
Ameren Corp. | | | 199,348 | | | | 17,221,674 | |
Black Hills Corp. | | | 23,856 | | | | 1,505,313 | |
CenterPoint Energy, Inc. | | | 485,567 | | | | 14,304,804 | |
CMS Energy Corp. | | | 226,084 | | | | 13,877,036 | |
Consolidated Edison, Inc. | | | 274,978 | | | | 26,307,145 | |
Dominion Energy, Inc. | | | 644,478 | | | | 36,032,765 | |
DTE Energy Co. | | | 149,391 | | | | 16,364,290 | |
NiSource, Inc. | | | 314,648 | | | | 8,797,558 | |
NorthWestern Corp. | | | 44,566 | | | | 2,578,589 | |
Public Service Enterprise Group, Inc. | | | 386,973 | | | | 24,166,464 | |
Sempra Energy | | | 97,807 | | | | 14,784,506 | |
WEC Energy Group, Inc. | | | 116,897 | | | | 11,080,667 | |
| | | | | | | | |
| | |
| | | | | | | 187,020,811 | |
|
| Office REITs — 0.3% | |
Alexandria Real Estate Equities, Inc. | | | 122,345 | | | | 15,365,309 | |
Boston Properties, Inc. | | | 110,760 | | | | 5,994,331 | |
Corporate Office Properties Trust | | | 41,184 | | | | 976,473 | |
Cousins Properties, Inc. | | | 115,601 | | | | 2,471,549 | |
Douglas Emmett, Inc. | | | 134,189 | | | | 1,654,550 | |
Highwoods Properties, Inc. | | | 84,697 | | | | 1,964,123 | |
Kilroy Realty Corp. | | | 84,468 | | | | 2,736,763 | |
Vornado Realty Trust | | | 122,972 | | | | 1,890,080 | |
| | | | | | | | |
| | |
| | | | | | | 33,053,178 | |
|
| Oil, Gas & Consumable Fuels — 1.0% | |
Chord Energy Corp. | | | 7,752 | | | | 1,043,419 | |
Equitrans Midstream Corp. | | | 197,085 | | | | 1,139,151 | |
HF Sinclair Corp. | | | 59,971 | | | | 2,901,397 | |
Kinder Morgan, Inc. | | | 1,532,362 | | | | 26,831,659 | |
Marathon Petroleum Corp. | | | 182,374 | | | | 24,589,487 | |
PetroCorp Escrow(a)(d) | | | 190 | | | | — | |
Phillips 66 | | | 360,416 | | | | 36,538,974 | |
Valero Energy Corp. | | | 294,397 | | | | 41,097,821 | |
| | | | | | | | |
| | |
| | | | | | | 134,141,908 | |
|
| Passenger Airlines — 0.4% | |
Alaska Air Group, Inc.(a)(b) | | | 99,974 | | | | 4,194,909 | |
American Airlines Group, Inc.(a)(b) | | | 505,911 | | | | 7,462,187 | |
Delta Air Lines, Inc.(a) | | | 497,888 | | | | 17,386,249 | |
JetBlue Airways Corp.(a) | | | 256,920 | | | | 1,870,378 | |
| | | | | | | | |
| Security | | Shares | | | Value | |
|
| Passenger Airlines (continued) | |
Southwest Airlines Co. | | | 457,628 | | | $ | 14,891,215 | |
United Airlines Holdings, Inc.(a) | | | 252,832 | | | | 11,187,816 | |
| | | | | | | | |
| | |
| | | | | | | 56,992,754 | |
|
| Personal Care Products — 0.4% | |
BellRing Brands, Inc.(a) | | | 61,006 | | | | 2,074,204 | |
Coty, Inc., Class A(a) | | | 288,440 | | | | 3,478,586 | |
Estee Lauder Cos., Inc., Class A | | | 179,189 | | | | 44,162,921 | |
| | | | | | | | |
| | |
| | | | | | | 49,715,711 | |
|
| Pharmaceuticals — 1.6% | |
Catalent, Inc.(a) | | | 140,217 | | | | 9,213,659 | |
Johnson & Johnson | | | 768,396 | | | | 119,101,380 | |
Organon & Co. | | | 198,750 | | | | 4,674,600 | |
Perrigo Co. PLC | | | 102,795 | | | | 3,687,257 | |
Viatris, Inc. | | | 937,197 | | | | 9,015,835 | |
Zoetis, Inc., Class A | | | 360,472 | | | | 59,996,960 | |
| | | | | | | | |
| | |
| | | | | | | 205,689,691 | |
|
| Professional Services — 0.6% | |
ASGN, Inc.(a) | | | 38,104 | | | | 3,150,058 | |
Broadridge Financial Solutions, Inc. | | | 47,644 | | | | 6,983,181 | |
CACI International, Inc., Class A(a) | | | 6,463 | | | | 1,914,858 | |
Equifax, Inc. | | | 48,317 | | | | 9,800,620 | |
Exponent, Inc. | | | 12,159 | | | | 1,212,131 | |
Genpact Ltd. | | | 55,334 | | | | 2,557,537 | |
Jacobs Solutions, Inc. | | | 98,463 | | | | 11,570,387 | |
Leidos Holdings, Inc. | | | 36,518 | | | | 3,361,847 | |
ManpowerGroup, Inc. | | | 38,602 | | | | 3,185,823 | |
Maximus, Inc. | | | 46,228 | | | | 3,638,144 | |
Paychex, Inc. | | | 106,376 | | | | 12,189,626 | |
Robert Half International, Inc. | | | 84,538 | | | | 6,811,227 | |
Science Applications International Corp. | | | 13,892 | | | | 1,492,834 | |
Verisk Analytics, Inc. | | | 65,186 | | | | 12,506,586 | |
| | | | | | | | |
| | |
| | | | | | | 80,374,859 | |
|
| Real Estate Management & Development — 0.2% | |
CBRE Group, Inc., Class A(a) | | | 245,197 | | | | 17,852,793 | |
Jones Lang LaSalle, Inc.(a) | | | 37,030 | | | | 5,387,495 | |
| | | | | | | | |
| | |
| | | | | | | 23,240,288 | |
|
| Residential REITs — 0.7% | |
Apartment Income REIT Corp. | | | 114,011 | | | | 4,082,734 | |
AvalonBay Communities, Inc. | | | 108,628 | | | | 18,256,021 | |
Camden Property Trust | | | 85,552 | | | | 8,969,272 | |
Equity Residential | | | 264,537 | | | | 15,872,220 | |
Essex Property Trust, Inc. | | | 50,030 | | | | 10,463,274 | |
Independence Realty Trust, Inc. | | | 170,867 | | | | 2,738,998 | |
Invitation Homes, Inc. | | | 447,777 | | | | 13,984,076 | |
Mid-America Apartment Communities, Inc. | | | 88,952 | | | | 13,435,310 | |
UDR, Inc. | | | 240,218 | | | | 9,863,351 | |
| | | | | | | | |
| | |
| | | | | | | 97,665,256 | |
|
| Retail REITs — 0.7% | |
Agree Realty Corp. | | | 21,261 | | | | 1,458,717 | |
Brixmor Property Group, Inc. | | | 116,754 | | | | 2,512,546 | |
Federal Realty Investment Trust | | | 57,014 | | | | 5,634,694 | |
Kimco Realty Corp. | | | 478,039 | | | | 9,336,102 | |
Kite Realty Group Trust | | | 167,247 | | | | 3,498,807 | |
Macerich Co. | | | 171,796 | | | | 1,821,038 | |
National Retail Properties, Inc. | | | 67,058 | | | | 2,960,611 | |
Realty Income Corp. | | | 485,061 | | | | 30,714,062 | |
Regency Centers Corp. | | | 119,574 | | | | 7,315,537 | |
Simon Property Group, Inc. | | | 253,213 | | | | 28,352,260 | |
Spirit Realty Capital, Inc. | | | 109,791 | | | | 4,374,073 | |
| | | | | | | | |
| | |
| | | | | | | 97,978,447 | |
| | |
SCHEDULES OF INVESTMENTS | | 61 |
| | |
Schedule of Investments (continued) March 31, 2023 | | iShares® Core S&P U.S. Value ETF (Percentages shown are based on Net Assets) |
| | | | | | | | |
| Security | | Shares | | | Value | |
|
| Semiconductors & Semiconductor Equipment — 3.5% | |
Advanced Micro Devices, Inc.(a) | | | 573,633 | | | $ | 56,221,770 | |
Allegro MicroSystems, Inc.(a) | | | 30,279 | | | | 1,453,089 | |
Analog Devices, Inc. | | | 207,773 | | | | 40,976,991 | |
Broadcom, Inc. | | | 129,283 | | | | 82,940,216 | |
Intel Corp. | | | 3,199,670 | | | | 104,533,219 | |
Microchip Technology, Inc. | | | 216,078 | | | | 18,103,015 | |
Micron Technology, Inc. | | | 843,939 | | | | 50,923,279 | |
MKS Instruments, Inc.(b) | | | 44,882 | | | | 3,977,443 | |
NXP Semiconductors NV | | | 81,934 | | | | 15,278,643 | |
Qorvo, Inc.(a) | | | 77,251 | | | | 7,846,384 | |
Silicon Laboratories, Inc.(a)(b) | | | 11,934 | | | | 2,089,524 | |
SiTime Corp.(a)(b) | | | 5,658 | | | | 804,737 | |
Skyworks Solutions, Inc. | | | 122,728 | | | | 14,479,450 | |
Synaptics, Inc.(a) | | | 30,425 | | | | 3,381,739 | |
Teradyne, Inc. | | | 62,050 | | | | 6,670,996 | |
Texas Instruments, Inc. | | | 259,326 | | | | 48,237,229 | |
Universal Display Corp. | | | 12,264 | | | | 1,902,514 | |
Wolfspeed, Inc.(a) | | | 52,140 | | | | 3,386,493 | |
| | | | | | | | |
| | |
| | | | | | | 463,206,731 | |
|
| Software — 8.5% | |
ACI Worldwide, Inc.(a) | | | 85,790 | | | | 2,314,614 | |
Adobe, Inc.(a) | | | 187,657 | | | | 72,317,378 | |
ANSYS, Inc.(a) | | | 67,312 | | | | 22,401,434 | |
Aspen Technology, Inc.(a)(b) | | | 22,819 | | | | 5,222,584 | |
Autodesk, Inc.(a) | | | 74,989 | | | | 15,609,710 | |
Blackbaud, Inc.(a) | | | 18,383 | | | | 1,273,942 | |
Ceridian HCM Holding, Inc.(a)(b) | | | 119,223 | | | | 8,729,508 | |
CommVault Systems, Inc.(a) | | | 12,873 | | | | 730,414 | |
Envestnet, Inc.(a) | | | 5,825 | | | | 341,753 | |
Gen Digital, Inc. | | | 206,541 | | | | 3,544,244 | |
Intuit, Inc. | | | 102,115 | | | | 45,525,930 | |
Manhattan Associates, Inc.(a) | | | 21,013 | | | | 3,253,863 | |
Microsoft Corp. | | | 2,418,030 | | | | 697,118,049 | |
NCR Corp.(a)(b) | | | 111,276 | | | | 2,625,001 | |
Oracle Corp. | | | 487,342 | | | | 45,283,819 | |
Roper Technologies, Inc. | | | 82,027 | | | | 36,148,479 | |
Salesforce, Inc.(a) | | | 773,430 | | | | 154,515,845 | |
Teradata Corp.(a) | | | 41,974 | | | | 1,690,713 | |
Tyler Technologies, Inc.(a) | | | 17,247 | | | | 6,116,476 | |
| | | | | | | | |
| | |
| | | | | | | 1,124,763,756 | |
|
| Specialized REITs — 1.7% | |
American Tower Corp. | | | 169,252 | | | | 34,584,954 | |
Crown Castle, Inc. | | | 334,780 | | | | 44,806,955 | |
CubeSmart | | | 81,609 | | | | 3,771,968 | |
Digital Realty Trust, Inc. | | | 223,010 | | | | 21,924,113 | |
EPR Properties | | | 60,309 | | | | 2,297,773 | |
Equinix, Inc. | | | 71,557 | | | | 51,595,459 | |
Extra Space Storage, Inc. | | | 51,950 | | | | 8,464,213 | |
Iron Mountain, Inc. | | | 84,547 | | | | 4,473,382 | |
Lamar Advertising Co., Class A | | | 29,307 | | | | 2,927,476 | |
Life Storage, Inc. | | | 25,305 | | | | 3,317,232 | |
National Storage Affiliates Trust | | | 34,177 | | | | 1,427,915 | |
PotlatchDeltic Corp. | | | 26,506 | | | | 1,312,047 | |
Public Storage | | | 46,319 | | | | 13,994,823 | |
Rayonier, Inc. | | | 50,301 | | | | 1,673,011 | |
SBA Communications Corp. | | | 36,710 | | | | 9,583,880 | |
VICI Properties, Inc. | | | 335,230 | | | | 10,935,203 | |
Weyerhaeuser Co. | | | 245,576 | | | | 7,399,205 | |
| | | | | | | | |
| | |
| | | | | | | 224,489,609 | |
|
| Specialty Retail — 1.9% | |
Advance Auto Parts, Inc. | | | 46,793 | | | | 5,690,497 | |
| | | | | | | | |
| Security | | Shares | | | Value | |
|
| Specialty Retail (continued) | |
AutoNation, Inc.(a) | | | 14,102 | | | $ | 1,894,745 | |
Bath & Body Works, Inc. | | | 177,442 | | | | 6,490,828 | |
Best Buy Co., Inc. | | | 152,304 | | | | 11,920,834 | |
CarMax, Inc.(a)(b) | | | 122,662 | | | | 7,884,713 | |
Dick’s Sporting Goods, Inc. | | | 23,230 | | | | 3,296,105 | |
Five Below, Inc.(a) | | | 13,145 | | | | 2,707,476 | |
Foot Locker, Inc. | | | 61,351 | | | | 2,435,021 | |
GameStop Corp., Class A(a)(b) | | | 192,966 | | | | 4,442,077 | |
Gap, Inc. | | | 172,876 | | | | 1,735,675 | |
Home Depot, Inc. | | | 370,488 | | | | 109,338,419 | |
Lithia Motors, Inc., Class A | | | 21,344 | | | | 4,886,282 | |
Lowe’s Cos., Inc. | | | 144,943 | | | | 28,984,252 | |
RH(a) | | | 14,669 | | | | 3,572,635 | |
Ross Stores, Inc. | | | 266,347 | | | | 28,267,407 | |
TJX Cos., Inc. | | | 321,727 | | | | 25,210,528 | |
Victoria’s Secret & Co.(a) | | | 62,017 | | | | 2,117,880 | |
Williams-Sonoma, Inc. | | | 26,473 | | | | 3,220,705 | |
| | | | | | | | |
| | |
| | | | | | | 254,096,079 | |
|
| Technology Hardware, Storage & Peripherals — 0.5% | |
Hewlett Packard Enterprise Co. | | | 991,389 | | | | 15,792,827 | |
HP, Inc. | | | 666,818 | | | | 19,571,108 | |
NetApp, Inc. | | | 166,003 | | | | 10,599,291 | |
Seagate Technology Holdings PLC | | | 148,980 | | | | 9,850,558 | |
Super Micro Computer, Inc.(a) | | | 7,089 | | | | 755,333 | |
Western Digital Corp.(a) | | | 246,410 | | | | 9,282,265 | |
Xerox Holdings Corp. | | | 90,433 | | | | 1,392,668 | |
| | | | | | | | |
| | |
| | | | | | | 67,244,050 | |
|
| Textiles, Apparel & Luxury Goods — 1.2% | |
Capri Holdings Ltd.(a) | | | 100,563 | | | | 4,726,461 | |
Carter’s, Inc. | | | 29,514 | | | | 2,122,647 | |
Columbia Sportswear Co. | | | 27,041 | | | | 2,440,180 | |
NIKE, Inc., Class B | | | 963,438 | | | | 118,156,036 | |
PVH Corp. | | | 49,794 | | | | 4,439,633 | |
Ralph Lauren Corp., Class A | | | 31,376 | | | | 3,660,638 | |
Skechers U.S.A., Inc., Class A(a) | | | 102,445 | | | | 4,868,186 | |
Tapestry, Inc. | | | 182,594 | | | | 7,871,627 | |
Under Armour, Inc., Class A(a) | | | 144,044 | | | | 1,366,978 | |
Under Armour, Inc., Class C, NVS(a) | | | 150,413 | | | | 1,283,023 | |
VF Corp. | | | 256,887 | | | | 5,885,281 | |
| | | | | | | | |
| | |
| | | | | | | 156,820,690 | |
|
| Tobacco — 0.6% | |
Altria Group, Inc. | | | 662,869 | | | | 29,577,215 | |
Philip Morris International, Inc. | | | 551,534 | | | | 53,636,681 | |
| | | | | | | | |
| | |
| | | | | | | 83,213,896 | |
|
| Trading Companies & Distributors — 0.3% | |
Fastenal Co. | | | 225,618 | | | | 12,169,835 | |
GATX Corp.(b) | | | 12,909 | | | | 1,420,248 | |
MSC Industrial Direct Co., Inc., Class A | | | 18,024 | | | | 1,514,016 | |
United Rentals, Inc. | | | 53,797 | | | | 21,290,701 | |
Univar Solutions, Inc.(a) | | | 128,361 | | | | 4,496,486 | |
| | | | | | | | |
| | |
| | | | | | | 40,891,286 | |
|
| Water Utilities — 0.2% | |
American Water Works Co., Inc. | | | 149,348 | | | | 21,877,989 | |
| | | | | | | | |
|
| Wireless Telecommunication Services — 0.2% | |
T-Mobile U.S., Inc.(a) | | | 146,597 | | | | 21,233,109 | |
| | | | | | | | |
| | |
Total Long-Term Investments — 99.7%
(Cost: $12,602,052,731) | | | | | | | 13,244,753,315 | |
| | | | | | | | |
| | |
| 62 | | 2 0 2 3 I SHARES ANNUAL REPORT TO SHAREHOLDERS |
| | |
Schedule of Investments (continued) March 31, 2023 | | iShares® Core S&P U.S. Value ETF (Percentages shown are based on Net Assets) |
| | | | | | | | |
| Security | | Shares | | | Value | |
| | |
Short-Term Securities | | | | | | | | |
| | |
Money Market Funds — 0.9% | | | | | | | | |
BlackRock Cash Funds: Institutional, SL Agency Shares, 5.01%(c)(e)(f) | | | 96,332,955 | | | $ | 96,361,854 | |
BlackRock Cash Funds: Treasury, SL Agency Shares, 4.73%(c)(e) | | | 23,677,943 | | | | 23,677,943 | |
| | | | | | | | |
| |
Total Short-Term Securities — 0.9%
(Cost: $119,991,918) | | | | 120,039,797 | |
| | | | | | | | |
| |
Total Investments — 100.6%
(Cost: $12,722,044,649) | | | | 13,364,793,112 | |
Liabilities in Excess of Other Assets — (0.6)% | | | | (80,807,540 | ) |
| | | | | | | | |
| | |
Net Assets — 100.0% | | | | | | $ | 13,283,985,572 | |
| | | | | | | | |
| (a) | Non-income producing security. |
| (b) | All or a portion of this security is on loan. |
| (c) | Affiliate of the Fund. |
| (d) | Security is valued using significant unobservable inputs and is classified as Level 3 in the fair value hierarchy. |
| (e) | Annualized 7-day yield as of period end. |
| (f) | All or a portion of this security was purchased with the cash collateral from loaned securities. |
Affiliates
Investments in issuers considered to be affiliate(s) of the Fund during the year ended March 31, 2023 for purposes of Section 2(a)(3) of the Investment Company Act of 1940, as amended, were as follows:
| | | | | | | | | | | | | | | | | | | | | | | | | | | | | | | | | | | | |
| Affiliated Issuer | | Value at
03/31/22 | | | Purchases
at Cost | | | Proceeds
from Sale | | | Net
Realized
Gain (Loss) | | | Change in
Unrealized
Appreciation
(Depreciation) | | | Value at
03/31/23 | | | Shares
Held at
03/31/23 | | | Income | | | Capital Gain
Distributions
from Underlying
Funds | |
BlackRock Cash
Funds: Institutional, SL Agency Shares | | $ | 70,219,115 | | | $ | 26,091,028 | (a) | | $ | — | | | $ | 21,638 | | | $ | 30,073 | | | $ | 96,361,854 | | | | 96,332,955 | | | $ | 370,516 | (b) | | $ | — | |
BlackRock Cash
Funds: Treasury, SL Agency Shares | | | 22,420,000 | | | | 1,257,943 | (a) | | | — | | | | — | | | | — | | | | 23,677,943 | | | | 23,677,943 | | | | 625,675 | | | | 25 | |
BlackRock, Inc. | | | 31,448,652 | | | | 56,388,092 | | | | (4,623,548 | ) | | | 1,311,578 | | | | (7,025,288 | ) | | | 77,499,486 | | | | 115,823 | | | | 1,226,865 | | | | — | |
| | | | | | | | | | | | | | | | | | | | | | | | | | | | | | | | | | | | |
| | | | | | | | | | | | | | $ | 1,333,216 | | | $ | (6,995,215 | ) | | $ | 197,539,283 | | | | | | | $ | 2,223,056 | | | $ | 25 | |
| | | | | | | | | | | | | | | | | | | | | | | | | | | | | | | | | | | | |
| | (a) | Represents net amount purchased (sold). | |
| | (b) | All or a portion represents securities lending income earned from the reinvestment of cash collateral from loaned securities, net of fees and collateral investment expenses, and other payments to and from borrowers of securities. | |
Derivative Financial Instruments Outstanding as of Period End
Futures Contracts
| | | | | | | | | | | | | | | | |
| Description | | Number of
Contracts | | | Expiration
Date | | | Notional
Amount
(000) | | | Value/ Unrealized
Appreciation
(Depreciation) | |
Long Contracts | | | | | | | | | | | | | | | | |
S&P 500 E-mini Index | | | 132 | | | | 06/16/23 | | | $ | 27,309 | | | $ | 1,477,868 | |
S&P MidCap 400 E-Mini Index | | | 40 | | | | 06/16/23 | | | | 10,119 | | | | 229,867 | |
| | | | | | | | | | | | | | | | |
| | | | | | | | | | | | | | $ | 1,707,735 | |
| | | | | | | | | | | | | | | | |
| | |
SCHEDULES OF INVESTMENTS | | 63 |
| | |
Schedule of Investments (continued) March 31, 2023 | | iShares® Core S&P U.S. Value ETF |
Derivative Financial Instruments Categorized by Risk Exposure
As of period end, the fair values of derivative financial instruments located in the Statements of Assets and Liabilities were as follows:
| | | | | | | | | | | | | | | | | | | | | | | | | | | | |
| | | Commodity
Contracts | | | Credit
Contracts | | | Equity
Contracts | | | Foreign
Currency
Exchange
Contracts | | | Interest
Rate
Contracts | | | Other
Contracts | | | Total | |
Assets — Derivative Financial Instruments | | | | | | | | | | | | | | | | | | | | | | | | | | | | |
Futures contracts | | | | | | | | | | | | | | | | | | | | | | | | | | | | |
Unrealized appreciation on futures contracts(a) | | $ | — | | | $ | — | | | $ | 1,707,735 | | | $ | — | | | $ | — | | | $ | — | | | $ | 1,707,735 | |
| | | | | | | | | | | | | | | | | | | | | | | | | | | | |
| | (a) | Net cumulative unrealized appreciation (depreciation) on futures contracts, if any, are reported in the Schedule of Investments. In the Statements of Assets and Liabilities, only current day’s variation margin is reported in receivables or payables and the net cumulative unrealized appreciation (depreciation) is included in accumulated earnings (loss). | |
For the period ended March 31, 2023, the effect of derivative financial instruments in the Statements of Operations was as follows:
| | | | | | | | | | | | | | | | | | | | | | | | | | | | |
| | | Commodity
Contracts | | | Credit
Contracts | | | Equity
Contracts | | | Foreign
Currency
Exchange
Contracts | | | Interest
Rate
Contracts | | | Other
Contracts | | | Total | |
Net Realized Gain (Loss) from | | | | | | | | | | | | | | | | | | | | | | | | | | | | |
Futures contracts | | $ | — | | | $ | — | | | $ | (5,128,624) | | | $ | — | | | $ | — | | | $ | — | | | $ | (5,128,624) | |
| | | | | | | | | | | | | | | | | | | | | | | | | | | | |
Net Change in Unrealized Appreciation (Depreciation) on | | | | | | | | | | | | | | | | | | | | | | | | | | | | |
Futures contracts | | $ | — | | | $ | — | | | $ | 215,016 | | | $ | — | | | $ | — | | | $ | — | | | $ | 215,016 | |
| | | | | | | | | | | | | | | | | | | | | | | | | | | | |
Average Quarterly Balances of Outstanding Derivative Financial Instruments
| | | | |
| | |
Futures contracts | | | | |
Average notional value of contracts — long | | $ | 33,940,884 | |
For more information about the Fund’s investment risks regarding derivative financial instruments, refer to the Notes to Financial Statements.
Fair Value Hierarchy as of Period End
Various inputs are used in determining the fair value of financial instruments. For a description of the input levels and information about the Fund’s policy regarding valuation of financial instruments, refer to the Notes to Financial Statements.
The following table summarizes the Fund’s financial instruments categorized in the fair value hierarchy. The breakdown of the Fund’s financial instruments into major categories is disclosed in the Schedule of Investments above.
| | | | | | | | | | | | | | | | |
| | | Level 1 | | | Level 2 | | | Level 3 | | | Total | |
Assets | | | | | | | | | | | | | | | | |
Investments | | | | | | | | | | | | | | | | |
Long-Term Investments | | | | | | | | | | | | | | | | |
Common Stocks | | $ | 13,244,753,315 | | | $ | — | | | $ | — | | | $ | 13,244,753,315 | |
Short-Term Securities | | | | | | | | | | | | | | | | |
Money Market Funds | | | 120,039,797 | | | | — | | | | — | | | | 120,039,797 | |
| | | | | | | | | | | | | | | | |
| | $ | 13,364,793,112 | | | $ | — | | | $ | — | | | $ | 13,364,793,112 | |
| | | | | | | | | | | | | | | | |
Derivative Financial Instruments(a) | | | | | | | | | | | | | | | | |
Assets | | | | | | | | | | | | | | | | |
Equity Contracts | | $ | 1,707,735 | | | $ | — | | | $ | — | | | $ | 1,707,735 | |
| | | | | | | | | | | | | | | | |
| | (a) | Derivative financial instruments are futures contracts. Futures contracts are valued at the unrealized appreciation (depreciation) on the instrument. | |
See notes to financial statements.
| | |
| 64 | | 2 0 2 3 I SHARES ANNUAL REPORT TO SHAREHOLDERS |
Statements of Assets and Liabilities
March 31, 2023
| | | | | | | | | | | | | | | | |
| | | iShares
Core S&P
Mid-Cap ETF | | | iShares
Core S&P
Small-Cap ETF | | | iShares
Core S&P
U.S. Growth
ETF | | | iShares Core S&P
U.S. Value ETF | |
| | | | |
ASSETS | | | | | | | | | | | | | | | | |
Investments, at value — unaffiliated(a)(b) | | $ | 66,161,795,889 | | | $ | 5,012,735,968 | | | $ | 12,296,721,139 | | | $ | 13,167,253,829 | |
Investments, at value — affiliated(c) | | | 4,294,415,382 | | | | 65,754,443,738 | | | | 131,002,011 | | | | 197,539,283 | |
Cash | | | 12,311,531 | | | | 20,184,788 | | | | 525,924 | | | | 1,093,291 | |
Cash pledged: | | | | | | | | | | | | | | | | |
Collateral - OTC derivatives | | | 5,960,000 | | | | 125,340,000 | | | | — | | | | — | |
Futures contracts | | | 10,254,100 | | | | 25,466,000 | | | | 1,432,620 | | | | — | |
Receivables: | | | | | | | | | | | | | | | | |
Investments sold | | | 22,321,859 | | | | 137,541,584 | | | | 32,541,930 | | | | 45,565,691 | |
Securities lending income — affiliated | | | 1,967,185 | | | | 1,367,596 | | | | 21,593 | | | | 64,364 | |
Capital shares sold | | | 99,851,626 | | | | 38,520,979 | | | | 4,374,957 | | | | — | |
Dividends — unaffiliated | | | 78,635,172 | | | | 76,547,047 | | | | 7,264,886 | | | | 12,191,978 | |
Dividends — affiliated | | | 539,494 | | | | 4,959,159 | | | | 70,453 | | | | 103,956 | |
Variation margin on futures contracts | | | 4,223,050 | | | | 6,184,460 | | | | 325,702 | | | | 2,842,366 | |
Unrealized appreciation on OTC swaps | | | 773,580 | | | | 6,460,668 | | | | — | | | | — | |
| | | | | | | | | | | | | | | | |
| | | | |
Total assets | | | 70,693,048,868 | | | | 71,209,751,987 | | | | 12,474,281,215 | | | | 13,426,654,758 | |
| | | | | | | | | | | | | | | | |
| | | | |
LIABILITIES | | | | | | | | | | | | | | | | |
Cash received: | | | | | | | | | | | | | | | | |
Collateral - OTC derivatives | | | 560,000 | | | | — | | | | — | | | | — | |
Collateral on securities loaned | | | 4,067,777,890 | | | | 4,009,095,632 | | | | 113,467,545 | | | | 96,319,563 | |
Payables: | | | | | | | | | | | | | | | | |
Investments purchased | | | 109,036,780 | | | | 248,464,280 | | | | 19,451,752 | | | | 27,726,675 | |
Swaps | | | 1,430,505 | | | | 89,055,470 | | | | — | | | | — | |
Capital shares redeemed | | | — | | | | 72,572,810 | | | | 17,499,827 | | | | 18,186,692 | |
Investment advisory fees | | | 2,792,770 | | | | 3,430,196 | | | | 399,643 | | | | 436,256 | |
Unrealized depreciation on OTC swaps | | | 3,174,321 | | | | 30,307,531 | | | | — | | | | — | |
| | | | | | | | | | | | | | | | |
| | | | |
Total liabilities | | | 4,184,772,266 | | | | 4,452,925,919 | | | | 150,818,767 | | | | 142,669,186 | |
| | | | | | | | | | | | | | | | |
| | | | |
NET ASSETS | | $ | 66,508,276,602 | | | $ | 66,756,826,068 | | | $ | 12,323,462,448 | | | $ | 13,283,985,572 | |
| | | | | | | | | | | | | | | | |
| | | | |
NET ASSETS CONSIST OF: | | | | | | | | | | | | | | | | |
Paid-in capital | | $ | 61,916,915,232 | | | $ | 67,579,302,222 | | | $ | 11,422,305,474 | | | $ | 13,419,852,944 | |
Accumulated earnings (loss) | | | 4,591,361,370 | | | | (822,476,154 | ) | | | 901,156,974 | | | | (135,867,372 | ) |
| | | | | | | | | | | | | | | | |
| | | | |
NET ASSETS | | $ | 66,508,276,602 | | | $ | 66,756,826,068 | | | $ | 12,323,462,448 | | | $ | 13,283,985,572 | |
| | | | | | | | | | | | | | | | |
| | | | |
NET ASSET VALUE | | | | | | | | | | | | | | | | |
Shares outstanding | | | 265,850,000 | | | | 689,900,000 | | | | 138,750,000 | | | | 180,050,000 | |
| | | | | | | | | | | | | | | | |
| | | | |
Net asset value | | $ | 250.17 | | | $ | 96.76 | | | $ | 88.82 | | | $ | 73.78 | |
| | | | | | | | | | | | | | | | |
| | | | |
Shares authorized | | | Unlimited | | | | Unlimited | | | | Unlimited | | | | Unlimited | |
| | | | | | | | | | | | | | | | |
| | | | |
Par value | | | None | | | | None | | | | None | | | | None | |
| | | | | | | | | | | | | | | | |
| | | | |
(a) Investments, at cost — unaffiliated | | $ | 59,478,123,663 | | | $ | 4,953,283,053 | | | $ | 9,927,871,648 | | | $ | 12,520,215,622 | |
(b) Securities loaned, at value | | $ | 4,056,920,552 | | | $ | 3,985,699,806 | | | $ | 112,265,189 | | | $ | 96,314,846 | |
(c) Investments, at cost — affiliated | | $ | 4,292,393,953 | | | $ | 63,047,413,795 | | | $ | 130,976,315 | | | $ | 201,829,027 | |
See notes to financial statements.
Statements of Operations
Year Ended March 31, 2023
| | | | | | | | | | | | | | | | |
| | | iShares
Core S&P
Mid-Cap ETF | | | iShares
Core S&P
Small-Cap ETF | | | iShares
Core S&P
U.S. Growth
ETF | | | iShares
Core S&P
U.S. Value ETF | |
| |
INVESTMENT INCOME | | | | | |
Dividends — unaffiliated | | $ | 1,011,685,034 | | | $ | 20,995,834 | | | $ | 128,270,309 | | | $ | 268,673,027 | |
Dividends — affiliated | | | 4,594,053 | | | | 1,065,819,452 | | | | 1,176,149 | | | | 1,852,540 | |
Securities lending income — affiliated — net | | | 30,583,184 | | | | 12,809,798 | | | | 663,645 | | | | 370,516 | |
Foreign taxes withheld | | | — | | | | (929,604 | ) | | | (56,768 | ) | | | (36,232 | ) |
| | | | | | | | | | | | | | | | |
| | | | |
Total investment income | | | 1,046,862,271 | | | | 1,098,695,480 | | | | 130,053,335 | | | | 270,859,851 | |
| | | | | | | | | | | | | | | | |
| | | | |
EXPENSES | | | | | | | | | | | | | | | | |
Investment advisory | | | 31,349,904 | | | | 39,729,962 | | | | 4,561,492 | | | | 4,869,856 | |
| | | | | | | | | | | | | | | | |
| | | | |
Total expenses | | | 31,349,904 | | | | 39,729,962 | | | | 4,561,492 | | | | 4,869,856 | |
| | | | | | | | | | | | | | | | |
| | | | |
Net investment income | | | 1,015,512,367 | | | | 1,058,965,518 | | | | 125,491,843 | | | | 265,989,995 | |
| | | | | | | | | | | | | | | | |
| | | | |
REALIZED AND UNREALIZED GAIN (LOSS) | | | | | | | | | | | | | | | | |
Net realized gain (loss) from: | | | | | | | | | | | | | | | | |
Investments — unaffiliated | | | (300,423,912 | ) | | | (259,899,514 | ) | | | (1,056,471,729 | ) | | | (222,264,258 | ) |
Investments — affiliated | | | (212,973 | ) | | | (1,456,004,632 | ) | | | 3,931,773 | | | | (143,678 | ) |
Capital gain distributions from underlying funds — affiliated | | | 117 | | | | 976 | | | | 4 | | | | 25 | |
Futures contracts | | | (10,172,728 | ) | | | (12,826,306 | ) | | | (4,567,797 | ) | | | (5,128,624 | ) |
In-kind redemptions — unaffiliated(a) | | | 1,931,228,108 | | | | (165,185,414 | ) | | | 513,857,740 | | | | 1,052,974,250 | |
In-kind redemptions — affiliated(a) | | | — | | | | 3,010,763,449 | | | | 388,363 | | | | 1,476,894 | |
Swaps | | | (11,115,927 | ) | | | (144,078,571 | ) | | | — | | | | — | |
| | | | | | | | | | | | | | | | |
| | | 1,609,302,685 | | | | 972,769,988 | | | | (542,861,646 | ) | | | 826,914,609 | |
| | | | | | | | | | | | | | | | |
Net change in unrealized appreciation (depreciation) on: | | | | | | | | | | | | | | | | |
Investments — unaffiliated | | | (5,947,179,310 | ) | | | (700,414,001 | ) | | | (1,430,330,237 | ) | | | (1,113,174,984 | ) |
Investments — affiliated | | | 1,933,551 | | | | (7,948,624,486 | ) | | | (6,805,375 | ) | | | (6,995,215 | ) |
Futures contracts | | | 1,487,803 | | | | 5,839,004 | | | | (46,777 | ) | | | 215,016 | |
Swaps | | | (3,883,244 | ) | | | (34,438,561 | ) | | | — | | | | — | |
| | | | | | | | | | | | | | | | |
| | | (5,947,641,200 | ) | | | (8,677,638,044 | ) | | | (1,437,182,389 | ) | | | (1,119,955,183 | ) |
| | | | | | | | | | | | | | | | |
Net realized and unrealized loss | | | (4,338,338,515 | ) | | | (7,704,868,056 | ) | | | (1,980,044,035 | ) | | | (293,040,574 | ) |
| | | | | | | | | | | | | | | | |
NET DECREASE IN NET ASSETS RESULTING FROM OPERATIONS | | $ | (3,322,826,148 | ) | | $ | (6,645,902,538 | ) | | $ | (1,854,552,192 | ) | | $ | (27,050,579 | ) |
| | | | | | | | | | | | | | | | |
| (a) | See Note 2 of the Notes to Financial Statements. |
See notes to financial statements.
| | |
| 66 | | 2 0 2 3 I SHARES ANNUAL REPORT TO SHAREHOLDERS |
Statements of Changes in Net Assets
| | | | | | | | | | | | | | | | |
| | | iShares Core S&P Mid-Cap ETF | | | iShares Core S&P Small-Cap ETF | |
| | | Year Ended
03/31/23 | | | Year Ended
03/31/22 | | | Year Ended
03/31/23 | | | Year Ended
03/31/22 | |
| | | | |
INCREASE (DECREASE) IN NET ASSETS | | | | | | | | | | | | | | | | |
| | | | |
OPERATIONS | | | | | | | | | | | | | | | | |
Net investment income | | $ | 1,015,512,367 | | | $ | 811,894,676 | | | $ | 1,058,965,518 | | | $ | 722,885,353 | |
Net realized gain | | | 1,609,302,685 | | | | 4,258,650,564 | | | | 972,769,988 | | | | 5,970,340,526 | |
Net change in unrealized appreciation (depreciation) | | | (5,947,641,200 | ) | | | (2,379,387,402 | ) | | | (8,677,638,044 | ) | | | (6,138,369,512 | ) |
| | | | | | | | | | | | | | | | |
Net increase (decrease) in net assets resulting from operations | | | (3,322,826,148 | ) | | | 2,691,157,838 | | | | (6,645,902,538 | ) | | | 554,856,367 | |
| | | | | | | | | | | | | | | | |
| | | | |
DISTRIBUTIONS TO SHAREHOLDERS(a) | | | | | | | | | | | | | | | | |
Decrease in net assets resulting from distributions to shareholders | | | (1,068,069,845 | ) | | | (842,798,749 | ) | | | (1,012,107,695 | ) | | | (1,058,667,702 | ) |
| | | | | | | | | | | | | | | | |
| | | | |
CAPITAL SHARE TRANSACTIONS | | | | | | | | | | | | | | | | |
Net increase in net assets derived from capital share transactions | | | 4,875,353,742 | | | | 3,037,584,731 | | | | 2,344,556,736 | | | | 4,301,078,815 | |
| | | | | | | | | | | | | | | | |
| | | | |
NET ASSETS | | | | | | | | | | | | | | | | |
Total increase (decrease) in net assets | | | 484,457,749 | | | | 4,885,943,820 | | | | (5,313,453,497 | ) | | | 3,797,267,480 | |
Beginning of year | | | 66,023,818,853 | | | | 61,137,875,033 | | | | 72,070,279,565 | | | | 68,273,012,085 | |
| | | | | | | | | | | | | | | | |
End of year | | $ | 66,508,276,602 | | | $ | 66,023,818,853 | | | $ | 66,756,826,068 | | | $ | 72,070,279,565 | |
| | | | | | | | | | | | | | | | |
| (a) | Distributions for annual periods determined in accordance with U.S. federal income tax regulations. |
See notes to financial statements.
Statements of Changes in Net Assets (continued)
| | | | | | | | | | | | | | | | |
| | | iShares Core S&P U.S. Growth ETF | | | iShares Core S&P U.S. Value ETF | |
| | | Year Ended
03/31/23 | | | Year Ended
03/31/22 | | | Year Ended
03/31/23 | | | Year Ended
03/31/22 | |
| | | | |
INCREASE (DECREASE) IN NET ASSETS | | | | | | | | | | | | | | | | |
| | | | |
OPERATIONS | | | | | | | | | | | | | | | | |
Net investment income | | $ | 125,491,843 | | | $ | 85,009,485 | | | $ | 265,989,995 | | | $ | 222,080,510 | |
Net realized gain (loss) | | | (542,861,646 | ) | | | 1,351,036,924 | | | | 826,914,609 | | | | 543,813,091 | |
Net change in unrealized appreciation (depreciation) | | | (1,437,182,389 | ) | | | 327,529,213 | | | | (1,119,955,183 | ) | | | 448,061,179 | |
| | | | | | | | | | | | | | | | |
| | | | |
Net increase (decrease) in net assets resulting from operations | | | (1,854,552,192 | ) | | | 1,763,575,622 | | | | (27,050,579 | ) | | | 1,213,954,780 | |
| | | | | | | | | | | | | | | | |
| | | | |
DISTRIBUTIONS TO SHAREHOLDERS(a) | | | | | | | | | | | | | | | | |
Decrease in net assets resulting from distributions to shareholders | | | (124,923,098 | ) | | | (85,386,412 | ) | | | (267,844,515 | ) | | | (219,854,566 | ) |
| | | | | | | | | | | | | | | | |
| | | | |
CAPITAL SHARE TRANSACTIONS | | | | | | | | | | | | | | | | |
Net increase in net assets derived from capital share transactions | | | 1,445,604,490 | | | | 717,396,779 | | | | 1,455,025,976 | | | | 2,044,887,472 | |
| | | | | | | | | | | | | | | | |
| | | | |
NET ASSETS | | | | | | | | | | | | | | | | |
Total increase (decrease) in net assets | | | (533,870,800 | ) | | | 2,395,585,989 | | | | 1,160,130,882 | | | | 3,038,987,686 | |
Beginning of year | | | 12,857,333,248 | | | | 10,461,747,259 | | | | 12,123,854,690 | | | | 9,084,867,004 | |
| | | | | | | | | | | | | | | | |
| | | | |
End of year | | $ | 12,323,462,448 | | | $ | 12,857,333,248 | | | $ | 13,283,985,572 | | | $ | 12,123,854,690 | |
| | | | | | | | | | | | | | | | |
| (a) | Distributions for annual periods determined in accordance with U.S. federal income tax regulations. |
See notes to financial statements.
| | |
| 68 | | 2 0 2 3 I SHARES ANNUAL REPORT TO SHAREHOLDERS |
Financial Highlights
(For a share outstanding throughout each period)
| | | | | | | | | | | | | | | | | | | | |
| | | iShares Core S&P Mid-Cap ETF | |
| | | Year Ended
03/31/23 | | | Year Ended
03/31/22 | | | Year Ended
03/31/21 | | | Year Ended
03/31/20 | | | Year Ended
03/31/19 | |
| | | | | |
Net asset value, beginning of year | | $ | 268.39 | | | $ | 260.16 | | | $ | 143.87 | | | $ | 189.34 | | | $ | 187.51 | |
| | | | | | | | | | | | | | | | | | | | |
Net investment income(a) | | | 3.99 | | | | 3.41 | | | | 2.74 | | | | 3.12 | | | | 2.85 | |
Net realized and unrealized gain (loss)(b) | | | (18.04 | ) | | | 8.35 | | | | 116.36 | | | | (45.14 | ) | | | 1.84 | |
| | | | | | | | | | | | | | | | | | | | |
Net increase (decrease) from investment operations | | | (14.05 | ) | | | 11.76 | | | | 119.10 | | | | (42.02 | ) | | | 4.69 | |
| | | | | | | | | | | | | | | | | | | | |
Distributions from net investment income(c) | | | (4.17 | ) | | | (3.53 | ) | | | (2.81 | ) | | | (3.45 | ) | | | (2.86 | ) |
| | | | | | | | | | | | | | | | | | | | |
| | | | | |
Net asset value, end of year | | $ | 250.17 | | | $ | 268.39 | | | $ | 260.16 | | | $ | 143.87 | | | $ | 189.34 | |
| | | | | | | | | | | | | | | | | | | | |
| | | | | |
Total Return(d) | | | | | | | | | | | | | | | | | | | | |
Based on net asset value | | | (5.13 | )% | | | 4.51 | % | | | 83.36 | % | | | (22.53 | )% | | | 2.50 | % |
| | | | | | | | | | | | | | | | | | | | |
| | | | | |
Ratios to Average Net Assets(e) | | | | | | | | | | | | | | | | | | | | |
Total expenses | | | 0.05 | % | | | 0.05 | % | | | 0.05 | % | | | 0.07 | % | | | 0.07 | % |
| | | | | | | | | | | | | | | | | | | | |
Net investment income | | | 1.62 | % | | | 1.26 | % | | | 1.36 | % | | | 1.62 | % | | | 1.50 | % |
| | | | | | | | | | | | | | | | | | | | |
| | | | | |
Supplemental Data | | | | | | | | | | | | | | | | | | | | |
Net assets, end of year (000) | | $ | 66,508,277 | | | $ | 66,023,819 | | | $ | 61,137,875 | | | $ | 35,722,456 | | | $ | 48,206,329 | |
| | | | | | | | | | | | | | | | | | | | |
Portfolio turnover rate(f) | | | 18 | % | | | 16 | % | | | 20 | % | | | 15 | % | | | 17 | % |
| | | | | | | | | | | | | | | | | | | | |
| (a) | Based on average shares outstanding. |
| (b) | The amounts reported for a share outstanding may not accord with the change in aggregate gains and losses in securities for the fiscal period due to the timing of capital share transactions in relation to the fluctuating market values of the Fund’s underlying securities. |
| (c) | Distributions for annual periods determined in accordance with U.S. federal income tax regulations. |
| (d) | Where applicable, assumes the reinvestment of distributions. |
| (e) | Excludes fees and expenses incurred indirectly as a result of investments in underlying funds. |
| (f) | Portfolio turnover rate excludes in-kind transactions. |
See notes to financial statements.
Financial Highlights
(For a share outstanding throughout each period)
| | | | | | | | | | | | | | | | | | | | |
| | | iShares Core S&P Small-Cap ETF | |
| | | Year Ended
03/31/23 | | | Year Ended
03/31/22 | | | Year Ended
03/31/21 | | | Year Ended
03/31/20 | | | Year Ended
03/31/19 | |
| | | | | |
Net asset value, beginning of year | | $ | 107.93 | | | $ | 108.34 | | | $ | 56.22 | | | $ | 77.13 | | | $ | 77.05 | |
| | | | | | | | | | | | | | | | | | | | |
| | | | | |
Net investment income(a) | | | 1.57 | | | | 1.13 | | | | 1.03 | | | | 1.06 | | | | 1.09 | |
Net realized and unrealized gain(b) | | | (11.24 | ) | | | 0.12 | | | | 52.13 | | | | (20.77 | ) | | | 0.11 | |
| | | | | | | | | | | | | | | | | | | | |
| | | | | |
Net increase from investment operations | | | (9.67 | ) | | | 1.25 | | | | 53.16 | | | | (19.71 | ) | | | 1.20 | |
| | | | | | | | | | | | | | | | | | | | |
| | | | | |
Distributions from net investment income(c) | | | (1.50 | ) | | | (1.66 | ) | | | (1.04 | ) | | | (1.20 | ) | | | (1.12 | ) |
| | | | | | | | | | | | | | | | | | | | |
| | | | | |
Net asset value, end of year | | $ | 96.76 | | | $ | 107.93 | | | $ | 108.34 | | | $ | 56.22 | | | $ | 77.13 | |
| | | | | | | | | | | | | | | | | | | | |
| | | | | |
Total Return(d) | | | | | | | | | | | | | | | | | | | | |
Based on net asset value | | | (8.90 | )% | | | 1.12 | % | | | 95.23 | %(e) | | | (25.89 | )% | | | 1.53 | % |
| | | | | | | | | | | | | | | | | | | | |
| | | | | |
Ratios to Average Net Assets(f) | | | | | | | | | | | | | | | | | | | | |
Total expenses | | | 0.06 | % | | | 0.06 | % | | | 0.06 | % | | | 0.07 | % | | | 0.07 | % |
| | | | | | | | | | | | | | | | | | | | |
| | | | | |
Net investment income | | | 1.60 | % | | | 1.02 | % | | | 1.28 | % | | | 1.36 | % | | | 1.35 | % |
| | | | | | | | | | | | | | | | | | | | |
| | | | | |
Supplemental Data | | | | | | | | | | | | | | | | | | | | |
Net assets, end of year (000) | | $ | 66,756,826 | | | $ | 72,070,280 | | | $ | 68,273,012 | | | $ | 31,863,332 | | | $ | 43,064,083 | |
| | | | | | | | | | | | | | | | | | | | |
| | | | | |
Portfolio turnover rate(g) | | | 19 | % | | | 16 | % | | | 20 | % | | | 16 | % | | | 14 | % |
| | | | | | | | | | | | | | | | | | | | |
| (a) | Based on average shares outstanding. |
| (b) | The amounts reported for a share outstanding may not accord with the change in aggregate gains and losses in securities for the fiscal period due to the timing of capital share transactions in relation to the fluctuating market values of the Fund’s underlying securities. |
| (c) | Distributions for annual periods determined in accordance with U.S. federal income tax regulations. |
| (d) | Where applicable, assumes the reinvestment of distributions. |
| (e) | Includes a payment received from an affiliate, which had no impact on the Fund’s total return. |
| (f) | Excludes fees and expenses incurred indirectly as a result of investments in underlying funds. |
| (g) | Portfolio turnover rate excludes in-kind transactions. |
See notes to financial statements.
| | |
| 70 | | 2 0 2 3 I SHARES ANNUAL REPORT TO SHAREHOLDERS |
Financial Highlights
(For a share outstanding throughout each period)
| | | | | | | | | | | | | | | | | | | | |
| | | iShares Core S&P U.S. Growth ETF | |
| | | Year Ended
03/31/23 | | | Year Ended
03/31/22 | | | Year Ended
03/31/21 | | | Year Ended
03/31/20 | | | Year Ended
03/31/19 | |
| | | | | |
Net asset value, beginning of year | | $ | 105.47 | | | $ | 90.74 | | | $ | 57.16 | | | $ | 60.31 | | | $ | 54.56 | |
| | | | | | | | | | | | | | | | | | | | |
| | | | | |
Net investment income(a) | | | 0.96 | | | | 0.72 | | | | 0.76 | | | | 0.92 | | | | 0.81 | |
Net realized and unrealized gain(b) | | | (16.67 | ) | | | 14.73 | | | | 33.62 | | | | (2.97 | ) | | | 5.68 | |
| | | | | | | | | | | | | | | | | | | | |
| | | | | |
Net increase from investment operations | | | (15.71 | ) | | | 15.45 | | | | 34.38 | | | | (2.05 | ) | | | 6.49 | |
| | | | | | | | | | | | | | | | | | | | |
| | | | | |
Distributions from net investment income(c) | | | (0.94 | ) | | | (0.72 | ) | | | (0.80 | ) | | | (1.10 | ) | | | (0.74 | ) |
| | | | | | | | | | | | | | | | | | | | |
| | | | | |
Net asset value, end of year | | $ | 88.82 | | | $ | 105.47 | | | $ | 90.74 | | | $ | 57.16 | | | $ | 60.31 | |
| | | | | | | | | | | | | | | | | | | | |
| | | | | |
Total Return(d) | | | | | | | | | | | | | | | | | | | | |
Based on net asset value | | | (14.86 | )% | | | 17.03 | % | | | 60.34 | % | | | (3.54 | )% | | | 11.95 | % |
| | | | | | | | | | | | | | | | | | | | |
| | | | | |
Ratios to Average Net Assets(e) | | | | | | | | | | | | | | | | | | | | |
Total expenses | | | 0.04 | % | | | 0.04 | % | | | 0.04 | % | | | 0.04 | % | | | 0.04 | % |
| | | | | | | | | | | | | | | | | | | | |
| | | | | |
Net investment income | | | 1.10 | % | | | 0.69 | % | | | 0.96 | % | | | 1.44 | % | | | 1.41 | % |
| | | | | | | | | | | | | | | | | | | | |
| | | | | |
Supplemental Data | | | | | | | | | | | | | | | | | | | | |
Net assets, end of year (000) | | $ | 12,323,462 | | | $ | 12,857,333 | | | $ | 10,461,747 | | | $ | 6,893,329 | | | $ | 5,985,790 | |
| | | | | | | | | | | | | | | | | | | | |
| | | | | |
Portfolio turnover rate(f) | | | 36 | % | | | 15 | % | | | 14 | % | | | 35 | % | | | 31 | % |
| | | | | | | | | | | | | | | | | | | | |
| (a) | Based on average shares outstanding. |
| (b) | The amounts reported for a share outstanding may not accord with the change in aggregate gains and losses in securities for the fiscal period due to the timing of capital share transactions in relation to the fluctuating market values of the Fund’s underlying securities. |
| (c) | Distributions for annual periods determined in accordance with U.S. federal income tax regulations. |
| (d) | Where applicable, assumes the reinvestment of distributions. |
| (e) | Excludes fees and expenses incurred indirectly as a result of investments in underlying funds. |
| (f) | Portfolio turnover rate excludes in-kind transactions. |
See notes to financial statements.
Financial Highlights
(For a share outstanding throughout each period)
| | | | | | | | | | | | | | | | | | | | |
| | | iShares Core S&P U.S. Value ETF | |
| | | Year Ended
03/31/23 | | | Year Ended
03/31/22 | | | Year Ended
03/31/21 | | | Year Ended
03/31/20 | | | Year Ended
03/31/19 | |
| | | | | |
Net asset value, beginning of year | | $ | 75.80 | | | $ | 68.82 | | | $ | 46.23 | | | $ | 54.82 | | | $ | 53.08 | |
| | | | | | | | | | | | | | | | | | | | |
| | | | | |
Net investment income(a) | | | 1.55 | | | | 1.50 | | | | 1.43 | | | | 1.45 | | | | 1.37 | |
Net realized and unrealized gain(b) | | | (2.02 | ) | | | 6.93 | | | | 22.60 | | | | (8.57 | ) | | | 1.68 | |
| | | | | | | | | | | | | | | | | | | | |
| | | | | |
Net increase from investment operations | | | (0.47 | ) | | | 8.43 | | | | 24.03 | | | | (7.12 | ) | | | 3.05 | |
| | | | | | | | | | | | | | | | | | | | |
| | | | | |
Distributions from net investment income(c) | | | (1.55 | ) | | | (1.45 | ) | | | (1.44 | ) | | | (1.47 | ) | | | (1.31 | ) |
| | | | | | | | | | | | | | | | | | | | |
| | | | | |
Net asset value, end of year | | $ | 73.78 | | | $ | 75.80 | | | $ | 68.82 | | | $ | 46.23 | | | $ | 54.82 | |
| | | | | | | | | | | | | | | | | | | | |
| | | | | |
Total Return(d) | | | | | | | | | | | | | | | | | | | | |
Based on net asset value | | | (0.46 | )% | | | 12.33 | % | | | 52.59 | % | | | (13.34 | )% | | | 5.83 | % |
| | | | | | | | | | | | | | | | | | | | |
| | | | | |
Ratios to Average Net Assets(e) | | | | | | | | | | | | | | | | | | | | |
Total expenses | | | 0.04 | % | | | 0.04 | % | | | 0.04 | % | | | 0.04 | % | | | 0.04 | % |
| | | | | | | | | | | | | | | | | | | | |
| | | | | |
Net investment income | | | 2.18 | % | | | 2.04 | % | | | 2.48 | % | | | 2.52 | % | | | 2.53 | % |
| | | | | | | | | | | | | | | | | | | | |
| | | | | |
Supplemental Data | | | | | | | | | | | | | | | | | | | | |
Net assets, end of year (000) | | $ | 13,283,986 | | | $ | 12,123,855 | | | $ | 9,084,867 | | | $ | 5,270,383 | | | $ | 5,208,349 | |
| | | | | | | | | | | | | | | | | | | | |
| | | | | |
Portfolio turnover rate(f) | | | 31 | % | | | 20 | % | | | 25 | % | | | 34 | % | | | 35 | % |
| | | | | | | | | | | | | | | | | | | | |
| (a) | Based on average shares outstanding. |
| (b) | The amounts reported for a share outstanding may not accord with the change in aggregate gains and losses in securities for the fiscal period due to the timing of capital share transactions in relation to the fluctuating market values of the Fund’s underlying securities. |
| (c) | Distributions for annual periods determined in accordance with U.S. federal income tax regulations. |
| (d) | Where applicable, assumes the reinvestment of distributions. |
| (e) | Excludes fees and expenses incurred indirectly as a result of investments in underlying funds. |
| (f) | Portfolio turnover rate excludes in-kind transactions. |
See notes to financial statements.
| | |
| 72 | | 2 0 2 3 I SHARES ANNUAL REPORT TO SHAREHOLDERS |
Notes to Financial Statements
iShares Trust (the “Trust”) is registered under the Investment Company Act of 1940, as amended (the “1940 Act”), as an open-end management investment company. The Trust is organized as a Delaware statutory trust and is authorized to have multiple series or portfolios.
These financial statements relate only to the following funds (each, a “Fund” and collectively, the “Funds”):
| | |
| iShares ETF | | Diversification
Classification |
Core S&P Mid-Cap | | Diversified |
Core S&P Small-Cap | | Diversified |
Core S&P U.S. Growth(a) | | Diversified |
Core S&P U.S. Value | | Diversified |
| | (a) | The Fund intends to be diversified in approximately the same proportion as its underlying index is diversified. The Fund may become non-diversified, as defined in the 1940 Act, solely as a result of a change in relative market capitalization or index weighting of one or more constituents of its underlying index. Shareholder approval will not be sought if the Fund crosses from diversified to non-diversified status due solely to a change in its relative market capitalization or index weighting of one or more constituents of its underlying index. | |
| 2. | SIGNIFICANT ACCOUNTING POLICIES |
The financial statements are prepared in conformity with accounting principles generally accepted in the United States of America (“U.S. GAAP”), which may require management to make estimates and assumptions that affect the reported amounts of assets and liabilities in the financial statements, disclosure of contingent assets and liabilities at the date of the financial statements and the reported amounts of increases and decreases in net assets from operations during the reporting period. Actual results could differ from those estimates. Each Fund is considered an investment company under U.S. GAAP and follows the accounting and reporting guidance applicable to investment companies. Below is a summary of significant accounting policies:
Investment Transactions and Income Recognition: For financial reporting purposes, investment transactions are recorded on the dates the transactions are executed. Realized gains and losses on investment transactions are determined using the specific identification method. Dividend income and capital gain distributions, if any, are recorded on the ex-dividend date. Non-cash dividends, if any, are recorded on the ex-dividend date at fair value. Upon notification from issuers or as estimated by management, a portion of the dividend income received from a real estate investment trust may be redesignated as a reduction of cost of the related investment and/or realized gain.
ForeignTaxes: The Funds may be subject to foreign taxes (a portion of which may be reclaimable) on income, stock dividends, capital gains on investments, or certain foreign currency transactions. All foreign taxes are recorded in accordance with the applicable foreign tax regulations and rates that exist in the foreign jurisdiction in which each Fund invests. These foreign taxes, if any, are paid by each Fund and are reflected in its Statements of Operations as follows: foreign taxes withheld at source are presented as a reduction of income, foreign taxes on securities lending income are presented as a reduction of securities lending income, foreign taxes on stock dividends are presented as “Other foreign taxes”, and foreign taxes on capital gains from sales of investments and foreign taxes on foreign currency transactions are included in their respective net realized gain (loss) categories. Foreign taxes payable or deferred as of March 31, 2023, if any, are disclosed in the Statements of Assets and Liabilities.
The Funds file withholding tax reclaims in certain jurisdictions to recover a portion of amounts previously withheld. The Funds may record a reclaim receivable based on collectability, which includes factors such as the jurisdiction’s applicable laws, payment history and market convention. The Statements of Operations includes tax reclaims recorded as well as professional and other fees, if any, associated with recovery of foreign withholding taxes.
Collateralization: If required by an exchange or counterparty agreement, the Funds may be required to deliver/deposit cash and/or securities to/with an exchange, or broker-dealer or custodian as collateral for certain investments.
In-kind Redemptions: For financial reporting purposes, in-kind redemptions are treated as sales of securities resulting in realized capital gains or losses to the Funds. Because such gains or losses are not taxable to the Funds and are not distributed to existing Fund shareholders, the gains or losses are reclassified from accumulated net realized gain (loss) to paid-in capital at the end of the Funds’ tax year. These reclassifications have no effect on net assets or net asset value (“NAV”) per share.
Distributions: Dividends and distributions paid by each Fund are recorded on the ex-dividend dates. Distributions are determined on a tax basis and may differ from net investment income and net realized capital gains for financial reporting purposes. Dividends and distributions are paid in U.S. dollars and cannot be automatically reinvested in additional shares of the Funds.
The character and timing of distributions are determined in accordance with U.S. federal income tax regulations, which may differ from U.S. GAAP.
Indemnifications: In the normal course of business, each Fund enters into contracts that contain a variety of representations that provide general indemnification. The Funds’ maximum exposure under these arrangements is unknown because it involves future potential claims against the Funds, which cannot be predicted with any certainty.
| 3. | INVESTMENT VALUATION AND FAIR VALUE MEASUREMENTS |
Investment Valuation Policies: Each Fund’s investments are valued at fair value (also referred to as “market value” within the financial statements) each day that the Fund’s listing exchange is open and, for financial reporting purposes, as of the report date. U.S. GAAP defines fair value as the price a fund would receive to sell an asset or pay to transfer a liability in an orderly transaction between market participants at the measurement date. The Board of Trustees of the Trust (the “Board”) of each Fund has approved the designation of BlackRock Fund Advisors (“BFA”), the Fund’s investment adviser, as the valuation designee for each Fund. Each Fund determines the fair values of its
| | |
NOTES TO FINANCIAL STATEMENTS | | 73 |
Notes to Financial Statements (continued)
financial instruments using various independent dealers or pricing services under BFA’s policies. If a security’s market price is not readily available or does not otherwise accurately represent the fair value of the security, the security will be valued in accordance with BFA’s policies and procedures as reflecting fair value. BFA has formed a committee (the “Valuation Committee”) to develop pricing policies and procedures and to oversee the pricing function for all financial instruments, with assistance from other BlackRock pricing committees.
Fair Value Inputs and Methodologies: The following methods and inputs are used to establish the fair value of each Fund’s assets and liabilities:
| | • | | Equity investments traded on a recognized securities exchange are valued at that day’s official closing price, as applicable, on the exchange where the stock is primarily traded. Equity investments traded on a recognized exchange for which there were no sales on that day are valued at the last traded price. |
| | • | | Investments in open-end U.S. mutual funds (including money market funds) are valued at that day’s published NAV. |
| | • | | Futures contracts are valued based on that day’s last reported settlement or trade price on the exchange where the contract is traded. |
| | • | | Swap agreements are valued utilizing quotes received daily by independent pricing services or through brokers, which are derived using daily swap curves and models that incorporate a number of market data factors, such as discounted cash flows, trades and values of the underlying reference instruments. |
If events (e.g., market volatility, company announcement or a natural disaster) occur that are expected to materially affect the value of such investment, or in the event that application of these methods of valuation results in a price for an investment that is deemed not to be representative of the market value of such investment, or if a price is not available, the investment will be valued by the Valuation Committee, in accordance with BFA’s policies and procedures as reflecting fair value (“Fair Valued Investments”). The fair valuation approaches that may be used by the Valuation Committee include market approach, income approach and cost approach. Valuation techniques such as discounted cash flow, use of market comparables and matrix pricing are types of valuation approaches and are typically used in determining fair value. When determining the price for Fair Valued Investments, the Valuation Committee seeks to determine the price that each Fund might reasonably expect to receive or pay from the current sale or purchase of that asset or liability in an arm’s-length transaction. Fair value determinations shall be based upon all available factors that the Valuation Committee deems relevant and consistent with the principles of fair value measurement.
Fair value pricing could result in a difference between the prices used to calculate a fund’s NAV and the prices used by the fund’s underlying index, which in turn could result in a difference between the fund’s performance and the performance of the fund’s underlying index.
Fair Value Hierarchy: Various inputs are used in determining the fair value of financial instruments. These inputs to valuation techniques are categorized into a fair value hierarchy consisting of three broad levels for financial reporting purposes as follows:
| | • | | Level 1 – Unadjusted price quotations in active markets/exchanges for identical assets or liabilities that each Fund has the ability to access; |
| | • | | Level 2 – Other observable inputs (including, but not limited to, quoted prices for similar assets or liabilities in markets that are active, quoted prices for identical or similar assets or liabilities in markets that are not active, inputs other than quoted prices that are observable for the assets or liabilities (such as interest rates, yield curves, volatilities, prepayment speeds, loss severities, credit risks and default rates) or other market–corroborated inputs); and |
| | • | | Level 3 – Unobservable inputs based on the best information available in the circumstances, to the extent observable inputs are not available (including the Valuation Committee’s assumptions used in determining the fair value of financial instruments). |
The hierarchy gives the highest priority to unadjusted quoted prices in active markets for identical assets or liabilities (Level 1 measurements) and the lowest priority to unobservable inputs (Level 3 measurements). Accordingly, the degree of judgment exercised in determining fair value is greatest for instruments categorized in Level 3. The inputs used to measure fair value may fall into different levels of the fair value hierarchy. In such cases, for disclosure purposes, the fair value hierarchy classification is determined based on the lowest level input that is significant to the fair value measurement in its entirety. Investments classified within Level 3 have significant unobservable inputs used by the Valuation Committee in determining the price for Fair Valued Investments. Level 3 investments include equity or debt issued by privately held companies or funds that may not have a secondary market and/or may have a limited number of investors. The categorization of a value determined for financial instruments is based on the pricing transparency of the financial instruments and is not necessarily an indication of the risks associated with investing in those securities.
| 4. | SECURITIES AND OTHER INVESTMENTS |
Securities Lending: Each Fund may lend its securities to approved borrowers, such as brokers, dealers and other financial institutions. The borrower pledges and maintains with the Fund collateral consisting of cash, an irrevocable letter of credit issued by an approved bank, or securities issued or guaranteed by the U.S. government. The initial collateral received by each Fund is required to have a value of at least 102% of the current market value of the loaned securities for securities traded on U.S. exchanges and a value of at least 105% for all other securities. The collateral is maintained thereafter at a value equal to at least 100% of the current value of the securities on loan. The market value of the loaned securities is determined at the close of each business day of the Fund and any additional required collateral is delivered to the Fund or excess collateral is returned by the Fund, on the next business day. During the term of the loan, each Fund is entitled to all distributions made on or in respect of the loaned securities but does not receive interest income on securities received as collateral. Loans of securities are terminable at any time and the borrower, after notice, is required to return borrowed securities within the standard time period for settlement of securities transactions.
As of period end, any securities on loan were collateralized by cash and/or U.S. Government obligations. Cash collateral invested in money market funds managed by BFA or its affiliates is disclosed in the Schedule of Investments. Any non-cash collateral received cannot be sold, re-invested or pledged by the Fund, except in the event of borrower default. The securities on loan, if any, are also disclosed in each Fund’s Schedule of Investments. The market value of any securities on loan and the value of any related cash collateral are disclosed in the Statements of Assets and Liabilities.
Securities lending transactions are entered into by the Funds under Master Securities Lending Agreements (each, an “MSLA”) which provide the right, in the event of default (including bankruptcy or insolvency) for the non-defaulting party to liquidate the collateral and calculate a net exposure to the defaulting party or request additional collateral. In the event that a borrower defaults, the Funds, as lender, would offset the market value of the collateral received against the market value of the securities loaned. When the
| | |
| 74 | | 2 0 2 3 I SHARES ANNUAL REPORT TO SHAREHOLDERS |
Notes to Financial Statements (continued)
value of the collateral is greater than that of the market value of the securities loaned, the lender is left with a net amount payable to the defaulting party. However, bankruptcy or insolvency laws of a particular jurisdiction may impose restrictions on or prohibitions against such a right of offset in the event of an MSLA counterparty’s bankruptcy or insolvency. Under the MSLA, absent an event of default, the borrower can resell or re-pledge the loaned securities, and the Funds can reinvest cash collateral received in connection with loaned securities. Upon an event of default, the parties’ obligations to return the securities or collateral to the other party are extinguished, and the parties can resell or re-pledge the loaned securities or the collateral received in connection with the loaned securities in order to satisfy the defaulting party’s net payment obligation for all transactions under the MSLA. The defaulting party remains liable for any deficiency.
As of period end, the following table is a summary of the securities on loan by counterparty which are subject to offset under an MSLA:
| | | | | | | | | | | | | | | | |
| | | | | |
| iShares ETF and Counterparty | |
| Securities
Loaned at Value |
| |
| Cash
Collateral Received |
(a) | |
| Non-Cash
Collateral Received,
at Fair Value |
(a) | |
| Net
Amount |
(b) |
Core S&P Mid-Cap | | | | | | | | | | | | | | | | |
Barclays Bank PLC | | $ | 231,454,327 | | | $ | (231,216,608 | ) | | $ | — | | | $ | 237,719 | |
Barclays Capital, Inc. | | | 21,556,926 | | | | (21,556,926 | ) | | | — | | | | — | |
BMO Capital Markets Corp. | | | 59,630 | | | | (59,630 | ) | | | — | | | | — | |
BNP Paribas SA | | | 307,271,643 | | | | (307,271,643 | ) | | | — | | | | — | |
BofA Securities, Inc. | | | 131,928,980 | | | | (131,928,980 | ) | | | — | | | | — | |
Citadel Clearing LLC | | | 82,684,343 | | | | (82,684,343 | ) | | | — | | | | — | |
Citigroup Global Markets, Inc. | | | 211,937,929 | | | | (211,937,929 | ) | | | — | | | | — | |
Credit Suisse Securities (USA) LLC | | | 6,066,803 | | | | (6,022,188 | ) | | | — | | | | 44,615 | |
Deutsche Bank Securities, Inc. | | | 737,280 | | | | (737,280 | ) | | | — | | | | — | |
Goldman Sachs & Co. LLC | | | 1,109,049,792 | | | | (1,109,049,792 | ) | | | — | | | | — | |
HSBC Bank PLC | | | 69,491,858 | | | | (69,491,858 | ) | | | — | | | | — | |
J.P. Morgan Securities LLC | | | 416,990,283 | | | | (416,990,283 | ) | | | — | | | | — | |
Jefferies LLC | | | 2,431,599 | | | | (2,431,599 | ) | | | — | | | | — | |
Morgan Stanley | | | 555,794,778 | | | | (554,196,466 | ) | | | — | | | | 1,598,312 | |
National Financial Services LLC | | | 16,683,267 | | | | (16,683,267 | ) | | | — | | | | — | |
Natixis SA | | | 49,118,236 | | | | (48,975,391 | ) | | | — | | | | 142,845 | |
Nomura Securities International, Inc. | | | 41,036 | | | | (41,036 | ) | | | — | | | | — | |
RBC Capital Market LLC | | | 322,259,410 | | | | (322,259,410 | ) | | | — | | | | — | |
Scotia Capital (USA), Inc. | | | 55,114,996 | | | | (54,906,529 | ) | | | — | | | | 208,467 | |
SG Americas Securities LLC | | | 2,636,523 | | | | (2,636,523 | ) | | | — | | | | — | |
State Street Bank & Trust Co. | | | 48,391,126 | | | | (48,391,126 | ) | | | — | | | | — | |
Toronto-Dominion Bank | | | 205,781,193 | | | | (205,781,193 | ) | | | — | | | | — | |
UBS AG | | | 105,032,365 | | | | (104,881,562 | ) | | | — | | | | 150,803 | |
UBS Securities LLC | | | 44,900,319 | | | | (44,760,889 | ) | | | — | | | | 139,430 | |
Virtu Americas LLC | | | 9,047,710 | | | | (9,047,710 | ) | | | — | | | | — | |
Wells Fargo Bank N.A. | | | 43,785,936 | | | | (43,778,729 | ) | | | — | | | | 7,207 | |
Wells Fargo Securities LLC | | | 6,672,264 | | | | (6,672,264 | ) | | | — | | | | — | |
| | | | | | | | | | | | | | | | |
| | $ | 4,056,920,552 | | | $ | (4,054,391,154 | ) | | $ | — | | | $ | 2,529,398 | |
| | | | | | | | | | | | | | | | |
Core S&P Small-Cap | | | | | | | | | | | | | | | | |
Barclays Bank PLC | | $ | 170,299,911 | | | $ | (170,299,911 | ) | | $ | — | | | $ | — | |
Barclays Capital, Inc. | | | 43,080,634 | | | | (43,080,634 | ) | | | — | | | | — | |
BMO Capital Markets Corp. | | | 116,510 | | | | (116,510 | ) | | | — | | | | — | |
BNP Paribas SA | | | 307,378,182 | | | | (307,378,182 | ) | | | — | | | | — | |
BofA Securities, Inc. | | | 334,296,295 | | | | (334,296,295 | ) | | | — | | | | — | |
Citadel Clearing LLC | | | 24,480,169 | | | | (24,480,169 | ) | | | — | | | | — | |
Citigroup Global Markets, Inc. | | | 116,919,009 | | | | (116,558,087 | ) | | | — | | | | 360,922 | |
Credit Suisse Securities (USA) LLC | | | 1,409,672 | | | | (1,409,672 | ) | | | — | | | | — | |
Goldman Sachs & Co. LLC | | | 781,170,963 | | | | (781,170,963 | ) | | | — | | | | — | |
HSBC Bank PLC | | | 33,464,703 | | | | (33,464,703 | ) | | | — | | | | — | |
J.P. Morgan Securities LLC | | | 665,563,018 | | | | (665,563,018 | ) | | | — | | | | — | |
Jefferies LLC | | | 14,306,700 | | | | (14,306,700 | ) | | | — | | | | — | |
Morgan Stanley | | | 724,742,912 | | | | (724,742,912 | ) | | | — | | | | — | |
National Financial Services LLC | | | 68,722,080 | | | | (68,582,804 | ) | | | — | | | | 139,276 | |
Natixis SA | | | 8,952,555 | | | | (8,952,555 | ) | | | — | | | | — | |
Nomura Securities International, Inc. | | | 38,840 | | | | (38,840 | ) | | | — | | | | — | |
Pershing LLC | | | 23,795,791 | | | | (23,795,791 | ) | | | — | | | | — | |
RBC Capital Market LLC | | | 29,772,247 | | | | (29,772,247 | ) | | | — | | | | — | |
Scotia Capital (USA), Inc. | | | 18,103,200 | | | | (18,103,200 | ) | | | — | | | | — | |
SG Americas Securities LLC | | | 2,343,431 | | | | (2,343,431 | ) | | | — | | | | — | |
State Street Bank & Trust Co. | | | 190,533,168 | | | | (190,533,168 | ) | | | — | | | | — | |
Toronto-Dominion Bank | | | 173,462,892 | | | | (173,462,892 | ) | | | — | | | | — | |
UBS AG | | | 169,243,337 | | | | (169,243,337 | ) | | | — | | | | — | |
UBS Securities LLC | | | 20,055,293 | | | | (19,968,491 | ) | | | — | | | | 86,802 | |
Virtu Americas LLC | | | 4,173,150 | | | | (4,173,150 | ) | | | — | | | | — | |
Wells Fargo Bank N.A. | | | 41,545,403 | | | | (41,545,403 | ) | | | — | | | | — | |
Wells Fargo Securities LLC | | | 17,729,741 | | | | (17,729,741 | ) | | | — | | | | — | |
| | | | | | | | | | | | | | | | |
| | $ | 3,985,699,806 | | | $ | (3,985,112,806 | ) | | $ | — | | | $ | 587,000 | |
| | | | | | | | | | | | | | | | |
| | |
NOTES TO FINANCIAL STATEMENTS | | 75 |
Notes to Financial Statements (continued)
| | | | | | | | | | | | | | | | |
| iShares ETF and Counterparty | |
| Securities
Loaned at Value |
| |
| Cash
Collateral Received |
(a) | |
| Non-Cash
Collateral Received,
at Fair Value |
(a) | |
| Net
Amount |
(b) |
Core S&P U.S. Growth | | | | | | | | | | | | | | | | |
BNP Paribas SA | | $ | 8,200,869 | | | $ | (8,200,869 | ) | | $ | — | | | $ | — | |
BofA Securities, Inc. | | | 2,534,553 | | | | (2,534,553 | ) | | | — | | | | — | |
Citadel Clearing LLC | | | 1,599,690 | | | | (1,599,690 | ) | | | — | | | | — | |
Citigroup Global Markets, Inc. | | | 10,195,459 | | | | (10,195,459 | ) | | | — | | | | — | |
Goldman Sachs & Co. LLC | | | 67,868,907 | | | | (67,868,907 | ) | | | — | | | | — | |
HSBC Bank PLC | | | 443,689 | | | | (443,689 | ) | | | — | | | | — | |
J.P. Morgan Securities LLC | | | 1,510,203 | | | | (1,510,203 | ) | | | — | | | | — | |
Morgan Stanley | | | 4,104,275 | | | | (4,104,275 | ) | | | — | | | | — | |
National Financial Services LLC | | | 218,661 | | | | (218,661 | ) | | | — | | | | — | |
RBC Capital Market LLC | | | 7,494,774 | | | | (7,494,774 | ) | | | — | | | | — | |
Scotia Capital (USA), Inc. | | | 1,767,028 | | | | (1,725,335 | ) | | | — | | | | 41,693 | |
SG Americas Securities LLC | | | 194,805 | | | | (194,805 | ) | | | — | | | | — | |
Toronto-Dominion Bank | | | 4,851,594 | | | | (4,851,594 | ) | | | — | | | | — | |
UBS Securities LLC | | | 695,241 | | | | (683,820 | ) | | | — | | | | 11,421 | |
Virtu Americas LLC | | | 585,441 | | | | (585,441 | ) | | | — | | | | — | |
| | | | | | | | | | | | | | | | |
| | $ | 112,265,189 | | | $ | (112,212,075 | ) | | $ | — | | | $ | 53,114 | |
| | | | | | | | | | | | | | | | |
Core S&P U.S. Value | | | | | | | | | | | | | | | | |
Barclays Bank PLC | | $ | 10,489,650 | | | $ | (10,366,874 | ) | | $ | — | | | $ | 122,776 | |
Barclays Capital, Inc. | | | 2,420,713 | | | | (2,406,410 | ) | | | — | | | | 14,303 | |
BNP Paribas SA | | | 10,016,249 | | | | (10,016,249 | ) | | | — | | | | — | |
BofA Securities, Inc. | | | 2,499,168 | | | | (2,499,168 | ) | | | — | | | | — | |
Citadel Clearing LLC | | | 1,026,165 | | | | (1,022,250 | ) | | | — | | | | 3,915 | |
Citigroup Global Markets, Inc. | | | 23,816 | | | | (23,816 | ) | | | — | | | | — | |
Credit Suisse Securities (USA) LLC | | | 16,025 | | | | (15,962 | ) | | | — | | | | 63 | |
Goldman Sachs & Co. LLC | | | 23,033,998 | | | | (23,005,419 | ) | | | — | | | | 28,579 | |
HSBC Bank PLC | | | 972,585 | | | | (972,585 | ) | | | — | | | | — | |
J.P. Morgan Securities LLC | | | 9,710,390 | | | | (9,710,390 | ) | | | — | | | | — | |
Morgan Stanley | | | 3,038,995 | | | | (3,037,936 | ) | | | — | | | | 1,059 | |
Natixis SA | | | 2,211,121 | | | | (2,195,470 | ) | | | — | | | | 15,651 | |
RBC Capital Market LLC | | | 3,092,061 | | | | (3,006,438 | ) | | | — | | | | 85,623 | |
Scotia Capital (USA), Inc. | | | 35,445 | | | | (35,397 | ) | | | — | | | | 48 | |
SG Americas Securities LLC | | | 14,903,403 | | | | (14,903,403 | ) | | | — | | | | — | |
State Street Bank & Trust Co. | | | 41,405 | | | | (41,405 | ) | | | — | | | | — | |
Toronto-Dominion Bank | | | 4,556,424 | | | | (4,430,250 | ) | | | — | | | | 126,174 | |
UBS AG | | | 7,871,560 | | | | (7,871,560 | ) | | | — | | | | — | |
Virtu Americas LLC | | | 279,095 | | | | (279,095 | ) | | | — | | | | — | |
Wells Fargo Bank N.A. | | | 76,578 | | | | (76,578 | ) | | | — | | | | — | |
| | | | | | | | | | | | | | | | |
| | $ | 96,314,846 | | | $ | (95,916,655) | | | $ | — | | | $ | 398,191 | |
| | | | | | | | | | | | | | | | |
| | (a) | Collateral received, if any, in excess of the market value of securities on loan is not presented in this table. The total cash collateral received by each Fund is disclosed in the Funds’ Statements of Assets and Liabilities. | |
| | (b) | The market value of the loaned securities is determined as of March 31, 2023. Additional collateral is delivered to the Fund on the next business day in accordance with the MSLA. The net amount would be subject to the borrower default indemnity in the event of default by the counterparty. | |
The risks of securities lending include the risk that the borrower may not provide additional collateral when required or may not return the securities when due. To mitigate these risks, each Fund benefits from a borrower default indemnity provided by BlackRock, Inc. (“BlackRock”). BlackRock’s indemnity allows for full replacement of the securities loaned to the extent the collateral received does not cover the value on the securities loaned in the event of borrower default. Each Fund could incur a loss if the value of an investment purchased with cash collateral falls below the market value of loaned securities or if the value of an investment purchased with cash collateral falls below the value of the original cash collateral received. Such losses are borne entirely by each Fund.
| 5. | DERIVATIVE FINANCIAL INSTRUMENTS |
Futures Contracts: Futures contracts are purchased or sold to gain exposure to, or manage exposure to, changes in interest rates (interest rate risk) and changes in the value of equity securities (equity risk) or foreign currencies (foreign currency exchange rate risk).
Futures contracts are exchange-traded agreements between the Funds and a counterparty to buy or sell a specific quantity of an underlying instrument at a specified price and on a specified date. Depending on the terms of a contract, it is settled either through physical delivery of the underlying instrument on the settlement date or by payment of a cash amount on the settlement date. Upon entering into a futures contract, the Funds are required to deposit initial margin with the broker in the form of cash or securities in an amount that varies depending on a contract’s size and risk profile. The initial margin deposit must then be maintained to an established level over the life of the contract. Amounts pledged, which are considered restricted, are included in cash pledged for futures contracts in the Statements of Assets and Liabilities.
Securities deposited as initial margin are designated in the Schedule of Investments and cash deposited, if any, are shown as cash pledged for futures contracts in the Statements of Assets and Liabilities. Pursuant to the contract, the Funds agree to receive from or pay to the broker an amount of cash equal to the daily fluctuation in market value of the contract (“variation margin”). Variation margin is recorded as unrealized appreciation (depreciation) and, if any, shown as variation margin receivable (or payable)
| | |
| 76 | | 2 0 2 3 I SHARES ANNUAL REPORT TO SHAREHOLDERS |
Notes to Financial Statements (continued)
on futures contracts in the Statements of Assets and Liabilities. When the contract is closed, a realized gain or loss is recorded in the Statements of Operations equal to the difference between the notional amount of the contract at the time it was opened and the notional amount at the time it was closed. The use of futures contracts involves the risk of an imperfect correlation in the movements in the price of futures contracts and interest rates, foreign currency exchange rates or underlying assets.
Swaps: Swap contracts are entered into to manage exposure to issuers, markets and securities. Such contracts are agreements between the Funds and a counterparty to make periodic net payments on a specified notional amount or a net payment upon termination. Swap agreements are privately negotiated in the OTC market and may be entered into as a bilateral contract (“OTC swaps”) or centrally cleared (“centrally cleared swaps”). For OTC swaps, any upfront premiums paid and any upfront fees received are shown as swap premiums paid and swap premiums received, respectively, in the Statements of Assets and Liabilities and amortized over the term of the contract. The daily fluctuation in market value is recorded as unrealized appreciation (depreciation) on OTC Swaps in the Statements of Assets and Liabilities. Payments received or paid are recorded in the Statements of Operations as realized gains or losses, respectively. When an OTC swap is terminated, a realized gain or loss is recorded in the Statements of Operations equal to the difference between the proceeds from (or cost of) the closing transaction and the Funds’ basis in the contract, if any. Generally, the basis of the contract is the premium received or paid. Total return swaps are entered into by the iShares Core S&P Mid-Cap ETF and iShares Core S&P Small-Cap ETF to obtain exposure to a security or market without owning such security or investing directly in such market or to exchange the risk/return of one security or market (e.g., fixed-income) with another security or market (e.g., equity or commodity prices) (equity risk, commodity price risk and/or interest rate risk).
Total return swaps are agreements in which there is an exchange of cash flows whereby one party commits to make payments based on the total return (distributions plus capital gains/losses) of an underlying instrument, or basket of underlying instruments, in exchange for fixed or floating rate interest payments. If the total return of the instruments or index underlying the transaction exceeds or falls short of the offsetting fixed or floating interest rate obligation, the Fund receives payment from or makes a payment to the counterparty.
Certain total return swaps are designed to function as a portfolio of direct investments in long and short equity positions. This means that the Fund has the ability to trade in and out of these long and short positions within the swap and will receive the economic benefits and risks equivalent to direct investment in these positions, subject to certain adjustments due to events related to the counterparty. Benefits and risks include capital appreciation (depreciation), corporate actions and dividends received and paid, all of which are reflected in the swap’s market value. The market value also includes interest charges and credits (“financing fees”) related to the notional values of the long and short positions and cash balances within the swap. These interest charges and credits are based on a specified benchmark rate plus or minus a specified spread determined based upon the country and/or currency of the positions in the portfolio.
Positions within the swap and financing fees are reset periodically. During a reset, any unrealized appreciation (depreciation) on positions and accrued financing fees become available for cash settlement between the Fund and the counterparty. The amounts that are available for cash settlement are recorded as realized gains or losses in the Statements of Operations. Cash settlement in and out of the swap may occur at a reset date or any other date, at the discretion of the Fund and the counterparty, over the life of the agreement. Certain swaps have no stated expiration and can be terminated by either party at any time.
Swap transactions involve, to varying degrees, elements of interest rate, credit and market risks in excess of the amounts recognized in the Statements of Assets and Liabilities. Such risks involve the possibility that there will be no liquid market for these agreements, that the counterparty to the agreements may default on its obligation to perform or disagree as to the meaning of the contractual terms in the agreements, and that there may be unfavorable changes in interest rates and/or market values associated with these transactions.
Master Netting Arrangements: In order to define its contractual rights and to secure rights that will help it mitigate its counterparty risk, a Fund may enter into an International Swaps and Derivatives Association, Inc. Master Agreement (“ISDA Master Agreement”) or similar agreement with its derivative contract counterparties. An ISDA Master Agreement is a bilateral agreement between a Fund and a counterparty that governs certain OTC derivatives and typically contains, among other things, collateral posting terms and netting provisions in the event of a default and/or termination event. Under an ISDA Master Agreement, a Fund may, under certain circumstances, offset with the counterparty certain derivative financial instruments’ payables and/or receivables with collateral held and/or posted and create one single net payment. The provisions of the ISDA Master Agreement typically permit a single net payment in the event of default including the bankruptcy or insolvency of the counterparty. However, bankruptcy or insolvency laws of a particular jurisdiction may impose restrictions on or prohibitions against the right of offset in bankruptcy, insolvency or other events.
For derivatives traded under an ISDA Master Agreement, the collateral requirements are typically calculated by netting the mark-to-market amount for each transaction under such agreement and comparing that amount to the value of any collateral currently pledged by a Fund and the counterparty.
Cash collateral that has been pledged to cover obligations of the Funds and cash collateral received from the counterparty, if any, is reported separately in the Statements of Assets and Liabilities as cash pledged as collateral and cash received as collateral, respectively. Non-cash collateral pledged by the Funds, if any, is noted in the Schedules of Investments. Generally, the amount of collateral due from or to a counterparty is subject to a certain minimum transfer amount threshold before a transfer is required, which is determined at the close of business of the Funds. Any additional required collateral is delivered to/pledged by the Funds on the next business day. Typically, the counterparty is not permitted to sell, re-pledge or use cash and non-cash collateral it receives. A Fund generally agrees not to use non-cash collateral that it receives but may, absent default or certain other circumstances defined in the underlying ISDA Master Agreement, be permitted to use cash collateral received. In such cases, interest may be paid pursuant to the collateral arrangement with the counterparty. To the extent amounts due to the Funds from the counterparty are not fully collateralized, each Fund bears the risk of loss from counterparty non-performance. Likewise, to the extent the Funds have delivered collateral to a counterparty and stand ready to perform under the terms of the agreement with such counterparty, each Fund bears the risk of loss from a counterparty in the amount of the value of the collateral in the event the counterparty fails to return such collateral. Based on the terms of agreements, collateral may not be required for all derivative contracts.
For financial reporting purposes, each Fund does not offset derivative assets and derivative liabilities that are subject to netting arrangements, if any, in the Statements of Assets and Liabilities.
| | |
NOTES TO FINANCIAL STATEMENTS | | 77 |
Notes to Financial Statements (continued)
| 6. | INVESTMENT ADVISORY AGREEMENT AND OTHER TRANSACTIONS WITH AFFILIATES |
Investment Advisory Fees: Pursuant to an Investment Advisory Agreement with the Trust, BFA manages the investment of each Fund’s assets. BFA is a California corporation indirectly owned by BlackRock. Under the Investment Advisory Agreement, BFA is responsible for substantially all expenses of the Funds, except (i) interest and taxes; (ii) brokerage commissions and other expenses connected with the execution of portfolio transactions; (iii) distribution fees; (iv) the advisory fee payable to BFA; and (v) litigation expenses and any extraordinary expenses (in each case as determined by a majority of the independent trustees).
For its investment advisory services to each of the following Funds, BFA is entitled to an annual investment advisory fee, accrued daily and paid monthly by the Funds, based on the average daily net assets of each Fund as follows:
| | | | |
| iShares ETF | | Investment Advisory Fees | |
Core S&P Mid-Cap | | | 0.05 | % |
Core S&P Small-Cap | | | 0.06 | |
Core S&P U.S. Growth | | | 0.04 | |
Core S&P U.S. Value | | | 0.04 | |
Distributor: BlackRock Investments, LLC (“BRIL”), an affiliate of BFA, is the distributor for each Fund. Pursuant to the distribution agreement, BFA is responsible for any fees or expenses for distribution services provided to the Funds.
ETF Servicing Fees: Each Fund has entered into an ETF Services Agreement with BRIL to perform certain order processing, Authorized Participant communications, and related services in connection with the issuance and redemption of Creation Units (“ETF Services”). BRIL is entitled to a transaction fee from Authorized Participants on each creation or redemption order for the ETF Services provided. The Funds do not pay BRIL for ETF Services.
Prior to April 25, 2022, ETF Services were performed by State Street Bank and Trust Company (“SSB”) for the Funds, with the exception of iShares Core S&P Small-Cap ETF, which SSB performed ETF Services prior to April 11, 2022.
Securities Lending: The U.S. Securities and Exchange Commission (the “SEC”) has issued an exemptive order which permits BlackRock Institutional Trust Company, N.A. (“BTC”), an affiliate of BFA, to serve as securities lending agent for the Funds, subject to applicable conditions. As securities lending agent, BTC bears all operational costs directly related to securities lending, including any custodial costs. Each Fund is responsible for fees in connection with the investment of cash collateral received for securities on loan (the “collateral investment fees”). The cash collateral is invested in a money market fund, BlackRock Cash Funds: Institutional or BlackRock Cash Funds: Treasury, managed by BFA, or its affiliates. However, BTC has agreed to reduce the amount of securities lending income it receives in order to effectively limit the collateral investment fees each Fund bears to an annual rate of 0.04%. The SL Agency Shares of such money market fund will not be subject to a sales load, distribution fee or service fee. The money market fund in which the cash collateral has been invested may, under certain circumstances, impose a liquidity fee of up to 2% of the value redeemed or temporarily restrict redemptions for up to 10 business days during a 90 day period, in the event that the money market fund’s weekly liquid assets fall below certain thresholds.
Securities lending income is equal to the total of income earned from the reinvestment of cash collateral, net of fees and other payments to and from borrowers of securities, and less the collateral investment fees. Each Fund retains a portion of securities lending income and remits the remaining portion to BTC as compensation for its services as securities lending agent.
Pursuant to the current securities lending agreement, each Fund retains 81% of securities lending income (which excludes collateral investment fees) and the amount retained can never be less than 70% of the total of securities lending income plus the collateral investment fees.
In addition, commencing the business day following the date that the aggregate securities lending income plus the collateral investment fees generated across all 1940 Act iShares exchange-traded funds (the “iShares ETF Complex”) in that calendar year exceeds a specified threshold, each Fund, pursuant to the securities lending agreement, will retain for the remainder of that calendar year 81% of securities lending income (which excludes collateral investment fees), and the amount retained can never be less than 70% of the total of securities lending income plus the collateral investment fees.
The share of securities lending income earned by each Fund is shown as securities lending income - affiliated - net in its Statements of Operations. For the year ended March 31, 2023, the Funds paid BTC the following amounts for securities lending agent services:
| | | | |
| iShares ETF | | Amounts | |
Core S&P Mid-Cap | | $ | 8,650,401 | |
Core S&P Small-Cap | | | 4,394,373 | |
Core S&P U.S. Growth | | | 208,803 | |
Core S&P U.S. Value | | | 127,961 | |
Officers and Trustees: Certain officers and/or trustees of the Trust are officers and/or trustees of BlackRock or its affiliates.
Other Transactions: Cross trading is the buying or selling of portfolio securities between funds to which BFA (or an affiliate) serves as investment adviser. At its regularly scheduled quarterly meetings, the Board reviews such transactions as of the most recent calendar quarter for compliance with the requirements and restrictions set forth by Rule 17a-7.
| | |
| 78 | | 2 0 2 3 I SHARES ANNUAL REPORT TO SHAREHOLDERS |
Notes to Financial Statements (continued)
For the year ended March 31, 2023, transactions executed by the Funds pursuant to Rule 17a-7 under the 1940 Act were as follows:
| | | | | | | | | | | | |
| | | | |
| iShares ETF | | Purchases | | | Sales | | | Net Realized
Gain (Loss) | |
| | | |
Core S&P Mid-Cap | | $ | 2,048,797,185 | | | $ | 3,485,447,707 | | | $ | (906,004,486 | ) |
Core S&P Small-Cap | | | 2,314,420,022 | | | | 2,101,833,049 | | | | 94,199,658 | |
Core S&P U.S. Growth | | | 2,662,783,579 | | | | 2,977,432,999 | | | | (832,128,178 | ) |
Core S&P U.S. Value | | | 3,146,812,931 | | | | 2,815,297,919 | | | | (116,294,218 | ) |
Each Fund may invest its positive cash balances in certain money market funds managed by BFA or an affiliate. The income earned on these temporary cash investments is shown as dividends - affiliated in the Statements of Operations.
A fund, in order to improve its portfolio liquidity and its ability to track its underlying index, may invest in shares of other iShares funds that invest in securities in the fund’s underlying index.
For the year ended March 31, 2023, purchases and sales of investments, excluding short-term securities and in-kind transactions, were as follows:
| | | | | | | | |
| iShares ETF | | Purchases | | | Sales | |
| | |
Core S&P Mid-Cap | | $ | 11,122,412,600 | | | $ | 11,137,650,642 | |
Core S&P Small-Cap | | | 12,526,547,049 | | | | 12,883,440,519 | |
Core S&P U.S. Growth | | | 4,080,939,244 | | | | 4,083,840,137 | |
Core S&P U.S. Value | | | 3,764,282,315 | | | | 3,724,869,768 | |
For the year ended March 31, 2023, in-kind transactions were as follows:
| | | | | | | | |
| iShares ETF | | In-kind
Purchases | | | In-kind
Sales | |
| | |
Core S&P Mid-Cap | | $ | 10,706,977,048 | | | $ | 6,027,966,673 | |
Core S&P Small-Cap | | | 10,734,231,094 | | | | 8,274,894,310 | |
Core S&P U.S. Growth | | | 2,758,615,656 | | | | 1,305,477,021 | |
Core S&P U.S. Value | | | 4,758,950,936 | | | | 3,356,378,308 | |
Each Fund is treated as an entity separate from the Trust’s other funds for federal income tax purposes. It is each Fund’s policy to comply with the requirements of the Internal Revenue Code of 1986, as amended, applicable to regulated investment companies, and to distribute substantially all of its taxable income to its shareholders. Therefore, no U.S. federal income tax provision is required.
Management has analyzed tax laws and regulations and their application to the Funds as of March 31, 2023, inclusive of the open tax return years, and does not believe that there are any uncertain tax positions that require recognition of a tax liability in the Funds’ financial statements.
U.S. GAAP requires that certain components of net assets be adjusted to reflect permanent differences between financial and tax reporting. These reclassifications have no effect on net assets or NAV per share. As of March 31, 2023, permanent differences attributable to distributions paid in excess of taxable income and realized gains (losses) from in-kind redemptions were reclassified to the following accounts:
| | | | | | | | |
| iShares ETF | | Paid-in capital | | | Accumulated earnings (loss) | |
| | |
Core S&P Mid-Cap | | $ | 1,854,728,886 | | | $ | (1,854,728,886 | ) |
Core S&P Small-Cap | | | 2,766,853,678 | | | | (2,766,853,678 | ) |
Core S&P U.S. Growth | | | 512,862,723 | | | | (512,862,723 | ) |
Core S&P U.S. Value | | | 1,050,199,128 | | | | (1,050,199,128 | ) |
| | |
NOTES TO FINANCIAL STATEMENTS | | 79 |
Notes to Financial Statements (continued)
The tax character of distributions paid was as follows:
| | | | | | | | |
| iShares ETF | | Year Ended
March 31, 2023 | | | Year Ended
March 31, 2022
| |
Core S&P Mid-Cap | | | | | | | | |
Ordinary income | | $ | 1,068,069,845 | | | $ | 842,798,749 | |
| | | | | | | | |
Core S&P Small-Cap | | | | | | | | |
Ordinary income | | $ | 1,012,107,695 | | | $ | 1,058,667,702 | |
| | | | | | | | |
Core S&P U.S. Growth | | | | | | | | |
Ordinary income | | $ | 124,923,098 | | | $ | 85,386,412 | |
| | | | | | | | |
Core S&P U.S. Value | | | | | | | | |
Ordinary income | | $ | 267,844,515 | | | $ | 219,854,566 | |
| | | | | | | | |
As of March 31, 2023, the tax components of accumulated net earnings (losses) were as follows:
| | | | | | | | | | | | | | | | | | | | |
| iShares ETF | | Undistributed
Ordinary Income
| | | Non-expiring
Capital Loss
Carryforwards(a) | | | Net Unrealized
Gains (Losses)(b)
| | | Qualified late-year losses(c) | | | Total | |
Core S&P Mid-Cap | | $ | — | | | $ | (1,713,541,092 | ) | | $ | 6,305,213,278 | | | $ | (310,816 | ) | | $ | 4,591,361,370 | |
Core S&P Small-Cap | | | — | | | | (2,941,893,594 | ) | | | 2,231,084,016 | | | | (111,666,576 | ) | | | (822,476,154 | ) |
Core S&P U.S. Growth | | | 1,271,844 | | | | (1,457,321,766 | ) | | | 2,357,206,896 | | | | — | | | | 901,156,974 | |
Core S&P U.S. Value | | | 464,743 | | | | (728,805,923 | ) | | | 592,473,808 | | | | — | | | | (135,867,372 | ) |
| (a) | Amounts available to offset future realized capital gains. | |
| (b) | The difference between book-basis and tax-basis unrealized gains (losses) was attributable primarily to the tax deferral of losses on wash sales, the realization for tax purposes of unrealized gains (losses) on certain futures contracts, accounting for swap agreements, characterization of corporate actions and the timing and recognition of realized gains (losses) for tax purposes. | |
| (c) | The Fund has elected to defer certain qualified late-year losses and recognize such losses in the next taxable year. | |
As of March 31, 2023, gross unrealized appreciation and depreciation based on cost of investments (including short positions and derivatives, if any) for U.S. federal income tax purposes were as follows:
| | | | | | | | | | | | | | | | |
| iShares ETF | | Tax Cost | | | Gross Unrealized
Appreciation | | | Gross Unrealized
Depreciation | | | Net Unrealized
Appreciation (Depreciation) | |
Core S&P Mid-Cap | | $ | 64,150,997,994 | | | $ | 11,956,116,969 | | | $ | (5,650,903,691 | ) | | $ | 6,305,213,278 | |
Core S&P Small-Cap | | | 68,536,095,691 | | | | 11,316,943,169 | | | | (9,085,859,153 | ) | | | 2,231,084,016 | |
Core S&P U.S. Growth | | | 10,070,516,254 | | | | 2,674,052,660 | | | | (316,845,764 | ) | | | 2,357,206,896 | |
Core S&P U.S. Value | | | 12,772,139,410 | | | | 1,429,584,854 | | | | (836,931,152 | ) | | | 592,653,702 | |
In the normal course of business, each Fund invests in securities or other instruments and may enter into certain transactions, and such activities subject the Fund to various risks, including, among others, fluctuations in the market (market risk) or failure of an issuer to meet all of its obligations. The value of securities or other instruments may also be affected by various factors, including, without limitation: (i) the general economy; (ii) the overall market as well as local, regional or global political and/or social instability; (iii) regulation, taxation or international tax treaties between various countries; or (iv) currency, interest rate or price fluctuations. Local, regional or global events such as war, acts of terrorism, the spread of infectious illness or other public health issues, recessions, or other events could have a significant impact on the Funds and their investments. Each Fund’s prospectus provides details of the risks to which the Fund is subject.
BFA uses a “passive” or index approach to try to achieve each Fund’s investment objective following the securities included in its underlying index during upturns as well as downturns. BFA does not take steps to reduce market exposure or to lessen the effects of a declining market. Divergence from the underlying index and the composition of the portfolio is monitored by BFA.
The Funds may be exposed to additional risks when reinvesting cash collateral in money market funds that do not seek to maintain a stable NAV per share of $1.00, which may be subject to redemption gates or liquidity fees under certain circumstances.
Infectious Illness Risk: An outbreak of an infectious illness, such as the COVID-19 pandemic, may adversely impact the economies of many nations and the global economy, and may impact individual issuers and capital markets in ways that cannot be foreseen. An infectious illness outbreak may result in, among other things, closed international borders, prolonged quarantines, supply chain disruptions, market volatility or disruptions and other significant economic, social and political impacts.
Valuation Risk: The market values of equities, such as common stocks and preferred securities or equity related investments, such as futures and options, may decline due to general market conditions which are not specifically related to a particular company. They may also decline due to factors which affect a particular industry or industries. A fund may invest in illiquid investments. An illiquid investment is any investment that a fund reasonably expects cannot be sold or disposed of in current market conditions in seven calendar days or less without the sale or disposition significantly changing the market value of the investment. A fund may experience difficulty in selling illiquid
| | |
| 80 | | 2 0 2 3 I SHARES ANNUAL REPORT TO SHAREHOLDERS |
Notes to Financial Statements (continued)
investments in a timely manner at the price that it believes the investments are worth. Prices may fluctuate widely over short or extended periods in response to company, market or economic news. Markets also tend to move in cycles, with periods of rising and falling prices. This volatility may cause a fund’s NAV to experience significant increases or decreases over short periods of time. If there is a general decline in the securities and other markets, the NAV of a fund may lose value, regardless of the individual results of the securities and other instruments in which a fund invests.
The price each Fund could receive upon the sale of any particular portfolio investment may differ from each Fund’s valuation of the investment, particularly for securities that trade in thin or volatile markets or that are valued using a fair valuation technique or a price provided by an independent pricing service. Changes to significant unobservable inputs and assumptions (i.e., publicly traded company multiples, growth rate, time to exit) due to the lack of observable inputs.
Counterparty Credit Risk: The Funds may be exposed to counterparty credit risk, or the risk that an entity may fail to or be unable to perform on its commitments related to unsettled or open transactions, including making timely interest and/or principal payments or otherwise honoring its obligations. The Funds manage counterparty credit risk by entering into transactions only with counterparties that BFA believes have the financial resources to honor their obligations and by monitoring the financial stability of those counterparties. Financial assets, which potentially expose the Funds to market, issuer and counterparty credit risks, consist principally of financial instruments and receivables due from counterparties. The extent of the Funds’ exposure to market, issuer and counterparty credit risks with respect to these financial assets is approximately their value recorded in the Statements of Assets and Liabilities, less any collateral held by the Funds.
A derivative contract may suffer a mark-to-market loss if the value of the contract decreases due to an unfavorable change in the market rates or values of the underlying instrument. Losses can also occur if the counterparty does not perform under the contract.
With exchange-traded futures, there is less counterparty credit risk to the Funds since the exchange or clearinghouse, as counterparty to such instruments, guarantees against a possible default. The clearinghouse stands between the buyer and the seller of the contract; therefore, credit risk is limited to failure of the clearinghouse. While offset rights may exist under applicable law, a Fund does not have a contractual right of offset against a clearing broker or clearinghouse in the event of a default (including the bankruptcy or insolvency). Additionally, credit risk exists in exchange-traded futures with respect to initial and variation margin that is held in a clearing broker’s customer accounts. While clearing brokers are required to segregate customer margin from their own assets, in the event that a clearing broker becomes insolvent or goes into bankruptcy and at that time there is a shortfall in the aggregate amount of margin held by the clearing broker for all its clients, typically the shortfall would be allocated on a pro rata basis across all the clearing broker’s customers, potentially resulting in losses to the Funds.
Concentration Risk: A diversified portfolio, where this is appropriate and consistent with a fund’s objectives, minimizes the risk that a price change of a particular investment will have a material impact on the NAV of a fund. The investment concentrations within each Fund’s portfolio are disclosed in its Schedule of Investments.
The Funds invest a significant portion of their assets in securities within a single or limited number of market sectors. When a Fund concentrates its investments in this manner, it assumes the risk that economic, regulatory, political and social conditions affecting such sectors may have a significant impact on the fund and could affect the income from, or the value or liquidity of, the fund’s portfolio. Investment percentages in specific sectors are presented in the Schedule of Investments.
Significant Shareholder Redemption Risk: Certain shareholders may own or manage a substantial amount of fund shares and/or hold their fund investments for a limited period of time. Large redemptions of fund shares by these shareholders may force a fund to sell portfolio securities, which may negatively impact the fund’s NAV, increase the fund’s brokerage costs, and/or accelerate the realization of taxable income/gains and cause the fund to make additional taxable distributions to shareholders.
| 10. | CAPITAL SHARE TRANSACTIONS |
Capital shares are issued and redeemed by each Fund only in aggregations of a specified number of shares or multiples thereof (“Creation Units”) at NAV. Except when aggregated in Creation Units, shares of each Fund are not redeemable.
Transactions in capital shares were as follows:
| | | | | | | | | | | | | | | | |
| | | Year Ended
03/31/23 | | | Year Ended
03/31/22 | |
| iShares ETF | | Shares | | | Amount | | | Shares | | | Amount | |
Core S&P Mid-Cap | | | | | | | | | | | | | | | | |
Shares sold | | | 44,050,000 | | | $ | 10,833,257,889 | | | | 44,950,000 | | | $ | 12,187,553,091 | |
Shares redeemed | | | (24,200,000 | ) | | | (5,957,904,147 | ) | | | (33,950,000 | ) | | | (9,149,968,360 | ) |
| | | | | | | | | | | | | | | | |
| | | 19,850,000 | | | $ | 4,875,353,742 | | | | 11,000,000 | | | $ | 3,037,584,731 | |
| | | | | | | | | | | | | | | | |
Core S&P Small-Cap | | | | | | | | | | | | | | | | |
Shares sold | | | 109,400,000 | | | $ | 10,712,472,940 | | | | 122,700,000 | | | $ | 13,651,203,551 | |
Shares redeemed | | | (87,250,000 | ) | | | (8,367,916,204 | ) | | | (85,100,000 | ) | | | (9,350,124,736 | ) |
| | | | | | | | | | | | | | | | |
| | | 22,150,000 | | | $ | 2,344,556,736 | | | | 37,600,000 | | | $ | 4,301,078,815 | |
| | | | | | | | | | | | | | | | |
Core S&P U.S. Growth | | | | | | | | | | | | | | | | |
Shares sold | | | 32,150,000 | | | $ | 2,766,534,333 | | | | 32,600,000 | | | $ | 3,543,506,031 | |
Shares redeemed | | | (15,300,000 | ) | | | (1,320,929,843 | ) | | | (26,000,000 | ) | | | (2,826,109,252 | ) |
| | | | | | | | | | | | | | | | |
| | | 16,850,000 | | | $ | 1,445,604,490 | | | | 6,600,000 | | | $ | 717,396,779 | |
| | | | | | | | | | | | | | | | |
| | |
NOTES TO FINANCIAL STATEMENTS | | 81 |
Notes to Financial Statements (continued)
| | | | | | | | | | | | | | | | |
| | | Year Ended
03/31/23 | | | Year Ended
03/31/22 | |
| iShares ETF | | Shares | | | Amount | | | Shares | | | Amount | |
Core S&P U.S. Value | | | | | | | | | | | | | | | | |
Shares sold | | | 67,600,000 | | | $ | 4,795,462,207 | | | | 45,100,000 | | | $ | 3,309,869,059 | |
Shares redeemed | | | (47,500,000 | ) | | | (3,340,436,231 | ) | | | (17,150,000 | ) | | | (1,264,981,587 | ) |
| | | | | | | | | | | | | | | | |
| | | 20,100,000 | | | $ | 1,455,025,976 | | | | 27,950,000 | | | $ | 2,044,887,472 | |
| | | | | | | | | | | | | | | | |
The consideration for the purchase of Creation Units of a fund in the Trust generally consists of the in-kind deposit of a designated portfolio of securities and a specified amount of cash. Certain funds in the Trust may be offered in Creation Units solely or partially for cash in U.S. dollars. Investors purchasing and redeeming Creation Units may pay a purchase transaction fee and a redemption transaction fee directly to BRIL, to offset transfer and other transaction costs associated with the issuance and redemption of Creation Units, including Creation Units for cash. Investors transacting in Creation Units for cash may also pay an additional variable charge to compensate the relevant fund for certain transaction costs (i.e., stamp taxes, taxes on currency or other financial transactions, and brokerage costs) and market impact expenses relating to investing in portfolio securities. Such variable charges, if any, are included in shares sold in the table above.
From time to time, settlement of securities related to in-kind contributions or in-kind redemptions may be delayed. In such cases, securities related to in-kind transactions are reflected as a receivable or a payable in the Statements of Assets and Liabilities.
Management has evaluated the impact of all subsequent events on the Funds through the date the financial statements were available to be issued and has determined that there were no subsequent events requiring adjustment or additional disclosure in the financial statements.
| | |
| 82 | | 2 0 2 3 I SHARES ANNUAL REPORT TO SHAREHOLDERS |
Report of Independent Registered Public Accounting Firm
To the Board of Trustees of iShares Trust and
Shareholders of each of the four funds listed in the table below
Opinions on the Financial Statements
We have audited the accompanying statements of assets and liabilities, including the schedules of investments, of each of the funds listed in the table below (four of the funds constituting iShares Trust, hereafter collectively referred to as the “Funds”) as of March 31, 2023, the related statements of operations for the year ended March 31, 2023, the statements of changes in net assets for each of the two years in the period ended March 31, 2023, including the related notes, and the financial highlights for each of the five years in the period ended March 31, 2023 (collectively referred to as the “financial statements”). In our opinion, the financial statements present fairly, in all material respects, the financial position of each of the Funds as of March 31, 2023, the results of each of their operations for the year then ended, the changes in each of their net assets for each of the two years in the period ended March 31, 2023 and each of the financial highlights for each of the five years in the period ended March 31, 2023 in conformity with accounting principles generally accepted in the United States of America.
| | |
iShares Core S&P Mid-Cap ETF | | |
iShares Core S&P Small-Cap ETF | | |
iShares Core S&P U.S. Growth ETF | | |
iShares Core S&P U.S. Value ETF | | |
Basis for Opinions
These financial statements are the responsibility of the Funds’ management. Our responsibility is to express an opinion on the Funds’ financial statements based on our audits. We are a public accounting firm registered with the Public Company Accounting Oversight Board (United States) (PCAOB) and are required to be independent with respect to the Funds in accordance with the U.S. federal securities laws and the applicable rules and regulations of the Securities and Exchange Commission and the PCAOB.
We conducted our audits of these financial statements in accordance with the standards of the PCAOB. Those standards require that we plan and perform the audit to obtain reasonable assurance about whether the financial statements are free of material misstatement, whether due to error or fraud.
Our audits included performing procedures to assess the risks of material misstatement of the financial statements, whether due to error or fraud, and performing procedures that respond to those risks. Such procedures included examining, on a test basis, evidence regarding the amounts and disclosures in the financial statements. Our audits also included evaluating the accounting principles used and significant estimates made by management, as well as evaluating the overall presentation of the financial statements. Our procedures included confirmation of securities owned as of March 31, 2023 by correspondence with the custodian, transfer agent and brokers; when replies were not received from brokers, we performed other auditing procedures. We believe that our audits provide a reasonable basis for our opinions.
/s/PricewaterhouseCoopers LLP
Philadelphia, Pennsylvania
May 25, 2023
We have served as the auditor of one or more BlackRock investment companies since 2000.
| | |
REPORT OF INDEPENDENT REGISTERED PUBLIC ACCOUNTING FIRM | | 83 |
| | |
| Important Tax Information (unaudited) | | |
The following amounts, or maximum amounts allowable by law, are hereby designated as qualified dividend income for individuals for the fiscal year ended March 31, 2023:
| | | | |
| iShares ETF | | Qualified Dividend
Income | |
Core S&P Mid-Cap | | $ | 817,118,083 | |
Core S&P Small-Cap | | | 769,604,422 | |
Core S&P U.S. Growth | | | 121,718,631 | |
Core S&P U.S. Value | | | 250,448,729 | |
The following amounts, or maximum amounts allowable by law, are hereby designated as qualified business income for individuals for the fiscal year ended March 31, 2023:
| | | | |
| iShares ETF | | Qualified Business
Income | |
Core S&P Mid-Cap | | $ | 94,558,909 | |
Core S&P Small-Cap | | | 129,224,285 | |
Core S&P U.S. Growth | | | 4,810,632 | |
Core S&P U.S. Value | | | 8,005,097 | |
The following percentages, or maximum percentages allowable by law, of ordinary income distributions paid during the fiscal year ended March 31, 2023 qualified for the dividends-received deduction for corporate shareholders:
| | | | |
| iShares ETF | | Dividends-Received
Deduction | |
Core S&P Mid-Cap | | | 75.67 | % |
Core S&P Small-Cap | | | 74.94 | |
Core S&P U.S. Growth | | | 94.29 | |
Core S&P U.S. Value | | | 90.86 | |
| | |
| 84 | | 2 0 2 3 I SHARES ANNUAL REPORT TO SHAREHOLDERS |
Statement Regarding Liquidity Risk Management Program (unaudited)
In compliance with Rule 22e-4 under the Investment Company Act of 1940, as amended (the “Liquidity Rule”), iShares Trust (the “Trust”) has adopted and implemented a liquidity risk management program (the “Program”) for iShares Core S&P Mid-Cap ETF, iShares Core S&P Small-Cap ETF, iShares Core S&P U.S. Growth ETF and iShares Core S&P U.S. Value ETF (the “Funds” or “ETFs”), each a series of the Trust, which is reasonably designed to assess and manage each Fund’s liquidity risk.
The Board of Trustees (the “Board”) of the Trust, on behalf of the Funds, met on December 9, 2022 (the “Meeting”) to review the Program. The Board previously appointed BlackRock Fund Advisors (“BlackRock”), the investment adviser to the Funds, as the program administrator for each Fund’s Program. BlackRock also previously delegated oversight of the Program to the 40 Act Liquidity Risk Management Committee (the “Committee”). At the Meeting, the Committee, on behalf of BlackRock, provided the Board with a report that addressed the operation of the Program and assessed its adequacy and effectiveness of implementation, including the management of each Fund’s Highly Liquid Investment Minimum (“HLIM”) where applicable, and any material changes to the Program (the “Report”). The Report covered the period from October 1, 2021 through September 30, 2022 (the “Program Reporting Period”).
The Report described the Program’s liquidity classification methodology for categorizing each Fund’s investments (including derivative transactions) into one of four liquidity buckets. It also referenced the methodology used by BlackRock to establish each Fund’s HLIM and noted that the Committee reviews and ratifies the HLIM assigned to each Fund no less frequently than annually. The Report also discussed notable events affecting liquidity over the Program Reporting Period, including extended market holidays, the imposition of capital controls in certain non-U.S. countries, Russian sanctions and the closure of the Russian securities market.
The Report noted that the Program complied with the key factors for consideration under the Liquidity Rule for assessing, managing and periodically reviewing each Fund’s liquidity risk, as follows:
| | a) | The Fund’s investment strategy and liquidity of portfolio investments during both normal and reasonably foreseeable stressed conditions. During the Program Reporting Period, the Committee reviewed whether each Fund’s strategy is appropriate for an open-end fund structure, with a focus on funds with more significant and consistent holdings of less liquid and illiquid assets. The Committee also factored a fund’s concentration in an issuer into the liquidity classification methodology by taking issuer position sizes into account. Derivative exposure was also considered in the calculation of a fund’s liquidity bucketing. Finally, a factor for consideration under the Liquidity Rule is a Fund’s use of borrowings for investment purposes. However, the Funds do not borrow for investment purposes. |
| | b) | Short-term and long-term cash flow projections during both normal and reasonably foreseeable stressed conditions. During the Program Reporting Period, the Committee reviewed historical redemption activity and used this information as a component to establish each ETF’s reasonably anticipated trading size (“RATS”). The Committee may also take into consideration a fund’s shareholder ownership concentration (which, depending on product type and distribution channel, may or may not be available), a fund’s distribution channels, and the degree of certainty associated with a fund’s short-term and long-term cash flow projections. |
| | c) | Holdings of cash and cash equivalents, as well as borrowing arrangements. The Committee considered that ETFs generally do not hold more than de minimis amounts of cash. The Committee also considered that ETFs generally do not engage in borrowing. |
| | d) | The relationship between an ETF’s portfolio liquidity and the way in which, and the prices and spreads at which, ETF shares trade, including the efficiency of the arbitrage function and the level of active participation by market participants, including authorized participants. The Committee monitored the prevailing bid/ask spread and the ETF price premium (or discount) to NAV for all ETFs. However, there were no ETFs with persistent deviations of fund premium/discount or bid/ask spreads from long-term averages over the Program Reporting Period. |
| | e) | The effect of the composition of baskets on the overall liquidity of an ETF’s portfolio. In reviewing the linkage between the composition of custom baskets accepted by an ETF and any significant change in the liquidity profile of such ETF, the Committee reviewed changes in the proportion of each ETF’s portfolio comprised of less liquid and illiquid holdings to determine if applicable thresholds were met requiring enhanced review. |
There were no material changes to the Program during the Program Reporting Period other than the enhancement of certain model components in the Program’s classification methodology. The Report provided to the Board stated that the Committee concluded that based on the operation of the functions, as described in the Report, the Program is operating as intended and is effective in implementing the requirements of the Liquidity Rule.
| | |
STATEMENT REGARDING LIQUIDITY RISK MANAGEMENT PROGRAM | | 85 |
Supplemental Information (unaudited)
Section 19(a) Notices
The amounts and sources of distributions reported are estimates and are being provided pursuant to regulatory requirements and are not being provided for tax reporting purposes. The actual amounts and sources for tax reporting purposes will depend upon each Fund’s investment experience during the year and may be subject to changes based on tax regulations. Shareholders will receive a Form 1099-DIV each calendar year that will inform them how to report these distributions for federal income tax purposes.
March 31, 2023
| | | | | | | | | | | | | | | | | | | | | | | | | | | | | | | | |
| | | Total Cumulative Distributions
for the Fiscal Year-to-Date | | | % Breakdown of the Total Cumulative
Distributions for the Fiscal Year-to-Date | |
| iShares ETF | | Net
Investment
Income | | | Net Realized
Capital Gains | | | Return of
Capital | | | Total Per
Share | | | Net
Investment
Income | | | Net Realized
Capital Gains | | | Return of
Capital | | | Total Per
Share | |
Core S&P Mid-Cap | | $ | 4.170696 | | | $ | — | | | $ | — | | | $ | 4.170696 | | | | 100 | % | | | — | % | | | — | % | | | 100 | % |
Core S&P Small-Cap | | | 1.498078 | | | | — | | | | — | | | | 1.498078 | | | | 100 | | | | — | | | | — | | | | 100 | |
Premium/Discount Information
Information on the Fund’s net asset value, market price, premiums and discounts, and bid-ask spreads can be found at iShares.com.
Regulation under the Alternative Investment Fund Managers Directive
The Alternative Investment Fund Managers Directive, and its United Kingdom (“UK”) equivalent, ( “AIFMD”) impose detailed and prescriptive obligations on fund managers established in the European Union (the “EU”) and the UK. These do not currently apply to managers established outside of the EU or UK, such as BFA (the “Company”). Rather, the Company is only required to comply with certain disclosure, reporting and transparency obligations of AIFMD because it has registered the iShares Core S&P Mid-Cap ETF and iShares Core S&P Small-Cap ETF (the “Funds”) to be marketed to investors in the EU and/or UK.
Report on Remuneration
The Company is required under AIFMD to make quantitative disclosures of remuneration. These disclosures are made in line with BlackRock’s interpretation of currently available regulatory guidance on quantitative remuneration disclosures. As market or regulatory practice develops BlackRock may consider it appropriate to make changes to the way in which quantitative remuneration disclosures are calculated. Where such changes are made, this may result in disclosures in relation to a fund not being comparable to the disclosures made in the prior year, or in relation to other BlackRock fund disclosures in that same year.
Disclosures are provided in relation to (a) the staff of the Company; (b) staff who are senior management; and (c) staff who have the ability to materially affect the risk profile of the Funds.
All individuals included in the aggregated figures disclosed are rewarded in line with BlackRock’s remuneration policy for their responsibilities across the relevant BlackRock business area. As all individuals have a number of areas of responsibilities, only the portion of remuneration for those individuals’ services attributable to the Funds is included in the aggregate figures disclosed.
BlackRock has a clear and well-defined pay-for-performance philosophy, and compensation programs which support that philosophy.
BlackRock operates a total compensation model for remuneration which includes a base salary, which is contractual, and a discretionary bonus scheme. Although all employees are eligible to receive a discretionary bonus, there is no contractual obligation to make a discretionary bonus award to any employees. For senior management and staff who have the ability to materially affect the risk profile of the Funds, a significant percentage of variable remuneration is deferred over time. All employees are subject to a clawback policy.
Remuneration decisions for employees are made once annually in January following the end of the performance year, based on BlackRock’s full-year financial results and other non-financial goals and objectives. Alongside financial performance, individual total compensation is also based on strategic and operating results and other considerations such as management and leadership capabilities. No set formulas are established and no fixed benchmarks are used in determining annual incentive awards.
Annual incentive awards are paid from a bonus pool which is reviewed throughout the year by BlackRock’s independent compensation committee, taking into account both actual and projected financial information together with information provided by the Enterprise Risk and Regulatory Compliance departments in relation to any activities, incidents or events that warrant consideration in making compensation decisions. Individuals are not involved in setting their own remuneration.
Each of the control functions (Enterprise Risk, Legal & Compliance, and Internal Audit) each have their own organizational structures which are independent of the business units and therefore staff members in control functions are remunerated independently of the businesses they oversee. Functional bonus pools for those control functions are determined with reference to the performance of each individual function and the remuneration of the senior members of control functions is directly overseen by BlackRock’s independent remuneration committee.
Members of staff and senior management of the Company typically provide both AIFMD and non-AIFMD related services in respect of multiple funds, clients and functions of the Company and across the broader BlackRock group. Conversely, members of staff and senior management of the broader BlackRock group may provide both AIFMD and non-AIFMD related services in respect of multiple funds, clients and functions of the broader BlackRock group and of the Company. Therefore, the figures disclosed are a sum
| | |
| 86 | | 2 0 2 3 I SHARES ANNUAL REPORT TO SHAREHOLDERS |
Supplemental Information (unaudited)
of individuals’ portion of remuneration attributable to the Company according to an objective apportionment methodology which acknowledges the multiple-service nature of the Company and the broader BlackRock group. Accordingly, the figures are not representative of any individual’s actual remuneration or their remuneration structure.
The amount of the total remuneration awarded to the Company’s staff in respect of the Company’s financial year ending December 31, 2022 was USD 4,121 million. This figure is comprised of fixed remuneration of USD 685 million and variable remuneration of USD 3,436 million. There was a total of 8 beneficiaries of the remuneration described above.
The amount of the aggregate remuneration awarded by the Company in respect of the Company’s financial year ending December 31, 2022, to its senior management was USD 2,958 million, and to other members of its staff whose actions potentially have a material impact on the risk profile of the Company or its funds was USD 970 million. These figures relate to the entire Company and not to the Funds.
Disclosures Under the EU Sustainable Finance Disclosure Regulation
The iShares Core S&P Mid-Cap ETF and iShares Core S&P Small-Cap ETF (the “Funds”) are registered under the Alternative Investment Fund Managers Directive to be marketed to European Union (“EU”) investors, as noted above. As a result, certain disclosures are required under the EU Sustainable Finance Disclosure Regulation (“SFDR”).
Each Fund has not been categorized under the SFDR as an “Article 8” or “Article 9” product. In addition, each Fund’s investment strategy does not take into account the criteria for environmentally sustainable economic activities under the EU sustainable investment taxonomy regulation or principal adverse impacts (“PAIs”) on sustainability factors under the SFDR. PAIs are identified under the SFDR as the material impacts of investment decisions on sustainability factors relating to environmental, social and employee matters, respect for human rights, and anti-corruption and anti-bribery matters.
| | |
SUPPLEMENTAL INFORMATION | | 87 |
Trustee and Officer Information
The Board of Trustees has responsibility for the overall management and operations of the Funds, including general supervision of the duties performed by BFA and other service providers. Each Trustee serves until he or she resigns, is removed, dies, retires or becomes incapacitated. Each officer shall hold office until his or her successor is elected and qualifies or until his or her death, resignation or removal. Trustees who are not “interested persons” (as defined in the 1940 Act) of the Trust are referred to as independent trustees (“Independent Trustees”).
The registered investment companies advised by BFA or its affiliates (the “BlackRock-advised Funds”) are organized into one complex of open-end equity, multi-asset, index and money market funds and ETFs (the “BlackRock Multi-Asset Complex”), one complex of closed-end funds and open-end non-index fixed-income funds (including ETFs) (the “BlackRock Fixed-Income Complex”) and one complex of ETFs (“Exchange-Traded Fund Complex”) (each, a “BlackRock Fund Complex”). Each Fund is included in the Exchange-Traded Fund Complex. Each Trustee also serves as a Director of iShares, Inc. and a Trustee of iShares U.S. ETF Trust and, as a result, oversees all of the funds within the Exchange-Traded Fund Complex, which consists of 380 funds as of March 31, 2023. With the exception of Robert S. Kapito, Salim Ramji and Charles Park, the address of each Trustee and officer is c/o BlackRock, Inc., 400 Howard Street, San Francisco, CA 94105. The address of Mr. Kapito, Mr. Ramji and Mr. Park is c/o BlackRock, Inc., 50 Hudson Yards, New York, NY 10001. The Board has designated John E. Kerrigan as its Independent Board Chair. Additional information about the Funds’ Trustees and officers may be found in the Funds’ combined Statement of Additional Information, which is available without charge, upon request, by calling toll-free 1-800-iShares (1-800-474-2737).
| | | | | | |
| Interested Trustees |
| | | | |
Name (Year of
Birth) | | Position(s) | | Principal Occupation(s)
During Past 5 Years | | Other Directorships Held by Trustee |
Robert S.
Kapito(a) (1957) | | Trustee (since 2009). | | President, BlackRock, Inc. (since 2006); Vice Chairman of BlackRock, Inc. and Head of BlackRock’s Portfolio Management Group (since its formation in 1998) and BlackRock, Inc.’s predecessor entities (since 1988); Trustee, University of Pennsylvania (since 2009); President of Board of Directors, Hope & Heroes Children’s Cancer Fund (since 2002). | | Director of BlackRock, Inc. (since 2006); Director of iShares, Inc. (since 2009); Trustee of iShares U.S. ETF Trust (since 2011). |
| | | |
Salim Ramji(b)
(1970) | | Trustee (since 2019). | | Senior Managing Director, BlackRock, Inc. (since 2014); Global Head of BlackRock’s ETF and Index Investments Business (since 2019); Head of BlackRock’s U.S. Wealth Advisory Business (2015-2019); Global Head of Corporate Strategy, BlackRock, Inc. (2014-2015); Senior Partner, McKinsey & Company (2010-2014). | | Director of iShares, Inc. (since 2019); Trustee of iShares U.S. ETF Trust (since 2019). |
(a) Robert S. Kapito is deemed to be an “interested person” (as defined in the 1940 Act) of the Trust due to his affiliations with BlackRock, Inc. and its affiliates. |
(b) Salim Ramji is deemed to be an “interested person” (as defined in the 1940 Act) of the Trust due to his affiliations with BlackRock, Inc. and its affiliates. |
| | | | | | |
| Independent Trustees |
| | | | |
Name (Year of
Birth) | | Position(s) | | Principal Occupation(s)
During Past 5 Years | | Other Directorships Held by Trustee |
John E.
Kerrigan (1955) | | Trustee (since 2005); Independent Board Chair (since 2022). | | Chief Investment Officer, Santa Clara University (since 2002). | | Director of iShares, Inc. (since 2005); Trustee of iShares U.S. ETF Trust (since 2011); Independent Board Chair of iShares, Inc. and iShares U.S. ETF Trust (since 2022). |
| | | |
Jane D.
Carlin (1956) | | Trustee (since 2015); Risk Committee Chair (since 2016). | | Consultant (since 2012); Member of the Audit Committee (2012-2018), Chair of the Nominating and Governance Committee (2017-2018) and Director of PHH Corporation (mortgage solutions) (2012-2018); Managing Director and Global Head of Financial Holding Company Governance & Assurance and the Global Head of Operational Risk Management of Morgan Stanley (2006-2012). | | Director of iShares, Inc. (since 2015); Trustee of iShares U.S. ETF Trust (since 2015); Member of the Audit Committee (since 2016), Chair of the Audit Committee (since 2020) and Director of The Hanover Insurance Group, Inc. (since 2016). |
| | | |
Richard L.
Fagnani (1954) | | Trustee (since 2017); Audit Committee Chair (since 2019). | | Partner, KPMG LLP (2002-2016); Director of One Generation Away (since 2021). | | Director of iShares, Inc. (since 2017); Trustee of iShares U.S. ETF Trust (since 2017). |
| | |
| 88 | | 2 0 2 3 I SHARES ANNUAL REPORT TO SHAREHOLDERS |
Trustee and Officer Information (continued)
| | | | | | |
| Independent Trustees |
| | | | |
Name (Year of
Birth) | | Position(s) | | Principal Occupation(s)
During Past 5 Years | | Other Directorships Held by Trustee |
Cecilia H.
Herbert (1949) | | Trustee (since 2005); Nominating and Governance and Equity Plus Committee Chairs (since 2022). | | Chair of the Finance Committee (since 2019) and Trustee and Member of the Finance, Audit and Quality Committees of Stanford Health Care (since 2016); Trustee of WNET, New York’s public media company (since 2011) and Member of the Audit Committee (since 2018), Investment Committee (since 2011) and Personnel Committee (since 2022); Chair (1994-2005) and Member (1992-2021) of the Investment Committee, Archdiocese of San Francisco; Trustee of Forward Funds (14 portfolios) (2009-2018); Trustee of Salient MF Trust (4 portfolios) (2015- 2018); Director (1998-2013) and President (2007-2011) of the Board of Directors, Catholic Charities CYO; Trustee (2002-2011) and Chair of the Finance and Investment Committee (2006-2010) of the Thacher School; Director of the Senior Center of Jackson Hole (since 2020); Director of the Jackson Hole Center for the Arts (since 2021); Member of the Wyoming State Investment Funds Committee (since 2022). | | Director of iShares, Inc. (since 2005); Trustee of iShares U.S. ETF Trust (since 2011). |
| | | |
Drew E.
Lawton (1959) | | Trustee (since 2017); 15(c) Committee Chair (since 2017). | | Senior Managing Director of New York Life Insurance Company (2010-2015). | | Director of iShares, Inc. (since 2017); Trustee of iShares U.S. ETF Trust (since 2017); Director of Jackson Financial Inc. (since 2021). |
| | | |
John E.
Martinez (1961) | | Trustee (since 2003); Securities Lending Committee Chair (since 2019). | | Director of Real Estate Equity Exchange, Inc. (since 2005); Director of Cloudera Foundation (2017-2020); and Director of Reading Partners (2012-2016). | | Director of iShares, Inc. (since 2003); Trustee of iShares U.S. ETF Trust (since 2011). |
| | | |
Madhav V.
Rajan (1964) | | Trustee (since 2011); Fixed Income Plus Committee Chair (since 2019). | | Dean, and George Pratt Shultz Professor of Accounting, University of Chicago Booth School of Business (since 2017); Advisory Board Member (since 2016) and Director (since 2020) of C.M. Capital Corporation; Chair of the Board for the Center for Research in Security Prices, LLC (since 2020); Robert K. Jaedicke Professor of Accounting, Stanford University Graduate School of Business (2001-2017); Professor of Law (by courtesy), Stanford Law School (2005-2017); Senior Associate Dean for Academic Affairs and Head of MBA Program, Stanford University Graduate School of Business (2010-2016). | | Director of iShares, Inc. (since 2011); Trustee of iShares U.S. ETF Trust (since 2011). |
| | |
TRUSTEE AND OFFICER INFORMATION | | 89 |
Trustee and Officer Information (continued)
| | | | |
| Officers |
| | | |
Name (Year of
Birth) | | Position(s) | | Principal Occupation(s)
During Past 5 Years |
Dominik
Rohé (1973) | | President (since 2023). | | Managing Director, BlackRock, Inc. (since 2005); Head of Americas ETF and Index Investments (since 2023); Head of Latin America (2019- 2023). |
| | |
Trent
Walker (1974) | | Treasurer and Chief Financial Officer (since 2020). | | Managing Director, BlackRock, Inc. (since September 2019); Chief Financial Officer of iShares Delaware Trust Sponsor LLC, BlackRock Funds, BlackRock Funds II, BlackRock Funds IV, BlackRock Funds V and BlackRock Funds VI (since 2021); Executive Vice President of PIMCO (2016-2019); Senior Vice President of PIMCO (2008-2015); Treasurer (2013-2019) and Assistant Treasurer (2007-2017) of PIMCO Funds, PIMCO Variable Insurance Trust, PIMCO ETF Trust, PIMCO Equity Series, PIMCO Equity Series VIT, PIMCO Managed Accounts Trust, 2 PIMCO-sponsored interval funds and 21 PIMCO-sponsored closed-end funds. |
| | |
Charles
Park (1967) | | Chief Compliance Officer (since 2006). | | Chief Compliance Officer of BlackRock Advisors, LLC and the BlackRock-advised Funds in the BlackRock Multi-Asset Complex and the BlackRock Fixed-Income Complex (since 2014); Chief Compliance Officer of BFA (since 2006). |
| | |
Marisa
Rolland (1980) | | Secretary (since 2022). | | Managing Director, BlackRock, Inc. (since 2023); Director, BlackRock, Inc. (2018-2022); Vice President, BlackRock, Inc. (2010-2017). |
| | |
Rachel
Aguirre (1982) | | Executive Vice President (since 2022). | | Managing Director, BlackRock, Inc. (since 2018); Director, BlackRock, Inc. (2009-2018); Head of U.S. iShares Product (since 2022); Head of EII U.S. Product Engineering (since 2021); Co-Head of EII’s Americas Portfolio Engineering (2020-2021); Head of Developed Markets Portfolio Engineering (2016-2019). |
| | |
Jennifer
Hsui (1976) | | Executive Vice President (since 2022). | | Managing Director, BlackRock, Inc. (since 2009); Co-Head of Index Equity (since 2022). |
| | |
James
Mauro (1970) | | Executive Vice President (since 2022). | | Managing Director, BlackRock, Inc. (since 2010); Head of Fixed Income Index Investments in the Americas and Head of San Francisco Core Portfolio Management (since 2020). |
Effective June 15, 2022, Marisa Rolland replaced Deepa Damre Smith as Secretary.
Effective March 30, 2023, Dominik Rohé replaced Armando Senra as President.
| | |
| 90 | | 2 0 2 3 I SHARES ANNUAL REPORT TO SHAREHOLDERS |
General Information
Electronic Delivery
Shareholders can sign up for e-mail notifications announcing that the shareholder report or prospectus has been posted on the iShares website at iShares.com. Once you have enrolled, you will no longer receive prospectuses and shareholder reports in the mail.
To enroll in electronic delivery:
| | • | | If your brokerage firm is not listed, electronic delivery may not be available. Please contact your broker-dealer or financial advisor. |
Householding
Householding is an option available to certain fund investors. Householding is a method of delivery, based on the preference of the individual investor, in which a single copy of certain shareholder documents and Rule 30e-3 notices can be delivered to investors who share the same address, even if their accounts are registered under different names. Please contact your broker-dealer if you are interested in enrolling in householding and receiving a single copy of prospectuses and other shareholder documents, or if you are currently enrolled in householding and wish to change your householding status.
Availability of Quarterly Schedule of Investments
The Funds file their complete schedule of portfolio holdings with the SEC for the first and third quarters of each fiscal year as an exhibit to their reports on Form N-PORT. The Funds’ Forms N-PORT are available on the SEC’s website at sec.gov. Additionally, each Fund makes its portfolio holdings for the first and third quarters of each fiscal year available at iShares.com/fundreports.
Availability of Proxy Voting Policies and Proxy Voting Records
A description of the policies and procedures that the iShares Funds use to determine how to vote proxies relating to portfolio securities and information about how the iShares Funds voted proxies relating to portfolio securities during the most recent twelve-month period ending June 30 is available without charge, upon request (1) by calling toll-free 1-800-474-2737; (2) on the iShares website at iShares.com; and (3) on the SEC website at sec.gov.
A description of the Trust’s policies and procedures with respect to the disclosure of the Fund’s portfolio securities is available in the Fund Prospectus. The Fund discloses its portfolio holdings daily and provides information regarding its top holdings in Fund fact sheets at iShares.com.
Glossary of Terms Used in this Report
| | |
| Portfolio Abbreviation |
| |
| CVR | | Contingent Value Rights |
| |
| NVS | | Non-Voting Shares |
| |
| REIT | | Real Estate Investment Trust |
| |
| S&P | | Standard & Poor’s |
| | |
| 92 | | 2 0 2 3 I SHARES ANNUAL REPORT TO SHAREHOLDERS |
THIS PAGE INTENTIONALLY LEFT BLANK.
THIS PAGE INTENTIONALLY LEFT BLANK.
THIS PAGE INTENTIONALLY LEFT BLANK.
Want to know more?
iShares.com | 1-800-474-2737
This report is intended for the Funds’ shareholders. It may not be distributed to prospective investors unless it is preceded or accompanied by the current prospectus.
Investing involves risk, including possible loss of principal.
The iShares Funds are distributed by BlackRock Investments, LLC (together with its affiliates, “BlackRock”).
The iShares Funds are not sponsored, endorsed, issued, sold or promoted by S&P Dow Jones Indices LLC, nor does this company make any representations regarding the advisability of investing in the iShares Funds. BlackRock is not affiliated with the company listed above.
©2022 BlackRock, Inc. All rights reserved. iSHARES and BLACKROCK are registered trademarks of BlackRock, Inc. or its subsidiaries. All other marks are the property of their respective owners.
iS-AR-302-0323
| | |

| | MARCH 31, 2023 |
iShares Trust
| · | | iShares Russell Top 200 ETF | IWL | NYSE Arca |
| · | | iShares Russell Top 200 Growth ETF | IWY | NYSE Arca |
| · | | iShares Russell Top 200 Value ETF | IWX | NYSE Arca |
The Markets in Review
Dear Shareholder,
Significant economic headwinds emerged during the 12-month reporting period ended March 31, 2023, as investors navigated changing economic conditions and volatile markets. The U.S. economy shrank in the first half of 2022 before returning to modest growth in the second half of the year, marking a shift to a more challenging post-reopening economic environment. Changes in consumer spending patterns and a tight labor market led to elevated inflation, which reached a 40-year high before beginning to moderate.
Equity prices fell as interest rates rose, particularly during the first half of the reporting period. Both large- and small-capitalization U.S. stocks declined, although equities began to recover in the second half of the period as inflation eased and economic growth resumed. Emerging market stocks and international equities from developed markets declined overall, pressured by rising interest rates and volatile commodities prices.
The 10-year U.S. Treasury yield rose during the reporting period, driving its price down, as investors reacted to fluctuating inflation data and attempted to anticipate its impact on future interest rate changes. The corporate bond market also faced inflationary headwinds, and higher interest rates led to rising borrowing costs for corporate issuers.
The U.S. Federal Reserve (the “Fed”), acknowledging that inflation has been more persistent than expected, raised interest rates eight times. Furthermore, the Fed wound down its bond-buying programs and accelerated the reduction of its balance sheet.
Restricted labor supply kept inflation elevated even as other inflation drivers, such as goods prices and energy costs, moderated. While economic growth slowed in the last year, we believe that taming inflation requires a more substantial decline that lowers demand to a level more in line with the economy’s productive capacity. Although the Fed has decelerated the pace of interest rate hikes, we believe that it still seems determined to get inflation back to target. With this in mind, we believe the possibility of a U.S. recession in the near-term is high, but the dimming economic outlook has not yet been fully reflected in current market prices. We believe investors should expect a period of higher volatility as markets adjust to the new economic reality and policymakers attempt to adapt to rapidly changing conditions. Turmoil in the banking sector late in the period highlighted the potential for the knock-on effects of substantially higher interest rates to disrupt markets with little warning.
While we favor an overweight to equities in the long term, we prefer an underweight stance on equities overall in the near term. Expectations for corporate earnings remain elevated, which seems inconsistent with the possibility of a recession. Nevertheless, we are overweight on emerging market stocks as we believe a weakening U.S. dollar provides a supportive backdrop. We also see long-term opportunities in credit, where we believe that valuations are appealing and higher yields provide attractive income, although we are neutral on credit in the near term, as we’re concerned about tightening credit and financial conditions. However, we believe there are still some strong opportunities for a six- to twelve-month horizon, particularly short-term U.S. Treasuries, global inflation-linked bonds, and emerging market bonds denominated in local currency.
Overall, our view is that investors need to think globally, position themselves to be prepared for a decarbonizing economy, and be nimble as market conditions change. We encourage you to talk with your financial advisor and visit iShares.com for further insight about investing in today’s markets.
Sincerely,

Rob Kapito
President, BlackRock, Inc.

Rob Kapito
President, BlackRock, Inc.
| | | | | | | | |
Total Returns as of March 31, 2023 | |
| | | |
| | | 6-Month | | 12-Month |
| | |
U.S. large cap equities
(S&P 500® Index) | | | 15.62 | % | | | (7.73 | )% |
| | |
U.S. small cap equities
(Russell 2000® Index) | | | 9.14 | | | | (11.61 | ) |
| | |
International equities
(MSCI Europe, Australasia,
Far East Index) | | | 27.27 | | | | (1.38 | ) |
| | |
Emerging market equities
(MSCI Emerging Markets Index) | | | 14.04 | | | | (10.70 | ) |
| | |
3-month Treasury bills
(ICE BofA 3-Month
U.S. Treasury Bill Index) | | | 1.93 | | | | 2.52 | |
| | |
U.S. Treasury securities
(ICE BofA 10-Year
U.S. Treasury Index) | | | 4.38 | | | | (6.90 | ) |
| | |
U.S. investment grade bonds (Bloomberg U.S. Aggregate Bond Index) | | | 4.89 | | | | (4.78 | ) |
| | |
Tax-exempt municipal bonds (Bloomberg Municipal Bond Index) | | | 7.00 | | | | 0.26 | |
| | |
U.S. high yield bonds
(Bloomberg U.S. Corporate High Yield 2% Issuer Capped Index) | | | 7.88 | | | | (3.35 | ) |
|
| Past performance is not an indication of future results. Index performance is shown for illustrative purposes only. You cannot invest directly in an index. | |
| | |
| 2 | | THIS PAGE IS NOT PART OF YOUR FUND REPORT |
Table of Contents
Market Overview
iShares Trust
Domestic Market Overview
U.S. stocks declined for the 12 months ended March 31, 2023 (“reporting period”), when the Russell 3000® Index, a broad measure of U.S. equity market performance, returned -8.58%. Elevated inflation and rapid tightening of monetary policy dampened growth and weighed on equities. Higher interest rates drove bond yields higher and increased borrowing costs for businesses and consumers. Equities began to recover in the second half of the reporting period, as the broader economy remained resilient and the pace of inflation declined. In March 2023, two banks suddenly failed, representing the second and third largest bank failures in U.S. history by asset value. This drove concern among investors about the resiliency of the financial system in the face of rapidly rising interest rates. However, government agencies acted swiftly to organize a sale of the failed banks’ assets and inject liquidity, and equity prices recovered.
Inflation was a significant driver of the economic outlook. As the reporting period began, the consumer price index, a widely followed measure of inflation, stood at multi-decade highs. Strong consumer spending and a tight labor market, along with continued supply chain disruptions in Asia, combined to drive prices higher. But the rate of inflation began to decline as the reporting period wore on, decelerating for nine consecutive months beginning in July 2022. Nonetheless, inflation remained elevated by historic standards, and higher prices negatively impacted both consumers and businesses.
The U.S. economy recovered from a decline in the first half of 2022 to post modest growth in the third and fourth quarters of 2022. Consumers continued to power the economy with growing spending, despite higher prices for many consumer goods and services. The strong labor market supported spending, as unemployment remained very low, at one point dropping to the lowest recorded level since 1969. Furthermore, the labor force participation rate—which measures the total proportion of employed persons of working age—rose, indicating that more people were being drawn into the labor force. Amid tightening labor supply, wages rose significantly, with the largest gains at the lower end of the wage spectrum.
To contain inflation, the U.S. Federal Reserve (“Fed”) tightened monetary policy rapidly, raising short-term interest rates eight times over the course of the reporting period. The pace of tightening accelerated as the Fed twice stepped up the increment of increase before reducing it again as inflation began to subside. The Fed also started to reduce the size of its balance sheet by reducing the store of U.S. Treasuries it had accumulated to stabilize markets in the early phases of the coronavirus pandemic. While the Fed indicated that more tightening could be needed to achieve its long-term inflation goal, it sounded a more cautious note about the potential for further interest rate increases near the end of the reporting period.
Despite economic headwinds, corporate profits remained robust, and many companies were able to sufficiently raise prices to preserve profit margins even in the face of rising labor and input costs. Nonetheless, profits declined overall in the fourth quarter of 2022, and the yield curve (a graphical representation of U.S. Treasury rates at different maturities) inverted, a sign that markets were concerned about the impact of higher borrowing costs on the economy. Furthermore, dwindling personal savings and rising household debt raised questions about the sustainability of consumer spending as an engine of economic growth.
| | |
| 4 | | 2 0 2 3 I SHARES ANNUAL REPORT TO SHAREHOLDERS |
| | |
| Fund Summary as of March 31, 2023 | | iShares® Russell Top 200 ETF |
Investment Objective
The iShares RussellTop 200 ETF(the “Fund) seeks to track the investment results of an index composed of large-capitalization U.S. equities, as represented by the Russell Top 200® Index (the ”Index“). The Fund invests in a representative sample of securities included in the Index that collectively has an investment profile similar to the Index. Due to the use of representative sampling, the Fund may or may not hold all of the securities that are included in the Index.
Performance
| | | | | | | | | | | | | | | | | | | | | | | | | | | | |
| | | Average Annual Total Returns | | | | | | Cumulative Total Returns | |
| | | 1 Year | | | 5 Years | | | 10 Years | | | | | | 1 Year | | | 5 Years | | | 10 Years | |
| | | | | | | |
Fund NAV | | | (8.41 | )% | | | 11.75 | % | | | 12.59 | % | | | | | | | (8.41 | )% | | | 74.30 | % | | | 227.44 | % |
| | | | | | | |
Fund Market | | | (8.55 | ) | | | 11.72 | | | | 12.59 | | | | | | | | (8.55 | ) | | | 74.06 | | | | 227.46 | |
| | | | | | | |
Index | | | (8.27 | ) | | | 11.92 | | | | 12.77 | | | | | | | | (8.27 | ) | | | 75.63 | | | | 232.50 | |
GROWTH OF $10,000 INVESTMENT
(AT NET ASSET VALUE)
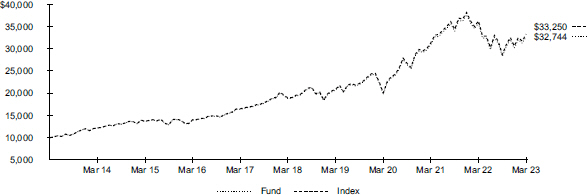
Past performance is not an indication of future results. Performance results do not reflect the deduction of taxes that a shareholder would pay on fund distributions or on the redemption or sale of fund shares. See “About Fund Performance” for more information.
Expense Example
| | | | | | | | | | | | | | | | | | | | | | | | | | | | | | |
| Actual | | | Hypothetical 5% Return | |
| | | | | | | | | | | | | | |
| | | | | | | |
| Beginning
Account Value
(10/01/22) |
| |
| Ending
Account Value
(03/31/23) |
| |
| Expenses
Paid During
the Period |
(a) | | | | | |
| Beginning
Account Value
(10/01/22) |
| |
| Ending
Account Value
(03/31/23) |
| |
| Expenses
Paid During
the Period |
(a) | |
| Annualized
Expense
Ratio |
|
| | |
| | $ 1,000.00 | | | | $ 1,157.30 | | | | $ 0.81 | | | | | | | | $ 1,000.00 | | | | $ 1,024.18 | | | | $ 0.76 | | | | 0.15% | |
| | |
| (a) | Expenses are equal to the annualized expense ratio, multiplied by the average account value over the period, multiplied by 182/365 (to reflect the one-half year period shown). Other fees, such as brokerage commissions and other fees to financial intermediaries, may be paid which are not reflected in the tables and examples above. See ”Disclosure of Expenses“ for more information. | |
| | |
| Fund Summary as of March 31, 2023 (continued) | | iShares® Russell Top 200 ETF |
Portfolio Management Commentary
Large-capitalization U.S. stocks declined for the reporting period, as high inflation and tighter financial conditions impeded economic growth and weighed on equities. The consumer discretionary sector detracted the most from the Index’s return. While consumer spending continued to grow, rising inflation drove up costs for companies, and consumers increasingly sought bargains as higher prices eroded personal spending power. Within the sector, the internet and direct marketing retail industry detracted significantly. The sharp rise in e-commerce, which boosted the industry early in the pandemic, waned as more workers returned to the office and brick-and-mortar retailers gained market share. Stocks in the automobiles industry also declined amid concerns about the market for electric vehicles in the weakening economy and production volumes that failed to meet analysts’ expectations.
The information technology sector also detracted significantly from the Index’s return, as sharply higher interest rates reduced the current value of future earnings. The software and services industry declined notably amid high inflation and slow growth, as cuts to corporate information technology budgets tempered revenue growth. Slowing sales growth for cloud-based software further constrained earnings. Changing consumer behavior patterns pressured the IT services industry, as a return to in-person spending slowed revenue growth for online payment platform providers.
The communication services sector also detracted, particularly high-valuation stocks with growth prospects in the interactive media and services industry. Demand for online advertisements slowed during the reporting period, as businesses cut back marketing expenditures in a more challenging economic environment. Stiff competition among companies producing disruptive new artificial intelligence products also pressured the industry.
On the upside, energy sector stocks contributed to the Index’s return. Relatively high average prices of energy commodities following Russia’s invasion of Ukraine supported profitability in the oil, gas, and consumable fuels industry.
Portfolio Information
SECTOR ALLOCATION
| | | | |
| | |
Sector | |
| Percent of
Total Investments |
(a) |
| |
Information Technology | | | 28.9 | % |
Health Care | | | 15.0 | |
Financials | | | 13.2 | |
Consumer Discretionary | | | 9.7 | |
Communication Services | | | 9.3 | |
Consumer Staples | | | 7.7 | |
Industrials | | | 6.9 | |
Energy | | | 4.5 | |
Utilities | | | 1.7 | |
Materials | | | 1.7 | |
Real Estate | | | 1.4 | |
TEN LARGEST HOLDINGS
| | | | |
| | |
Security | |
| Percent of
Total Investments |
(a) |
| |
Apple Inc. | | | 8.8 | % |
Microsoft Corp. | | | 7.7 | |
Amazon.com, Inc. | | | 3.3 | |
NVIDIA Corp. | | | 2.3 | |
Alphabet, Inc., Class A | | | 2.2 | |
Berkshire Hathaway, Inc., Class B | | | 2.0 | |
Alphabet, Inc., Class C, NVS | | | 1.9 | |
Tesla, Inc. | | | 1.9 | |
Meta Platforms, Inc., Class A | | | 1.7 | |
Exxon Mobil Corp. | | | 1.6 | |
| (a) | Excludes money market funds. | |
| | |
| 6 | | 2 0 2 3 I SHARES ANNUAL REPORT TO SHAREHOLDERS |
| | |
| Fund Summary as of March 31, 2023 | | iShares® Russell Top 200 Growth ETF |
Investment Objective
The iShares Russell Top 200 Growth ETF (the “Fund”) seeks to track the investment results of an index composed of large-capitalization U.S. equities that exhibit growth characteristics, as represented by the Russell Top 200® Growth Index (the “Index”). The Fund invests in a representative sample of securities included in the Index that collectively has an investment profile similar to the Index. Due to representative sampling, the Fund may or may not hold all of the securities that are included in the Index.
Performance
| | | | | | | | | | | | | | | | | | | | | | | | | | | | |
| | | Average Annual Total Returns | | | | | | Cumulative Total Returns | |
| | | | | | | | | | | | |
| | | 1 Year | | | 5 Years | | | 10 Years | | | | | | 1 Year | | | 5 Years | | | 10 Years | |
| | | | | | | |
Fund NAV | | | (11.60 | )% | | | 14.61 | % | | | 15.38 | % | | | | | | | (11.60 | )% | | | 97.73 | % | | | 318.21 | % |
| | | | | | | |
Fund Market | | | (11.80 | ) | | | 14.59 | | | | 15.38 | | | | | | | | (11.80 | ) | | | 97.54 | | | | 318.27 | |
| | | | | | | |
Index | | | (11.44 | ) | | | 14.79 | | | | 15.61 | | | | | | | | (11.44 | ) | | | 99.34 | | | | 326.38 | |
GROWTH OF $10,000 INVESTMENT
(AT NET ASSET VALUE)
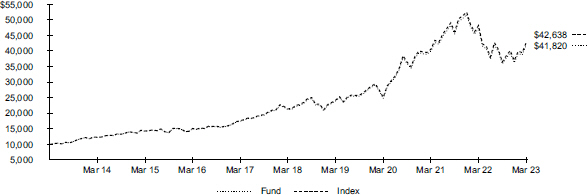
Past performance is not an indication of future results. Performance results do not reflect the deduction of taxes that a shareholder would pay on fund distributions or on the redemption or sale of fund shares. See “About Fund Performance” for more information.
Expense Example
| | | | | | | | | | | | | | | | | | | | | | | | | | | | | | | | |
| | | Actual | | | | | | Hypothetical 5% Return | | | | |
| | | | | | | | | | | | | | | | |
| | | | | | | | |
| |
| Beginning
Account Value
(10/01/22) |
| |
| Ending
Account Value
(03/31/23) |
| |
| Expenses
Paid During
the Period |
(a) | | | | | |
| Beginning
Account Value
(10/01/22) |
| |
| Ending
Account Value
(03/31/23) |
| |
| Expenses
Paid During
the Period |
(a) | |
| Annualized
Expense
Ratio |
|
| | | | |
| | | $ 1,000.00 | | | | $ 1,168.10 | | | | $ 1.08 | | | | | | | | $ 1,000.00 | | | | $ 1,023.93 | | | | $ 1.01 | | | | 0.20% | |
| | | | |
| (a) | Expenses are equal to the annualized expense ratio, multiplied by the average account value over the period, multiplied by 182/365 (to reflect the one-half year period shown). Other fees, such as brokerage commissions and other fees to financial intermediaries, may be paid which are not reflected in the tables and examples above. See “Disclosure of Expenses” for more information. | |
| | |
| Fund Summary as of March 31, 2023 (continued) | | iShares® Russell Top 200 Growth ETF |
Portfolio Management Commentary
Growth-oriented large-capitalization U.S. stocks declined for the reporting period, as high inflation and tighter financial conditions impeded economic growth and weighed on equities. Large-capitalization growth stocks, which derive a significant portion of their price from investors’ expectations of future growth, faced significant headwinds relative to other equities. Growth stocks are particularly sensitive to interest rates, which rose notably as the Fed sharply tightened monetary policy.
The consumer discretionary sector detracted the most from the Index’s return. Rising inflation drove up costs for companies, and consumers increasingly sought bargains as higher prices eroded personal spending power. Within the sector, the internet and direct marketing retail industry detracted significantly from the Index’s performance. The sharp rise in e-commerce, which boosted the industry early in the pandemic, waned as more workers returned to the office and brick-and-mortar retailers gained market share. Excess warehouse capacity also weighed on industry cash flow. Slowing revenue growth from data cloud services further pressured the industry’s profitability, as business customers tried to reduce expenditures amid economic uncertainty. The automobiles industry also declined amid concerns about the market for electric vehicles (“EVs”) in the weakening economy. While EV sales continued to grow, production did not meet analysts’ expectations, and price discounts on some new models negatively impacted revenues.
The communication services sector also detracted significantly from the Index’s return, as the rising interest rate environment negatively impacted the interactive media and services industry, particularly high-valuation stocks with growth prospects. Demand for online advertisements slowed during the reporting period, as businesses cut back on marketing expenditures in a more challenging economic environment. Stiff competition among companies producing disruptive new artificial intelligence products also pressured the industry, as analysts attempted to chart the potential impact of the new technologies.
Portfolio Information
SECTOR ALLOCATION
| | | | |
| | |
Sector | |
| Percent of
Total Investments |
(a) |
Information Technology | | | 45.3 | % |
Consumer Discretionary | | | 14.2 | |
Health Care | | | 10.5 | |
Communication Services | | | 7.8 | |
Financials | | | 6.7 | |
Consumer Staples | | | 6.6 | |
Industrials | | | 6.0 | |
Real Estate | | | 1.4 | |
Other (each representing less than 1%) | | | 1.5 | |
TEN LARGEST HOLDINGS
| | | | |
| | |
Security | |
| Percent of
Total Investments |
(a) |
Apple Inc. | | | 15.6 | % |
Microsoft Corp. | | | 13.5 | |
Amazon.com, Inc. | | | 5.8 | |
NVIDIA Corp. | | | 4.1 | |
Alphabet, Inc., Class A | | | 3.4 | |
Tesla, Inc. | | | 3.4 | |
Alphabet, Inc., Class C, NVS | | | 3.0 | |
UnitedHealth Group, Inc. | | | 2.5 | |
Visa, Inc., Class A | | | 2.3 | |
Mastercard, Inc., Class A | | | 1.9 | |
| (a) | Excludes money market funds. | |
| | |
| 8 | | 2 0 2 3 I SHARES ANNUAL REPORT TO SHAREHOLDERS |
| | |
| Fund Summary as of March 31, 2023 | | iShares® Russell Top 200 Value ETF |
Investment Objective
The iShares Russell Top 200 Value ETF (the “Fund”) seeks to track the investment results of an index composed of large-capitalization U.S. equities that exhibit value characteristics, as represented by the Russell Top 200® Value Index (the “Index”). The Fund invests in a representative sample of securities included in the Index that collectively has an investment profile similar to the Index. Due to the use of representative sampling, the Fund may or may not hold all of the securities that are included in the Index.
Performance
| | | | | | | | | | | | | | | | | | | | | | | | | | | | |
| | | Average Annual Total Returns | | | | | | Cumulative Total Returns | |
| | | | | | | |
| | | 1 Year | | | 5 Years | | | 10 Years | | | | | | 1 Year | | | 5 Years | | | 10 Years | |
| | | | | | | |
Fund NAV | | | (4.37 | )% | | | 7.76 | % | | | 9.08 | % | | | | | | | (4.37 | )% | | | 45.29 | % | | | 138.44 | % |
| | | | | | | |
Fund Market | | | (4.51 | ) | | | 7.73 | | | | 9.07 | | | | | | | | (4.51 | ) | | | 45.11 | | | | 138.30 | |
| | | | | | | |
Index | | | (4.16 | ) | | | 7.96 | | | | 9.30 | | | | | | | | (4.16 | ) | | | 46.69 | | | | 143.43 | |
GROWTH OF $10,000 INVESTMENT
(AT NET ASSET VALUE)
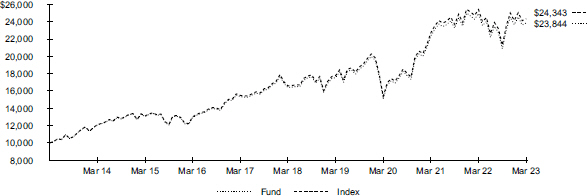
Past performance is not an indication of future results. Performance results do not reflect the deduction of taxes that a shareholder would pay on fund distributions or on the redemption or sale of fund shares. See “About Fund Performance” for more information.
Expense Example
| | | | | | | | | | | | | | | | | | | | | | | | | | | | | | | | |
| | | Actual | | | Hypothetical 5% Return | | | | |
| | | | | | | | | | | | | | | | |
| | | | | | | | |
| |
| Beginning
Account Value
(10/01/22 |
) | |
| Ending
Account Value
(03/31/23 |
) | |
| Expenses
Paid During
the Period |
(a) | | | | | |
| Beginning
Account Value
(10/01/22 |
) | |
| Ending
Account Value
(03/31/23 |
) | |
| Expenses
Paid During
the Period |
(a) | |
| Annualized
Expense
Ratio |
|
| | | | |
| | | $ 1,000.00 | | | | $ 1,142.60 | | | | $ 1.07 | | | | | | | | $ 1,000.00 | | | | $ 1,023.93 | | | | $ 1.01 | | | | 0.20% | |
| | | | |
| (a) | Expenses are equal to the annualized expense ratio, multiplied by the average account value over the period, multiplied by 182/365 (to reflect the one-half year period shown). Other fees, such as brokerage commissions and other fees to financial intermediaries, may be paid which are not reflected in the tables and examples above. See “Disclosure of Expenses” for more information. | |
| | |
| Fund Summary as of March 31, 2023 (continued) | | iShares® Russell Top 200 Value ETF |
Portfolio Management Commentary
Value-oriented large-capitalization U.S. stocks declined for the reporting period, as high inflation and tighter financial conditions impeded economic growth and weighed on equities. The financials sector detracted the most from the Index’s performance amid tightening financial conditions. The banking industry faced significant challenges as the potential impact of a slowing economy outweighed the benefits of being able to charge more for loans. While bank profitability is typically supported by higher interest rates, persistently high inflation led to significant tightening from the Fed, and investors became concerned about the long-term effect of this tightening on loan growth and credit losses. Bank stocks were further pressured late in the reporting period after the sudden failure of two regional banks. Despite government actions to contain the impact, these bank failures weighed heavily on the industry. The financial services industry also faced headwinds due to weak economic growth, declining prices for stocks and bonds, and concerns about the balance sheet liquidity of a large discount broker following the bank failures.
The information technology sector also detracted significantly from the Index’s return, as sharply higher interest rates reduced the current value of future earnings. High inflation and slow growth weighed on the sector, as consumers and businesses often seek to reduce spending on technology products and services during a downturn.
On the upside, stocks in the energy sector contributed to the Index’s return despite lower oil prices and a sharp decline in the price of natural gas. The price of oil and natural gas surged in the aftermath of Russia’s invasion of Ukraine. While prices subsequently fell as markets stabilized, the relatively high average prices of energy commodities supported profitability in the oil, gas, and consumable fuels industry.
Portfolio Information
SECTOR ALLOCATION
| | | | |
| | |
Sector | |
| Percent of
Total Investments |
(a) |
Financials | | | 21.6 | % |
Health Care | | | 20.8 | |
Communication Services | | | 11.3 | |
Energy | | | 9.4 | |
Consumer Staples | | | 9.2 | |
Industrials | | | 7.9 | |
Information Technology | | | 7.6 | |
Utilities | | | 3.9 | |
Consumer Discretionary | | | 3.9 | |
Materials | | | 2.8 | |
Real Estate | | | 1.6 | |
TEN LARGEST HOLDINGS
| | | | |
| | |
Security | |
| Percent of
Total Investments |
(a) |
Berkshire Hathaway, Inc., Class B | | | 4.5 | % |
Exxon Mobil Corp. | | | 3.7 | |
Johnson & Johnson | | | 3.3 | |
JPMorgan Chase & Co. | | | 3.1 | |
Meta Platforms, Inc., Class A | | | 3.0 | |
Chevron Corp. | | | 2.6 | |
Pfizer, Inc. | | | 1.9 | |
Cisco Systems, Inc. | | | 1.8 | |
Walmart, Inc. | | | 1.7 | |
Procter & Gamble Co. | | | 1.6 | |
| (a) | Excludes money market funds. | |
| | |
| 10 | | 2 0 2 3 I SHARES ANNUAL REPORT TO SHAREHOLDERS |
About Fund Performance
Past performance is not an indication of future results. Financial markets have experienced extreme volatility and trading in many instruments has been disrupted. These circumstances may continue for an extended period of time and may continue to affect adversely the value and liquidity of each Fund’s investments. As a result, current performance may be lower or higher than the performance data quoted. Performance data current to the most recent month-end is available at iShares.com. Performance results assume reinvestment of all dividends and capital gain distributions and do not reflect the deduction of taxes that a shareholder would pay on fund distributions or on the redemption or sale of fund shares. The investment return and principal value of shares will vary with changes in market conditions. Shares may be worth more or less than their original cost when they are redeemed or sold in the market. Performance for certain funds may reflect a waiver of a portion of investment advisory fees. Without such a waiver, performance would have been lower.
Net asset value or “NAV” is the value of one share of a fund as calculated in accordance with the standard formula for valuing mutual fund shares. Beginning August 10, 2020, the price used to calculate market return (“Market Price”) is the closing price. Prior to August 10, 2020, Market Price was determined using the midpoint between the highest bid and the lowest ask on the primary stock exchange on which shares of a fund are listed for trading, as of the time that such fund’s NAV is calculated. Market and NAV returns assume that dividends and capital gain distributions have been reinvested at Market Price and NAV, respectively.
An index is a statistical composite that tracks a specified financial market or sector. Unlike a fund, an index does not actually hold a portfolio of securities and therefore does not incur the expenses incurred by a fund. These expenses negatively impact fund performance. Also, market returns do not include brokerage commissions that may be payable on secondary market transactions. If brokerage commissions were included, market returns would be lower.
Disclosure of Expenses
Shareholders of each Fund may incur the following charges: (1) transactional expenses, including brokerage commissions on purchases and sales of fund shares and (2) ongoing expenses, including management fees and other fund expenses. The expense examples shown (which are based on a hypothetical investment of $1,000 invested at the beginning of the period and held through the end of the period) are intended to assist shareholders both in calculating expenses based on an investment in each Fund and in comparing these expenses with similar costs of investing in other funds.
The expense examples provide information about actual account values and actual expenses. Annualized expense ratios reflect contractual and voluntary fee waivers, if any. In order to estimate the expenses a shareholder paid during the period covered by this report, shareholders can divide their account value by $1,000 and then multiply the result by the number under the heading entitled “Expenses Paid During the Period.”
The expense examples also provide information about hypothetical account values and hypothetical expenses based on a fund’s actual expense ratio and an assumed rate of return of 5% per year before expenses. In order to assist shareholders in comparing the ongoing expenses of investing in the Funds and other funds, compare the 5% hypothetical examples with the 5% hypothetical examples that appear in the shareholder reports of the other funds.
The expenses shown in the expense examples are intended to highlight shareholders’ ongoing costs only and do not reflect any transactional expenses, such as brokerage commissions and other fees paid on purchases and sales of fund shares. Therefore, the hypothetical examples are useful in comparing ongoing expenses only and will not help shareholders determine the relative total expenses of owning different funds. If these transactional expenses were included, shareholder expenses would have been higher.
| | |
ABOUT FUND PERFORMANCE / DISCLOSURE OF EXPENSES | | 11 |
| | |
Schedule of Investments March 31, 2023 | | iShares® Russell Top 200 ETF (Percentages shown are based on Net Assets) |
| | | | | | | | |
| Security | | Shares | | | Value | |
| | |
Common Stocks | | | | | | | | |
| | |
| Aerospace & Defense — 1.9% | | | | | | |
Boeing Co.(a) | | | 15,752 | | | $ | 3,346,198 | |
General Dynamics Corp. | | | 6,905 | | | | 1,575,790 | |
L3Harris Technologies, Inc. | | | 5,414 | | | | 1,062,443 | |
Lockheed Martin Corp. | | | 6,474 | | | | 3,060,454 | |
Northrop Grumman Corp. | | | 4,093 | | | | 1,889,820 | |
Raytheon Technologies Corp. | | | 41,787 | | | | 4,092,201 | |
| | | | | | | | |
| | |
| | | | | | | 15,026,906 | |
| | |
| Air Freight & Logistics — 0.7% | | | | | | |
FedEx Corp. | | | 6,632 | | | | 1,515,346 | |
United Parcel Service, Inc., Class B | | | 20,898 | | | | 4,054,003 | |
| | | | | | | | |
| | |
| | | | | | | 5,569,349 | |
| | |
| Automobiles — 2.3% | | | | | | |
Ford Motor Co. | | | 112,341 | | | | 1,415,497 | |
General Motors Co. | | | 39,443 | | | | 1,446,769 | |
Tesla, Inc.(a) | | | 73,475 | | | | 15,243,123 | |
| | | | | | | | |
| | |
| | | | | | | 18,105,389 | |
| | |
| Banks — 3.4% | | | | | | |
Bank of America Corp. | | | 199,668 | | | | 5,710,505 | |
Citigroup, Inc. | | | 55,029 | | | | 2,580,310 | |
JPMorgan Chase & Co. | | | 82,922 | | | | 10,805,566 | |
PNC Financial Services Group, Inc. | | | 11,468 | | | | 1,457,583 | |
Truist Financial Corp. | | | 37,757 | | | | 1,287,513 | |
U.S. Bancorp | | | 39,229 | | | | 1,414,205 | |
Wells Fargo & Co. | | | 109,052 | | | | 4,076,364 | |
| | | | | | | | |
| | |
| | | | | | | 27,332,046 | |
| | |
| Beverages — 2.1% | | | | | | |
Coca-Cola Co. | | | 111,001 | | | | 6,885,392 | |
Constellation Brands, Inc., Class A | | | 4,294 | | | | 969,972 | |
Keurig Dr Pepper, Inc. | | | 24,475 | | | | 863,478 | |
Monster Beverage Corp.(a) | | | 20,887 | | | | 1,128,107 | |
PepsiCo, Inc. | | | 39,302 | | | | 7,164,754 | |
| | | | | | | | |
| | |
| | | | | | | 17,011,703 | |
| | |
| Biotechnology — 2.6% | | | | | | |
AbbVie, Inc. | | | 50,243 | | | | 8,007,227 | |
Amgen, Inc. | | | 15,180 | | | | 3,669,765 | |
Gilead Sciences, Inc. | | | 35,687 | | | | 2,960,950 | |
Moderna, Inc.(a) | | | 9,413 | | | | 1,445,649 | |
Regeneron Pharmaceuticals, Inc.(a) | | | 2,946 | | | | 2,420,640 | |
Vertex Pharmaceuticals, Inc.(a) | | | 7,269 | | | | 2,290,244 | |
| | | | | | | | |
| | |
| | | | | | | 20,794,475 | |
| | |
| Broadline Retail — 3.3% | | | | | | |
Amazon.com, Inc.(a) | | | 252,684 | | | | 26,099,730 | |
| | | | | | | | |
| | |
| Building Products — 0.2% | | | | | | |
Johnson Controls International PLC | | | 19,591 | | | | 1,179,770 | |
| | | | | | | | |
| | |
| Capital Markets — 2.6% | | | | | | |
BlackRock, Inc.(b) | | | 4,217 | | | | 2,821,679 | |
Blackstone, Inc., Class A, NVS | | | 20,143 | | | | 1,769,361 | |
Charles Schwab Corp. | | | 43,210 | | | | 2,263,340 | |
CME Group, Inc., Class A | | | 10,194 | | | | 1,952,355 | |
Goldman Sachs Group, Inc. | | | 9,324 | | | | 3,049,974 | |
Intercontinental Exchange, Inc. | | | 15,715 | | | | 1,638,917 | |
Moody’s Corp. | | | 4,537 | | | | 1,388,413 | |
Morgan Stanley | | | 35,048 | | | | 3,077,214 | |
S&P Global, Inc. | | | 9,148 | | | | 3,153,956 | |
| | | | | | | | |
| | |
| | | | | | | 21,115,209 | |
| | |
| Chemicals — 1.3% | | | | | | |
Air Products & Chemicals, Inc. | | | 6,307 | | | | 1,811,434 | |
| | | | | | | | |
| Security | | Shares | | | Value | |
| | |
| Chemicals (continued) | | | | | | |
Dow, Inc. | | | 19,950 | | | $ | 1,093,659 | |
Ecolab, Inc. | | | 7,032 | | | | 1,164,007 | |
Linde PLC | | | 14,046 | | | | 4,992,510 | |
Sherwin-Williams Co. | | | 6,818 | | | | 1,532,482 | |
| | | | | | | | |
| | |
| | | | | | | 10,594,092 | |
| | |
| Commercial Services & Supplies — 0.2% | | | | | | |
Waste Management, Inc. | | | 11,648 | | | | 1,900,604 | |
| | | | | | | | |
| | |
| Communications Equipment — 0.8% | | | | | | |
Cisco Systems, Inc. | | | 116,830 | | | | 6,107,288 | |
| | | | | | | | |
| | |
| Consumer Finance — 0.5% | | | | | | |
American Express Co. | | | 16,913 | | | | 2,789,799 | |
Capital One Financial Corp. | | | 10,794 | | | | 1,037,951 | |
| | | | | | | | |
| | |
| | | | | | | 3,827,750 | |
| | |
| Consumer Staples Distribution & Retail — 2.2% | | | | | | |
Costco Wholesale Corp. | | | 12,587 | | | | 6,254,103 | |
Dollar General Corp. | | | 6,418 | | | | 1,350,732 | |
Sysco Corp. | | | 14,437 | | | | 1,114,969 | |
Target Corp. | | | 13,165 | | | | 2,180,519 | |
Walgreens Boots Alliance, Inc. | | | 20,377 | | | | 704,637 | |
Walmart, Inc. | | | 40,409 | | | | 5,958,307 | |
| | | | | | | | |
| | |
| | | | | | | 17,563,267 | |
| |
| Diversified Telecommunication Services — 1.1% | | | | |
AT&T Inc. | | | 203,542 | | | | 3,918,184 | |
Verizon Communications, Inc. | | | 119,488 | | | | 4,646,888 | |
| | | | | | | | |
| | |
| | | | | | | 8,565,072 | |
| | |
| Electric Utilities — 1.4% | | | | | | |
American Electric Power Co., Inc. | | | 14,660 | | | | 1,333,913 | |
Duke Energy Corp. | | | 21,887 | | | | 2,111,439 | |
Exelon Corp. | | | 28,152 | | | | 1,179,287 | |
NextEra Energy, Inc. | | | 56,459 | | | | 4,351,860 | |
Southern Co. | | | 30,912 | | | | 2,150,857 | |
| | | | | | | | |
| | |
| | | | | | | 11,127,356 | |
| | |
| Electrical Equipment — 0.4% | | | | | | |
Eaton Corp. PLC | | | 11,353 | | | | 1,945,223 | |
Emerson Electric Co. | | | 16,105 | | | | 1,403,390 | |
| | | | | | | | |
| | |
| | | | | | | 3,348,613 | |
| | |
| Energy Equipment & Services — 0.2% | | | | | | |
Schlumberger NV | | | 40,151 | | | | 1,971,414 | |
| | | | | | | | |
| | |
| Entertainment — 1.4% | | | | | | |
Activision Blizzard, Inc. | | | 22,052 | | | | 1,887,431 | |
Netflix, Inc.(a) | | | 12,445 | | | | 4,299,498 | |
Walt Disney Co.(a) | | | 51,799 | | | | 5,186,634 | |
| | | | | | | | |
| | |
| | | | | | | 11,373,563 | |
| | |
| Financial Services — 5.2% | | | | | | |
Berkshire Hathaway, Inc., Class B(a) | | | 51,289 | | | | 15,836,505 | |
Block, Inc., Class A(a) | | | 15,190 | | | | 1,042,793 | |
Fidelity National Information Services, Inc. | | | 16,793 | | | | 912,364 | |
Fiserv, Inc.(a) | | | 16,751 | | | | 1,893,366 | |
Mastercard, Inc., Class A | | | 24,190 | | | | 8,790,888 | |
PayPal Holdings, Inc.(a) | | | 32,401 | | | | 2,460,532 | |
Visa, Inc., Class A | | | 46,212 | | | | 10,418,957 | |
| | | | | | | | |
| | |
| | | | | | | 41,355,405 | |
| | |
| Food Products — 0.8% | | | | | | |
Archer-Daniels-Midland Co. | | | 15,490 | | | | 1,233,933 | |
General Mills, Inc. | | | 16,716 | | | | 1,428,549 | |
| | |
| 12 | | 2 0 2 3 I SHARES ANNUAL REPORT TO SHAREHOLDERS |
| | |
Schedule of Investments (continued) March 31, 2023 | | iShares® Russell Top 200 ETF (Percentages shown are based on Net Assets) |
| | | | | | | | |
| Security | | Shares | | | Value | |
|
Food Products (continued) | |
Kraft Heinz Co. | | | 19,958 | | | $ | 771,776 | |
Mondelez International, Inc., Class A | | | 38,759 | | | | 2,702,278 | |
| | | | | | | | |
| | |
| | | | | | | 6,136,536 | |
| | |
| Ground Transportation — 1.0% | | | | | | |
CSX Corp. | | | 59,791 | | | | 1,790,143 | |
Norfolk Southern Corp. | | | 6,444 | | | | 1,366,128 | |
Uber Technologies, Inc.(a) | | | 54,628 | | | | 1,731,708 | |
Union Pacific Corp. | | | 17,471 | | | | 3,516,213 | |
| | | | | | | | |
| | |
| | | | | | | 8,404,192 | |
| | |
| Health Care Equipment & Supplies — 2.5% | | | | | | |
Abbott Laboratories | | | 48,749 | | | | 4,936,324 | |
Baxter International, Inc. | | | 14,340 | | | | 581,630 | |
Becton Dickinson & Co. | | | 8,071 | | | | 1,997,895 | |
Boston Scientific Corp.(a) | | | 40,536 | | | | 2,028,016 | |
Edwards Lifesciences Corp.(a) | | | 17,611 | | | | 1,456,958 | |
GE HealthCare Technologies, Inc.(a) | | | 10,341 | | | | 848,272 | |
Intuitive Surgical, Inc.(a) | | | 10,014 | | | | 2,558,277 | |
Medtronic PLC | | | 37,998 | | | | 3,063,399 | |
Stryker Corp. | | | 9,987 | | | | 2,850,989 | |
| | | | | | | | |
| | |
| | | | | | | 20,321,760 | |
| | |
| Health Care Providers & Services — 3.3% | | | | | | |
Centene Corp.(a) | | | 15,613 | | | | 986,898 | |
Cigna Group | | | 8,329 | | | | 2,128,309 | |
CVS Health Corp. | | | 36,493 | | | | 2,711,795 | |
Elevance Health, Inc. | | | 6,858 | | | | 3,153,377 | |
HCA Healthcare, Inc. | | | 6,121 | | | | 1,613,985 | |
Humana, Inc. | | | 3,593 | | | | 1,744,258 | |
McKesson Corp. | | | 3,883 | | | | 1,382,542 | |
UnitedHealth Group, Inc. | | | 26,592 | | | | 12,567,113 | |
| | | | | | | | |
| | |
| | | | | | | 26,288,277 | |
| | |
| Hotels, Restaurants & Leisure — 1.8% | | | | | | |
Airbnb, Inc., Class A(a) | | | 10,646 | | | | 1,324,362 | |
Booking Holdings, Inc.(a) | | | 1,101 | | | | 2,920,304 | |
Marriott International, Inc., Class A | | | 7,559 | | | | 1,255,096 | |
McDonald’s Corp. | | | 21,010 | | | | 5,874,606 | |
Starbucks Corp. | | | 32,598 | | | | 3,394,430 | |
| | | | | | | | |
| | |
| | | | | | | 14,768,798 | |
| | |
| Household Products — 1.6% | | | | | | |
Colgate-Palmolive Co. | | | 23,504 | | | | 1,766,326 | |
Kimberly-Clark Corp. | | | 9,598 | | | | 1,288,243 | |
Procter & Gamble Co. | | | 67,107 | | | | 9,978,140 | |
| | | | | | | | |
| | |
| | | | | | | 13,032,709 | |
| | |
| Industrial Conglomerates — 1.0% | | | | | | |
3M Co. | | | 15,695 | | | | 1,649,702 | |
General Electric Co. | | | 30,809 | | | | 2,945,340 | |
Honeywell International, Inc. | | | 19,159 | | | | 3,661,668 | |
| | | | | | | | |
| | |
| | | | | | | 8,256,710 | |
| | |
| Industrial REITs — 0.4% | | | | | | |
Prologis, Inc. | | | 26,169 | | | | 3,265,106 | |
| | | | | | | | |
| | |
| Insurance — 1.5% | | | | | | |
American International Group, Inc. | | | 21,195 | | | | 1,067,380 | |
Aon PLC, Class A | | | 5,814 | | | | 1,833,096 | |
Chubb Ltd. | | | 11,827 | | | | 2,296,567 | |
Marsh & McLennan Cos., Inc. | | | 14,081 | | | | 2,345,190 | |
MetLife, Inc. | | | 18,732 | | | | 1,085,332 | |
Progressive Corp. | | | 16,596 | | | | 2,374,224 | |
Travelers Cos., Inc. | | | 6,634 | | | | 1,137,134 | |
| | | | | | | | |
| | |
| | | | | | | 12,138,923 | |
| | | | | | | | |
| Security | | Shares | | | Value | |
|
Interactive Media & Services — 5.8% | |
Alphabet, Inc., Class A(a) | | | 171,009 | | | $ | 17,738,764 | |
Alphabet, Inc., Class C, NVS(a) | | | 148,713 | | | | 15,466,152 | |
Meta Platforms, Inc., Class A(a) | | | 63,261 | | | | 13,407,536 | |
| | | | | | | | |
| | |
| | | | | | | 46,612,452 | |
| | |
| IT Services — 1.3% | | | | | | |
Accenture PLC, Class A | | | 18,014 | | | | 5,148,581 | |
Cognizant Technology Solutions Corp., Class A | | | 14,603 | | | | 889,761 | |
International Business Machines Corp. | | | 25,584 | | | | 3,353,806 | |
Snowflake, Inc., Class A(a) | | | 8,837 | | | | 1,363,461 | |
| | | | | | | | |
| | |
| | | | | | | 10,755,609 | |
| | |
| Life Sciences Tools & Services — 1.5% | | | | | | |
Danaher Corp. | | | 18,403 | | | | 4,638,292 | |
Illumina, Inc.(a) | | | 4,453 | | | | 1,035,545 | |
Thermo Fisher Scientific, Inc. | | | 11,124 | | | | 6,411,540 | |
| | | | | | | | |
| | |
| | | | | | | 12,085,377 | |
| | |
| Machinery — 1.1% | | | | | | |
Caterpillar, Inc. | | | 14,793 | | | | 3,385,230 | |
Deere & Co. | | | 7,719 | | | | 3,187,021 | |
Illinois Tool Works, Inc. | | | 8,686 | | | | 2,114,607 | |
| | | | | | | | |
| | |
| | | | | | | 8,686,858 | |
| | |
| Media — 0.7% | | | | | | |
Charter Communications, Inc., Class A(a) | | | 2,999 | | | | 1,072,473 | |
Comcast Corp., Class A | | | 118,921 | | | | 4,508,295 | |
| | | | | | | | |
| | |
| | | | | | | 5,580,768 | |
| | |
| Metals & Mining — 0.4% | | | | | | |
Freeport-McMoRan, Inc. | | | 40,584 | | | | 1,660,292 | |
Newmont Corp. | | | 22,591 | | | | 1,107,411 | |
Southern Copper Corp. | | | 2,393 | | | | 182,466 | |
| | | | | | | | |
| | |
| | | | | | | 2,950,169 | |
| | |
| Multi-Utilities — 0.3% | | | | | | |
Dominion Energy, Inc. | | | 23,735 | | | | 1,327,024 | |
Sempra Energy | | | 8,919 | | | | 1,348,196 | |
| | | | | | | | |
| | |
| | | | | | | 2,675,220 | |
| | |
| Oil, Gas & Consumable Fuels — 4.3% | | | | | | |
Chevron Corp. | | | 54,983 | | | | 8,971,026 | |
ConocoPhillips | | | 34,803 | | | | 3,452,805 | |
EOG Resources, Inc. | | | 16,655 | | | | 1,909,163 | |
Exxon Mobil Corp. | | | 117,156 | | | | 12,847,327 | |
Kinder Morgan, Inc. | | | 56,290 | | | | 985,638 | |
Marathon Petroleum Corp. | | | 12,865 | | | | 1,734,588 | |
Occidental Petroleum Corp. | | | 22,635 | | | | 1,413,103 | |
Pioneer Natural Resources Co. | | | 6,749 | | | | 1,378,416 | |
Valero Energy Corp. | | | 10,997 | | | | 1,535,181 | |
| | | | | | | | |
| | |
| | | | | | | 34,227,247 | |
| | |
| Personal Care Products — 0.2% | | | | | | |
Estee Lauder Cos., Inc., Class A | | | 6,513 | | | | 1,605,194 | |
| | | | | | | | |
| | |
| Pharmaceuticals — 5.0% | | | | | | |
Bristol-Myers Squibb Co. | | | 60,545 | | | | 4,196,374 | |
Eli Lilly & Co. | | | 23,955 | | | | 8,226,626 | |
Johnson & Johnson | | | 74,820 | | | | 11,597,100 | |
Merck & Co., Inc. | | | 71,917 | | | | 7,651,250 | |
Pfizer, Inc. | | | 160,679 | | | | 6,555,703 | |
Zoetis, Inc., Class A | | | 13,385 | | | | 2,227,799 | |
| | | | | | | | |
| | |
| | | | | | | 40,454,852 | |
| | |
| Professional Services — 0.3% | | | | | | |
Automatic Data Processing, Inc. | | | 11,870 | | | | 2,642,618 | |
| | | | | | | | |
| |
| Semiconductors & Semiconductor Equipment — 6.9% | | | | |
Advanced Micro Devices, Inc.(a) | | | 45,918 | | | | 4,500,423 | |
| | |
SCHEDULES OF INVESTMENTS | | 13 |
| | |
Schedule of Investments (continued) March 31, 2023 | | iShares® Russell Top 200 ETF (Percentages shown are based on Net Assets) |
| | | | | | | | |
| Security | | Shares | | | Value | |
|
Semiconductors & Semiconductor Equipment (continued) | |
Analog Devices, Inc. | | | 14,373 | | | $ | 2,834,643 | |
Applied Materials, Inc. | | | 23,922 | | | | 2,938,339 | |
Broadcom, Inc. | | | 11,228 | | | | 7,203,211 | |
Intel Corp. | | | 117,703 | | | | 3,845,357 | |
KLA Corp. | | | 3,928 | | | | 1,567,940 | |
Lam Research Corp. | | | 3,829 | | | | 2,029,830 | |
Marvell Technology, Inc. | | | 24,171 | | | | 1,046,604 | |
Micron Technology, Inc. | | | 30,911 | | | | 1,865,170 | |
NVIDIA Corp. | | | 67,260 | | | | 18,682,810 | |
QUALCOMM, Inc. | | | 31,855 | | | | 4,064,061 | |
Texas Instruments, Inc. | | | 25,798 | | | | 4,798,686 | |
| | | | | | | | |
| | |
| | | | | | | 55,377,074 | |
| | |
| Software — 11.1% | | | | | | |
Adobe, Inc.(a) | | | 12,998 | | | | 5,009,039 | |
Atlassian Corp., Class A(a) | | | 4,147 | | | | 709,842 | |
Autodesk, Inc.(a) | | | 6,175 | | | | 1,285,388 | |
Intuit, Inc. | | | 7,835 | | | | 3,493,078 | |
Microsoft Corp. | | | 212,720 | | | | 61,327,176 | |
Oracle Corp. | | | 43,456 | | | | 4,037,931 | |
Palo Alto Networks, Inc.(a)(c) | | | 8,439 | | | | 1,685,606 | |
Roper Technologies, Inc. | | | 3,003 | | | | 1,323,392 | |
Salesforce, Inc.(a) | | | 27,360 | | | | 5,465,981 | |
ServiceNow, Inc.(a) | | | 5,764 | | | | 2,678,646 | |
VMware, Inc., Class A(a) | | | 6,088 | | | | 760,087 | |
Workday, Inc., Class A(a) | | | 5,663 | | | | 1,169,636 | |
| | | | | | | | |
| | |
| | | | | | | 88,945,802 | |
| | |
| Specialized REITs — 1.0% | | | | | | |
American Tower Corp. | | | 13,190 | | | | 2,695,245 | |
Crown Castle, Inc. | | | 12,235 | | | | 1,637,532 | |
Digital Realty Trust, Inc. | | | 8,132 | | | | 799,457 | |
Equinix, Inc. | | | 2,625 | | | | 1,892,730 | |
Public Storage | | | 4,443 | | | | 1,342,408 | |
| | | | | | | | |
| | |
| | | | | | | 8,367,372 | |
| | |
| Specialty Retail — 1.8% | | | | | | |
Home Depot, Inc. | | | 28,971 | | | | 8,549,922 | |
Lowe’s Cos., Inc. | | | 17,199 | | | | 3,439,284 | |
TJX Cos., Inc. | | | 32,995 | | | | 2,585,488 | |
| | | | | | | | |
| | |
| | | | | | | 14,574,694 | |
| | | | | | | | |
| Security | | Shares | | | Value | |
|
Technology Hardware, Storage & Peripherals — 8.8% | |
Apple Inc. | | | 427,271 | | | $ | 70,456,988 | |
| | | | | | | | |
|
| Textiles, Apparel & Luxury Goods — 0.5% | |
NIKE, Inc., Class B | | | 34,200 | | | | 4,194,288 | |
| | | | | | | | |
| | |
| Tobacco — 0.8% | | | | | | |
Altria Group, Inc. | | | 50,966 | | | | 2,274,103 | |
Philip Morris International, Inc. | | | 44,053 | | | | 4,284,154 | |
| | | | | | | | |
| | |
| | | | | | | 6,558,257 | |
|
| Wireless Telecommunication Services — 0.3% | |
T-Mobile U.S., Inc.(a) | | | 16,671 | | | | 2,414,628 | |
| | | | | | | | |
| | |
Total Long-Term Investments — 99.8%
(Cost: $802,292,132) | | | | | | | 801,747,479 | |
| | | | | | | | |
| | |
Short-Term Securities | | | | | | | | |
| | |
| Money Market Funds — 0.3% | | | | | | |
BlackRock Cash Funds: Institutional, SL Agency Shares, 5.01%(b)(d)(e) | | | 1,636,633 | | | | 1,637,124 | |
BlackRock Cash Funds: Treasury, SL Agency Shares, 4.73%(b)(d) | | | 1,169,890 | | | | 1,169,890 | |
| | | | | | | | |
| |
Total Short-Term Securities — 0.3%
(Cost: $2,806,990) | | | | 2,807,014 | |
| | | | | | | | |
| |
Total Investments — 100.1%
(Cost: $805,099,122) | | | | 804,554,493 | |
| |
Liabilities in Excess of Other Assets — (0.1)% | | | | (1,147,276 | ) |
| | | | | | | | |
| |
Net Assets — 100.0% | | | $ | 803,407,217 | |
| | | | | | | | |
| (a) | Non-income producing security. |
| (b) | Affiliate of the Fund. |
| (c) | All or a portion of this security is on loan. |
| (d) | Annualized 7-day yield as of period end. |
| (e) | All or a portion of this security was purchased with the cash collateral from loaned securities. |
Affiliates
Investments in issuers considered to be affiliate(s) of the Fund during the year ended March 31, 2023 for purposes of Section 2(a)(3) of the Investment Company Act of 1940, as amended, were as follows:
| | | | | | | | | | | | | | | | | | | | | | | | | | | | | | | | | | | | |
| |
| Affiliated Issuer | | Value at
03/31/22 | | | Purchases
at Cost | | | Proceeds
from Sale | | | Net Realized
Gain (Loss) | | | Change in
Unrealized
Appreciation
(Depreciation) | | | Value at
03/31/23 | | | Shares
Held at
03/31/23 | | | Income | | | Capital Gain
Distributions
from Underlying
Funds | |
| |
BlackRock Cash Funds: Institutional,
SL Agency Shares | | $ | 249,903 | | | $ | 1,381,728 | (a) | | $ | — | | | $ | 5,434 | | | $ | 59 | | | $ | 1,637,124 | | | | 1,636,633 | | | $ | 14,072 | (b) | | $ | — | |
BlackRock Cash Funds: Treasury,
SL Agency Shares | | | 1,385,000 | | | | — | | | | (215,110 | )(a) | | | — | | | | — | | | | 1,169,890 | | | | 1,169,890 | | | | 33,759 | | | | 1 | |
BlackRock, Inc. | | | 3,604,590 | | | | 1,038,890 | | | | (1,730,601 | ) | | | 703,995 | | | | (795,195 | ) | | | 2,821,679 | | | | 4,217 | | | | — | | | | — | |
| | | | | | | | | | | | | | | | | | | | | | | | | | | | | | | | | | | | |
| | | | | | | | | |
| | | | | | | | | | | | | | $ | 709,429 | | | $ | (795,136 | ) | | $ | 5,628,693 | | | | | | | $ | 47,831 | | | $ | 1 | |
| | | | | | | | | | | | | | | | | | | | | | | | | | | | | | | | | | | | |
| | (a) | Represents net amount purchased (sold). | |
| | (b) | All or a portion represents securities lending income earned from the reinvestment of cash collateral from loaned securities, net of fees and collateral investment expenses, and other payments to and from borrowers of securities. | |
| | |
| 14 | | 2 0 2 3 I SHARES ANNUAL REPORT TO SHAREHOLDERS |
| | |
Schedule of Investments (continued) March 31, 2023 | | iShares® Russell Top 200 ETF |
Derivative Financial Instruments Outstanding as of Period End
Futures Contracts
| | | | | | | | | | | | | | | | |
| |
| Description | | Number of
Contracts | | | Expiration
Date | | | Notional
Amount
(000) | | | Value/
Unrealized
Appreciation
(Depreciation) | |
| |
Long Contracts | | | | | | | | | | | | | | | | |
S&P 500 E-mini Index | | | 7 | | | | 06/16/23 | | | $ | 1,448 | | | $ | 85,017 | |
| | | | | | | | | | | | | | | | |
Derivative Financial Instruments Categorized by Risk Exposure
As of period end, the fair values of derivative financial instruments located in the Statements of Assets and Liabilities were as follows:
| | | | | | | | | | | | | | | | | | | | | | | | | | | | |
| |
| | | Commodity
Contracts | | | Credit
Contracts | | | Equity
Contracts | | | Foreign
Currency
Exchange
Contracts | | | Interest
Rate
Contracts | | | Other
Contracts | | | Total | |
| |
Assets — Derivative Financial Instruments | | | | | | | | | | | | | | | | | | | | | | | | | | | | |
Futures contracts | | | | | | | | | | | | | | | | | | | | | | | | | | | | |
Unrealized appreciation on futures contracts(a) | | $ | — | | | $ | — | | | $ | 85,017 | | | $ | — | | | $ | — | | | $ | — | | | $ | 85,017 | |
| | | | | | | | | | | | | | | | | | | | | | | | | | | | |
| | (a) | Net cumulative unrealized appreciation (depreciation) on futures contracts, if any, are reported in the Schedule of Investments. In the Statements of Assets and Liabilities, only current day’s variation margin is reported in receivables or payables and the net cumulative unrealized appreciation (depreciation) is included in accumulated earnings (loss). | |
For the period ended March 31, 2023, the effect of derivative financial instruments in the Statements of Operations was as follows:
| | | | | | | | | | | | | | | | | | | | | | | | | | | | |
| |
| | | Commodity
Contracts | | | Credit
Contracts | | | Equity
Contracts | | | Foreign
Currency
Exchange
Contracts | | | Interest
Rate
Contracts | | | Other
Contracts | | | Total | |
| |
Net Realized Gain (Loss) from | | | | | | | | | | | | | | | | | | | | | | | | | | | | |
Futures contracts | | $ | — | | | $ | — | | | $ | (230,224 | ) | | $ | — | | | $ | — | | | $ | — | | | $ | (230,224 | ) |
| | | | | | | | | | | | | | | | | | | | | | | | | | | | |
Net Change in Unrealized Appreciation (Depreciation) on | | | | | | | | | | | | | | | | | | | | | | | | | | | | |
Futures contracts | | $ | — | | | $ | — | | | $ | (13,507 | ) | | $ | — | | | $ | — | | | $ | — | | | $ | (13,507 | ) |
| | | | | | | | | | | | | | | | | | | | | | | | | | | | |
Average Quarterly Balances of Outstanding Derivative Financial Instruments
| | | | |
| |
Futures contracts | | | | |
Average notional value of contracts — long | | $ | 1,498,366 | |
| |
For more information about the Fund’s investment risks regarding derivative financial instruments, refer to the Notes to Financial Statements.
| | |
SCHEDULES OF INVESTMENTS | | 15 |
| | |
Schedule of Investments (continued) March 31, 2023 | | iShares® Russell Top 200 ETF |
Fair Value Hierarchy as of Period End
Various inputs are used in determining the fair value of financial instruments. For a description of the input levels and information about the Fund’s policy regarding valuation of financial instruments, refer to the Notes to Financial Statements.
The following table summarizes the Fund’s financial instruments categorized in the fair value hierarchy. The breakdown of the Fund’s financial instruments into major categories is disclosed in the Schedule of Investments above.
| | | | | | | | | | | | | | | | |
| |
| | | Level 1 | | | Level 2 | | | Level 3 | | | Total | |
| |
Assets | | | | | | | | | | | | | | | | |
Investments | | | | | | | | | | | | | | | | |
Long-Term Investments | | | | | | | | | | | | | | | | |
Common Stocks | | $ | 801,747,479 | | | $ | — | | | $ | — | | | $ | 801,747,479 | |
Short-Term Securities | | | | | | | | | | | | | | | | |
Money Market Funds | | | 2,807,014 | | | | — | | | | — | | | | 2,807,014 | |
| | | | | | | | | | | | | | | | |
| | | | |
| | $ | 804,554,493 | | | $ | — | | | $ | — | | | $ | 804,554,493 | |
| | | | | | | | | | | | | | | | |
Derivative Financial Instruments(a) | | | | | | | | | | | | | | | | |
Assets | | | | | | | | | | | | | | | | |
Equity Contracts | | $ | 85,017 | | | $ | — | | | $ | — | | | $ | 85,017 | |
| | | | | | | | | | | | | | | | |
(a) Derivative financial instruments are futures contracts. Futures contracts are valued at the unrealized appreciation (depreciation) on the instrument.
See notes to financial statements.
| | |
| 16 | | 2 0 2 3 I SHARES ANNUAL REPORT TO SHAREHOLDERS |
| | |
Schedule of Investments March 31, 2023 | | iShares® Russell Top 200 Growth ETF (Percentages shown are based on Net Assets) |
| | | | | | | | |
| Security | | Shares | | | Value | |
| | |
Common Stocks | | | | | | | | |
| | |
| Aerospace & Defense — 1.0% | | | | | | |
Boeing Co.(a)(b) | | | 64,193 | | | $ | 13,636,519 | |
Lockheed Martin Corp. | | | 84,718 | | | | 40,048,740 | |
Northrop Grumman Corp. | | | 6,212 | | | | 2,868,205 | |
| | | | | | | | |
| | |
| | | | | | | 56,553,464 | |
| | |
| Air Freight & Logistics — 0.8% | | | | | | |
United Parcel Service, Inc., Class B | | | 243,969 | | | | 47,327,546 | |
| | | | | | | | |
| | |
| Automobiles — 3.4% | | | | | | |
Tesla, Inc.(a) | | | 961,597 | | | | 199,492,914 | |
| | | | | | | | |
| | |
| Beverages — 2.7% | | | | | | |
Coca-Cola Co. | | | 1,089,548 | | | | 67,584,662 | |
Monster Beverage Corp.(a) | | | 252,259 | | | | 13,624,509 | |
PepsiCo, Inc. | | | 434,633 | | | | 79,233,596 | |
| | | | | | | | |
| | |
| | | | | | | 160,442,767 | |
| | |
| Biotechnology — 3.0% | | | | | | |
AbbVie, Inc. | | | 657,565 | | | | 104,796,134 | |
Amgen, Inc. | | | 166,878 | | | | 40,342,757 | |
Moderna, Inc.(a) | | | 7,214 | | | | 1,107,926 | |
Regeneron Pharmaceuticals, Inc.(a) | | | 5,644 | | | | 4,637,505 | |
Vertex Pharmaceuticals, Inc.(a) | | | 89,747 | | | | 28,276,587 | |
| | | | | | | | |
| | |
| | | | | | | 179,160,909 | |
| | |
| Broadline Retail — 5.8% | | | | | | |
Amazon.com, Inc.(a) | | | 3,306,977 | | | | 341,577,654 | |
| | | | | | | | |
| | |
| Capital Markets — 1.0% | | | | | | |
Blackstone, Inc., Class A, NVS | | | 264,265 | | | | 23,213,037 | |
Charles Schwab Corp. | | | 313,408 | | | | 16,416,311 | |
Moody’s Corp. | | | 56,080 | | | | 17,161,602 | |
| | | | | | | | |
| | |
| | | | | | | 56,790,950 | |
| | |
| Chemicals — 0.8% | | | | | | |
Ecolab, Inc. | | | 81,576 | | | | 13,503,275 | |
Linde PLC | | | 38,654 | | | | 13,739,178 | |
Sherwin-Williams Co. | | | 88,888 | | | | 19,979,356 | |
| | | | | | | | |
| | |
| | | | | | | 47,221,809 | |
| | |
| Commercial Services & Supplies — 0.4% | | | | | | |
Waste Management, Inc. | | | 143,203 | | | | 23,366,434 | |
| | | | | | | | |
| | |
| Consumer Finance — 0.0% | | | | | | |
American Express Co. | | | 13,918 | | | | 2,295,774 | |
| | | | | | | | |
| |
| Consumer Staples Distribution & Retail — 2.2% | | | | |
Costco Wholesale Corp. | | | 164,729 | | | | 81,848,898 | |
Dollar General Corp. | | | 83,754 | | | | 17,626,867 | |
Sysco Corp. | | | 189,122 | | | | 14,605,892 | |
Target Corp. | | | 95,074 | | | | 15,747,107 | |
| | | | | | | | |
| | |
| | | | | | | 129,828,764 | |
| | |
| Electrical Equipment — 0.1% | | | | | | |
Emerson Electric Co. | | | 67,541 | | | | 5,885,523 | |
| | | | | | | | |
| | |
| Entertainment — 0.5% | | | | | | |
Netflix, Inc.(a) | | | 73,571 | | | | 25,417,309 | |
Walt Disney Co.(a) | | | 45,403 | | | | 4,546,202 | |
| | | | | | | | |
| | |
| | | | | | | 29,963,511 | |
| | |
| Financial Services — 4.4% | | | | | | |
Fiserv, Inc.(a) | | | 19,849 | | | | 2,243,532 | |
Mastercard, Inc., Class A | | | 316,596 | | | | 115,054,152 | |
PayPal Holdings, Inc.(a) | | | 130,839 | | | | 9,935,914 | |
Visa, Inc., Class A | | | 604,799 | | | | 136,357,983 | |
| | | | | | | | |
| | |
| | | | | | | 263,591,581 | |
| | | | | | | | |
| Security | | Shares | | | Value | |
|
Ground Transportation — 1.2% | |
CSX Corp. | | | 197,532 | | | $ | 5,914,108 | |
Uber Technologies, Inc.(a) | | | 617,645 | | | | 19,579,347 | |
Union Pacific Corp. | | | 228,659 | | | | 46,019,910 | |
| | | | | | | | |
| | |
| | | | | | | 71,513,365 | |
| | |
| Health Care Equipment & Supplies — 1.3% | | | | | | |
Abbott Laboratories | | | 84,266 | | | | 8,532,775 | |
Baxter International, Inc. | | | 28,881 | | | | 1,171,414 | |
Edwards Lifesciences Corp.(a) | | | 229,667 | | | | 19,000,351 | |
GE HealthCare Technologies, Inc.(a) | | | 7,534 | | | | 618,014 | |
Intuitive Surgical, Inc.(a) | | | 120,651 | | | | 30,822,711 | |
Stryker Corp. | | | 69,922 | | | | 19,960,633 | |
| | | | | | | | |
| | |
| | | | | | | 80,105,898 | |
| | |
| Health Care Providers & Services — 3.2% | | | | | | |
Cigna Group | | | 17,365 | | | | 4,437,278 | |
Elevance Health, Inc. | | | 27,216 | | | | 12,514,189 | |
HCA Healthcare, Inc. | | | 4,876 | | | | 1,285,704 | |
Humana, Inc. | | | 33,218 | | | | 16,126,010 | |
McKesson Corp. | | | 10,011 | | | | 3,564,417 | |
UnitedHealth Group, Inc. | | | 316,696 | | | | 149,667,363 | |
| | | | | | | | |
| | |
| | | | | | | 187,594,961 | |
| | |
| Hotels, Restaurants & Leisure — 1.8% | | | | | | |
Airbnb, Inc., Class A(a) | | | 139,482 | | | | 17,351,561 | |
Booking Holdings, Inc.(a)(b) | | | 14,428 | | | | 38,268,971 | |
Marriott International, Inc., Class A | | | 98,726 | | | | 16,392,465 | |
McDonald’s Corp. | | | 66,765 | | | | 18,668,162 | |
Starbucks Corp. | | | 153,805 | | | | 16,015,715 | |
| | | | | | | | |
| | |
| | | | | | | 106,696,874 | |
| | |
| Household Products — 1.3% | | | | | | |
Colgate-Palmolive Co. | | | 189,686 | | | | 14,254,903 | |
Kimberly-Clark Corp. | | | 73,987 | | | | 9,930,535 | |
Procter & Gamble Co. | | | 374,139 | | | | 55,630,728 | |
| | | | | | | | |
| | |
| | | | | | | 79,816,166 | |
| | |
| Industrial Conglomerates — 0.3% | | | | | | |
General Electric Co.(b) | | | 22,563 | | | | 2,157,023 | |
Honeywell International, Inc. | | | 73,820 | | | | 14,108,478 | |
| | | | | | | | |
| | |
| | | | | | | 16,265,501 | |
| | |
| Insurance — 1.3% | | | | | | |
Aon PLC, Class A | | | 71,741 | | | | 22,619,220 | |
Marsh & McLennan Cos., Inc. | | | 164,798 | | | | 27,447,107 | |
Progressive Corp. | | | 188,829 | | | | 27,013,877 | |
| | | | | | | | |
| | |
| | | | | | | 77,080,204 | |
| | |
| Interactive Media & Services — 7.0% | | | | | | |
Alphabet, Inc., Class A(a) | | | 1,947,115 | | | | 201,974,239 | |
Alphabet, Inc., Class C, NVS(a) | | | 1,693,261 | | | | 176,099,144 | |
Meta Platforms, Inc., Class A(a) | | | 176,339 | | | | 37,373,288 | |
| | | | | | | | |
| | |
| | | | | | | 415,446,671 | |
| | |
| IT Services — 1.9% | | | | | | |
Accenture PLC, Class A | | | 235,750 | | | | 67,379,708 | |
International Business Machines Corp. | | | 223,534 | | | | 29,303,072 | |
Snowflake, Inc., Class A(a) | | | 108,060 | | | | 16,672,577 | |
| | | | | | | | |
| | |
| | | | | | | 113,355,357 | |
| | |
| Life Sciences Tools & Services — 0.2% | | | | | | |
Danaher Corp. | | | 16,360 | | | | 4,123,374 | |
Thermo Fisher Scientific, Inc. | | | 17,730 | | | | 10,219,040 | |
| | | | | | | | |
| | |
| | | | | | | 14,342,414 | |
| | |
| Machinery — 1.8% | | | | | | |
Caterpillar, Inc. | | | 168,620 | | | | 38,587,001 | |
| | |
SCHEDULES OF INVESTMENTS | | 17 |
| | |
Schedule of Investments (continued) March 31, 2023 | | iShares® Russell Top 200 Growth ETF (Percentages shown are based on Net Assets) |
| | | | | | | | |
| Security | | Shares | | | Value | |
| | |
| Machinery (continued) | | | | | | |
Deere & Co. | | | 101,018 | | | $ | 41,708,312 | |
Illinois Tool Works, Inc. | | | 102,363 | | | | 24,920,272 | |
| | | | | | | | |
| | |
| | | | | | | 105,215,585 | |
| | |
| Media — 0.2% | | | | | | |
Charter Communications, Inc., Class A(a) | | | 39,028 | | | | 13,956,803 | |
| | | | | | | | |
| | |
| Metals & Mining — 0.0% | | | | | | |
Southern Copper Corp. | | | 20,608 | | | | 1,571,360 | |
| | | | | | | | |
| | |
| Oil, Gas & Consumable Fuels — 0.7% | | | | | | |
EOG Resources, Inc. | | | 158,964 | | | | 18,222,043 | |
Occidental Petroleum Corp.(b) | | | 244,212 | | | | 15,246,155 | |
Pioneer Natural Resources Co. | | | 48,537 | | | | 9,913,197 | |
| | | | | | | | |
| | |
| | | | | | | 43,381,395 | |
| | |
| Personal Care Products — 0.4% | | | | | | |
Estee Lauder Cos., Inc., Class A | | | 85,491 | | | | 21,070,112 | |
| | | | | | | | |
| | |
| Pharmaceuticals — 2.7% | | | | | | |
Eli Lilly & Co. | | | 255,192 | | | | 87,638,037 | |
Merck & Co., Inc. | | | 394,370 | | | | 41,957,024 | |
Zoetis, Inc., Class A | | | 175,085 | | | | 29,141,147 | |
| | | | | | | | |
| | |
| | | | | | | 158,736,208 | |
| | |
| Professional Services — 0.5% | | | | | | |
Automatic Data Processing, Inc. | | | 142,561 | | | | 31,738,355 | |
| | | | | | | | |
| | |
| Semiconductors & Semiconductor Equipment — 9.8% | | | | | | |
Advanced Micro Devices, Inc.(a) | | | 473,548 | | | | 46,412,440 | |
Analog Devices, Inc. | | | 37,870 | | | | 7,468,721 | |
Applied Materials, Inc. | | | 313,085 | | | | 38,456,231 | |
Broadcom, Inc. | | | 146,949 | | | | 94,273,661 | |
KLA Corp. | | | 51,455 | | | | 20,539,292 | |
Lam Research Corp. | | | 50,123 | | | | 26,571,205 | |
Micron Technology, Inc. | | | 76,561 | | | | 4,619,691 | |
NVIDIA Corp. | | | 880,272 | | | | 244,513,153 | |
QUALCOMM, Inc. | | | 416,897 | | | | 53,187,719 | |
Texas Instruments, Inc. | | | 231,279 | | | | 43,020,207 | |
| | | | | | | | |
| | |
| | | | | | | 579,062,320 | |
| | |
| Software — 18.0% | | | | | | |
Adobe, Inc.(a) | | | 170,113 | | | | 65,556,447 | |
Atlassian Corp., Class A(a) | | | 54,148 | | | | 9,268,513 | |
Autodesk, Inc.(a) | | | 80,924 | | | | 16,845,140 | |
Intuit, Inc. | | | 102,529 | | | | 45,710,504 | |
Microsoft Corp. | | | 2,783,965 | | | | 802,617,109 | |
Oracle Corp. | | | 390,628 | | | | 36,297,154 | |
Palo Alto Networks, Inc.(a) | | | 110,747 | | | | 22,120,606 | |
Salesforce, Inc.(a) | | | 76,678 | | | | 15,318,731 | |
| | | | | | | | |
| Security | | Shares | | | Value | |
| | |
| Software (continued) | | | | | | |
ServiceNow, Inc.(a) | | | 75,401 | | | $ | 35,040,353 | |
VMware, Inc., Class A(a) | | | 38,725 | | | | 4,834,816 | |
Workday, Inc., Class A(a) | | | 74,066 | | | | 15,297,591 | |
| | | | | | | | |
| | |
| | | | | | | 1,068,906,964 | |
| | |
| Specialized REITs — 1.4% | | | | | | |
American Tower Corp. | | | 132,310 | | | | 27,036,225 | |
Crown Castle, Inc. | | | 160,366 | | | | 21,463,386 | |
Equinix, Inc. | | | 25,935 | | | | 18,700,172 | |
Public Storage | | | 46,220 | | | | 13,964,911 | |
| | | | | | | | |
| | |
| | | | | | | 81,164,694 | |
| | |
| Specialty Retail — 2.3% | | | | | | |
Home Depot, Inc. | | | 219,922 | | | | 64,903,381 | |
Lowe’s Cos., Inc. | | | 194,251 | | | | 38,844,372 | |
TJX Cos., Inc. | | | 431,708 | | | | 33,828,639 | |
| | | | | | | | |
| | |
| | | | | | | 137,576,392 | |
|
| Technology Hardware, Storage & Peripherals — 15.5% | |
Apple Inc. | | | 5,591,901 | | | | 922,104,475 | |
| | | | | | | | |
| |
| Textiles, Apparel & Luxury Goods — 0.9% | | | | |
NIKE, Inc., Class B | | | 447,589 | | | | 54,892,315 | |
| | | | | | | | |
| | |
Total Long-Term Investments — 99.8%
(Cost: $5,293,935,887) | | | | | | | 5,925,093,989 | |
| | | | | | | | |
| | |
Short-Term Securities | | | | | | | | |
| | |
| Money Market Funds — 0.8% | | | | | | |
BlackRock Cash Funds: Institutional, SL Agency Shares, 5.01%(c)(d)(e) | | | 40,082,221 | | | | 40,094,246 | |
BlackRock Cash Funds: Treasury, SL Agency Shares, 4.73%(c)(d) | | | 7,923,181 | | | | 7,923,181 | |
| | | | | | | | |
| | |
Total Short-Term Securities — 0.8%
(Cost: $48,011,243) | | | | | | | 48,017,427 | |
| | | | | | | | |
| | |
Total Investments — 100.6%
(Cost: $5,341,947,130) | | | | | | | 5,973,111,416 | |
| |
Liabilities in Excess of Other Assets — (0.6)% | | | | (38,560,228 | ) |
| | | | | | | | |
| | |
Net Assets — 100.0% | | | | | | $ | 5,934,551,188 | |
| | | | | | | | |
| (a) | Non-income producing security. |
| (b) | All or a portion of this security is on loan. |
| (c) | Affiliate of the Fund. |
| (d) | Annualized 7-day yield as of period end. |
| (e) | All or a portion of this security was purchased with the cash collateral from loaned securities. |
| | |
| 18 | | 2 0 2 3 I SHARES ANNUAL REPORT TO SHAREHOLDERS |
| | |
Schedule of Investments (continued) March 31, 2023 | | iShares® Russell Top 200 Growth ETF |
Affiliates
Investments in issuers considered to be affiliate(s) of the Fund during the year ended March 31, 2023 for purposes of Section 2(a)(3) of the Investment Company Act of 1940, as amended, were as follows:
| | | | | | | | | | | | | | | | | | | | | | | | | | | | | | | | | | | | |
| |
| | | | | | | | | |
| Affiliated Issuer | | Value at
03/31/22 | | | Purchases
at Cost | | | Proceeds
from Sale | | | Net Realized
Gain (Loss) | | | Change in
Unrealized
Appreciation
(Depreciation) | | | Value at
03/31/23 | | | Shares
Held at
03/31/23 | | | Income | | | Capital
Gain
Distributions
from Underlying
Funds | |
| |
BlackRock Cash Funds: Institutional, SL Agency Shares | | $ | 8,926,531 | | | $ | 31,124,831 | (a) | | $ | — | | | $ | 37,894 | | | $ | 4,990 | | | $ | 40,094,246 | | | | 40,082,221 | | | $ | 120,319 | (b) | | $ | — | |
BlackRock Cash Funds: Treasury, SL Agency Shares | | | 6,166,000 | | | | 1,757,181 | (a) | | | — | | | | — | | | | — | | | | 7,923,181 | | | | 7,923,181 | | | | 194,167 | | | | 4 | |
| | | | | | | | | | | | | | | | | | | | | | | | | | | | | | | | | | | | |
| | | | | | | | | |
| | | | | | | | | | | | | | $ | 37,894 | | | $ | 4,990 | | | $ | 48,017,427 | | | | | | | $ | 314,486 | | | $ | 4 | |
| | | | | | | | | | | | | | | | | | | | | | | | | | | | | | | | | | | | |
| | (a) | Represents net amount purchased (sold). | |
| | (b) | All or a portion represents securities lending income earned from the reinvestment of cash collateral from loaned securities, net of fees and collateral investment expenses, and other payments to and from borrowers of securities. | |
Derivative Financial Instruments Outstanding as of Period End
Futures Contracts
| | | | | | | | | | | | | | | | |
| |
| Description | | Number of
Contracts | | | Expiration
Date | | | Notional
Amount
(000) | | | Value/
Unrealized
Appreciation
(Depreciation) | |
| |
Long Contracts | | | | | | | | | | | | | | | | |
E-mini Technology Select Sector Index | | | 13 | | | | 06/16/23 | | | $ | 1,996 | | | $ | 200,811 | |
Nasdaq 100 E-Mini Index | | | 25 | | | | 06/16/23 | | | | 6,651 | | | | 663,321 | |
| | | | | | | | | | | | | | | | |
| | | | |
| | | | | | | | | | | | | | $ | 864,132 | |
| | | | | | | | | | | | | | | | |
Derivative Financial Instruments Categorized by Risk Exposure
As of period end, the fair values of derivative financial instruments located in the Statements of Assets and Liabilities were as follows:
| | | | | | | | | | | | | | | | | | | | | | | | | | | | |
| | | Commodity
Contracts | | | Credit
Contracts | | | Equity
Contracts | | | Foreign
Currency
Exchange
Contracts | | | Interest
Rate
Contracts | | | Other
Contracts | | | Total | |
Assets — Derivative Financial Instruments | | | | | | | | | | | | | | | | | | | | | | | | | | | | |
Futures contracts | | | | | | | | | | | | | | | | | | | | | | | | | | | | |
Unrealized appreciation on futures contracts(a) | | $ | — | | | $ | — | | | $ | 864,132 | | | $ | — | | | $ | — | | | $ | — | | | $ | 864,132 | |
| | | | | | | | | | | | | | | | | | | | | | | | | | | | |
| | (a) | Net cumulative unrealized appreciation (depreciation) on futures contracts, if any, are reported in the Schedule of Investments. In the Statements of Assets and Liabilities, only current day’s variation margin is reported in receivables or payables and the net cumulative unrealized appreciation (depreciation) is included in accumulated earnings (loss). | |
For the period ended March 31, 2023, the effect of derivative financial instruments in the Statements of Operations was as follows:
| | | | | | | | | | | | | | | | | | | | | | | | | | | | |
| | | Commodity
Contracts | | | Credit
Contracts | | | Equity
Contracts | | | Foreign
Currency
Exchange
Contracts | | | Interest
Rate
Contracts | | | Other
Contracts | | | Total | |
Net Realized Gain (Loss) from | | | | | | | | | | | | | | | | | | | | | | | | | | | | |
Futures contracts | | $ | — | | | $ | — | | | $ | (319,077 | ) | | $ | — | | | $ | — | | | $ | — | | | $ | (319,077 | ) |
| | | | | | | | | | | | | | | | | | | | | | | | | | | | |
Net Change in Unrealized Appreciation (Depreciation) on | | | | | | | | | | | | | | | | | | | | | | | | | | | | |
Futures contracts | | $ | — | | | $ | — | | | $ | 361,996 | | | $ | — | | | $ | — | | | $ | — | | | $ | 361,996 | |
| | | | | | | | | | | | | | | | | | | | | | | | | | | | |
| | |
SCHEDULES OF INVESTMENTS | | 19 |
| | |
Schedule of Investments (continued) March 31, 2023 | | iShares® Russell Top 200 Growth ETF |
Average Quarterly Balances of Outstanding Derivative Financial Instruments
| | | | |
| |
Futures contracts | | | | |
Average notional value of contracts — long | | $ | 7,388,034 | |
| |
For more information about the Fund’s investment risks regarding derivative financial instruments, refer to the Notes to Financial Statements.
Fair Value Hierarchy as of Period End
Various inputs are used in determining the fair value of financial instruments. For a description of the input levels and information about the Fund’s policy regarding valuation of financial instruments, refer to the Notes to Financial Statements.
The following table summarizes the Fund’s financial instruments categorized in the fair value hierarchy. The breakdown of the Fund’s financial instruments into major categories is disclosed in the Schedule of Investments above.
| | | | | | | | | | | | | | | | |
| |
| | | Level 1 | | | Level 2 | | | Level 3 | | | Total | |
| |
Assets | | | | | | | | | | | | | | | | |
Investments | | | | | | | | | | | | | | | | |
Long-Term Investments | | | | | | | | | | | | | | | | |
Common Stocks | | $ | 5,925,093,989 | | | $ | — | | | $ | — | | | $ | 5,925,093,989 | |
Short-Term Securities | | | | | | | | | | | | | | | | |
Money Market Funds | | | 48,017,427 | | | | — | | | | — | | | | 48,017,427 | |
| | | | | | | | | | | | | | | | |
| | | | |
| | $ | 5,973,111,416 | | | $ | — | | | $ | — | | | $ | 5,973,111,416 | |
| | | | | | | | | | | | | | | | |
| Derivative Financial Instruments(a) | | | | | | | | | | | | |
Assets | | | | | | | | | | | | | | | | |
Equity Contracts | | $ | 864,132 | | | $ | — | | | $ | — | | | $ | 864,132 | |
| | | | | | | | | | | | | | | | |
| | (a) | Derivative financial instruments are swaps and futures contracts. Swaps and futures contracts are valued at the unrealized appreciation (depreciation) on the instrument. | |
See notes to financial statements.
| | |
| 20 | | 2 0 2 3 I SHARES ANNUAL REPORT TO SHAREHOLDERS |
| | |
Schedule of Investments March 31, 2023 | | iShares® Russell Top 200 Value ETF (Percentages shown are based on Net Assets) |
| | | | | | | | |
| Security | | Shares | | | Value | |
|
Common Stocks | |
|
| Aerospace & Defense — 3.1% | |
Boeing Co.(a) | | | 48,302 | | | $ | 10,260,794 | |
General Dynamics Corp. | | | 30,774 | | | | 7,022,935 | |
L3Harris Technologies, Inc. | | | 24,017 | | | | 4,713,096 | |
Northrop Grumman Corp. | | | 16,102 | | | | 7,434,615 | |
Raytheon Technologies Corp. | | | 185,976 | | | | 18,212,630 | |
| | | | | | | | |
| | |
| | | | | | | 47,644,070 | |
|
| Air Freight & Logistics — 0.6% | |
FedEx Corp. | | | 29,573 | | | | 6,757,135 | |
United Parcel Service, Inc., Class B | | | 10,045 | | | | 1,948,629 | |
| | | | | | | | |
| | |
| | | | | | | 8,705,764 | |
| | |
| Automobiles — 0.8% | | | | | | |
Ford Motor Co. | | | 498,581 | | | | 6,282,121 | |
General Motors Co. | | | 175,946 | | | | 6,453,699 | |
| | | | | | | | |
| | |
| | | | | | | 12,735,820 | |
| | |
| Banks — 7.8% | | | | | | |
Bank of America Corp. | | | 888,641 | | | | 25,415,133 | |
Citigroup, Inc. | | | 244,915 | | | | 11,484,064 | |
JPMorgan Chase & Co. | | | 369,052 | | | | 48,091,166 | |
PNC Financial Services Group, Inc. | | | 50,930 | | | | 6,473,203 | |
Truist Financial Corp. | | | 168,917 | | | | 5,760,070 | |
U.S. Bancorp | | | 174,940 | | | | 6,306,587 | |
Wells Fargo & Co. | | | 485,348 | | | | 18,142,308 | |
| | | | | | | | |
| | |
| | | | | | | 121,672,531 | |
| | |
| Beverages — 1.4% | | | | | | |
Coca-Cola Co. | | | 123,507 | | | | 7,661,139 | |
Constellation Brands, Inc., Class A | | | 19,157 | | | | 4,327,375 | |
Keurig Dr Pepper, Inc. | | | 108,421 | | | | 3,825,093 | |
Monster Beverage Corp.(a) | | | 6,989 | | | | 377,476 | |
PepsiCo, Inc. | | | 27,112 | | | | 4,942,517 | |
| | | | | | | | |
| | |
| | | | | | | 21,133,600 | |
| | |
| Biotechnology — 2.0% | | | | | | |
Amgen, Inc. | | | 10,794 | | | | 2,609,450 | |
Gilead Sciences, Inc. | | | 158,826 | | | | 13,177,793 | |
Moderna, Inc.(a) | | | 39,459 | | | | 6,060,113 | |
Regeneron Pharmaceuticals, Inc.(a) | | | 11,200 | | | | 9,202,704 | |
Vertex Pharmaceuticals, Inc.(a) | | | 1,799 | | | | 566,811 | |
| | | | | | | | |
| | |
| | | | | | | 31,616,871 | |
| | |
| Building Products — 0.3% | | | | | | |
Johnson Controls International PLC | | | 87,085 | | | | 5,244,259 | |
| | | | | | | | |
| | |
| Capital Markets — 4.8% | | | | | | |
BlackRock, Inc.(b) | | | 18,767 | | | | 12,557,375 | |
Charles Schwab Corp. | | | 85,578 | | | | 4,482,576 | |
CME Group, Inc., Class A | | | 45,371 | | | | 8,689,454 | |
Goldman Sachs Group, Inc. | | | 41,497 | | | | 13,574,084 | |
Intercontinental Exchange, Inc. | | | 69,808 | | | | 7,280,276 | |
Moody’s Corp. | | | 1,142 | | | | 349,475 | |
Morgan Stanley | | | 155,983 | | | | 13,695,307 | |
S&P Global, Inc. | | | 40,711 | | | | 14,035,931 | |
| | | | | | | | |
| | |
| | | | | | | 74,664,478 | |
| | |
| Chemicals — 2.0% | | | | | | |
Air Products & Chemicals, Inc. | | | 28,009 | | | | 8,044,465 | |
Dow, Inc. | | | 89,034 | | | | 4,880,844 | |
Ecolab, Inc. | | | 3,649 | | | | 604,019 | |
Linde PLC | | | 49,384 | | | | 17,553,049 | |
| | | | | | | | |
| | |
| | | | | | | 31,082,377 | |
|
| Commercial Services & Supplies — 0.0% | |
Waste Management, Inc. | | | 3,305 | | | | 539,277 | |
| | | | | | | | |
| | | | | | | | |
| Security | | Shares | | | Value | |
|
| Communications Equipment — 1.7% | |
Cisco Systems, Inc. | | | 519,962 | | | $ | 27,181,014 | |
| | | | | | | | |
| | |
| Consumer Finance — 1.0% | | | | | | |
American Express Co. | | | 70,532 | | | | 11,634,253 | |
Capital One Financial Corp. | | | 48,142 | | | | 4,629,335 | |
| | | | | | | | |
| | |
| | | | | | | 16,263,588 | |
|
| Consumer Staples Distribution & Retail — 2.2% | |
Target Corp. | | | 26,308 | | | | 4,357,394 | |
Walgreens Boots Alliance, Inc. | | | 90,702 | | | | 3,136,475 | |
Walmart, Inc. | | | 179,843 | | | | 26,517,851 | |
| | | | | | | | |
| | |
| | | | | | | 34,011,720 | |
|
| Diversified Telecommunication Services — 2.4% | |
AT&T Inc. | | | 905,884 | | | | 17,438,267 | |
Verizon Communications, Inc. | | | 531,789 | | | | 20,681,274 | |
| | | | | | | | |
| | |
| | | | | | | 38,119,541 | |
|
| Electric Utilities — 3.2% | |
American Electric Power Co., Inc. | | | 65,033 | | | | 5,917,353 | |
Duke Energy Corp. | | | 97,413 | | | | 9,397,432 | |
Exelon Corp. | | | 125,580 | | | | 5,260,546 | |
NextEra Energy, Inc. | | | 251,273 | | | | 19,368,123 | |
Southern Co. | | | 137,573 | | | | 9,572,329 | |
| | | | | | | | |
| | |
| | | | | | | 49,515,783 | |
|
| Electrical Equipment — 0.8% | |
Eaton Corp. PLC | | | 50,495 | | | | 8,651,813 | |
Emerson Electric Co. | | | 48,932 | | | | 4,263,935 | |
| | | | | | | | |
| | |
| | | | | | | 12,915,748 | |
|
| Energy Equipment & Services — 0.6% | |
Schlumberger NV | | | 178,692 | | | | 8,773,777 | |
| | | | | | | | |
| | |
| Entertainment — 2.6% | | | | | | |
Activision Blizzard, Inc. | | | 98,255 | | | | 8,409,645 | |
Netflix, Inc.(a) | | | 30,408 | | | | 10,505,356 | |
Walt Disney Co.(a) | | | 215,091 | | | | 21,537,062 | |
| | | | | | | | |
| | |
| | | | | | | 40,452,063 | |
|
| Financial Services — 6.1% | |
Berkshire Hathaway, Inc., Class B(a) | | | 228,268 | | | | 70,482,310 | |
Block, Inc., Class A(a) | | | 67,782 | | | | 4,653,234 | |
Fidelity National Information Services, Inc. | | | 74,909 | | | | 4,069,806 | |
Fiserv, Inc.(a) | | | 67,700 | | | | 7,652,131 | |
PayPal Holdings, Inc.(a) | | | 99,787 | | | | 7,577,825 | |
| | | | | | | | |
| | |
| | | | | | | 94,435,306 | |
| | |
| Food Products — 1.8% | | | | | | |
Archer-Daniels-Midland Co. | | | 69,145 | | | | 5,508,091 | |
General Mills, Inc. | | | 74,581 | | | | 6,373,692 | |
Kraft Heinz Co. | | | 88,356 | | | | 3,416,726 | |
Mondelez International, Inc., Class A | | | 172,500 | | | | 12,026,700 | |
| | | | | | | | |
| | |
| | | | | | | 27,325,209 | |
|
| Ground Transportation — 0.8% | |
CSX Corp. | | | 198,758 | | | | 5,950,815 | |
Norfolk Southern Corp. | | | 28,752 | | | | 6,095,424 | |
Uber Technologies, Inc.(a) | | | 32,440 | | | | 1,028,348 | |
| | | | | | | | |
| | |
| | | | | | | 13,074,587 | |
|
| Health Care Equipment & Supplies — 4.1% | |
Abbott Laboratories | | | 188,321 | | | | 19,069,385 | |
Baxter International, Inc. | | | 53,934 | | | | 2,187,563 | |
Becton Dickinson & Co. | | | 35,923 | | | | 8,892,379 | |
Boston Scientific Corp.(a) | | | 180,521 | | | | 9,031,466 | |
GE HealthCare Technologies, Inc.(a)(c) | | | 43,701 | | | | 3,584,793 | |
Intuitive Surgical, Inc.(a) | | | 3,521 | | | | 899,510 | |
| | |
SCHEDULES OF INVESTMENTS | | 21 |
| | |
Schedule of Investments (continued) March 31, 2023 | | iShares® Russell Top 200 Value ETF (Percentages shown are based on Net Assets) |
| | | | | | | | |
| Security | | Shares | | | Value | |
|
| Health Care Equipment & Supplies (continued) | |
Medtronic PLC | | | 169,110 | | | $ | 13,633,648 | |
Stryker Corp. | | | 20,669 | | | | 5,900,379 | |
| | | | | | | | |
| | |
| | | | | | | 63,199,123 | |
|
| Health Care Providers & Services — 3.4% | |
Centene Corp.(a) | | | 69,262 | | | | 4,378,051 | |
Cigna Group | | | 31,179 | | | | 7,967,170 | |
CVS Health Corp. | | | 162,412 | | | | 12,068,836 | |
Elevance Health, Inc. | | | 21,229 | | | | 9,761,307 | |
HCA Healthcare, Inc. | | | 25,630 | | | | 6,758,118 | |
Humana, Inc. | | | 4,701 | | | | 2,282,147 | |
McKesson Corp. | | | 13,934 | | | | 4,961,201 | |
UnitedHealth Group, Inc. | | | 10,651 | | | | 5,033,556 | |
| | | | | | | | |
| | |
| | | | | | | 53,210,386 | |
|
| Hotels, Restaurants & Leisure — 1.9% | |
McDonald’s Corp. | | | 70,783 | | | | 19,791,635 | |
Starbucks Corp. | | | 92,854 | | | | 9,668,887 | |
| | | | | | | | |
| | |
| | | | | | | 29,460,522 | |
| | |
| Household Products — 2.0% | | | | | | |
Colgate-Palmolive Co. | | | 40,403 | | | | 3,036,285 | |
Kimberly-Clark Corp. | | | 17,383 | | | | 2,333,146 | |
Procter & Gamble Co. | | | 171,434 | | | | 25,490,522 | |
| | | | | | | | |
| | |
| | | | | | | 30,859,953 | |
|
| Industrial Conglomerates — 2.0% | |
3M Co. | | | 69,745 | | | | 7,330,897 | |
General Electric Co.(c) | | | 129,442 | | | | 12,374,655 | |
Honeywell International, Inc. | | | 60,200 | | | | 11,505,424 | |
| | | | | | | | |
| | |
| | | | | | | 31,210,976 | |
| | |
| Industrial REITs — 0.9% | | | | | | |
Prologis, Inc. | | | 116,469 | | | | 14,531,837 | |
| | | | | | | | |
| | |
| Insurance — 1.8% | | | | | | |
American International Group, Inc. | | | 93,933 | | | | 4,730,466 | |
Aon PLC, Class A | | | 1,536 | | | | 484,286 | |
Chubb Ltd. | | | 52,580 | | | | 10,209,984 | |
Marsh & McLennan Cos., Inc. | | | 6,675 | | | | 1,111,721 | |
MetLife, Inc. | | | 83,563 | | | | 4,841,640 | |
Progressive Corp. | | | 9,583 | | | | 1,370,944 | |
Travelers Cos., Inc. | | | 29,584 | | | | 5,070,994 | |
| | | | | | | | |
| | |
| | | | | | | 27,820,035 | |
|
| Interactive Media & Services — 4.2% | |
Alphabet, Inc., Class A(a) | | | 98,941 | | | | 10,263,150 | |
Alphabet, Inc., Class C, NVS(a) | | | 86,042 | | | | 8,948,368 | |
Meta Platforms, Inc., Class A(a) | | | 221,577 | | | | 46,961,029 | |
| | | | | | | | |
| | |
| | | | | | | 66,172,547 | |
| | |
| IT Services — 0.6% | | | | | | |
Cognizant Technology Solutions Corp., Class A | | | 64,879 | | | | 3,953,077 | |
International Business Machines Corp. | | | 37,802 | | | | 4,955,464 | |
Snowflake, Inc., Class A(a) | | | 2,475 | | | | 381,868 | |
| | | | | | | | |
| | |
| | | | | | | 9,290,409 | |
|
| Life Sciences Tools & Services — 3.1% | |
Danaher Corp. | | | 76,334 | | | | 19,239,221 | |
Illumina, Inc.(a)(c) | | | 19,872 | | | | 4,621,234 | |
Thermo Fisher Scientific, Inc. | | | 43,466 | | | | 25,052,498 | |
| | | | | | | | |
| | |
| | | | | | | 48,912,953 | |
| | |
| Machinery — 0.2% | | | | | | |
Caterpillar, Inc. | | | 8,479 | | | | 1,940,334 | |
Illinois Tool Works, Inc. | | | 3,939 | | | | 958,950 | |
| | | | | | | | |
| | |
| | | | | | | 2,899,284 | |
| | | | | | | | |
| Security | | Shares | | | Value | |
| | |
| Media — 1.3% | | | | | | |
Comcast Corp., Class A | | | 529,271 | | | $ | 20,064,664 | |
| | | | | | | | |
| | |
| Metals & Mining — 0.8% | | | | | | |
Freeport-McMoRan, Inc. | | | 180,299 | | | | 7,376,032 | |
Newmont Corp. | | | 100,480 | | | | 4,925,530 | |
Southern Copper Corp. | | | 3,690 | | | | 281,362 | |
| | | | | | | | |
| | |
| | | | | | | 12,582,924 | |
| | |
| Multi-Utilities — 0.8% | | | | | | |
Dominion Energy, Inc. | | | 105,284 | | | | 5,886,428 | |
Sempra Energy | | | 39,791 | | | | 6,014,808 | |
| | | | | | | | |
| | |
| | | | | | | 11,901,236 | |
|
| Oil, Gas & Consumable Fuels — 8.8% | |
Chevron Corp. | | | 244,705 | | | | 39,926,068 | |
ConocoPhillips | | | 154,893 | | | | 15,366,935 | |
EOG Resources, Inc. | | | 20,002 | | | | 2,292,829 | |
Exxon Mobil Corp. | | | 521,413 | | | | 57,178,150 | |
Kinder Morgan, Inc. | | | 251,243 | | | | 4,399,265 | |
Marathon Petroleum Corp. | | | 57,336 | | | | 7,730,613 | |
Occidental Petroleum Corp. | | | 17,654 | | | | 1,102,139 | |
Pioneer Natural Resources Co. | | | 13,527 | | | | 2,762,754 | |
Valero Energy Corp. | | | 48,500 | | | | 6,770,600 | |
| | | | | | | | |
| | |
| | | | | | | 137,529,353 | |
| | |
| Pharmaceuticals — 8.1% | | | | | | |
Bristol-Myers Squibb Co. | | | 269,462 | | | | 18,676,411 | |
Eli Lilly & Co. | | | 19,830 | | | | 6,810,019 | |
Johnson & Johnson | | | 332,989 | | | | 51,613,295 | |
Merck & Co., Inc. | | | 185,963 | | | | 19,784,603 | |
Pfizer, Inc. | | | 715,120 | | | | 29,176,896 | |
| | | | | | | | |
| | |
| | | | | | | 126,061,224 | |
| | |
| Professional Services — 0.1% | | | | | | |
Automatic Data Processing, Inc. | | | 4,349 | | | | 968,218 | |
| | | | | | | | |
|
| Semiconductors & Semiconductor Equipment — 3.2% | |
Advanced Micro Devices, Inc.(a) | | | 43,324 | | | | 4,246,185 | |
Analog Devices, Inc. | | | 51,109 | | | | 10,079,717 | |
Intel Corp. | | | 523,844 | | | | 17,113,983 | |
Marvell Technology, Inc. | | | 107,289 | | | | 4,645,614 | |
Micron Technology, Inc. | | | 111,406 | | | | 6,722,238 | |
Texas Instruments, Inc. | | | 36,167 | | | | 6,727,424 | |
| | | | | | | | |
| | |
| | | | | | | 49,535,161 | |
| | |
| Software — 2.1% | | | | | | |
Oracle Corp. | | | 60,534 | | | | 5,624,819 | |
Roper Technologies, Inc. | | | 13,352 | | | | 5,884,093 | |
Salesforce, Inc.(a) | | | 95,709 | | | | 19,120,744 | |
VMware, Inc., Class A(a) | | | 13,915 | | | | 1,737,288 | |
| | | | | | | | |
| | |
| | | | | | | 32,366,944 | |
| | |
| Specialized REITs — 0.6% | | | | | | |
American Tower Corp. | | | 13,656 | | | | 2,790,467 | |
Digital Realty Trust, Inc. | | | 36,267 | | | | 3,565,409 | |
Equinix, Inc. | | | 2,865 | | | | 2,065,779 | |
Public Storage | | | 4,093 | | | | 1,236,659 | |
| | | | | | | | |
| | |
| | | | | | | 9,658,314 | |
| | |
| Specialty Retail — 1.2% | | | | | | |
Home Depot, Inc. | | | 54,156 | | | | 15,982,519 | |
Lowe’s Cos., Inc. | | | 10,533 | | | | 2,106,284 | |
| | | | | | | | |
| | |
| | | | | | | 18,088,803 | |
| | |
| Tobacco — 1.9% | | | | | | |
Altria Group, Inc. | | | 226,829 | | | | 10,121,110 | |
Philip Morris International, Inc. | | | 196,060 | | | | 19,066,835 | |
| | | | | | | | |
| | |
| | | | | | | 29,187,945 | |
| | |
| 22 | | 2 0 2 3 I SHARES ANNUAL REPORT TO SHAREHOLDERS |
| | |
Schedule of Investments (continued) March 31, 2023 | | iShares® Russell Top 200 Value ETF (Percentages shown are based on Net Assets) |
| | | | | | | | |
| Security | | Shares | | | Value | |
|
| Wireless Telecommunication Services — 0.7% | |
T-Mobile U.S., Inc.(a) | | | 74,196 | | | $ | 10,746,549 | |
| | | | | | | | |
| |
Total Long-Term Investments — 99.8%
(Cost: $1,519,302,827) | | | | 1,553,366,743 | |
| | | | | | | | |
| | |
| Short-Term Securities | | | | | | |
| | |
| Money Market Funds — 0.4% | | | | | | |
BlackRock Cash Funds: Institutional, SL Agency Shares, 5.01%(b)(d)(e) | | | 4,045,677 | | | | 4,046,890 | |
BlackRock Cash Funds: Treasury, SL Agency Shares, 4.73%(b)(d) | | | 2,378,970 | | | | 2,378,970 | |
| | | | | | | | |
| |
Total Short-Term Securities — 0.4%
(Cost: $6,426,265) | | | | 6,425,860 | |
| | | | | | | | |
| |
Total Investments — 100.2%
(Cost: $1,525,729,092) | | | | 1,559,792,603 | |
| |
Liabilities in Excess of Other Assets — (0.2)% | | | | (2,634,806 | ) |
| | | | | | | | |
| |
Net Assets — 100.0% | | | $ | 1,557,157,797 | |
| | | | | | | | |
| (a) | Non-income producing security. |
| (b) | Affiliate of the Fund. |
| (c) | All or a portion of this security is on loan. |
| (d) | Annualized 7-day yield as of period end. |
| (e) | All or a portion of this security was purchased with the cash collateral from loaned securities. |
Affiliates
Investments in issuers considered to be affiliate(s) of the Fund during the year ended March 31, 2023 for purposes of Section 2(a)(3) of the Investment Company Act of 1940, as amended, were as follows:
| | | | | | | | | | | | | | | | | | | | | | | | | | | | | | | | | | | | |
| |
| Affiliated Issuer | | Value at
03/31/22 | | | Purchases
at Cost | | | Proceeds
from Sale | | | Net
Realized Gain (Loss) | | | Change in
Unrealized
Appreciation (Depreciation) | | | Value at
03/31/23 | | | Shares
Held at
03/31/23 | | | Income | | | Capital Gain
Distributions
from Underlying
Funds | |
| |
BlackRock Cash Funds: Institutional, SL Agency Shares | | $ | 1,178,770 | | | $ | 2,864,748 | (a) | | $ | — | | | $ | 3,581 | | | $ | (209 | ) | | $ | 4,046,890 | | | | 4,045,677 | | | $ | 20,889 | (b) | | $ | — | |
BlackRock Cash Funds: Treasury, SL Agency Shares | | | 1,740,000 | | | | 638,970 | (a) | | | — | | | | — | | | | — | | | | 2,378,970 | | | | 2,378,970 | | | | 67,630 | | | | 1 | |
BlackRock, Inc. | | | 10,349,918 | | | | 6,069,609 | | | | (3,235,512 | ) | | | 1,461,494 | | | | (2,088,134 | ) | | | 12,557,375 | | | | 18,767 | | | | 342,900 | | | | — | |
| | | | | | | | | | | | | | | | | | | | | | | | | | | | | | | | | | | | |
| | | | | | | | | |
| | | | | | | | | | | | | | $ | 1,465,075 | | | $ | (2,088,343 | ) | | $ | 18,983,235 | | | | | | | $ | 431,419 | | | $ | 1 | |
| | | | | | | | | | | | | | | | | | | | | | | | | | | | | | | | | | | | |
| | (a) | Represents net amount purchased (sold). | |
| | (b) | All or a portion represents securities lending income earned from the reinvestment of cash collateral from loaned securities, net of fees and collateral investment expenses, and other payments to and from borrowers of securities. | |
Derivative Financial Instruments Outstanding as of Period End
Futures Contracts
| | | | | | | | | | | | | | | | |
| |
| Description | | Number of
Contracts | | | Expiration
Date | | | Notional
Amount
(000) | | | Value/
Unrealized
Appreciation
(Depreciation) | |
| |
Long Contracts | | | | | | | | | | | | | | | | |
E-Mini Consumer Staples Select Sector Index | | | 7 | | | | 06/16/23 | | | $ | 530 | | | $ | 20,523 | |
E-Mini Dow Jones Industrial Average Index | | | 10 | | | | 06/16/23 | | | | 1,673 | | | | 63,446 | |
E-Mini Financials Select Sector Index | | | 12 | | | | 06/16/23 | | | | 1,198 | | | | (5,704 | ) |
| | | | | | | | | | | | | | | | |
| | | | |
| | | | | | | | | | | | | | $ | 78,265 | |
| | | | | | | | | | | | | | | | |
| | |
SCHEDULES OF INVESTMENTS | | 23 |
| | |
Schedule of Investments (continued) March 31, 2023 | | iShares® Russell Top 200 Value ETF |
Derivative Financial Instruments Categorized by Risk Exposure
As of period end, the fair values of derivative financial instruments located in the Statements of Assets and Liabilities were as follows:
| | | | | | | | | | | | | | | | | | | | | | | | | | | | |
| |
| | | Commodity
Contracts | | | Credit
Contracts | | | Equity
Contracts | | | Foreign
Currency
Exchange
Contracts | | | Interest
Rate
Contracts | | | Other
Contracts | | | Total | |
| |
Assets — Derivative Financial Instruments | | | | | | | | | | | | | | | | | | | | | | | | | | | | |
Futures contracts | | | | | | | | | | | | | | | | | | | | | | | | | | | | |
Unrealized appreciation on futures contracts(a) | | $ | — | | | $ | — | | | $ | 78,265 | | | $ | — | | | $ | — | | | $ | — | | | $ | 78,265 | |
| | | | | | | | | | | | | | | | | | | | | | | | | | | | |
| | (a) | Net cumulative unrealized appreciation (depreciation) on futures contracts, if any, are reported in the Schedule of Investments. In the Statements of Assets and Liabilities, only current day’s variation margin is reported in receivables or payables and the net cumulative unrealized appreciation (depreciation) is included in accumulated earnings (loss). | |
For the period ended March 31, 2023, the effect of derivative financial instruments in the Statements of Operations was as follows:
| | | | | | | | | | | | | | | | | | | | | | | | | | | | |
| |
| | | Commodity
Contracts | | | Credit
Contracts | | | Equity
Contracts | | | Foreign
Currency
Exchange
Contracts | | | Interest
Rate
Contracts | | | Other
Contracts | | | Total | |
| |
Net Realized Gain (Loss) from | | | | | | | | | | | | | | | | | | | | | | | | | | | | |
Futures contracts | | $ | — | | | $ | — | | | $ | (242,914 | ) | | $ | — | | | $ | — | | | $ | — | | | $ | (242,914 | ) |
| | | | | | | | | | | | | | | | | | | | | | | | | | | | |
| | | | | | | |
Net Change in Unrealized Appreciation (Depreciation) on | | | | | | | | | | | | | | | | | | | | | | | | | | | | |
Futures contracts | | $ | — | | | $ | — | | | $ | (17,865 | ) | | $ | — | | | $ | — | | | $ | — | | | $ | (17,865 | ) |
| | | | | | | | | | | | | | | | | | | | | | | | | | | | |
Average Quarterly Balances of Outstanding Derivative Financial Instruments
| | | | |
| |
Futures contracts | | | | |
Average notional value of contracts — long | | $ | 3,126,066 | |
| |
For more information about the Fund’s investment risks regarding derivative financial instruments, refer to the Notes to Financial Statements.
Fair Value Hierarchy as of Period End
Various inputs are used in determining the fair value of financial instruments. For a description of the input levels and information about the Fund’s policy regarding valuation of financial instruments, refer to the Notes to Financial Statements.
The following table summarizes the Fund’s financial instruments categorized in the fair value hierarchy. The breakdown of the Fund’s financial instruments into major categories is disclosed in the Schedule of Investments above.
| | | | | | | | | | | | | | | | |
| |
| | | Level 1 | | | Level 2 | | | Level 3 | | | Total | |
| |
Assets | | | | | | | | | | | | | | | | |
Investments | | | | | | | | | | | | | | | | |
Long-Term Investments | | | | | | | | | | | | | | | | |
Common Stocks | | $ | 1,553,366,743 | | | $ | — | | | $ | — | | | $ | 1,553,366,743 | |
Short-Term Securities | | | | | | | | | | | | | | | | |
Money Market Funds | | | 6,425,860 | | | | — | | | | — | | | | 6,425,860 | |
| | | | | | | | | | | | | | | | |
| | | | |
| | $ | 1,559,792,603 | | | $ | — | | | $ | — | | | $ | 1,559,792,603 | |
| | | | | | | | | | | | | | | | |
Derivative Financial Instruments(a) | | | | | | | | | | | | | | | | |
Assets | | | | | | | | | | | | | | | | |
Equity Contracts | | $ | 78,265 | | | $ | — | | | $ | — | | | $ | 78,265 | |
| | | | | | | | | | | | | | | | |
| (a) | Derivative financial instruments are futures contracts. Futures contracts are valued at the unrealized appreciation (depreciation) on the instrument. | |
See notes to financial statements.
| | |
| 24 | | 2 0 2 3 I SHARES ANNUAL REPORT TO SHAREHOLDERS |
Statements of Assets and Liabilities
March 31, 2023
| | | | | | | | | | | | |
| | | iShares Russell Top
200 ETF | | | iShares Russell Top 200
Growth ETF | | | iShares Russell Top 200
Value ETF | |
| | | |
ASSETS | | | | | | | | | | | | |
| | | |
Investments, at value — unaffiliated(a)(b) | | $ | 798,925,800 | | | $ | 5,925,093,989 | | | $ | 1,540,809,368 | |
| | | |
Investments, at value — affiliated(c) | | | 5,628,693 | | | | 48,017,427 | | | | 18,983,235 | |
| | | |
Cash | | | 16 | | | | 6 | | | | 8 | |
| | | |
Cash pledged: | | | | | | | | | | | | |
| | | |
Futures contracts | | | 80,000 | | | | 549,000 | | | | 195,000 | |
| | | |
Receivables: | | | | | | | | | | | | |
| | | |
Investments sold | | | 5,503,133 | | | | 24,347,976 | | | | 7,643,465 | |
| | | |
Securities lending income — affiliated | | | 2,114 | | | | 13,684 | | | | 1,156 | |
| | | |
Dividends — unaffiliated | | | 483,266 | | | | 1,661,329 | | | | 1,521,554 | |
| | | |
Dividends — affiliated | | | 4,774 | | | | 30,823 | | | | 10,440 | |
| | | |
Variation margin on futures contracts | | | 20,212 | | | | 138,475 | | | | 37,820 | |
| | | | | | | | | | | | |
| | | |
Total assets | | | 810,648,008 | | | | 5,999,852,709 | | | | 1,569,202,046 | |
| | | | | | | | | | | | |
| | | |
LIABILITIES | | | | | | | | | | | | |
| | | |
Collateral on securities loaned | | | 1,635,740 | | | | 40,052,275 | | | | 4,047,421 | |
| | | |
Payables: | | | | | | | | | | | | |
| | | |
Investments purchased | | | 5,503,133 | | | | 17,409,698 | | | | 1,260,816 | |
| | | |
Capital shares redeemed | | | — | | | | 6,949,122 | | | | 6,477,941 | |
| | | |
Investment advisory fees | | | 101,918 | | | | 890,426 | | | | 258,071 | |
| | | | | | | | | | | | |
| | | |
Total liabilities | | | 7,240,791 | | | | 65,301,521 | | | | 12,044,249 | |
| | | | | | | | | | | | |
| | | |
NET ASSETS | | $ | 803,407,217 | | | $ | 5,934,551,188 | | | $ | 1,557,157,797 | |
| | | | | | | | | | | | |
| | | |
NET ASSETS CONSIST OF: | | | | | | | | | | | | |
| | | |
Paid-in capital | | $ | 830,227,631 | | | $ | 5,599,406,434 | | | $ | 1,578,914,692 | |
| | | |
Accumulated earnings (loss) | | | (26,820,414 | ) | | | 335,144,754 | | | | (21,756,895 | ) |
| | | | | | | | | | | | |
| | | |
NET ASSETS | | $ | 803,407,217 | | | $ | 5,934,551,188 | | | $ | 1,557,157,797 | |
| | | | | | | | | | | | |
| | | |
NET ASSET VALUE | | | | | | | | | | | | |
| | | |
Shares outstanding | | | 8,250,000 | | | | 42,700,000 | | | | 23,900,000 | |
| | | | | | | | | | | | |
| | | |
Net asset value | | $ | 97.38 | | | $ | 138.98 | | | $ | 65.15 | |
| | | | | | | | | | | | |
| | | |
Shares authorized | | | Unlimited | | | | Unlimited | | | | Unlimited | |
| | | | | | | | | | | | |
| | | |
Par value | | | None | | | | None | | | | None | |
| | | | | | | | | | | | |
| | | |
(a) Investments, at cost — unaffiliated | | $ | 799,336,182 | | | $ | 5,293,935,887 | | | $ | 1,506,496,444 | |
(b) Securities loaned, at value | | $ | 1,658,841 | | | $ | 39,687,747 | | | $ | 4,065,098 | |
(c) Investments, at cost — affiliated | | $ | 5,762,940 | | | $ | 48,011,243 | | | $ | 19,232,648 | |
See notes to financial statements.
Statements of Operations
Year Ended March 31, 2023
| | | | | | | | | | | | |
| | | iShares Russell Top 200 ETF | | | iShares Russell Top 200
Growth ETF | | | iShares Russell Top 200
Value ETF | |
| | | |
INVESTMENT INCOME | | | | | | | | | | | | |
| | | |
Dividends — unaffiliated | | $ | 14,324,281 | | | $ | 49,206,170 | | | $ | 33,156,969 | |
| | | |
Dividends — affiliated | | | 33,759 | | | | 194,167 | | | | 410,530 | |
| | | |
Securities lending income — affiliated — net | | | 14,072 | | | | 120,319 | | | | 20,889 | |
| | | |
Foreign taxes withheld | | | (1,106 | ) | | | (3,089 | ) | | | (2,692 | ) |
| | | | | | | | | | | | |
| | | |
Total investment income | | | 14,371,006 | | | | 49,517,567 | | | | 33,585,696 | |
| | | | | | | | | | | | |
| | | |
EXPENSES | | | | | | | | | | | | |
| | | |
Investment advisory | | | 1,297,201 | | | | 9,252,268 | | | | 2,834,991 | |
| | | | | | | | | | | | |
| | | |
Total expenses | | | 1,297,201 | | | | 9,252,268 | | | | 2,834,991 | |
| | | | | | | | | | | | |
| | | |
Net investment income | | | 13,073,805 | | | | 40,265,299 | | | | 30,750,705 | |
| | | | | | | | | | | | |
| | | |
REALIZED AND UNREALIZED GAIN (LOSS) | | | | | | | | | | | | |
| | | |
Net realized gain (loss) from: | | | | | | | | | | | | |
| | | |
Investments — unaffiliated | | | (13,069,815 | ) | | | (204,641,431 | ) | | | (9,802,597 | ) |
| | | |
Investments — affiliated | | | 349,417 | | | | 37,894 | | | | 707,490 | |
| | | |
Capital gain distributions from underlying funds — affiliated | | | 1 | | | | 4 | | | | 1 | |
| | | |
Futures contracts | | | (230,224 | ) | | | (319,077 | ) | | | (242,914 | ) |
| | | |
In-kind redemptions — unaffiliated(a) | | | 122,912,619 | | | | 369,469,630 | | | | 85,011,908 | |
| | | |
In-kind redemptions — affiliated(a) | | | 360,012 | | | | — | | | | 757,585 | |
| | | | | | | | | | | | |
| | | |
| | | 110,322,010 | | | | 164,547,020 | | | | 76,431,473 | |
| | | | | | | | | | | | |
| | | |
Net change in unrealized appreciation (depreciation) on: | | | | | | | | | | | | |
| | | |
Investments — unaffiliated | | | (213,619,201 | ) | | | (696,040,165 | ) | | | (167,264,399 | ) |
| | | |
Investments — affiliated | | | (795,136 | ) | | | 4,990 | | | | (2,088,343 | ) |
| | | |
Futures contracts | | | (13,507 | ) | | | 361,996 | | | | (17,865 | ) |
| | | | | | | | | | | | |
| | | |
| | | (214,427,844 | ) | | | (695,673,179 | ) | | | (169,370,607 | ) |
| | | | | | | | | | | | |
| | | |
Net realized and unrealized loss | | | (104,105,834 | ) | | | (531,126,159 | ) | | | (92,939,134 | ) |
| | | | | | | | | | | | |
| | | |
NET DECREASE IN NET ASSETS RESULTING FROM OPERATIONS | | $ | (91,032,029 | ) | | $ | (490,860,860 | ) | | $ | (62,188,429 | ) |
| | | | | | | | | | | | |
| (a) | See Note 2 of the Notes to Financial Statements. | |
See notes to financial statements.
| | |
| 26 | | 2 0 2 3 I SHARES ANNUAL REPORT TO SHAREHOLDERS |
Statements of Changes in Net Assets
| | | | | | | | | | | | | | | | | | | | |
| | | iShares Russell Top 200 ETF | | | | | | iShares Russell Top 200 Growth ETF | |
| | | Year Ended 03/31/23 | | | Year Ended 03/31/22 | | | | | | Year Ended 03/31/23 | | | Year Ended 03/31/22 | |
| | | | | |
INCREASE (DECREASE) IN NET ASSETS | | | | | | | | | | | | | | | | | | | | |
| | | | | |
OPERATIONS | | | | | | | | | | | | | | | | | | | | |
Net investment income | | $ | 13,073,805 | | | $ | 11,557,048 | | | | | | | $ | 40,265,299 | | | $ | 24,224,459 | |
Net realized gain | | | 110,322,010 | | | | 88,803,279 | | | | | | | | 164,547,020 | | | | 438,653,331 | |
Net change in unrealized appreciation (depreciation) | | | (214,427,844 | ) | | | 31,330,490 | | | | | | | | (695,673,179 | ) | | | 169,212,054 | |
| | | | | | | | | | | | | | | | | | | | |
| | | | | |
Net increase (decrease) in net assets resulting from operations | | | (91,032,029 | ) | | | 131,690,817 | | | | | | | | (490,860,860 | ) | | | 632,089,844 | |
| | | | | | | | | | | | | | | | | | | | |
| | | | | |
DISTRIBUTIONS TO SHAREHOLDERS(a) | | | | | | | | | | | | | | | | | | | | |
Decrease in net assets resulting from distributions to shareholders | | | (12,861,101 | ) | | | (11,546,241 | ) | | | | | | | (40,613,805 | ) | | | (24,456,769 | ) |
| | | | | | | | | | | | | | | | | | | | |
| | | | | |
CAPITAL SHARE TRANSACTIONS | | | | | | | | | | | | | | | | | | | | |
Net increase (decrease) in net assets derived from capital share transactions | | | (134,788,881 | ) | | | 56,024,466 | | | | | | | | 1,645,653,871 | | | | 682,843,598 | |
| | | | | | | | | | | | | | | | | | | | |
| | | | | |
NET ASSETS | | | | | | | | | | | | | | | | | | | | |
| | | | | |
Total increase (decrease) in net assets | | | (238,682,011 | ) | | | 176,169,042 | | | | | | | | 1,114,179,206 | | | | 1,290,476,673 | |
| | | | | |
Beginning of year | | | 1,042,089,228 | | | | 865,920,186 | | | | | | | | 4,820,371,982 | | | | 3,529,895,309 | |
| | | | | | | | | | | | | | | | | | | | |
| | | | | |
End of year | | $ | 803,407,217 | | | $ | 1,042,089,228 | | | | | | | $ | 5,934,551,188 | | | $ | 4,820,371,982 | |
| | | | | | | | | | | | | | | | | | | | |
| (a) | Distributions for annual periods determined in accordance with U.S. federal income tax regulations. | |
See notes to financial statements.
Statements of Changes in Net Assets (continued)
| | | | | | | | | | | | |
| | | iShares Russell Top 200 Value ETF | |
| |
| Year Ended
03/31/23 |
| | | | | |
| Year Ended
03/31/22 |
|
| |
| | | |
INCREASE (DECREASE) IN NET ASSETS | | | | | | | | | | | | |
| | | |
OPERATIONS | | | | | | | | | | | | |
Net investment income | | $ | 30,750,705 | | | | | | | $ | 22,977,803 | |
Net realized gain | | | 76,431,473 | | | | | | | | 132,334,923 | |
Net change in unrealized appreciation (depreciation) | | | (169,370,607 | ) | | | | | | | (24,705,658 | ) |
| | | | | | | | | | | | |
| | | |
Net increase (decrease) in net assets resulting from operations | | | (62,188,429 | ) | | | | | | | 130,607,068 | |
| | | | | | | | | | | | |
| | | |
DISTRIBUTIONS TO SHAREHOLDERS(a) | | | | | | | | | | | | |
Decrease in net assets resulting from distributions to shareholders | | | (30,093,801 | ) | | | | | | | (22,928,866 | ) |
| | | | | | | | | | | | |
| | | |
CAPITAL SHARE TRANSACTIONS | | | | | | | | | | | | |
Net increase in net assets derived from capital share transactions | | | 361,717,362 | | | | | | | | 26,107,292 | |
| | | | | | | | | | | | |
| | | |
NET ASSETS | | | | | | | | | | | | |
Total increase in net assets | | | 269,435,132 | | | | | | | | 133,785,494 | |
Beginning of year | | | 1,287,722,665 | | | | | | | | 1,153,937,171 | |
| | | | | | | | | | | | |
| | | |
End of year | | $ | 1,557,157,797 | | | | | | | $ | 1,287,722,665 | |
| | | | | | | | | | | | |
| (a) | Distributions for annual periods determined in accordance with U.S. federal income tax regulations. |
See notes to financial statements.
| | |
| 28 | | 2 0 2 3 I SHARES ANNUAL REPORT TO SHAREHOLDERS |
Financial Highlights
(For a share outstanding throughout each period)
| | | | | | | | | | | | | | | | | | | | |
| | | iShares Russell Top 200 ETF | |
| | | | |
| | | | | |
| |
| Year Ended
03/31/23 |
| |
| Year Ended
03/31/22 |
| |
| Year Ended
03/31/21 |
| |
| Year Ended
03/31/20 |
| |
| Year Ended
03/31/19 |
|
| |
| | | | | |
Net asset value, beginning of year | | $ | 107.99 | | | $ | 94.64 | | | $ | 61.54 | | | $ | 65.66 | | | $ | 60.63 | |
| | | | | | | | | | | | | | | | | | | | |
Net investment income(a) | | | 1.42 | | | | 1.26 | | | | 1.23 | | | | 1.28 | | | | 1.21 | |
Net realized and unrealized gain(b) | | | (10.59 | ) | | | 13.37 | | | | 33.09 | | | | (3.94 | ) | | | 4.97 | |
| | | | | | | | | | | | | | | | | | | | |
| | | | | |
Net increase from investment operations | | | (9.17 | ) | | | 14.63 | | | | 34.32 | | | | (2.66 | ) | | | 6.18 | |
| | | | | | | | | | | | | | | | | | | | |
| | | | | |
Distributions from net investment income(c) | | | (1.44 | ) | | | (1.28 | ) | | | (1.22 | ) | | | (1.46 | ) | | | (1.15 | ) |
| | | | | | | | | | | | | | | | | | | | |
| | | | | |
Net asset value, end of year | | $ | 97.38 | | | $ | 107.99 | | | $ | 94.64 | | | $ | 61.54 | | | $ | 65.66 | |
| | | | | | | | | | | | | | | | | | | | |
| | | | | |
Total Return(d) | | | | | | | | | | | | | | | | | | | | |
Based on net asset value | | | (8.41 | )% | | | 15.48 | % | | | 56.06 | % | | | (4.24 | )% | | | 10.27 | % |
| | | | | | | | | | | | | | | | | | | | |
| | | | | |
Ratios to Average Net Assets(e) | | | | | | | | | | | | | | | | | | | | |
Total expenses | | | 0.15 | % | | | 0.15 | % | | | 0.15 | % | | | 0.15 | % | | | 0.15 | % |
| | | | | | | | | | | | | | | | | | | | |
| | | | | |
Net investment income | | | 1.51 | % | | | 1.20 | % | | | 1.48 | % | | | 1.82 | % | | | 1.91 | % |
| | | | | | | | | | | | | | | | | | | | |
| | | | | |
Supplemental Data | | | | | | | | | | | | | | | | | | | | |
Net assets, end of year (000) | | $ | 803,407 | | | $
|
1,042,089 |
| | $ | 865,920 | | | $ | 369,243 | | | $ | 213,382 | |
| | | | | | | | | | | | | | | | | | | | |
| | | | | |
Portfolio turnover rate(f) | | | 5 | % | | | 4 | % | | | 5 | % | | | 5 | % | | | 5 | % |
| | | | | | | | | | | | | | | | | | | | |
| (a) | Based on average shares outstanding. |
| (b) | The amounts reported for a share outstanding may not accord with the change in aggregate gains and losses in securities for the fiscal period due to the timing of capital share transactions in relation to the fluctuating market values of the Fund’s underlying securities. |
| (c) | Distributions for annual periods determined in accordance with U.S. federal income tax regulations. |
| (d) | Where applicable, assumes the reinvestment of distributions. |
| (e) | Excludes fees and expenses incurred indirectly as a result of investments in underlying funds. |
| (f) | Portfolio turnover rate excludes in-kind transactions. |
See notes to financial statements.
Financial Highlights
(For a share outstanding throughout each period)
| | | | | | | | | | | | | | | | | | | | |
| | | iShares Russell Top 200 Growth ETF | |
| | | | |
| | | | | |
| |
| Year Ended
03/31/23 |
| |
| Year Ended
03/31/22 |
| |
| Year Ended
03/31/21 |
| |
| Year Ended
03/31/20 |
| |
| Year Ended
03/31/19 |
|
| |
| | | | | |
Net asset value, beginning of year | | $ | 158.56 | | | $ | 134.47 | | | $ | 84.14 | | | $ | 82.24 | | | $ | 73.61 | |
| | | | | | | | | | | | | | | | | | | | |
Net investment income(a) | | | 1.14 | | | | 0.89 | | | | 0.93 | | | | 1.04 | | | | 1.00 | |
Net realized and unrealized gain(b) | | | (19.62 | ) | | | 24.09 | | | | 50.31 | | | | 1.90 | | | | 8.60 | |
| | | | | | | | | | | | | | | | | | | | |
| | | | | |
Net increase from investment operations | | | (18.48 | ) | | | 24.98 | | | | 51.24 | | | | 2.94 | | | | 9.60 | |
| | | | | | | | | | | | | | | | | | | | |
| | | | | |
Distributions from net investment income(c) | | | (1.10 | ) | | | (0.89 | ) | | | (0.91 | ) | | | (1.04 | ) | | | (0.97 | ) |
| | | | | | | | | | | | | | | | | | | | |
| | | | | |
Net asset value, end of year | | $ | 138.98 | | | $ | 158.56 | | | $ | 134.47 | | | $ | 84.14 | | | $ | 82.24 | |
| | | | | | | | | | | | | | | | | | | | |
| | | | | |
Total Return(d) | | | | | | | | | | | | | | | | | | | | |
Based on net asset value | | | (11.60 | )% | | | 18.58 | % | | | 61.04 | % | | | 3.55 | % | | | 13.11 | % |
| | | | | | | | | | | | | | | | | | | | |
| | | | | |
Ratios to Average Net Assets(e) | | | | | | | | | | | | | | | | | | | | |
Total expenses | | | 0.20 | % | | | 0.20 | % | | | 0.20 | % | | | 0.20 | % | | | 0.20 | % |
| | | | | | | | | | | | | | | | | | | | |
| | | | | |
Net investment income | | | 0.87 | % | | | 0.57 | % | | | 0.77 | % | | | 1.16 | % | | | 1.27 | % |
| | | | | | | | | | | | | | | | | | | | |
| | | | | |
Supplemental Data | | | | | | | | | | | | | | | | | | | | |
Net assets, end of year (000) | | $ | 5,934,551 | | | $ | 4,820,372 | | | $ | 3,529,895 | | | $ | 1,678,603 | | | $ | 1,377,486 | |
| | | | | | | | | | | | | | | | | | | | |
| | | | | |
Portfolio turnover rate(f) | | | 12 | % | | | 10 | % | | | 11 | % | | | 20 | % | | | 15 | % |
| | | | | | | | | | | | | | | | | | | | |
| (a) | Based on average shares outstanding. |
| (b) | The amounts reported for a share outstanding may not accord with the change in aggregate gains and losses in securities for the fiscal period due to the timing of capital share transactions in relation to the fluctuating market values of the Fund’s underlying securities. |
| (c) | Distributions for annual periods determined in accordance with U.S. federal income tax regulations. |
| (d) | Where applicable, assumes the reinvestment of distributions. |
| (e) | Excludes fees and expenses incurred indirectly as a result of investments in underlying funds. |
| (f) | Portfolio turnover rate excludes in-kind transactions. |
See notes to financial statements.
| | |
| 30 | | 2 0 2 3 I SHARES ANNUAL REPORT TO SHAREHOLDERS |
Financial Highlights
(For a share outstanding throughout each period)
| | | | | | | | | | | | | | | | | | | | |
| | | iShares Russell Top 200 Value ETF | |
| | | | |
| | | | | |
| |
| Year Ended
03/31/23 |
| |
| Year Ended
03/31/22 |
| |
| Year Ended
03/31/21 |
| |
| Year Ended
03/31/20 |
| |
| Year Ended
03/31/19 |
|
| |
| | | | | |
Net asset value, beginning of year | | $ | 69.61 | | | $ | 63.58 | | | $ | 44.04 | | | $ | 52.57 | | | $ | 50.39 | |
| | | | | | | | | | | | | | | | | | | | |
Net investment income(a) | | | 1.40 | | | | 1.30 | | | | 1.26 | | | | 1.40 | | | | 1.31 | |
Net realized and unrealized gain(b) | | | (4.52 | ) | | | 6.01 | | | | 19.49 | | | | (8.38 | ) | | | 2.13 | |
| | | | | | | | | | | | | | | | | | | | |
| | | | | |
Net increase from investment operations | | | (3.12 | ) | | | 7.31 | | | | 20.75 | | | | (6.98 | ) | | | 3.44 | |
| | | | | | | | | | | | | | | | | | | | |
| | | | | |
Distributions from net investment income(c) | | | (1.34 | ) | | | (1.28 | ) | | | (1.21 | ) | | | (1.55 | ) | | | (1.26 | ) |
| | | | | | | | | | | | | | | | | | | | |
| | | | | |
Net asset value, end of year | | $ | 65.15 | | | $ | 69.61 | | | $ | 63.58 | | | $ | 44.04 | | | $ | 52.57 | |
| | | | | | | | | | | | | | | | | | | | |
| | | | | |
Total Return(d) | | | | | | | | | | | | | | | | | | | | |
Based on net asset value | | | (4.37 | )% | | | 11.56 | % | | | 47.63 | % | | | (13.72 | )% | | | 6.92 | % |
| | | | | | | | | | | | | | | | | | | | |
| | | | | |
Ratios to Average Net Assets(e) | | | | | | | | | | | | | | | | | | | | |
Total expenses | | | 0.20 | % | | | 0.20 | % | | | 0.20 | % | | | 0.20 | % | | | 0.20 | % |
| | | | | | | | | | | | | | | | | | | | |
| | | | | |
Net investment income | | | 2.17 | % | | | 1.91 | % | | | 2.31 | % | | | 2.56 | % | | | 2.54 | % |
| | | | | | | | | | | | | | | | | | | | |
| | | | | |
Supplemental Data | | | | | | | | | | | | | | | | | | | | |
Net assets, end of year (000) | | $ | 1,557,158 | | | $ | 1,287,723 | | | $ | 1,153,937 | | | $ | 389,726 | | | $ | 425,831 | |
| | | | | | | | | | | | | | | | | | | | |
| | | | | |
Portfolio turnover rate(f) | | | 18 | % | | | 15 | % | | | 17 | % | | | 17 | % | | | 14 | % |
| | | | | | | | | | | | | | | | | | | | |
| (a) | Based on average shares outstanding. |
| (b) | The amounts reported for a share outstanding may not accord with the change in aggregate gains and losses in securities for the fiscal period due to the timing of capital share transactions in relation to the fluctuating market values of the Fund’s underlying securities. |
| (c) | Distributions for annual periods determined in accordance with U.S. federal income tax regulations. |
| (d) | Where applicable, assumes the reinvestment of distributions. |
| (e) | Excludes fees and expenses incurred indirectly as a result of investments in underlying funds. |
| (f) | Portfolio turnover rate excludes in-kind transactions. |
See notes to financial statements.
Notes to Financial Statements
iShares Trust (the “Trust”) is registered under the Investment Company Act of 1940, as amended (the “1940 Act”), as an open-end management investment company. The Trust is organized as a Delaware statutory trust and is authorized to have multiple series or portfolios.
These financial statements relate only to the following funds (each, a “Fund” and collectively, the “Funds”):
| | | | |
| |
| iShares ETF | | Diversification
Classification | |
| |
Russell Top 200 | | | Diversified | |
Russell Top 200 Growth(a) | | | Diversified | |
Russell Top 200 Value | | | Diversified | |
| | (a) | The Fund intends to be diversified in approximately the same proportion as its underlying index is diversified. The Fund may become non-diversified, as defined in the 1940 Act, solely as a result of a change in relative market capitalization or index weighting of one or more constituents of its underlying index. Shareholder approval will not be sought if the Fund crosses from diversified to non-diversified status due solely to a change in its relative market capitalization or index weighting of one or more constituents of its underlying index. | |
| 2. | SIGNIFICANT ACCOUNTING POLICIES |
The financial statements are prepared in conformity with accounting principles generally accepted in the United States of America (“U.S. GAAP”), which may require management to make estimates and assumptions that affect the reported amounts of assets and liabilities in the financial statements, disclosure of contingent assets and liabilities at the date of the financial statements and the reported amounts of increases and decreases in net assets from operations during the reporting period. Actual results could differ from those estimates. Each Fund is considered an investment company under U.S. GAAP and follows the accounting and reporting guidance applicable to investment companies. Below is a summary of significant accounting policies:
Investment Transactions and Income Recognition: For financial reporting purposes, investment transactions are recorded on the dates the transactions are executed. Realized gains and losses on investment transactions are determined using the specific identification method. Dividend income and capital gain distributions, if any, are recorded on the ex-dividend date. Non-cash dividends, if any, are recorded on the ex-dividend date at fair value. Under the applicable foreign tax laws, a withholding tax at various rates may be imposed on capital gains, dividends and interest. Upon notification from issuers or as estimated by management, a portion of the dividend income received from a real estate investment trust may be redesignated as a reduction of cost of the related investment and/or realized gain.
Foreign Taxes: The Funds may be subject to foreign taxes (a portion of which may be reclaimable) on income, stock dividends, capital gains on investments, or certain foreign currency transactions. All foreign taxes are recorded in accordance with the applicable foreign tax regulations and rates that exist in the foreign jurisdiction in which each Fund invests. These foreign taxes, if any, are paid by each Fund and are reflected in its Statements of Operations as follows: foreign taxes withheld at source are presented as a reduction of income, foreign taxes on securities lending income are presented as a reduction of securities lending income, foreign taxes on stock dividends are presented as “Other foreign taxes”, and foreign taxes on capital gains from sales of investments and foreign taxes on foreign currency transactions are included in their respective net realized gain (loss) categories. Foreign taxes payable or deferred as of March 31, 2023, if any, are disclosed in the Statements of Assets and Liabilities.
The Funds file withholding tax reclaims in certain jurisdictions to recover a portion of amounts previously withheld. The Funds may record a reclaim receivable based on collectability, which includes factors such as the jurisdiction’s applicable laws, payment history and market convention. The Statements of Operations includes tax reclaims recorded as well as professional and other fees, if any, associated with recovery of foreign withholding taxes.
Collateralization: If required by an exchange or counterparty agreement, the Funds may be required to deliver/deposit cash and/or securities to/with an exchange, or broker-dealer or custodian as collateral for certain investments.
In-kind Redemptions: For financial reporting purposes, in-kind redemptions are treated as sales of securities resulting in realized capital gains or losses to the Funds. Because such gains or losses are not taxable to the Funds and are not distributed to existing Fund shareholders, the gains or losses are reclassified from accumulated net realized gain (loss) to paid-in capital at the end of the Funds’ tax year. These reclassifications have no effect on net assets or net asset value (“NAV”) per share.
Distributions: Dividends and distributions paid by each Fund are recorded on the ex-dividend dates. Distributions are determined on a tax basis and may differ from net investment income and net realized capital gains for financial reporting purposes. Dividends and distributions are paid in U.S. dollars and cannot be automatically reinvested in additional shares of the Funds.
The character and timing of distributions are determined in accordance with U.S. federal income tax regulations, which may differ from U.S. GAAP.
Indemnifications: In the normal course of business, each Fund enters into contracts that contain a variety of representations that provide general indemnification. The Funds’ maximum exposure under these arrangements is unknown because it involves future potential claims against the Funds, which cannot be predicted with any certainty.
| 3. | INVESTMENT VALUATION AND FAIR VALUE MEASUREMENTS |
Investment Valuation Policies: Each Fund’s investments are valued at fair value (also referred to as “market value” within the financial statements) each day that the Fund’s listing exchange is open and, for financial reporting purposes, as of the report date. U.S. GAAP defines fair value as the price a fund would receive to sell an asset or pay to transfer a liability in an orderly transaction between market participants at the measurement date. The Board of Trustees of the Trust (the “Board”) of each Fund has approved the designation of BlackRock Fund Advisors (“BFA”), the Fund’s investment adviser, as the valuation designee for each Fund. Each Fund determines the fair values of its
| | |
| 32 | | 2 0 2 3 I SHARES ANNUAL REPORT TO SHAREHOLDERS |
Notes to Financial Statements (continued)
financial instruments using various independent dealers or pricing services under BFA’s policies. If a security’s market price is not readily available or does not otherwise accurately represent the fair value of the security, the security will be valued in accordance with BFA’s policies and procedures as reflecting fair value. BFA has formed a committee (the “Valuation Committee”) to develop pricing policies and procedures and to oversee the pricing function for all financial instruments, with assistance from other BlackRock pricing committees.
Fair Value Inputs and Methodologies: The following methods and inputs are used to establish the fair value of each Fund’s assets and liabilities:
| | • | | Equity investments traded on a recognized securities exchange are valued at that day’s official closing price, as applicable, on the exchange where the stock is primarily traded. Equity investments traded on a recognized exchange for which there were no sales on that day are valued at the last traded price. |
| | • | | Investments in open-end U.S. mutual funds (including money market funds) are valued at that day’s published NAV. |
| | • | | Futures contracts are valued based on that day’s last reported settlement or trade price on the exchange where the contract is traded. |
If events (e.g., market volatility, company announcement or a natural disaster) occur that are expected to materially affect the value of such investment, or in the event that application of these methods of valuation results in a price for an investment that is deemed not to be representative of the market value of such investment, or if a price is not available, the investment will be valued by the Valuation Committee, in accordance with BFA’s policies and procedures as reflecting fair value (“Fair Valued Investments”). The fair valuation approaches that may be used by the Valuation Committee include market approach, income approach and cost approach. Valuation techniques such as discounted cash flow, use of market comparables and matrix pricing are types of valuation approaches and are typically used in determining fair value. When determining the price for Fair Valued Investments, the Valuation Committee seeks to determine the price that each Fund might reasonably expect to receive or pay from the current sale or purchase of that asset or liability in an arm’s-length transaction. Fair value determinations shall be based upon all available factors that the Valuation Committee deems relevant and consistent with the principles of fair value measurement.
Fair value pricing could result in a difference between the prices used to calculate a fund’s NAV and the prices used by the fund’s underlying index, which in turn could result in a difference between the fund’s performance and the performance of the fund’s underlying index.
Fair Value Hierarchy: Various inputs are used in determining the fair value of financial instruments. These inputs to valuation techniques are categorized into a fair value hierarchy consisting of three broad levels for financial reporting purposes as follows:
| | • | | Level 1 – Unadjusted price quotations in active markets/exchanges for identical assets or liabilities that each Fund has the ability to access; |
| | • | | Level 2 – Other observable inputs (including, but not limited to, quoted prices for similar assets or liabilities in markets that are active, quoted prices for identical or similar assets or liabilities in markets that are not active, inputs other than quoted prices that are observable for the assets or liabilities (such as interest rates, yield curves, volatilities, prepayment speeds, loss severities, credit risks and default rates) or other market–corroborated inputs); and |
| | • | | Level 3 – Unobservable inputs based on the best information available in the circumstances, to the extent observable inputs are not available (including the Valuation Committee’s assumptions used in determining the fair value of financial instruments). |
The hierarchy gives the highest priority to unadjusted quoted prices in active markets for identical assets or liabilities (Level 1 measurements) and the lowest priority to unobservable inputs (Level 3 measurements). Accordingly, the degree of judgment exercised in determining fair value is greatest for instruments categorized in Level 3. The inputs used to measure fair value may fall into different levels of the fair value hierarchy. In such cases, for disclosure purposes, the fair value hierarchy classification is determined based on the lowest level input that is significant to the fair value measurement in its entirety. Investments classified within Level 3 have significant unobservable inputs used by the Valuation Committee in determining the price for Fair Valued Investments. Level 3 investments include equity or debt issued by privately held companies or funds that may not have a secondary market and/or may have a limited number of investors. The categorization of a value determined for financial instruments is based on the pricing transparency of the financial instruments and is not necessarily an indication of the risks associated with investing in those securities.
| 4. | SECURITIES AND OTHER INVESTMENTS |
Warrants: Warrants entitle a fund to purchase a specified number of shares of common stock and are non-income producing. The purchase price and number of shares are subject to adjustment under certain conditions until the expiration date of the warrants, if any. If the price of the underlying stock does not rise above the strike price before the warrant expires, the warrant generally expires without any value and a fund will lose any amount it paid for the warrant. Thus, investments in warrants may involve more risk than investments in common stock. Warrants may trade in the same markets as their underlying stock; however, the price of the warrant does not necessarily move with the price of the underlying stock.
Securities Lending: Each Fund may lend its securities to approved borrowers, such as brokers, dealers and other financial institutions. The borrower pledges and maintains with the Fund collateral consisting of cash, an irrevocable letter of credit issued by an approved bank, or securities issued or guaranteed by the U.S. government. The initial collateral received by each Fund is required to have a value of at least 102% of the current market value of the loaned securities for securities traded on U.S. exchanges and a value of at least 105% for all other securities. The collateral is maintained thereafter at a value equal to at least 100% of the current value of the securities on loan. The market value of the loaned securities is determined at the close of each business day of the Fund and any additional required collateral is delivered to the Fund or excess collateral is returned by the Fund, on the next business day. During the term of the loan, each Fund is entitled to all distributions made on or in respect of the loaned securities but does not receive interest income on securities received as collateral. Loans of securities are terminable at any time and the borrower, after notice, is required to return borrowed securities within the standard time period for settlement of securities transactions.
As of period end, any securities on loan were collateralized by cash and/or U.S. Government obligations. Cash collateral invested in money market funds managed by BFA or its affiliates is disclosed in the Schedule of Investments. Any non-cash collateral received cannot be sold, re-invested or pledged by the Fund, except in the event of borrower default. The securities on loan, if any, are also disclosed in each Fund’s Schedule of Investments. The market value of any securities on loan and the value of any related cash collateral are disclosed in the Statements of Assets and Liabilities.
| | |
NOTES TO FINANCIAL STATEMENTS | | 33 |
Notes to Financial Statements (continued)
Securities lending transactions are entered into by the Funds under Master Securities Lending Agreements (each, an “MSLA”) which provide the right, in the event of default (including bankruptcy or insolvency) for the non-defaulting party to liquidate the collateral and calculate a net exposure to the defaulting party or request additional collateral. In the event that a borrower defaults, the Funds, as lender, would offset the market value of the collateral received against the market value of the securities loaned. When the value of the collateral is greater than that of the market value of the securities loaned, the lender is left with a net amount payable to the defaulting party. However, bankruptcy or insolvency laws of a particular jurisdiction may impose restrictions on or prohibitions against such a right of offset in the event of an MSLA counterparty’s bankruptcy or insolvency. Under the MSLA, absent an event of default, the borrower can resell or re-pledge the loaned securities, and the Funds can reinvest cash collateral received in connection with loaned securities. Upon an event of default, the parties’ obligations to return the securities or collateral to the other party are extinguished, and the parties can resell or re-pledge the loaned securities or the collateral received in connection with the loaned securities in order to satisfy the defaulting party’s net payment obligation for all transactions under the MSLA. The defaulting party remains liable for any deficiency.
As of period end, the following table is a summary of the securities on loan by counterparty which are subject to offset under an MSLA:
| | | | | | | | | | | | | | | | |
| iShares ETF and Counterparty | |
| Securities
Loaned at Value |
| |
| Cash
Collateral Received |
(a) | |
| Non-Cash
Collateral Received,
at Fair Value |
(a) | |
| Net
Amount |
(b) |
| | | | |
Russell Top 200 | | | | | | | | | | | | | | | | |
BNP Paribas SA | | $ | 1,658,841 | | | $ | (1,640,238 | ) | | $ | — | | | $ | 18,603 | |
| | | | | | | | | | | | | | | | |
| | | | |
Russell Top 200 Growth | | | | | | | | | | | | | | | | |
Barclays Bank PLC | | $ | 513,276 | | | $ | (513,276 | ) | | $ | — | | | $ | — | |
J.P. Morgan Securities LLC | | | 26,524,100 | | | | (26,524,100 | ) | | | — | | | | — | |
Toronto-Dominion Bank | | | 12,501,670 | | | | (12,501,670 | ) | | | — | | | | — | |
Virtu Americas LLC | | | 148,701 | | | | (148,701 | ) | | | — | | | | — | |
| | | | | | | | | | | | | | | | |
| | | | |
| | $ | 39,687,747 | | | $ | (39,687,747 | ) | | $ | — | | | $ | — | |
| | | | | | | | | | | | | | | | |
| | | | |
Russell Top 200 Value | | | | | | | | | | | | | | | | |
Barclays Bank PLC | | $ | 30,401 | | | $ | (30,401 | ) | | $ | — | | | $ | — | |
BNP Paribas SA | | | 755,742 | | | | (755,742 | ) | | | — | | | | — | |
BofA Securities, Inc. | | | 3,278,955 | | | | (3,243,000 | ) | | | — | | | | 35,955 | |
| | | | | | | | | | | | | | | | |
| | | | |
| | $ | 4,065,098 | | | $ | (4,029,143 | ) | | $ | — | | | $ | 35,955 | |
| | | | | | | | | | | | | | | | |
| | (a) | Collateral received in excess of the market value of securities on loan is not presented in this table. The total cash collateral received by each Fund is disclosed in the Funds’ Statements of Assets and Liabilities. | |
| | (b) | The market value of the loaned securities is determined as of March 31, 2023. Additional collateral is delivered to the Fund on the next business day in accordance with the MSLA. The net amount would be subject to the borrower default indemnity in the event of default by the counterparty. | |
The risks of securities lending include the risk that the borrower may not provide additional collateral when required or may not return the securities when due. To mitigate these risks, each Fund benefits from a borrower default indemnity provided by BlackRock, Inc. (“BlackRock”). BlackRock’s indemnity allows for full replacement of the securities loaned to the extent the collateral received does not cover the value of the securities loaned in the event of borrower default. Each Fund could incur a loss if the value of an investment purchased with cash collateral falls below the market value of the loaned securities or if the value of an investment purchased with cash collateral falls below the value of the original cash collateral received. Such losses are borne entirely by each Fund.
5. DERIVATIVE FINANCIAL INSTRUMENTS
Futures Contracts: Futures contracts are purchased or sold to gain exposure to, or manage exposure to, changes in interest rates (interest rate risk) and changes in the value of equity securities (equity risk) or foreign currencies (foreign currency exchange rate risk).
Futures contracts are exchange-traded agreements between the Funds and a counterparty to buy or sell a specific quantity of an underlying instrument at a specified price and on a specified date. Depending on the terms of a contract, it is settled either through physical delivery of the underlying instrument on the settlement date or by payment of a cash amount on the settlement date. Upon entering into a futures contract, the Funds are required to deposit initial margin with the broker in the form of cash or securities in an amount that varies depending on a contract’s size and risk profile. The initial margin deposit must then be maintained to an established level over the life of the contract. Amounts pledged, which are considered restricted, are included in cash pledged for futures contracts in the Statements of Assets and Liabilities.
Securities deposited as initial margin are designated in the Schedule of Investments and cash deposited, if any, are shown as cash pledged for futures contracts in the Statements of Assets and Liabilities. Pursuant to the contract, the Funds agree to receive from or pay to the broker an amount of cash equal to the daily fluctuation in market value of the contract (“variation margin”). Variation margin is recorded as unrealized appreciation (depreciation) and, if any, shown as variation margin receivable (or payable) on futures contracts in the Statements of Assets and Liabilities. When the contract is closed, a realized gain or loss is recorded in the Statements of Operations equal to the difference between the notional amount of the contract at the time it was opened and the notional amount at the time it was closed. The use of futures contracts involves the risk of an imperfect correlation in the movements in the price of futures contracts and interest rates, foreign currency exchange rates or underlying assets.
6. INVESTMENT ADVISORY AGREEMENT AND OTHER TRANSACTIONS WITH AFFILIATES
Investment Advisory Fees: Pursuant to an Investment Advisory Agreement with the Trust, BFA manages the investment of each Fund’s assets. BFA is a California corporation indirectly owned by BlackRock. Under the Investment Advisory Agreement, BFA is responsible for substantially all expenses of the Funds, except (i) interest and taxes; (ii) brokerage commissions and other expenses connected with the execution of portfolio transactions; (iii) distribution fees; (iv) the advisory fee payable to BFA; and (v) litigation expenses and any extraordinary expenses (in each case as determined by a majority of the independent trustees).
| | |
| 34 | | 2 0 2 3 I SHARES ANNUAL REPORT TO SHAREHOLDERS |
Notes to Financial Statements (continued)
For its investment advisory services to each of the following Funds, BFA is entitled to an annual investment advisory fee, accrued daily and paid monthly by the Funds, based on the average daily net assets of each Fund as follows:
| | | | |
| | |
| iShares ETF | | Investment Advisory Fees | |
| |
Russell Top 200 | | | 0.15 | % |
Russell Top 200 Growth | | | 0.20 | |
Russell Top 200 Value | | | 0.20 | |
Distributor: BlackRock Investments, LLC (“BRIL”), an affiliate of BFA, is the distributor for each Fund. Pursuant to the distribution agreement, BFA is responsible for any fees or expenses for distribution services provided to the Funds.
ETF Servicing Fees: Each Fund has entered into an ETF Services Agreement with BRIL to perform certain order processing, Authorized Participant communications, and related services in connection with the issuance and redemption of Creation Units (“ETF Services”). BRIL is entitled to a transaction fee from Authorized Participants on each creation or redemption order for the ETF Services provided. Each Fund does not pay BRIL for ETF Services.
Prior to April 25, 2022, ETF Services were performed by State Street Bank and Trust Company.
Securities Lending: The U.S. Securities and Exchange Commission (the “SEC”) has issued an exemptive order which permits BlackRock Institutional Trust Company, N.A. (“BTC”), an affiliate of BFA, to serve as securities lending agent for the Funds, subject to applicable conditions. As securities lending agent, BTC bears all operational costs directly related to securities lending, including any custodial costs. Each Fund is responsible for fees in connection with the investment of cash collateral received for securities on loan (the “collateral investment fees”). The cash collateral is invested in a money market fund, BlackRock Cash Funds: Institutional or BlackRock Cash Funds: Treasury, managed by BFA, or its affiliates. However, BTC has agreed to reduce the amount of securities lending income it receives in order to effectively limit the collateral investment fees each Fund bears to an annual rate of 0.04%. The SL Agency Shares of such money market fund will not be subject to a sales load, distribution fee or service fee. The money market fund in which the cash collateral has been invested may, under certain circumstances, impose a liquidity fee of up to 2% of the value redeemed or temporarily restrict redemptions for up to 10 business days during a 90 day period, in the event that the money market fund’s weekly liquid assets fall below certain thresholds.
Securities lending income is equal to the total of income earned from the reinvestment of cash collateral, net of fees and other payments to and from borrowers of securities, and less the collateral investment fees. Each Fund retains a portion of securities lending income and remits the remaining portion to BTC as compensation for its services as securities lending agent.
Pursuant to the current securities lending agreement, each Fund retains 81% of securities lending income (which excludes collateral investment fees) and the amount retained can never be less than 70% of the total of securities lending income plus the collateral investment fees.
In addition, commencing the business day following the date that the aggregate securities lending income plus the collateral investment fees generated across all 1940 Act iShares exchange-traded funds (the “iShares ETF Complex”) in that calendar year exceeds a specified threshold, each Fund, pursuant to the securities lending agreement, will retain for the remainder of that calendar year 81% of securities lending income (which excludes collateral investment fees), and the amount retained can never be less than 70% of the total of securities lending income plus the collateral investment fees.
The share of securities lending income earned by each Fund is shown as securities lending income - affiliated - net in its Statements of Operations. For the year ended March 31, 2023, the Funds paid BTC the following amounts for securities lending agent services:
| | | | |
| |
| |
| iShares ETF | | Amounts | |
| |
| |
Russell Top 200 | | $ | 4,906 | |
Russell Top 200 Growth | | | 48,245 | |
Russell Top 200 Value | | | 6,520 | |
| |
Officers and Trustees: Certain officers and/or trustees of the Trust are officers and/or trustees of BlackRock or its affiliates.
Other Transactions: Cross trading is the buying or selling of portfolio securities between funds to which BFA (or an affiliate) serves as investment adviser. At its regularly scheduled quarterly meetings, the Board reviews such transactions as of the most recent calendar quarter for compliance with the requirements and restrictions set forth by Rule 17a-7.
For the year ended March 31, 2023, transactions executed by the Funds pursuant to Rule 17a-7 under the 1940 Act were as follows:
| | | | | | | | | | | | |
| | | | |
| iShares ETF | | Purchases | | | Sales | | | Net Realized
Gain (Loss) | |
| | | |
Russell Top 200 | | $ | 18,667,521 | | | $ | 18,462,481 | | | $ | (6,930,340 | ) |
Russell Top 200 Growth | | | 412,316,889 | | | | 316,817,617 | | | | (149,755,398 | ) |
Russell Top 200 Value | | | 187,135,237 | | | | 196,134,146 | | | | 1,130 | |
Each Fund may invest its positive cash balances in certain money market funds managed by BFA or an affiliate. The income earned on these temporary cash investments is shown as dividends - affiliated in the Statements of Operations.
A fund, in order to improve its portfolio liquidity and its ability to track its underlying index, may invest in shares of other iShares funds that invest in securities in the fund’s underlying index.
| | |
NOTES TO FINANCIAL STATEMENTS | | 35 |
Notes to Financial Statements (continued)
7. PURCHASES AND SALES
For the year ended March 31, 2023, purchases and sales of investments, excluding short-term securities and in-kind transactions, were as follows:
| | | | | | | | |
| |
| | |
| iShares ETF | | Purchases | | | Sales | |
| |
| | |
Russell Top 200 | | $ | 42,025,142 | | | $ | 42,258,036 | |
Russell Top 200 Growth | | | 563,450,685 | | | | 561,923,855 | |
Russell Top 200 Value | | | 259,577,390 | | | | 258,112,301 | |
| |
For the year ended March 31, 2023, in-kind transactions were as follows:
| | | | | | | | |
| |
| | |
| iShares ETF | | In-kind
Purchases | | | In-kind Sales | |
| |
| | |
Russell Top 200 | | $ | 334,380,701 | | | $ | 468,764,504 | |
Russell Top 200 Growth | | | 2,455,567,125 | | | | 814,279,402 | |
Russell Top 200 Value | | | 733,047,970 | | | | 373,425,596 | |
| |
8. INCOME TAX INFORMATION
Each Fund is treated as an entity separate from the Trust’s other funds for federal income tax purposes. It is each Fund’s policy to comply with the requirements of the Internal Revenue Code of 1986, as amended, applicable to regulated investment companies, and to distribute substantially all of its taxable income to its shareholders. Therefore, no U.S. federal income tax provision is required.
Management has analyzed tax laws and regulations and their application to the Funds as of March 31, 2023, inclusive of the open tax return years, and does not believe that there are any uncertain tax positions that require recognition of a tax liability in the Funds’ financial statements.
U.S. GAAP requires that certain components of net assets be adjusted to reflect permanent differences between financial and tax reporting. These reclassifications have no effect on net assets or NAV per share. As of March 31, 2023, permanent differences attributable to distributions paid in excess of taxable income and realized gains (losses) from in-kind redemptions were reclassified to the following accounts:
| | | | | | | | |
| |
| | |
| iShares ETF | | Paid-in capital | | | Accumulated earnings (loss) | |
| |
| | |
Russell Top 200 | | $ | 122,830,815 | | | $ | (122,830,815 | ) |
Russell Top 200 Growth | | | 368,542,676 | | | | (368,542,676 | ) |
Russell Top 200 Value | | | 84,851,353 | | | | (84,851,353 | ) |
| |
The tax character of distributions paid was as follows:
| | | | | | | | |
| |
| | |
| iShares ETF | | Year Ended
March 31, 2023 | | | Year Ended
March 31, 2022 | |
| |
Russell Top 200 | | | | | | | | |
Ordinary income | | $ | 12,861,101 | | | $ | 11,546,241 | |
| | | | | | | | |
| | |
Russell Top 200 Growth | | | | | | | | |
Ordinary income | | $ | 40,613,805 | | | $ | 24,456,769 | |
| | | | | | | | |
| | |
Russell Top 200 Value | | | | | | | | |
Ordinary income | | $ | 30,093,801 | | | $ | 22,928,866 | |
| | | | | | | | |
As of March 31, 2023, the tax components of accumulated net earnings (losses) were as follows:
| | | | | | | | | | | | | | | | |
| |
| iShares ETF | |
| Undistributed
Ordinary Income |
| |
| Non-expiring
Capital Loss
Carryforwards(a) |
| |
| Net Unrealized
Gains (Losses)(b) |
| | | Total | |
| |
| | | | |
Russell Top 200 | | $ | 319,346 | | | $ | (23,957,521 | ) | | $ | (3,182,239 | ) | | $ | (26,820,414) | |
Russell Top 200 Growth | | | — | | | | (288,680,613 | ) | | | 623,825,367 | | | | 335,144,754 | |
Russell Top 200 Value | | | 994,025 | | | | (49,966,749 | ) | | | 27,215,829 | | | | (21,756,895 | ) |
| |
| (a) | Amounts available to offset future realized capital gains. | |
| (b) | The difference between book-basis and tax-basis unrealized gains (losses) was attributable primarily to the tax deferral of losses on wash sales, the realization for tax purposes of unrealized gains(losses) on certain futures contracts and characterization of corporate actions. | |
| | |
| 36 | | 2 0 2 3 I SHARES ANNUAL REPORT TO SHAREHOLDERS |
Notes to Financial Statements (continued)
As of March 31, 2023, gross unrealized appreciation and depreciation based on cost of investments (including short positions and derivatives, if any) for U.S. federal income tax purposes were as follows:
| | | | | | | | | | | | | | | | |
| |
| iShares ETF | | | Tax Cost | | |
| Gross Unrealized
Appreciation |
| |
| Gross Unrealized
Depreciation |
| |
| Net Unrealized
Appreciation
(Depreciation) |
|
| |
Russell Top 200 | | $ | 807,736,732 | | | $ | 61,177,348 | | | $ | (64,359,587 | ) | | $ | (3,182,239) | |
Russell Top 200 Growth | | | 5,349,286,049 | | | | 782,578,329 | | | | (158,752,962 | ) | | | 623,825,367 | |
Russell Top 200 Value | | | 1,532,576,774 | | | | 122,304,922 | | | | (95,089,093 | ) | | | 27,215,829 | |
| |
9. PRINCIPAL RISKS
In the normal course of business, each Fund invests in securities or other instruments and may enter into certain transactions, and such activities subject the Fund to various risks, including, among others, fluctuations in the market (market risk) or failure of an issuer to meet all of its obligations. The value of securities or other instruments may also be affected by various factors, including, without limitation: (i) the general economy; (ii) the overall market as well as local, regional or global political and/or social instability; (iii) regulation, taxation or international tax treaties between various countries; or (iv) currency, interest rate or price fluctuations. Local, regional or global events such as war, acts of terrorism, the spread of infectious illness or other public health issues, recessions, or other events could have a significant impact on the Funds and their investments. Each Fund’s prospectus provides details of the risks to which the Fund is subject.
BFA uses a “passive” or index approach to try to achieve each Fund’s investment objective following the securities included in its underlying index during upturns as well as downturns. BFA does not take steps to reduce market exposure or to lessen the effects of a declining market. Divergence from the underlying index and the composition of the portfolio is monitored by BFA.
The Funds may be exposed to additional risks when reinvesting cash collateral in money market funds that do not seek to maintain a stable NAV per share of $1.00, which may be subject to redemption gates or liquidity fees under certain circumstances.
Infectious Illness Risk: An outbreak of an infectious illness, such as the COVID-19 pandemic, may adversely impact the economies of many nations and the global economy, and may impact individual issuers and capital markets in ways that cannot be foreseen. An infectious illness outbreak may result in, among other things, closed international borders, prolonged quarantines, supply chain disruptions, market volatility or disruptions and other significant economic, social and political impacts.
Valuation Risk: The market values of equities, such as common stocks and preferred securities or equity related investments, such as futures and options, may decline due to general market conditions which are not specifically related to a particular company. They may also decline due to factors which affect a particular industry or industries. A fund may invest in illiquid investments. An illiquid investment is any investment that a fund reasonably expects cannot be sold or disposed of in current market conditions in seven calendar days or less without the sale or disposition significantly changing the market value of the investment. A fund may experience difficulty in selling illiquid investments in a timely manner at the price that it believes the investments are worth. Prices may fluctuate widely over short or extended periods in response to company, market or economic news. Markets also tend to move in cycles, with periods of rising and falling prices. This volatility may cause a fund’s NAV to experience significant increases or decreases over short periods of time. If there is a general decline in the securities and other markets, the NAV of a fund may lose value, regardless of the individual results of the securities and other instruments in which a fund invests.
The price each Fund could receive upon the sale of any particular portfolio investment may differ from each Fund’s valuation of the investment, particularly for securities that trade in thin or volatile markets or that are valued using a fair valuation technique or a price provided by an independent pricing service. Changes to significant unobservable inputs and assumptions (i.e., publicly traded company multiples, growth rate, time to exit) due to the lack of observable inputs.
Counterparty Credit Risk: The Funds may be exposed to counterparty credit risk, or the risk that an entity may fail to or be unable to perform on its commitments related to unsettled or open transactions, including making timely interest and/or principal payments or otherwise honoring its obligations. The Funds manage counterparty credit risk by entering into transactions only with counterparties that BFA believes have the financial resources to honor their obligations and by monitoring the financial stability of those counterparties. Financial assets, which potentially expose the Funds to market, issuer and counterparty credit risks, consist principally of financial instruments and receivables due from counterparties. The extent of the Funds’ exposure to market, issuer and counterparty credit risks with respect to these financial assets is approximately their value recorded in the Statements of Assets and Liabilities, less any collateral held by the Funds.
A derivative contract may suffer a mark-to-market loss if the value of the contract decreases due to an unfavorable change in the market rates or values of the underlying instrument. Losses can also occur if the counterparty does not perform under the contract.
With exchange-traded futures, there is less counterparty credit risk to the Funds since the exchange or clearinghouse, as counterparty to such instruments, guarantees against a possible default. The clearinghouse stands between the buyer and the seller of the contract; therefore, credit risk is limited to failure of the clearinghouse. While offset rights may exist under applicable law, a Fund does not have a contractual right of offset against a clearing broker or clearinghouse in the event of a default (including the bankruptcy or insolvency). Additionally, credit risk exists in exchange-traded futures with respect to initial and variation margin that is held in a clearing broker’s customer accounts. While clearing brokers are required to segregate customer margin from their own assets, in the event that a clearing broker becomes insolvent or goes into bankruptcy and at that time there is a shortfall in the aggregate amount of margin held by the clearing broker for all its clients, typically the shortfall would be allocated on a pro rata basis across all the clearing broker’s customers, potentially resulting in losses to the Funds.
Concentration Risk: A diversified portfolio, where this is appropriate and consistent with a fund’s objectives, minimizes the risk that a price change of a particular investment will have a material impact on the NAV of a fund. The investment concentrations within each Fund’s portfolio are disclosed in its Schedule of Investments.
| | |
NOTES TO FINANCIAL STATEMENTS | | 37 |
Notes to Financial Statements (continued)
Certain Funds invest a significant portion of their assets in securities within a single or limited number of market sectors. When a Fund concentrates its investments in this manner, it assumes the risk that economic, regulatory, political and social conditions affecting such sectors may have a significant impact on the fund and could affect the income from, or the value or liquidity of, the fund’s portfolio. Investment percentages in specific sectors are presented in the Schedule of Investments.
Significant Shareholder Redemption Risk: Certain shareholders may own or manage a substantial amount of fund shares and/or hold their fund investments for a limited period of time. Large redemptions of fund shares by these shareholders may force a fund to sell portfolio securities, which may negatively impact the fund’s NAV, increase the fund’s brokerage costs, and/or accelerate the realization of taxable income/gains and cause the fund to make additional taxable distributions to shareholders.
10. CAPITAL SHARE TRANSACTIONS
Capital shares are issued and redeemed by each Fund only in aggregations of a specified number of shares or multiples thereof (“Creation Units”) at NAV. Except when aggregated in Creation Units, shares of each Fund are not redeemable.
Transactions in capital shares were as follows:
| | | | | | | | | | | | | | | | |
| | | Year Ended 03/31/23 | | | Year Ended 03/31/22 | |
| | | | | | | | |
| | | | |
| iShares ETF | | Shares | | | Amount | | | Shares | | | Amount | |
| | | | |
Russell Top 200 | | | | | | | | | | | | | | | | |
| | | | |
Shares sold | | | 3,600,000 | | | $ | 333,290,298 | | | | 2,650,000 | | | $ | 283,025,557 | |
| | | | |
Shares redeemed | | | (5,000,000 | ) | | | (468,079,179 | ) | | | (2,150,000 | ) | | | (227,001,091 | ) |
| | | | | | | | | | | | | | | | |
| | | | |
| | | (1,400,000 | ) | | $ | (134,788,881 | ) | | | 500,000 | | | $ | 56,024,466 | |
| | | | | | | | | | | | | | | | |
| | | | |
Russell Top 200 Growth | | | | | | | | | | | | | | | | |
| | | | |
Shares sold | | | 18,450,000 | | | $ | 2,459,950,957 | | | | 10,200,000 | | | $ | 1,599,356,266 | |
| | | | |
Shares redeemed | | | (6,150,000 | ) | | | (814,297,086 | ) | | | (6,050,000 | ) | | | (916,512,668 | ) |
| | | | | | | | | | | | | | | | |
| | | | |
| | | 12,300,000 | | | $ | 1,645,653,871 | | | | 4,150,000 | | | $ | 682,843,598 | |
| | | | | | | | | | | | | | | | |
| | | | |
Russell Top 200 Value | | | | | | | | | | | | | | | | |
| | | | |
Shares sold | | | 11,250,000 | | | $ | 736,022,834 | | | | 6,300,000 | | | $ | 425,716,600 | |
| | | | |
Shares redeemed | | | (5,850,000 | ) | | | (374,305,472 | ) | | | (5,950,000 | ) | | | (399,609,308 | ) |
| | | | | | | | | | | | | | | | |
| | | | |
| | | 5,400,000 | | | $ | 361,717,362 | | | | 350,000 | | | $ | 26,107,292 | |
| | | | | | | | | | | | | | | | |
The consideration for the purchase of Creation Units of a fund in the Trust generally consists of the in-kind deposit of a designated portfolio of securities and a specified amount of cash. Certain funds in the Trust may be offered in Creation Units solely or partially for cash in U.S. dollars. Investors purchasing and redeeming Creation Units may pay a purchase transaction fee and a redemption transaction fee directly to BRIL, to offset transfer and other transaction costs associated with the issuance and redemption of Creation Units, including Creation Units for cash. Investors transacting in Creation Units for cash may also pay an additional variable charge to compensate the relevant fund for certain transaction costs (i.e., stamp taxes, taxes on currency or other financial transactions, and brokerage costs) and market impact expenses relating to investing in portfolio securities. Such variable charges, if any, are included in shares sold in the table above.
From time to time, settlement of securities related to in-kind contributions or in-kind redemptions may be delayed. In such cases, securities related to in-kind transactions are reflected as a receivable or a payable in the Statements of Assets and Liabilities.
11. SUBSEQUENT EVENTS
Management has evaluated the impact of all subsequent events on the Funds through the date the financial statements were available to be issued and has determined that there were no subsequent events requiring adjustment or additional disclosure in the financial statements.
| | |
| 38 | | 2 0 2 3 I SHARES ANNUAL REPORT TO SHAREHOLDERS |
Report of Independent Registered Public Accounting Firm
To the Board of Trustees of
iShares Trust and Shareholders of each of the three funds listed in the table below
Opinions on the Financial Statements
We have audited the accompanying statements of assets and liabilities, including the schedules of investments, of each of the funds listed in the table below (three of the funds constituting iShares Trust, hereafter collectively referred to as the “Funds”) as of March 31, 2023, the related statements of operations for the year ended March 31, 2023, the statements of changes in net assets for each of the two years in the period ended March 31, 2023, including the related notes, and the financial highlights for each of the five years in the period ended March 31, 2023 (collectively referred to as the “financial statements”). In our opinion, the financial statements present fairly, in all material respects, the financial position of each of the Funds as of March 31, 2023, the results of each of their operations for the year then ended, the changes in each of their net assets for each of the two years in the period ended March 31, 2023 and each of the financial highlights for each of the five years in the period ended March 31, 2023 in conformity with accounting principles generally accepted in the United States of America.
|
| |
iShares Russell Top 200 ETF |
| |
iShares Russell Top 200 Growth ETF |
| |
iShares Russell Top 200 Value ETF |
Basis for Opinions
These financial statements are the responsibility of the Funds’ management. Our responsibility is to express an opinion on the Funds’ financial statements based on our audits. We are a public accounting firm registered with the Public Company Accounting Oversight Board (United States) (PCAOB) and are required to be independent with respect to the Funds in accordance with the U.S. federal securities laws and the applicable rules and regulations of the Securities and Exchange Commission and the PCAOB.
We conducted our audits of these financial statements in accordance with the standards of the PCAOB. Those standards require that we plan and perform the audit to obtain reasonable assurance about whether the financial statements are free of material misstatement, whether due to error or fraud.
Our audits included performing procedures to assess the risks of material misstatement of the financial statements, whether due to error or fraud, and performing procedures that respond to those risks. Such procedures included examining, on a test basis, evidence regarding the amounts and disclosures in the financial statements. Our audits also included evaluating the accounting principles used and significant estimates made by management, as well as evaluating the overall presentation of the financial statements. Our procedures included confirmation of securities owned as of March 31, 2023 by correspondence with the custodian, transfer agent and brokers; when replies were not received from brokers, we performed other auditing procedures. We believe that our audits provide a reasonable basis for our opinions.
/s/PricewaterhouseCoopers LLP
Philadelphia, Pennsylvania
May 25, 2023
We have served as the auditor of one or more BlackRock investment companies since 2000.
| | |
REPORT OF INDEPENDENT REGISTERED PUBLIC ACCOUNTING FIRM | | 39 |
Important Tax Information (unaudited)
The following amounts, or maximum amounts allowable by law, are hereby designated as qualified dividend income for individuals for the fiscal year ended March 31, 2023:
| | | | |
| |
| iShares ETF | | Qualified Dividend
Income | |
| |
Russell Top 200 | | $ | 13,782,554 | |
Russell Top 200 Growth | | | 47,034,459 | |
Russell Top 200 Value | | | 32,612,676 | |
The following maximum amounts, or maximum amounts allowable by law, are hereby designated as qualified business income for individuals for the fiscal year ended March 31, 2023:
| | | | |
| |
| iShares ETF | | Qualified Business
Income | |
| |
Russell Top 200 | | $ | 204,781 | |
Russell Top 200 Growth | | | 1,043,569 | |
Russell Top 200 Value | | | 295,830 | |
The following percentages, or maximum percentages allowable by law, of ordinary income distributions paid during the fiscal year ended March 31, 2023 qualified for the dividends-received deduction for corporate shareholders:
| | | | |
| iShares ETF | | Dividends-Received
Deduction | |
Russell Top 200 | | | 100.00 | % |
Russell Top 200 Growth | | | 100.00 | |
Russell Top 200 Value | | | 100.00 | |
| | |
| 40 | | 2 0 2 3 I SHARES ANNUAL REPORT TO SHAREHOLDERS |
Statement Regarding Liquidity Risk Management Program (unaudited)
In compliance with Rule 22e-4 under the Investment Company Act of 1940, as amended (the “Liquidity Rule”), iShares Trust (the “Trust”) has adopted and implemented a liquidity risk management program (the “Program”) for iShares Russell Top 200 ETF, iShares Russell Top 200 Growth ETF and iShares Russell Top 200 Value ETF (the “Funds” or “ETFs”), each a series of the Trust, which is reasonably designed to assess and manage each Fund’s liquidity risk.
The Board of Trustees (the “Board”) of the Trust, on behalf of the Funds, met on December 9, 2022 (the “Meeting”) to review the Program. The Board previously appointed BlackRock Fund Advisors (“BlackRock”), the investment adviser to the Funds, as the program administrator for each Fund’s Program. BlackRock also previously delegated oversight of the Program to the 40 Act Liquidity Risk Management Committee (the “Committee”). At the Meeting, the Committee, on behalf of BlackRock, provided the Board with a report that addressed the operation of the Program and assessed its adequacy and effectiveness of implementation, including the management of each Fund’s Highly Liquid Investment Minimum (“HLIM”) where applicable, and any material changes to the Program (the “Report”). The Report covered the period from October 1, 2021 through September 30, 2022 (the “Program Reporting Period”).
The Report described the Program’s liquidity classification methodology for categorizing each Fund’s investments (including derivative transactions) into one of four liquidity buckets. It also referenced the methodology used by BlackRock to establish each Fund’s HLIM and noted that the Committee reviews and ratifies the HLIM assigned to each Fund no less frequently than annually. The Report also discussed notable events affecting liquidity over the Program Reporting Period, including extended market holidays, the imposition of capital controls in certain non-U.S. countries, Russian sanctions and the closure of the Russian securities market.
The Report noted that the Program complied with the key factors for consideration under the Liquidity Rule for assessing, managing and periodically reviewing each Fund’s liquidity risk, as follows:
| | a) | The Fund’s investment strategy and liquidity of portfolio investments during both normal and reasonably foreseeable stressed conditions. During the Program Reporting Period, the Committee reviewed whether each Fund’s strategy is appropriate for an open-end fund structure, with a focus on funds with more significant and consistent holdings of less liquid and illiquid assets. The Committee also factored a fund’s concentration in an issuer into the liquidity classification methodology by taking issuer position sizes into account. Derivative exposure was also considered in the calculation of a fund’s liquidity bucketing. Finally, a factor for consideration under the Liquidity Rule is a Fund’s use of borrowings for investment purposes. However, the Funds do not borrow for investment purposes. |
| | b) | Short-term and long-term cash flow projections during both normal and reasonably foreseeable stressed conditions. During the Program Reporting Period, the Committee reviewed historical redemption activity and used this information as a component to establish each ETF’s reasonably anticipated trading size (“RATS”). The Committee may also take into consideration a fund’s shareholder ownership concentration (which, depending on product type and distribution channel, may or may not be available), a fund’s distribution channels, and the degree of certainty associated with a fund’s short-term and long-term cash flow projections. |
| | c) | Holdings of cash and cash equivalents, as well as borrowing arrangements. The Committee considered that ETFs generally do not hold more than de minimis amounts of cash. The Committee also considered that ETFs generally do not engage in borrowing. |
| | d) | The relationship between an ETF’s portfolio liquidity and the way in which, and the prices and spreads at which, ETF shares trade, including the efficiency of the arbitrage function and the level of active participation by market participants, including authorized participants. The Committee monitored the prevailing bid/ask spread and the ETF price premium (or discount) to NAV for all ETFs. However, there were no ETFs with persistent deviations of fund premium/discount or bid/ask spreads from long-term averages over the Program Reporting Period. |
| | e) | The effect of the composition of baskets on the overall liquidity of an ETF’s portfolio. In reviewing the linkage between the composition of custom baskets accepted by an ETF and any significant change in the liquidity profile of such ETF, the Committee reviewed changes in the proportion of each ETF’s portfolio comprised of less liquid and illiquid holdings to determine if applicable thresholds were met requiring enhanced review. |
There were no material changes to the Program during the Program Reporting Period other than the enhancement of certain model components in the Program’s classification methodology. The Report provided to the Board stated that the Committee concluded that based on the operation of the functions, as described in the Report, the Program is operating as intended and is effective in implementing the requirements of the Liquidity Rule.
| | |
STATEMENT REGARDING LIQUIDITY RISK MANAGEMENT PROGRAM | | 41 |
Supplemental Information (unaudited)
Section 19(a) Notices
The amounts and sources of distributions reported are estimates and are being provided pursuant to regulatory requirements and are not being provided for tax reporting purposes. The actual amounts and sources for tax reporting purposes will depend upon each Fund’s investment experience during the year and may be subject to changes based on tax regulations. Shareholders will receive a Form 1099-DIV each calendar year that will inform them how to report these distributions for federal income tax purposes.
March 31, 2023
| | | | | | | | | | | | | | | | | | | | | | | | | | | | | | | | |
| | | Total Cumulative Distributions
for the Fiscal Year-to-Date | | | % Breakdown of the Total Cumulative
Distributions for the Fiscal Year-to-Date | |
| iShares ETF | | Net
Investment
Income | | | Net Realized
Capital Gains | | | Return of
Capital | | | Total Per
Share | | | Net
Investment
Income | | | Net Realized
Capital Gains | | | Return of
Capital | | | Total Per
Share | |
Russell Top 200 Value | | $ | 1.343796 | | | $ | — | | | $ | — | | | $ | 1.343796 | | | | 100 | % | | | — | % | | | — | % | | | 100 | % |
Premium/Discount Information
Information on the Fund’s net asset value, market price, premiums and discounts, and bid-ask spreads can be found at iShares.com.
| | |
| 42 | | 2 0 2 3 I SHARES ANNUAL REPORT TO SHAREHOLDERS |
Trustee and Officer Information
The Board of Trustees has responsibility for the overall management and operations of the Funds, including general supervision of the duties performed by BFA and other service providers. Each Trustee serves until he or she resigns, is removed, dies, retires or becomes incapacitated. Each officer shall hold office until his or her successor is elected and qualifies or until his or her death, resignation or removal. Trustees who are not “interested persons” (as defined in the 1940 Act) of the Trust are referred to as independent trustees (“Independent Trustees”).
The registered investment companies advised by BFA or its affiliates (the “BlackRock-advised Funds”) are organized into one complex of open-end equity, multi-asset, index and money market funds and ETFs (the “BlackRock Multi-Asset Complex”), one complex of closed-end funds and open-end non-index fixed-income funds (including ETFs) (the “BlackRock Fixed-Income Complex”) and one complex of ETFs (“Exchange-Traded Fund Complex”) (each, a “BlackRock Fund Complex”). Each Fund is included in the Exchange-Traded Fund Complex. Each Trustee also serves as a Director of iShares, Inc. and a Trustee of iShares U.S. ETF Trust and, as a result, oversees all of the funds within the Exchange-Traded Fund Complex, which consists of 380 funds as of March 31, 2023. With the exception of Robert S. Kapito, Salim Ramji and Charles Park, the address of each Trustee and officer is c/o BlackRock, Inc., 400 Howard Street, San Francisco, CA 94105. The address of Mr. Kapito, Mr. Ramji and Mr. Park is c/o BlackRock, Inc., 50 Hudson Yards, New York, NY 10001. The Board has designated John E. Kerrigan as its Independent Board Chair. Additional information about the Funds’ Trustees and officers may be found in the Funds’ combined Statement of Additional Information, which is available without charge, upon request, by calling toll-free 1-800-iShares (1-800-474-2737).
| | | | | | |
| Interested Trustees |
| | | | |
| Name (Year of Birth) | | Position(s) | | Principal Occupation(s) During Past 5 Years | | Other Directorships Held by Trustee |
| | | |
| Robert S. Kapito(a) (1957) | | Trustee (since 2009). | | President, BlackRock, Inc. (since 2006); Vice Chairman of BlackRock, Inc. and Head of BlackRock’s Portfolio Management Group (since its formation in 1998) and BlackRock, Inc.’s predecessor entities (since 1988); Trustee, University of Pennsylvania (since 2009); President of Board of Directors, Hope & Heroes Children’s Cancer Fund (since 2002). | | Director of BlackRock, Inc. (since 2006); Director of iShares, Inc. (since 2009); Trustee of iShares U.S. ETF Trust (since 2011). |
| | | |
| Salim Ramji(b) (1970) | | Trustee (since 2019). | | Senior Managing Director, BlackRock, Inc. (since 2014); Global Head of BlackRock’s ETF and Index Investments Business (since 2019); Head of BlackRock’s U.S. Wealth Advisory Business (2015-2019); Global Head of Corporate Strategy, BlackRock, Inc. (2014-2015); Senior Partner, McKinsey & Company (2010-2014). | | Director of iShares, Inc. (since 2019); Trustee of iShares U.S. ETF Trust (since 2019). |
| (a) | Robert S. Kapito is deemed to be an “interested person” (as defined in the 1940 Act) of the Trust due to his affiliations with BlackRock, Inc. and its affiliates. |
| (b) | Salim Ramji is deemed to be an “interested person” (as defined in the 1940 Act) of the Trust due to his affiliations with BlackRock, Inc. and its affiliates. |
| | | | | | |
| Independent Trustees |
| | | | |
| Name (Year of Birth) | | Position(s) | | Principal Occupation(s) During Past 5 Years | | Other Directorships Held by Trustee |
| | | |
| John E. Kerrigan (1955) | | Trustee (since 2005); Independent Board Chair (since 2022). | | Chief Investment Officer, Santa Clara University (since 2002). | | Director of iShares, Inc. (since 2005); Trustee of iShares U.S. ETF Trust (since 2011); Independent Board Chair of iShares, Inc. and iShares U.S. ETF Trust (since 2022). |
| | | |
| Jane D. Carlin (1956) | | Trustee (since 2015); Risk Committee Chair (since 2016). | | Consultant (since 2012); Member of the Audit Committee (2012-2018), Chair of the Nominating and Governance Committee (2017-2018) and Director of PHH Corporation (mortgage solutions) (2012-2018); Managing Director and Global Head of Financial Holding Company Governance & Assurance and the Global Head of Operational Risk Management of Morgan Stanley (2006-2012). | | Director of iShares, Inc. (since 2015); Trustee of iShares U.S. ETF Trust (since 2015); Member of the Audit Committee (since 2016), Chair of the Audit Committee (since 2020) and Director of The Hanover Insurance Group, Inc. (since 2016). |
| | | |
| Richard L. Fagnani (1954) | | Trustee (since 2017); Audit Committee Chair (since 2019). | | Partner, KPMG LLP (2002-2016); Director of One Generation Away (since 2021). | | Director of iShares, Inc. (since 2017); Trustee of iShares U.S. ETF Trust (since 2017). |
| | |
TRUSTEE AND OFFICER INFORMATION | | 43 |
Trustee and Officer Information (continued)
| | | | | | |
| Independent Trustees |
| | | | |
| Name (Year of Birth) | | Position(s) | | Principal Occupation(s) During Past 5 Years | | Other Directorships Held by Trustee |
| | | |
| Cecilia H. Herbert (1949) | | Trustee (since 2005); Nominating and Governance and Equity Plus Committee Chairs (since 2022). | | Chair of the Finance Committee (since 2019) and Trustee and Member of the Finance, Audit and Quality Committees of Stanford Health Care (since 2016); Trustee of WNET, New York’s public media company (since 2011) and Member of the Audit Committee (since 2018), Investment Committee (since 2011) and Personnel Committee (since 2022); Chair (1994-2005) and Member (1992-2021) of the Investment Committee, Archdiocese of San Francisco; Trustee of Forward Funds (14 portfolios) (2009-2018); Trustee of Salient MF Trust (4 portfolios) (2015- 2018); Director (1998-2013) and President (2007-2011) of the Board of Directors, Catholic Charities CYO; Trustee (2002-2011) and Chair of the Finance and Investment Committee (2006-2010) of the Thacher School; Director of the Senior Center of Jackson Hole (since 2020); Director of the Jackson Hole Center for the Arts (since 2021); Member of the Wyoming State Investment Funds Committee (since 2022). | | Director of iShares, Inc. (since 2005); Trustee of iShares U.S. ETF Trust (since 2011). |
| | | |
| Drew E. Lawton (1959) | | Trustee (since 2017); 15(c) Committee Chair (since 2017). | | Senior Managing Director of New York Life Insurance Company (2010-2015). | | Director of iShares, Inc. (since 2017); Trustee of iShares U.S. ETF Trust (since 2017); Director of Jackson Financial Inc. (since 2021). |
| | | |
| John E. Martinez (1961) | | Trustee (since 2003); Securities Lending Committee Chair (since 2019). | | Director of Real Estate Equity Exchange, Inc. (since 2005); Director of Cloudera Foundation (2017-2020); and Director of Reading Partners (2012-2016). | | Director of iShares, Inc. (since 2003); Trustee of iShares U.S. ETF Trust (since 2011). |
| | | |
| Madhav V. Rajan (1964) | | Trustee (since 2011); Fixed Income Plus Committee Chair (since 2019). | | Dean, and George Pratt Shultz Professor of Accounting, University of Chicago Booth School of Business (since 2017); Advisory Board Member (since 2016) and Director (since 2020) of C.M. Capital Corporation; Chair of the Board for the Center for Research in Security Prices, LLC (since 2020); Robert K. Jaedicke Professor of Accounting, Stanford University Graduate School of Business (2001-2017); Professor of Law (by courtesy), Stanford Law School (2005-2017); Senior Associate Dean for Academic Affairs and Head of MBA Program, Stanford University Graduate School of Business (2010-2016). | | Director of iShares, Inc. (since 2011); Trustee of iShares U.S. ETF Trust (since 2011). |
| | | | |
| Officers |
| | | |
| Name (Year of Birth) | | Position(s) | | Principal Occupation(s) During Past 5 Years |
| | |
| Dominik Rohé (1973) | | President (since 2023). | | Managing Director, BlackRock, Inc. (since 2005); Head of Americas ETF and Index Investments (since 2023); Head of Latin America (2019- 2023). |
| | |
| Trent Walker (1974) | | Treasurer and Chief Financial Officer (since 2020). | | Managing Director, BlackRock, Inc. (since September 2019); Chief Financial Officer of iShares Delaware Trust Sponsor LLC, BlackRock Funds, BlackRock Funds II, BlackRock Funds IV, BlackRock Funds V and BlackRock Funds VI (since 2021); Executive Vice President of PIMCO (2016-2019); Senior Vice President of PIMCO (2008-2015); Treasurer (2013-2019) and Assistant Treasurer (2007-2017) of PIMCO Funds, PIMCO Variable Insurance Trust, PIMCO ETF Trust, PIMCO Equity Series, PIMCO Equity Series VIT, PIMCO Managed Accounts Trust, 2 PIMCO-sponsored interval funds and 21 PIMCO-sponsored closed-end funds. |
| | |
| Charles Park (1967) | | Chief Compliance Officer (since 2006). | | Chief Compliance Officer of BlackRock Advisors, LLC and the BlackRock-advised Funds in the BlackRock Multi-Asset Complex and the BlackRock Fixed-Income Complex (since 2014); Chief Compliance Officer of BFA (since 2006). |
| | |
| Marisa Rolland (1980) | | Secretary (since 2022). | | Managing Director, BlackRock, Inc. (since 2023); Director, BlackRock, Inc. (2018-2022); Vice President, BlackRock, Inc. (2010-2017). |
| | |
| Rachel Aguirre (1982) | | Executive Vice President (since 2022). | | Managing Director, BlackRock, Inc. (since 2018); Director, BlackRock, Inc. (2009-2018); Head of U.S. iShares Product (since 2022); Head of EII U.S. Product Engineering (since 2021); Co-Head of EII’s Americas Portfolio Engineering (2020-2021); Head of Developed Markets Portfolio Engineering (2016-2019). |
| | |
| Jennifer Hsui (1976) | | Executive Vice President (since 2022). | | Managing Director, BlackRock, Inc. (since 2009); Co-Head of Index Equity (since 2022). |
| | |
| James Mauro (1970) | | Executive Vice President (since 2022). | | Managing Director, BlackRock, Inc. (since 2010); Head of Fixed Income Index Investments in the Americas and Head of San Francisco Core Portfolio Management (since 2020). |
Effective June 15, 2022, Marisa Rolland replaced Deepa Damre Smith as Secretary.
| | |
| 44 | | 2 0 2 3 I SHARES ANNUAL REPORT TO SHAREHOLDERS |
Trustee and Officer Information (continued)
Effective March 30, 2023, Dominik Rohé replaced Armando Senra as President.
| | |
TRUSTEE AND OFFICER INFORMATION | | 45 |
General Information
Electronic Delivery
Shareholders can sign up for e-mail notifications announcing that the shareholder report or prospectus has been posted on the iShares website at iShares.com. Once you have enrolled, you will no longer receive prospectuses and shareholder reports in the mail.
To enroll in electronic delivery:
| | • | | If your brokerage firm is not listed, electronic delivery may not be available. Please contact your broker-dealer or financial advisor. |
Householding
Householding is an option available to certain fund investors. Householding is a method of delivery, based on the preference of the individual investor, in which a single copy of certain shareholder documents and Rule 30e-3 notices can be delivered to investors who share the same address, even if their accounts are registered under different names. Please contact your broker-dealer if you are interested in enrolling in householding and receiving a single copy of prospectuses and other shareholder documents, or if you are currently enrolled in householding and wish to change your householding status.
Availability of Quarterly Schedule of Investments
The Funds file their complete schedule of portfolio holdings with the SEC for the first and third quarters of each fiscal year as an exhibit to their reports on Form N-PORT. The Funds’ Forms N-PORT are available on the SEC’s website at sec.gov. Additionally, each Fund makes its portfolio holdings for the first and third quarters of each fiscal year available at iShares.com/fundreports.
Availability of Proxy Voting Policies and Proxy Voting Records
A description of the policies and procedures that the iShares Funds use to determine how to vote proxies relating to portfolio securities and information about how the iShares Funds voted proxies relating to portfolio securities during the most recent twelve-month period ending June 30 is available without charge, upon request (1) by calling toll-free 1-800-474-2737; (2) on the iShares website at iShares.com; and (3) on the SEC website at sec.gov.
A description of the Trust’s policies and procedures with respect to the disclosure of the Fund’s portfolio securities is available in the Fund Prospectus. The Fund discloses its portfolio holdings daily and provides information regarding its top holdings in Fund fact sheets at iShares.com.
| | |
| 46 | | 2 0 2 3 I SHARES ANNUAL REPORT TO SHAREHOLDERS |
Glossary of Terms Used in this Report
Portfolio Abbreviation
| | |
| NVS | | Non-Voting Shares |
| |
| REIT | | Real Estate Investment Trust |
| |
| S&P | | Standard & Poor’s |
| | |
GLOSSARY OF TERMS USED IN THIS REPORT | | 47 |
Want to know more?
iShares.com | 1-800-474-2737
This report is intended for the Funds’ shareholders. It may not be distributed to prospective investors unless it is preceded or accompanied by the current prospectus.
Investing involves risk, including possible loss of principal.
The iShares Funds are distributed by BlackRock Investments, LLC (together with its affiliates, “BlackRock”).
The iShares Funds are not sponsored, endorsed, issued, sold or promoted by FTSE Russell, nor does this company make any representation regarding the advisability of investing in the iShares Funds. BlackRock is not affiliated with teh company listed above.
©2022 BlackRock, Inc. All rights reserved. iSHARES and BLACKROCK are registered trademarks of BlackRock, Inc. or its subsidiaries. All other marks are the property of their respective owners.
iS-AR-305-0323
| | |

| | MARCH 31, 2023 |
iShares Trust
· iShares Russell 3000 ETF | IWV | NYSE Arca
· iShares Russell Mid-Cap Value ETF | IWS | NYSE Arca
The Markets in Review
Dear Shareholder,
Significant economic headwinds emerged during the 12-month reporting period ended March 31, 2023, as investors navigated changing economic conditions and volatile markets. The U.S. economy shrank in the first half of 2022 before returning to modest growth in the second half of the year, marking a shift to a more challenging post-reopening economic environment. Changes in consumer spending patterns and a tight labor market led to elevated inflation, which reached a 40-year high before beginning to moderate.
Equity prices fell as interest rates rose, particularly during the first half of the reporting period. Both large- and small-capitalization U.S. stocks declined, although equities began to recover in the second half of the period as inflation eased and economic growth resumed. Emerging market stocks and international equities from developed markets declined overall, pressured by rising interest rates and volatile commodities prices.
The 10-year U.S. Treasury yield rose during the reporting period, driving its price down, as investors reacted to fluctuating inflation data and attempted to anticipate its impact on future interest rate changes. The corporate bond market also faced inflationary headwinds, and higher interest rates led to rising borrowing costs for corporate issuers.
The U.S. Federal Reserve (the “Fed”), acknowledging that inflation has been more persistent than expected, raised interest rates eight times. Furthermore, the Fed wound down its bond-buying programs and accelerated the reduction of its balance sheet.
Restricted labor supply kept inflation elevated even as other inflation drivers, such as goods prices and energy costs, moderated. While economic growth slowed in the last year, we believe that taming inflation requires a more substantial decline that lowers demand to a level more in line with the economy’s productive capacity. Although the Fed has decelerated the pace of interest rate hikes, we believe that it still seems determined to get inflation back to target. With this in mind, we believe the possibility of a U.S. recession in the near-term is high, but the dimming economic outlook has not yet been fully reflected in current market prices. We believe investors should expect a period of higher volatility as markets adjust to the new economic reality and policymakers attempt to adapt to rapidly changing conditions. Turmoil in the banking sector late in the period highlighted the potential for the knock-on effects of substantially higher interest rates to disrupt markets with little warning.
While we favor an overweight to equities in the long term, we prefer an underweight stance on equities overall in the near term. Expectations for corporate earnings remain elevated, which seems inconsistent with the possibility of a recession. Nevertheless, we are overweight on emerging market stocks as we believe a weakening U.S. dollar provides a supportive backdrop. We also see long-term opportunities in credit, where we believe that valuations are appealing and higher yields provide attractive income, although we are neutral on credit in the near term, as we’re concerned about tightening credit and financial conditions. However, we believe there are still some strong opportunities for a six- to twelve-month horizon, particularly short-term U.S. Treasuries, global inflation-linked bonds, and emerging market bonds denominated in local currency.
Overall, our view is that investors need to think globally, position themselves to be prepared for a decarbonizing economy, and be nimble as market conditions change. We encourage you to talk with your financial advisor and visit iShares.com for further insight about investing in today’s markets.
Sincerely,

Rob Kapito
President, BlackRock, Inc.

Rob Kapito
President, BlackRock, Inc.
| | | | |
| Total Returns as of March 31, 2023 |
| | | |
| | | 6-Month | | 12-Month |
| | |
U.S. large cap equities
(S&P 500® Index) | | 15.62% | | (7.73)% |
| | |
U.S. small cap equities
(Russell 2000® Index) | | 9.14 | | (11.61) |
| | |
International equities
(MSCI Europe, Australasia, Far East Index) | | 27.27 | | (1.38) |
| | |
Emerging market equities
(MSCI Emerging Markets Index) | | 14.04 | | (10.70) |
| | |
3-month Treasury bills
(ICE BofA 3-Month U.S. Treasury Bill Index) | | 1.93 | | 2.52 |
| | |
U.S. Treasury securities
(ICE BofA 10-Year U.S. Treasury Index) | | 4.38 | | (6.90) |
| | |
U.S. investment grade bonds (Bloomberg U.S. Aggregate Bond Index) | | 4.89 | | (4.78) |
| | |
Tax-exempt municipal bonds (Bloomberg Municipal Bond Index) | | 7.00 | | 0.26 |
| | |
U.S. high yield bonds
(Bloomberg U.S. Corporate High Yield 2% Issuer Capped Index) | | 7.88 | | (3.35) |
|
Past performance is not an indication of future results. Index performance is shown for illustrative purposes only. You cannot invest directly in an index. |
| | |
| 2 | | T H I S P A G E I S N O T P A R T O F Y O U R F U N D R E P O R T |
Table of Contents
Market Overview
iShares Trust
Domestic Market Overview
U.S. stocks declined for the 12 months ended March 31, 2023 (“reporting period”), when the Russell 3000® Index, a broad measure of U.S. equity market performance, returned -8.58%. Elevated inflation and rapid tightening of monetary policy dampened growth and weighed on equities. Higher interest rates drove bond yields higher and increased borrowing costs for businesses and consumers. Equities began to recover in the second half of the reporting period, as the broader economy remained resilient and the pace of inflation declined. In March 2023, two banks suddenly failed, representing the second and third largest bank failures in U.S. history by asset value. This drove concern among investors about the resiliency of the financial system in the face of rapidly rising interest rates. However, government agencies acted swiftly to organize a sale of the failed banks’ assets and inject liquidity, and equity prices recovered.
Inflation was a significant driver of the economic outlook. As the reporting period began, the consumer price index, a widely followed measure of inflation, stood at multi-decade highs. Strong consumer spending and a tight labor market, along with continued supply chain disruptions in Asia, combined to drive prices higher. But the rate of inflation began to decline as the reporting period wore on, decelerating for nine consecutive months beginning in July 2022. Nonetheless, inflation remained elevated by historic standards, and higher prices negatively impacted both consumers and businesses.
The U.S. economy recovered from a decline in the first half of 2022 to post modest growth in the third and fourth quarters of 2022. Consumers continued to power the economy with growing spending, despite higher prices for many consumer goods and services. The strong labor market supported spending, as unemployment remained very low, at one point dropping to the lowest recorded level since 1969. Furthermore, the labor force participation rate—which measures the total proportion of employed persons of working age—rose, indicating that more people were being drawn into the labor force. Amid tightening labor supply, wages rose significantly, with the largest gains at the lower end of the wage spectrum.
To contain inflation, the U.S. Federal Reserve (“Fed”) tightened monetary policy rapidly, raising short-term interest rates eight times over the course of the reporting period. The pace of tightening accelerated as the Fed twice stepped up the increment of increase before reducing it again as inflation began to subside. The Fed also started to reduce the size of its balance sheet by reducing the store of U.S. Treasuries it had accumulated to stabilize markets in the early phases of the coronavirus pandemic. While the Fed indicated that more tightening could be needed to achieve its long-term inflation goal, it sounded a more cautious note about the potential for further interest rate increases near the end of the reporting period.
Despite economic headwinds, corporate profits remained robust, and many companies were able to sufficiently raise prices to preserve profit margins even in the face of rising labor and input costs. Nonetheless, profits declined overall in the fourth quarter of 2022, and the yield curve (a graphical representation of U.S. Treasury rates at different maturities) inverted, a sign that markets were concerned about the impact of higher borrowing costs on the economy. Furthermore, dwindling personal savings and rising household debt raised questions about the sustainability of consumer spending as an engine of economic growth.
| | |
| 4 | | 2 0 2 3 I S H A R E S A N N U A L R E P O R T T O S H A R E H O L D E R S |
| | |
| Fund Summary as of March 31, 2023 | | iShares® Russell 3000 ETF |
Investment Objective
The iShares Russell 3000 ETF (the “Fund”) seeks to track the investment results of a broad-based index composed of U.S. equities, as represented by the Russell 3000® Index (the “Index”). The Fund invests in a representative sample of securities included in the Index that collectively has an investment profile similar to the Index. Due to the use of representative sampling, the Fund may or may not hold all of the securities that are included in the Index.
Performance
| | | | | | | | | | | | | | | | | | | | | | | | | | | | |
| | | Average Annual Total Returns | | | | | | Cumulative Total Returns | |
| | | | | | | |
| | | | 1 Year | | | | 5 Years | | | | 10 Years | | | | | | | | 1 Year | | | | 5 Years | | | | 10 Years | |
| | | | | | | |
Fund NAV | | | (8.72 | )% | | | 10.26 | % | | | 11.55 | % | | | | | | | (8.72 | )% | | | 62.99 | % | | | 198.23 | % |
| | | | | | | |
Fund Market | | | (8.86 | ) | | | 10.25 | | | | 11.55 | | | | | | | | (8.86 | ) | | | 62.87 | | | | 198.30 | |
| | | | | | | |
Index | | | (8.58 | ) | | | 10.45 | | | | 11.73 | | | | | | | | (8.58 | ) | | | 64.37 | | | | 203.26 | |
GROWTH OF $10,000 INVESTMENT
(AT NET ASSET VALUE)
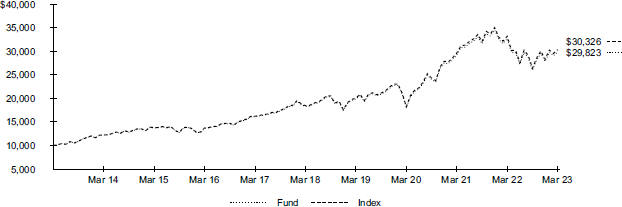
Past performance is not an indication of future results. Performance results do not reflect the deduction of taxes that a shareholder would pay on fund distributions or on the redemption or sale of fund shares. See “About Fund Performance” for more information.
Expense Example
| | | | | | | | | | | | | | | | | | | | | | | | | | | | |
Actual | | | | | | Hypothetical 5% Return | | | | |
| | | | | | | | | | | | | | | | | | | | | | |
Beginning Account Value (10/01/22) | |
| Ending
Account Value (03/31/23) |
| |
| Expenses
Paid During the Period |
(a) | | | | | |
| Beginning
Account Value (10/01/22) |
| |
| Ending
Account Value (03/31/23) |
| |
| Expenses
Paid During the Period |
(a) | |
| Annualized
Expense Ratio |
|
| | | | | | | |
$ 1,000.00 | | | $ 1,147.90 | | | | $ 1.07 | | | | | | | | $ 1,000.00 | | | | $ 1,023.93 | | | | $ 1.01 | | | | 0.20 | % |
| (a) | Expenses are equal to the annualized expense ratio, multiplied by the average account value over the period, multiplied by 182/365 (to reflect the one-half year period shown). Other fees, such as brokerage commissions and other fees to financial intermediaries, may be paid which are not reflected in the tables and examples above. See “Disclosure of Expenses” for more information. |
| | |
| Fund Summary as of March 31, 2023 (continued) | | iShares® Russell 3000 ETF |
Portfolio Management Commentary
U.S. stocks declined for the reporting period, as high inflation and tighter financial conditions impeded economic growth and weighed on equities. The consumer discretionary sector detracted the most from the Index’s return, primarily due to weakness in the internet and direct marketing retail industry. The pandemic-related rise in e-commerce waned, as more workers returned to the office and brick-and-mortar retailers gained market share. Slowing revenue growth from data cloud services further pressured the industry, as business customers reduced expenditures amid economic uncertainty. The automobiles industry also declined amid concerns about the market for electric vehicles (“EVs”) in the weakening economy. While EV sales grew, production did not meet analysts’ expectations.
The information technology sector detracted significantly from the Index’s return, as sharply higher interest rates lowered the current value of future earnings. The software and services industry declined, as cuts to corporate information technology budgets reduced revenue growth. Slowing growth in cloud-based software sales, which provide software companies with steady revenue streams, further constrained earnings. Changing consumer behavior patterns pressured the IT services industry, as a return to in-person spending meant slowing revenue growth for online payment platforms.
The financials sector also detracted amid tightening financial conditions. The banking industry faced significant challenges as the potential impact of a slowing economy outweighed the benefits of being able to charge more for loans. Bank stocks were further pressured late in the reporting period after the sudden failure of two regional banks. The financial services industry also faced headwinds, as declining prices for stocks and bonds reduced assets under management, diminishing profits.
On the upside, the energy sector contributed to performance. Relatively high average prices of energy commodities following Russia’s invasion of Ukraine boosted the oil, gas, and consumable fuels industry.
Portfolio Information
SECTOR ALLOCATION
| | |
| | |
| Sector | | Percent of Total Investments(a) |
| |
Information Technology | | 24.6% |
| |
Health Care | | 14.1 |
| |
Financials | | 13.4 |
| |
Consumer Discretionary | | 10.3 |
| |
Industrials | | 9.9 |
| |
Communication Services | | 7.6 |
| |
Consumer Staples | | 6.6 |
| |
Energy | | 4.7 |
| |
Real Estate | | 3.1 |
| |
Materials | | 2.9 |
| |
Utilities | | 2.8 |
TEN LARGEST HOLDINGS
| | |
| | |
| Security | | Percent of
Total Investments(a) |
| |
Apple Inc. | | 6.2% |
| |
Microsoft Corp. | | 5.4 |
| |
Amazon.com, Inc. | | 2.3 |
| |
NVIDIA Corp. | | 1.7 |
| |
Alphabet, Inc., Class A | | 1.6 |
| |
Berkshire Hathaway, Inc., Class B | | 1.4 |
| |
Alphabet, Inc., Class C, NVS | | 1.4 |
| |
Tesla, Inc. | | 1.4 |
| |
Meta Platforms, Inc., Class A | | 1.2 |
| |
Exxon Mobil Corp. | | 1.1 |
| (a) | Excludes money market funds. |
| | |
| 6 | | 2 0 2 3 I S H A R E S A N N U A L R E P O R T T O S H A R E H O L D E R S |
| | |
| Fund Summary as of March 31, 2023 | | iShares® Russell Mid-Cap Value ETF |
Investment Objective
The iShares Russell Mid-Cap Value ETF (the “Fund”) seeks to track the investment results of an index composed of mid-capitalization U.S. equities that exhibit value characteristics, as represented by the Russell MidCap® Value Index (the “Index”). The Fund invests in a representative sample of securities included in the Index that collectively has an investment profile similar to the Index. Due to the use of representative sampling, the Fund may or may not hold all of the securities that are included in the Index.
Performance
| | | | | | | | | | | | | | | | | | | | | | | | | | |
| | | Average Annual Total Returns | | | | | Cumulative Total Returns | |
| | | | | | | |
| | | 1 Year | | | 5 Years | | | 10 Years | | | | | 1 Year | | | 5 Years | | | 10 Years | |
| | | | | | | |
Fund NAV | | | (9.37 | )% | | | 6.34 | % | | 8.58% | | | | | | | (9.37 | )% | | | 36.00 | % | | | 127.71 | % |
| | | | | | | |
Fund Market | | | (9.44 | ) | | | 6.35 | | | 8.58 | | | | | | | (9.44 | ) | | | 36.05 | | | | 127.81 | |
| | | | | | | |
Index | | | (9.22 | ) | | | 6.54 | | | 8.80 | | | | | | | (9.22 | ) | | | 37.24 | | | | 132.37 | |
GROWTH OF $10,000 INVESTMENT
(AT NET ASSET VALUE)
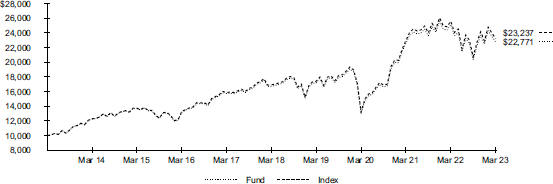
Past performance is not an indication of future results. Performance results do not reflect the deduction of taxes that a shareholder would pay on fund distributions or on the redemption or sale of fund shares. See “About Fund Performance” for more information.
Expense Example
| | | | | | | | | | | | | | | | | | | | | | | | | | | | |
Actual | | | | | | Hypothetical 5% Return | | | | |
| | | | | | | | | | | | | | | | | | | | | | |
Beginning Account Value (10/01/22) | |
| Ending
Account Value
(03/31/23) |
| |
| Expenses
Paid During
the Period |
(a) | | | | | |
| Beginning
Account Value
(10/01/22) |
| |
| Ending
Account Value
(03/31/23) |
| |
| Expenses
Paid During
the Period |
(a) | |
| Annualized
Expense
Ratio |
|
| | | | | | | |
$ 1,000.00 | | | $ 1,118.20 | | | | $ 1.24 | | | | | | | | $ 1,000.00 | | | | $ 1,023.76 | | | | $ 1.16 | | | | 0.23 | % |
| (a) | Expenses are equal to the annualized expense ratio, multiplied by the average account value over the period, multiplied by 182/365 (to reflect the one-half year period shown). Other fees, such as brokerage commissions and other fees to financial intermediaries, may be paid which are not reflected in the tables and examples above. See “Disclosure of Expenses” for more information. |
| | |
| Fund Summary as of March 31, 2023 (continued) | | iShares® Russell Mid-Cap Value ETF |
Portfolio Management Commentary
Value-oriented mid-capitalization U.S. stocks declined for the reporting period, as high inflation and tighter financial conditions impeded economic growth and weighed on equities. The financials sector detracted the most from the Index’s performance amid tightening financial conditions. The banking industry faced significant challenges as the potential impact of a slowing economy outweighed the benefits of being able to charge more for loans. Persistently high inflation led to significant tightening from the Fed, and investors became concerned about the long-term effect of this tightening on loan growth and credit losses. Bank stocks were further pressured late in the reporting period after the sudden failure of two regional banks, as markets digested the long-term implications of the disruption, including a potential slowdown in lending activity.
The real estate sector detracted significantly from the Index’s return, as higher interest rates and changing usage patterns weighed on the sector. Equity real estate investment trusts (“REITs”) were the largest source of weakness. REITs typically take on substantial debt to finance the purchase of the properties they manage. Higher interest rates make financing more expensive for REITs. Furthermore, higher interest rates also meant increased bond yields, making dividend yields from REITs comparatively less attractive to income-oriented investors, although many REITs raised dividends during the reporting period.
The information technology sector also detracted. Interest rates rose sharply during the reporting period, which reduced the current value of future earnings. Furthermore, increased concerns about economic growth lowered investors’ growth expectations for information technology stocks. The software and services industry declined, as cuts to corporate information technology budgets pressured revenue growth.
On the upside, the industrials sector contributed to the Index’s return, driven by the machinery industry. Improvements in machine efficiency and increased demand for automation boosted industry revenue.
Portfolio Information
SECTOR ALLOCATION
| | |
| | |
| Sector | | Percent of Total Investments(a) |
| |
Financials | | 17.0% |
| |
Industrials | | 16.9 |
| |
Real Estate | | 10.4 |
| |
Consumer Discretionary | | 10.1 |
| |
Utilities | | 8.9 |
| |
Information Technology | | 8.7 |
| |
Materials | | 7.8 |
| |
Health Care | | 7.4 |
| |
Energy | | 5.0 |
| |
Consumer Staples | | 4.5 |
| |
Communication Services | | 3.3 |
TEN LARGEST HOLDINGS
| | |
| | |
| Security | | Percent of Total Investments(a) |
| |
Phillips 66 | | 0.8% |
| |
Motorola Solutions, Inc. | | 0.8 |
| |
Corteva, Inc. | | 0.7 |
| |
Biogen, Inc. | | 0.7 |
| |
Realty Income Corp. | | 0.7 |
| |
Nucor Corp. | | 0.7 |
| |
Aflac, Inc. | | 0.6 |
| |
Carrier Global Corp. | | 0.6 |
| |
PACCAR, Inc. | | 0.6 |
| |
Xcel Energy, Inc. | | 0.6 |
| (a) | Excludes money market funds. |
| | |
| 8 | | 2 0 2 3 I S H A R E S A N N U A L R E P O R T T O S H A R E H O L D E R S |
About Fund Performance
Past performance is not an indication of future results. Financial markets have experienced extreme volatility and trading in many instruments has been disrupted. These circumstances may continue for an extended period of time and may continue to affect adversely the value and liquidity of each Fund’s investments. As a result, current performance may be lower or higher than the performance data quoted. Performance data current to the most recent month-end is available at iShares.com. Performance results assume reinvestment of all dividends and capital gain distributions and do not reflect the deduction of taxes that a shareholder would pay on fund distributions or on the redemption or sale of fund shares. The investment return and principal value of shares will vary with changes in market conditions. Shares may be worth more or less than their original cost when they are redeemed or sold in the market. Performance for certain funds may reflect a waiver of a portion of investment advisory fees. Without such a waiver, performance would have been lower.
Net asset value or “NAV” is the value of one share of a fund as calculated in accordance with the standard formula for valuing mutual fund shares. Beginning August 10, 2020, the price used to calculate market return (“Market Price”) is the closing price. Prior to August 10, 2020, Market Price was determined using the midpoint between the highest bid and the lowest ask on the primary stock exchange on which shares of a fund are listed for trading, as of the time that such fund’s NAV is calculated. Market and NAV returns assume that dividends and capital gain distributions have been reinvested at Market Price and NAV, respectively.
An index is a statistical composite that tracks a specified financial market or sector. Unlike a fund, an index does not actually hold a portfolio of securities and therefore does not incur the expenses incurred by a fund. These expenses negatively impact fund performance. Also, market returns do not include brokerage commissions that may be payable on secondary market transactions. If brokerage commissions were included, market returns would be lower.
Disclosure of Expenses
Shareholders of each Fund may incur the following charges: (1) transactional expenses, including brokerage commissions on purchases and sales of fund shares and (2) ongoing expenses, including management fees and other fund expenses. The expense examples shown (which are based on a hypothetical investment of $1,000 invested at the beginning of the period and held through the end of the period) are intended to assist shareholders both in calculating expenses based on an investment in each Fund and in comparing these expenses with similar costs of investing in other funds.
The expense examples provide information about actual account values and actual expenses. Annualized expense ratios reflect contractual and voluntary fee waivers, if any. In order to estimate the expenses a shareholder paid during the period covered by this report, shareholders can divide their account value by $1,000 and then multiply the result by the number under the heading entitled “Expenses Paid During the Period.”
The expense examples also provide information about hypothetical account values and hypothetical expenses based on a fund’s actual expense ratio and an assumed rate of return of 5% per year before expenses. In order to assist shareholders in comparing the ongoing expenses of investing in the Funds and other funds, compare the 5% hypothetical examples with the 5% hypothetical examples that appear in the shareholder reports of the other funds.
The expenses shown in the expense examples are intended to highlight shareholders’ ongoing costs only and do not reflect any transactional expenses, such as brokerage commissions and other fees paid on purchases and sales of fund shares. Therefore, the hypothetical examples are useful in comparing ongoing expenses only and will not help shareholders determine the relative total expenses of owning different funds. If these transactional expenses were included, shareholder expenses would have been higher.
| | |
ABOUT FUND PERFORMANCE / D I S C L O S U R E O F EXPENSES | | 9 |
| | |
Schedule of Investments March 31, 2023 | | iShares® Russell 3000 ETF (Percentages shown are based on Net Assets) |
| | | | | | | | |
| Security | | Shares | | | Value | |
| | |
Common Stocks | | | | | | | | |
| | |
Aerospace & Defense — 1.7% | | | | | | | | |
AAR Corp.(a) | | | 9,392 | | | $ | 512,334 | |
Aerojet Rocketdyne Holdings, Inc.(a) | | | 19,909 | | | | 1,118,289 | |
AeroVironment, Inc.(a)(b) | | | 5,870 | | | | 538,044 | |
AerSale Corp.(a) | | | 7,435 | | | | 128,031 | |
Archer Aviation, Inc., Class A(a)(b) | | | 41,067 | | | | 117,452 | |
Astronics Corp.(a) | | | 7,715 | | | | 103,072 | |
Axon Enterprise, Inc.(a) | | | 17,831 | | | | 4,009,300 | |
Boeing Co.(a) | | | 147,656 | | | | 31,366,564 | |
BWX Technologies, Inc. | | | 25,225 | | | | 1,590,184 | |
Cadre Holdings, Inc. | | | 6,713 | | | | 144,598 | |
Curtiss-Wright Corp. | | | 10,052 | | | | 1,771,765 | |
Ducommun, Inc.(a) | | | 2,615 | | | | 143,067 | |
General Dynamics Corp. | | | 64,934 | | | | 14,818,588 | |
HEICO Corp. | | | 11,906 | | | | 2,036,402 | |
HEICO Corp., Class A | | | 20,700 | | | | 2,813,130 | |
Hexcel Corp. | | | 21,567 | | | | 1,471,948 | |
Howmet Aerospace, Inc. | | | 98,040 | | | | 4,153,955 | |
Huntington Ingalls Industries, Inc. | | | 10,299 | | | | 2,132,099 | |
Kaman Corp. | | | 7,951 | | | | 181,760 | |
Kratos Defense & Security Solutions, Inc.(a) | | | 33,510 | | | | 451,715 | |
L3Harris Technologies, Inc. | | | 50,883 | | | | 9,985,280 | |
Lockheed Martin Corp. | | | 60,670 | | | | 28,680,529 | |
Maxar Technologies, Inc. | | | 20,039 | | | | 1,023,191 | |
Mercury Systems, Inc.(a) | | | 13,138 | | | | 671,615 | |
Moog, Inc., Class A | | | 7,692 | | | | 774,969 | |
National Presto Industries, Inc. | | | 2,245 | | | | 161,842 | |
Northrop Grumman Corp. | | | 38,541 | | | | 17,795,150 | |
Park Aerospace Corp. | | | 6,379 | | | | 85,798 | |
Parsons Corp.(a) | | | 8,138 | | | | 364,094 | |
Raytheon Technologies Corp. | | | 391,912 | | | | 38,379,942 | |
Rocket Lab U.S.A., Inc., Class A(a)(b) | | | 61,684 | | | | 249,203 | |
Spirit AeroSystems Holdings, Inc., Class A | | | 28,240 | | | | 975,127 | |
Textron, Inc. | | | 55,190 | | | | 3,898,070 | |
TransDigm Group, Inc. | | | 13,759 | | | | 10,141,071 | |
Triumph Group, Inc.(a) | | | 15,954 | | | | 184,907 | |
V2X, Inc.(a) | | | 3,345 | | | | 132,863 | |
Virgin Galactic Holdings, Inc., Class A(a)(b) | | | 66,592 | | | | 269,698 | |
Woodward, Inc. | | | 15,378 | | | | 1,497,356 | |
| | | | | | | | |
| | |
| | | | | | | 184,873,002 | |
| | |
| Air Freight & Logistics — 0.6% | | | | | | |
Air Transport Services Group, Inc.(a) | | | 15,863 | | | | 330,426 | |
CH Robinson Worldwide, Inc. | | | 30,792 | | | | 3,059,801 | |
Expeditors International of Washington, Inc. | | | 42,113 | | | | 4,637,484 | |
FedEx Corp. | | | 62,503 | | | | 14,281,311 | |
Forward Air Corp. | | | 7,341 | | | | 791,066 | |
GXO Logistics, Inc.(a) | | | 28,153 | | | | 1,420,600 | |
Hub Group, Inc., Class A(a) | | | 8,683 | | | | 728,851 | |
United Parcel Service, Inc., Class B | | | 196,001 | | | | 38,022,234 | |
| | | | | | | | |
| | |
| | | | | | | 63,271,773 | |
| | |
| Automobile Components — 0.2% | | | | | | |
Adient PLC(a) | | | 24,885 | | | | 1,019,290 | |
American Axle & Manufacturing Holdings, Inc.(a) | | | 30,183 | | | | 235,729 | |
Aptiv PLC(a) | | | 72,472 | | | | 8,130,634 | |
BorgWarner, Inc. | | | 62,473 | | | | 3,068,049 | |
Dana, Inc. | | | 34,147 | | | | 513,912 | |
Dorman Products, Inc.(a) | | | 7,423 | | | | 640,308 | |
Fox Factory Holding Corp.(a)(b) | | | 11,243 | | | | 1,364,563 | |
Gentex Corp. | | | 62,823 | | | | 1,760,929 | |
Gentherm, Inc.(a) | | | 8,474 | | | | 511,999 | |
Goodyear Tire & Rubber Co.(a) | | | 75,348 | | | | 830,335 | |
| | | | | | | | |
| Security | | Shares | | | Value | |
| | |
Automobile Components (continued) | | | | | | | | |
LCI Industries | | | 6,965 | | | $ | 765,244 | |
Lear Corp. | | | 15,954 | | | | 2,225,423 | |
Luminar Technologies, Inc.(a)(b) | | | 66,232 | | | | 429,846 | |
Modine Manufacturing Co.(a) | | | 11,758 | | | | 271,022 | |
Patrick Industries, Inc.(b) | | | 5,904 | | | | 406,254 | |
QuantumScape Corp., Class A(a)(b) | | | 64,417 | | | | 526,931 | |
Solid Power, Inc.(a) | | | 37,878 | | | | 114,013 | |
Standard Motor Products, Inc. | | | 5,095 | | | | 188,056 | |
Stoneridge, Inc.(a) | | | 6,844 | | | | 127,983 | |
Visteon Corp.(a) | | | 6,994 | | | | 1,096,869 | |
XPEL, Inc.(a) | | | 6,648 | | | | 451,732 | |
| | | | | | | | |
| | |
| | | | | | | 24,679,121 | |
| | |
| Automobiles — 1.7% | | | | | | |
Canoo, Inc.(a)(b) | | | 71,344 | | | | 46,559 | |
Fisker, Inc.(a)(b) | | | 41,193 | | | | 252,925 | |
Ford Motor Co. | | | 1,051,617 | | | | 13,250,374 | |
General Motors Co. | | | 371,856 | | | | 13,639,678 | |
Harley-Davidson, Inc. | | | 35,685 | | | | 1,354,960 | |
Lordstown Motors Corp., Class A(a)(b) | | | 63,623 | | | | 42,188 | |
Lucid Group, Inc.(a)(b) | | | 155,127 | | | | 1,247,221 | |
Rivian Automotive, Inc., Class A(a)(b) | | | 138,210 | | | | 2,139,491 | |
Tesla, Inc.(a) | | | 689,109 | | | | 142,962,553 | |
Thor Industries, Inc. | | | 14,546 | | | | 1,158,443 | |
Winnebago Industries, Inc.(b) | | | 7,835 | | | | 452,080 | |
Workhorse Group, Inc.(a)(b) | | | 35,452 | | | | 47,151 | |
| | | | | | | | |
| | |
| | | | | | | 176,593,623 | |
| | |
| Banks — 3.4% | | | | | | |
1st Source Corp. | | | 4,047 | | | | 174,628 | |
ACNB Corp. | | | 3,182 | | | | 103,574 | |
Amalgamated Financial Corp. | | | 5,075 | | | | 89,777 | |
Amerant Bancorp, Inc., Class A | | | 7,764 | | | | 168,945 | |
American National Bankshares, Inc. | | | 3,346 | | | | 106,068 | |
Ameris Bancorp | | | 16,322 | | | | 597,059 | |
Arrow Financial Corp. | | | 4,849 | | | | 120,789 | |
Associated Banc-Corp. | | | 39,591 | | | | 711,846 | |
Atlantic Union Bankshares Corp. | | | 19,288 | | | | 676,044 | |
Axos Financial, Inc.(a) | | | 15,549 | | | | 574,069 | |
Banc of California, Inc. | | | 14,370 | | | | 180,056 | |
BancFirst Corp. | | | 4,744 | | | | 394,226 | |
Bancorp, Inc.(a) | | | 12,700 | | | | 353,695 | |
Bank First Corp.(b) | | | 1,644 | | | | 120,966 | |
Bank of America Corp. | | | 1,872,661 | | | | 53,558,105 | |
Bank of Hawaii Corp.(b) | | | 10,456 | | | | 544,548 | |
Bank of Marin Bancorp | | | 4,508 | | | | 98,680 | |
Bank of NT Butterfield & Son Ltd. | | | 14,064 | | | | 379,728 | |
Bank OZK | | | 29,543 | | | | 1,010,371 | |
BankUnited, Inc. | | | 20,095 | | | | 453,745 | |
Banner Corp. | | | 9,732 | | | | 529,129 | |
Bar Harbor Bankshares | | | 4,816 | | | | 127,383 | |
BCB Bancorp, Inc. | | | 5,763 | | | | 75,668 | |
Berkshire Hills Bancorp, Inc. | | | 11,818 | | | | 296,159 | |
Blue Foundry Bancorp(a) | | | 8,872 | | | | 84,461 | |
BOK Financial Corp. | | | 7,803 | | | | 658,651 | |
Bridgewater Bancshares, Inc.(a) | | | 8,181 | | | | 88,682 | |
Brookline Bancorp, Inc. | | | 17,954 | | | | 188,517 | |
Business First Bancshares, Inc. | | | 6,549 | | | | 112,184 | |
Byline Bancorp, Inc. | | | 7,366 | | | | 159,253 | |
Cadence Bank | | | 38,189 | | | | 792,804 | |
Cambridge Bancorp | | | 1,678 | | | | 108,751 | |
Camden National Corp. | | | 3,726 | | | | 134,844 | |
Capital City Bank Group, Inc. | | | 4,570 | | | | 133,947 | |
Capitol Federal Financial, Inc. | | | 39,520 | | | | 265,970 | |
| | |
| 10 | | 2 0 2 3 I S H A R E S A N N U A L R E P O R T T O S H A R E H O L D E R S |
| | |
Schedule of Investments (continued) March 31, 2023 | | iShares® Russell 3000 ETF (Percentages shown are based on Net Assets) |
| | | | | | | | |
| Security | | Shares | | | Value | |
| | |
Banks (continued) | | | | | | | | |
Capstar Financial Holdings, Inc. | | | 5,912 | | | $ | 89,567 | |
Carter Bankshares, Inc.(a) | | | 8,320 | | | | 116,480 | |
Cathay General Bancorp | | | 17,836 | | | | 615,699 | |
Central Pacific Financial Corp. | | | 8,258 | | | | 147,818 | |
Citigroup, Inc. | | | 516,115 | | | | 24,200,632 | |
Citizens & Northern Corp. | | | 5,817 | | | | 124,367 | |
Citizens Financial Group, Inc. | | | 128,693 | | | | 3,908,406 | |
City Holding Co. | | | 4,234 | | | | 384,786 | |
Civista Bancshares, Inc. | | | 6,038 | | | | 101,921 | |
CNB Financial Corp. | | | 5,073 | | | | 97,402 | |
Coastal Financial Corp.(a)(b) | | | 2,800 | | | | 100,828 | |
Colony Bankcorp, Inc. | | | 11,978 | | | | 122,176 | |
Columbia Banking System, Inc. | | | 54,574 | | | | 1,168,975 | |
Columbia Financial, Inc.(a) | | | 8,622 | | | | 157,610 | |
Comerica, Inc. | | | 34,001 | | | | 1,476,323 | |
Commerce Bancshares, Inc. | | | 30,372 | | | | 1,772,206 | |
Community Bank System, Inc. | | | 14,122 | | | | 741,264 | |
Community Trust Bancorp, Inc. | | | 3,852 | | | | 146,183 | |
ConnectOne Bancorp, Inc. | | | 10,448 | | | | 184,721 | |
CrossFirst Bankshares, Inc.(a)(b) | | | 12,872 | | | | 134,899 | |
Cullen/Frost Bankers, Inc. | | | 15,115 | | | | 1,592,214 | |
Customers Bancorp, Inc.(a) | | | 7,353 | | | | 136,178 | |
CVB Financial Corp. | | | 34,654 | | | | 578,029 | |
Dime Community Bancshares, Inc. | | | 9,577 | | | | 217,589 | |
Eagle Bancorp, Inc. | | | 8,669 | | | | 290,151 | |
East West Bancorp, Inc. | | | 37,341 | | | | 2,072,426 | |
Eastern Bankshares, Inc. | | | 40,276 | | | | 508,283 | |
Enterprise Bancorp, Inc. | | | 4,082 | | | | 128,420 | |
Enterprise Financial Services Corp. | | | 9,370 | | | | 417,808 | |
Equity Bancshares, Inc., Class A | | | 3,974 | | | | 96,846 | |
Esquire Financial Holdings, Inc. | | | 2,276 | | | | 88,992 | |
Farmers & Merchants Bancorp, Inc. | | | 4,356 | | | | 105,938 | |
Farmers National Banc Corp. | | | 10,834 | | | | 136,942 | |
FB Financial Corp. | | | 10,423 | | | | 323,947 | |
Fifth Third Bancorp | | | 181,056 | | | | 4,823,332 | |
Financial Institutions, Inc. | | | 4,631 | | | | 89,286 | |
First Bancorp, Inc. | | | 3,793 | | | | 98,201 | |
First BanCorp/Puerto Rico | | | 48,397 | | | | 552,694 | |
First Bancorp/Southern Pines NC | | | 8,919 | | | | 316,803 | |
First Bancshares, Inc. | | | 5,044 | | | | 130,287 | |
First Busey Corp. | | | 14,003 | | | | 284,821 | |
First Business Financial Services, Inc. | | | 3,316 | | | | 101,171 | |
First Citizens BancShares, Inc., Class A(b) | | | 2,923 | | | | 2,844,371 | |
First Commonwealth Financial Corp. | | | 23,135 | | | | 287,568 | |
First Community Bankshares, Inc. | | | 4,414 | | | | 110,571 | |
First Financial Bancorp | | | 24,566 | | | | 534,802 | |
First Financial Bankshares, Inc. | | | 34,516 | | | | 1,101,060 | |
First Financial Corp. | | | 2,801 | | | | 104,981 | |
First Foundation, Inc. | | | 11,623 | | | | 86,591 | |
First Hawaiian, Inc. | | | 35,437 | | | | 731,065 | |
First Horizon Corp. | | | 139,036 | | | | 2,472,060 | |
First Internet Bancorp | | | 4,142 | | | | 68,964 | |
First Interstate BancSystem, Inc., Class A | | | 23,714 | | | | 708,100 | |
First Merchants Corp. | | | 14,341 | | | | 472,536 | |
First Mid Bancshares, Inc. | | | 3,360 | | | | 91,459 | |
First of Long Island Corp. | | | 6,616 | | | | 89,316 | |
First Republic Bank(b) | | | 48,345 | | | | 676,347 | |
Five Star Bancorp | | | 3,927 | | | | 83,802 | |
Flushing Financial Corp. | | | 7,579 | | | | 112,851 | |
FNB Corp. | | | 94,086 | | | | 1,091,398 | |
Fulton Financial Corp. | | | 44,061 | | | | 608,923 | |
German American Bancorp, Inc. | | | 6,503 | | | | 217,005 | |
| | | | | | | | |
| Security | | Shares | | | Value | |
| | |
Banks (continued) | | | | | | | | |
Glacier Bancorp, Inc. | | | 28,500 | | | $ | 1,197,285 | |
Great Southern Bancorp, Inc. | | | 2,585 | | | | 131,008 | |
Guaranty Bancshares, Inc. | | | 3,130 | | | | 87,233 | |
Hancock Whitney Corp. | | | 23,650 | | | | 860,860 | |
Hanmi Financial Corp. | | | 8,508 | | | | 157,994 | |
HarborOne Bancorp, Inc. | | | 17,089 | | | | 208,486 | |
HBT Financial, Inc. | | | 5,134 | | | | 101,242 | |
Heartland Financial U.S.A., Inc. | | | 9,649 | | | | 370,136 | |
Heritage Commerce Corp. | | | 16,550 | | | | 137,862 | |
Heritage Financial Corp. | | | 9,192 | | | | 196,709 | |
Hilltop Holdings, Inc. | | | 13,830 | | | | 410,336 | |
Hingham Institution For Savings | | | 467 | | | | 109,016 | |
Home Bancorp, Inc. | | | 2,904 | | | | 95,919 | |
Home BancShares, Inc. | | | 52,538 | | | | 1,140,600 | |
HomeStreet, Inc. | | | 4,842 | | | | 87,108 | |
HomeTrust Bancshares, Inc. | | | 5,442 | | | | 133,819 | |
Hope Bancorp, Inc. | | | 29,353 | | | | 288,246 | |
Horizon Bancorp, Inc. | | | 10,570 | | | | 116,904 | |
Huntington Bancshares, Inc. | | | 384,322 | | | | 4,304,406 | |
Independent Bank Corp. | | | 12,027 | | | | 789,212 | |
Independent Bank Corp. | | | 5,170 | | | | 91,871 | |
Independent Bank Group, Inc. | | | 9,221 | | | | 427,393 | |
International Bancshares Corp. | | | 14,674 | | | | 628,341 | |
John Marshall Bancorp, Inc. | | | 5,911 | | | | 127,678 | |
JPMorgan Chase & Co. | | | 777,715 | | | | 101,344,042 | |
Kearny Financial Corp. | | | 15,682 | | | | 127,338 | |
KeyCorp | | | 244,750 | | | | 3,064,270 | |
Lakeland Bancorp, Inc. | | | 17,687 | | | | 276,625 | |
Lakeland Financial Corp. | | | 6,035 | | | | 378,032 | |
Live Oak Bancshares, Inc.(b) | | | 8,482 | | | | 206,706 | |
M&T Bank Corp. | | | 46,148 | | | | 5,517,916 | |
Macatawa Bank Corp. | | | 10,070 | | | | 102,915 | |
Mercantile Bank Corp. | | | 4,770 | | | | 145,867 | |
Metrocity Bankshares, Inc. | | | 7,589 | | | | 129,696 | |
Metropolitan Bank Holding Corp.(a) | | | 2,466 | | | | 83,573 | |
Mid Penn Bancorp, Inc. | | | 5,609 | | | | 143,646 | |
Midland States Bancorp, Inc. | | | 6,252 | | | | 133,918 | |
MidWestOne Financial Group, Inc. | | | 6,080 | | | | 148,474 | |
National Bank Holdings Corp., Class A | | | 8,104 | | | | 271,160 | |
NBT Bancorp, Inc. | | | 11,816 | | | | 398,317 | |
New York Community Bancorp, Inc., Class A | | | 175,387 | | | | 1,585,498 | |
Nicolet Bankshares, Inc.(a)(b) | | | 3,271 | | | | 206,237 | |
Northeast Bank | | | 2,857 | | | | 96,167 | |
Northfield Bancorp, Inc. | | | 12,444 | | | | 146,590 | |
Northwest Bancshares, Inc. | | | 26,773 | | | | 322,079 | |
OceanFirst Financial Corp. | | | 15,196 | | | | 280,822 | |
OFG Bancorp | | | 11,498 | | | | 286,760 | |
Old National Bancorp | | | 77,021 | | | | 1,110,643 | |
Old Second Bancorp, Inc. | | | 11,950 | | | | 168,017 | |
Origin Bancorp, Inc. | | | 7,029 | | | | 225,982 | |
Orrstown Financial Services, Inc. | | | 6,384 | | | | 126,786 | |
Pacific Premier Bancorp, Inc. | | | 22,786 | | | | 547,320 | |
PacWest Bancorp(b) | | | 29,592 | | | | 287,930 | |
Park National Corp. | | | 3,568 | | | | 423,058 | |
Pathward Financial, Inc. | | | 7,353 | | | | 305,076 | |
Peapack-Gladstone Financial Corp. | | | 4,858 | | | | 143,894 | |
Peoples Bancorp, Inc. | | | 5,476 | | | | 141,007 | |
Peoples Financial Services Corp. | | | 3,244 | | | | 140,627 | |
Pinnacle Financial Partners, Inc. | | | 20,297 | | | | 1,119,583 | |
PNC Financial Services Group, Inc. | | | 106,986 | | | | 13,597,921 | |
Popular, Inc. | | | 19,217 | | | | 1,103,248 | |
Preferred Bank | | | 2,534 | | | | 138,889 | |
| | |
S C H E D U L E S O F I N V E S T M E N T S | | 11 |
| | |
Schedule of Investments (continued) March 31, 2023 | | iShares® Russell 3000 ETF (Percentages shown are based on Net Assets) |
| | | | | | | | |
| Security | | Shares | | | Value | |
| | |
Banks (continued) | | | | | | | | |
Premier Financial Corp. | | | 8,952 | | | $ | 185,575 | |
Primis Financial Corp. | | | 9,741 | | | | 93,806 | |
Prosperity Bancshares, Inc. | | | 22,746 | | | | 1,399,334 | |
Provident Financial Services, Inc. | | | 21,816 | | | | 418,431 | |
QCR Holdings, Inc. | | | 5,065 | | | | 222,404 | |
RBB Bancorp | | | 4,895 | | | | 75,873 | |
Regions Financial Corp. | | | 247,793 | | | | 4,599,038 | |
Renasant Corp. | | | 16,064 | | | | 491,237 | |
Republic Bancorp, Inc., Class A | | | 3,142 | | | | 133,315 | |
S&T Bancorp, Inc. | | | 8,969 | | | | 282,075 | |
Sandy Spring Bancorp, Inc. | | | 11,001 | | | | 285,806 | |
Seacoast Banking Corp. of Florida | | | 16,955 | | | | 401,834 | |
ServisFirst Bancshares, Inc. | | | 13,456 | | | | 735,101 | |
Shore Bancshares, Inc. | | | 6,814 | | | | 97,304 | |
Sierra Bancorp | | | 7,019 | | | | 120,867 | |
Simmons First National Corp., Class A | | | 34,010 | | | | 594,835 | |
SmartFinancial, Inc. | | | 6,437 | | | | 148,952 | |
South Plains Financial, Inc. | | | 3,553 | | | | 76,070 | |
Southern First Bancshares, Inc.(a) | | | 2,918 | | | | 89,583 | |
Southern Missouri Bancorp, Inc. | | | 2,562 | | | | 95,844 | |
Southside Bancshares, Inc. | | | 9,146 | | | | 303,647 | |
SouthState Corp. | | | 19,515 | | | | 1,390,639 | |
Stellar Bancorp, Inc. | | | 13,640 | | | | 335,680 | |
Stock Yards Bancorp, Inc. | | | 7,605 | | | | 419,340 | |
Summit Financial Group, Inc. | | | 4,424 | | | | 91,798 | |
Synovus Financial Corp. | | | 37,602 | | | | 1,159,270 | |
Texas Capital Bancshares, Inc.(a) | | | 13,061 | | | | 639,467 | |
Third Coast Bancshares, Inc.(a) | | | 7,851 | | | | 123,339 | |
Tompkins Financial Corp. | | | 3,478 | | | | 230,278 | |
Towne Bank | | | 17,017 | | | | 453,503 | |
TriCo Bancshares | | | 7,295 | | | | 303,399 | |
Triumph Financial, Inc.(a)(b) | | | 5,796 | | | | 336,516 | |
Truist Financial Corp. | | | 353,055 | | | | 12,039,175 | |
TrustCo Bank Corp. | | | 5,288 | | | | 168,899 | |
Trustmark Corp. | | | 16,710 | | | | 412,737 | |
U.S. Bancorp | | | 369,731 | | | | 13,328,803 | |
UMB Financial Corp. | | | 11,212 | | | | 647,157 | |
United Bankshares, Inc. | | | 36,232 | | | | 1,275,366 | |
United Community Banks, Inc. | | | 25,283 | | | | 710,958 | |
Univest Financial Corp. | | | 7,201 | | | | 170,952 | |
Valley National Bancorp | | | 112,696 | | | | 1,041,311 | |
Veritex Holdings, Inc. | | | 12,013 | | | | 219,357 | |
Washington Federal, Inc. | | | 16,850 | | | | 507,522 | |
Washington Trust Bancorp, Inc. | | | 3,596 | | | | 124,637 | |
Webster Financial Corp. | | | 46,744 | | | | 1,842,648 | |
Wells Fargo & Co. | | | 1,022,789 | | | | 38,231,853 | |
WesBanco, Inc. | | | 16,939 | | | | 520,027 | |
West BanCorp, Inc. | | | 5,742 | | | | 104,906 | |
Westamerica Bancorp | | | 7,741 | | | | 342,926 | |
Western Alliance Bancorp | | | 27,809 | | | | 988,332 | |
Wintrust Financial Corp. | | | 15,365 | | | | 1,120,877 | |
WSFS Financial Corp. | | | 16,322 | | | | 613,870 | |
Zions Bancorp N.A. | | | 39,637 | | | | 1,186,335 | |
| | | | | | | | |
| | |
| | | | | | | 364,658,814 | |
| | |
| Beverages — 1.6% | | | | | | |
Boston Beer Co., Inc., Class A, NVS(a) | | | 2,420 | | | | 795,454 | |
Brown-Forman Corp., Class A | | | 12,217 | | | | 796,426 | |
Brown-Forman Corp., Class B, NVS | | | 48,958 | | | | 3,146,531 | |
Celsius Holdings, Inc.(a)(b) | | | 14,301 | | | | 1,329,135 | |
Coca-Cola Co. | | | 1,041,069 | | | | 64,577,510 | |
Coca-Cola Consolidated, Inc. | | | 1,184 | | | | 633,535 | |
Constellation Brands, Inc., Class A | | | 40,158 | | | | 9,071,291 | |
| | | | | | | | |
| Security | | Shares | | | Value | |
| | |
Beverages (continued) | | | | | | | | |
Duckhorn Portfolio, Inc.(a) | | | 6,984 | | | $ | 111,046 | |
Keurig Dr Pepper, Inc. | | | 229,071 | | | | 8,081,625 | |
MGP Ingredients, Inc. | | | 3,875 | | | | 374,790 | |
Molson Coors Beverage Co., Class B | | | 46,469 | | | | 2,401,518 | |
Monster Beverage Corp.(a)(b) | | | 194,470 | | | | 10,503,325 | |
National Beverage Corp.(a) | | | 6,738 | | | | 355,227 | |
PepsiCo, Inc. | | | 368,605 | | | | 67,196,691 | |
Primo Water Corp. | | | 44,900 | | | | 689,215 | |
Vita Coco Co., Inc.(a) | | | 10,788 | | | | 211,660 | |
| | | | | | | | |
| | |
| | | | | | | 170,274,979 | |
| | |
| Biotechnology — 2.7% | | | | | | |
2seventy bio, Inc.(a) | | | 7,840 | | | | 79,968 | |
4D Molecular Therapeutics, Inc.(a) | | | 7,655 | | | | 131,589 | |
AbbVie, Inc. | | | 471,230 | | | | 75,099,925 | |
ACADIA Pharmaceuticals, Inc.(a) | | | 30,291 | | | | 570,077 | |
Adicet Bio, Inc.(a)(b) | | | 8,517 | | | | 49,058 | |
ADMA Biologics, Inc.(a)(b) | | | 44,916 | | | | 148,672 | |
Aerovate Therapeutics, Inc.(a) | | | 4,632 | | | | 93,427 | |
Agenus, Inc.(a) | | | 61,842 | | | | 94,000 | |
Agios Pharmaceuticals, Inc.(a) | | | 16,284 | | | | 374,044 | |
Akero Therapeutics, Inc.(a) | | | 8,914 | | | | 341,050 | |
Alector, Inc.(a) | | | 16,184 | | | | 100,179 | |
Alkermes PLC(a) | | | 42,540 | | | | 1,199,203 | |
Allogene Therapeutics, Inc.(a)(b) | | | 24,902 | | | | 123,016 | |
Alnylam Pharmaceuticals, Inc.(a) | | | 32,619 | | | | 6,534,238 | |
ALX Oncology Holdings, Inc.(a)(b) | | | 9,174 | | | | 41,467 | |
Amgen, Inc. | | | 142,341 | | | | 34,410,937 | |
Amicus Therapeutics, Inc.(a) | | | 70,499 | | | | 781,834 | |
AnaptysBio, Inc.(a) | | | 7,274 | | | | 158,282 | |
Anavex Life Sciences Corp.(a)(b) | | | 19,303 | | | | 165,427 | |
Anika Therapeutics, Inc.(a) | | | 6,012 | | | | 172,665 | |
Apellis Pharmaceuticals, Inc.(a) | | | 24,614 | | | | 1,623,539 | |
Arbutus Biopharma Corp.(a) | | | 48,511 | | | | 146,988 | |
Arcellx, Inc.(a) | | | 10,153 | | | | 312,814 | |
Arcturus Therapeutics Holdings, Inc.(a) | | | 8,788 | | | | 210,648 | |
Arcus Biosciences, Inc.(a) | | | 12,090 | | | | 220,522 | |
Arcutis Biotherapeutics, Inc.(a)(b) | | | 11,477 | | | | 126,247 | |
Arrowhead Pharmaceuticals, Inc.(a) | | | 26,994 | | | | 685,648 | |
Atara Biotherapeutics, Inc.(a)(b) | | | 26,345 | | | | 76,401 | |
Aura Biosciences, Inc.(a) | | | 8,710 | | | | 80,829 | |
Aurinia Pharmaceuticals, Inc.(a) | | | 37,743 | | | | 413,663 | |
Avid Bioservices, Inc.(a) | | | 16,752 | | | | 314,268 | |
Avidity Biosciences, Inc.(a) | | | 15,714 | | | | 241,210 | |
Beam Therapeutics, Inc.(a)(b) | | | 17,664 | | | | 540,872 | |
BioCryst Pharmaceuticals, Inc.(a)(b) | | | 46,148 | | | | 384,874 | |
Biogen, Inc.(a) | | | 38,149 | | | | 10,606,566 | |
Biohaven Ltd.(a) | | | 16,693 | | | | 228,026 | |
BioMarin Pharmaceutical, Inc.(a) | | | 49,899 | | | | 4,852,179 | |
Bioxcel Therapeutics, Inc.(a)(b) | | | 3,848 | | | | 71,804 | |
Bluebird Bio, Inc.(a) | | | 17,324 | | | | 55,090 | |
Blueprint Medicines Corp.(a)(b) | | | 15,572 | | | | 700,584 | |
Bridgebio Pharma, Inc.(a)(b) | | | 28,874 | | | | 478,731 | |
C4 Therapeutics, Inc.(a) | | | 10,616 | | | | 33,334 | |
CareDx, Inc.(a) | | | 12,897 | | | | 117,879 | |
Caribou Biosciences, Inc.(a) | | | 17,941 | | | | 95,267 | |
Catalyst Pharmaceuticals, Inc.(a)(b) | | | 24,429 | | | | 405,033 | |
Celldex Therapeutics, Inc.(a) | | | 13,474 | | | | 484,795 | |
Century Therapeutics, Inc.(a) | | | 10,229 | | | | 35,495 | |
Cerevel Therapeutics Holdings, Inc.(a)(b) | | | 15,665 | | | | 382,069 | |
Chinook Therapeutics, Inc.(a) | | | 13,888 | | | | 321,507 | |
Cogent Biosciences, Inc.(a)(b) | | | 14,649 | | | | 158,063 | |
Coherus Biosciences, Inc.(a) | | | 16,598 | | | | 113,530 | |
| | |
| 12 | | 2 0 2 3 I S H A R E S A N N U A L R E P O R T T O S H A R E H O L D E R S |
| | |
Schedule of Investments (continued) March 31, 2023 | | iShares® Russell 3000 ETF (Percentages shown are based on Net Assets) |
| | | | | | | | |
| Security | | Shares | | | Value | |
| | |
Biotechnology (continued) | | | | | | | | |
Crinetics Pharmaceuticals, Inc.(a) | | | 12,233 | | | $ | 196,462 | |
CTI BioPharma Corp.(a) | | | 29,038 | | | | 121,960 | |
Cullinan Oncology, Inc.(a) | | | 8,142 | | | | 83,293 | |
Cytokinetics, Inc.(a) | | | 20,547 | | | | 723,049 | |
Day One Biopharmaceuticals, Inc.(a)(b) | | | 10,418 | | | | 139,289 | |
Deciphera Pharmaceuticals, Inc.(a) | | | 16,154 | | | | 249,579 | |
Denali Therapeutics, Inc.(a) | | | 28,695 | | | | 661,133 | |
Design Therapeutics, Inc.(a) | | | 8,914 | | | | 51,434 | |
Dynavax Technologies Corp.(a)(b) | | | 28,575 | | | | 280,321 | |
Dyne Therapeutics, Inc.(a) | | | 9,514 | | | | 109,601 | |
Eagle Pharmaceuticals, Inc.(a) | | | 3,852 | | | | 109,281 | |
Editas Medicine, Inc.(a)(b) | | | 18,726 | | | | 135,764 | |
Eiger BioPharmaceuticals, Inc.(a)(b) | | | 19,877 | | | | 17,828 | |
Emergent BioSolutions, Inc.(a)(b) | | | 11,985 | | | | 124,165 | |
Enanta Pharmaceuticals, Inc.(a) | | | 4,839 | | | | 195,689 | |
EQRx, Inc.(a)(b) | | | 46,048 | | | | 89,333 | |
Erasca, Inc.(a)(b) | | | 17,317 | | | | 52,124 | |
Exact Sciences Corp.(a)(b) | | | 46,898 | | | | 3,180,153 | |
Exelixis, Inc.(a) | | | 83,184 | | | | 1,614,601 | |
Fate Therapeutics, Inc.(a) | | | 20,309 | | | | 115,761 | |
FibroGen, Inc.(a) | | | 22,391 | | | | 417,816 | |
Generation Bio Co.(a) | | | 21,027 | | | | 90,416 | |
Geron Corp.(a) | | | 98,617 | | | | 213,999 | |
Gilead Sciences, Inc. | | | 334,696 | | | | 27,769,727 | |
Gossamer Bio, Inc.(a) | | | 13,515 | | | | 17,029 | |
Halozyme Therapeutics, Inc.(a) | | | 35,873 | | | | 1,369,990 | |
Heron Therapeutics, Inc.(a) | | | 28,378 | | | | 42,851 | |
HilleVax, Inc.(a) | | | 5,831 | | | | 96,386 | |
Horizon Therapeutics PLC(a) | | | 59,564 | | | | 6,500,815 | |
Ideaya Biosciences, Inc.(a) | | | 9,612 | | | | 131,973 | |
IGM Biosciences, Inc.(a) | | | 5,384 | | | | 73,976 | |
ImmunityBio, Inc.(a) | | | 21,823 | | | | 39,718 | |
ImmunoGen, Inc.(a) | | | 55,162 | | | | 211,822 | |
Immunovant, Inc.(a)(b) | | | 10,534 | | | | 163,382 | |
Incyte Corp.(a) | | | 49,401 | | | | 3,570,210 | |
Inhibrx, Inc.(a) | | | 7,637 | | | | 144,110 | |
Inovio Pharmaceuticals, Inc.(a)(b) | | | 62,803 | | | | 51,498 | |
Insmed, Inc.(a)(b) | | | 36,420 | | | | 620,961 | |
Instil Bio, Inc.(a) | | | 21,271 | | | | 14,056 | |
Intellia Therapeutics, Inc.(a) | | | 23,299 | | | | 868,354 | |
Intercept Pharmaceuticals, Inc.(a) | | | 8,149 | | | | 109,441 | |
Ionis Pharmaceuticals, Inc.(a) | | | 38,426 | | | | 1,373,345 | |
Iovance Biotherapeutics, Inc.(a) | | | 36,636 | | | | 223,846 | |
Ironwood Pharmaceuticals, Inc., Class A(a) | | | 40,411 | | | | 425,124 | |
iTeos Therapeutics, Inc.(a) | | | 6,613 | | | | 90,003 | |
IVERIC bio, Inc.(a) | | | 35,490 | | | | 863,472 | |
Janux Therapeutics, Inc.(a) | | | 5,840 | | | | 70,664 | |
KalVista Pharmaceuticals, Inc.(a)(b) | | | 6,498 | | | | 51,074 | |
Karuna Therapeutics, Inc.(a) | | | 8,578 | | | | 1,558,108 | |
Karyopharm Therapeutics, Inc.(a) | | | 22,522 | | | | 87,611 | |
Keros Therapeutics, Inc.(a) | | | 4,111 | | | | 175,540 | |
Kezar Life Sciences, Inc.(a) | | | 14,166 | | | | 44,340 | |
Kiniksa Pharmaceuticals Ltd., Class A(a) | | | 11,538 | | | | 124,149 | |
Kinnate Biopharma, Inc.(a) | | | 11,820 | | | | 73,875 | |
Kodiak Sciences, Inc.(a) | | | 14,136 | | | | 87,643 | |
Krystal Biotech, Inc.(a)(b) | | | 5,874 | | | | 470,272 | |
Kura Oncology, Inc.(a) | | | 16,701 | | | | 204,253 | |
Kymera Therapeutics, Inc.(a)(b) | | | 9,789 | | | | 290,048 | |
Lyell Immunopharma, Inc.(a)(b) | | | 40,966 | | | | 96,680 | |
MacroGenics, Inc.(a) | | | 16,354 | | | | 117,258 | |
Madrigal Pharmaceuticals, Inc.(a) | | | 3,338 | | | | 808,664 | |
MannKind Corp.(a) | | | 60,112 | | | | 246,459 | |
| | | | | | | | |
| Security | | Shares | | | Value | |
| | |
Biotechnology (continued) | | | | | | | | |
MeiraGTx Holdings PLC(a) | | | 17,169 | | | $ | 88,764 | |
Mersana Therapeutics, Inc.(a) | | | 22,300 | | | | 91,653 | |
MiMedx Group, Inc.(a) | | | 33,458 | | | | 114,092 | |
Mineralys Therapeutics, Inc.(a) | | | 6,227 | | | | 97,515 | |
Mirati Therapeutics, Inc.(a) | | | 10,908 | | | | 405,559 | |
Mirum Pharmaceuticals, Inc.(a) | | | 6,013 | | | | 144,432 | |
Moderna, Inc.(a) | | | 88,819 | | | | 13,640,822 | |
Morphic Holding, Inc.(a) | | | 5,795 | | | | 218,124 | |
Myriad Genetics, Inc.(a) | | | 22,776 | | | | 529,087 | |
Natera, Inc.(a) | | | 25,553 | | | | 1,418,703 | |
Neurocrine Biosciences, Inc.(a) | | | 25,306 | | | | 2,561,473 | |
Nkarta, Inc.(a)(b) | | | 8,733 | | | | 31,002 | |
Novavax, Inc.(a)(b) | | | 19,598 | | | | 135,814 | |
Nurix Therapeutics, Inc.(a)(b) | | | 10,600 | | | | 94,128 | |
Nuvalent, Inc., Class A(a)(b) | | | 6,003 | | | | 156,618 | |
Ocugen, Inc.(a)(b) | | | 57,149 | | | | 48,754 | |
PepGen, Inc.(a) | | | 7,415 | | | | 90,685 | |
PMV Pharmaceuticals, Inc.(a) | | | 8,312 | | | | 39,648 | |
Point Biopharma Global, Inc.(a)(b) | | | 26,299 | | | | 191,194 | |
Precigen, Inc.(a) | | | 60,589 | | | | 64,224 | |
Prometheus Biosciences, Inc.(a) | | | 9,180 | | | | 985,198 | |
Protagonist Therapeutics, Inc.(a)(b) | | | 11,731 | | | | 269,813 | |
Prothena Corp. PLC(a) | | | 9,343 | | | | 452,855 | |
PTC Therapeutics, Inc.(a) | | | 19,854 | | | | 961,728 | |
RAPT Therapeutics, Inc.(a) | | | 5,464 | | | | 100,264 | |
Recursion Pharmaceuticals, Inc., Class A(a) | | | 31,974 | | | | 213,267 | |
Regeneron Pharmaceuticals, Inc.(a) | | | 27,688 | | | | 22,750,399 | |
REGENXBIO, Inc.(a) | | | 9,284 | | | | 175,560 | |
Relay Therapeutics, Inc.(a)(b) | | | 20,009 | | | | 329,548 | |
Replimune Group, Inc.(a) | | | 10,313 | | | | 182,128 | |
REVOLUTION Medicines, Inc.(a)(b) | | | 23,034 | | | | 498,916 | |
Rigel Pharmaceuticals, Inc.(a) | | | 63,854 | | | | 84,287 | |
Rocket Pharmaceuticals, Inc.(a)(b) | | | 14,146 | | | | 242,321 | |
Sage Therapeutics, Inc.(a)(b) | | | 13,559 | | | | 568,936 | |
Sana Biotechnology, Inc.(a)(b) | | | 22,616 | | | | 73,954 | |
Sangamo Therapeutics, Inc.(a) | | | 33,780 | | | | 59,453 | |
Sarepta Therapeutics, Inc.(a) | | | 22,636 | | | | 3,119,920 | |
Seagen, Inc.(a) | | | 36,050 | | | | 7,299,044 | |
Seres Therapeutics, Inc.(a)(b) | | | 18,238 | | | | 103,409 | |
SpringWorks Therapeutics, Inc.(a) | | | 10,429 | | | | 268,442 | |
Stoke Therapeutics, Inc.(a) | | | 7,777 | | | | 64,782 | |
Sutro Biopharma, Inc.(a) | | | 22,512 | | | | 104,005 | |
Syndax Pharmaceuticals, Inc.(a) | | | 14,461 | | | | 305,416 | |
Tango Therapeutics, Inc.(a) | | | 12,953 | | | | 51,164 | |
TG Therapeutics, Inc.(a)(b) | | | 32,672 | | | | 491,387 | |
Travere Therapeutics, Inc.(a) | | | 16,888 | | | | 379,811 | |
Twist Bioscience Corp.(a)(b) | | | 15,113 | | | | 227,904 | |
Ultragenyx Pharmaceutical, Inc.(a) | | | 16,808 | | | | 674,001 | |
United Therapeutics Corp.(a) | | | 11,934 | | | | 2,672,739 | |
Vanda Pharmaceuticals, Inc.(a) | | | 14,935 | | | | 101,409 | |
Vaxart, Inc.(a)(b) | | | 53,740 | | | | 40,665 | |
Vaxcyte, Inc.(a) | | | 17,850 | | | | 669,018 | |
Veracyte, Inc.(a) | | | 17,434 | | | | 388,778 | |
Vericel Corp.(a)(b) | | | 11,625 | | | | 340,845 | |
Vertex Pharmaceuticals, Inc.(a) | | | 68,281 | | | | 21,513,295 | |
Verve Therapeutics, Inc.(a)(b) | | | 12,467 | | | | 179,774 | |
Vir Biotechnology, Inc.(a) | | | 20,130 | | | | 468,425 | |
Viridian Therapeutics, Inc.(a) | | | 10,432 | | | | 265,390 | |
Xencor, Inc.(a) | | | 14,962 | | | | 417,290 | |
Y-mAbs Therapeutics, Inc.(a) | | | 9,137 | | | | 45,776 | |
Zentalis Pharmaceuticals, Inc.(a)(b) | | | 14,061 | | | | 241,849 | |
| | | | | | | | |
| | |
| | | | | | | 291,984,767 | |
| | |
S C H E D U L E S O F I N V E S T M E N T S | | 13 |
| | |
Schedule of Investments (continued) March 31, 2023 | | iShares® Russell 3000 ETF (Percentages shown are based on Net Assets) |
| | | | | | | | |
| Security | | Shares | | | Value | |
| | |
Broadline Retail — 2.4% | | | | | | | | |
Amazon.com, Inc.(a) | | | 2,369,881 | | | $ | 244,785,008 | |
Big Lots, Inc. | | | 8,971 | | | | 98,322 | |
ContextLogic, Inc., Class A(a) | | | 169,533 | | | | 75,578 | |
Dillard’s, Inc., Class A(b) | | | 1,051 | | | | 323,372 | |
eBay, Inc. | | | 145,596 | | | | 6,460,094 | |
Etsy, Inc.(a)(b) | | | 33,366 | | | | 3,714,637 | |
Kohl’s Corp. | | | 29,365 | | | | 691,252 | |
Macy’s, Inc. | | | 73,892 | | | | 1,292,371 | |
Nordstrom, Inc.(b) | | | 29,096 | | | | 473,392 | |
Ollie’s Bargain Outlet Holdings, Inc.(a) | | | 17,020 | | | | 986,139 | |
Qurate Retail, Inc., Class A(a) | | | 97,898 | | | | 96,704 | |
| | | | | | | | |
| | |
| | | | | | | 258,996,869 | |
| | |
| Building Products — 0.6% | | | | | | |
A O Smith Corp. | | | 33,423 | | | | 2,311,200 | |
AAON, Inc. | | | 11,725 | | | | 1,133,690 | |
Advanced Drainage Systems, Inc.(b) | | | 16,937 | | | | 1,426,265 | |
Allegion PLC | | | 23,123 | | | | 2,467,918 | |
American Woodmark Corp.(a) | | | 4,771 | | | | 248,426 | |
Apogee Enterprises, Inc. | | | 6,981 | | | | 301,928 | |
Armstrong World Industries, Inc. | | | 12,142 | | | | 864,996 | |
AZEK Co., Inc., Class A(a)(b) | | | 28,708 | | | | 675,786 | |
AZZ, Inc. | | | 6,745 | | | | 278,164 | |
Builders FirstSource, Inc.(a) | | | 38,843 | | | | 3,448,482 | |
Carlisle Cos., Inc. | | | 13,532 | | | | 3,059,179 | |
Carrier Global Corp. | | | 222,098 | | | | 10,160,983 | |
CSW Industrials, Inc. | | | 3,702 | | | | 514,319 | |
Fortune Brands Innovations, Inc. | | | 34,416 | | | | 2,021,252 | |
Gibraltar Industries, Inc.(a) | | | 8,147 | | | | 395,129 | |
Griffon Corp. | | | 11,123 | | | | 356,047 | |
Hayward Holdings, Inc.(a)(b) | | | 18,845 | | | | 220,863 | |
Insteel Industries, Inc. | | | 4,296 | | | | 119,515 | |
Janus International Group, Inc.(a) | | | 22,281 | | | | 219,691 | |
JELD-WEN Holding, Inc.(a) | | | 21,804 | | | | 276,039 | |
Johnson Controls International PLC | | | 183,654 | | | | 11,059,644 | |
Lennox International, Inc. | | | 8,459 | | | | 2,125,577 | |
Masco Corp. | | | 59,369 | | | | 2,951,827 | |
Masonite International Corp.(a)(b) | | | 6,208 | | | | 563,500 | |
Masterbrand, Inc.(a) | | | 34,226 | | | | 275,177 | |
Owens Corning | | | 25,153 | | | | 2,409,657 | |
PGT Innovations, Inc.(a) | | | 14,854 | | | | 372,984 | |
Quanex Building Products Corp. | | | 9,073 | | | | 195,342 | |
Resideo Technologies, Inc.(a) | | | 37,909 | | | | 692,977 | |
Simpson Manufacturing Co., Inc. | | | 11,630 | | | | 1,275,113 | |
Trane Technologies PLC | | | 61,214 | | | | 11,262,152 | |
Trex Co., Inc.(a)(b) | | | 30,306 | | | | 1,474,993 | |
UFP Industries, Inc. | | | 16,355 | | | | 1,299,732 | |
Zurn Elkay Water Solutions Corp. | | | 32,902 | | | | 702,787 | |
| | | | | | | | |
| | |
| | | | | | | 67,161,334 | |
| | |
| Capital Markets — 3.0% | | | | | | |
Affiliated Managers Group, Inc. | | | 10,025 | | | | 1,427,761 | |
Ameriprise Financial, Inc. | | | 28,102 | | | | 8,613,263 | |
Ares Management Corp., Class A | | | 41,065 | | | | 3,426,464 | |
Artisan Partners Asset Management, Inc., Class A | | | 14,945 | | | | 477,941 | |
AssetMark Financial Holdings, Inc.(a) | | | 7,043 | | | | 221,502 | |
Avantax, Inc.(a) | | | 13,168 | | | | 346,582 | |
B Riley Financial, Inc. | | | 5,782 | | | | 164,151 | |
Bank of New York Mellon Corp. | | | 195,799 | | | | 8,897,107 | |
BGC Partners, Inc., Class A | | | 87,424 | | | | 457,228 | |
BlackRock, Inc.(c) | | | 39,503 | | | | 26,432,247 | |
Blackstone, Inc., Class A, NVS | | | 189,692 | | | | 16,662,545 | |
Blue Owl Capital, Inc. | | | 107,951 | | | | 1,196,097 | |
| | | | | | | | |
| Security | | Shares | | | Value | |
| | |
Capital Markets (continued) | | | | | | | | |
Brightsphere Investment Group, Inc. | | | 8,546 | | | $ | 201,515 | |
Carlyle Group, Inc. | | | 53,886 | | | | 1,673,699 | |
Cboe Global Markets, Inc. | | | 27,872 | | | | 3,741,537 | |
Charles Schwab Corp. | | | 404,952 | | | | 21,211,386 | |
CME Group, Inc., Class A | | | 95,505 | | | | 18,291,118 | |
Cohen & Steers, Inc. | | | 6,102 | | | | 390,284 | |
Coinbase Global, Inc., Class A(a)(b) | | | 41,640 | | | | 2,813,615 | |
Diamond Hill Investment Group, Inc., Class A | | | 687 | | | | 113,066 | |
Donnelley Financial Solutions, Inc.(a) | | | 6,459 | | | | 263,915 | |
Evercore, Inc., Class A | | | 9,523 | | | | 1,098,764 | |
FactSet Research Systems, Inc. | | | 10,056 | | | | 4,174,145 | |
Federated Hermes, Inc., Class B | | | 23,674 | | | | 950,274 | |
Focus Financial Partners, Inc., Class A(a) | | | 15,595 | | | | 808,913 | |
Franklin Resources, Inc. | | | 75,649 | | | | 2,037,984 | |
GCM Grosvenor, Inc., Class A | | | 13,043 | | | | 101,866 | |
Goldman Sachs Group, Inc. | | | 87,417 | | | | 28,594,975 | |
Hamilton Lane, Inc., Class A | | | 9,342 | | | | 691,121 | |
Houlihan Lokey, Inc., Class A | | | 13,810 | | | | 1,208,237 | |
Interactive Brokers Group, Inc., Class A | | | 24,148 | | | | 1,993,659 | |
Intercontinental Exchange, Inc. | | | 147,336 | | | | 15,365,671 | |
Invesco Ltd. | | | 100,276 | | | | 1,644,526 | |
Janus Henderson Group PLC | | | 38,607 | | | | 1,028,490 | |
Jefferies Financial Group, Inc. | | | 54,203 | | | | 1,720,403 | |
KKR & Co., Inc., Class A | | | 151,575 | | | | 7,960,719 | |
Lazard Ltd., Class A | | | 23,777 | | | | 787,256 | |
LPL Financial Holdings, Inc. | | | 20,987 | | | | 4,247,769 | |
MarketAxess Holdings, Inc. | | | 10,009 | | | | 3,916,422 | |
Moelis & Co., Class A | | | 16,423 | | | | 631,300 | |
Moody’s Corp. | | | 42,726 | | | | 13,075,011 | |
Morgan Stanley | | | 328,633 | | | | 28,853,977 | |
Morningstar, Inc. | | | 6,794 | | | | 1,379,386 | |
MSCI, Inc., Class A | | | 20,693 | | | | 11,581,665 | |
Nasdaq, Inc. | | | 91,575 | | | | 5,006,405 | |
Northern Trust Corp. | | | 55,340 | | | | 4,877,114 | |
Open Lending Corp., Class A(a) | | | 26,930 | | | | 189,587 | |
Oppenheimer Holdings, Inc., Class A, NVS | | | 2,485 | | | | 97,288 | |
Perella Weinberg Partners, Class A | | | 8,331 | | | | 75,812 | |
Piper Sandler Cos. | | | 4,969 | | | | 688,753 | |
PJT Partners, Inc., Class A | | | 6,338 | | | | 457,540 | |
Raymond James Financial, Inc. | | | 51,340 | | | | 4,788,482 | |
Robinhood Markets, Inc., Class A(a)(b) | | | 148,595 | | | | 1,442,857 | |
S&P Global, Inc. | | | 85,735 | | | | 29,558,856 | |
Sculptor Capital Management, Inc. | | | 10,749 | | | | 92,549 | |
SEI Investments Co. | | | 26,929 | | | | 1,549,764 | |
State Street Corp. | | | 93,188 | | | | 7,053,400 | |
StepStone Group, Inc., Class A | | | 15,109 | | | | 366,695 | |
Stifel Financial Corp. | | | 27,824 | | | | 1,644,120 | |
StoneX Group, Inc.(a) | | | 5,303 | | | | 549,020 | |
T Rowe Price Group, Inc. | | | 58,289 | | | | 6,580,828 | |
Tradeweb Markets, Inc., Class A | | | 27,957 | | | | 2,209,162 | |
Victory Capital Holdings, Inc., Class A | | | 4,354 | | | | 127,442 | |
Virtu Financial, Inc., Class A | | | 27,816 | | | | 525,722 | |
Virtus Investment Partners, Inc. | | | 1,731 | | | | 329,565 | |
WisdomTree, Inc. | | | 39,738 | | | | 232,865 | |
| | | | | | | | |
| | |
| | | | | | | 319,319,382 | |
| | |
| Chemicals — 1.8% | | | | | | |
AdvanSix, Inc. | | | 7,886 | | | | 301,797 | |
Air Products & Chemicals, Inc. | | | 58,886 | | | | 16,912,648 | |
Albemarle Corp. | | | 30,985 | | | | 6,848,924 | |
American Vanguard Corp. | | | 8,832 | | | | 193,244 | |
Amyris, Inc.(a)(b) | | | 44,037 | | | | 59,890 | |
Ashland, Inc. | | | 13,658 | | | | 1,402,813 | |
| | |
| 14 | | 2 0 2 3 I S H A R E S A N N U A L R E P O R T T O S H A R E H O L D E R S |
| | |
Schedule of Investments (continued) March 31, 2023 | | iShares® Russell 3000 ETF (Percentages shown are based on Net Assets) |
| | | | | | | | |
| Security | | Shares | | | Value | |
| | |
Chemicals (continued) | | | | | | | | |
Aspen Aerogels, Inc.(a) | | | 10,509 | | | $ | 78,292 | |
Avient Corp. | | | 23,060 | | | | 949,150 | |
Axalta Coating Systems Ltd.(a) | | | 56,731 | | | | 1,718,382 | |
Balchem Corp. | | | 8,168 | | | | 1,033,089 | |
Cabot Corp. | | | 14,136 | | | | 1,083,383 | |
Celanese Corp., Class A | | | 28,666 | | | | 3,121,441 | |
CF Industries Holdings, Inc. | | | 52,389 | | | | 3,797,679 | |
Chase Corp. | | | 2,289 | | | | 239,727 | |
Chemours Co. | | | 41,515 | | | | 1,242,959 | |
Corteva, Inc. | | | 190,344 | | | | 11,479,647 | |
Diversey Holdings Ltd.(a) | | | 20,779 | | | | 168,102 | |
Dow, Inc. | | | 187,007 | | | | 10,251,724 | |
DuPont de Nemours, Inc. | | | 122,545 | | | | 8,795,055 | |
Eastman Chemical Co. | | | 31,851 | | | | 2,686,313 | |
Ecolab, Inc. | | | 65,751 | | | | 10,883,763 | |
Ecovyst, Inc.(a) | | | 16,484 | | | | 182,148 | |
Element Solutions, Inc. | | | 59,012 | | | | 1,139,522 | |
FMC Corp. | | | 33,129 | | | | 4,046,045 | |
Ginkgo Bioworks Holdings, Inc., Class A(a)(b) | | | 237,229 | | | | 315,515 | |
Hawkins, Inc. | | | 4,486 | | | | 196,397 | |
HB Fuller Co. | | | 13,544 | | | | 927,087 | |
Huntsman Corp. | | | 50,857 | | | | 1,391,447 | |
Ingevity Corp.(a) | | | 9,742 | | | | 696,748 | |
Innospec, Inc. | | | 6,521 | | | | 669,511 | |
International Flavors & Fragrances, Inc. | | | 67,339 | | | | 6,192,494 | |
Intrepid Potash, Inc.(a) | | | 2,897 | | | | 79,957 | |
Koppers Holdings, Inc. | | | 5,212 | | | | 182,264 | |
Linde PLC | | | 132,116 | | | | 46,959,311 | |
Livent Corp.(a)(b) | | | 44,126 | | | | 958,417 | |
LSB Industries, Inc.(a) | | | 19,512 | | | | 201,559 | |
LyondellBasell Industries NV, Class A | | | 68,376 | | | | 6,419,823 | |
Mativ Holdings, Inc. | | | 13,952 | | | | 299,549 | |
Minerals Technologies, Inc. | | | 9,727 | | | | 587,705 | |
Mosaic Co. | | | 91,024 | | | | 4,176,181 | |
NewMarket Corp. | | | 1,514 | | | | 552,580 | |
Olin Corp. | | | 33,482 | | | | 1,858,251 | |
Origin Materials, Inc.(a)(b) | | | 32,106 | | | | 137,093 | |
Orion Engineered Carbons SA | | | 16,012 | | | | 417,753 | |
Perimeter Solutions SA(a)(b) | | | 38,558 | | | | 311,549 | |
PPG Industries, Inc. | | | 62,643 | | | | 8,367,852 | |
PureCycle Technologies, Inc.(a)(b) | | | 27,793 | | | | 194,551 | |
Quaker Chemical Corp. | | | 3,554 | | | | 703,514 | |
Rayonier Advanced Materials, Inc.(a) | | | 16,250 | | | | 101,887 | |
RPM International, Inc. | | | 33,384 | | | | 2,912,420 | |
Scotts Miracle-Gro Co. | | | 10,744 | | | | 749,286 | |
Sensient Technologies Corp. | | | 11,434 | | | | 875,387 | |
Sherwin-Williams Co. | | | 63,389 | | | | 14,247,945 | |
Stepan Co. | | | 6,114 | | | | 629,925 | |
Trinseo PLC | | | 9,821 | | | | 204,768 | |
Tronox Holdings PLC | | | 27,007 | | | | 388,361 | |
Valvoline, Inc. | | | 46,619 | | | | 1,628,868 | |
Westlake Corp.(b) | | | 9,059 | | | | 1,050,663 | |
| | | | | | | | |
| | |
| | | | | | | 194,202,355 | |
|
| Commercial Services & Supplies — 0.6% | |
ABM Industries, Inc. | | | 17,561 | | | | 789,191 | |
ACCO Brands Corp. | | | 27,827 | | | | 148,040 | |
ACV Auctions, Inc., Class A(a)(b) | | | 33,613 | | | | 433,944 | |
Aris Water Solutions, Inc., Class A | | | 6,504 | | | | 50,666 | |
Brady Corp., Class A, NVS | | | 12,743 | | | | 684,681 | |
BrightView Holdings, Inc.(a) | | | 13,951 | | | | 78,405 | |
Brink’s Co. | | | 11,676 | | | | 779,957 | |
Casella Waste Systems, Inc., Class A(a) | | | 13,304 | | | | 1,099,709 | |
| | | | | | | | |
| Security | | Shares | | | Value | |
|
Commercial Services & Supplies (continued) | |
Cimpress PLC(a)(b) | | | 4,459 | | | $ | 195,393 | |
Cintas Corp. | | | 23,090 | | | | 10,683,281 | |
Clean Harbors, Inc.(a) | | | 13,509 | | | | 1,925,843 | |
Copart, Inc.(a) | | | 113,086 | | | | 8,505,198 | |
CoreCivic, Inc.(a) | | | 30,614 | | | | 281,649 | |
Deluxe Corp. | | | 10,910 | | | | 174,560 | |
Driven Brands Holdings, Inc.(a)(b) | | | 17,001 | | | | 515,300 | |
Ennis, Inc. | | | 6,523 | | | | 137,570 | |
GEO Group, Inc.(a) | | | 33,192 | | | | 261,885 | |
Harsco Corp.(a) | | | 22,873 | | | | 156,223 | |
Healthcare Services Group, Inc. | | | 20,261 | | | | 281,020 | |
Heritage-Crystal Clean, Inc.(a) | | | 5,246 | | | | 186,810 | |
HNI Corp. | | | 11,701 | | | | 325,756 | |
Interface, Inc., Class A | | | 14,453 | | | | 117,358 | |
KAR Auction Services, Inc.(a) | | | 28,549 | | | | 390,550 | |
Kimball International, Inc., Class B | | | 9,498 | | | | 117,775 | |
Li-Cycle Holdings Corp.(a)(b) | | | 36,229 | | | | 203,969 | |
Liquidity Services, Inc.(a) | | | 6,761 | | | | 89,042 | |
Matthews International Corp., Class A | | | 7,933 | | | | 286,064 | |
MillerKnoll, Inc. | | | 21,070 | | | | 430,882 | |
Montrose Environmental Group, Inc.(a)(b) | | | 6,022 | | | | 214,805 | |
MSA Safety, Inc. | | | 9,649 | | | | 1,288,142 | |
Republic Services, Inc. | | | 55,182 | | | | 7,461,710 | |
Ritchie Bros Auctioneers, Inc.(b) | | | 19,064 | | | | 1,073,113 | |
Rollins, Inc. | | | 61,142 | | | | 2,294,659 | |
SP Plus Corp.(a) | | | 5,965 | | | | 204,540 | |
Steelcase, Inc., Class A | | | 25,282 | | | | 212,874 | |
Stericycle, Inc.(a) | | | 24,085 | | | | 1,050,347 | |
Tetra Tech, Inc. | | | 14,254 | | | | 2,094,055 | |
UniFirst Corp. | | | 4,121 | | | | 726,244 | |
Viad Corp.(a) | | | 5,044 | | | | 105,117 | |
VSE Corp. | | | 2,973 | | | | 133,488 | |
Waste Management, Inc. | | | 109,582 | | | | 17,880,495 | |
| | | | | | | | |
| | |
| | | | | | | 64,070,310 | |
| | |
| Communications Equipment — 0.9% | | | | | | |
ADTRAN Holdings, Inc. | | | 18,538 | | | | 294,013 | |
Arista Networks, Inc.(a) | | | 65,751 | | | | 11,036,963 | |
Calix, Inc.(a) | | | 14,550 | | | | 779,735 | |
Cambium Networks Corp.(a) | | | 4,536 | | | | 80,378 | |
Ciena Corp.(a) | | | 40,084 | | | | 2,105,212 | |
Cisco Systems, Inc. | | | 1,095,732 | | | | 57,279,390 | |
Clearfield, Inc.(a) | | | 3,411 | | | | 158,884 | |
CommScope Holding Co., Inc.(a) | | | 52,019 | | | | 331,361 | |
Comtech Telecommunications Corp. | | | 8,059 | | | | 100,576 | |
Digi International, Inc.(a) | | | 8,672 | | | | 292,073 | |
Extreme Networks, Inc.(a) | | | 35,462 | | | | 678,033 | |
F5, Inc.(a) | | | 15,756 | | | | 2,295,492 | |
Harmonic, Inc.(a) | | | 25,064 | | | | 365,684 | |
Infinera Corp.(a)(b) | | | 53,109 | | | | 412,126 | |
Inseego Corp.(a)(b) | | | 50,435 | | | | 29,373 | |
Juniper Networks, Inc. | | | 84,193 | | | | 2,897,923 | |
Lumentum Holdings, Inc.(a) | | | 19,048 | | | | 1,028,782 | |
Motorola Solutions, Inc. | | | 43,879 | | | | 12,555,098 | |
NETGEAR, Inc.(a) | | | 8,768 | | | | 162,296 | |
NetScout Systems, Inc.(a) | | | 16,586 | | | | 475,189 | |
Ribbon Communications, Inc.(a) | | | 23,481 | | | | 80,305 | |
Ubiquiti, Inc.(b) | | | 1,060 | | | | 287,991 | |
Viasat, Inc.(a)(b) | | | 18,227 | | | | 616,802 | |
Viavi Solutions, Inc.(a) | | | 63,988 | | | | 692,990 | |
| | | | | | | | |
| | |
| | | | | | | 95,036,669 | |
| | |
| Construction & Engineering — 0.3% | | | | | | |
AECOM | | | 35,671 | | | | 3,007,779 | |
| | |
S C H E D U L E S O F I N V E S T M E N T S | | 15 |
| | |
Schedule of Investments (continued) March 31, 2023 | | iShares® Russell 3000 ETF (Percentages shown are based on Net Assets) |
| | | | | | | | |
| Security | | Shares | | | Value | |
| | |
Construction & Engineering (continued) | | | | | | | | |
Ameresco, Inc., Class A(a)(b) | | | 8,005 | | | $ | 394,006 | |
API Group Corp.(a) | | | 51,915 | | | | 1,167,049 | |
Arcosa, Inc. | | | 12,815 | | | | 808,755 | |
Argan, Inc. | | | 3,849 | | | | 155,769 | |
Comfort Systems U.S.A., Inc. | | | 9,088 | | | | 1,326,484 | |
Construction Partners, Inc., Class A(a)(b) | | | 8,890 | | | | 239,497 | |
Dycom Industries, Inc.(a)(b) | | | 7,177 | | | | 672,126 | |
EMCOR Group, Inc. | | | 12,541 | | | | 2,039,041 | |
Fluor Corp.(a) | | | 39,075 | | | | 1,207,808 | |
Granite Construction, Inc. | | | 13,398 | | | | 550,390 | |
Great Lakes Dredge & Dock Corp.(a)(b) | | | 14,740 | | | | 80,038 | |
IES Holdings, Inc.(a) | | | 2,690 | | | | 115,912 | |
MasTec, Inc.(a) | | | 15,792 | | | | 1,491,396 | |
MDU Resources Group, Inc. | | | 52,237 | | | | 1,592,184 | |
MYR Group, Inc.(a) | | | 4,910 | | | | 618,709 | |
Northwest Pipe Co.(a) | | | 4,008 | | | | 125,170 | |
Primoris Services Corp. | | | 15,638 | | | | 385,633 | |
Quanta Services, Inc. | | | 37,938 | | | | 6,321,988 | |
Sterling Infrastructure, Inc.(a) | | | 6,794 | | | | 257,357 | |
Tutor Perini Corp.(a)(b) | | | 13,280 | | | | 81,938 | |
Valmont Industries, Inc. | | | 5,519 | | | | 1,762,106 | |
WillScot Mobile Mini Holdings Corp.(a) | | | 54,644 | | | | 2,561,711 | |
| | | | | | | | |
| | |
| | | | | | | 26,962,846 | |
| | |
| Construction Materials — 0.1% | | | | | | |
Eagle Materials, Inc. | | | 9,551 | | | | 1,401,609 | |
Martin Marietta Materials, Inc.(b) | | | 16,682 | | | | 5,923,111 | |
Summit Materials, Inc., Class A(a)(b) | | | 32,497 | | | | 925,839 | |
United States Lime & Minerals, Inc. | | | 684 | | | | 104,440 | |
Vulcan Materials Co. | | | 35,430 | | | | 6,078,371 | |
| | | | | | | | |
| | |
| | | | | | | 14,433,370 | |
| | |
| Consumer Finance — 0.5% | | | | | | |
Ally Financial, Inc. | | | 82,271 | | | | 2,097,088 | |
American Express Co. | | | 158,458 | | | | 26,137,647 | |
Bread Financial Holdings, Inc. | | | 12,814 | | | | 388,521 | |
Capital One Financial Corp. | | | 101,644 | | | | 9,774,087 | |
Credit Acceptance Corp.(a)(b) | | | 1,827 | | | | 796,645 | |
Discover Financial Services | | | 71,254 | | | | 7,042,745 | |
Encore Capital Group, Inc.(a)(b) | | | 6,523 | | | | 329,085 | |
Enova International, Inc.(a) | | | 7,670 | | | | 340,778 | |
EZCORP, Inc., Class A, NVS(a) | | | 13,975 | | | | 120,185 | |
FirstCash Holdings, Inc. | | | 9,767 | | | | 931,479 | |
Green Dot Corp., Class A(a) | | | 14,236 | | | | 244,575 | |
LendingClub Corp.(a) | | | 25,765 | | | | 185,766 | |
LendingTree, Inc.(a) | | | 3,876 | | | | 103,334 | |
Navient Corp. | | | 25,377 | | | | 405,778 | |
Nelnet, Inc., Class A | | | 3,244 | | | | 298,091 | |
NerdWallet, Inc., Class A(a) | | | 5,929 | | | | 95,931 | |
OneMain Holdings, Inc. | | | 29,554 | | | | 1,095,862 | |
PRA Group, Inc.(a) | | | 9,575 | | | | 373,042 | |
PROG Holdings, Inc.(a) | | | 14,689 | | | | 349,451 | |
Regional Management Corp. | | | 3,389 | | | | 88,419 | |
SLM Corp. | | | 65,027 | | | | 805,685 | |
SoFi Technologies, Inc.(a)(b) | | | 214,405 | | | | 1,301,438 | |
Synchrony Financial | | | 115,664 | | | | 3,363,509 | |
Upstart Holdings, Inc.(a)(b) | | | 20,212 | | | | 321,169 | |
World Acceptance Corp.(a) | | | 986 | | | | 82,124 | |
| | | | | | | | |
| | |
| | | | | | | 57,072,434 | |
|
| Consumer Staples Distribution & Retail — 1.8% | |
Albertsons Cos., Inc., Class A | | | 62,240 | | | | 1,293,347 | |
Andersons, Inc. | | | 9,847 | | | | 406,878 | |
BJ’s Wholesale Club Holdings, Inc.(a) | | | 35,099 | | | | 2,669,981 | |
| | | | | | | | |
| Security | | Shares | | | Value | |
|
Consumer Staples Distribution & Retail (continued) | |
Casey’s General Stores, Inc. | | | 10,001 | | | $ | 2,164,816 | |
Chefs’ Warehouse, Inc.(a) | | | 7,594 | | | | 258,576 | |
Costco Wholesale Corp. | | | 118,050 | | | | 58,655,503 | |
Dollar General Corp. | | | 59,984 | | | | 12,624,233 | |
Dollar Tree, Inc.(a)(b) | | | 55,339 | | | | 7,943,913 | |
Fresh Market, Inc. Escrow(a)(d) | | | 10,847 | | | | — | |
Grocery Outlet Holding Corp.(a) | | | 22,170 | | | | 626,524 | |
Ingles Markets, Inc., Class A | | | 4,237 | | | | 375,822 | |
Kroger Co. | | | 175,496 | | | | 8,664,238 | |
Performance Food Group Co.(a) | | | 39,940 | | | | 2,409,980 | |
PriceSmart, Inc. | | | 5,986 | | | | 427,879 | |
Rite Aid Corp.(a)(b) | | | 20,565 | | | | 46,066 | |
SpartanNash Co. | | | 9,025 | | | | 223,820 | |
Sprouts Farmers Market, Inc.(a)(b) | | | 27,784 | | | | 973,274 | |
Sysco Corp. | | | 134,868 | | | | 10,415,856 | |
Target Corp. | | | 123,343 | | | | 20,429,301 | |
U.S. Foods Holding Corp.(a) | | | 53,292 | | | | 1,968,606 | |
United Natural Foods, Inc.(a) | | | 14,129 | | | | 372,299 | |
Walgreens Boots Alliance, Inc. | | | 191,678 | | | | 6,628,225 | |
Walmart, Inc. | | | 378,987 | | | | 55,881,633 | |
Weis Markets, Inc. | | | 4,746 | | | | 401,844 | |
| | | | | | | | |
| | |
| | | | | | | 195,862,614 | |
| | |
| Containers & Packaging — 0.4% | | | | | | |
Amcor PLC | | | 389,056 | | | | 4,427,457 | |
AptarGroup, Inc.(b) | | | 17,391 | | | | 2,055,442 | |
Ardagh Group SA, Class A(a) | | | 4,919 | | | | 32,859 | |
Ardagh Metal Packaging SA(b) | | | 41,863 | | | | 170,801 | |
Avery Dennison Corp. | | | 21,674 | | | | 3,878,129 | |
Ball Corp. | | | 82,785 | | | | 4,562,281 | |
Berry Global Group, Inc. | | | 32,960 | | | | 1,941,344 | |
Crown Holdings, Inc. | | | 31,187 | | | | 2,579,477 | |
Graphic Packaging Holding Co. | | | 82,999 | | | | 2,115,645 | |
Greif, Inc., Class A, NVS | | | 6,331 | | | | 401,195 | |
Greif, Inc., Class B | | | 1,999 | | | | 152,964 | |
International Paper Co. | | | 95,718 | | | | 3,451,591 | |
Myers Industries, Inc. | | | 9,724 | | | | 208,385 | |
O-I Glass, Inc.(a) | | | 43,697 | | | | 992,359 | |
Packaging Corp. of America | | | 24,016 | | | | 3,334,141 | |
Pactiv Evergreen, Inc. | | | 10,599 | | | | 84,792 | |
Sealed Air Corp. | | | 38,327 | | | | 1,759,593 | |
Silgan Holdings, Inc. | | | 22,078 | | | | 1,184,926 | |
Sonoco Products Co. | | | 26,105 | | | | 1,592,405 | |
TriMas Corp. | | | 9,873 | | | | 275,062 | |
Westrock Co. | | | 67,615 | | | | 2,060,229 | |
| | | | | | | | |
| | |
| | | | | | | 37,261,077 | |
| | |
| Distributors — 0.1% | | | | | | |
Funko, Inc., Class A(a) | | | 7,120 | | | | 67,142 | |
Genuine Parts Co. | | | 37,262 | | | | 6,234,305 | |
LKQ Corp. | | | 67,535 | | | | 3,833,286 | |
Pool Corp. | | | 10,254 | | | | 3,511,380 | |
| | | | | | | | |
| | |
| | | | | | | 13,646,113 | |
| | |
| Diversified Consumer Services — 0.1% | | | | | | |
2U, Inc.(a) | | | 18,563 | | | | 127,156 | |
ADT, Inc. | | | 55,191 | | | | 399,031 | |
Adtalem Global Education, Inc.(a)(b) | | | 12,765 | | | | 492,984 | |
Bright Horizons Family Solutions, Inc.(a)(b) | | | 15,001 | | | | 1,154,927 | |
Carriage Services, Inc. | | | 3,914 | | | | 119,455 | |
Chegg, Inc.(a)(b) | | | 32,132 | | | | 523,752 | |
Coursera, Inc.(a) | | | 34,882 | | | | 401,841 | |
Duolingo, Inc.(a)(b) | | | 6,472 | | | | 922,842 | |
European Wax Center, Inc., Class A | | | 6,841 | | | | 129,979 | |
| | |
| 16 | | 2 0 2 3 I S H A R E S A N N U A L R E P O R T T O S H A R E H O L D E R S |
| | |
Schedule of Investments (continued) March 31, 2023 | | iShares® Russell 3000 ETF (Percentages shown are based on Net Assets) |
| | | | | | | | |
| Security | | Shares | | | Value | |
|
Diversified Consumer Services (continued) | |
Frontdoor, Inc.(a) | | | 22,870 | | | $ | 637,616 | |
Graham Holdings Co., Class B | | | 1,032 | | | | 614,907 | |
Grand Canyon Education, Inc.(a) | | | 8,069 | | | | 919,059 | |
H&R Block, Inc. | | | 41,577 | | | | 1,465,589 | |
Laureate Education, Inc., Class A | | | 35,384 | | | | 416,116 | |
Mister Car Wash, Inc.(a)(b) | | | 20,247 | | | | 174,529 | |
OneSpaWorld Holdings Ltd.(a)(b) | | | 14,025 | | | | 168,160 | |
Perdoceo Education Corp.(a) | | | 20,213 | | | | 271,461 | |
Rover Group, Inc.(a)(b) | | | 32,800 | | | | 148,584 | |
Service Corp. International | | | 40,179 | | | | 2,763,512 | |
Strategic Education, Inc. | | | 5,910 | | | | 530,895 | |
Stride, Inc.(a) | | | 11,175 | | | | 438,619 | |
Udemy, Inc.(a) | | | 22,381 | | | | 197,624 | |
| | | | | | | | |
| | |
| | | | | | | 13,018,638 | |
| | |
| Diversified REITs — 0.1% | | | | | | |
Alexander & Baldwin, Inc. | | | 20,254 | | | | 383,003 | |
American Assets Trust, Inc. | | | 12,433 | | | | 231,130 | |
Armada Hoffler Properties, Inc. | | | 14,842 | | | | 175,284 | |
Broadstone Net Lease, Inc. | | | 46,675 | | | | 793,942 | |
CTO Realty Growth, Inc. | | | 6,711 | | | | 115,832 | |
Empire State Realty Trust, Inc., Class A(b) | | | 38,766 | | | | 251,591 | |
Essential Properties Realty Trust, Inc. | | | 36,497 | | | | 906,950 | |
Gladstone Commercial Corp. | | | 9,804 | | | | 123,825 | |
Global Net Lease, Inc. | | | 25,400 | | | | 326,644 | |
One Liberty Properties, Inc. | | | 4,622 | | | | 105,982 | |
WP Carey, Inc. | | | 56,014 | | | | 4,338,284 | |
| | | | | | | | |
| | |
| | | | | | | 7,752,467 | |
|
| Diversified Telecommunication Services — 0.8% | |
Anterix, Inc.(a) | | | 6,556 | | | | 216,610 | |
AT&T Inc. | | | 1,908,937 | | | | 36,747,037 | |
ATN International, Inc. | | | 3,073 | | | | 125,747 | |
Bandwidth, Inc., Class A(a) | | | 8,528 | | | | 129,626 | |
Charge Enterprises, Inc.(a)(b) | | | 60,774 | | | | 66,851 | |
Cogent Communications Holdings, Inc. | | | 11,570 | | | | 737,240 | |
Consolidated Communications Holdings, Inc.(a) | | | 20,808 | | | | 53,685 | |
EchoStar Corp., Class A(a)(b) | | | 9,711 | | | | 177,614 | |
Frontier Communications Parent, Inc.(a) | | | 63,214 | | | | 1,439,383 | |
Globalstar, Inc.(a)(b) | | | 172,419 | | | | 200,006 | |
IDT Corp., Class B(a) | | | 5,263 | | | | 179,363 | |
Iridium Communications, Inc. | | | 33,737 | | | | 2,089,333 | |
Liberty Latin America Ltd., Class A(a) | | | 11,917 | | | | 99,030 | |
Liberty Latin America Ltd., Class C, NVS(a) | | | 42,900 | | | | 354,354 | |
Lumen Technologies, Inc. | | | 268,947 | | | | 712,710 | |
Ooma, Inc.(a) | | | 7,115 | | | | 89,009 | |
Radius Global Infrastructure, Inc., Class A(a)(b) | | | 22,287 | | | | 326,950 | |
Verizon Communications, Inc. | | | 1,120,656 | | | | 43,582,312 | |
| | | | | | | | |
| | |
| | | | | | | 87,326,860 | |
| | |
| Electric Utilities — 1.7% | | | | | | |
ALLETE, Inc. | | | 15,038 | | | | 967,996 | |
Alliant Energy Corp. | | | 67,709 | | | | 3,615,661 | |
American Electric Power Co., Inc. | | | 136,915 | | | | 12,457,896 | |
Avangrid, Inc. | | | 19,342 | | | | 771,359 | |
Constellation Energy Corp. | | | 87,553 | | | | 6,872,911 | |
Duke Energy Corp. | | | 205,146 | | | | 19,790,435 | |
Edison International | | | 100,491 | | | | 7,093,660 | |
Entergy Corp. | | | 54,154 | | | | 5,834,552 | |
Evergy, Inc. | | | 59,712 | | | | 3,649,597 | |
Eversource Energy | | | 92,447 | | | | 7,234,902 | |
Exelon Corp. | | | 263,697 | | | | 11,046,267 | |
FirstEnergy Corp. | | | 145,051 | | | | 5,810,743 | |
Hawaiian Electric Industries, Inc. | | | 29,269 | | | | 1,123,930 | |
| | | | | | | | |
| Security | | Shares | | | Value | |
| | |
Electric Utilities (continued) | | | | | | | | |
IDACORP, Inc. | | | 12,956 | | | $ | 1,403,523 | |
MGE Energy, Inc. | | | 9,514 | | | | 738,952 | |
NextEra Energy, Inc. | | | 529,515 | | | | 40,815,016 | |
NRG Energy, Inc. | | | 56,682 | | | | 1,943,626 | |
OGE Energy Corp. | | | 51,862 | | | | 1,953,123 | |
Otter Tail Corp. | | | 10,591 | | | | 765,412 | |
PG&E Corp.(a)(b) | | | 437,029 | | | | 7,066,759 | |
Pinnacle West Capital Corp. | | | 29,382 | | | | 2,328,230 | |
PNM Resources, Inc. | | | 22,430 | | | | 1,091,892 | |
Portland General Electric Co. | | | 24,206 | | | | 1,183,431 | |
PPL Corp. | | | 195,200 | | | | 5,424,608 | |
Southern Co. | | | 290,492 | | | | 20,212,433 | |
Xcel Energy, Inc. | | | 145,671 | | | | 9,824,052 | |
| | | | | | | | |
| | |
| | | | | | | 181,020,966 | |
| | |
| Electrical Equipment — 0.7% | | | | | | |
Acuity Brands, Inc. | | | 8,567 | | | | 1,565,448 | |
Allied Motion Technologies, Inc. | | | 3,514 | | | | 135,816 | |
AMETEK, Inc. | | | 61,407 | | | | 8,924,279 | |
Array Technologies, Inc.(a)(b) | | | 41,274 | | | | 903,075 | |
Atkore, Inc.(a)(b) | | | 10,765 | | | | 1,512,267 | |
Babcock & Wilcox Enterprises, Inc.(a) | | | 17,309 | | | | 104,893 | |
Blink Charging Co.(a)(b) | | | 9,945 | | | | 86,024 | |
Bloom Energy Corp., Class A(a)(b) | | | 44,990 | | | | 896,651 | |
ChargePoint Holdings, Inc., Class A(a)(b) | | | 67,811 | | | | 709,981 | |
Eaton Corp. PLC | | | 106,412 | | | | 18,232,632 | |
Emerson Electric Co. | | | 151,858 | | | | 13,232,906 | |
Encore Wire Corp. | | | 5,101 | | | | 945,368 | |
EnerSys | | | 11,517 | | | | 1,000,597 | |
Enovix Corp.(a)(b) | | | 30,435 | | | | 453,786 | |
ESS Tech, Inc.(a)(b) | | | 32,148 | | | | 44,686 | |
Fluence Energy, Inc., Class A(a) | | | 8,949 | | | | 181,217 | |
FuelCell Energy, Inc.(a)(b) | | | 100,839 | | | | 287,391 | |
Generac Holdings, Inc.(a)(b) | | | 16,573 | | | | 1,790,050 | |
GrafTech International Ltd. | | | 57,202 | | | | 278,002 | |
Hubbell, Inc. | | | 14,071 | | | | 3,423,615 | |
NEXTracker, Inc., Class A(a)(b) | | | 8,188 | | | | 296,897 | |
NuScale Power Corp., Class A(a)(b) | | | 10,297 | | | | 93,600 | |
nVent Electric PLC | | | 44,276 | | | | 1,901,211 | |
Plug Power, Inc.(a)(b) | | | 136,319 | | | | 1,597,659 | |
Powell Industries, Inc. | | | 2,845 | | | | 121,169 | |
Preformed Line Products Co. | | | 882 | | | | 112,931 | |
Regal Rexnord Corp. | | | 17,390 | | | | 2,447,295 | |
Rockwell Automation, Inc. | | | 30,588 | | | | 8,976,049 | |
Sensata Technologies Holding PLC | | | 40,469 | | | | 2,024,259 | |
Shoals Technologies Group, Inc., Class A(a) | | | 43,080 | | | | 981,793 | |
Stem, Inc.(a)(b) | | | 42,454 | | | | 240,714 | |
SunPower Corp.(a)(b) | | | 20,424 | | | | 282,668 | |
Sunrun, Inc.(a)(b) | | | 53,765 | | | | 1,083,365 | |
Thermon Group Holdings, Inc.(a) | | | 8,770 | | | | 218,548 | |
TPI Composites, Inc.(a)(b) | | | 10,617 | | | | 138,552 | |
Vertiv Holdings Co. | | | 84,725 | | | | 1,212,415 | |
Vicor Corp.(a) | | | 5,553 | | | | 260,658 | |
| | | | | | | | |
| | |
| | | | | | | 76,698,467 | |
|
| Electronic Equipment, Instruments & Components — 0.7% | |
908 Devices, Inc.(a)(b) | | | 7,927 | | | | 68,172 | |
Advanced Energy Industries, Inc. | | | 10,720 | | | | 1,050,560 | |
Akoustis Technologies, Inc.(a)(b) | | | 33,763 | | | | 103,990 | |
Amphenol Corp., Class A | | | 156,293 | | | | 12,772,264 | |
Arlo Technologies, Inc.(a) | | | 21,722 | | | | 131,635 | |
Arrow Electronics, Inc.(a) | | | 15,504 | | | | 1,935,984 | |
Avnet, Inc. | | | 24,409 | | | | 1,103,287 | |
Badger Meter, Inc. | | | 7,216 | | | | 879,053 | |
| | |
S C H E D U L E S O F I N V E S T M E N T S | | 17 |
| | |
Schedule of Investments (continued) March 31, 2023 | | iShares® Russell 3000 ETF (Percentages shown are based on Net Assets) |
| | | | | | | | |
| Security | | Shares | | | Value | |
|
| Electronic Equipment, Instruments & Components (continued) | |
Belden, Inc. | | | 11,227 | | | $ | 974,167 | |
Benchmark Electronics, Inc. | | | 10,666 | | | | 252,678 | |
CDW Corp. | | | 35,843 | | | | 6,985,442 | |
Cognex Corp. | | | 45,295 | | | | 2,244,367 | |
Coherent Corp.(a)(b) | | | 30,839 | | | | 1,174,349 | |
Corning, Inc. | | | 196,564 | | | | 6,934,778 | |
CTS Corp. | | | 8,300 | | | | 410,518 | |
ePlus, Inc.(a) | | | 7,612 | | | | 373,292 | |
Fabrinet(a) | | | 9,459 | | | | 1,123,351 | |
FARO Technologies, Inc.(a) | | | 4,216 | | | | 103,756 | |
Insight Enterprises, Inc.(a)(b) | | | 8,126 | | | | 1,161,693 | |
IPG Photonics Corp.(a) | | | 8,533 | | | | 1,052,204 | |
Itron, Inc.(a) | | | 11,820 | | | | 655,419 | |
Jabil, Inc. | | | 34,400 | | | | 3,032,704 | |
Keysight Technologies, Inc.(a) | | | 47,490 | | | | 7,668,685 | |
Kimball Electronics, Inc.(a) | | | 6,050 | | | | 145,805 | |
Knowles Corp.(a)(b) | | | 26,140 | | | | 444,380 | |
Lightwave Logic, Inc.(a)(b) | | | 31,721 | | | | 165,901 | |
Littelfuse, Inc. | | | 6,305 | | | | 1,690,307 | |
Methode Electronics, Inc. | | | 9,312 | | | | 408,611 | |
MicroVision, Inc.(a)(b) | | | 41,822 | | | | 111,665 | |
Mirion Technologies, Inc., Class A(a)(b) | | | 42,683 | | | | 364,513 | |
Napco Security Technologies, Inc.(a)(b) | | | 7,642 | | | | 287,186 | |
National Instruments Corp. | | | 35,085 | | | | 1,838,805 | |
nLight, Inc.(a) | | | 10,925 | | | | 111,217 | |
Novanta, Inc.(a) | | | 9,060 | | | | 1,441,355 | |
OSI Systems, Inc.(a) | | | 4,571 | | | | 467,888 | |
Ouster, Inc.(a) | | | 83,654 | | | | 69,993 | |
PAR Technology Corp.(a)(b) | | | 7,460 | | | | 253,342 | |
PC Connection, Inc. | | | 2,996 | | | | 134,700 | |
Plexus Corp.(a) | | | 7,476 | | | | 729,433 | |
Rogers Corp.(a) | | | 5,027 | | | | 821,563 | |
Sanmina Corp.(a) | | | 14,052 | | | | 857,031 | |
ScanSource, Inc.(a) | | | 6,836 | | | | 208,088 | |
SmartRent, Inc.(a) | | | 38,548 | | | | 98,297 | |
TD SYNNEX Corp. | | | 12,414 | | | | 1,201,551 | |
Teledyne Technologies, Inc.(a) | | | 12,410 | | | | 5,551,738 | |
Trimble, Inc.(a) | | | 65,113 | | | | 3,413,223 | |
TTM Technologies, Inc.(a)(b) | | | 24,153 | | | | 325,824 | |
Vishay Intertechnology, Inc. | | | 32,409 | | | | 733,092 | |
Vishay Precision Group, Inc.(a) | | | 3,264 | | | | 136,305 | |
Vontier Corp. | | | 42,841 | | | | 1,171,273 | |
Zebra Technologies Corp., Class A(a) | | | 13,576 | | | | 4,317,168 | |
| | | | | | | | |
| | |
| | | | | | | 79,692,602 | |
| | |
| Energy Equipment & Services — 0.5% | | | | | | |
Archrock, Inc. | | | 35,195 | | | | 343,855 | |
Baker Hughes Co., Class A | | | 252,734 | | | | 7,293,903 | |
Borr Drilling Ltd.(a) | | | 46,405 | | | | 351,750 | |
Bristow Group, Inc.(a) | | | 6,195 | | | | 138,768 | |
Cactus, Inc., Class A | | | 14,966 | | | | 617,048 | |
ChampionX Corp. | | | 51,580 | | | | 1,399,365 | |
Diamond Offshore Drilling, Inc.(a) | | | 26,571 | | | | 319,915 | |
DMC Global, Inc.(a)(b) | | | 6,426 | | | | 141,179 | |
Dril-Quip, Inc.(a) | | | 9,969 | | | | 286,011 | |
Expro Group Holdings NV(a)(b) | | | 20,279 | | | | 372,322 | |
Halliburton Co. | | | 239,112 | | | | 7,565,504 | |
Helix Energy Solutions Group, Inc.(a) | | | 35,809 | | | | 277,162 | |
Helmerich & Payne, Inc. | | | 27,084 | | | | 968,253 | |
Liberty Energy, Inc., Class A | | | 39,313 | | | | 503,600 | |
Nabors Industries Ltd.(a) | | | 2,256 | | | | 275,029 | |
Newpark Resources, Inc.(a) | | | 26,365 | | | | 101,505 | |
NexTier Oilfield Solutions, Inc.(a)(b) | | | 40,906 | | | | 325,203 | |
| | | | | | | | |
| Security | | Shares | | | Value | |
|
| Energy Equipment & Services (continued) | |
Noble Corp. PLC(a) | | | 22,264 | | | $ | 878,760 | |
NOV, Inc. | | | 105,360 | | | | 1,950,214 | |
Oceaneering International, Inc.(a) | | | 24,823 | | | | 437,629 | |
Oil States International, Inc.(a) | | | 23,162 | | | | 192,939 | |
Patterson-UTI Energy, Inc. | | | 58,495 | | | | 684,392 | |
ProFrac Holding Corp., Class A(a) | | | 8,219 | | | | 104,135 | |
ProPetro Holding Corp.(a) | | | 20,065 | | | | 144,267 | |
RPC, Inc. | | | 20,839 | | | | 160,252 | |
Schlumberger NV | | | 376,192 | | | | 18,471,027 | |
Select Energy Services, Inc., Class A | | | 22,635 | | | | 157,540 | |
Solaris Oilfield Infrastructure, Inc., Class A | | | 12,623 | | | | 107,800 | |
TETRA Technologies, Inc.(a) | | | 42,560 | | | | 112,784 | |
Tidewater, Inc.(a) | | | 13,090 | | | | 577,007 | |
U.S. Silica Holdings, Inc.(a) | | | 21,420 | | | | 255,755 | |
Valaris Ltd.(a) | | | 15,737 | | | | 1,023,849 | |
Weatherford International PLC(a) | | | 18,369 | | | | 1,090,200 | |
| | | | | | | | |
| | |
| | | | | | | 47,628,922 | |
| | |
| Entertainment — 1.5% | | | | | | |
Activision Blizzard, Inc. | | | 206,699 | | | | 17,691,367 | |
AMC Entertainment Holdings, Inc., Class A(a)(b) | | | 135,834 | | | | 680,528 | |
Cinemark Holdings, Inc.(a)(b) | | | 29,321 | | | | 433,658 | |
Electronic Arts, Inc. | | | 73,189 | | | | 8,815,615 | |
IMAX Corp.(a) | | | 14,901 | | | | 285,801 | |
Liberty Media Corp. - Liberty Braves,
Class A(a)(b) | | | 3,144 | | | | 108,720 | |
Liberty Media Corp. - Liberty Braves, Class C, NVS(a) | | | 8,666 | | | | 291,958 | |
Liberty Media Corp. - Liberty Formula One,
Class A(a) | | | 4,891 | | | | 330,142 | |
Liberty Media Corp. - Liberty Formula One,
Class C, NVS(a) | | | 53,728 | | | | 4,020,466 | |
Lions Gate Entertainment Corp., Class A(a)(b) | | | 14,275 | | | | 158,024 | |
Lions Gate Entertainment Corp., Class B, NVS(a) | | | 33,784 | | | | 350,678 | |
Live Nation Entertainment, Inc.(a) | | | 40,710 | | | | 2,849,700 | |
Madison Square Garden Entertainment Corp., Class A(a) | | | 6,896 | | | | 407,347 | |
Madison Square Garden Sports Corp., Class A | | | 5,288 | | | | 1,030,367 | |
Marcus Corp. | | | 7,290 | | | | 116,640 | |
Netflix, Inc.(a) | | | 116,720 | | | | 40,324,426 | |
Playstudios, Inc., Class A(a) | | | 27,703 | | | | 102,224 | |
Playtika Holding Corp.(a) | | | 27,395 | | | | 308,468 | |
ROBLOX Corp., Class A(a)(b) | | | 119,400 | | | | 5,370,612 | |
Roku, Inc.(a)(b) | | | 31,994 | | | | 2,105,845 | |
Skillz, Inc.(a) | | | 129,732 | | | | 76,957 | |
Spotify Technology SA(a) | | | 37,040 | | | | 4,949,285 | |
Take-Two Interactive Software, Inc.(a) | | | 44,375 | | | | 5,293,937 | |
Walt Disney Co.(a) | | | 485,816 | | | | 48,644,756 | |
Warner Bros Discovery, Inc., Class A(a) | | | 629,609 | | | | 9,507,096 | |
World Wrestling Entertainment, Inc., Class A | | | 11,622 | | | | 1,060,624 | |
| | | | | | | | |
| | |
| | | | | | | 155,315,241 | |
| | |
| Financial Services — 4.1% | | | | | | |
Affirm Holdings, Inc., Class A(a)(b) | | | 57,748 | | | | 650,820 | |
Alerus Financial Corp. | | | 5,596 | | | | 89,816 | |
A-Mark Precious Metals, Inc. | | | 5,156 | | | | 178,655 | |
Apollo Global Management, Inc. | | | 128,356 | | | | 8,106,965 | |
AvidXchange Holdings, Inc.(a) | | | 38,134 | | | | 297,445 | |
Banco Latinoamericano de Comercio Exterior SA, Class E | | | 10,926 | | | | 189,894 | |
Berkshire Hathaway, Inc., Class B(a) | | | 481,036 | | | | 148,529,486 | |
Block, Inc., Class A(a) | | | 142,343 | | | | 9,771,847 | |
Cannae Holdings, Inc.(a) | | | 22,233 | | | | 448,662 | |
Cantaloupe, Inc.(a) | | | 24,639 | | | | 140,442 | |
Cass Information Systems, Inc. | | | 3,411 | | | | 147,730 | |
| | |
| 18 | | 2 0 2 3 I S H A R E S A N N U A L R E P O R T T O S H A R E H O L D E R S |
| | |
Schedule of Investments (continued) March 31, 2023 | | iShares® Russell 3000 ETF (Percentages shown are based on Net Assets) |
| | | | | | | | |
| Security | | Shares | | | Value | |
|
| Financial Services (continued) | |
Compass Diversified Holdings | | | 14,424 | | | $ | 275,210 | |
Enact Holdings, Inc. | | | 8,504 | | | | 194,401 | |
Equitable Holdings, Inc. | | | 96,810 | | | | 2,458,006 | |
Essent Group Ltd. | | | 29,301 | | | | 1,173,505 | |
Euronet Worldwide, Inc.(a)(b) | | | 12,415 | | | | 1,389,239 | |
EVERTEC, Inc. | | | 16,117 | | | | 543,949 | |
Federal Agricultural Mortgage Corp., Class C, NVS | | | 2,527 | | | | 336,571 | |
Fidelity National Information Services, Inc. | | | 157,419 | | | | 8,552,574 | |
Fiserv, Inc.(a) | | | 156,893 | | | | 17,733,616 | |
FleetCor Technologies, Inc.(a) | | | 19,078 | | | | 4,022,596 | |
Flywire Corp.(a) | | | 16,501 | | | | 484,469 | |
Global Payments, Inc. | | | 69,757 | | | | 7,341,227 | |
I3 Verticals, Inc., Class A(a) | | | 6,147 | | | | 150,786 | |
International Money Express, Inc.(a)(b) | | | 9,577 | | | | 246,895 | |
Jack Henry & Associates, Inc. | | | 19,222 | | | | 2,897,140 | |
Jackson Financial, Inc., Class A | | | 20,018 | | | | 748,873 | |
Marqeta, Inc., Class A(a) | | | 116,802 | | | | 533,785 | |
Mastercard, Inc., Class A | | | 226,880 | | | | 82,450,461 | |
Merchants Bancorp | | | 5,209 | | | | 135,642 | |
MGIC Investment Corp. | | | 83,617 | | | | 1,122,140 | |
MoneyGram International, Inc.(a) | | | 23,572 | | | | 245,620 | |
Mr. Cooper Group, Inc.(a) | | | 18,798 | | | | 770,154 | |
NMI Holdings, Inc., Class A(a) | | | 22,199 | | | | 495,704 | |
Payoneer Global, Inc.(a) | | | 66,133 | | | | 415,315 | |
PayPal Holdings, Inc.(a) | | | 304,140 | | | | 23,096,392 | |
Paysafe Ltd.(a) | | | 7,779 | | | | 134,343 | |
PennyMac Financial Services, Inc., Class A | | | 6,772 | | | | 403,679 | |
Radian Group, Inc. | | | 44,881 | | | | 991,870 | |
Remitly Global, Inc.(a)(b) | | | 26,961 | | | | 456,989 | |
Repay Holdings Corp.(a) | | | 20,910 | | | | 137,379 | |
Rocket Cos., Inc., Class A(a)(b) | | | 31,073 | | | | 281,521 | |
Shift4 Payments, Inc., Class A(a) | | | 13,319 | | | | 1,009,580 | |
Star Holdings(a) | | | 2,417 | | | | 42,036 | |
StoneCo Ltd., Class A(a) | | | 76,526 | | | | 730,058 | |
TFS Financial Corp. | | | 15,225 | | | | 192,292 | |
Toast, Inc., Class A(a)(b) | | | 69,089 | | | | 1,226,330 | |
UWM Holdings Corp., Class A(b) | | | 33,203 | | | | 163,027 | |
Visa, Inc., Class A | | | 433,419 | | | | 97,718,648 | |
Voya Financial, Inc. | | | 26,234 | | | | 1,874,682 | |
Walker & Dunlop, Inc. | | | 7,880 | | | | 600,220 | |
Waterstone Financial, Inc. | | | 8,288 | | | | 125,397 | |
Western Union Co. | | | 88,648 | | | | 988,425 | |
WEX, Inc.(a) | | | 11,705 | | | | 2,152,433 | |
| | | | | | | | |
| | |
| | | | | | | 435,594,941 | |
| | |
| Food Products — 1.1% | | | | | | |
Archer-Daniels-Midland Co. | | | 145,212 | | | | 11,567,588 | |
B&G Foods, Inc. | | | 16,935 | | | | 263,000 | |
Benson Hill, Inc.(a)(b) | | | 59,955 | | | | 68,948 | |
Beyond Meat, Inc.(a)(b) | | | 15,109 | | | | 245,219 | |
BRC, Inc., Class A(a)(b) | | | 14,149 | | | | 72,726 | |
Bunge Ltd. | | | 36,866 | | | | 3,521,440 | |
Calavo Growers, Inc. | | | 4,144 | | | | 119,223 | |
Cal-Maine Foods, Inc. | | | 9,420 | | | | 573,584 | |
Campbell Soup Co. | | | 50,853 | | | | 2,795,898 | |
Conagra Brands, Inc. | | | 126,550 | | | | 4,753,218 | |
Darling Ingredients, Inc.(a) | | | 42,479 | | | | 2,480,774 | |
Flowers Foods, Inc. | | | 49,512 | | | | 1,357,124 | |
Fresh Del Monte Produce, Inc. | | | 8,970 | | | | 270,087 | |
Freshpet, Inc.(a)(b) | | | 12,181 | | | | 806,260 | |
General Mills, Inc. | | | 156,921 | | | | 13,410,469 | |
Hain Celestial Group, Inc.(a) | | | 23,464 | | | | 402,408 | |
| | | | | | | | |
| Security | | Shares | | | Value | |
|
| Food Products (continued) | |
Hershey Co. | | | 38,992 | | | $ | 9,919,955 | |
Hormel Foods Corp. | | | 75,299 | | | | 3,002,924 | |
Hostess Brands, Inc., Class A(a) | | | 37,735 | | | | 938,847 | |
Ingredion, Inc. | | | 17,938 | | | | 1,824,833 | |
J & J Snack Foods Corp. | | | 4,123 | | | | 611,111 | |
J M Smucker Co. | | | 27,564 | | | | 4,337,747 | |
John B Sanfilippo & Son, Inc. | | | 1,976 | | | | 191,514 | |
Kellogg Co. | | | 67,685 | | | | 4,532,188 | |
Kraft Heinz Co. | | | 187,273 | | | | 7,241,847 | |
Lamb Weston Holdings, Inc. | | | 38,841 | | | | 4,059,661 | |
Lancaster Colony Corp. | | | 5,065 | | | | 1,027,587 | |
Lifecore Biomedical, Inc.(a) | | | 11,554 | | | | 43,616 | |
McCormick & Co., Inc., NVS | | | 66,266 | | | | 5,513,994 | |
Mission Produce, Inc.(a) | | | 10,467 | | | | 116,288 | |
Mondelez International, Inc., Class A | | | 363,863 | | | | 25,368,528 | |
Pilgrim’s Pride Corp.(a) | | | 13,878 | | | | 321,692 | |
Post Holdings, Inc.(a) | | | 14,652 | | | | 1,316,775 | |
Seaboard Corp. | | | 75 | | | | 282,751 | |
Seneca Foods Corp., Class A(a) | | | 2,104 | | | | 109,976 | |
Simply Good Foods Co.(a) | | | 22,876 | | | | 909,778 | |
Sovos Brands, Inc.(a)(b) | | | 8,293 | | | | 138,327 | |
SunOpta, Inc.(a)(b) | | | 28,049 | | | | 215,977 | |
Tattooed Chef, Inc., Class A(a)(b) | | | 26,849 | | | | 38,126 | |
Tootsie Roll Industries, Inc. | | | 4,191 | | | | 188,218 | |
TreeHouse Foods, Inc.(a) | | | 13,293 | | | | 670,366 | |
Tyson Foods, Inc., Class A | | | 75,113 | | | | 4,455,703 | |
Utz Brands, Inc.(b) | | | 15,630 | | | | 257,426 | |
Vital Farms, Inc.(a) | | | 8,736 | | | | 133,661 | |
| | | | | | | | |
| | |
| | | | | | | 120,477,382 | |
| | |
| Gas Utilities — 0.1% | | | | | | |
Atmos Energy Corp. | | | 37,963 | | | | 4,265,523 | |
Brookfield Infrastructure Corp., Class A | | | 24,589 | | | | 1,132,569 | |
Chesapeake Utilities Corp. | | | 4,585 | | | | 586,834 | |
National Fuel Gas Co. | | | 22,508 | | | | 1,299,612 | |
New Jersey Resources Corp. | | | 26,436 | | | | 1,406,395 | |
Northwest Natural Holding Co. | | | 8,698 | | | | 413,677 | |
ONE Gas, Inc. | | | 14,467 | | | | 1,146,220 | |
Southwest Gas Holdings, Inc. | | | 17,342 | | | | 1,083,008 | |
Spire, Inc. | | | 13,543 | | | | 949,906 | |
UGI Corp. | | | 56,472 | | | | 1,962,967 | |
| | | | | | | | |
| | |
| | | | | | | 14,246,711 | |
| | |
| Ground Transportation — 1.0% | | | | | | |
ArcBest Corp. | | | 6,181 | | | | 571,248 | |
Avis Budget Group, Inc.(a) | | | 6,796 | | | | 1,323,861 | |
Covenant Logistics Group, Inc., Class A | | | 3,737 | | | | 132,365 | |
CSX Corp. | | | 561,591 | | | | 16,814,035 | |
Daseke, Inc.(a) | | | 12,699 | | | | 98,163 | |
Heartland Express, Inc. | | | 11,922 | | | | 189,798 | |
Hertz Global Holdings, Inc.(a) | | | 48,398 | | | | 788,404 | |
JB Hunt Transport Services, Inc. | | | 22,022 | | | | 3,863,980 | |
Knight-Swift Transportation Holdings, Inc. | | | 42,127 | | | | 2,383,546 | |
Landstar System, Inc. | | | 9,242 | | | | 1,656,721 | |
Lyft, Inc., Class A(a) | | | 84,901 | | | | 787,032 | |
Marten Transport Ltd. | | | 14,132 | | | | 296,065 | |
Norfolk Southern Corp. | | | 60,767 | | | | 12,882,604 | |
Old Dominion Freight Line, Inc.(b) | | | 26,402 | | | | 8,998,858 | |
RXO, Inc.(a) | | | 27,836 | | | | 546,699 | |
Ryder System, Inc. | | | 13,221 | | | | 1,179,842 | |
Saia, Inc.(a)(b) | | | 7,101 | | | | 1,932,040 | |
Schneider National, Inc., Class B | | | 14,826 | | | | 396,596 | |
TuSimple Holdings, Inc., Class A(a) | | | 34,955 | | | | 51,384 | |
Uber Technologies, Inc.(a) | | | 513,106 | | | | 16,265,460 | |
| | |
S C H E D U L E S O F I N V E S T M E N T S | | 19 |
| | |
Schedule of Investments (continued) March 31, 2023 | | iShares® Russell 3000 ETF (Percentages shown are based on Net Assets) |
| | | | | | | | |
| Security | | Shares | | | Value | |
|
| Ground Transportation (continued) | |
U-Haul Holding Co. | | | 2,317 | | | $ | 138,209 | |
U-Haul Holding Co., NVS(b) | | | 20,905 | | | | 1,083,924 | |
Union Pacific Corp. | | | 163,790 | | | | 32,964,375 | |
Universal Logistics Holdings, Inc. | | | 3,526 | | | | 102,783 | |
Werner Enterprises, Inc. | | | 16,396 | | | | 745,854 | |
XPO, Inc.(a) | | | 27,836 | | | | 887,968 | |
| | | | | | | | |
| | |
| | | | | | | 107,081,814 | |
|
| Health Care Equipment & Supplies — 2.8% | |
Abbott Laboratories | | | 457,205 | | | | 46,296,578 | |
Align Technology, Inc.(a) | | | 20,939 | | | | 6,996,557 | |
Alphatec Holdings, Inc.(a) | | | 21,371 | | | | 333,388 | |
AngioDynamics, Inc.(a) | | | 10,237 | | | | 105,851 | |
Artivion, Inc.(a) | | | 10,570 | | | | 138,467 | |
AtriCure, Inc.(a) | | | 12,065 | | | | 500,094 | |
Atrion Corp. | | | 382 | | | | 239,862 | |
Avanos Medical, Inc.(a) | | | 12,089 | | | | 359,527 | |
Axogen, Inc.(a) | | | 10,984 | | | | 103,799 | |
Axonics, Inc.(a) | | | 12,825 | | | | 699,732 | |
Baxter International, Inc. | | | 133,322 | | | | 5,407,540 | |
Becton Dickinson & Co. | | | 75,880 | | | | 18,783,335 | |
Boston Scientific Corp.(a) | | | 379,865 | | | | 19,004,646 | |
Butterfly Network, Inc.(a)(b) | | | 47,836 | | | | 89,932 | |
Cardiovascular Systems, Inc.(a) | | | 9,979 | | | | 198,183 | |
Cerus Corp.(a) | | | 38,883 | | | | 115,483 | |
CONMED Corp. | | | 7,851 | | | | 815,405 | |
Cooper Cos., Inc. | | | 13,039 | | | | 4,868,241 | |
Cue Health, Inc.(a)(b) | | | 38,287 | | | | 69,682 | |
Cutera, Inc.(a) | | | 4,115 | | | | 97,196 | |
DENTSPLY SIRONA, Inc. | | | 58,462 | | | | 2,296,387 | |
Dexcom, Inc.(a) | | | 102,917 | | | | 11,956,897 | |
Edwards Lifesciences Corp.(a) | | | 164,963 | | | | 13,647,389 | |
Embecta Corp. | | | 16,127 | | | | 453,491 | |
Enovis Corp.(a) | | | 14,010 | | | | 749,395 | |
Envista Holdings Corp.(a) | | | 43,234 | | | | 1,767,406 | |
Figs, Inc., Class A(a)(b) | | | 38,013 | | | | 235,300 | |
GE HealthCare Technologies, Inc.(a) | | | 97,009 | | | | 7,957,648 | |
Glaukos Corp.(a) | | | 11,873 | | | | 594,837 | |
Globus Medical, Inc., Class A(a) | | | 19,957 | | | | 1,130,364 | |
Haemonetics Corp.(a) | | | 13,721 | | | | 1,135,413 | |
Heska Corp.(a) | | | 2,517 | | | | 245,710 | |
Hologic, Inc.(a) | | | 64,224 | | | | 5,182,877 | |
ICU Medical, Inc.(a) | | | 5,116 | | | | 843,935 | |
IDEXX Laboratories, Inc.(a) | | | 21,896 | | | | 10,949,752 | |
Inari Medical, Inc.(a) | | | 13,136 | | | | 811,017 | |
Inogen, Inc.(a) | | | 4,680 | | | | 58,406 | |
Inspire Medical Systems, Inc.(a) | | | 7,361 | | | | 1,722,989 | |
Insulet Corp.(a) | | | 18,343 | | | | 5,850,683 | |
Integer Holdings Corp.(a)(b) | | | 9,114 | | | | 706,335 | |
Integra LifeSciences Holdings Corp.(a) | | | 19,338 | | | | 1,110,195 | |
Intuitive Surgical, Inc.(a) | | | 94,044 | | | | 24,025,421 | |
iRadimed Corp. | | | 2,760 | | | | 108,606 | |
iRhythm Technologies, Inc.(a)(b) | | | 7,981 | | | | 989,883 | |
Lantheus Holdings, Inc.(a) | | | 17,522 | | | | 1,446,616 | |
LeMaitre Vascular, Inc. | | | 4,775 | | | | 245,769 | |
LivaNova PLC(a) | | | 13,820 | | | | 602,276 | |
Masimo Corp.(a)(b) | | | 12,706 | | | | 2,344,765 | |
Medtronic PLC | | | 356,371 | | | | 28,730,630 | |
Merit Medical Systems, Inc.(a) | | | 14,180 | | | | 1,048,611 | |
Mesa Laboratories, Inc. | | | 1,385 | | | | 242,001 | |
Nano-X Imaging Ltd.(a)(b) | | | 14,570 | | | | 84,069 | |
Neogen Corp.(a)(b) | | | 57,223 | | | | 1,059,770 | |
Nevro Corp.(a) | | | 9,106 | | | | 329,182 | |
| | | | | | | | |
| Security | | Shares | | | Value | |
|
| Health Care Equipment & Supplies (continued) | |
Novocure Ltd.(a)(b) | | | 26,946 | | | $ | 1,620,532 | |
NuVasive, Inc.(a) | | | 14,396 | | | | 594,699 | |
Omnicell, Inc.(a) | | | 11,601 | | | | 680,631 | |
OraSure Technologies, Inc.(a) | | | 20,704 | | | | 125,259 | |
Orthofix Medical, Inc.(a) | | | 9,102 | | | | 152,459 | |
OrthoPediatrics Corp.(a) | | | 2,866 | | | | 126,935 | |
Outset Medical, Inc.(a)(b) | | | 12,618 | | | | 232,171 | |
Paragon 28, Inc.(a) | | | 14,774 | | | | 252,192 | |
Penumbra, Inc.(a)(b) | | | 9,667 | | | | 2,694,096 | |
PROCEPT BioRobotics Corp.(a) | | | 7,810 | | | | 221,804 | |
Pulmonx Corp.(a) | | | 8,042 | | | | 89,910 | |
QuidelOrtho Corp.(a) | | | 13,160 | | | | 1,172,424 | |
ResMed, Inc. | | | 38,602 | | | | 8,453,452 | |
RxSight, Inc.(a) | | | 8,174 | | | | 136,342 | |
Senseonics Holdings, Inc.(a)(b) | | | 108,467 | | | | 77,012 | |
Shockwave Medical, Inc.(a) | | | 9,457 | | | | 2,050,561 | |
SI-BONE, Inc.(a)(b) | | | 7,600 | | | | 149,492 | |
Silk Road Medical, Inc.(a) | | | 9,336 | | | | 365,318 | |
STAAR Surgical Co.(a) | | | 12,666 | | | | 809,991 | |
STERIS PLC | | | 26,324 | | | | 5,035,255 | |
Stryker Corp. | | | 93,770 | | | | 26,768,522 | |
Surmodics, Inc.(a) | | | 3,851 | | | | 87,726 | |
Tactile Systems Technology, Inc.(a) | | | 7,248 | | | | 119,012 | |
Tandem Diabetes Care, Inc.(a) | | | 16,409 | | | | 666,369 | |
Teleflex, Inc. | | | 12,315 | | | | 3,119,513 | |
TransMedics Group, Inc.(a)(b) | | | 7,371 | | | | 558,206 | |
Treace Medical Concepts, Inc.(a) | | | 10,750 | | | | 270,792 | |
UFP Technologies, Inc.(a) | | | 1,983 | | | | 257,473 | |
Utah Medical Products, Inc. | | | 1,148 | | | | 108,796 | |
Varex Imaging Corp.(a) | | | 9,831 | | | | 178,826 | |
ViewRay, Inc.(a) | | | 40,436 | | | | 139,909 | |
Zimmer Biomet Holdings, Inc. | | | 56,020 | | | | 7,237,784 | |
Zimvie, Inc.(a) | | | 13,212 | | | | 95,523 | |
Zynex, Inc.(a) | | | 7,370 | | | | 88,440 | |
| | | | | | | | |
| | |
| | | | | | | 300,624,949 | |
| | |
| Health Care Providers & Services — 2.9% | | | | | | |
23andMe Holding Co., Class A(a)(b) | | | 61,857 | | | | 141,034 | |
Acadia Healthcare Co., Inc.(a) | | | 22,993 | | | | 1,661,244 | |
Accolade, Inc.(a) | | | 14,956 | | | | 215,067 | |
AdaptHealth Corp.(a)(b) | | | 20,179 | | | | 250,825 | |
Addus HomeCare Corp.(a)(b) | | | 3,488 | | | | 372,379 | |
Agiliti, Inc.(a)(b) | | | 7,279 | | | | 116,318 | |
agilon health, Inc.(a)(b) | | | 51,188 | | | | 1,215,715 | |
Alignment Healthcare, Inc.(a) | | | 20,775 | | | | 132,129 | |
Amedisys, Inc.(a) | | | 8,789 | | | | 646,431 | |
AmerisourceBergen Corp. | | | 43,557 | | | | 6,973,911 | |
AMN Healthcare Services, Inc.(a) | | | 11,393 | | | | 945,163 | |
Apollo Medical Holdings, Inc.(a)(b) | | | 9,333 | | | | 340,375 | |
Brookdale Senior Living, Inc.(a)(b) | | | 49,555 | | | | 146,187 | |
Cano Health, Inc.(a)(b) | | | 47,310 | | | | 43,052 | |
Cardinal Health, Inc. | | | 68,124 | | | | 5,143,362 | |
CareMax, Inc.(a)(b) | | | 22,495 | | | | 60,062 | |
Castle Biosciences, Inc.(a) | | | 5,382 | | | | 122,279 | |
Centene Corp.(a) | | | 146,384 | | | | 9,252,933 | |
Chemed Corp. | | | 3,940 | | | | 2,118,735 | |
Cigna Group | | | 78,351 | | | | 20,021,031 | |
Clover Health Investments Corp.(a)(b) | | | 117,833 | | | | 99,581 | |
Community Health Systems, Inc.(a) | | | 41,097 | | | | 201,375 | |
CorVel Corp.(a) | | | 2,091 | | | | 397,875 | |
Cross Country Healthcare, Inc.(a) | | | 12,024 | | | | 268,376 | |
CVS Health Corp. | | | 341,874 | | | | 25,404,657 | |
DaVita, Inc.(a)(b) | | | 15,610 | | | | 1,266,127 | |
| | |
| 20 | | 2 0 2 3 I S H A R E S A N N U A L R E P O R T T O S H A R E H O L D E R S |
| | |
Schedule of Investments (continued) March 31, 2023 | | iShares® Russell 3000 ETF (Percentages shown are based on Net Assets) |
| | | | | | | | |
| Security | | Shares | | | Value | |
|
| Health Care Providers & Services (continued) | |
DocGo, Inc.(a)(b) | | | 24,638 | | | $ | 213,119 | |
Elevance Health, Inc. | | | 64,237 | | | | 29,536,815 | |
Encompass Health Corp. | | | 25,609 | | | | 1,385,447 | |
Enhabit, Inc.(a) | | | 14,413 | | | | 200,485 | |
Ensign Group, Inc. | | | 13,729 | | | | 1,311,669 | |
Fulgent Genetics, Inc.(a) | | | 5,261 | | | | 164,248 | |
Guardant Health, Inc.(a) | | | 26,905 | | | | 630,653 | |
HCA Healthcare, Inc. | | | 57,667 | | | | 15,205,635 | |
HealthEquity, Inc.(a) | | | 21,553 | | | | 1,265,377 | |
Henry Schein, Inc.(a)(b) | | | 35,633 | | | | 2,905,515 | |
Hims & Hers Health, Inc., Class A(a) | | | 31,880 | | | | 316,250 | |
Humana, Inc. | | | 33,592 | | | | 16,307,572 | |
Invitae Corp.(a)(b) | | | 53,164 | | | | 71,771 | |
Laboratory Corp. of America Holdings | | | 23,588 | | | | 5,411,559 | |
LifeStance Health Group, Inc.(a) | | | 23,459 | | | | 174,300 | |
McKesson Corp. | | | 36,630 | | | | 13,042,112 | |
ModivCare, Inc.(a) | | | 3,098 | | | | 260,480 | |
Molina Healthcare, Inc.(a) | | | 15,257 | | | | 4,081,095 | |
National HealthCare Corp. | | | 3,511 | | | | 203,884 | |
National Research Corp., Class A | | | 3,771 | | | | 164,076 | |
NeoGenomics, Inc.(a) | | | 34,444 | | | | 599,670 | |
Nutex Health, Inc.(a)(b) | | | 66,079 | | | | 66,740 | |
Oak Street Health, Inc.(a) | | | 30,436 | | | | 1,177,265 | |
OPKO Health, Inc.(a)(b) | | | 100,897 | | | | 147,310 | |
Option Care Health, Inc.(a) | | | 44,234 | | | | 1,405,314 | |
Owens & Minor, Inc.(a) | | | 19,533 | | | | 284,205 | |
Patterson Cos., Inc. | | | 21,607 | | | | 578,419 | |
Pediatrix Medical Group, Inc.(a) | | | 20,729 | | | | 309,069 | |
Pennant Group, Inc.(a)(b) | | | 8,610 | | | | 122,951 | |
PetIQ, Inc., Class A(a) | | | 9,380 | | | | 107,307 | |
Premier, Inc., Class A | | | 32,826 | | | | 1,062,578 | |
Privia Health Group, Inc.(a)(b) | | | 14,863 | | | | 410,367 | |
Progyny, Inc.(a) | | | 21,075 | | | | 676,929 | |
Quest Diagnostics, Inc. | | | 29,553 | | | | 4,181,158 | |
R1 RCM, Inc.(a) | | | 38,623 | | | | 579,345 | |
RadNet, Inc.(a) | | | 14,102 | | | | 352,973 | |
Select Medical Holdings Corp. | | | 30,509 | | | | 788,658 | |
Surgery Partners, Inc.(a)(b) | | | 13,309 | | | | 458,761 | |
Tenet Healthcare Corp.(a) | | | 27,572 | | | | 1,638,328 | |
U.S. Physical Therapy, Inc. | | | 3,538 | | | | 346,406 | |
UnitedHealth Group, Inc. | | | 249,399 | | | | 117,863,473 | |
Universal Health Services, Inc., Class B | | | 16,797 | | | | 2,134,899 | |
| | | | | | | | |
| | |
| | | | | | | 305,700,410 | |
| | |
| Health Care REITs — 0.2% | | | | | | |
CareTrust REIT, Inc. | | | 26,331 | | | | 515,561 | |
Community Healthcare Trust, Inc. | | | 5,786 | | | | 211,768 | |
Diversified Healthcare Trust | | | 82,608 | | | | 111,521 | |
Global Medical REIT, Inc. | | | 11,664 | | | | 106,259 | |
Healthcare Realty Trust, Inc. | | | 99,551 | | | | 1,924,321 | |
Healthpeak Properties, Inc. | | | 146,623 | | | | 3,221,307 | |
LTC Properties, Inc. | | | 9,886 | | | | 347,295 | |
Medical Properties Trust, Inc. | | | 157,888 | | | | 1,297,839 | |
National Health Investors, Inc. | | | 11,398 | | | | 587,909 | |
Omega Healthcare Investors, Inc. | | | 61,225 | | | | 1,678,177 | |
Physicians Realty Trust | | | 62,211 | | | | 928,810 | |
Sabra Health Care REIT, Inc. | | | 63,250 | | | | 727,375 | |
Universal Health Realty Income Trust | | | 3,249 | | | | 156,310 | |
Ventas, Inc. | | | 106,109 | | | | 4,599,825 | |
Welltower, Inc. | | | 125,496 | | | | 8,996,808 | |
| | | | | | | | |
| | |
| | | | | | | 25,411,085 | |
| | |
| Health Care Technology — 0.1% | | | | | | |
American Well Corp., Class A(a) | | | 52,343 | | | | 123,529 | |
| | | | | | | | |
| Security | | Shares | | | Value | |
|
| Health Care Technology (continued) | |
Certara, Inc.(a) | | | 28,604 | | | $ | 689,642 | |
Computer Programs & Systems, Inc.(a) | | | 4,009 | | | | 121,072 | |
Definitive Healthcare Corp.(a)(b) | | | 10,445 | | | | 107,897 | |
Doximity, Inc., Class A(a)(b) | | | 29,652 | | | | 960,132 | |
Evolent Health, Inc., Class A(a) | | | 22,540 | | | | 731,423 | |
Health Catalyst, Inc.(a) | | | 12,105 | | | | 141,265 | |
HealthStream, Inc.(a) | | | 6,907 | | | | 187,180 | |
Multiplan Corp., Class A(a) | | | 99,766 | | | | 105,752 | |
NextGen Healthcare, Inc.(a) | | | 13,301 | | | | 231,570 | |
OptimizeRx Corp.(a) | | | 5,232 | | | | 76,544 | |
Phreesia, Inc.(a) | | | 12,806 | | | | 413,506 | |
Schrodinger, Inc.(a)(b) | | | 15,690 | | | | 413,118 | |
Sharecare, Inc., Class A(a) | | | 93,579 | | | | 132,882 | |
Simulations Plus, Inc. | | | 4,171 | | | | 183,274 | |
Teladoc Health, Inc.(a) | | | 44,585 | | | | 1,154,752 | |
Veeva Systems, Inc., Class A(a) | | | 37,365 | | | | 6,867,313 | |
Veradigm, Inc.(a)(b) | | | 30,707 | | | | 400,726 | |
| | | | | | | | |
| | |
| | | | | | | 13,041,577 | |
| | |
| Hotel & Resort REITs — 0.1% | | | | | | |
Apple Hospitality REIT, Inc. | | | 54,216 | | | | 841,432 | |
Braemar Hotels & Resorts, Inc. | | | 22,762 | | | | 87,861 | |
Chatham Lodging Trust | | | 12,892 | | | | 135,237 | |
DiamondRock Hospitality Co. | | | 56,876 | | | | 462,402 | |
Hersha Hospitality Trust, Class A | | | 13,430 | | | | 90,250 | |
Host Hotels & Resorts, Inc. | | | 187,466 | | | | 3,091,314 | |
Park Hotels & Resorts, Inc. | | | 59,495 | | | | 735,358 | |
Pebblebrook Hotel Trust(b) | | | 34,644 | | | | 486,402 | |
RLJ Lodging Trust | | | 46,017 | | | | 487,780 | |
Ryman Hospitality Properties, Inc. | | | 14,275 | | | | 1,280,896 | |
Service Properties Trust | | | 43,364 | | | | 431,906 | |
Summit Hotel Properties, Inc. | | | 29,386 | | | | 205,702 | |
Sunstone Hotel Investors, Inc. | | | 55,065 | | | | 544,042 | |
Xenia Hotels & Resorts, Inc. | | | 30,301 | | | | 396,640 | |
| | | | | | | | |
| | |
| | | | | | | 9,277,222 | |
| | |
| Hotels, Restaurants & Leisure — 2.3% | | | | | | |
Accel Entertainment, Inc.(a) | | | 13,027 | | | | 118,676 | |
Airbnb, Inc., Class A(a)(b) | | | 99,674 | | | | 12,399,446 | |
Aramark | | | 61,856 | | | | 2,214,445 | |
Bally’s Corp.(a)(b) | | | 8,454 | | | | 165,022 | |
BJ’s Restaurants, Inc.(a) | | | 6,028 | | | | 175,656 | |
Bloomin’ Brands, Inc. | | | 23,177 | | | | 594,490 | |
Bluegreen Vacations Holding Corp., Class A | | | 3,888 | | | | 106,453 | |
Booking Holdings, Inc.(a) | | | 10,328 | | | | 27,394,090 | |
Bowlero Corp.(a) | | | 12,088 | | | | 204,892 | |
Boyd Gaming Corp. | | | 21,185 | | | | 1,358,382 | |
Brinker International, Inc.(a) | | | 12,065 | | | | 458,470 | |
Caesars Entertainment, Inc.(a) | | | 53,791 | | | | 2,625,539 | |
Carnival Corp.(a)(b) | | | 263,579 | | | | 2,675,327 | |
Cheesecake Factory, Inc.(b) | | | 11,646 | | | | 408,192 | |
Chipotle Mexican Grill, Inc.(a) | | | 7,322 | | | | 12,508,099 | |
Choice Hotels International, Inc. | | | 8,590 | | | | 1,006,662 | |
Churchill Downs, Inc. | | | 9,663 | | | | 2,483,874 | |
Chuy’s Holdings, Inc.(a) | | | 5,740 | | | | 205,779 | |
Cracker Barrel Old Country Store, Inc. | | | 5,804 | | | | 659,334 | |
Darden Restaurants, Inc. | | | 32,816 | | | | 5,091,731 | |
Dave & Buster’s Entertainment, Inc.(a) | | | 12,764 | | | | 469,588 | |
Denny’s Corp.(a) | | | 17,557 | | | | 195,936 | |
Dine Brands Global, Inc. | | | 4,559 | | | | 308,371 | |
Domino’s Pizza, Inc. | | | 9,430 | | | | 3,110,674 | |
DoorDash, Inc., Class A(a) | | | 66,598 | | | | 4,232,969 | |
DraftKings, Inc., Class A(a)(b) | | | 94,958 | | | | 1,838,387 | |
Everi Holdings, Inc.(a)(b) | | | 24,153 | | | | 414,224 | |
| | |
S C H E D U L E S O F I N V E S T M E N T S | | 21 |
| | |
Schedule of Investments (continued) March 31, 2023 | | iShares® Russell 3000 ETF (Percentages shown are based on Net Assets) |
| | | | | | | | |
| Security | | Shares | | | Value | |
|
| Hotels, Restaurants & Leisure (continued) | |
Expedia Group, Inc.(a) | | | 38,858 | | | $ | 3,770,392 | |
Golden Entertainment, Inc.(a) | | | 5,237 | | | | 227,862 | |
Hilton Grand Vacations, Inc.(a) | | | 23,342 | | | | 1,037,085 | |
Hilton Worldwide Holdings, Inc. | | | 70,121 | | | | 9,877,945 | |
Hyatt Hotels Corp., Class A(a) | | | 12,644 | | | | 1,413,473 | |
Inspired Entertainment, Inc.(a) | | | 6,629 | | | | 84,785 | |
International Game Technology PLC | | | 25,179 | | | | 674,797 | |
Jack in the Box, Inc. | | | 5,447 | | | | 477,103 | |
Krispy Kreme, Inc.(b) | | | 22,337 | | | | 347,340 | |
Kura Sushi U.S.A., Inc., Class A(a)(b) | | | 1,518 | | | | 99,945 | |
Las Vegas Sands Corp.(a) | | | 87,165 | | | | 5,007,629 | |
Life Time Group Holdings, Inc.(a)(b) | | | 10,193 | | | | 162,680 | |
Light & Wonder, Inc., Class A(a) | | | 25,203 | | | | 1,513,440 | |
Lindblad Expeditions Holdings, Inc.(a)(b) | | | 12,508 | | | | 119,576 | |
Marriott International, Inc., Class A | | | 70,503 | | | | 11,706,318 | |
Marriott Vacations Worldwide Corp. | | | 9,779 | | | | 1,318,796 | |
McDonald’s Corp. | | | 197,043 | | | | 55,095,193 | |
MGM Resorts International | | | 85,631 | | | | 3,803,729 | |
Monarch Casino & Resort, Inc. | | | 3,645 | | | | 270,277 | |
Norwegian Cruise Line Holdings Ltd.(a)(b) | | | 115,552 | | | | 1,554,174 | |
Papa John’s International, Inc.(b) | | | 8,749 | | | | 655,563 | |
Penn Entertainment, Inc.(a) | | | 43,328 | | | | 1,285,108 | |
Planet Fitness, Inc., Class A(a) | | | 22,607 | | | | 1,755,886 | |
Portillo’s, Inc., Class A(a)(b) | | | 5,208 | | | | 111,295 | |
RCI Hospitality Holdings, Inc.(b) | | | 2,946 | | | | 230,289 | |
Red Rock Resorts, Inc., Class A | | | 12,886 | | | | 574,329 | |
Royal Caribbean Cruises Ltd.(a) | | | 57,779 | | | | 3,772,969 | |
Rush Street Interactive, Inc., Class A(a) | | | 23,080 | | | | 71,779 | |
Ruth’s Hospitality Group, Inc. | | | 8,493 | | | | 139,455 | |
Sabre Corp.(a) | | | 85,744 | | | | 367,842 | |
SeaWorld Entertainment, Inc.(a)(b) | | | 10,102 | | | | 619,354 | |
Shake Shack, Inc., Class A(a) | | | 9,483 | | | | 526,212 | |
Six Flags Entertainment Corp.(a) | | | 21,463 | | | | 573,277 | |
Sonder Holdings, Inc.(a) | | | 61,383 | | | | 46,473 | |
Starbucks Corp. | | | 305,691 | | | | 31,831,604 | |
Sweetgreen, Inc., Class A(a)(b) | | | 25,123 | | | | 196,964 | |
Target Hospitality Corp.(a) | | | 9,620 | | | | 126,407 | |
Texas Roadhouse, Inc. | | | 17,205 | | | | 1,859,172 | |
Travel + Leisure Co. | | | 22,023 | | | | 863,302 | |
Vacasa, Inc., Class A(a)(b) | | | 37,089 | | | | 35,687 | |
Vail Resorts, Inc. | | | 10,661 | | | | 2,491,262 | |
Wendy’s Co. | | | 48,044 | | | | 1,046,398 | |
Wingstop, Inc. | | | 7,685 | | | | 1,410,812 | |
Wyndham Hotels & Resorts, Inc. | | | 23,063 | | | | 1,564,825 | |
Wynn Resorts Ltd.(a) | | | 28,064 | | | | 3,140,642 | |
Xponential Fitness, Inc., Class A(a) | | | 4,859 | | | | 147,665 | |
Yum! Brands, Inc. | | | 75,383 | | | | 9,956,587 | |
| | | | | | | | |
| | |
| | | | | | | 247,388,405 | |
| | |
| Household Durables — 0.5% | | | | | | |
Beazer Homes U.S.A., Inc.(a) | | | 9,853 | | | | 156,466 | |
Cavco Industries, Inc.(a) | | | 2,385 | | | | 757,810 | |
Century Communities, Inc. | | | 7,177 | | | | 458,754 | |
DR Horton, Inc. | | | 84,133 | | | | 8,218,953 | |
Ethan Allen Interiors, Inc. | | | 6,039 | | | | 165,831 | |
Garmin Ltd. | | | 40,447 | | | | 4,081,911 | |
GoPro, Inc., Class A(a) | | | 31,753 | | | | 159,717 | |
Green Brick Partners, Inc.(a) | | | 8,286 | | | | 290,507 | |
Helen of Troy Ltd.(a) | | | 6,408 | | | | 609,849 | |
Hovnanian Enterprises, Inc., Class A(a) | | | 1,534 | | | | 104,066 | |
Installed Building Products, Inc. | | | 6,030 | | | | 687,601 | |
iRobot Corp.(a) | | | 7,280 | | | | 317,699 | |
KB Home | | | 20,168 | | | | 810,350 | |
| | | | | | | | |
| Security | | Shares | | | Value | |
|
| Household Durables (continued) | |
La-Z-Boy, Inc. | | | 12,796 | | | $ | 372,108 | |
Leggett & Platt, Inc. | | | 36,358 | | | | 1,159,093 | |
Lennar Corp., Class A | | | 66,665 | | | | 7,007,158 | |
Lennar Corp., Class B | | | 3,873 | | | | 345,898 | |
LGI Homes, Inc.(a) | | | 5,965 | | | | 680,189 | |
Lovesac Co.(a)(b) | | | 3,842 | | | | 111,034 | |
M/I Homes, Inc.(a) | | | 7,303 | | | | 460,746 | |
MDC Holdings, Inc. | | | 14,910 | | | | 579,552 | |
Meritage Homes Corp. | | | 9,813 | | | | 1,145,766 | |
Mohawk Industries, Inc.(a) | | | 13,890 | | | | 1,392,056 | |
Newell Brands, Inc. | | | 98,599 | | | | 1,226,571 | |
NVR, Inc.(a) | | | 789 | | | | 4,396,458 | |
PulteGroup, Inc. | | | 60,369 | | | | 3,518,305 | |
Skyline Champion Corp.(a) | | | 13,438 | | | | 1,010,941 | |
Sonos, Inc.(a) | | | 32,329 | | | | 634,295 | |
Taylor Morrison Home Corp., Class A(a) | | | 29,273 | | | | 1,119,985 | |
Tempur Sealy International, Inc. | | | 44,080 | | | | 1,740,719 | |
Toll Brothers, Inc. | | | 29,535 | | | | 1,772,986 | |
TopBuild Corp.(a) | | | 8,749 | | | | 1,821,017 | |
Tri Pointe Homes, Inc.(a) | | | 25,821 | | | | 653,788 | |
Tupperware Brands Corp.(a) | | | 14,430 | | | | 36,075 | |
Vizio Holding Corp., Class A(a)(b) | | | 19,399 | | | | 178,083 | |
Vuzix Corp.(a)(b) | | | 20,078 | | | | 83,123 | |
Whirlpool Corp. | | | 14,298 | | | | 1,887,622 | |
| | | | | | | | |
| | |
| | | | | | | 50,153,082 | |
| | |
| Household Products — 1.3% | | | | | | |
Central Garden & Pet Co.(a) | | | 2,592 | | | | 106,428 | |
Central Garden & Pet Co., Class A, NVS(a) | | | 11,613 | | | | 453,720 | |
Church & Dwight Co., Inc. | | | 64,583 | | | | 5,709,783 | |
Clorox Co. | | | 33,077 | | | | 5,234,104 | |
Colgate-Palmolive Co. | | | 220,495 | | | | 16,570,199 | |
Energizer Holdings, Inc. | | | 19,340 | | | | 671,098 | |
Kimberly-Clark Corp. | | | 89,937 | | | | 12,071,344 | |
Procter & Gamble Co. | | | 629,390 | | | | 93,583,999 | |
Reynolds Consumer Products, Inc. | | | 14,341 | | | | 394,378 | |
Spectrum Brands Holdings, Inc. | | | 10,243 | | | | 678,291 | |
WD-40 Co. | | | 3,591 | | | | 639,378 | |
| | | | | | | | |
| | |
| | | | | | | 136,112,722 | |
|
| Independent Power and Renewable Electricity Producers — 0.1% | |
AES Corp. | | | 175,324 | | | | 4,221,802 | |
Altus Power, Inc.(a)(b) | | | 14,044 | | | | 76,961 | |
Brookfield Renewable Corp., Class A | | | 34,582 | | | | 1,208,641 | |
Clearway Energy, Inc., Class A | | | 8,324 | | | | 249,970 | |
Clearway Energy, Inc., Class C | | | 23,166 | | | | 725,791 | |
Montauk Renewables, Inc.(a) | | | 18,941 | | | | 149,065 | |
Ormat Technologies, Inc. | | | 13,884 | | | | 1,176,947 | |
Sunnova Energy International, Inc.(a)(b) | | | 27,509 | | | | 429,690 | |
Vistra Corp. | | | 104,632 | | | | 2,511,168 | |
| | | | | | | | |
| | |
| | | | | | | 10,750,035 | |
| | |
| Industrial Conglomerates — 0.7% | | | | | | |
3M Co. | | | 147,433 | | | | 15,496,683 | |
Brookfield Business Corp., Class A | | | 10,853 | | | | 215,107 | |
General Electric Co.(b) | | | 288,669 | | | | 27,596,756 | |
Honeywell International, Inc. | | | 179,669 | | | | 34,338,339 | |
| | | | | | | | |
| | |
| | | | | | | 77,646,885 | |
| | |
| Industrial REITs — 0.4% | | | | | | |
Americold Realty Trust, Inc. | | | 70,971 | | | | 2,019,125 | |
EastGroup Properties, Inc. | | | 10,831 | | | | 1,790,581 | |
First Industrial Realty Trust, Inc. | | | 34,488 | | | | 1,834,762 | |
Indus Realty Trust, Inc. | | | 2,055 | | | | 136,226 | |
Industrial Logistics Properties Trust(b) | | | 20,912 | | | | 64,200 | |
| | |
| 22 | | 2 0 2 3 I S H A R E S A N N U A L R E P O R T T O S H A R E H O L D E R S |
| | |
Schedule of Investments (continued) March 31, 2023 | | iShares® Russell 3000 ETF (Percentages shown are based on Net Assets) |
| | | | | | | | |
| Security | | Shares | | | Value | |
|
| Industrial REITs (continued) | |
Innovative Industrial Properties, Inc. | | | 7,797 | | | $ | 592,494 | |
LXP Industrial Trust | | | 73,810 | | | | 760,981 | |
Plymouth Industrial REIT, Inc. | | | 11,809 | | | | 248,107 | |
Prologis, Inc. | | | 245,437 | | | | 30,623,175 | |
Rexford Industrial Realty, Inc. | | | 52,223 | | | | 3,115,102 | |
STAG Industrial, Inc. | | | 46,831 | | | | 1,583,824 | |
Terreno Realty Corp. | | | 20,957 | | | | 1,353,822 | |
| | | | | | | | |
| | |
| | | | | | | 44,122,399 | |
| | |
| Insurance — 2.3% | | | | | | |
Aflac, Inc. | | | 163,016 | | | | 10,517,792 | |
Allstate Corp. | | | 70,100 | | | | 7,767,781 | |
Ambac Financial Group, Inc.(a) | | | 13,040 | | | | 201,859 | |
American Equity Investment Life Holding Co. | | | 20,907 | | | | 762,896 | |
American Financial Group, Inc. | | | 18,417 | | | | 2,237,666 | |
American International Group, Inc. | | | 197,365 | | | | 9,939,301 | |
AMERISAFE, Inc. | | | 4,911 | | | | 240,394 | |
Aon PLC, Class A | | | 54,780 | | | | 17,271,586 | |
Arch Capital Group Ltd.(a) | | | 93,561 | | | | 6,349,985 | |
Argo Group International Holdings Ltd. | | | 8,273 | | | | 242,316 | |
Arthur J. Gallagher & Co. | | | 55,216 | | | | 10,563,373 | |
Assurant, Inc. | | | 14,754 | | | | 1,771,513 | |
Assured Guaranty Ltd. | | | 16,400 | | | | 824,428 | |
Axis Capital Holdings Ltd. | | | 21,212 | | | | 1,156,478 | |
Bright Health Group, Inc.(a)(b) | | | 95,801 | | | | 21,105 | |
Brighthouse Financial, Inc.(a) | | | 17,443 | | | | 769,411 | |
Brown & Brown, Inc. | | | 62,344 | | | | 3,579,793 | |
BRP Group, Inc., Class A(a) | | | 16,315 | | | | 415,380 | |
Chubb Ltd. | | | 110,659 | | | | 21,487,765 | |
Cincinnati Financial Corp. | | | 40,931 | | | | 4,587,547 | |
CNA Financial Corp. | | | 8,064 | | | | 314,738 | |
CNO Financial Group, Inc. | | | 32,256 | | | | 715,761 | |
Employers Holdings, Inc. | | | 7,311 | | | | 304,796 | |
Enstar Group Ltd.(a) | | | 3,151 | | | | 730,370 | |
Erie Indemnity Co., Class A, NVS | | | 6,568 | | | | 1,521,543 | |
Everest Re Group Ltd. | | | 10,466 | | | | 3,747,037 | |
F&G Annuities & Life, Inc. | | | 4,708 | | | | 85,309 | |
Fidelity National Financial, Inc., Class A | | | 69,364 | | | | 2,422,885 | |
First American Financial Corp. | | | 27,259 | | | | 1,517,236 | |
Genworth Financial, Inc., Class A(a) | | | 136,479 | | | | 685,125 | |
Globe Life, Inc. | | | 23,619 | | | | 2,598,562 | |
Goosehead Insurance, Inc., Class A(a) | | | 4,642 | | | | 242,312 | |
Hanover Insurance Group, Inc. | | | 9,438 | | | | 1,212,783 | |
Hartford Financial Services Group, Inc. | | | 84,197 | | | | 5,867,689 | |
HCI Group, Inc. | | | 3,027 | | | | 162,247 | |
Hippo Holdings, Inc.(a)(b) | | | 6,416 | | | | 104,132 | |
Horace Mann Educators Corp. | | | 10,907 | | | | 365,166 | |
James River Group Holdings Ltd. | | | 8,472 | | | | 174,947 | |
Kemper Corp. | | | 16,399 | | | | 896,369 | |
Kinsale Capital Group, Inc. | | | 5,795 | | | | 1,739,369 | |
Lemonade, Inc.(a)(b) | | | 10,544 | | | | 150,357 | |
Lincoln National Corp. | | | 45,380 | | | | 1,019,689 | |
Loews Corp. | | | 51,300 | | | | 2,976,426 | |
Markel Corp.(a) | | | 3,503 | | | | 4,474,767 | |
Marsh & McLennan Cos., Inc. | | | 132,255 | | | | 22,027,070 | |
MBIA, Inc.(a)(b) | | | 15,043 | | | | 139,298 | |
Mercury General Corp. | | | 7,045 | | | | 223,608 | |
MetLife, Inc. | | | 175,488 | | | | 10,167,775 | |
National Western Life Group, Inc., Class A | | | 565 | | | | 137,080 | |
Old Republic International Corp. | | | 75,213 | | | | 1,878,069 | |
Oscar Health, Inc., Class A(a) | | | 38,846 | | | | 254,053 | |
Palomar Holdings, Inc.(a) | | | 5,824 | | | | 321,485 | |
Primerica, Inc. | | | 10,003 | | | | 1,722,917 | |
| | | | | | | | |
| Security | | Shares | | | Value | |
|
| Insurance (continued) | |
Principal Financial Group, Inc. | | | 64,829 | | | $ | 4,818,091 | |
ProAssurance Corp. | | | 13,261 | | | | 245,063 | |
Progressive Corp. | | | 155,524 | | | | 22,249,263 | |
Prudential Financial, Inc. | | | 97,771 | | | | 8,089,573 | |
Reinsurance Group of America, Inc. | | | 17,560 | | | | 2,331,266 | |
RenaissanceRe Holdings Ltd. | | | 11,273 | | | | 2,258,433 | |
RLI Corp. | | | 10,612 | | | | 1,410,441 | |
Ryan Specialty Holdings, Inc., Class A(a)(b) | | | 21,747 | | | | 875,099 | |
Safety Insurance Group, Inc. | | | 3,821 | | | | 284,741 | |
Selective Insurance Group, Inc. | | | 15,476 | | | | 1,475,327 | |
Selectquote, Inc.(a) | | | 44,761 | | | | 97,131 | |
SiriusPoint Ltd.(a) | | | 24,175 | | | | 196,543 | |
Stewart Information Services Corp. | | | 6,984 | | | | 281,804 | |
Tiptree, Inc. | | | 6,831 | | | | 99,528 | |
Travelers Cos., Inc. | | | 62,249 | | | | 10,670,101 | |
Trupanion, Inc.(a)(b) | | | 9,643 | | | | 413,588 | |
United Fire Group, Inc. | | | 5,953 | | | | 158,052 | |
Universal Insurance Holdings, Inc. | | | 9,229 | | | | 168,152 | |
Unum Group | | | 52,694 | | | | 2,084,575 | |
W R Berkley Corp. | | | 54,144 | | | | 3,371,005 | |
White Mountains Insurance Group Ltd.(b) | | | 651 | | | | 896,746 | |
Willis Towers Watson PLC | | | 28,902 | | | | 6,716,247 | |
| | | | | | | | |
| | |
| | | | | | | 240,800,108 | |
| | |
| Interactive Media & Services — 4.2% | | | | | | |
Alphabet, Inc., Class A(a) | | | 1,603,864 | | | | 166,368,813 | |
Alphabet, Inc., Class C, NVS(a) | | | 1,394,759 | | | | 145,054,936 | |
Bumble, Inc., Class A(a) | | | 23,266 | | | | 454,850 | |
Cargurus, Inc.(a) | | | 25,802 | | | | 481,981 | |
Cars.com, Inc.(a) | | | 18,799 | | | | 362,821 | |
Eventbrite, Inc., Class A(a)(b) | | | 18,686 | | | | 160,326 | |
EverQuote, Inc., Class A(a) | | | 7,778 | | | | 108,114 | |
fuboTV, Inc.(a) | | | 41,960 | | | | 50,772 | |
IAC, Inc.(a) | | | 20,434 | | | | 1,054,394 | |
Match Group, Inc.(a) | | | 74,538 | | | | 2,861,514 | |
MediaAlpha, Inc., Class A(a) | | | 7,566 | | | | 113,339 | |
Meta Platforms, Inc., Class A(a) | | | 593,311 | | | | 125,746,333 | |
Outbrain, Inc.(a)(b) | | | 26,862 | | | | 110,940 | |
Pinterest, Inc., Class A(a) | | | 160,040 | | | | 4,364,291 | |
QuinStreet, Inc.(a) | | | 12,412 | | | | 196,978 | |
Shutterstock, Inc. | | | 6,043 | | | | 438,722 | |
TripAdvisor, Inc.(a) | | | 27,696 | | | | 550,043 | |
Vimeo, Inc.(a) | | | 38,546 | | | | 147,631 | |
Yelp, Inc.(a)(b) | | | 18,799 | | | | 577,129 | |
Ziff Davis, Inc.(a)(b) | | | 11,422 | | | | 891,487 | |
ZipRecruiter, Inc., Class A(a) | | | 21,503 | | | | 342,758 | |
ZoomInfo Technologies, Inc., Class A(a)(b) | | | 73,056 | | | | 1,805,214 | |
| | | | | | | | |
| | |
| | | | | | | 452,243,386 | |
| | |
| IT Services — 1.4% | | | | | | |
Accenture PLC, Class A | | | 168,945 | | | | 48,286,170 | |
Akamai Technologies, Inc.(a) | | | 40,771 | | | | 3,192,369 | |
Amdocs Ltd. | | | 32,183 | | | | 3,090,533 | |
BigCommerce Holdings, Inc., Series 1(a) | | | 19,935 | | | | 178,219 | |
Cloudflare, Inc., Class A(a)(b) | | | 76,075 | | | | 4,690,784 | |
Cognizant Technology Solutions Corp., Class A | | | 137,014 | | | | 8,348,263 | |
DigitalOcean Holdings, Inc.(a)(b) | | | 20,321 | | | | 795,974 | |
DXC Technology Co.(a)(b) | | | 61,151 | | | | 1,563,020 | |
Edgio, Inc.(a)(b) | | | 36,584 | | | | 28,942 | |
EPAM Systems, Inc.(a) | | | 14,541 | | | | 4,347,759 | |
Fastly, Inc., Class A(a)(b) | | | 27,957 | | | | 496,516 | |
Gartner, Inc.(a) | | | 20,441 | | | | 6,659,065 | |
Globant SA(a) | | | 10,907 | | | | 1,788,857 | |
GoDaddy, Inc., Class A(a) | | | 41,448 | | | | 3,221,338 | |
| | |
S C H E D U L E S O F I N V E S T M E N T S | | 23 |
| | |
Schedule of Investments (continued) March 31, 2023 | | iShares® Russell 3000 ETF (Percentages shown are based on Net Assets) |
| | | | | | | | |
| Security | | Shares | | | Value | |
|
| IT Services (continued) | |
Grid Dynamics Holdings, Inc.(a) | | | 11,366 | | | $ | 130,254 | |
Hackett Group, Inc. | | | 7,906 | | | | 146,103 | |
International Business Machines Corp. | | | 239,822 | | | | 31,438,266 | |
Kyndryl Holdings, Inc.(a) | | | 59,125 | | | | 872,685 | |
MongoDB, Inc.(a)(b) | | | 17,865 | | | | 4,164,689 | |
Okta, Inc., Class A(a) | | | 40,184 | | | | 3,465,468 | |
Perficient, Inc.(a) | | | 8,503 | | | | 613,832 | |
Snowflake, Inc., Class A(a)(b) | | | 82,861 | | | | 12,784,624 | |
Squarespace, Inc., Class A(a) | | | 9,918 | | | | 315,095 | |
Thoughtworks Holding, Inc.(a) | | | 28,925 | | | | 212,888 | |
Tucows, Inc., Class A(a) | | | 2,736 | | | | 53,215 | |
Twilio, Inc., Class A(a) | | | 46,186 | | | | 3,077,373 | |
Unisys Corp.(a)(b) | | | 18,100 | | | | 70,228 | |
VeriSign, Inc.(a) | | | 24,651 | | | | 5,209,496 | |
Wix.com Ltd.(a) | | | 14,035 | | | | 1,400,693 | |
| | | | | | | | |
| | |
| | | | | | | 150,642,718 | |
| | |
| Leisure Products — 0.1% | | | | | | |
Acushnet Holdings Corp. | | | 9,460 | | | | 481,892 | |
AMMO, Inc.(a)(b) | | | 36,772 | | | | 72,441 | |
Brunswick Corp. | | | 18,921 | | | | 1,551,522 | |
Hasbro, Inc. | | | 34,454 | | | | 1,849,835 | |
Johnson Outdoors, Inc., Class A | | | 1,492 | | | | 94,011 | |
Malibu Boats, Inc., Class A(a) | | | 5,108 | | | | 288,347 | |
MasterCraft Boat Holdings, Inc.(a) | | | 5,244 | | | | 159,575 | |
Mattel, Inc.(a) | | | 91,042 | | | | 1,676,083 | |
Peloton Interactive, Inc., Class A(a)(b) | | | 78,896 | | | | 894,681 | |
Polaris, Inc.(b) | | | 14,608 | | | | 1,616,083 | |
Smith & Wesson Brands, Inc. | | | 15,045 | | | | 185,204 | |
Sturm Ruger & Co., Inc. | | | 4,144 | | | | 238,031 | |
Topgolf Callaway Brands Corp.(a) | | | 38,167 | | | | 825,171 | |
Vista Outdoor, Inc.(a)(b) | | | 15,864 | | | | 439,591 | |
YETI Holdings, Inc.(a) | | | 22,686 | | | | 907,440 | |
| | | | | | | | |
| | |
| | | | | | | 11,279,907 | |
| | |
| Life Sciences Tools & Services — 1.8% | | | | | | |
10X Genomics, Inc., Class A(a)(b) | | | 25,766 | | | | 1,437,485 | |
AbCellera Biologics, Inc.(a)(b) | | | 58,078 | | | | 437,908 | |
Adaptive Biotechnologies Corp.(a)(b) | | | 29,488 | | | | 260,379 | |
Agilent Technologies, Inc. | | | 78,878 | | | | 10,911,983 | |
Avantor, Inc.(a)(b) | | | 163,845 | | | | 3,463,683 | |
Azenta, Inc.(a) | | | 19,066 | | | | 850,725 | |
BioLife Solutions, Inc.(a)(b) | | | 9,551 | | | | 207,734 | |
Bionano Genomics, Inc.(a)(b) | | | 73,441 | | | | 81,520 | |
Bio-Rad Laboratories, Inc., Class A(a) | | | 5,772 | | | | 2,764,903 | |
Bio-Techne Corp. | | | 41,982 | | | | 3,114,645 | |
Bruker Corp. | | | 29,064 | | | | 2,291,406 | |
Charles River Laboratories International,
Inc.(a)(b) | | | 13,233 | | | | 2,670,684 | |
Codexis, Inc.(a)(b) | | | 16,674 | | | | 69,030 | |
CryoPort, Inc.(a)(b) | | | 10,117 | | | | 242,808 | |
Cytek Biosciences, Inc.(a) | | | 27,922 | | | | 256,603 | |
Danaher Corp. | | | 172,599 | | | | 43,501,852 | |
Illumina, Inc.(a) | | | 41,676 | | | | 9,691,754 | |
Inotiv, Inc.(a) | | | 863 | | | | 3,737 | |
IQVIA Holdings, Inc.(a) | | | 49,454 | | | | 9,835,906 | |
Maravai LifeSciences Holdings, Inc., Class A(a) | | | 29,897 | | | | 418,857 | |
MaxCyte, Inc.(a) | | | 25,128 | | | | 124,384 | |
Medpace Holdings, Inc.(a) | | | 6,564 | | | | 1,234,360 | |
Mettler-Toledo International, Inc.(a) | | | 5,822 | | | | 8,908,883 | |
NanoString Technologies, Inc.(a) | | | 11,895 | | | | 117,761 | |
OmniAb, Inc.(a) | | | 19,145 | | | | 70,454 | |
OmniAb, Inc., 12.50 Earnout Shares(a)(d) | | | 1,502 | | | | — | |
OmniAb, Inc., 15.00 Earnout Shares(a)(d) | | | 1,502 | | | | — | |
Pacific Biosciences of California, Inc.(a)(b) | | | 67,871 | | | | 785,946 | |
| | | | | | | | |
| Security | | Shares | | | Value | |
|
| Life Sciences Tools & Services (continued) | |
PerkinElmer, Inc. | | | 33,263 | | | $ | 4,432,627 | |
QIAGEN NV(a) | | | 61,157 | | | | 2,808,941 | |
Quanterix Corp.(a) | | | 12,288 | | | | 138,486 | |
Quantum-Si, Inc.(a) | | | 35,046 | | | | 61,681 | |
Repligen Corp.(a) | | | 14,665 | | | | 2,468,999 | |
Seer, Inc., Class A(a) | | | 18,863 | | | | 72,811 | |
SomaLogic, Inc., Class A(a)(b) | | | 59,807 | | | | 152,508 | |
Sotera Health Co.(a) | | | 26,207 | | | | 469,367 | |
Syneos Health, Inc.(a) | | | 27,150 | | | | 967,083 | |
Thermo Fisher Scientific, Inc. | | | 104,326 | | | | 60,130,377 | |
Waters Corp.(a) | | | 15,913 | | | | 4,927,142 | |
West Pharmaceutical Services, Inc. | | | 19,656 | | | | 6,810,214 | |
| | | | | | | | |
| | |
| | | | | | | 187,195,626 | |
| | |
| Machinery — 2.0% | | | | | | |
3D Systems Corp.(a) | | | 31,103 | | | | 333,424 | |
AGCO Corp. | | | 16,378 | | | | 2,214,306 | |
Alamo Group, Inc. | | | 2,397 | | | | 441,432 | |
Albany International Corp., Class A | | | 7,990 | | | | 713,986 | |
Allison Transmission Holdings, Inc. | | | 24,567 | | | | 1,111,411 | |
Astec Industries, Inc. | | | 5,987 | | | | 246,964 | |
Barnes Group, Inc. | | | 12,412 | | | | 499,955 | |
Blue Bird Corp.(a) | | | 5,415 | | | | 110,628 | |
Caterpillar, Inc. | | | 138,690 | | | | 31,737,820 | |
Chart Industries, Inc.(a)(b) | | | 11,273 | | | | 1,413,634 | |
CIRCOR International, Inc.(a) | | | 4,670 | | | | 145,330 | |
Columbus McKinnon Corp. | | | 6,623 | | | | 246,111 | |
Crane NXT Co. | | | 12,637 | | | | 1,434,300 | |
Cummins, Inc. | | | 37,395 | | | | 8,932,918 | |
Deere & Co. | | | 72,345 | | | | 29,869,804 | |
Desktop Metal, Inc., Class A(a)(b) | | | 62,688 | | | | 144,182 | |
Donaldson Co., Inc. | | | 32,700 | | | | 2,136,618 | |
Douglas Dynamics, Inc. | | | 5,478 | | | | 174,693 | |
Dover Corp. | | | 37,311 | | | | 5,669,033 | |
Energy Recovery, Inc.(a) | | | 14,895 | | | | 343,330 | |
Enerpac Tool Group Corp. | | | 15,877 | | | | 404,864 | |
EnPro Industries, Inc. | | | 5,147 | | | | 534,722 | |
Esab Corp.(b) | | | 15,137 | | | | 894,143 | |
ESCO Technologies, Inc. | | | 6,631 | | | | 632,929 | |
Evoqua Water Technologies Corp.(a) | | | 31,835 | | | | 1,582,836 | |
Federal Signal Corp. | | | 17,244 | | | | 934,797 | |
Flowserve Corp. | | | 35,592 | | | | 1,210,128 | |
Fortive Corp. | | | 94,199 | | | | 6,421,546 | |
Franklin Electric Co., Inc. | | | 11,797 | | | | 1,110,098 | |
Gates Industrial Corp. PLC(a) | | | 25,089 | | | | 348,486 | |
Gorman-Rupp Co. | | | 4,753 | | | | 118,825 | |
Graco, Inc. | | | 44,336 | | | | 3,236,971 | |
Greenbrier Cos., Inc. | | | 8,383 | | | | 269,681 | |
Helios Technologies, Inc. | | | 8,155 | | | | 533,337 | |
Hillenbrand, Inc. | | | 18,986 | | | | 902,405 | |
Hillman Solutions Corp.(a) | | | 33,880 | | | | 285,270 | |
Hyliion Holdings Corp.(a) | | | 54,749 | | | | 108,403 | |
Hyster-Yale Materials Handling, Inc., Class A | | | 2,690 | | | | 134,204 | |
IDEX Corp. | | | 20,145 | | | | 4,654,099 | |
Illinois Tool Works, Inc. | | | 81,362 | | | | 19,807,579 | |
Ingersoll Rand, Inc. | | | 109,002 | | | | 6,341,736 | |
ITT, Inc. | | | 22,055 | | | | 1,903,346 | |
John Bean Technologies Corp. | | | 8,637 | | | | 943,938 | |
Kadant, Inc. | | | 2,832 | | | | 590,529 | |
Kennametal, Inc. | | | 22,180 | | | | 611,724 | |
Lincoln Electric Holdings, Inc. | | | 14,944 | | | | 2,527,030 | |
Lindsay Corp. | | | 3,108 | | | | 469,712 | |
Luxfer Holdings PLC | | | 7,280 | | | | 123,032 | |
| | |
| 24 | | 2 0 2 3 I S H A R E S A N N U A L R E P O R T T O S H A R E H O L D E R S |
| | |
Schedule of Investments (continued) March 31, 2023 | | iShares® Russell 3000 ETF (Percentages shown are based on Net Assets) |
| | | | | | | | |
| Security | | Shares | | | Value | |
|
| Machinery (continued) | |
Manitowoc Co., Inc.(a) | | | 9,214 | | | $ | 157,467 | |
Markforged Holding Corp.(a)(b) | | | 47,272 | | | | 45,324 | |
Microvast Holdings, Inc.(a)(b) | | | 54,413 | | | | 67,472 | |
Middleby Corp.(a) | | | 14,419 | | | | 2,113,970 | |
Miller Industries, Inc. | | | 3,051 | | | | 107,853 | |
Mueller Industries, Inc. | | | 15,481 | | | | 1,137,544 | |
Mueller Water Products, Inc., Class A | | | 45,589 | | | | 635,511 | |
Nikola Corp.(a)(b) | | | 81,463 | | | | 98,570 | |
Nordson Corp. | | | 15,475 | | | | 3,439,473 | |
Omega Flex, Inc.(b) | | | 1,089 | | | | 121,358 | |
Oshkosh Corp. | | | 17,912 | | | | 1,489,920 | |
Otis Worldwide Corp. | | | 110,544 | | | | 9,329,914 | |
PACCAR, Inc. | | | 136,733 | | | | 10,008,856 | |
Parker-Hannifin Corp. | | | 34,085 | | | | 11,456,309 | |
Pentair PLC | | | 42,217 | | | | 2,333,334 | |
Proterra, Inc.(a)(b) | | | 62,684 | | | | 95,280 | |
Proto Labs, Inc.(a)(b) | | | 7,142 | | | | 236,757 | |
RBC Bearings, Inc.(a) | | | 7,303 | | | | 1,699,627 | |
REV Group, Inc. | | | 9,406 | | | | 112,778 | |
Sarcos Technology & Robotics Corp.(a)(b) | | | 54,085 | | | | 25,674 | |
Shyft Group, Inc. | | | 8,917 | | | | 202,862 | |
Snap-on, Inc. | | | 13,871 | | | | 3,424,611 | |
SPX Technologies, Inc.(a) | | | 12,310 | | | | 868,840 | |
Standex International Corp. | | | 3,103 | | | | 379,931 | |
Stanley Black & Decker, Inc. | | | 39,580 | | | | 3,189,356 | |
Tennant Co. | | | 4,631 | | | | 317,362 | |
Terex Corp. | | | 17,987 | | | | 870,211 | |
Timken Co. | | | 16,701 | | | | 1,364,806 | |
Titan International, Inc.(a) | | | 11,187 | | | | 117,240 | |
Toro Co. | | | 27,987 | | | | 3,111,035 | |
Trinity Industries, Inc. | | | 20,182 | | | | 491,634 | |
Wabash National Corp. | | | 12,574 | | | | 309,195 | |
Watts Water Technologies, Inc., Class A | | | 7,026 | | | | 1,182,616 | |
Westinghouse Air Brake Technologies Corp. | | | 48,362 | | | | 4,887,464 | |
Xylem, Inc. | | | 48,043 | | | | 5,030,102 | |
| | | | | | | | |
| | |
| | | | | | | 216,016,505 | |
| | |
| Marine Transportation — 0.0% | | | | | | |
Costamare, Inc. | | | 18,033 | | | | 169,690 | |
Eagle Bulk Shipping, Inc. | | | 3,012 | | | | 137,046 | |
Genco Shipping & Trading Ltd. | | | 9,062 | | | | 141,911 | |
Golden Ocean Group Ltd. | | | 30,205 | | | | 287,552 | |
Kirby Corp.(a) | | | 15,680 | | | | 1,092,896 | |
Matson, Inc. | | | 10,957 | | | | 653,804 | |
| | | | | | | | |
| | |
| | | | | | | 2,482,899 | |
| | |
| Media — 0.9% | | | | | | |
Altice U.S.A., Inc., Class A(a) | | | 58,904 | | | | 201,452 | |
AMC Networks, Inc., Class A(a) | | | 7,641 | | | | 134,329 | |
Boston Omaha Corp., Class A(a)(b) | | | 4,951 | | | | 117,190 | |
Cable One, Inc. | | | 1,628 | | | | 1,142,856 | |
Charter Communications, Inc., Class A(a) | | | 28,113 | | | | 10,053,490 | |
Clear Channel Outdoor Holdings, Inc.(a) | | | 98,790 | | | | 118,548 | |
Comcast Corp., Class A | | | 1,115,348 | | | | 42,282,843 | |
Daily Journal Corp.(a) | | | 396 | | | | 112,844 | |
DISH Network Corp., Class A(a)(b) | | | 66,612 | | | | 621,490 | |
Entravision Communications Corp., Class A | | | 23,462 | | | | 141,945 | |
EW Scripps Co., Class A, NVS(a) | | | 13,710 | | | | 129,011 | |
Fox Corp., Class A, NVS | | | 77,918 | | | | 2,653,108 | |
Fox Corp., Class B | | | 37,079 | | | | 1,160,943 | |
Gannett Co., Inc.(a) | | | 60,605 | | | | 113,331 | |
Gray Television, Inc. | | | 21,533 | | | | 187,768 | |
iHeartMedia, Inc., Class A(a) | | | 28,363 | | | | 110,616 | |
Integral Ad Science Holding Corp.(a) | | | 10,108 | | | | 144,241 | |
| | | | | | | | |
| Security | | Shares | | | Value | |
|
| Media (continued) | |
Interpublic Group of Cos., Inc. | | | 104,491 | | | $ | 3,891,245 | |
John Wiley & Sons, Inc., Class A | | | 12,338 | | | | 478,344 | |
Liberty Broadband Corp., Class A(a)(b) | | | 5,333 | | | | 437,946 | |
Liberty Broadband Corp., Class C, NVS(a) | | | 31,365 | | | | 2,562,521 | |
Liberty Media Corp. - Liberty SiriusXM, Class A(a)(b) | | | 18,943 | | | | 532,109 | |
Liberty Media Corp. - Liberty SiriusXM, Class C, NVS(a) | | | 40,361 | | | | 1,129,704 | |
Magnite, Inc.(a)(b) | | | 34,024 | | | | 315,062 | |
New York Times Co., Class A | | | 43,708 | | | | 1,699,367 | |
News Corp., Class A, NVS | | | 103,967 | | | | 1,795,510 | |
News Corp., Class B | | | 31,536 | | | | 549,672 | |
Nexstar Media Group, Inc., Class A | | | 9,961 | | | | 1,719,866 | |
Omnicom Group, Inc. | | | 53,042 | | | | 5,003,982 | |
Paramount Global, Class B, NVS | | | 152,972 | | | | 3,412,805 | |
PubMatic, Inc., Class A(a)(b) | | | 11,372 | | | | 157,161 | |
Quotient Technology, Inc.(a) | | | 27,771 | | | | 91,089 | |
Scholastic Corp., NVS | | | 6,949 | | | | 237,795 | |
Sinclair Broadcast Group, Inc., Class A | | | 11,917 | | | | 204,496 | |
Sirius XM Holdings, Inc.(b) | | | 195,439 | | | | 775,893 | |
Stagwell, Inc.(a)(b) | | | 18,709 | | | | 138,821 | |
TechTarget, Inc.(a)(b) | | | 7,385 | | | | 266,746 | |
TEGNA, Inc. | | | 55,919 | | | | 945,590 | |
Thryv Holdings, Inc.(a) | | | 6,663 | | | | 153,649 | |
Trade Desk, Inc., Class A(a)(b) | | | 116,036 | | | | 7,067,753 | |
WideOpenWest, Inc.(a)(b) | | | 14,857 | | | | 157,930 | |
| | | | | | | | |
| | |
| | | | | | | 93,151,061 | |
| | |
| Metals & Mining — 0.6% | | | | | | |
5E Advanced Materials, Inc.(a) | | | 10,839 | | | | 58,747 | |
Alcoa Corp. | | | 48,689 | | | | 2,072,204 | |
Alpha Metallurgical Resources, Inc. | | | 4,505 | | | | 702,780 | |
Arconic Corp.(a) | | | 26,316 | | | | 690,269 | |
ATI, Inc.(a)(b) | | | 32,891 | | | | 1,297,879 | |
Carpenter Technology Corp. | | | 13,396 | | | | 599,605 | |
Century Aluminum Co.(a) | | | 15,311 | | | | 153,110 | |
Cleveland-Cliffs, Inc.(a) | | | 136,779 | | | | 2,507,159 | |
Coeur Mining, Inc.(a) | | | 64,839 | | | | 258,708 | |
Commercial Metals Co. | | | 31,753 | | | | 1,552,722 | |
Compass Minerals International, Inc. | | | 9,018 | | | | 309,227 | |
Constellium SE(a) | | | 30,530 | | | | 466,498 | |
Freeport-McMoRan, Inc. | | | 378,749 | | | | 15,494,622 | |
Haynes International, Inc. | | | 3,755 | | | | 188,088 | |
Hecla Mining Co.(b) | | | 144,980 | | | | 917,723 | |
Ivanhoe Electric, Inc.(a) | | | 12,303 | | | | 149,482 | |
Kaiser Aluminum Corp. | | | 4,355 | | | | 325,014 | |
Materion Corp. | | | 5,022 | | | | 582,552 | |
MP Materials Corp., Class A(a)(b) | | | 23,823 | | | | 671,570 | |
Newmont Corp. | | | 212,667 | | | | 10,424,936 | |
Novagold Resources, Inc.(a) | | | 65,594 | | | | 407,995 | |
Nucor Corp. | | | 68,264 | | | | 10,544,740 | |
Olympic Steel, Inc. | | | 2,534 | | | | 132,300 | |
Piedmont Lithium, Inc.(a)(b) | | | 4,883 | | | | 293,224 | |
Reliance Steel & Aluminum Co. | | | 15,443 | | | | 3,964,836 | |
Royal Gold, Inc. | | | 17,938 | | | | 2,326,738 | |
Ryerson Holding Corp. | | | 5,022 | | | | 182,700 | |
Schnitzer Steel Industries, Inc., Class A | | | 6,252 | | | | 194,437 | |
Southern Copper Corp. | | | 22,177 | | | | 1,690,996 | |
SSR Mining, Inc. | | | 53,198 | | | | 804,354 | |
Steel Dynamics, Inc. | | | 44,182 | | | | 4,995,217 | |
SunCoke Energy, Inc. | | | 26,356 | | | | 236,677 | |
TimkenSteel Corp.(a) | | | 10,063 | | | | 184,555 | |
Tredegar Corp. | | | 11,430 | | | | 104,356 | |
| | |
S C H E D U L E S O F I N V E S T M E N T S | | 25 |
| | |
Schedule of Investments (continued) March 31, 2023 | | iShares® Russell 3000 ETF (Percentages shown are based on Net Assets) |
| | | | | | | | |
| Security | | Shares | | | Value | |
|
| Metals & Mining (continued) | |
United States Steel Corp. | | | 59,359 | | | $ | 1,549,270 | |
Warrior Met Coal, Inc. | | | 12,514 | | | | 459,389 | |
Worthington Industries, Inc. | | | 9,436 | | | | 610,037 | |
| | | | | | | | |
| | |
| | | | | | | 68,104,716 | |
|
| Mortgage Real Estate Investment Trusts (REITs) — 0.1% | |
AFC Gamma, Inc. | | | 6,405 | | | | 77,885 | |
AGNC Investment Corp. | | | 151,405 | | | | 1,526,162 | |
Annaly Capital Management, Inc. | | | 124,045 | | | | 2,370,500 | |
Apollo Commercial Real Estate Finance, Inc. | | | 41,209 | | | | 383,656 | |
Arbor Realty Trust, Inc. | | | 41,720 | | | | 479,363 | |
Ares Commercial Real Estate Corp. | | | 11,119 | | | | 101,072 | |
ARMOUR Residential REIT, Inc. | | | 49,142 | | | | 257,996 | |
Blackstone Mortgage Trust, Inc., Class A | | | 42,673 | | | | 761,713 | |
BrightSpire Capital, Inc., Class A | | | 23,558 | | | | 138,992 | |
Broadmark Realty Capital, Inc. | | | 36,510 | | | | 171,597 | |
Chimera Investment Corp. | | | 60,231 | | | | 339,703 | |
Claros Mortgage Trust, Inc. | | | 23,529 | | | | 274,113 | |
Dynex Capital, Inc. | | | 8,729 | | | | 105,795 | |
Ellington Financial, Inc. | | | 13,771 | | | | 168,144 | |
Franklin BSP Realty Trust, Inc. | | | 22,021 | | | | 262,711 | |
Granite Point Mortgage Trust, Inc. | | | 16,042 | | | | 79,568 | |
Hannon Armstrong Sustainable Infrastructure Capital, Inc.(b) | | | 22,985 | | | | 657,371 | |
Invesco Mortgage Capital, Inc. | | | 8,714 | | | | 96,638 | |
KKR Real Estate Finance Trust, Inc. | | | 15,992 | | | | 182,149 | |
Ladder Capital Corp., Class A | | | 28,069 | | | | 265,252 | |
MFA Financial, Inc. | | | 29,882 | | | | 296,429 | |
New York Mortgage Trust, Inc. | | | 24,480 | | | | 243,821 | |
Orchid Island Capital, Inc. | | | 11,938 | | | | 128,095 | |
PennyMac Mortgage Investment Trust | | | 23,801 | | | | 293,466 | |
Ready Capital Corp. | | | 21,495 | | | | 218,604 | |
Redwood Trust, Inc. | | | 31,709 | | | | 213,719 | |
Rithm Capital Corp. | | | 113,088 | | | | 904,704 | |
Starwood Property Trust, Inc. | | | 75,478 | | | | 1,335,206 | |
TPG RE Finance Trust, Inc. | | | 14,931 | | | | 108,399 | |
Two Harbors Investment Corp. | | | 24,088 | | | | 354,334 | |
| | | | | | | | |
| | |
| | | | | | | 12,797,157 | |
| | |
| Multi-Utilities — 0.7% | | | | | | |
Ameren Corp. | | | 68,624 | | | | 5,928,427 | |
Avista Corp. | | | 18,236 | | | | 774,118 | |
Black Hills Corp. | | | 17,609 | | | | 1,111,128 | |
CenterPoint Energy, Inc. | | | 167,063 | | | | 4,921,676 | |
CMS Energy Corp. | | | 77,724 | | | | 4,770,699 | |
Consolidated Edison, Inc. | | | 94,705 | | | | 9,060,427 | |
Dominion Energy, Inc. | | | 222,516 | | | | 12,440,870 | |
DTE Energy Co. | | | 51,285 | | | | 5,617,759 | |
NiSource, Inc. | | | 106,864 | | | | 2,987,918 | |
NorthWestern Corp. | | | 15,555 | | | | 900,012 | |
Public Service Enterprise Group, Inc. | | | 133,272 | | | | 8,322,836 | |
Sempra Energy | | | 83,485 | | | | 12,619,593 | |
Unitil Corp. | | | 3,429 | | | | 195,590 | |
WEC Energy Group, Inc. | | | 84,081 | | | | 7,970,038 | |
| | | | | | | | |
| | |
| | | | | | | 77,621,091 | |
| | |
| Office REITs — 0.2% | | | | | | |
Alexandria Real Estate Equities, Inc. | | | 45,895 | | | | 5,763,953 | |
Boston Properties, Inc. | | | 41,763 | | | | 2,260,214 | |
Brandywine Realty Trust | | | 50,370 | | | | 238,250 | |
City Office REIT, Inc. | | | 13,001 | | | | 89,707 | |
Corporate Office Properties Trust | | | 29,830 | | | | 707,269 | |
Cousins Properties, Inc. | | | 39,890 | | | | 852,848 | |
Douglas Emmett, Inc. | | | 45,071 | | | | 555,726 | |
| | | | | | | | |
| Security | | Shares | | | Value | |
|
| Office REITs (continued) | |
Easterly Government Properties, Inc. | | | 25,580 | | | $ | 351,469 | |
Equity Commonwealth | | | 27,990 | | | | 579,673 | |
Franklin Street Properties Corp. | | | 36,281 | | | | 56,961 | |
Highwoods Properties, Inc. | | | 27,148 | | | | 629,562 | |
Hudson Pacific Properties, Inc. | | | 40,963 | | | | 272,404 | |
JBG SMITH Properties | | | 28,765 | | | | 433,201 | |
Kilroy Realty Corp. | | | 31,110 | | | | 1,007,964 | |
Office Properties Income Trust | | | 12,742 | | | | 156,727 | |
Orion Office REIT, Inc. | | | 14,444 | | | | 96,775 | |
Paramount Group, Inc. | | | 47,069 | | | | 214,635 | |
Piedmont Office Realty Trust, Inc., Class A | | | 33,998 | | | | 248,185 | |
Postal Realty Trust, Inc., Class A | | | 3,870 | | | | 58,901 | |
SL Green Realty Corp.(b) | | | 16,856 | | | | 396,453 | |
Vornado Realty Trust | | | 47,438 | | | | 729,122 | |
| | | | | | | | |
| | |
| | | | | | | 15,699,999 | |
|
| Oil, Gas & Consumable Fuels — 4.2% | |
Amplify Energy Corp.(a) | | | 12,533 | | | | 86,102 | |
Antero Midstream Corp. | | | 89,193 | | | | 935,635 | |
Antero Resources Corp.(a) | | | 77,230 | | | | 1,783,241 | |
APA Corp. | | | 86,694 | | | | 3,126,186 | |
Arch Resources, Inc. | | | 4,041 | | | | 531,230 | |
Ardmore Shipping Corp. | | | 13,338 | | | | 198,336 | |
Berry Corp. | | | 23,041 | | | | 180,872 | |
California Resources Corp. | | | 19,472 | | | | 749,672 | |
Callon Petroleum Co.(a)(b) | | | 12,962 | | | | 433,449 | |
Cheniere Energy, Inc. | | | 66,655 | | | | 10,504,828 | |
Chesapeake Energy Corp. | | | 31,971 | | | | 2,431,075 | |
Chevron Corp. | | | 515,674 | | | | 84,137,370 | |
Chord Energy Corp. | | | 11,223 | | | | 1,510,616 | |
Civitas Resources, Inc. | | | 19,441 | | | | 1,328,598 | |
Clean Energy Fuels Corp.(a) | | | 41,917 | | | | 182,758 | |
CNX Resources Corp.(a)(b) | | | 44,642 | | | | 715,165 | |
Comstock Resources, Inc. | | | 22,464 | | | | 242,387 | |
ConocoPhillips | | | 326,317 | | | | 32,373,910 | |
CONSOL Energy, Inc. | | | 9,620 | | | | 560,557 | |
Coterra Energy, Inc. | | | 208,477 | | | | 5,116,026 | |
Crescent Energy Co., Class A | | | 10,020 | | | | 113,326 | |
CVR Energy, Inc. | | | 7,555 | | | | 247,653 | |
Delek U.S. Holdings, Inc. | | | 19,215 | | | | 440,984 | |
Denbury, Inc.(a) | | | 13,907 | | | | 1,218,670 | |
Devon Energy Corp. | | | 173,159 | | | | 8,763,577 | |
DHT Holdings, Inc. | | | 31,369 | | | | 339,099 | |
Diamondback Energy, Inc. | | | 47,831 | | | | 6,465,316 | |
Dorian LPG Ltd. | | | 9,471 | | | | 188,852 | |
DT Midstream, Inc. | | | 25,152 | | | | 1,241,754 | |
Earthstone Energy, Inc., Class A(a)(b) | | | 8,930 | | | | 116,179 | |
Energy Fuels, Inc.(a)(b) | | | 39,744 | | | | 221,771 | |
Enviva, Inc. | | | 7,876 | | | | 227,459 | |
EOG Resources, Inc. | | | 156,273 | | | | 17,913,574 | |
EQT Corp. | | | 96,881 | | | | 3,091,473 | |
Equitrans Midstream Corp. | | | 112,001 | | | | 647,366 | |
Excelerate Energy, Inc., Class A | | | 4,879 | | | | 108,021 | |
Exxon Mobil Corp. | | | 1,098,788 | | | | 120,493,092 | |
FLEX LNG Ltd. | | | 7,261 | | | | 243,824 | |
Frontline PLC | | | 33,739 | | | | 558,718 | |
Gevo, Inc.(a)(b) | | | 53,319 | | | | 82,111 | |
Golar LNG Ltd.(a) | | | 25,052 | | | | 541,123 | |
Green Plains, Inc.(a) | | | 9,493 | | | | 294,188 | |
Gulfport Energy Corp.(a)(b) | | | 2,953 | | | | 236,240 | |
Hess Corp. | | | 74,813 | | | | 9,900,752 | |
HF Sinclair Corp. | | | 35,811 | | | | 1,732,536 | |
International Seaways, Inc. | | | 13,424 | | | | 559,512 | |
| | |
| 26 | | 2 0 2 3 I S H A R E S A N N U A L R E P O R T T O S H A R E H O L D E R S |
| | |
Schedule of Investments (continued) March 31, 2023 | | iShares® Russell 3000 ETF (Percentages shown are based on Net Assets) |
| | | | | | | | |
| Security | | Shares | | | Value | |
|
| Oil, Gas & Consumable Fuels (continued) | |
Kinder Morgan, Inc. | | | 531,264 | | | $ | 9,302,433 | |
Kinetik Holdings, Inc. | | | 4,913 | | | | 153,777 | |
Kosmos Energy Ltd.(a) | | | 124,472 | | | | 926,072 | |
Magnolia Oil & Gas Corp., Class A | | | 48,428 | | | | 1,059,605 | |
Marathon Oil Corp. | | | 168,045 | | | | 4,026,358 | |
Marathon Petroleum Corp. | | | 121,178 | | | | 16,338,430 | |
Matador Resources Co. | | | 30,083 | | | | 1,433,455 | |
Murphy Oil Corp. | | | 38,085 | | | | 1,408,383 | |
New Fortress Energy, Inc., Class A | | | 15,218 | | | | 447,866 | |
Nordic American Tankers Ltd. | | | 51,634 | | | | 204,471 | |
Northern Oil & Gas, Inc. | | | 17,587 | | | | 533,765 | |
Occidental Petroleum Corp.(b) | | | 210,895 | | | | 13,166,175 | |
ONEOK, Inc. | | | 119,024 | | | | 7,562,785 | |
Ovintiv, Inc. | | | 65,556 | | | | 2,365,260 | |
Par Pacific Holdings, Inc.(a)(b) | | | 11,798 | | | | 344,502 | |
PBF Energy, Inc., Class A | | | 31,433 | | | | 1,362,935 | |
PDC Energy, Inc. | | | 23,455 | | | | 1,505,342 | |
Peabody Energy Corp.(a)(b) | | | 30,597 | | | | 783,283 | |
Permian Resources Corp. | | | 62,253 | | | | 653,656 | |
PetroCorp Escrow(a)(d) | | | 1,248 | | | | — | |
Phillips 66 | | | 124,180 | | | | 12,589,368 | |
Pioneer Natural Resources Co. | | | 63,206 | | | | 12,909,193 | |
Range Resources Corp. | | | 62,474 | | | | 1,653,687 | |
Ranger Oil Corp., Class A | | | 6,257 | | | | 255,536 | |
REX American Resources Corp.(a) | | | 4,604 | | | | 131,628 | |
Riley Exploration Permian, Inc. | | | 3,314 | | | | 126,131 | |
Scorpio Tankers, Inc. | | | 12,820 | | | | 721,894 | |
SFL Corp. Ltd. | | | 36,084 | | | | 342,798 | |
SilverBow Resources, Inc.(a) | | | 3,093 | | | | 70,675 | |
Sitio Royalties Corp., Class A | | | 19,181 | | | | 433,491 | |
SM Energy Co. | | | 31,948 | | | | 899,656 | |
Southwestern Energy Co.(a) | | | 296,275 | | | | 1,481,375 | |
Talos Energy, Inc.(a) | | | 18,409 | | | | 273,189 | |
Targa Resources Corp. | | | 60,593 | | | | 4,420,259 | |
Teekay Corp.(a)(b) | | | 22,022 | | | | 136,096 | |
Teekay Tankers Ltd., Class A(a) | | | 6,420 | | | | 275,611 | |
Tellurian, Inc.(a)(b) | | | 139,735 | | | | 171,874 | |
Texas Pacific Land Corp. | | | 1,495 | | | | 2,543,025 | |
Uranium Energy Corp.(a)(b) | | | 86,886 | | | | 250,232 | |
Ur-Energy, Inc.(a)(b) | | | 92,421 | | | | 97,966 | |
VAALCO Energy, Inc. | | | 27,961 | | | | 126,663 | |
Valero Energy Corp. | | | 102,033 | | | | 14,243,807 | |
Vertex Energy, Inc.(a)(b) | | | 15,844 | | | | 156,539 | |
Vital Energy, Inc.(a) | | | 4,680 | | | | 213,127 | |
Vitesse Energy, Inc. | | | 6,379 | | | | 121,392 | |
W&T Offshore, Inc.(a)(b) | | | 33,221 | | | | 168,763 | |
Williams Cos., Inc. | | | 326,170 | | | | 9,739,436 | |
World Fuel Services Corp. | | | 17,787 | | | | 454,458 | |
| | | | | | | | |
| | |
| | | | | | | 451,701,605 | |
| | |
| Paper & Forest Products — 0.0% | | | | | | |
Clearwater Paper Corp.(a) | | | 4,528 | | | | 151,326 | |
Louisiana-Pacific Corp. | | | 18,382 | | | | 996,488 | |
Sylvamo Corp. | | | 9,399 | | | | 434,798 | |
| | | | | | | | |
| | |
| | | | | | | 1,582,612 | |
| | |
| Passenger Airlines — 0.2% | | | | | | |
Alaska Air Group, Inc.(a) | | | 32,674 | | | | 1,371,001 | |
Allegiant Travel Co.(a) | | | 3,675 | | | | 338,027 | |
American Airlines Group, Inc.(a) | | | 174,783 | | | | 2,578,049 | |
Blade Air Mobility, Inc., Class A(a) | | | 23,467 | | | | 79,318 | |
Copa Holdings SA, Class A, NVS(b) | | | 8,172 | | | | 754,684 | |
Delta Air Lines, Inc.(a) | | | 170,815 | | | | 5,964,860 | |
Frontier Group Holdings, Inc.(a)(b) | | | 9,833 | | | | 96,757 | |
| | | | | | | | |
| Security | | Shares | | | Value | |
|
| Passenger Airlines (continued) | |
Hawaiian Holdings, Inc.(a) | | | 14,243 | | | $ | 130,466 | |
JetBlue Airways Corp.(a) | | | 82,558 | | | | 601,022 | |
Joby Aviation, Inc.(a)(b) | | | 69,932 | | | | 303,505 | |
SkyWest, Inc.(a) | | | 14,042 | | | | 311,311 | |
Southwest Airlines Co. | | | 157,127 | | | | 5,112,913 | |
Spirit Airlines, Inc. | | | 26,652 | | | | 457,615 | |
Sun Country Airlines Holdings, Inc.(a) | | | 6,778 | | | | 138,949 | |
United Airlines Holdings, Inc.(a) | | | 86,506 | | | | 3,827,890 | |
| | | | | | | | |
| | |
| | | | | | | 22,066,367 | |
| | |
| Personal Care Products — 0.2% | | | | | | |
Beauty Health Co., Class A(a) | | | 24,187 | | | | 305,482 | |
BellRing Brands, Inc.(a) | | | 35,573 | | | | 1,209,482 | |
Coty, Inc., Class A(a)(b) | | | 89,677 | | | | 1,081,505 | |
Edgewell Personal Care Co. | | | 15,159 | | | | 643,045 | |
elf Beauty, Inc.(a) | | | 12,220 | | | | 1,006,317 | |
Estee Lauder Cos., Inc., Class A | | | 61,384 | | | | 15,128,701 | |
Herbalife Nutrition Ltd.(a) | | | 28,398 | | | | 457,208 | |
Inter Parfums, Inc. | | | 5,044 | | | | 717,458 | |
Medifast, Inc. | | | 3,200 | | | | 331,744 | |
Nu Skin Enterprises, Inc., Class A | | | 11,889 | | | | 467,356 | |
Olaplex Holdings, Inc.(a) | | | 34,623 | | | | 147,840 | |
USANA Health Sciences, Inc.(a) | | | 3,624 | | | | 227,950 | |
Veru, Inc.(a)(b) | | | 16,562 | | | | 19,212 | |
| | | | | | | | |
| | |
| | | | | | | 21,743,300 | |
| | |
| Pharmaceuticals — 3.8% | | | | | | |
Aclaris Therapeutics, Inc.(a)(b) | | | 17,902 | | | | 144,827 | |
Amneal Pharmaceuticals, Inc.(a)(b) | | | 54,985 | | | | 76,429 | |
Amphastar Pharmaceuticals, Inc.(a) | | | 10,488 | | | | 393,300 | |
Amylyx Pharmaceuticals, Inc.(a) | | | 13,677 | | | | 401,283 | |
ANI Pharmaceuticals, Inc.(a) | | | 3,200 | | | | 127,104 | |
Arvinas, Inc.(a)(b) | | | 11,661 | | | | 318,579 | |
Atea Pharmaceuticals, Inc.(a)(b) | | | 18,257 | | | | 61,161 | |
Axsome Therapeutics, Inc.(a)(b) | | | 8,472 | | | | 522,553 | |
Bristol-Myers Squibb Co. | | | 567,845 | | | | 39,357,337 | |
Cara Therapeutics, Inc.(a) | | | 12,351 | | | | 60,643 | |
Cassava Sciences, Inc.(a)(b) | | | 9,990 | | | | 240,959 | |
Catalent, Inc.(a) | | | 47,495 | | | | 3,120,896 | |
Collegium Pharmaceutical, Inc.(a) | | | 9,456 | | | | 226,849 | |
Corcept Therapeutics, Inc.(a)(b) | | | 23,051 | | | | 499,285 | |
DICE Therapeutics, Inc.(a)(b) | | | 9,562 | | | | 273,951 | |
Edgewise Therapeutics, Inc.(a)(b) | | | 12,533 | | | | 83,595 | |
Elanco Animal Health, Inc.(a) | | | 118,186 | | | | 1,110,948 | |
Eli Lilly & Co. | | | 224,665 | | | | 77,154,454 | |
Esperion Therapeutics, Inc.(a)(b) | | | 16,699 | | | | 26,551 | |
Evolus, Inc.(a) | | | 11,582 | | | | 97,984 | |
Fulcrum Therapeutics, Inc.(a) | | | 18,691 | | | | 53,269 | |
Harmony Biosciences Holdings, Inc.(a) | | | 7,401 | | | | 241,643 | |
Innoviva, Inc.(a) | | | 18,560 | | | | 208,800 | |
Intra-Cellular Therapies, Inc.(a) | | | 24,446 | | | | 1,323,751 | |
Jazz Pharmaceuticals PLC(a) | | | 16,482 | | | | 2,411,811 | |
Johnson & Johnson | | | 701,718 | | | | 108,766,290 | |
Ligand Pharmaceuticals, Inc.(a) | | | 3,911 | | | | 287,693 | |
Liquidia Corp.(a) | | | 21,435 | | | | 148,116 | |
Merck & Co., Inc. | | | 674,500 | | | | 71,760,055 | |
Nektar Therapeutics(a) | | | 45,251 | | | | 31,807 | |
NGM Biopharmaceuticals, Inc.(a)(b) | | | 20,493 | | | | 83,611 | |
Nuvation Bio, Inc.(a) | | | 46,571 | | | | 77,308 | |
Ocular Therapeutix, Inc.(a) | | | 27,259 | | | | 143,655 | |
Organon & Co. | | | 68,392 | | | | 1,608,580 | |
Pacira BioSciences, Inc.(a) | | | 11,838 | | | | 483,109 | |
Perrigo Co. PLC | | | 37,023 | | | | 1,328,015 | |
Pfizer, Inc. | | | 1,506,992 | | | | 61,485,274 | |
| | |
S C H E D U L E S O F I N V E S T M E N T S | | 27 |
| | |
Schedule of Investments (continued) March 31, 2023 | | iShares® Russell 3000 ETF (Percentages shown are based on Net Assets) |
| | | | | | | | |
| Security | | Shares | | | Value | |
|
| Pharmaceuticals (continued) | |
Phibro Animal Health Corp., Class A | | | 3,823 | | | $ | 58,568 | |
Prestige Consumer Healthcare, Inc.(a) | | | 13,659 | | | | 855,463 | |
Provention Bio, Inc.(a) | | | 15,527 | | | | 374,201 | |
Reata Pharmaceuticals, Inc., Class A(a) | | | 7,353 | | | | 668,535 | |
Relmada Therapeutics, Inc.(a)(b) | | | 14,493 | | | | 32,754 | |
Revance Therapeutics, Inc.(a) | | | 22,316 | | | | 718,798 | |
Royalty Pharma PLC, Class A | | | 97,994 | | | | 3,530,724 | |
Scilex Holding Co. (Acquired 01/13/23,
Cost $96,475)(a)(b)(e) | | | 19,104 | | | | 154,869 | |
SIGA Technologies, Inc. | | | 12,144 | | | | 69,828 | |
Supernus Pharmaceuticals, Inc.(a)(b) | | | 13,130 | | | | 475,700 | |
Tarsus Pharmaceuticals, Inc.(a) | | | 9,335 | | | | 117,341 | |
Theravance Biopharma, Inc.(a)(b) | | | 15,424 | | | | 167,350 | |
Ventyx Biosciences, Inc.(a)(b) | | | 7,019 | | | | 235,137 | |
Viatris, Inc. | | | 320,464 | | | | 3,082,864 | |
Xeris Biopharma Holdings, Inc.(a) | | | 64,131 | | | | 104,534 | |
Zoetis, Inc., Class A | | | 125,217 | | | | 20,841,118 | |
| | | | | | | | |
| | |
| | | | | | | 406,229,259 | |
|
| Professional Services — 1.0% | |
Alight, Inc., Class A(a)(b) | | | 101,896 | | | | 938,462 | |
ASGN, Inc.(a) | | | 13,333 | | | | 1,102,239 | |
Automatic Data Processing, Inc. | | | 111,409 | | | | 24,802,986 | |
Barrett Business Services, Inc. | | | 1,745 | | | | 154,677 | |
Booz Allen Hamilton Holding Corp., Class A | | | 35,479 | | | | 3,288,548 | |
Broadridge Financial Solutions, Inc. | | | 30,771 | | | | 4,510,105 | |
CACI International, Inc., Class A(a) | | | 6,075 | | | | 1,799,901 | |
CBIZ, Inc.(a) | | | 13,592 | | | | 672,668 | |
Clarivate PLC(a)(b) | | | 123,338 | | | | 1,158,144 | |
Concentrix Corp. | | | 11,200 | | | | 1,361,360 | |
Conduent, Inc.(a) | | | 41,224 | | | | 141,398 | |
CoStar Group, Inc.(a) | | | 107,041 | | | | 7,369,773 | |
CRA International, Inc. | | | 1,737 | | | | 187,283 | |
CSG Systems International, Inc. | | | 8,364 | | | | 449,147 | |
Dun & Bradstreet Holdings, Inc. | | | 67,850 | | | | 796,559 | |
Equifax, Inc. | | | 32,433 | | | | 6,578,710 | |
ExlService Holdings, Inc.(a) | | | 8,743 | | | | 1,414,880 | |
Exponent, Inc. | | | 13,424 | | | | 1,338,239 | |
First Advantage Corp.(a)(b) | | | 15,083 | | | | 210,559 | |
Forrester Research, Inc.(a) | | | 3,639 | | | | 117,722 | |
Franklin Covey Co.(a) | | | 4,383 | | | | 168,614 | |
FTI Consulting, Inc.(a)(b) | | | 8,723 | | | | 1,721,484 | |
Genpact Ltd. | | | 47,242 | | | | 2,183,525 | |
Heidrick & Struggles International, Inc. | | | 4,465 | | | | 135,557 | |
HireRight Holdings Corp.(a)(b) | | | 8,458 | | | | 89,739 | |
Huron Consulting Group, Inc.(a) | | | 5,796 | | | | 465,825 | |
ICF International, Inc. | | | 4,865 | | | | 533,690 | |
Insperity, Inc. | | | 9,426 | | | | 1,145,730 | |
Jacobs Solutions, Inc. | | | 33,472 | | | | 3,933,295 | |
KBR, Inc. | | | 36,492 | | | | 2,008,885 | |
Kelly Services, Inc., Class A, NVS | | | 10,105 | | | | 167,642 | |
Kforce, Inc. | | | 5,065 | | | | 320,311 | |
Korn Ferry | | | 14,178 | | | | 733,570 | |
Legalzoom.com, Inc.(a)(b) | | | 25,191 | | | | 236,292 | |
Leidos Holdings, Inc. | | | 35,731 | | | | 3,289,396 | |
ManpowerGroup, Inc. | | | 13,931 | | | | 1,149,725 | |
Maximus, Inc. | | | 16,460 | | | | 1,295,402 | |
NV5 Global, Inc.(a) | | | 3,690 | | | | 383,649 | |
Paychex, Inc. | | | 86,054 | | | | 9,860,928 | |
Planet Labs PBC, Class A(a)(b) | | | 44,904 | | | | 176,473 | |
Resources Connection, Inc. | | | 10,727 | | | | 183,003 | |
Robert Half International, Inc. | | | 28,385 | | | | 2,286,979 | |
Science Applications International Corp. | | | 14,621 | | | | 1,571,173 | |
| | | | | | | | |
| Security | | Shares | | | Value | |
|
| Professional Services (continued) | |
SS&C Technologies Holdings, Inc. | | | 58,952 | | | $ | 3,329,019 | |
Sterling Check Corp.(a)(b) | | | 5,933 | | | | 66,153 | |
TransUnion | | | 52,024 | | | | 3,232,771 | |
TriNet Group, Inc.(a)(b) | | | 10,368 | | | | 835,764 | |
TrueBlue, Inc.(a) | | | 10,009 | | | | 178,160 | |
TTEC Holdings, Inc. | | | 4,671 | | | | 173,901 | |
Upwork, Inc.(a) | | | 30,482 | | | | 345,056 | |
Verisk Analytics, Inc. | | | 41,371 | | | | 7,937,440 | |
Verra Mobility Corp., Class A(a) | | | 37,279 | | | | 630,761 | |
| | | | | | | | |
| | |
| | | | | | | 109,163,272 | |
|
| Real Estate Management & Development — 0.1% | |
Anywhere Real Estate, Inc.(a) | | | 31,577 | | | | 166,727 | |
CBRE Group, Inc., Class A(a) | | | 84,395 | | | | 6,144,800 | |
Compass, Inc., Class A(a) | | | 75,010 | | | | 242,282 | |
Cushman & Wakefield PLC(a)(b) | | | 39,856 | | | | 420,082 | |
DigitalBridge Group, Inc. | | | 41,988 | | | | 503,436 | |
Douglas Elliman, Inc. | | | 25,654 | | | | 79,784 | |
eXp World Holdings, Inc. | | | 16,255 | | | | 206,276 | |
Forestar Group, Inc.(a) | | | 6,608 | | | | 102,820 | |
FRP Holdings, Inc.(a) | | | 2,524 | | | | 146,089 | |
Howard Hughes Corp.(a)(b) | | | 9,694 | | | | 775,520 | |
Jones Lang LaSalle, Inc.(a) | | | 12,741 | | | | 1,853,688 | |
Kennedy-Wilson Holdings, Inc. | | | 31,753 | | | | 526,782 | |
Marcus & Millichap, Inc. | | | 5,899 | | | | 189,417 | |
Newmark Group, Inc., Class A | | | 41,727 | | | | 295,427 | |
Opendoor Technologies, Inc.(a)(b) | | | 118,556 | | | | 208,659 | |
RE/MAX Holdings, Inc., Class A | | | 5,450 | | | | 102,242 | |
Redfin Corp.(a) | | | 27,091 | | | | 245,444 | |
RMR Group, Inc., Class A | | | 4,144 | | | | 108,739 | |
St. Joe Co.(b) | | | 8,431 | | | | 350,814 | |
Tejon Ranch Co.(a) | | | 8,456 | | | | 154,491 | |
WeWork, Inc., Class A(a)(b) | | | 38,275 | | | | 29,751 | |
Zillow Group, Inc., Class A(a) | | | 15,910 | | | | 695,267 | |
Zillow Group, Inc., Class C, NVS(a)(b) | | | 42,284 | | | | 1,880,370 | |
| | | | | | | | |
| | |
| | | | | | | 15,428,907 | |
|
| Residential REITs — 0.4% | |
American Homes 4 Rent, Class A | | | 82,248 | | | | 2,586,700 | |
Apartment Income REIT Corp. | | | 40,282 | | | | 1,442,498 | |
Apartment Investment & Management Co., Class A | | | 40,370 | | | | 310,445 | |
AvalonBay Communities, Inc. | | | 37,486 | | | | 6,299,897 | |
Bluerock Homes Trust, Inc., Class A(a)(b) | | | 3,896 | | | | 77,219 | |
Camden Property Trust | | | 27,721 | | | | 2,906,270 | |
Centerspace | | | 4,672 | | | | 255,231 | |
Elme Communities | | | 24,179 | | | | 431,837 | |
Equity LifeStyle Properties, Inc. | | | 46,905 | | | | 3,148,733 | |
Equity Residential | | | 98,154 | | | | 5,889,240 | |
Essex Property Trust, Inc. | | | 17,242 | | | | 3,605,992 | |
Independence Realty Trust, Inc. | | | 58,016 | | | | 929,996 | |
Invitation Homes, Inc. | | | 163,631 | | | | 5,110,196 | |
Mid-America Apartment Communities, Inc. | | | 30,314 | | | | 4,578,627 | |
NexPoint Residential Trust, Inc. | | | 6,215 | | | | 271,409 | |
Sun Communities, Inc. | | | 32,244 | | | | 4,542,535 | |
UDR, Inc. | | | 88,383 | | | | 3,629,006 | |
UMH Properties, Inc. | | | 15,648 | | | | 231,434 | |
Veris Residential, Inc.(a) | | | 24,207 | | | | 354,390 | |
| | | | | | | | |
| | |
| | | | | | | 46,601,655 | |
| | |
| Retail REITs — 0.4% | | | | | | |
Acadia Realty Trust | | | 24,793 | | | | 345,862 | |
Agree Realty Corp. | | | 23,106 | | | | 1,585,303 | |
Alexander’s, Inc. | | | 557 | | | | 107,919 | |
| | |
| 28 | | 2 0 2 3 I S H A R E S A N N U A L R E P O R T T O S H A R E H O L D E R S |
| | |
Schedule of Investments (continued) March 31, 2023 | | iShares® Russell 3000 ETF (Percentages shown are based on Net Assets) |
| | | | | | | | |
| Security | | Shares | | | Value | |
|
| Retail REITs (continued) | |
Brixmor Property Group, Inc. | | | 80,354 | | | $ | 1,729,218 | |
CBL & Associates Properties, Inc. | | | 8,990 | | | | 230,504 | |
Federal Realty Investment Trust | | | 21,207 | | | | 2,095,888 | |
Getty Realty Corp. | | | 8,694 | | | | 313,245 | |
InvenTrust Properties Corp. | | | 18,561 | | | | 434,327 | |
Kimco Realty Corp. | | | 161,718 | | | | 3,158,352 | |
Kite Realty Group Trust | | | 55,465 | | | | 1,160,328 | |
Macerich Co. | | | 58,281 | | | | 617,779 | |
National Retail Properties, Inc. | | | 48,834 | | | | 2,156,021 | |
Necessity Retail REIT, Inc., Class A | | | 28,707 | | | | 180,280 | |
NETSTREIT Corp. | | | 15,984 | | | | 292,187 | |
Phillips Edison & Co., Inc. | | | 29,913 | | | | 975,762 | |
Realty Income Corp. | | | 166,507 | | | | 10,543,223 | |
Regency Centers Corp. | | | 45,091 | | | | 2,758,667 | |
Retail Opportunity Investments Corp. | | | 29,088 | | | | 406,068 | |
RPT Realty | | | 19,564 | | | | 186,054 | |
Saul Centers, Inc. | | | 3,202 | | | | 124,878 | |
Simon Property Group, Inc. | | | 86,415 | | | | 9,675,888 | |
SITE Centers Corp. | | | 48,242 | | | | 592,412 | |
Spirit Realty Capital, Inc. | | | 37,843 | | | | 1,507,665 | |
Tanger Factory Outlet Centers, Inc. | | | 29,000 | | | | 569,270 | |
Urban Edge Properties | | | 30,285 | | | | 456,092 | |
Urstadt Biddle Properties, Inc., Class A | | | 9,274 | | | | 162,944 | |
Whitestone REIT | | | 15,779 | | | | 145,167 | |
| | | | | | | | |
| | |
| | | | | | | 42,511,303 | |
|
| Semiconductors & Semiconductor Equipment — 5.7% | |
ACM Research, Inc., Class A(a)(b) | | | 16,012 | | | | 187,340 | |
Advanced Micro Devices, Inc.(a) | | | 430,654 | | | | 42,208,399 | |
Allegro MicroSystems, Inc.(a) | | | 19,292 | | | | 925,823 | |
Alpha & Omega Semiconductor Ltd.(a) | | | 6,389 | | | | 172,184 | |
Ambarella, Inc.(a) | | | 9,273 | | | | 717,916 | |
Amkor Technology, Inc. | | | 29,060 | | | | 756,141 | |
Analog Devices, Inc. | | | 134,639 | | | | 26,553,504 | |
Applied Materials, Inc. | | | 224,151 | | | | 27,532,467 | |
Axcelis Technologies, Inc.(a) | | | 8,158 | | | | 1,087,054 | |
AXT, Inc.(a)(b) | | | 22,347 | | | | 88,941 | |
Broadcom, Inc. | | | 105,310 | | | | 67,560,577 | |
CEVA, Inc.(a) | | | 5,669 | | | | 172,508 | |
Cirrus Logic, Inc.(a) | | | 14,357 | | | | 1,570,369 | |
Cohu, Inc.(a) | | | 11,114 | | | | 426,666 | |
Credo Technology Group Holding Ltd.(a)(b) | | | 29,021 | | | | 273,378 | |
Diodes, Inc.(a)(b) | | | 12,155 | | | | 1,127,498 | |
Enphase Energy, Inc.(a) | | | 35,094 | | | | 7,379,566 | |
Entegris, Inc. | | | 39,936 | | | | 3,275,151 | |
First Solar, Inc.(a) | | | 28,478 | | | | 6,193,965 | |
FormFactor, Inc.(a)(b) | | | 20,439 | | | | 650,982 | |
GLOBALFOUNDRIES, Inc.(a)(b) | | | 16,421 | | | | 1,185,268 | |
Ichor Holdings Ltd.(a) | | | 7,333 | | | | 240,082 | |
Impinj, Inc.(a)(b) | | | 5,704 | | | | 773,006 | |
indie Semiconductor, Inc., Class A(a) | | | 32,832 | | | | 346,378 | |
Intel Corp. | | | 1,103,466 | | | | 36,050,234 | |
KLA Corp. | | | 37,020 | | | | 14,777,273 | |
Kulicke & Soffa Industries, Inc. | | | 15,097 | | | | 795,461 | |
Lam Research Corp. | | | 36,038 | | | | 19,104,465 | |
Lattice Semiconductor Corp.(a) | | | 35,443 | | | | 3,384,806 | |
MACOM Technology Solutions Holdings, Inc.(a) | | | 14,638 | | | | 1,036,956 | |
Marvell Technology, Inc. | | | 226,139 | | | | 9,791,819 | |
MaxLinear, Inc.(a) | | | 18,778 | | | | 661,173 | |
Microchip Technology, Inc. | | | 141,708 | | | | 11,872,296 | |
Micron Technology, Inc. | | | 288,546 | | | | 17,410,866 | |
MKS Instruments, Inc.(b) | | | 15,536 | | | | 1,376,800 | |
Monolithic Power Systems, Inc. | | | 12,157 | | | | 6,085,065 | |
| | | | | | | | |
| Security | | Shares | | | Value | |
|
| Semiconductors & Semiconductor Equipment (continued) | |
NVIDIA Corp. | | | 630,827 | | | $ | 175,224,816 | |
ON Semiconductor Corp.(a) | | | 115,333 | | | | 9,494,213 | |
Onto Innovation, Inc.(a) | | | 13,591 | | | | 1,194,377 | |
PDF Solutions, Inc.(a) | | | 7,558 | | | | 320,459 | |
Photronics, Inc.(a) | | | 16,263 | | | | 269,641 | |
Power Integrations, Inc. | | | 15,657 | | | | 1,325,208 | |
Qorvo, Inc.(a) | | | 26,150 | | | | 2,656,055 | |
QUALCOMM, Inc. | | | 298,762 | | | | 38,116,056 | |
Rambus, Inc.(a) | | | 27,391 | | | | 1,404,063 | |
Semtech Corp.(a) | | | 17,050 | | | | 411,587 | |
Silicon Laboratories, Inc.(a) | | | 8,379 | | | | 1,467,079 | |
SiTime Corp.(a) | | | 4,307 | | | | 612,585 | |
Skyworks Solutions, Inc. | | | 42,176 | | | | 4,975,924 | |
SMART Global Holdings, Inc.(a)(b) | | | 14,129 | | | | 243,584 | |
Synaptics, Inc.(a) | | | 10,271 | | | | 1,141,622 | |
Teradyne, Inc. | | | 42,157 | | | | 4,532,299 | |
Texas Instruments, Inc. | | | 241,958 | | | | 45,006,608 | |
Ultra Clean Holdings, Inc.(a) | | | 11,515 | | | | 381,837 | |
Universal Display Corp. | | | 11,821 | | | | 1,833,792 | |
Veeco Instruments, Inc.(a)(b) | | | 11,252 | | | | 237,755 | |
Wolfspeed, Inc.(a)(b) | | | 32,672 | | | | 2,122,046 | |
| | | | | | | | |
| | |
| | | | | | | 606,723,983 | |
| | |
| Software — 9.5% | | | | | | |
8x8, Inc.(a) | | | 28,145 | | | | 117,365 | |
A10 Networks, Inc. | | | 14,940 | | | | 231,421 | |
ACI Worldwide, Inc.(a) | | | 31,753 | | | | 856,696 | |
Adeia, Inc. | | | 28,067 | | | | 248,674 | |
Adobe, Inc.(a) | | | 121,910 | | | | 46,980,457 | |
Agilysys, Inc.(a) | | | 5,009 | | | | 413,293 | |
Alarm.com Holdings, Inc.(a) | | | 12,226 | | | | 614,723 | |
Alkami Technology, Inc.(a) | | | 7,450 | | | | 94,317 | |
Altair Engineering, Inc., Class A(a)(b) | | | 14,024 | | | | 1,011,271 | |
Alteryx, Inc., Class A(a) | | | 15,537 | | | | 914,197 | |
American Software, Inc., Class A | | | 8,823 | | | | 111,258 | |
Amplitude, Inc., Class A(a)(b) | | | 17,238 | | | | 214,441 | |
ANSYS, Inc.(a) | | | 23,248 | | | | 7,736,934 | |
Appfolio, Inc., Class A(a) | | | 4,800 | | | | 597,504 | |
Appian Corp., Class A(a) | | | 10,323 | | | | 458,135 | |
AppLovin Corp., Class A(a)(b) | | | 59,697 | | | | 940,228 | |
Asana, Inc., Class A(a) | | | 19,718 | | | | 416,641 | |
Aspen Technology, Inc.(a) | | | 6,976 | | | | 1,596,597 | |
Atlassian Corp., Class A(a)(b) | | | 38,875 | | | | 6,654,234 | |
Autodesk, Inc.(a) | | | 57,921 | | | | 12,056,835 | |
AvePoint, Inc., Class A(a)(b) | | | 39,298 | | | | 161,908 | |
Bentley Systems, Inc., Class B(b) | | | 45,647 | | | | 1,962,365 | |
BILL Holdings, Inc.(a)(b) | | | 25,867 | | | | 2,098,848 | |
Black Knight, Inc.(a) | | | 41,052 | | | | 2,362,953 | |
Blackbaud, Inc.(a) | | | 12,866 | | | | 891,614 | |
Blackline, Inc.(a) | | | 14,904 | | | | 1,000,804 | |
Blend Labs, Inc., Class A(a)(b) | | | 60,275 | | | | 60,046 | |
Box, Inc., Class A(a) | | | 37,484 | | | | 1,004,196 | |
C3.ai, Inc., Class A(a)(b) | | | 15,644 | | | | 525,169 | |
Cadence Design Systems, Inc.(a) | | | 72,487 | | | | 15,228,794 | |
CCC Intelligent Solutions Holdings, Inc.(a)(b) | | | 46,241 | | | | 414,782 | |
Cerence, Inc.(a) | | | 9,944 | | | | 279,327 | |
Ceridian HCM Holding, Inc.(a)(b) | | | 37,341 | | | | 2,734,108 | |
Clear Secure, Inc., Class A | | | 16,650 | | | | 435,730 | |
CommVault Systems, Inc.(a) | | | 11,165 | | | | 633,502 | |
Confluent, Inc., Class A(a) | | | 33,767 | | | | 812,772 | |
Consensus Cloud Solutions, Inc.(a) | | | 5,684 | | | | 193,768 | |
Couchbase, Inc.(a)(b) | | | 9,435 | | | | 132,656 | |
Crowdstrike Holdings, Inc., Class A(a)(b) | | | 57,545 | | | | 7,898,627 | |
| | |
S C H E D U L E S O F I N V E S T M E N T S | | 29 |
| | |
Schedule of Investments (continued) March 31, 2023 | | iShares® Russell 3000 ETF (Percentages shown are based on Net Assets) |
| | | | | | | | |
| Security | | Shares | | | Value | |
|
| Software (continued) | |
CS Disco, Inc.(a) | | | 9,723 | | | $ | 64,561 | |
Cvent Holding Corp.(a)(b) | | | 12,186 | | | | 101,875 | |
Datadog, Inc., Class A(a) | | | 70,335 | | | | 5,110,541 | |
Digimarc Corp.(a) | | | 5,308 | | | | 104,302 | |
Digital Turbine, Inc.(a)(b) | | | 22,649 | | | | 279,942 | |
DocuSign, Inc.(a) | | | 52,628 | | | | 3,068,212 | |
Dolby Laboratories, Inc., Class A | | | 15,525 | | | | 1,326,145 | |
Domo, Inc., Class B(a) | | | 6,907 | | | | 98,010 | |
DoubleVerify Holdings, Inc.(a) | | | 22,862 | | | | 689,289 | |
Dropbox, Inc., Class A(a) | | | 70,163 | | | | 1,516,924 | |
Dynatrace, Inc.(a) | | | 56,858 | | | | 2,405,093 | |
E2open Parent Holdings, Inc., Class A(a) | | | 53,945 | | | | 313,960 | |
Ebix, Inc. | | | 6,822 | | | | 89,982 | |
Elastic NV(a) | | | 21,316 | | | | 1,234,196 | |
Enfusion, Inc., Class A(a) | | | 8,078 | | | | 84,819 | |
EngageSmart, Inc.(a) | | | 11,604 | | | | 223,377 | |
Envestnet, Inc.(a)(b) | | | 14,382 | | | | 843,792 | |
Everbridge, Inc.(a) | | | 9,648 | | | | 334,496 | |
EverCommerce, Inc.(a) | | | 11,363 | | | | 120,221 | |
Fair Isaac Corp.(a) | | | 6,503 | | | | 4,569,593 | |
Five9, Inc.(a) | | | 19,424 | | | | 1,404,161 | |
ForgeRock, Inc., Class A(a)(b) | | | 9,323 | | | | 192,054 | |
Fortinet, Inc.(a) | | | 171,974 | | | | 11,429,392 | |
Gen Digital, Inc. | | | 146,607 | | | | 2,515,776 | |
Guidewire Software, Inc.(a) | | | 21,853 | | | | 1,793,039 | |
HubSpot, Inc.(a) | | | 12,297 | | | | 5,272,339 | |
Informatica, Inc., Class A(a)(b) | | | 8,811 | | | | 144,500 | |
Instructure Holdings, Inc.(a)(b) | | | 5,218 | | | | 135,146 | |
Intapp, Inc.(a) | | | 4,098 | | | | 183,754 | |
InterDigital, Inc.(b) | | | 8,910 | | | | 649,539 | |
Intuit, Inc. | | | 73,476 | | | | 32,757,805 | |
Jamf Holding Corp.(a) | | | 17,996 | | | | 349,482 | |
LivePerson, Inc.(a) | | | 16,556 | | | | 73,012 | |
LiveRamp Holdings, Inc.(a) | | | 16,697 | | | | 366,165 | |
Manhattan Associates, Inc.(a) | | | 16,532 | | | | 2,559,980 | |
Marathon Digital Holdings, Inc.(a)(b) | | | 27,502 | | | | 239,817 | |
Matterport, Inc.(a) | | | 65,431 | | | | 178,627 | |
MeridianLink, Inc.(a)(b) | | | 6,056 | | | | 104,769 | |
Microsoft Corp. | | | 1,995,073 | | | | 575,179,546 | |
MicroStrategy, Inc., Class A(a)(b) | | | 2,548 | | | | 744,831 | |
Mitek Systems, Inc.(a) | | | 10,975 | | | | 105,250 | |
Model N, Inc.(a)(b) | | | 9,649 | | | | 322,952 | |
Momentive Global, Inc.(a) | | | 32,109 | | | | 299,256 | |
N-able, Inc.(a) | | | 17,985 | | | | 237,402 | |
nCino, Inc.(a)(b) | | | 20,406 | | | | 505,661 | |
NCR Corp.(a) | | | 33,595 | | | | 792,506 | |
New Relic, Inc.(a) | | | 13,785 | | | | 1,037,873 | |
Nutanix, Inc., Class A(a) | | | 60,938 | | | | 1,583,779 | |
Olo, Inc., Class A(a)(b) | | | 26,776 | | | | 218,492 | |
ON24, Inc.(a) | | | 15,162 | | | | 132,819 | |
OneSpan, Inc.(a) | | | 11,005 | | | | 192,587 | |
Oracle Corp. | | | 407,560 | | | | 37,870,475 | |
PagerDuty, Inc.(a) | | | 21,253 | | | | 743,430 | |
Palantir Technologies, Inc., Class A(a)(b) | | | 495,405 | | | | 4,186,172 | |
Palo Alto Networks, Inc.(a)(b) | | | 79,489 | | | | 15,877,133 | |
Paycom Software, Inc.(a) | | | 13,548 | | | | 4,118,727 | |
Paycor HCM, Inc.(a)(b) | | | 17,034 | | | | 451,742 | |
Paylocity Holding Corp.(a) | | | 10,436 | | | | 2,074,468 | |
Pegasystems, Inc. | | | 10,991 | | | | 532,844 | |
Porch Group, Inc.(a) | | | 31,979 | | | | 45,730 | |
PowerSchool Holdings, Inc., Class A(a) | | | 11,286 | | | | 223,689 | |
Procore Technologies, Inc.(a) | | | 18,101 | | | | 1,133,666 | |
| | | | | | | | |
| Security | | Shares | | | Value | |
|
| Software (continued) | |
Progress Software Corp. | | | 11,758 | | | $ | 675,497 | |
PROS Holdings, Inc.(a) | | | 11,803 | | | | 323,402 | |
PTC, Inc.(a) | | | 28,090 | | | | 3,601,981 | |
Q2 Holdings, Inc.(a) | | | 14,814 | | | | 364,721 | |
Qualys, Inc.(a)(b) | | | 10,008 | | | | 1,301,240 | |
Rapid7, Inc.(a) | | | 15,199 | | | | 697,786 | |
RingCentral, Inc., Class A(a) | | | 24,451 | | | | 749,912 | |
Riot Platforms, Inc.(a)(b) | | | 40,626 | | | | 405,854 | |
Roper Technologies, Inc. | | | 28,044 | | | | 12,358,710 | |
Salesforce, Inc.(a) | | | 256,605 | | | | 51,264,547 | |
Sapiens International Corp. NV | | | 6,886 | | | | 149,564 | |
SentinelOne, Inc., Class A(a) | | | 50,885 | | | | 832,479 | |
ServiceNow, Inc.(a) | | | 54,219 | | | | 25,196,654 | |
Smartsheet, Inc., Class A(a) | | | 34,494 | | | | 1,648,813 | |
SolarWinds Corp.(a) | | | 12,307 | | | | 105,840 | |
SoundThinking, Inc.(a)(b) | | | 2,883 | | | | 113,360 | |
Splunk, Inc.(a) | | | 43,271 | | | | 4,148,823 | |
Sprout Social, Inc., Class A(a)(b) | | | 11,640 | | | | 708,643 | |
SPS Commerce, Inc.(a) | | | 9,835 | | | | 1,497,870 | |
Sumo Logic, Inc.(a) | | | 35,080 | | | | 420,258 | |
Synopsys, Inc.(a) | | | 40,789 | | | | 15,754,751 | |
Telos Corp.(a) | | | 12,342 | | | | 31,225 | |
Tenable Holdings, Inc.(a) | | | 28,887 | | | | 1,372,421 | |
Teradata Corp.(a) | | | 26,335 | | | | 1,060,774 | |
Tyler Technologies, Inc.(a) | | | 11,073 | | | | 3,926,929 | |
UiPath, Inc., Class A(a) | | | 100,079 | | | | 1,757,387 | |
Unity Software, Inc.(a)(b) | | | 62,125 | | | | 2,015,335 | |
Varonis Systems, Inc.(a) | | | 27,501 | | | | 715,301 | |
Verint Systems, Inc.(a) | | | 17,794 | | | | 662,649 | |
VMware, Inc., Class A(a) | | | 57,078 | | | | 7,126,188 | |
Workday, Inc., Class A(a)(b) | | | 53,047 | | | | 10,956,327 | |
Workiva, Inc., Class A(a) | | | 13,084 | | | | 1,339,932 | |
Xperi, Inc.(a) | | | 12,417 | | | | 135,718 | |
Yext, Inc.(a)(b) | | | 25,562 | | | | 245,651 | |
Zeta Global Holdings Corp., Class A(a)(b) | | | 30,754 | | | | 333,066 | |
Zoom Video Communications, Inc., Class A(a) | | | 65,339 | | | | 4,824,632 | |
Zscaler, Inc.(a)(b) | | | 22,197 | | | | 2,593,276 | |
Zuora, Inc., Class A(a) | | | 29,493 | | | | 291,391 | |
| | | | | | | | |
| | |
| | | | | | | 1,014,345,814 | |
| | |
| Specialized REITs — 1.2% | | | | | | |
American Tower Corp. | | | 123,971 | | | | 25,332,234 | |
Crown Castle, Inc. | | | 114,954 | | | | 15,385,443 | |
CubeSmart | | | 58,804 | | | | 2,717,921 | |
Digital Realty Trust, Inc. | | | 76,245 | | | | 7,495,646 | |
EPR Properties | | | 20,701 | | | | 788,708 | |
Equinix, Inc. | | | 24,534 | | | | 17,689,995 | |
Extra Space Storage, Inc. | | | 35,563 | | | | 5,794,280 | |
Farmland Partners, Inc. | | | 10,264 | | | | 109,825 | |
Four Corners Property Trust, Inc. | | | 22,253 | | | | 597,716 | |
Gaming & Leisure Properties, Inc. | | | 65,803 | | | | 3,425,704 | |
Gladstone Land Corp. | | | 9,274 | | | | 154,412 | |
Iron Mountain, Inc. | | | 77,815 | | | | 4,117,192 | |
Lamar Advertising Co., Class A | | | 23,338 | | | | 2,331,233 | |
Life Storage, Inc. | | | 22,313 | | | | 2,925,011 | |
National Storage Affiliates Trust | | | 22,571 | | | | 943,016 | |
Outfront Media, Inc. | | | 39,045 | | | | 633,700 | |
PotlatchDeltic Corp. | | | 21,687 | | | | 1,073,507 | |
Public Storage | | | 41,698 | | | | 12,598,634 | |
Rayonier, Inc. | | | 37,817 | | | | 1,257,793 | |
Safehold, Inc. | | | 8,977 | | | | 263,650 | |
SBA Communications Corp. | | | 28,531 | | | | 7,448,588 | |
Uniti Group, Inc. | | | 61,727 | | | | 219,131 | |
| | |
| 30 | | 2 0 2 3 I S H A R E S A N N U A L R E P O R T T O S H A R E H O L D E R S |
| | |
Schedule of Investments (continued) March 31, 2023 | | iShares® Russell 3000 ETF (Percentages shown are based on Net Assets) |
| | | | | | | | |
| Security | | Shares | | | Value | |
|
| Specialized REITs (continued) | |
VICI Properties, Inc. | | | 267,857 | | | $ | 8,737,495 | |
Weyerhaeuser Co. | | | 196,342 | | | | 5,915,785 | |
| | | | | | | | |
| | |
| | | | | | | 127,956,619 | |
| | |
| Specialty Retail — 2.2% | | | | | | |
1-800-Flowers.com, Inc., Class A(a) | | | 10,740 | | | | 123,510 | |
Aaron’s Co., Inc. | | | 9,848 | | | | 95,132 | |
Abercrombie & Fitch Co., Class A(a) | | | 14,232 | | | | 394,938 | |
Academy Sports & Outdoors, Inc. | | | 20,174 | | | | 1,316,354 | |
Advance Auto Parts, Inc. | | | 15,609 | | | | 1,898,211 | |
American Eagle Outfitters, Inc. | | | 38,915 | | | | 523,018 | |
America’s Car-Mart, Inc.(a) | | | 1,958 | | | | 155,093 | |
Arko Corp., Class A | | | 20,871 | | | | 177,195 | |
Asbury Automotive Group, Inc.(a) | | | 5,933 | | | | 1,245,930 | |
AutoNation, Inc.(a) | | | 9,004 | | | | 1,209,777 | |
AutoZone, Inc.(a) | | | 4,966 | | | | 12,207,173 | |
Bath & Body Works, Inc. | | | 61,339 | | | | 2,243,781 | |
Bed Bath & Beyond, Inc.(a)(b) | | | 28,339 | | | | 12,112 | |
Best Buy Co., Inc. | | | 52,005 | | | | 4,070,431 | |
Boot Barn Holdings, Inc.(a) | | | 8,191 | | | | 627,758 | |
Buckle, Inc. | | | 6,808 | | | | 242,978 | |
Build-A-Bear Workshop, Inc. | | | 4,272 | | | | 99,281 | |
Burlington Stores, Inc.(a) | | | 17,059 | | | | 3,447,624 | |
Caleres, Inc. | | | 10,702 | | | | 231,484 | |
Camping World Holdings, Inc., Class A | | | 10,927 | | | | 228,046 | |
CarMax, Inc.(a)(b) | | | 42,739 | | | | 2,747,263 | |
CarParts.com, Inc.(a) | | | 21,805 | | | | 116,439 | |
Carvana Co., Class A(a)(b) | | | 30,679 | | | | 300,347 | |
Chico’s FAS, Inc.(a) | | | 33,463 | | | | 184,047 | |
Children’s Place, Inc.(a) | | | 3,249 | | | | 130,772 | |
Designer Brands, Inc., Class A | | | 17,755 | | | | 155,179 | |
Destination XL Group, Inc.(a) | | | 15,332 | | | | 84,479 | |
Dick’s Sporting Goods, Inc. | | | 14,199 | | | | 2,014,696 | |
EVgo, Inc.(a)(b) | | | 20,741 | | | | 161,572 | |
Five Below, Inc.(a) | | | 14,649 | | | | 3,017,255 | |
Floor & Decor Holdings, Inc., Class A(a)(b) | | | 26,785 | | | | 2,630,823 | |
Foot Locker, Inc. | | | 20,846 | | | | 827,378 | |
Franchise Group, Inc. | | | 7,656 | | | | 208,626 | |
GameStop Corp., Class A(a)(b) | | | 71,338 | | | | 1,642,201 | |
Gap, Inc. | | | 53,329 | | | | 535,423 | |
Genesco, Inc.(a) | | | 3,200 | | | | 118,016 | |
Group 1 Automotive, Inc. | | | 3,750 | | | | 849,075 | |
GrowGeneration Corp.(a) | | | 28,115 | | | | 96,153 | |
Guess?, Inc. | | | 9,577 | | | | 186,368 | |
Haverty Furniture Cos., Inc. | | | 4,597 | | | | 146,690 | |
Hibbett, Inc. | | | 4,201 | | | | 247,775 | |
Home Depot, Inc. | | | 271,723 | | | | 80,190,892 | |
Leslie’s, Inc.(a)(b) | | | 41,898 | | | | 461,297 | |
Lithia Motors, Inc., Class A | | | 7,443 | | | | 1,703,926 | |
Lowe’s Cos., Inc. | | | 161,247 | | | | 32,244,563 | |
MarineMax, Inc.(a) | | | 5,430 | | | | 156,113 | |
Monro, Inc. | | | 8,431 | | | | 416,744 | |
Murphy U.S.A., Inc. | | | 5,550 | | | | 1,432,178 | |
National Vision Holdings, Inc.(a) | | | 20,701 | | | | 390,007 | |
ODP Corp.(a) | | | 11,830 | | | | 532,113 | |
OneWater Marine, Inc., Class A(a) | | | 3,382 | | | | 94,595 | |
O’Reilly Automotive, Inc.(a) | | | 16,432 | | | | 13,950,439 | |
Overstock.com, Inc.(a) | | | 11,571 | | | | 234,544 | |
Penske Automotive Group, Inc.(b) | | | 7,043 | | | | 998,768 | |
Petco Health & Wellness Co., Inc.(a)(b) | | | 23,456 | | | | 211,104 | |
PetMed Express, Inc. | | | 5,725 | | | | 92,974 | |
Revolve Group, Inc.(a)(b) | | | 9,746 | | | | 256,320 | |
RH(a)(b) | | | 4,807 | | | | 1,170,745 | |
| | | | | | | | |
| Security | | Shares | | | Value | |
|
| Specialty Retail (continued) | |
Ross Stores, Inc. | | | 91,129 | | | $ | 9,671,521 | |
Sally Beauty Holdings, Inc.(a) | | | 27,797 | | | | 433,077 | |
Shoe Carnival, Inc. | | | 5,543 | | | | 142,178 | |
Signet Jewelers Ltd. | | | 11,766 | | | | 915,159 | |
Sleep Number Corp.(a) | | | 5,794 | | | | 176,196 | |
Sonic Automotive, Inc., Class A | | | 5,589 | | | | 303,706 | |
Sportsman’s Warehouse Holdings, Inc.(a) | | | 13,354 | | | | 113,242 | |
Stitch Fix, Inc., Class A(a)(b) | | | 26,331 | | | | 134,551 | |
TJX Cos., Inc. | | | 308,991 | | | | 24,212,535 | |
Tractor Supply Co. | | | 29,487 | | | | 6,930,624 | |
TravelCenters of America, Inc.(a) | | | 4,064 | | | | 351,536 | |
Ulta Beauty, Inc.(a) | | | 13,345 | | | | 7,281,966 | |
Upbound Group, Inc. | | | 12,640 | | | | 309,806 | |
Urban Outfitters, Inc.(a) | | | 18,859 | | | | 522,771 | |
Victoria’s Secret & Co.(a) | | | 21,247 | | | | 725,585 | |
Warby Parker, Inc., Class A(a)(b) | | | 25,915 | | | | 274,440 | |
Wayfair, Inc., Class A(a)(b) | | | 19,822 | | | | 680,687 | |
Williams-Sonoma, Inc. | | | 17,697 | | | | 2,153,017 | |
Winmark Corp. | | | 776 | | | | 248,654 | |
Zumiez, Inc.(a) | | | 5,414 | | | | 99,834 | |
| | | | | | | | |
| | |
| | | | | | | 237,168,810 | |
|
| Technology Hardware, Storage & Peripherals — 6.4% | |
Apple Inc. | | | 4,007,325 | | | | 660,807,892 | |
Avid Technology, Inc.(a)(b) | | | 10,820 | | | | 346,024 | |
Corsair Gaming, Inc.(a)(b) | | | 10,236 | | | | 187,831 | |
Dell Technologies, Inc., Class C | | | 63,104 | | | | 2,537,412 | |
Eastman Kodak Co.(a)(b) | | | 20,075 | | | | 82,307 | |
Hewlett Packard Enterprise Co. | | | 346,306 | | | | 5,516,654 | |
HP, Inc. | | | 262,533 | | | | 7,705,343 | |
IonQ, Inc.(a)(b) | | | 37,078 | | | | 228,030 | |
NetApp, Inc. | | | 58,771 | | | | 3,752,528 | |
Pure Storage, Inc., Class A(a)(b) | | | 75,057 | | | | 1,914,704 | |
Super Micro Computer, Inc.(a) | | | 12,363 | | | | 1,317,278 | |
Western Digital Corp.(a) | | | 85,367 | | | | 3,215,775 | |
Xerox Holdings Corp. | | | 33,639 | | | | 518,041 | |
| | | | | | | | |
| | |
| | | | | | | 688,129,819 | |
|
| Textiles, Apparel & Luxury Goods — 0.7% | |
Allbirds, Inc., Class A(a) | | | 34,064 | | | | 40,877 | |
Capri Holdings Ltd.(a) | | | 33,304 | | | | 1,565,288 | |
Carter’s, Inc. | | | 9,844 | | | | 707,980 | |
Columbia Sportswear Co. | | | 10,030 | | | | 905,107 | |
Crocs, Inc.(a) | | | 16,354 | | | | 2,067,800 | |
Deckers Outdoor Corp.(a) | | | 6,979 | | | | 3,137,409 | |
Ermenegildo Zegna NV | | | 16,732 | | | | 228,224 | |
G-III Apparel Group Ltd.(a) | | | 11,264 | | | | 175,155 | |
Hanesbrands, Inc. | | | 95,318 | | | | 501,373 | |
Kontoor Brands, Inc. | | | 14,169 | | | | 685,638 | |
Lululemon Athletica, Inc.(a) | | | 29,490 | | | | 10,739,963 | |
Movado Group, Inc. | | | 4,360 | | | | 125,437 | |
NIKE, Inc., Class B | | | 320,757 | | | | 39,337,639 | |
Oxford Industries, Inc. | | | 4,606 | | | | 486,348 | |
PVH Corp. | | | 17,658 | | | | 1,574,387 | |
Ralph Lauren Corp., Class A | | | 10,973 | | | | 1,280,220 | |
Skechers U.S.A., Inc., Class A(a) | | | 35,054 | | | | 1,665,766 | |
Steven Madden Ltd. | | | 22,224 | | | | 800,064 | |
Tapestry, Inc. | | | 63,078 | | | | 2,719,293 | |
Under Armour, Inc., Class A(a) | | | 50,343 | | | | 477,755 | |
Under Armour, Inc., Class C, NVS(a) | | | 51,233 | | | | 437,018 | |
VF Corp. | | | 92,637 | | | | 2,122,314 | |
Wolverine World Wide, Inc. | | | 22,627 | | | | 385,790 | |
| | | | | | | | |
| | |
| | | | | | | 72,166,845 | |
| | |
S C H E D U L E S O F I N V E S T M E N T S | | 31 |
| | |
Schedule of Investments (continued) March 31, 2023 | | iShares® Russell 3000 ETF (Percentages shown are based on Net Assets) |
| | | | | | | | |
| Security | | Shares | | | Value | |
|
| Tobacco — 0.6% | |
Altria Group, Inc. | | | 478,429 | | | $ | 21,347,502 | |
Philip Morris International, Inc. | | | 413,164 | | | | 40,180,199 | |
Turning Point Brands, Inc. | | | 6,111 | | | | 128,331 | |
Universal Corp. | | | 6,664 | | | | 352,459 | |
Vector Group Ltd. | | | 41,257 | | | | 495,497 | |
| | | | | | | | |
| | |
| | | | | | | 62,503,988 | |
| | |
| Trading Companies & Distributors — 0.4% | | | | | | |
Air Lease Corp., Class A | | | 28,419 | | | | 1,118,856 | |
Alta Equipment Group, Inc., Class A | | | 8,962 | | | | 142,048 | |
Applied Industrial Technologies, Inc. | | | 9,886 | | | | 1,405,097 | |
Beacon Roofing Supply, Inc.(a) | | | 14,298 | | | | 841,437 | |
BlueLinx Holdings, Inc.(a) | | | 2,289 | | | | 155,560 | |
Boise Cascade Co. | | | 9,649 | | | | 610,299 | |
Core & Main, Inc., Class A(a)(b) | | | 21,052 | | | | 486,301 | |
Custom Truck One Source, Inc.(a)(b) | | | 17,247 | | | | 117,107 | |
DXP Enterprises, Inc.(a) | | | 5,424 | | | | 146,014 | |
Fastenal Co. | | | 152,638 | | | | 8,233,294 | |
GATX Corp. | | | 9,043 | | | | 994,911 | |
Global Industrial Co. | | | 3,967 | | | | 106,474 | |
GMS, Inc.(a) | | | 11,183 | | | | 647,384 | |
H&E Equipment Services, Inc. | | | 8,156 | | | | 360,740 | |
Herc Holdings, Inc. | | | 6,328 | | | | 720,759 | |
Hudson Technologies, Inc.(a) | | | 11,357 | | | | 99,147 | |
McGrath RentCorp | | | 6,161 | | | | 574,883 | |
MRC Global, Inc.(a) | | | 23,378 | | | | 227,234 | |
MSC Industrial Direct Co., Inc., Class A | | | 12,368 | | | | 1,038,912 | |
NOW, Inc.(a) | | | 27,717 | | | | 309,045 | |
Rush Enterprises, Inc., Class A | | | 10,335 | | | | 564,291 | |
Rush Enterprises, Inc., Class B | | | 2,236 | | | | 133,914 | |
SiteOne Landscape Supply, Inc.(a)(b) | | | 11,517 | | | | 1,576,332 | |
Textainer Group Holdings Ltd. | | | 11,911 | | | | 382,462 | |
Titan Machinery, Inc.(a) | | | 5,729 | | | | 174,448 | |
Transcat, Inc.(a) | | | 1,405 | | | | 125,593 | |
Triton International Ltd. | | | 16,877 | | | | 1,066,964 | |
United Rentals, Inc. | | | 18,605 | | | | 7,363,115 | |
Univar Solutions, Inc.(a) | | | 42,972 | | | | 1,505,309 | |
Veritiv Corp. | | | 3,525 | | | | 476,369 | |
Watsco, Inc.(b) | | | 8,878 | | | | 2,824,625 | |
WESCO International, Inc. | | | 11,665 | | | | 1,802,709 | |
WW Grainger, Inc. | | | 11,982 | | | | 8,253,321 | |
Xometry, Inc., Class A(a)(b) | | | 9,490 | | | | 142,065 | |
| | | | | | | | |
| | |
| | | | | | | 44,727,019 | |
| | |
| Water Utilities — 0.1% | | | | | | |
American States Water Co. | | | 10,219 | | | | 908,367 | |
American Water Works Co., Inc. | | | 51,397 | | | | 7,529,147 | |
Artesian Resources Corp., Class A, NVS | | | 2,961 | | | | 163,921 | |
California Water Service Group | | | 13,333 | | | | 775,981 | |
Essential Utilities, Inc. | | | 60,911 | | | | 2,658,765 | |
Middlesex Water Co. | | | 5,085 | | | | 397,240 | |
SJW Group | | | 7,686 | | | | 585,135 | |
York Water Co. | | | 3,303 | | | | 147,644 | |
| | | | | | | | |
| | |
| | | | | | | 13,166,200 | |
|
| Wireless Telecommunication Services — 0.2% | |
Gogo, Inc.(a) | | | 10,826 | | | | 156,977 | |
Shenandoah Telecommunications Co. | | | 13,333 | | | | 253,594 | |
| | | | | | | | |
| Security | | Shares | | | Value | |
|
| Wireless Telecommunication Services (continued) | |
Telephone & Data Systems, Inc. | | | 27,633 | | | $ | 290,423 | |
T-Mobile U.S., Inc.(a)(b) | | | 156,810 | | | | 22,712,360 | |
United States Cellular Corp.(a) | | | 4,570 | | | | 94,736 | |
| | | | | | | | |
| | |
| | | | | | | 23,508,090 | |
| | | | | | | | |
| | |
Total Common Stocks — 99.8%
(Cost: $8,436,162,095) | | | | | | | 10,701,905,874 | |
| | | | | | | | |
| | |
Rights | | | | | | | | |
|
| Biotechnology — 0.0% | |
Aduro Biotech CVR, Expires 01/02/24(a)(d) | | | 4,039 | | | | 10,255 | |
GTX, Inc., Contingent Rights, Expires 06/10/34(a)(b)(d) | | | 684 | | | | 701 | |
| | | | | | | | |
| | |
| | | | | | | 10,956 | |
| | | | | | | | |
| | |
Total Rights — 0.0%
(Cost: $1,402) | | | | | | | 10,956 | |
| | | | | | | | |
| | |
Warrants(a) | | | | | | | | |
| | |
| Oil, Gas & Consumable Fuels — 0.0% | | | | | | |
Chord Energy Corp. (Issued/Exercisable, Expires 09/01/25, Strike Price USD 83.45) | | | 204 | | | | 2,897 | |
Chord Energy Corp., Class A (Issued/Exercisable, Expires 09/01/24, Strike Price USD 73.44) | | | 409 | | | | 7,272 | |
| | | | | | | | |
| | |
| | | | | | | 10,169 | |
| | | | | | | | |
| | |
Total Warrants — 0.0%
(Cost: $68,578) | | | | | | | 10,169 | |
| | | | | | | | |
| | |
Total Long-Term Investments — 99.8%
(Cost: $8,436,232,075) | | | | | | | 10,701,926,999 | |
| | | | | | | | |
| | |
Short-Term Securities | | | | | | | | |
| | |
| Money Market Funds — 2.4% | | | | | | |
BlackRock Cash Funds: Institutional, SL Agency Shares, 5.01%(c)(f)(g) | | | 245,597,200 | | | | 245,670,879 | |
BlackRock Cash Funds: Treasury, SL Agency Shares, 4.73%(c)(f) | | | 17,462,038 | | | | 17,462,038 | |
| | | | | | | | |
| |
Total Short-Term Securities — 2.4%
(Cost: $262,966,770) | | | | 263,132,917 | |
| | | | | | | | |
Total Investments — 102.2%
(Cost: $8,699,198,845) | | | | 10,965,059,916 | |
Liabilities in Excess of Other Assets — (2.2)% | | | | (237,156,384 | ) |
| | | | | | | | |
| | |
Net Assets — 100.0% | | | | | | $ | 10,727,903,532 | |
| | | | | | | | |
| (a) | Non-income producing security. |
| (b) | All or a portion of this security is on loan. |
| (c) | Affiliate of the Fund. |
| (d) | Security is valued using significant unobservable inputs and is classified as Level 3 in the fair value hierarchy. |
| (e) | Restricted security as to resale, excluding 144A securities. The Fund held restricted securities with a current value of $154,869, representing 0.0% of its net assets as of period end, and an original cost of $96,475. |
| (f) | Annualized 7-day yield as of period end. |
| (g) | All or a portion of this security was purchased with the cash collateral from loaned securities. |
| | |
| 32 | | 2 0 2 3 I S H A R E S A N N U A L R E P O R T T O S H A R E H O L D E R S |
| | |
Schedule of Investments (continued) March 31, 2023 | | iShares® Russell 3000 ETF |
Affiliates
Investments in issuers considered to be affiliate(s) of the Fund during the year ended March 31, 2023 for purposes of Section 2(a)(3) of the Investment Company Act of 1940, as amended, were as follows:
| | | | | | | | | | | | | | | | | | | | | | | | | | | | | | | | | | | | | | | | |
| | | Affiliated Issuer | | Value at
03/31/22 | | | Purchases
at Cost | | | Proceeds
from Sale | | | Net
Realized
Gain (Loss) | | | Change in
Unrealized
Appreciation
(Depreciation) | | | Value at
03/31/23 | | | Shares Held at
03/31/23 | | | Income | | | Capital Gain Distributions
from Underlying
Funds | | | |
| | BlackRock Cash Funds: Institutional, SL Agency Shares | | $ | 231,125,019 | | | $ | 14,390,546 | (a) | | $ | — | | | $ | 23,625 | | | $ | 131,689 | | | $ | 245,670,879 | | | | 245,597,200 | | | $ | 2,467,148 | (b) | | $ | — | | | |
| | BlackRock Cash Funds: Treasury, SL Agency Shares | | | 19,635,000 | | | | — | | | | (2,172,962 | )(a) | | | — | | | | — | | | | 17,462,038 | | | | 17,462,038 | | | | 459,237 | | | | 17 | | | |
| | BlackRock, Inc. | | | 29,068,263 | | | | 5,015,284 | | | | (4,213,108 | ) | | | 1,727,219 | | | | (5,165,411 | ) | | | 26,432,247 | | | | 39,503 | | | | 778,726 | | | | — | | | |
| | | | | | | | | | | | | | | | | | | | | | | | | | | | | | | | | | | | | | | | |
| | | | | | | | | | | | | | | | $ | 1,750,844 | | | $ | (5,033,722 | ) | | $ | 289,565,164 | | | | | | | $ | 3,705,111 | | | $ | 17 | | | |
| | | | | | | | | | | | | | | | | | | | | | | | | | | | | | | | | | | | | | | | |
| | (a) | Represents net amount purchased (sold). | |
| | (b) | All or a portion represents securities lending income earned from the reinvestment of cash collateral from loaned securities, net of fees and collateral investment expenses, and other payments to and from borrowers of securities. | |
Derivative Financial Instruments Outstanding as of Period End
Futures Contracts
| | | | | | | | | | | | | | | | |
| Description | | Number of
Contracts | | | Expiration
Date | | | Notional
Amount
(000) | | | Value/
Unrealized
Appreciation
(Depreciation) | |
Long Contracts | | | | | | | | | | | | | | | | |
Russel 2000 E-Mini Index | | | 34 | | | | 06/16/23 | | | $ | 3,083 | | | $ | 52,579 | |
S&P 500 E-mini Index | | | 102 | | | | 06/16/23 | | | | 21,102 | | | | 1,080,384 | |
| | | | | | | | | | | | | | | | |
| | | | | | | | | | | | | | $ | 1,132,963 | |
| | | | | | | | | | | | | | | | |
Derivative Financial Instruments Categorized by Risk Exposure
As of period end, the fair values of derivative financial instruments located in the Statements of Assets and Liabilities were as follows:
| | | | | | | | | | | | | | | | | | | | | | | | | | | | |
| | | Commodity
Contracts | | | Credit
Contracts | | | Equity
Contracts | | | Foreign
Currency
Exchange
Contracts | | | Interest
Rate
Contracts | | | Other
Contracts | | | Total | |
Assets — Derivative Financial Instruments | | | | | | | | | | | | | | | | | | | | | | | | | | | | |
Futures contracts | | | | | | | | | | | | | | | | | | | | | | | | | | | | |
Unrealized appreciation on futures contracts(a) | | $ | — | | | $ | — | | | $ | 1,132,963 | | | $ | — | | | $ | — | | | $ | — | | | $ | 1,132,963 | |
| | | | | | | | | | | | | | | | | | | | | | | | | | | | |
| | (a) | Net cumulative unrealized appreciation (depreciation) on futures contracts, if any, are reported in the Schedule of Investments. In the Statements of Assets and Liabilities, only current day’s variation margin is reported in receivables or payables and the net cumulative unrealized appreciation (depreciation) is included in accumulated earnings (loss). |
For the period ended March 31, 2023, the effect of derivative financial instruments in the Statements of Operations was as follows:
| | | | | | | | | | | | | | | | | | | | | | | | | | | | |
| | | Commodity
Contracts | | | Credit
Contracts | | | Equity
Contracts | | | Foreign
Currency
Exchange
Contracts | | | Interest
Rate
Contracts | | | Other
Contracts | | | Total | |
Net Realized Gain (Loss) from | | | | | | | | | | | | | | | | | | | | | | | | | | | | |
Futures contracts | | $ | — | | | $ | — | | | $ | (2,679,242 | ) | | $ | — | | | $ | — | | | $ | — | | | $ | (2,679,242 | ) |
| | | | | | | | | | | | | | | | | | | | | | | | | | | | |
Net Change in Unrealized Appreciation (Depreciation) on | | | | | | | | | | | | | | | | | | | | | | | | | | | | |
Futures contracts | | $ | — | | | $ | — | | | $ | 33,161 | | | $ | — | | | $ | — | | | $ | — | | | $ | 33,161 | |
| | | | | | | | | | | | | | | | | | | | | | | | | | | | |
| | |
S C H E D U L E S O F I N V E S T M E N T S | | 33 |
| | |
Schedule of Investments (continued) March 31, 2023 | | iShares® Russell 3000 ETF |
Average Quarterly Balances of Outstanding Derivative Financial Instruments
| | | | |
Futures contracts | | | | |
Average notional value of contracts — long | | $ | 23,177,881 | |
For more information about the Fund’s investment risks regarding derivative financial instruments, refer to the Notes to Financial Statements.
Fair Value Hierarchy as of Period End
Various inputs are used in determining the fair value of financial instruments. For a description of the input levels and information about the Fund’s policy regarding valuation of financial instruments, refer to the Notes to Financial Statements.
The following table summarizes the Fund’s financial instruments categorized in the fair value hierarchy. The breakdown of the Fund’s financial instruments into major categories is disclosed in the Schedule of Investments above.
| | | | | | | | | | | | | | | | |
| | | Level 1 | | | Level 2 | | | Level 3 | | | Total | |
| | | | |
Assets | | | | | | | | | | | | | | | | |
Investments | | | | | | | | | | | | | | | | |
Long-Term Investments | | | | | | | | | | | | | | | | |
Common Stocks | | $ | 10,701,718,146 | | | $ | 187,728 | | | $ | — | | | $ | 10,701,905,874 | |
Rights | | | — | | | | — | | | | 10,956 | | | | 10,956 | |
Warrants | | | 10,169 | �� | | | — | | | | — | | | | 10,169 | |
Short-Term Securities | | | | | | | | | | | | | | | | |
Money Market Funds | | | 263,132,917 | | | | — | | | | — | | | | 263,132,917 | |
| | | | | | | | | | | | | | | | |
| | | | |
| | $ | 10,964,861,232 | | | $ | 187,728 | | | $ | 10,956 | | | $ | 10,965,059,916 | |
| | | | | | | | | | | | | | | | |
| | | | |
Derivative Financial Instruments(a) | | | | | | | | | | | | | | | | |
Assets | | | | | | | | | | | | | | | | |
Equity Contracts | | $ | 1,132,963 | | | $ | — | | | $ | — | | | $ | 1,132,963 | |
| | | | | | | | | | | | | | | | |
| (a) | Derivative financial instruments are futures contracts. Futures contracts are valued at the unrealized appreciation (depreciation) on the instrument. | |
See notes to financial statements.
| | |
| 34 | | 2 0 2 3 I S H A R E S A N N U A L R E P O R T T O S H A R E H O L D E R S |
| | |
Schedule of Investments March 31, 2023 | | iShares® Russell Mid-Cap Value ETF (Percentages shown are based on Net Assets) |
| | | | | | | | |
| Security | | Shares | | | Value | |
| | |
Common Stocks | | | | | | | | |
|
| Aerospace & Defense — 1.4% | |
Axon Enterprise, Inc.(a) | | | 31,720 | | | $ | 7,132,242 | |
BWX Technologies, Inc. | | | 115,264 | | | | 7,266,243 | |
Curtiss-Wright Corp. | | | 79,320 | | | | 13,980,943 | |
HEICO Corp.(b) | | | 5,772 | | | | 987,243 | |
HEICO Corp., Class A | | | 10,104 | | | | 1,373,134 | |
Hexcel Corp. | | | 174,194 | | | | 11,888,740 | |
Howmet Aerospace, Inc. | | | 692,693 | | | | 29,349,402 | |
Huntington Ingalls Industries, Inc. | | | 63,493 | | | | 13,144,321 | |
Mercury Systems, Inc.(a) | | | 101,438 | | | | 5,185,511 | |
Spirit AeroSystems Holdings, Inc., Class A | | | 10,790 | | | | 372,579 | |
Textron, Inc.(b) | | | 431,507 | | | | 30,477,339 | |
TransDigm Group, Inc. | | | 65,325 | | | | 48,147,791 | |
Woodward, Inc. | | | 120,455 | | | | 11,728,703 | |
| | | | | | | | |
| | |
| | | | | | | 181,034,191 | |
| | |
| Air Freight & Logistics — 0.4% | | | | | | |
CH Robinson Worldwide, Inc. | | | 176,245 | | | | 17,513,466 | |
Expeditors International of Washington, Inc.(b) | | | 227,201 | | | | 25,019,374 | |
GXO Logistics, Inc.(a)(b) | | | 194,387 | | | | 9,808,768 | |
| | | | | | | | |
| | |
| | | | | | | 52,341,608 | |
| | |
| Automobile Components — 0.8% | | | | | | |
Aptiv PLC(a)(b) | | | 419,095 | | | | 47,018,268 | |
BorgWarner, Inc. | | | 482,896 | | | | 23,715,023 | |
Gentex Corp. | | | 486,500 | | | | 13,636,595 | |
Lear Corp. | | | 122,060 | | | | 17,026,149 | |
QuantumScape Corp., Class A(a)(b) | | | 538,724 | | | | 4,406,762 | |
| | | | | | | | |
| | |
| | | | | | | 105,802,797 | |
| | |
| Automobiles — 0.3% | | | | | | |
Harley-Davidson, Inc. | | | 279,351 | | | | 10,606,958 | |
Lucid Group, Inc.(a)(b) | | | 82,136 | | | | 660,373 | |
Rivian Automotive, Inc., Class A(a)(b) | | | 1,078,346 | | | | 16,692,796 | |
Thor Industries, Inc. | | | 107,915 | | | | 8,594,351 | |
| | | | | | | | |
| | |
| | | | | | | 36,554,478 | |
| | |
| Banks — 3.4% | | | | | | |
Bank of Hawaii Corp.(b) | | | 81,790 | | | | 4,259,623 | |
Bank OZK | | | 231,510 | | | | 7,917,642 | |
BOK Financial Corp. | | | 60,631 | | | | 5,117,863 | |
Citizens Financial Group, Inc. | | | 1,013,313 | | | | 30,774,316 | |
Columbia Banking System, Inc. | | | 429,278 | | | | 9,195,135 | |
Comerica, Inc. | | | 270,341 | | | | 11,738,206 | |
Commerce Bancshares, Inc. | | | 235,151 | | | | 13,721,061 | |
Cullen/Frost Bankers, Inc. | | | 120,315 | | | | 12,673,982 | |
East West Bancorp, Inc. | | | 292,103 | | | | 16,211,716 | |
Fifth Third Bancorp | | | 1,410,061 | | | | 37,564,025 | |
First Citizens BancShares, Inc., Class A | | | 17,168 | | | | 16,706,181 | |
First Hawaiian, Inc. | | | 265,459 | | | | 5,476,419 | |
First Horizon Corp. | | | 1,097,325 | | | | 19,510,438 | |
First Republic Bank(b) | | | 385,036 | | | | 5,386,654 | |
FNB Corp. | | | 743,610 | | | | 8,625,876 | |
Huntington Bancshares, Inc. | | | 2,969,970 | | | | 33,263,664 | |
KeyCorp | | | 1,930,461 | | | | 24,169,372 | |
M&T Bank Corp. | | | 355,801 | | | | 42,543,126 | |
New York Community Bancorp, Inc., Class A | | | 1,392,651 | | | | 12,589,565 | |
PacWest Bancorp(b) | | | 240,735 | | | | 2,342,351 | |
Pinnacle Financial Partners, Inc. | | | 156,160 | | | | 8,613,786 | |
Popular, Inc. | | | 146,302 | | | | 8,399,198 | |
Prosperity Bancshares, Inc. | | | 181,310 | | | | 11,154,191 | |
Regions Financial Corp. | | | 1,934,335 | | | | 35,901,258 | |
Synovus Financial Corp. | | | 298,808 | | | | 9,212,251 | |
Webster Financial Corp. | | | 359,018 | | | | 14,152,489 | |
| | | | | | | | |
| Security | | Shares | | | Value | |
| | |
| Banks (continued) | | | | | | |
Western Alliance Bancorp(b) | | | 85,150 | | | $ | 3,026,231 | |
Wintrust Financial Corp. | | | 124,170 | | | | 9,058,201 | |
Zions Bancorp N.A. | | | 305,460 | | | | 9,142,418 | |
| | | | | | | | |
| | |
| | | | | | | 428,447,238 | |
| | |
| Beverages — 0.3% | | | | | | |
Boston Beer Co., Inc., Class A, NVS(a) | | | 994 | | | | 326,728 | |
Brown-Forman Corp., Class A(b) | | | 38,042 | | | | 2,479,958 | |
Brown-Forman Corp., Class B, NVS | | | 157,344 | | | | 10,112,499 | |
Molson Coors Beverage Co., Class B | | | 363,442 | | | | 18,782,682 | |
| | | | | | | | |
| | |
| | | | | | | 31,701,867 | |
| | |
| Biotechnology — 1.4% | | | | | | |
Biogen, Inc.(a) | | | 297,144 | | | | 82,614,946 | |
BioMarin Pharmaceutical, Inc.(a) | | | 382,966 | | | | 37,239,614 | |
Exact Sciences Corp.(a)(b) | | | 296,243 | | | | 20,088,238 | |
Exelixis, Inc.(a) | | | 90,990 | | | | 1,766,116 | |
Horizon Therapeutics PLC(a) | | | 31,923 | | | | 3,484,076 | |
Incyte Corp.(a) | | | 51,536 | | | | 3,724,507 | |
Ionis Pharmaceuticals, Inc.(a)(b) | | | 22,667 | | | | 810,119 | |
Mirati Therapeutics, Inc.(a)(b) | | | 91,941 | | | | 3,418,366 | |
Natera, Inc.(a) | | | 14,327 | | | | 795,435 | |
Ultragenyx Pharmaceutical, Inc.(a) | | | 29,708 | | | | 1,191,291 | |
United Therapeutics Corp.(a) | | | 92,293 | | | | 20,669,940 | |
| | | | | | | | |
| | |
| | | | | | | 175,802,648 | |
| | |
| Broadline Retail — 0.5% | | | | | | |
eBay, Inc. | | | 980,532 | | | | 43,506,205 | |
Kohl’s Corp. | | | 228,484 | | | | 5,378,513 | |
Macy’s, Inc. | | | 557,538 | | | | 9,751,340 | |
Nordstrom, Inc. | | | 35,490 | | | | 577,422 | |
Ollie’s Bargain Outlet Holdings, Inc.(a)(b) | | | 122,427 | | | | 7,093,421 | |
| | | | | | | | |
| | |
| | | | | | | 66,306,901 | |
| | |
| Building Products — 1.9% | | | | | | |
A O Smith Corp. | | | 197,527 | | | | 13,658,992 | |
Allegion PLC | | | 38,115 | | | | 4,068,014 | |
Armstrong World Industries, Inc. | | | 39,889 | | | | 2,841,692 | |
AZEK Co., Inc., Class A(a)(b) | | | 230,136 | | | | 5,417,402 | |
Builders FirstSource, Inc.(a) | | | 301,441 | | | | 26,761,932 | |
Carlisle Cos., Inc. | | | 16,939 | | | | 3,829,400 | |
Carrier Global Corp. | | | 1,732,599 | | | | 79,266,404 | |
Fortune Brands Innovations, Inc. | | | 173,210 | | | | 10,172,623 | |
Hayward Holdings, Inc.(a)(b) | | | 146,278 | | | | 1,714,378 | |
Lennox International, Inc. | | | 66,181 | | | | 16,629,962 | |
Masco Corp. | | | 441,954 | | | | 21,973,953 | |
Masterbrand, Inc.(a) | | | 173,626 | | | | 1,395,953 | |
Owens Corning | | | 193,633 | | | | 18,550,041 | |
Trane Technologies PLC | | | 199,274 | | | | 36,662,431 | |
| | | | | | | | |
| | |
| | | | | | | 242,943,177 | |
| | |
| Capital Markets — 4.7% | | | | | | |
Affiliated Managers Group, Inc. | | | 76,979 | | | | 10,963,349 | |
Ameriprise Financial, Inc. | | | 78,734 | | | | 24,131,971 | |
Bank of New York Mellon Corp. | | | 1,523,165 | | | | 69,212,618 | |
Carlyle Group, Inc. | | | 428,550 | | | | 13,310,763 | |
Cboe Global Markets, Inc. | | | 219,053 | | | | 29,405,675 | |
Coinbase Global, Inc., Class A(a)(b) | | | 331,748 | | | | 22,416,212 | |
Evercore, Inc., Class A | | | 75,862 | | | | 8,752,958 | |
Franklin Resources, Inc. | | | 589,969 | | | | 15,893,765 | |
Interactive Brokers Group, Inc., Class A | | | 192,144 | | | | 15,863,409 | |
Invesco Ltd. | | | 773,188 | | | | 12,680,283 | |
Janus Henderson Group PLC | | | 280,097 | | | | 7,461,784 | |
Jefferies Financial Group, Inc. | | | 411,128 | | | | 13,049,203 | |
KKR & Co., Inc., Class A | | | 1,186,163 | | | | 62,297,281 | |
| | |
S C H E D U L E S O F I N V E S T M E N T S | | 35 |
| | |
Schedule of Investments (continued) March 31, 2023 | | iShares® Russell Mid-Cap Value ETF (Percentages shown are based on Net Assets) |
| | | | | | | | |
| Security | | Shares | | | Value | |
| | |
| Capital Markets (continued) | | | | | | |
Lazard Ltd., Class A | | | 170,676 | | | $ | 5,651,082 | |
Morningstar, Inc. | | | 5,137 | | | | 1,042,965 | |
MSCI, Inc., Class A | | | 39,719 | | | | 22,230,327 | |
Nasdaq, Inc. | | | 711,554 | | | | 38,900,657 | |
Northern Trust Corp. | | | 426,611 | | | | 37,597,227 | |
Raymond James Financial, Inc. | | | 371,611 | | | | 34,660,158 | |
Robinhood Markets, Inc., Class A(a)(b) | | | 1,187,170 | | | | 11,527,421 | |
SEI Investments Co. | | | 213,621 | | | | 12,293,888 | |
State Street Corp. | | | 723,561 | | | | 54,766,332 | |
Stifel Financial Corp. | | | 211,300 | | | | 12,485,717 | |
T Rowe Price Group, Inc. | | | 455,363 | | | | 51,410,483 | |
Tradeweb Markets, Inc., Class A | | | 82,425 | | | | 6,513,223 | |
Virtu Financial, Inc., Class A | | | 194,551 | | | | 3,677,014 | |
| | | | | | | | |
| | |
| | | | | | | 598,195,765 | |
| | |
| Chemicals — 4.0% | | | | | | |
Albemarle Corp.(b) | | | 117,476 | | | | 25,966,895 | |
Ashland, Inc. | | | 105,026 | | | | 10,787,221 | |
Axalta Coating Systems Ltd.(a)(b) | | | 344,743 | | | | 10,442,266 | |
Celanese Corp., Class A | | | 224,098 | | | | 24,402,031 | |
Chemours Co. | | | 120,298 | | | | 3,601,722 | |
Corteva, Inc. | | | 1,482,869 | | | | 89,431,829 | |
DuPont de Nemours, Inc. | | | 951,085 | | | | 68,259,370 | |
Eastman Chemical Co. | | | 248,117 | | | | 20,926,188 | |
Element Solutions, Inc. | | | 468,556 | | | | 9,047,816 | |
FMC Corp. | | | 171,505 | | | | 20,945,906 | |
Ginkgo Bioworks Holdings, Inc.,
Class A(a)(b) | | | 1,454,929 | | | | 1,935,056 | |
Huntsman Corp. | | | 375,980 | | | | 10,286,813 | |
International Flavors & Fragrances, Inc. | | | 528,839 | | | | 48,632,034 | |
LyondellBasell Industries NV, Class A | | | 532,969 | | | | 50,040,459 | |
Mosaic Co. | | | 617,196 | | | | 28,316,953 | |
NewMarket Corp. | | | 11,995 | | | | 4,377,935 | |
Olin Corp. | | | 253,360 | | | | 14,061,480 | |
PPG Industries, Inc. | | | 228,738 | | | | 30,554,822 | |
RPM International, Inc. | | | 251,170 | | | | 21,912,071 | |
Scotts Miracle-Gro Co. | | | 56,265 | | | | 3,923,921 | |
Westlake Corp.(b) | | | 68,249 | | | | 7,915,519 | |
| | | | | | | | |
| | |
| | | | | | | 505,768,307 | |
|
| Commercial Services & Supplies — 0.8% | |
Cintas Corp. | | | 12,168 | | | | 5,629,890 | |
Clean Harbors, Inc.(a) | | | 105,296 | | | | 15,010,998 | |
Driven Brands Holdings, Inc.(a)(b) | | | 120,727 | | | | 3,659,235 | |
MSA Safety, Inc. | | | 46,926 | | | | 6,264,621 | |
Republic Services, Inc. | | | 400,444 | | | | 54,148,038 | |
Ritchie Bros Auctioneers, Inc. | | | 24,464 | | | | 1,377,079 | |
Rollins, Inc. | | | 36,127 | | | | 1,355,846 | |
Stericycle, Inc.(a) | | | 190,677 | | | | 8,315,424 | |
Tetra Tech, Inc. | | | 64,648 | | | | 9,497,438 | |
| | | | | | | | |
| | |
| | | | | | | 105,258,569 | |
| | |
| Communications Equipment — 1.3% | | | | | | |
Ciena Corp.(a) | | | 304,352 | | | | 15,984,567 | |
F5, Inc.(a) | | | 122,962 | | | | 17,914,334 | |
Juniper Networks, Inc. | | | 661,262 | | | | 22,760,638 | |
Lumentum Holdings, Inc.(a)(b) | | | 141,620 | | | | 7,648,896 | |
Motorola Solutions, Inc. | | | 341,244 | | | | 97,640,146 | |
Ubiquiti, Inc. | | | 6,026 | | | | 1,637,204 | |
Viasat, Inc.(a)(b) | | | 152,144 | | | | 5,148,553 | |
| | | | | | | | |
| | |
| | | | | | | 168,734,338 | |
| | |
| Construction & Engineering — 0.7% | | | | | | |
AECOM | | | 256,636 | | | | 21,639,548 | |
MasTec, Inc.(a) | | | 126,460 | | | | 11,942,882 | |
MDU Resources Group, Inc. | | | 418,193 | | | | 12,746,523 | |
| | | | | | | | |
| Security | | Shares | | | Value | |
| | |
| Construction & Engineering (continued) | | | | | | |
Quanta Services, Inc. | | | 134,071 | | | $ | 22,341,591 | |
Valmont Industries, Inc. | | | 37,484 | | | | 11,967,892 | |
WillScot Mobile Mini Holdings Corp.(a) | | | 196,247 | | | | 9,200,059 | |
| | | | | | | | |
| | | | | | | 89,838,495 | |
| | |
| Construction Materials — 0.5% | | | | | | |
Eagle Materials, Inc. | | | 12,651 | | | | 1,856,534 | |
Martin Marietta Materials, Inc. | | | 117,679 | | | | 41,783,106 | |
Vulcan Materials Co. | | | 140,285 | | | | 24,067,295 | |
| | | | | | | | |
| | | | | | | 67,706,935 | |
| | |
| Consumer Finance — 1.0% | | | | | | |
Ally Financial, Inc. | | | 619,170 | | | | 15,782,643 | |
Credit Acceptance Corp.(a)(b) | | | 12,396 | | | | 5,405,152 | |
Discover Financial Services | | | 553,280 | | | | 54,686,195 | |
OneMain Holdings, Inc. | | | 238,739 | | | | 8,852,442 | |
SLM Corp. | | | 497,615 | | | | 6,165,450 | |
SoFi Technologies, Inc.(a)(b) | | | 1,663,285 | | | | 10,096,140 | |
Synchrony Financial | | | 901,088 | | | | 26,203,639 | |
Upstart Holdings, Inc.(a)(b) | | | 120,553 | | | | 1,915,587 | |
| | | | | | | | |
| | |
| | | | | | | 129,107,248 | |
|
| Consumer Staples Distribution & Retail — 1.4% | |
Albertsons Cos., Inc., Class A | | | 483,830 | | | | 10,053,987 | |
BJ’s Wholesale Club Holdings, Inc.(a) | | | 101,980 | | | | 7,757,619 | |
Casey’s General Stores, Inc. | | | 77,009 | | | | 16,669,368 | |
Dollar Tree, Inc.(a)(b) | | | 298,147 | | | | 42,799,002 | |
Grocery Outlet Holding Corp.(a)(b) | | | 169,485 | | | | 4,789,646 | |
Kroger Co. | | | 1,359,691 | | | | 67,127,945 | |
Performance Food Group Co.(a) | | | 218,113 | | | | 13,160,938 | |
U.S. Foods Holding Corp.(a) | | | 416,818 | | | | 15,397,257 | |
| | | | | | | | |
| | |
| | | | | | | 177,755,762 | |
| | |
| Containers & Packaging — 1.5% | | | | | | |
Amcor PLC | | | 3,068,994 | | | | 34,925,152 | |
AptarGroup, Inc. | | | 135,419 | | | | 16,005,172 | |
Ardagh Group SA, Class A(a) | | | 34,751 | | | | 232,137 | |
Ardagh Metal Packaging SA | | | 222,239 | | | | 906,735 | |
Avery Dennison Corp. | | | 65,065 | | | | 11,642,080 | |
Ball Corp. | | | 384,195 | | | | 21,172,986 | |
Berry Global Group, Inc. | | | 130,550 | | | | 7,689,395 | |
Crown Holdings, Inc. | | | 28,503 | | | | 2,357,483 | |
Graphic Packaging Holding Co. | | | 147,893 | | | | 3,769,793 | |
International Paper Co. | | | 734,966 | | | | 26,502,874 | |
Packaging Corp. of America | | | 189,079 | | | | 26,249,837 | |
Silgan Holdings, Inc. | | | 174,333 | | | | 9,356,452 | |
Sonoco Products Co. | | | 201,624 | | | | 12,299,064 | |
Westrock Co. | | | 524,802 | | | | 15,990,717 | |
| | | | | | | | |
| | |
| | | | | | | 189,099,877 | |
| | |
| Distributors — 0.6% | | | | | | |
Genuine Parts Co. | | | 264,810 | | | | 44,305,361 | |
LKQ Corp. | | | 517,279 | | | | 29,360,756 | |
| | | | | | | | |
| | |
| | | | | | | 73,666,117 | |
| | |
| Diversified Consumer Services — 0.3% | | | | | | |
ADT, Inc. | | | 437,421 | | | | 3,162,554 | |
Bright Horizons Family Solutions, Inc.(a)(b) | | | 85,952 | | | | 6,617,445 | |
Grand Canyon Education, Inc.(a) | | | 63,238 | | | | 7,202,808 | |
H&R Block, Inc. | | | 54,583 | | | | 1,924,051 | |
Mister Car Wash, Inc.(a)(b) | | | 41,684 | | | | 359,316 | |
Service Corp. International | | | 310,212 | | | | 21,336,381 | |
| | | | | | | | |
| | |
| | | | | | | 40,602,555 | |
| | |
| Diversified REITs — 0.3% | | | | | | |
WP Carey, Inc. | | | 431,995 | | | | 33,458,013 | |
| | | | | | | | |
| | |
| 36 | | 2 0 2 3 I S H A R E S A N N U A L R E P O R T T O S H A R E H O L D E R S |
| | |
Schedule of Investments (continued) March 31, 2023 | | iShares® Russell Mid-Cap Value ETF (Percentages shown are based on Net Assets) |
| | | | | | | | |
| Security | | Shares | | | Value | |
|
| Diversified Telecommunication Services — 0.1% | |
Frontier Communications Parent, Inc.(a)(b) | | | 506,675 | | | $ | 11,536,990 | |
Lumen Technologies, Inc. | | | 2,116,617 | | | | 5,609,035 | |
| | | | | | | | |
| | |
| | | | | | | 17,146,025 | |
| | |
| Electric Utilities — 4.4% | | | | | | |
Alliant Energy Corp. | | | 518,728 | | | | 27,700,075 | |
Avangrid, Inc. | | | 147,002 | | | | 5,862,440 | |
Constellation Energy Corp. | | | 677,495 | | | | 53,183,358 | |
Edison International | | | 779,954 | | | | 55,056,953 | |
Entergy Corp. | | | 420,153 | | | | 45,267,284 | |
Evergy, Inc. | | | 460,042 | | | | 28,117,767 | |
Eversource Energy | | | 714,875 | | | | 55,946,118 | |
FirstEnergy Corp. | | | 1,123,901 | | | | 45,023,474 | |
Hawaiian Electric Industries, Inc. | | | 225,744 | | | | 8,668,570 | |
IDACORP, Inc. | | | 104,680 | | | | 11,339,984 | |
NRG Energy, Inc. | | | 441,086 | | | | 15,124,839 | |
OGE Energy Corp. | | | 415,228 | | | | 15,637,486 | |
PG&E Corp.(a)(b) | | | 3,415,359 | | | | 55,226,355 | |
Pinnacle West Capital Corp. | | | 234,509 | | | | 18,582,493 | |
PPL Corp. | | | 1,525,291 | | | | 42,387,837 | |
Xcel Energy, Inc. | | | 1,130,694 | | | | 76,254,003 | |
| | | | | | | | |
| | |
| | | | | | | 559,379,036 | |
| | |
| Electrical Equipment — 1.6% | | | | | | |
Acuity Brands, Inc. | | | 66,612 | | | | 12,172,011 | |
AMETEK, Inc. | | | 477,759 | | | | 69,432,715 | |
Hubbell, Inc. | | | 110,986 | | | | 27,004,004 | |
nVent Electric PLC | | | 342,161 | | | | 14,692,393 | |
Plug Power, Inc.(a)(b) | | | 544,397 | | | | 6,380,333 | |
Regal Rexnord Corp.(b) | | | 134,441 | | | | 18,919,882 | |
Rockwell Automation, Inc. | | | 77,496 | | | | 22,741,201 | |
Sensata Technologies Holding PLC | | | 314,279 | | | | 15,720,236 | |
Sunrun, Inc.(a)(b) | | | 429,021 | | | | 8,644,773 | |
Vertiv Holdings Co. | | | 527,429 | | | | 7,547,509 | |
| | | | | | | | |
| | |
| | | | | | | 203,255,057 | |
|
| Electronic Equipment, Instruments & Components — 2.0% | |
Amphenol Corp., Class A | | | 298,826 | | | | 24,420,061 | |
Arrow Electronics, Inc.(a) | | | 114,601 | | | | 14,310,227 | |
Avnet, Inc. | | | 187,452 | | | | 8,472,830 | |
Cognex Corp. | | | 24,339 | | | | 1,205,997 | |
Coherent Corp.(a)(b) | | | 205,877 | | | | 7,839,796 | |
Corning, Inc. | | | 1,436,527 | | | | 50,680,673 | |
IPG Photonics Corp.(a) | | | 67,222 | | | | 8,289,145 | |
Jabil, Inc. | | | 49,752 | | | | 4,386,136 | |
Keysight Technologies, Inc.(a) | | | 27,246 | | | | 4,399,684 | |
Littelfuse, Inc. | | | 50,182 | | | | 13,453,292 | |
National Instruments Corp. | | | 236,490 | | | | 12,394,441 | |
TD SYNNEX Corp. | | | 96,486 | | | | 9,338,880 | |
Teledyne Technologies, Inc.(a) | | | 96,111 | | | | 42,996,217 | |
Trimble, Inc.(a) | | | 509,461 | | | | 26,705,946 | |
Vontier Corp. | | | 123,136 | | | | 3,366,538 | |
Zebra Technologies Corp., Class A(a) | | | 63,266 | | | | 20,118,588 | |
| | | | | | | | |
| | |
| | | | | | | 252,378,451 | |
| | |
| Energy Equipment & Services — 0.8% | | | | | | |
Baker Hughes Co., Class A | | | 1,953,616 | | | | 56,381,358 | |
Halliburton Co. | | | 1,020,263 | | | | 32,281,121 | |
NOV, Inc. | | | 808,198 | | | | 14,959,745 | |
| | | | | | | | |
| | |
| | | | | | | 103,622,224 | |
| | |
| Entertainment — 1.2% | | | | | | |
AMC Entertainment Holdings, Inc., Class A(a)(b) | | | 1,067,801 | | | | 5,349,683 | |
Electronic Arts, Inc. | | | 531,672 | | | | 64,039,893 | |
| | | | | | | | |
| Security | | Shares | | | Value | |
|
| Entertainment (continued) | |
Liberty Media Corp. - Liberty Formula One,
Class A(a)(b) | | | 37,888 | | | $ | 2,557,440 | |
Liberty Media Corp. - Liberty Formula One,
Class C, NVS(a)(b) | | | 369,566 | | | | 27,654,624 | |
Live Nation Entertainment, Inc.(a)(b) | | | 160,819 | | | | 11,257,330 | |
Madison Square Garden Sports Corp., Class A | | | 19,189 | | | | 3,738,977 | |
Playtika Holding Corp.(a) | | | 18,032 | | | | 203,040 | |
Roku, Inc.(a)(b) | | | 180,271 | | | | 11,865,437 | |
Take-Two Interactive Software, Inc.(a)(b) | | | 58,611 | | | | 6,992,292 | |
Warner Bros Discovery, Inc., Class A(a) | | | 1,302,800 | | | | 19,672,280 | |
| | | | | | | | |
| | |
| | | | | | | 153,330,996 | |
| | |
| Financial Services — 1.1% | | | | | | |
Affirm Holdings, Inc., Class A(a)(b) | | | 460,734 | | | | 5,192,472 | |
Apollo Global Management, Inc. | | | 239,344 | | | | 15,116,967 | |
Equitable Holdings, Inc. | | | 764,366 | | | | 19,407,253 | |
Euronet Worldwide, Inc.(a)(b) | | | 24,235 | | | | 2,711,897 | |
Global Payments, Inc. | | | 541,613 | | | | 56,999,352 | |
MGIC Investment Corp. | | | 614,696 | | | | 8,249,220 | |
Rocket Cos., Inc., Class A(a)(b) | | | 105,763 | | | | 958,213 | |
TFS Financial Corp. | | | 107,696 | | | | 1,360,200 | |
UWM Holdings Corp., Class A(b) | | | 28,660 | | | | 140,721 | |
Voya Financial, Inc. | | | 202,839 | | | | 14,494,875 | |
Western Union Co. | | | 458,982 | | | | 5,117,649 | |
WEX, Inc.(a)(b) | | | 25,146 | | | | 4,624,098 | |
| | | | | | | | |
| | |
| | | | | | | 134,372,917 | |
| | |
| Food Products — 2.4% | | | | | | |
Bunge Ltd. | | | 286,249 | | | | 27,342,504 | |
Campbell Soup Co. | | | 402,079 | | | | 22,106,303 | |
Conagra Brands, Inc. | | | 973,972 | | | | 36,582,388 | |
Darling Ingredients, Inc.(a)(b) | | | 309,533 | | | | 18,076,727 | |
Flowers Foods, Inc. | | | 390,102 | | | | 10,692,696 | |
Freshpet, Inc.(a)(b) | | | 42,612 | | | | 2,820,488 | |
Hershey Co. | | | 40,034 | | | | 10,185,050 | |
Hormel Foods Corp. | | | 593,285 | | | | 23,660,206 | |
Ingredion, Inc. | | | 135,697 | | | | 13,804,456 | |
J M Smucker Co. | | | 213,315 | | | | 33,569,382 | |
Kellogg Co. | | | 239,496 | | | | 16,036,652 | |
McCormick & Co., Inc., NVS | | | 519,951 | | | | 43,265,123 | |
Pilgrim’s Pride Corp.(a) | | | 46,014 | | | | 1,066,605 | |
Post Holdings, Inc.(a)(b) | | | 111,479 | | | | 10,018,618 | |
Seaboard Corp. | | | 542 | | | | 2,043,345 | |
Tyson Foods, Inc., Class A | | | 575,766 | | | | 34,154,439 | |
| | | | | | | | |
| | |
| | | | | | | 305,424,982 | |
| | |
| Gas Utilities — 0.5% | | | | | | |
Atmos Energy Corp. | | | 294,090 | | | | 33,043,952 | |
National Fuel Gas Co. | | | 167,791 | | | | 9,688,252 | |
UGI Corp. | | | 434,952 | | | | 15,118,932 | |
| | | | | | | | |
| | |
| | | | | | | 57,851,136 | |
| | |
| Ground Transportation — 0.6% | | | | | | |
Avis Budget Group, Inc.(a)(b) | | | 52,582 | | | | 10,242,974 | |
Hertz Global Holdings, Inc.(a)(b) | | | 378,763 | | | | 6,170,049 | |
JB Hunt Transport Services, Inc. | | | 18,503 | | | | 3,246,536 | |
Knight-Swift Transportation Holdings, Inc. | | | 322,316 | | | | 18,236,639 | |
Landstar System, Inc. | | | 8,130 | | | | 1,457,384 | |
Lyft, Inc., Class A(a)(b) | | | 135,256 | | | | 1,253,823 | |
RXO, Inc.(a) | | | 218,007 | | | | 4,281,658 | |
Ryder System, Inc. | | | 101,534 | | | | 9,060,894 | |
Schneider National, Inc., Class B | | | 110,986 | | | | 2,968,876 | |
U-Haul Holding Co. | | | 18,656 | | | | 1,112,830 | |
| | |
S C H E D U L E S O F I N V E S T M E N T S | | 37 |
| | |
Schedule of Investments (continued) March 31, 2023 | | iShares® Russell Mid-Cap Value ETF (Percentages shown are based on Net Assets) |
| | | | | | | | |
| Security | | Shares | | | Value | |
|
| Ground Transportation (continued) | |
U-Haul Holding Co., NVS(b) | | | 168,145 | | | $ | 8,718,318 | |
XPO, Inc.(a) | | | 198,452 | | | | 6,330,619 | |
| | | | | | | | |
| | |
| | | | | | | 73,080,600 | |
|
| Health Care Equipment & Supplies — 2.3% | |
Align Technology, Inc.(a) | | | 40,501 | | | | 13,533,004 | |
Cooper Cos., Inc. | | | 100,535 | | | | 37,535,748 | |
DENTSPLY SIRONA, Inc. | | | 443,362 | | | | 17,415,259 | |
Enovis Corp.(a) | | | 105,193 | | | | 5,626,773 | |
Envista Holdings Corp.(a) | | | 336,928 | | | | 13,773,617 | |
Globus Medical, Inc., Class A(a) | | | 148,459 | | | | 8,408,718 | |
Hologic, Inc.(a) | | | 503,280 | | | | 40,614,696 | |
ICU Medical, Inc.(a) | | | 34,169 | | | | 5,636,518 | |
Integra LifeSciences Holdings Corp.(a)(b) | | | 150,799 | | | | 8,657,371 | |
Masimo Corp.(a) | | | 23,094 | | | | 4,261,767 | |
QuidelOrtho Corp.(a)(b) | | | 101,785 | | | | 9,068,026 | |
STERIS PLC | | | 206,521 | | | | 39,503,337 | |
Tandem Diabetes Care, Inc.(a)(b) | | | 10,532 | | | | 427,704 | |
Teleflex, Inc. | | | 97,091 | | | | 24,594,121 | |
Zimmer Biomet Holdings, Inc. | | | 435,171 | | | | 56,224,093 | |
| | | | | | | | |
| | |
| | | | | | | 285,280,752 | |
|
| Health Care Providers & Services — 1.8% | |
Acadia Healthcare Co., Inc.(a)(b) | | | 184,281 | | | | 13,314,302 | |
agilon health, Inc.(a)(b) | | | 25,758 | | | | 611,752 | |
Amedisys, Inc.(a) | | | 66,105 | | | | 4,862,023 | |
Cardinal Health, Inc. | | | 533,234 | | | | 40,259,167 | |
Chemed Corp. | | | 19,377 | | | | 10,419,982 | |
Encompass Health Corp. | | | 203,661 | | | | 11,018,060 | |
Enhabit, Inc.(a) | | | 99,515 | | | | 1,384,254 | |
Henry Schein, Inc.(a)(b) | | | 280,409 | | | | 22,864,550 | |
Laboratory Corp. of America Holdings | | | 183,261 | | | | 42,043,738 | |
Molina Healthcare, Inc.(a) | | | 26,714 | | | | 7,145,728 | |
Oak Street Health, Inc.(a)(b) | | | 242,216 | | | | 9,368,915 | |
Premier, Inc., Class A | | | 246,240 | | | | 7,970,789 | |
Quest Diagnostics, Inc. | | | 228,937 | | | | 32,390,007 | |
Tenet Healthcare Corp.(a) | | | 219,862 | | | | 13,064,200 | |
Universal Health Services, Inc., Class B | | | 128,756 | | | | 16,364,887 | |
| | | | | | | | |
| | |
| | | | | | | 233,082,354 | |
| | |
| Health Care REITs — 1.3% | | | | | | |
Healthcare Realty Trust, Inc. | | | 786,697 | | | | 15,206,853 | |
Healthpeak Properties, Inc. | | | 1,135,553 | | | | 24,948,099 | |
Medical Properties Trust, Inc. | | | 1,238,335 | | | | 10,179,114 | |
Omega Healthcare Investors, Inc. | | | 486,725 | | | | 13,341,132 | |
Ventas, Inc. | | | 826,230 | | | | 35,817,071 | |
Welltower, Inc. | | | 980,899 | | | | 70,320,649 | |
| | | | | | | | |
| | |
| | | | | | | 169,812,918 | |
| | |
| Health Care Technology — 0.1% | | | | | | |
Certara, Inc.(a)(b) | | | 88,647 | | | | 2,137,279 | |
Definitive Healthcare Corp.(a)(b) | | | 37,574 | | | | 388,139 | |
Doximity, Inc., Class A(a)(b) | | | 122,996 | | | | 3,982,611 | |
Teladoc Health, Inc.(a)(b) | | | 299,571 | | | | 7,758,889 | |
| | | | | | | | |
| | |
| | | | | | | 14,266,918 | |
| | |
| Hotel & Resort REITs — 0.2% | | | | | | |
Host Hotels & Resorts, Inc. | | | 1,466,823 | | | | 24,187,911 | |
Park Hotels & Resorts, Inc. | | | 462,387 | | | | 5,715,104 | |
| | | | | | | | |
| | |
| | | | | | | 29,903,015 | |
| | |
| Hotels, Restaurants & Leisure — 2.6% | | | | | | |
Aramark | | | 488,655 | | | | 17,493,849 | |
Boyd Gaming Corp. | | | 157,443 | | | | 10,095,245 | |
Caesars Entertainment, Inc.(a) | | | 133,606 | | | | 6,521,309 | |
Carnival Corp.(a)(b) | | | 2,023,302 | | | | 20,536,515 | |
| | | | | | | | |
| Security | | Shares | | | Value | |
|
| Hotels, Restaurants & Leisure (continued) | |
Darden Restaurants, Inc. | | | 68,200 | | | $ | 10,581,912 | |
Domino’s Pizza, Inc. | | | 19,585 | | | | 6,460,504 | |
DoorDash, Inc., Class A(a)(b) | | | 60,698 | | | | 3,857,965 | |
Hilton Worldwide Holdings, Inc. | | | 150,244 | | | | 21,164,872 | |
Hyatt Hotels Corp., Class A(a)(b) | | | 97,608 | | | | 10,911,598 | |
Las Vegas Sands Corp.(a) | | | 430,110 | | | | 24,709,819 | |
Marriott Vacations Worldwide Corp. | | | 77,114 | | | | 10,399,594 | |
MGM Resorts International | | | 655,156 | | | | 29,102,030 | |
Norwegian Cruise Line Holdings Ltd.(a)(b) | | | 803,353 | | | | 10,805,098 | |
Penn Entertainment, Inc.(a) | | | 318,773 | | | | 9,454,807 | |
Planet Fitness, Inc., Class A(a) | | | 45,052 | | | | 3,499,189 | |
Royal Caribbean Cruises Ltd.(a)(b) | | | 455,809 | | | | 29,764,328 | |
Six Flags Entertainment Corp.(a) | | | 78,286 | | | | 2,091,019 | |
Travel + Leisure Co. | | | 47,807 | | | | 1,874,034 | |
Vail Resorts, Inc. | | | 4,397 | | | | 1,027,491 | |
Wyndham Hotels & Resorts, Inc. | | | 54,455 | | | | 3,694,772 | |
Wynn Resorts Ltd.(a) | | | 189,105 | | | | 21,162,741 | |
Yum! Brands, Inc. | | | 517,483 | | | | 68,349,155 | |
| | | | | | | | |
| | |
| | | | | | | 323,557,846 | |
| | |
| Household Durables — 1.7% | | | | | | |
DR Horton, Inc. | | | 310,832 | | | | 30,365,178 | |
Garmin Ltd. | | | 319,049 | | | | 32,198,425 | |
Leggett & Platt, Inc. | | | 277,999 | | | | 8,862,608 | |
Lennar Corp., Class A | | | 518,984 | | | | 54,550,408 | |
Lennar Corp., Class B | | | 30,291 | | | | 2,705,289 | |
Mohawk Industries, Inc.(a) | | | 109,105 | | | | 10,934,503 | |
Newell Brands, Inc. | | | 783,574 | | | | 9,747,661 | |
NVR, Inc.(a) | | | 1,678 | | | | 9,350,135 | |
PulteGroup, Inc. | | | 286,998 | | | | 16,726,243 | |
Tempur Sealy International, Inc. | | | 344,065 | | | | 13,587,127 | |
Toll Brothers, Inc. | | | 110,399 | | | | 6,627,252 | |
TopBuild Corp.(a) | | | 10,183 | | | | 2,119,490 | |
Whirlpool Corp. | | | 110,915 | | | | 14,642,998 | |
| | | | | | | | |
| | |
| | | | | | | 212,417,317 | |
|
| Household Products — 0.3% | |
Church & Dwight Co., Inc. | | | 275,647 | | | | 24,369,951 | |
Clorox Co. | | | 43,693 | | | | 6,913,980 | |
Reynolds Consumer Products, Inc. | | | 111,162 | | | | 3,056,955 | |
Spectrum Brands Holdings, Inc. | | | 82,649 | | | | 5,473,017 | |
| | | | | | | | |
| | |
| | | | | | | 39,813,903 | |
|
| Independent Power and Renewable Electricity Producers — 0.4% | |
AES Corp. | | | 1,132,134 | | | | 27,261,787 | |
Brookfield Renewable Corp., Class A | | | 266,800 | | | | 9,324,660 | |
Vistra Corp. | | | 342,588 | | | | 8,222,112 | |
| | | | | | | | |
| | |
| | | | | | | 44,808,559 | |
| | |
| Industrial REITs — 0.5% | | | | | | |
Americold Realty Trust, Inc. | | | 556,966 | | | | 15,845,683 | |
EastGroup Properties, Inc. | | | 85,248 | | | | 14,093,199 | |
First Industrial Realty Trust, Inc. | | | 271,643 | | | | 14,451,408 | |
Rexford Industrial Realty, Inc. | | | 404,062 | | | | 24,102,298 | |
| | | | | | | | |
| | |
| | | | | | | 68,492,588 | |
| | |
| Insurance — 6.4% | | | | | | |
Aflac, Inc. | | | 1,264,761 | | | | 81,602,380 | |
Allstate Corp. | | | 548,244 | | | | 60,750,918 | |
American Financial Group, Inc. | | | 139,106 | | | | 16,901,379 | |
Arch Capital Group Ltd.(a)(b) | | | 494,757 | | | | 33,579,158 | |
Arthur J. Gallagher & Co. | | | 382,191 | | | | 73,116,960 | |
Assurant, Inc. | | | 103,336 | | | | 12,407,553 | |
Assured Guaranty Ltd. | | | 118,440 | | | | 5,953,979 | |
Axis Capital Holdings Ltd. | | | 161,428 | | | | 8,801,055 | |
| | |
| 38 | | 2 0 2 3 I S H A R E S A N N U A L R E P O R T T O S H A R E H O L D E R S |
| | |
Schedule of Investments (continued) March 31, 2023 | | iShares® Russell Mid-Cap Value ETF (Percentages shown are based on Net Assets) |
| | | | | | | | |
| Security | | Shares | | | Value | |
| | |
| Insurance (continued) | | | | | | |
Brighthouse Financial, Inc.(a) | | | 140,831 | | | $ | 6,212,055 | |
Brown & Brown, Inc. | | | 453,874 | | | | 26,061,445 | |
Cincinnati Financial Corp. | | | 317,245 | | | | 35,556,820 | |
CNA Financial Corp. | | | 57,491 | | | | 2,243,874 | |
Erie Indemnity Co., Class A, NVS | | | 13,781 | | | | 3,192,506 | |
Everest Re Group Ltd. | | | 55,575 | | | | 19,896,961 | |
F&G Annuities & Life, Inc. | | | 36,989 | | | | 670,241 | |
Fidelity National Financial, Inc., Class A | | | 536,639 | | | | 18,744,800 | |
First American Financial Corp. | | | 209,007 | | | | 11,633,330 | |
Globe Life, Inc. | | | 185,689 | | | | 20,429,504 | |
Hanover Insurance Group, Inc. | | | 73,806 | | | | 9,484,071 | |
Hartford Financial Services Group, Inc. | | | 657,083 | | | | 45,792,114 | |
Kemper Corp. | | | 131,134 | | | | 7,167,784 | |
Lincoln National Corp. | | | 279,343 | | | | 6,276,837 | |
Loews Corp.(b) | | | 401,889 | | | | 23,317,600 | |
Markel Corp.(a)(b) | | | 21,177 | | | | 27,051,712 | |
Old Republic International Corp. | | | 579,937 | | | | 14,481,027 | |
Primerica, Inc. | | | 75,645 | | | | 13,029,095 | |
Principal Financial Group, Inc. | | | 501,147 | | | | 37,245,245 | |
Prudential Financial, Inc. | | | 762,212 | | | | 63,065,421 | |
Reinsurance Group of America, Inc. | | | 138,617 | | | | 18,402,793 | |
RenaissanceRe Holdings Ltd. | | | 40,672 | | | | 8,148,228 | |
Unum Group | | | 410,613 | | | | 16,243,850 | |
W R Berkley Corp. | | | 426,004 | | | | 26,523,009 | |
White Mountains Insurance Group Ltd.(b) | | | 5,169 | | | | 7,120,246 | |
Willis Towers Watson PLC | | | 222,740 | | | | 51,760,321 | |
| | | | | | | | |
| | |
| | | | | | | 812,864,271 | |
| | |
| Interactive Media & Services — 0.3% | | | | | | |
IAC, Inc.(a)(b) | | | 158,617 | | | | 8,184,637 | |
Match Group, Inc.(a)(b) | | | 36,462 | | | | 1,399,776 | |
Pinterest, Inc., Class A(a) | | | 969,416 | | | | 26,435,975 | |
TripAdvisor, Inc.(a) | | | 197,422 | | | | 3,920,801 | |
| | | | | | | | |
| | |
| | | | | | | 39,941,189 | |
| | |
| IT Services — 1.3% | | | | | | |
Akamai Technologies, Inc.(a) | | | 320,545 | | | | 25,098,674 | |
Amdocs Ltd. | | | 245,581 | | | | 23,583,143 | |
DXC Technology Co.(a)(b) | | | 474,247 | | | | 12,121,753 | |
GoDaddy, Inc., Class A(a) | | | 279,114 | | | | 21,692,740 | |
Kyndryl Holdings, Inc.(a)(b) | | | 425,087 | | | | 6,274,284 | |
Okta, Inc., Class A(a) | | | 271,280 | | | | 23,395,187 | |
Twilio, Inc., Class A(a)(b) | | | 223,495 | | | | 14,891,472 | |
VeriSign, Inc.(a) | | | 172,066 | | | | 36,362,708 | |
Wix.com Ltd.(a) | | | 25,671 | | | | 2,561,966 | |
| | | | | | | | |
| | |
| | | | | | | 165,981,927 | |
| | |
| Leisure Products — 0.3% | | | | | | |
Brunswick Corp. | | | 122,928 | | | | 10,080,096 | |
Hasbro, Inc. | | | 272,121 | | | | 14,610,176 | |
Mattel, Inc.(a) | | | 375,615 | | | | 6,915,072 | |
Peloton Interactive, Inc., Class A(a)(b) | | | 646,382 | | | | 7,329,972 | |
Polaris, Inc. | | | 29,719 | | | | 3,287,813 | |
| | | | | | | | |
| | |
| | | | | | | 42,223,129 | |
| | |
| Life Sciences Tools & Services — 0.9% | | | | | | |
10X Genomics, Inc., Class A(a)(b) | | | 19,193 | | | | 1,070,778 | |
Agilent Technologies, Inc. | | | 63,087 | | | | 8,727,456 | |
Avantor, Inc.(a) | | | 87,898 | | | | 1,858,164 | |
Azenta, Inc.(a) | | | 141,978 | | | | 6,335,058 | |
Bio-Rad Laboratories, Inc., Class A(a) | | | 44,184 | | | | 21,165,020 | |
Charles River Laboratories International,
Inc.(a)(b) | | | 7,061 | | | | 1,425,051 | |
PerkinElmer, Inc. | | | 261,971 | | | | 34,910,255 | |
QIAGEN NV(a)(b) | | | 468,715 | | | | 21,528,080 | |
| | | | | | | | |
| Security | | Shares | | | Value | |
|
| Life Sciences Tools & Services (continued) | |
Repligen Corp.(a)(b) | | | 32,903 | | | $ | 5,539,549 | |
Syneos Health, Inc.(a) | | | 174,141 | | | | 6,202,902 | |
| | | | | | | | |
| | |
| | | | | | | 108,762,313 | |
| | |
| Machinery — 5.8% | | | | | | |
AGCO Corp. | | | 111,475 | | | | 15,071,420 | |
Allison Transmission Holdings, Inc. | | | 41,024 | | | | 1,855,926 | |
Crane NXT Co. | | | 97,908 | | | | 11,112,558 | |
Cummins, Inc. | | | 292,242 | | | | 69,810,769 | |
Donaldson Co., Inc. | | | 210,019 | | | | 13,722,641 | |
Dover Corp. | | | 289,882 | | | | 44,044,671 | |
Esab Corp. | | | 117,728 | | | | 6,954,193 | |
Flowserve Corp. | | | 271,642 | | | | 9,235,828 | |
Fortive Corp. | | | 732,823 | | | | 49,956,544 | |
Gates Industrial Corp. PLC(a)(b) | | | 224,734 | | | | 3,121,555 | |
Graco, Inc. | | | 108,862 | | | | 7,948,015 | |
IDEX Corp. | | | 129,223 | | | | 29,854,390 | |
Ingersoll Rand, Inc. | | | 840,684 | | | | 48,910,995 | |
ITT, Inc. | | | 172,799 | | | | 14,912,554 | |
Middleby Corp.(a) | | | 102,768 | | | | 15,066,816 | |
Nordson Corp. | | | 90,861 | | | | 20,194,766 | |
Oshkosh Corp. | | | 136,271 | | | | 11,335,022 | |
Otis Worldwide Corp. | | | 759,140 | | | | 64,071,416 | |
PACCAR, Inc. | | | 1,060,939 | | | | 77,660,735 | |
Parker-Hannifin Corp.(b) | | | 205,141 | | | | 68,949,942 | |
Pentair PLC | | | 340,280 | | | | 18,807,276 | |
Snap-on, Inc. | | | 108,998 | | | | 26,910,516 | |
Stanley Black & Decker, Inc. | | | 305,571 | | | | 24,622,911 | |
Timken Co. | | | 126,034 | | | | 10,299,498 | |
Westinghouse Air Brake Technologies Corp. | | | 375,740 | | | | 37,972,284 | |
Xylem, Inc. | | | 318,776 | | | | 33,375,847 | |
| | | | | | | | |
| | |
| | | | | | | 735,779,088 | |
| | |
| Marine Transportation — 0.1% | | | | | | |
Kirby Corp.(a) | | | 124,760 | | | | 8,695,772 | |
| | | | | | | | |
| | |
| Media — 1.6% | | | | | | |
Altice U.S.A., Inc., Class A(a) | | | 424,709 | | | | 1,452,505 | |
Cable One, Inc. | | | 4,656 | | | | 3,268,512 | |
DISH Network Corp., Class A(a) | | | 520,050 | | | | 4,852,066 | |
Fox Corp., Class A, NVS | | | 606,294 | | | | 20,644,311 | |
Fox Corp., Class B | | | 289,877 | | | | 9,076,049 | |
Interpublic Group of Cos., Inc. | | | 802,955 | | | | 29,902,044 | |
Liberty Broadband Corp., Class A(a)(b) | | | 19,910 | | | | 1,635,009 | |
Liberty Broadband Corp., Class C, NVS(a) | | | 131,470 | | | | 10,741,099 | |
Liberty Media Corp. - Liberty SiriusXM,
Class A(a)(b) | | | 112,936 | | | | 3,172,372 | |
Liberty Media Corp. - Liberty SiriusXM, Class C, NVS(a)(b) | | | 229,877 | | | | 6,434,257 | |
New York Times Co., Class A | | | 337,854 | | | | 13,135,764 | |
News Corp., Class A, NVS | | | 783,111 | | | | 13,524,327 | |
News Corp., Class B | | | 248,342 | | | | 4,328,601 | |
Nexstar Media Group, Inc., Class A(b) | | | 67,909 | | | | 11,725,168 | |
Omnicom Group, Inc. | | | 414,873 | | | | 39,139,119 | |
Paramount Global, Class A(b) | | | 21,680 | | | | 560,211 | |
Paramount Global, Class B, NVS | | | 1,195,625 | | | | 26,674,394 | |
Sirius XM Holdings, Inc.(b) | | | 1,461,733 | | | | 5,803,080 | |
| | | | | | | | |
| | |
| | | | | | | 206,068,888 | |
| | |
| Metals & Mining — 1.8% | | | | | | |
Alcoa Corp. | | | 366,922 | | | | 15,616,200 | |
Cleveland-Cliffs, Inc.(a) | | | 1,058,973 | | | | 19,410,975 | |
Nucor Corp. | | | 531,521 | | | | 82,104,049 | |
Reliance Steel & Aluminum Co. | | | 120,834 | | | | 31,022,921 | |
Royal Gold, Inc. | | | 126,777 | | | | 16,444,245 | |
| | |
S C H E D U L E S O F I N V E S T M E N T S | | 39 |
| | |
Schedule of Investments (continued) March 31, 2023 | | iShares® Russell Mid-Cap Value ETF (Percentages shown are based on Net Assets) |
| | | | | | | | |
| Security | | Shares | | | Value | |
|
| Metals & Mining (continued) | |
SSR Mining, Inc.(b) | | | 424,647 | | | $ | 6,420,663 | |
Steel Dynamics, Inc. | | | 344,499 | | | | 38,949,057 | |
United States Steel Corp. | | | 466,596 | | | | 12,178,155 | |
| | | | | | | | |
| | |
| | | | | | | 222,146,265 | |
|
| Mortgage Real Estate Investment Trusts (REITs) — 0.4% | |
AGNC Investment Corp. | | | 1,187,432 | | | | 11,969,315 | |
Annaly Capital Management, Inc. | | | 969,250 | | | | 18,522,367 | |
Rithm Capital Corp. | | | 896,173 | | | | 7,169,384 | |
Starwood Property Trust, Inc. | | | 602,810 | | | | 10,663,709 | |
| | | | | | | | |
| | |
| | | | | | | 48,324,775 | |
| | |
| Multi-Utilities — 3.0% | | | | | | |
Ameren Corp. | | | 532,684 | | | | 46,018,571 | |
CenterPoint Energy, Inc. | | | 1,308,018 | | | | 38,534,210 | |
CMS Energy Corp. | | | 599,135 | | | | 36,774,906 | |
Consolidated Edison, Inc. | | | 735,849 | | | | 70,398,674 | |
DTE Energy Co. | | | 399,275 | | | | 43,736,584 | |
NiSource, Inc. | | | 842,448 | | | | 23,554,846 | |
Public Service Enterprise Group, Inc. | | | 1,032,666 | | | | 64,489,992 | |
WEC Energy Group, Inc. | | | 654,504 | | | | 62,040,434 | |
| | | | | | | | |
| | |
| | | | | | | 385,548,217 | |
| | |
| Office REITs — 0.8% | | | | | | |
Alexandria Real Estate Equities, Inc. | | | 355,536 | | | | 44,651,766 | |
Boston Properties, Inc. | | | 324,992 | | | | 17,588,567 | |
Cousins Properties, Inc. | | | 316,295 | | | | 6,762,387 | |
Douglas Emmett, Inc. | | | 351,843 | | | | 4,338,224 | |
Highwoods Properties, Inc. | | | 214,922 | | | | 4,984,041 | |
Hudson Pacific Properties, Inc. | | | 285,147 | | | | 1,896,228 | |
JBG SMITH Properties | | | 226,280 | | | | 3,407,777 | |
Kilroy Realty Corp. | | | 242,227 | | | | 7,848,155 | |
SL Green Realty Corp. | | | 133,102 | | | | 3,130,559 | |
Vornado Realty Trust | | | 366,189 | | | | 5,628,325 | |
| | | | | | | | |
| | |
| | | | | | | 100,236,029 | |
| | |
| Oil, Gas & Consumable Fuels — 4.2% | | | | | | |
Antero Midstream Corp. | | | 694,197 | | | | 7,282,127 | |
Antero Resources Corp.(a) | | | 204,097 | | | | 4,712,600 | |
APA Corp. | | | 662,938 | | | | 23,905,544 | |
Cheniere Energy, Inc. | | | 218,949 | | | | 34,506,362 | |
Chesapeake Energy Corp. | | | 251,167 | | | | 19,098,739 | |
Coterra Energy, Inc. | | | 1,359,406 | | | | 33,359,823 | |
Devon Energy Corp. | | | 689,858 | | | | 34,913,713 | |
Diamondback Energy, Inc. | | | 159,615 | | | | 21,575,160 | |
DT Midstream, Inc. | | | 201,184 | | | | 9,932,454 | |
EQT Corp. | | | 762,591 | | | | 24,334,279 | |
Hess Corp. | | | 126,273 | | | | 16,710,969 | |
HF Sinclair Corp. | | | 278,200 | | | | 13,459,316 | |
Marathon Oil Corp. | | | 1,315,165 | | | | 31,511,353 | |
ONEOK, Inc. | | | 818,055 | | | | 51,979,215 | |
Ovintiv, Inc. | | | 147,779 | | | | 5,331,866 | |
PDC Energy, Inc. | | | 84,021 | | | | 5,392,468 | |
Phillips 66 | | | 966,038 | | | | 97,936,933 | |
Range Resources Corp. | | | 165,073 | | | | 4,369,482 | |
Southwestern Energy Co.(a) | | | 2,111,291 | | | | 10,556,455 | |
Vitesse Energy, Inc. | | | 49,071 | | | | 933,821 | |
Williams Cos., Inc. | | | 2,525,377 | | | | 75,407,757 | |
| | | | | | | | |
| | |
| | | | | | | 527,210,436 | |
| | |
| Paper & Forest Products — 0.1% | | | | | | |
Louisiana-Pacific Corp. | | | 132,395 | | | | 7,177,133 | |
| | | | | | | | |
| | |
| Passenger Airlines — 0.9% | | | | | | |
Alaska Air Group, Inc.(a) | | | 257,878 | | | | 10,820,561 | |
American Airlines Group, Inc.(a)(b) | | | 1,337,995 | | | | 19,735,426 | |
| | | | | | | | |
| Security | | Shares | | | Value | |
|
| Passenger Airlines (continued) | |
Copa Holdings SA, Class A, NVS(b) | | | 58,753 | | | $ | 5,425,839 | |
JetBlue Airways Corp.(a) | | | 669,380 | | | | 4,873,086 | |
Southwest Airlines Co. | | | 1,228,703 | | | | 39,981,996 | |
United Airlines Holdings, Inc.(a) | | | 674,979 | | | | 29,867,821 | |
| | | | | | | | |
| | |
| | | | | | | 110,704,729 | |
| | |
| Personal Care Products — 0.1% | | | | | | |
Coty, Inc., Class A(a)(b) | | | 724,756 | | | | 8,740,557 | |
| | | | | | | | |
| | |
| Pharmaceuticals — 0.9% | | | | | | |
Catalent, Inc.(a)(b) | | | 253,209 | | | | 16,638,363 | |
Elanco Animal Health, Inc.(a) | | | 922,473 | | | | 8,671,246 | |
Jazz Pharmaceuticals PLC(a) | | | 127,742 | | | | 18,692,487 | |
Organon & Co. | | | 525,729 | | | | 12,365,146 | |
Perrigo Co. PLC | | | 279,411 | | | | 10,022,473 | |
Royalty Pharma PLC, Class A | | | 769,659 | | | | 27,730,814 | |
Viatris, Inc. | | | 2,507,531 | | | | 24,122,448 | |
| | | | | | | | |
| | |
| | | | | | | 118,242,977 | |
| | |
| Professional Services — 2.0% | | | | | | |
Broadridge Financial Solutions, Inc. | | | 22,759 | | | | 3,335,787 | |
CACI International, Inc., Class A(a)(b) | | | 47,963 | | | | 14,210,478 | |
Clarivate PLC(a)(b) | | | 980,983 | | | | 9,211,430 | |
Concentrix Corp. | | | 87,604 | | | | 10,648,266 | |
CoStar Group, Inc.(a)(b) | | | 715,392 | | | | 49,254,739 | |
Dun & Bradstreet Holdings, Inc. | | | 519,883 | | | | 6,103,426 | |
Equifax, Inc. | | | 125,775 | | | | 25,512,201 | |
FTI Consulting, Inc.(a)(b) | | | 40,320 | | | | 7,957,152 | |
Genpact Ltd. | | | 175,559 | | | | 8,114,337 | |
Jacobs Solutions, Inc. | | | 260,559 | | | | 30,618,288 | |
KBR, Inc. | | | 99,051 | | | | 5,452,758 | |
Leidos Holdings, Inc. | | | 281,871 | | | | 25,949,044 | |
ManpowerGroup, Inc. | | | 104,963 | | | | 8,662,596 | |
Robert Half International, Inc. | | | 25,872 | | | | 2,084,507 | |
Science Applications International Corp. | | | 114,219 | | | | 12,273,974 | |
SS&C Technologies Holdings, Inc. | | | 457,265 | | | | 25,821,755 | |
TransUnion | | | 106,498 | | | | 6,617,786 | |
| | | | | | | | |
| | |
| | | | | | | 251,828,524 | |
|
| Real Estate Management & Development — 0.5% | |
CBRE Group, Inc., Class A(a)(b) | | | 334,010 | | | | 24,319,268 | |
Howard Hughes Corp.(a)(b) | | | 76,161 | | | | 6,092,880 | |
Jones Lang LaSalle, Inc.(a) | | | 99,216 | | | | 14,434,936 | |
Opendoor Technologies, Inc.(a)(b) | | | 734,727 | | | | 1,293,120 | |
WeWork, Inc., Class A(a)(b) | | | 440,411 | | | | 342,331 | |
Zillow Group, Inc., Class A(a)(b) | | | 110,976 | | | | 4,849,651 | |
Zillow Group, Inc., Class C, NVS(a)(b) | | | 305,649 | | | | 13,592,211 | |
| | | | | | | | |
| | |
| | | | | | | 64,924,397 | |
| | |
| Residential REITs — 2.5% | | | | | | |
American Homes 4 Rent, Class A | | | 638,482 | | | | 20,080,259 | |
Apartment Income REIT Corp. | | | 283,124 | | | | 10,138,670 | |
AvalonBay Communities, Inc. | | | 289,077 | | | | 48,582,281 | |
Camden Property Trust | | | 196,905 | | | | 20,643,520 | |
Equity LifeStyle Properties, Inc. | | | 143,331 | | | | 9,621,810 | |
Equity Residential | | | 766,424 | | | | 45,985,440 | |
Essex Property Trust, Inc. | | | 132,965 | | | | 27,808,300 | |
Invitation Homes, Inc. | | | 1,266,793 | | | | 39,561,945 | |
Mid-America Apartment Communities, Inc. | | | 238,313 | | | | 35,994,796 | |
Sun Communities, Inc. | | | 251,735 | | | | 35,464,427 | |
UDR, Inc. | | | 678,104 | | | | 27,842,950 | |
| | | | | | | | |
| | |
| | | | | | | 321,724,398 | |
| | |
| Retail REITs — 1.8% | | | | | | |
Brixmor Property Group, Inc. | | | 617,785 | | | | 13,294,733 | |
Federal Realty Investment Trust | | | 166,751 | | | | 16,480,001 | |
| | |
| 40 | | 2 0 2 3 I S H A R E S A N N U A L R E P O R T T O S H A R E H O L D E R S |
| | |
Schedule of Investments (continued) March 31, 2023 | | iShares® Russell Mid-Cap Value ETF (Percentages shown are based on Net Assets) |
| | | | | | | | |
| Security | | Shares | | | Value | |
| | |
Retail REITs (continued) | | | | | | | | |
Kimco Realty Corp. | | | 1,249,813 | | | $ | 24,408,848 | |
National Retail Properties, Inc. | | | 376,032 | | | | 16,601,813 | |
Realty Income Corp. | | | 1,300,989 | | | | 82,378,624 | |
Regency Centers Corp. | | | 355,512 | | | | 21,750,224 | |
Simon Property Group, Inc. | | | 347,713 | | | | 38,933,425 | |
Spirit Realty Capital, Inc. | | | 286,810 | | | | 11,426,510 | |
| | | | | | | | |
| | |
| | | | | | | 225,274,178 | |
|
| Semiconductors & Semiconductor Equipment — 1.6% | |
Cirrus Logic, Inc.(a)(b) | | | 113,870 | | | | 12,455,101 | |
First Solar, Inc.(a) | | | 219,818 | | | | 47,810,415 | |
GLOBALFOUNDRIES, Inc.(a)(b) | | | 100,696 | | | | 7,268,237 | |
Microchip Technology, Inc. | | | 161,417 | | | | 13,523,516 | |
MKS Instruments, Inc. | | | 119,182 | | | | 10,561,909 | |
ON Semiconductor Corp.(a)(b) | | | 338,342 | | | | 27,852,313 | |
Qorvo, Inc.(a) | | | 205,808 | | | | 20,903,918 | |
Skyworks Solutions, Inc. | | | 328,758 | | | | 38,786,869 | |
Teradyne, Inc. | | | 30,202 | | | | 3,247,017 | |
Wolfspeed, Inc.(a)(b) | | | 255,527 | | | | 16,596,479 | |
| | | | | | | | |
| | |
| | | | | | | 199,005,774 | |
| | |
| Software — 1.5% | | | | | | |
ANSYS, Inc.(a) | | | 85,344 | | | | 28,402,483 | |
BILL Holdings, Inc.(a)(b) | | | 205,069 | | | | 16,639,299 | |
Black Knight, Inc.(a) | | | 290,339 | | | | 16,711,913 | |
CCC Intelligent Solutions Holdings, Inc.(a)(b) | | | 223,843 | | | | 2,007,872 | |
Ceridian HCM Holding, Inc.(a)(b) | | | 229,360 | | | | 16,793,739 | |
Dolby Laboratories, Inc., Class A | | | 122,988 | | | | 10,505,635 | |
DoubleVerify Holdings, Inc.(a)(b) | | | 24,548 | | | | 740,122 | |
Dropbox, Inc., Class A(a) | | | 38,707 | | | | 836,845 | |
Gen Digital, Inc. | | | 732,296 | | | | 12,566,199 | |
Guidewire Software, Inc.(a)(b) | | | 169,218 | | | | 13,884,337 | |
Informatica, Inc., Class A(a)(b) | | | 61,049 | | | | 1,001,204 | |
Jamf Holding Corp.(a)(b) | | | 22,687 | | | | 440,582 | |
Manhattan Associates, Inc.(a) | | | 49,687 | | | | 7,694,032 | |
nCino, Inc.(a)(b) | | | 114,062 | | | | 2,826,456 | |
NCR Corp.(a) | | | 250,236 | | | | 5,903,067 | |
Nutanix, Inc., Class A(a) | | | 226,769 | | | | 5,893,726 | |
Paycor HCM, Inc.(a)(b) | | | 126,237 | | | | 3,347,805 | |
Procore Technologies, Inc.(a)(b) | | | 42,123 | | | | 2,638,164 | |
SentinelOne, Inc., Class A(a) | | | 120,994 | | | | 1,979,462 | |
Teradata Corp.(a) | | | 96,893 | | | | 3,902,850 | |
Tyler Technologies, Inc.(a) | | | 10,958 | | | | 3,886,145 | |
UiPath, Inc., Class A(a)(b) | | | 707,228 | | | | 12,418,924 | |
Unity Software, Inc.(a)(b) | | | 160,442 | | | | 5,204,738 | |
Zoom Video Communications, Inc., Class A(a)(b) | | | 251,580 | | | | 18,576,667 | |
| | | | | | | | |
| | |
| | | | | | | 194,802,266 | |
| | |
| Specialized REITs — 2.4% | | | | | | |
CubeSmart | | | 462,505 | | | | 21,376,981 | |
EPR Properties | | | 155,173 | | | | 5,912,091 | |
Extra Space Storage, Inc. | | | 241,581 | | | | 39,360,792 | |
Gaming & Leisure Properties, Inc. | | | 505,217 | | | | 26,301,597 | |
Iron Mountain, Inc. | | | 149,690 | | | | 7,920,098 | |
Lamar Advertising Co., Class A | | | 22,158 | | | | 2,213,363 | |
Life Storage, Inc. | | | 173,838 | | | | 22,788,423 | |
National Storage Affiliates Trust | | | 175,229 | | | | 7,321,068 | |
Rayonier, Inc. | | | 301,965 | | | | 10,043,356 | |
SBA Communications Corp. | | | 170,883 | | | | 44,612,425 | |
VICI Properties, Inc. | | | 2,078,890 | | | | 67,813,392 | |
Weyerhaeuser Co. | | | 1,522,971 | | | | 45,887,116 | |
| | | | | | | | |
| | |
| | | | | | | 301,550,702 | |
| | |
| Specialty Retail — 2.1% | | | | | | |
Advance Auto Parts, Inc. | | | 113,360 | | | | 13,785,710 | |
| | | | | | | | |
| Security | | Shares | | | Value | |
| | |
Specialty Retail (continued) | | | | | | | | |
AutoNation, Inc.(a) | | | 69,522 | | | $ | 9,340,976 | |
AutoZone, Inc.(a) | | | 3,602 | | | | 8,854,256 | |
Bath & Body Works, Inc. | | | 474,493 | | | | 17,356,954 | |
Best Buy Co., Inc. | | | 280,682 | | | | 21,968,980 | |
Burlington Stores, Inc.(a) | | | 8,618 | | | | 1,741,698 | |
CarMax, Inc.(a)(b) | | | 289,501 | | | | 18,609,124 | |
Dick’s Sporting Goods, Inc. | | | 109,764 | | | | 15,574,414 | |
GameStop Corp., Class A(a)(b) | | | 557,783 | | | | 12,840,165 | |
Gap, Inc. | | | 408,726 | | | | 4,103,609 | |
Leslie’s, Inc.(a)(b) | | | 39,932 | | | | 439,651 | |
Lithia Motors, Inc., Class A | | | 56,059 | | | | 12,833,587 | |
O’Reilly Automotive, Inc.(a)(b) | | | 76,131 | | | | 64,633,696 | |
Penske Automotive Group, Inc.(b) | | | 53,198 | | | | 7,544,008 | |
Petco Health & Wellness Co., Inc.(a)(b) | | | 163,387 | | | | 1,470,483 | |
RH(a) | | | 23,649 | | | | 5,759,714 | |
Ross Stores, Inc. | | | 406,462 | | | | 43,137,812 | |
Victoria’s Secret & Co.(a)(b) | | | 47,844 | | | | 1,633,873 | |
Wayfair, Inc., Class A(a)(b) | | | 60,221 | | | | 2,067,989 | |
Williams-Sonoma, Inc. | | | 28,522 | | | | 3,469,987 | |
| | | | | | | | |
| | |
| | | | | | | 267,166,686 | |
|
| Technology Hardware, Storage & Peripherals — 0.9% | |
Dell Technologies, Inc., Class C | | | 415,954 | | | | 16,725,511 | |
Hewlett Packard Enterprise Co. | | | 2,668,355 | | | | 42,506,895 | |
HP, Inc. | | | 1,100,278 | | | | 32,293,159 | |
Western Digital Corp.(a) | | | 657,769 | | | | 24,778,158 | |
| | | | | | | | |
| | |
| | | | | | | 116,303,723 | |
| | |
| Textiles, Apparel & Luxury Goods — 0.8% | | | | | | |
Capri Holdings Ltd.(a)(b) | | | 254,706 | | | | 11,971,182 | |
Carter’s, Inc. | | | 78,131 | | | | 5,619,182 | |
Columbia Sportswear Co. | | | 74,860 | | | | 6,755,366 | |
Deckers Outdoor Corp.(a) | | | 6,399 | | | | 2,876,671 | |
Hanesbrands, Inc. | | | 728,002 | | | | 3,829,291 | |
PVH Corp. | | | 130,984 | | | | 11,678,534 | |
Ralph Lauren Corp., Class A | | | 83,582 | | | | 9,751,512 | |
Skechers U.S.A., Inc., Class A(a)(b) | | | 234,197 | | | | 11,129,041 | |
Tapestry, Inc. | | | 424,472 | | | | 18,298,988 | |
Under Armour, Inc., Class A(a) | | | 395,613 | | | | 3,754,367 | |
Under Armour, Inc., Class C, NVS(a)(b) | | | 392,863 | | | | 3,351,121 | |
VF Corp. | | | 726,696 | | | | 16,648,605 | |
| | | | | | | | |
| | |
| | | | | | | 105,663,860 | |
|
| Trading Companies & Distributors — 0.7% | |
Air Lease Corp., Class A | | | 214,489 | | | | 8,444,432 | |
Core & Main, Inc., Class A(a)(b) | | | 101,153 | | | | 2,336,634 | |
MSC Industrial Direct Co., Inc., Class A | | | 95,283 | | | | 8,003,772 | |
SiteOne Landscape Supply, Inc.(a)(b) | | | 36,504 | | | | 4,996,302 | |
United Rentals, Inc. | | | 78,188 | | | | 30,943,683 | |
Univar Solutions, Inc.(a) | | | 331,673 | | | | 11,618,505 | |
Watsco, Inc. | | | 32,017 | | | | 10,186,529 | |
WESCO International, Inc. | | | 43,644 | | | | 6,744,744 | |
| | | | | | | | |
| | |
| | | | | | | 83,274,601 | |
| | |
| Water Utilities — 0.6% | | | | | | |
American Water Works Co., Inc. | | | 400,217 | | | | 58,627,788 | |
Essential Utilities, Inc. | | | 480,135 | | | | 20,957,893 | |
| | | | | | | | |
| | |
| | | | | | | 79,585,681 | |
| | | | | | | | |
| | |
Total Long-Term Investments — 99.7%
(Cost: $11,798,010,709) | | | | | | | 12,641,156,965 | |
| | | | | | | | |
| | |
S C H E D U L E S O F I N V E S T M E N T S | | 41 |
| | |
Schedule of Investments (continued) March 31, 2023 | | iShares® Russell Mid-Cap Value ETF (Percentages shown are based on Net Assets) |
| | | | | | | | |
| Security | | Shares | | | Value | |
| |
Short-Term Securities | | | | | |
| | |
Money Market Funds — 3.2% | | | | | | | | |
| | |
BlackRock Cash Funds: Institutional,
SL Agency Shares, 5.01%(c)(d)(e) | | | 389,506,511 | | | $ | 389,623,363 | |
| | |
BlackRock Cash Funds: Treasury,
SL Agency Shares, 4.73%(c)(d) | | | 12,494,031 | | | | 12,494,031 | |
| | | | | | | | |
| |
Total Short-Term Securities — 3.2%
(Cost: $401,849,697) | | | | 402,117,394 | |
| | | | | | | | |
| |
Total Investments — 102.9%
(Cost: $12,199,860,406) | | | | 13,043,274,359 | |
| |
Liabilities in Excess of Other Assets — (2.9)% | | | | (367,148,716 | ) |
| | | | | | | | |
| | |
Net Assets — 100.0% | | | | | | $ | 12,676,125,643 | |
| | | | | | | | |
| (a) | Non-income producing security. |
| (b) | All or a portion of this security is on loan. |
| (c) | Affiliate of the Fund. |
| (d) | Annualized 7-day yield as of period end. |
| (e) | All or a portion of this security was purchased with the cash collateral from loaned securities. |
Affiliates
Investments in issuers considered to be affiliate(s) of the Fund during the year ended March 31, 2023 for purposes of Section 2(a)(3) of the Investment Company Act of 1940, as amended, were as follows:
| | | | | | | | | | | | | | | | | | | | | | | | | | | | | | | | | | | | | | | | |
| | | | | |
| | | | | | | | | | | |
| | | Affiliated Issuer | | Value at
03/31/22 | | | Purchases
at Cost | | | Proceeds
from Sale | | | Net
Realized
Gain (Loss) | | | Change in
Unrealized
Appreciation
(Depreciation) | | | Value at
03/31/23 | | | Shares
Held at
03/31/23 | | | Income | | | Capital Gain
Distributions
from Underlying
Funds | | | |
| | | | | |
| | | | | | | | | | | |
| | BlackRock Cash Funds: Institutional,
SL Agency Shares | | $ | 397,536,030 | | | $ | — | | | $ | (8,259,101) | (a) | | $ | 139,773 | | | $ | 206,661 | | | $ | 389,623,363 | | | | 389,506,511 | | | $ | 6,276,486 | (b) | | $ | — | | | |
| | BlackRock Cash Funds: Treasury,
SL Agency Shares | | | 21,620,000 | | | | — | | | | (9,125,969 | )(a) | | | — | | | | — | | | | 12,494,031 | | | | 12,494,031 | | | | 495,356 | | | | 13 | | | |
| | | | | | | | | | | | | | | | | | | | | | | | | | | | | | | | | | | | | | | | |
| | | | | | | | | | | | | | | | $ | 139,773 | | | $ | 206,661 | | | $ | 402,117,394 | | | | | | | $ | 6,771,842 | | | $ | 13 | | | |
| | | | | | | | | | | | | | | | | | | | | | | | | | | | | | | | | | | | | | | | |
| | (a) | Represents net amount purchased (sold). | |
| | (b) | All or a portion represents securities lending income earned from the reinvestment of cash collateral from loaned securities, net of fees and collateral investment expenses, and other payments to and from borrowers of securities. | |
Derivative Financial Instruments Outstanding as of Period End
Futures Contracts
| | | | | | | | | | | | | | | | |
| |
| | | | |
| Description | | Number of
Contracts | | | Expiration
Date | | | Notional
Amount
(000) | | | Value/
Unrealized
Appreciation
(Depreciation) | |
| |
| | | | |
Long Contracts | | | | | | | | | | | | | | | | |
S&P 500 E-mini Index | | | 34 | | | | 06/16/23 | | | $ | 7,034 | | | $ | 332,300 | |
S&P MidCap 400 E-Mini Index | | | 94 | | | | 06/16/23 | | | | 23,779 | | | | 644,233 | |
| | | | | | | | | | | | | | | | |
| | | | | | | | | | | | | | $ | 976,533 | |
| | | | | | | | | | | | | | | | |
| | |
| 42 | | 2 0 2 3 I S H A R E S A N N U A L R E P O R T T O S H A R E H O L D E R S |
| | |
Schedule of Investments (continued) March 31, 2023 | | iShares® Russell Mid-Cap Value ETF |
Derivative Financial Instruments Categorized by Risk Exposure
As of period end, the fair values of derivative financial instruments located in the Statements of Assets and Liabilities were as follows:
| | | | | | | | | | | | | | | | | | | | | | | | | | | | |
| |
| | | | | | | |
| | | Commodity
Contracts | | | Credit
Contracts | | | Equity
Contracts | | | Foreign
Currency
Exchange
Contracts | | | Interest
Rate
Contracts | | | Other
Contracts | | | Total | |
| |
Assets — Derivative Financial Instruments | | | | | | | | | | | | | | | | | | | | | | | | | | | | |
Futures contracts | | | | | | | | | | | | | | | | | | | | | | | | | | | | |
Unrealized appreciation on futures contracts(a) | | $ | — | | | $ | — | | | $ | 976,533 | | | $ | — | | | $ | — | | | $ | — | | | $ | 976,533 | |
| | | | | | | | | | | | | | | | | | | | | | | | | | | | |
| | (a) | Net cumulative unrealized appreciation (depreciation) on futures contracts, if any, are reported in the Schedule of Investments. In the Statements of Assets and Liabilities, only current day’s variation margin is reported in receivables or payables and the net cumulative unrealized appreciation (depreciation) is included in accumulated earnings (loss). | |
For the period ended March 31, 2023, the effect of derivative financial instruments in the Statements of Operations was as follows:
| | | | | | | | | | | | | | | | | | | | | | | | | | | | |
| |
| | | | | | | |
| | | Commodity
Contracts | | | Credit
Contracts | | | Equity
Contracts | | | Foreign
Currency
Exchange
Contracts | | | Interest
Rate
Contracts | | | Other
Contracts | | | Total | |
| |
Net Realized Gain (Loss) from | | | | | | | | | | | | | | | | | | | | | | | | | | | | |
Futures contracts | | $ | — | | | $ | — | | | $ | (2,644,951 | ) | | $ | — | | | $ | — | | | $ | — | | | $ | (2,644,951 | ) |
| | | | | | | | | | | | | | | | | | | | | | | | | | | | |
| | | | | | | |
Net Change in Unrealized Appreciation (Depreciation) on | | | | | | | | | | | | | | | | | | | | | | | | | | | | |
Futures contracts | | $ | — | | | $ | — | | | $ | (337,993 | ) | | $ | — | | | $ | — | | | $ | — | | | $ | (337,993 | ) |
| | | | | | | | | | | | | | | | | | | | | | | | | | | | |
Average Quarterly Balances of Outstanding Derivative Financial Instruments
| | | | |
| |
| |
Futures contracts | | | | |
Average notional value of contracts — long | | $ | 32,231,064 | |
| |
For more information about the Fund’s investment risks regarding derivative financial instruments, refer to the Notes to Financial Statements.
Fair Value Hierarchy as of Period End
Various inputs are used in determining the fair value of financial instruments. For a description of the input levels and information about the Fund’s policy regarding valuation of financial instruments, refer to the Notes to Financial Statements.
The following table summarizes the Fund’s financial instruments categorized in the fair value hierarchy. The breakdown of the Fund’s financial instruments into major categories is disclosed in the Schedule of Investments above.
| | | | | | | | | | | | | | | | |
| |
| | | Level 1 | | | Level 2 | | | Level 3 | | | Total | |
| |
Assets | | | | | | | | | | | | | | | | |
Investments | | | | | | | | | | | | | | | | |
Long-Term Investments | | | | | | | | | | | | | | | | |
Common Stocks | | $ | 12,640,924,828 | | | $ | 232,137 | | | $ | — | | | $ | 12,641,156,965 | |
Short-Term Securities | | | | | | | | | | | | | | | | |
Money Market Funds | | | 402,117,394 | | | | — | | | | — | | | | 402,117,394 | |
| | | | | | | | | | | | | | | | |
| | | | |
| | $ | 13,043,042,222 | | | $ | 232,137 | | | $ | — | | | $ | 13,043,274,359 | |
| | | | | | | | | | | | | | | | |
Derivative Financial Instruments(a) | | | | | | | | | | | | | | | | |
Assets | | | | | | | | | | | | | | | | |
Equity Contracts | | $ | 976,533 | | | $ | — | | | $ | — | | | $ | 976,533 | |
| | | | | | | | | | | | | | | | |
| (a) | Derivative financial instruments are futures contracts. Futures contracts are valued at the unrealized appreciation (depreciation) on the instrument. | |
See notes to financial statements.
| | |
S C H E D U L E S O F I N V E S T M E N T S | | 43 |
Statements of Assets and Liabilities
March 31, 2023
| | | | | | | | |
| | | iShares
Russell 3000 ETF | | | iShares
Russell Mid-Cap
Value ETF | |
| | |
ASSETS | | | | | | | | |
Investments, at value — unaffiliated(a)(b) | | $ | 10,675,494,752 | | | $ | 12,641,156,965 | |
Investments, at value — affiliated(c) | | | 289,565,164 | | | | 402,117,394 | |
Cash pledged: | | | | | | | | |
Futures contracts | | | 1,503,459 | | | | 1,927,590 | |
Receivables: | | | | | | | | |
Investments sold | | | 4,483,061 | | | | 17,935,266 | |
Securities lending income — affiliated | | | 274,500 | | | | 1,086,847 | |
Capital shares sold | | | 1,140 | | | | 1,401 | |
Dividends — unaffiliated | | | 8,066,965 | | | | 20,441,047 | |
Dividends — affiliated | | | 71,802 | | | | 67,265 | |
Variation margin on futures contracts | | | 351,253 | | | | 516,495 | |
| | | | | | | | |
| | |
Total assets | | | 10,979,812,096 | | | | 13,085,250,270 | |
| | | | | | | | |
| | |
LIABILITIES | | | | | | | | |
Bank overdraft | | | 277,106 | | | | 29,923 | |
Collateral on securities loaned | | | 245,555,320 | | | | 389,212,581 | |
Payables: | | | | | | | | |
Investments purchased | | | 4,304,401 | | | | 17,388,814 | |
Investment advisory fees | | | 1,771,109 | | | | 2,493,309 | |
Other accrued expenses | | | 628 | | | | — | |
| | | | | | | | |
| | |
Total liabilities | | | 251,908,564 | | | | 409,124,627 | |
| | | | | | | | |
| | |
NET ASSETS | | $ | 10,727,903,532 | | | $ | 12,676,125,643 | |
| | | | | | | | |
| | |
NET ASSETS CONSIST OF: | | | | | | | | |
Paid-in capital | | $ | 8,793,168,556 | | | $ | 12,644,614,795 | |
Accumulated earnings | | | 1,934,734,976 | | | | 31,510,848 | |
| | | | | | | | |
| | |
NET ASSETS | | $ | 10,727,903,532 | | | $ | 12,676,125,643 | |
| | | | | | | | |
| | |
NET ASSET VALUE | | | | | | | | |
Shares outstanding | | $ | 45,550,000 | | | $ | 119,350,000 | |
| | | | | | | | |
| | |
Net asset value | | $ | 235.52 | | | $ | 106.21 | |
| | | | | | | | |
| | |
Shares authorized | | | Unlimited | | | | Unlimited | |
| | | | | | | | |
| | |
Par value | | | None | | | | None | |
| | | | | | | | |
| | |
(a) Investments, at cost — unaffiliated | | $ | 8,414,982,442 | | | $ | 11,798,010,709 | |
| | |
(b) Securities loaned, at value | | $ | 246,612,950 | | | $ | 390,121,924 | |
| | |
(c) Investments, at cost — affiliated | | $ | 284,216,403 | | | $ | 401,849,697 | |
See notes to financial statements.
| | |
| 44 | | 2 0 2 3 I S H A R E S A N N U A L R E P O R T T O S H A R E H O L D E R S |
Statements of Operations
Year Ended March 31, 2023
| | | | | | | | |
| | | iShares Russell 3000 ETF | | | iShares Russell Mid-Cap Value ETF | |
| | |
INVESTMENT INCOME | | | | | | | | |
Dividends — unaffiliated | | $ | 172,863,775 | | | $ | 272,656,801 | |
Dividends — affiliated | | | 1,237,963 | | | | 495,356 | |
Securities lending income — affiliated — net | | | 2,467,148 | | | | 6,276,486 | |
Foreign taxes withheld | | | (37,421 | ) | | | (109,962 | ) |
| | | | | | | | |
| | |
Total investment income | | | 176,531,465 | | | | 279,318,681 | |
| | | | | | | | |
| | |
EXPENSES | | | | | | | | |
Investment advisory | | | 21,207,142 | | | | 30,920,472 | |
| | | | | | | | |
| | |
Total expenses | | | 21,207,142 | | | | 30,920,472 | |
| | | | | | | | |
| | |
Net investment income | | | 155,324,323 | | | | 248,398,209 | |
| | | | | | | | |
| | |
REALIZED AND UNREALIZED GAIN (LOSS) | | | | | | | | |
Net realized gain (loss) from: | | | | | | | | |
Investments — unaffiliated | | | (119,127,485 | ) | | | (311,725,961 | ) |
Investments — affiliated | | | (84,436 | ) | | | 139,773 | |
Capital gain distributions from underlying funds — affiliated | | | 17 | | | | 13 | |
Futures contracts | | | (2,679,242 | ) | | | (2,644,951 | ) |
In-kind redemptions — unaffiliated(a) | | | 754,070,676 | | | | 1,092,789,475 | |
In-kind redemptions — affiliated(a) | | | 1,835,280 | | | | — | |
| | | | | | | | |
| | |
| | | 634,014,810 | | | | 778,558,349 | |
| | | | | | | | |
Net change in unrealized appreciation (depreciation) on: | | | | | | | | |
Investments — unaffiliated | | | (1,795,920,346 | ) | | | (2,368,408,788 | ) |
Investments — affiliated | | | (5,033,722 | ) | | | 206,661 | |
Futures contracts | | | 33,161 | | | | (337,993 | ) |
| | | | | | | | |
| | |
| | | (1,800,920,907 | ) | | | (2,368,540,120 | ) |
| | | | | | | | |
| | |
Net realized and unrealized loss | | | (1,166,906,097 | ) | | | (1,589,981,771 | ) |
| | | | | | | | |
| | |
NET DECREASE IN NET ASSETS RESULTING FROM OPERATIONS | | $ | (1,011,581,774 | ) | | $ | (1,341,583,562 | ) |
| | | | | | | | |
| (a) | See Note 2 of the Notes to Financial Statements. |
See notes to financial statements.
| | |
F I N A N C I A L S T A T E M E N T S | | 45 |
Statements of Changes in Net Assets
| | | | | | | | | | | | | | | | | | | | |
| | | iShares Russell 3000 ETF | | | | | | iShares Russell Mid-Cap Value ETF | |
| | | | | | | | | | | | |
| | | | | |
| | | Year Ended
03/31/23 | | | Year Ended
03/31/22 | | | | | | Year Ended
03/31/23 | | | Year Ended
03/31/22 | |
| | | | | |
INCREASE (DECREASE) IN NET ASSETS | | | | | | | | | | | | | | | | | | | | |
| | | | | |
OPERATIONS | | | | | | | | | | | | | | | | | | | | |
Net investment income | | $ | 155,324,323 | | | $ | 132,413,906 | | | | | | | $ | 248,398,209 | | | $ | 200,831,244 | |
Net realized gain | | | 634,014,810 | | | | 856,447,831 | | | | | | | | 778,558,349 | | | | 1,226,700,162 | |
Net change in unrealized appreciation (depreciation) | | | (1,800,920,907 | ) | | | 290,779,607 | | | | | | | | (2,368,540,120 | ) | | | 53,384,283 | |
| | | | | | | | | | | | | | | | | | | | |
Net increase (decrease) in net assets resulting from operations | | | (1,011,581,774 | ) | | | 1,279,641,344 | | | | | | | | (1,341,583,562 | ) | | | 1,480,915,689 | |
| | | | | | | | | | | | | | | | | | | | |
| | | | | |
DISTRIBUTIONS TO SHAREHOLDERS(a) | | | | | | | | | | | | | | | | | | | | |
Decrease in net assets resulting from distributions to shareholders | | | (161,314,568 | ) | | | (135,842,146 | ) | | | | | | | (252,968,676 | ) | | | (220,370,366 | ) |
| | | | | | | | | | | | | | | | | | | | |
| | | | | |
CAPITAL SHARE TRANSACTIONS | | | | | | | | | | | | | | | | | | | | |
Net increase (decrease) in net assets derived from capital share transactions | | | (116,682,684 | ) | | | (84,663,380 | ) | | | | | | | (637,067,384 | ) | | | 527,173,955 | |
| | | | | | | | | | | | | | | | | | | | |
| | | | | |
NET ASSETS | | | | | | | | | | | | | | | | | | | | |
Total increase (decrease) in net assets | | | (1,289,579,026 | ) | | | 1,059,135,818 | | | | | | | | (2,231,619,622 | ) | | | 1,787,719,278 | |
Beginning of year | | | 12,017,482,558 | | | | 10,958,346,740 | | | | | | | | 14,907,745,265 | | | | 13,120,025,987 | |
| | | | | | | | | | | | | | | | | | | | |
End of year | | $ | 10,727,903,532 | | | $ | 12,017,482,558 | | | | | | | $ | 12,676,125,643 | | | $ | 14,907,745,265 | |
| | | | | | | | | | | | | | | | | | | | |
| (a) | Distributions for annual periods determined in accordance with U.S. federal income tax regulations. |
See notes to financial statements.
| | |
| 46 | | 2 0 2 3 I S H A R E S A N N U A L R E P O R T T O S H A R E H O L D E R S |
Financial Highlights
(For a share outstanding throughout each period)
| | | | | | | | | | | | | | | | | | | | |
| | | iShares Russell 3000 ETF | |
| | | | | |
| | | Year Ended
03/31/23 | | | Year Ended
03/31/22 | | | Year Ended
03/31/21 | | | Year Ended
03/31/20 | | | Year Ended
03/31/19 | |
| | | | | |
Net asset value, beginning of year | | $ | 262.10 | | | $ | 237.19 | | | $ | 148.31 | | | $ | 166.74 | | | $ | 156.30 | |
| | | | | | | | | | | | | | | | | | | | |
| | | | | |
Net investment income(a) | | | 3.37 | | | | 2.87 | | | | 2.73 | | | | 2.91 | | | | 2.78 | |
Net realized and unrealized gain(b) | | | (26.44 | ) | | | 25.00 | | | | 89.03 | | | | (18.04 | ) | | | 10.52 | |
| | | | | | | | | | | | | | | | | | | | |
| | | | | |
Net increase from investment operations | | | (23.07 | ) | | | 27.87 | | | | 91.76 | | | | (15.13 | ) | | | 13.30 | |
| | | | | | | | | | | | | | | | | | | | |
| | | | | |
Distributions from net investment income(c) | | | (3.51 | ) | | | (2.96 | ) | | | (2.88 | ) | | | (3.30 | ) | | | (2.86 | ) |
| | | | | | | | | | | | | | | | | | | | |
| | | | | |
Net asset value, end of year | | $ | 235.52 | | | $ | 262.10 | | | $ | 237.19 | | | $ | 148.31 | | | $ | 166.74 | |
| | | | | | | | | | | | | | | | | | | | |
| | | | | |
Total Return(d) | | | | | | | | | | | | | | | | | | | | |
Based on net asset value | | | (8.72 | )% | | | 11.75 | % | | | 62.21 | % | | | (9.29 | )% | | | 8.59 | % |
| | | | | | | | | | | | | | | | | | | | |
| | | | | |
Ratios to Average Net Assets(e) | | | | | | | | | | | | | | | | | | | | |
Total expenses | | | 0.20 | % | | | 0.20 | % | | | 0.20 | % | | | 0.20 | % | | | 0.20 | % |
| | | | | | | | | | | | | | | | | | | | |
| | | | | |
Net investment income | | | 1.47 | % | | | 1.10 | % | | | 1.37 | % | | | 1.69 | % | | | 1.72 | % |
| | | | | | | | | | | | | | | | | | | | |
| | | | | |
Supplemental Data | | | | | | | | | | | | | | | | | | | | |
Net assets, end of year (000) | | $ | 10,727,904 | | | $ | 12,017,483 | | | $ | 10,958,347 | | | $ | 8,230,988 | | | $ | 9,379,045 | |
| | | | | | | | | | | | | | | | | | | | |
| | | | | |
Portfolio turnover rate(f) | | | 4 | % | | | 5 | % | | | 4 | % | | | 5 | % | | | 5 | % |
| | | | | | | | | | | | | | | | | | | | |
| (a) | Based on average shares outstanding. |
| (b) | The amounts reported for a share outstanding may not accord with the change in aggregate gains and losses in securities for the fiscal period due to the timing of capital share transactions in relation to the fluctuating market values of the Fund’s underlying securities. |
| (c) | Distributions for annual periods determined in accordance with U.S. federal income tax regulations. |
| (d) | Where applicable, assumes the reinvestment of distributions. |
| (e) | Excludes fees and expenses incurred indirectly as a result of investments in underlying funds. |
| (f) | Portfolio turnover rate excludes in-kind transactions. |
See notes to financial statements.
| | |
F I N A N C I A L H I G H L I G H T S | | 47 |
Financial Highlights
(For a share outstanding throughout each period)
| | | | | | | | | | | | | | | | | | | | |
| | | iShares Russell Mid-Cap Value ETF | |
| | | | | |
| | | Year Ended
03/31/23 | | | Year Ended
03/31/22 | | | Year Ended
03/31/21 | | | Year Ended
03/31/20 | | | Year Ended
03/31/19 | |
| | | | | |
Net asset value, beginning of year | | $ | 119.55 | | | $ | 109.15 | | | $ | 64.10 | | | $ | 86.86 | | | $ | 86.44 | |
| | | | | | | | | | | | | | | | | | | | |
| | | | | |
Net investment income(a) | | | 2.04 | | | | 1.62 | | | | 1.43 | | | | 1.93 | | | | 1.67 | |
Net realized and unrealized gain(b) | | | (13.31 | ) | | | 10.55 | | | | 45.22 | | | | (22.63 | ) | | | 0.70 | |
| | | | | | | | | | | | | | | | | | | | |
| | | | | |
Net increase from investment operations | | | (11.27 | ) | | | 12.17 | | | | 46.65 | | | | (20.70 | ) | | | 2.37 | |
| | | | | | | | | | | | | | | | | | | | |
| | | | | |
Distributions from net investment income(c) | | | (2.07 | ) | | | (1.77 | ) | | | (1.60 | ) | | | (2.06 | ) | | | (1.95 | ) |
| | | | | | | | | | | | | | | | | | | | |
| | | | | |
Net asset value, end of year | | $ | 106.21 | | | $ | 119.55 | | | $ | 109.15 | | | $ | 64.10 | | | $ | 86.86 | |
| | | | | | | | | | | | | | | | | | | | |
| | | | | |
Total Return(d) | | | | | | | | | | | | | | | | | | | | |
Based on net asset value | | | (9.37 | )% | | | 11.19 | % | | | 73.40 | % | | | (24.28 | )% | | | 2.78 | % |
| | | | | | | | | | | | | | | | | | | | |
| | | | | |
Ratios to Average Net Assets(e) | | | | | | | | | | | | | | | | | | | | |
Total expenses | | | 0.23 | % | | | 0.23 | % | | | 0.23 | % | | | 0.24 | % | | | 0.24 | % |
| | | | | | | | | | | | | | | | | | | | |
| | | | | |
Net investment income | | | 1.88 | % | | | 1.39 | % | | | 1.65 | % | | | 2.18 | % | | | 1.93 | % |
| | | | | | | | | | | | | | | | | | | | |
| | | | | |
Supplemental Data | | | | | | | | | | | | | | | | | | | | |
Net assets, end of year (000) | | $ | 12,676,126 | | | $ | 14,907,745 | | | $ | 13,120,026 | | | $ | 8,201,945 | | | $ | 11,218,007 | |
| | | | | | | | | | | | | | | | | | | | |
| | | | | |
Portfolio turnover rate(f) | | | 19 | % | | | 21 | % | | | 25 | % | | | 20 | % | | | 25 | % |
| | | | | | | | | | | | | | | | | | | | |
| (a) | Based on average shares outstanding. |
| (b) | The amounts reported for a share outstanding may not accord with the change in aggregate gains and losses in securities for the fiscal period due to the timing of capital share transactions in relation to the fluctuating market values of the Fund’s underlying securities. |
| (c) | Distributions for annual periods determined in accordance with U.S. federal income tax regulations. |
| (d) | Where applicable, assumes the reinvestment of distributions. |
| (e) | Excludes fees and expenses incurred indirectly as a result of investments in underlying funds. |
| (f) | Portfolio turnover rate excludes in-kind transactions. |
See notes to financial statements.
| | |
| 48 | | 2 0 2 3 I S H A R E S A N N U A L R E P O R T T O S H A R E H O L D E R S |
Notes to Financial Statements
iShares Trust (the “Trust”) is registered under the Investment Company Act of 1940, as amended (the “1940 Act”), as an open-end management investment company. The Trust is organized as a Delaware statutory trust and is authorized to have multiple series or portfolios.
These financial statements relate only to the following funds (each, a “Fund” and collectively, the “Funds”):
| | |
| | |
| iShares ETF | | Diversification Classification |
| |
Russell 3000 | | Diversified |
| |
Russell Mid-Cap Value | | Diversified |
| 2. | SIGNIFICANT ACCOUNTING POLICIES |
The financial statements are prepared in conformity with accounting principles generally accepted in the United States of America (“U.S. GAAP”), which may require management to make estimates and assumptions that affect the reported amounts of assets and liabilities in the financial statements, disclosure of contingent assets and liabilities at the date of the financial statements and the reported amounts of increases and decreases in net assets from operations during the reporting period. Actual results could differ from those estimates. Each Fund is considered an investment company under U.S. GAAP and follows the accounting and reporting guidance applicable to investment companies. Below is a summary of significant accounting policies:
Investment Transactions and Income Recognition: For financial reporting purposes, investment transactions are recorded on the dates the transactions are executed. Realized gains and losses on investment transactions are determined using the specific identification method. Dividend income and capital gain distributions, if any, are recorded on the ex-dividend date. Non-cash dividends, if any, are recorded on the ex-dividend date at fair value. Upon notification from issuers or as estimated by management, a portion of the dividend income received from a real estate investment trust may be redesignated as a reduction of cost of the related investment and/or realized gain.
ForeignTaxes: The Funds may be subject to foreign taxes (a portion of which may be reclaimable) on income, stock dividends, capital gains on investments, or certain foreign currency transactions. All foreign taxes are recorded in accordance with the applicable foreign tax regulations and rates that exist in the foreign jurisdiction in which each Fund invests. These foreign taxes, if any, are paid by each Fund and are reflected in its Statements of Operations as follows: foreign taxes withheld at source are presented as a reduction of income, foreign taxes on securities lending income are presented as a reduction of securities lending income, foreign taxes on stock dividends are presented as “Other foreign taxes”, and foreign taxes on capital gains from sales of investments and foreign taxes on foreign currency transactions are included in their respective net realized gain (loss) categories. Foreign taxes payable or deferred as of March 31, 2023, if any, are disclosed in the Statements of Assets and Liabilities.
The Funds file withholding tax reclaims in certain jurisdictions to recover a portion of amounts previously withheld. The Funds may record a reclaim receivable based on collectability, which includes factors such as the jurisdiction’s applicable laws, payment history and market convention. The Statements of Operations includes tax reclaims recorded as well as professional and other fees, if any, associated with recovery of foreign withholding taxes.
Collateralization: If required by an exchange or counterparty agreement, the Funds may be required to deliver/deposit cash and/or securities to/with an exchange, or broker-dealer or custodian as collateral for certain investments.
In-kind Redemptions: For financial reporting purposes, in-kind redemptions are treated as sales of securities resulting in realized capital gains or losses to the Funds. Because such gains or losses are not taxable to the Funds and are not distributed to existing Fund shareholders, the gains or losses are reclassified from accumulated net realized gain (loss) to paid-in capital at the end of the Funds’ tax year. These reclassifications have no effect on net assets or net asset value (“NAV”) per share.
Distributions: Dividends and distributions paid by each Fund are recorded on the ex-dividend dates. Distributions are determined on a tax basis and may differ from net investment income and net realized capital gains for financial reporting purposes. Dividends and distributions are paid in U.S. dollars and cannot be automatically reinvested in additional shares of the Funds.
The character and timing of distributions are determined in accordance with U.S. federal income tax regulations, which may differ from U.S. GAAP.
Indemnifications: In the normal course of business, each Fund enters into contracts that contain a variety of representations that provide general indemnification. The Funds’ maximum exposure under these arrangements is unknown because it involves future potential claims against the Funds, which cannot be predicted with any certainty.
| 3. | INVESTMENT VALUATION AND FAIR VALUE MEASUREMENTS |
Investment Valuation Policies: Each Fund’s investments are valued at fair value (also referred to as “market value” within the financial statements) each day that the Fund’s listing exchange is open and, for financial reporting purposes, as of the report date. U.S. GAAP defines fair value as the price a fund would receive to sell an asset or pay to transfer a liability in an orderly transaction between market participants at the measurement date. The Board of Trustees of the Trust (the “Board”) of each Fund has approved the designation of BlackRock Fund Advisors (“BFA”), the Funds’ investment adviser, as the valuation designee for each Fund. Each Fund determines the fair values of its financial instruments using various independent dealers or pricing services under BFA’s policies. If a security’s market price is not readily available or does not otherwise accurately represent the fair value of the security, the security will be valued in accordance with BFA’s policies and procedures as reflecting fair value. BFA has formed a committee (the “Valuation Committee”) to develop pricing policies and procedures and to oversee the pricing function for all financial instruments, with assistance from other BlackRock pricing committees.
| | |
N O T E S T O F I N A N C I A L S T A T E M E N T S | | 49 |
Notes to Financial Statements (continued)
Fair Value Inputs and Methodologies: The following methods and inputs are used to establish the fair value of each Fund’s assets and liabilities:
| | • | | Equity investments traded on a recognized securities exchange are valued at that day’s official closing price, as applicable, on the exchange where the stock is primarily traded. Equity investments traded on a recognized exchange for which there were no sales on that day are valued at the last traded price. |
| | • | | Investments in open-end U.S. mutual funds (including money market funds) are valued at that day’s published NAV. |
| | • | | Futures contracts are valued based on that day’s last reported settlement or trade price on the exchange where the contract is traded. |
If events (e.g., market volatility, company announcement or a natural disaster) occur that are expected to materially affect the value of such investment, or in the event that application of these methods of valuation results in a price for an investment that is deemed not to be representative of the market value of such investment, or if a price is not available, the investment will be valued by the Valuation Committee, in accordance with BFA’s policies and procedures as reflecting fair value (“Fair Valued Investments”). The fair valuation approaches that may be used by the Valuation Committee include market approach, income approach and cost approach. Valuation techniques such as discounted cash flow, use of market comparables and matrix pricing are types of valuation approaches and are typically used in determining fair value. When determining the price for Fair Valued Investments, the Valuation Committee seeks to determine the price that each Fund might reasonably expect to receive or pay from the current sale or purchase of that asset or liability in an arm’s-length transaction. Fair value determinations shall be based upon all available factors that the Valuation Committee deems relevant and consistent with the principles of fair value measurement.
Fair value pricing could result in a difference between the prices used to calculate a fund’s NAV and the prices used by the fund’s underlying index, which in turn could result in a difference between the fund’s performance and the performance of the fund’s underlying index.
Fair Value Hierarchy: Various inputs are used in determining the fair value of financial instruments. These inputs to valuation techniques are categorized into a fair value hierarchy consisting of three broad levels for financial reporting purposes as follows:
| | • | | Level 1 – Unadjusted price quotations in active markets/exchanges for identical assets or liabilities that each Fund has the ability to access; |
| | • | | Level 2 – Other observable inputs (including, but not limited to, quoted prices for similar assets or liabilities in markets that are active, quoted prices for identical or similar assets or liabilities in markets that are not active, inputs other than quoted prices that are observable for the assets or liabilities (such as interest rates, yield curves, volatilities, prepayment speeds, loss severities, credit risks and default rates) or other market–corroborated inputs); and |
| | • | | Level 3 – Unobservable inputs based on the best information available in the circumstances, to the extent observable inputs are not available (including the Valuation Committee’s assumptions used in determining the fair value of financial instruments). |
The hierarchy gives the highest priority to unadjusted quoted prices in active markets for identical assets or liabilities (Level 1 measurements) and the lowest priority to unobservable inputs (Level 3 measurements). Accordingly, the degree of judgment exercised in determining fair value is greatest for instruments categorized in Level 3. The inputs used to measure fair value may fall into different levels of the fair value hierarchy. In such cases, for disclosure purposes, the fair value hierarchy classification is determined based on the lowest level input that is significant to the fair value measurement in its entirety. Investments classified within Level 3 have significant unobservable inputs used by the Valuation Committee in determining the price for Fair Valued Investments. Level 3 investments include equity or debt issued by privately held companies or funds that may not have a secondary market and/or may have a limited number of investors. The categorization of a value determined for financial instruments is based on the pricing transparency of the financial instruments and is not necessarily an indication of the risks associated with investing in those securities.
| 4. | SECURITIES AND OTHER INVESTMENTS |
Warrants: Warrants entitle a fund to purchase a specified number of shares of common stock and are non-income producing. The purchase price and number of shares are subject to adjustment under certain conditions until the expiration date of the warrants, if any. If the price of the underlying stock does not rise above the strike price before the warrant expires, the warrant generally expires without any value and a fund will lose any amount it paid for the warrant. Thus, investments in warrants may involve more risk than investments in common stock. Warrants may trade in the same markets as their underlying stock; however, the price of the warrant does not necessarily move with the price of the underlying stock.
Securities Lending: Each Fund may lend its securities to approved borrowers, such as brokers, dealers and other financial institutions. The borrower pledges and maintains with the Fund collateral consisting of cash, an irrevocable letter of credit issued by an approved bank, or securities issued or guaranteed by the U.S. government. The initial collateral received by each Fund is required to have a value of at least 102% of the current market value of the loaned securities for securities traded on U.S. exchanges and a value of at least 105% for all other securities. The collateral is maintained thereafter at a value equal to at least 100% of the current value of the securities on loan. The market value of the loaned securities is determined at the close of each business day of the Fund and any additional required collateral is delivered to the Fund or excess collateral is returned by the Fund, on the next business day. During the term of the loan, each Fund is entitled to all distributions made on or in respect of the loaned securities but does not receive interest income on securities received as collateral. Loans of securities are terminable at any time and the borrower, after notice, is required to return borrowed securities within the standard time period for settlement of securities transactions.
As of period end, any securities on loan were collateralized by cash and/or U.S. Government obligations. Cash collateral invested in money market funds managed by BFA or its affiliates is disclosed in the Schedule of Investments. Any non-cash collateral received cannot be sold, re-invested or pledged by the Fund, except in the event of borrower default. The securities on loan, if any, are also disclosed in each Fund’s Schedule of Investments. The market value of any securities on loan and the value of any related cash collateral are disclosed in the Statements of Assets and Liabilities.
Securities lending transactions are entered into by the Funds under Master Securities Lending Agreements (each, an “MSLA”) which provide the right, in the event of default (including bankruptcy or insolvency) for the non-defaulting party to liquidate the collateral and calculate a net exposure to the defaulting party or request additional collateral. In the event that a borrower defaults, the Funds, as lender, would offset the market value of the collateral received against the market value of the securities loaned. When the value of the collateral is greater than that of the market value of the securities loaned, the lender is left with a net amount payable to the defaulting party. However, bankruptcy
| | |
| 50 | | 2 0 2 3 I S H A R E S A N N U A L R E P O R T T O S H A R E H O L D E R S |
Notes to Financial Statements (continued)
or insolvency laws of a particular jurisdiction may impose restrictions on or prohibitions against such a right of offset in the event of an MSLA counterparty’s bankruptcy or insolvency. Under the MSLA, absent an event of default, the borrower can resell or re-pledge the loaned securities, and the Funds can reinvest cash collateral received in connection with loaned securities. Upon an event of default, the parties’ obligations to return the securities or collateral to the other party are extinguished, and the parties can resell or re-pledge the loaned securities or the collateral received in connection with the loaned securities in order to satisfy the defaulting party’s net payment obligation for all transactions under the MSLA. The defaulting party remains liable for any deficiency.
As of period end, the following table is a summary of the securities on loan by counterparty which are subject to offset under an MSLA:
| | | | | | | | | | | | | | | | |
| | | | | |
| iShares ETF and Counterparty | |
| Securities
Loaned at Value |
| |
| Cash
Collateral Received |
(a) | |
| Non-Cash
Collateral Received,
at Fair Value |
(a) | |
| Net
Amount |
(b) |
| | | | |
Russell 3000 | | | | | | | | | | | | | | | | |
| | | | |
Barclays Bank PLC | | $ | 36,953,190 | | | $ | (36,953,190 | ) | | $ | — | | | $ | — | |
| | | | |
Barclays Capital, Inc. | | | 1,832,774 | | | | (1,754,795 | ) | | | — | | | | 77,979 | |
| | | | |
BNP Paribas SA | | | 35,326,598 | | | | (34,793,585 | ) | | | — | | | | 533,013 | |
| | | | |
BofA Securities, Inc. | | | 8,210,779 | | | | (8,187,016 | ) | | | — | | | | 23,763 | |
| | | | |
Citadel Clearing LLC | | | 3,486,331 | | | | (3,397,677 | ) | | | — | | | | 88,654 | |
| | | | |
Citigroup Global Markets, Inc. | | | 20,721,507 | | | | (20,491,106 | ) | | | — | | | | 230,401 | |
| | | | |
Credit Suisse Securities (USA) LLC | | | 194,293 | | | | (194,293 | ) | | | — | | | | — | |
| | | | |
Deutsche Bank Securities, Inc. | | | 226,916 | | | | (226,916 | ) | | | — | | | | — | |
| | | | |
Goldman Sachs & Co. LLC | | | 48,337,613 | | | | (48,205,646 | ) | | | — | | | | 131,967 | |
| | | | |
HSBC Bank PLC | | | 3,650,439 | | | | (3,650,439 | ) | | | — | | | | — | |
| | | | |
ING Financial Markets LLC | | | 1,073,479 | | | | (1,051,155 | ) | | | — | | | | 22,324 | |
| | | | |
J.P. Morgan Securities LLC | | | 16,410,589 | | | | (16,410,589 | ) | | | — | | | | — | |
| | | | |
Jefferies LLC | | | 2,861,156 | | | | (2,861,156 | ) | | | — | | | | — | |
| | | | |
Morgan Stanley | | | 27,772,488 | | | | (27,665,663 | ) | | | — | | | | 106,825 | |
| | | | |
National Financial Services LLC | | | 1,378,225 | | | | (1,378,225 | ) | | | — | | | | — | |
| | | | |
Natixis SA | | | 3,396,327 | | | | (3,354,132 | ) | | | — | | | | 42,195 | |
| | | | |
Nomura Securities International, Inc. | | | 29,925 | | | | (29,925 | ) | | | — | | | | — | |
| | | | |
Pershing LLC | | | 26,563 | | | | (26,563 | ) | | | — | | | | — | |
| | | | |
RBC Capital Market LLC | | | 4,540,780 | | | | (4,437,185 | ) | | | — | | | | 103,595 | |
| | | | |
Scotia Capital (USA), Inc. | | | 12,746,855 | | | | (12,674,483 | ) | | | — | | | | 72,372 | |
| | | | |
SG Americas Securities LLC | | | 1,831,502 | | | | (1,822,414 | ) | | | — | | | | 9,088 | |
| | | | |
State Street Bank & Trust Co. | | | 447,376 | | | | (447,376 | ) | | | — | | | | — | |
| | | | |
Toronto-Dominion Bank | | | 5,965,269 | | | | (5,951,556 | ) | | | — | | | | 13,713 | |
| | | | |
UBS AG | | | 4,063,898 | | | | (4,063,898 | ) | | | — | | | | — | |
| | | | |
UBS Securities LLC | | | 1,015,846 | | | | (1,004,325 | ) | | | — | | | | 11,521 | |
| | | | |
Virtu Americas LLC | | | 119,897 | | | | (118,675 | ) | | | — | | | | 1,222 | |
| | | | |
Wells Fargo Bank N.A | | | 3,682,359 | | | | (3,682,359 | ) | | | — | | | | — | |
| | | | |
Wells Fargo Securities LLC | | | 309,976 | | | | (309,976 | ) | | | — | | | | — | |
| | | | | | | | | | | | | | | | |
| | | | |
| | $ | 246,612,950 | | | $ | (245,144,318 | ) | | $ | — | | | $ | 1,468,632 | |
| | | | | | | | | | | | | | | | |
| | | | |
Russell Mid-Cap Value | | | | | | | | | | | | | | | | |
| | | | |
Barclays Bank PLC | | $ | 22,270,522 | | | $ | (22,218,194 | ) | | $ | — | | | $ | 52,328 | |
| | | | |
Barclays Capital, Inc. | | | 3,420,835 | | | | (3,408,500 | ) | | | — | | | | 12,335 | |
| | | | |
BMO Capital Markets Corp. | | | 43,773 | | | | (41,753 | ) | | | — | | | | 2,020 | |
| | | | |
BNP Paribas SA | | | 46,431,870 | | | | (46,143,764 | ) | | | — | | | | 288,106 | |
| | | | |
BofA Securities, Inc. | | | 8,632,458 | | | | (8,601,913 | ) | | | — | | | | 30,545 | |
| | | | |
Citadel Clearing LLC | | | 7,515,523 | | | | (7,452,885 | ) | | | — | | | | 62,638 | |
| | | | |
Citigroup Global Markets, Inc. | | | 11,281,488 | | | | (11,182,993 | ) | | | — | | | | 98,495 | |
| | | | |
Goldman Sachs & Co. LLC | | | 104,448,744 | | | | (103,987,781 | ) | | | — | | | | 460,963 | |
| | | | |
HSBC Bank PLC | | | 4,842,149 | | | | (4,822,881 | ) | | | — | | | | 19,268 | |
| | | | |
ING Financial Markets LLC | | | 620 | | | | (618 | ) | | | — | | | | 2 | |
| | | | |
J.P. Morgan Securities LLC | | | 47,450,507 | | | | (47,450,507 | ) | | | — | | | | — | |
| | | | |
Jefferies LLC | | | 2,342,958 | | | | (2,342,958 | ) | | | — | | | | — | |
| | | | |
Morgan Stanley | | | 65,454,900 | | | | (65,209,595 | ) | | | — | | | | 245,305 | |
| | | | |
National Financial Services LLC | | | 1,207,415 | | | | (1,207,159 | ) | | | — | | | | 256 | |
| | | | |
Natixis SA | | | 2,756,124 | | | | (2,756,124 | ) | | | — | | | | — | |
| | | | |
Nomura Securities International, Inc. | | | 223,300 | | | | (223,300 | ) | | | — | | | | — | |
| | | | |
RBC Capital Market LLC | | | 10,860,761 | | | | (10,852,240 | ) | | | — | | | | 8,521 | |
| | | | |
Scotia Capital (USA), Inc. | | | 1,889,810 | | | | (1,875,307 | ) | | | — | | | | 14,503 | |
| | | | |
SG Americas Securities LLC | | | 4,273,696 | | | | (4,259,629 | ) | | | — | | | | 14,067 | |
| | | | |
State Street Bank & Trust Co. | | | 1,282 | | | | (1,282 | ) | | | — | | | | — | |
| | | | |
Toronto-Dominion Bank | | | 2,692,254 | | | | (2,605,094 | ) | | | — | | | | 87,160 | |
| | | | |
UBS AG | | | 16,313,442 | | | | (16,174,132 | ) | | | — | | | | 139,310 | |
| | | | |
UBS Securities LLC | | | 12,660,066 | | | | (12,531,212 | ) | | | — | | | | 128,854 | |
| | | | |
Virtu Americas LLC | | | 584,365 | | | | (582,505 | ) | | | — | | | | 1,860 | |
| | |
N O T E S T O F I N A N C I A L S T A T E M E N T S | | 51 |
Notes to Financial Statements (continued)
| | | | | | | | | | | | | | | | |
| | | | | |
| iShares ETF and Counterparty | |
| Securities
Loaned at Value |
| |
| Cash
Collateral Received |
(a) | |
| Non-Cash
Collateral Received,
at Fair Value |
(a) | |
| Net
Amount |
(b) |
| | | | |
Russell Mid-Cap Value (continued) | | | | | | | | | | | | | | | | |
Wells Fargo Bank N.A. | | $ | 5,830,355 | | | $ | (5,813,615 | ) | | $ | — | | | $ | 16,740 | |
Wells Fargo Securities LLC | | | 6,692,707 | | | | (6,692,707 | ) | | | — | | | | — | |
| | | | | | | | | | | | | | | | |
| | | | |
| | $ | 390,121,924 | | | $ | (388,438,648 | ) | | $ | — | | | $ | 1,683,276 | |
| | | | | | | | | | | | | | | | |
| | (a) | Collateral received, if any, in excess of the market value of securities on loan is not presented in this table. The total cash collateral received by each Fund is disclosed in the Funds’ Statements of Assets and Liabilities. | |
| | (b) | The market value of the loaned securities is determined as of March 31, 2023. Additional collateral is delivered to the Fund on the next business day in accordance with the MSLA. The net amount would be subject to the borrower default indemnity in the event of default by the counterparty. | |
The risks of securities lending include the risk that the borrower may not provide additional collateral when required or may not return the securities when due. To mitigate these risks, each Fund benefits from a borrower default indemnity provided by BlackRock, Inc. (“BlackRock”). BlackRock’s indemnity allows for full replacement of the securities loaned to the extent the collateral received does not cover the value of the securities loaned in the event of borrower default. Each Fund could incur a loss if the value of an investment purchased with cash collateral falls below the market value of the loaned securities or if the value of an investment purchased with cash collateral falls below the value of the original cash collateral received. Such losses are borne entirely by each Fund.
| 5. | DERIVATIVE FINANCIAL INSTRUMENTS |
Futures Contracts: Futures contracts are purchased or sold to gain exposure to, or manage exposure to, changes in interest rates (interest rate risk) and changes in the value of equity securities (equity risk) or foreign currencies (foreign currency exchange rate risk).
Futures contracts are exchange-traded agreements between the Funds and a counterparty to buy or sell a specific quantity of an underlying instrument at a specified price and on a specified date. Depending on the terms of a contract, it is settled either through physical delivery of the underlying instrument on the settlement date or by payment of a cash amount on the settlement date. Upon entering into a futures contract, the Funds are required to deposit initial margin with the broker in the form of cash or securities in an amount that varies depending on a contract’s size and risk profile. The initial margin deposit must then be maintained to an established level over the life of the contract. Amounts pledged, which are considered restricted, are included in cash pledged for futures contracts in the Statements of Assets and Liabilities.
Securities deposited as initial margin are designated in the Schedule of Investments and cash deposited, if any, are shown as cash pledged for futures contracts in the Statements of Assets and Liabilities. Pursuant to the contract, the Funds agree to receive from or pay to the broker an amount of cash equal to the daily fluctuation in market value of the contract (“variation margin”). Variation margin is recorded as unrealized appreciation (depreciation) and, if any, shown as variation margin receivable (or payable) on futures contracts in the Statements of Assets and Liabilities. When the contract is closed, a realized gain or loss is recorded in the Statements of Operations equal to the difference between the notional amount of the contract at the time it was opened and the notional amount at the time it was closed. The use of futures contracts involves the risk of an imperfect correlation in the movements in the price of futures contracts and interest rates, foreign currency exchange rates or underlying assets.
| 6. | INVESTMENT ADVISORY AGREEMENT AND OTHER TRANSACTIONS WITH AFFILIATES |
Investment Advisory Fees: Pursuant to an Investment Advisory Agreement with the Trust, BFA manages the investment of each Fund’s assets. BFA is a California corporation indirectly owned by BlackRock. Under the Investment Advisory Agreement, BFA is responsible for substantially all expenses of the Funds, except (i) interest and taxes; (ii) brokerage commissions and other expenses connected with the execution of portfolio transactions; (iii) distribution fees; (iv) the advisory fee payable to BFA; and (v) litigation expenses and any extraordinary expenses (in each case as determined by a majority of the independent trustees).
For its investment advisory services to the following fund, BFA is entitled to an annual investment advisory fee, accrued daily and paid monthly by the Fund, based on the average daily net assets of the Fund, as follows:
| | | | |
| | |
| iShares ETF | | Investment Advisory Fees | |
| |
Russell 3000 | | | 0.20% | |
For its investment advisory services to the iShares Russell Mid-Cap Value ETF, BFA is entitled to an annual investment advisory fee, accrued daily and paid monthly by the Fund, based on the Fund’s allocable portion of the aggregate of the the average daily net assets of the Fund and certain other iShares funds, as follows:
| | | | |
| | |
| Aggregate Average Daily Net Assets | | Investment Advisory Fees | |
| |
First $121 billion | | | 0.2500 | % |
| |
Over $121 billion, up to and including $181 billion | | | 0.2375 | |
| |
Over $181 billion, up to and including $231 billion | | | 0.2257 | |
| |
Over $231 billion, up to and including $281 billion | | | 0.2144 | |
| |
Over $281 billion | | | 0.2037 | |
Distributor: BlackRock Investments, LLC (“BRIL”), an affiliate of BFA, is the distributor for each Fund. Pursuant to the distribution agreement, BFA is responsible for any fees or expenses for distribution services provided to the Funds.
| | |
| 52 | | 2 0 2 3 I S H A R E S A N N U A L R E P O R T T O S H A R E H O L D E R S |
Notes to Financial Statements (continued)
ETF Servicing Fees: Each Fund has entered into an ETF Services Agreement with BRIL to perform certain order processing, Authorized Participant communications, and related services in connection with the issuance and redemption of Creation Units (“ETF Services”). BRIL is entitled to a transaction fee from Authorized Participants on each creation or redemption order for the ETF Services provided. The Funds do not pay BRIL for ETF Services.
Prior to April 25, 2022, ETF Services were performed by State Street Bank and Trust Company.
Securities Lending: The U.S. Securities and Exchange Commission (the “SEC”) has issued an exemptive order which permits BlackRock Institutional Trust Company, N.A. (“BTC”), an affiliate of BFA, to serve as securities lending agent for the Funds, subject to applicable conditions. As securities lending agent, BTC bears all operational costs directly related to securities lending, including any custodial costs. Each Fund is responsible for fees in connection with the investment of cash collateral received for securities on loan (the “collateral investment fees”). The cash collateral is invested in a money market fund, BlackRock Cash Funds: Institutional or BlackRock Cash Funds: Treasury, managed by BFA, or its affiliates. However, BTC has agreed to reduce the amount of securities lending income it receives in order to effectively limit the collateral investment fees each Fund bears to an annual rate of 0.04%. The SL Agency Shares of such money market fund will not be subject to a sales load, distribution fee or service fee. The money market fund in which the cash collateral has been invested may, under certain circumstances, impose a liquidity fee of up to 2% of the value redeemed or temporarily restrict redemptions for up to 10 business days during a 90 day period, in the event that the money market fund’s weekly liquid assets fall below certain thresholds.
Securities lending income is equal to the total of income earned from the reinvestment of cash collateral, net of fees and other payments to and from borrowers of securities, and less the collateral investment fees. Each Fund retains a portion of securities lending income and remits the remaining portion to BTC as compensation for its services as securities lending agent.
Pursuant to the current securities lending agreement, each Fund retains 81% of securities lending income (which excludes collateral investment fees) and the amount retained can never be less than 70% of the total of securities lending income plus the collateral investment fees.
In addition, commencing the business day following the date that the aggregate securities lending income plus the collateral investment fees generated across all 1940 Act iShares exchange-traded funds (the “iShares ETF Complex”) in that calendar year exceeds a specified threshold, each Fund, pursuant to the securities lending agreement, will retain for the remainder of that calendar year 81% of securities lending income (which excludes collateral investment fees), and the amount retained can never be less than 70% of the total of securities lending income plus the collateral investment fees.
The share of securities lending income earned by each Fund is shown as securities lending income - affiliated - net in its Statements of Operations. For the year ended March 31, 2023, the Funds paid BTC the following amounts for securities lending agent services:
| | | | |
| | |
| iShares ETF | | Amounts | |
| |
Russell 3000 | | $ | 691,670 | |
Russell Mid-Cap Value | | | 1,679,004 | |
Officers and Trustees: Certain officers and/or trustees of the Trust are officers and/or trustees of BlackRock or its affiliates.
Other Transactions: Cross trading is the buying or selling of portfolio securities between funds to which BFA (or an affiliate) serves as investment adviser. At its regularly scheduled quarterly meetings, the Board reviews such transactions as of the most recent calendar quarter for compliance with the requirements and restrictions set forth by Rule 17a-7.
For the year ended March 31, 2023, transactions executed by the Funds pursuant to Rule 17a-7 under the 1940 Act were as follows:
| | | | | | | | | | | | |
| | | | |
| iShares ETF | | Purchases | | | Sales | | | Net Realized
Gain (Loss) | |
| | | |
Russell 3000 | | $ | 60,672,740 | | | $ | 79,151,900 | | | $ | (32,716,730 | ) |
Russell Mid-Cap Value | | | 1,093,929,606 | | | | 1,151,782,609 | | | | (180,997,540 | ) |
Each Fund may invest its positive cash balances in certain money market funds managed by BFA or an affiliate. The income earned on these temporary cash investments is shown as dividends - affiliated in the Statements of Operations.
A fund, in order to improve its portfolio liquidity and its ability to track its underlying index, may invest in shares of other iShares funds that invest in securities in the fund’s underlying index.
For the year ended March 31, 2023, purchases and sales of investments, excluding short-term securities and in-kind transactions, were as follows:
| | | | | | | | |
| |
| | |
| iShares ETF | | Purchases | | | Sales | |
| |
| | |
Russell 3000 | | $ | 469,325,775 | | | $ | 472,122,779 | |
Russell Mid-Cap Value | | | 2,482,023,620 | | | | 2,480,769,070 | |
| |
| | |
N O T E S T O F I N A N C I A L S T A T E M E N T S | | 53 |
Notes to Financial Statements (continued)
For the year ended March 31, 2023, in-kind transactions were as follows:
| | | | | | | | |
| |
| | |
| iShares ETF | | In-kind Purchases | | | In-kind Sales | |
| |
| | |
Russell 3000 | | $ | 1,406,561,676 | | | $ | 1,482,857,262 | |
Russell Mid-Cap Value | | | 2,665,395,307 | | | | 3,304,973,984 | |
| |
Each Fund is treated as an entity separate from the Trust’s other funds for federal income tax purposes. It is each Fund’s policy to comply with the requirements of the Internal Revenue Code of 1986, as amended, applicable to regulated investment companies, and to distribute substantially all of its taxable income to its shareholders. Therefore, no U.S. federal income tax provision is required.
Management has analyzed tax laws and regulations and their application to the Funds as of March 31, 2023, inclusive of the open tax return years, and does not believe that there are any uncertain tax positions that require recognition of a tax liability in the Funds’ financial statements.
U.S. GAAP requires that certain components of net assets be adjusted to reflect permanent differences between financial and tax reporting. These reclassifications have no effect on net assets or NAV per share. As of March 31, 2023, permanent differences attributable to distributions paid in excess of taxable income and realized gains (losses) from in-kind redemptions were reclassified to the following accounts:
| | | | | | | | |
| |
| | |
| iShares ETF | | Paid-in capital | | | Accumulated earnings (loss) | |
| |
| | |
Russell 3000 | | $ | 747,001,355 | | | $ | (747,001,355) | |
Russell Mid-Cap Value | | | 1,076,949,017 | | | | (1,076,949,017) | |
| |
The tax character of distributions paid was as follows:
| | | | | | | | |
| |
| | |
| iShares ETF | | Year Ended March 31, 2023 | | | Year Ended March 31, 2022 | |
| |
| | |
Russell 3000 | | | | | | | | |
Ordinary income | | $ | 161,314,568 | | | $ | 135,842,146 | |
| | | | | | | | |
| | |
Russell Mid-Cap Value | | | | | | | | |
Ordinary income | | $ | 252,968,676 | | | $ | 220,370,366 | |
| | | | | | | | |
As of March 31, 2023, the tax components of accumulated net earnings (losses) were as follows:
| | | | | | | | | | | | | | | | |
| |
| | | | |
| iShares ETF | |
| Non-expiring
Capital Loss
Carryforwards |
(a) | |
| Net Unrealized
Gains (Losses) |
(b) | | | Qualified late-year losses | (c) | | | Total | |
| |
| | | | |
Russell 3000 | | $ | (262,843,385 | ) | | $ | 2,197,578,361 | | | $ | — | | | $ | 1,934,734,976 | |
Russell Mid-Cap Value | | | (701,035,961 | ) | | | 732,597,544 | | | | (50,735 | ) | | | 31,510,848 | |
| |
| (a) | Amounts available to offset future realized capital gains. | |
| (b) | The difference between book-basis and tax-basis net accumulated losses was attributable primarily to the tax deferral of losses on wash sales, the realization for tax purposes of unrealized gains(losses) on certain futures contracts, the timing and recognition of partnership income, the characterization of corporate actions, the realization for tax purposes of unrealized gains on investments in passive foreign investment companies and the timing and recognition of realized gains/losses for tax purposes. | |
| (c) | The Fund has elected to defer certain qualified late-year losses and recognize such losses in the next taxable year. | |
A fund may own shares in certain foreign investment entities, referred to, under U.S. tax law, as “passive foreign investment companies.” Such fund may elect to mark-to-market annually the shares of each passive foreign investment company and would be required to distribute to shareholders any such marked-to-market gains.
As of March 31, 2023, gross unrealized appreciation and depreciation based on cost of investments (including short positions and derivatives, if any) for U.S. federal income tax purposes were as follows:
| | | | | | | | | | | | | | | | |
| |
| | | | |
| iShares ETF | | Tax Cost | | | Gross Unrealized
Appreciation | | | Gross Unrealized
Depreciation | | | Net Unrealized
Appreciation
(Depreciation) | |
| |
| | | | |
Russell 3000 | | $ | 8,767,467,483 | | | $ | 3,035,635,806 | | | $ | (838,043,373 | ) | | $ | 2,197,592,433 | |
Russell Mid-Cap Value | | | 12,310,573,076 | | | | 2,116,052,928 | | | | (1,383,351,645 | ) | | | 732,701,283 | |
| |
In the normal course of business, each Fund invests in securities or other instruments and may enter into certain transactions, and such activities subject the Fund to various risks, including, among others, fluctuations in the market (market risk) or failure of an issuer to meet all of its obligations. The value of securities or other instruments may also be affected by various factors, including, without limitation: (i) the general economy; (ii) the overall market as well as local, regional or global political and/or social instability;
| | |
| 54 | | 2 0 2 3 I S H A R E S A N N U A L R E P O R T T O S H A R E H O L D E R S |
Notes to Financial Statements (continued)
(iii) regulation, taxation or international tax treaties between various countries; or (iv) currency, interest rate or price fluctuations. Local, regional or global events such as war, acts of terrorism, the spread of infectious illness or other public health issues, recessions, or other events could have a significant impact on the Funds and their investments. Each Fund’s prospectus provides details of the risks to which the Fund is subject.
BFA uses a “passive” or index approach to try to achieve each Fund’s investment objective following the securities included in its underlying index during upturns as well as downturns. BFA does not take steps to reduce market exposure or to lessen the effects of a declining market. Divergence from the underlying index and the composition of the portfolio is monitored by BFA.
The Funds may be exposed to additional risks when reinvesting cash collateral in money market funds that do not seek to maintain a stable NAV per share of $1.00, which may be subject to redemption gates or liquidity fees under certain circumstances.
Infectious Illness Risk: An outbreak of an infectious illness, such as the COVID-19 pandemic, may adversely impact the economies of many nations and the global economy, and may impact individual issuers and capital markets in ways that cannot be foreseen. An infectious illness outbreak may result in, among other things, closed international borders, prolonged quarantines, supply chain disruptions, market volatility or disruptions and other significant economic, social and political impacts.
Valuation Risk: The market values of equities, such as common stocks and preferred securities or equity related investments, such as futures and options, may decline due to general market conditions which are not specifically related to a particular company. They may also decline due to factors which affect a particular industry or industries. A fund may invest in illiquid investments. An illiquid investment is any investment that a fund reasonably expects cannot be sold or disposed of in current market conditions in seven calendar days or less without the sale or disposition significantly changing the market value of the investment. A fund may experience difficulty in selling illiquid investments in a timely manner at the price that it believes the investments are worth. Prices may fluctuate widely over short or extended periods in response to company, market or economic news. Markets also tend to move in cycles, with periods of rising and falling prices. This volatility may cause a fund’s NAV to experience significant increases or decreases over short periods of time. If there is a general decline in the securities and other markets, the NAV of a fund may lose value, regardless of the individual results of the securities and other instruments in which a fund invests.
The price each Fund could receive upon the sale of any particular portfolio investment may differ from each Fund’s valuation of the investment, particularly for securities that trade in thin or volatile markets or that are valued using a fair valuation technique or a price provided by an independent pricing service. Changes to significant unobservable inputs and assumptions (i.e., publicly traded company multiples, growth rate, time to exit) due to the lack of observable inputs.
Counterparty Credit Risk: The Funds may be exposed to counterparty credit risk, or the risk that an entity may fail to or be unable to perform on its commitments related to unsettled or open transactions, including making timely interest and/or principal payments or otherwise honoring its obligations. The Funds manage counterparty credit risk by entering into transactions only with counterparties that BFA believes have the financial resources to honor their obligations and by monitoring the financial stability of those counterparties. Financial assets, which potentially expose the Funds to market, issuer and counterparty credit risks, consist principally of financial instruments and receivables due from counterparties. The extent of the Funds’ exposure to market, issuer and counterparty credit risks with respect to these financial assets is approximately their value recorded in the Statements of Assets and Liabilities, less any collateral held by the Funds.
A derivative contract may suffer a mark-to-market loss if the value of the contract decreases due to an unfavorable change in the market rates or values of the underlying instrument. Losses can also occur if the counterparty does not perform under the contract.
With exchange-traded futures, there is less counterparty credit risk to the Funds since the exchange or clearinghouse, as counterparty to such instruments, guarantees against a possible default. The clearinghouse stands between the buyer and the seller of the contract; therefore, credit risk is limited to failure of the clearinghouse. While offset rights may exist under applicable law, a Fund does not have a contractual right of offset against a clearing broker or clearinghouse in the event of a default (including the bankruptcy or insolvency). Additionally, credit risk exists in exchange-traded futures with respect to initial and variation margin that is held in a clearing broker’s customer accounts. While clearing brokers are required to segregate customer margin from their own assets, in the event that a clearing broker becomes insolvent or goes into bankruptcy and at that time there is a shortfall in the aggregate amount of margin held by the clearing broker for all its clients, typically the shortfall would be allocated on a pro rata basis across all the clearing broker’s customers, potentially resulting in losses to the Funds.
Concentration Risk: A diversified portfolio, where this is appropriate and consistent with a fund’s objectives, minimizes the risk that a price change of a particular investment will have a material impact on the NAV of a fund. The investment concentrations within each Fund’s portfolio are disclosed in its Schedule of Investments.
Significant Shareholder Redemption Risk: Certain shareholders may own or manage a substantial amount of fund shares and/or hold their fund investments for a limited period of time. Large redemptions of fund shares by these shareholders may force a fund to sell portfolio securities, which may negatively impact the fund’s NAV, increase the fund’s brokerage costs, and/or accelerate the realization of taxable income/gains and cause the fund to make additional taxable distributions to shareholders.
| 10. | CAPITAL SHARE TRANSACTIONS |
Capital shares are issued and redeemed by each Fund only in aggregations of a specified number of shares or multiples thereof (“Creation Units”) at NAV. Except when aggregated in Creation Units, shares of each Fund are not redeemable.
| | |
N O T E S T O F I N A N C I A L S T A T E M E N T S | | 55 |
Notes to Financial Statements (continued)
Transactions in capital shares were as follows:
| | | | | | | | | | | | | | | | |
| |
| | |
| | | Year Ended 03/31/23 | | | Year Ended 03/31/22 | |
| | | | | | | | |
| | | | |
| iShares ETF | | Shares | | | Amount | | | Shares | | | Amount | |
| |
| | | | |
Russell 3000 | | | | | | | | | | | | | | | | |
| | | | |
Shares sold | | | 6,250,000 | | | $ | 1,412,201,639 | | | | 5,400,000 | | | $ | 1,415,391,570 | |
| | | | |
Shares redeemed | | | (6,550,000 | ) | | | (1,528,884,323 | ) | | | (5,750,000 | ) | | | (1,500,054,950 | ) |
| | | | | | | | | | | | | | | | |
| | | | |
| | | (300,000 | ) | | $ | (116,682,684 | ) | | | (350,000 | ) | | $ | (84,663,380 | ) |
| | | | | | | | | | | | | | | | |
| | | | |
| | | | | | | | | | | | | | | | |
| | | | |
Russell Mid-Cap Value | | | | | | | | | | | | | | | | |
| | | | |
Shares sold | | | 25,450,000 | | | $ | 2,683,741,714 | | | | 16,200,000 | | | $ | 1,882,610,327 | |
| | | | |
Shares redeemed | | | (30,800,000 | ) | | | (3,320,809,098 | ) | | | (11,700,000 | ) | | | (1,355,436,372 | ) |
| | | | | | | | | | | | | | | | |
| | | | |
| | | (5,350,000 | ) | | $ | (637,067,384 | ) | | | 4,500,000 | | | $ | 527,173,955 | |
| | | | | | | | | | | | | | | | |
The consideration for the purchase of Creation Units of a fund in the Trust generally consists of the in-kind deposit of a designated portfolio of securities and a specified amount of cash. Certain funds in the Trust may be offered in Creation Units solely or partially for cash in U.S. dollars. Investors purchasing and redeeming Creation Units may pay a purchase transaction fee and a redemption transaction fee directly to BRIL, to offset transfer and other transaction costs associated with the issuance and redemption of Creation Units, including Creation Units for cash. Investors transacting in Creation Units for cash may also pay an additional variable charge to compensate the relevant fund for certain transaction costs (i.e., stamp taxes, taxes on currency or other financial transactions, and brokerage costs) and market impact expenses relating to investing in portfolio securities. Such variable charges, if any, are included in shares sold in the table above.
From time to time, settlement of securities related to in-kind contributions or in-kind redemptions may be delayed. In such cases, securities related to in-kind transactions are reflected as a receivable or a payable in the Statements of Assets and Liabilities.
Management has evaluated the impact of all subsequent events on the Funds through the date the financial statements were available to be issued and has determined that there were no subsequent events requiring adjustment or additional disclosure in the financial statements.
| | |
| 56 | | 2 0 2 3 I S H A R E S A N N U A L R E P O R T T O S H A R E H O L D E R S |
Report of Independent Registered Public Accounting Firm
To the Board of Trustees of
iShares Trust and Shareholders of each of the two funds listed in the table below
Opinions on the Financial Statements
We have audited the accompanying statements of assets and liabilities, including the schedules of investments, of each of the funds listed in the table below (two of the funds constituting iShares Trust, hereafter collectively referred to as the “Funds”) as of March 31, 2023, the related statements of operations for the year ended March 31, 2023, the statements of changes in net assets for each of the two years in the period ended March 31, 2023, including the related notes, and the financial highlights for each of the five years in the period ended March 31, 2023 (collectively referred to as the “financial statements”). In our opinion, the financial statements present fairly, in all material respects, the financial position of each of the Funds as of March 31, 2023, the results of each of their operations for the year then ended, the changes in each of their net assets for each of the two years in the period ended March 31, 2023 and each of the financial highlights for each of the five years in the period ended March 31, 2023 in conformity with accounting principles generally accepted in the United States of America.
|
| |
iShares Russell 3000 ETF |
| |
iShares Russell Mid-Cap Value ETF |
Basis for Opinions
These financial statements are the responsibility of the Funds’ management. Our responsibility is to express an opinion on the Funds’ financial statements based on our audits. We are a public accounting firm registered with the Public Company Accounting Oversight Board (United States) (PCAOB) and are required to be independent with respect to the Funds in accordance with the U.S. federal securities laws and the applicable rules and regulations of the Securities and Exchange Commission and the PCAOB.
We conducted our audits of these financial statements in accordance with the standards of the PCAOB. Those standards require that we plan and perform the audit to obtain reasonable assurance about whether the financial statements are free of material misstatement, whether due to error or fraud.
Our audits included performing procedures to assess the risks of material misstatement of the financial statements, whether due to error or fraud, and performing procedures that respond to those risks. Such procedures included examining, on a test basis, evidence regarding the amounts and disclosures in the financial statements. Our audits also included evaluating the accounting principles used and significant estimates made by management, as well as evaluating the overall presentation of the financial statements. Our procedures included confirmation of securities owned as of March 31, 2023 by correspondence with the custodian, transfer agent and brokers; when replies were not received from brokers, we performed other auditing procedures. We believe that our audits provide a reasonable basis for our opinions.
/s/PricewaterhouseCoopers LLP
Philadelphia, Pennsylvania
May 25, 2023
We have served as the auditor of one or more BlackRock investment companies since 2000.
| | |
R E P O R T O F I N D E P E N D E N T R E G I S T E R E D P U B L I C A C C O U N T I N G F I R M | | 57 |
Important Tax Information (unaudited)
The following amounts, or maximum amounts allowable by law, are hereby designated as qualified dividend income for individuals for the fiscal year ended March 31, 2023:
| | | | |
| | |
| iShares ETF | | Qualified Dividend
Income | |
| |
Russell 3000 | | $ | 162,979,049 | |
| |
Russell Mid-Cap Value | | | 220,481,463 | |
The following amounts, or maximum amounts allowable by law, are hereby designated as qualified business income for individuals for the fiscal year ended March 31, 2023:
| | | | |
| | |
| iShares ETF | | Qualified Business
Income | |
| |
Russell 3000 | | $ | 6,142,551 | |
| |
Russell Mid-Cap Value | | | 24,635,138 | |
The following percentages or maximum percentages allowable by law, of ordinary income distributions paid during the fiscal year ended March 31, 2023 qualified for the dividends-received deduction for corporate shareholders:
| | | | |
| | |
| iShares ETF | | Dividends-Received
Deduction | |
| |
Russell 3000 | | | 100.00 | % |
Russell Mid-Cap Value | | | 83.65 | |
| | |
| 58 | | 2 0 2 3 I S H A R E S A N N U A L R E P O R T T O S H A R E H O L D E R S |
Statement Regarding Liquidity Risk Management Program
In compliance with Rule 22e-4 under the Investment Company Act of 1940, as amended (the “Liquidity Rule”), iShares Trust (the “Trust”) has adopted and implemented a liquidity risk management program (the “Program”) for iShares Russell 3000 ETF and iShares Russell Mid-Cap Value ETF (the “Funds” or “ETFs”), each a series of the Trust, which is reasonably designed to assess and manage each Fund’s liquidity risk.
The Board of Trustees (the “Board”) of the Trust, on behalf of the Funds, met on December 9, 2022 (the “Meeting”) to review the Program. The Board previously appointed BlackRock Fund Advisors (“BlackRock”), the investment adviser to the Funds, as the program administrator for each Fund’s Program. BlackRock also previously delegated oversight of the Program to the 40 Act Liquidity Risk Management Committee (the “Committee”). At the Meeting, the Committee, on behalf of BlackRock, provided the Board with a report that addressed the operation of the Program and assessed its adequacy and effectiveness of implementation, including the management of each Fund’s Highly Liquid Investment Minimum (“HLIM”) where applicable, and any material changes to the Program (the “Report”). The Report covered the period from October 1, 2021 through September 30, 2022 (the “Program Reporting Period”).).
The Report described the Program’s liquidity classification methodology for categorizing each Fund’s investments (including derivative transactions) into one of four liquidity buckets. It also referenced the methodology used by BlackRock to establish each Fund’s HLIM and noted that the Committee reviews and ratifies the HLIM assigned to each Fund no less frequently than annually. The Report also discussed notable events affecting liquidity over the Program Reporting Period, including extended market holidays, the imposition of capital controls in certain non-U.S. countries, Russian sanctions and the closure of the Russian securities market.
The Report noted that the Program complied with the key factors for consideration under the Liquidity Rule for assessing, managing and periodically reviewing each Fund’s liquidity risk, as follows:
| | a) | | The Fund’s investment strategy and liquidity of portfolio investments during both normal and reasonably foreseeable stressed conditions. During the Program Reporting Period, the Committee reviewed whether each Fund’s strategy is appropriate for an open-end fund structure, with a focus on funds with more significant and consistent holdings of less liquid and illiquid assets. The Committee also factored a fund’s concentration in an issuer into the liquidity classification methodology by taking issuer position sizes into account. Derivative exposure was also considered in the calculation of a fund’s liquidity bucketing. Finally, a factor for consideration under the Liquidity Rule is a Fund’s use of borrowings for investment purposes. However, the Funds do not borrow for investment purposes. |
| | b) | | Short-term and long-term cash flow projections during both normal and reasonably foreseeable stressed conditions. During the Program Reporting Period, the Committee reviewed historical redemption activity and used this information as a component to establish each ETF’s reasonably anticipated trading size (“RATS”). The Committee may also take into consideration a fund’s shareholder ownership concentration (which, depending on product type and distribution channel, may or may not be available), a fund’s distribution channels, and the degree of certainty associated with a fund’s short-term and long-term cash flow projections. |
| | c) | | Holdings of cash and cash equivalents, as well as borrowing arrangements. The Committee considered that ETFs generally do not hold more than de minimis amounts of cash. The Committee also considered that ETFs generally do not engage in borrowing. |
| | d) | | The relationship between an ETF’s portfolio liquidity and the way in which, and the prices and spreads at which, ETF shares trade, including the efficiency of the arbitrage function and the level of active participation by market participants, including authorized participants. The Committee monitored the prevailing bid/ask spread and the ETF price premium (or discount) to NAV for all ETFs. However, there were no ETFs with persistent deviations of fund premium/discount or bid/ask spreads from long-term averages over the Program Reporting Period. |
| | e) | | The effect of the composition of baskets on the overall liquidity of an ETF’s portfolio. In reviewing the linkage between the composition of custom baskets accepted by an ETF and any significant change in the liquidity profile of such ETF, the Committee reviewed changes in the proportion of each ETF’s portfolio comprised of less liquid and illiquid holdings to determine if applicable thresholds were met requiring enhanced review. |
There were no material changes to the Program during the Program Reporting Period other than the enhancement of certain model components in the Program’s classification methodology. The Report provided to the Board stated that the Committee concluded that based on the operation of the functions, as described in the Report, the Program is operating as intended and is effective in implementing the requirements of the Liquidity Rule
| | |
S T A T E M E N T R E G A R D I N G L I Q U I D I T Y R I S K M A N A G E M E N T P R O G R A M | | 59 |
Supplemental Information (unaudited)
Section 19(a) Notices
The amounts and sources of distributions reported are estimates and are being provided pursuant to regulatory requirements and are not being provided for tax reporting purposes. The actual amounts and sources for tax reporting purposes will depend upon each Fund’s investment experience during the year and may be subject to changes based on tax regulations. Shareholders will receive a Form 1099-DIV each calendar year that will inform them how to report these distributions for federal income tax purposes.
March 31, 2023
| | | | | | | | | | | | | | | | | | | | | | | | | | | | | | | | |
| | | |
| | | Total Cumulative Distributions for the Fiscal Year-to-Date | | | % Breakdown of the Total Cumulative Distributions for the Fiscal Year-to-Date | |
| | | | | | | | |
| | | | | | | | |
| iShares ETF | | Net
Investment
Income | | | Net Realized
Capital Gains | | | Return of
Capital | | | Total Per
Share | | | Net
Investment
Income | | | Net Realized
Capital Gains | | | Return of
Capital | | | Total Per
Share | |
| | | | | | | | |
Russell 3000(a) | | $ | 3.416108 | | | $ | — | | | $ | 0.096410 | | | $ | 3.512518 | | | | 97 | % | | | — | % | | | 3 | % | | | 100 | % |
Russell Mid-Cap Value | | | 2.069501 | | | | — | | | | — | | | | 2.069501 | | | | 100 | | | | — | | | | — | | | | 100 | |
| (a) | The Fund estimates that it has distributed more than its net investment income and net realized capital gains; therefore, a portion of the distribution may be a return of capital. A return of capital may occur, for example, when some or all of the shareholder’s investment in the Fund is returned to the shareholder. A return of capital does not necessarily reflect the Fund’s investment performance and should not be confused with “yield” or “income”. When distributions exceed total return performance, the difference will incrementally reduce the Fund’s net asset value per share. | |
Premium/Discount Information
Information on the Fund’s net asset value, market price, premiums and discounts, and bid-ask spreads can be found at iShares.com.
Regulation under the Alternative Investment Fund Managers Directive
The Alternative Investment Fund Managers Directive, and its United Kingdom (“UK”) equivalent, ( “AIFMD”) impose detailed and prescriptive obligations on fund managers established in the European Union (the “EU”) and the UK. These do not currently apply to managers established outside of the EU or UK, such as BFA (the “Company”). Rather, the Company is only required to comply with certain disclosure, reporting and transparency obligations of AIFMD because it has registered the iShares Russell 3000 ETF (the “Fund”) to be marketed to investors in the EU and/or UK.
Report on Remuneration
The Company is required under AIFMD to make quantitative disclosures of remuneration. These disclosures are made in line with BlackRock’s interpretation of currently available regulatory guidance on quantitative remuneration disclosures. As market or regulatory practice develops BlackRock may consider it appropriate to make changes to the way in which quantitative remuneration disclosures are calculated. Where such changes are made, this may result in disclosures in relation to a fund not being comparable to the disclosures made in the prior year, or in relation to other BlackRock fund disclosures in that same year.
Disclosures are provided in relation to (a) the staff of the Company; (b) staff who are senior management; and (c) staff who have the ability to materially affect the risk profile of the Fund.
All individuals included in the aggregated figures disclosed are rewarded in line with BlackRock’s remuneration policy for their responsibilities across the relevant BlackRock business area. As all individuals have a number of areas of responsibilities, only the portion of remuneration for those individuals’ services attributable to the Fund is included in the aggregate figures disclosed.
BlackRock has a clear and well-defined pay-for-performance philosophy, and compensation programs which support that philosophy.
BlackRock operates a total compensation model for remuneration which includes a base salary, which is contractual, and a discretionary bonus scheme. Although all employees are eligible to receive a discretionary bonus, there is no contractual obligation to make a discretionary bonus award to any employees. For senior management and staff who have the ability to materially affect the risk profile of the Fund, a significant percentage of variable remuneration is deferred over time. All employees are subject to a clawback policy.
Remuneration decisions for employees are made once annually in January following the end of the performance year, based on BlackRock’s full-year financial results and other non-financial goals and objectives. Alongside financial performance, individual total compensation is also based on strategic and operating results and other considerations such as management and leadership capabilities. No set formulas are established and no fixed benchmarks are used in determining annual incentive awards.
Annual incentive awards are paid from a bonus pool which is reviewed throughout the year by BlackRock’s independent compensation committee, taking into account both actual and projected financial information together with information provided by the Enterprise Risk and Regulatory Compliance departments in relation to any activities, incidents or events that warrant consideration in making compensation decisions. Individuals are not involved in setting their own remuneration.
| | |
| 60 | | 2 0 2 3 I S H A R E S A N N U A L R E P O R T T O S H A R E H O L D E R S |
Supplemental Information (unaudited)
Each of the control functions (Enterprise Risk, Legal & Compliance, and Internal Audit) each have their own organizational structures which are independent of the business units and therefore staff members in control functions are remunerated independently of the businesses they oversee. Functional bonus pools for those control functions are determined with reference to the performance of each individual function and the remuneration of the senior members of control functions is directly overseen by BlackRock’s independent remuneration committee.
Members of staff and senior management of the Company typically provide both AIFMD and non-AIFMD related services in respect of multiple funds, clients and functions of the Company and across the broader BlackRock group. Conversely, members of staff and senior management of the broader BlackRock group may provide both AIFMD and non-AIFMD related services in respect of multiple funds, clients and functions of the broader BlackRock group and of the Company. Therefore, the figures disclosed are a sum of individuals’ portion of remuneration attributable to the Company according to an objective apportionment methodology which acknowledges the multiple-service nature of the Company and the broader BlackRock group. Accordingly, the figures are not representative of any individual’s actual remuneration or their remuneration structure.
The amount of the total remuneration awarded to the Company’s staff in respect of the Company’s financial year ending December 31, 2022 was USD 4,121 million. This figure is comprised of fixed remuneration of USD 685 million and variable remuneration of USD 3,436 million. There was a total of 8 beneficiaries of the remuneration described above.
The amount of the aggregate remuneration awarded by the Company in respect of the Company’s financial year ending December 31, 2022, to its senior management was USD 2,958 million, and to other members of its staff whose actions potentially have a material impact on the risk profile of the Company or its funds was USD 970 million. These figures relate to the entire Company and not to the Fund.
Disclosures Under the EU Sustainable Finance Disclosure Regulation
iShares Russell 3000 ETF is registered under the Alternative Investment Fund Managers Directive to be marketed to European Union (“EU”) investors, as noted above. As a result, certain disclosures are required under the EU Sustainable Finance Disclosure Regulation (“SFDR”).
iShares Russell 3000 ETF has not been categorized under the SFDR as an “Article 8” or “Article 9” product. In addition, the Fund’s investment strategy does not take into account the criteria for environmentally sustainable economic activities under the EU sustainable investment taxonomy regulation or principal adverse impacts (“PAIs”) on sustainability factors under the SFDR. PAIs are identified under the SFDR as the material impacts of investment decisions on sustainability factors relating to environmental, social and employee matters, respect for human rights, and anti-corruption and anti-bribery matters.
| | |
SUPPLEMENTAL INFORMATION | | 61 |
Trustee and Officer Information
The Board of Trustees has responsibility for the overall management and operations of the Funds, including general supervision of the duties performed by BFA and other service providers. Each Trustee serves until he or she resigns, is removed, dies, retires or becomes incapacitated. Each officer shall hold office until his or her successor is elected and qualifies or until his or her death, resignation or removal. Trustees who are not “interested persons” (as defined in the 1940 Act) of the Trust are referred to as independent trustees (“Independent Trustees”).
The registered investment companies advised by BFA or its affiliates (the “BlackRock-advised Funds”) are organized into one complex of open-end equity, multi-asset, index and money market funds and ETFs (the “BlackRock Multi-Asset Complex”), one complex of closed-end funds and open-end non-index fixed-income funds (including ETFs) (the “BlackRock Fixed-Income Complex”) and one complex of ETFs (“Exchange-Traded Fund Complex”) (each, a “BlackRock Fund Complex”). Each Fund is included in the Exchange-Traded Fund Complex. Each Trustee also serves as a Director of iShares, Inc. and a Trustee of iShares U.S. ETF Trust and, as a result, oversees all of the funds within the Exchange-Traded Fund Complex, which consists of 380 funds as of March 31, 2023. With the exception of Robert S. Kapito, Salim Ramji and Charles Park, the address of each Trustee and officer is c/o BlackRock, Inc., 400 Howard Street, San Francisco, CA 94105. The address of Mr. Kapito, Mr. Ramji and Mr. Park is c/o BlackRock, Inc., 50 Hudson Yards, New York, NY 10001. The Board has designated John E. Kerrigan as its Independent Board Chair. Additional information about the Funds’ Trustees and officers may be found in the Funds’ combined Statement of Additional Information, which is available without charge, upon request, by calling toll-free 1-800-iShares (1-800-474-2737).
| | | | | | |
| Interested Trustees |
| | | | |
Name (Year of
Birth) | | Position(s) | | Principal Occupation(s) During Past 5 Years | | Other Directorships Held by Trustee |
| | | |
Robert S. Kapito(a) (1957) | | Trustee (since 2009). | | President, BlackRock, Inc. (since 2006); Vice Chairman of BlackRock, Inc. and Head of BlackRock’s Portfolio Management Group (since its formation in 1998) and BlackRock, Inc.’s predecessor entities (since 1988); Trustee, University of Pennsylvania (since 2009); President of Board of Directors, Hope & Heroes Children’s Cancer Fund (since 2002). | | Director of BlackRock, Inc. (since 2006); Director of iShares, Inc. (since 2009); Trustee of iShares U.S. ETF Trust (since 2011). |
| | | |
Salim Ramji(b) (1970) | | Trustee (since 2019). | | Senior Managing Director, BlackRock, Inc. (since 2014); Global Head of BlackRock’s ETF and Index Investments Business (since 2019); Head of BlackRock’s U.S. Wealth Advisory Business (2015-2019); Global Head of Corporate Strategy, BlackRock, Inc. (2014-2015); Senior Partner, McKinsey & Company (2010-2014). | | Director of iShares, Inc. (since 2019); Trustee of iShares U.S. ETF Trust (since 2019). |
|
(a) Robert S. Kapito is deemed to be an “interested person” (as defined in the 1940 Act) of the Trust due to his affiliations with BlackRock, Inc. and its affiliates. (b) Salim Ramji is deemed to be an “interested person” (as defined in the 1940 Act) of the Trust due to his affiliations with BlackRock, Inc. and its affiliates. |
|
| Independent Trustees |
| | | | |
Name (Year of
Birth) | | Position(s) | | Principal Occupation(s) During Past 5 Years | | Other Directorships Held by Trustee |
| | | |
John E.
Kerrigan (1955) | | Trustee (since 2005); Independent Board Chair (since 2022). | | Chief Investment Officer, Santa Clara University (since 2002). | | Director of iShares, Inc. (since 2005); Trustee of iShares U.S. ETF Trust (since 2011); Independent Board Chair of iShares, Inc. and iShares U.S. ETF Trust (since 2022). |
| | | |
Jane D.
Carlin (1956) | | Trustee (since 2015); Risk Committee Chair (since 2016). | | Consultant (since 2012); Member of the Audit Committee (2012-2018), Chair of the Nominating and Governance Committee (2017-2018) and Director of PHH Corporation (mortgage solutions) (2012-2018); Managing Director and Global Head of Financial Holding Company Governance & Assurance and the Global Head of Operational Risk Management of Morgan Stanley (2006-2012). | | Director of iShares, Inc. (since 2015); Trustee of iShares U.S. ETF Trust (since 2015); Member of the Audit Committee (since 2016), Chair of the Audit Committee (since 2020) and Director of The Hanover Insurance Group, Inc. (since 2016). |
| | | |
Richard L.
Fagnani (1954) | | Trustee (since 2017); Audit Committee Chair (since 2019). | | Partner, KPMG LLP (2002-2016); Director of One Generation Away (since 2021). | | Director of iShares, Inc. (since 2017); Trustee of iShares U.S. ETF Trust (since 2017). |
| | |
| 62 | | 2 0 2 3 I S H A R E S A N N U A L R E P O R T T O S H A R E H O L D E R S |
Trustee and Officer Information (continued)
| | | | | | |
| Independent Trustees |
| | | | |
Name (Year of
Birth) | | Position(s) | | Principal Occupation(s) During Past 5 Years | | Other Directorships Held by Trustee |
| | | |
Cecilia H.
Herbert (1949) | | Trustee (since 2005); Nominating and Governance and Equity Plus Committee Chairs (since 2022). | | Chair of the Finance Committee (since 2019) and Trustee and Member of the Finance, Audit and Quality Committees of Stanford Health Care (since 2016); Trustee of WNET, New York’s public media company (since 2011) and Member of the Audit Committee (since 2018), Investment Committee (since 2011) and Personnel Committee (since 2022); Chair (1994-2005) and Member (1992-2021) of the Investment Committee, Archdiocese of San Francisco; Trustee of Forward Funds (14 portfolios) (2009-2018); Trustee of Salient MF Trust (4 portfolios) (2015- 2018); Director (1998-2013) and President (2007-2011) of the Board of Directors, Catholic Charities CYO; Trustee (2002-2011) and Chair of the Finance and Investment Committee (2006-2010) of the Thacher School; Director of the Senior Center of Jackson Hole (since 2020); Director of the Jackson Hole Center for the Arts (since 2021); Member of the Wyoming State Investment Funds Committee (since 2022). | | Director of iShares, Inc. (since 2005); Trustee of iShares U.S. ETF Trust (since 2011). |
| | | |
Drew E.
Lawton (1959) | | Trustee (since 2017); 15(c) Committee Chair (since 2017). | | Senior Managing Director of New York Life Insurance Company (2010-2015). | | Director of iShares, Inc. (since 2017); Trustee of iShares U.S. ETF Trust (since 2017); Director of Jackson Financial Inc. (since 2021). |
| | | |
John E.
Martinez (1961) | | Trustee (since 2003); Securities Lending Committee Chair (since 2019). | | Director of Real Estate Equity Exchange, Inc. (since 2005); Director of Cloudera Foundation (2017-2020); and Director of Reading Partners (2012-2016). | | Director of iShares, Inc. (since 2003); Trustee of iShares U.S. ETF Trust (since 2011). |
| | | |
Madhav V.
Rajan (1964) | | Trustee (since 2011); Fixed Income Plus Committee Chair (since 2019). | | Dean, and George Pratt Shultz Professor of Accounting, University of Chicago Booth School of Business (since 2017); Advisory Board Member (since 2016) and Director (since 2020) of C.M. Capital Corporation; Chair of the Board for the Center for Research in Security Prices, LLC (since 2020); Robert K. Jaedicke Professor of Accounting, Stanford University Graduate School of Business (2001-2017); Professor of Law (by courtesy), Stanford Law School (2005-2017); Senior Associate Dean for Academic Affairs and Head of MBA Program, Stanford University Graduate School of Business (2010-2016). | | Director of iShares, Inc. (since 2011); Trustee of iShares U.S. ETF Trust (since 2011). |
| | |
T R U S T E E A N D O F F I C E R I N F O R M A T I O N | | 63 |
Trustee and Officer Information (continued)
| | | | | | |
|
| Officers |
| | | |
Name (Year of
Birth) | | Position(s) | | Principal Occupation(s) During Past 5 Years |
| | |
Dominik Rohé (1973) | | President (since 2023). | | Managing Director, BlackRock, Inc. (since 2005); Head of Americas ETF and Index Investments (since 2023); Head of Latin America (2019-2023). |
| | |
Trent Walker (1974) | | Treasurer and Chief Financial Officer (since 2020). | | Managing Director, BlackRock, Inc. (since September 2019); Chief Financial Officer of iShares Delaware Trust Sponsor LLC, BlackRock Funds, BlackRock Funds II, BlackRock Funds IV, BlackRock Funds V and BlackRock Funds VI (since 2021); Executive Vice President of PIMCO (2016-2019); Senior Vice President of PIMCO (2008-2015); Treasurer (2013-2019) and Assistant Treasurer (2007-2017) of PIMCO Funds, PIMCO Variable Insurance Trust, PIMCO ETF Trust, PIMCO Equity Series, PIMCO Equity Series VIT, PIMCO Managed Accounts Trust, 2 PIMCO-sponsored interval funds and 21 PIMCO-sponsored closed-end funds. |
| | |
Charles Park (1967) | | Chief Compliance Officer (since 2006). | | Chief Compliance Officer of BlackRock Advisors, LLC and the BlackRock-advised Funds in the BlackRock Multi-Asset Complex and the BlackRock Fixed-Income Complex (since 2014); Chief Compliance Officer of BFA (since 2006). |
| | |
Marisa Rolland (1980) | | Secretary (since 2022). | | Managing Director, BlackRock, Inc. (since 2023); Director, BlackRock, Inc. (2018-2022); Vice President, BlackRock, Inc. (2010-2017). |
| | |
Rachel Aguirre (1982) | | Executive Vice President (since 2022). | | Managing Director, BlackRock, Inc. (since 2018); Director, BlackRock, Inc. (2009-2018); Head of U.S. iShares Product (since 2022); Head of EII U.S. Product Engineering (since 2021); Co-Head of EII’s Americas Portfolio Engineering (2020-2021); Head of Developed Markets Portfolio Engineering (2016-2019). |
| | |
Jennifer Hsui (1976) | | Executive Vice President (since 2022). | | Managing Director, BlackRock, Inc. (since 2009); Co-Head of Index Equity (since 2022). |
| | |
James Mauro (1970) | | Executive Vice President (since 2022). | | Managing Director, BlackRock, Inc. (since 2010); Head of Fixed Income Index Investments in the Americas and Head of San Francisco Core Portfolio Management (since 2020). |
Effective June 15, 2022, Marisa Rolland replaced Deepa Damre Smith as Secretary.
Effective March 30, 2023, Dominik Rohé replaced Armando Senra as President.
| | |
| 64 | | 2 0 2 3 I S H A R E S A N N U A L R E P O R T T O S H A R E H O L D E R S |
General Information
Electronic Delivery
Shareholders can sign up for e-mail notifications announcing that the shareholder report or prospectus has been posted on the iShares website at iShares.com. Once you have enrolled, you will no longer receive prospectuses and shareholder reports in the mail.
To enroll in electronic delivery:
| | • | | If your brokerage firm is not listed, electronic delivery may not be available. Please contact your broker-dealer or financial advisor. |
Householding
Householding is an option available to certain fund investors. Householding is a method of delivery, based on the preference of the individual investor, in which a single copy of certain shareholder documents and Rule 30e-3 notices can be delivered to investors who share the same address, even if their accounts are registered under different names. Please contact your broker-dealer if you are interested in enrolling in householding and receiving a single copy of prospectuses and other shareholder documents, or if you are currently enrolled in householding and wish to change your householding status.
Availability of Quarterly Schedule of Investments
The Funds file their complete schedule of portfolio holdings with the SEC for the first and third quarters of each fiscal year as an exhibit to their reports on Form N-PORT. The Funds’ Forms N-PORT are available on the SEC’s website at sec.gov. Additionally, each Fund makes its portfolio holdings for the first and third quarters of each fiscal year available at iShares.com/fundreports.
Availability of Proxy Voting Policies and Proxy Voting Records
A description of the policies and procedures that the iShares Funds use to determine how to vote proxies relating to portfolio securities and information about how the iShares Funds voted proxies relating to portfolio securities during the most recent twelve-month period ending June 30 is available without charge, upon request (1) by calling toll-free 1-800-474-2737; (2) on the iShares website at iShares.com; and (3) on the SEC website at sec.gov.
A description of the Trust’s policies and procedures with respect to the disclosure of the Fund’s portfolio securities is available in the Fund Prospectus. The Fund discloses its portfolio holdings daily and provides information regarding its top holdings in Fund fact sheets at iShares.com.
| | |
G E N E R A L I N F O R M A T I O N | | 65 |
Glossary of Terms Used in this Report
| | |
| |
| CVR | | Contingent Value Rights |
| |
| NVS | | Non-Voting Shares |
| |
| REIT | | Real Estate Investment Trust |
| |
| S&P | | Standard & Poor’s |
| | |
| 66 | | 2 0 2 3 I S H A R E S A N N U A L R E P O R T T O S H A R E H O L D E R S |
THIS PAGE INTENTIONALLY LEFT BLANK.
Want to know more?
iShares.com | 1-800-474-2737
This report is intended for the Funds’ shareholders. It may not be distributed to prospective investors unless it is preceded or accompanied by the current prospectus.
Investing involves risk, including possible loss of principal.
The iShares Funds are distributed by BlackRock Investments, LLC (together with its affiliates, “BlackRock”).
The iShares Funds are not sponsored, endorsed, issued, sold or promoted by FTSE Russell, nor does this company make any representation regarding the advisability of investing in the iShares Funds. BlackRock is not affiliated with the company listed above.
©2022 BlackRock, Inc. All rights reserved. iSHARES and BLACKROCK are registered trademarks of BlackRock, Inc. or its subsidiaries. All other marks are the property of their respective owners.
iS-AR-306-0323
| | |
 | | MARCH 31, 2023 |
iShares Trust
| · | | iShares Mortgage Real Estate ETF | REM | Cboe BZX |
| · | | iShares Residential and Multisector Real Estate ETF | REZ | NYSE Arca |
The Markets in Review
Dear Shareholder,
Significant economic headwinds emerged during the 12-month reporting period ended March 31, 2023, as investors navigated changing economic conditions and volatile markets. The U.S. economy shrank in the first half of 2022 before returning to modest growth in the second half of the year, marking a shift to a more challenging post-reopening economic environment. Changes in consumer spending patterns and a tight labor market led to elevated inflation, which reached a 40-year high before beginning to moderate.
Equity prices fell as interest rates rose, particularly during the first half of the reporting period. Both large- and small-capitalization U.S. stocks declined, although equities began to recover in the second half of the period as inflation eased and economic growth resumed. Emerging market stocks and international equities from developed markets declined overall, pressured by rising interest rates and volatile commodities prices.
The 10-year U.S. Treasury yield rose during the reporting period, driving its price down, as investors reacted to fluctuating inflation data and attempted to anticipate its impact on future interest rate changes. The corporate bond market also faced inflationary headwinds, and higher interest rates led to rising borrowing costs for corporate issuers.
The U.S. Federal Reserve (the “Fed”), acknowledging that inflation has been more persistent than expected, raised interest rates eight times. Furthermore, the Fed wound down its bond-buying programs and accelerated the reduction of its balance sheet.
Restricted labor supply kept inflation elevated even as other inflation drivers, such as goods prices and energy costs, moderated. While economic growth slowed in the last year, we believe that taming inflation requires a more substantial decline that lowers demand to a level more in line with the economy’s productive capacity. Although the Fed has decelerated the pace of interest rate hikes, we believe that it still seems determined to get inflation back to target. With this in mind, we believe the possibility of a U.S. recession in the near-term is high, but the dimming economic outlook has not yet been fully reflected in current market prices. We believe investors should expect a period of higher volatility as markets adjust to the new economic reality and policymakers attempt to adapt to rapidly changing conditions. Turmoil in the banking sector late in the period highlighted the potential for the knock-on effects of substantially higher interest rates to disrupt markets with little warning.
While we favor an overweight to equities in the long term, we prefer an underweight stance on equities overall in the near term. Expectations for corporate earnings remain elevated, which seems inconsistent with the possibility of a recession. Nevertheless, we are overweight on emerging market stocks as we believe a weakening U.S. dollar provides a supportive backdrop. We also see long-term opportunities in credit, where we believe that valuations are appealing and higher yields provide attractive income, although we are neutral on credit in the near term, as we’re concerned about tightening credit and financial conditions. However, we believe there are still some strong opportunities for a six- to twelve-month horizon, particularly short-term U.S. Treasuries, global inflation-linked bonds, and emerging market bonds denominated in local currency.
Overall, our view is that investors need to think globally, position themselves to be prepared for a decarbonizing economy, and be nimble as market conditions change. We encourage you to talk with your financial advisor and visit iShares.com for further insight about investing in today’s markets.
Sincerely,

Rob Kapito
President, BlackRock, Inc.

Rob Kapito
President, BlackRock, Inc.
| | | | |
| Total Returns as of March 31, 2023 |
| | | 6-Month | | 12-Month |
| | |
U.S. large cap equities
(S&P 500® Index) | | 15.62% | | (7.73)% |
| | |
U.S. small cap equities (Russell 2000® Index) | | 9.14 | | (11.61) |
| | |
International equities (MSCI Europe, Australasia, Far East Index) | | 27.27 | | (1.38) |
| | |
Emerging market equities (MSCI Emerging Markets Index) | | 14.04 | | (10.70) |
| | |
3-month Treasury bills (ICE BofA 3-Month U.S. Treasury Bill Index) | | 1.93 | | 2.52 |
| | |
U.S. Treasury securities (ICE BofA 10-Year U.S. Treasury Index) | | 4.38 | | (6.90) |
| | |
U.S. investment grade bonds (Bloomberg U.S. Aggregate Bond Index) | | 4.89 | | (4.78) |
| | |
Tax-exempt municipal bonds (Bloomberg Municipal Bond Index) | | 7.00 | | 0.26 |
| | |
U.S. high yield bonds (Bloomberg U.S. Corporate High Yield 2% Issuer Capped Index) | | 7.88 | | (3.35) |
| Past performance is not an indication of future results. Index performance is shown for illustrative purposes only. You cannot invest directly in an index. |
| | |
| 2 | | T H I S P A G E I S N O T P A R T O F Y O U R F U N D R E P O R T |
Table of Contents
Market Overview
iShares Trust
Domestic Market Overview
U.S. stocks declined for the 12 months ended March 31, 2023 (“reporting period”), when the Russell 3000® Index, a broad measure of U.S. equity market performance, returned -8.58%. Elevated inflation and rapid tightening of monetary policy dampened growth and weighed on equities. Higher interest rates drove bond yields higher and increased borrowing costs for businesses and consumers. Equities began to recover in the second half of the reporting period, as the broader economy remained resilient and the pace of inflation declined. In March 2023, two banks suddenly failed, representing the second and third largest bank failures in U.S. history by asset value. This drove concern among investors about the resiliency of the financial system in the face of rapidly rising interest rates. However, government agencies acted swiftly to organize a sale of the failed banks’ assets and inject liquidity, and equity prices recovered.
Inflation was a significant driver of the economic outlook. As the reporting period began, the consumer price index, a widely followed measure of inflation, stood at multi-decade highs. Strong consumer spending and a tight labor market, along with continued supply chain disruptions in Asia, combined to drive prices higher. But the rate of inflation began to decline as the reporting period wore on, decelerating for nine consecutive months beginning in July 2022. Nonetheless, inflation remained elevated by historic standards, and higher prices negatively impacted both consumers and businesses.
The U.S. economy recovered from a decline in the first half of 2022 to post modest growth in the third and fourth quarters of 2022. Consumers continued to power the economy with growing spending, despite higher prices for many consumer goods and services. The strong labor market supported spending, as unemployment remained very low, at one point dropping to the lowest recorded level since 1969. Furthermore, the labor force participation rate—which measures the total proportion of employed persons of working age—rose, indicating that more people were being drawn into the labor force. Amid tightening labor supply, wages rose significantly, with the largest gains at the lower end of the wage spectrum.
To contain inflation, the U.S. Federal Reserve (“Fed”) tightened monetary policy rapidly, raising short-term interest rates eight times over the course of the reporting period. The pace of tightening accelerated as the Fed twice stepped up the increment of increase before reducing it again as inflation began to subside. The Fed also started to reduce the size of its balance sheet by reducing the store of U.S. Treasuries it had accumulated to stabilize markets in the early phases of the coronavirus pandemic. While the Fed indicated that more tightening could be needed to achieve its long-term inflation goal, it sounded a more cautious note about the potential for further interest rate increases near the end of the reporting period.
Despite economic headwinds, corporate profits remained robust, and many companies were able to sufficiently raise prices to preserve profit margins even in the face of rising labor and input costs. Nonetheless, profits declined overall in the fourth quarter of 2022, and the yield curve (a graphical representation of U.S. Treasury rates at different maturities) inverted, a sign that markets were concerned about the impact of higher borrowing costs on the economy. Furthermore, dwindling personal savings and rising household debt raised questions about the sustainability of consumer spending as an engine of economic growth.
| | |
| 4 | | 2 0 2 3 I S H A R E S A N N U A L R E P O R T T O S H A R E H O L D E R S |
| | |
| Fund Summary as of March 31, 2023 | | iShares® Mortgage Real Estate ETF |
Investment Objective
The iShares Mortgage Real Estate ETF (the “Fund”) seeks to track the investment results of an index composed of U.S. real estate investment trusts (REITs) that hold U.S. residential and commercial mortgages, as represented by the FTSE Nareit All Mortgage Capped Index (the “Index”). The Fund invests in a representative sample of securities included in the Index that collectively has an investment profile similar to the Index. Due to the use of representative sampling, the Fund may or may not hold all of the securities that are included in the Index.
Performance
| | | | | | | | | | | | | | | | | | | | | | | | | | | | |
| | | Average Annual Total Returns | | | | | | Cumulative Total Returns | |
| | | 1 Year | | | 5 Years | | | 10 Years | | | | | | 1 Year | | | 5 Years | | | 10 Years | |
Fund NAV | | | (26.00 | )% | | | (4.47 | )% | | | (0.30 | )% | | | | | | | (26.00 | )% | | | (20.42 | )% | | | (2.92 | )% |
Fund Market | | | (26.02 | ) | | | (4.46 | ) | | | (0.32 | ) | | | | | | | (26.02 | ) | | | (20.41 | ) | | | (3.13 | ) |
Index | | | (25.49 | ) | | | (3.79 | ) | | | 0.29 | | | | | | | | (25.49 | ) | | | (17.59 | ) | | | 2.98 | |
GROWTH OF $10,000 INVESTMENT
(AT NET ASSET VALUE)
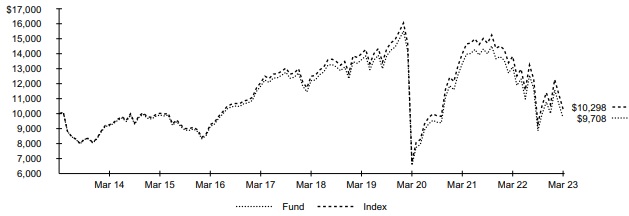
Past performance is not an indication of future results. Performance results do not reflect the deduction of taxes that a shareholder would pay on fund distributions or on the redemption or sale of fund shares. See “About Fund Performance” for more information.
Expense Example
| | | | | | | | | | | | | | | | | | | | | | | | | | | | | | |
| Actual | | | | | | Hypothetical 5% Return | | | | |
| Beginning
Account Value
(10/01/22) |
| |
| Ending
Account Value
(03/31/23) |
| |
| Expenses
Paid During
the Period |
(a) | | | | | |
| Beginning
Account Value
(10/01/22) |
| |
| Ending
Account Value
(03/31/23) |
| |
| Expenses
Paid During
the Period |
(a) | |
| Annualized
Expense
Ratio |
|
| $ | 1,000.00 | | | $ | 1,095.80 | | | $ | 2.51 | | | | | | | $ | 1,000.00 | | | $ | 1,022.54 | | | $ | 2.42 | | | | 0.48 | % |
| (a) | Expenses are equal to the annualized expense ratio, multiplied by the average account value over the period, multiplied by 182/365 (to reflect the one-half year period shown). Other fees, such as brokerage commissions and other fees to financial intermediaries, may be paid which are not reflected in the tables and examples above. See “Disclosure of Expenses” for more information. | |
| | |
| Fund Summary as of March 31, 2023 (continued) | | iShares® Mortgage Real Estate ETF |
Portfolio Management Commentary
Mortgage real estate investment trusts (“REITs”) declined substantially for the reporting period amid sharply rising interest rates. Inflation reached the highest point in four decades before subsiding somewhat, while remaining persistently elevated. The Fed raised interest rates eight times in an attempt to control inflation, sending mortgage rates to a more than 20-year high. Rising borrowing costs made homebuyers more hesitant to take on home loans, and mortgage originations dropped substantially. The fourth quarter of 2022 was the seventh consecutive quarter with fewer originations, which dropped to less than half the level of a year prior. Mortgage refinancing also declined sharply, as higher mortgage rates incentivized homeowners to maintain their current financing.
Higher interest rates weighed on mortgage REITs, which derive their income from the difference between the short-term interest rates at which they borrow funds to purchase securities and the long-term rates they earn on their mortgage investments. As interest rates rise, profit margins for mortgage REITs can narrow or turn negative and the value of their existing mortgage portfolios declines. In addition, the value of the mortgage-backed securities that the REITs hold can go down, and mortgage holders with variable interest rate loans may struggle to meet payment obligations. Mortgage REITs often cut dividend payouts to shareholders when profits fall, reducing their appeal to investors seeking consistent income. Amid a softening economic environment during the reporting period, mortgage REITs built up reserves in anticipation of future credit losses, cutting into earnings.
Equity REITs detracted slightly from the Index’s return. Unlike mortgage REITs, equity REITs own and sometimes operate commercial and residential properties and generate income from rents. Declining revenues stifled profitability in the industry.
Portfolio Information
INDUSTRY ALLOCATION
| | | | |
| Industry | |
| Percent of
Total Investments |
(a) |
Mortgage REITs | | | 100.0 | % |
TEN LARGEST HOLDINGS
| | | | |
| Security | |
| Percent of
Total Investments |
(a) |
Annaly Capital Management, Inc. | | | 17.7 | % |
AGNC Investment Corp. | | | 11.4 | |
Starwood Property Trust, Inc. | | | 10.2 | |
Rithm Capital Corp. | | | 6.9 | |
Hannon Armstrong Sustainable Infrastructure Capital, Inc. | | | 4.6 | |
Blackstone Mortgage Trust, Inc., Class A | | | 4.2 | |
Arbor Realty Trust, Inc. | | | 3.8 | |
Two Harbors Investment Corp. | | | 3.4 | |
Chimera Investment Corp. | | | 3.1 | |
Apollo Commercial Real Estate Finance, Inc. | | | 3.1 | |
| (a) | Excludes money market funds. | |
| | |
| 6 | | 2 0 2 3 I S H A R E S A N N U A L R E P O R T T O S H A R E H O L D E R S |
| | |
| Fund Summary as of March 31, 2023 | | iShares® Residential and Multisector Real Estate ETF |
Investment Objective
The iShares Residential and Multisector Real Estate ETF (the “Fund”) seeks to track the investment results of an index composed of U.S. residential, healthcare and self-storage real estate equities, as represented by the FTSE Nareit All Residential Capped Index (the “Index”). The Fund invests in a representative sample of securities included in the Index that collectively has an investment profile similar to the Index. Due to the use of representative sampling, the Fund may or may not hold all of the securities that are included in the Index.
Performance
| | | | | | | | | | | | | | | | | | | | | | | | | | | | |
| | | Average Annual Total Returns | | | | | | Cumulative Total Returns | |
| | | 1 Year | | | 5 Years | | | 10 Years | | | | | | 1 Year | | | 5 Years | | | 10 Years | |
Fund NAV | | | (23.84 | )% | | | 7.31 | % | | | 6.79 | % | | | | | | | (23.84 | )% | | | 42.28 | % | | | 92.97 | % |
Fund Market | | | (23.92 | ) | | | 7.31 | | | | 6.80 | | | | | | | | (23.92 | ) | | | 42.29 | | | | 93.15 | |
Index | | | (23.54 | ) | | | 7.75 | | | | 7.20 | | | | | | | | (23.54 | ) | | | 45.22 | | | | 100.36 | |
GROWTH OF $10,000 INVESTMENT
(AT NET ASSET VALUE)
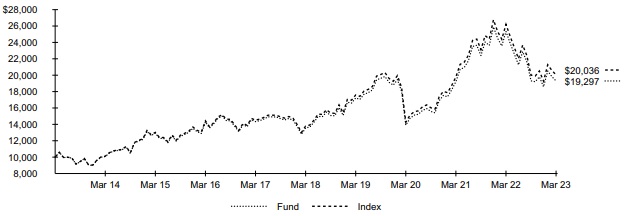
Past performance is not an indication of future results. Performance results do not reflect the deduction of taxes that a shareholder would pay on fund distributions or the redemption of sale of fund shares. See “About Fund Performance” for more information.
Expense Example
| | | | | | | | | | | | | | | | | | | | | | | | | | | | | | |
| Actual | | | | | | Hypothetical 5% Return | | | | |
| Beginning
Account Value
(10/01/22) |
| |
| Ending
Account Value
(03/31/23) |
| |
| Expenses
Paid During
the Period |
(a) | | | | | |
| Beginning
Account Value
(10/01/22) |
| |
| Ending
Account Value
(03/31/23) |
| |
| Expenses
Paid During
the Period |
(a) | |
| Annualized
Expense
Ratio |
|
| $ | 1,000.00 | | | $ | 999.30 | | | $ | 2.39 | | | | | | | $ | 1,000.00 | | | $ | 1,022.54 | | | $ | 2.42 | | | | 0.48 | % |
| (a) | Expenses are equal to the annualized expense ratio, multiplied by the average account value over the period, multiplied by 182/365 (to reflect the one-half year period shown). Other fees, such as brokerage commissions and other fees to financial intermediaries, may be paid which are not reflected in the tables and examples above. See “Disclosure of Expenses” for more information. | |
| | |
| Fund Summary as of March 31, 2023 (continued) | | iShares® Residential and Multisector Real Estate ETF |
Portfolio Management Commentary
Residential and multisector real estate investment trusts (“REITs”) declined significantly during the reporting period. Rising interest rates raised the cost for REITs to pay debt held on existing properties and increased the expense of financing new acquisitions. As interest rates rose, bond yields increased, making bonds a more attractive investment option, perceived to have lower risk than the dividends offered by REITs. Because REITs are required to pay out 90% of their earnings in dividends to shareholders each year in order to maintain their tax-free status, they often compete with bonds for yield-seeking investors, particularly when interest rates rise.
Diversified REITs, including those that operate self-storage units, apartment complexes, and senior living complexes, detracted the most from the Index’s performance. The occupancy rates of REITs that own and operate self-storage units declined from levels reached during the COVID-19 pandemic. Demand for self-storage units soared during the pandemic as Americans decluttered their homes and put items into storage to accommodate working, studying, and exercising at home. However, with the widespread usage of vaccines, many people returned to offices and schools. In addition, rising mortgage rates slowed housing sales, lessening the demand for storage rentals during a move. Labor costs, a significant expense for operating storage units, increased as inflationary pressure raised wages. In addition, the costs of materials to build new storage units increased significantly. REITs that own and operate apartment buildings, particularly those operating in large cities with slow post-pandemic real estate market recovery, also detracted from the Index’s performance. REITs that focus on senior living complexes continued to face challenges due to COVID-19 outbreaks, which caused disruptions in the process of new tenants moving into apartments and led to increased expenses for staffing.
Portfolio Information
INDUSTRY ALLOCATION
| | | | |
| Industry | |
| Percent of
Total Investments |
(a) |
Residential REITs | | | 48.0 | % |
Health Care REITs | | | 26.1 | |
Specialized REITs | | | 25.9 | |
TEN LARGEST HOLDINGS
| | | | |
| Security | |
| Percent of
Total Investments |
(a) |
Public Storage | | | 12.9 | % |
Welltower, Inc. | | | 9.3 | |
AvalonBay Communities, Inc. | | | 6.4 | |
Equity Residential | | | 6.1 | |
Extra Space Storage, Inc. | | | 5.9 | |
Invitation Homes, Inc. | | | 5.2 | |
Sun Communities, Inc. | | | 4.5 | |
Mid-America Apartment Communities, Inc. | | | 4.5 | |
Ventas, Inc. | | | 4.2 | |
UDR, Inc. | | | 3.8 | |
| (a) | Excludes money market funds. | |
| | |
| 8 | | 2 0 2 3 I S H A R E S A N N U A L R E P O R T T O S H A R E H O L D E R S |
About Fund Performance
Past performance is not an indication of future results. Financial markets have experienced extreme volatility and trading in many instruments has been disrupted. These circumstances may continue for an extended period of time and may continue to affect adversely the value and liquidity of each Fund’s investments. As a result, current performance may be lower or higher than the performance data quoted. Performance data current to the most recent month-end is available at iShares.com. Performance results assume reinvestment of all dividends and capital gain distributions and do not reflect the deduction of taxes that a shareholder would pay on fund distributions or on the redemption or sale of fund shares. The investment return and principal value of shares will vary with changes in market conditions. Shares may be worth more or less than their original cost when they are redeemed or sold in the market. Performance for certain funds may reflect a waiver of a portion of investment advisory fees. Without such a waiver, performance would have been lower.
Net asset value or “NAV” is the value of one share of a fund as calculated in accordance with the standard formula for valuing mutual fund shares. Beginning August 10, 2020, the price used to calculate market return (“Market Price”) is the closing price. Prior to August 10, 2020, Market Price was determined using the midpoint between the highest bid and the lowest ask on the primary stock exchange on which shares of a fund are listed for trading, as of the time that such fund’s NAV is calculated. Market and NAV returns assume that dividends and capital gain distributions have been reinvested at Market Price and NAV, respectively.
An index is a statistical composite that tracks a specified financial market or sector. Unlike a fund, an index does not actually hold a portfolio of securities and therefore does not incur the expenses incurred by a fund. These expenses negatively impact fund performance. Also, market returns do not include brokerage commissions that may be payable on secondary market transactions. If brokerage commissions were included, market returns would be lower.
Disclosure of Expenses
Shareholders of each Fund may incur the following charges: (1) transactional expenses, including brokerage commissions on purchases and sales of fund shares and (2) ongoing expenses, including management fees and other fund expenses. The expense examples shown (which are based on a hypothetical investment of $1,000 invested at the beginning of the period and held through the end of the period) are intended to assist shareholders both in calculating expenses based on an investment in each Fund and in comparing these expenses with similar costs of investing in other funds.
The expense examples provide information about actual account values and actual expenses. Annualized expense ratios reflect contractual and voluntary fee waivers, if any. In order to estimate the expenses a shareholder paid during the period covered by this report, shareholders can divide their account value by $1,000 and then multiply the result by the number under the heading entitled “Expenses Paid During the Period.”
The expense examples also provide information about hypothetical account values and hypothetical expenses based on a fund’s actual expense ratio and an assumed rate of return of 5% per year before expenses. In order to assist shareholders in comparing the ongoing expenses of investing in the Funds and other funds, compare the 5% hypothetical examples with the 5% hypothetical examples that appear in the shareholder reports of the other funds.
The expenses shown in the expense examples are intended to highlight shareholders’ ongoing costs only and do not reflect any transactional expenses, such as brokerage commissions and other fees paid on purchases and sales of fund shares. Therefore, the hypothetical examples are useful in comparing ongoing expenses only and will not help shareholders determine the relative total expenses of owning different funds. If these transactional expenses were included, shareholder expenses would have been higher.
| | |
A B O U T F U N D P E R F O R M A N C E / D I S C L O S U R E O F E X P E N S E S | | 9 |
| | |
Schedule of Investments March 31, 2023 | | iShares® Mortgage Real Estate ETF (Percentages shown are based on Net Assets) |
| | | | | | | | |
| | |
| Security | | Shares | | | Value | |
| | |
Common Stocks | | | | | | | | |
| | |
| Mortgage REITs — 97.4% | | | | | | |
AFC Gamma, Inc. | | | 223,838 | | | $ | 2,721,870 | |
AGNC Investment Corp. | | | 6,537,579 | | | | 65,898,796 | |
Angel Oak Mortgage REIT, Inc. | | | 163,712 | | | | 1,195,098 | |
Annaly Capital Management, Inc. | | | 5,356,170 | | | | 102,356,409 | |
Apollo Commercial Real Estate Finance, Inc. | | | 1,931,248 | | | | 17,979,919 | |
Arbor Realty Trust, Inc. | | | 1,922,043 | | | | 22,084,274 | |
Ares Commercial Real Estate Corp. | | | 705,473 | | | | 6,412,749 | |
ARMOUR Residential REIT, Inc. | | | 2,226,026 | | | | 11,686,637 | |
Blackstone Mortgage Trust, Inc., Class A | | | 1,375,365 | | | | 24,550,265 | |
BrightSpire Capital, Inc., Class A | | | 1,287,812 | | | | 7,598,091 | |
Broadmark Realty Capital, Inc. | | | 1,789,424 | | | | 8,410,293 | |
Chicago Atlantic Real Estate Finance, Inc. | | | 74,687 | | | | 1,009,021 | |
Chimera Investment Corp. | | | 3,191,682 | | | | 18,001,086 | |
Dynex Capital, Inc. | | | 724,962 | | | | 8,786,539 | |
Ellington Financial, Inc. | | | 870,269 | | | | 10,625,984 | |
Franklin BSP Realty Trust, Inc. | | | 1,140,266 | | | | 13,603,373 | |
Granite Point Mortgage Trust, Inc. | | | 713,937 | | | | 3,541,128 | |
Great Ajax Corp. | | | 296,721 | | | | 1,952,424 | |
Hannon Armstrong Sustainable Infrastructure Capital, Inc.(a) | | | 928,967 | | | | 26,568,456 | |
Invesco Mortgage Capital, Inc. | | | 488,982 | | | | 5,422,810 | |
KKR Real Estate Finance Trust, Inc. | | | 783,861 | | | | 8,928,177 | |
Ladder Capital Corp., Class A | | | 1,559,343 | | | | 14,735,791 | |
MFA Financial, Inc. | | | 1,410,666 | | | | 13,993,807 | |
New York Mortgage Trust, Inc. | | | 1,271,358 | | | | 12,662,726 | |
Nexpoint Real Estate Finance, Inc. | | | 110,790 | | | | 1,736,079 | |
Orchid Island Capital, Inc.(a) | | | 514,172 | | | | 5,517,066 | |
PennyMac Mortgage Investment Trust | | | 1,221,017 | | | | 15,055,140 | |
| | | | | | | | |
| | |
| Security | | Shares | | | Value | |
| | |
| Mortgage REITs (continued) | | | | | | |
Ready Capital Corp. | | | 982,273 | | | $ | 9,989,716 | |
Redwood Trust, Inc. | | | 1,554,667 | | | | 10,478,456 | |
Rithm Capital Corp. | | | 4,960,757 | | | | 39,686,056 | |
Starwood Property Trust, Inc. | | | 3,338,930 | | | | 59,065,672 | |
TPG RE Finance Trust, Inc. | | | 947,398 | | | | 6,878,109 | |
Two Harbors Investment Corp. | | | 1,330,367 | | | | 19,569,699 | |
| | | | | | | | |
| | |
| | | | | | | 578,701,716 | |
| | | | | | | | |
| | |
Total Long-Term Investments — 97.4%
(Cost: $886,194,815) | | | | | | | 578,701,716 | |
| | | | | | | | |
| | |
Short-Term Securities | | | | | | | | |
| | |
| Money Market Funds — 1.1% | | | | | | |
BlackRock Cash Funds: Institutional, SL Agency Shares, 5.01%(b)(c)(d) | | | 6,291,044 | | | | 6,292,932 | |
BlackRock Cash Funds: Treasury, SL Agency Shares, 4.73%(b)(c) | | | 498,399 | | | | 498,399 | |
| | | | | | | | |
| | |
Total Short-Term Securities — 1.1%
(Cost: $6,791,627) | | | | | | | 6,791,331 | |
| | | | | | | | |
| | |
Total Investments — 98.5%
(Cost: $892,986,442) | | | | | | | 585,493,047 | |
| | |
Other Assets Less Liabilities — 1.5% | | | | | | | 8,669,743 | |
| | | | | | | | |
| | |
Net Assets — 100.0% | | | | | | $ | 594,162,790 | |
| | | | | | | | |
| (a) | All or a portion of this security is on loan. |
| (b) | Affiliate of the Fund. |
| (c) | Annualized 7-day yield as of period end. |
| (d) | All or a portion of this security was purchased with the cash collateral from loaned securities. |
Affiliates
Investments in issuers considered to be affiliate(s) of the Fund during the year ended March 31, 2023 for purposes of Section 2(a)(3) of the Investment Company Act of 1940, as amended, were as follows:
| | | | | | | | | | | | | | | | | | | | | | | | | | | | | | | | | | | | | | | | | | |
| | | Affiliated Issuer | | Value at
03/31/22 | | | Purchases
at Cost | | | Proceeds
from Sale | | | Net Realized
Gain (Loss) | | | Change in
Unrealized
Appreciation
(Depreciation) | | | Value at
03/31/23 | | | Shares
Held at
03/31/23 | | | Income | | | Capital
Gain
Distributions from Underlying Funds | | | | |
| | BlackRock Cash Funds: Institutional, SL Agency Shares | | $ | 23,893 | | | $ | 6,263,406 | (a) | | $ | — | | | $ | 5,933 | | | $ | (300 | ) | | $ | 6,292,932 | | | | 6,291,044 | | | $ | 88,238 | (b) | | $ | — | | | | | |
| | BlackRock Cash Funds: Treasury, SL Agency Shares | | | 1,230,000 | | | | — | | | | (731,601 | )(a) | | | — | | | | — | | | | 498,399 | | | | 498,399 | | | | 40,093 | | | | 1 | | | | | |
| | | | | | | | | | | | | | | | | | | | | | | | | | | | | | | | | | | | | | | | | | |
| | | | | | | | | | | | | | | | $ | 5,933 | | | $ | (300 | ) | | $ | 6,791,331 | | | | | | | $ | 128,331 | | | $ | 1 | | | | | |
| | | | | | | | | | | | | | | | | | | | | | | | | | | | | | | | | | | | | | | | | | |
| | (a) | Represents net amount purchased (sold). | |
| | (b) | All or a portion represents securities lending income earned from the reinvestment of cash collateral from loaned securities, net of fees and collateral investment expenses, and other payments to and from borrowers of securities. | |
Derivative Financial Instruments Outstanding as of Period End
Futures Contracts
| | | | | | | | | | | | | | | | |
| |
| Description | | Number of
Contracts | | | Expiration
Date | | | Notional
Amount
(000) | | | Value/
Unrealized
Appreciation
(Depreciation) | |
| |
Long Contracts | | | | | | | | | | | | | | | | |
Dow Jones U.S. Real Estate Index | | | 477 | | | | 06/16/23 | | | $ | 15,803 | | | $ | 401,484 | |
| | | | | | | | | | | | | | | | |
| | |
| 10 | | 2 0 2 3 I S H A R E S A N N U A L R E P O R T T O S H A R E H O L D E R S |
| | |
Schedule of Investments (continued) March 31, 2023 | | iShares® Mortgage Real Estate ETF |
Derivative Financial Instruments Categorized by Risk Exposure
As of period end, the fair values of derivative financial instruments located in the Statements of Assets and Liabilities were as follows:
| | | | | | | | | | | | | | | | | | | | | | | | | | | | |
| | | Commodity
Contracts | | | Credit
Contracts | | | Equity
Contracts | | | Foreign
Currency
Exchange
Contracts | | | Interest
Rate
Contracts | | | Other
Contracts | | | Total | |
Assets — Derivative Financial Instruments | | | | | | | | | | | | | | | | | | | | | | | | | | | | |
Futures contracts | | | | | | | | | | | | | | | | | | | | | | | | | | | | |
Unrealized appreciation on futures contracts(a) | | $ | — | | | $ | — | | | $ | 401,484 | | | $ | — | | | $ | — | | | $ | — | | | $ | 401,484 | |
| | | | | | | | | | | | | | | | | | | | | | | | | | | | |
| | (a) | Net cumulative unrealized appreciation (depreciation) on futures contracts, if any, are reported in the Schedule of Investments. In the Statements of Assets and Liabilities, only current day’s variation margin is reported in receivables or payables and the net cumulative unrealized appreciation (depreciation) is included in accumulated earnings (loss). | |
For the period ended March 31, 2023 the effect of derivative financial instruments in the Statements of Operations was as follows:
| | | | | | | | | | | | | | | | | | | | | | | | | | | | |
| | | Commodity
Contracts | | | Credit
Contracts | | | Equity
Contracts | | | Foreign
Currency
Exchange
Contracts | | | Interest
Rate
Contracts | | | Other
Contracts | | | Total | |
Net Realized Gain (Loss) from | | | | | | | | | | | | | | | | | | | | | | | | | | | | |
Futures contracts | | $ | — | | | $ | — | | | $ | 875,132 | | | $ | — | | | $ | — | | | $ | — | | | $ | 875,132 | |
| | | | | | | | | | | | | | | | | | | | | | | | | | | | |
| | | | | | | |
Net Change in Unrealized Appreciation (Depreciation) on | | | | | | | | | | | | | | | | | | | | | | | | | | | | |
Futures contracts | | $ | — | | | $ | — | | | $ | 431,409 | | | $ | — | | | $ | — | | | $ | — | | | $ | 431,409 | |
| | | | | | | | | | | | | | | | | | | | | | | | | | | | |
Average Quarterly Balances of Outstanding Derivative Financial Instruments
| | | | |
| |
Futures contracts | | | | |
Average notional value of contracts — long | | $ | 16,371,195 | |
| |
For more information about the Fund’s investment risks regarding derivative financial instruments, refer to the Notes to Financial Statements.
Fair Value Hierarchy as of Period End
Various inputs are used in determining the fair value of financial instruments. For a description of the input levels and information about the Fund’s policy regarding valuation of financial instruments, refer to the Notes to Financial Statements.
The following table summarizes the Fund’s financial instruments categorized in the fair value hierarchy. The breakdown of the Fund’s financial instruments into major categories is disclosed in the Schedule of Investments above.
| | | | | | | | | | | | | | | | |
| |
| | | | |
| | | Level 1 | | | Level 2 | | | Level 3 | | | Total | |
| |
Assets | | | | | | | | | | | | | | | | |
Investments | | | | | | | | | | | | | | | | |
Long-Term Investments | | | | | | | | | | | | | | | | |
Common Stocks | | $ | 578,701,716 | | | $ | — | | | $ | — | | | $ | 578,701,716 | |
Short-Term Securities | | | | | | | | | | | | | | | | |
Money Market Funds | | | 6,791,331 | | | | — | | | | — | | | | 6,791,331 | |
| | | | | | | | | | | | | | | | |
| | $ | 585,493,047 | | | $ | — | | | $ | — | | | $ | 585,493,047 | |
| | | | | | | | | | | | | | | | |
Derivative Financial Instruments(a) | | | | | | | | | | | | | | | | |
Assets | | | | | | | | | | | | | | | | |
Equity Contracts | | $ | 401,484 | | | $ | — | | | $ | — | | | $ | 401,484 | |
| | | | | | | | | | | | | | | | |
| (a) | Derivative financial instruments are futures contracts. Futures contracts are valued at the unrealized appreciation (depreciation) on the instrument. | |
| | |
S C H E D U L E S O F I N V E S T M E N T S | | 11 |
| | |
Schedule of Investments March 31, 2023 | | iShares® Residential and Multisector Real Estate ETF (Percentages shown are based on Net Assets) |
| | | | | | | | |
| | |
| Security | | Shares | | | Value | |
| | |
Common Stocks | | | | | | | | |
| | |
| Health Care REITs — 26.0% | | | | | | |
CareTrust REIT, Inc. | | | 174,726 | | | $ | 3,421,135 | |
Community Healthcare Trust, Inc. | | | 41,748 | | | | 1,527,977 | |
Diversified Healthcare Trust | | | 420,507 | | | | 567,684 | |
Global Medical REIT, Inc. | | | 107,897 | | | | 982,942 | |
Healthcare Realty Trust, Inc. | | | 672,500 | | | | 12,999,425 | |
Healthpeak Properties, Inc. | | | 969,371 | | | | 21,297,081 | |
LTC Properties, Inc. | | | 70,381 | | | | 2,472,485 | |
Medical Properties Trust, Inc. | | | 1,053,397 | | | | 8,658,923 | |
National Health Investors, Inc. | | | 73,672 | | | | 3,800,002 | |
Omega Healthcare Investors, Inc. | | | 416,831 | | | | 11,425,338 | |
Physicians Realty Trust | | | 401,928 | | | | 6,000,785 | |
Sabra Health Care REIT, Inc. | | | 407,032 | | | | 4,680,868 | |
Universal Health Realty Income Trust | | | 22,532 | | | | 1,084,014 | |
Ventas, Inc. | | | 606,121 | | | | 26,275,345 | |
Welltower, Inc. | | | 806,798 | | | | 57,839,349 | |
| | | | | | | | |
| | |
| | | | | | 163,033,353 | |
| | |
| Residential REITs — 47.7% | | | | | | |
American Homes 4 Rent, Class A | | | 545,960 | | | | 17,170,442 | |
Apartment Income REIT Corp. | | | 267,017 | | | | 9,561,879 | |
Apartment Investment & Management Co., Class A | | | 263,740 | | | | 2,028,161 | |
AvalonBay Communities, Inc. | | | 238,198 | | | | 40,031,556 | |
BRT Apartments Corp. | | | 21,261 | | | | 419,267 | |
Camden Property Trust | | | 183,887 | | | | 19,278,713 | |
Centerspace | | | 26,512 | | | | 1,448,351 | |
Elme Communities | | | 154,815 | | | | 2,764,996 | |
Equity LifeStyle Properties, Inc. | | | 315,026 | | | | 21,147,695 | |
Equity Residential | | | 631,530 | | | | 37,891,800 | |
Essex Property Trust, Inc. | | | 114,006 | | | | 23,843,215 | |
Independence Realty Trust, Inc. | | | 396,006 | | | | 6,347,976 | |
Invitation Homes, Inc. | | | 1,040,646 | | | | 32,499,375 | |
Mid-America Apartment Communities, Inc. | | | 184,379 | | | | 27,848,604 | |
| | | | | | | | |
| | |
| Security | | Shares | | | Value | |
| | |
| Residential REITs (continued) | | | | | | |
NexPoint Residential Trust, Inc. | | | 39,858 | | | $ | 1,740,599 | |
Sun Communities, Inc. | | | 201,666 | | | | 28,410,706 | |
UDR, Inc. | | | 581,518 | | | | 23,877,129 | |
UMH Properties, Inc. | | | 93,270 | | | | 1,379,463 | |
Veris Residential, Inc.(a) | | | 152,124 | | | | 2,227,095 | |
| | | | | | | | |
| | |
| | | | | | 299,917,022 | |
| | |
| Specialized REITs — 25.7% | | | | | | |
CubeSmart | | | 396,471 | | | | 18,324,890 | |
Extra Space Storage, Inc. | | | 225,949 | | | | 36,813,870 | |
Life Storage, Inc. | | | 149,212 | | | | 19,560,201 | |
National Storage Affiliates Trust | | | 150,572 | | | | 6,290,898 | |
Public Storage | | | 266,677 | | | | 80,573,789 | |
| | | | | | | | |
| | |
| | | | | | 161,563,648 | |
| | | | | | | | |
| | |
Total Long-Term Investments — 99.4%
(Cost: $805,596,014) | | | | | | | 624,514,023 | |
| | | | | | | | |
| | |
Short-Term Securities | | | | | | | | |
| | |
| Money Market Funds — 0.2% | | | | | | |
BlackRock Cash Funds: Treasury, SL Agency Shares, 4.73%(b)(c) | | | 1,066,711 | | | | 1,066,711 | |
| | | | | | | | |
| | |
Total Short-Term Securities — 0.2%
(Cost: $1,066,711) | | | | | | | 1,066,711 | |
| | | | | | | | |
| | |
Total Investments — 99.6%
(Cost: $806,662,725) | | | | | | | 625,580,734 | |
| | |
Other Assets Less Liabilities — 0.4% | | | | | | | 2,761,399 | |
| | | | | | | | |
| | |
Net Assets — 100.0% | | | | | | $ | 628,342,133 | |
| | | | | | | | |
| (a) | Non-income producing security. |
| (b) | Affiliate of the Fund. |
| (c) | Annualized 7-day yield as of period end. |
Affiliates
Investments in issuers considered to be affiliate(s) of the Fund during the year ended March 31, 2023 for purposes of Section 2(a)(3) of the Investment Company Act of 1940, as amended, were as follows:
| | | | | | | | | | | | | | | | | | | | | | | | | | | | | | | | | | | | |
| Affiliated Issuer | | Value at
03/31/22 | | | Purchases
at Cost | | | Proceeds
from Sale | | | Net Realized
Gain (Loss) | | | Change in
Unrealized
Appreciation
(Depreciation) | | | Value at
03/31/23 | | | Shares Held at 03/31/23 | | | Income | | | Capital Gain Distributions from Underlying Funds | |
BlackRock Cash Funds: Institutional, SL Agency Shares(a) | | $ | — | | | $ | — | | | $ | (3,683 | )(b) | | $ | 3,683 | | | $ | — | | | $ | — | | | | — | | | $ | 14,385 | (c) | | $ | — | |
BlackRock Cash Funds: Treasury, SL Agency Shares | | | 2,910,000 | | | | — | | | | (1,843,289 | )(b) | | | — | | | | — | | | | 1,066,711 | | | | 1,066,711 | | | | 33,788 | | | | 1 | |
| | | | | | | | | | | | | | | | | | | | | | | | | | | | | | | | | | | | |
| | | | | | | | | | | | | | $ | 3,683 | | | $ | — | | | $ | 1,066,711 | | | | | | | $ | 48,173 | | | $ | 1 | |
| | | | | | | | | | | | | | | | | | | | | | | | | | | | | | | | | | | | |
| | (a) | As of period end, the entity is no longer held. | |
| | (b) | Represents net amount purchased (sold). | |
| | (c) | All or a portion represents securities lending income earned from the reinvestment of cash collateral from loaned securities, net of fees and collateral investment expenses, and other payments to and from borrowers of securities. | |
| | |
| 12 | | 2 0 2 3 I S H A R E S A N N U A L R E P O R T T O S H A R E H O L D E R S |
| | |
Schedule of Investments (continued) March 31, 2023 | | iShares® Residential and Multisector Real Estate ETF |
Derivative Financial Instruments Outstanding as of Period End
Futures Contracts
| | | | | | | | | | | | | | | | |
| |
| Description | | Number of
Contracts | | | Expiration
Date | | | Notional
Amount
(000) | | | Value/
Unrealized
Appreciation
(Depreciation) | |
| |
Long Contracts | | | | | | | | | | | | | | | | |
Dow Jones U.S. Real Estate Index | | | 113 | | | | 06/16/23 | | | $ | 3,744 | | | $ | 123,326 | |
| | | | | | | | | | | | | | | | |
Derivative Financial Instruments Categorized by Risk Exposure
As of period end, the fair values of derivative financial instruments located in the Statements of Assets and Liabilities were as follows:
| | | | | | | | | | | | | | | | | | | | | | | | | | | | |
| |
| | | Commodity
Contracts | | | Credit
Contracts | | | Equity
Contracts | | | Foreign
Currency
Exchange
Contracts | | | Interest
Rate
Contracts | | | Other
Contracts | | | Total | |
| |
Assets — Derivative Financial Instruments | | | | | | | | | | | | | | | | | | | | | | | | | | | | |
Futures contracts | | | | | | | | | | | | | | | | | | | | | | | | | | | | |
Unrealized appreciation on futures contracts(a) | | $ | — | | | $ | — | | | $ | 123,326 | | | $ | — | | | $ | — | | | $ | — | | | $ | 123,326 | |
| | | | | | | | | | | | | | | | | | | | | | | | | | | | |
| | (a) | Net cumulative unrealized appreciation (depreciation) on futures contracts, if any, are reported in the Schedule of Investments. In the Statements of Assets and Liabilities, only current day’s variation margin is reported in receivables or payables and the net cumulative unrealized appreciation (depreciation) is included in accumulated earnings (loss). |
For the period ended March 31, 2023, the effect of derivative financial instruments in the Statements of Operations was as follows:
| | | | | | | | | | | | | | | | | | | | | | | | | | | | |
| |
| | | Commodity
Contracts | | | Credit
Contracts | | | Equity
Contracts | | | Foreign
Currency
Exchange
Contracts | | | Interest
Rate
Contracts | | | Other
Contracts | | | Total | |
| |
Net Realized Gain (Loss) from | | | | | | | | | | | | | | | | | | | | | | | | | | | | |
Futures contracts | | $ | — | | | $ | — | | | $ | (252,333 | ) | | $ | — | | | $ | — | | | $ | — | | | $ | (252,333 | ) |
| | | | | | | | | | | | | | | | | | | | | | | | | | | | |
| | | | | | | |
Net Change in Unrealized Appreciation (Depreciation) on | | | | | | | | | | | | | | | | | | | | | | | | | | | | |
Futures contracts | | $ | — | | | $ | — | | | $ | (18,379 | ) | | $ | — | | | $ | — | | | $ | — | | | $ | (18,379 | ) |
| | | | | | | | | | | | | | | | | | | | | | | | | | | | |
Average Quarterly Balances of Outstanding Derivative Financial Instruments
| | | | |
| |
Futures contracts | | | | |
Average notional value of contracts — long | | $ | 4,010,328 | |
| |
For more information about the Fund’s investment risks regarding derivative financial instruments, refer to the Notes to Financial Statements.
| | |
SCHEDULES OF INVESTMENTS | | 13 |
| | |
Schedule of Investments (continued) March 31, 2023 | | iShares® Residential and Multisector Real Estate ETF |
Fair Value Hierarchy as of Period End
Various inputs are used in determining the fair value of financial instruments. For a description of the input levels and information about the Fund’s policy regarding valuation of financial instruments, refer to the Notes to Financial Statements.
The following table summarizes the Fund’s financial instruments categorized in the fair value hierarchy. The breakdown of the Fund’s financial instruments into major categories is disclosed in the Schedule of Investments above.
| | | | | | | | | | | | | | | | |
| |
| | | | |
| | | Level 1 | | | Level 2 | | | Level 3 | | | Total | |
| |
Assets | | | | | | | | | | | | | | | | |
Investments | | | | | | | | | | | | | | | | |
Long-Term Investments | | | | | | | | | | | | | | | | |
Common Stocks | | $ | 624,514,023 | | | $ | — | | | $ | — | | | $ | 624,514,023 | |
Short-Term Securities | | | | | | | | | | | | | | | | |
Money Market Funds | | | 1,066,711 | | | | — | | | | — | | | | 1,066,711 | |
| | | | | | | | | | | | | | | | |
| | $ | 625,580,734 | | | $ | — | | | $ | — | | | $ | 625,580,734 | |
| | | | | | | | | | | | | | | | |
Derivative Financial Instruments(a) | | | | | | | | | | | | | | | | |
Assets | | | | | | | | | | | | | | | | |
Equity Contracts | | $ | 123,326 | | | $ | — | | | $ | — | | | $ | 123,326 | |
| | | | | | | | | | | | | | | | |
| (a) | Derivative financial instruments are futures contracts. Futures contracts are valued at the unrealized appreciation (depreciation) on the instrument. |
| | |
| 14 | | 2 0 2 3 I S H A R E S A N N U A L R E P O R T T O S H A R E H O L D E R S |
Statements of Assets and Liabilities
March 31, 2023
| | | | | | | | |
| | | iShares
Mortgage Real
Estate ETF | | | iShares
Residential and
Multisector Real
Estate ETF | |
| | |
ASSETS | | | | | | | | |
Investments, at value — unaffiliated(a)(b) | | $ | 578,701,716 | | | $ | 624,514,023 | |
Investments, at value — affiliated(c) | | | 6,791,331 | | | | 1,066,711 | |
Cash | | | — | | | | 11 | |
Cash pledged: | | | | | | | | |
Futures contracts | | | 1,189,000 | | | | 273,000 | |
Receivables: | | | | | | | | |
Investments sold | | | 621,205 | | | | — | |
Securities lending income — affiliated | | | 10,519 | | | | 3,308 | |
Dividends — unaffiliated | | | 13,688,074 | | | | 2,663,641 | |
Dividends — affiliated | | | 4,509 | | | | 3,869 | |
Variation margin on futures contracts | | | 317,564 | | | | 74,946 | |
| | | | | | | | |
Total assets | | | 601,323,918 | | | | 628,599,509 | |
| | | | | | | | |
| | |
LIABILITIES | | | | | | | | |
Bank overdraft | | | 23,843 | | | | — | |
Collateral on securities loaned | | | 6,287,305 | | | | — | |
Payables: | | | | | | | | |
Investments purchased | | | 606,654 | | | | — | |
Investment advisory fees | | | 243,326 | | | | 257,376 | |
| | | | | | | | |
Total liabilities | | | 7,161,128 | | | | 257,376 | |
| | | | | | | | |
NET ASSETS | | $ | 594,162,790 | | | $ | 628,342,133 | |
| | | | | | | | |
| | |
NET ASSETS CONSIST OF: | | | | | | | | |
Paid-in capital | | $ | 1,210,906,012 | | | $ | 842,343,833 | |
Accumulated loss | | | (616,743,222 | ) | | | (214,001,700 | ) |
| | | | | | | | |
NET ASSETS | | $ | 594,162,790 | | | $ | 628,342,133 | |
| | | | | | | | |
| | |
NET ASSET VALUE | | | | | | | | |
Shares outstanding | | | 27,200,000 | | | | 8,900,000 | |
| | | | | | | | |
| | |
Net asset value | | $ | 21.84 | | | $ | 70.60 | |
| | | | | | | | |
| | |
Shares authorized | | | Unlimited | | | | Unlimited | |
| | | | | | | | |
| | |
Par value | | | None | | | | None | |
| | | | | | | | |
| | |
(a) Investments, at cost — unaffiliated | | $ | 886,194,815 | | | $ | 805,596,014 | |
(b) Securities loaned, at value | | $ | 6,156,969 | | | $ | — | |
(c) Investments, at cost — affiliated | | $ | 6,791,627 | | | $ | 1,066,711 | |
See notes to financial statements.
| | |
F I N A N C I A L S T A T E M E N T S | | 15 |
Statements of Operations
Year Ended March 31, 2023
| | | | | | | | |
| | | iShares
Mortgage Real
Estate ETF | | | iShares
Residential and
Multisector Real
Estate ETF | |
| | |
INVESTMENT INCOME | | | | | | | | |
Dividends — unaffiliated | | $ | 65,319,304 | | | $ | 21,473,974 | |
Dividends — affiliated | | | 40,093 | | | | 33,788 | |
Securities lending income — affiliated — net | | | 88,238 | | | | 14,385 | |
| | | | | | | | |
Total investment income | | | 65,447,635 | | | | 21,522,147 | |
| | | | | | | | |
| | |
EXPENSES | | | | | | | | |
Investment advisory | | | 3,473,169 | | | | 4,001,380 | |
| | | | | | | | |
Total expenses | | | 3,473,169 | | | | 4,001,380 | |
| | | | | | | | |
Net investment income | | | 61,974,466 | | | | 17,520,767 | |
| | | | | | | | |
| | |
REALIZED AND UNREALIZED GAIN (LOSS) | | | | | | | | |
Net realized gain (loss) from: | | | | | | | | |
Investments — unaffiliated | | | (67,975,319 | ) | | | (26,350,113 | ) |
Investments — affiliated | | | 5,933 | | | | 3,683 | |
Capital gain distributions from underlying funds — affiliated | | | 1 | | | | 1 | |
Futures contracts | | | 875,132 | | | | (252,333 | ) |
In-kind redemptions — unaffiliated(a) | | | 5,646,973 | | | | 44,784,193 | |
| | | | | | | | |
| | | (61,447,280 | ) | | | 18,185,431 | |
| | | | | | | | |
Net change in unrealized appreciation (depreciation) on: | | | | | | | | |
Investments — unaffiliated | | | (242,760,832 | ) | | | (310,762,784 | ) |
Investments — affiliated | | | (300 | ) | | | — | |
Futures contracts | | | 431,409 | | | | (18,379 | ) |
| | | | | | | | |
| | | (242,329,723 | ) | | | (310,781,163 | ) |
| | | | | | | | |
Net realized and unrealized loss | | | (303,777,003 | ) | | | (292,595,732 | ) |
| | | | | | | | |
NET DECREASE IN NET ASSETS RESULTING FROM OPERATIONS | | $ | (241,802,537 | ) | | $ | (275,074,965 | ) |
| | | | | | | | |
| (a) | See Note 2 of the Notes to Financial Statements. |
See notes to financial statements.
| | |
| 16 | | 2 0 2 3 I S H A R E S A N N U A L R E P O R T T O S H A R E H O L D E R S |
Statements of Changes in Net Assets
| | | | | | | | | | | | | | | | | | | | |
| | | iShares Mortgage Real Estate ETF | | | | | | iShares Residential and Multisector Real
Estate ETF | |
| | | | | | | | | | | | |
| | | | | |
| | | Year Ended
03/31/23 | | | Year Ended
03/31/22 | | | | | | Year Ended
03/31/23 | | | Year Ended
03/31/22 | |
| | | | | |
INCREASE (DECREASE) IN NET ASSETS | | | | | | | | | | | | | | | | | | | | |
| | | | | |
OPERATIONS | | | | | | | | | | | | | | | | | | | | |
Net investment income | | $ | 61,974,466 | | | $ | 32,106,113 | | | | | | | $ | 17,520,767 | | | $ | 15,723,193 | |
Net realized gain (loss) | | | (61,447,280 | ) | | | 131,124,057 | | | | | | | | 18,185,431 | | | | 107,107,083 | |
Net change in unrealized appreciation (depreciation) | | | (242,329,723 | ) | | | (173,766,987 | ) | | | | | | | (310,781,163 | ) | | | 99,352,430 | |
| | | | | | | | | | | | | | | | | | | | |
Net increase (decrease) in net assets resulting from operations | | | (241,802,537 | ) | | | (10,536,817 | ) | | | | | | | (275,074,965 | ) | | | 222,182,706 | |
| | | | | | | | | | | | | | | | | | | | |
| | | | | |
DISTRIBUTIONS TO SHAREHOLDERS(a) | | | | | | | | | | | | | | | | | | | | |
From net investment income and net realized gain | | | (61,974,466 | ) | | | (81,209,640 | ) | | | | | | | (24,693,312 | ) | | | (18,832,367 | ) |
Return of capital | | | (6,144,140 | ) | | | — | | | | | | | | — | | | | — | |
| | | | | | | | | | | | | | | | | | | | |
Decrease in net assets resulting from distributions to shareholders | | | (68,118,606 | ) | | | (81,209,640 | ) | | | | | | | (24,693,312 | ) | | | (18,832,367 | ) |
| | | | | | | | | | | | | | | | | | | | |
| | | | | |
CAPITAL SHARE TRANSACTIONS | | | | | | | | | | | | | | | | | | | | |
Net increase (decrease) in net assets derived from capital share transactions | | | (71,024,623 | ) | | | (446,732,193 | ) | | | | | | | (360,163,509 | ) | | | 589,464,681 | |
| | | | | | | | | | | | | | | | | | | | |
| | | | | |
NET ASSETS | | | | | | | | | | | | | | | | | | | | |
Total increase (decrease) in net assets | | | (380,945,766 | ) | | | (538,478,650 | ) | | | | | | | (659,931,786 | ) | | | 792,815,020 | |
Beginning of year | | | 975,108,556 | | | | 1,513,587,206 | | | | | | | | 1,288,273,919 | | | | 495,458,899 | |
| | | | | | | | | | | | | | | | | | | | |
End of year | | $ | 594,162,790 | | | $ | 975,108,556 | | | | | | | $ | 628,342,133 | | | $ | 1,288,273,919 | |
| | | | | | | | | | | | | | | | | | | | |
| (a) | Distributions for annual periods determined in accordance with U.S. federal income tax regulations. |
See notes to financial statements.
| | |
F I N A N C I A L S T A T E M E N T S | | 17 |
Financial Highlights
(For a share outstanding throughout each period)
| | | | | | | | | | | | | | | | | | | | |
| | | iShares Mortgage Real Estate ETF | |
| | | | | |
| | | Year Ended
03/31/23 | | | Year Ended
03/31/22 | | | Year Ended
03/31/21 | | | Year Ended
03/31/20 | | | Year Ended
03/31/19 | |
| | | | | |
Net asset value, beginning of year | | $ | 32.67 | | | $ | 35.20 | | | $ | 18.67 | | | $ | 43.32 | | | $ | 42.48 | |
| | | | | | | | | | | | | | | | | | | | |
| | | | | |
Net investment income(a) | | | 2.26 | | | | 0.82 | | | | 1.38 | | | | 2.61 | | | | 3.13 | |
Net realized and unrealized gain (loss)(b) | | | (10.57 | ) | | | (1.27 | ) | | | 17.37 | | | | (23.51 | ) | | | 1.52 | |
| | | | | | | | | | | | | | | | | | | | |
| | | | | |
Net increase (decrease) from investment operations | | | (8.31 | ) | | | (0.45 | ) | | | 18.75 | | | | (20.90 | ) | | | 4.65 | |
| | | | | | | | | | | | | | | | | | | | |
| | | | | |
Distributions(c) | | | | | | | | | | | | | | | | | | | | |
From net investment income | | | (2.29 | ) | | | (2.08 | ) | | | (1.34 | ) | | | (2.60 | ) | | | (3.08 | ) |
Return of capital | | | (0.23 | ) | | | — | | | | (0.88 | ) | | | (1.15 | ) | | | (0.73 | ) |
| | | | | | | | | | | | | | | | | | | | |
| | | | | |
Total distributions | | | (2.52 | ) | | | (2.08 | ) | | | (2.22 | ) | | | (3.75 | ) | | | (3.81 | ) |
| | | | | | | | | | | | | | | | | | | | |
| | | | | |
Net asset value, end of year | | $ | 21.84 | | | $ | 32.67 | | | $ | 35.20 | | | $ | 18.67 | | | $ | 43.32 | |
| | | | | | | | | | | | | | | | | | | | |
| | | | | |
Total Return(d) | | | | | | | | | | | | | | | | | | | | |
Based on net asset value | | | (26.00 | )% | | | (1.65 | )% | | | 103.62 | % | | | (51.80 | )% | | | 11.46 | % |
| | | | | | | | | | | | | | | | | | | | |
| | | | | |
Ratios to Average Net Assets(e) | | | | | | | | | | | | | | | | | | | | |
Total expenses | | | 0.48 | % | | | 0.48 | % | | | 0.48 | % | | | 0.48 | % | | | 0.48 | % |
| | | | | | | | | | | | | | | | | | | | |
| | | | | |
Net investment income | | | 8.57 | % | | | 2.30 | % | | | 4.94 | % | | | 6.16 | % | | | 7.22 | % |
| | | | | | | | | | | | | | | | | | | | |
| | | | | |
Supplemental Data | | | | | | | | | | | | | | | | | | | | |
Net assets, end of year (000) | | $ | 594,163 | | | $ | 975,109 | | | $ | 1,513,587 | | | $ | 593,850 | | | $ | 1,252,029 | |
| | | | | | | | | | | | | | | | | | | | |
| | | | | |
Portfolio turnover rate(f) | | | 28 | % | | | 20 | % | | | 30 | % | | | 29 | % | | | 25 | % |
| | | | | | | | | | | | | | | | | | | | |
| (a) | Based on average shares outstanding. |
| (b) | The amounts reported for a share outstanding may not accord with the change in aggregate gains and losses in securities for the fiscal period due to the timing of capital share transactions in relation to the fluctuating market values of the Fund’s underlying securities. |
| (c) | Distributions for annual periods determined in accordance with U.S. federal income tax regulations. |
| (d) | Where applicable, assumes the reinvestment of distributions. |
| (e) | Excludes fees and expenses incurred indirectly as a result of investments in underlying funds. |
| (f) | Portfolio turnover rate excludes in-kind transactions. |
See notes to financial statements.
| | |
| 18 | | 2 0 2 3 I S H A R E S A N N U A L R E P O R T T O S H A R E H O L D E R S |
Financial Highlights
(For a share outstanding throughout each period)
| | | | | | | | | | | | | | | | | | | | |
| | | iShares Residential and Multisector Real Estate ETF | |
| | | | | |
| | | Year Ended
03/31/23 | | | Year Ended
03/31/22 | | | Year Ended
03/31/21 | | | Year Ended
03/31/20 | | | Year Ended
03/31/19 | |
| | | | | |
Net asset value, beginning of year | | $ | 95.78 | | | $ | 73.95 | | | $ | 55.26 | | | $ | 70.64 | | | $ | 57.61 | |
| | | | | | | | | | | | | | | | | | | | |
| | | | | |
Net investment income(a) | | | 1.66 | | | | 1.46 | | | | 1.51 | | | | 1.55 | | | | 1.80 | |
Net realized and unrealized gain (loss)(b) | | | (24.47 | ) | | | 21.98 | | | | 19.29 | | | | (14.77 | ) | | | 13.45 | |
| | | | | | | | | | | | | | | | | | | | |
| | | | | |
Net increase (decrease) from investment operations | | | (22.81 | ) | | | 23.44 | | | | 20.80 | | | | (13.22 | ) | | | 15.25 | |
| | | | | | | | | | | | | | | | | | | | |
| | | | | |
Distributions(c) | | | | | | | | | | | | | | | | | | | | |
From net investment income | | | (2.37 | ) | | | (1.50 | ) | | | (2.11 | ) | | | (2.16 | ) | | | (2.00 | ) |
From net realized gain | | | — | | | | (0.11 | ) | | | — | | | | — | | | | (0.22 | ) |
| | | | | | | | | | | | | | | | | | | | |
| | | | | |
Total distributions | | | (2.37 | ) | | | (1.61 | ) | | | (2.11 | ) | | | (2.16 | ) | | | (2.22 | ) |
| | | | | | | | | | | | | | | | | | | | |
| | | | | |
Net asset value, end of year | | $ | 70.60 | | | $ | 95.78 | | | $ | 73.95 | | | $ | 55.26 | | | $ | 70.64 | |
| | | | | | | | | | | | | | | | | | | | |
| | | | | |
Total Return(d) | | | | | | | | | | | | | | | | | | | | |
Based on net asset value | | | (23.84 | )% | | | 31.85 | % | | | 38.23 | % | | | (19.25 | )% | | | 26.94 | % |
| | | | | | | | | | | | | | | | | | | | |
| | | | | |
Ratios to Average Net Assets(e) | | | | | | | | | | | | | | | | | | | | |
Total expenses | | | 0.48 | % | | | 0.48 | % | | | 0.48 | % | | | 0.48 | % | | | 0.48 | % |
| | | | | | | | | | | | | | | | | | | | |
| | | | | |
Net investment income | | | 2.10 | % | | | 1.64 | % | | | 2.36 | % | | | 2.07 | % | | | 2.81 | % |
| | | | | | | | | | | | | | | | | | | | |
| | | | | |
Supplemental Data | | | | | | | | | | | | | | | | | | | | |
Net assets, end of year (000) | | $ | 628,342 | | | $ | 1,288,274 | | | $ | 495,459 | | | $ | 331,559 | | | $ | 430,875 | |
| | | | | | | | | | | | | | | | | | | | |
| | | | | |
Portfolio turnover rate(f) | | | 18 | % | | | 8 | % | | | 7 | % | | | 12 | % | | | 10 | % |
| | | | | | | | | | | | | | | | | | | | |
| (a) | Based on average shares outstanding. |
| (b) | The amounts reported for a share outstanding may not accord with the change in aggregate gains and losses in securities for the fiscal period due to the timing of capital share transactions in relation to the fluctuating market values of the Fund’s underlying securities. |
| (c) | Distributions for annual periods determined in accordance with U.S. federal income tax regulations. |
| (d) | Where applicable, assumes the reinvestment of distributions. |
| (e) | Excludes fees and expenses incurred indirectly as a result of investments in underlying funds. |
| (f) | Portfolio turnover rate excludes in-kind transactions. |
See notes to financial statements.
| | |
F I N A N C I A L H I G H L I G H T S | | 19 |
Notes to Financial Statements
iShares Trust (the “Trust”) is registered under the Investment Company Act of 1940, as amended (the “1940 Act”), as an open-end management investment company. The Trust is organized as a Delaware statutory trust and is authorized to have multiple series or portfolios.
These financial statements relate only to the following funds (each, a “Fund” and collectively, the “Funds”):
| | |
| iShares ETF | | Diversification
Classification |
Mortgage Real Estate | | Non-Diversified |
Residential and Multisector Real Estate | | Non-Diversified |
| 2. | SIGNIFICANT ACCOUNTING POLICIES |
The financial statements are prepared in conformity with accounting principles generally accepted in the United States of America (“U.S. GAAP”), which may require management to make estimates and assumptions that affect the reported amounts of assets and liabilities in the financial statements, disclosure of contingent assets and liabilities at the date of the financial statements and the reported amounts of increases and decreases in net assets from operations during the reporting period. Actual results could differ from those estimates. Each Fund is considered an investment company under U.S. GAAP and follows the accounting and reporting guidance applicable to investment companies. Below is a summary of significant accounting policies:
Investment Transactions and Income Recognition: For financial reporting purposes, investment transactions are recorded on the dates the transactions are executed. Realized gains and losses on investment transactions are determined using the specific identification method. Dividend income and capital gain distributions, if any, are recorded on the ex-dividend date. Non-cash dividends, if any, are recorded on the ex-dividend date at fair value. Upon notification from issuers or as estimated by management, a portion of the dividend income received from a real estate investment trust may be redesignated as a reduction of cost of the related investment and/or realized gain.
Collateralization: If required by an exchange or counterparty agreement, the Funds may be required to deliver/deposit cash and/or securities to/with an exchange, or broker-dealer or custodian as collateral for certain investments.
In-kind Redemptions: For financial reporting purposes, in-kind redemptions are treated as sales of securities resulting in realized capital gains or losses to the Funds. Because such gains or losses are not taxable to the Funds and are not distributed to existing Fund shareholders, the gains or losses are reclassified from accumulated net realized gain (loss) to paid-in capital at the end of the Funds’ tax year. These reclassifications have no effect on net assets or net asset value (“NAV”) per share.
Distributions: Dividends and distributions paid by each Fund are recorded on the ex-dividend dates. Distributions are determined on a tax basis and may differ from net investment income, net realized capital gains and/or return of capital for financial reporting purposes. Dividends and distributions are paid in U.S. dollars and cannot be automatically reinvested in additional shares of the Funds.
The character and timing of distributions are determined in accordance with U.S. federal income tax regulations, which may differ from U.S. GAAP. The portion of distributions that exceeds each Fund’s current and accumulated earnings and profits will constitute a non-taxable return of capital. Distributions in excess of each Fund’s minimum distribution requirements, but not in excess of the Fund’s earning and profits, will be taxable to the Fund’s shareholders and will not constitute non-taxable returns of capital. Return of capital distributions will reduce a shareholder’s cost basis and will result in higher capital gains or lower capital losses when each Fund’s shares on which distributions were received are sold. Once a shareholder’s cost basis is reduced to zero, further distributions will be treated as capital gains.
Indemnifications: In the normal course of business, each Fund enters into contracts that contain a variety of representations that provide general indemnification. The Funds’ maximum exposure under these arrangements is unknown because it involves future potential claims against the Funds, which cannot be predicted with any certainty.
| 3. | INVESTMENT VALUATION AND FAIR VALUE MEASUREMENTS |
Investment Valuation Policies: Each Fund’s investments are valued at fair value (also referred to as “market value” within the financial statements) each day that the Fund’s listing exchange is open and, for financial reporting purposes, as of the report date. U.S. GAAP defines fair value as the price a fund would receive to sell an asset or pay to transfer a liability in an orderly transaction between market participants at the measurement date. The Board of Trustees of the Trust (the “Board”) of each Fund has approved the designation of BlackRock Fund Advisors (“BFA”), the Fund’s investment adviser, as the valuation designee for each Fund. Each Fund determines the fair values of its financial instruments using various independent dealers or pricing services under BFA’s policies. If a security’s market price is not readily available or does not otherwise accurately represent the fair value of the security, the security will be valued in accordance with BFA’s policies and procedures as reflecting fair value. BFA has formed a committee (the “Valuation Committee”) to develop pricing policies and procedures and to oversee the pricing function for all financial instruments, with assistance from other BlackRock pricing committees.
Fair Value Inputs and Methodologies: The following methods and inputs are used to establish the fair value of each Fund’s assets and liabilities:
| | • | | Equity investments traded on a recognized securities exchange are valued at that day’s official closing price, as applicable, on the exchange where the stock is primarily traded. Equity investments traded on a recognized exchange for which there were no sales on that day are valued at the last traded price. |
| | • | | Investments in open-end U.S. mutual funds (including money market funds) are valued at that day’s published NAV. |
| | • | | Futures contracts are valued based on that day’s last reported settlement or trade price on the exchange where the contract is traded. |
| | |
| 20 | | 2 0 2 3 I S H A R E S A N N U A L R E P O R T T O S H A R E H O L D E R S |
Notes to Financial Statements (continued)
If events (e.g., market volatility, company announcement or a natural disaster) occur that are expected to materially affect the value of such investment, or in the event that application of these methods of valuation results in a price for an investment that is deemed not to be representative of the market value of such investment, or if a price is not available, the investment will be valued by the Valuation Committee, in accordance with BFA’s policies and procedures as reflecting fair value (“Fair Valued Investments”). The fair valuation approaches that may be used by the Valuation Committee include market approach, income approach and cost approach. Valuation techniques such as discounted cash flow, use of market comparables and matrix pricing are types of valuation approaches and are typically used in determining fair value. When determining the price for Fair Valued Investments, the Valuation Committee seeks to determine the price that each Fund might reasonably expect to receive or pay from the current sale or purchase of that asset or liability in an arm’s-length transaction. Fair value determinations shall be based upon all available factors that the Valuation Committee deems relevant and consistent with the principles of fair value measurement.
Fair value pricing could result in a difference between the prices used to calculate a fund’s NAV and the prices used by the fund’s underlying index, which in turn could result in a difference between the fund’s performance and the performance of the fund’s underlying index.
Fair Value Hierarchy: Various inputs are used in determining the fair value of financial instruments. These inputs to valuation techniques are categorized into a fair value hierarchy consisting of three broad levels for financial reporting purposes as follows:
| | • | | Level 1 – Unadjusted price quotations in active markets/exchanges for identical assets or liabilities that each Fund has the ability to access; |
| | • | | Level 2 – Other observable inputs (including, but not limited to, quoted prices for similar assets or liabilities in markets that are active, quoted prices for identical or similar assets or liabilities in markets that are not active, inputs other than quoted prices that are observable for the assets or liabilities (such as interest rates, yield curves, volatilities, prepayment speeds, loss severities, credit risks and default rates) or other market–corroborated inputs); and |
| | • | | Level 3 – Unobservable inputs based on the best information available in the circumstances, to the extent observable inputs are not available (including the Valuation Committee’s assumptions used in determining the fair value of financial instruments). |
The hierarchy gives the highest priority to unadjusted quoted prices in active markets for identical assets or liabilities (Level 1 measurements) and the lowest priority to unobservable inputs (Level 3 measurements). Accordingly, the degree of judgment exercised in determining fair value is greatest for instruments categorized in Level 3. The inputs used to measure fair value may fall into different levels of the fair value hierarchy. In such cases, for disclosure purposes, the fair value hierarchy classification is determined based on the lowest level input that is significant to the fair value measurement in its entirety. Investments classified within Level 3 have significant unobservable inputs used by the Valuation Committee in determining the price for Fair Valued Investments. Level 3 investments include equity or debt issued by privately held companies or funds that may not have a secondary market and/or may have a limited number of investors. The categorization of a value determined for financial instruments is based on the pricing transparency of the financial instruments and is not necessarily an indication of the risks associated with investing in those securities.
| 4. | SECURITIES AND OTHER INVESTMENTS |
Securities Lending: Each Fund may lend its securities to approved borrowers, such as brokers, dealers and other financial institutions. The borrower pledges and maintains with the Fund collateral consisting of cash, an irrevocable letter of credit issued by an approved bank, or securities issued or guaranteed by the U.S. government. The initial collateral received by each Fund is required to have a value of at least 102% of the current market value of the loaned securities for securities traded on U.S. exchanges and a value of at least 105% for all other securities. The collateral is maintained thereafter at a value equal to at least 100% of the current value of the securities on loan. The market value of the loaned securities is determined at the close of each business day of the Fund and any additional required collateral is delivered to the Fund or excess collateral is returned by the Fund, on the next business day. During the term of the loan, each Fund is entitled to all distributions made on or in respect of the loaned securities but does not receive interest income on securities received as collateral. Loans of securities are terminable at any time and the borrower, after notice, is required to return borrowed securities within the standard time period for settlement of securities transactions.
As of period end, any securities on loan were collateralized by cash and/or U.S. Government obligations. Cash collateral invested in money market funds managed by BFA or its affiliates is disclosed in the Schedule of Investments. Any non-cash collateral received cannot be sold, re-invested or pledged by the Fund, except in the event of borrower default. The securities on loan, if any, are also disclosed in each Fund’s Schedule of Investments. The market value of any securities on loan and the value of any related cash collateral are disclosed in the Statements of Assets and Liabilities.
Securities lending transactions are entered into by the Funds under Master Securities Lending Agreements (each, an “MSLA”) which provide the right, in the event of default (including bankruptcy or insolvency) for the non-defaulting party to liquidate the collateral and calculate a net exposure to the defaulting party or request additional collateral. In the event that a borrower defaults, the Funds, as lender, would offset the market value of the collateral received against the market value of the securities loaned. When the value of the collateral is greater than that of the market value of the securities loaned, the lender is left with a net amount payable to the defaulting party. However, bankruptcy or insolvency laws of a particular jurisdiction may impose restrictions on or prohibitions against such a right of offset in the event of an MSLA counterparty’s bankruptcy or insolvency. Under the MSLA, absent an event of default, the borrower can resell or re-pledge the loaned securities, and the Funds can reinvest cash collateral received in connection with loaned securities. Upon an event of default, the parties’ obligations to return the securities or collateral to the other party are extinguished, and the parties can resell or re-pledge the loaned securities or the collateral received in connection with the loaned securities in order to satisfy the defaulting party’s net payment obligation for all transactions under the MSLA. The defaulting party remains liable for any deficiency.
| | |
N O T E S T O F I N A N C I A L S T A T E M E N T S | | 21 |
Notes to Financial Statements (continued)
As of period end, the following table is a summary of the securities on loan by counterparty which are subject to offset under an MSLA:
| | | | | | | | | | | | | | | | |
| |
| | | | |
iShares ETF and Counterparty | |
| Securities
Loaned at Value |
| |
| Cash
Collateral Received |
(a) | |
| Non-Cash
Collateral Received,
at Fair Value |
(a) | |
| Net
Amount |
|
| |
| | | | |
Mortgage Real Estate | | | | | | | | | | | | | | | | |
Goldman Sachs & Co. LLC | | $ | 1,675,960 | | | $ | (1,675,960 | ) | | $ | — | | | $ | — | |
J.P. Morgan Securities LLC | | | 4,481,009 | | | | (4,481,009 | ) | | | — | | | | — | |
| | | | | | | | | | | | | | | | |
| | | | |
| | $ | 6,156,969 | | | $ | (6,156,969 | ) | | $ | — | | | $ | — | |
| | | | | | | | | | | | | | | | |
| | (a) | Collateral received, if any, in excess of the market value of securities on loan is not presented in this table. The total cash collateral received by each Fund is disclosed in the Funds’ Statements of Assets and Liabilities. | |
The risks of securities lending include the risk that the borrower may not provide additional collateral when required or may not return the securities when due. To mitigate these risks, each Fund benefits from a borrower default indemnity provided by BlackRock, Inc. (“BlackRock”). BlackRock’s indemnity allows for full replacement of the securities loaned to the extent the collateral received does not cover the value of the securities loaned in the event of borrower default. Each Fund could incur a loss if the value of an investment purchased with cash collateral falls below the market value of the loaned securities or if the value of an investment purchased with cash collateral falls below the value of the original cash collateral received. Such losses are borne entirely by each Fund.
| 5. | DERIVATIVE FINANCIAL INSTRUMENTS |
Futures Contracts: Futures contracts are purchased or sold to gain exposure to, or manage exposure to, changes in interest rates (interest rate risk) and changes in the value of equity securities (equity risk) or foreign currencies (foreign currency exchange rate risk).
Futures contracts are exchange-traded agreements between the Funds and a counterparty to buy or sell a specific quantity of an underlying instrument at a specified price and on a specified date. Depending on the terms of a contract, it is settled either through physical delivery of the underlying instrument on the settlement date or by payment of a cash amount on the settlement date. Upon entering into a futures contract, the Funds are required to deposit initial margin with the broker in the form of cash or securities in an amount that varies depending on a contract’s size and risk profile. The initial margin deposit must then be maintained to an established level over the life of the contract. Amounts pledged, which are considered restricted, are included in cash pledged for futures contracts in the Statements of Assets and Liabilities.
Securities deposited as initial margin are designated in the Schedule of Investments and cash deposited, if any, are shown as cash pledged for futures contracts in the Statements of Assets and Liabilities. Pursuant to the contract, the Funds agree to receive from or pay to the broker an amount of cash equal to the daily fluctuation in market value of the contract (“variation margin”). Variation margin is recorded as unrealized appreciation (depreciation) and, if any, shown as variation margin receivable (or payable) on futures contracts in the Statements of Assets and Liabilities. When the contract is closed, a realized gain or loss is recorded in the Statements of Operations equal to the difference between the notional amount of the contract at the time it was opened and the notional amount at the time it was closed. The use of futures contracts involves the risk of an imperfect correlation in the movements in the price of futures contracts and interest rates, foreign currency exchange rates or underlying assets.
| 6. | INVESTMENT ADVISORY AGREEMENT AND OTHER TRANSACTIONS WITH AFFILIATES |
Investment Advisory Fees: Pursuant to an Investment Advisory Agreement with the Trust, BFA manages the investment of each Fund’s assets. BFA is a California corporation indirectly owned by BlackRock. Under the Investment Advisory Agreement, BFA is responsible for substantially all expenses of the Funds, except (i) interest and taxes; (ii) brokerage commissions and other expenses connected with the execution of portfolio transactions; (iii) distribution fees; (iv) the advisory fee payable to BFA; and (v) litigation expenses and any extraordinary expenses (in each case as determined by a majority of the independent trustees).
For its investment advisory services to each of the following Funds, BFA is entitled to an annual investment advisory fee, accrued daily and paid monthly by the Funds, based on the average daily net assets of each Fund as follows:
| | | | |
| | |
| iShares ETF | | Investment Advisory Fees | |
| |
Mortgage Real Estate | | | 0.48 | % |
Residential and Multisector Real Estate | | | 0.48 | |
Distributor: BlackRock Investments, LLC (“BRIL”), an affiliate of BFA, is the distributor for each Fund. Pursuant to the distribution agreement, BFA is responsible for any fees or expenses for distribution services provided to the Funds.
ETF Servicing Fees: Each Fund has entered into an ETF Services Agreement with BRIL to perform certain order processing, Authorized Participant communications, and related services in connection with the issuance and redemption of Creation Units (“ETF Services”). BRIL is entitled to a transaction fee from Authorized Participants on each creation or redemption order for the ETF Services provided. The Funds do not pay BRIL for ETF Services.
Prior to April 25, 2022, ETF Services were performed by State Street Bank and Trust Company.
Securities Lending: The U.S. Securities and Exchange Commission (the “SEC”) has issued an exemptive order which permits BlackRock Institutional Trust Company, N.A. (“BTC”), an affiliate of BFA, to serve as securities lending agent for the Funds, subject to applicable conditions. As securities lending agent, BTC bears all operational costs directly related to securities lending, including any custodial costs. Each Fund is responsible for fees in connection with the investment of cash collateral received for securities on loan (the “collateral investment fees”). The cash collateral is invested in a money market fund, BlackRock Cash Funds: Institutional or BlackRock Cash Funds: Treasury,
| | |
| 22 | | 2 0 2 3 I S H A R E S A N N U A L R E P O R T T O S H A R E H O L D E R S |
Notes to Financial Statements (continued)
managed by BFA, or its affiliates. However, BTC has agreed to reduce the amount of securities lending income it receives in order to effectively limit the collateral investment fees each Fund bears to an annual rate of 0.04%. The SL Agency Shares of such money market fund will not be subject to a sales load, distribution fee or service fee. The money market fund in which the cash collateral has been invested may, under certain circumstances, impose a liquidity fee of up to 2% of the value redeemed or temporarily restrict redemptions for up to 10 business days during a 90 day period, in the event that the money market fund’s weekly liquid assets fall below certain thresholds.
Securities lending income is equal to the total of income earned from the reinvestment of cash collateral, net of fees and other payments to and from borrowers of securities, and less the collateral investment fees. Each Fund retains a portion of securities lending income and remits the remaining portion to BTC as compensation for its services as securities lending agent.
Pursuant to the current securities lending agreement, each Fund retains 81% of securities lending income (which excludes collateral investment fees) and the amount retained can never be less than 70% of the total of securities lending income plus the collateral investment fees.
In addition, commencing the business day following the date that the aggregate securities lending income plus the collateral investment fees generated across all 1940 Act iShares exchange-traded funds (the “iShares ETF Complex”) in that calendar year exceeds a specified threshold, each Fund, pursuant to the securities lending agreement, will retain for the remainder of that calendar year 81% of securities lending income (which excludes collateral investment fees), and the amount retained can never be less than 70% of the total of securities lending income plus the collateral investment fees.
The share of securities lending income earned by each Fund is shown as securities lending income - affiliated - net in its Statements of Operations. For the year ended March 31, 2023, the Funds paid BTC the following amounts for securities lending agent services:
| | | | |
| | |
| iShares ETF | | Amounts | |
| |
Mortgage Real Estate | | $ | 22,232 | |
Residential and Multisector Real Estate | | | 5,828 | |
Officers and Trustees: Certain officers and/or trustees of the Trust are officers and/or trustees of BlackRock or its affiliates.
Other Transactions: Cross trading is the buying or selling of portfolio securities between funds to which BFA (or an affiliate) serves as investment adviser. At its regularly scheduled quarterly meetings, the Board reviews such transactions as of the most recent calendar quarter for compliance with the requirements and restrictions set forth by Rule 17a-7.
For the year ended March 31, 2023, transactions executed by the Funds pursuant to Rule 17a-7 under the 1940 Act were as follows:
| | | | | | | | | | | | |
| | | | |
| iShares ETF | | Purchases | | | Sales | | | Net Realized
Gain (Loss) | |
Mortgage Real Estate | | $ | 16,886,254 | | | $ | 42,064,041 | | | $ | (15,129,925 | ) |
Residential and Multisector Real Estate | | | 40,990,397 | | | | 45,745,158 | | | | (18,773,927 | ) |
Each Fund may invest its positive cash balances in certain money market funds managed by BFA or an affiliate. The income earned on these temporary cash investments is shown as dividends - affiliated in the Statements of Operations.
A fund, in order to improve its portfolio liquidity and its ability to track its underlying index, may invest in shares of other iShares funds that invest in securities in the fund’s underlying index.
For the year ended March 31, 2023, purchases and sales of investments, excluding short-term securities and in-kind transactions, were as follows:
| | | | | | | | |
| | | |
| iShares ETF | | Purchases | | | Sales | |
Mortgage Real Estate | | $ | 216,701,578 | | | $ | 204,771,506 | |
Residential and Multisector Real Estate | | | 158,066,541 | | | | 150,124,435 | |
For the year ended March 31, 2023, in-kind transactions were as follows:
| | | | | | | | |
| | | |
| iShares ETF | | In-kind
Purchases | | | In-kind
Sales | |
Mortgage Real Estate | | $ | 476,619,332 | | | $ | 567,116,334 | |
Residential and Multisector Real Estate | | | 192,788,301 | | | | 565,875,753 | |
Each Fund is treated as an entity separate from the Trust’s other funds for federal income tax purposes. It is each Fund’s policy to comply with the requirements of the Internal Revenue Code of 1986, as amended, applicable to regulated investment companies, and to distribute substantially all of its taxable income to its shareholders. Therefore, no U.S. federal income tax provision is required.
| | |
N O T E S T O F I N A N C I A L S T A T E M E N T S | | 23 |
Notes to Financial Statements (continued)
Management has analyzed tax laws and regulations and their application to the Funds as of March 31, 2023, inclusive of the open tax return years, and does not believe that there are any uncertain tax positions that require recognition of a tax liability in the Funds’ financial statements.
U.S. GAAP requires that certain components of net assets be adjusted to reflect permanent differences between financial and tax reporting. These reclassifications have no effect on net assets or NAV per share. As of March 31, 2023, permanent differences attributable to realized gains (losses) from in-kind redemptions and distributions paid in excess of taxable income were reclassified to the following accounts:
| | | | | | | | |
| | | |
| iShares ETF | | Paid-in capital | | | Accumulated earnings (loss) | |
Mortgage Real Estate | | $ | (16,227,988 | ) | | $ | 16,227,988 | |
Residential and Multisector Real Estate | | | 32,482,220 | | | | (32,482,220 | ) |
The tax character of distributions paid was as follows:
| | | | | | | | |
| | | |
| iShares ETF | | Year Ended
March 31, 2023 | | | Year Ended
March 31, 2022 | |
Mortgage Real Estate | | | | | | | | |
Ordinary income | | $ | 61,974,466 | | | $ | 81,209,640 | |
Return of capital | | | 6,144,140 | | | | — | |
| | | | | | | | |
| | $ | 68,118,606 | | | $ | 81,209,640 | |
| | | | | | | | |
| | |
Residential and Multisector Real Estate | | | | | | | | |
Ordinary income | | $ | 24,693,312 | | | $ | 17,568,653 | |
Long term capital gains | | | — | | | | 1,263,714 | |
| | | | | | | | |
| | $ | 24,693,312 | | | $ | 18,832,367 | |
| | | | | | | | |
As of March 31, 2023, the tax components of accumulated net earnings (losses) were as follows:
| | | | | | | | | | | | |
| | | | |
| iShares ETF | | Non-expiring
Capital Loss
Carryforwards(a) | | | Net Unrealized
Gains (Losses)(b) | | | Total | |
Mortgage Real Estate | | $ | (276,754,574 | ) | | $ | (339,988,648 | ) | | $ | (616,743,222 | ) |
Residential and Multisector Real Estate | | | (26,817,079 | ) | | | (187,184,621 | ) | | | (214,001,700 | ) |
| (a) | Amounts available to offset future realized capital gains. |
| (b) | The difference between book-basis and tax-basis unrealized gains (losses) was attributable primarily to the tax deferral of losses on wash sales, the realization for tax purposes of unrealized gains (losses) on certain futures contracts and characterization of corporate actions. |
As of March 31, 2023, gross unrealized appreciation and depreciation based on cost of investments (including short positions and derivatives, if any) for U.S. federal income tax purposes were as follows:
| | | | | | | | | | | | | | | | |
| | | | | |
| iShares ETF | | Tax Cost | | | Gross Unrealized
Appreciation | | | Gross Unrealized
Depreciation | | | Net Unrealized
Appreciation
(Depreciation) | |
Mortgage Real Estate | | $ | 925,481,695 | | | $ | 401,485 | | | $ | (340,390,133 | ) | | $ | (339,988,648 | ) |
Residential and Multisector Real Estate | | | 812,765,355 | | | | 915,938 | | | | (188,100,559 | ) | | | (187,184,621 | ) |
In the normal course of business, each Fund invests in securities or other instruments and may enter into certain transactions, and such activities subject the Fund to various risks, including, among others, fluctuations in the market (market risk) or failure of an issuer to meet all of its obligations. The value of securities or other instruments may also be affected by various factors, including, without limitation: (i) the general economy; (ii) the overall market as well as local, regional or global political and/or social instability; (iii) regulation, taxation or international tax treaties between various countries; or (iv) currency, interest rate or price fluctuations. Local, regional or global events such as war, acts of terrorism, the spread of infectious illness or other public health issues, recessions, or other events could have a significant impact on the Funds and their investments. Each Fund’s prospectus provides details of the risks to which the Fund is subject.
BFA uses a “passive” or index approach to try to achieve each Fund’s investment objective following the securities included in its underlying index during upturns as well as downturns. BFA does not take steps to reduce market exposure or to lessen the effects of a declining market. Divergence from the underlying index and the composition of the portfolio is monitored by BFA.
The Funds may be exposed to additional risks when reinvesting cash collateral in money market funds that do not seek to maintain a stable NAV per share of $1.00, which may be subject to redemption gates or liquidity fees under certain circumstances.
Infectious Illness Risk: An outbreak of an infectious illness, such as the COVID-19 pandemic, may adversely impact the economies of many nations and the global economy, and may impact individual issuers and capital markets in ways that cannot be foreseen. An infectious illness outbreak may result in, among other things, closed international borders, prolonged quarantines, supply chain disruptions, market volatility or disruptions and other significant economic, social and political impacts.
| | |
| 24 | | 2 0 2 3 I S H A R E S A N N U A L R E P O R T T O S H A R E H O L D E R S |
Notes to Financial Statements (continued)
Valuation Risk: The market values of equities, such as common stocks and preferred securities or equity related investments, such as futures and options, may decline due to general market conditions which are not specifically related to a particular company. They may also decline due to factors which affect a particular industry or industries. A fund may invest in illiquid investments. An illiquid investment is any investment that a fund reasonably expects cannot be sold or disposed of in current market conditions in seven calendar days or less without the sale or disposition significantly changing the market value of the investment. A fund may experience difficulty in selling illiquid investments in a timely manner at the price that it believes the investments are worth. Prices may fluctuate widely over short or extended periods in response to company, market or economic news. Markets also tend to move in cycles, with periods of rising and falling prices. This volatility may cause a fund’s NAV to experience significant increases or decreases over short periods of time. If there is a general decline in the securities and other markets, the NAV of a fund may lose value, regardless of the individual results of the securities and other instruments in which a fund invests.
Counterparty Credit Risk: The Funds may be exposed to counterparty credit risk, or the risk that an entity may fail to or be unable to perform on its commitments related to unsettled or open transactions, including making timely interest and/or principal payments or otherwise honoring its obligations. The Funds manage counterparty credit risk by entering into transactions only with counterparties that BFA believes have the financial resources to honor their obligations and by monitoring the financial stability of those counterparties. Financial assets, which potentially expose the Funds to market, issuer and counterparty credit risks, consist principally of financial instruments and receivables due from counterparties. The extent of the Fund’s exposure to market, issuer and counterparty credit risks with respect to these financial assets is approximately their value recorded in the Statements of Assets and Liabilities, less any collateral held by the Funds.
A derivative contract may suffer a mark-to-market loss if the value of the contract decreases due to an unfavorable change in the market rates or values of the underlying instrument. Losses can also occur if the counterparty does not perform under the contract.
With exchange-traded futures, there is less counterparty credit risk to the Funds since the exchange or clearinghouse, as counterparty to such instruments, guarantees against a possible default. The clearinghouse stands between the buyer and the seller of the contract; therefore, credit risk is limited to failure of the clearinghouse. While offset rights may exist under applicable law, a Fund does not have a contractual right of offset against a clearing broker or clearinghouse in the event of a default (including the bankruptcy or insolvency). Additionally, credit risk exists in exchange-traded futures with respect to initial and variation margin that is held in a clearing broker’s customer accounts. While clearing brokers are required to segregate customer margin from their own assets, in the event that a clearing broker becomes insolvent or goes into bankruptcy and at that time there is a shortfall in the aggregate amount of margin held by the clearing broker for all its clients, typically the shortfall would be allocated on a pro rata basis across all the clearing broker’s customers, potentially resulting in losses to the Funds.
Concentration Risk: A diversified portfolio, where this is appropriate and consistent with a fund’s objectives, minimizes the risk that a price change of a particular investment will have a material impact on the NAV of a fund. The investment concentrations within each Fund’s portfolio are disclosed in its Schedule of Investments.
The Funds invest a significant portion of their assets in securities within a single or limited number of market sectors. When a Fund concentrates its investments in this manner, it assumes the risk that economic, regulatory, political and social conditions affecting such sectors may have a significant impact on the fund and could affect the income from, or the value or liquidity of, the fund’s portfolio. Investment percentages in specific sectors are presented in the Schedule of Investments.
Significant Shareholder Redemption Risk: Certain shareholders may own or manage a substantial amount of fund shares and/or hold their fund investments for a limited period of time. Large redemptions of fund shares by these shareholders may force a fund to sell portfolio securities, which may negatively impact the fund’s NAV, increase the fund’s brokerage costs, and/or accelerate the realization of taxable income/gains and cause the fund to make additional taxable distributions to shareholders.
| 10. | CAPITAL SHARE TRANSACTIONS |
Capital shares are issued and redeemed by each Fund only in aggregations of a specified number of shares or multiples thereof (“Creation Units”) at NAV. Except when aggregated in Creation Units, shares of each Fund are not redeemable.
Transactions in capital shares were as follows:
| | | | | | | | | | | | | | | | |
| |
| | | Year Ended
03/31/23 | | | Year Ended
03/31/22 | |
| | | | | | | | |
| iShares ETF | | Shares | | | Amount | | | Shares | | | Amount | |
| |
Mortgage Real Estate | | | | | | | | | | | | | | | | |
Shares sold | | | 18,600,000 | | | $ | 473,627,895 | | | | 8,400,000 | | | $ | 299,578,675 | |
Shares redeemed | | | (21,250,000 | ) | | | (544,652,518 | ) | | | (21,550,000 | ) | | | (746,310,868 | ) |
| | | | | | | | | | | | | | | | |
| | | (2,650,000 | ) | | $ | (71,024,623 | ) | | | (13,150,000 | ) | | $ | (446,732,193 | ) |
| | | | | | | | | | | | | | | | |
Residential and Multisector Real Estate | | | | | | | | | | | | | | | | |
Shares sold | | | 2,150,000 | | | $ | 189,986,614 | | | | 10,400,000 | | | $ | 926,228,317 | |
Shares redeemed | | | (6,700,000 | ) | | | (550,150,123 | ) | | | (3,650,000 | ) | | | (336,763,636 | ) |
| | | | | | | | | | | | | | | | |
| | | (4,550,000 | ) | | $ | (360,163,509 | ) | | | 6,750,000 | | | $ | 589,464,681 | |
| | | | | | | | | | | | | | | | |
The consideration for the purchase of Creation Units of a fund in the Trust generally consists of the in-kind deposit of a designated portfolio of securities and a specified amount of cash. Certain funds in the Trust may be offered in Creation Units solely or partially for cash in U.S. dollars. Investors purchasing and redeeming Creation Units may pay a purchase transaction fee and a redemption transaction fee directly to BRIL, to offset transfer and other transaction costs associated with the issuance and redemption of Creation Units, including Creation Units for cash. Investors transacting in Creation Units for cash may also pay an additional variable charge to compensate the relevant fund
| | |
N O T E S T O F I N A N C I A L S T A T E M E N T S | | 25 |
Notes to Financial Statements (continued)
for certain transaction costs (i.e., stamp taxes, taxes on currency or other financial transactions, and brokerage costs) and market impact expenses relating to investing in portfolio securities. Such variable charges, if any, are included in shares sold in the table above.
From time to time, settlement of securities related to in-kind contributions or in-kind redemptions may be delayed. In such cases, securities related to in-kind transactions are reflected as a receivable or a payable in the Statements of Assets and Liabilities.
Management has evaluated the impact of all subsequent events on the Funds through the date the financial statements were available to be issued and has determined that there were no subsequent events requiring adjustment or additional disclosure in the financial statements.
| | |
| 26 | | 2 0 2 3 I S H A R E S A N N U A L R E P O R T T O S H A R E H O L D E R S |
Report of Independent Registered Public Accounting Firm
To the Board of Trustees of
iShares Trust and Shareholders of each of the two funds listed in the table below
Opinions on the Financial Statements
We have audited the accompanying statements of assets and liabilities, including the schedules of investments, of each of the funds listed in the table below (two of the funds constituting iShares Trust, hereafter collectively referred to as the “Funds”) as of March 31, 2023, the related statements of operations for the year ended March 31, 2023, the statements of changes in net assets for each of the two years in the period ended March 31, 2023, including the related notes, and the financial highlights for each of the five years in the period ended March 31, 2023 (collectively referred to as the “financial statements”). In our opinion, the financial statements present fairly, in all material respects, the financial position of each of the Funds as of March 31, 2023, the results of each of their operations for the year then ended, the changes in each of their net assets for each of the two years in the period ended March 31, 2023 and each of the financial highlights for each of the five years in the period ended March 31, 2023 in conformity with accounting principles generally accepted in the United States of America.
|
iShares Mortgage Real Estate ETF |
iShares Residential and Multisector Real Estate ETF |
Basis for Opinions
These financial statements are the responsibility of the Funds’ management. Our responsibility is to express an opinion on the Funds’ financial statements based on our audits. We are a public accounting firm registered with the Public Company Accounting Oversight Board (United States) (PCAOB) and are required to be independent with respect to the Funds in accordance with the U.S. federal securities laws and the applicable rules and regulations of the Securities and Exchange Commission and the PCAOB.
We conducted our audits of these financial statements in accordance with the standards of the PCAOB. Those standards require that we plan and perform the audit to obtain reasonable assurance about whether the financial statements are free of material misstatement, whether due to error or fraud.
Our audits included performing procedures to assess the risks of material misstatement of the financial statements, whether due to error or fraud, and performing procedures that respond to those risks. Such procedures included examining, on a test basis, evidence regarding the amounts and disclosures in the financial statements. Our audits also included evaluating the accounting principles used and significant estimates made by management, as well as evaluating the overall presentation of the financial statements. Our procedures included confirmation of securities owned as of March 31, 2023 by correspondence with the custodian, transfer agent and brokers; when replies were not received from brokers, we performed other auditing procedures. We believe that our audits provide a reasonable basis for our opinions.
/s/PricewaterhouseCoopers LLP
Philadelphia, Pennsylvania
May 25, 2023
We have served as the auditor of one or more BlackRock investment companies since 2000.
| | |
R E P O R T O F I N D E P E N D E N T R E G I S T E R E D P U B L I C A C C O U N T I N G F I R M | | 27 |
Important Tax Information (unaudited)
The following amounts, or maximum amounts allowable by law, are hereby designated as qualified dividend income for individuals for the fiscal year ended March 31, 2023:
| | | | |
| iShares ETF | | Qualified Dividend
Income | |
Mortgage Real Estate | | $ | 1,594,738 | |
Residential and Multisector Real Estate | | | 50,635 | |
The following amounts, or maximum amounts allowable by law, are hereby designated as qualified business income for individuals for the fiscal year ended March 31, 2023:
| | | | |
| iShares ETF | | Qualified Business
Income | |
Mortgage Real Estate | | $ | 29,491,485 | |
Residential and Multisector Real Estate | | | 11,921,827 | |
The following percentages, or maximum percentages allowable by law, of ordinary income distributions paid during the fiscal year ended March 31, 2023 qualified for the dividends-received deduction for corporate shareholders:
| | | | |
| iShares ETF | | Dividends-Received
Deduction | |
Mortgage Real Estate | | | 0.98 | % |
| | |
| 28 | | 2 0 2 3 I S H A R E S A N N U A L R E P O R T T O S H A R E H O L D E R S |
Statement Regarding Liquidity Risk Management Program (unaudited)
In compliance with Rule 22e-4 under the Investment Company Act of 1940, as amended (the “Liquidity Rule”), iShares Trust (the “Trust”) has adopted and implemented a liquidity risk management program (the “Program”) for iShares Mortgage Real Estate ETF and iShares Residential and Multisector Real Estate ETF (the “Funds” or “ETFs”), each a series of the Trust, which is reasonably designed to assess and manage each Fund’s liquidity risk.
The Board of Trustees (the “Board”) of the Trust, on behalf of the Funds, met on December 9, 2022 (the “Meeting”) to review the Program. The Board previously appointed BlackRock Fund Advisors (“BlackRock”), the investment adviser to the Funds, as the program administrator for each Fund’s Program. BlackRock also previously delegated oversight of the Program to the 40 Act Liquidity Risk Management Committee (the “Committee”). At the Meeting, the Committee, on behalf of BlackRock, provided the Board with a report that addressed the operation of the Program and assessed its adequacy and effectiveness of implementation, including the management of each Fund’s Highly Liquid Investment Minimum (“HLIM”) where applicable, and any material changes to the Program (the “Report”). The Report covered the period from October 1, 2021 through September 30, 2022 (the “Program Reporting Period”).
The Report described the Program’s liquidity classification methodology for categorizing each Fund’s investments (including derivative transactions) into one of four liquidity buckets. It also referenced the methodology used by BlackRock to establish each Fund’s HLIM and noted that the Committee reviews and ratifies the HLIM assigned to each Fund no less frequently than annually. The Report also discussed notable events affecting liquidity over the Program Reporting Period, including extended market holidays, the imposition of capital controls in certain non-U.S. countries, Russian sanctions and the closure of the Russian securities market.
The Report noted that the Program complied with the key factors for consideration under the Liquidity Rule for assessing, managing and periodically reviewing each Fund’s liquidity risk, as follows:
| | a) | The Fund’s investment strategy and liquidity of portfolio investments during both normal and reasonably foreseeable stressed conditions. During the Program Reporting Period, the Committee reviewed whether each Fund’s strategy is appropriate for an open-end fund structure, with a focus on funds with more significant and consistent holdings of less liquid and illiquid assets. The Committee also factored a fund’s concentration in an issuer into the liquidity classification methodology by taking issuer position sizes into account. Derivative exposure was also considered in the calculation of a fund’s liquidity bucketing. Finally, a factor for consideration under the Liquidity Rule is a Fund’s use of borrowings for investment purposes. However, the Funds do not borrow for investment purposes. |
| | b) | Short-term and long-term cash flow projections during both normal and reasonably foreseeable stressed conditions. During the Program Reporting Period, the Committee reviewed historical redemption activity and used this information as a component to establish each ETF’s reasonably anticipated trading size (“RATS”). The Committee may also take into consideration a fund’s shareholder ownership concentration (which, depending on product type and distribution channel, may or may not be available), a fund’s distribution channels, and the degree of certainty associated with a fund’s short-term and long-term cash flow projections. |
| | c) | Holdings of cash and cash equivalents, as well as borrowing arrangements. The Committee considered that ETFs generally do not hold more than de minimis amounts of cash. The Committee also considered that ETFs generally do not engage in borrowing. |
| | d) | The relationship between an ETF’s portfolio liquidity and the way in which, and the prices and spreads at which, ETF shares trade, including the efficiency of the arbitrage function and the level of active participation by market participants, including authorized participants. The Committee monitored the prevailing bid/ask spread and the ETF price premium (or discount) to NAV for all ETFs. However, there were no ETFs with persistent deviations of fund premium/discount or bid/ask spreads from long-term averages over the Program Reporting Period. |
| | e) | The effect of the composition of baskets on the overall liquidity of an ETF’s portfolio. In reviewing the linkage between the composition of custom baskets accepted by an ETF and any significant change in the liquidity profile of such ETF, the Committee reviewed changes in the proportion of each ETF’s portfolio comprised of less liquid and illiquid holdings to determine if applicable thresholds were met requiring enhanced review. |
There were no material changes to the Program during the Program Reporting Period other than the enhancement of certain model components in the Program’s classification methodology. The Report provided to the Board stated that the Committee concluded that based on the operation of the functions, as described in the Report, the Program is operating as intended and is effective in implementing the requirements of the Liquidity Rule.
| | |
S T A T E M E N T R E G A R D I N G L I Q U I D I T Y R I S K M A N A G E M E N T P R O G R A M | | 29 |
Supplemental Information (unaudited)
Section 19(a) Notices
The amounts and sources of distributions reported are estimates and are being provided pursuant to regulatory requirements and are not being provided for tax reporting purposes. The actual amounts and sources for tax reporting purposes will depend upon each Fund’s investment experience during the year and may be subject to changes based on tax regulations. Shareholders will receive a Form 1099-DIV each calendar year that will inform them how to report these distributions for federal income tax purposes.
March 31, 2023
| | | | | | | | | | | | | | | | | | | | | | | | | | | | | | | | |
| | | |
| | | Total Cumulative Distributions
for the Fiscal Year-to-Date | | | % Breakdown of the Total Cumulative
Distributions for the Fiscal Year-to-Date | |
| iShares ETF | | Net
Investment
Income | | | Net Realized
Capital Gains | | | Return of
Capital | | | Total Per
Share | | | Net
Investment
Income | | | Net Realized
Capital Gains
| | | Return of
Capital | | | Total Per
Share | |
Mortgage Real Estate(a) | | $ | 2.505192 | | | $ | — | | | $ | 0.017360 | | | $ | 2.522552 | | | | 99 | % | | | — | % | | | 1 | % | | | 100 | % |
Residential and Multisector Real Estate | | | 2.369643 | | | | — | | | | — | | | | 2.369643 | | | | 100 | | | | — | | | | — | | | | 100 | |
| | (a) | The Fund estimates that it has distributed more than its net investment income and net realized capital gains; therefore, a portion of the distribution may be a return of capital. A return of capital may occur, for example, when some or all of the shareholder’s investment in the Fund is returned to the shareholder. A return of capital does not necessarily reflect the Fund’s investment performance and should not be confused with “yield” or “income”. When distributions exceed total return performance, the difference will incrementally reduce the Fund’s net asset value per share. | |
Premium/Discount Information
Information on the Fund’s net asset value, market price, premiums and discounts, and bid-ask spreads can be found at iShares.com.
| | |
| 30 | | 2 0 2 3 I S H A R E S A N N U A L R E P O R T T O S H A R E H O L D E R S |
Trustee and Officer Information
The Board of Trustees has responsibility for the overall management and operations of the Funds, including general supervision of the duties performed by BFA and other service providers. Each Trustee serves until he or she resigns, is removed, dies, retires or becomes incapacitated. Each officer shall hold office until his or her successor is elected and qualifies or until his or her death, resignation or removal. Trustees who are not “interested persons” (as defined in the 1940 Act) of the Trust are referred to as independent trustees (“Independent Trustees”).
The registered investment companies advised by BFA or its affiliates (the “BlackRock-advised Funds”) are organized into one complex of open-end equity, multi-asset, index and money market funds and ETFs (the “BlackRock Multi-Asset Complex”), one complex of closed-end funds and open-end non-index fixed-income funds (including ETFs) (the “BlackRock Fixed-Income Complex”) and one complex of ETFs (“Exchange-Traded Fund Complex”) (each, a “BlackRock Fund Complex”). Each Fund is included in the Exchange-Traded Fund Complex. Each Trustee also serves as a Director of iShares, Inc. and a Trustee of iShares U.S. ETF Trust and, as a result, oversees all of the funds within the Exchange-Traded Fund Complex, which consists of 380 funds as of March 31, 2023. With the exception of Robert S. Kapito, Salim Ramji and Charles Park, the address of each Trustee and officer is c/o BlackRock, Inc., 400 Howard Street, San Francisco, CA 94105. The address of Mr. Kapito, Mr. Ramji and Mr. Park is c/o BlackRock, Inc., 50 Hudson Yards, New York, NY 10001. The Board has designated John E. Kerrigan as its Independent Board Chair. Additional information about the Funds’ Trustees and officers may be found in the Funds’ combined Statement of Additional Information, which is available without charge, upon request, by calling toll-free 1-800-iShares (1-800-474-2737).
| | | | | | |
| Interested Trustees |
| | | | |
Name (Year of Birth) | | Position(s) | | Principal Occupation(s) During Past 5 Years | | Other Directorships Held by Trustee |
| | | |
Robert S. Kapito(a) (1957) | | Trustee (since 2009). | | President, BlackRock, Inc. (since 2006); Vice Chairman of BlackRock, Inc. and Head of BlackRock’s Portfolio Management Group (since its formation in 1998) and BlackRock, Inc.’s predecessor entities (since 1988); Trustee, University of Pennsylvania (since 2009); President of Board of Directors, Hope & Heroes Children’s Cancer Fund (since 2002). | | Director of BlackRock, Inc. (since 2006); Director of iShares, Inc. (since 2009); Trustee of iShares U.S. ETF Trust (since 2011). |
| | | |
Salim Ramji(b) (1970) | | Trustee (since 2019). | | Senior Managing Director, BlackRock, Inc. (since 2014); Global Head of BlackRock’s ETF and Index Investments Business (since 2019); Head of BlackRock’s U.S. Wealth Advisory Business (2015-2019); Global Head of Corporate Strategy, BlackRock, Inc. (2014-2015); Senior Partner, McKinsey & Company (2010-2014). | | Director of iShares, Inc. (since 2019); Trustee of iShares U.S. ETF Trust (since 2019). |
(a) Robert S. Kapito is deemed to be an “interested person” (as defined in the 1940 Act) of the Trust due to his affiliations with BlackRock, Inc. and its affiliates. (b) Salim Ramji is deemed to be an “interested person” (as defined in the 1940 Act) of the Trust due to his affiliations with BlackRock, Inc. and its affiliates. |
| | | | | | |
| Independent Trustees |
| | | | |
Name (Year of Birth) | | Position(s) | | Principal Occupation(s) During Past 5 Years | | Other Directorships Held by Trustee |
| | | |
John E. Kerrigan (1955) | | Trustee (since 2005); Independent Board Chair (since 2022). | | Chief Investment Officer, Santa Clara University (since 2002). | | Director of iShares, Inc. (since 2005); Trustee of iShares U.S. ETF Trust (since 2011); Independent Board Chair of iShares, Inc. and iShares U.S. ETF Trust (since 2022). |
| | | |
Jane D. Carlin (1956) | | Trustee (since 2015); Risk Committee Chair (since 2016). | | Consultant (since 2012); Member of the Audit Committee (2012-2018), Chair of the Nominating and Governance Committee (2017-2018) and Director of PHH Corporation (mortgage solutions) (2012-2018); Managing Director and Global Head of Financial Holding Company Governance & Assurance and the Global Head of Operational Risk Management of Morgan Stanley (2006-2012). | | Director of iShares, Inc. (since 2015); Trustee of iShares U.S. ETF Trust (since 2015); Member of the Audit Committee (since 2016), Chair of the Audit Committee (since 2020) and Director of The Hanover Insurance Group, Inc. (since 2016). |
| | | |
Richard L. Fagnani (1954) | | Trustee (since 2017); Audit Committee Chair (since 2019). | | Partner, KPMG LLP (2002-2016); Director of One Generation Away (since 2021). | | Director of iShares, Inc. (since 2017); Trustee of iShares U.S. ETF Trust (since 2017). |
| | |
T R U S T E E A N D O F F I C E R I N F O R M A T I O N | | 31 |
Trustee and Officer Information (continued)
| | | | | | |
| Independent Trustees |
| | | | |
Name (Year of Birth) | | Position(s) | | Principal Occupation(s) During Past 5 Years | | Other Directorships Held by Trustee |
| | | |
Cecilia H. Herbert (1949) | | Trustee (since 2005); Nominating and Governance and Equity Plus Committee Chairs (since 2022). | | Chair of the Finance Committee (since 2019) and Trustee and Member of the Finance, Audit and Quality Committees of Stanford Health Care (since 2016); Trustee of WNET, New York’s public media company (since 2011) and Member of the Audit Committee (since 2018), Investment Committee (since 2011) and Personnel Committee (since 2022); Chair (1994-2005) and Member (1992-2021) of the Investment Committee, Archdiocese of San Francisco; Trustee of Forward Funds (14 portfolios) (2009-2018); Trustee of Salient MF Trust (4 portfolios) (2015- 2018); Director (1998-2013) and President (2007-2011) of the Board of Directors, Catholic Charities CYO; Trustee (2002-2011) and Chair of the Finance and Investment Committee (2006-2010) of the Thacher School; Director of the Senior Center of Jackson Hole (since 2020); Director of the Jackson Hole Center for the Arts (since 2021); Member of the Wyoming State Investment Funds Committee (since 2022). | | Director of iShares, Inc. (since 2005); Trustee of iShares U.S. ETF Trust (since 2011). |
| | | |
Drew E. Lawton (1959) | | Trustee (since 2017); 15(c) Committee Chair (since 2017). | | Senior Managing Director of New York Life Insurance Company (2010-2015). | | Director of iShares, Inc. (since 2017); Trustee of iShares U.S. ETF Trust (since 2017); Director of Jackson Financial Inc. (since 2021). |
| | | |
John E. Martinez (1961) | | Trustee (since 2003); Securities Lending Committee Chair (since 2019). | | Director of Real Estate Equity Exchange, Inc. (since 2005); Director of Cloudera Foundation (2017-2020); and Director of Reading Partners (2012-2016). | | Director of iShares, Inc. (since 2003); Trustee of iShares U.S. ETF Trust (since 2011). |
| | | |
Madhav V. Rajan (1964) | | Trustee (since 2011); Fixed Income Plus Committee Chair (since 2019). | | Dean, and George Pratt Shultz Professor of Accounting, University of Chicago Booth School of Business (since 2017); Advisory Board Member (since 2016) and Director (since 2020) of C.M. Capital Corporation; Chair of the Board for the Center for Research in Security Prices, LLC (since 2020); Robert K. Jaedicke Professor of Accounting, Stanford University Graduate School of Business (2001-2017); Professor of Law (by courtesy), Stanford Law School (2005-2017); Senior Associate Dean for Academic Affairs and Head of MBA Program, Stanford University Graduate School of Business (2010-2016). | | Director of iShares, Inc. (since 2011); Trustee of iShares U.S. ETF Trust (since 2011). |
| | |
| 32 | | 2 0 2 3 I S H A R E S A N N U A L R E P O R T T O S H A R E H O L D E R S |
Trustee and Officer Information (continued)
| | | | |
| Officers |
| | | |
Name (Year of Birth) | | Position(s) | | Principal Occupation(s) During Past 5 Years |
| | |
Dominik Rohé (1973) | | President (since 2023). | | Managing Director, BlackRock, Inc. (since 2005); Head of Americas ETF and Index Investments (since 2023); Head of Latin America (2019- 2023). |
| | |
Trent Walker (1974) | | Treasurer and Chief Financial Officer (since 2020). | | Managing Director, BlackRock, Inc. (since September 2019); Chief Financial Officer of iShares Delaware Trust Sponsor LLC, BlackRock Funds, BlackRock Funds II, BlackRock Funds IV, BlackRock Funds V and BlackRock Funds VI (since 2021); Executive Vice President of PIMCO (2016-2019); Senior Vice President of PIMCO (2008-2015); Treasurer (2013-2019) and Assistant Treasurer (2007-2017) of PIMCO Funds, PIMCO Variable Insurance Trust, PIMCO ETF Trust, PIMCO Equity Series, PIMCO Equity Series VIT, PIMCO Managed Accounts Trust, 2 PIMCO-sponsored interval funds and 21 PIMCO-sponsored closed-end funds. |
| | |
Charles Park (1967) | | Chief Compliance Officer (since 2006). | | Chief Compliance Officer of BlackRock Advisors, LLC and the BlackRock-advised Funds in the BlackRock Multi-Asset Complex and the BlackRock Fixed-Income Complex (since 2014); Chief Compliance Officer of BFA (since 2006). |
| | |
Marisa Rolland (1980) | | Secretary (since 2022). | | Managing Director, BlackRock, Inc. (since 2023); Director, BlackRock, Inc. (2018-2022); Vice President, BlackRock, Inc. (2010-2017). |
| | |
Rachel Aguirre (1982) | | Executive Vice President (since 2022). | | Managing Director, BlackRock, Inc. (since 2018); Director, BlackRock, Inc. (2009-2018); Head of U.S. iShares Product (since 2022); Head of EII U.S. Product Engineering (since 2021); Co-Head of EII’s Americas Portfolio Engineering (2020-2021); Head of Developed Markets Portfolio Engineering (2016-2019). |
| | |
Jennifer Hsui (1976) | | Executive Vice President (since 2022). | | Managing Director, BlackRock, Inc. (since 2009); Co-Head of Index Equity (since 2022). |
| | |
James Mauro (1970) | | Executive Vice President (since 2022). | | Managing Director, BlackRock, Inc. (since 2010); Head of Fixed Income Index Investments in the Americas and Head of San Francisco Core Portfolio Management (since 2020). |
Effective June 15, 2022, Marisa Rolland replaced Deepa Damre Smith as Secretary.
Effective March 30, 2023, Dominik Rohé replaced Armando Senra as President.
| | |
TRUSTEE AND OFFICER INFORMATION | | 33 |
General Information
Electronic Delivery
Shareholders can sign up for e-mail notifications announcing that the shareholder report or prospectus has been posted on the iShares website at iShares.com. Once you have enrolled, you will no longer receive prospectuses and shareholder reports in the mail.
To enroll in electronic delivery:
| | • | | If your brokerage firm is not listed, electronic delivery may not be available. Please contact your broker-dealer or financial advisor. |
Householding
Householding is an option available to certain fund investors. Householding is a method of delivery, based on the preference of the individual investor, in which a single copy of certain shareholder documents and Rule 30e-3 notices can be delivered to investors who share the same address, even if their accounts are registered under different names. Please contact your broker-dealer if you are interested in enrolling in householding and receiving a single copy of prospectuses and other shareholder documents, or if you are currently enrolled in householding and wish to change your householding status.
Availability of Quarterly Schedule of Investments
The Funds file their complete schedule of portfolio holdings with the SEC for the first and third quarters of each fiscal year as an exhibit to their reports on Form N-PORT. The Funds’ Forms N-PORT are available on the SEC’s website at sec.gov. Additionally, each Fund makes its portfolio holdings for the first and third quarters of each fiscal year available at iShares.com/fundreports.
Availability of Proxy Voting Policies and Proxy Voting Records
A description of the policies and procedures that the iShares Funds use to determine how to vote proxies relating to portfolio securities and information about how the iShares Funds voted proxies relating to portfolio securities during the most recent twelve-month period ending June 30 is available without charge, upon request (1) by calling toll-free 1-800-474-2737; (2) on the iShares website at iShares.com; and (3) on the SEC website at sec.gov.
A description of the Trust’s policies and procedures with respect to the disclosure of the Fund’s portfolio securities is available in the Fund Prospectus. The Fund discloses its portfolio holdings daily and provides information regarding its top holdings in Fund fact sheets at iShares.com.
| | |
| 34 | | 2 0 2 3 I S H A R E S A N N U A L R E P O R T T O S H A R E H O L D E R S |
Glossary of Terms Used in this Report
| | |
| Portfolio Abbreviations |
| |
| REIT | | Real Estate Investment Trust |
| | |
GLOSSARY OF TERMS USED IN THIS REPORT | | 35 |
Want to know more?
iShares.com | 1-800-474-2737
This report is intended for the Funds’ shareholders. It may not be distributed to prospective investors unless it is preceded or accompanied by the current prospectus.
Investing involves risk, including possible loss of principal.
The iShares Funds are distributed by BlackRock Investments, LLC (together with its affiliates, “BlackRock”).
The iShares Funds are not sponsored, endorsed, issued, sold or promoted by FTSE International Limited, nor does this company make any representation regarding the advisability of investing in the iShares Funds. BlackRock is not affiliated with the company listed above.
©2022 BlackRock, Inc. All rights reserved. iSHARES and BLACKROCK are registered trademarks of BlackRock, Inc. or its subsidiaries. All other marks are the property of their respective owners.
iS-AR-312-0323
| | |

| | MARCH 31, 2023 |
iShares Trust
· iShares Factors US Growth Style ETF | STLG | Cboe BZX
· iShares Factors US Value Style ETF | STLV | Cboe BZX
The Markets in Review
Dear Shareholder,
Significant economic headwinds emerged during the 12-month reporting period ended March 31, 2023, as investors navigated changing economic conditions and volatile markets. The U.S. economy shrank in the first half of 2022 before returning to modest growth in the second half of the year, marking a shift to a more challenging post-reopening economic environment. Changes in consumer spending patterns and a tight labor market led to elevated inflation, which reached a 40-year high before beginning to moderate.
Equity prices fell as interest rates rose, particularly during the first half of the reporting period. Both large- and small-capitalization U.S. stocks declined, although equities began to recover in the second half of the period as inflation eased and economic growth resumed. Emerging market stocks and international equities from developed markets declined overall, pressured by rising interest rates and volatile commodities prices.
The 10-year U.S. Treasury yield rose during the reporting period, driving its price down, as investors reacted to fluctuating inflation data and attempted to anticipate its impact on future interest rate changes. The corporate bond market also faced inflationary headwinds, and higher interest rates led to rising borrowing costs for corporate issuers.
The U.S. Federal Reserve (the “Fed”), acknowledging that inflation has been more persistent than expected, raised interest rates eight times. Furthermore, the Fed wound down its bond-buying programs and accelerated the reduction of its balance sheet.
Restricted labor supply kept inflation elevated even as other inflation drivers, such as goods prices and energy costs, moderated. While economic growth slowed in the last year, we believe that taming inflation requires a more substantial decline that lowers demand to a level more in line with the economy’s productive capacity. Although the Fed has decelerated the pace of interest rate hikes, we believe that it still seems determined to get inflation back to target. With this in mind, we believe the possibility of a U.S. recession in the near-term is high, but the dimming economic outlook has not yet been fully reflected in current market prices. We believe investors should expect a period of higher volatility as markets adjust to the new economic reality and policymakers attempt to adapt to rapidly changing conditions. Turmoil in the banking sector late in the period highlighted the potential for the knock-on effects of substantially higher interest rates to disrupt markets with little warning.
While we favor an overweight to equities in the long term, we prefer an underweight stance on equities overall in the near term. Expectations for corporate earnings remain elevated, which seems inconsistent with the possibility of a recession. Nevertheless, we are overweight on emerging market stocks as we believe a weakening U.S. dollar provides a supportive backdrop. We also see long-term opportunities in credit, where we believe that valuations are appealing and higher yields provide attractive income, although we are neutral on credit in the near term, as we’re concerned about tightening credit and financial conditions. However, we believe there are still some strong opportunities for a six- to twelve-month horizon, particularly short-term U.S. Treasuries, global inflation-linked bonds, and emerging market bonds denominated in local currency.
Overall, our view is that investors need to think globally, position themselves to be prepared for a decarbonizing economy, and be nimble as market conditions change. We encourage you to talk with your financial advisor and visit iShares.com for further insight about investing in today’s markets.
Sincerely,

Rob Kapito
President, BlackRock, Inc.

Rob Kapito
President, BlackRock, Inc.
| | | | |
| Total Returns as of March 31, 2023 |
| | | |
| | | 6-Month | | 12-Month |
U.S. large cap equities (S&P 500® Index) | | 15.62% | | (7.73)% |
| | |
U.S. small cap equities (Russell 2000® Index) | | 9.14 | | (11.61) |
| | |
International equities (MSCI Europe, Australasia, Far East Index) | | 27.27 | | (1.38) |
| | |
Emerging market equities (MSCI Emerging Markets Index) | | 14.04 | | (10.70) |
| | |
3-month Treasury bills (ICE BofA 3-Month U.S. Treasury Bill Index) | | 1.93 | | 2.52 |
| | |
U.S. Treasury securities (ICE BofA 10-Year U.S. Treasury Index) | | 4.38 | | (6.90) |
| | |
U.S. investment grade bonds (Bloomberg U.S. Aggregate Bond Index) | | 4.89 | | (4.78) |
| | |
Tax-exempt municipal bonds (Bloomberg Municipal Bond Index) | | 7.00 | | 0.26 |
| | |
U.S. high yield bonds (Bloomberg U.S. Corporate High Yield 2% Issuer Capped Index) | | 7.88 | | (3.35) |
|
Past performance is not an indication of future results. Index performance is shown for illustrative purposes only. You cannot invest directly in an index. |
| | |
| 2 | | THIS PAGE IS NOT PART OF YOUR FUND REPORT |
Table of Contents
Market Overview
iShares Trust
Domestic Market Overview
U.S. stocks declined for the 12 months ended March 31, 2023 (“reporting period”), when the Russell 3000® Index, a broad measure of U.S. equity market performance, returned -8.58%. Elevated inflation and rapid tightening of monetary policy dampened growth and weighed on equities. Higher interest rates drove bond yields higher and increased borrowing costs for businesses and consumers. Equities began to recover in the second half of the reporting period, as the broader economy remained resilient and the pace of inflation declined. In March 2023, two banks suddenly failed, representing the second and third largest bank failures in U.S. history by asset value. This drove concern among investors about the resiliency of the financial system in the face of rapidly rising interest rates. However, government agencies acted swiftly to organize a sale of the failed banks’ assets and inject liquidity, and equity prices recovered.
Inflation was a significant driver of the economic outlook. As the reporting period began, the consumer price index, a widely followed measure of inflation, stood at multi-decade highs. Strong consumer spending and a tight labor market, along with continued supply chain disruptions in Asia, combined to drive prices higher. But the rate of inflation began to decline as the reporting period wore on, decelerating for nine consecutive months beginning in July 2022. Nonetheless, inflation remained elevated by historic standards, and higher prices negatively impacted both consumers and businesses.
The U.S. economy recovered from a decline in the first half of 2022 to post modest growth in the third and fourth quarters of 2022. Consumers continued to power the economy with growing spending, despite higher prices for many consumer goods and services. The strong labor market supported spending, as unemployment remained very low, at one point dropping to the lowest recorded level since 1969. Furthermore, the labor force participation rate—which measures the total proportion of employed persons of working age—rose, indicating that more people were being drawn into the labor force. Amid tightening labor supply, wages rose significantly, with the largest gains at the lower end of the wage spectrum.
To contain inflation, the U.S. Federal Reserve (“Fed”) tightened monetary policy rapidly, raising short-term interest rates eight times over the course of the reporting period. The pace of tightening accelerated as the Fed twice stepped up the increment of increase before reducing it again as inflation began to subside. The Fed also started to reduce the size of its balance sheet by reducing the store of U.S. Treasuries it had accumulated to stabilize markets in the early phases of the coronavirus pandemic. While the Fed indicated that more tightening could be needed to achieve its long-term inflation goal, it sounded a more cautious note about the potential for further interest rate increases near the end of the reporting period.
Despite economic headwinds, corporate profits remained robust, and many companies were able to sufficiently raise prices to preserve profit margins even in the face of rising labor and input costs. Nonetheless, profits declined overall in the fourth quarter of 2022, and the yield curve (a graphical representation of U.S. Treasury rates at different maturities) inverted, a sign that markets were concerned about the impact of higher borrowing costs on the economy. Furthermore, dwindling personal savings and rising household debt raised questions about the sustainability of consumer spending as an engine of economic growth.
| | |
| 4 | | 2 0 2 3 I SHARES ANNUAL REPORT TO SHAREHOLDERS |
| | |
| Fund Summary as of March 31, 2023 | | iShares® Factors US Growth Style ETF |
Investment Objective
The iShares Factors US Growth Style ETF (the “Fund”) seeks to track the investment results of an index composed of U.S. large- and mid-capitalization stocks with favorable exposure to target style factors subject to constraints, as represented by the Russell US Large Cap Factors Growth Style Index (the “Index”). The Fund invests in a representative sample of securities included in the Index that collectively has an investment profile similar to the Index. Due to the use of representative sampling, the Fund may or may not hold all of the securities that are included in the Index.
Performance
| | | | | | | | | | | | | | | | | | |
| | | Average Annual Total Returns | | | | | Cumulative Total Returns | |
| | | | | | | | | | |
| | | | | |
| | | 1 Year | | | Since Inception | | | | | 1 Year | | | Since
Inception | |
| | | | | |
Fund NAV | | | (7.47 | )% | | | 10.41 | % | | | | | (7.47 | )% | | | 37.47 | % |
Fund Market | | | (7.70 | ) | | | 10.39 | | | | | | (7.70 | ) | | | 37.39 | |
Index | | | (7.33 | ) | | | 10.61 | | | | | | (7.33 | ) | | | 38.24 | |
GROWTH OF $10,000 INVESTMENT
(SINCE INCEPTION AT NET ASSET VALUE)
The inception date of the Fund was 1/14/20. The first day of secondary market trading was 1/16/20.
Past performance is not an indication of future results. Performance results do not reflect the deduction of taxes that a shareholder would pay on fund distributions or the redemption of sale of fund shares. See “About Fund Performance” for more information.
Expense Example
| | | | | | | | | | | | | | | | | | | | | | | | | | | | | | |
| Actual | | | | | | Hypothetical 5% Return | | | | |
| | | | | | | | | | | | | | |
| | | | | | | |
| Beginning
Account Value
(10/01/22) |
| |
| Ending
Account Value (03/31/23) |
| |
| Expenses
Paid During
the Period |
(a) | | | | | |
| Beginning
Account Value
(10/01/22) |
| |
| Ending
Account Value
(03/31/23) |
| |
| Expenses
Paid Duringthe Period |
(a) | |
| Annualized
Expense
Ratio |
|
| | | | | | | | |
| | $ 1,000.00 | | | | $ 1,171.30 | | | | $ 1.35 | | | | | | | | $ 1,000.00 | | | | $ 1,023.68 | | | | $ 1.26 | | | | 0.25 | % |
| | (a) | | Expenses are equal to the annualized expense ratio, multiplied by the average account value over the period, multiplied by 182/365 (to reflect the one-half year period shown). Other fees, such as brokerage commissions and other fees to financial intermediaries, may be paid which are not reflected in the tables and examples above. See “Disclosure of Expenses” for more information. | |
| | |
| Fund Summary as of March 31, 2023 (continued) | | iShares® Factors US Growth Style ETF |
Portfolio Management Commentary
Growth-oriented large- and mid-capitalization U.S. stocks declined for the reporting period, as high inflation and tighter financial conditions impeded economic growth and weighed on equities. The consumer discretionary sector detracted the most from the Index’s return. While consumer spending continued to grow, rising inflation drove up costs for companies, and consumers increasingly sought bargains as higher prices eroded personal spending power. Individual savings rates declined, while credit card debt and interest rates rose, further pressuring consumers. A tight labor market amid historically low unemployment also meant higher labor costs for the sector.
Within the sector, the internet and direct marketing retail industry detracted significantly from the Index’s performance. The sharp rise in e-commerce that boosted the industry early in the pandemic waned as more workers returned to the office and brick-and-mortar retailers gained market share. Overbuilding of warehouses during the online shopping surge created excess capacity, which weighed on industry cash flow. Slowing revenue growth from data cloud services further pressured the industry’s profitability, as business customers tried to reduce expenditures amid economic uncertainty.
The information technology sector detracted significantly from the Index’s return, as rising interest rates reduced the current value of future earnings. High inflation and slow economic growth led consumers and businesses to reduce spending on technology products and services. The software and services industry declined, as cuts to corporate information technology budgets reduced revenue growth. Slowing growth in cloud-based software sales, which provide software companies with steady revenue streams, further constrained earnings. On the upside, industrials stocks contributed to the Index’s return, as the capital goods industry benefited from government incentives that encouraged investments in additional industrial capacity.
The Index’s research-based selection process is designed to maximize exposure to the weighted combination of five target investment style factors: momentum, quality, value, size, and low volatility. Reflecting those factor contributions, the Index outperformed the broader market, as represented by the Russell 1000 Growth Index. Security selection in the information technology sector and an underweight position in the communication services sector contributed to the Index’s return for the reporting period.
Portfolio Information
SECTOR ALLOCATION
| | | | |
| | |
Sector | |
| Percent of
Total Investments |
(a) |
| |
Information Technology | | | 48.2 | % |
Consumer Discretionary | | | 16.1 | |
Health Care | | | 10.7 | |
Industrials | | | 8.7 | |
Consumer Staples | | | 5.7 | |
Financials | | | 3.5 | |
Materials | | | 3.2 | |
Communication Services | | | 1.4 | |
Energy | | | 1.2 | |
Other (each representing less than 1%) | | | 1.3 | |
| (a) | Excludes money market funds. | |
TEN LARGEST HOLDINGS
| | | | |
| | |
Security | |
| Percent of
Total Investments |
(a) |
| |
Apple Inc. | | | 14.2 | % |
Microsoft Corp. | | | 10.7 | |
Amazon.com, Inc. | | | 3.4 | |
NVIDIA Corp. | | | 3.1 | |
QUALCOMM, Inc. | | | 2.4 | |
AbbVie, Inc. | | | 2.2 | |
Tesla, Inc. | | | 2.0 | |
Merck & Co., Inc. | | | 1.8 | |
Costco Wholesale Corp. | | | 1.8 | |
Louisiana-Pacific Corp. | | | 1.8 | |
| | |
| 6 | | 2 0 2 3 I SHARES ANNUAL REPORT TO SHAREHOLDERS |
| | |
| Fund Summary as of March 31, 2023 | | iShares® Factors US Value Style ETF |
Investment Objective
The iShares Factors US Value Style ETF (the “Fund”) seeks to track the investment results of an index composed of U.S. large- and mid-capitalization stocks with favorable exposure to target style factors subject to constraints, as represented by the Russell US Large Cap Factors Value Style Index (the “Index”). The Fund invests in a representative sample of securities included in the Index that collectively has an investment profile similar to the Index. Due to the use of representative sampling, the Fund may or may not hold all of the securities that are included in the Index.
Performance
| | | | | | | | | | | | | | | | | | | | |
| | | Average Annual Total Returns | | | | | | Cumulative Total Returns | |
| | | | | | | | | | | | |
| | | | | |
| | | 1 Year | | | Since Inception | | | | | | 1 Year | | | Since
Inception | |
| | | | | |
Fund NAV | | | (5.40 | )% | | | 4.64 | % | | | | | | | (5.40 | )% | | | 15.85 | % |
Fund Market | | | (5.67 | ) | | | 4.68 | | | | | | | | (5.67 | ) | | | 15.70 | |
Index | | | (5.25 | ) | | | 4.82 | | | | | | | | (5.25 | ) | | | 16.34 | |
GROWTH OF $10,000 INVESTMENT
(SINCE INCEPTION AT NET ASSET VALUE)
The inception date of the Fund was 1/14/20. The first day of secondary market trading was 1/16/20.
Past performance is not an indication of future results. Performance results do not reflect the deduction of taxes that a shareholder would pay on fund distributions or the redemption of sale of fund shares. See “About Fund Performance” for more information.
Expense Example
| | | | | | | | | | | | | | | | | | | | | | | | | | | | | | | | |
| | | Actual | | | | | | Hypothetical 5% Return | | | | |
| | | | | | | | | | | | | | | | |
| | | | | | | | |
| | |
| Beginning
Account Value (10/01/22) |
| |
| Ending
Account Value (03/31/23) |
| |
| Expenses
Paid During the Period |
(a) | |
|
|
| |
| Beginning
Account Value
(10/01/22) |
| |
| Ending
Account Value
(03/31/23) |
| |
| Expenses
Paid During
the Period |
(a) | |
| Annualized
Expense
Ratio |
|
| | | | $ 1,000.00 | | | | $ 1,122.80 | | | | $ 1.32 | | | | | | | | $ 1,000.00 | | | | $ 1,023.68 | | | | $ 1.26 | | | | 0.25 | % |
| | (a) | | Expenses are equal to the annualized expense ratio, multiplied by the average account value over the period, multiplied by 182/365 (to reflect the one-half year period shown). Other fees, such as brokerage commissions and other fees to financial intermediaries, may be paid which are not reflected in the tables and examples above. See “Disclosure of Expenses” for more information. | |
| | |
| Fund Summary as of March 31, 2023 (continued) | | iShares® Factors US Value Style ETF |
Portfolio Management Commentary
Value-oriented large- and mid-capitalization U.S. stocks declined for the reporting period, as high inflation and tighter financial conditions impeded economic growth and weighed on equities. The financials sector detracted the most from the Index’s performance amid tightening financial conditions. U.S. insurance stocks led declines. Despite rising interest rates that can benefit insurance providers, lower earnings pressured the sector. Insurance stocks declined at the end of the reporting period amid concern about unrealized bond investment losses and potential liquidity impacts within the wider global financials sector.
The property and casualty insurance industry detracted from the Index’s return amid rising claims, natural disasters, and price declines on long-term bonds. Stocks in the life and health insurance industry also detracted. Large life insurers reported relatively flat premium and fee revenue, excluding certain pension-related items. At the same time, lower investment income resulting from declining net investment spreads (the difference between interest earned on assets and interest paid on liabilities) and private equity returns reduced annual earnings. Regional banks were also pressured late in the reporting period after the sudden failure of two regional banks led to government intervention to cover depositors and prevent a contagion effect.
The communications services sector also detracted from the Index’s performance, as a telecommunications provider cut its dividend while struggling with a legacy wireline business and a heavy debt load. Stocks in the healthcare sector also faltered during the reporting period, primarily due to weakness in the healthcare equipment and supplies industry. Stocks of a diabetes equipment maker declined, as charges related to closing down U.S. production lines and an ongoing separation from its parent company weighed on earnings. Meanwhile, slow growth and a heavy debt load constrained a maker of dental and spine products. On the upside, industrials stocks contributed, benefiting from government incentives that encouraged investments in additional industrial capacity.
The Index’s research-based selection process is designed to maximize exposure to the weighted combination of five target investment style factors: momentum, quality, value, low size, and low volatility. Reflecting those factor contributions, the Index outperformed the broader market, as represented by the Russell 1000 Value Index. Strong security selection in the financials and information technology sectors drove positive relative performance, while underweight positions in the energy and communication services sectors detracted somewhat.
Portfolio Information
SECTOR ALLOCATION
| | | | |
| | |
Sector | |
| Percent of
Total Investments |
(a) |
| |
Financials | | | 21.8 | % |
Health Care | | | 16.1 | |
Industrials | | | 11.9 | |
Consumer Discretionary | | | 9.8 | |
Consumer Staples | | | 9.3 | |
Information Technology | | | 8.0 | |
Energy | | | 6.3 | |
Utilities | | | 5.3 | |
Communication Services | | | 5.0 | |
Materials | | | 4.0 | |
Real Estate | | | 2.5 | |
| (a) | Excludes money market funds. | |
TEN LARGEST HOLDINGS
| | | | |
| | |
Security | |
| Percent of
Total Investments |
(a) |
| |
Johnson & Johnson | | | 3.0 | % |
Merck & Co., Inc. | | | 2.6 | |
Vitesse Energy, Inc. | | | 2.2 | |
Verizon Communications, Inc. | | | 2.1 | |
Pfizer, Inc. | | | 1.8 | |
Evercore, Inc., Class A | | | 1.8 | |
Jefferies Financial Group, Inc. | | | 1.8 | |
Lazard Ltd., Class A | | | 1.7 | |
Otis Worldwide Corp. | | | 1.6 | |
Kroger Co. | | | 1.6 | |
| | |
| 8 | | 2 0 2 3 I SHARES ANNUAL REPORT TO SHAREHOLDERS |
About Fund Performance
Past performance is not an indication of future results. Financial markets have experienced extreme volatility and trading in many instruments has been disrupted. These circumstances may continue for an extended period of time and may continue to affect adversely the value and liquidity of each Fund’s investments. As a result, current performance may be lower or higher than the performance data quoted. Performance data current to the most recent month-end is available at iShares.com. Performance results assume reinvestment of all dividends and capital gain distributions and do not reflect the deduction of taxes that a shareholder would pay on fund distributions or on the redemption or sale of fund shares. The investment return and principal value of shares will vary with changes in market conditions. Shares may be worth more or less than their original cost when they are redeemed or sold in the market. Performance for certain funds may reflect a waiver of a portion of investment advisory fees. Without such a waiver, performance would have been lower.
Net asset value or “NAV” is the value of one share of a fund as calculated in accordance with the standard formula for valuing mutual fund shares. Beginning August 10, 2020, the price used to calculate market return (“Market Price”) is the closing price. Prior to August 10, 2020, Market Price was determined using the midpoint between the highest bid and the lowest ask on the primary stock exchange on which shares of a fund are listed for trading, as of the time that such fund’s NAV is calculated. Since shares of a fund may not trade in the secondary market until after the fund’s inception, for the period from inception to the first day of secondary market trading in shares of the fund, the NAV of the fund is used as a proxy for the Market Price to calculate market returns. Market and NAV returns assume that dividends and capital gain distributions have been reinvested at Market Price and NAV, respectively.
An index is a statistical composite that tracks a specified financial market or sector. Unlike a fund, an index does not actually hold a portfolio of securities and therefore does not incur the expenses incurred by a fund. These expenses negatively impact fund performance. Also, market returns do not include brokerage commissions that may be payable on secondary market transactions. If brokerage commissions were included, market returns would be lower.
Disclosure of Expenses
Shareholders of each Fund may incur the following charges: (1) transactional expenses, including brokerage commissions on purchases and sales of fund shares and (2) ongoing expenses, including management fees and other fund expenses. The expense examples shown (which are based on a hypothetical investment of $1,000 invested at the beginning of the period and held through the end of the period) are intended to assist shareholders both in calculating expenses based on an investment in each Fund and in comparing these expenses with similar costs of investing in other funds.
The expense examples provide information about actual account values and actual expenses. Annualized expense ratios reflect contractual and voluntary fee waivers, if any. In order to estimate the expenses a shareholder paid during the period covered by this report, shareholders can divide their account value by $1,000 and then multiply the result by the number under the heading entitled “Expenses Paid During the Period.”
The expense examples also provide information about hypothetical account values and hypothetical expenses based on a fund’s actual expense ratio and an assumed rate of return of 5% per year before expenses. In order to assist shareholders in comparing the ongoing expenses of investing in the Funds and other funds, compare the 5% hypothetical examples with the 5% hypothetical examples that appear in the shareholder reports of the other funds.
The expenses shown in the expense examples are intended to highlight shareholders’ ongoing costs only and do not reflect any transactional expenses, such as brokerage commissions and other fees paid on purchases and sales of fund shares. Therefore, the hypothetical examples are useful in comparing ongoing expenses only and will not help shareholders determine the relative total expenses of owning different funds. If these transactional expenses were included, shareholder expenses would have been higher.
| | | | |
ABOUT FUND PERFORMANCE / DISCLOSURE OF EXPENSES | | | 9 | |
| | |
Schedule of Investments March 31, 2023 | | iShares® Factors US Growth Style ETF (Percentages shown are based on Net Assets) |
| | | | | | | | |
| | |
| Security | | Shares | | | Value | |
|
Common Stocks | |
|
Air Freight & Logistics — 2.4% | |
CH Robinson Worldwide, Inc. | | | 9 | | | $ | 894 | |
Expeditors International of Washington, Inc. | | | 113 | | | | 12,444 | |
United Parcel Service, Inc., Class B | | | 133 | | | | 25,801 | |
| | | | | | | | |
| | |
| | | | | | | 39,139 | |
|
| Automobiles — 2.0% | |
Tesla, Inc.(a) | | | 156 | | | | 32,364 | |
| | | | | | | | |
|
| Beverages — 0.8% | |
PepsiCo, Inc. | | | 69 | | | | 12,579 | |
| | | | | | | | |
|
| Biotechnology — 4.2% | |
AbbVie, Inc. | | | 230 | | | | 36,655 | |
Amgen, Inc. | | | 30 | | | | 7,252 | |
Moderna, Inc.(a) | | | 94 | | | | 14,437 | |
Vertex Pharmaceuticals, Inc.(a) | | | 34 | | | | 10,712 | |
| | | | | | | | |
| | |
| | | | | | | 69,056 | |
|
| Broadline Retail — 3.9% | |
Amazon.com, Inc.(a) | | | 544 | | | | 56,190 | |
eBay, Inc. | | | 165 | | | | 7,321 | |
Nordstrom, Inc. | | | 65 | | | | 1,057 | |
| | | | | | | | |
| | |
| | | | | | | 64,568 | |
|
| Building Products — 1.3% | |
Carlisle Cos., Inc. | | | 17 | | | | 3,843 | |
Masco Corp. | | | 228 | | | | 11,336 | |
Masterbrand, Inc.(a) | | | 398 | | | | 3,200 | |
Trex Co., Inc.(a) | | | 78 | | | | 3,797 | |
| | | | | | | | |
| | |
| | | | | | | 22,176 | |
|
| Capital Markets — 3.2% | |
Ameriprise Financial, Inc. | | | 43 | | | | 13,179 | |
FactSet Research Systems, Inc. | | | 7 | | | | 2,906 | |
MSCI, Inc., Class A | | | 42 | | | | 23,507 | |
Raymond James Financial, Inc. | | | 144 | | | | 13,431 | |
| | | | | | | | |
| | |
| | | | | | | 53,023 | |
|
| Chemicals — 1.1% | |
CF Industries Holdings, Inc. | | | 144 | | | | 10,439 | |
Chemours Co. | | | 161 | | | | 4,820 | |
Mosaic Co. | | | 57 | | | | 2,615 | |
Scotts Miracle-Gro Co. | | | 11 | | | | 767 | |
| | | | | | | | |
| | |
| | | | | | | 18,641 | |
|
| Communications Equipment — 0.7% | |
Arista Networks, Inc.(a) | | | 49 | | | | 8,225 | |
Ubiquiti, Inc. | | | 10 | | | | 2,717 | |
| | | | | | | | |
| | |
| | | | | | | 10,942 | |
|
| Consumer Staples Distribution & Retail — 3.5% | |
BJ’s Wholesale Club Holdings, Inc.(a) | | | 162 | | | | 12,323 | |
Costco Wholesale Corp. | | | 60 | | | | 29,812 | |
Dollar General Corp. | | | 30 | | | | 6,314 | |
Target Corp. | | | 55 | | | | 9,110 | |
| | | | | | | | |
| | |
| | | | | | | 57,559 | |
|
| Containers & Packaging — 0.3% | |
Sealed Air Corp. | | | 99 | | | | 4,545 | |
| | | | | | | | |
|
| Distributors — 0.2% | |
Pool Corp. | | | 11 | | | | 3,767 | |
| | | | | | | | |
|
| Diversified Consumer Services — 0.6% | |
H&R Block, Inc. | | | 264 | | | | 9,306 | |
| | | | | | | | |
|
| Electronic Equipment, Instruments & Components — 0.8% | |
Arrow Electronics, Inc.(a) | | | 45 | | | | 5,619 | |
| | | | | | | | |
| | |
| Security | | Shares | | | Value | |
|
Electronic Equipment, Instruments & Components (continued) | |
Jabil, Inc. | | | 54 | | | $ | 4,761 | |
Vontier Corp. | | | 100 | | | | 2,734 | |
| | | | | | | | |
| | |
| | | | | | | 13,114 | |
|
| Food Products — 1.3% | |
Hershey Co. | | | 86 | | | | 21,879 | |
| | | | | | | | |
|
| Ground Transportation — 0.3% | |
Old Dominion Freight Line, Inc. | | | 14 | | | | 4,772 | |
| | | | | | | | |
|
| Health Care Providers & Services — 2.3% | |
Chemed Corp. | | | 17 | | | | 9,142 | |
DaVita, Inc.(a) | | | 61 | | | | 4,948 | |
HCA Healthcare, Inc. | | | 24 | | | | 6,328 | |
McKesson Corp. | | | 20 | | | | 7,121 | |
Molina Healthcare, Inc.(a) | | | 26 | | | | 6,955 | |
UnitedHealth Group, Inc. | | | 9 | | | | 4,253 | |
| | | | | | | | |
| | |
| | | | | | | 38,747 | |
|
| Hotels, Restaurants & Leisure — 1.7% | |
Airbnb, Inc., Class A(a) | | | 68 | | | | 8,459 | |
Domino’s Pizza, Inc. | | | 35 | | | | 11,545 | |
Yum! Brands, Inc. | | | 61 | | | | 8,057 | |
| | | | | | | | |
| | |
| | | | | | | 28,061 | |
|
| Household Durables — 0.1% | |
PulteGroup, Inc. | | | 21 | | | | 1,224 | |
| | | | | | | | |
|
| Household Products — 0.0% | |
Procter & Gamble Co. | | | 5 | | | | 743 | |
| | | | | | | | |
|
| Independent Power and Renewable Electricity Producers — 0.7% | |
Vistra Corp. | | | 457 | | | | 10,968 | |
| | | | | | | | |
|
| Insurance — 0.3% | |
Assurant, Inc. | | | 40 | | | | 4,803 | |
| | | | | | | | |
|
| Interactive Media & Services — 1.2% | |
Alphabet, Inc., Class A(a) | | | 112 | | | | 11,618 | |
Alphabet, Inc., Class C, NVS(a) | | | 74 | | | | 7,696 | |
| | | | | | | | |
| | |
| | | | | | | 19,314 | |
|
| IT Services — 1.1% | |
Gartner, Inc.(a) | | | 7 | | | | 2,280 | |
MongoDB, Inc.(a) | | | 8 | | | | 1,865 | |
VeriSign, Inc.(a) | | | 66 | | | | 13,948 | |
| | | | | | | | |
| | |
| | | | | | | 18,093 | |
|
| Life Sciences Tools & Services — 1.0% | |
Maravai LifeSciences Holdings, Inc., Class A(a) | | | 253 | | | | 3,544 | |
Mettler-Toledo International, Inc.(a) | | | 9 | | | | 13,772 | |
| | | | | | | | |
| | |
| | | | | | | 17,316 | |
|
| Machinery — 0.8% | |
AGCO Corp. | | | 2 | | | | 270 | |
Allison Transmission Holdings, Inc. | | | 210 | | | | 9,501 | |
Otis Worldwide Corp. | | | 47 | | | | 3,967 | |
| | | | | | | | |
| | |
| | | | | | | 13,738 | |
|
| Media — 0.2% | |
Liberty Broadband Corp., Class A(a) | | | 43 | | | | 3,531 | |
| | | | | | | | |
|
| Oil, Gas & Consumable Fuels — 1.2% | |
Devon Energy Corp. | | | 210 | | | | 10,628 | |
Range Resources Corp. | | | 321 | | | | 8,497 | |
| | | | | | | | |
| | |
| | | | | | | 19,125 | |
|
| Paper & Forest Products — 1.8% | |
Louisiana-Pacific Corp. | | | 537 | | | | 29,111 | |
| | | | | | | | |
| | |
| 10 | | 2 0 2 3 I SHARES ANNUAL REPORT TO SHAREHOLDERS |
| | |
Schedule of Investments (continued) March 31, 2023 | | iShares® Factors US Growth Style ETF (Percentages shown are based on Net Assets) |
| | | | | | | | |
| | |
| Security | | Shares | | | Value | |
|
Personal Care Products — 0.0% | |
Estee Lauder Cos., Inc., Class A | | | 3 | | | $ | 739 | |
| | | | | | | | |
|
| Pharmaceuticals — 3.1% | |
Eli Lilly & Co. | | | 63 | | | | 21,636 | |
Merck & Co., Inc. | | | 285 | | | | 30,321 | |
| | | | | | | | |
| | |
| | | | | | | 51,957 | |
|
| Professional Services — 2.3% | |
Booz Allen Hamilton Holding Corp., Class A | | | 270 | | | | 25,026 | |
FTI Consulting, Inc.(a) | | | 22 | | | | 4,342 | |
Paychex, Inc. | | | 41 | | | | 4,698 | |
Robert Half International, Inc. | | | 51 | | | | 4,109 | |
| | | | | | | | |
| | |
| | | | | | | 38,175 | |
|
| Residential REITs — 0.4% | |
Apartment Income REIT Corp. | | | 171 | | | | 6,123 | |
| | | | | | | | |
|
| Semiconductors & Semiconductor Equipment — 9.0% | |
Allegro MicroSystems, Inc.(a) | | | 170 | | | | 8,158 | |
Broadcom, Inc. | | | 26 | | | | 16,680 | |
KLA Corp. | | | 18 | | | | 7,185 | |
Lattice Semiconductor Corp.(a) | | | 77 | | | | 7,353 | |
NVIDIA Corp. | | | 184 | | | | 51,110 | |
QUALCOMM, Inc. | | | 309 | | | | 39,422 | |
Teradyne, Inc. | | | 33 | | | | 3,548 | |
Texas Instruments, Inc. | | | 88 | | | | 16,369 | |
| | | | | | | | |
| | |
| | | | | | | 149,825 | |
|
| Software — 20.3% | |
Adobe, Inc.(a) | | | 4 | | | | 1,541 | |
Aspen Technology, Inc.(a) | | | 31 | | | | 7,095 | |
Atlassian Corp., Class A(a) | | | 138 | | | | 23,621 | |
Cadence Design Systems, Inc.(a) | | | 94 | | | | 19,748 | |
Crowdstrike Holdings, Inc., Class A(a) | | | 131 | | | | 17,981 | |
Dropbox, Inc., Class A(a) | | | 125 | | | | 2,703 | |
Fair Isaac Corp.(a) | | | 25 | | | | 17,567 | |
Fortinet, Inc.(a) | | | 258 | | | | 17,147 | |
HubSpot, Inc.(a) | | | 6 | | | | 2,573 | |
Intuit, Inc. | | | 2 | | | | 892 | |
Manhattan Associates, Inc.(a) | | | 124 | | | | 19,201 | |
Microsoft Corp. | | | 614 | | | | 177,016 | |
Nutanix, Inc., Class A(a) | | | 116 | | | | 3,015 | |
Oracle Corp. | | | 30 | | | | 2,788 | |
Palo Alto Networks, Inc.(a) | | | 19 | | | | 3,795 | |
Smartsheet, Inc., Class A(a) | | | 154 | | | | 7,361 | |
Synopsys, Inc.(a) | | | 16 | | | | 6,180 | |
Teradata Corp.(a) | | | 49 | | | | 1,974 | |
Zscaler, Inc.(a) | | | 39 | | | | 4,556 | |
| | | | | | | | |
| | |
| | | | | | | 336,754 | |
|
| Specialized REITs — 0.3% | |
Public Storage | | | 14 | | | | 4,230 | |
SBA Communications Corp. | | | 1 | | | | 261 | |
| | | | | | | | |
| | |
| | | | | | | 4,491 | |
| | | | | | | | |
| | |
| Security | | Shares | | | Value | |
|
Specialty Retail — 6.5% | |
AutoZone, Inc.(a) | | | 6 | | | $ | 14,749 | |
Best Buy Co., Inc. | | | 132 | | | | 10,332 | |
Home Depot, Inc. | | | 58 | | | | 17,117 | |
Leslie’s, Inc.(a) | | | 390 | | | | 4,294 | |
Lowe’s Cos., Inc. | | | 92 | | | | 18,397 | |
O’Reilly Automotive, Inc.(a) | | | 2 | | | | 1,698 | |
Tractor Supply Co. | | | 26 | | | | 6,111 | |
Victoria’s Secret & Co.(a) | | | 291 | | | | 9,938 | |
Wayfair, Inc., Class A(a)(b) | | | 75 | | | | 2,575 | |
Williams-Sonoma, Inc. | | | 180 | | | | 21,899 | |
| | | | | | | | |
| | |
| | | | | | | 107,110 | |
|
| Technology Hardware, Storage & Peripherals — 16.2% | |
Apple Inc. | | | 1,423 | | | | 234,653 | |
HP, Inc. | | | 760 | | | | 22,306 | |
NetApp, Inc. | | | 181 | | | | 11,557 | |
Pure Storage, Inc., Class A(a) | | | 10 | | | | 255 | |
| | | | | | | | |
| | |
| | | | | | | 268,771 | |
|
| Textiles, Apparel & Luxury Goods — 1.2% | |
Deckers Outdoor Corp.(a) | | | 35 | | | | 15,734 | |
Lululemon Athletica, Inc.(a) | | | 3 | | | | 1,093 | |
NIKE, Inc., Class B | | | 31 | | | | 3,802 | |
| | | | | | | | |
| | |
| | | | | | | 20,629 | |
|
| Trading Companies & Distributors — 1.6% | |
Watsco, Inc. | | | 25 | | | | 7,954 | |
WW Grainger, Inc. | | | 27 | | | | 18,598 | |
| | | | | | | | |
| | |
| | | | | | | 26,552 | |
| | | | | | | | |
| | |
Total Long-Term Investments — 99.9%
(Cost: $1,736,326) | | | | | | | 1,653,330 | |
| | | | | | | | |
| | |
| Short-Term Securities | | | | | | |
| | |
Money Market Funds — 0.2% | | | | | | | | |
BlackRock Cash Funds: Institutional, SL Agency Shares, 5.01%(c)(d)(e) | | | 1,703 | | | | 1,703 | |
BlackRock Cash Funds: Treasury, SL Agency Shares, 4.73%(c)(d) | | | 1,256 | | | | 1,256 | |
| | | | | | | | |
| | |
Total Short-Term Securities — 0.2%
(Cost: $2,959) | | | | | | | 2,959 | |
| | | | | | | | |
| | |
Total Investments — 100.1%
(Cost: $1,739,285) | | | | | | | 1,656,289 | |
Liabilities in Excess of Other Assets — (0.1)% | | | | | | | (1,301 | ) |
| | | | | | | | |
Net Assets — 100.0% | | | | | | $ | 1,654,988 | |
| | | | | | | | |
| (a) | Non-income producing security. |
| (b) | All or a portion of this security is on loan. |
| (c) | Affiliate of the Fund. |
| (d) | Annualized 7-day yield as of period end. |
| (e) | All or a portion of this security was purchased with the cash collateral from loaned securities. |
| | | | |
SCHEDULES OF INVESTMENTS | | | 11 | |
| | |
Schedule of Investments (continued) March 31, 2023 | | iShares® Factors US Growth Style ETF |
Affiliates
Investments in issuers considered to be affiliate(s) of the Fund during the year ended March 31, 2023 for purposes of Section 2(a)(3) of the Investment Company Act of 1940, as amended, were as follows:
| | | | | | | | | | | | | | | | | | | | | | | | | | | | | | | | | | | | | | | | |
| |
| | | | | | | | | |
| Affiliated Issuer | | Value at
03/31/22 | | | Purchases
at Cost | | | Proceeds
from Sale | | | Net Realized
Gain (Loss) | | | Change in
Unrealized
Appreciation
(Depreciation) | | | Value at
03/31/23 | | | Shares
Held at
03/31/23 | | | Income | | | Capital Gain
Distributions
from Underlying
Funds | |
| |
| | | | | | | | | | | |
BlackRock Cash Funds: Institutional, SL Agency Shares | | $ | 4,274 | | | $ | — | | | $ | (2,580 | )(a) | | | | $ | 10 | | | $ | (1 | ) | | $ | 1,703 | | | | 1,703 | | | | | $ | 102 | (b) | | $ | — | |
| | | | | | | | | | | |
BlackRock Cash Funds: Treasury, SL Agency Shares | | | — | | | | 1,256 | (a) | | | — | | | | | | — | | | | — | | | | 1,256 | | | | 1,256 | | | | | | 75 | | | | — | |
| | | | | | | | | | | | | | | | | | | | | | | | | | | | | | | | | | | | | | | | |
| | | | | | | | | | | |
| | | | | | | | | | | | | | | | $ | 10 | | | $ | (1 | ) | | $ | 2,959 | | | | | | | | | $ | 177 | | | $ | — | |
| | | | | | | | | | | | | | | | | | | | | | | | | | | | | | | | | | | | | | | | |
| | (a) | Represents net amount purchased (sold). | |
| | (b) | All or a portion represents securities lending income earned from the reinvestment of cash collateral from loaned securities, net of fees and collateral investment expenses, and other payments to and from borrowers of securities. | |
Fair Value Hierarchy as of Period End
Various inputs are used in determining the fair value of financial instruments. For a description of the input levels and information about the Fund’s policy regarding valuation of financial instruments, refer to the Notes to Financial Statements.
The following table summarizes the Fund’s financial instruments categorized in the fair value hierarchy. The breakdown of the Fund’s financial instruments into major categories is disclosed in the Schedule of Investments above.
| | | | | | | | | | | | | | | | |
| |
| | | | |
| | | Level 1 | | | Level 2 | | | Level 3 | | | Total | |
| |
| | | | |
Assets | | | | | | | | | | | | | | | | |
Investments | | | | | | | | | | | | | | | | |
Long-Term Investments | | | | | | | | | | | | | | | | |
Common Stocks | | $ | 1,653,330 | | | $ | — | | | $ | — | | | $ | 1,653,330 | |
Short-Term Securities | | | | | | | | | | | | | | | | |
Money Market Funds | | | 2,959 | | | | — | | | | — | | | | 2,959 | |
| | | | | | | | | | | | | | | | |
| | | | |
| | $ | 1,656,289 | | | $ | — | | | $ | — | | | $ | 1,656,289 | |
| | | | | | | | | | | | | | | | |
See notes to financial statements.
| | |
| 12 | | 2 0 2 3 I SHARES ANNUAL REPORT TO SHAREHOLDERS |
| | |
Schedule of Investments March 31, 2023 | | iShares® Factors US Value Style ETF (Percentages shown are based on Net Assets) |
| | | | | | | | |
| | |
| Security | | Shares | | | Value | |
| | |
Common Stocks | | | | | | | | |
| | |
Aerospace & Defense — 0.3% | | | | | | | | |
Northrop Grumman Corp. | | | 23 | | | $ | 10,620 | |
| | | | | | | | |
| | |
| Air Freight & Logistics — 2.8% | | | | | | |
CH Robinson Worldwide, Inc. | | | 145 | | | | 14,409 | |
Expeditors International of Washington, Inc. | | | 252 | | | | 27,750 | |
FedEx Corp. | | | 109 | | | | 24,905 | |
United Parcel Service, Inc., Class B | | | 235 | | | | 45,588 | |
| | | | | | | | |
| | |
| | | | | | | 112,652 | |
| | |
| Banks — 2.3% | | | | | | |
Citigroup, Inc. | | | 545 | | | | 25,555 | |
JPMorgan Chase & Co. | | | 234 | | | | 30,493 | |
Popular, Inc. | | | 608 | | | | 34,905 | |
| | | | | | | | |
| | |
| | | | | | | 90,953 | |
| | |
| Biotechnology — 2.2% | | | | | | |
Amgen, Inc. | | | 80 | | | | 19,340 | |
Biogen, Inc.(a) | | | 16 | | | | 4,448 | |
Gilead Sciences, Inc. | | | 370 | | | | 30,699 | |
Moderna, Inc.(a) | | | 212 | | | | 32,559 | |
Vertex Pharmaceuticals, Inc.(a) | | | 7 | | | | 2,206 | |
| | | | | | | | |
| | |
| | | | | | | 89,252 | |
| | |
| Broadline Retail — 1.3% | | | | | | |
eBay, Inc. | | | 296 | | | | 13,134 | |
Kohl’s Corp. | | | 262 | | | | 6,167 | |
Macy’s, Inc. | | | 1,891 | | | | 33,074 | |
| | | | | | | | |
| | |
| | | | | | | 52,375 | |
| | |
| Building Products — 2.2% | | | | | | |
Builders FirstSource, Inc.(a) | | | 44 | | | | 3,906 | |
Lennox International, Inc. | | | 136 | | | | 34,174 | |
Masco Corp. | | | 519 | | | | 25,805 | |
Masterbrand, Inc.(a) | | | 2,327 | | | | 18,709 | |
Owens Corning | | | 67 | | | | 6,419 | |
| | | | | | | | |
| | |
| | | | | | | 89,013 | |
| | |
| Capital Markets — 8.4% | | | | | | |
Evercore, Inc., Class A | | | 631 | | | | 72,805 | |
Franklin Resources, Inc. | | | 420 | | | | 11,315 | |
Goldman Sachs Group, Inc. | | | 96 | | | | 31,403 | |
Interactive Brokers Group, Inc., Class A | | | 41 | | | | 3,385 | |
Jefferies Financial Group, Inc. | | | 2,207 | | | | 70,050 | |
Lazard Ltd., Class A | | | 2,002 | | | | 66,286 | |
Morgan Stanley | | | 150 | | | | 13,170 | |
MSCI, Inc., Class A | | | 32 | | | | 17,910 | |
Raymond James Financial, Inc. | | | 202 | | | | 18,840 | |
State Street Corp. | | | 74 | | | | 5,601 | |
Virtu Financial, Inc., Class A | | | 1,343 | | | | 25,383 | |
| | | | | | | | |
| | |
| | | | | | | 336,148 | |
| | |
| Chemicals — 0.6% | | | | | | |
Chemours Co. | | | 304 | | | | 9,102 | |
Huntsman Corp. | | | 378 | | | | 10,342 | |
Mosaic Co. | | | 68 | | | | 3,120 | |
| | | | | | | | |
| | |
| | | | | | | 22,564 | |
| | |
| Commercial Services & Supplies — 0.6% | | | | | | |
Republic Services, Inc. | | | 160 | | | | 21,635 | |
Waste Management, Inc. | | | 25 | | | | 4,079 | |
| | | | | | | | |
| | |
| | | | | | | 25,714 | |
| | |
| Communications Equipment — 1.2% | | | | | | |
Cisco Systems, Inc. | | | 168 | | | | 8,782 | |
Juniper Networks, Inc. | | | 56 | | | | 1,928 | |
| | | | | | | | |
| | |
| Security | | Shares | | | Value | |
| | |
Communications Equipment (continued) | | | | | | | | |
Motorola Solutions, Inc. | | | 103 | | | $ | 29,471 | |
Ubiquiti, Inc. | | | 29 | | | | 7,879 | |
| | | | | | | | |
| | |
| | | | | | | 48,060 | |
| | |
| Consumer Finance — 3.0% | | | | | | |
Ally Financial, Inc. | | | 1,428 | | | | 36,400 | |
American Express Co. | | | 78 | | | | 12,866 | |
Capital One Financial Corp. | | | 143 | | | | 13,751 | |
OneMain Holdings, Inc. | | | 568 | | | | 21,061 | |
SLM Corp. | | | 1,002 | | | | 12,415 | |
Synchrony Financial | | | 861 | | | | 25,038 | |
| | | | | | | | |
| | |
| | | | | | | 121,531 | |
| | |
| Consumer Staples Distribution & Retail — 4.6% | | | | | | |
Albertsons Cos., Inc., Class A | | | 2,366 | | | | 49,165 | |
BJ’s Wholesale Club Holdings, Inc.(a) | | | 176 | | | | 13,388 | |
Kroger Co. | | | 1,249 | | | | 61,663 | |
Target Corp. | | | 41 | | | | 6,791 | |
Walmart, Inc. | | | 359 | | | | 52,935 | |
| | | | | | | | |
| | |
| | | | | | | 183,942 | |
| | |
| Containers & Packaging — 0.7% | | | | | | |
Amcor PLC | | | 1,165 | | | | 13,258 | |
Silgan Holdings, Inc. | | | 282 | | | | 15,135 | |
| | | | | | | | |
| | |
| | | | | | | 28,393 | |
| | |
| Diversified Consumer Services — 0.8% | | | | | | |
H&R Block, Inc. | | | 689 | | | | 24,287 | |
Service Corp. International | | | 86 | | | | 5,915 | |
| | | | | | | | |
| | |
| | | | | | | 30,202 | |
| | |
| Diversified Telecommunication Services — 3.0% | | | | | | |
AT&T Inc. | | | 779 | | | | 14,996 | |
Lumen Technologies, Inc. | | | 7,835 | | | | 20,763 | |
Verizon Communications, Inc. | | | 2,126 | | | | 82,680 | |
| | | | | | | | |
| | |
| | | | | | | 118,439 | |
| | |
| Electric Utilities — 2.8% | | | | | | |
American Electric Power Co., Inc. | | | 41 | | | | 3,730 | |
Avangrid, Inc. | | | 14 | | | | 558 | |
Entergy Corp. | | | 232 | | | | 24,996 | |
Hawaiian Electric Industries, Inc. | | | 609 | | | | 23,386 | |
IDACORP, Inc. | | | 91 | | | | 9,858 | |
NRG Energy, Inc. | | | 507 | | | | 17,385 | |
Pinnacle West Capital Corp. | | | 178 | | | | 14,105 | |
Southern Co. | | | 29 | | | | 2,018 | |
Xcel Energy, Inc. | | | 253 | | | | 17,062 | |
| | | | | | | | |
| | |
| | | | | | | 113,098 | |
| | |
| Electrical Equipment — 0.8% | | | | | | |
Acuity Brands, Inc. | | | 33 | | | | 6,030 | |
nVent Electric PLC | | | 604 | | | | 25,936 | |
| | | | | | | | |
| | |
| | | | | | | 31,966 | |
|
| Electronic Equipment, Instruments & Components — 0.2% | |
Avnet, Inc. | | | 28 | | | | 1,266 | |
Jabil, Inc. | | | 18 | | | | 1,587 | |
Vontier Corp. | | | 216 | | | | 5,905 | |
| | | | | | | | |
| | |
| | | | | | | 8,758 | |
| | |
| Entertainment — 0.1% | | | | | | |
Electronic Arts, Inc. | | | 22 | | | | 2,650 | |
Take-Two Interactive Software, Inc.(a) | | | 3 | | | | 358 | |
| | | | | | | | |
| | |
| | | | | | | 3,008 | |
| | | | |
SCHEDULES OF INVESTMENTS | | | 13 | |
| | |
Schedule of Investments (continued) March 31, 2023 | | iShares® Factors US Value Style ETF (Percentages shown are based on��Net Assets) |
| | | | | | | | |
| | |
| Security | | Shares | | | Value | |
|
| Financial Services — 1.4% | |
Voya Financial, Inc. | | | 474 | | | $ | 33,872 | |
Western Union Co. | | | 1,892 | | | | 21,096 | |
| | | | | | | | |
| | |
| | | | | | | 54,968 | |
|
| Food Products — 2.4% | |
Campbell Soup Co. | | | 111 | | | | 6,103 | |
Flowers Foods, Inc. | | | 1,438 | | | | 39,416 | |
General Mills, Inc. | | | 81 | | | | 6,922 | |
Hershey Co. | | | 113 | | | | 28,748 | |
J M Smucker Co. | | | 106 | | | | 16,681 | |
| | | | | | | | |
| | |
| | | | | | | 97,870 | |
|
| Gas Utilities — 0.1% | |
National Fuel Gas Co. | | | 90 | | | | 5,197 | |
| | | | | | | | |
|
| Ground Transportation — 1.2% | |
Avis Budget Group, Inc.(a)(b) | | | 65 | | | | 12,662 | |
RXO, Inc.(a) | | | 453 | | | | 8,897 | |
Schneider National, Inc., Class B | | | 947 | | | | 25,332 | |
| | | | | | | | |
| | |
| | | | | | | 46,891 | |
|
| Health Care Equipment & Supplies — 0.6% | |
Abbott Laboratories | | | 225 | | | | 22,783 | |
| | | | | | | | |
|
| Health Care Providers & Services — 3.1% | |
Chemed Corp. | | | 18 | | | | 9,679 | |
CVS Health Corp. | | | 694 | | | | 51,571 | |
Enhabit, Inc.(a) | | | 838 | | | | 11,657 | |
HCA Healthcare, Inc. | | | 58 | | | | 15,293 | |
McKesson Corp. | | | 60 | | | | 21,363 | |
Molina Healthcare, Inc.(a) | | | 38 | | | | 10,165 | |
Premier, Inc., Class A | | | 107 | | | | 3,464 | |
| | | | | | | | |
| | |
| | | | | | | 123,192 | |
|
| Health Care REITs — 0.2% | |
Healthpeak Properties, Inc. | | | 327 | | | | 7,184 | |
| | | | | | | | |
|
| Hotels, Restaurants & Leisure — 2.2% | |
Domino’s Pizza, Inc. | | | 73 | | | | 24,080 | |
McDonald’s Corp. | | | 92 | | | | 25,724 | |
Yum! Brands, Inc. | | | 285 | | | | 37,643 | |
| | | | | | | | |
| | |
| | | | | | | 87,447 | |
|
| Household Durables — 0.2% | |
Newell Brands, Inc. | | | 518 | | | | 6,444 | |
| | | | | | | | |
|
| Household Products — 0.3% | |
Procter & Gamble Co. | | | 84 | | | | 12,490 | |
| | | | | | | | |
|
| Independent Power and Renewable Electricity Producers — 0.4% | |
Vistra Corp. | | | 605 | | | | 14,520 | |
| | | | | | | | |
|
| Insurance — 6.7% | |
Aflac, Inc. | | | 185 | | | | 11,936 | |
Allstate Corp. | | | 66 | | | | 7,313 | |
American Financial Group, Inc. | | | 192 | | | | 23,328 | |
Assurant, Inc. | | | 50 | | | | 6,004 | |
Assured Guaranty Ltd. | | | 406 | | | | 20,410 | |
Axis Capital Holdings Ltd. | | | 233 | | | | 12,703 | |
Brighthouse Financial, Inc.(a) | | | 381 | | | | 16,806 | |
CNA Financial Corp. | | | 169 | | | | 6,596 | |
F&G Annuities & Life, Inc. | | | 2,527 | | | | 45,789 | |
Fidelity National Financial, Inc., Class A | | | 423 | | | | 14,775 | |
Hanover Insurance Group, Inc. | | | 16 | | | | 2,056 | |
Hartford Financial Services Group, Inc. | | | 64 | | | | 4,460 | |
Loews Corp. | | | 549 | | | | 31,853 | |
MetLife, Inc. | | | 439 | | | | 25,436 | |
Principal Financial Group, Inc. | | | 30 | | | | 2,230 | |
Travelers Cos., Inc. | | | 9 | | | | 1,543 | |
| | | | | | | | |
| | |
| Security | | Shares | | | Value | |
|
| Insurance (continued) | |
Unum Group | | | 300 | | | $ | 11,868 | |
White Mountains Insurance Group Ltd. | | | 15 | | | | 20,662 | |
| | | | | | | | |
| | |
| | | | | | | 265,768 | |
|
| Interactive Media & Services — 1.1% | |
Meta Platforms, Inc., Class A(a) | | | 205 | | | | 43,448 | |
| | | | | | | | |
|
| IT Services — 1.0% | |
VeriSign, Inc.(a) | | | 180 | | | | 38,039 | |
| | | | | | | | |
|
| Leisure Products — 0.4% | |
Hasbro, Inc. | | | 298 | | | | 16,000 | |
| | | | | | | | |
|
| Life Sciences Tools & Services — 1.0% | |
Danaher Corp. | | | 83 | | | | 20,919 | |
Thermo Fisher Scientific, Inc. | | | 32 | | | | 18,444 | |
| | | | | | | | |
| | |
| | | | | | | 39,363 | |
|
| Machinery — 2.5% | |
AGCO Corp. | | | 46 | | | | 6,219 | |
Allison Transmission Holdings, Inc. | | | 633 | | | | 28,637 | |
Esab Corp. | | | 45 | | | | 2,658 | |
Illinois Tool Works, Inc. | | | 1 | | | | 243 | |
Otis Worldwide Corp. | | | 739 | | | | 62,372 | |
| | | | | | | | |
| | |
| | | | | | | 100,129 | |
|
| Media — 0.9% | |
Altice U.S.A., Inc., Class A(a) | | | 2,207 | | | | 7,548 | |
Comcast Corp., Class A | | | 451 | | | | 17,097 | |
Omnicom Group, Inc. | | | 11 | | | | 1,038 | |
Sirius XM Holdings, Inc.(b) | | | 2,169 | | | | 8,611 | |
| | | | | | | | |
| | |
| | | | | | | 34,294 | |
|
| Metals & Mining — 1.2% | |
Nucor Corp. | | | 74 | | | | 11,431 | |
Reliance Steel & Aluminum Co. | | | 63 | | | | 16,175 | |
Steel Dynamics, Inc. | | | 177 | | | | 20,011 | |
United States Steel Corp. | | | 53 | | | | 1,383 | |
| | | | | | | | |
| | |
| | | | | | | 49,000 | |
|
| Mortgage Real Estate Investment Trusts (REITs) — 0.0% | |
AGNC Investment Corp. | | | 82 | | | | 827 | |
| | | | | | | | |
|
| Multi-Utilities — 2.0% | |
Ameren Corp. | | | 364 | | | | 31,446 | |
CMS Energy Corp. | | | 76 | | | | 4,665 | |
Consolidated Edison, Inc. | | | 167 | | | | 15,977 | |
NiSource, Inc. | | | 309 | | | | 8,639 | |
WEC Energy Group, Inc. | | | 182 | | | | 17,252 | |
| | | | | | | | |
| | |
| | | | | | | 77,979 | |
|
| Office REITs — 0.7% | |
JBG SMITH Properties | | | 116 | | | | 1,747 | |
SL Green Realty Corp. | | | 926 | | | | 21,779 | |
Vornado Realty Trust | | | 262 | | | | 4,027 | |
| | | | | | | | |
| | |
| | | | | | | 27,553 | |
|
| Oil, Gas & Consumable Fuels — 6.2% | |
Antero Midstream Corp. | | | 3,781 | | | | 39,663 | |
APA Corp. | | | 45 | | | | 1,623 | |
Chesapeake Energy Corp. | | | 783 | | | | 59,539 | |
Coterra Energy, Inc. | | | 454 | | | | 11,141 | |
Devon Energy Corp. | | | 576 | | | | 29,151 | |
DT Midstream, Inc. | | | 269 | | | | 13,281 | |
Range Resources Corp. | | | 218 | | | | 5,770 | |
Vitesse Energy, Inc. | | | 4,691 | | | | 89,270 | |
| | | | | | | | |
| | |
| | | | | | | 249,438 | |
| | |
| 14 | | 2 0 2 3 I SHARES ANNUAL REPORT TO SHAREHOLDERS |
| | |
Schedule of Investments (continued) March 31, 2023 | | iShares® Factors US Value Style ETF (Percentages shown are based on Net Assets) |
| | | | | | | | |
| | |
| Security | | Shares | | | Value | |
|
| Paper & Forest Products — 1.5% | |
Louisiana-Pacific Corp. | | | 1,087 | | | $ | 58,926 | |
| | | | | | | | |
|
| Pharmaceuticals — 9.1% | |
Bristol-Myers Squibb Co. | | | 603 | | | | 41,794 | |
Eli Lilly & Co. | | | 69 | | | | 23,696 | |
Johnson & Johnson | | | 760 | | | | 117,800 | |
Merck & Co., Inc. | | | 962 | | | | 102,347 | |
Organon & Co. | | | 25 | | | | 588 | |
Pfizer, Inc. | | | 1,800 | | | | 73,440 | |
Royalty Pharma PLC, Class A | | | 158 | | | | 5,693 | |
| | | | | | | | |
| | |
| | | | | | | 365,358 | |
|
| Professional Services — 0.9% | |
Dun & Bradstreet Holdings, Inc. | | | 1,077 | | | | 12,644 | |
FTI Consulting, Inc.(a) | | | 82 | | | | 16,183 | |
ManpowerGroup, Inc. | | | 25 | | | | 2,063 | |
Robert Half International, Inc. | | | 65 | | | | 5,237 | |
| | | | | | | | |
| | |
| | | | | | | 36,127 | |
|
| Residential REITs — 0.5% | |
Equity Residential | | | 313 | | | | 18,780 | |
| | | | | | | | |
|
Retail REITs — 0.1% | |
Brixmor Property Group, Inc. | | | 251 | | | | 5,402 | |
| | | | | | | | |
|
Semiconductors & Semiconductor Equipment — 1.4% | |
Cirrus Logic, Inc.(a) | | | 120 | | | | 13,126 | |
Texas Instruments, Inc. | | | 241 | | | | 44,828 | |
| | | | | | | | |
| | |
| | | | | | | 57,954 | |
|
| Software — 1.6% | |
Dropbox, Inc., Class A(a) | | | 644 | | | | 13,923 | |
Manhattan Associates, Inc.(a) | | | 185 | | | | 28,647 | |
Nutanix, Inc., Class A(a) | | | 365 | | | | 9,487 | |
Oracle Corp. | | | 16 | | | | 1,487 | |
Teradata Corp.(a) | | | 290 | | | | 11,681 | |
| | | | | | | | |
| | |
| | | | | | | 65,225 | |
|
| Specialized REITs — 1.0% | |
Public Storage | | | 64 | | | | 19,337 | |
SBA Communications Corp. | | | 82 | | | | 21,408 | |
| | | | | | | | |
| | |
| | | | | | | 40,745 | |
|
| Specialty Retail — 3.8% | |
AutoNation, Inc.(a) | | | 151 | | | | 20,288 | |
AutoZone, Inc.(a) | | | 5 | | | | 12,291 | |
Bath & Body Works, Inc. | | | 170 | | | | 6,219 | |
Best Buy Co., Inc. | | | 155 | | | | 12,132 | |
Dick’s Sporting Goods, Inc. | | | 105 | | | | 14,898 | |
Home Depot, Inc. | | | 55 | | | | 16,231 | |
Leslie’s, Inc.(a) | | | 520 | | | | 5,725 | |
Lowe’s Cos., Inc. | | | 78 | | | | 15,598 | |
| | | | | | | | |
| | |
| Security | | Shares | | | Value | |
|
| Specialty Retail (continued) | |
O’Reilly Automotive, Inc.(a) | | | 1 | | | $ | 849 | |
Victoria’s Secret & Co.(a) | | | 479 | | | | 16,358 | |
Wayfair, Inc., Class A(a)(b) | | | 22 | | | | 755 | |
Williams-Sonoma, Inc. | | | 254 | | | | 30,902 | |
| | | | | | | | |
| | |
| | | | | | | 152,246 | |
|
| Technology Hardware, Storage & Peripherals — 2.5% | |
Hewlett Packard Enterprise Co. | | | 3,474 | | | | 55,341 | |
HP, Inc. | | | 1,576 | | | | 46,255 | |
| | | | | | | | |
| | |
| | | | | | | 101,596 | |
|
| Textiles, Apparel & Luxury Goods — 1.2% | |
Carter’s, Inc. | | | 74 | | | | 5,322 | |
Columbia Sportswear Co. | | | 197 | | | | 17,777 | |
Deckers Outdoor Corp.(a) | | | 51 | | | | 22,927 | |
| | | | | | | | |
| | |
| | | | | | | 46,026 | |
|
| Tobacco — 1.9% | |
Altria Group, Inc. | | | 692 | | | | 30,877 | |
Philip Morris International, Inc. | | | 471 | | | | 45,805 | |
| | | | | | | | |
| | |
| | | | | | | 76,682 | |
|
| Trading Companies & Distributors — 0.5% | |
MSC Industrial Direct Co., Inc., Class A | | | 21 | | | | 1,764 | |
Watsco, Inc. | | | 55 | | | | 17,499 | |
| | | | | | | | |
| | |
| | | | | | | 19,263 | |
| | | | | | | | |
| | |
Total Long-Term Investments — 99.7%
(Cost: $4,245,074) | | | | | | | 3,981,842 | |
| | | | | | | | |
|
| Short-Term Securities | |
|
| Money Market Funds — 0.7% | |
BlackRock Cash Funds: Institutional, SL Agency Shares, 5.01%(c)(d)(e) | | | 22,037 | | | | 22,043 | |
BlackRock Cash Funds: Treasury, SL Agency Shares, 4.73%(c)(d) | | | 5,487 | | | | 5,487 | |
| | | | | | | | |
| | |
Total Short-Term Securities — 0.7%
(Cost: $27,530) | | | | | | | 27,530 | |
| | | | | | | | |
| |
Total Investments — 100.4%
(Cost: $4,272,604) | | | | 4,009,372 | |
Liabilities in Excess of Other Assets — (0.4)% | | | | | | | (14,445 | ) |
| | | | | | | | |
Net Assets — 100.0% | | | $ | 3,994,927 | |
| | | | | | | | |
| (a) | Non-income producing security. |
| (b) | All or a portion of this security is on loan. |
| (c) | Affiliate of the Fund. |
| (d) | Annualized 7-day yield as of period end. |
| (e) | All or a portion of this security was purchased with the cash collateral from loaned securities. |
| | | | |
SCHEDULES OF INVESTMENTS | | | 15 | |
| | |
Schedule of Investments (continued) March 31, 2023 | | iShares® Factors US Value Style ETF |
Affiliates
Investments in issuers considered to be affiliate(s) of the Fund during the year ended March 31, 2023 for purposes of Section 2(a)(3) of the Investment Company Act of 1940, as amended, were as follows:
| | | | | | | | | | | | | | | | | | | | | | | | | | | | | | | | | | | | |
| |
| Affiliated Issuer | | Value at
03/31/22 | | | Purchases
at Cost | | | Proceeds
from Sale | | | Net Realized
Gain (Loss) | | | Change in
Unrealized
Appreciation
(Depreciation) | | | Value at
03/31/23 | | | Shares
Held at
03/31/23 | | | Income | | | Capital Gain
Distributions
from Underlying
Funds | |
| |
| | | | | | | | | |
BlackRock Cash Funds: Institutional, SL Agency Shares | | $ | 105,560 | | | $ | — | | | $ | (83,574 | )(a) | | $ | 74 | | | $ | (17 | ) | | $ | 22,043 | | | | 22,037 | | | $ | 674 | (b) | | $ | — | |
BlackRock Cash Funds: Treasury, SL Agency Shares | | | 10,000 | | | | — | | | | (4,513 | )(a) | | | — | | | | — | | | | 5,487 | | | | 5,487 | | | | 175 | | | | — | |
| | | | | | | | | | | | | | | | | | | | | | | | | | | | | | | | | | | | |
| | | | | | | | | |
| | | | | | | | | | | | | | $ | 74 | | | $ | (17 | ) | | $ | 27,530 | | | | | | | $ | 849 | | | $ | — | |
| | | | | | | | | | | | | | | | | | | | | | | | | | | | | | | | | | | | |
| | (a) | Represents net amount purchased (sold). | |
| | (b) | All or a portion represents securities lending income earned from the reinvestment of cash collateral from loaned securities, net of fees and collateral investment expenses, and other payments to and from borrowers of securities. | |
Fair Value Hierarchy as of Period End
Various inputs are used in determining the fair value of financial instruments. For a description of the input levels and information about the Fund’s policy regarding valuation of financial instruments, refer to the Notes to Financial Statements.
The following table summarizes the Fund’s financial instruments categorized in the fair value hierarchy. The breakdown of the Fund’s financial instruments into major categories is disclosed in the Schedule of Investments above.
| | | | | | | | | | | | | | | | |
| |
| | | | |
| | | Level 1 | | | Level 2 | | | Level 3 | | | Total | |
| |
| | | | |
Assets | | | | | | | | | | | | | | | | |
Investments | | | | | | | | | | | | | | | | |
Long-Term Investments | | | | | | | | | | | | | | | | |
Common Stocks | | $ | 3,981,842 | | | $ | — | | | $ | — | | | $ | 3,981,842 | |
Short-Term Securities | | | | | | | | | | | | | | | | |
Money Market Funds | | | 27,530 | | | | — | | | | — | | | | 27,530 | |
| | | | | | | | | | | | | | | | |
| | | | |
| | $ | 4,009,372 | | | $ | — | | | $ | — | | | $ | 4,009,372 | |
| | | | | | | | | | | | | | | | |
See notes to financial statements.
| | |
| 16 | | 2 0 2 3 I SHARES ANNUAL REPORT TO SHAREHOLDERS |
Statements of Assets and Liabilities
March 31, 2023
| | | | | | | | |
| | | iShares Factors US Growth Style
ETF | | | iShares Factors US Value Style ETF | |
| |
| | |
ASSETS | | | | | | | | |
Investments, at value — unaffiliated(a)(b) | | $ | 1,653,330 | | | $ | 3,981,842 | |
Investments, at value — affiliated(c) | | | 2,959 | | | | 27,530 | |
Cash | | | 66 | | | | 2 | |
Receivables: | | | | | | | | |
Investments sold | | | 51 | | | | 17,996 | |
Securities lending income — affiliated | | | — | | | | 43 | |
Dividends — unaffiliated | | | 686 | | | | 6,087 | |
Dividends — affiliated | | | 8 | | | | 31 | |
| | | | | | | | |
| | |
Total assets | | | 1,657,100 | | | | 4,033,531 | |
| | | | | | | | |
| | |
LIABILITIES | | | | | | | | |
Collateral on securities loaned | | | 1,725 | | | | 22,085 | |
Payables: | | | | | | | | |
Investments purchased | | | 51 | | | | 15,680 | |
Investment advisory fees | | | 336 | | | | 839 | |
| | | | | | | | |
| | |
Total liabilities | | | 2,112 | | | | 38,604 | |
| | | | | | | | |
| | |
NET ASSETS | | $ | 1,654,988 | | | $ | 3,994,927 | |
| | | | | | | | |
| | |
NET ASSETS CONSIST OF: | | | | | | | | |
Paid-in capital | | $ | 2,659,925 | | | $ | 5,172,151 | |
Accumulated loss | | | (1,004,937 | ) | | | (1,177,224 | ) |
| | | | | | | | |
| | |
NET ASSETS | | $ | 1,654,988 | | | $ | 3,994,927 | |
| | | | | | | | |
| | |
NET ASSET VALUE | | | | | | | | |
Shares outstanding | | | 50,000 | | | | 150,000 | |
| | | | | | | | |
| | |
Net asset value | | $ | 33.10 | | | $ | 26.63 | |
| | | | | | | | |
| | |
Shares authorized | | | Unlimited | | | | Unlimited | |
| | | | | | | | |
| | |
Par value | | | None | | | | None | |
| | | | | | | | |
| | |
(a) Investments, at cost — unaffiliated | | $ | 1,736,326 | | | $ | 4,245,074 | |
(b) Securities loaned, at value | | $ | 1,751 | | | $ | 21,712 | |
(c) Investments, at cost — affiliated | | $ | 2,959 | | | $ | 27,530 | |
See notes to financial statements.
Statements of Operations
Year Ended March 31, 2023
| | | | | | | | |
| | | iShares
Factors US
Growth Style
ETF | | | iShares
Factors US
Value Style
ETF | |
| |
| | |
INVESTMENT INCOME | | | | | | | | |
Dividends — unaffiliated | | $ | 37,086 | | | $ | 149,722 | |
Dividends — affiliated | | | 75 | | | | 175 | |
Securities lending income — affiliated — net | | | 102 | | | | 674 | |
Foreign taxes withheld | | | — | | | | (146 | ) |
| | | | | | | | |
| | |
Total investment income | | | 37,263 | | | | 150,425 | |
| | | | | | | | |
| | |
EXPENSES | | | | | | | | |
Investment advisory | | | 7,385 | | | | 12,818 | |
| | | | | | | | |
| | |
Total expenses | | | 7,385 | | | | 12,818 | |
| | | | | | | | |
| | |
Net investment income | | | 29,878 | | | | 137,607 | |
| | | | | | | | |
| | |
REALIZED AND UNREALIZED GAIN (LOSS) | | | | | | | | |
Net realized gain (loss) from: | | | | | | | | |
Investments — unaffiliated | | | (311,310 | ) | | | (682,582 | ) |
Investments — affiliated | | | 10 | | | | 74 | |
In-kind redemptions — unaffiliated(a) | | | (444,383 | ) | | | 309,605 | |
| | | | | | | | |
| | |
| | | (755,683 | ) | | | (372,903 | ) |
| | | | | | | | |
| | |
Net change in unrealized appreciation (depreciation) on: | | | | | | | | |
Investments — unaffiliated | | | 121,880 | | | | (21,263 | ) |
Investments — affiliated | | | (1 | ) | | | (17 | ) |
| | | | | | | | |
| | |
| | | 121,879 | | | | (21,280 | ) |
| | | | | | | | |
| | |
Net realized and unrealized loss | | | (633,804 | ) | | | (394,183 | ) |
| | | | | | | | |
| | |
NET DECREASE IN NET ASSETS RESULTING FROM OPERATIONS | | $ | (603,926 | ) | | $ | (256,576 | ) |
| | | | | | | | |
| (a) | See Note 2 of the Notes to Financial Statements. |
See notes to financial statements.
| | |
| 18 | | 2 0 2 3 I SHARES ANNUAL REPORT TO SHAREHOLDERS |
Statements of Changes in Net Assets
| | | | | | | | | | | | | | | | |
| | | iShares Factors US Growth Style ETF | | | iShares Factors US Value Style ETF | |
| | | | | | | | |
| | | | |
| | | Year Ended
03/31/23 | | | Year Ended
03/31/22 | | | Year Ended
03/31/23 | | | Year Ended
03/31/22 | |
INCREASE (DECREASE) IN NET ASSETS | | | | | | | | | | | | | | | | |
| | | | |
OPERATIONS | | | | | | | | | | | | | | | | |
| | | | |
Net investment income | | $ | 29,878 | | | $ | 36,997 | | | $ | 137,607 | | | $ | 175,589 | |
Net realized gain (loss) | | | (755,683 | ) | | | 1,652,570 | | | | (372,903 | ) | | | 2,079,050 | |
Net change in unrealized appreciation (depreciation) | | | 121,879 | | | | (1,206,725 | ) | | | (21,280 | ) | | | (1,743,608 | ) |
| | | | | | | | | | | | | | | | |
| | | | |
Net increase (decrease) in net assets resulting from operations | | | (603,926 | ) | | | 482,842 | | | | (256,576 | ) | | | 511,031 | |
| | | | | | | | | | | | | | | | |
| | | | |
DISTRIBUTIONS TO SHAREHOLDERS(a) | | | | | | | | | | | | | | | | |
| | | | |
Decrease in net assets resulting from distributions to shareholders | | | (31,710 | ) | | | (43,421 | ) | | | (136,086 | ) | | | (173,963 | ) |
| | | | | | | | | | | | | | | | |
| | | | |
CAPITAL SHARE TRANSACTIONS | | | | | | | | | | | | | | | | |
| | | | |
Net increase (decrease) in net assets derived from capital share transactions | | | (3,168,344 | ) | | | 167,748 | | | | (2,875,406 | ) | | | 62,505 | |
| | | | | | | | | | | | | | | | |
| | | | |
NET ASSETS | | | | | | | | | | | | | | | | |
| | | | |
Total increase (decrease) in net assets | | | (3,803,980 | ) | | | 607,169 | | | | (3,268,068 | ) | | | 399,573 | |
Beginning of year | | | 5,458,968 | | | | 4,851,799 | | | | 7,262,995 | | | | 6,863,422 | |
| | | | | | | | | | | | | | | | |
| | | | |
End of year | | $ | 1,654,988 | | | $ | 5,458,968 | | | $ | 3,994,927 | | | $ | 7,262,995 | |
| | | | | | | | | | | | | | | | |
| (a) | Distributions for annual periods determined in accordance with U.S. federal income tax regulations. |
See notes to financial statements.
Financial Highlights
(For a share outstanding throughout each period)
| | | | | | | | | | | | | | | | |
| | | iShares Factors US Growth Style ETF | |
| | | | |
| |
| Year Ended
03/31/23 |
| |
| Year Ended
03/31/22 |
| |
| Year Ended
03/31/21 |
| |
| Period From
01/14/20 to 03/31/20 |
(a) |
| | |
| | | | |
Net asset value, beginning of period | | $ | 36.39 | | | $ | 32.35 | | | $ | 20.27 | | | $ | 24.96 | |
| | | | | | | | | | | | | | | | |
Net investment income(b) | | | 0.32 | | | | 0.24 | | | | 0.25 | | | | 0.06 | |
Net realized and unrealized gain (loss)(c) | | | (3.08 | ) | | | 4.06 | | | | 12.08 | | | | (4.69 | ) |
| | | | | | | | | | | | | | | | |
Net increase (decrease) from investment operations | | | (2.76 | ) | | | 4.30 | | | | 12.33 | | | | (4.63 | ) |
| | | | | | | | | | | | | | | | |
| | | | |
Distributions(d) | | | | | | | | | | | | | | | | |
From net investment income | | | (0.53 | ) | | | (0.26 | ) | | | (0.25 | ) | | | (0.06 | ) |
Return of capital | | | — | | | | — | | | | — | | | | (0.00 | )(e) |
| | | | | | | | | | | | | | | | |
Total distributions | | | (0.53 | ) | | | (0.26 | ) | | | (0.25 | ) | | | (0.06 | ) |
| | | | | | | | | | | | | | | | |
Net asset value, end of period | | $ | 33.10 | | | $ | 36.39 | | | $ | 32.35 | | | $ | 20.27 | |
| | | | | | | | | | | | | | | | |
| | | | |
Total Return(f) | | | | | | | | | | | | | | | | |
Based on net asset value | | | (7.47 | )% | | | 13.28 | % | | | 61.00 | % | | | (18.54 | )%(g) |
| | | | | | | | | | | | | | | | |
| | | | |
Ratios to Average Net Assets(h) | | | | | | | | | | | | | | | | |
Total expenses | | | 0.25 | % | | | 0.25 | % | | | 0.25 | % | | | 0.25 | %(i) |
| | | | | | | | | | | | | | | | |
Net investment income | | | 1.01 | % | | | 0.66 | % | | | 0.88 | % | | | 1.20 | %(i) |
| | | | | | | | | | | | | | | | |
| | | | |
Supplemental Data | | | | | | | | | | | | | | | | |
Net assets, end of period (000) | | $ | 1,655 | | | $ | 5,459 | | | $ | 4,852 | | | $ | 4,054 | |
| | | | | | | | | | | | | | | | |
Portfolio turnover rate(j) | | | 67 | % | | | 111 | % | | | 103 | % | | | 13 | % |
| | | | | | | | | | | | | | | | |
| (a) | Commencement of operations. |
| (b) | Based on average shares outstanding. |
| (c) | The amounts reported for a share outstanding may not accord with the change in aggregate gains and losses in securities for the fiscal period due to the timing of capital share transactions in relation to the fluctuating market values of the Fund’s underlying securities. |
| (d) | Distributions for annual periods determined in accordance with U.S. federal income tax regulations. |
| (e) | Rounds to less than $0.01. |
| (f) | Where applicable, assumes the reinvestment of distributions. |
| (h) | Excludes fees and expenses incurred indirectly as a result of investments in underlying funds. |
| (j) | Portfolio turnover rate excludes in-kind transactions. |
See notes to financial statements.
| | |
| 20 | | 2 0 2 3 I SHARES ANNUAL REPORT TO SHAREHOLDERS |
Financial Highlights
(For a share outstanding throughout each period)
| | | | | | | | | | | | | | | | |
| | | iShares Factors US Value Style ETF | |
| | | | |
| |
| Year Ended
03/31/23 |
| |
| Year Ended
03/31/22 |
| |
| Year Ended
03/31/21 |
| |
| Period From
01/14/20 to 03/31/20 |
(a) |
| | |
| | | | |
Net asset value, beginning of period | | $ | 29.05 | | | $ | 27.45 | | | $ | 17.46 | | | $ | 25.09 | |
| | | | | | | | | | | | | | | | |
Net investment income(b) | | | 0.73 | | | | 0.69 | | | | 0.51 | | | | 0.15 | |
Net realized and unrealized gain (loss)(c) | | | (2.33 | ) | | | 1.58 | | | | 10.06 | | | | (7.65 | ) |
| | | | | | | | | | | | | | | | |
Net increase (decrease) from investment operations | | | (1.60 | ) | | | 2.27 | | | | 10.57 | | | | (7.50 | ) |
| | | | | | | | | | | | | | | | |
Distributions from net investment income(d) | | | (0.82 | ) | | | (0.67 | ) | | | (0.58 | ) | | | (0.13 | ) |
| | | | | | | | | | | | | | | | |
Net asset value, end of period | | $ | 26.63 | | | $ | 29.05 | | | $ | 27.45 | | | $ | 17.46 | |
| | | | | | | | | | | | | | | | |
| | | | |
Total Return(e) | | | | | | | | | | | | | | | | |
Based on net asset value | | | (5.40 | )% | | | 8.28 | % | | | 61.25 | % | | | (29.87 | )%(f) |
| | | | | | | | | | | | | | | | |
| | | | |
Ratios to Average Net Assets(g) | | | | | | | | | | | | | | | | |
Total expenses | | | 0.25 | % | | | 0.25 | % | | | 0.25 | % | | | 0.25 | %(h) |
| | | | | | | | | | | | | | | | |
Net investment income | | | 2.69 | % | | | 2.37 | % | | | 2.29 | % | | | 3.09 | %(h) |
| | | | | | | | | | | | | | | | |
| | | | |
Supplemental Data | | | | | | | | | | | | | | | | |
Net assets, end of period (000) | | $ | 3,995 | | | $ | 7,263 | | | $ | 6,863 | | | $ | 3,492 | |
| | | | | | | | | | | | | | | | |
Portfolio turnover rate(i) | | | 109 | % | | | 104 | % | | | 148 | % | | | 16 | % |
| | | | | | | | | | | | | | | | |
| (a) | Commencement of operations. |
| (b) | Based on average shares outstanding. |
| (c) | The amounts reported for a share outstanding may not accord with the change in aggregate gains and losses in securities for the fiscal period due to the timing of capital share transactions in relation to the fluctuating market values of the Fund’s underlying securities. |
| (d) | Distributions for annual periods determined in accordance with U.S. federal income tax regulations. |
| (e) | Where applicable, assumes the reinvestment of distributions. |
| (g) | Excludes fees and expenses incurred indirectly as a result of investments in underlying funds. |
| (i) | Portfolio turnover rate excludes in-kind transactions. |
See notes to financial statements.
Notes to Financial Statements
iShares Trust (the “Trust”) is registered under the Investment Company Act of 1940, as amended (the “1940 Act”), as an open-end management investment company. The Trust is organized as a Delaware statutory trust and is authorized to have multiple series or portfolios.
These financial statements relate only to the following funds (each, a “Fund” and collectively, the “Funds”):
| | |
| iShares ETF | | Diversification Classification |
Factors US Growth Style | | Non-Diversified |
Factors US Value Style | | Diversified(a) |
| | (a) | The Fund’s classification changed from non-diversified to diversified during the reporting period. | |
| 2. | SIGNIFICANT ACCOUNTING POLICIES |
The financial statements are prepared in conformity with accounting principles generally accepted in the United States of America (“U.S. GAAP”), which may require management to make estimates and assumptions that affect the reported amounts of assets and liabilities in the financial statements, disclosure of contingent assets and liabilities at the date of the financial statements and the reported amounts of increases and decreases in net assets from operations during the reporting period. Actual results could differ from those estimates. Each Fund is considered an investment company under U.S. GAAP and follows the accounting and reporting guidance applicable to investment companies. Below is a summary of significant accounting policies:
Investment Transactions and Income Recognition: For financial reporting purposes, investment transactions are recorded on the dates the transactions are executed. Realized gains and losses on investment transactions are determined using the specific identification method. Dividend income and capital gain distributions, if any, are recorded on the ex-dividend date. Non-cash dividends, if any, are recorded on the ex-dividend date at fair value. Upon notification from issuers or as estimated by management, a portion of the dividend income received from a real estate investment trust may be redesignated as a reduction of cost of the related investment and/or realized gain.
Foreign Taxes: The Funds may be subject to foreign taxes (a portion of which may be reclaimable) on income, stock dividends, capital gains on investments, or certain foreign currency transactions. All foreign taxes are recorded in accordance with the applicable foreign tax regulations and rates that exist in the foreign jurisdiction in which each Fund invests. These foreign taxes, if any, are paid by each Fund and are reflected in its Statements of Operations as follows: foreign taxes withheld at source are presented as a reduction of income, foreign taxes on securities lending income are presented as a reduction of securities lending income, foreign taxes on stock dividends are presented as “Other foreign taxes”, and foreign taxes on capital gains from sales of investments and foreign taxes on foreign currency transactions are included in their respective net realized gain (loss) categories. Foreign taxes payable or deferred as of March 31, 2023, if any, are disclosed in the Statements of Assets and Liabilities.
The Funds file withholding tax reclaims in certain jurisdictions to recover a portion of amounts previously withheld. The Funds may record a reclaim receivable based on collectability, which includes factors such as the jurisdiction’s applicable laws, payment history and market convention. The Statements of Operations include tax reclaims recorded as well as professional and other fees, if any, associated with recovery of foreign withholding taxes.
In-kind Redemptions: For financial reporting purposes, in-kind redemptions are treated as sales of securities resulting in realized capital gains or losses to the Funds. Because such gains or losses are not taxable to the Funds and are not distributed to existing Fund shareholders, the gains or losses are reclassified from accumulated net realized gain (loss) to paid-in capital at the end of the Funds’ tax year. These reclassifications have no effect on net assets or net asset value (“NAV”) per share.
Distributions: Dividends and distributions paid by each Fund are recorded on the ex-dividend dates. Distributions are determined on a tax basis and may differ from net investment income and net realized capital gains for financial reporting purposes. Dividends and distributions are paid in U.S. dollars and cannot be automatically reinvested in additional shares of the Funds.
The character and timing of distributions are determined in accordance with U.S. federal income tax regulations, which may differ from U.S. GAAP.
Indemnifications: In the normal course of business, each Fund enters into contracts that contain a variety of representations that provide general indemnification. The Funds’ maximum exposure under these arrangements is unknown because it involves future potential claims against the Funds, which cannot be predicted with any certainty.
| 3. | INVESTMENT VALUATION AND FAIR VALUE MEASUREMENTS |
Investment Valuation Policies: Each Fund’s investments are valued at fair value (also referred to as “market value” within the financial statements) each day that the Fund’s listing exchange is open and, for financial reporting purposes, as of the report date. U.S. GAAP defines fair value as the price a fund would receive to sell an asset or pay to transfer a liability in an orderly transaction between market participants at the measurement date. The Board of Trustees of the Trust (the “Board”) of each Fund has approved the designation of BlackRock Fund Advisors (“BFA”), the Fund’s investment adviser, as the valuation designee for each Fund. Each Fund determines the fair values of its financial instruments using various independent dealers or pricing services under BFA’s policies. If a security’s market price is not readily available or does not otherwise accurately represent the fair value of the security, the security will be valued in accordance with BFA’s policies and procedures as reflecting fair value. BFA has formed a committee (the “Valuation Committee”) to develop pricing policies and procedures and to oversee the pricing function for all financial instruments, with assistance from other BlackRock pricing committees.
| | |
| 22 | | 2 0 2 3 I SHARES ANNUAL REPORT TO SHAREHOLDERS |
Notes to Financial Statements (continued)
Fair Value Inputs and Methodologies: The following methods and inputs are used to establish the fair value of each Fund’s assets and liabilities:
| | • | | Equity investments traded on a recognized securities exchange are valued at that day’s official closing price, as applicable, on the exchange where the stock is primarily traded. Equity investments traded on a recognized exchange for which there were no sales on that day are valued at the last traded price. |
| | • | | Investments in open-end U.S. mutual funds (including money market funds) are valued at that day’s published NAV. |
If events (e.g., market volatility, company announcement or a natural disaster) occur that are expected to materially affect the value of such investment, or in the event that application of these methods of valuation results in a price for an investment that is deemed not to be representative of the market value of such investment, or if a price is not available, the investment will be valued by the Valuation Committee, in accordance with BFA’s policies and procedures as reflecting fair value (“Fair Valued Investments”). The fair valuation approaches that may be used by the Valuation Committee include market approach, income approach and cost approach. Valuation techniques such as discounted cash flow, use of market comparables and matrix pricing are types of valuation approaches and are typically used in determining fair value. When determining the price for Fair Valued Investments, the Valuation Committee seeks to determine the price that each Fund might reasonably expect to receive or pay from the current sale or purchase of that asset or liability in an arm’s-length transaction. Fair value determinations shall be based upon all available factors that the Valuation Committee deems relevant and consistent with the principles of fair value measurement.
Fair value pricing could result in a difference between the prices used to calculate a fund’s NAV and the prices used by the fund’s underlying index, which in turn could result in a difference between the fund’s performance and the performance of the fund’s underlying index.
Fair Value Hierarchy: Various inputs are used in determining the fair value of financial instruments. These inputs to valuation techniques are categorized into a fair value hierarchy consisting of three broad levels for financial reporting purposes as follows:
| | • | | Level 1 – Unadjusted price quotations in active markets/exchanges for identical assets or liabilities that each Fund has the ability to access; |
| | • | | Level 2 – Other observable inputs (including, but not limited to, quoted prices for similar assets or liabilities in markets that are active, quoted prices for identical or similar assets or liabilities in markets that are not active, inputs other than quoted prices that are observable for the assets or liabilities (such as interest rates, yield curves, volatilities, prepayment speeds, loss severities, credit risks and default rates) or other market–corroborated inputs); and |
| | • | | Level 3 – Unobservable inputs based on the best information available in the circumstances, to the extent observable inputs are not available (including the Valuation Committee’s assumptions used in determining the fair value of financial instruments). |
The hierarchy gives the highest priority to unadjusted quoted prices in active markets for identical assets or liabilities (Level 1 measurements) and the lowest priority to unobservable inputs (Level 3 measurements). Accordingly, the degree of judgment exercised in determining fair value is greatest for instruments categorized in Level 3. The inputs used to measure fair value may fall into different levels of the fair value hierarchy. In such cases, for disclosure purposes, the fair value hierarchy classification is determined based on the lowest level input that is significant to the fair value measurement in its entirety. Investments classified within Level 3 have significant unobservable inputs used by the Valuation Committee in determining the price for Fair Valued Investments. Level 3 investments include equity or debt issued by privately held companies or funds that may not have a secondary market and/or may have a limited number of investors. The categorization of a value determined for financial instruments is based on the pricing transparency of the financial instruments and is not necessarily an indication of the risks associated with investing in those securities.
| 4. | SECURITIES AND OTHER INVESTMENTS |
Securities Lending: Each Fund may lend its securities to approved borrowers, such as brokers, dealers and other financial institutions. The borrower pledges and maintains with the Fund collateral consisting of cash, an irrevocable letter of credit issued by an approved bank, or securities issued or guaranteed by the U.S. government. The initial collateral received by each Fund is required to have a value of at least 102% of the current market value of the loaned securities for securities traded on U.S. exchanges and a value of at least 105% for all other securities. The collateral is maintained thereafter at a value equal to at least 100% of the current value of the securities on loan. The market value of the loaned securities is determined at the close of each business day of the Fund and any additional required collateral is delivered to the Fund or excess collateral is returned by the Fund, on the next business day. During the term of the loan, each Fund is entitled to all distributions made on or in respect of the loaned securities but does not receive interest income on securities received as collateral. Loans of securities are terminable at any time and the borrower, after notice, is required to return borrowed securities within the standard time period for settlement of securities transactions.
As of period end, any securities on loan were collateralized by cash and/or U.S. Government obligations. Cash collateral invested in money market funds managed by BFA or its affiliates is disclosed in the Schedule of Investments. Any non-cash collateral received cannot be sold, re-invested or pledged by the Fund, except in the event of borrower default. The securities on loan, if any, are also disclosed in each Fund’s Schedule of Investments. The market value of any securities on loan and the value of any related cash collateral are disclosed in the Statements of Assets and Liabilities.
Securities lending transactions are entered into by the Funds under Master Securities Lending Agreements (each, an “MSLA”) which provide the right, in the event of default (including bankruptcy or insolvency) for the non-defaulting party to liquidate the collateral and calculate a net exposure to the defaulting party or request additional collateral. In the event that a borrower defaults, the Funds, as lender, would offset the market value of the collateral received against the market value of the securities loaned. When the value of the collateral is greater than that of the market value of the securities loaned, the lender is left with a net amount payable to the defaulting party. However, bankruptcy or insolvency laws of a particular jurisdiction may impose restrictions on or prohibitions against such a right of offset in the event of an MSLA counterparty’s bankruptcy or insolvency. Under the MSLA, absent an event of default, the borrower can resell or re-pledge the loaned securities, and the Funds can reinvest cash collateral received in connection with loaned securities. Upon an event of default, the parties’ obligations to return the securities or collateral to the other party are extinguished, and the parties can resell or re-pledge the loaned securities or the collateral received in connection with the loaned securities in order to satisfy the defaulting party’s net payment obligation for all transactions under the MSLA. The defaulting party remains liable for any deficiency.
| | | | |
NOTES TO FINANCIAL STATEMENTS | | | 23 | |
Notes to Financial Statements (continued)
As of period end, the following table is a summary of the securities on loan by counterparty which are subject to offset under an MSLA:
| | | | | | | | | | | | | | | | |
| | |
iShares ETF and Counterparty | |
| Securities
Loaned at Value |
| |
| Cash
Collateral Received |
(a) | |
| Non-Cash
Collateral Received, at Fair Value |
(a) | |
| Net
Amount |
(b) |
| | |
Factors US Growth Style | | | | | | | | | | | | | | | | |
Morgan Stanley | | $ | 1,751 | | | $ | (1,725 | ) | | $ | — | | | $ | 26 | |
| | | | | | | | | | | | | | | | |
| | | | |
Factors US Value Style | | | | | | | | | | | | | | | | |
Barclays Capital, Inc. | | $ | 123 | | | $ | (123 | ) | | $ | — | | | $ | — | |
Jefferies LLC | | | 3,446 | | | | (3,446 | ) | | | — | | | | — | |
Morgan Stanley | | | 5,676 | | | | (5,676 | ) | | | — | | | | — | |
UBS Securities LLC | | | 12,467 | | | | (12,262 | ) | | | — | | | | 205 | |
| | | | | | | | | | | | | | | | |
| | $ | 21,712 | | | $ | (21,507 | ) | | $ | — | | | $ | 205 | |
| | | | | | | | | | | | | | | | |
| | (a) | Collateral received in excess of the market value of securities on loan is not presented in this table. The total cash collateral received by each Fund is disclosed in the Funds’ Statements of Assets and Liabilities. | |
| | (b) | The market value of the loaned securities is determined as of March 31, 2023. Additional collateral is delivered to the Fund on the next business day in accordance with the MSLA. The net amount would be subject to the borrower default indemnity in the event of default by the counterparty. | |
The risks of securities lending include the risk that the borrower may not provide additional collateral when required or may not return the securities when due. To mitigate these risks, each Fund benefits from a borrower default indemnity provided by BlackRock, Inc. (“BlackRock”). BlackRock’s indemnity allows for full replacement of the securities loaned to the extent the collateral received does not cover the value of the securities loaned in the event of borrower default. Each Fund could incur a loss if the value of an investment purchased with cash collateral falls below the market value of the loaned securities or if the value of an investment purchased with cash collateral falls below the value of the original cash collateral received. Such losses are borne entirely by each Fund.
| 5. | INVESTMENT ADVISORY AGREEMENT AND OTHER TRANSACTIONS WITH AFFILIATES |
Investment Advisory Fees: Pursuant to an Investment Advisory Agreement with the Trust, BFA manages the investment of each Fund’s assets. BFA is a California corporation indirectly owned by BlackRock. Under the Investment Advisory Agreement, BFA is responsible for substantially all expenses of the Funds, except (i) interest and taxes; (ii) brokerage commissions and other expenses connected with the execution of portfolio transactions; (iii) distribution fees; (iv) the advisory fee payable to BFA; and (v) litigation expenses and any extraordinary expenses (in each case as determined by a majority of the independent trustees).
For its investment advisory services to each of the following Funds, BFA is entitled to an annual investment advisory fee, accrued daily and paid monthly by the Funds, based on the average daily net assets of each Fund as follows:
| | |
| iShares ETF | | Investment Advisory Fees |
Factors US Growth Style | | 0.25% |
Factors US Value Style | | 0.25 |
Distributor: BlackRock Investments, LLC (“BRIL”), an affiliate of BFA, is the distributor for each Fund. Pursuant to the distribution agreement, BFA is responsible for any fees or expenses for distribution services provided to the Funds.
ETF Servicing Fees: Each Fund has entered into an ETF Services Agreement with BRIL to perform certain order processing, Authorized Participant communications, and related services in connection with the issuance and redemption of Creation Units (“ETF Services”). BRIL is entitled to a transaction fee from Authorized Participants on each creation or redemption order for the ETF Services provided. The Funds do not pay BRIL for ETF Services.
Prior to April 25, 2022, ETF Services were performed by State Street Bank and Trust Company.
Securities Lending: The U.S. Securities and Exchange Commission (the “SEC”) has issued an exemptive order which permits BlackRock Institutional Trust Company, N.A. (“BTC”), an affiliate of BFA, to serve as securities lending agent for the Funds, subject to applicable conditions. As securities lending agent, BTC bears all operational costs directly related to securities lending, including any custodial costs. Each Fund is responsible for fees in connection with the investment of cash collateral received for securities on loan (the “collateral investment fees”). The cash collateral is invested in a money market fund, BlackRock Cash Funds: Institutional or BlackRock Cash Funds: Treasury, managed by BFA, or its affiliates. However, BTC has agreed to reduce the amount of securities lending income it receives in order to effectively limit the collateral investment fees each Fund bears to an annual rate of 0.04%. The SL Agency Shares of such money market fund will not be subject to a sales load, distribution fee or service fee. The money market fund in which the cash collateral has been invested may, under certain circumstances, impose a liquidity fee of up to 2% of the value redeemed or temporarily restrict redemptions for up to 10 business days during a 90 day period, in the event that the money market fund’s weekly liquid assets fall below certain thresholds.
Securities lending income is equal to the total of income earned from the reinvestment of cash collateral, net of fees and other payments to and from borrowers of securities, and less the collateral investment fees. Each Fund retains a portion of securities lending income and remits the remaining portion to BTC as compensation for its services as securities lending agent.
Pursuant to the current securities lending agreement, each Fund retains 81% of securities lending income (which excludes collateral investment fees) and the amount retained can never be less than 70% of the total of securities lending income plus the collateral investment fees.
| | |
| 24 | | 2 0 2 3 I SHARES ANNUAL REPORT TO SHAREHOLDERS |
Notes to Financial Statements (continued)
In addition, commencing the business day following the date that the aggregate securities lending income plus the collateral investment fees generated across all 1940 Act iShares exchange-traded funds (the “iShares ETF Complex”) in that calendar year exceeds a specified threshold, each Fund, pursuant to the securities lending agreement, will retain for the remainder of that calendar year 81% of securities lending income (which excludes collateral investment fees), and the amount retained can never be less than 70% of the total of securities lending income plus the collateral investment fees.
The share of securities lending income earned by each Fund is shown as securities lending income - affiliated - net in its Statements of Operations. For the year ended March 31, 2023, the Funds paid BTC the following amounts for securities lending agent services:
| | | | |
| |
| iShares ETF | | Amounts | |
| |
| |
Factors US Growth Style | | $ | 34 | |
Factors US Value Style | | | 174 | |
| |
Officers and Trustees: Certain officers and/or trustees of the Trust are officers and/or trustees of BlackRock or its affiliates.
Other Transactions: Cross trading is the buying or selling of portfolio securities between funds to which BFA (or an affiliate) serves as investment adviser. At its regularly scheduled quarterly meetings, the Board reviews such transactions as of the most recent calendar quarter for compliance with the requirements and restrictions set forth by Rule 17a-7.
For the year ended March 31, 2023, transactions executed by the Funds pursuant to Rule 17a-7 under the 1940 Act were as follows:
| | | | | | | | | | | | |
| |
| iShares ETF | | Purchases | | | Sales | | | Net Realized
Gain (Loss) | |
| |
Factors US Growth Style | | $ | 59,649 | | | $ | 36,478 | | | $ | (8,853) | |
Factors US Value Style | | | 607,502 | | | | 644,320 | | | | (79,950) | |
| |
Each Fund may invest its positive cash balances in certain money market funds managed by BFA or an affiliate. The income earned on these temporary cash investments is shown as dividends - affiliated in the Statements of Operations.
A fund, in order to improve its portfolio liquidity and its ability to track its underlying index, may invest in shares of other iShares funds that invest in securities in the fund’s underlying index.
For the year ended March 31, 2023, purchases and sales of investments, excluding short-term securities and in-kind transactions, were as follows:
| | | | | | | | |
| |
| iShares ETF | | Purchases | | | Sales | |
| |
Factors US Growth Style | | $ | 2,059,233 | | | $ | 2,105,043 | |
Factors US Value Style | | | 5,586,068 | | | | 5,579,390 | |
| |
For the year ended March 31, 2023, in-kind transactions were as follows:
| | | | | | | | |
| |
| iShares ETF | | In-kind
Purchases | | | In-kind Sales | |
| |
Factors US Growth Style | | $ | 7,167,369 | | | $ | 10,283,479 | |
Factors US Value Style | | | 1,473,314 | | | | 4,346,436 | |
| |
Each Fund is treated as an entity separate from the Trust’s other funds for federal income tax purposes. It is each Fund’s policy to comply with the requirements of the Internal Revenue Code of 1986, as amended, applicable to regulated investment companies, and to distribute substantially all of its taxable income to its shareholders. Therefore, no U.S. federal income tax provision is required.
Management has analyzed tax laws and regulations and their application to the Funds as of March 31, 2023, inclusive of the open tax return years, and does not believe that there are any uncertain tax positions that require recognition of a tax liability in the Funds’ financial statements.
U.S. GAAP requires that certain components of net assets be adjusted to reflect permanent differences between financial and tax reporting. These reclassifications have no effect on net assets or NAV per share. As of March 31, 2023, permanent differences attributable to realized gains (losses) from in-kind redemptions were reclassified to the following accounts:
| | | | | | | | |
| |
| iShares ETF | | Paid-in capital | | | Accumulated earnings (loss) | |
| |
Factors US Growth Style | | $ | (523,117 | ) | | $ | 523,117 | |
Factors US Value Style | | | 168,954 | | | | (168,954 | ) |
| |
| | | | |
NOTES TO FINANCIAL STATEMENTS | | | 25 | |
Notes to Financial Statements (continued)
The tax character of distributions paid was as follows:
| | | | | | | | |
| iShares ETF | | Year Ended March 31, 2023 | | | Year Ended March 31, 2022 | |
Factors US Growth Style | | | | | | | | |
Ordinary income | | $ | 31,710 | | | $ | 43,421 | |
| | | | | | | | |
Factors US Value Style | | | | | | | | |
Ordinary income | | $ | 136,086 | | | $ | 173,963 | |
| | | | | | | | |
As of March 31, 2023, the tax components of accumulated net earnings (losses) were as follows:
| | | | | | | | | | | | | | | | |
| |
| iShares ETF | | Undistributed Ordinary Income | | | Non-expiring Capital Loss Carryforwards(a) | | | Net Unrealized Gains (Losses)(b) | | | Total | |
| |
Factors US Growth Style | | $ | 147 | | | $ | (899,128 | ) | | $ | (105,956 | ) | | | $ (1,004,937 | ) |
Factors US Value Style | | | 3,605 | | | | (863,481 | ) | | | (317,348 | ) | | | (1,177,224 | ) |
| |
| (a) | Amounts available to offset future realized capital gains. | |
| (b) | The difference between book-basis and tax-basis unrealized gains (losses) was attributable primarily to the tax deferral of losses on wash sales, the timing and recognition of partnership income, the characterization of corporate actions, and the realization for tax purposes of unrealized gains on investments in passive foreign investment companies. | |
A fund may own shares in certain foreign investment entities, referred to, under U.S. tax law, as “passive foreign investment companies.” Such fund may elect to mark-to-market annually the shares of each passive foreign investment company and would be required to distribute to shareholders any such marked-to-market gains.
As of March 31, 2023, gross unrealized appreciation and depreciation based on cost of investments (including short positions and derivatives, if any) for U.S. federal income tax purposes were as follows:
| | | | | | | | | | | | | | | | |
| |
| iShares ETF | | Tax Cost | | | Gross Unrealized Appreciation | | | Gross Unrealized Depreciation | | | Net Unrealized Appreciation (Depreciation) | |
| |
Factors US Growth Style | | $ | 1,762,245 | | | $ | 69,176 | | | $ | (175,132 | ) | | $ | (105,956 | ) |
Factors US Value Style | | | 4,326,720 | | | | 171,910 | | | | (489,258 | ) | | | (317,348 | ) |
| |
In the normal course of business, each Fund invests in securities or other instruments and may enter into certain transactions, and such activities subject the Fund to various risks, including, among others, fluctuations in the market (market risk) or failure of an issuer to meet all of its obligations. The value of securities or other instruments may also be affected by various factors, including, without limitation: (i) the general economy; (ii) the overall market as well as local, regional or global political and/or social instability; (iii) regulation, taxation or international tax treaties between various countries; or (iv) currency, interest rate or price fluctuations. Local, regional or global events such as war, acts of terrorism, the spread of infectious illness or other public health issues, recessions, or other events could have a significant impact on the Funds and their investments. Each Fund’s prospectus provides details of the risks to which the Fund is subject.
BFA uses a “passive” or index approach to try to achieve each Fund’s investment objective following the securities included in its underlying index during upturns as well as downturns. BFA does not take steps to reduce market exposure or to lessen the effects of a declining market. Divergence from the underlying index and the composition of the portfolio is monitored by BFA.
The Funds may be exposed to additional risks when reinvesting cash collateral in money market funds that do not seek to maintain a stable NAV per share of $1.00, which may be subject to redemption gates or liquidity fees under certain circumstances.
Infectious Illness Risk: An outbreak of an infectious illness, such as the COVID-19 pandemic, may adversely impact the economies of many nations and the global economy, and may impact individual issuers and capital markets in ways that cannot be foreseen. An infectious illness outbreak may result in, among other things, closed international borders, prolonged quarantines, supply chain disruptions, market volatility or disruptions and other significant economic, social and political impacts.
Valuation Risk: The market values of equities, such as common stocks and preferred securities or equity related investments, such as futures and options, may decline due to general market conditions which are not specifically related to a particular company. They may also decline due to factors which affect a particular industry or industries. A fund may invest in illiquid investments. An illiquid investment is any investment that a fund reasonably expects cannot be sold or disposed of in current market conditions in seven calendar days or less without the sale or disposition significantly changing the market value of the investment. A fund may experience difficulty in selling illiquid investments in a timely manner at the price that it believes the investments are worth. Prices may fluctuate widely over short or extended periods in response to company, market or economic news. Markets also tend to move in cycles, with periods of rising and falling prices. This volatility may cause a fund’s NAV to experience significant increases or decreases over short periods of time. If there is a general decline in the securities and other markets, the NAV of a fund may lose value, regardless of the individual results of the securities and other instruments in which a fund invests.
Counterparty Credit Risk: The Funds may be exposed to counterparty credit risk, or the risk that an entity may fail to or be unable to perform on its commitments related to unsettled or open transactions, including making timely interest and/or principal payments or otherwise honoring its obligations. The Funds manage counterparty credit risk by
| | |
| 26 | | 2 0 2 3 I SHARES ANNUAL REPORT TO SHAREHOLDERS |
Notes to Financial Statements (continued)
entering into transactions only with counterparties that BFA believes have the financial resources to honor their obligations and by monitoring the financial stability of those counterparties. Financial assets, which potentially expose the Funds to market, issuer and counterparty credit risks, consist principally of financial instruments and receivables due from counterparties. The extent of the Funds’ exposure to market, issuer and counterparty credit risks with respect to these financial assets is approximately their value recorded in the Statements of Assets and Liabilities, less any collateral held by the Funds.
Concentration Risk: A diversified portfolio, where this is appropriate and consistent with a fund’s objectives, minimizes the risk that a price change of a particular investment will have a material impact on the NAV of a fund. The investment concentrations within each Fund’s portfolio are disclosed in its Schedule of Investments.
The Funds invest a significant portion of their assets in securities within a single or limited number of market sectors. When a Fund concentrates its investments in this manner, it assumes the risk that economic, regulatory, political and social conditions affecting such sectors may have a significant impact on the fund and could affect the income from, or the value or liquidity of, the fund’s portfolio. Investment percentages in specific sectors are presented in the Schedule of Investments.
Significant Shareholder Redemption Risk: Certain shareholders may own or manage a substantial amount of fund shares and/or hold their fund investments for a limited period of time. Large redemptions of fund shares by these shareholders may force a fund to sell portfolio securities, which may negatively impact the fund’s NAV, increase the fund’s brokerage costs, and/or accelerate the realization of taxable income/gains and cause the fund to make additional taxable distributions to shareholders.
| 9. | CAPITAL SHARE TRANSACTIONS |
Capital shares are issued and redeemed by each Fund only in aggregations of a specified number of shares or multiples thereof (“Creation Units”) at NAV. Except when aggregated in Creation Units, shares of each Fund are not redeemable.
Transactions in capital shares were as follows:
| | | | | | | | | | | | | | | | |
| | | Year Ended
03/31/23 | | | Year Ended
03/31/22 | |
| | | | |
| iShares ETF | | Shares | | | Amount | | | Shares | | | Amount | |
Factors US Growth Style | | | | | | | | | | | | | | | | |
Shares sold | | | 200,000 | | | $ | 6,596,262 | | | | 450,000 | | | $ | 16,814,770 | |
Shares redeemed | | | (300,000 | ) | | | (9,764,606 | ) | | | (450,000 | ) | | | (16,647,022 | ) |
| | | | | | | | | | | | | | | | |
| | | (100,000 | ) | | $ | (3,168,344 | ) | | | — | | | $ | 167,748 | |
| | | | | | | | | | | | | | | | |
| | | | |
Factors US Value Style | | | | | | | | | | | | | | | | |
Shares sold | | | 50,000 | | | $ | 1,458,535 | | | | 450,000 | | | $ | 13,270,839 | |
Shares redeemed | | | (150,000 | ) | | | (4,333,941 | ) | | | (450,000 | ) | | | (13,208,334 | ) |
| | | | | | | | | | | | | | | | |
| | | (100,000 | ) | | $ | (2,875,406 | ) | | | — | | | $ | 62,505 | |
| | | | | | | | | | | | | | | | |
The consideration for the purchase of Creation Units of a fund in the Trust generally consists of the in-kind deposit of a designated portfolio of securities and a specified amount of cash. Certain funds in the Trust may be offered in Creation Units solely or partially for cash in U.S. dollars. Investors purchasing and redeeming Creation Units may pay a purchase transaction fee and a redemption transaction fee directly to BRIL, to offset transfer and other transaction costs associated with the issuance and redemption of Creation Units, including Creation Units for cash. Investors transacting in Creation Units for cash may also pay an additional variable charge to compensate the relevant fund for certain transaction costs (i.e., stamp taxes, taxes on currency or other financial transactions, and brokerage costs) and market impact expenses relating to investing in portfolio securities. Such variable charges, if any, are included in shares sold in the table above.
From time to time, settlement of securities related to in-kind contributions or in-kind redemptions may be delayed. In such cases, securities related to in-kind transactions are reflected as a receivable or a payable in the Statements of Assets and Liabilities.
Management has evaluated the impact of all subsequent events on the Funds through the date the financial statements were available to be issued and has determined that there were no subsequent events requiring adjustment or additional disclosure in the financial statements.
| | | | |
NOTES TO FINANCIAL STATEMENTS | | | 27 | |
| | |
| Report of Independent Registered Public Accounting Firm | | |
To the Board of Trustees of
iShares Trust and Shareholders of each of the two funds listed in the table below
Opinions on the Financial Statements
We have audited the accompanying statements of assets and liabilities, including the schedules of investments, of each of the funds listed in the table below (two of the funds constituting iShares Trust, hereafter collectively referred to as the “Funds”) as of March 31, 2023, the related statements of operations for the year ended March 31, 2023, the statements of changes in net assets for each of the two years in the period ended March 31, 2023, including the related notes, and the financial highlights for each of the periods indicated therein (collectively referred to as the “financial statements”). In our opinion, the financial statements present fairly, in all material respects, the financial position of each of the Funds as of March 31, 2023, the results of each of their operations for the year then ended, the changes in each of their net assets for each of the two years in the period ended March 31, 2023 and each of the financial highlights for each of the periods indicated therein in conformity with accounting principles generally accepted in the United States of America.
|
| |
iShares Factors US Growth Style ETF |
| |
iShares Factors US Value Style ETF |
Basis for Opinions
These financial statements are the responsibility of the Funds’ management. Our responsibility is to express an opinion on the Funds’ financial statements based on our audits. We are a public accounting firm registered with the Public Company Accounting Oversight Board (United States) (PCAOB) and are required to be independent with respect to the Funds in accordance with the U.S. federal securities laws and the applicable rules and regulations of the Securities and Exchange Commission and the PCAOB.
We conducted our audits of these financial statements in accordance with the standards of the PCAOB. Those standards require that we plan and perform the audit to obtain reasonable assurance about whether the financial statements are free of material misstatement, whether due to error or fraud.
Our audits included performing procedures to assess the risks of material misstatement of the financial statements, whether due to error or fraud, and performing procedures that respond to those risks. Such procedures included examining, on a test basis, evidence regarding the amounts and disclosures in the financial statements. Our audits also included evaluating the accounting principles used and significant estimates made by management, as well as evaluating the overall presentation of the financial statements. Our procedures included confirmation of securities owned as of March 31, 2023 by correspondence with the custodian, transfer agent and brokers; when replies were not received from brokers, we performed other auditing procedures. We believe that our audits provide a reasonable basis for our opinions.
/s/PricewaterhouseCoopers LLP
Philadelphia, Pennsylvania
May 25, 2023
We have served as the auditor of one or more BlackRock investment companies since 2000.
| | |
| 28 | | 2 0 2 3 I SHARES ANNUAL REPORT TO SHAREHOLDERS |
| | |
| Important Tax Information (unaudited) | | |
The following amounts, or maximum amounts allowable by law, are hereby designated as qualified dividend income for individuals for the fiscal year ended March 31, 2023:
| | | | |
| iShares ETF | | Qualified Dividend Income | |
Factors US Growth Style | | $ | 32,736 | |
Factors US Value Style | | | 135,895 | |
The following amounts, or maximum amounts allowable by law, are hereby designated as qualified business income for individuals for the fiscal year ended March 31, 2023:
| | | | |
| iShares ETF | | Qualified Business Income | |
Factors US Growth Style | | $ | 110 | |
Factors US Value Style | | | 3,167 | |
The following percentages, or maximum percentages allowable by law, of ordinary income distributions paid during the fiscal year ended March 31, 2023 qualified for the dividends-received deduction for corporate shareholders:
| | | | |
| iShares ETF | | Dividends-Received Deduction | |
Factors US Growth Style | | | 100.00 | % |
Factors US Value Style | | | 98.28 | |
| | | | |
IMPORTANT TAX INFORMATION | | | 29 | |
Statement Regarding Liquidity Risk Management Program (unaudited)
In compliance with Rule 22e-4 under the Investment Company Act of 1940, as amended (the “Liquidity Rule”), iShares Trust (the “Trust”) has adopted and implemented a liquidity risk management program (the “Program”) for iShares Factors US Growth Style ETF and iShares Factors US Value Style ETF (the “Funds” or “ETFs”), each a series of the Trust, which is reasonably designed to assess and manage each Fund’s liquidity risk.
The Board of Trustees (the “Board”) of the Trust, on behalf of the Funds, met on December 9, 2022 (the “Meeting”) to review the Program. The Board previously appointed BlackRock Fund Advisors (“BlackRock”), the investment adviser to the Funds, as the program administrator for each Fund’s Program. BlackRock also previously delegated oversight of the Program to the 40 Act Liquidity Risk Management Committee (the “Committee”). At the Meeting, the Committee, on behalf of BlackRock, provided the Board with a report that addressed the operation of the Program and assessed its adequacy and effectiveness of implementation, including the management of each Fund’s Highly Liquid Investment Minimum (“HLIM”) where applicable, and any material changes to the Program (the “Report”). The Report covered the period from October 1, 2021 through September 30, 2022 (the “Program Reporting Period”).
The Report described the Program’s liquidity classification methodology for categorizing each Fund’s investments (including derivative transactions) into one of four liquidity buckets. It also referenced the methodology used by BlackRock to establish each Fund’s HLIM and noted that the Committee reviews and ratifies the HLIM assigned to each Fund no less frequently than annually. The Report also discussed notable events affecting liquidity over the Program Reporting Period, including extended market holidays, the imposition of capital controls in certain non-U.S. countries, Russian sanctions and the closure of the Russian securities market.
The Report noted that the Program complied with the key factors for consideration under the Liquidity Rule for assessing, managing and periodically reviewing each Fund’s liquidity risk, as follows:
| | a) | The Fund’s investment strategy and liquidity of portfolio investments during both normal and reasonably foreseeable stressed conditions. During the Program Reporting Period, the Committee reviewed whether each Fund’s strategy is appropriate for an open-end fund structure, with a focus on funds with more significant and consistent holdings of less liquid and illiquid assets. The Committee also factored a fund’s concentration in an issuer into the liquidity classification methodology by taking issuer position sizes into account. Derivative exposure was also considered in the calculation of a fund’s liquidity bucketing. Finally, a factor for consideration under the Liquidity Rule is a Fund’s use of borrowings for investment purposes. However, the Funds do not borrow for investment purposes. |
| | b) | Short-term and long-term cash flow projections during both normal and reasonably foreseeable stressed conditions. During the Program Reporting Period, the Committee reviewed historical redemption activity and used this information as a component to establish each ETF’s reasonably anticipated trading size (“RATS”). The Committee may also take into consideration a fund’s shareholder ownership concentration (which, depending on product type and distribution channel, may or may not be available), a fund’s distribution channels, and the degree of certainty associated with a fund’s short-term and long-term cash flow projections. |
| | c) | Holdings of cash and cash equivalents, as well as borrowing arrangements. The Committee considered that ETFs generally do not hold more than de minimis amounts of cash. The Committee also considered that ETFs generally do not engage in borrowing. |
| | d) | The relationship between an ETF’s portfolio liquidity and the way in which, and the prices and spreads at which, ETF shares trade, including the efficiency of the arbitrage function and the level of active participation by market participants, including authorized participants. The Committee monitored the prevailing bid/ask spread and the ETF price premium (or discount) to NAV for all ETFs. However, there were no ETFs with persistent deviations of fund premium/discount or bid/ask spreads from long-term averages over the Program Reporting Period. |
| | e) | The effect of the composition of baskets on the overall liquidity of an ETF’s portfolio. In reviewing the linkage between the composition of custom baskets accepted by an ETF and any significant change in the liquidity profile of such ETF, the Committee reviewed changes in the proportion of each ETF’s portfolio comprised of less liquid and illiquid holdings to determine if applicable thresholds were met requiring enhanced review. |
There were no material changes to the Program during the Program Reporting Period other than the enhancement of certain model components in the Program’s classification methodology. The Report provided to the Board stated that the Committee concluded that based on the operation of the functions, as described in the Report, the Program is operating as intended and is effective in implementing the requirements of the Liquidity Rule.
| | |
| 30 | | 2 0 2 3 I SHARES ANNUAL REPORT TO SHAREHOLDERS |
Supplemental Information (unaudited)
Section 19(a) Notices
The amounts and sources of distributions reported are estimates and are being provided pursuant to regulatory requirements and are not being provided for tax reporting purposes. The actual amounts and sources for tax reporting purposes will depend upon each Fund’s investment experience during the year and may be subject to changes based on tax regulations. Shareholders will receive a Form 1099-DIV each calendar year that will inform them how to report these distributions for federal income tax purposes.
March 31, 2023
| | | | | | | | | | | | | | | | | | | | | | | | | | | | | | | | |
| | | Total Cumulative Distributions
for the Fiscal Year-to-Date | | | % Breakdown of the Total Cumulative
Distributions for the Fiscal Year-to-Date | |
| iShares ETF | | Net Investment Income | | | Net Realized Capital Gains | | | Return of Capital | | | Total Per Share | | | Net Investment Income | | | Net Realized Capital Gains | | | Return of Capital | | | Total Per Share | |
Factors US Growth Style(a) | | $ | 0.498387 | | | $ | — | | | $ | 0.030110 | | | $ | 0.528497 | | | | 94 | % | | | — | % | | | 6 | % | | | 100 | % |
| (a) | The Fund estimates that it has distributed more than its net investment income and net realized capital gains; therefore, a portion of the distribution may be a return of capital. A return of capital may occur, for example, when some or all of the shareholder’s investment in the Fund is returned to the shareholder. A return of capital does not necessarily reflect the Fund’s investment performance and should not be confused with “yield” or “income”. When distributions exceed total return performance, the difference will incrementally reduce the Fund’s net asset value per share. |
Premium/Discount Information
Information on the Fund’s net asset value, market price, premiums and discounts, and bid-ask spreads can be found at iShares.com.
| | | | |
SUPPLEMENTAL INFORMATION | | | 31 | |
Trustee and Officer Information
The Board of Trustees has responsibility for the overall management and operations of the Funds, including general supervision of the duties performed by BFA and other service providers. Each Trustee serves until he or she resigns, is removed, dies, retires or becomes incapacitated. Each officer shall hold office until his or her successor is elected and qualifies or until his or her death, resignation or removal. Trustees who are not “interested persons” (as defined in the 1940 Act) of the Trust are referred to as independent trustees (“Independent Trustees”).
The registered investment companies advised by BFA or its affiliates (the “BlackRock-advised Funds”) are organized into one complex of open-end equity, multi-asset, index and money market funds and ETFs (the “BlackRock Multi-Asset Complex”), one complex of closed-end funds and open-end non-index fixed-income funds (including ETFs) (the “BlackRock Fixed-Income Complex”) and one complex of ETFs (“Exchange-Traded Fund Complex”) (each, a “BlackRock Fund Complex”). Each Fund is included in the Exchange-Traded Fund Complex. Each Trustee also serves as a Director of iShares, Inc. and a Trustee of iShares U.S. ETF Trust and, as a result, oversees all of the funds within the Exchange-Traded Fund Complex, which consists of 380 funds as of March 31, 2023. With the exception of Robert S. Kapito, Salim Ramji and Charles Park, the address of each Trustee and officer is c/o BlackRock, Inc., 400 Howard Street, San Francisco, CA 94105. The address of Mr. Kapito, Mr. Ramji and Mr. Park is c/o BlackRock, Inc., 50 Hudson Yards, New York, NY 10001. The Board has designated John E. Kerrigan as its Independent Board Chair. Additional information about the Funds’ Trustees and officers may be found in the Funds’ combined Statement of Additional Information, which is available without charge, upon request, by calling toll-free 1-800-iShares (1-800-474-2737).
| | | | | | |
| Interested Trustees |
| | | | |
Name (Year of Birth) | | Position(s) | | Principal Occupation(s) During Past 5 Years | | Other Directorships Held by Trustee |
| | | |
Robert S. Kapito(a) (1957) | | Trustee (since 2009). | | President, BlackRock, Inc. (since 2006); Vice Chairman of BlackRock, Inc. and Head of BlackRock’s Portfolio Management Group (since its formation in 1998) and BlackRock, Inc.’s predecessor entities (since 1988); Trustee, University of Pennsylvania (since 2009); President of Board of Directors, Hope & Heroes Children’s Cancer Fund (since 2002). | | Director of BlackRock, Inc. (since 2006); Director of iShares, Inc. (since 2009); Trustee of iShares U.S. ETF Trust (since 2011). |
| | | |
Salim Ramji(b) (1970) | | Trustee (since 2019). | | Senior Managing Director, BlackRock, Inc. (since 2014); Global Head of BlackRock’s ETF and Index Investments Business (since 2019); Head of BlackRock’s U.S. Wealth Advisory Business (2015-2019); Global Head of Corporate Strategy, BlackRock, Inc. (2014-2015); Senior Partner, McKinsey & Company (2010-2014). | | Director of iShares, Inc. (since 2019); Trustee of iShares U.S. ETF Trust (since 2019). |
(a) Robert S. Kapito is deemed to be an “interested person” (as defined in the 1940 Act) of the Trust due to his affiliations with BlackRock, Inc. and its affiliates. (b) Salim Ramji is deemed to be an “interested person” (as defined in the 1940 Act) of the Trust due to his affiliations with BlackRock, Inc. and its affiliates. |
| | | | | | |
| Independent Trustees |
| | | | |
Name (Year of Birth) | | Position(s) | | Principal Occupation(s) During Past 5 Years | | Other Directorships Held by Trustee |
| | | |
John E. Kerrigan (1955) | | Trustee (since 2005); Independent Board Chair (since 2022). | | Chief Investment Officer, Santa Clara University (since 2002). | | Director of iShares, Inc. (since 2005); Trustee of iShares U.S. ETF Trust (since 2011); Independent Board Chair of iShares, Inc. and iShares U.S. ETF Trust (since 2022). |
| | | |
Jane D. Carlin (1956) | | Trustee (since 2015); Risk Committee Chair (since 2016). | | Consultant (since 2012); Member of the Audit Committee (2012-2018), Chair of the Nominating and Governance Committee (2017-2018) and Director of PHH Corporation (mortgage solutions) (2012-2018); Managing Director and Global Head of Financial Holding Company Governance & Assurance and the Global Head of Operational Risk Management of Morgan Stanley (2006-2012). | | Director of iShares, Inc. (since 2015); Trustee of iShares U.S. ETF Trust (since 2015); Member of the Audit Committee (since 2016), Chair of the Audit Committee (since 2020) and Director of The Hanover Insurance Group, Inc. (since 2016). |
| | | |
Richard L. Fagnani (1954) | | Trustee (since 2017); Audit Committee Chair (since 2019). | | Partner, KPMG LLP (2002-2016); Director of One Generation Away (since 2021). | | Director of iShares, Inc. (since 2017); Trustee of iShares U.S. ETF Trust (since 2017). |
| | |
| 32 | | 2 0 2 3 I SHARES ANNUAL REPORT TO SHAREHOLDERS |
Trustee and Officer Information (continued)
| | | | | | |
| Independent Trustees |
| | | | |
Name (Year of Birth) | | Position(s) | | Principal Occupation(s) During Past 5 Years | | Other Directorships Held by Trustee |
| | | |
Cecilia H. Herbert (1949) | | Trustee (since 2005); Nominating and Governance and Equity Plus Committee Chairs (since 2022). | | Chair of the Finance Committee (since 2019) and Trustee and Member of the Finance, Audit and Quality Committees of Stanford Health Care (since 2016); Trustee of WNET, New York’s public media company (since 2011) and Member of the Audit Committee (since 2018), Investment Committee (since 2011) and Personnel Committee (since 2022); Chair (1994-2005) and Member (1992-2021) of the Investment Committee, Archdiocese of San Francisco; Trustee of Forward Funds (14 portfolios) (2009-2018); Trustee of Salient MF Trust (4 portfolios) (2015- 2018); Director (1998-2013) and President (2007-2011) of the Board of Directors, Catholic Charities CYO; Trustee (2002-2011) and Chair of the Finance and Investment Committee (2006-2010) of the Thacher School; Director of the Senior Center of Jackson Hole (since 2020); Director of the Jackson Hole Center for the Arts (since 2021); Member of the Wyoming State Investment Funds Committee (since 2022). | | Director of iShares, Inc. (since 2005); Trustee of iShares U.S. ETF Trust (since 2011). |
| | | |
Drew E. Lawton (1959) | | Trustee (since 2017); 15(c) Committee Chair (since 2017). | | Senior Managing Director of New York Life Insurance Company (2010-2015). | | Director of iShares, Inc. (since 2017); Trustee of iShares U.S. ETF Trust (since 2017); Director of Jackson Financial Inc. (since 2021). |
| | | |
John E. Martinez (1961) | | Trustee (since 2003); Securities Lending Committee Chair (since 2019). | | Director of Real Estate Equity Exchange, Inc. (since 2005); Director of Cloudera Foundation (2017-2020); and Director of Reading Partners (2012-2016). | | Director of iShares, Inc. (since 2003); Trustee of iShares U.S. ETF Trust (since 2011). |
| | | |
Madhav V. Rajan (1964) | | Trustee (since 2011); Fixed Income Plus Committee Chair (since 2019). | | Dean, and George Pratt Shultz Professor of Accounting, University of Chicago Booth School of Business (since 2017); Advisory Board Member (since 2016) and Director (since 2020) of C.M. Capital Corporation; Chair of the Board for the Center for Research in Security Prices, LLC (since 2020); Robert K. Jaedicke Professor of Accounting, Stanford University Graduate School of Business (2001-2017); Professor of Law (by courtesy), Stanford Law School (2005-2017); Senior Associate Dean for Academic Affairs and Head of MBA Program, Stanford University Graduate School of Business (2010-2016). | | Director of iShares, Inc. (since 2011); Trustee of iShares U.S. ETF Trust (since 2011). |
| | |
TRUSTEE AND OFFICER INFORMATION | | 33 |
Trustee and Officer Information (continued)
| | | | |
| Officers |
| | | |
Name (Year of Birth) | | Position(s) | | Principal Occupation(s) During Past 5 Years |
| | |
Dominik Rohé (1973) | | President (since 2023). | | Managing Director, BlackRock, Inc. (since 2005); Head of Americas ETF and Index Investments (since 2023); Head of Latin America (2019- 2023). |
| | |
Trent Walker (1974) | | Treasurer and Chief Financial Officer (since 2020). | | Managing Director, BlackRock, Inc. (since September 2019); Chief Financial Officer of iShares Delaware Trust Sponsor LLC, BlackRock Funds, BlackRock Funds II, BlackRock Funds IV, BlackRock Funds V and BlackRock Funds VI (since 2021); Executive Vice President of PIMCO (2016-2019); Senior Vice President of PIMCO (2008-2015); Treasurer (2013-2019) and Assistant Treasurer (2007-2017) of PIMCO Funds, PIMCO Variable Insurance Trust, PIMCO ETF Trust, PIMCO Equity Series, PIMCO Equity Series VIT, PIMCO Managed Accounts Trust, 2 PIMCO-sponsored interval funds and 21 PIMCO-sponsored closed-end funds. |
| | |
Charles Park (1967) | | Chief Compliance Officer (since 2006). | | Chief Compliance Officer of BlackRock Advisors, LLC and the BlackRock-advised Funds in the BlackRock Multi-Asset Complex and the BlackRock Fixed-Income Complex (since 2014); Chief Compliance Officer of BFA (since 2006). |
| | |
Marisa Rolland (1980) | | Secretary (since 2022). | | Managing Director, BlackRock, Inc. (since 2023); Director, BlackRock, Inc. (2018-2022); Vice President, BlackRock, Inc. (2010-2017). |
| | |
Rachel Aguirre (1982) | | Executive Vice President (since 2022). | | Managing Director, BlackRock, Inc. (since 2018); Director, BlackRock, Inc. (2009-2018); Head of U.S. iShares Product (since 2022); Head of EII U.S. Product Engineering (since 2021); Co-Head of EII’s Americas Portfolio Engineering (2020-2021); Head of Developed Markets Portfolio Engineering (2016-2019). |
| | |
Jennifer Hsui (1976) | | Executive Vice President (since 2022). | | Managing Director, BlackRock, Inc. (since 2009); Co-Head of Index Equity (since 2022). |
| | |
James Mauro (1970) | | Executive Vice President (since 2022). | | Managing Director, BlackRock, Inc. (since 2010); Head of Fixed Income Index Investments in the Americas and Head of San Francisco Core Portfolio Management (since 2020). |
Effective June 15, 2022, Marisa Rolland replaced Deepa Damre Smith as Secretary.
Effective March 30, 2023, Dominik Rohé replaced Armando Senra as President.
| | |
| 34 | | 2 0 2 3 I SHARES ANNUAL REPORT TO SHAREHOLDERS |
General Information
Electronic Delivery
Shareholders can sign up for e-mail notifications announcing that the shareholder report or prospectus has been posted on the iShares website at iShares.com. Once you have enrolled, you will no longer receive prospectuses and shareholder reports in the mail.
To enroll in electronic delivery:
| | • | | If your brokerage firm is not listed, electronic delivery may not be available. Please contact your broker-dealer or financial advisor. |
Householding
Householding is an option available to certain fund investors. Householding is a method of delivery, based on the preference of the individual investor, in which a single copy of certain shareholder documents and Rule 30e-3 notices can be delivered to investors who share the same address, even if their accounts are registered under different names. Please contact your broker-dealer if you are interested in enrolling in householding and receiving a single copy of prospectuses and other shareholder documents, or if you are currently enrolled in householding and wish to change your householding status.
Availability of Quarterly Schedule of Investments
The Funds file their complete schedule of portfolio holdings with the SEC for the first and third quarters of each fiscal year as an exhibit to their reports on Form N-PORT. The Funds’ Forms N-PORT are available on the SEC’s website at sec.gov. Additionally, each Fund makes its portfolio holdings for the first and third quarters of each fiscal year available at iShares.com/fundreports.
Availability of Proxy Voting Policies and Proxy Voting Records
A description of the policies and procedures that the iShares Funds use to determine how to vote proxies relating to portfolio securities and information about how the iShares Funds voted proxies relating to portfolio securities during the most recent twelve-month period ending June 30 is available without charge, upon request (1) by calling toll-free 1-800-474-2737; (2) on the iShares website at iShares.com; and (3) on the SEC website at sec.gov.
A description of the Trust’s policies and procedures with respect to the disclosure of the Fund’s portfolio securities is available in the Fund Prospectus. The Fund discloses its portfolio holdings daily and provides information regarding its top holdings in Fund fact sheets at iShares.com.
Glossary of Terms Used in this Report
| | |
| Portfolio Abbreviation |
| |
| NVS | | Non-Voting Shares |
| |
| REIT | | Real Estate Investment Trust |
| | |
| 36 | | 2 0 2 3 I SHARES ANNUAL REPORT TO SHAREHOLDERS |
THIS PAGE INTENTIONALLY LEFT BLANK.
THIS PAGE INTENTIONALLY LEFT BLANK.
THIS PAGE INTENTIONALLY LEFT BLANK.
Want to know more?
iShares.com | 1-800-474-2737
This report is intended for the Funds’ shareholders. It may not be distributed to prospective investors unless it is preceded or accompanied by the current prospectus.
Investing involves risk, including possible loss of principal.
The iShares Funds are distributed by BlackRock Investments, LLC (together with its affiliates, “BlackRock”).
The iShares Funds are not sponsored, endorsed, issued, sold or promoted by FTSE Russell, nor does this company make any representation regarding the advisability of investing in the iShares Funds. BlackRock is not affiliated with teh company listed above.
©2022 BlackRock, Inc. All rights reserved. iSHARES and BLACKROCK are registered trademarks of BlackRock, Inc. or its subsidiaries. All other marks are the property of their respective owners.
iS-AR-314-0323
| | |

| | MARCH 31, 2023 |
iShares Trust
| · | | iShares ESG Screened S&P 500 ETF | XVV | Cboe BZX |
| · | | iShares ESG Screened S&P Mid-Cap ETF | XJH | Cboe BZX |
| · | | iShares ESG Screened S&P Small-Cap ETF | XJR | Cboe BZX |
The Markets in Review
Dear Shareholder,
Significant economic headwinds emerged during the 12-month reporting period ended March 31, 2023, as investors navigated changing economic conditions and volatile markets. The U.S. economy shrank in the first half of 2022 before returning to modest growth in the second half of the year, marking a shift to a more challenging post-reopening economic environment. Changes in consumer spending patterns and a tight labor market led to elevated inflation, which reached a 40-year high before beginning to moderate.
Equity prices fell as interest rates rose, particularly during the first half of the reporting period. Both large- and small-capitalization U.S. stocks declined, although equities began to recover in the second half of the period as inflation eased and economic growth resumed. Emerging market stocks and international equities from developed markets declined overall, pressured by rising interest rates and volatile commodities prices.
The 10-year U.S. Treasury yield rose during the reporting period, driving its price down, as investors reacted to fluctuating inflation data and attempted to anticipate its impact on future interest rate changes. The corporate bond market also faced inflationary headwinds, and higher interest rates led to rising borrowing costs for corporate issuers.
The U.S. Federal Reserve (the “Fed”), acknowledging that inflation has been more persistent than expected, raised interest rates eight times. Furthermore, the Fed wound down its bond-buying programs and accelerated the reduction of its balance sheet.
Restricted labor supply kept inflation elevated even as other inflation drivers, such as goods prices and energy costs, moderated. While economic growth slowed in the last year, we believe that taming inflation requires a more substantial decline that lowers demand to a level more in line with the economy’s productive capacity. Although the Fed has decelerated the pace of interest rate hikes, we believe that it still seems determined to get inflation back to target. With this in mind, we believe the possibility of a U.S. recession in the near-term is high, but the dimming economic outlook has not yet been fully reflected in current market prices. We believe investors should expect a period of higher volatility as markets adjust to the new economic reality and policymakers attempt to adapt to rapidly changing conditions. Turmoil in the banking sector late in the period highlighted the potential for the knock-on effects of substantially higher interest rates to disrupt markets with little warning.
While we favor an overweight to equities in the long term, we prefer an underweight stance on equities overall in the near term. Expectations for corporate earnings remain elevated, which seems inconsistent with the possibility of a recession. Nevertheless, we are overweight on emerging market stocks as we believe a weakening U.S. dollar provides a supportive backdrop. We also see long-term opportunities in credit, where we believe that valuations are appealing and higher yields provide attractive income, although we are neutral on credit in the near term, as we’re concerned about tightening credit and financial conditions. However, we believe there are still some strong opportunities for a six- to twelve-month horizon, particularly short-term U.S. Treasuries, global inflation-linked bonds, and emerging market bonds denominated in local currency.
Overall, our view is that investors need to think globally, position themselves to be prepared for a decarbonizing economy, and be nimble as market conditions change. We encourage you to talk with your financial advisor and visit iShares.com for further insight about investing in today’s markets.
Sincerely,

Rob Kapito
President, BlackRock, Inc.

Rob Kapito
President, BlackRock, Inc.
| | | | | | | | |
Total Returns as of March 31, 2023 | |
| | | |
| | | 6-Month | | 12-Month |
| | |
U.S. large cap equities
(S&P 500® Index) | | | 15.62 | % | | | (7.73 | )% |
| | |
U.S. small cap equities
(Russell 2000® Index) | | | 9.14 | | | | (11.61 | ) |
| | |
International equities
(MSCI Europe, Australasia,
Far East Index) | | | 27.27 | | | | (1.38 | ) |
| | |
Emerging market equities
(MSCI Emerging Markets Index) | | | 14.04 | | | | (10.70 | ) |
| | |
3-month Treasury bills
(ICE BofA 3-Month U.S. Treasury Bill Index) | | | 1.93 | | | | 2.52 | |
| | |
U.S. Treasury securities
(ICE BofA 10-Year U.S. Treasury Index) | | | 4.38 | | | | (6.90 | ) |
| | |
U.S. investment grade bonds (Bloomberg U.S. Aggregate Bond Index) | | | 4.89 | | | | (4.78 | ) |
| | |
Tax-exempt municipal bonds
(Bloomberg Municipal Bond Index) | | | 7.00 | | | | 0.26 | |
| | |
U.S. high yield bonds
(Bloomberg U.S. Corporate High Yield 2% Issuer Capped Index) | | | 7.88 | | | | (3.35 | ) |
|
Past performance is not an indication of future results. Index performance is shown for illustrative purposes only. You cannot invest directly in an index. | |
| | |
| 2 | | THIS PAGE IS NOT PART OF YOUR FUND REPORT |
Table of Contents
Market Overview
iShares Trust
Domestic Market Overview
U.S. stocks declined for the 12 months ended March 31, 2023 (“reporting period”), when the Russell 3000® Index, a broad measure of U.S. equity market performance, returned -8.58%. Elevated inflation and rapid tightening of monetary policy dampened growth and weighed on equities. Higher interest rates drove bond yields higher and increased borrowing costs for businesses and consumers. Equities began to recover in the second half of the reporting period, as the broader economy remained resilient and the pace of inflation declined. In March 2023, two banks suddenly failed, representing the second and third largest bank failures in U.S. history by asset value. This drove concern among investors about the resiliency of the financial system in the face of rapidly rising interest rates. However, government agencies acted swiftly to organize a sale of the failed banks’ assets and inject liquidity, and equity prices recovered.
Inflation was a significant driver of the economic outlook. As the reporting period began, the consumer price index, a widely followed measure of inflation, stood at multi-decade highs. Strong consumer spending and a tight labor market, along with continued supply chain disruptions in Asia, combined to drive prices higher. But the rate of inflation began to decline as the reporting period wore on, decelerating for nine consecutive months beginning in July 2022. Nonetheless, inflation remained elevated by historic standards, and higher prices negatively impacted both consumers and businesses.
The U.S. economy recovered from a decline in the first half of 2022 to post modest growth in the third and fourth quarters of 2022. Consumers continued to power the economy with growing spending, despite higher prices for many consumer goods and services. The strong labor market supported spending, as unemployment remained very low, at one point dropping to the lowest recorded level since 1969. Furthermore, the labor force participation rate—which measures the total proportion of employed persons of working age—rose, indicating that more people were being drawn into the labor force. Amid tightening labor supply, wages rose significantly, with the largest gains at the lower end of the wage spectrum.
To contain inflation, the U.S. Federal Reserve (“Fed”) tightened monetary policy rapidly, raising short-term interest rates eight times over the course of the reporting period. The pace of tightening accelerated as the Fed twice stepped up the increment of increase before reducing it again as inflation began to subside. The Fed also started to reduce the size of its balance sheet by reducing the store of U.S. Treasuries it had accumulated to stabilize markets in the early phases of the coronavirus pandemic. While the Fed indicated that more tightening could be needed to achieve its long-term inflation goal, it sounded a more cautious note about the potential for further interest rate increases near the end of the reporting period.
Despite economic headwinds, corporate profits remained robust, and many companies were able to sufficiently raise prices to preserve profit margins even in the face of rising labor and input costs. Nonetheless, profits declined overall in the fourth quarter of 2022, and the yield curve (a graphical representation of U.S. Treasury rates at different maturities) inverted, a sign that markets were concerned about the impact of higher borrowing costs on the economy. Furthermore, dwindling personal savings and rising household debt raised questions about the sustainability of consumer spending as an engine of economic growth.
| | |
| 4 | | 2 0 2 3 I SHARES ANNUAL REPORT TO SHAREHOLDERS |
| | |
| Fund Summary as of March 31, 2023 | | iShares® ESG Screened S&P 500 ETF |
Investment Objective
The iShares ESG Screened S&P 500 ETF (the “Fund”) seeks to track the investment results of an index composed of large-capitalization U.S. equities while applying screens for company involvement in controversies and controversial business activities, as represented by the S&P 500 Substainability Screened Index (the “Index”). The Fund invests in a representative sample of securities included in the Index that collectively has an investment profile similar to the Index. Due to the use of representative sampling, the Fund may or may not hold all of the securities that are included in the Index.
Performance
| | | | | | | | | | | | | | | | | | | | |
| | | Average Annual Total Returns | | | | | | Cumulative Total Returns | |
| | | | | | | | | | | | |
| | | 1 Year | | | Since
Inception | | | | | | 1 Year | | | Since
Inception | |
| | | | | |
Fund NAV | | | (8.72 | )% | | | 9.58 | % | | | | | | | (8.72 | )% | | | 25.97 | % |
| | | | | |
Fund Market | | | (8.79 | ) | | | 9.57 | | | | | | | | (8.79 | ) | | | 25.95 | |
| | | | | |
Index | | | (8.66 | ) | | | 9.68 | | | | | | | | (8.66 | ) | | | 26.24 | |
GROWTH OF $10,000 INVESTMENT
(SINCE INCEPTION AT NET ASSET VALUE)
The inception date of the Fund was 9/22/20. The first day of secondary market trading was 9/24/20.
Past performance is not an indication of future results. Performance results do not reflect the deduction of taxes that a shareholder would pay on fund distributions or the redemption of sale of fund shares. See “About Fund Performance” for more information.
Expense Example
| | | | | | | | | | | | | | | | | | | | | | | | | | | | | | |
| Actual | | | Hypothetical 5% Return | |
| | | | | | | | | | | | | | |
| | | | | | | |
| Beginning
Account Value
(10/01/22) |
| |
| Ending
Account Value
(03/31/23) |
| |
| Expenses
Paid During
the Period |
(a) | | | | | |
| Beginning
Account Value
(10/01/22) |
| |
| Ending
Account Value
(03/31/23) |
| |
| Expenses
Paid During
the Period |
(a) | |
| Annualized
Expense
Ratio |
|
| | $ 1,000.00 | | | | $ 1,161.30 | | | | $ 0.43 | | | | | | | | $ 1,000.00 | | | | $ 1,024.53 | | | | $ 0.40 | | | | 0.08 | % |
| (a) | Expenses are equal to the annualized expense ratio, multiplied by the average account value over the period, multiplied by 182/365 (to reflect the one-half year period shown). Other fees, such as brokerage commissions and other fees to financial intermediaries, may be paid which are not reflected in the tables and examples above. See “Disclosure of Expenses” for more information. | |
| | |
| Fund Summary as of March 31, 2023 (continued) | | iShares® ESG Screened S&P 500 ETF |
Portfolio Management Commentary
Globally, bonds and equities that factor in companies’ ESG characteristics continued to attract investment flows, although the pace of investment slowed significantly in 2022. In the U.S., the country passed its largest ever climate appropriation, designed to encourage clean energy adoption with spending and tax credits.
In this environment the Parent Index, the S&P 500, posted a decline for the reporting period. The consumer discretionary sector detracted the most from the Index’s return, led by the internet and direct marketing retail industry. The sharp rise in e-commerce that boosted the industry early in the pandemic waned as more workers returned to the office and brick-and-mortar retailers gained market share. The automobiles industry also declined, amid concerns about the market for electric vehicles in the weakening economy.
The communication services sector also detracted from the Index’s performance, as the rising interest rate environment negatively impacted the interactive media and services industry. Demand for online advertisements slowed as businesses cut back on marketing expenditures.
The information technology sector, especially the software and services and technology hardware and equipment industries, also detracted. A sharp rise in interest rates reduced the current value of future earnings, as well as investors’ growth expectations. The financials sector also detracted from Index’s performance.
In terms of relative performance, the Index underperformed the broader market, as represented by the S&P 500 Index, while tracking it relatively closely. Relative to the broader market, the screening process leads to modest overweights and underweights that can affect returns. An overweight in the declining consumer discretionary sector and an underweight in the rising energy sector were the primary detractors. Overall, security selection contributed to relative performance, while sector allocation detracted from relative performance.
Portfolio Information
SECTOR ALLOCATION
| | | | |
| | |
Sector | |
| Percent of
Total Investments |
(a) |
| |
Information Technology | | | 29.0 | % |
Health Care | | | 14.4 | |
Financials | | | 13.9 | |
Consumer Discretionary | | | 11.3 | |
Communication Services | | | 9.1 | |
Industrials | | | 7.1 | |
Consumer Staples | | | 6.6 | |
Real Estate | | | 2.9 | |
Materials | | | 2.8 | |
Utilities | | | 1.6 | |
Energy | | | 1.3 | |
| (a) | Excludes money market funds. | |
TEN LARGEST HOLDINGS
| | | | |
| | |
Security | |
| Percent of
Total Investments |
(a) |
Apple Inc. | | | 8.0 | % |
Microsoft Corp. | | | 7.0 | |
Amazon.com, Inc. | | | 3.0 | |
NVIDIA Corp. | | | 2.2 | |
Alphabet, Inc., Class A | | | 2.0 | |
Tesla, Inc. | | | 1.8 | |
Berkshire Hathaway, Inc., Class B | | | 1.8 | |
Alphabet, Inc., Class C, NVS | | | 1.8 | |
Meta Platforms, Inc., Class A | | | 1.5 | |
UnitedHealth Group, Inc. | | | 1.4 | |
| | |
| 6 | | 2 0 2 3 I SHARES ANNUAL REPORT TO SHAREHOLDERS |
| | |
| Fund Summary as of March 31, 2023 | | iShares® ESG Screened S&P Mid-Cap ETF |
Investment Objective
The iShares ESG Screened S&P Mid-Cap ETF (the “Fund”) seeks to track the investment results of an index composed of mid-capitalization U.S. equities while applying screens for company involvement in controversies and controversial business activities, as represented by the S&P MidCap 400 Sustainability Screened Index (the “Index”). The Fund invests in a representative sample of securities included in the Index that collectively has an investment profile similar to the Index. Due to representative sampling, the Fund may or may not hold all of the securities that are included in the Index.
Performance
| | | | | | | | | | | | | | | | | | | | |
| | | Average Annual Total Returns | | | | | | Cumulative Total Returns | |
| | | | | | | | | | | | |
| | | 1 Year | | | Since
Inception | | | | | | 1 Year | | | Since
Inception | |
| | | | | |
Fund NAV | | | (5.35 | )% | | | 14.11 | % | | | | | | | (5.35 | )% | | | 39.54 | % |
| | | | | |
Fund Market | | | (5.58 | ) | | | 14.08 | | | | | | | | (5.58 | ) | | | 39.43 | |
| | | | | |
Index | | | (5.29 | ) | | | 14.28 | | | | | | | | (5.29 | ) | | | 40.04 | |
GROWTH OF $10,000 INVESTMENT
(SINCE INCEPTION AT NET ASSET VALUE)
The inception date of the Fund was 9/22/20. The first day of secondary market trading was 9/24/20.
Past performance is not an indication of future results. Performance results do not reflect the deduction of taxes that a shareholder would pay on fund distributions or the redemption of sale of fund shares. See “About Fund Performance” for more information.
Expense Example
| | | | | | | | | | | | | | | | | | | | | | | | | | | | | | |
| Actual | | | Hypothetical 5% Return | |
| | | | | | | | | | | | | | |
| | | | | | | |
| Beginning
Account Value
(10/01/22) |
| |
| Ending
Account Value
(03/31/23) |
| |
| Expenses
Paid During
the Period |
(a) | | | | | |
| Beginning
Account Value
(10/01/22) |
| |
| Ending
Account Value
(03/31/23) |
| |
| Expenses
Paid During
the Period |
(a) | |
| Annualized
Expense
Ratio |
|
| | $ 1,000.00 | | | | $ 1,153.70 | | | | $ 0.64 | | | | | | | | $ 1,000.00 | | | | $ 1,024.33 | | | | $ 0.61 | | | | 0.12 | % |
| (a) | Expenses are equal to the annualized expense ratio, multiplied by the average account value over the period, multiplied by 182/365 (to reflect the one-half year period shown). Other fees, such as brokerage commissions and other fees to financial intermediaries, may be paid which are not reflected in the tables and examples above. See “Disclosure of Expenses” for more information. | |
| | |
| Fund Summary as of March 31, 2023 (continued) | | iShares® ESG Screened S&P Mid-Cap ETF |
Portfolio Management Commentary
Equities that consider companies’ environmental, social, and governance (“ESG”) characteristics continued to attract investment flows, although the pace of investment slowed significantly in 2022. In the U.S., the country passed its largest ever climate appropriation bill, designed to encourage clean energy adoption with spending and tax credits.
The Parent Index, the S&P 400, declined for the reporting period, as high inflation and tighter financial conditions impeded economic growth and weighed on equities. The real estate sector detracted the most from the Index’s return, amid higher interest rates and changing usage patterns. Office real estate investment trusts (“REITs”) declined amid an ongoing oversupply of office space due to the shift toward remote work. In addition, analysts’ concerns about the solvency of several large tenants of medical facilities had a negative impact on the healthcare REIT industry.
The financials sector also detracted significantly from the Index’s performance amid tightening financial conditions. The banking industry faced significant challenges that outweighed the benefits of being able to charge more for loans, including the slowing economy and the sudden failure of two regional banks.
The healthcare sector also detracted from the Index’s return. Healthcare equipment manufacturers faced challenges in meeting demand, while healthcare providers endured labor market tightness and higher financing costs.
On the upside, the industrials sector contributed to the Index’s return, as the capital goods industry benefited from government incentives that encouraged investments in additional industrial capacity. The machinery industry benefited from increased efficiency and supply chain improvements, while investments in prefabrication capabilities boosted construction and engineering companies.
In terms of relative performance, the ETF slightly underperformed the broader market, as represented by the S&P 400 Index, while tracking it relatively closely. Relative to the broader market, the screening process leads to modest overweights and underweights that can affect returns. For the reporting period, security selection in the healthcare sector was the primary detractor, while a large underweight in the energy sector contributed to relative performance.
Portfolio Information
SECTOR ALLOCATION
| | | | |
| | |
Sector | |
| Percent of
Total Investments |
(a) |
| |
Industrials | | | 22.7 | % |
Financials | | | 15.2 | |
Consumer Discretionary | | | 15.0 | |
Information Technology | | | 11.5 | |
Health Care | | | 10.4 | |
Real Estate | | | 8.5 | |
Materials | | | 7.0 | |
Consumer Staples | | | 3.5 | |
Communication Services | | | 2.3 | |
Utilities | | | 2.3 | |
Energy | | | 1.6 | |
| (a) | Excludes money market funds. | |
TEN LARGEST HOLDINGS
| | | | |
| | |
Security | |
| Percent of
Total Investments |
(a) |
| |
Axon Enterprise, Inc. | | | 0.8 | % |
Reliance Steel & Aluminum Co. | | | 0.8 | |
Lattice Semiconductor Corp. | | | 0.7 | |
Builders FirstSource, Inc. | | | 0.7 | |
Hubbell, Inc. | | | 0.7 | |
Graco, Inc. | | | 0.6 | |
Deckers Outdoor Corp. | | | 0.6 | |
Jabil, Inc. | | | 0.6 | |
AECOM | | | 0.6 | |
Carlisle Cos., Inc. | | | 0.6 | |
| | |
| 8 | | 2 0 2 3 I SHARES ANNUAL REPORT TO SHAREHOLDERS |
| | |
| Fund Summary as of March 31, 2023 | | iShares® ESG Screened S&P Small-Cap ETF |
Investment Objective
The iShares ESG Screened S&PSmall-Cap ETF(the “Fund”) seeks to track the investment results if an index composed of small-capitalization U.S. equities while applying screens for company involvement in controversies and controversial business activities, as represented by the S&P SmallCap 600 Sustainability Screened Index (the “Index”). The Fund invests in a representative sample of securities included in the Index that collectively has an investment profile similar to the Index. Due to the use of representative sampling, the Fund may or may not hold all of the securities that are included in the Index.
Performance
| | | | | | | | | | | | | | | | | | | | |
| | | Average Annual Total Returns | | | | | | Cumulative Total Returns | |
| | | | | | | | | | | | |
| | | 1 Year | | | Since
Inception | | | | | | 1 Year | | | Since
Inception | |
| | | | | |
Fund NAV | | | (9.08 | )% | | | 14.44 | % | | | | | | | (9.08 | )% | | | 40.55 | % |
| | | | | |
Fund Market | | | (9.12 | ) | | | 14.42 | | | | | | | | (9.12 | ) | | | 40.49 | |
| | | | | |
Index | | | (9.04 | ) | | | 14.87 | | | | | | | | (9.04 | ) | | | 41.84 | |
GROWTH OF $10,000 INVESTMENT
(SINCE INCEPTION AT NET ASSET VALUE)
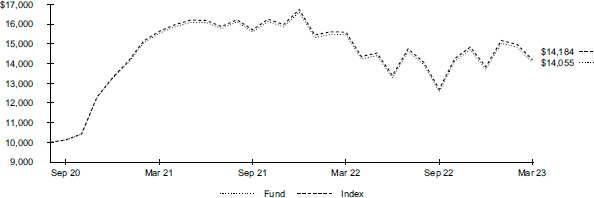
The inception date of the Fund was 9/22/20. The first day of secondary market trading was 9/24/20.
Past performance is not an indication of future results. Performance results do not reflect the deduction of taxes that a shareholder would pay on fund distributions or the redemption of sale of fund shares. See “About Fund Performance” for more information.
Expense Example
| | | | | | | | | | | | | | | | | | | | | | | | | | | | | | |
| Actual | | | Hypothetical 5% Return | |
| | | | | | | | | | | | | | |
| | | | | | | |
| Beginning
Account Value
(10/01/22) |
| |
| Ending
Account Value
(03/31/23) |
| |
| Expenses
Paid During
the Period |
(a) | | | | | |
| Beginning
Account Value
(10/01/22) |
| |
| Ending
Account Value
(03/31/23) |
| |
| Expenses
Paid During
the Period |
(a) | |
| Annualized
Expense
Ratio |
|
| | $ 1,000.00 | | |
| $ 1,117.40
|
| | | $ 0.63 | | | | | | | | $ 1,000.00 | | | | $ 1,024.33 | | | | $ 0.61 | | | | 0.12 | % |
| (a) | Expenses are equal to the annualized expense ratio, multiplied by the average account value over the period, multiplied by 182/365 (to reflect the one-half year period shown). Other fees, such as brokerage commissions and other fees to financial intermediaries, may be paid which are not reflected in the tables and examples above. See “Disclosure of Expenses” for more information. | |
| | |
| Fund Summary as of March 31, 2023 (continued) | | iShares® ESG Screened S&P Small-Cap ETF |
Portfolio Management Commentary
Equities that consider companies’ environmental, social, and governance (“ESG”) characteristics continued to attract investment flows, although the pace of investment slowed significantly in 2022.In the U.S., the country passed its largest ever climate appropriation bill, designed to encourage clean energy adoption with spending and tax credits.
The Parent Index, the S&P 600, declined for the reporting period, as high inflation and tighter financial conditions impeded economic growth and weighed on equities. The financials sector detracted the most from the Index’s performance amid tightening financial conditions. The banking industry faced significant challenges as the potential impact of a slowing economy outweighed the benefits of being able to charge more for loans. Although higher interest rates typically support bank profitability, sharp increases in interest rates during the reporting period due to persistently high inflation raised concerns among investors about the long-term effect on loan growth and credit losses. Healthcare also detracted from Index’s performance. The sudden failure of two regional banks late in the reporting period further pressured bank stocks, leading to government intervention to cover depositors and prevent a contagion effect.
The real estate sector also detracted from the Index’s return, as higher interest rates and changing usage patterns weighed on equity real estate investment trusts (“REITs”). REITs typically take on substantial debt in order to finance the purchase of the properties they manage. Higher interest rates make financing more expensive for REITs.
On the upside, the consumer staples and industrials sectors contributed modestly to the Index’s return despite the significant decline of the broader market. The beverages industry gained amid consumers’ increasing purchases of packaged products relative to fresh foods, while the capital goods industry benefited from government incentives that encouraged investments in additional industrial capacity.
In terms of relative performance, the Index modestly underperformed the broader market, as represented by the S&P 600 Index, while tracking it relatively closely. Relative to the broader market, the screening process leads to modest overweights and underweights that can affect returns. During the reporting period, security selection in the industrials and financials sectors were modest detractors while an underweight to energy contributed positively.
Portfolio Information
SECTOR ALLOCATION
| | | | |
| | |
Sector | |
| Percent of
Total Investments |
(a) |
| |
Industrials | | | 17.2 | % |
Financials | | | 15.6 | |
Information Technology | | | 15.0 | |
Consumer Discretionary | | | 14.6 | |
Health Care | | | 11.6 | |
Real Estate | | | 7.1 | |
Materials | | | 6.3 | |
Consumer Staples | | | 5.8 | |
Energy | | | 2.7 | |
Communication Services | | | 2.3 | |
Utilities | | | 1.8 | |
| (a) | Excludes money market funds. | |
TEN LARGEST HOLDINGS
| | | | |
| | |
Security | |
| Percent of
Total Investments |
(a) |
| |
Rambus, Inc. | | | 0.7 | % |
SPS Commerce, Inc. | | | 0.7 | |
Applied Industrial Technologies, Inc. | | | 0.7 | |
Ensign Group, Inc. | | | 0.7 | |
Comfort Systems U.S.A., Inc. | | | 0.7 | |
ATI, Inc. | | | 0.6 | |
Asbury Automotive Group, Inc. | | | 0.6 | |
Axcelis Technologies, Inc. | | | 0.5 | |
Onto Innovation, Inc. | | | 0.5 | |
Insight Enterprises, Inc. | | | 0.5 | |
| | |
| 10 | | 2 0 2 3 I SHARES ANNUAL REPORT TO SHAREHOLDERS |
About Fund Performance
Past performance is not an indication of future results. Financial markets have experienced extreme volatility and trading in many instruments has been disrupted. These circumstances may continue for an extended period of time and may continue to affect adversely the value and liquidity of each Fund’s investments. As a result, current performance may be lower or higher than the performance data quoted. Performance data current to the most recent month-end is available at iShares.com. Performance results assume reinvestment of all dividends and capital gain distributions and do not reflect the deduction of taxes that a shareholder would pay on fund distributions or on the redemption or sale of fund shares. The investment return and principal value of shares will vary with changes in market conditions. Shares may be worth more or less than their original cost when they are redeemed or sold in the market. Performance for certain funds may reflect a waiver of a portion of investment advisory fees. Without such a waiver, performance would have been lower.
Net asset value or “NAV” is the value of one share of a fund as calculated in accordance with the standard formula for valuing mutual fund shares. Beginning August 10, 2020, the price used to calculate market return (“Market Price”) is the closing price. Prior to August 10, 2020, Market Price was determined using the midpoint between the highest bid and the lowest ask on the primary stock exchange on which shares of a fund are listed for trading, as of the time that such fund’s NAV is calculated. Since shares of a fund may not trade in the secondary market until after the fund’s inception, for the period from inception to the first day of secondary market trading in shares of the fund, the NAV of the fund is used as a proxy for the Market Price to calculate market returns. Market and NAV returns assume that dividends and capital gain distributions have been reinvested at Market Price and NAV, respectively.
An index is a statistical composite that tracks a specified financial market or sector. Unlike a fund, an index does not actually hold a portfolio of securities and therefore does not incur the expenses incurred by a fund. These expenses negatively impact fund performance. Also, market returns do not include brokerage commissions that may be payable on secondary market transactions. If brokerage commissions were included, market returns would be lower.
Disclosure of Expenses
Shareholders of each Fund may incur the following charges: (1) transactional expenses, including brokerage commissions on purchases and sales of fund shares and (2) ongoing expenses, including management fees and other fund expenses. The expense examples shown (which are based on a hypothetical investment of $1,000 invested at the beginning of the period and held through the end of the period) are intended to assist shareholders both in calculating expenses based on an investment in each Fund and in comparing these expenses with similar costs of investing in other funds.
The expense examples provide information about actual account values and actual expenses. Annualized expense ratios reflect contractual and voluntary fee waivers, if any. In order to estimate the expenses a shareholder paid during the period covered by this report, shareholders can divide their account value by $1,000 and then multiply the result by the number under the heading entitled “Expenses Paid During the Period.”
The expense examples also provide information about hypothetical account values and hypothetical expenses based on a fund’s actual expense ratio and an assumed rate of return of 5% per year before expenses. In order to assist shareholders in comparing the ongoing expenses of investing in the Funds and other funds, compare the 5% hypothetical examples with the 5% hypothetical examples that appear in the shareholder reports of the other funds.
The expenses shown in the expense examples are intended to highlight shareholders’ ongoing costs only and do not reflect any transactional expenses, such as brokerage commissions and other fees paid on purchases and sales of fund shares. Therefore, the hypothetical examples are useful in comparing ongoing expenses only and will not help shareholders determine the relative total expenses of owning different funds. If these transactional expenses were included, shareholder expenses would have been higher.
| | |
ABOUT FUND PERFORMANCE / DISCLOSURE OF EXPENSES | | 11 |
| | |
Schedule of Investments March 31, 2023 | | iShares® ESG Screened S&P 500 ETF (Percentages shown are based on Net Assets) |
| | | | | | | | |
| Security | | Shares | | | Value | |
| | |
Common Stocks | | | | | | | | |
| | |
| Aerospace & Defense — 0.2% | | | | | | |
Howmet Aerospace, Inc. | | | 1,545 | | | $ | 65,461 | |
TransDigm Group, Inc. | | | 215 | | | | 158,466 | |
| | | | | | | | |
| | |
| | | | | | | 223,927 | |
| | |
| Air Freight & Logistics — 0.7% | | | | | | |
CH Robinson Worldwide, Inc. | | | 485 | | | | 48,195 | |
Expeditors International of Washington, Inc. | | | 663 | | | | 73,010 | |
FedEx Corp. | | | 978 | | | | 223,463 | |
United Parcel Service, Inc., Class B | | | 3,067 | | | | 594,967 | |
| | | | | | | | |
| | |
| | | | | | | 939,635 | |
| | |
| Automobile Components — 0.1% | | | | | | |
Aptiv PLC(a) | | | 1,141 | | | | 128,009 | |
BorgWarner, Inc. | | | 986 | | | | 48,422 | |
| | | | | | | | |
| | |
| | | | | | | 176,431 | |
| | |
| Automobiles — 2.1% | | | | | | |
Ford Motor Co. | | | 16,461 | | | | 207,409 | |
General Motors Co. | | | 5,883 | | | | 215,788 | |
Tesla, Inc.(a) | | | 11,308 | | | | 2,345,958 | |
| | | | | | | | |
| | |
| | | | | | | 2,769,155 | |
| | |
| Banks — 3.0% | | | | | | |
Bank of America Corp. | | | 29,351 | | | | 839,439 | |
Citigroup, Inc. | | | 8,141 | | | | 381,731 | |
Citizens Financial Group, Inc. | | | 2,072 | | | | 62,927 | |
Comerica, Inc. | | | 533 | | | | 23,143 | |
Fifth Third Bancorp | | | 2,892 | | | | 77,043 | |
First Republic Bank(b) | | | 775 | | | | 10,842 | |
Huntington Bancshares, Inc. | | | 6,088 | | | | 68,186 | |
JPMorgan Chase & Co. | | | 12,334 | | | | 1,607,243 | |
KeyCorp | | | 3,894 | | | | 48,753 | |
M&T Bank Corp. | | | 712 | | | | 85,134 | |
PNC Financial Services Group, Inc. | | | 1,687 | | | | 214,418 | |
Regions Financial Corp. | | | 3,920 | | | | 72,755 | |
Truist Financial Corp. | | | 5,585 | | | | 190,448 | |
U.S. Bancorp | | | 5,877 | | | | 211,866 | |
Zions Bancorp N.A. | | | 646 | | | | 19,335 | |
| | | | | | | | |
| | |
| | | | | | | 3,913,263 | |
| | |
| Beverages — 2.0% | | | | | | |
Brown-Forman Corp., Class B, NVS | | | 773 | | | | 49,681 | |
Coca-Cola Co. | | | 16,367 | | | | 1,015,245 | |
Constellation Brands, Inc., Class A | | | 681 | | | | 153,831 | |
Keurig Dr Pepper, Inc. | | | 3,557 | | | | 125,491 | |
Molson Coors Beverage Co., Class B | | | 795 | | | | 41,086 | |
Monster Beverage Corp.(a) | | | 3,196 | | | | 172,616 | |
PepsiCo, Inc. | | | 5,792 | | | | 1,055,881 | |
| | | | | | | | |
| | |
| | | | | | | 2,613,831 | |
| | |
| Biotechnology — 2.6% | | | | | | |
AbbVie, Inc. | | | 7,435 | | | | 1,184,916 | |
Amgen, Inc. | | | 2,244 | | | | 542,487 | |
Biogen, Inc.(a) | | | 603 | | | | 167,652 | |
Gilead Sciences, Inc. | | | 5,244 | | | | 435,095 | |
Incyte Corp.(a) | | | 784 | | | | 56,660 | |
Moderna, Inc.(a) | | | 1,392 | | | | 213,783 | |
Regeneron Pharmaceuticals, Inc.(a) | | | 454 | | | | 373,038 | |
Vertex Pharmaceuticals, Inc.(a) | | | 1,080 | | | | 340,276 | |
| | | | | | | | |
| | |
| | | | | | | 3,313,907 | |
| | |
| Broadline Retail — 3.1% | | | | | | |
Amazon.com, Inc.(a) | | | 37,488 | | | | 3,872,135 | |
| | | | | | | | |
| Security | | Shares | | | Value | |
| | |
| Broadline Retail (continued) | | | | | | |
eBay, Inc. | | | 2,281 | | | $ | 101,208 | |
Etsy, Inc.(a) | | | 532 | | | | 59,228 | |
| | | | | | | | |
| | |
| | | | | | | 4,032,571 | |
| | |
| Building Products — 0.5% | | | | | | |
A O Smith Corp. | | | 533 | | | | 36,857 | |
Allegion PLC | | | 373 | | | | 39,810 | |
Carrier Global Corp. | | | 3,506 | | | | 160,399 | |
Johnson Controls International PLC | | | 2,890 | | | | 174,036 | |
Masco Corp. | | | 937 | | | | 46,588 | |
Trane Technologies PLC | | | 963 | | | | 177,173 | |
| | | | | | | | |
| | |
| | | | | | | 634,863 | |
| | |
| Capital Markets — 3.1% | | | | | | |
Ameriprise Financial, Inc. | | | 446 | | | | 136,699 | |
Bank of New York Mellon Corp. | | | 3,102 | | | | 140,955 | |
BlackRock, Inc.(c) | | | 629 | | | | 420,876 | |
Cboe Global Markets, Inc. | | | 447 | | | | 60,005 | |
Charles Schwab Corp. | | | 6,423 | | | | 336,437 | |
CME Group, Inc., Class A | | | 1,513 | | | | 289,770 | |
FactSet Research Systems, Inc. | | | 161 | | | | 66,830 | |
Franklin Resources, Inc. | | | 1,200 | | | | 32,328 | |
Goldman Sachs Group, Inc. | | | 1,423 | | | | 465,478 | |
Intercontinental Exchange, Inc. | | | 2,344 | | | | 244,456 | |
Invesco Ltd. | | | 1,891 | | | | 31,012 | |
MarketAxess Holdings, Inc. | | | 158 | | | | 61,824 | |
Moody’s Corp. | | | 664 | | | | 203,197 | |
Morgan Stanley | | | 5,494 | | | | 482,373 | |
MSCI, Inc., Class A | | | 336 | | | | 188,056 | |
Nasdaq, Inc. | | | 1,418 | | | | 77,522 | |
Northern Trust Corp. | | | 882 | | | | 77,731 | |
Raymond James Financial, Inc. | | | 816 | | | | 76,108 | |
S&P Global, Inc. | | | 1,385 | | | | 477,506 | |
State Street Corp. | | | 1,470 | | | | 111,264 | |
T Rowe Price Group, Inc. | | | 942 | | | | 106,352 | |
| | | | | | | | |
| | |
| | | | | | | 4,086,779 | |
| | |
| Chemicals — 1.9% | | | | | | |
Air Products & Chemicals, Inc. | | | 933 | | | | 267,967 | |
Albemarle Corp. | | | 494 | | | | 109,194 | |
Celanese Corp., Class A | | | 417 | | | | 45,407 | |
CF Industries Holdings, Inc. | | | 827 | | | | 59,949 | |
Corteva, Inc. | | | 2,988 | | | | 180,206 | |
Dow, Inc. | | | 2,960 | | | | 162,267 | |
Eastman Chemical Co. | | | 501 | | | | 42,255 | |
Ecolab, Inc. | | | 1,047 | | | | 173,310 | |
FMC Corp. | | | 533 | | | | 65,095 | |
International Flavors & Fragrances, Inc. | | | 1,074 | | | | 98,765 | |
Linde PLC | | | 2,070 | | | | 735,761 | |
LyondellBasell Industries NV, Class A | | | 1,070 | | | | 100,462 | |
Mosaic Co. | | | 1,436 | | | | 65,884 | |
PPG Industries, Inc. | | | 990 | | | | 132,244 | |
Sherwin-Williams Co. | | | 987 | | | | 221,848 | |
| | | | | | | | |
| | |
| | | | | | | 2,460,614 | |
| | |
| Commercial Services & Supplies — 0.5% | | | | | | |
Cintas Corp. | | | 366 | | | | 169,341 | |
Copart, Inc.(a) | | | 1,806 | | | | 135,829 | |
Republic Services, Inc. | | | 868 | | | | 117,371 | |
Rollins, Inc. | | | 952 | | | | 35,729 | |
Waste Management, Inc. | | | 1,556 | | | | 253,892 | |
| | | | | | | | |
| | |
| | | | | | | 712,162 | |
| | |
| Communications Equipment — 1.1% | | | | | | |
Arista Networks, Inc.(a) | | | 1,038 | | | | 174,239 | |
| | |
| 12 | | 2 0 2 3 I SHARES ANNUAL REPORT TO SHAREHOLDERS |
| | |
Schedule of Investments (continued) March 31, 2023 | | iShares® ESG Screened S&P 500 ETF (Percentages shown are based on Net Assets) |
| | | | | | | | |
| Security | | Shares | | | Value | |
|
Communications Equipment (continued) | |
Cisco Systems, Inc. | | | 17,274 | | | $ | 902,998 | |
F5, Inc.(a) | | | 253 | | | | 36,860 | |
Juniper Networks, Inc. | | | 1,363 | | | | 46,914 | |
Motorola Solutions, Inc. | | | 707 | | | | 202,294 | |
| | | | | | | | |
| | |
| | | | | | | 1,363,305 | |
|
| Construction & Engineering — 0.1% | |
Quanta Services, Inc. | | | 604 | | | | 100,651 | |
| | | | | | | | |
| | |
| Construction Materials — 0.1% | | | | | | |
Martin Marietta Materials, Inc. | | | 262 | | | | 93,026 | |
Vulcan Materials Co. | | | 559 | | | | 95,902 | |
| | | | | | | | |
| | |
| | | | | | | 188,928 | |
|
| Consumer Finance — 0.6% | |
American Express Co. | | | 2,503 | | | | 412,870 | |
Capital One Financial Corp. | | | 1,604 | | | | 154,241 | |
Discover Financial Services | | | 1,127 | | | | 111,393 | |
Synchrony Financial | | | 1,843 | | | | 53,594 | |
| | | | | | | | |
| | |
| | | | | | | 732,098 | |
|
| Consumer Staples Distribution & Retail — 1.5% | |
Costco Wholesale Corp. | | | 1,867 | | | | 927,656 | |
Dollar General Corp. | | | 944 | | | | 198,674 | |
Dollar Tree, Inc.(a) | | | 879 | | | | 126,180 | |
Kroger Co. | | | 2,746 | | | | 135,570 | |
Sysco Corp. | | | 2,130 | | | | 164,500 | |
Target Corp. | | | 1,933 | | | | 320,163 | |
Walgreens Boots Alliance, Inc. | | | 2,984 | | | | 103,187 | |
| | | | | | | | |
| | |
| | | | | | | 1,975,930 | |
|
| Containers & Packaging — 0.3% | |
Amcor PLC | | | 6,200 | | | | 70,556 | |
Avery Dennison Corp. | | | 337 | | | | 60,299 | |
Ball Corp. | | | 1,323 | | | | 72,911 | |
International Paper Co. | | | 1,483 | | | | 53,477 | |
Packaging Corp. of America | | | 389 | | | | 54,005 | |
Sealed Air Corp. | | | 597 | | | | 27,408 | |
Westrock Co. | | | 1,073 | | | | 32,694 | |
| | | | | | | | |
| | |
| | | | | | | 371,350 | |
|
| Distributors — 0.2% | |
Genuine Parts Co. | | | 592 | | | | 99,048 | |
LKQ Corp. | | | 1,069 | | | | 60,676 | |
Pool Corp. | | | 164 | | | | 56,160 | |
| | | | | | | | |
| | |
| | | | | | | 215,884 | |
|
| Diversified Telecommunication Services — 1.0% | |
AT&T Inc. | | | 29,973 | | | | 576,980 | |
Verizon Communications, Inc. | | | 17,661 | | | | 686,837 | |
| | | | | | | | |
| | |
| | | | | | | 1,263,817 | |
|
| Electric Utilities — 1.1% | |
Constellation Energy Corp. | | | 1,375 | | | | 107,938 | |
Edison International | | | 1,612 | | | | 113,791 | |
Entergy Corp. | | | 858 | | | | 92,441 | |
Eversource Energy | | | 1,465 | | | | 114,651 | |
Exelon Corp. | | | 4,158 | | | | 174,179 | |
FirstEnergy Corp. | | | 2,287 | | | | 91,617 | |
NextEra Energy, Inc. | | | 8,353 | | | | 643,849 | |
NRG Energy, Inc. | | | 970 | | | | 33,261 | |
| | | | | | | | |
| | |
| | | | | | | 1,371,727 | |
|
| Electrical Equipment — 0.6% | |
AMETEK, Inc. | | | 966 | | | | 140,389 | |
Eaton Corp. PLC | | | 1,677 | | | | 287,337 | |
Emerson Electric Co. | | | 2,393 | | | | 208,526 | |
| | | | | | | | |
| Security | | Shares | | | Value | |
|
Electrical Equipment (continued) | |
Generac Holdings, Inc.(a) | | | 266 | | | $ | 28,731 | |
Rockwell Automation, Inc. | | | 483 | | | | 141,736 | |
| | | | | | | | |
| | |
| | | | | | | 806,719 | |
|
| Electronic Equipment, Instruments & Components — 0.7% | |
Amphenol Corp., Class A | | | 2,489 | | | | 203,401 | |
CDW Corp. | | | 570 | | | | 111,087 | |
Corning, Inc. | | | 3,212 | | | | 113,319 | |
Keysight Technologies, Inc.(a) | | | 750 | | | | 121,110 | |
TE Connectivity Ltd. | | | 1,330 | | | | 174,430 | |
Trimble, Inc.(a) | | | 1,050 | | | | 55,041 | |
Zebra Technologies Corp., Class A(a) | | | 216 | | | | 68,688 | |
| | | | | | | | |
| | |
| | | | | | | 847,076 | |
|
| Energy Equipment & Services — 0.4% | |
Baker Hughes Co., Class A | | | 4,198 | | | | 121,154 | |
Halliburton Co. | | | 3,796 | | | | 120,106 | |
Schlumberger NV | | | 5,992 | | | | 294,207 | |
| | | | | | | | |
| | |
| | | | | | | 535,467 | |
|
| Entertainment — 1.6% | |
Activision Blizzard, Inc. | | | 2,986 | | | | 255,572 | |
Electronic Arts, Inc. | | | 1,099 | | | | 132,374 | |
Live Nation Entertainment, Inc.(a) | | | 603 | | | | 42,210 | |
Netflix, Inc.(a) | | | 1,874 | | | | 647,429 | |
Take-Two Interactive Software, Inc.(a) | | | 669 | | | | 79,812 | |
Walt Disney Co.(a) | | | 7,683 | | | | 769,299 | |
Warner Bros Discovery, Inc., Class A(a) | | | 9,279 | | | | 140,113 | |
| | | | | | | | |
| | |
| | | | | | | 2,066,809 | |
|
| Financial Services — 4.8% | |
Berkshire Hathaway, Inc., Class B(a) | | | 7,578 | | | | 2,339,859 | |
Fidelity National Information Services, Inc. | | | 2,502 | | | | 135,934 | |
Fiserv, Inc.(a) | | | 2,672 | | | | 302,016 | |
FleetCor Technologies, Inc.(a) | | | 310 | | | | 65,363 | |
Global Payments, Inc. | | | 1,111 | | | | 116,922 | |
Jack Henry & Associates, Inc. | | | 306 | | | | 46,120 | |
Mastercard, Inc., Class A | | | 3,549 | | | | 1,289,742 | |
PayPal Holdings, Inc.(a) | | | 4,756 | | | | 361,171 | |
Visa, Inc., Class A | | | 6,833 | | | | 1,540,568 | |
| | | | | | | | |
| | |
| | | | | | | 6,197,695 | |
|
| Food Products — 1.2% | |
Archer-Daniels-Midland Co. | | | 2,310 | | | | 184,015 | |
Campbell Soup Co. | | | 857 | | | | 47,118 | |
Conagra Brands, Inc. | | | 1,999 | | | | 75,082 | |
General Mills, Inc. | | | 2,485 | | | | 212,368 | |
Hershey Co. | | | 616 | | | | 156,717 | |
Hormel Foods Corp. | | | 1,206 | | | | 48,095 | |
J M Smucker Co. | | | 452 | | | | 71,131 | |
Kellogg Co. | | | 1,079 | | | | 72,250 | |
Kraft Heinz Co. | | | 3,330 | | | | 128,771 | |
Lamb Weston Holdings, Inc. | | | 613 | | | | 64,071 | |
McCormick & Co., Inc., NVS | | | 1,056 | | | | 87,870 | |
Mondelez International, Inc., Class A | | | 5,734 | | | | 399,774 | |
Tyson Foods, Inc., Class A | | | 1,206 | | | | 71,540 | |
| | | | | | | | |
| | |
| | | | | | | 1,618,802 | |
|
| Gas Utilities — 0.1% | |
Atmos Energy Corp. | | | 605 | | | | 67,978 | |
| | | | | | | | |
| | |
| Ground Transportation — 0.9% | | | | | | |
CSX Corp. | | | 8,823 | | | | 264,161 | |
JB Hunt Transport Services, Inc. | | | 351 | | | | 61,586 | |
Norfolk Southern Corp. | | | 963 | | | | 204,156 | |
| | |
SCHEDULES OF INVESTMENTS | | 13 |
| | |
Schedule of Investments (continued) March 31, 2023 | | iShares® ESG Screened S&P 500 ETF (Percentages shown are based on Net Assets) |
| | | | | | | | |
| Security | | Shares | | | Value | |
|
Ground Transportation (continued) | |
Old Dominion Freight Line, Inc. | | | 380 | | | $ | 129,519 | |
Union Pacific Corp. | | | 2,571 | | | | 517,440 | |
| | | | | | | | |
| | |
| | | | | | | 1,176,862 | |
|
| Health Care Equipment & Supplies — 3.1% | |
Abbott Laboratories | | | 7,332 | | | | 742,438 | |
Align Technology, Inc.(a) | | | 305 | | | | 101,913 | |
Baxter International, Inc. | | | 2,114 | | | | 85,744 | |
Becton Dickinson & Co. | | | 1,193 | | | | 295,315 | |
Boston Scientific Corp.(a) | | | 6,032 | | | | 301,781 | |
Cooper Cos., Inc. | | | 211 | | | | 78,779 | |
DENTSPLY SIRONA, Inc. | | | 905 | | | | 35,548 | |
Dexcom, Inc.(a) | | | 1,625 | | | | 188,793 | |
Edwards Lifesciences Corp.(a) | | | 2,608 | | | | 215,760 | |
GE HealthCare Technologies, Inc.(a) | | | 1,530 | | | | 125,506 | |
Hologic, Inc.(a) | | | 1,026 | | | | 82,798 | |
IDEXX Laboratories, Inc.(a) | | | 350 | | | | 175,028 | |
Intuitive Surgical, Inc.(a) | | | 1,470 | | | | 375,541 | |
Medtronic PLC | | | 5,587 | | | | 450,424 | |
ResMed, Inc. | | | 615 | | | | 134,679 | |
STERIS PLC | | | 416 | | | | 79,572 | |
Stryker Corp. | | | 1,417 | | | | 404,511 | |
Teleflex, Inc. | | | 200 | | | | 50,662 | |
Zimmer Biomet Holdings, Inc. | | | 883 | | | | 114,084 | |
| | | | | | | | |
| | |
| | | | | | | 4,038,876 | |
|
| Health Care Providers & Services — 3.4% | |
AmerisourceBergen Corp. | | | 685 | | | | 109,675 | |
Cardinal Health, Inc. | | | 1,083 | | | | 81,766 | |
Centene Corp.(a) | | | 2,321 | | | | 146,710 | |
Cigna Group | | | 1,255 | | | | 320,690 | |
CVS Health Corp. | | | 5,401 | | | | 401,348 | |
DaVita, Inc.(a) | | | 219 | | | | 17,763 | |
Elevance Health, Inc. | | | 1,007 | | | | 463,029 | |
HCA Healthcare, Inc. | | | 891 | | | | 234,939 | |
Henry Schein, Inc.(a) | | | 571 | | | | 46,559 | |
Humana, Inc. | | | 526 | | | | 255,352 | |
Laboratory Corp. of America Holdings | | | 376 | | | | 86,262 | |
McKesson Corp. | | | 573 | | | | 204,017 | |
Molina Healthcare, Inc.(a) | | | 246 | | | | 65,803 | |
Quest Diagnostics, Inc. | | | 466 | | | | 65,930 | |
UnitedHealth Group, Inc. | | | 3,928 | | | | 1,856,334 | |
Universal Health Services, Inc., Class B | | | 272 | | | | 34,571 | |
| | | | | | | | |
| | |
| | | | | | | 4,390,748 | |
|
| Health Care REITs — 0.2% | |
Healthpeak Properties, Inc. | | | 2,266 | | | | 49,784 | |
Ventas, Inc. | | | 1,674 | | | | 72,568 | |
Welltower, Inc. | | | 1,992 | | | | 142,806 | |
| | | | | | | | |
| | |
| | | | | | | 265,158 | |
|
| Hotel & Resort REITs — 0.0% | |
Host Hotels & Resorts, Inc. | | | 3,017 | | | | 49,750 | |
| | | | | | | | |
| | |
| Hotels, Restaurants & Leisure — 2.3% | | | | | | |
Booking Holdings, Inc.(a) | | | 163 | | | | 432,343 | |
Caesars Entertainment, Inc.(a) | | | 904 | | | | 44,124 | |
Carnival Corp.(a) | | | 4,251 | | | | 43,148 | |
Chipotle Mexican Grill, Inc.(a) | | | 118 | | | | 201,578 | |
Darden Restaurants, Inc. | | | 514 | | | | 79,752 | |
Domino’s Pizza, Inc. | | | 148 | | | | 48,821 | |
Expedia Group, Inc.(a) | | | 626 | | | | 60,741 | |
Hilton Worldwide Holdings, Inc. | | | 1,126 | | | | 158,620 | |
Las Vegas Sands Corp.(a) | | | 1,381 | | | | 79,338 | |
Marriott International, Inc., Class A | | | 1,135 | | | | 188,455 | |
| | | | | | | | |
| Security | | Shares | | | Value | |
|
Hotels, Restaurants & Leisure (continued) | |
McDonald’s Corp. | | | 3,078 | | | $ | 860,639 | |
MGM Resorts International | | | 1,326 | | | | 58,901 | |
Norwegian Cruise Line Holdings Ltd.(a)(b) | | | 1,726 | | | | 23,215 | |
Royal Caribbean Cruises Ltd.(a) | | | 906 | | | | 59,162 | |
Starbucks Corp. | | | 4,829 | | | | 502,844 | |
Wynn Resorts Ltd.(a) | | | 431 | | | | 48,233 | |
Yum! Brands, Inc. | | | 1,174 | | | | 155,062 | |
| | | | | | | | |
| | |
| | | | | | | 3,044,976 | |
|
| Household Durables — 0.4% | |
DR Horton, Inc. | | | 1,317 | | | | 128,658 | |
Garmin Ltd. | | | 638 | | | | 64,387 | |
Lennar Corp., Class A | | | 1,068 | | | | 112,257 | |
Mohawk Industries, Inc.(a) | | | 221 | | | | 22,149 | |
Newell Brands, Inc. | | | 1,570 | | | | 19,531 | |
NVR, Inc.(a) | | | 13 | | | | 72,438 | |
PulteGroup, Inc. | | | 953 | | | | 55,541 | |
Whirlpool Corp. | | | 229 | | | | 30,233 | |
| | | | | | | | |
| | |
| | | | | | | 505,194 | |
|
| Household Products — 1.6% | |
Church & Dwight Co., Inc. | | | 1,023 | | | | 90,443 | |
Clorox Co. | | | 519 | | | | 82,127 | |
Colgate-Palmolive Co. | | | 3,504 | | | | 263,326 | |
Kimberly-Clark Corp. | | | 1,423 | | | | 190,995 | |
Procter & Gamble Co. | | | 9,921 | | | | 1,475,153 | |
| | | | | | | | |
| | |
| | | | | | | 2,102,044 | |
|
| Industrial Conglomerates — 0.3% | |
General Electric Co.(b) | | | 4,586 | | | | 438,422 | |
| | | | | | | | |
| | |
| Industrial REITs — 0.4% | | | | | | |
Prologis, Inc. | | | 3,883 | | | | 484,482 | |
| | | | | | | | |
| | |
| Insurance — 2.4% | | | | | | |
Aflac, Inc. | | | 2,362 | | | | 152,396 | |
Allstate Corp. | | | 1,110 | | | | 122,999 | |
American International Group, Inc. | | | 3,121 | | | | 157,174 | |
Aon PLC, Class A | | | 863 | | | | 272,095 | |
Arch Capital Group Ltd.(a) | | | 1,558 | | | | 105,741 | |
Arthur J. Gallagher & Co. | | | 893 | | | | 170,840 | |
Assurant, Inc. | | | 232 | | | | 27,856 | |
Brown & Brown, Inc. | | | 991 | | | | 56,903 | |
Chubb Ltd. | | | 1,743 | | | | 338,456 | |
Cincinnati Financial Corp. | | | 665 | | | | 74,533 | |
Everest Re Group Ltd. | | | 164 | | | | 58,715 | |
Globe Life, Inc. | | | 379 | | | | 41,698 | |
Hartford Financial Services Group, Inc. | | | 1,325 | | | | 92,339 | |
Lincoln National Corp. | | | 633 | | | | 14,223 | |
Loews Corp. | | | 817 | | | | 47,402 | |
Marsh & McLennan Cos., Inc. | | | 2,078 | | | | 346,091 | |
MetLife, Inc. | | | 2,758 | | | | 159,799 | |
Principal Financial Group, Inc. | | | 961 | | | | 71,422 | |
Progressive Corp. | | | 2,461 | | | | 352,071 | |
Prudential Financial, Inc. | | | 1,548 | | | | 128,082 | |
Travelers Cos., Inc. | | | 965 | | | | 165,411 | |
W R Berkley Corp. | | | 863 | | | | 53,730 | |
Willis Towers Watson PLC | | | 453 | | | | 105,268 | |
| | | | | | | | |
| | |
| | | | | | | 3,115,244 | |
|
| Interactive Media & Services — 5.3% | |
Alphabet, Inc., Class A(a) | | | 25,046 | | | | 2,598,022 | |
Alphabet, Inc., Class C, NVS(a) | | | 21,832 | | | | 2,270,528 | |
Match Group, Inc.(a) | | | 1,172 | | | | 44,993 | |
Meta Platforms, Inc., Class A(a) | | | 9,360 | | | | 1,983,758 | |
| | | | | | | | |
| | |
| | | | | | | 6,897,301 | |
| | |
| 14 | | 2 0 2 3 I SHARES ANNUAL REPORT TO SHAREHOLDERS |
| | |
Schedule of Investments (continued) March 31, 2023 | | iShares® ESG Screened S&P 500 ETF (Percentages shown are based on Net Assets) |
| | | | | | | | |
| Security | | Shares | | | Value | |
|
IT Services — 1.3% | |
Accenture PLC, Class A | | | 2,646 | | | $ | 756,253 | |
Akamai Technologies, Inc.(a) | | | 669 | | | | 52,383 | |
Cognizant Technology Solutions Corp., Class A | | | 2,128 | | | | 129,659 | |
DXC Technology Co.(a)(b) | | | 940 | | | | 24,027 | |
EPAM Systems, Inc.(a) | | | 242 | | | | 72,358 | |
Gartner, Inc.(a) | | | 329 | | | | 107,178 | |
International Business Machines Corp. | | | 3,803 | | | | 498,535 | |
VeriSign, Inc.(a) | | | 382 | | | | 80,728 | |
| | | | | | | | |
| | |
| | | | | | | 1,721,121 | |
|
| Leisure Products — 0.0% | |
Hasbro, Inc. | | | 555 | | | | 29,798 | |
| | | | | | | | |
| | |
| Life Sciences Tools & Services — 2.1% | | | | | | |
Agilent Technologies, Inc. | | | 1,247 | | | | 172,510 | |
Bio-Rad Laboratories, Inc., Class A(a) | | | 91 | | | | 43,591 | |
Bio-Techne Corp. | | | 652 | | | | 48,372 | |
Charles River Laboratories International, Inc.(a) | | | 212 | | | | 42,786 | |
Danaher Corp. | | | 2,756 | | | | 694,622 | |
Illumina, Inc.(a) | | | 663 | | | | 154,181 | |
IQVIA Holdings, Inc.(a) | | | 785 | | | | 156,129 | |
Mettler-Toledo International, Inc.(a) | | | 93 | | | | 142,309 | |
PerkinElmer, Inc. | | | 535 | | | | 71,294 | |
Thermo Fisher Scientific, Inc. | | | 1,647 | | | | 949,281 | |
Waters Corp.(a) | | | 247 | | | | 76,479 | |
West Pharmaceutical Services, Inc. | | | 311 | | | | 107,752 | |
| | | | | | | | |
| | |
| | | | | | | 2,659,306 | |
|
| Machinery — 2.0% | |
Caterpillar, Inc. | | | 2,189 | | | | 500,931 | |
Cummins, Inc. | | | 595 | | | | 142,134 | |
Deere & Co. | | | 1,135 | | | | 468,619 | |
Dover Corp. | | | 589 | | | | 89,493 | |
Fortive Corp. | | | 1,481 | | | | 100,960 | |
IDEX Corp. | | | 317 | | | | 73,236 | |
Illinois Tool Works, Inc. | | | 1,169 | | | | 284,593 | |
Ingersoll Rand, Inc. | | | 1,696 | | | | 98,673 | |
Nordson Corp. | | | 221 | | | | 49,119 | |
Otis Worldwide Corp. | | | 1,739 | | | | 146,771 | |
PACCAR, Inc. | | | 2,184 | | | | 159,869 | |
Parker-Hannifin Corp. | | | 543 | | | | 182,508 | |
Pentair PLC | | | 703 | | | | 38,855 | |
Snap-on, Inc. | | | 223 | | | | 55,056 | |
Stanley Black & Decker, Inc. | | | 622 | | | | 50,121 | |
Westinghouse Air Brake Technologies Corp. | | | 769 | | | | 77,715 | |
Xylem, Inc. | | | 763 | | | | 79,886 | |
| | | | | | | | |
| | |
| | | | | | | 2,598,539 | |
|
| Media — 0.9% | |
Charter Communications, Inc., Class A(a) | | | 442 | | | | 158,064 | |
Comcast Corp., Class A | | | 17,688 | | | | 670,552 | |
DISH Network Corp., Class A(a) | | | 1,049 | | | | 9,787 | |
Fox Corp., Class A, NVS | | | 1,252 | | | | 42,631 | |
Fox Corp., Class B | | | 581 | | | | 18,191 | |
Interpublic Group of Cos., Inc. | | | 1,652 | | | | 61,520 | |
News Corp., Class A, NVS | | | 1,570 | | | | 27,114 | |
News Corp., Class B | | | 528 | | | | 9,203 | |
Omnicom Group, Inc. | | | 856 | | | | 80,755 | |
Paramount Global, Class B, NVS | | | 2,135 | | | | 47,632 | |
| | | | | | | | |
| | |
| | | | | | | 1,125,449 | |
|
| Metals & Mining — 0.5% | |
Freeport-McMoRan, Inc. | | | 6,021 | | | | 246,319 | |
Newmont Corp. | | | 3,347 | | | | 164,070 | |
| | | | | | | | |
| Security | | Shares | | | Value | |
|
Metals & Mining (continued) | |
Nucor Corp. | | | 1,062 | | | $ | 164,047 | |
Steel Dynamics, Inc. | | | 705 | | | | 79,708 | |
| | | | | | | | |
| | |
| | | | | | | 654,144 | |
|
| Multi-Utilities — 0.4% | |
CenterPoint Energy, Inc. | | | 2,635 | | | | 77,627 | |
Consolidated Edison, Inc. | | | 1,496 | | | | 143,122 | |
Public Service Enterprise Group, Inc. | | | 2,100 | | | | 131,145 | |
Sempra Energy | | | 1,325 | | | | 200,287 | |
| | | | | | | | |
| | |
| | | | | | | 552,181 | |
|
| Office REITs — 0.1% | |
Alexandria Real Estate Equities, Inc. | | | 657 | | | | 82,512 | |
Boston Properties, Inc. | | | 602 | | | | 32,580 | |
| | | | | | | | |
| | |
| | | | | | | 115,092 | |
|
| Oil, Gas & Consumable Fuels — 0.9% | |
Kinder Morgan, Inc. | | | 8,325 | | | | 145,771 | |
Marathon Petroleum Corp. | | | 1,914 | | | | 258,065 | |
ONEOK, Inc. | | | 1,878 | | | | 119,328 | |
Phillips 66 | | | 1,968 | | | | 199,516 | |
Targa Resources Corp. | | | 950 | | | | 69,302 | |
Valero Energy Corp. | | | 1,696 | | | | 236,761 | |
Williams Cos., Inc. | | | 5,138 | | | | 153,421 | |
| | | | | | | | |
| | |
| | | | | | | 1,182,164 | |
|
| Passenger Airlines — 0.2% | |
Alaska Air Group, Inc.(a) | | | 540 | | | | 22,658 | |
American Airlines Group, Inc.(a) | | | 2,731 | | | | 40,282 | |
Delta Air Lines, Inc.(a) | | | 2,695 | | | | 94,110 | |
Southwest Airlines Co. | | | 2,506 | | | | 81,545 | |
United Airlines Holdings, Inc.(a) | | | 1,362 | | | | 60,269 | |
| | | | | | | | |
| | |
| | | | | | | 298,864 | |
|
| Personal Care Products — 0.2% | |
Estee Lauder Cos., Inc., Class A | | | 972 | | | | 239,559 | |
| | | | | | | | |
| | |
| Pharmaceuticals — 3.3% | | | | | | |
Bristol-Myers Squibb Co. | | | 8,941 | | | | 619,701 | |
Catalent, Inc.(a) | | | 745 | | | | 48,954 | |
Eli Lilly & Co. | | | 3,317 | | | | 1,139,124 | |
Merck & Co., Inc. | | | 10,662 | | | | 1,134,330 | |
Organon & Co. | | | 1,051 | | | | 24,720 | |
Pfizer, Inc. | | | 23,604 | | | | 963,043 | |
Viatris, Inc. | | | 5,082 | | | | 48,889 | |
Zoetis, Inc., Class A | | | 1,962 | | | | 326,555 | |
| | | | | | | | |
| | |
| | | | | | | 4,305,316 | |
|
| Professional Services — 0.8% | |
Automatic Data Processing, Inc. | | | 1,743 | | | | 388,044 | |
Broadridge Financial Solutions, Inc. | | | 496 | | | | 72,699 | |
CoStar Group, Inc.(a) | | | 1,705 | | | | 117,389 | |
Equifax, Inc. | | | 518 | | | | 105,071 | |
Paychex, Inc. | | | 1,341 | | | | 153,665 | |
Robert Half International, Inc. | | | 456 | | | | 36,740 | |
Verisk Analytics, Inc. | | | 659 | | | | 126,436 | |
| | | | | | | | |
| | |
| | | | | | | 1,000,044 | |
|
| Real Estate Management & Development — 0.1% | |
CBRE Group, Inc., Class A(a) | | | 1,332 | | | | 96,983 | |
| | | | | | | | |
| | |
| Residential REITs — 0.4% | | | | | | |
AvalonBay Communities, Inc. | | | 590 | | | | 99,155 | |
Camden Property Trust | | | 462 | | | | 48,436 | |
Equity Residential | | | 1,440 | | | | 86,400 | |
Essex Property Trust, Inc. | | | 274 | | | | 57,304 | |
Invitation Homes, Inc. | | | 2,435 | | | | 76,045 | |
| | |
SCHEDULES OF INVESTMENTS | | 15 |
| | |
Schedule of Investments (continued) March 31, 2023 | | iShares® ESG Screened S&P 500 ETF (Percentages shown are based on Net Assets) |
| | | | | | | | |
| Security | | Shares | | | Value | |
|
Residential REITs (continued) | |
Mid-America Apartment Communities, Inc. | | | 486 | | | $ | 73,406 | |
UDR, Inc. | | | 1,299 | | | | 53,337 | |
| | | | | | | | |
| | |
| | | | | | | 494,083 | |
|
| Retail REITs — 0.3% | |
Federal Realty Investment Trust | | | 307 | | | | 30,341 | |
Kimco Realty Corp. | | | 2,607 | | | | 50,915 | |
Realty Income Corp. | | | 2,628 | | | | 166,405 | |
Regency Centers Corp. | | | 635 | | | | 38,849 | |
Simon Property Group, Inc. | | | 1,381 | | | | 154,630 | |
| | | | | | | | |
| | |
| | | | | | | 441,140 | |
|
| Semiconductors & Semiconductor Equipment — 7.2% | |
Advanced Micro Devices, Inc.(a) | | | 6,779 | | | | 664,410 | |
Analog Devices, Inc. | | | 2,132 | | | | 420,473 | |
Applied Materials, Inc. | | | 3,546 | | | | 435,555 | |
Broadcom, Inc. | | | 1,757 | | | | 1,127,186 | |
Enphase Energy, Inc.(a) | | | 572 | | | | 120,280 | |
First Solar, Inc.(a) | | | 418 | | | | 90,915 | |
Intel Corp. | | | 17,396 | | | | 568,327 | |
KLA Corp. | | | 580 | | | | 231,519 | |
Lam Research Corp. | | | 565 | | | | 299,518 | |
Microchip Technology, Inc. | | | 2,311 | | | | 193,615 | |
Micron Technology, Inc. | | | 4,579 | | | | 276,297 | |
Monolithic Power Systems, Inc. | | | 190 | | | | 95,103 | |
NVIDIA Corp. | | | 10,344 | | | | 2,873,253 | |
NXP Semiconductors NV | | | 1,093 | | | | 203,817 | |
ON Semiconductor Corp.(a) | | | 1,821 | | | | 149,905 | |
Qorvo, Inc.(a) | | | 421 | | | | 42,761 | |
QUALCOMM, Inc. | | | 4,688 | | | | 598,095 | |
Skyworks Solutions, Inc. | | | 673 | | | | 79,400 | |
SolarEdge Technologies, Inc.(a) | | | 235 | | | | 71,428 | |
Teradyne, Inc. | | | 647 | | | | 69,559 | |
Texas Instruments, Inc. | | | 3,811 | | | | 708,884 | |
| | | | | | | | |
| | |
| | | | | | | 9,320,300 | |
|
| Software — 10.5% | |
Adobe, Inc.(a) | | | 1,925 | | | | 741,837 | |
ANSYS, Inc.(a) | | | 369 | | | | 122,803 | |
Autodesk, Inc.(a) | | | 909 | | | | 189,217 | |
Cadence Design Systems, Inc.(a) | | | 1,149 | | | | 241,393 | |
Ceridian HCM Holding, Inc.(a) | | | 648 | | | | 47,447 | |
Fortinet, Inc.(a) | | | 2,721 | | | | 180,838 | |
Gen Digital, Inc. | | | 2,397 | | | | 41,133 | |
Intuit, Inc. | | | 1,182 | | | | 526,971 | |
Microsoft Corp. | | | 31,300 | | | | 9,023,790 | |
Oracle Corp. | | | 6,463 | | | | 600,542 | |
Paycom Software, Inc.(a) | | | 205 | | | | 62,322 | |
PTC, Inc.(a) | | | 444 | | | | 56,934 | |
Roper Technologies, Inc. | | | 449 | | | | 197,870 | |
Salesforce, Inc.(a) | | | 4,206 | | | | 840,275 | |
ServiceNow, Inc.(a) | | | 854 | | | | 396,871 | |
Synopsys, Inc.(a) | | | 639 | | | | 246,814 | |
Tyler Technologies, Inc.(a) | | | 174 | | | | 61,707 | |
| | | | | | | | |
| | |
| | | | | | | 13,578,764 | |
|
| Specialized REITs — 1.3% | |
American Tower Corp. | | | 1,959 | | | | 400,302 | |
Crown Castle, Inc. | | | 1,814 | | | | 242,786 | |
Digital Realty Trust, Inc. | | | 1,215 | | | | 119,447 | |
Equinix, Inc. | | | 387 | | | | 279,042 | |
Extra Space Storage, Inc. | | | 564 | | | | 91,892 | |
Iron Mountain, Inc. | | | 1,226 | | | | 64,868 | |
Public Storage | | | 666 | | | | 201,225 | |
SBA Communications Corp. | | | 452 | | | | 118,004 | |
| | | | | | | | |
| Security | | Shares | | | Value | |
|
Specialized REITs (continued) | |
VICI Properties, Inc. | | | 4,236 | | | $ | 138,178 | |
Weyerhaeuser Co. | | | 3,084 | | | | 92,921 | |
| | | | | | | | |
| | |
| | | | | | | 1,748,665 | |
|
| Specialty Retail — 2.4% | |
Advance Auto Parts, Inc. | | | 250 | | | | 30,402 | |
AutoZone, Inc.(a) | | | 78 | | | | 191,736 | |
Bath & Body Works, Inc. | | | 946 | | | | 34,605 | |
Best Buy Co., Inc. | | | 830 | | | | 64,964 | |
CarMax, Inc.(a)(b) | | | 668 | | | | 42,939 | |
Home Depot, Inc. | | | 4,286 | | | | 1,264,884 | |
Lowe’s Cos., Inc. | | | 2,544 | | | | 508,724 | |
O’Reilly Automotive, Inc.(a) | | | 262 | | | | 222,433 | |
Ross Stores, Inc. | | | 1,454 | | | | 154,313 | |
TJX Cos., Inc. | | | 4,865 | | | | 381,221 | |
Tractor Supply Co. | | | 464 | | | | 109,059 | |
Ulta Beauty, Inc.(a) | | | 211 | | | | 115,136 | |
| | | | | | | | |
| | |
| | | | | | | 3,120,416 | |
|
| Technology Hardware, Storage & Peripherals — 8.2% | |
Apple Inc. | | | 62,538 | | | | 10,312,516 | |
Hewlett Packard Enterprise Co. | | | 5,417 | | | | 86,293 | |
HP, Inc. | | | 3,648 | | | | 107,069 | |
NetApp, Inc. | | | 914 | | | | 58,359 | |
Seagate Technology Holdings PLC | | | 804 | | | | 53,160 | |
Western Digital Corp.(a) | | | 1,347 | | | | 50,742 | |
| | | | | | | | |
| | |
| | | | | | | 10,668,139 | |
|
| Textiles, Apparel & Luxury Goods — 0.6% | |
NIKE, Inc., Class B | | | 5,238 | | | | 642,388 | |
Ralph Lauren Corp., Class A | | | 171 | | | | 19,950 | |
Tapestry, Inc. | | | 979 | | | | 42,205 | |
VF Corp. | | | 1,413 | | | | 32,372 | |
| | | | | | | | |
| | |
| | | | | | | 736,915 | |
|
| Trading Companies & Distributors — 0.2% | |
Fastenal Co. | | | 2,406 | | | | 129,779 | |
United Rentals, Inc. | | | 293 | | | | 115,958 | |
| | | | | | | | |
| | |
| | | | | | | 245,737 | |
|
| Water Utilities — 0.1% | |
American Water Works Co., Inc. | | | 812 | | | | 118,950 | |
| | | | | | | | |
|
| Wireless Telecommunication Services — 0.3% | |
T-Mobile U.S., Inc.(a) | | | 2,491 | | | | 360,796 | |
| | | | | | | | |
| | |
Total Long-Term Investments — 99.8%
(Cost: $155,429,456) | | | | | | | 129,522,896 | |
| | | | | | | | |
| | |
| 16 | | 2 0 2 3 I SHARES ANNUAL REPORT TO SHAREHOLDERS |
| | |
Schedule of Investments (continued) March 31, 2023 | | iShares® ESG Screened S&P 500 ETF (Percentages shown are based on Net Assets) |
| | | | | | | | |
| Security | | Shares | | | Value | |
| | |
| Short-Term Securities | | | | | | |
| | |
| Money Market Funds — 0.2% | | | | | | |
BlackRock Cash Funds: Institutional, SL Agency Shares, 5.01%(c)(d)(e) | | | 68,946 | | | $ | 68,967 | |
BlackRock Cash Funds: Treasury, SL Agency Shares, 4.73%(c)(d) | | | 167,581 | | | | 167,581 | |
| | | | | | | | |
| |
Total Short-Term Securities — 0.2%
(Cost: $236,533) | | | | 236,548 | |
| | | | | | | | |
| |
Total Investments — 100.0%
(Cost: $155,665,989) | | | | 129,759,444 | |
| |
Other Assets Less Liabilities — 0.0% | | | | 34,428 | |
| | | | | | | | |
| |
Net Assets — 100.0% | | | $ | 129,793,872 | |
| | | | | | | | |
| (a) | Non-income producing security. |
| (b) | All or a portion of this security is on loan. |
| (c) | Affiliate of the Fund. |
| (d) | Annualized 7-day yield as of period end. |
| (e) | All or a portion of this security was purchased with the cash collateral from loaned securities. |
Affiliates
Investments in issuers considered to be affiliate(s) of the Fund during the year ended March 31, 2023 for purposes of Section 2(a)(3) of the Investment Company Act of 1940, as amended, were as follows:
| | | | | | | | | | | | | | | | | | | | | | | | | | | | | | | | | | | | |
| |
| Affiliated Issuer | | Value at
03/31/22 | | | Purchases
at Cost | | | Proceeds
from Sale | | | Net
Realized
Gain (Loss) | | | Change in
Unrealized
Appreciation
(Depreciation) | | | Value at
03/31/23 | | | Shares
Held at
03/31/23 | | | Income | | | Capital
Gain
Distributions
from Underlying
Funds | |
| |
BlackRock Cash Funds: Institutional, SL Agency Shares | | $ | 12,354 | | | $ | 56,072 | (a) | | $ | — | | | $ | 524 | | | $ | 17 | | | $ | 68,967 | | | | 68,946 | | | $ | 1,679 | (b) | | $ | — | |
BlackRock Cash Funds: Treasury, SL Agency Shares | | | 320,000 | | | | — | | | | (152,419 | )(a) | | | — | | | | — | | | | 167,581 | | | | 167,581 | | | | 8,328 | | | | — | |
BlackRock, Inc. | | | 719,848 | | | | 338,420 | | | | (577,302 | ) | | | (24,548 | ) | | | (35,542 | ) | | | 420,876 | | | | 629 | | | | 19,002 | | | | — | |
| | | | | | | | | | | | | | | | | | | | | | | | | | | | | | | | | | | | |
| | | | | | | | | |
| | | | | | | | | | | | | | $ | (24,024 | ) | | $ | (35,525 | ) | | $ | 657,424 | | | | | | | $ | 29,009 | | | $ | — | |
| | | | | | | | | | | | | | | | | | | | | | | | | | | | | | | | | | | | |
| | (a) | Represents net amount purchased (sold). | |
| | (b) | All or a portion represents securities lending income earned from the reinvestment of cash collateral from loaned securities, net of fees and collateral investment expenses, and other payments to and from borrowers of securities. | |
Derivative Financial Instruments Outstanding as of Period End
Futures Contracts
| | | | | | | | | | | | | | | | |
| |
| Description | | Number of
Contracts | | | Expiration
Date | | | Notional
Amount
(000) | | | Value/
Unrealized
Appreciation
(Depreciation) | |
| |
Long Contracts | | | | | | | | | | | | | | | | |
Micro E-mini S&P 500 Index | | | 12 | | | | 06/16/23 | | | $ | 248 | | | $ | 13,294 | |
| | | | | | | | | | | | | | | | |
| | |
SCHEDULES OF INVESTMENTS | | 17 |
| | |
Schedule of Investments (continued) March 31, 2023 | | iShares® ESG Screened S&P 500 ETF |
Derivative Financial Instruments Categorized by Risk Exposure
As of period end, the fair values of derivative financial instruments located in the Statements of Assets and Liabilities were as follows:
| | | | | | | | | | | | | | | | | | | | | | | | | | | | |
| |
| | | Commodity
Contracts | | | Credit
Contracts | | | Equity
Contracts | | | Foreign
Currency
Exchange
Contracts | | | Interest
Rate
Contracts | | | Other
Contracts | | | Total | |
| |
Assets — Derivative Financial Instruments | | | | | | | | | | | | | | | | | | | | | | | | | | | | |
Futures contracts | | | | | | | | | | | | | | | | | | | | | | | | | | | | |
Unrealized appreciation on futures contracts(a) | | $ | — | | | $ | — | | | $ | 13,294 | | | $ | — | | | $ | — | | | $ | — | | | $ | 13,294 | |
| | | | | | | | | | | | | | | | | | | | | | | | | | | | |
| | (a) | Net cumulative unrealized appreciation (depreciation) on futures contracts, if any, are reported in the Schedule of Investments. In the Statements of Assets and Liabilities, only current day’s variation margin is reported in receivables or payables and the net cumulative unrealized appreciation (depreciation) is included in accumulated earnings (loss). | |
For the period ended March 31, 2023, the effect of derivative financial instruments in the Statements of Operations was as follows:
| | | | | | | | | | | | | | | | | | | | | | | | | | | | |
| |
| | | Commodity
Contracts | | | Credit
Contracts | | | Equity
Contracts | | | Foreign
Currency
Exchange
Contracts | | | Interest
Rate
Contracts | | | Other
Contracts | | | Total | |
| |
Net Realized Gain (Loss) from | | | | | | | | | | | | | | | | | | | | | | | | | | | | |
Futures contracts | | $ | — | | | $ | — | | | $ | (19,644 | ) | | $ | — | | | $ | — | | | $ | — | | | $ | (19,644 | ) |
| | | | | | | | | | | | | | | | | | | | | | | | | | | | |
Net Change in Unrealized Appreciation (Depreciation) on | | | | | | | | | | | | | | | | | | | | | | | | | | | | |
Futures contracts | | $ | — | | | $ | — | | | $ | (9,704 | ) | | $ | — | | | $ | — | | | $ | — | | | $ | (9,704 | ) |
| | | | | | | | | | | | | | | | | | | | | | | | | | | | |
Average Quarterly Balances of Outstanding Derivative Financial Instruments
| | | | |
| |
Futures contracts | | | | |
Average notional value of contracts — long | | $ | 398,794 | |
| |
For more information about the Fund’s investment risks regarding derivative financial instruments, refer to the Notes to Financial Statements.
Fair Value Hierarchy as of Period End
Various inputs are used in determining the fair value of financial instruments. For a description of the input levels and information about the Fund’s policy regarding valuation of financial instruments, refer to the Notes to Financial Statements.
The following table summarizes the Fund’s financial instruments categorized in the fair value hierarchy. The breakdown of the Fund’s financial instruments into major categories is disclosed in the Schedule of Investments above.
| | | | | | | | | | | | | | | | |
| |
| | | Level 1 | | | Level 2 | | | Level 3 | | | Total | |
| |
Assets | | | | | | | | | | | | | | | | |
Investments | | | | | | | | | | | | | | | | |
Long-Term Investments | | | | | | | | | | | | | | | | |
Common Stocks | | $ | 129,522,896 | | | $ | — | | | $ | — | | | $ | 129,522,896 | |
Short-Term Securities | | | | | | | | | | | | | | | | |
Money Market Funds | | | 236,548 | | | | — | | | | — | | | | 236,548 | |
| | | | | | | | | | | | | | | | |
| | | | |
| | $ | 129,759,444 | | | $ | — | | | $ | — | | | $ | 129,759,444 | |
| | | | | | | | | | | | | | | | |
Derivative Financial Instruments(a) | | | | | | | | | | | | | | | | |
Assets | | | | | | | | | | | | | | | | |
Equity Contracts | | $ | 13,294 | | | $ | — | | | $ | — | | | $ | 13,294 | |
| | | | | | | | | | | | | | | | |
| | (a) | Derivative financial instruments are futures contracts. Futures contracts are valued at the unrealized appreciation (depreciation) on the instrument. | |
See notes to financial statements.
| | |
| 18 | | 2 0 2 3 I SHARES ANNUAL REPORT TO SHAREHOLDERS |
| | |
Schedule of Investments March 31, 2023 | | iShares® ESG Screened S&P Mid-Cap ETF (Percentages shown are based on Net Assets) |
| | | | | | | | |
| Security | | Shares | | | Value | |
|
Common Stocks | |
|
| Aerospace & Defense — 1.9% | |
Axon Enterprise, Inc.(a) | | | 3,558 | | | $ | 800,016 | |
Curtiss-Wright Corp. | | | 2,016 | | | | 355,340 | |
Hexcel Corp. | | | 4,436 | | | | 302,757 | |
Mercury Systems, Inc.(a) | | | 3,073 | | | | 157,092 | |
Woodward, Inc. | | | 3,141 | | | | 305,839 | |
| | | | | | | | |
| | |
| | | | | | | 1,921,044 | |
|
| Air Freight & Logistics — 0.3% | |
GXO Logistics, Inc.(a) | | | 6,244 | | | | 315,072 | |
| | | | | | | | |
|
| Automobile Components — 1.7% | |
Adient PLC(a) | | | 5,020 | | | | 205,619 | |
Dana, Inc. | | | 6,753 | | | | 101,633 | |
Fox Factory Holding Corp.(a) | | | 2,225 | | | | 270,048 | |
Gentex Corp. | | | 12,366 | | | | 346,619 | |
Goodyear Tire & Rubber Co.(a) | | | 14,969 | | | | 164,958 | |
Lear Corp. | | | 3,112 | | | | 434,093 | |
Visteon Corp.(a) | | | 1,482 | | | | 232,422 | |
| | | | | | | | |
| | |
| | | | | | | 1,755,392 | |
|
| Automobiles — 0.5% | |
Harley-Davidson, Inc. | | | 7,001 | | | | 265,828 | |
Thor Industries, Inc. | | | 2,820 | | | | 224,585 | |
| | | | | | | | |
| | |
| | | | | | | 490,413 | |
|
| Banks — 6.2% | |
Associated Banc-Corp. | | | 7,962 | | | | 143,157 | |
Bank of Hawaii Corp.(b) | | | 2,110 | | | | 109,889 | |
Bank OZK | | | 5,827 | | | | 199,283 | |
Cadence Bank | | | 7,970 | | | | 165,457 | |
Cathay General Bancorp | | | 3,861 | | | | 133,282 | |
Columbia Banking System, Inc. | | | 1 | | | | 21 | |
Commerce Bancshares, Inc. | | | 5,987 | | | | 349,341 | |
Cullen/Frost Bankers, Inc. | | | 3,400 | | | | 358,156 | |
East West Bancorp, Inc. | | | 7,418 | | | | 411,699 | |
First Financial Bankshares, Inc. | | | 6,869 | | | | 219,121 | |
First Horizon Corp. | | | 28,244 | | | | 502,178 | |
FNB Corp. | | | 19,077 | | | | 221,293 | |
Fulton Financial Corp. | | | 8,903 | | | | 123,039 | |
Glacier Bancorp, Inc. | | | 5,830 | | | | 244,918 | |
Hancock Whitney Corp. | | | 4,527 | | | | 164,783 | |
Home BancShares, Inc. | | | 9,994 | | | | 216,970 | |
International Bancshares Corp. | | | 2,790 | | | | 119,468 | |
New York Community Bancorp, Inc., Class A | | | 36,015 | | | | 325,576 | |
Old National Bancorp | | | 15,472 | | | | 223,106 | |
PacWest Bancorp(b) | | | 6,311 | | | | 61,406 | |
Pinnacle Financial Partners, Inc. | | | 4,026 | | | | 222,074 | |
Prosperity Bancshares, Inc. | | | 4,806 | | | | 295,665 | |
Synovus Financial Corp. | | | 7,656 | | | | 236,035 | |
Texas Capital Bancshares, Inc.(a) | | | 2,559 | | | | 125,289 | |
UMB Financial Corp. | | | 2,300 | | | | 132,756 | |
United Bankshares, Inc. | | | 7,328 | | | | 257,946 | |
Valley National Bancorp | | | 22,216 | | | | 205,276 | |
Webster Financial Corp. | | | 9,194 | | | | 362,428 | |
Wintrust Financial Corp. | | | 3,211 | | | | 234,242 | |
| | | | | | | | |
| | |
| | | | | | | 6,363,854 | |
|
| Beverages — 0.5% | |
Boston Beer Co., Inc., Class A, NVS(a) | | | 497 | | | | 163,364 | |
Celsius Holdings, Inc.(a)(b) | | | 2,132 | | | | 198,148 | |
Coca-Cola Consolidated, Inc. | | | 244 | | | | 130,559 | |
| | | | | | | | |
| | |
| | | | | | | 492,071 | |
| | | | | | | | |
| Security | | Shares | | | Value | |
|
| Biotechnology — 1.8% | |
Arrowhead Pharmaceuticals, Inc.(a) | | | 5,700 | | | $ | 144,780 | |
Exelixis, Inc.(a) | | | 17,057 | | | | 331,077 | |
Halozyme Therapeutics, Inc.(a) | | | 7,131 | | | | 272,333 | |
Neurocrine Biosciences, Inc.(a) | | | 5,083 | | | | 514,501 | |
United Therapeutics Corp.(a) | | | 2,399 | | | | 537,280 | |
| | | | | | | | |
| | |
| | | | | | | 1,799,971 | |
|
| Broadline Retail — 0.6% | |
Kohl’s Corp. | | | 5,814 | | | | 136,862 | |
Macy’s, Inc. | | | 14,252 | | | | 249,268 | |
Nordstrom, Inc. | | | 5,898 | | | | 95,960 | |
Ollie’s Bargain Outlet Holdings, Inc.(a) | | | 3,060 | | | | 177,296 | |
| | | | | | | | |
| | |
| | | | | | | 659,386 | |
|
| Building Products — 3.1% | |
Builders FirstSource, Inc.(a) | | | 7,746 | | | | 687,690 | |
Carlisle Cos., Inc. | | | 2,722 | | | | 615,363 | |
Fortune Brands Innovations, Inc. | | | 6,750 | | | | 396,428 | |
Lennox International, Inc. | | | 1,700 | | | | 427,176 | |
Owens Corning | | | 4,919 | | | | 471,240 | |
Simpson Manufacturing Co., Inc. | | | 2,246 | | | | 246,251 | |
Trex Co., Inc.(a) | | | 5,790 | | | | 281,799 | |
| | | | | | | | |
| | |
| | | | | | | 3,125,947 | |
|
| Capital Markets — 2.2% | |
Affiliated Managers Group, Inc. | | | 1,982 | | | | 282,276 | |
Evercore, Inc., Class A | | | 1,883 | | | | 217,260 | |
Federated Hermes, Inc., Class B | | | 4,443 | | | | 178,342 | |
Interactive Brokers Group, Inc., Class A | | | 5,414 | | | | 446,980 | |
Janus Henderson Group PLC | | | 6,973 | | | | 185,761 | |
Jefferies Financial Group, Inc. | | | 9,523 | | | | 302,260 | |
SEI Investments Co. | | | 5,367 | | | | 308,871 | |
Stifel Financial Corp. | | | 5,545 | | | | 327,654 | |
| | | | | | | | |
| | |
| | | | | | | 2,249,404 | |
|
| Chemicals — 2.6% | |
Ashland, Inc. | | | 2,632 | | | | 270,333 | |
Avient Corp. | | | 4,491 | | | | 184,850 | |
Cabot Corp. | | | 2,978 | | | | 228,234 | |
Chemours Co. | | | 7,816 | | | | 234,011 | |
Ingevity Corp.(a) | | | 1,848 | | | | 132,169 | |
NewMarket Corp. | | | 352 | | | | 128,473 | |
RPM International, Inc. | | | 6,794 | | | | 592,708 | |
Scotts Miracle-Gro Co. | | | 2,150 | | | | 149,941 | |
Sensient Technologies Corp. | | | 2,224 | | | | 170,269 | |
Valvoline, Inc. | | | 9,050 | | | | 316,207 | |
Westlake Corp. | | | 1,809 | | | | 209,808 | |
| | | | | | | | |
| | |
| | | | | | | 2,617,003 | |
|
| Commercial Services & Supplies — 1.4% | |
Brink’s Co. | | | 2,444 | | | | 163,259 | |
Clean Harbors, Inc.(a) | | | 2,647 | | | | 377,357 | |
MSA Safety, Inc. | | | 1,940 | | | | 258,990 | |
Stericycle, Inc.(a) | | | 4,848 | | | | 211,421 | |
Tetra Tech, Inc. | | | 2,801 | | | | 411,495 | |
| | | | | | | | |
| | |
| | | | | | | 1,422,522 | |
|
| Communications Equipment — 0.8% | |
Calix, Inc.(a) | | | 2,997 | | | | 160,609 | |
Ciena Corp.(a) | | | 7,811 | | | | 410,234 | |
Lumentum Holdings, Inc.(a) | | | 3,606 | | | | 194,760 | |
| | | | | | | | |
| | |
| | | | | | | 765,603 | |
|
| Construction & Engineering — 2.0% | |
AECOM | | | 7,314 | | | | 616,716 | |
EMCOR Group, Inc. | | | 2,508 | | | | 407,776 | |
| | |
SCHEDULES OF INVESTMENTS | | 19 |
| | |
Schedule of Investments (continued) March 31, 2023 | | iShares® ESG Screened S&P Mid-Cap ETF (Percentages shown are based on Net Assets) |
| | | | | | | | |
| Security | | Shares | | | Value | |
|
| Construction & Engineering (continued) | |
MasTec, Inc.(a) | | | 3,122 | | | $ | 294,842 | |
MDU Resources Group, Inc. | | | 10,721 | | | | 326,776 | |
Valmont Industries, Inc. | | | 1,121 | | | | 357,913 | |
| | | | | | | | |
| | |
| | | | | | | 2,004,023 | |
| | |
| Construction Materials — 0.3% | | | | | | |
Eagle Materials, Inc. | | | 1,897 | | | | 278,385 | |
| | | | | | | | |
| | |
| Consumer Finance — 0.2% | | | | | | |
Navient Corp. | | | 5,336 | | | | 85,323 | |
SLM Corp. | | | 12,683 | | | | 157,142 | |
| | | | | | | | |
| | |
| | | | | | | 242,465 | |
| | |
| Consumer Staples Distribution & Retail — 0.8% | | | | | | |
BJ’s Wholesale Club Holdings, Inc.(a) | | | 7,076 | | | | 538,271 | |
Grocery Outlet Holding Corp.(a)(b) | | | 4,659 | | | | 131,664 | |
Sprouts Farmers Market, Inc.(a) | | | 5,566 | | | | 194,977 | |
| | | | | | | | |
| | |
| | | | | | | 864,912 | |
| | |
| Containers & Packaging — 1.0% | | | | | | |
AptarGroup, Inc. | | | 3,437 | | | | 406,219 | |
Greif, Inc., Class A, NVS | | | 1,346 | | | | 85,296 | |
Silgan Holdings, Inc. | | | 4,422 | | | | 237,329 | |
Sonoco Products Co. | | | 5,132 | | | | 313,052 | |
| | | | | | | | |
| | |
| | | | | | | 1,041,896 | |
| | |
| Diversified Consumer Services — 1.1% | | | | | | |
Graham Holdings Co., Class B | | | 204 | | | | 121,551 | |
Grand Canyon Education, Inc.(a) | | | 1,614 | | | | 183,835 | |
H&R Block, Inc. | | | 8,014 | | | | 282,493 | |
Service Corp. International | | | 8,096 | | | | 556,843 | |
| | | | | | | | |
| | |
| | | | | | | 1,144,722 | |
|
| Diversified Telecommunication Services — 0.7% | |
Frontier Communications Parent, Inc.(a) | | | 11,762 | | | | 267,821 | |
Iridium Communications, Inc. | | | 6,613 | | | | 409,543 | |
| | | | | | | | |
| | |
| | | | | | | 677,364 | |
| | |
| Electric Utilities — 0.2% | | | | | | |
Hawaiian Electric Industries, Inc. | | | 5,789 | | | | 222,298 | |
| | | | | | | | |
| | |
| Electrical Equipment — 2.3% | | | | | | |
Acuity Brands, Inc. | | | 1,691 | | | | 308,996 | |
EnerSys | | | 2,158 | | | | 187,487 | |
Hubbell, Inc. | | | 2,821 | | | | 686,378 | |
nVent Electric PLC | | | 8,768 | | | | 376,498 | |
Regal Rexnord Corp. | | | 3,482 | | | | 490,022 | |
SunPower Corp.(a)(b) | | | 4,508 | | | | 62,391 | |
Sunrun, Inc.(a)(b) | | | 11,216 | | | | 226,002 | |
Vicor Corp.(a) | | | 1,172 | | | | 55,014 | |
| | | | | | | | |
| | |
| | | | | | | 2,392,788 | |
|
| Electronic Equipment, Instruments & Components — 3.9% | |
Arrow Electronics, Inc.(a) | | | 3,068 | | | | 383,101 | |
Avnet, Inc. | | | 4,809 | | | | 217,367 | |
Belden, Inc. | | | 2,260 | | | | 196,100 | |
Cognex Corp. | | | 9,102 | | | | 451,004 | |
Coherent Corp.(a)(b) | | | 7,313 | | | | 278,479 | |
IPG Photonics Corp.(a) | | | 1,693 | | | | 208,764 | |
Jabil, Inc.(b) | | | 7,015 | | | | 618,443 | |
Littelfuse, Inc. | | | 1,302 | | | | 349,053 | |
National Instruments Corp. | | | 6,872 | | | | 360,162 | |
Novanta, Inc.(a)(b) | | | 1,879 | | | | 298,930 | |
TD SYNNEX Corp. | | | 2,208 | | | | 213,712 | |
Vishay Intertechnology, Inc. | | | 6,818 | | | | 154,223 | |
Vontier Corp. | | | 8,353 | | | | 228,371 | |
| | | | | | | | |
| | |
| | | | | | | 3,957,709 | |
| | | | | | | | |
| Security | | Shares | | | Value | |
|
| Energy Equipment & Services — 0.7% | |
ChampionX Corp. | | | 10,479 | | | $ | 284,295 | |
NOV, Inc. | | | 20,674 | | | | 382,676 | |
| | | | | | | | |
| | |
| | | | | | | 666,971 | |
| | |
| Entertainment — 0.2% | | | | | | |
World Wrestling Entertainment, Inc., Class A | | | 2,282 | | | | 208,255 | |
| | | | | | | | |
| | |
| Financial Services — 1.7% | | | | | | |
Essent Group Ltd. | | | 5,696 | | | | 228,125 | |
Euronet Worldwide, Inc.(a) | | | 2,480 | | | | 277,512 | |
MGIC Investment Corp. | | | 15,960 | | | | 214,183 | |
Voya Financial, Inc. | | | 5,106 | | | | 364,875 | |
Western Union Co. | | | 17,972 | | | | 200,388 | |
WEX, Inc.(a) | | | 2,296 | | | | 422,211 | |
| | | | | | | | |
| | |
| | | | | | | 1,707,294 | |
| | |
| Food Products — 1.6% | | | | | | |
Darling Ingredients, Inc.(a)(b) | | | 8,435 | | | | 492,604 | |
Flowers Foods, Inc. | | | 10,112 | | | | 277,170 | |
Ingredion, Inc. | | | 3,457 | | | | 351,681 | |
Lancaster Colony Corp. | | | 1,048 | | | | 212,618 | |
Pilgrim’s Pride Corp.(a) | | | 2,394 | | | | 55,493 | |
Post Holdings, Inc.(a) | | | 2,822 | | | | 253,613 | |
| | | | | | | | |
| | |
| | | | | | | 1,643,179 | |
| | |
| Gas Utilities — 1.3% | | | | | | |
New Jersey Resources Corp. | | | 5,100 | | | | 271,320 | |
ONE Gas, Inc. | | | 2,853 | | | | 226,043 | |
Southwest Gas Holdings, Inc. | | | 3,421 | | | | 213,642 | |
Spire, Inc. | | | 2,766 | | | | 194,007 | |
UGI Corp. | | | 11,030 | | | | 383,403 | |
| | | | | | | | |
| | |
| | | | | | | 1,288,415 | |
| | |
| Ground Transportation — 2.0% | | | | | | |
Avis Budget Group, Inc.(a) | | | 1,316 | | | | 256,357 | |
Knight-Swift Transportation Holdings, Inc. | | | 8,458 | | | | 478,554 | |
Landstar System, Inc. | | | 1,890 | | | | 338,801 | |
Ryder System, Inc. | | | 2,654 | | | | 236,843 | |
Saia, Inc.(a) | | | 1,393 | | | | 379,007 | |
Werner Enterprises, Inc. | | | 3,094 | | | | 140,746 | |
XPO, Inc.(a) | | | 6,042 | | | | 192,740 | |
| | | | | | | | |
| | |
| | | | | | | 2,023,048 | |
| | |
| Health Care Equipment & Supplies — 4.0% | | | | | | |
Enovis Corp.(a) | | | 2,508 | | | | 134,153 | |
Envista Holdings Corp.(a) | | | 8,590 | | | | 351,159 | |
Globus Medical, Inc., Class A(a) | | | 4,103 | | | | 232,394 | |
Haemonetics Corp.(a) | | | 2,655 | | | | 219,701 | |
ICU Medical, Inc.(a) | | | 1,057 | | | | 174,363 | |
Inari Medical, Inc.(a)(b) | | | 2,541 | | | | 156,881 | |
Integra LifeSciences Holdings Corp.(a) | | | 3,824 | | | | 219,536 | |
Lantheus Holdings, Inc.(a) | | | 3,628 | | | | 299,528 | |
LivaNova PLC(a) | | | 2,817 | | | | 122,765 | |
Masimo Corp.(a) | | | 2,545 | | | | 469,654 | |
Neogen Corp.(a) | | | 11,443 | | | | 211,924 | |
Omnicell, Inc.(a) | | | 2,358 | | | | 138,344 | |
Penumbra, Inc.(a) | | | 2,000 | | | | 557,380 | |
QuidelOrtho Corp.(a) | | | 2,826 | | | | 251,768 | |
Shockwave Medical, Inc.(a) | | | 1,902 | | | | 412,411 | |
STAAR Surgical Co.(a) | | | 2,536 | | | | 162,177 | |
| | | | | | | | |
| | |
| | | | | | | 4,114,138 | |
| | |
| Health Care Providers & Services — 2.4% | | | | | | |
Acadia Healthcare Co., Inc.(a) | | | 4,788 | | | | 345,933 | |
Amedisys, Inc.(a) | | | 1,722 | | | | 126,653 | |
Chemed Corp. | | | 783 | | | | 421,059 | |
| | |
| 20 | | 2 0 2 3 I SHARES ANNUAL REPORT TO SHAREHOLDERS |
| | |
Schedule of Investments (continued) March 31, 2023 | | iShares® ESG Screened S&P Mid-Cap ETF (Percentages shown are based on Net Assets) |
| | | | | | | | |
| Security | | Shares | | | Value | |
|
| Health Care Providers & Services (continued) | |
Encompass Health Corp. | | | 5,257 | | | $ | 284,404 | |
HealthEquity, Inc.(a) | | | 4,462 | | | | 261,964 | |
Option Care Health, Inc.(a) | | | 8,808 | | | | 279,830 | |
Patterson Cos., Inc. | | | 4,574 | | | | 122,446 | |
Progyny, Inc.(a) | | | 3,959 | | | | 127,163 | |
R1 RCM, Inc.(a) | | | 7,233 | | | | 108,495 | |
Tenet Healthcare Corp.(a) | | | 5,691 | | | | 338,159 | |
| | | | | | | | |
| | |
| | | | | | | 2,416,106 | |
| | |
| Health Care REITs — 1.3% | | | | | | |
Healthcare Realty Trust, Inc. | | | 20,030 | | | | 387,180 | |
Medical Properties Trust, Inc. | | | 31,560 | | | | 259,423 | |
Omega Healthcare Investors, Inc. | | | 12,330 | | | | 337,965 | |
Physicians Realty Trust | | | 12,058 | | | | 180,026 | |
Sabra Health Care REIT, Inc. | | | 12,156 | | | | 139,794 | |
| | | | | | | | |
| | |
| | | | | | | 1,304,388 | |
| | |
| Hotel & Resort REITs — 0.1% | | | | | | |
Park Hotels & Resorts, Inc. | | | 11,910 | | | | 147,208 | |
| | | | | | | | |
| | |
| Hotels, Restaurants & Leisure — 3.1% | | | | | | |
Boyd Gaming Corp. | | | 4,175 | | | | 267,701 | |
Choice Hotels International, Inc. | | | 1,458 | | | | 170,863 | |
Churchill Downs, Inc. | | | 1,732 | | | | 445,211 | |
Light & Wonder, Inc., Class A(a) | | | 4,928 | | | | 295,926 | |
Marriott Vacations Worldwide Corp. | | | 2,016 | | | | 271,878 | |
Papa John’s International, Inc. | | | 1,693 | | | | 126,856 | |
Penn Entertainment, Inc.(a) | | | 8,190 | | | | 242,915 | |
Texas Roadhouse, Inc. | | | 3,522 | | | | 380,587 | |
Travel + Leisure Co. | | | 4,272 | | | | 167,462 | |
Wendy’s Co. | | | 8,969 | | | | 195,345 | |
Wingstop, Inc. | | | 1,575 | | | | 289,139 | |
Wyndham Hotels & Resorts, Inc. | | | 4,656 | | | | 315,910 | |
| | | | | | | | |
| | |
| | | | | | | 3,169,793 | |
| | |
| Household Durables — 1.7% | | | | | | |
Helen of Troy Ltd.(a) | | | 1,268 | | | | 120,676 | |
KB Home | | | 4,296 | | | | 172,613 | |
Leggett & Platt, Inc. | | | 7,009 | | | | 223,447 | |
Taylor Morrison Home Corp., Class A(a) | | | 5,702 | | | | 218,159 | |
Tempur Sealy International, Inc. | | | 8,984 | | | | 354,778 | |
Toll Brothers, Inc. | | | 5,412 | | | | 324,882 | |
TopBuild Corp.(a) | | | 1,681 | | | | 349,883 | |
| | | | | | | | |
| | |
| | | | | | | 1,764,438 | |
| | |
| Household Products — 0.1% | | | | | | |
Energizer Holdings, Inc. | | | 3,496 | | | | 121,311 | |
| | | | | | | | |
|
| Independent Power and Renewable Electricity Producers — 0.2% | |
Ormat Technologies, Inc. | | | 2,763 | | | | 234,220 | |
| | | | | | | | |
| | |
| Industrial REITs — 1.3% | | | | | | |
EastGroup Properties, Inc. | | | 2,294 | | | | 379,244 | |
First Industrial Realty Trust, Inc. | | | 6,955 | | | | 370,006 | |
Rexford Industrial Realty, Inc. | | | 9,954 | | | | 593,756 | |
| | | | | | | | |
| | |
| | | | | | | 1,343,006 | |
| | |
| Insurance — 4.3% | | | | | | |
American Financial Group, Inc. | | | 3,738 | | | | 454,167 | |
Brighthouse Financial, Inc.(a) | | | 3,593 | | | | 158,487 | |
CNO Financial Group, Inc. | | | 6,041 | | | | 134,050 | |
First American Financial Corp. | | | 5,451 | | | | 303,403 | |
Hanover Insurance Group, Inc. | | | 1,881 | | | | 241,708 | |
Kemper Corp. | | | 3,362 | | | | 183,767 | |
Kinsale Capital Group, Inc. | | | 1,142 | | | | 342,771 | |
Old Republic International Corp. | | | 14,518 | | | | 362,514 | |
Primerica, Inc. | | | 1,942 | | | | 334,490 | |
| | | | | | | | |
| Security | | Shares | | | Value | |
|
| Insurance (continued) | |
Reinsurance Group of America, Inc. | | | 3,510 | | | $ | 465,988 | |
RenaissanceRe Holdings Ltd. | | | 2,302 | | | | 461,183 | |
RLI Corp.(b) | | | 2,130 | | | | 283,098 | |
Selective Insurance Group, Inc. | | | 3,176 | | | | 302,768 | |
Unum Group | | | 9,842 | | | | 389,350 | |
| | | | | | | | |
| | |
| | | | | | | 4,417,744 | |
| | |
| Interactive Media & Services — 0.3% | | | | | | |
TripAdvisor, Inc.(a) | | | 5,543 | | | | 110,084 | |
Ziff Davis, Inc.(a) | | | 2,484 | | | | 193,876 | |
| | | | | | | | |
| | |
| | | | | | | 303,960 | |
| | |
| IT Services — 0.2% | | | | | | |
Kyndryl Holdings, Inc.(a) | | | 10,776 | | | | 159,054 | |
| | | | | | | | |
| | |
| Leisure Products — 1.0% | | | | | | |
Brunswick Corp. | | | 3,823 | | | | 313,486 | |
Polaris, Inc. | | | 2,867 | | | | 317,176 | |
Topgolf Callaway Brands Corp.(a) | | | 7,337 | | | | 158,626 | |
YETI Holdings, Inc.(a) | | | 4,557 | | | | 182,280 | |
| | | | | | | | |
| | |
| | | | | | | 971,568 | |
| | |
| Life Sciences Tools & Services — 1.5% | | | | | | |
Azenta, Inc.(a) | | | 3,637 | | | | 162,283 | |
Bruker Corp. | | | 5,264 | | | | 415,014 | |
Medpace Holdings, Inc.(a) | | | 1,333 | | | | 250,670 | |
Repligen Corp.(a) | | | 2,719 | | | | 457,771 | |
Syneos Health, Inc.(a) | | | 5,416 | | | | 192,918 | |
| | | | | | | | |
| | |
| | | | | | | 1,478,656 | |
| | |
| Machinery — 5.3% | | | | | | |
AGCO Corp. | | | 3,259 | | | | 440,617 | |
Chart Industries, Inc.(a) | | | 2,243 | | | | 281,272 | |
Crane NXT Co. | | | 2,516 | | | | 285,566 | |
Donaldson Co., Inc. | | | 6,405 | | | | 418,503 | |
Esab Corp. | | | 2,719 | | | | 160,611 | |
Flowserve Corp. | | | 6,913 | | | | 235,042 | |
Graco, Inc. | | | 8,870 | | | | 647,599 | |
ITT, Inc. | | | 4,352 | | | | 375,578 | |
Lincoln Electric Holdings, Inc. | | | 3,038 | | | | 513,726 | |
Middleby Corp.(a) | | | 2,837 | | | | 415,933 | |
Oshkosh Corp. | | | 3,442 | | | | 286,306 | |
Terex Corp. | | | 3,566 | | | | 172,523 | |
Timken Co. | | | 3,484 | | | | 284,712 | |
Toro Co. | | | 5,509 | | | | 612,380 | |
Watts Water Technologies, Inc., Class A | | | 1,439 | | | | 242,212 | |
| | | | | | | | |
| | |
| | | | | | | 5,372,580 | |
| | |
| Marine Transportation — 0.2% | | | | | | |
Kirby Corp.(a) | | | 3,157 | | | | 220,043 | |
| | | | | | | | |
| | |
| Media — 1.1% | | | | | | |
Cable One, Inc. | | | 254 | | | | 178,308 | |
John Wiley & Sons, Inc., Class A | | | 2,252 | | | | 87,310 | |
New York Times Co., Class A | | | 8,666 | | | | 336,934 | |
Nexstar Media Group, Inc., Class A | | | 1,985 | | | | 342,730 | |
TEGNA, Inc. | | | 11,737 | | | | 198,473 | |
| | | | | | | | |
| | |
| | | | | | | 1,143,755 | |
| | |
| Metals & Mining — 2.9% | | | | | | |
Alcoa Corp. | | | 9,314 | | | | 396,404 | |
Cleveland-Cliffs, Inc.(a) | | | 27,122 | | | | 497,146 | |
Commercial Metals Co. | | | 6,171 | | | | 301,762 | |
MP Materials Corp., Class A(a) | | | 4,858 | | | | 136,947 | |
Reliance Steel & Aluminum Co. | | | 3,089 | | | | 793,070 | |
Royal Gold, Inc. | | | 3,454 | | | | 448,018 | |
| | |
SCHEDULES OF INVESTMENTS | | 21 |
| | |
Schedule of Investments (continued) March 31, 2023 | | iShares® ESG Screened S&P Mid-Cap ETF (Percentages shown are based on Net Assets) |
| | | | | | | | |
| Security | | Shares | | | Value | |
|
| Metals & Mining (continued) | |
United States Steel Corp. | | | 11,926 | | | $ | 311,269 | |
Worthington Industries, Inc. | | | 1,614 | | | | 104,345 | |
| | | | | | | | |
| | |
| | | | | | | 2,988,961 | |
|
| Mortgage Real Estate Investment Trusts (REITs) — 0.5% | |
Annaly Capital Management, Inc. | | | 24,649 | | | | 471,042 | |
| | | | | | | | |
|
| Office REITs — 0.8% | |
Corporate Office Properties Trust | | | 5,957 | | | | 141,240 | |
Cousins Properties, Inc. | | | 7,975 | | | | 170,505 | |
Douglas Emmett, Inc. | | | 9,251 | | | | 114,065 | |
Highwoods Properties, Inc. | | | 5,537 | | | | 128,403 | |
Kilroy Realty Corp. | | | 5,547 | | | | 179,723 | |
Vornado Realty Trust | | | 8,480 | | | | 130,338 | |
| | | | | | | | |
| | |
| | | | | | | 864,274 | |
|
| Oil, Gas & Consumable Fuels — 1.0% | |
DT Midstream, Inc. | | | 5,086 | | | | 251,096 | |
Equitrans Midstream Corp. | | | 22,776 | | | | 131,645 | |
HF Sinclair Corp. | | | 7,078 | | | | 342,434 | |
PBF Energy, Inc., Class A | | | 6,015 | | | | 260,810 | |
| | | | | | | | |
| | |
| | | | | | | 985,985 | |
|
| Paper & Forest Products — 0.2% | |
Louisiana-Pacific Corp. | | | 3,773 | | | | 204,534 | |
| | | | | | | | |
|
| Passenger Airlines — 0.1% | |
JetBlue Airways Corp.(a) | | | 17,045 | | | | 124,088 | |
| | | | | | | | |
|
| Personal Care Products — 0.5% | |
BellRing Brands, Inc.(a) | | | 7,038 | | | | 239,292 | |
Coty, Inc., Class A(a) | | | 19,316 | | | | 232,951 | |
| | | | | | | | |
| | |
| | | | | | | 472,243 | |
|
| Pharmaceuticals — 0.7% | |
Jazz Pharmaceuticals PLC(a) | | | 3,315 | | | | 485,084 | |
Perrigo Co. PLC | | | 7,086 | | | | 254,175 | |
| | | | | | | | |
| | |
| | | | | | | 739,259 | |
|
| Professional Services — 2.9% | |
ASGN, Inc.(a) | | | 2,640 | | | | 218,249 | |
Concentrix Corp. | | | 2,247 | | | | 273,123 | |
ExlService Holdings, Inc.(a) | | | 1,743 | | | | 282,070 | |
FTI Consulting, Inc.(a) | | | 1,812 | | | | 357,598 | |
Genpact Ltd. | | | 8,857 | | | | 409,370 | |
Insperity, Inc. | | | 1,880 | | | | 228,514 | |
KBR, Inc. | | | 7,221 | | | | 397,516 | |
ManpowerGroup, Inc. | | | 2,666 | �� | | | 220,025 | |
Maximus, Inc. | | | 3,204 | | | | 252,155 | |
Science Applications International Corp. | | | 2,875 | | | | 308,947 | |
| | | | | | | | |
| | |
| | | | | | | 2,947,567 | |
|
| Real Estate Management & Development — 0.4% | |
Jones Lang LaSalle, Inc.(a)(b) | | | 2,498 | | | | 363,434 | |
| | | | | | | | |
|
| Residential REITs — 0.5% | |
Apartment Income REIT Corp. | | | 7,959 | | | | 285,012 | |
Independence Realty Trust, Inc. | | | 11,781 | | | | 188,849 | |
| | | | | | | | |
| | |
| | | | | | | 473,861 | |
|
| Retail REITs — 1.7% | |
Agree Realty Corp. | | | 4,662 | | | | 319,860 | |
Brixmor Property Group, Inc. | | | 15,785 | | | | 339,693 | |
Kite Realty Group Trust | | | 11,576 | | | | 242,170 | |
Macerich Co. | | | 11,555 | | | | 122,483 | |
National Retail Properties, Inc. | | | 9,551 | | | | 421,677 | |
Spirit Realty Capital, Inc. | | | 7,350 | | | | 292,824 | |
| | | | | | | | |
| | |
| | | | | | | 1,738,707 | |
| | | | | | | | |
| Security | | Shares | | | Value | |
|
| Semiconductors & Semiconductor Equipment — 3.4% | |
Allegro MicroSystems, Inc.(a) | | | 3,427 | | | $ | 164,462 | |
Amkor Technology, Inc. | | | 5,286 | | | | 137,542 | |
Cirrus Logic, Inc.(a) | | | 2,908 | | | | 318,077 | |
Lattice Semiconductor Corp.(a) | | | 7,214 | | | | 688,937 | |
MACOM Technology Solutions Holdings, Inc.(a) | | | 2,718 | | | | 192,543 | |
MKS Instruments, Inc. | | | 3,011 | | | | 266,835 | |
Power Integrations, Inc. | | | 3,000 | | | | 253,920 | |
Silicon Laboratories, Inc.(a) | | | 1,679 | | | | 293,976 | |
SiTime Corp.(a) | | | 847 | | | | 120,469 | |
Synaptics, Inc.(a) | | | 2,073 | | | | 230,414 | |
Universal Display Corp. | | | 2,288 | | | | 354,937 | |
Wolfspeed, Inc.(a) | | | 6,548 | | | | 425,292 | |
| | | | | | | | |
| | |
| | | | | | | 3,447,404 | |
|
| Software — 2.9% | |
ACI Worldwide, Inc.(a) | | | 5,934 | | | | 160,099 | |
Aspen Technology, Inc.(a) | | | 1,533 | | | | 350,858 | |
Blackbaud, Inc.(a) | | | 2,370 | | | | 164,241 | |
CommVault Systems, Inc.(a) | | | 2,344 | | | | 132,998 | |
Dynatrace, Inc.(a) | | | 11,410 | | | | 482,643 | |
Envestnet, Inc.(a) | | | 2,506 | | | | 147,027 | |
Manhattan Associates, Inc.(a) | | | 3,289 | | | | 509,302 | |
NCR Corp.(a) | | | 7,322 | | | | 172,726 | |
Paylocity Holding Corp.(a) | | | 2,181 | | | | 433,539 | |
Qualys, Inc.(a) | | | 1,831 | | | | 238,067 | |
Teradata Corp.(a) | | | 5,378 | | | | 216,626 | |
| | | | | | | | |
| | |
| | | | | | | 3,008,126 | |
|
| Specialized REITs — 2.3% | |
CubeSmart | | | 11,820 | | | | 546,320 | |
EPR Properties | | | 3,974 | | | | 151,409 | |
Lamar Advertising Co., Class A | | | 4,592 | | | | 458,695 | |
Life Storage, Inc. | | | 4,473 | | | | 586,366 | |
National Storage Affiliates Trust | | | 4,440 | | | | 185,503 | |
PotlatchDeltic Corp. | | | 4,252 | | | | 210,474 | |
Rayonier, Inc. | | | 7,761 | | | | 258,131 | |
| | | | | | | | |
| | |
| | | | | | | 2,396,898 | |
|
| Specialty Retail — 2.8% | |
AutoNation, Inc.(a) | | | 1,803 | | | | 242,251 | |
Five Below, Inc.(a) | | | 2,921 | | | | 601,638 | |
Foot Locker, Inc. | | | 4,169 | | | | 165,468 | |
GameStop Corp., Class A(a)(b) | | | 13,339 | | | | 307,064 | |
Gap, Inc. | | | 11,211 | | | | 112,558 | |
Lithia Motors, Inc., Class A | | | 1,439 | | | | 329,430 | |
Murphy U.S.A., Inc. | | | 1,052 | | | | 271,469 | |
RH(a) | | | 984 | | | | 239,653 | |
Victoria’s Secret & Co.(a) | | | 4,272 | | | | 145,889 | |
Williams-Sonoma, Inc. | | | 3,504 | | | | 426,297 | |
| | | | | | | | |
| | |
| | | | | | | 2,841,717 | |
|
| Technology Hardware, Storage & Peripherals — 0.3% | |
Super Micro Computer, Inc.(a) | | | 2,456 | | | | 261,687 | |
Xerox Holdings Corp. | | | 5,948 | | | | 91,599 | |
| | | | | | | | |
| | |
| | | | | | | 353,286 | |
|
| Textiles, Apparel & Luxury Goods — 2.4% | |
Capri Holdings Ltd.(a) | | | 6,616 | | | | 310,952 | |
Carter’s, Inc. | | | 2,008 | | | | 144,415 | |
Columbia Sportswear Co. | | | 1,864 | | | | 168,207 | |
Crocs, Inc.(a) | | | 3,250 | | | | 410,930 | |
Deckers Outdoor Corp.(a) | | | 1,388 | | | | 623,976 | |
PVH Corp. | | | 3,335 | | | | 297,349 | |
Skechers U.S.A., Inc., Class A(a) | | | 7,064 | | | | 335,681 | |
| | |
| 22 | | 2 0 2 3 I SHARES ANNUAL REPORT TO SHAREHOLDERS |
| | |
Schedule of Investments (continued) March 31, 2023 | | iShares® ESG Screened S&P Mid-Cap ETF (Percentages shown are based on Net Assets) |
| | | | | | | | |
| Security | | Shares | | | Value | |
|
| Textiles, Apparel & Luxury Goods (continued) | |
Under Armour, Inc., Class A(a) | | | 9,906 | | | $ | 94,008 | |
Under Armour, Inc., Class C, NVS(a) | | | 9,976 | | | | 85,095 | |
| | | | | | | | |
| | |
| | | | | | | 2,470,613 | |
|
| Trading Companies & Distributors — 1.2% | |
GATX Corp. | | | 1,853 | | | | 203,867 | |
MSC Industrial Direct Co., Inc., Class A | | | 2,490 | | | | 209,160 | |
Univar Solutions, Inc.(a) | | | 8,588 | | | | 300,838 | |
Watsco, Inc. | | | 1,751 | | | | 557,098 | |
| | | | | | | | |
| | |
| | | | | | | 1,270,963 | |
|
| Water Utilities — 0.5% | |
Essential Utilities, Inc. | | | 12,563 | | | | 548,375 | |
| | | | | | | | |
| | |
Total Long-Term Investments — 99.7%
(Cost: $106,652,582) | | | | | | | 101,734,711 | |
| | | | | | | | |
| | |
Short-Term Securities | | | | | | | | |
| | |
| Money Market Funds — 3.3% | | | | | | |
BlackRock Cash Funds: Institutional, SL Agency Shares, 5.01%(c)(d)(e) | | | 3,257,274 | | | | 3,258,251 | |
BlackRock Cash Funds: Treasury, SL Agency Shares, 4.73%(c)(d) | | | 158,472 | | | | 158,472 | |
| | | | | | | | |
| | |
Total Short-Term Securities — 3.3%
(Cost: $3,416,150) | | | | | | | 3,416,723 | |
| | | | | | | | |
| | |
Total Investments — 103.0%
(Cost: $110,068,732) | | | | | | | 105,151,434 | |
| |
Liabilities in Excess of Other Assets — (3.0)% | | | | (3,105,416 | ) |
| | | | | | | | |
| | |
Net Assets — 100.0% | | | | | | $ | 102,046,018 | |
| | | | | | | | |
| (a) | Non-income producing security. |
| (b) | All or a portion of this security is on loan. |
| (c) | Affiliate of the Fund. |
| (d) | Annualized 7-day yield as of period end. |
| (e) | All or a portion of this security was purchased with the cash collateral from loaned securities. |
Affiliates
Investments in issuers considered to be affiliate(s) of the Fund during the year ended March 31, 2023 for purposes of Section 2(a)(3) of the Investment Company Act of 1940, as amended, were as follows:
| | | | | | | | | | | | | | | | | | | | | | | | | | | | | | | | | | | | |
| |
| | | | | | | | | |
| Affiliated Issuer | | Value at
03/31/22 | | | Purchases
at Cost | | | Proceeds
from Sale | | | Net
Realized
Gain (Loss) | | | Change in
Unrealized
Appreciation
(Depreciation) | | | Value at
03/31/23 | | | Shares
Held at
03/31/23 | | | Income | | | Capital
Gain
Distributions
from Underlying
Funds | |
| |
BlackRock Cash Funds: Institutional, SL Agency Shares | | $ | 815,271 | | | $ | 2,442,211 | (a) | | $ | — | | | $ | 307 | | | $ | 462 | | | $ | 3,258,251 | | | | 3,257,274 | | | $ | 36,649 | (b) | | $ | — | |
BlackRock Cash Funds: Treasury, SL Agency Shares | | | 90,000 | | | | 68,472 | (a) | | | — | | | | — | | | | — | | | | 158,472 | | | | 158,472 | | | | 5,533 | | | | — | |
| | | | | | | | | | | | | | | | | | | | | | | | | | | | | | | | | | | | |
| | | | | | | | | |
| | | | | | | | | | | | | | $ | 307 | | | $ | 462 | | | $ | 3,416,723 | | | | | | | $ | 42,182 | | | $ | — | |
| | | | | | | | | | | | | | | | | | | | | | | | | | | | | | | | | | | | |
| | (a) | Represents net amount purchased (sold). | |
| | (b) | All or a portion represents securities lending income earned from the reinvestment of cash collateral from loaned securities, net of fees and collateral investment expenses, and other payments to and from borrowers of securities. | |
| | |
SCHEDULES OF INVESTMENTS | | 23 |
| | |
Schedule of Investments (continued) March 31, 2023 | | iShares® ESG Screened S&P Mid-Cap ETF |
Derivative Financial Instruments Outstanding as of Period End
Futures Contracts
| | | | | | | | | | | | | | | | |
| |
| Description | | Number of
Contracts | | | Expiration
Date | | | Notional
Amount
(000) | | | Value/
Unrealized
Appreciation
(Depreciation) | |
| |
Long Contracts | | | | | | | | | | | | | | | | |
S&P MidCap 400 E-Mini Index | | | 1 | | | | 06/16/23 | | | $ | 253 | | | $ | 5,977 | |
| | | | | | | | | | | | | | | | |
Derivative Financial Instruments Categorized by Risk Exposure
As of period end, the fair values of derivative financial instruments located in the Statements of Assets and Liabilities were as follows:
| | | | | | | | | | | | | | | | | | | | | | | | | | | | |
| |
| | | Commodity
Contracts | | | Credit
Contracts | | | Equity
Contracts | | | Foreign
Currency
Exchange
Contracts | | | Interest
Rate
Contracts | | | Other
Contracts | | | Total | |
| |
Assets — Derivative Financial Instruments | | | | | | | | | | | | | | | | | | | | | | | | | | | | |
Futures contracts | | | | | | | | | | | | | | | | | | | | | | | | | | | | |
Unrealized appreciation on futures contracts | | $ | — | | | $ | — | | | $ | 5,977 | | | $ | — | | | $ | — | | | $ | — | | | $ | 5,977 | |
| | | | | | | | | | | | | | | | | | | | | | | | | | | | |
For the period ended March 31, 2023, the effect of derivative financial instruments in the Statements of Operations was as follows:
| | | | | | | | | | | | | | | | | | | | | | | | | | | | |
| |
| | | Commodity
Contracts | | | Credit
Contracts | | | Equity
Contracts | | | Foreign
Currency
Exchange
Contracts | | | Interest
Rate
Contracts | | | Other
Contracts | | | Total | |
| |
Net Realized Gain (Loss) from | | | | | | | | | | | | | | | | | | | | | | | | | | | | |
Futures contracts | | $ | — | | | $ | — | | | $ | (5,910 | ) | | $ | — | | | $ | — | | | $ | — | | | $ | (5,910 | ) |
| | | | | | | | | | | | | | | | | | | | | | | | | | | | |
Net Change in Unrealized Appreciation (Depreciation) on | | | | | | | | | | | | | | | | | | | | | | | | | | | | |
Futures contracts | | $ | — | | | $ | — | | | $ | 5,977 | | | $ | — | | | $ | — | | | $ | — | | | $ | 5,977 | |
| | | | | | | | | | | | | | | | | | | | | | | | | | | | |
Average Quarterly Balances of Outstanding Derivative Financial Instruments
| | | | |
| |
Futures contracts | | | | |
Average notional value of contracts — long | | $ | 124,308 | |
| |
For more information about the Fund’s investment risks regarding derivative financial instruments, refer to the Notes to Financial Statements.
| | |
| 24 | | 2 0 2 3 I SHARES ANNUAL REPORT TO SHAREHOLDERS |
| | |
Schedule of Investments (continued) March 31, 2023 | | iShares® ESG Screened S&P Mid-Cap ETF |
Fair Value Hierarchy as of Period End
Various inputs are used in determining the fair value of financial instruments. For a description of the input levels and information about the Fund’s policy regarding valuation of financial instruments, refer to the Notes to Financial Statements.
The following table summarizes the Fund’s financial instruments categorized in the fair value hierarchy. The breakdown of the Fund’s financial instruments into major categories is disclosed in the Schedule of Investments above.
| | | | | | | | | | | | | | | | |
| |
| | | Level 1 | | | Level 2 | | | Level 3 | | | Total | |
| |
Assets | | | | | | | | | | | | | | | | |
Investments | | | | | | | | | | | | | | | | |
Long-Term Investments | | | | | | | | | | | | | | | | |
Common Stocks | | $ | 101,734,711 | | | $ | — | | | $ | — | | | $ | 101,734,711 | |
Short-Term Securities | | | | | | | | | | | | | | | | |
Money Market Funds | | | 3,416,723 | | | | — | | | | — | | | | 3,416,723 | |
| | | | | | | | | | | | | | | | |
| | | | |
| | $ | 105,151,434 | | | $ | — | | | $ | — | | | $ | 105,151,434 | |
| | | | | | | | | | | | | | | | |
Derivative Financial Instruments(a) | | | | | | | | | | | | | | | | |
Assets | | | | | | | | | | | | | | | | |
Equity Contracts | | $ | 5,977 | | | $ | — | | | $ | — | | | $ | 5,977 | |
| | | | | | | | | | | | | | | | |
| (a) | Derivative financial instruments are futures contracts. Futures contracts are valued at the unrealized appreciation (depreciation) on the instrument. | |
See notes to financial statements.
| | |
SCHEDULES OF INVESTMENTS | | 25 |
| | |
Schedule of Investments March 31, 2023 | | iShares® ESG Screened S&P Small-Cap ETF (Percentages shown are based on Net Assets) |
| | | | | | | | |
| Security | | Shares | | | Value | |
|
Common Stocks | |
|
| Aerospace & Defense — 0.7% | |
AAR Corp.(a) | | | 1,762 | | | $ | 96,117 | |
AeroVironment, Inc.(a) | | | 1,349 | | | | 123,649 | |
Kaman Corp. | | | 1,511 | | | | 34,542 | |
National Presto Industries, Inc. | | | 269 | | | | 19,392 | |
Triumph Group, Inc.(a) | | | 3,493 | | | | 40,484 | |
| | | | | | | | |
| | |
| | | | | | | 314,184 | |
|
| Air Freight & Logistics — 0.7% | |
Forward Air Corp. | | | 1,427 | | | | 153,773 | |
Hub Group, Inc., Class A(a) | | | 1,752 | | | | 147,063 | |
| | | | | | | | |
| | |
| | | | | | | 300,836 | |
|
| Automobile Components — 1.4% | |
American Axle & Manufacturing Holdings, Inc.(a) | | | 6,118 | | | | 47,782 | |
Dorman Products, Inc.(a) | | | 1,517 | | | | 130,856 | |
Gentherm, Inc.(a) | | | 1,780 | | | | 107,548 | |
LCI Industries | | | 1,366 | | | | 150,082 | |
Patrick Industries, Inc. | | | 1,155 | | | | 79,476 | |
Standard Motor Products, Inc. | | | 1,010 | | | | 37,279 | |
XPEL, Inc.(a) | | | 1,054 | | | | 71,619 | |
| | | | | | | | |
| | |
| | | | | | | 624,642 | |
|
| Automobiles — 0.2% | |
Winnebago Industries, Inc. | | | 1,648 | | | | 95,090 | |
| | | | | | | | |
|
| Banks — 8.4% | |
Ameris Bancorp | | | 3,364 | | | | 123,055 | |
Axos Financial, Inc.(a) | | | 2,646 | | | | 97,690 | |
Banc of California, Inc. | | | 2,374 | | | | 29,746 | |
BancFirst Corp. | | | 936 | | | | 77,782 | |
Bancorp, Inc.(a) | | | 2,385 | | | | 66,422 | |
BankUnited, Inc. | | | 3,179 | | | | 71,782 | |
Banner Corp. | | | 1,588 | | | | 86,340 | |
Berkshire Hills Bancorp, Inc. | | | 1,691 | | | | 42,376 | |
Brookline Bancorp, Inc. | | | 3,883 | | | | 40,771 | |
Capitol Federal Financial, Inc. | | | 5,491 | | | | 36,954 | |
Central Pacific Financial Corp. | | | 540 | | | | 9,666 | |
City Holding Co. | | | 737 | | | | 66,979 | |
Community Bank System, Inc. | | | 2,280 | | | | 119,677 | |
Customers Bancorp, Inc.(a) | | | 1,411 | | | | 26,132 | |
CVB Financial Corp. | | | 6,310 | | | | 105,251 | |
Dime Community Bancshares, Inc. | | | 1,749 | | | | 39,737 | |
Eagle Bancorp, Inc. | | | 1,360 | | | | 45,519 | |
FB Financial Corp. | | | 1,882 | | | | 58,493 | |
First BanCorp/Puerto Rico | | | 6,375 | | | | 72,802 | |
First Bancorp/Southern Pines NC | | | 1,992 | | | | 70,756 | |
First Commonwealth Financial Corp. | | | 5,073 | | | | 63,057 | |
First Financial Bancorp | | | 4,426 | | | | 96,354 | |
First Hawaiian, Inc. | | | 6,838 | | | | 141,068 | |
Hanmi Financial Corp. | | | 1,354 | | | | 25,144 | |
Heritage Financial Corp. | | | 1,615 | | | | 34,561 | |
Hilltop Holdings, Inc. | | | 2,465 | | | | 73,137 | |
HomeStreet, Inc. | | | 766 | | | | 13,780 | |
Hope Bancorp, Inc. | | | 5,805 | | | | 57,005 | |
Independent Bank Corp. | | | 1,185 | | | | 77,760 | |
Independent Bank Group, Inc. | | | 1,906 | | | | 88,343 | |
Lakeland Financial Corp. | | | 1,308 | | | | 81,933 | |
National Bank Holdings Corp., Class A | | | 1,923 | | | | 64,344 | |
NBT Bancorp, Inc. | | | 1,962 | | | | 66,139 | |
Northfield Bancorp, Inc. | | | 1,784 | | | | 21,016 | |
Northwest Bancshares, Inc. | | | 5,784 | | | | 69,582 | |
OFG Bancorp | | | 2,331 | | | | 58,135 | |
Pacific Premier Bancorp, Inc. | | | 4,032 | | | | 96,849 | |
| | | | | | | | |
| Security | | Shares | | | Value | |
|
| Banks (continued) | |
Park National Corp. | | | 779 | | | $ | 92,366 | |
Pathward Financial, Inc. | | | 1,124 | | | | 46,635 | |
Preferred Bank | | | 107 | | | | 5,865 | |
Provident Financial Services, Inc. | | | 3,208 | | | | 61,529 | |
Renasant Corp. | | | 2,374 | | | | 72,597 | |
S&T Bancorp, Inc. | | | 1,959 | | | | 61,611 | |
Seacoast Banking Corp. of Florida | | | 3,945 | | | | 93,496 | |
ServisFirst Bancshares, Inc. | | | 2,624 | | | | 143,349 | |
Simmons First National Corp., Class A | | | 3,595 | | | | 62,877 | |
Southside Bancshares, Inc. | | | 1,296 | | | | 43,027 | |
Stellar Bancorp, Inc. | | | 2,423 | | | | 59,630 | |
Tompkins Financial Corp. | | | 672 | | | | 44,493 | |
Triumph Financial, Inc.(a) | | | 1,114 | | | | 64,679 | |
TrustCo Bank Corp. | | | 915 | | | | 29,225 | |
Trustmark Corp. | | | 2,873 | | | | 70,963 | |
United Community Banks, Inc. | | | 5,262 | | | | 147,967 | |
Veritex Holdings, Inc. | | | 2,103 | | | | 38,401 | |
Westamerica Bancorp | | | 1,367 | | | | 60,558 | |
WSFS Financial Corp. | | | 1,754 | | | | 65,968 | |
| | | | | | | | |
| | |
| | | | | | | 3,681,373 | |
|
| Beverages — 0.3% | |
MGP Ingredients, Inc. | | | 826 | | | | 79,891 | |
National Beverage Corp.(a) | | | 1,254 | | | | 66,111 | |
| | | | | | | | |
| | |
| | | | | | | 146,002 | |
|
| Biotechnology — 2.6% | |
Anika Therapeutics, Inc.(a) | | | 785 | | | | 22,545 | |
Arcus Biosciences, Inc.(a) | | | 2,785 | | | | 50,798 | |
Avid Bioservices, Inc.(a) | | | 3,333 | | | | 62,527 | |
Catalyst Pharmaceuticals, Inc.(a) | | | 5,147 | | | | 85,337 | |
Coherus Biosciences, Inc.(a) | | | 3,447 | | | | 23,578 | |
Cytokinetics, Inc.(a) | | | 5,080 | | | | 178,765 | |
Dynavax Technologies Corp.(a) | | | 6,375 | | | | 62,539 | |
Eagle Pharmaceuticals, Inc.(a) | | | 563 | | | | 15,972 | |
Emergent BioSolutions, Inc.(a)(b) | | | 2,406 | | | | 24,926 | |
Enanta Pharmaceuticals, Inc.(a) | | | 1,051 | | | | 42,503 | |
Ironwood Pharmaceuticals, Inc., Class A(a) | | | 7,160 | | | | 75,323 | |
iTeos Therapeutics, Inc.(a) | | | 1,309 | | | | 17,816 | |
Myriad Genetics, Inc.(a) | | | 4,363 | | | | 101,353 | |
REGENXBIO, Inc.(a) | | | 2,023 | | | | 38,255 | |
uniQure NV(a)(b) | | | 2,443 | | | | 49,202 | |
Vanda Pharmaceuticals, Inc.(a) | | | 3,039 | | | | 20,635 | |
Vericel Corp.(a) | | | 2,532 | | | | 74,238 | |
Vir Biotechnology, Inc.(a) | | | 4,074 | | | | 94,802 | |
Xencor, Inc.(a) | | | 3,233 | | | | 90,168 | |
| | | | | | | | |
| | |
| | | | | | | 1,131,282 | |
|
| Broadline Retail — 0.0% | |
Big Lots, Inc. | | | 1,545 | | | | 16,933 | |
| | | | | | | | |
|
| Building Products — 1.9% | |
AAON, Inc. | | | 2,257 | | | | 218,229 | |
American Woodmark Corp.(a) | | | 892 | | | | 46,446 | |
Apogee Enterprises, Inc. | | | 1,188 | | | | 51,381 | |
AZZ, Inc. | | | 1,341 | | | | 55,303 | |
Gibraltar Industries, Inc.(a) | | | 1,660 | | | | 80,510 | |
Griffon Corp. | | | 2,546 | | | | 81,498 | |
Insteel Industries, Inc. | | | 1,052 | | | | 29,267 | |
PGT Innovations, Inc.(a) | | | 3,220 | | | | 80,854 | |
Quanex Building Products Corp. | | | 1,778 | | | | 38,280 | |
Resideo Technologies, Inc.(a) | | | 7,828 | | | | 143,096 | |
| | | | | | | | |
| | |
| | | | | | | 824,864 | |
| | |
| 26 | | 2 0 2 3 I SHARES ANNUAL REPORT TO SHAREHOLDERS |
| | |
Schedule of Investments (continued) March 31, 2023 | | iShares® ESG Screened S&P Small-Cap ETF (Percentages shown are based on Net Assets) |
| | | | | | | | |
| Security | | Shares | | | Value | |
|
| Capital Markets — 1.1% | |
Avantax, Inc.(a) | | | 2,131 | | | $ | 56,088 | |
B Riley Financial, Inc. | | | 863 | | | | 24,501 | |
Brightsphere Investment Group, Inc. | | | 1,737 | | | | 40,958 | |
Donnelley Financial Solutions, Inc.(a) | | | 1,339 | | | | 54,712 | |
Piper Sandler Cos. | | | 739 | | | | 102,433 | |
StoneX Group, Inc.(a) | | | 947 | | | | 98,043 | |
Virtus Investment Partners, Inc. | | | 352 | | | | 67,017 | |
WisdomTree, Inc. | | | 5,485 | | | | 32,142 | |
| | | | | | | | |
| | |
| | | | | | | 475,894 | |
| | |
| Chemicals — 3.1% | | | | | | |
AdvanSix, Inc. | | | 1,485 | | | | 56,831 | |
American Vanguard Corp. | | | 1,486 | | | | 32,514 | |
Balchem Corp. | | | 1,725 | | | | 218,178 | |
FutureFuel Corp. | | | 1,404 | | | | 10,362 | |
Hawkins, Inc. | | | 1,018 | | | | 44,568 | |
HB Fuller Co. | | | 2,884 | | | | 197,410 | |
Innospec, Inc. | | | 1,328 | | | | 136,346 | |
Koppers Holdings, Inc. | | | 1,125 | | | | 39,341 | |
Livent Corp.(a) | | | 9,630 | | | | 209,164 | |
Minerals Technologies, Inc. | | | 1,750 | | | | 105,735 | |
Quaker Chemical Corp. | | | 731 | | | | 144,701 | |
Rayonier Advanced Materials, Inc.(a) | | | 3,427 | | | | 21,487 | |
Stepan Co. | | | 1,132 | | | | 116,630 | |
Trinseo PLC | | | 1,871 | | | | 39,010 | |
| | | | | | | | |
| | |
| | | | | | | 1,372,277 | |
| | |
| Commercial Services & Supplies — 2.2% | | | | | | |
ABM Industries, Inc. | | | 3,548 | | | | 159,447 | |
Brady Corp., Class A, NVS | | | 2,479 | | | | 133,197 | |
Deluxe Corp. | | | 2,317 | | | | 37,072 | |
GEO Group, Inc.(a) | | | 6,683 | | | | 52,729 | |
Harsco Corp.(a) | | | 4,291 | | | | 29,308 | |
Healthcare Services Group, Inc. | | | 3,968 | | | | 55,036 | |
HNI Corp. | | | 2,225 | | | | 61,944 | |
Interface, Inc., Class A | | | 3,142 | | | | 25,513 | |
KAR Auction Services, Inc.(a) | | | 5,842 | | | | 79,919 | |
Liquidity Services, Inc.(a) | | | 1,279 | | | | 16,844 | |
Matthews International Corp., Class A | | | 1,638 | | | | 59,066 | |
MillerKnoll, Inc. | | | 4,052 | | | | 82,863 | |
Pitney Bowes, Inc. | | | 1,838 | | | | 7,150 | |
UniFirst Corp. | | | 810 | | | | 142,746 | |
Viad Corp.(a) | | | 1,121 | | | | 23,362 | |
| | | | | | | | |
| | |
| | | | | | | 966,196 | |
| | |
| Communications Equipment — 1.5% | | | | | | |
ADTRAN Holdings, Inc. | | | 3,800 | | | | 60,268 | |
Clearfield, Inc.(a)(b) | | | 674 | | | | 31,395 | |
Comtech Telecommunications Corp. | | | 1,484 | | | | 18,520 | |
Digi International, Inc.(a) | | | 1,920 | | | | 64,666 | |
Extreme Networks, Inc.(a) | | | 6,930 | | | | 132,501 | |
Harmonic, Inc.(a) | | | 5,895 | | | | 86,008 | |
NETGEAR, Inc.(a) | | | 1,564 | | | | 28,950 | |
NetScout Systems, Inc.(a) | | | 3,635 | | | | 104,143 | |
Viavi Solutions, Inc.(a) | | | 12,060 | | | | 130,610 | |
| | | | | | | | |
| | |
| | | | | | | 657,061 | |
| | |
| Construction & Engineering — 1.5% | | | | | | |
Arcosa, Inc. | | | 2,596 | | | | 163,833 | |
Comfort Systems U.S.A., Inc. | | | 1,920 | | | | 280,243 | |
Granite Construction, Inc. | | | 2,358 | | | | 96,867 | |
MYR Group, Inc.(a) | | | 893 | | | | 112,527 | |
| | | | | | | | |
| | |
| | | | | | | 653,470 | |
| | | | | | | | |
| Security | | Shares | | | Value | |
|
| Consumer Finance — 0.8% | |
Bread Financial Holdings, Inc. | | | 646 | | | $ | 19,587 | |
Encore Capital Group, Inc.(a) | | | 1,256 | | | | 63,365 | |
Enova International, Inc.(a) | | | 1,671 | | | | 74,243 | |
Green Dot Corp., Class A(a) | | | 875 | | | | 15,033 | |
LendingTree, Inc.(a) | | | 584 | | | | 15,569 | |
PRA Group, Inc.(a) | | | 2,089 | | | | 81,387 | |
PROG Holdings, Inc.(a) | | | 2,693 | | | | 64,066 | |
World Acceptance Corp.(a) | | | 180 | | | | 14,992 | |
| | | | | | | | |
| | |
| | | | | | | 348,242 | |
| | |
| Consumer Staples Distribution & Retail — 0.8% | | | | | | |
Andersons, Inc. | | | 1,671 | | | | 69,046 | |
Chefs’ Warehouse, Inc.(a) | | | 1,831 | | | | 62,346 | |
PriceSmart, Inc. | | | 1,357 | | | | 96,998 | |
SpartanNash Co. | | | 1,899 | | | | 47,095 | |
United Natural Foods, Inc.(a) | | | 3,210 | | | | 84,583 | |
| | | | | | | | |
| | |
| | | | | | | 360,068 | |
| | |
| Containers & Packaging — 0.5% | | | | | | |
Myers Industries, Inc. | | | 1,968 | | | | 42,174 | |
O-I Glass, Inc.(a) | | | 8,287 | | | | 188,198 | |
| | | | | | | | |
| | |
| | | | | | | 230,372 | |
| | |
| Diversified Consumer Services — 1.0% | | | | | | |
Adtalem Global Education, Inc.(a) | | | 2,452 | | | | 94,696 | |
Frontdoor, Inc.(a) | | | 4,372 | | | | 121,892 | |
Perdoceo Education Corp.(a) | | | 3,598 | | | | 48,321 | |
Strategic Education, Inc. | | | 1,195 | | | | 107,347 | |
Stride, Inc.(a) | | | 2,204 | | | | 86,507 | |
| | | | | | | | |
| | |
| | | | | | | 458,763 | |
| | |
| Diversified REITs — 1.0% | | | | | | |
Alexander & Baldwin, Inc. | | | 3,878 | | | | 73,333 | |
American Assets Trust, Inc. | | | 2,797 | | | | 51,996 | |
Armada Hoffler Properties, Inc. | | | 3,649 | | | | 43,095 | |
Essential Properties Realty Trust, Inc. | | | 7,644 | | | | 189,953 | |
Global Net Lease, Inc. | | | 5,570 | | | | 71,630 | |
| | | | | | | | |
| | |
| | | | | | | 430,007 | |
| | |
| Diversified Telecommunication Services — 0.4% | | | | | | |
ATN International, Inc. | | | 575 | | | | 23,529 | |
Cogent Communications Holdings, Inc. | | | 2,293 | | | | 146,110 | |
Consolidated Communications Holdings, Inc.(a) | | | 3,984 | | | | 10,279 | |
| | | | | | | | |
| | |
| | | | | | | 179,918 | |
| | |
| Electrical Equipment — 0.5% | | | | | | |
Encore Wire Corp. | | | 982 | | | | 181,994 | |
Powell Industries, Inc. | | | 491 | | | | 20,912 | |
| | | | | | | | |
| | |
| | | | | | | 202,906 | |
|
| Electronic Equipment, Instruments & Components — 4.8% | |
Advanced Energy Industries, Inc. | | | 2,007 | | | | 196,686 | |
Arlo Technologies, Inc.(a) | | | 4,750 | | | | 28,785 | |
Badger Meter, Inc. | | | 1,571 | | | | 191,379 | |
Benchmark Electronics, Inc. | | | 1,887 | | | | 44,703 | |
CTS Corp. | | | 1,711 | | | | 84,626 | |
ePlus, Inc.(a) | | | 1,445 | | | | 70,863 | |
Fabrinet(a) | | | 1,958 | | | | 232,532 | |
FARO Technologies, Inc.(a) | | | 1,002 | | | | 24,659 | |
Insight Enterprises, Inc.(a) | | | 1,627 | | | | 232,596 | |
Itron, Inc.(a) | | | 2,424 | | | | 134,411 | |
Knowles Corp.(a) | | | 4,892 | | | | 83,164 | |
Methode Electronics, Inc. | | | 1,935 | | | | 84,908 | |
OSI Systems, Inc.(a) | | | 841 | | | | 86,085 | |
PC Connection, Inc. | | | 604 | | | | 27,156 | |
Plexus Corp.(a) | | | 1,486 | | | | 144,989 | |
| | |
SCHEDULES OF INVESTMENTS | | 27 |
| | |
Schedule of Investments (continued) March 31, 2023 | | iShares® ESG Screened S&P Small-Cap ETF (Percentages shown are based on Net Assets) |
| | | | | | | | |
| Security | | Shares | | | Value | |
|
| Electronic Equipment, Instruments & Components (continued) | |
Rogers Corp.(a) | | | 970 | | | $ | 158,527 | |
Sanmina Corp.(a) | | | 3,134 | | | | 191,143 | |
ScanSource, Inc.(a) | | | 1,214 | | | | 36,954 | |
TTM Technologies, Inc.(a) | | | 5,485 | | | | 73,992 | |
| | | | | | | | |
| | |
| | | | | | | 2,128,158 | |
| | |
| Energy Equipment & Services — 1.9% | | | | | | |
Archrock, Inc. | | | 7,193 | | | | 70,275 | |
Bristow Group, Inc.(a) | | | 1,272 | | | | 28,493 | |
Core Laboratories NV | | | 2,734 | | | | 60,285 | |
DMC Global, Inc.(a) | | | 995 | | | | 21,860 | |
Dril-Quip, Inc.(a) | | | 1,815 | | | | 52,072 | |
Helix Energy Solutions Group, Inc.(a) | | | 7,632 | | | | 59,072 | |
Helmerich & Payne, Inc. | | | 5,610 | | | | 200,557 | |
Nabors Industries Ltd.(a) | | | 524 | | | | 63,881 | |
Oil States International, Inc.(a) | | | 3,417 | | | | 28,464 | |
Patterson-UTI Energy, Inc. | | | 11,636 | | | | 136,141 | |
ProPetro Holding Corp.(a) | | | 5,147 | | | | 37,007 | |
RPC, Inc. | | | 4,472 | | | | 34,390 | |
U.S. Silica Holdings, Inc.(a) | | | 4,078 | | | | 48,691 | |
| | | | | | | | |
| | |
| | | | | | | 841,188 | |
| | |
| Entertainment — 0.2% | | | | | | |
Cinemark Holdings, Inc.(a)(b) | | | 5,762 | | | | 85,220 | |
Marcus Corp. | | | 1,314 | | | | 21,024 | |
| | | | | | | | |
| | |
| | | | | | | 106,244 | |
| | |
| Financial Services — 1.3% | | | | | | |
EVERTEC, Inc. | | | 3,601 | | | | 121,534 | |
Mr. Cooper Group, Inc.(a) | | | 3,720 | | | | 152,408 | |
NMI Holdings, Inc., Class A(a) | | | 4,508 | | | | 100,664 | |
Payoneer Global, Inc.(a) | | | 10,676 | | | | 67,045 | |
Star Holdings(a) | | | 38 | | | | 667 | |
Walker & Dunlop, Inc. | | | 1,647 | | | | 125,452 | |
| | | | | | | | |
| | |
| | | | | | | 567,770 | |
| | |
| Food Products — 2.4% | | | | | | |
B&G Foods, Inc. | | | 3,851 | | | | 59,806 | |
Calavo Growers, Inc. | | | 946 | | | | 27,216 | |
Cal-Maine Foods, Inc. | | | 2,036 | | | | 123,972 | |
Fresh Del Monte Produce, Inc. | | | 1,644 | | | | 49,501 | |
Hain Celestial Group, Inc.(a) | | | 4,794 | | | | 82,217 | |
Hostess Brands, Inc., Class A(a) | | | 7,188 | | | | 178,837 | |
J & J Snack Foods Corp. | | | 804 | | | | 119,169 | |
John B Sanfilippo & Son, Inc. | | | 482 | | | | 46,715 | |
Seneca Foods Corp., Class A(a) | | | 288 | | | | 15,054 | |
Simply Good Foods Co.(a) | | | 4,530 | | | | 180,158 | |
Tootsie Roll Industries, Inc. | | | 982 | | | | 44,102 | |
TreeHouse Foods, Inc.(a) | | | 2,709 | | | | 136,615 | |
| | | | | | | | |
| | |
| | | | | | | 1,063,362 | |
| | |
| Gas Utilities — 0.3% | | | | | | |
Chesapeake Utilities Corp. | | | 280 | | | | 35,837 | |
Northwest Natural Holding Co. | | | 1,894 | | | | 90,079 | |
| | | | | | | | |
| | |
| | | | | | | 125,916 | |
| | |
| Ground Transportation — 0.5% | | | | | | |
ArcBest Corp. | | | 1,299 | | | | 120,054 | |
Heartland Express, Inc. | | | 2,503 | | | | 39,848 | |
Marten Transport Ltd. | | | 3,094 | | | | 64,819 | |
| | | | | | | | |
| | |
| | | | | | | 224,721 | |
| | |
| Health Care Equipment & Supplies — 2.8% | | | | | | |
AngioDynamics, Inc.(a) | | | 2,094 | | | | 21,652 | |
Artivion, Inc.(a) | | | 2,154 | | | | 28,217 | |
Avanos Medical, Inc.(a) | | | 2,495 | | | | 74,201 | |
| | | | | | | | |
| Security | | Shares | | | Value | |
|
| Health Care Equipment & Supplies (continued) | |
Cardiovascular Systems, Inc.(a) | | | 2,256 | | | $ | 44,804 | |
CONMED Corp. | | | 1,636 | | | | 169,915 | |
Cutera, Inc.(a) | | | 966 | | | | 22,817 | |
Glaukos Corp.(a) | | | 2,560 | | | | 128,256 | |
Heska Corp.(a) | | | 544 | | | | 53,105 | |
Inogen, Inc.(a) | | | 1,224 | | | | 15,276 | |
Integer Holdings Corp.(a) | | | 1,778 | | | | 137,795 | |
LeMaitre Vascular, Inc. | | | 1,040 | | | | 53,529 | |
Merit Medical Systems, Inc.(a) | | | 3,056 | | | | 225,991 | |
Mesa Laboratories, Inc. | | | 268 | | | | 46,828 | |
NuVasive, Inc.(a) | | | 2,795 | | | | 115,462 | |
OraSure Technologies, Inc.(a) | | | 3,905 | | | | 23,625 | |
Orthofix Medical, Inc.(a) | | | 1,819 | | | | 30,468 | |
Varex Imaging Corp.(a) | | | 2,153 | | | | 39,163 | |
Zynex, Inc.(a)(b) | | | 1,176 | | | | 14,112 | |
| | | | | | | | |
| | |
| | | | | | | 1,245,216 | |
| | |
| Health Care Providers & Services — 3.4% | | | | | | |
AdaptHealth Corp.(a) | | | 4,105 | | | | 51,025 | |
Addus HomeCare Corp.(a) | | | 869 | | | | 92,774 | |
Agiliti, Inc.(a) | | | 1,777 | | | | 28,396 | |
AMN Healthcare Services, Inc.(a) | | | 2,326 | | | | 192,965 | |
Apollo Medical Holdings, Inc.(a) | | | 2,109 | | | | 76,915 | |
Community Health Systems, Inc.(a) | | | 6,733 | | | | 32,992 | |
CorVel Corp.(a) | | | 491 | | | | 93,428 | |
Cross Country Healthcare, Inc.(a) | | | 1,898 | | | | 42,363 | |
Ensign Group, Inc. | | | 2,992 | | | | 285,856 | |
Fulgent Genetics, Inc.(a) | | | 1,052 | | | | 32,843 | |
ModivCare, Inc.(a) | | | 685 | | | | 57,595 | |
NeoGenomics, Inc.(a) | | | 6,776 | | | | 117,970 | |
Owens & Minor, Inc.(a) | | | 4,100 | | | | 59,655 | |
Pediatrix Medical Group, Inc.(a) | | | 4,401 | | | | 65,619 | |
RadNet, Inc.(a) | | | 2,619 | | | | 65,554 | |
Select Medical Holdings Corp. | | | 5,589 | | | | 144,476 | |
U.S. Physical Therapy, Inc. | | | 699 | | | | 68,439 | |
| | | | | | | | |
| | |
| | | | | | | 1,508,865 | |
| | |
| Health Care REITs — 0.6% | | | | | | |
CareTrust REIT, Inc. | | | 5,365 | | | | 105,047 | |
Community Healthcare Trust, Inc. | | | 1,264 | | | | 46,262 | |
LTC Properties, Inc. | | | 2,174 | | | | 76,373 | |
Universal Health Realty Income Trust | | | 685 | | | | 32,955 | |
| | | | | | | | |
| | |
| | | | | | | 260,637 | |
| | |
| Health Care Technology — 0.5% | | | | | | |
Computer Programs & Systems, Inc.(a) | | | 765 | | | | 23,103 | |
HealthStream, Inc.(a) | | | 1,292 | | | | 35,013 | |
NextGen Healthcare, Inc.(a) | | | 2,880 | | | | 50,141 | |
Simulations Plus, Inc. | | | 864 | | | | 37,964 | |
Veradigm, Inc.(a) | | | 5,882 | | | | 76,760 | |
| | | | | | | | |
| | |
| | | | | | | 222,981 | |
| | |
| Hotel & Resort REITs — 1.0% | | | | | | |
Chatham Lodging Trust | | | 2,635 | | | | 27,641 | |
DiamondRock Hospitality Co. | | | 11,215 | | | | 91,178 | |
Service Properties Trust | | | 8,908 | | | | 88,724 | |
Summit Hotel Properties, Inc. | | | 5,718 | | | | 40,026 | |
Sunstone Hotel Investors, Inc. | | | 11,328 | | | | 111,920 | |
Xenia Hotels & Resorts, Inc. | | | 5,543 | | | | 72,558 | |
| | | | | | | | |
| | |
| | | | | | | 432,047 | |
| | |
| Hotels, Restaurants & Leisure — 2.4% | | | | | | |
BJ’s Restaurants, Inc.(a) | | | 1,258 | | | | 36,658 | |
Bloomin’ Brands, Inc. | | | 4,709 | | | | 120,786 | |
Brinker International, Inc.(a) | | | 2,361 | | | | 89,718 | |
| | |
| 28 | | 2 0 2 3 I SHARES ANNUAL REPORT TO SHAREHOLDERS |
| | |
Schedule of Investments (continued) March 31, 2023 | | iShares® ESG Screened S&P Small-Cap ETF (Percentages shown are based on Net Assets) |
| | | | | | | | |
| Security | | Shares | | | Value | |
|
| Hotels, Restaurants & Leisure (continued) | |
Cheesecake Factory, Inc. | | | 2,579 | | | $ | 90,394 | |
Chuy’s Holdings, Inc.(a) | | | 971 | | | | 34,810 | |
Dave & Buster’s Entertainment, Inc.(a) | | | 2,253 | | | | 82,888 | |
Dine Brands Global, Inc. | | | 843 | | | | 57,021 | |
El Pollo Loco Holdings, Inc. | | | 1,061 | | | | 10,175 | |
Golden Entertainment, Inc.(a) | | | 1,180 | | | | 51,342 | |
Jack in the Box, Inc. | | | 1,106 | | | | 96,875 | |
Monarch Casino & Resort, Inc. | | | 714 | | | | 52,943 | |
Ruth’s Hospitality Group, Inc. | | | 1,618 | | | | 26,568 | |
Sabre Corp.(a) | | | 17,625 | | | | 75,611 | |
Shake Shack, Inc., Class A(a)(b) | | | 2,001 | | | | 111,035 | |
Six Flags Entertainment Corp.(a) | | | 3,992 | | | | 106,626 | |
| | | | | | | | |
| | |
| | | | | | | 1,043,450 | |
| | |
| Household Durables — 3.3% | | | | | | |
Cavco Industries, Inc.(a) | | | 434 | | | | 137,899 | |
Century Communities, Inc. | | | 1,526 | | | | 97,542 | |
Ethan Allen Interiors, Inc. | | | 1,231 | | | | 33,803 | |
Green Brick Partners, Inc.(a) | | | 1,458 | | | | 51,117 | |
Installed Building Products, Inc. | | | 1,259 | | | | 143,564 | |
iRobot Corp.(a) | | | 1,456 | | | | 63,540 | |
La-Z-Boy, Inc. | | | 2,315 | | | | 67,320 | |
LGI Homes, Inc.(a) | | | 1,099 | | | | 125,319 | |
M/I Homes, Inc.(a) | | | 1,473 | | | | 92,932 | |
MDC Holdings, Inc. | | | 3,114 | | | | 121,041 | |
Meritage Homes Corp. | | | 1,964 | | | | 229,317 | |
Sonos, Inc.(a) | | | 6,834 | | | | 134,083 | |
Tri Pointe Homes, Inc.(a) | | | 5,415 | | | | 137,108 | |
| | | | | | | | |
| | |
| | | | | | | 1,434,585 | |
| | |
| Household Products — 0.5% | | | | | | |
Central Garden & Pet Co.(a) | | | 524 | | | | 21,515 | |
Central Garden & Pet Co., Class A, NVS(a) | | | 2,207 | | | | 86,227 | |
WD-40 Co. | | | 731 | | | | 130,155 | |
| | | | | | | | |
| | |
| | | | | | | 237,897 | |
| | |
| Industrial REITs — 0.6% | | | | | | |
Innovative Industrial Properties, Inc. | | | 1,505 | | | | 114,365 | |
LXP Industrial Trust | | | 14,800 | | | | 152,588 | |
| | | | | | | | |
| | |
| | | | | | | 266,953 | |
| | |
| Insurance — 2.3% | | | | | | |
Ambac Financial Group, Inc.(a) | | | 2,422 | | | | 37,493 | |
American Equity Investment Life Holding Co. | | | 3,726 | | | | 135,962 | |
AMERISAFE, Inc. | | | 1,026 | | | | 50,223 | |
Assured Guaranty Ltd. | | | 3,219 | | | | 161,819 | |
Employers Holdings, Inc. | | | 1,151 | | | | 47,985 | |
Genworth Financial, Inc., Class A(a) | | | 14,070 | | | | 70,631 | |
HCI Group, Inc. | | | 365 | | | | 19,564 | |
Horace Mann Educators Corp. | | | 1,098 | | | | 36,761 | |
James River Group Holdings Ltd. | | | 1,590 | | | | 32,833 | |
Mercury General Corp. | | | 1,427 | | | | 45,293 | |
Palomar Holdings, Inc.(a) | | | 1,354 | | | | 74,741 | |
ProAssurance Corp. | | | 2,026 | | | | 37,440 | |
Safety Insurance Group, Inc. | | | 728 | | | | 54,251 | |
SiriusPoint Ltd.(a) | | | 4,558 | | | | 37,057 | |
Stewart Information Services Corp. | | | 1,266 | | | | 51,083 | |
Trupanion, Inc.(a) | | | 1,881 | | | | 80,676 | |
United Fire Group, Inc. | | | 1,118 | | | | 29,683 | |
Universal Insurance Holdings, Inc. | | | 1,333 | | | | 24,287 | |
| | | | | | | | |
| | |
| | | | | | | 1,027,782 | |
| | |
| Interactive Media & Services — 0.7% | | | | | | |
Cars.com, Inc.(a) | | | 3,315 | | | | 63,979 | |
QuinStreet, Inc.(a) | | | 2,708 | | | | 42,976 | |
| | | | | | | | |
| Security | | Shares | | | Value | |
|
| Interactive Media & Services (continued) | |
Shutterstock, Inc. | | | 1,295 | | | $ | 94,017 | |
Yelp, Inc.(a) | | | 3,738 | | | | 114,757 | |
| | | | | | | | |
| | |
| | | | | | | 315,729 | |
| | |
| IT Services — 0.3% | | | | | | |
Perficient, Inc.(a) | | | 1,858 | | | | 134,129 | |
| | | | | | | | |
| | |
| Life Sciences Tools & Services — 0.1% | | | | | | |
BioLife Solutions, Inc.(a) | | | 1,839 | | | | 39,998 | |
OmniAb, Inc., 12.50 Earnout Shares(a)(c) | | | 262 | | | | — | |
OmniAb, Inc., 15.00 Earnout Shares(a)(c) | | | 262 | | | | — | |
| | | | | | | | |
| | |
| | | | | | | 39,998 | |
| | |
| Machinery — 5.2% | | | | | | |
3D Systems Corp.(a)(b) | | | 7,043 | | | | 75,501 | |
Alamo Group, Inc. | | | 555 | | | | 102,209 | |
Albany International Corp., Class A | | | 1,669 | | | | 149,142 | |
Astec Industries, Inc. | | | 1,212 | | | | 49,995 | |
Barnes Group, Inc. | | | 2,711 | | | | 109,199 | |
CIRCOR International, Inc.(a) | | | 1,089 | | | | 33,890 | |
Enerpac Tool Group Corp. | | | 3,054 | | | | 77,877 | |
EnPro Industries, Inc. | | | 1,115 | | | | 115,837 | |
ESCO Technologies, Inc. | | | 1,384 | | | | 132,103 | |
Federal Signal Corp. | | | 3,255 | | | | 176,454 | |
Franklin Electric Co., Inc. | | | 2,089 | | | | 196,575 | |
Greenbrier Cos., Inc. | | | 1,755 | | | | 56,458 | |
Hillenbrand, Inc. | | | 3,725 | | | | 177,049 | |
John Bean Technologies Corp. | | | 1,711 | | | | 186,995 | |
Lindsay Corp. | | | 592 | | | | 89,469 | |
Proto Labs, Inc.(a) | | | 1,457 | | | | 48,300 | |
SPX Technologies, Inc.(a) | | | 2,426 | | | | 171,227 | |
Standex International Corp. | | | 641 | | | | 78,484 | |
Tennant Co. | | | 995 | | | | 68,187 | |
Titan International, Inc.(a) | | | 2,734 | | | | 28,652 | |
Trinity Industries, Inc. | | | 4,389 | | | | 106,916 | |
Wabash National Corp. | | | 2,562 | | | | 63,000 | |
| | | | | | | | |
| | |
| | | | | | | 2,293,519 | |
| | |
| Marine Transportation — 0.3% | | | | | | |
Matson, Inc. | | | 2,026 | | | | 120,891 | |
| | | | | | | | |
| | |
| Media — 0.5% | | | | | | |
AMC Networks, Inc., Class A(a) | | | 1,519 | | | | 26,704 | |
EW Scripps Co., Class A, NVS(a) | | | 3,113 | | | | 29,293 | |
Gannett Co., Inc.(a) | | | 7,867 | | | | 14,711 | |
Scholastic Corp., NVS | | | 1,588 | | | | 54,342 | |
TechTarget, Inc.(a) | | | 1,437 | | | | 51,905 | |
Thryv Holdings, Inc.(a) | | | 1,655 | | | | 38,164 | |
| | | | | | | | |
| | |
| | | | | | | 215,119 | |
| | |
| Metals & Mining — 2.2% | | | | | | |
Arconic Corp.(a) | | | 5,237 | | | | 137,366 | |
ATI, Inc.(a) | | | 6,948 | | | | 274,168 | |
Carpenter Technology Corp. | | | 2,604 | | | | 116,555 | |
Century Aluminum Co.(a) | | | 2,727 | | | | 27,270 | |
Compass Minerals International, Inc. | | | 1,824 | | | | 62,545 | |
Haynes International, Inc. | | | 673 | | | | 33,711 | |
Kaiser Aluminum Corp. | | | 857 | | | | 63,958 | |
Materion Corp. | | | 1,102 | | | | 127,832 | |
Olympic Steel, Inc. | | | 518 | | | | 27,045 | |
SunCoke Energy, Inc. | | | 4,486 | | | | 40,284 | |
TimkenSteel Corp.(a) | | | 2,129 | | | | 39,046 | |
Tredegar Corp. | | | 1,336 | | | | 12,198 | |
| | | | | | | | |
| | |
| | | | | | | 961,978 | |
| | |
SCHEDULES OF INVESTMENTS | | 29 |
| | |
Schedule of Investments (continued) March 31, 2023 | | iShares® ESG Screened S&P Small-Cap ETF (Percentages shown are based on Net Assets) |
| | | | | | | | |
| Security | | Shares | | | Value | |
|
| Mortgage Real Estate Investment Trusts (REITs) — 1.2% | |
Apollo Commercial Real Estate Finance, Inc. | | | 6,977 | | | $ | 64,956 | |
ARMOUR Residential REIT, Inc. | | | 8,777 | | | | 46,079 | |
Ellington Financial, Inc. | | | 3,411 | | | | 41,648 | |
Franklin BSP Realty Trust, Inc. | | | 4,428 | | | | 52,826 | |
Invesco Mortgage Capital, Inc. | | | 1,898 | | | | 21,049 | |
KKR Real Estate Finance Trust, Inc. | | | 3,109 | | | | 35,412 | |
New York Mortgage Trust, Inc. | | | 4,980 | | | | 49,601 | |
PennyMac Mortgage Investment Trust | | | 4,753 | | | | 58,604 | |
Ready Capital Corp. | | | 5,285 | | | | 53,748 | |
Redwood Trust, Inc. | | | 6,086 | | | | 41,020 | |
Two Harbors Investment Corp. | | | 5,198 | | | | 76,463 | |
| | | | | | | | |
| | |
| | | | | | | 541,406 | |
| | |
| Multi-Utilities — 0.4% | | | | | | |
Avista Corp. | | | 3,131 | | | | 132,911 | |
Unitil Corp. | | | 861 | | | | 49,111 | |
| | | | | | | | |
| | |
| | | | | | | 182,022 | |
| | |
| Office REITs — 0.5% | | | | | | |
Brandywine Realty Trust | | | 8,853 | | | | 41,875 | |
Easterly Government Properties, Inc. | | | 4,855 | | | | 66,708 | |
Hudson Pacific Properties, Inc. | | | 6,891 | | | | 45,825 | |
Office Properties Income Trust | | | 2,618 | | | | 32,201 | |
Orion Office REIT, Inc. | | | 3,023 | | | | 20,254 | |
| | | | | | | | |
| | |
| | | | | | | 206,863 | |
| | |
| Oil, Gas & Consumable Fuels — 0.7% | | | | | | |
Dorian LPG Ltd. | | | 1,720 | | | | 34,297 | |
Green Plains, Inc.(a) | | | 2,434 | | | | 75,430 | |
Par Pacific Holdings, Inc.(a) | | | 2,992 | | | | 87,366 | |
REX American Resources Corp.(a) | | | 818 | | | | 23,387 | |
World Fuel Services Corp. | | | 3,333 | | | | 85,158 | |
| | | | | | | | |
| | |
| | | | | | | 305,638 | |
| | |
| Paper & Forest Products — 0.3% | | | | | | |
Clearwater Paper Corp.(a) | | | 906 | | | | 30,279 | |
Mercer International, Inc. | | | 2,167 | | | | 21,182 | |
Sylvamo Corp. | | | 1,714 | | | | 79,290 | |
| | | | | | | | |
| | |
| | | | | | | 130,751 | |
| | |
| Passenger Airlines — 0.5% | | | | | | |
Allegiant Travel Co.(a) | | | 840 | | | | 77,263 | |
Hawaiian Holdings, Inc.(a) | | | 2,787 | | | | 25,529 | |
SkyWest, Inc.(a) | | | 2,705 | | | | 59,970 | |
Sun Country Airlines Holdings, Inc.(a) | | | 1,740 | | | | 35,670 | |
| | | | | | | | |
| | |
| | | | | | | 198,432 | |
| | |
| Personal Care Products — 1.5% | | | | | | |
Edgewell Personal Care Co. | | | 2,757 | | | | 116,952 | |
elf Beauty, Inc.(a) | | | 2,719 | | | | 223,910 | |
Inter Parfums, Inc. | | | 957 | | | | 136,124 | |
Medifast, Inc. | | | 588 | | | | 60,958 | |
Nu Skin Enterprises, Inc., Class A | | | 2,650 | | | | 104,171 | |
USANA Health Sciences, Inc.(a) | | | 596 | | | | 37,488 | |
| | | | | | | | |
| | |
| | | | | | | 679,603 | |
| | |
| Pharmaceuticals — 1.9% | | | | | | |
Amphastar Pharmaceuticals, Inc.(a) | | | 2,023 | | | | 75,862 | |
ANI Pharmaceuticals, Inc.(a) | | | 654 | | | | 25,977 | |
Cara Therapeutics, Inc.(a)(b) | | | 2,412 | | | | 11,843 | |
Collegium Pharmaceutical, Inc.(a) | | | 1,799 | | | | 43,158 | |
Corcept Therapeutics, Inc.(a) | | | 5,138 | | | | 111,289 | |
Harmony Biosciences Holdings, Inc.(a) | | | 1,592 | | | | 51,979 | |
Innoviva, Inc.(a) | | | 3,377 | | | | 37,991 | |
Ligand Pharmaceuticals, Inc.(a) | | | 864 | | | | 63,556 | |
Nektar Therapeutics(a) | | | 10,092 | | | | 7,093 | |
| | | | | | | | |
| Security | | Shares | | | Value | |
|
| Pharmaceuticals (continued) | |
Pacira BioSciences, Inc.(a) | | | 2,475 | | | $ | 101,005 | |
Phibro Animal Health Corp., Class A | | | 1,082 | | | | 16,576 | |
Prestige Consumer Healthcare, Inc.(a) | | | 2,668 | | | | 167,097 | |
Supernus Pharmaceuticals, Inc.(a) | | | 2,899 | | | | 105,031 | |
| | | | | | | | |
| | |
| | | | | | | 818,457 | |
|
| Professional Services — 1.1% | |
CSG Systems International, Inc. | | | 1,611 | | | | 86,511 | |
Forrester Research, Inc.(a) | | | 604 | | | | 19,539 | |
Heidrick & Struggles International, Inc. | | | 1,060 | | | | 32,182 | |
Kelly Services, Inc., Class A, NVS | | | 1,864 | | | | 30,924 | |
Korn Ferry | | | 2,829 | | | | 146,372 | |
NV5 Global, Inc.(a) | | | 665 | | | | 69,140 | |
Resources Connection, Inc. | | | 1,715 | | | | 29,258 | |
TrueBlue, Inc.(a) | | | 1,769 | | | | 31,488 | |
TTEC Holdings, Inc. | | | 1,014 | | | | 37,751 | |
| | | | | | | | |
| | |
| | | | | | | 483,165 | |
|
| Real Estate Management & Development — 0.4% | |
Anywhere Real Estate, Inc.(a) | | | 6,267 | | | | 33,090 | |
Douglas Elliman, Inc. | | | 4,217 | | | | 13,115 | |
Marcus & Millichap, Inc. | | | 1,451 | | | | 46,592 | |
RE/MAX Holdings, Inc., Class A | | | 1,085 | | | | 20,354 | |
St. Joe Co. | | | 1,816 | | | | 75,564 | |
| | | | | | | | |
| | |
| | | | | | | 188,715 | |
|
| Residential REITs — 0.5% | |
Centerspace | | | 804 | | | | 43,922 | |
Elme Communities | | | 4,338 | | | | 77,477 | |
NexPoint Residential Trust, Inc. | | | 1,225 | | | | 53,496 | |
Veris Residential, Inc.(a) | | | 4,256 | | | | 62,308 | |
| | | | | | | | |
| | |
| | | | | | | 237,203 | |
|
| Retail REITs — 1.5% | |
Acadia Realty Trust | | | 4,292 | | | | 59,873 | |
Getty Realty Corp. | | | 2,105 | | | | 75,843 | |
Retail Opportunity Investments Corp. | | | 6,719 | | | | 93,797 | |
RPT Realty | | | 4,399 | | | | 41,835 | |
Saul Centers, Inc. | | | 691 | | | | 26,949 | |
SITE Centers Corp. | | | 9,839 | | | | 120,823 | |
Tanger Factory Outlet Centers, Inc. | | | 5,602 | | | | 109,967 | |
Urban Edge Properties | | | 6,335 | | | | 95,405 | |
Urstadt Biddle Properties, Inc., Class A | | | 1,544 | | | | 27,128 | |
Whitestone REIT | | | 2,488 | | | | 22,890 | |
| | | | | | | | |
| | |
| | | | | | | 674,510 | |
|
| Semiconductors & Semiconductor Equipment — 4.6% | |
Alpha & Omega Semiconductor Ltd.(a) | | | 1,199 | | | | 32,313 | |
Axcelis Technologies, Inc.(a) | | | 1,760 | | | | 234,520 | |
CEVA, Inc.(a) | | | 1,249 | | | | 38,007 | |
Cohu, Inc.(a) | | | 2,569 | | | | 98,624 | |
Diodes, Inc.(a) | | | 2,442 | | | | 226,520 | |
FormFactor, Inc.(a) | | | 4,133 | | | | 131,636 | |
Ichor Holdings Ltd.(a) | | | 1,556 | | | | 50,943 | |
Kulicke & Soffa Industries, Inc. | | | 3,034 | | | | 159,861 | |
MaxLinear, Inc.(a) | | | 3,888 | | | | 136,897 | |
Onto Innovation, Inc.(a) | | | 2,658 | | | | 233,585 | |
PDF Solutions, Inc.(a) | | | 1,586 | | | | 67,246 | |
Photronics, Inc.(a) | | | 3,323 | | | | 55,095 | |
Rambus, Inc.(a) | | | 5,771 | | | | 295,821 | |
Semtech Corp.(a) | | | 3,422 | | | | 82,607 | |
SMART Global Holdings, Inc.(a) | | | 2,652 | | | | 45,721 | |
Ultra Clean Holdings, Inc.(a) | | | 2,441 | | | | 80,944 | |
Veeco Instruments, Inc.(a) | | | 2,751 | | | | 58,129 | |
| | | | | | | | |
| | |
| | | | | | | 2,028,469 | |
| | |
| 30 | | 2 0 2 3 I SHARES ANNUAL REPORT TO SHAREHOLDERS |
| | |
Schedule of Investments (continued) March 31, 2023 | | iShares® ESG Screened S&P Small-Cap ETF (Percentages shown are based on Net Assets) |
| | | | | | | | |
| Security | | Shares | | | Value | |
|
| Software — 3.1% | |
8x8, Inc.(a) | | | 6,046 | | | $ | 25,212 | |
A10 Networks, Inc. | | | 3,453 | | | | 53,487 | |
Adeia, Inc. | | | 5,658 | | | | 50,130 | |
Agilysys, Inc.(a) | | | 1,075 | | | | 88,698 | |
Alarm.com Holdings, Inc.(a) | | | 2,678 | | | | 134,650 | |
Cerence, Inc.(a) | | | 2,166 | | | | 60,843 | |
Consensus Cloud Solutions, Inc.(a) | | | 947 | | | | 32,283 | |
Digital Turbine, Inc.(a) | | | 4,846 | | | | 59,896 | |
DoubleVerify Holdings, Inc.(a)(b) | | | 4,686 | | | | 141,283 | |
Ebix, Inc. | | | 1,256 | | | | 16,567 | |
InterDigital, Inc. | | | 1,444 | | | | 105,268 | |
LivePerson, Inc.(a) | | | 3,786 | | | | 16,696 | |
LiveRamp Holdings, Inc.(a) | | | 3,470 | | | | 76,097 | |
OneSpan, Inc.(a) | | | 1,890 | | | | 33,075 | |
Progress Software Corp.(b) | | | 2,326 | | | | 133,629 | |
SPS Commerce, Inc.(a) | | | 1,935 | | | | 294,700 | |
Xperi, Inc.(a) | | | 2,241 | | | | 24,494 | |
| | | | | | | | |
| | |
| | | | | | | 1,347,008 | |
| | |
| Specialized REITs — 0.8% | | | | | | |
Four Corners Property Trust, Inc. | | | 4,500 | | | | 120,870 | |
Outfront Media, Inc. | | | 7,533 | | | | 122,261 | |
Safehold, Inc. | | | 2,050 | | | | 60,210 | |
Uniti Group, Inc. | | | 12,739 | | | | 45,223 | |
| | | | | | | | |
| | |
| | | | | | | 348,564 | |
| | |
| Specialty Retail — 4.6% | | | | | | |
Aaron’s Co., Inc. | | | 1,641 | | | | 15,852 | |
Abercrombie & Fitch Co., Class A(a) | | | 2,629 | | | | 72,955 | |
American Eagle Outfitters, Inc. | | | 9,351 | | | | 125,678 | |
America’s Car-Mart, Inc.(a) | | | 311 | | | | 24,634 | |
Asbury Automotive Group, Inc.(a) | | | 1,186 | | | | 249,060 | |
Boot Barn Holdings, Inc.(a)(b) | | | 1,600 | | | | 122,624 | |
Buckle, Inc. | | | 1,589 | | | | 56,711 | |
Caleres, Inc. | | | 1,919 | | | | 41,508 | |
Chico’s FAS, Inc.(a) | | | 6,670 | | | | 36,685 | |
Children’s Place, Inc.(a) | | | 652 | | | | 26,243 | |
Designer Brands, Inc., Class A | | | 2,718 | | | | 23,755 | |
Genesco, Inc.(a) | | | 639 | | | | 23,566 | |
Group 1 Automotive, Inc. | | | 781 | | | | 176,834 | |
Guess?, Inc. | | | 1,645 | | | | 32,012 | |
Haverty Furniture Cos., Inc. | | | 709 | | | | 22,624 | |
Hibbett, Inc. | | | 687 | | | | 40,519 | |
Leslie’s, Inc.(a) | | | 7,987 | | | | 87,937 | |
MarineMax, Inc.(a) | | | 1,164 | | | | 33,465 | |
Monro, Inc. | | | 1,684 | | | | 83,240 | |
National Vision Holdings, Inc.(a) | | | 4,233 | | | | 79,750 | |
ODP Corp.(a) | | | 2,174 | | | | 97,787 | |
PetMed Express, Inc. | | | 1,132 | | | | 18,384 | |
Sally Beauty Holdings, Inc.(a) | | | 5,763 | | | | 89,788 | |
Shoe Carnival, Inc. | | | 899 | | | | 23,059 | |
Signet Jewelers Ltd. | | | 2,439 | | | | 189,705 | |
Sleep Number Corp.(a)(b) | | | 1,185 | | | | 36,036 | |
Sonic Automotive, Inc., Class A | | | 893 | | | | 48,526 | |
Upbound Group, Inc. | | | 2,690 | | | | 65,932 | |
Urban Outfitters, Inc.(a)(b) | | | 3,211 | | | | 89,009 | |
Zumiez, Inc.(a) | | | 835 | | | | 15,397 | |
| | | | | | | | |
| | |
| | | | | | | 2,049,275 | |
| | | | | | | | |
| Security | | Shares | | | Value | |
|
| Technology Hardware, Storage & Peripherals — 0.2% | |
Avid Technology, Inc.(a) | | | 1,777 | | | $ | 56,829 | |
Corsair Gaming, Inc.(a) | | | 2,144 | | | | 39,342 | |
| | | | | | | | |
| | |
| | | | | | | 96,171 | |
|
| Textiles, Apparel & Luxury Goods — 1.1% | |
G-III Apparel Group Ltd.(a) | | | 2,303 | | | | 35,812 | |
Kontoor Brands, Inc. | | | 2,648 | | | | 128,137 | |
Movado Group, Inc. | | | 837 | | | | 24,080 | |
Oxford Industries, Inc. | | | 796 | | | | 84,049 | |
Steven Madden Ltd. | | | 3,929 | | | | 141,444 | |
Wolverine World Wide, Inc. | | | 4,233 | | | | 72,173 | |
| | | | | | | | |
| | |
| | | | | | | 485,695 | |
|
| Trading Companies & Distributors — 1.7% | |
Applied Industrial Technologies, Inc. | | | 2,069 | | | | 294,067 | |
Boise Cascade Co. | | | 2,117 | | | | 133,900 | |
DXP Enterprises, Inc.(a) | | | 846 | | | | 22,774 | |
GMS, Inc.(a) | | | 2,233 | | | | 129,269 | |
NOW, Inc.(a) | | | 5,932 | | | | 66,142 | |
Veritiv Corp. | | | 728 | | | | 98,382 | |
| | | | | | | | |
| | |
| | | | | | | 744,534 | |
| | |
| Water Utilities — 1.0% | | | | | | |
American States Water Co. | | | 1,984 | | | | 176,358 | |
California Water Service Group | | | 2,943 | | | | 171,282 | |
SJW Group | | | 1,430 | | | | 108,866 | |
| | | | | | | | |
| | |
| | | | | | | 456,506 | |
|
| Wireless Telecommunication Services — 0.4% | |
Gogo, Inc.(a) | | | 3,468 | | | | 50,286 | |
Shenandoah Telecommunications Co. | | | 2,680 | | | | 50,973 | |
Telephone & Data Systems, Inc. | | | 5,362 | | | | 56,355 | |
| | | | | | | | |
| | |
| | | | | | | 157,614 | |
| | | | | | | | |
| | |
Total Long-Term Investments — 96.7%
(Cost: $45,949,727) | | | | | | | 42,650,116 | |
| | | | | | | | |
| | |
Short-Term Securities | | | | | | | | |
| | |
| Money Market Funds — 5.8% | | | | | | |
BlackRock Cash Funds: Institutional, SL Agency Shares, 5.01%(d)(e)(f) | | | 718,614 | | | | 718,829 | |
BlackRock Cash Funds: Treasury, SL Agency Shares, 4.73%(d)(e) | | | 1,812,611 | | | | 1,812,611 | |
| | | | | | | | |
| |
Total Short-Term Securities — 5.8%
(Cost: $2,531,147) | | | | 2,531,440 | |
| | | | | | | | |
| |
Total Investments — 102.5%
(Cost: $48,480,874) | | | | 45,181,556 | |
| |
Liabilities in Excess of Other Assets — (2.5)% | | | | (1,081,683 | ) |
| | | | | | | | |
| | |
Net Assets — 100.0% | | | | | | $ | 44,099,873 | |
| | | | | | | | |
| (a) | Non-income producing security. |
| (b) | All or a portion of this security is on loan. |
| (c) | Security is valued using significant unobservable inputs and is classified as Level 3 in the fair value hierarchy. |
| (d) | Affiliate of the Fund. |
| (e) | Annualized 7-day yield as of period end. |
| (f) | All or a portion of this security was purchased with the cash collateral from loaned securities. |
| | |
SCHEDULES OF INVESTMENTS | | 31 |
| | |
Schedule of Investments (continued) March 31, 2023 | | iShares® ESG Screened S&P Small-Cap ETF |
Affiliates
Investments in issuers considered to be affiliate(s) of the Fund during the year ended March 31, 2023 for purposes of Section 2(a)(3) of the Investment Company Act of 1940, as amended, were as follows:
| | | | | | | | | | | | | | | | | | | | | | | | | | | | | | | | | | | | |
| |
| | | | | | | | | |
| Affiliated Issuer | | Value at
03/31/22 | | | Purchases
at Cost | | | Proceeds
from Sale | | | Net
Realized
Gain (Loss) | | | Change in
Unrealized
Appreciation
(Depreciation) | | | Value at
03/31/23 | | | Shares
Held at
03/31/23 | | | Income | | | Capital
Gain
Distributions
from Underlying
Funds | |
| |
BlackRock Cash Funds: Institutional, SL Agency Shares | | $ | 405,593 | | | $ | 312,904 | (a) | | $ | — | | | $ | 105 | | | $ | 227 | | | $ | 718,829 | | | | 718,614 | | | $ | 4,244 | (b) | | $ | — | |
BlackRock Cash Funds: Treasury, SL Agency Shares | | | 760,000 | | | | 1,052,611 | (a) | | | — | | | | — | | | | — | | | | 1,812,611 | | | | 1,812,611 | | | | 36,0771 | | | | | |
| | | | | | | | | | | | | | | | | | | | | | | | | | | | | | | | | | | | |
| | | | | | | | | |
| | | | | | | | | | | | | | $ | 105 | | | $ | 227 | | | $ | 2,531,440 | | | | | | | $ | 40,321 | | | $ | 1 | |
| | | | | | | | | | | | | | | | | | | | | | | | | | | | | | | | | | | | |
| | (a) | Represents net amount purchased (sold). | |
| | (b) | All or a portion represents securities lending income earned from the reinvestment of cash collateral from loaned securities, net of fees and collateral investment expenses, and other payments to and from borrowers of securities. | |
Derivative Financial Instruments Outstanding as of Period End
Futures Contracts
| | | | | | | | | | | | | | | | |
| |
| Description | | Number of
Contracts | | | Expiration
Date | | | Notional
Amount
(000) | | | Value/
Unrealized
Appreciation
(Depreciation) | |
| |
Long Contracts | | | | | | | | | | | | | | | | |
Micro E-mini Russell 2000 Index | | | 18 | | | | 06/16/23 | | | $ | 163 | | | $ | 2,929 | |
| | | | | | | | | | | | | | | | |
OTC Total Return Swaps
| | | | | | | | | | | | | | | | | | | | | | | | | | | | |
| |
| Reference Entity | | Payment
Frequency | | | | Counterparty(a) | | | Termination
Date | | | Net
Notional | | | Accrued
Unrealized
Appreciation
(Depreciation) | | | Net Value of
Reference
Entity | | | Gross Notional
Amount
Net Asset
Percentage | |
| |
Equity Securities Long/Short | | Monthly | | | | | Goldman Sachs Bank USA(b) | | | | 08/19/26 | | | $ | 446,283 | | | $ | (9,705 | )(c) | | $ | 436,623 | | | | 1.0 | % |
| | Monthly | | | | | HSBC Bank PLC(d) | | | | 02/10/28 | | | | 435,573 | | | | (34,511 | )(e) | | | 401,825 | | | | 1.0 | |
| | Monthly | | | | | JPMorgan Chase Bank NA(f) | | | | 02/08/24 | | | | 486,802 | | | | (55,880 | )(g) | | | 431,866 | | | | 1.1 | |
| | | | | | | | | | | | | | | | | | | | | | | | | | | | |
| | | | | | | | |
| | | | | | | | | | | | | | | | | | $ | (100,096 | ) | | $ | 1,270,314 | | | | | |
| | | | | | | | | | | | | | | | | | | | | | | | | | | | |
| | (a) | The Fund receives the total return on a portfolio of long positions underlying the total return swap. The Fund pays the total return on a portfolio of short positions underlying the total return swap. In addition, the Fund pays or receives a variable rate of interest, based on a specified benchmark. The benchmark and spread are determined based upon the country and/or currency of the individual underlying positions. | |
| | (c) | Amount includes $(45) of net dividends, payable for referenced securities purchased and financing fees. | |
| | (e) | Amount includes $(763) of net dividends, payable for referenced securities purchased and financing fees. | |
| | (g) | Amount includes $(944) of net dividends, payable for referenced securities purchased and financing fees. | |
The following are the specified benchmarks (plus or minus a range) used in determining the variable rate of interest:
| | | | | | | | | | |
| | | | | (b) | | (d) | | (f) | | |
| | Range: | | 40 basis points | | 40 basis points | | 40 basis points | | |
| | | Benchmarks: | | USD -1D Overnight Fed Funds Effective Rate | | USD - 1D Overnight Bank Funding Rate | | USD -1D Overnight Bank Funding Rate | | |
| | | | (FEDL01) | | (OBFR01) | | (OBFR01) | | |
| | |
| 32 | | 2 0 2 3 I SHARES ANNUAL REPORT TO SHAREHOLDERS |
| | |
Schedule of Investments (continued) March 31, 2023 | | iShares® ESG Screened S&P Small-Cap ETF |
The following table represents the individual long positions and related values of the equity securities underlying the total return swap with Goldman Sachs Bank USA as of period end, termination date February 27, 2023.
| | | | | | | | | | | | |
| |
| | | Shares | | | Value | | | % of
Basket
Value | |
| |
| | | |
Reference Entity — Long | | | | | | | | | | | | |
| | | |
| Common Stocks | | | | | | | | | |
| | | |
| Banks | | | | | | | | | |
Banc of California, Inc. | | | 140 | | | $ | 1,754 | | | | 0.4 | % |
Bancorp, Inc. | | | 480 | | | | 13,368 | | | | 3.1 | |
BankUnited, Inc. | | | 883 | | | | 19,938 | | | | 4.6 | |
Brookline Bancorp, Inc. | | | 282 | | | | 2,961 | | | | 0.7 | |
Capitol Federal Financial, Inc. | | | 322 | | | | 2,167 | | | | 0.5 | |
Central Pacific Financial Corp. | | | 11 | | | | 197 | | | | 0.0 | |
City Holding Co. | | | 60 | | | | 5,453 | | | | 1.2 | |
Community Bank System, Inc. | | | 188 | | | | 9,868 | | | | 2.3 | |
Eagle Bancorp, Inc. | | | 82 | | | | 2,745 | | | | 0.6 | |
First Bancorp | | | 1,294 | | | | 14,777 | | | | 3.4 | |
First Financial Bancorp | | | 664 | | | | 14,455 | | | | 3.3 | |
Hanmi Financial Corp. | | | 282 | | | | 5,237 | | | | 1.2 | |
Heritage Financial Corp. | | | 269 | | | | 5,757 | | | | 1.3 | |
HomeStreet, Inc. | | | 14 | | | | 252 | | | | 0.1 | |
Hope Bancorp, Inc. | | | 36 | | | | 354 | | | | 0.1 | |
Independent Bank Corp. | | | 263 | | | | 17,258 | | | | 3.9 | |
NBT Bancorp, Inc. | | | 337 | | | | 11,360 | | | | 2.6 | |
Northwest Bancshares, Inc. | | | 940 | | | | 11,308 | | | | 2.6 | |
OFG Bancorp | | | 325 | | | | 8,106 | | | | 1.9 | |
Pacific Premier Bancorp, Inc. | | | 367 | | | | 8,815 | | | | 2.0 | |
Preferred Bank | | | 330 | | | | 18,087 | | | | 4.1 | |
Provident Financial Services, Inc. | | | 832 | | | | 15,958 | | | | 3.6 | |
Renasant Corp. | | | 195 | | | | 5,963 | | | | 1.4 | |
S&T Bancorp, Inc. | | | 134 | | | | 4,214 | | | | 1.0 | |
Simmons First National Corp., Class A | | | 1,574 | | | | 27,529 | | | | 6.3 | |
Southside Bancshares, Inc. | | | 80 | | | | 2,656 | | | | 0.6 | |
TrustCo Bank Corp. | | | 85 | | | | 2,715 | | | | 0.6 | |
Trustmark Corp. | | | 162 | | | | 4,001 | | | | 0.9 | |
United Community Banks, Inc. | | | 681 | | | | 19,150 | | | | 4.4 | |
Westamerica BanCorp | | | 4 | | | | 177 | | | | 0.0 | |
WSFS Financial Corp. | | | 1,032 | | | | 38,814 | | | | 8.9 | |
| | | | | | | | | | | | |
| | | |
| | | | | | | 295,394 | | | | | |
| | | |
| Commercial Services & Supplies | | | | | | | | | |
Pitney Bowes, Inc. | | | 1,110 | | | | 4,318 | | | | 1.0 | |
| | | | | | | | | | | | |
| | | |
| Consumer Finance | | | | | | | | | |
Bread Financial Holdings, Inc. | | | 303 | | | | 9,187 | | | | 2.1 | |
| | | | | | | | | | | | |
| | | |
| Gas Utilities | | | | | | | | | |
Chesapeake Utilities Corp. | | | 132 | | | | 16,895 | | | | 3.9 | |
| | | | | | | | | | | | |
| | | |
| Insurance | | | | | | | | | |
Employers Holdings, Inc. | | | 134 | | | | 5,587 | | | | 1.3 | |
Genworth Financial, Inc., Class A | | | 1,685 | | | | 8,459 | | | | 2.0 | |
Horace Mann Educators Corp. | | | 442 | | | | 14,798 | | | | 3.4 | |
James River Group Holdings Ltd. | | | 153 | | | | 3,159 | | | | 0.7 | |
ProAssurance Corp. | | | 575 | | | | 10,626 | | | | 2.4 | |
Safety Insurance Group, Inc. | | | 25 | | | | 1,863 | | | | 0.4 | |
| | | | | | | | | | | | |
| | | |
| | | | | | | 44,492 | | | | | |
| | | |
| Residential REITs | | | | | | | | | |
Elme Communities | | | 359 | | | | 6,412 | | | | 1.5 | |
| | | | | | | | | | | | |
| | | | | | | | | | | | |
| |
| | | Shares | | | Value | | | % of
Basket
Value | |
| |
| | | |
| Retail REITs | | | | | | | | | |
Getty Realty Corp. | | | 152 | | | $ | 5,476 | | | | 1.2 | % |
| | | | | | | | | | | | |
| | | |
| Water Utilities | | | | | | | | | |
Middlesex Water Co. | | | 697 | | | | 54,449 | | | | 12.5 | |
| | | | | | | | | | | | |
| | | |
Net Value of Reference Entity — Goldman Sachs Bank USA | | | | | | $ | 436,623 | | | | | |
| | | | | | | | | | | | |
The following table represents the individual long positions and related values of the equity securities underlying the total return swap with HSBC Bank PLC as of period end, termination date February 10, 2023.
| | | | | | | | | | | | |
| |
| | | Shares | | | Value | | | % of
Basket
Value | |
| |
| | | |
Reference Entity — Long | | | | | | | | | | | | |
| | | |
| Common Stocks | | | | | | | | | |
| | | |
| Banks | | | | | | | | | |
Ameris Bancorp | | | 135 | | | $ | 4,938 | | | | 1.2 | % |
Axos Financial, Inc. | | | 11 | | | | 406 | | | | 0.1 | |
Banc of California, Inc. | | | 432 | | | | 5,413 | | | | 1.4 | |
Bancorp, Inc. | | | 124 | | | | 3,453 | | | | 0.9 | |
Banner Corp. | | | 83 | | | | 4,513 | | | | 1.1 | |
Berkshire Hills Bancorp, Inc. | | | 690 | | | | 17,291 | | | | 4.3 | |
Brookline Bancorp, Inc. | | | 546 | | | | 5,733 | | | | 1.4 | |
Capitol Federal Financial, Inc. | | | 352 | | | | 2,369 | | | | 0.6 | |
Community Bank System, Inc. | | | 160 | | | | 8,398 | | | | 2.1 | |
Customers Bancorp, Inc. | | | 222 | | | | 4,112 | | | | 1.0 | |
CVB Financial Corp. | | | 116 | | | | 1,935 | | | | 0.5 | |
Eagle Bancorp., Inc. | | | 89 | | | | 2,979 | | | | 0.8 | |
First Bancorp | | | 614 | | | | 7,012 | | | | 1.8 | |
First Bancorp/Southern Pines NC | | | 12 | | | | 426 | | | | 0.1 | |
HomeStreet, Inc. | | | 175 | | | | 3,148 | | | | 0.8 | |
Hope Bancorp, Inc. | | | 572 | | | | 5,617 | | | | 1.4 | |
Independent Bank Corp. | | | 306 | | | | 20,080 | | | | 5.0 | |
Lakeland Financial Corp. | | | 53 | | | | 3,320 | | | | 0.8 | |
Northfield Bancorp., Inc. | | | 457 | | | | 5,384 | | | | 1.3 | |
Northwest Bancshares, Inc. | | | 94 | | | | 1,131 | | | | 0.3 | |
Pacific Premier Bancorp, Inc. | | | 701 | | | | 16,838 | | | | 4.2 | |
Preferred Bank | | | 47 | | | | 2,576 | | | | 0.6 | |
Renasant Corp. | | | 439 | | | | 13,425 | | | | 3.3 | |
Seacoast Banking Corp. of Florida | | | 173 | | | | 4,100 | | | | 1.0 | |
Simmons First National Corp., Class A | | | 1,492 | | | | 26,095 | | | | 6.5 | |
Southside Bancshares, Inc. | | | 1 | | | | 33 | | | | 0.0 | |
Triumph Financial, Inc. | | | 1 | | | | 58 | | | | 0.0 | |
TrustCo Bank Corp. | | | 21 | | | | 671 | | | | 0.2 | |
Trustmark Corp. | | | 238 | | | | 5,879 | | | | 1.5 | |
United Community Banks, Inc. | | | 3 | | | | 84 | | | | 0.0 | |
Verites Holdings, Inc. | | | 140 | | | | 2,556 | | | | 0.6 | |
Westamerica BanCorp | | | 73 | | | | 3,234 | | | | 0.8 | |
WSFS Financial Corp. | | | 57 | | | | 2,144 | | | | 0.5 | |
| | | | | | | | | | | | |
| | | |
| | | | | | | 185,351 | | | | | |
| | | |
| Commercial Services & Supplies | | | | | | | | | |
Pitney Bowes, Inc. | | | 5,737 | | | | 22,317 | | | | 5.6 | |
| | | | | | | | | | | | |
| | | |
| Consumer Finance | | | | | | | | | |
Green Dot Corp., Class A | | | 124 | | | | 2,130 | | | | 0.5 | |
| | | | | | | | | | | | |
| | |
SCHEDULES OF INVESTMENTS | | 33 |
| | |
Schedule of Investments (continued) March 31, 2023 | | iShares® ESG Screened S&P Small-Cap ETF |
| | | | | | | | | | | | |
| |
| | | Shares | | | Value | | | % of
Basket
Value | |
| |
| | | |
| Electronic Equipment, Instruments & Components | | | | | | | | | |
Rogers Corp. | | | 3 | | | $ | 490 | | | | 0.1 | % |
ScanSource, Inc. | | | 147 | | | | 4,475 | | | | 1.1 | |
| | | | | | | | | | | | |
| | | |
| | | | | | | 4,965 | | | | | |
| | | |
| Gas Utilities | | | | | | | | | |
Chesapeake Utilities Corp. | | | 540 | | | | 69,115 | | | | 17.2 | |
| | | | | | | | | | | | |
| | | |
| Hotel & Resort REITs | | | | | | | | | |
Xenia Hotels & Resorts, Inc. | | | 36 | | | | 471 | | | | 0.1 | |
| | | | | | | | | | | | |
| | | |
| Insurance | | | | | | | | | |
Employers Holdings, Inc. | | | 175 | | | | 7,296 | | | | 1.8 | |
Genworth Financial, Inc., Class A | | | 2,109 | | | | 10,587 | | | | 2.6 | |
Horace Mann Educators Corp. | | | 655 | | | | 21,929 | | | | 5.5 | |
James River Group Holdings Ltd. | | | 499 | | | | 10,304 | | | | 2.6 | |
ProAssurance Corp. | | | 295 | | | | 5,452 | | | | 1.4 | |
Safety Insurance Group, Inc. | | | 38 | | | | 2,832 | | | | 0.7 | |
Stewart Information Services Corp. | | | 190 | | | | 7,666 | | | | 1.9 | |
United Fire Group, Inc. | | | 45 | | | | 1,195 | | | | 0.3 | |
Universal Insurance Holdings, Inc. | | | 141 | | | | 2,569 | | | | 0.6 | |
| | | | | | | | | | | | |
| | | |
| | | | | | | 69,830 | | | | | |
| | | |
| Multi-Utilities | | | | | | | | | |
Avista Corp. | | | 175 | | | | 7,429 | | | | 1.8 | |
| | | | | | | | | | | | |
| | | |
| Oil, Gas & Consumable Fuels | | | | | | | | | |
Green Plains, Inc. | | | 422 | | | | 13,078 | | | | 3.3 | |
| | | | | | | | | | | | |
| | | |
| Retail REITs | | | | | | | | | |
Getty Realty Corp. | | | 26 | | | | 937 | | | | 0.3 | |
RPT Realty | | | 176 | | | | 1,673 | | | | 0.4 | |
| | | | | | | | | | | | |
| | | |
| | | | | | | 2,610 | | | | | |
| | | |
| Specialized REITs | | | | | | | | | |
Outfront Media, Inc. | | | 308 | | | | 4,999 | | | | 1.2 | |
| | | | | | | | | | | | |
| | | |
| Water Utilities | | | | | | | | | |
Middlesex Water Co. | | | 250 | | | | 19,530 | | | | 4.9 | |
| | | | | | | | | | | | |
| | | |
Net Value of Reference Entity — HSBC Bank PLC | | | | | | $ | 401,825 | | | | | |
| | | | | | | | | | | | |
The following table represents the individual long positions and related values of the equity securities underlying the total return swap with JPMorgan Chase Bank NA as of period end, termination date February 8, 2023.
| | | | | | | | | | | | |
| |
| | | Shares | | | Value | | | % of
Basket
Value | |
| |
| | | |
Reference Entity — Long | | | | | | | | | | | | |
| | | |
| Common Stocks | | | | | | | | | |
| | | |
| Banks | | | | | | | | | |
Axos Financial, Inc. | | | 209 | | | $ | 7,716 | | | | 1.8 | % |
Banner Corp. | | | 167 | | | | 9,080 | | | | 2.1 | |
| | | | | | | | | | | | |
| |
| | | Shares | | | Value | | | % of
Basket
Value | |
| |
| | | |
| Banks (continued) | | | | | | | | | |
Capitol Federal Financial, Inc. | | | 631 | | | $ | 4,247 | | | | 1.0 | % |
Central Pacific Financial Corp. | | | 857 | | | | 15,340 | | | | 3.6 | |
Community Bank System, Inc. | | | 256 | | | | 13,438 | | | | 3.1 | |
CVB Financial Corp. | | | 628 | | | | 10,475 | | | | 2.4 | |
Eagle Bancorp, Inc. | | | 151 | | | | 5,054 | | | | 1.2 | |
First BanCorp/Puerto Rico | | | 1,848 | | | | 21,104 | | | | 4.9 | |
First Bancorp/Southern Pines NC | | | 181 | | | | 6,429 | | | | 1.5 | |
First Commonwealth Financial Corp. | | | 447 | | | | 5,556 | | | | 1.3 | |
Independent Bank Corp. | | | 696 | | | | 45,672 | | | | 10.6 | |
National Bank Holdings Corp., Class A | | | 96 | | | | 3,212 | | | | 0.7 | |
Pathward Financial, Inc. | | | 355 | | | | 14,729 | | | | 3.4 | |
Preferred Bank | | | 225 | | | | 12,332 | | | | 2.9 | |
Seacoast Banking Corp. of Florida | | | 371 | | | | 8,793 | | | | 2.0 | |
Simmons First National Corp., Class A | | | 158 | | | | 2,763 | | | | 0.6 | |
Southside Bancshares, Inc. | | | 232 | | | | 7,702 | | | | 1.8 | |
Triumph Bancorp, Inc. | | | 99 | | | | 5,748 | | | | 1.3 | |
United Community Banks, Inc. | | | 223 | | | | 6,271 | | | | 1.5 | |
Veritex Holdings, Inc. | | | 657 | | | | 11,997 | | | | 2.8 | |
WSFS Financial Corp. | | | 464 | | | | 17,451 | | | | 4.0 | |
| | | | | | | | | | | | |
| | | |
| | | | | | | 235,109 | | | | | |
| | | |
| Capital Markets | | | | | | | | | |
Virtus Investment Partners, Inc. | | | 13 | | | | 2,475 | | | | 0.6 | |
WisdomTree, Inc. | | | 491 | | | | 2,877 | | | | 0.6 | |
| | | | | | | | | | | | |
| | | |
| | | | | | | 5,352 | | | | | |
| | | |
| Consumer Finance | | | | | | | | | |
Bread Financial Holdings, Inc. | | | 1,727 | | | | 52,363 | | | | 12.1 | |
Green Dot Corp., Class A | | | 1,512 | | | | 25,976 | | | | 6.0 | |
| | | | | | | | | | | | |
| | | |
| | | | | | | 78,339 | | | | | |
| | | |
| Diversified REITs | | | | | | | | | |
Acadia Realty Trust | | | 804 | | | | 11,216 | | | | 2.6 | |
| | | | | | | | | | | | |
| | | |
| Electronic Equipment, Instruments & Components | | | | | | | | | |
Rogers Corp. | | | 37 | | | | 6,047 | | | | 1.4 | |
| | | | | | | | | | | | |
| | | |
| Hotel & Resort REITs | | | | | | | | | |
Xenia Hotels & Resorts, Inc. | | | 531 | | | | 6,951 | | | | 1.6 | |
| | | | | | | | | | | | |
| | | |
| Insurance | | | | | | | | | |
Genworth Financial, Inc., Class A | | | 8,725 | | | | 43,800 | | | | 10.2 | |
| | | | | | | | | | | | |
| | | |
| Metals & Mining | | | | | | | | | |
Arconic Corp. | | | 210 | | | | 5,508 | | | | 1.3 | |
| | | | | | | | | | | | |
| | | |
| Multi-Utilities | | | | | | | | | |
Avista Corp. | | | 654 | | | | 27,762 | | | | 6.4 | |
| | | | | | | | | | | | |
| | | |
| Office REITs | | | | | | | | | |
Brandywine Realty Trust | �� | | 355 | | | | 1,679 | | | | 0.4 | |
| | | | | | | | | | | | |
| | | |
| Oil, Gas & Consumable Fuels | | | | | | | | | |
Green Plains, Inc. | | | 326 | | | | 10,103 | | | | 2.3 | |
| | | | | | | | | | | | |
| | | |
Net Value of Reference Entity — JPMorgan Chase Bank NA | | | | | | $ | 431,866 | | | | | |
| | | | | | | | | | | | |
Balances Reported in the Statements of Assets and Liabilities for OTC Swaps
| | | | | | | | | | | | | | | | |
| Description | | Swap
Premiums
Paid | | | Swap
Premiums
Received | | | Unrealized
Appreciation | | | Unrealized
Depreciation | |
OTC Swaps | | | $ — | | | | $ — | | | | $ — | | | | $ (100,096 | ) |
| | |
| 34 | | 2 0 2 3 I SHARES ANNUAL REPORT TO SHAREHOLDERS |
| | |
Schedule of Investments (continued) March 31, 2023 | | iShares® ESG Screened S&P Small-Cap ETF |
Derivative Financial Instruments Categorized by Risk Exposure
As of period end, the fair values of derivative financial instruments located in the Statements of Assets and Liabilities were as follows:
| | | | | | | | | | | | | | | | | | | | | | | | | | | | |
| |
| | | | | | | |
| |
| Commodity
Contracts |
| |
| Credit
Contracts |
| |
| Equity
Contracts |
| |
| Foreign
Currency
Exchange
Contracts |
| |
| Interest
Rate
Contracts |
| |
| Other
Contracts |
| | | Total | |
| |
| | | | | | | |
Assets — Derivative Financial Instruments | | | | | | | | | | | | | | | | | | | | | | | | | | | | |
Futures contracts | | | | | | | | | | | | | | | | | | | | | | | | | | | | |
Unrealized appreciation on futures contracts | | $ | — | | | $ | — | | | $ | 2,929 | | | $ | — | | | $ | — | | | $ | — | | | $ | 2,929 | |
| | | | | | | | | | | | | | | | | | | | | | | | | | | | |
| | | | | | | |
Liabilities — Derivative Financial Instruments | | | | | | | | | | | | | | | | | | | | | | | | | | | | |
Swaps — OTC | | | | | | | | | | | | | | | | | | | | | | | | | | | | |
Unrealized depreciation on OTC swaps; | | | | | | | | | | | | | | | | | | | | | | | | | | | | |
Swap premiums received | | $ | — | | | $ | — | | | $ | 100,096 | | | $ | — | | | $ | — | | | $ | — | | | $ | 100,096 | |
| | | | | | | | | | | | | | | | | | | | | | | | | | | | |
For the period ended March 31, 2023, the effect of derivative financial instruments in the Statements of Operations was as follows:
| | | | | | | | | | | | | | | | | | | | | | | | | | | | |
| |
| | | | | | | |
| |
| Commodity
Contracts |
| |
| Credit
Contracts |
| |
| Equity
Contracts |
| |
| Foreign
Currency
Exchange
Contracts |
| |
| Interest
Rate
Contracts |
| |
| Other
Contracts |
| | | Total | |
| |
| | | | | | | |
Net Realized Gain (Loss) from | | | | | | | | | | | | | | | | | | | | | | | | | | | | |
Futures contracts | | $ | — | | | $ | — | | | $ | 2,931 | | | $ | — | | | $ | — | | | $ | — | | | $ | 2,931 | |
Swaps | | | — | | | | — | | | | (128,210 | ) | | | — | | | | — | | | | — | | | | (128,210 | ) |
| | | | | | | | | | | | | | | | | | | | | | | | | | | | |
| | | | | | | |
| | $ | — | | | $ | — | | | $ | (125,279 | ) | | $ | — | | | $ | — | | | $ | — | | | $ | (125,279 | ) |
| | | | | | | | | | | | | | | | | | | | | | | | | | | | |
| | | | | | | |
Net Change in Unrealized Appreciation (Depreciation) on | | | | | | | | | | | | | | | | | | | | | | | | | | | | |
Futures contracts | | $ | — | | | $ | — | | | $ | 2,929 | | | $ | — | | | $ | — | | | $ | — | | | $ | 2,929 | |
Swaps | | | — | | | | — | | | | (115,081 | ) | | | — | | | | — | | | | — | | | | (115,081 | ) |
| | | | | | | | | | | | | | | | | | | | | | | | | | | | |
| | | | | | | |
| | $ | — | | | $ | — | | | $ | (112,152 | ) | | $ | — | | | $ | — | | | $ | — | | | $ | (112,152 | ) |
| | | | | | | | | | | | | | | | | | | | | | | | | | | | |
Average Quarterly Balances of Outstanding Derivative Financial Instruments
| | | | |
Futures contracts | | | | |
Average notional value of contracts — long | | | $83,920 | |
| |
Total return swaps | | | | |
Average notional amount | | | $1,202,452 | |
For more information about the Fund’s investment risks regarding derivative financial instruments, refer to the Notes to Financial Statements
Derivative Financial Instruments – Offsetting as of Period End
The Fund’s derivative assets and liabilities (by type) were as follows:
| | | | | | | | |
| | | |
| | | Assets | | | Liabilities | |
Derivative Financial Instruments | | | | | | | | |
Futures contracts | | $ | 2,844 | | | $ | — | |
Swaps — OTC(a) | | | — | | | | 100,096 | |
| | | | | | | | |
Total derivative assets and liabilities in the Statements of Assets and Liabilities | | $ | 2,844 | | | $ | 100,096 | |
| | | | | | | | |
Derivatives not subject to a Master Netting Agreement or similar agreement (“MNA”) | | | (2,844 | ) | | | — | |
| | | | | | | | |
| | |
Total derivative assets and liabilities subject to an MNA | | $ | — | | | $ | 100,096 | |
| | | | | | | | |
| | (a) | Includes unrealized appreciation (depreciation) on OTC swaps and swap premiums paid/received in the Statements of Assets and Liabilities. | |
| | |
SCHEDULES OF INVESTMENTS | | 35 |
| | |
Schedule of Investments (continued) March 31, 2023 | | iShares® ESG Screened S&P Small-Cap ETF |
| | | | | | | | | | | | | | | | | | | | |
| |
Counterparty | |
| Derivative
Liabilities
Subject to
an MNA by
Counterparty |
| |
| Derivatives
Available
for Offset(a) |
| |
| Non-
Cash
Collateral
Pledged |
| |
| Cash
Collateral
Pledged |
| |
| Net
Amount of
Derivative
Liabilities(b) |
|
| |
Goldman Sachs Bank USA | | $ | 9,705 | | | $ | — | | | $ | — | | | $ | — | | | $ | 9,705 | |
HSBC Bank PLC | | | 34,511 | | | | — | | | | — | | | | — | | | | 34,511 | |
J.P. Morgan Securities LLC | | | 55,880 | | | | — | | | | — | | | | — | | | | 55,880 | |
| | | | | | | | | | | | | | | | | | | | |
| | | | | |
| | $ | 100,096 | | | $ | — | | | $ | — | | | $ | — | | | $ | 100,096 | |
| | | | | | | | | | | | | | | | | | | | |
| | (a) | The amount of derivatives available for offset is limited to the amount of derivative assets and/or liabilities that are subject to an MNA. | |
| | (b) | Net amount represents the net amount payable from the counterparty in the event of default. | |
Fair Value Hierarchy as of Period End
Various inputs are used in determining the fair value of financial instruments. For a description of the input levels and information about the Fund’s policy regarding valuation of financial instruments, refer to the Notes to Financial Statements.
The following table summarizes the Fund’s financial instruments categorized in the fair value hierarchy. The breakdown of the Fund’s financial instruments into major categories is disclosed in the Schedule of Investments above.
| | | | | | | | | | | | | | | | |
| |
| | | | |
| | | Level 1 | | | Level 2 | | | Level 3 | | | Total | |
| |
Assets | | | | | | | | | | | | | | | | |
Investments | | | | | | | | | | | | | | | | |
Long-Term Investments | | | | | | | | | | | | | | | | |
Common Stocks | | $ | 42,650,116 | | | $ | — | | | $ | — | | | $ | 42,650,116 | |
Short-Term Securities | | | | | | | | | | | | | | | | |
Money Market Funds | | | 2,531,440 | | | | — | | | | — | | | | 2,531,440 | |
| | | | | | | | | | | | | | | | |
| | | | |
| | $ | 45,181,556 | | | $ | — | | | $ | — | | | $ | 45,181,556 | |
| | | | | | | | | | | | | | | | |
Derivative Financial Instruments(a) | | | | | | | | | | | | | | | | |
Assets | | | | | | | | | | | | | | | | |
Equity Contracts | | $ | 2,929 | | | $ | — | | | $ | — | | | $ | 2,929 | |
Liabilities | | | | | | | | | | | | | | | | |
Equity Contracts | | | — | | | | (100,096 | ) | | | — | | | | (100,096 | ) |
| | | | | | | | | | | | | | | | |
| | | | |
| | $ | 2,929 | | | $ | (100,096 | ) | | $ | — | | | $ | (97,167 | ) |
| | | | | | | | | | | | | | | | |
| | (a) | Derivative financial instruments are swaps and futures contracts. Swaps and futures contracts are valued at the unrealized appreciation (depreciation) on the instrument. | |
See notes to financial statements.
| | |
| 36 | | 2 0 2 3 I SHARES ANNUAL REPORT TO SHAREHOLDERS |
Statements of Assets and Liabilities
March 31, 2023
| | | | | | | | | | | | |
| | | iShares ESG Screened S&P 500 ETF | | | iShares ESG Screened S&P Mid-Cap ETF | | | iShares ESG Screened S&P Small-Cap ETF | |
| |
| | | |
ASSETS | | | | | | | | | | | | |
Investments, at value — unaffiliated(a)(b) | | $ | 129,102,020 | | | $ | 101,734,711 | | | $ | 42,650,116 | |
Investments, at value — affiliated(c) | | | 657,424 | | | | 3,416,723 | | | | 2,531,440 | |
Cash | | | 10,738 | | | | 765 | | | | — | |
Cash pledged: | | | | | | | | | | | | |
Futures contracts | | | 14,000 | | | | 16,000 | | | | 12,000 | |
Receivables: | | | | | | | | | | | | |
Investments sold | | | 397 | | | | 176,060 | | | | 30,968 | |
Securities lending income — affiliated | | | 140 | | | | 2,677 | | | | 460 | |
Swaps | | | — | | | | — | | | | 4,859 | |
Dividends — unaffiliated | | | 81,869 | | | | 123,594 | | | | 49,445 | |
Dividends — affiliated | | | 730 | | | | 755 | | | | 6,551 | |
Variation margin on futures contracts | | | 4,571 | | | | 4,450 | | | | 2,844 | |
| | | | | | | | | | | | |
| | | |
Total assets | | | 129,871,889 | | | | 105,475,735 | | | | 45,288,683 | |
| | | | | | | | | | | | |
| | | |
LIABILITIES | | | | | | | | | | | | |
Bank overdraft | | | — | | | | — | | | | 3 | |
Collateral on securities loaned | | | 68,603 | | | | 3,258,117 | | | | 718,873 | |
Payables: | | | | | | | | | | | | |
Investments purchased | | | 397 | | | | 161,016 | | | | 204,504 | |
Swaps | | | — | | | | — | | | | 160,929 | |
Investment advisory fees | | | 9,017 | | | | 10,584 | | | | 4,405 | |
Unrealized depreciation on OTC swaps | | | — | | | | — | | | | 100,096 | |
| | | | | | | | | | | | |
| | | |
Total liabilities | | | 78,017 | | | | 3,429,717 | | | | 1,188,810 | |
| | | | | | | | | | | | |
| | | |
NET ASSETS | | $ | 129,793,872 | | | $ | 102,046,018 | | | $ | 44,099,873 | |
| | | | | | | | | | | | |
| | | |
NET ASSETS CONSIST OF: | | | | | | | | | | | | |
Paid-in capital | | $ | 158,692,252 | | | $ | 110,472,167 | | | $ | 49,480,002 | |
Accumulated loss | | | (28,898,380 | ) | | | (8,426,149 | ) | | | (5,380,129 | ) |
| | | | | | | | | | | | |
| | | |
NET ASSETS | | $ | 129,793,872 | | | $ | 102,046,018 | | | $ | 44,099,873 | |
| | | | | | | | | | | | |
| | | |
NET ASSET VALUE | | | | | | | | | | | | |
| | | |
Shares outstanding | | | 4,200,000 | | | | 3,000,000 | | | | 1,300,000 | |
| | | | | | | | | | | | |
| | | |
Net asset value | | $ | 30.90 | | | $ | 34.02 | | | $ | 33.92 | |
| | | | | | | | | | | | |
| | | |
Shares authorized | | | Unlimited | | | | Unlimited | | | | Unlimited | |
| | | | | | | | | | | | |
| | | |
Par value | | | None | | | | None | | | | None | |
| | | | | | | | | | | | |
| | | |
(a) Investments, at cost — unaffiliated | | $ | 154,856,056 | | | $ | 106,652,582 | | | $ | 45,949,727 | |
(b) Securities loaned, at value | | $ | 67,920 | | | $ | 3,254,883 | | | $ | 725,154 | |
(c) Investments, at cost — affiliated | | $ | 809,933 | | | $ | 3,416,150 | | | $ | 2,531,147 | |
See notes to financial statements.
Statements of Operations
Year Ended March 31, 2023
| | | | | | | | | | | | |
| | | iShares ESG Screened S&P 500 ETF | | | iShares ESG Screened
S&P Mid-Cap ETF | | | iShares ESG Screened S&P Small-Cap ETF | |
| |
| | | |
INVESTMENT INCOME | | | | | | | | | | | | |
Dividends — unaffiliated | | $ | 2,908,324 | | | $ | 1,424,377 | | | $ | 520,170 | |
Dividends — affiliated | | | 27,330 | | | | 5,533 | | | | 36,077 | |
Securities lending income — affiliated — net | | | 1,679 | | | | 36,649 | | | | 4,244 | |
Foreign taxes withheld | | | (906 | ) | | | — | | | | (429 | ) |
| | | | | | | | | | | | |
Total investment income | | | 2,936,427 | | | | 1,466,559 | | | | 560,062 | |
| | | | | | | | | | | | |
| | | |
EXPENSES | | | | | | | | | | | | |
Investment advisory | | | 158,396 | | | | 105,437 | | | | 41,829 | |
| | | | | | | | | | | | |
Total expenses | | | 158,396 | | | | 105,437 | | | | 41,829 | |
| | | | | | | | | | | | |
Net investment income | | | 2,778,031 | | | | 1,361,122 | | | | 518,233 | |
| | | | | | | | | | | | |
| | | |
REALIZED AND UNREALIZED GAIN (LOSS) | | | | | | | | | | | | |
Net realized gain (loss) from: | | | | | | | | | | | | |
Investments — unaffiliated | | | (2,320,624 | ) | | | (2,322,889 | ) | | | (1,135,308 | ) |
Investments — affiliated | | | (989 | ) | | | 307 | | | | 105 | |
Capital gain distributions from underlying funds — affiliated | | | — | | | | — | | | | 1 | |
Futures contracts | | | (19,644 | ) | | | (5,910 | ) | | | 2,931 | |
In-kind redemptions — unaffiliated(a) | | | (13,691,198 | ) | | | 2,082,109 | | | | 784,227 | |
In-kind redemptions — affiliated(a) | | | (23,035 | ) | | | — | | | | — | |
Swaps | | | — | | | | — | | | | (128,210 | ) |
| | | | | | | | | | | | |
| | | (16,055,490 | ) | | | (246,383 | ) | | | (476,254 | ) |
| | | | | | | | | | | | |
Net change in unrealized appreciation (depreciation) on: | | | | | | | | | | | | |
Investments — unaffiliated | | | (13,886,548 | ) | | | (4,178,089 | ) | | | (2,130,779 | ) |
Investments — affiliated | | | (35,525 | ) | | | 462 | | | | 227 | |
Futures contracts | | | (9,704 | ) | | | 5,977 | | | | 2,929 | |
Swaps | | | — | | | | — | | | | (115,081 | ) |
| | | | | | | | | | | | |
| | | (13,931,777 | ) | | | (4,171,650 | ) | | | (2,242,704 | ) |
| | | | | | | | | | | | |
| | | |
Net realized and unrealized loss | | | (29,987,267 | ) | | | (4,418,033 | ) | | | (2,718,958 | ) |
| | | | | | | | | | | | |
| | | |
NET DECREASE IN NET ASSETS RESULTING FROM OPERATIONS | | $ | (27,209,236 | ) | | $ | (3,056,911 | ) | | $ | (2,200,725 | ) |
| | | | | | | | | | | | |
| (a) | See Note 2 of the Notes to Financial Statements. |
See notes to financial statements.
| | |
| 38 | | 2 0 2 3 I SHARES ANNUAL REPORT TO SHAREHOLDERS |
Statements of Changes in Net Assets
| | | | | | | | | | | | | | | | | | | | | | | | | | | | |
| | | iShares
ESG Screened S&P 500 ETF | | | | | | iShares
ESG Screened S&P Mid-Cap
ETF | |
| |
| Year Ended
03/31/23 |
| | | | | |
| Year Ended
03/31/22 |
| | | | | |
| Year Ended
03/31/23 |
| | | | | |
| Year Ended
03/31/22 |
|
| |
| | | | | | | |
INCREASE (DECREASE) IN NET ASSETS | | | | | | | | | | | | | | | | | | | | | | | | | | | | |
| | | | | | | |
OPERATIONS | | | | | | | | | | | | | | | | | | | | | | | | | | | | |
Net investment income | | $ | 2,778,031 | | | | | | | $ | 2,155,766 | | | | | | | $ | 1,361,122 | | | | | | | $ | 586,448 | |
Net realized gain (loss) | | | (16,055,490 | ) | | | | | | | 27,890,630 | | | | | | | | (246,383 | ) | | | | | | | 1,134,234 | |
Net change in unrealized appreciation (depreciation) | | | (13,931,777 | ) | | | | | | | (13,278,031 | ) | | | | | | | (4,171,650 | ) | | | | | | | (2,007,608 | ) |
| | | | | | | | | | | | | | | | | | | | | | | | | | | | |
| | | | | | | |
Net increase (decrease) in net assets resulting from operations | | | (27,209,236 | ) | | | | | | | 16,768,365 | | | | | | | | (3,056,911 | ) | | | | | | | (286,926 | ) |
| | | | | | | | | | | | | | | | | | | | | | | | | | | | |
| | | | | | | |
DISTRIBUTIONS TO SHAREHOLDERS(a) | | | | | | | | | | | | | | | | | | | | | | | | | | | | |
Decrease in net assets resulting from distributions to shareholders | | | (2,794,860 | ) | | | | | | | (2,164,851 | ) | | | | | | | (1,398,055 | ) | | | | | | | (598,577 | ) |
| | | | | | | | | | | | | | | | | | | | | | | | | | | | |
| | | | | | | |
CAPITAL SHARE TRANSACTIONS | | | | | | | | | | | | | | | | | | | | | | | | | | | | |
Net increase (decrease) in net assets derived from capital share transactions | | | (68,616,036 | ) | | | | | | | 183,536,895 | | | | | | | | 29,834,804 | | | | | | | | 57,811,412 | |
| | | | | | | | | | | | | | | | | | | | | | | | | | | | |
| | | | | | | |
NET ASSETS | | | | | | | | | | | | | | | | | | | | | | | | | | | | |
Total increase (decrease) in net assets | | | (98,620,132 | ) | | | | | | | 198,140,409 | | | | | | | | 25,379,838 | | | | | | | | 56,925,909 | |
Beginning of year | | | 228,414,004 | | | | | | | | 30,273,595 | | | | | | | | 76,666,180 | | | | | | | | 19,740,271 | |
| | | | | | | | | | | | | | | | | | | | | | | | | | | | |
| | | | | | | |
End of year | | $ | 129,793,872 | | | | | | | $ | 228,414,004 | | | | | | | $ | 102,046,018 | | | | | | | $ | 76,666,180 | |
| | | | | | | | | | | | | | | | | | | | | | | | | | | | |
| (a) | Distributions for annual periods determined in accordance with U.S. federal income tax regulations. |
See notes to financial statements.
Statements of Changes in Net Assets (continued)
| | | | | | | | | | | | |
| | | iShares
ESG Screened S&P Small-Cap ETF | |
| |
| Year Ended
03/31/23 |
| | | | | |
| Year Ended
03/31/22 |
|
| |
| | | |
INCREASE (DECREASE) IN NET ASSETS | | | | | | | | | | | | |
| | | |
OPERATIONS | | | | | | | | | | | | |
Net investment income | | $ | 518,233 | | | | | | | $ | 167,343 | |
Net realized gain (loss) | | | (476,254 | ) | | | | | | | 1,351,582 | |
Net change in unrealized appreciation (depreciation) | | | (2,242,704 | ) | | | | | | | (2,333,805 | ) |
| | | | | | | | | | | | |
| | | |
Net decrease in net assets resulting from operations | | | (2,200,725 | ) | | | | | | | (814,880 | ) |
| | | | | | | | | | | | |
| | | |
DISTRIBUTIONS TO SHAREHOLDERS(a) | | | | | | | | | | | | |
Decrease in net assets resulting from distributions to shareholders | | | (524,007 | ) | | | | | | | (297,928 | ) |
| | | | | | | | | | | | |
| | | |
CAPITAL SHARE TRANSACTIONS | | | | | | | | | | | | |
Net increase in net assets derived from capital share transactions | | | 22,208,671 | | | | | | | | 16,027,431 | |
| | | | | | | | | | | | |
| | | |
NET ASSETS | | | | | | | | | | | | |
Total increase in net assets | | | 19,483,939 | | | | | | | | 14,914,623 | |
Beginning of year | | | 24,615,934 | | | | | | | | 9,701,311 | |
| | | | | | | | | | | | |
| | | |
End of year | | $ | 44,099,873 | | | | | | | $ | 24,615,934 | |
| | | | | | | | | | | | |
| (a) | Distributions for annual periods determined in accordance with U.S. federal income tax regulations. |
See notes to financial statements.
| | |
| 40 | | 2 0 2 3 I SHARES ANNUAL REPORT TO SHAREHOLDERS |
Financial Highlights
(For a share outstanding throughout each period)
| | | | | | | | | | | | |
| | | iShares ESG Screened S&P 500 ETF | |
| | | |
| | |
| Year Ended
03/31/23 |
| |
| Year Ended
03/31/22 |
| |
| Period From
09/22/20 to 03/31/21 |
(a) |
| | | |
Net asset value, beginning of period | | $ | 34.35 | | | $ | 30.27 | | | $ | 25.29 | |
| | | | | | | | | | | | |
| | | |
Net investment income(b) | | | 0.42 | | | | 0.39 | | | | 0.21 | |
Net realized and unrealized gain(c) | | | (3.45 | ) | | | 4.07 | | | | 4.91 | |
| | | | | | | | | | | | |
| | | |
Net increase from investment operations | | | (3.03 | ) | | | 4.46 | | | | 5.12 | |
| | | | | | | | | | | | |
| | | |
Distributions from net investment income(d) | | | (0.42 | ) | | | (0.38 | ) | | | (0.14 | ) |
| | | | | | | | | | | | |
| | | |
Net asset value, end of period | | $ | 30.90 | | | $ | 34.35 | | | $ | 30.27 | |
| | | | | | | | | | | | |
| | | |
Total Return(e) | | | | | | | | | | | | |
Based on net asset value | | | (8.72 | )% | | | 14.74 | % | | | 20.27 | %(f) |
| | | | | | | | | | | | |
| | | |
Ratios to Average Net Assets(g) | | | | | | | | | | | | |
Total expenses | | | 0.08 | % | | | 0.08 | % | | | 0.08 | %(h) |
| | | | | | | | | | | | |
| | | |
Net investment income | | | 1.40 | % | | | 1.12 | % | | | 1.37 | %(h) |
| | | | | | | | | | | | |
| | | |
Supplemental Data | | | | | | | | | | | | |
Net assets, end of period (000) | | $ | 129,794 | | | $ | 228,414 | | | $ | 30,274 | |
| | | | | | | | | | | | |
Portfolio turnover rate(i) | | | 4 | % | | | 3 | % | | | 6 | % |
| | | | | | | | | | | | |
| (a) | Commencement of operations. |
| (b) | Based on average shares outstanding. |
| (c) | The amounts reported for a share outstanding may not accord with the change in aggregate gains and losses in securities for the fiscal period due to the timing of capital share transactions in relation to the fluctuating market values of the Fund’s underlying securities. |
| (d) | Distributions for annual periods determined in accordance with U.S. federal income tax regulations. |
| (e) | Where applicable, assumes the reinvestment of distributions. |
| (g) | Excludes fees and expenses incurred indirectly as a result of investments in underlying funds. |
| (i) | Portfolio turnover rate excludes in-kind transactions. |
See notes to financial statements.
Financial Highlights
(For a share outstanding throughout each period)
| | | | | | | | | | | | |
| | | iShares ESG Screened S&P Mid-Cap ETF | |
| | | |
| | |
| Year Ended
03/31/23 |
| |
| Year Ended
03/31/22 |
| | | Period From 09/22/20 to 03/31/21 | (a) |
| | | |
Net asset value, beginning of period | | $ | 36.51 | | | $ | 35.89 | | | $ | 25.19 | |
| | | | | | | | | | | | |
| | | |
Net investment income(b) | | | 0.52 | | | | 0.46 | | | | 0.22 | |
Net realized and unrealized gain(c) | | | (2.50 | ) | | | 0.58 | | | | 10.66 | |
| | | | | | | | | | | | |
| | | |
Net increase from investment operations | | | (1.98 | ) | | | 1.04 | | | | 10.88 | |
| | | | | | | | | | | | |
| | | |
Distributions from net investment income(d) | | | (0.51 | ) | | | (0.42 | ) | | | (0.18 | ) |
| | | | | | | | | | | | |
| | | |
Net asset value, end of period | | $ | 34.02 | | | $ | 36.51 | | | $ | 35.89 | |
| | | | | | | | | | | | |
| | | |
Total Return(e) | | | | | | | | | | | | |
Based on net asset value | | | (5.35 | )% | | | 2.88 | % | | | 43.29 | %(f) |
| | | | | | | | | | | | |
| | | |
Ratios to Average Net Assets(g) | | | | | | | | | | | | |
Total expenses | | | 0.12 | % | | | 0.12 | % | | | 0.12 | %(h) |
| | | | | | | | | | | | |
| | | |
Net investment income | | | 1.55 | % | | | 1.23 | % | | | 1.29 | %(h) |
| | | | | | | | | | | | |
| | | |
Supplemental Data | | | | | | | | | | | | |
Net assets, end of period (000) | | $ | 102,046 | | | $ | 76,666 | | | $ | 19,740 | |
| | | | | | | | | | | | |
Portfolio turnover rate(i) | | | 20 | % | | | 26 | % | | | 11 | % |
| | | | | | | | | | | | |
| (a) | Commencement of operations. |
| (b) | Based on average shares outstanding. |
| (c) | The amounts reported for a share outstanding may not accord with the change in aggregate gains and losses in securities for the fiscal period due to the timing of capital share transactions in relation to the fluctuating market values of the Fund’s underlying securities. |
| (d) | Distributions for annual periods determined in accordance with U.S. federal income tax regulations. |
| (e) | Where applicable, assumes the reinvestment of distributions. |
| (g) | Excludes fees and expenses incurred indirectly as a result of investments in underlying funds. |
| (i) | Portfolio turnover rate excludes in-kind transactions. |
See notes to financial statements.
| | |
| 42 | | 2 0 2 3 I SHARES ANNUAL REPORT TO SHAREHOLDERS |
Financial Highlights
(For a share outstanding throughout each period)
| | | | | | | | | | | | |
| | | iShares ESG Screened S&P Small-Cap ETF | |
| | | |
| | |
| Year Ended
03/31/23 |
| |
| Year Ended
03/31/22 |
| |
| Period From
09/22/20 to 03/31/21 |
(a) |
| | | |
Net asset value, beginning of period | | $ | 37.87 | | | $ | 38.81 | | | $
| 25.18
|
|
| | | | | | | | | | | | |
| | | |
Net investment income(b) | | | 0.51 | | | | 0.39 | | | | 0.20 | |
Net realized and unrealized gain(c) | | | (3.97 | ) | | | (0.55 | ) | | | 13.69 | |
| | | | | | | | | | | | |
| | | |
Net increase from investment operations | | | (3.46 | ) | | | (0.16 | ) | | | 13.89 | |
| | | | | | | | | | | | |
| | | |
Distributions from net investment income(d) | | | (0.49 | ) | | | (0.78 | ) | | | (0.26 | ) |
| | | | | | | | | | | | |
| | | |
Net asset value, end of period | | $ | 33.92 | | | $ | 37.87 | | | $ | 38.81 | |
| | | | | | | | | | | | |
| | | |
Total Return(e) | | | | | | | | | | | | |
Based on net asset value | | | (9.08 | )% | | | (0.47 | )% | | | 55.32 | %(f) |
| | | | | | | | | | | | |
| | | |
Ratios to Average Net Assets(g) | | | | | | | | | | | | |
Total expenses | | | 0.12 | % | | | 0.12 | % | | | 0.12 | %(h) |
| | | | | | | | | | | | |
| | | |
Net investment income | | | 1.49 | % | | | 1.00 | % | | | 1.13 | %(h) |
| | | | | | | | | | | | |
| | | |
Supplemental Data | | | | | | | | | | | | |
Net assets, end of period (000) | | $ | 44,100 | | | $ | 24,616 | | | $ | 9,701 | |
| | | | | | | | | | | | |
Portfolio turnover rate(i) | | | 23 | % | | | 34 | % | | | 18 | % |
| | | | | | | | | | | | |
| (a) | Commencement of operations. |
| (b) | Based on average shares outstanding. |
| (c) | The amounts reported for a share outstanding may not accord with the change in aggregate gains and losses in securities for the fiscal period due to the timing of capital share transactions in relation to the fluctuating market values of the Fund’s underlying securities. |
| (d) | Distributions for annual periods determined in accordance with U.S. federal income tax regulations. |
| (e) | Where applicable, assumes the reinvestment of distributions. |
| (g) | Excludes fees and expenses incurred indirectly as a result of investments in underlying funds. |
| (i) | Portfolio turnover rate excludes in-kind transactions. |
See notes to financial statements.
Notes to Financial Statements
iShares Trust (the “Trust”) is registered under the Investment Company Act of 1940, as amended (the “1940 Act”), as an open-end management investment company. The Trust is organized as a Delaware statutory trust and is authorized to have multiple series or portfolios.
These financial statements relate only to the following funds (each, a “Fund” and collectively, the “Funds”):
| | | | |
| iShares ETF | | Diversification
Classification | |
ESG Screened S&P 500 ETF | | | Non-Diversified | |
ESG Screened S&P Mid-Cap | | | Non-Diversified | |
ESG Screened S&P Small-Cap | | | Non-Diversified | |
| 2. | SIGNIFICANT ACCOUNTING POLICIES |
The financial statements are prepared in conformity with accounting principles generally accepted in the United States of America (“U.S. GAAP”), which may require management to make estimates and assumptions that affect the reported amounts of assets and liabilities in the financial statements, disclosure of contingent assets and liabilities at the date of the financial statements and the reported amounts of increases and decreases in net assets from operations during the reporting period. Actual results could differ from those estimates. Each Fund is considered an investment company under U.S. GAAP and follows the accounting and reporting guidance applicable to investment companies. Below is a summary of significant accounting policies:
Investment Transactions and Income Recognition: For financial reporting purposes, investment transactions are recorded on the dates the transactions are executed. Realized gains and losses on investment transactions are determined using the specific identification method. Dividend income and capital gain distributions, if any, are recorded on the ex-dividend date. Non-cash dividends, if any, are recorded on the ex-dividend date at fair value. Upon notification from issuers or as estimated by management, a portion of the dividend income received from a real estate investment trust may be redesignated as a reduction of cost of the related investment and/or realized gain.
ForeignTaxes: The Funds may be subject to foreign taxes (a portion of which may be reclaimable) on income, stock dividends, capital gains on investments, or certain foreign currency transactions. All foreign taxes are recorded in accordance with the applicable foreign tax regulations and rates that exist in the foreign jurisdiction in which each Fund invests. These foreign taxes, if any, are paid by each Fund and are reflected in its Statements of Operations as follows: foreign taxes withheld at source are presented as a reduction of income, foreign taxes on securities lending income are presented as a reduction of securities lending income, foreign taxes on stock dividends are presented as “Other foreign taxes”, and foreign taxes on capital gains from sales of investments and foreign taxes on foreign currency transactions are included in their respective net realized gain (loss) categories. Foreign taxes payable or deferred as of March 31, 2023, if any, are disclosed in the Statements of Assets and Liabilities.
The Funds file withholding tax reclaims in certain jurisdictions to recover a portion of amounts previously withheld. The Funds may record a reclaim receivable based on collectability, which includes factors such as the jurisdiction’s applicable laws, payment history and market convention. The Statements of Operations includes tax reclaims recorded as well as professional and other fees, if any, associated with recovery of foreign withholding taxes.
Collateralization: If required by an exchange or counterparty agreement, the Funds may be required to deliver/deposit cash and/or securities to/with an exchange, or broker-dealer or custodian as collateral for certain investments.
In-kind Redemptions: For financial reporting purposes, in-kind redemptions are treated as sales of securities resulting in realized capital gains or losses to the Funds. Because such gains or losses are not taxable to the Funds and are not distributed to existing Fund shareholders, the gains or losses are reclassified from accumulated net realized gain (loss) to paid-in capital at the end of the Funds’ tax year. These reclassifications have no effect on net assets or net asset value (“NAV”) per share.
Distributions: Dividends and distributions paid by each Fund are recorded on the ex-dividend dates. Distributions are determined on a tax basis and may differ from net investment income and net realized capital gains for financial reporting purposes. Dividends and distributions are paid in U.S. dollars and cannot be automatically reinvested in additional shares of the Funds.
The character and timing of distributions are determined in accordance with U.S. federal income tax regulations, which may differ from U.S. GAAP.
Indemnifications: In the normal course of business, each Fund enters into contracts that contain a variety of representations that provide general indemnification. The Funds’ maximum exposure under these arrangements is unknown because it involves future potential claims against the Funds, which cannot be predicted with any certainty.
| 3. | INVESTMENT VALUATION AND FAIR VALUE MEASUREMENTS |
Investment Valuation Policies: Each Fund’s investments are valued at fair value (also referred to as “market value” within the financial statements) each day that the Fund’s listing exchange is open and, for financial reporting purposes, as of the report date. U.S. GAAP defines fair value as the price a fund would receive to sell an asset or pay to transfer a liability in an orderly transaction between market participants at the measurement date. The Board of Trustees of the Trust (the “Board”) of each Fund has approved the designation of BlackRock Fund Advisors (“BFA”), the Fund’s investment adviser, as the valuation designee for each Fund. Each Fund determines the fair values of its financial instruments using various independent dealers or pricing services under BFA’s policies. If a security’s market price is not readily available or does not otherwise accurately represent the fair value of the security, the security will be valued in accordance with BFA’s policies and procedures as reflecting fair value. BFA has formed a committee (the “Valuation Committee”) to develop pricing policies and procedures and to oversee the pricing function for all financial instruments, with assistance from other BlackRock pricing committees.
| | |
| 44 | | 2 0 2 3 I SHARES ANNUAL REPORT TO SHAREHOLDERS |
Notes to Financial Statements (continued)
Fair Value Inputs and Methodologies: The following methods and inputs are used to establish the fair value of each Fund’s assets and liabilities:
| | • | | Equity investments traded on a recognized securities exchange are valued at that day’s official closing price, as applicable, on the exchange where the stock is primarily traded. Equity investments traded on a recognized exchange for which there were no sales on that day are valued at the last traded price. |
| | • | | Investments in open-end U.S. mutual funds (including money market funds) are valued at that day’s published NAV. |
| | • | | Futures contracts are valued based on that day’s last reported settlement or trade price on the exchange where the contract is traded. |
| | • | | Swap agreements are valued utilizing quotes received daily by independent pricing services or through brokers, which are derived using daily swap curves and models that incorporate a number of market data factors, such as discounted cash flows, trades and values of the underlying reference instruments. |
Generally, trading in foreign instruments is substantially completed each day at various times prior to the close of trading on the NYSE. Each business day, the Fund uses current market factors supplied by independent pricing services to value certain foreign instruments (“Systematic Fair Value Price”). The Systematic Fair Value Price is designed to value such foreign securities at fair value as of the close of trading on the NYSE, which follows the close of the local markets.
If events (e.g., market volatility, company announcement or a natural disaster) occur that are expected to materially affect the value of such investment, or in the event that application of these methods of valuation results in a price for an investment that is deemed not to be representative of the market value of such investment, or if a price is not available, the investment will be valued by the Valuation Committee in accordance with the Manager’s policies and procedures as reflecting fair value (“Fair Valued Investments”). The fair valuation approaches that may be used by the Valuation Committee include market approach, income approach and cost approach. Valuation techniques such as discounted cash flow, use of market comparables and matrix pricing are types of valuation approaches and are typically used in determining fair value. When determining the price for Fair Valued Investments, the Valuation Committee seeks to determine the price that each Fund might reasonably expect to receive or pay from the current sale or purchase of that asset or liability in an arm’s-length transaction. Fair value determinations shall be based upon all available factors that the Valuation Committee deems relevant and consistent with the principles of fair value measurement.
Fair value pricing could result in a difference between the prices used to calculate a fund’s NAV and the prices used by the fund’s underlying index, which in turn could result in a difference between the fund’s performance and the performance of the fund’s underlying index.
Fair Value Hierarchy: Various inputs are used in determining the fair value of financial instruments. These inputs to valuation techniques are categorized into a fair value hierarchy consisting of three broad levels for financial reporting purposes as follows:
| | • | | Level 1 – Unadjusted price quotations in active markets/exchanges for identical assets or liabilities that each Fund has the ability to access; |
| | • | | Level 2 – Other observable inputs (including, but not limited to, quoted prices for similar assets or liabilities in markets that are active, quoted prices for identical or similar assets or liabilities in markets that are not active, inputs other than quoted prices that are observable for the assets or liabilities (such as interest rates, yield curves, volatilities, prepayment speeds, loss severities, credit risks and default rates) or other market–corroborated inputs); and |
| | • | | Level 3 – Unobservable inputs based on the best information available in the circumstances, to the extent observable inputs are not available (including the Valuation Committee’s assumptions used in determining the fair value of financial instruments). |
The hierarchy gives the highest priority to unadjusted quoted prices in active markets for identical assets or liabilities (Level 1 measurements) and the lowest priority to unobservable inputs (Level 3 measurements). Accordingly, the degree of judgment exercised in determining fair value is greatest for instruments categorized in Level 3. The inputs used to measure fair value may fall into different levels of the fair value hierarchy. In such cases, for disclosure purposes, the fair value hierarchy classification is determined based on the lowest level input that is significant to the fair value measurement in its entirety. Investments classified within Level 3 have significant unobservable inputs used by the Valuation Committee in determining the price for Fair Valued Investments. Level 3 investments include equity or debt issued by privately held companies or funds that may not have a secondary market and/or may have a limited number of investors. The categorization of a value determined for financial instruments is based on the pricing transparency of the financial instruments and is not necessarily an indication of the risks associated with investing in those securities.
| 4. | SECURITIES AND OTHER INVESTMENTS |
Securities Lending: Each Fund may lend its securities to approved borrowers, such as brokers, dealers and other financial institutions. The borrower pledges and maintains with the Fund collateral consisting of cash, an irrevocable letter of credit issued by an approved bank, or securities issued or guaranteed by the U.S. government. The initial collateral received by each Fund is required to have a value of at least 102% of the current market value of the loaned securities for securities traded on U.S. exchanges and a value of at least 105% for all other securities. The collateral is maintained thereafter at a value equal to at least 100% of the current value of the securities on loan. The market value of the loaned securities is determined at the close of each business day of the Fund and any additional required collateral is delivered to the Fund or excess collateral is returned by the Fund, on the next business day. During the term of the loan, each Fund is entitled to all distributions made on or in respect of the loaned securities but does not receive interest income on securities received as collateral. Loans of securities are terminable at any time and the borrower, after notice, is required to return borrowed securities within the standard time period for settlement of securities transactions.
As of period end, any securities on loan were collateralized by cash and/or U.S. Government obligations. Cash collateral invested in money market funds managed by BFA or its affiliates is disclosed in the Schedule of Investments. Any non-cash collateral received cannot be sold, re-invested or pledged by the Fund, except in the event of borrower default. The securities on loan, if any, are also disclosed in each Fund’s Schedule of Investments. The market value of any securities on loan and the value of any related cash collateral are disclosed in the Statements of Assets and Liabilities.
Securities lending transactions are entered into by the Funds under Master Securities Lending Agreements (each, an “MSLA”) which provide the right, in the event of default (including bankruptcy or insolvency) for the non-defaulting party to liquidate the collateral and calculate a net exposure to the defaulting party or request additional collateral. In the event that a borrower defaults, the Funds, as lender, would offset the market value of the collateral received against the market value of the securities loaned. When the value of the collateral is greater than that of the market value of the securities loaned, the lender is left with a net amount payable to the defaulting party. However, bankruptcy
| | |
NOTES TO FINANCIAL STATEMENTS | | 45 |
Notes to Financial Statements (continued)
or insolvency laws of a particular jurisdiction may impose restrictions on or prohibitions against such a right of offset in the event of an MSLA counterparty’s bankruptcy or insolvency. Under the MSLA, absent an event of default, the borrower can resell or re-pledge the loaned securities, and the Funds can reinvest cash collateral received in connection with loaned securities. Upon an event of default, the parties’ obligations to return the securities or collateral to the other party are extinguished, and the parties can resell or re-pledge the loaned securities or the collateral received in connection with the loaned securities in order to satisfy the defaulting party’s net payment obligation for all transactions under the MSLA. The defaulting party remains liable for any deficiency.
As of period end, the following table is a summary of the securities on loan by counterparty which are subject to offset under an MSLA:
| | | | | | | | | | | | | | | | | | | | |
| |
iShares ETF and Counterparty | |
| Securities
Loaned at Value |
| |
| Cash
Collateral Received |
(a) | |
| Non-Cash
Collateral Received,
at Fair Value |
(a) | |
| Net
Amount |
(b) | | | | |
| |
| | | | | |
ESG Screened S&P 500 ETF | | | | | | | | | | | | | | | | | | | | |
Barclays Bank PLC | | $ | 15,774 | | | $ | (15,774 | ) | | $ | — | | | $ | — | | | | | |
BofA Securities, Inc. | | | 17,472 | | | | (17,472 | ) | | | — | | | | — | | | | | |
Citadel Clearing LLC | | | 23,771 | | | | (23,771 | ) | | | — | | | | — | | | | | |
Citigroup Global Markets, Inc. | | | 450 | | | | (436 | ) | | | — | | | | 14 | | | | | |
UBS AG | | | 10,453 | | | | (10,453 | ) | | | — | | | | — | | | | | |
| | | | | | | | | | | | | | | | | | | | |
| | $ | 67,920 | | | $ | (67,906 | ) | | $ | — | | | $ | 14 | | | | | |
| | | | | | | | | | | | | | | | | | | | |
| | | | | |
ESG Screened S&P Mid-Cap | | | | | | | | | | | | | | | | | | | | |
Barclays Bank PLC | | $ | 167,577 | | | $ | (167,084 | ) | | $ | — | | | $ | 493 | | | | | |
Barclays Capital, Inc. | | | 355,020 | | | | (355,020 | ) | | | — | | | | — | | | | | |
BofA Securities, Inc. | | | 108,743 | | | | (108,576 | ) | | | — | | | | 167 | | | | | |
Citadel Clearing LLC | | | 487,640 | | | | (484,300 | ) | | | — | | | | 3,340 | | | | | |
Citigroup Global Markets, Inc. | | | 21,915 | | | | (21,848 | ) | | | — | | | | 67 | | | | | |
HSBC Bank PLC | | | 275,661 | | | | (275,661 | ) | | | — | | | | — | | | | | |
J.P. Morgan Securities LLC | | | 610,113 | | | | (610,113 | ) | | | — | | | | — | | | | | |
Toronto-Dominion Bank | | | 851,808 | | | | (848,825 | ) | | | — | | | | 2,983 | | | | | |
UBS AG | | | 286,143 | | | | (276,517 | ) | | | — | | | | 9,626 | | | | | |
UBS Securities LLC | | | 90,263 | | | | (90,263 | ) | | | — | | | | — | | | | | |
| | | | | | | | | | | | | | | | | | | | |
| | $ | 3,254,883 | | | $ | (3,238,207 | ) | | $ | — | | | $ | 16,676 | | | | | |
| | | | | | | | | | | | | | | | | | | | |
| | | | | |
ESG Screened S&P Small-Cap | | | | | | | | | | | | | | | | | | | | |
Barclays Bank PLC | | $ | 99,632 | | | $ | (99,450 | ) | | $ | — | | | $ | 182 | | | | | |
BofA Securities, Inc. | | | 81,968 | | | | (81,734 | ) | | | — | | | | 234 | | | | | |
Goldman Sachs & Co. LLC | | | 469,955 | | | | (463,827 | ) | | | — | | | | 6,128 | | | | | |
J.P. Morgan Securities LLC | | | 25,329 | | | | (25,329 | ) | | | — | | | | — | | | | | |
Pershing LLC | | | 13,428 | | | | (13,148 | ) | | | — | | | | 280 | | | | | |
Scotia Capital (USA), Inc. | | | 34,842 | | | | (34,842 | ) | | | — | | | | — | | | | | |
| | | | | | | | | | | | | | | | | | | | |
| | $ | 725,154 | | | $ | (718,330 | ) | | $ | — | | | $ | 6,824 | | | | | |
| | | | | | | | | | | | | | | | | | | | |
| | (a) | Collateral received, if any, in excess of the market value of securities on loan is not presented in this table. The total cash collateral received by each Fund is disclosed in the Funds’ Statements of Assets and Liabilities. | |
| | (b) | The market value of the loaned securities is determined as of March 31, 2023. Additional collateral is delivered to the Fund on the next business day in accordance with the MSLA. The net amount would be subject to the borrower default indemnity in the event of default by the counterparty. | |
The risks of securities lending include the risk that the borrower may not provide additional collateral when required or may not return the securities when due. To mitigate these risks, each Fund benefits from a borrower default indemnity provided by BlackRock, Inc. (“BlackRock”). BlackRock’s indemnity allows for full replacement of the securities loaned to the extent the collateral received does not cover the value of the securities loaned in the event of borrower default. Each Fund could incur a loss if the value of an investment purchased with cash collateral falls below the market value of the loaned securities or if the value of an investment purchased with cash collateral falls below the value of the original cash collateral received. Such losses are borne entirely by each Fund.
| 5. | DERIVATIVE FINANCIAL INSTRUMENTS |
Futures Contracts: Futures contracts are purchased or sold to gain exposure to, or manage exposure to, changes in interest rates (interest rate risk) and changes in the value of equity securities (equity risk) or foreign currencies (foreign currency exchange rate risk).
Futures contracts are exchange-traded agreements between the Funds and a counterparty to buy or sell a specific quantity of an underlying instrument at a specified price and on a specified date. Depending on the terms of a contract, it is settled either through physical delivery of the underlying instrument on the settlement date or by payment of a cash amount on the settlement date. Upon entering into a futures contract, the Funds are required to deposit initial margin with the broker in the form of cash or securities in an amount that varies depending on a contract’s size and risk profile. The initial margin deposit must then be maintained to an established level over the life of the contract. Amounts pledged, which are considered restricted, are included in cash pledged for futures contracts in the Statements of Assets and Liabilities.
Securities deposited as initial margin are designated in the Schedule of Investments and cash deposited, if any, are shown as cash pledged for futures contracts in the Statements of Assets and Liabilities. Pursuant to the contract, the Funds agree to receive from or pay to the broker an amount of cash equal to the daily fluctuation in market value of the contract (“variation margin”). Variation margin is recorded as unrealized appreciation (depreciation) and, if any, shown as variation margin receivable (or payable) on futures contracts in the Statements of Assets and Liabilities. When the contract is closed, a realized gain or loss is recorded in the Statements of Operations equal to the
| | |
| 46 | | 2 0 2 3 I SHARES ANNUAL REPORT TO SHAREHOLDERS |
Notes to Financial Statements (continued)
difference between the notional amount of the contract at the time it was opened and the notional amount at the time it was closed. The use of futures contracts involves the risk of an imperfect correlation in the movements in the price of futures contracts and interest rates, foreign currency exchange rates or underlying assets.
Swaps: Swap contracts are entered into to manage exposure to issuers, markets and securities. Such contracts are agreements between the Funds and a counterparty to make periodic net payments on a specified notional amount or a net payment upon termination. Swap agreements are privately negotiated in the OTC market and may be entered into as a bilateral contract (“OTC swaps”) or centrally cleared (“centrally cleared swaps”). For OTC swaps, any upfront premiums paid and any upfront fees received are shown as premiums paid and swap premiums received, respectively, in the Statements of Assets and Liabilities and amortized over the term of the contract. The daily fluctuation in market value is recorded as unrealized appreciation (depreciation) on OTC Swaps in the Statements of Assets and Liabilities. Payments received or paid are recorded on the Statements of Operations as realized gains or losses, respectively. When an OTC swap is terminated, a realized gain or loss is recorded in the Statements of Operations equal to the difference between the proceeds from (or cost of) the closing transaction and the Funds’ basis in the contract, if any. Generally, the basis of the contract is the premium received or paid. Total return swaps are entered into by the iShares EGS Screened S&P Small-Cap ETF to obtain exposure to a security or market without owning such security or investing directly in such market or to exchange the risk/return of one security or market (e.g., fixed-income) with another security or market (e.g., equity or commodity prices) (equity risk, commodity price risk and/or interest rate risk).
Total return swaps are agreements in which there is an exchange of cash flows whereby one party commits to make payments based on the total return (distributions plus capital gains/losses) of an underlying instrument, or basket of underlying instruments, in exchange for fixed or floating rate interest payments. If the total return of the instruments or index underlying the transaction exceeds or falls short of the offsetting fixed or floating interest rate obligation, the Fund receives payment from or makes a payment to the counterparty.
Certain total return swaps are designed to function as a portfolio of direct investments in long and short equity positions. This means that the Fund has the ability to trade in and out of these long and short positions within the swap and will receive the economic benefits and risks equivalent to direct investment in these positions, subject to certain adjustments due to events related to the counterparty. Benefits and risks include capital appreciation (depreciation), corporate actions and dividends received and paid, all of which are reflected in the swap’s market value. The market value also includes interest charges and credits (“financing fees”) related to the notional values of the long and short positions and cash balances within the swap. These interest charges and credits are based on a specified benchmark rate plus or minus a specified spread determined based upon the country and/or currency of the positions in the portfolio.
Positions within the swap and financing fees are reset periodically. During a reset, any unrealized appreciation (depreciation) on positions and accrued financing fees become available for cash settlement between the Fund and the counterparty. The amounts that are available for cash settlement are recorded as realized gains or losses in the Statements of Operations. Cash settlement in and out of the swap may occur at a reset date or any other date, at the discretion of the Fund and the counterparty, over the life of the agreement. Certain swaps have no stated expiration and can be terminated by either party at any time.
Swap transactions involve, to varying degrees, elements of interest rate, credit and market risks in excess of the amounts recognized in the Statements of Assets and Liabilities. Such risks involve the possibility that there will be no liquid market for these agreements, that the counterparty to the agreements may default on its obligation to perform or disagree as to the meaning of the contractual terms in the agreements, and that there may be unfavorable changes in interest rates and/or market values associated with these transactions.
Master Netting Arrangements: In order to define its contractual rights and to secure rights that will help it mitigate its counterparty risk, a Fund may enter into an International Swaps and Derivatives Association, Inc. Master Agreement (“ISDA Master Agreement”) or similar agreement with its counterparties. An ISDA Master Agreement is a bilateral agreement between a Fund and a counterparty that governs certain OTC derivatives and typically contains, among other things, collateral posting terms and netting provisions in the event of a default and/or termination event. Under an ISDA Master Agreement, a Fund may, under certain circumstances, offset with the counterparty certain derivative financial instruments’ payables and/or receivables with collateral held and/or posted and create one single net payment. The provisions of the ISDA Master Agreement typically permit a single net payment in the event of default including the bankruptcy or insolvency of the counterparty. However, bankruptcy or insolvency laws of a particular jurisdiction may impose restrictions on or prohibitions against the right of offset in bankruptcy, insolvency or other events.
For derivatives traded under an ISDA Master Agreement, the collateral requirements are typically calculated by netting the mark-to-market amount for each transaction under such agreement and comparing that amount to the value of any collateral currently pledged by a Fund and the counterparty.
Cash collateral that has been pledged to cover obligations of the Funds and cash collateral received from the counterparty, if any, is reported separately in the Statements of Assets and Liabilities as cash pledged as collateral and cash received as collateral, respectively. Non-cash collateral pledged by the Funds, if any, is noted in the Schedules of Investments. Generally, the amount of collateral due from or to a counterparty is subject to a certain minimum transfer amount threshold before a transfer is required, which is determined at the close of business of the Funds. Any additional required collateral is delivered to/pledged by the Funds on the next business day. Typically, the counterparty is not permitted to sell, re-pledge or use cash and non-cash collateral it receives. A Fund generally agrees not to use non-cash collateral that it receives but may, absent default or certain other circumstances defined in the underlying ISDA Master Agreement, be permitted to use cash collateral received. In such cases, interest may be paid pursuant to the collateral arrangement with the counterparty. To the extent amounts due to the Funds from the counterparty are not fully collateralized, each Fund bears the risk of loss from counterparty non-performance. Likewise, to the extent the Funds have delivered collateral to a counterparty and stand ready to perform under the terms of the agreement with such counterparty, each Fund bears the risk of loss from a counterparty in the amount of the value of the collateral in the event the counterparty fails to return such collateral. Based on the terms of agreements, collateral may not be required for all derivative contracts.
For financial reporting purposes, each Fund does not offset derivative assets and derivative liabilities that are subject to netting arrangements, if any, in the Statements of Assets and Liabilities.
| | |
NOTES TO FINANCIAL STATEMENTS | | 47 |
Notes to Financial Statements (continued)
| 6. | INVESTMENT ADVISORY AGREEMENT AND OTHER TRANSACTIONS WITH AFFILIATES |
Investment Advisory Fees: Pursuant to an Investment Advisory Agreement with the Trust, BFA manages the investment of each Fund’s assets. BFA is a California corporation indirectly owned by BlackRock. Under the Investment Advisory Agreement, BFA is responsible for substantially all expenses of the Funds, except (i) interest and taxes; (ii) brokerage commissions and other expenses connected with the execution of portfolio transactions; (iii) distribution fees; (iv) the advisory fee payable to BFA; and (v) litigation expenses and any extraordinary expenses (in each case as determined by a majority of the independent trustees).
For its investment advisory services to each of the following Funds, BFA is entitled to an annual investment advisory fee, accrued daily and paid monthly by the Funds, based on the average daily net assets of each Fund as follows:
| | | | |
| | |
| iShares ETF | | Investment Advisory Fees | |
| |
ESG Screened S&P 500 | | | 0.08 | % |
ESG Screened S&P Mid-Cap | | | 0.12 | |
ESG Screened S&P Small-Cap | | | 0.12 | |
Distributor: BlackRock Investments, LLC (“BRIL”), an affiliate of BFA, is the distributor for each Fund. Pursuant to the distribution agreement, BFA is responsible for any fees or expenses for distribution services provided to the Funds.
ETF Servicing Fees: Each Fund has entered into an ETF Services Agreement with BRIL to perform certain order processing, Authorized Participant communications, and related services in connection with the issuance and redemption of Creation Units (“ETF Services”). BRIL is entitled to a transaction fee from Authorized Participants on each creation or redemption order for the ETF Services provided. The Funds do not pay BRIL for ETF Services.
Prior to September 12, 2022, ETF Services were performed by State Street Bank and Trust Company.
Securities Lending: The U.S. Securities and Exchange Commission (the “SEC”) has issued an exemptive order which permits BlackRock Institutional Trust Company, N.A. (“BTC”), an affiliate of BFA, to serve as securities lending agent for the Funds, subject to applicable conditions. As securities lending agent, BTC bears all operational costs directly related to securities lending, including any custodial costs. Each Fund is responsible for fees in connection with the investment of cash collateral received for securities on loan (the “collateral investment fees”). The cash collateral is invested in a money market fund, BlackRock Cash Funds: Institutional or BlackRock Cash Funds: Treasury, managed by BFA, or its affiliates. However, BTC has agreed to reduce the amount of securities lending income it receives in order to effectively limit the collateral investment fees each Fund bears to an annual rate of 0.04%. The SL Agency Shares of such money market fund will not be subject to a sales load, distribution fee or service fee. The money market fund in which the cash collateral has been invested may, under certain circumstances, impose a liquidity fee of up to 2% of the value redeemed or temporarily restrict redemptions for up to 10 business days during a 90 day period, in the event that the money market fund’s weekly liquid assets fall below certain thresholds.
Securities lending income is equal to the total of income earned from the reinvestment of cash collateral, net of fees and other payments to and from borrowers of securities, and less the collateral investment fees. Each Fund retains a portion of securities lending income and remits the remaining portion to BTC as compensation for its services as securities lending agent.
Pursuant to the current securities lending agreement, each Fund retains 81% of securities lending income (which excludes collateral investment fees) and the amount retained can never be less than 70% of the total of securities lending income plus the collateral investment fees.
In addition, commencing the business day following the date that the aggregate securities lending income plus the collateral investment fees generated across all 1940 Act iShares exchange-traded funds (the “iShares ETF Complex”) in that calendar year exceeds a specified threshold, each Fund, pursuant to the securities lending agreement, will retain for the remainder of that calendar year 81% of securities lending income (which excludes collateral investment fees), and the amount retained can never be less than 70% of the total of securities lending income plus the collateral investment fees.
The share of securities lending income earned by each Fund is shown as securities lending income - affiliated - net in its Statements of Operations. For the year ended March 31, 2023, the Funds paid BTC the following amounts for securities lending agent services:
| | | | |
| | |
| iShares ETF | | Amounts | |
| |
ESG Screened S&P 500 ETF | | $ | 675 | |
ESG Screened S&P Mid-Cap | | | 9,423 | |
ESG Screened S&P Small-Cap | | | 1,337 | |
Officers and Trustees: Certain officers and/or trustees of the Trust are officers and/or trustees of BlackRock or its affiliates.
Other Transactions: Cross trading is the buying or selling of portfolio securities between funds to which BFA (or an affiliate) serves as investment adviser. At its regularly scheduled quarterly meetings, the Board reviews such transactions as of the most recent calendar quarter for compliance with the requirements and restrictions set forth by Rule 17a-7.
For the year ended March 31, 2023, transactions executed by the Funds pursuant to Rule 17a-7 under the 1940 Act were as follows:
| | | | | | | | | | | | |
| | | | |
| iShares ETF | | Purchases | | | Sales | | | Net Realized
Gain (Loss) | |
| | | |
ESG Screened S&P 500 ETF | | $ | 1,893,031 | | | $ | 1,535,538 | | | $ | (609,648 | ) |
ESG Screened S&P Mid-Cap | | | 2,594,587 | | | | 5,066,854 | | | | (1,683,906 | ) |
| | |
| 48 | | 2 0 2 3 I SHARES ANNUAL REPORT TO SHAREHOLDERS |
Notes to Financial Statements (continued)
| | | | | | | | | | | | |
| | | | |
| iShares ETF | | Purchases | | | Sales | | | Net Realized
Gain (Loss) | |
ESG Screened S&P Small-Cap | | $ | 1,223,469 | | | $ | 341,914 | | | $ | (86,073 | ) |
Each Fund may invest its positive cash balances in certain money market funds managed by BFA or an affiliate. The income earned on these temporary cash investments is shown as dividends - affiliated in the Statements of Operations.
A fund, in order to improve its portfolio liquidity and its ability to track its underlying index, may invest in shares of other iShares funds that invest in securities in the fund’s underlying index.
For the year ended March 31, 2023, purchases and sales of investments, excluding short-term securities and in-kind transactions,, were as follows:
| | | | | | | | |
| | | |
| iShares ETF | | Purchases | | | Sales | |
| | |
ESG Screened S&P 500 ETF | | $ | 7,070,518 | | | $ | 7,633,029 | |
ESG Screened S&P Mid-Cap | | | 18,036,380 | | | | 17,836,109 | |
ESG Screened S&P Small-Cap | | | 9,857,093 | | | | 7,627,797 | |
For the year ended March 31, 2023, in-kind transactions were as follows:
| | | | | | | | |
| | | |
| iShares ETF | | In-kind
Purchases | | | In-kind Sales | |
| | |
ESG Screened S&P 500 ETF | | $ | 79,486,070 | | | $ | 147,412,983 | |
ESG Screened S&P Mid-Cap | | | 44,231,249 | | | | 14,801,457 | |
ESG Screened S&P Small-Cap | | | 24,807,975 | | | | 5,766,358 | |
Each Fund is treated as an entity separate from the Trust’s other funds for federal income tax purposes. It is each Fund’s policy to comply with the requirements of the Internal Revenue Code of 1986, as amended, applicable to regulated investment companies, and to distribute substantially all of its taxable income to its shareholders. Therefore, no U.S. federal income tax provision is required.
Management has analyzed tax laws and regulations and their application to the Funds as of March 31, 2023, inclusive of the open tax return years, and does not believe that there are any uncertain tax positions that require recognition of a tax liability in the Funds’ financial statements.
U.S. GAAP requires that certain components of net assets be adjusted to reflect permanent differences between financial and tax reporting. These reclassifications have no effect on net assets or NAV per share. As of March 31, 2023, permanent differences attributable to distributions paid in excess of taxable income and realized gains (losses) from in-kind redemptions were reclassified to the following accounts:
| | | | | | | | |
| | | |
| iShares ETF | | Paid-in capital | | | Accumulated earnings (loss) | |
| | |
ESG Screened S&P 500 ETF | | $ | (13,841,039 | ) | | $ | 13,841,039 | |
ESG Screened S&P Mid-Cap | | | 2,068,983 | | | | (2,068,983 | ) |
ESG Screened S&P Small-Cap | | | 758,869 | | | | (758,869 | ) |
The tax character of distributions paid was as follows:
| | | | | | | | |
| | | |
| iShares ETF | | Year Ended
March 31, 2023 | | | Year Ended
March 31, 2022 | |
ESG Screened S&P 500 ETF | | | | | | | | |
Ordinary income | | $ | 2,794,860 | | | $ | 2,164,851 | |
| | | | | | | | |
| | |
ESG Screened S&P Mid-Cap | | | | | | | | |
Ordinary income | | $ | 1,398,055 | | | $ | 598,577 | |
| | | | | | | | |
| | |
ESG Screened S&P Small-Cap | | | | | | | | |
Ordinary income | | $ | 524,007 | | | $ | 297,928 | |
| | | | | | | | |
| | |
NOTES TO FINANCIAL STATEMENTS | | 49 |
Notes to Financial Statements (continued)
As of March 31, 2023, the tax components of accumulated net earnings (losses) were as follows:
| | | | | | | | | | | | | | | | | | | | |
| iShares ETF | | Undistributed
Ordinary Income | | | Non-expiring
Capital Loss
Carryforwards(a) | | | Net Unrealized
Gains (Losses)(b) | | | Qualified late-year losses(c) | | | Total | |
ESG Screened S&P 500 ETF | | $ | — | | | $ | (2,733,274 | ) | | $ | (26,165,106 | ) | | $ | — | | | $ | (28,898,380 | ) |
ESG Screened S&P Mid-Cap | | | 3,087 | | | | (2,793,371 | ) | | | (5,635,865 | ) | | | — | | | | (8,426,149 | ) |
ESG Screened S&P Small-Cap | | | — | | | | (1,397,798 | ) | | | (3,723,239 | ) | | | (259,092 | ) | | | (5,380,129 | ) |
| | (a) | Amounts available to offset future realized capital gains. | |
| | (b) | The difference between book-basis and tax-basis net accumulated losses was attributable primarily to the tax deferral of losses on wash sales, accounting for swap agreements, the timing and recognition of realized gains/losses for tax purposes and the realization for tax purposes of unrealized gains (losses) on certain futures contracts. | |
| | (c) | The Fund has elected to defer certain qualified late-year losses and recognize such losses in the next taxable year. | |
As of March 31, 2023, gross unrealized appreciation and depreciation based on cost of investments (including short positions and derivatives, if any) for U.S. federal income tax purposes were as follows:
| | | | | | | | | | | | | | | | |
| | | | | |
| iShares ETF | | Tax Cost | | | Gross Unrealized
Appreciation | | | Gross Unrealized
Depreciation | | | Net Unrealized
Appreciation
(Depreciation) | |
| | | | |
ESG Screened S&P 500 ETF | | $ | 155,924,551 | | | $ | 2,025,225 | | | $ | (28,190,332 | ) | | $ | (26,165,107 | ) |
ESG Screened S&P Mid-Cap | | | 110,787,299 | | | | 6,917,945 | | | | (12,553,810 | ) | | | (5,635,865 | ) |
ESG Screened S&P Small-Cap | | | 48,904,795 | | | | 2,681,405 | | | | (6,404,644 | ) | | | (3,723,239 | ) |
In the normal course of business, each Fund invests in securities or other instruments and may enter into certain transactions, and such activities subject the Fund to various risks, including, among others, fluctuations in the market (market risk) or failure of an issuer to meet all of its obligations. The value of securities or other instruments may also be affected by various factors, including, without limitation: (i) the general economy; (ii) the overall market as well as local, regional or global political and/or social instability; (iii) regulation, taxation or international tax treaties between various countries; or (iv) currency, interest rate or price fluctuations. Local, regional or global events such as war, acts of terrorism, the spread of infectious illness or other public health issues, recessions, or other events could have a significant impact on the Funds and their investments. Each Fund’s prospectus provides details of the risks to which the Fund is subject.
BFA uses a “passive” or index approach to try to achieve each Fund’s investment objective following the securities included in its underlying index during upturns as well as downturns. BFA does not take steps to reduce market exposure or to lessen the effects of a declining market. Divergence from the underlying index and the composition of the portfolio is monitored by BFA.
The Funds may be exposed to additional risks when reinvesting cash collateral in money market funds that do not seek to maintain a stable NAV per share of $1.00, which may be subject to redemption gates or liquidity fees under certain circumstances.
Infectious Illness Risk: An outbreak of an infectious illness, such as the COVID-19 pandemic, may adversely impact the economies of many nations and the global economy, and may impact individual issuers and capital markets in ways that cannot be foreseen. An infectious illness outbreak may result in, among other things, closed international borders, prolonged quarantines, supply chain disruptions, market volatility or disruptions and other significant economic, social and political impacts.
Valuation Risk: The market values of equities, such as common stocks and preferred securities or equity related investments, such as futures and options, may decline due to general market conditions which are not specifically related to a particular company. They may also decline due to factors which affect a particular industry or industries. A fund may invest in illiquid investments. An illiquid investment is any investment that a fund reasonably expects cannot be sold or disposed of in current market conditions in seven calendar days or less without the sale or disposition significantly changing the market value of the investment. A fund may experience difficulty in selling illiquid investments in a timely manner at the price that it believes the investments are worth. Prices may fluctuate widely over short or extended periods in response to company, market or economic news. Markets also tend to move in cycles, with periods of rising and falling prices. This volatility may cause a fund’s NAV to experience significant increases or decreases over short periods of time. If there is a general decline in the securities and other markets, the NAV of a fund may lose value, regardless of the individual results of the securities and other instruments in which a fund invests.
Counterparty Credit Risk: The Funds may be exposed to counterparty credit risk, or the risk that an entity may fail to or be unable to perform on its commitments related to unsettled or open transactions, including making timely interest and/or principal payments or otherwise honoring its obligations. The Funds manage counterparty credit risk by entering into transactions only with counterparties that BFA believes have the financial resources to honor their obligations and by monitoring the financial stability of those counterparties. Financial assets, which potentially expose the Funds to market, issuer and counterparty credit risks, consist principally of financial instruments and receivables due from counterparties. The extent of the Funds’ exposure to market, issuer and counterparty credit risks with respect to these financial assets is approximately their value recorded in the Statements of Assets and Liabilities, less any collateral held by the Funds.
A derivative contract may suffer a mark-to-market loss if the value of the contract decreases due to an unfavorable change in the market rates or values of the underlying instrument. Losses can also occur if the counterparty does not perform under the contract.
With exchange-traded futures, there is less counterparty credit risk to the Funds since the exchange or clearinghouse, as counterparty to such instruments, guarantees against a possible default. The clearinghouse stands between the buyer and the seller of the contract; therefore, credit risk is limited to failure of the clearinghouse. While offset rights
| | |
| 50 | | 2 0 2 3 I SHARES ANNUAL REPORT TO SHAREHOLDERS |
Notes to Financial Statements (continued)
may exist under applicable law, a Fund does not have a contractual right of offset against a clearing broker or clearinghouse in the event of a default (including the bankruptcy or insolvency). Additionally, credit risk exists in exchange-traded futures with respect to initial and variation margin that is held in a clearing broker’s customer accounts. While clearing brokers are required to segregate customer margin from their own assets, in the event that a clearing broker becomes insolvent or goes into bankruptcy and at that time there is a shortfall in the aggregate amount of margin held by the clearing broker for all its clients, typically the shortfall would be allocated on a pro rata basis across all the clearing broker’s customers, potentially resulting in losses to the Funds.
Concentration Risk: A diversified portfolio, where this is appropriate and consistent with a fund’s objectives, minimizes the risk that a price change of a particular investment will have a material impact on the NAV of a fund. The investment concentrations within each Fund’s portfolio are disclosed in its Schedule of Investments.
The Funds invest a significant portion of their assets in securities within a single or limited number of market sectors. When a Fund concentrates its investments in this manner, it assumes the risk that economic, regulatory, political and social conditions affecting such sectors may have a significant impact on the fund and could affect the income from, or the value or liquidity of, the fund’s portfolio. Investment percentages in specific sectors are presented in the Schedule of Investments.
Significant Shareholder Redemption Risk: Certain shareholders may own or manage a substantial amount of fund shares and/or hold their fund investments for a limited period of time. Large redemptions of fund shares by these shareholders may force a fund to sell portfolio securities, which may negatively impact the fund’s NAV, increase the fund’s brokerage costs, and/or accelerate the realization of taxable income/gains and cause the fund to make additional taxable distributions to shareholders.
| 10. | CAPITAL SHARE TRANSACTIONS |
Capital shares are issued and redeemed by each Fund only in aggregations of a specified number of shares or multiples thereof (“Creation Units”) at NAV. Except when aggregated in Creation Units, shares of each Fund are not redeemable.
Transactions in capital shares were as follows:
| | | | | | | | | | | | | | | | | | | | |
| |
| | | |
| | | Year Ended
03/31/23 | | | Year Ended
03/31/22 | | | | |
| | | | | |
| iShares ETF | | Shares | | | Amount | | | Shares | | | Amount | | | | |
| |
| | | | | |
ESG Screened S&P 500 ETF | | | | | | | | | | | | | | | | | | | | |
Shares sold | | | 2,700,000 | | | $ | 79,779,151 | | | | 15,950,000 | | | $ | 540,500,596 | | | | | |
| | | | | |
Shares redeemed | | | (5,150,000 | ) | | | (148,395,187 | ) | | | (10,300,000 | ) | | | (356,963,701 | ) | | | | |
| | | | | | | | | | | | | | | | | | | | |
| | | | | |
| | | (2,450,000 | ) | | $ | (68,616,036 | ) | | | 5,650,000 | | | $ | 183,536,895 | | | | | |
| | | | | | | | | | | | | | | | | | | | |
| | | | | |
ESG Screened S&P Mid-Cap | | | | | | | | | | | | | | | | | | | | |
Shares sold | | | 1,350,000 | | | $ | 44,682,535 | | | | 1,850,000 | | | $ | 68,955,535 | | | | | |
| | | | | |
Shares redeemed | | | (450,000 | ) | | | (14,847,731 | ) | | | (300,000 | ) | | | (11,144,123 | ) | | | | |
| | | | | | | | | | | | | | | | | | | | |
| | | | | |
| | | 900,000 | | | $ | 29,834,804 | | | | 1,550,000 | | | $ | 57,811,412 | | | | | |
| | | | | | | | | | | | | | | | | | | | |
| | | | | |
ESG Screened S&P Small-Cap | | | | | | | | | | | | | | | | | | | | |
Shares sold | | | 850,000 | | | $ | 28,860,781 | | | | 700,000 | | | $ | 27,779,582 | | | | | |
| | | | | |
Shares redeemed | | | (200,000 | ) | | | (6,652,110 | ) | | | (300,000 | ) | | | (11,752,151 | ) | | | | |
| | | | | | | | | | | | | | | | | | | | |
| | | | | |
| | | 650,000 | | | $ | 22,208,671 | | | | 400,000 | | | $ | 16,027,431 | | | | | |
| | | | | | | | | | | | | | | | | | | | |
The consideration for the purchase of Creation Units of a fund in the Trust generally consists of the in-kind deposit of a designated portfolio of securities and a specified amount of cash. Certain funds in the Trust may be offered in Creation Units solely or partially for cash in U.S. dollars. Investors purchasing and redeeming Creation Units may pay a purchase transaction fee and a redemption transaction fee directly to BRIL, to offset transfer and other transaction costs associated with the issuance and redemption of Creation Units, including Creation Units for cash. Investors transacting in Creation Units for cash may also pay an additional variable charge to compensate the relevant fund for certain transaction costs (i.e., stamp taxes, taxes on currency or other financial transactions, and brokerage costs) and market impact expenses relating to investing in portfolio securities. Such variable charges, if any, are included in shares sold in the table above.
From time to time, settlement of securities related to in-kind contributions or in-kind redemptions may be delayed. In such cases, securities related to in-kind transactions are reflected as a receivable or a payable in the Statements of Assets and Liabilities.
Management has evaluated the impact of all subsequent events on the Funds through the date the financial statements were available to be issued and has determined that there were no subsequent events requiring adjustment or additional disclosure in the financial statements.
| | |
NOTES TO FINANCIAL STATEMENTS | | 51 |
Report of Independent Registered Public Accounting Firm
To the Board of Trustees of iShares Trust and Shareholders of each of the three funds listed in the table below
Opinions on the Financial Statements
We have audited the accompanying statements of assets and liabilities, including the schedules of investments, of each of the funds listed in the table below (three of the funds constituting iShares Trust, hereafter collectively referred to as the “Funds”) as of March 31, 2023, the related statements of operations for the year ended March 31, 2023, the statements of changes in net assets for each of the two years in the period ended March 31, 2023, including the related notes, and the financial highlights for each of the periods indicated therein (collectively referred to as the “financial statements”). In our opinion, the financial statements present fairly, in all material respects, the financial position of each of the Funds as of March 31, 2023, the results of each of their operations for the year then ended, the changes in each of their net assets for each of the two years in the period ended March 31, 2023 and each of the financial highlights for each of the periods indicated therein, in conformity with accounting principles generally accepted in the United States of America.
|
iShares ESG Screened S&P 500 ETF |
iShares ESG Screened S&P Mid-Cap ETF |
iShares ESG Screened S&P Small-Cap ETF |
Basis for Opinions
These financial statements are the responsibility of the Funds’ management. Our responsibility is to express an opinion on the Funds’ financial statements based on our audits. We are a public accounting firm registered with the Public Company Accounting Oversight Board (United States) (PCAOB) and are required to be independent with respect to the Funds in accordance with the U.S. federal securities laws and the applicable rules and regulations of the Securities and Exchange Commission and the PCAOB.
We conducted our audits of these financial statements in accordance with the standards of the PCAOB. Those standards require that we plan and perform the audit to obtain reasonable assurance about whether the financial statements are free of material misstatement, whether due to error or fraud.
Our audits included performing procedures to assess the risks of material misstatement of the financial statements, whether due to error or fraud, and performing procedures that respond to those risks. Such procedures included examining, on a test basis, evidence regarding the amounts and disclosures in the financial statements. Our audits also included evaluating the accounting principles used and significant estimates made by management, as well as evaluating the overall presentation of the financial statements. Our procedures included confirmation of securities owned as of March 31, 2023 by correspondence with the custodian, transfer agent and brokers; when replies were not received from brokers, we performed other auditing procedures. We believe that our audits provide a reasonable basis for our opinions.
/s/PricewaterhouseCoopers LLP
Philadelphia, Pennsylvania
May 25, 2023
We have served as the auditor of one or more BlackRock investment companies since 2000.
| | |
| 52 | | 2 0 2 3 I SHARES ANNUAL REPORT TO SHAREHOLDERS |
Important Tax Information (unaudited)
The following amounts, or maximum amounts allowable by law, are hereby designated as qualified dividend income for individuals for the fiscal year ended March 31, 2023:
| | | | |
| |
| iShares ETF | | Qualified Dividend
Income | |
| |
ESG Screened S&P 500 ETF | | $ | 2,696,846 | |
ESG Screened S&P Mid-Cap | | | 1,132,956 | |
ESG Screened S&P Small-Cap | | | 368,498 | |
| |
The following amounts, or maximum amounts allowable by law, are hereby designated as qualified business income for individuals for the fiscal year ended March 31, 2023:
| | | | |
| |
| iShares ETF | | Qualified Business
Income | |
| |
ESG Screened S&P 500 ETF | | $ | 113,254 | |
ESG Screened S&P Mid-Cap | | | 120,574 | |
ESG Screened S&P Small-Cap | | | 67,183 | |
| |
The following percentages, or maximum percentages allowable by law, of ordinary income distributions paid during the fiscal year ended March 31, 2023 qualified for the dividends-received deduction for corporate shareholders:
| | | | |
| |
| iShares ETF | | Dividends-Received
Deduction | |
| |
ESG Screened S&P 500 ETF | | | 93.35% | |
ESG Screened S&P Mid-Cap | | | 80.04 | |
ESG Screened S&P Small-Cap | | | 69.10 | |
| |
| | |
IMPORTANT TAX INFORMATION | | 53 |
Statement Regarding Liquidity Risk Management Program (unaudited)
In compliance with Rule 22e-4 under the Investment Company Act of 1940, as amended (the “Liquidity Rule”), iShares Trust (the “Trust”) has adopted and implemented a liquidity risk management program (the “Program”) for iShares ESG Screened S&P 500 ETF, iShares ESG Screened S&P Mid-Cap ETF and iShares ESG Screened S&P Small-Cap ETF (the “Funds” or “ETFs”), each a series of the Trust, which is reasonably designed to assess and manage each Fund’s liquidity risk.
The Board of Trustees (the “Board”) of the Trust, on behalf of the Funds, met on December 9, 2022 (the “Meeting”) to review the Program. The Board previously appointed BlackRock Fund Advisors (“BlackRock”), the investment adviser to the Funds, as the program administrator for each Fund’s Program. BlackRock also previously delegated oversight of the Program to the 40 Act Liquidity Risk Management Committee (the “Committee”). At the Meeting, the Committee, on behalf of BlackRock, provided the Board with a report that addressed the operation of the Program and assessed its adequacy and effectiveness of implementation, including the management of each Fund’s Highly Liquid Investment Minimum (“HLIM”) where applicable, and any material changes to the Program (the “Report”). The Report covered the period from October 1, 2021 through September 30, 2022 (the “Program Reporting Period”).
The Report described the Program’s liquidity classification methodology for categorizing each Fund’s investments (including derivative transactions) into one of four liquidity buckets. It also referenced the methodology used by BlackRock to establish each Fund’s HLIM and noted that the Committee reviews and ratifies the HLIM assigned to each Fund no less frequently than annually. The Report also discussed notable events affecting liquidity over the Program Reporting Period, including extended market holidays and the imposition of capital controls in certain non-U.S. countries, Russian sanctions and the closure of the Russian securities market.
The Report noted that the Program complied with the key factors for consideration under the Liquidity Rule for assessing, managing and periodically reviewing each Fund’s liquidity risk, as follows:
| | a) | The Fund’s investment strategy and liquidity of portfolio investments during both normal and reasonably foreseeable stressed conditions. During the Program Reporting Period, the Committee reviewed whether each Fund’s strategy is appropriate for an open-end fund structure, with a focus on funds with more significant and consistent holdings of less liquid and illiquid assets. The Committee also factored a fund’s concentration in an issuer into the liquidity classification methodology by taking issuer position sizes into account. Derivative exposure was also considered in the calculation of a fund’s liquidity bucketing. Finally, a factor for consideration under the Liquidity Rule is a Fund’s use of borrowings for investment purposes. However, the Funds do not borrow for investment purposes. |
| | b) | Short-term and long-term cash flow projections during both normal and reasonably foreseeable stressed conditions. During the Program Reporting Period, the Committee reviewed historical redemption activity and used this information as a component to establish each ETF’s reasonably anticipated trading size (“RATS”). The Committee may also take into consideration a fund’s shareholder ownership concentration (which, depending on product type and distribution channel, may or may not be available), a fund’s distribution channels, and the degree of certainty associated with a fund’s short-term and long-term cash flow projections. |
| | c) | Holdings of cash and cash equivalents, as well as borrowing arrangements. The Committee considered that ETFs generally do not hold more than de minimis amounts of cash. The Committee also considered that ETFs generally do not engage in borrowing. |
| | d) | The relationship between an ETF’s portfolio liquidity and the way in which, and the prices and spreads at which, ETF shares trade, including the efficiency of the arbitrage function and the level of active participation by market participants, including authorized participants. The Committee monitored the prevailing bid/ask spread and the ETF price premium (or discount) to NAV for all ETFs. However, there were no ETFs with persistent deviations of fund premium/discount or bid/ask spreads from long-term averages over the Program Reporting Period. |
| | e) | The effect of the composition of baskets on the overall liquidity of an ETF’s portfolio. In reviewing the linkage between the composition of custom baskets accepted by an ETF and any significant change in the liquidity profile of such ETF, the Committee reviewed changes in the proportion of each ETF’s portfolio comprised of less liquid and illiquid holdings to determine if applicable thresholds were met requiring enhanced review. |
There were no material changes to the Program during the Program Reporting Period other than the enhancement of certain model components in the Program’s classification methodology. The Report provided to the Board stated that the Committee concluded that based on the operation of the functions, as described in the Report, the Program is operating as intended and is effective in implementing the requirements of the Liquidity Rule.
| | |
| 54 | | 2 0 2 3 I SHARES ANNUAL REPORT TO SHAREHOLDERS |
Supplemental Information (unaudited)
Section 19(a) Notices
The amounts and sources of distributions reported are estimates and are being provided pursuant to regulatory requirements and are not being provided for tax reporting purposes. The actual amounts and sources for tax reporting purposes will depend upon each Fund’s investment experience during the year and may be subject to changes based on tax regulations. Shareholders will receive a Form 1099-DIV each calendar year that will inform them how to report these distributions for federal income tax purposes.
March 31, 2023
| | | | | | | | | | | | | | | | | | | | | | | | | | | | | | | | |
| | | Total Cumulative Distributions for the Fiscal Year-to-Date | | | % Breakdown of the Total Cumulative Distributions for the Fiscal Year-to-Date | |
| iShares ETF | | Net
Investment
Income | | | Net Realized
Capital Gains | | | Return of
Capital | | | Total Per
Share | | | Net
Investment
Income | | | Net Realized
Capital Gains | | | Return of
Capital | | | Total Per
Share | |
ESG Screened S&P Mid-Cap(a) | | $ | 0.505453 | | | $ | — | | | $ | 0.000770 | | | $ | 0.506223 | | | | 100 | % | | | — | % | | | 0 | % | | | 100 | % |
ESG Screened S&P Small-Cap | | | 0.492598 | | | | — | | | | — | | | | 0.492598 | | | | 100 | | | | — | | | | — | | | | 100 | |
| (a) | The Fund estimates that it has distributed more than its net investment income and net realized capital gains; therefore, a portion of the distribution may be a return of capital. A return of capital may occur, for example, when some or all of the shareholder’s investment in the Fund is returned to the shareholder. A return of capital does not necessarily reflect the Fund’s investment performance and should not be confused with “yield” or “income”. When distributions exceed total return performance, the difference will incrementally reduce the Fund’s net asset value per share. | |
Premium/Discount Information
Information on the Fund’s net asset value, market price, premiums and discounts, and bid-ask spreads can be found at iShares.com.
| | |
SUPPLEMENTAL INFORMATION | | 55 |
Trustee and Officer Information
The Board of Trustees has responsibility for the overall management and operations of the Funds, including general supervision of the duties performed by BFA and other service providers. Each Trustee serves until he or she resigns, is removed, dies, retires or becomes incapacitated. Each officer shall hold office until his or her successor is elected and qualifies or until his or her death, resignation or removal. Trustees who are not “interested persons” (as defined in the 1940 Act) of the Trust are referred to as independent trustees (“Independent Trustees”).
The registered investment companies advised by BFA or its affiliates (the “BlackRock-advised Funds”) are organized into one complex of open-end equity, multi-asset, index and money market funds and ETFs (the “BlackRock Multi-Asset Complex”), one complex of closed-end funds and open-end non-index fixed-income funds (including ETFs) (the “BlackRock Fixed-Income Complex”) and one complex of ETFs (“Exchange-Traded Fund Complex”) (each, a “BlackRock Fund Complex”). Each Fund is included in the Exchange-Traded Fund Complex. Each Trustee also serves as a Director of iShares, Inc. and a Trustee of iShares U.S. ETF Trust and, as a result, oversees all of the funds within the Exchange-Traded Fund Complex, which consists of 380 funds as of March 31, 2023. With the exception of Robert S. Kapito, Salim Ramji and Charles Park, the address of each Trustee and officer is c/o BlackRock, Inc., 400 Howard Street, San Francisco, CA 94105. The address of Mr. Kapito, Mr. Ramji and Mr. Park is c/o BlackRock, Inc., 50 Hudson Yards, New York, NY 10001. The Board has designated John E. Kerrigan as its Independent Board Chair. Additional information about the Funds’ Trustees and officers may be found in the Funds’ combined Statement of Additional Information, which is available without charge, upon request, by calling toll-free 1-800-iShares (1-800-474-2737).
| | | | | | |
| Interested Trustees |
| | | | |
Name (Year of Birth) | | Position(s) | | Principal Occupation(s) During Past 5 Years | | Other Directorships Held by Trustee |
| | | |
Robert S. Kapito(a) (1957) | | Trustee (since 2009). | | President, BlackRock, Inc. (since 2006); Vice Chairman of BlackRock, Inc. and Head of BlackRock’s Portfolio Management Group (since its formation in 1998) and BlackRock, Inc.’s predecessor entities (since 1988); Trustee, University of Pennsylvania (since 2009); President of Board of Directors, Hope & Heroes Children’s Cancer Fund (since 2002). | | Director of BlackRock, Inc. (since 2006); Director of iShares, Inc. (since 2009); Trustee of iShares U.S. ETF Trust (since 2011). |
| | | |
Salim Ramji(b) (1970) | | Trustee (since 2019). | | Senior Managing Director, BlackRock, Inc. (since 2014); Global Head of BlackRock’s ETF and Index Investments Business (since 2019); Head of BlackRock’s U.S. Wealth Advisory Business (2015-2019); Global Head of Corporate Strategy, BlackRock, Inc. (2014-2015); Senior Partner, McKinsey & Company (2010-2014). | | Director of iShares, Inc. (since 2019); Trustee of iShares U.S. ETF Trust (since 2019). |
|
(a) Robert S. Kapito is deemed to be an “interested person” (as defined in the 1940 Act) of the Trust due to his affiliations with BlackRock, Inc. and its affiliates. (b) Salim Ramji is deemed to be an “interested person” (as defined in the 1940 Act) of the Trust due to his affiliations with BlackRock, Inc. and its affiliates. |
| | | | | | |
| Independent Trustees |
| | | | |
Name (Year of Birth) | | Position(s) | | Principal Occupation(s) During Past 5 Years | | Other Directorships Held by Trustee |
| | | |
John E. Kerrigan (1955) | | Trustee (since 2005); Independent Board Chair (since 2022). | | Chief Investment Officer, Santa Clara University (since 2002). | | Director of iShares, Inc. (since 2005); Trustee of iShares U.S. ETF Trust (since 2011); Independent Board Chair of iShares, Inc. and iShares U.S. ETF Trust (since 2022). |
| | | |
Jane D. Carlin (1956) | | Trustee (since 2015); Risk Committee Chair (since 2016). | | Consultant (since 2012); Member of the Audit Committee (2012-2018), Chair of the Nominating and Governance Committee (2017-2018) and Director of PHH Corporation (mortgage solutions) (2012-2018); Managing Director and Global Head of Financial Holding Company Governance & Assurance and the Global Head of Operational Risk Management of Morgan Stanley (2006-2012). | | Director of iShares, Inc. (since 2015); Trustee of iShares U.S. ETF Trust (since 2015); Member of the Audit Committee (since 2016), Chair of the Audit Committee (since 2020) and Director of The Hanover Insurance Group, Inc. (since 2016). |
| | | |
Richard L. Fagnani (1954) | | Trustee (since 2017); Audit Committee Chair (since 2019). | | Partner, KPMG LLP (2002-2016); Director of One Generation Away (since 2021). | | Director of iShares, Inc. (since 2017); Trustee of iShares U.S. ETF Trust (since 2017). |
| | |
| 56 | | 2 0 2 3 I SHARES ANNUAL REPORT TO SHAREHOLDERS |
Trustee and Officer Information (continued)
| | | | | | |
| | | Independent Trustees | | |
| | | | |
Name (Year of Birth) | | Position(s) | | Principal Occupation(s) During Past 5 Years | | Other Directorships Held by Trustee |
| | | |
Cecilia H. Herbert (1949) | | Trustee (since 2005); Nominating and Governance and Equity Plus Committee Chairs (since 2022). | | Chair of the Finance Committee (since 2019) and Trustee and Member of the Finance, Audit and Quality Committees of Stanford Health Care (since 2016); Trustee of WNET, New York’s public media company (since 2011) and Member of the Audit Committee (since 2018), Investment Committee (since 2011) and Personnel Committee (since 2022); Chair (1994-2005) and Member (1992-2021) of the Investment Committee, Archdiocese of San Francisco; Trustee of Forward Funds (14 portfolios) (2009-2018); Trustee of Salient MF Trust (4 portfolios) (2015- 2018); Director (1998-2013) and President (2007-2011) of the Board of Directors, Catholic Charities CYO; Trustee (2002-2011) and Chair of the Finance and Investment Committee (2006-2010) of the Thacher School; Director of the Senior Center of Jackson Hole (since 2020); Director of the Jackson Hole Center for the Arts (since 2021); Member of the Wyoming State Investment Funds Committee (since 2022). | | Director of iShares, Inc. (since 2005); Trustee of iShares U.S. ETF Trust (since 2011). |
| | | |
Drew E. Lawton (1959) | | Trustee (since 2017); 15(c) Committee Chair (since 2017). | | Senior Managing Director of New York Life Insurance Company (2010-2015). | | Director of iShares, Inc. (since 2017); Trustee of iShares U.S. ETF Trust (since 2017); Director of Jackson Financial Inc. (since 2021). |
| | | |
John E. Martinez (1961) | | Trustee (since 2003); Securities Lending Committee Chair (since 2019). | | Director of Real Estate Equity Exchange, Inc. (since 2005); Director of Cloudera Foundation (2017-2020); and Director of Reading Partners (2012-2016). | | Director of iShares, Inc. (since 2003); Trustee of iShares U.S. ETF Trust (since 2011). |
| | | |
Madhav V. Rajan (1964) | | Trustee (since 2011); Fixed Income Plus Committee Chair (since 2019). | | Dean, and George Pratt Shultz Professor of Accounting, University of Chicago Booth School of Business (since 2017); Advisory Board Member (since 2016) and Director (since 2020) of C.M. Capital Corporation; Chair of the Board for the Center for Research in Security Prices, LLC (since 2020); Robert K. Jaedicke Professor of Accounting, Stanford University Graduate School of Business (2001-2017); Professor of Law (by courtesy), Stanford Law School (2005-2017); Senior Associate Dean for Academic Affairs and Head of MBA Program, Stanford University Graduate School of Business (2010-2016). | | Director of iShares, Inc. (since 2011); Trustee of iShares U.S. ETF Trust (since 2011). |
| | | | |
| Officers |
| | | |
Name (Year of Birth) | | Position(s) | | Principal Occupation(s) During Past 5 Years |
| | |
Dominik Rohé (1973) | | President (since 2023). | | Managing Director, BlackRock, Inc. (since 2005); Head of Americas ETF and Index Investments (since 2023); Head of Latin America (2019- 2023). |
| | |
Trent Walker (1974) | | Treasurer and Chief Financial Officer (since 2020). | | Managing Director, BlackRock, Inc. (since September 2019); Chief Financial Officer of iShares Delaware Trust Sponsor LLC, BlackRock Funds, BlackRock Funds II, BlackRock Funds IV, BlackRock Funds V and BlackRock Funds VI (since 2021); Executive Vice President of PIMCO (2016-2019); Senior Vice President of PIMCO (2008-2015); Treasurer (2013-2019) and Assistant Treasurer (2007-2017) of PIMCO Funds, PIMCO Variable Insurance Trust, PIMCO ETF Trust, PIMCO Equity Series, PIMCO Equity Series VIT, PIMCO Managed Accounts Trust, 2 PIMCO-sponsored interval funds and 21 PIMCO-sponsored closed-end funds. |
| | |
Charles Park (1967) | | Chief Compliance Officer (since 2006). | | Chief Compliance Officer of BlackRock Advisors, LLC and the BlackRock-advised Funds in the BlackRock Multi-Asset Complex and the BlackRock Fixed-Income Complex (since 2014); Chief Compliance Officer of BFA (since 2006). |
| | |
Marisa Rolland (1980) | | Secretary (since 2022). | | Managing Director, BlackRock, Inc. (since 2023); Director, BlackRock, Inc. (2018-2022); Vice President, BlackRock, Inc. (2010-2017). |
| | |
Rachel Aguirre (1982) | | Executive Vice President (since 2022). | | Managing Director, BlackRock, Inc. (since 2018); Director, BlackRock, Inc. (2009-2018); Head of U.S. iShares Product (since 2022); Head of EII U.S. Product Engineering (since 2021); Co.-Head of EII’s Americas Portfolio Engineering (2020-2021); Head of Developed Markets Portfolio Engineering (2016-2019). |
| | |
Jennifer Hsui (1976) | | Executive Vice President (since 2022). | | Managing Director, BlackRock, Inc. (since 2009); Co.-Head of Index Equity (since 2022). |
| | |
James Mauro (1970) | | Executive Vice President (since 2022). | | Managing Director, BlackRock, Inc. (since 2010); Head of Fixed Income Index Investments in the Americas and Head of San Francisco Core Portfolio Management (since 2020). |
Effective June 15, 2022, Marisa Rolland replaced Deepa Damre Smith as Secretary.
| | |
TRUSTEE AND OFFICER INFORMATION | | 57 |
Trustee and Officer Information (continued)
Effective March 30, 2023, Dominik Rohé replaced Armando Senra as President.
| | |
| 58 | | 2 0 2 3 I SHARES ANNUAL REPORT TO SHAREHOLDERS |
General Information
Electronic Delivery
Shareholders can sign up for e-mail notifications announcing that the shareholder report or prospectus has been posted on the iShares website at iShares.com. Once you have enrolled, you will no longer receive prospectuses and shareholder reports in the mail.
To enroll in electronic delivery:
| | • | | If your brokerage firm is not listed, electronic delivery may not be available. Please contact your broker-dealer or financial advisor. |
Householding
Householding is an option available to certain fund investors. Householding is a method of delivery, based on the preference of the individual investor, in which a single copy of certain shareholder documents and Rule 30e-3 notices can be delivered to investors who share the same address, even if their accounts are registered under different names. Please contact your broker-dealer if you are interested in enrolling in householding and receiving a single copy of prospectuses and other shareholder documents, or if you are currently enrolled in householding and wish to change your householding status.
Availability of Quarterly Schedule of Investments
The Funds file their complete schedule of portfolio holdings with the SEC for the first and third quarters of each fiscal year as an exhibit to their reports on Form N-PORT. The Funds’ Forms N-PORT are available on the SEC’s website at sec.gov. Additionally, each Fund makes its portfolio holdings for the first and third quarters of each fiscal year available at iShares.com/fundreports.
Availability of Proxy Voting Policies and Proxy Voting Records
A description of the policies and procedures that the iShares Funds use to determine how to vote proxies relating to portfolio securities and information about how the iShares Funds voted proxies relating to portfolio securities during the most recent twelve-month period ending June 30 is available without charge, upon request (1) by calling toll-free 1-800-474-2737; (2) on the iShares website at iShares.com; and (3) on the SEC website at sec.gov.
A description of the Trust’s policies and procedures with respect to the disclosure of the Fund’s portfolio securities is available in the Fund Prospectus. The Fund discloses its portfolio holdings daily and provides information regarding its top holdings in Fund fact sheets at iShares.com.
| | |
| 60 | | 2 0 2 3 I SHARES ANNUAL REPORT TO SHAREHOLDERS |
Glossary of Terms Used in this Report
| | |
| Portfolio Abbreviation |
| |
| NVS | | Non-Voting Shares |
| |
| REIT | | Real Estate Investment Trust |
| |
| S&P | | Standard & Poor’s |
| | |
GLOSSARY OF TERMS USED IN THIS REPORT | | 61 |
THIS PAGE INTENTIONALLY LEFT BLANK.
THIS PAGE INTENTIONALLY LEFT BLANK.
Want to know more?
iShares.com | 1-800-474-2737
This report is intended for the Funds’ shareholders. It may not be distributed to prospective investors unless it is preceded or accompanied by the current prospectus.
Investing involves risk, including possible loss of principal.
The iShares Funds are distributed by BlackRock Investments, LLC (together with its affiliates, “BlackRock”).
The iShares Funds are not sponsored, endorsed, issued, sold or promoted by S&P Dow Jones Indices LLC, nor does this company make any representations regarding the advisability of investing in the iShares Funds. BlackRock is not affiliated with the company listed above.
©2022 BlackRock, Inc. All rights reserved. iSHARES and BLACKROCK are registered trademarks of BlackRock, Inc. or its subsidiaries. All other marks are the property of their respective owners.
iS-AR-315-0323
(b) Not Applicable
The registrant has adopted a code of ethics, as of the end of the period covered by this report, applicable to the registrant’s principal executive officer, principal financial officer, principal accounting officer or controller, or persons performing similar functions. During the period covered by this report, the registrant has not amended the code of ethics and there have been no waivers granted under the code of ethics. The registrant undertakes to provide a copy of the code of ethics to any person upon request, without charge, by calling 1-800-474-2737.
| Item 3. | Audit Committee Financial Expert. |
The registrant’s Board of Trustees has determined that the registrant has more than one audit committee financial expert, as that term is defined under Item 3(b) and 3(c), serving on its audit committee. The audit committee financial experts serving on the registrant’s audit committee are Richard L. Fagnani and Madhav V. Rajan, all of whom are independent, as that term is defined under Item 3(a)(2).
| Item 4. | Principal Accountant Fees and Services. |
The principal accountant fees disclosed in items 4(a), 4(b), 4(c), 4(d) and 4(g) are for the twenty-one series of the registrant for which the fiscal year-end is March 31, 2023 (the “Funds”), and whose annual financial statements are reported in Item 1.
(a) Audit Fees – The aggregate fees billed for each of the last two fiscal years for professional services rendered by the principal accountant for the audit of the Funds’ annual financial statements or services that are normally provided by the accountant in connection with statutory and regulatory filings or engagements for those fiscal years were $270,700 for the fiscal year ended March 31, 2022 and $283,700 for the fiscal year ended March 31, 2023.
(b) Audit-Related Fees – There were no fees billed for the fiscal years ended March 31, 2022 and March 31, 2023 for assurance and related services by the principal accountant that were reasonably related to the performance of the audit of the Fund’s financial statements and are not reported under (a) of this Item.
(c) Tax Fees – The aggregate fees billed in each of the last two fiscal years for professional services rendered by the principal accountant for tax compliance, tax advice and tax planning for the Funds were $203,700 for the fiscal year ended March 31, 2022 and $203,700 for the fiscal year ended March 31, 2023. These services related to the review of the Funds’ tax returns and excise tax calculations.
(d) All Other Fees – There were no other fees billed in each of the fiscal years ended March 31, 2022 and March 31, 2023 for products and services provided by the principal accountant, other than the services reported in (a) through (c) of this Item.
(e) (1) The registrant’s audit committee charter, as amended, provides that the audit committee is responsible for the approval, prior to appointment, of the engagement of the principal accountant to annually audit and provide their opinion on the registrant’s financial statements. The audit committee must also approve, prior to appointment, the engagement of the principal accountant to provide non-audit services to the registrant or to any entity controlling, controlled by or under common control with the registrant’s investment adviser (“Adviser Affiliate”) that provides ongoing services to the registrant, if the engagement relates directly to the operations and financial reporting of the registrant.
(2) There were no services described in (b) through (d) above that were approved by the audit committee pursuant to paragraph (c)(7)(i)(C) of Rule 2-01 of Regulation S-X.
(f) Not Applicable
(g) The aggregate non-audit fees billed by the registrant’s principal accountant for services rendered to the Funds, and rendered to the registrant’s investment adviser, and any Adviser Affiliate that provides ongoing services to the registrant for the last two fiscal years were $203,700 for the fiscal year ended March 31, 2022 and $203,700 for the fiscal year ended March 31, 2023.
(h) The registrant’s audit committee has considered whether the provision of non-audit services rendered to the registrant’s investment adviser and any Adviser Affiliate that provides ongoing services to the registrant that were not pre-approved pursuant to paragraph (c)(7)(ii) of Rule 2-01 of Regulation S-X, if any, is compatible with maintaining the principal accountant’s independence, and has determined that the provision of these services, if any, does not compromise the principal accountant’s independence.
(i) Not Applicable
(j) Not Applicable
| Item 5. | Audit Committee of Listed Registrants |
(a) The registrant is a listed issuer as defined in Rule 10A-3 under the Exchange Act of 1934 and has a separately-designated standing audit committee established in accordance with Section 3(a)(58)(A) of the Exchange Act of 1934. The registrant’s audit committee members are Richard L. Fagnani, Cecilia H. Herbert and Madhav V. Rajan.
(b) Not applicable.
(a) Schedules of investments are included as part of the reports to shareholders filed under Item 1 of this Form.
(b) Not applicable.
| Item 7. | Disclosure of Proxy Voting Policies and Procedures for Closed-End Management Investment Companies. |
Not applicable to the registrant.
| Item 8. | Portfolio Managers of Closed-End Management Investment Companies. |
Not applicable to the registrant.
| Item 9. | Purchases of Equity Securities by Closed-End Management Investment Company and Affiliated Purchasers. |
Not applicable to the registrant.
| Item 10. | Submission of Matters to a Vote of Security Holders. |
There were no material changes to the procedures by which shareholders may recommend nominees to the registrant’s Board of Trustees.
| Item 11. | Controls and Procedures. |
(a) The President (the registrant’s Principal Executive Officer) and Treasurer and Chief Financial Officer (the registrant’s Principal Financial Officer) have concluded that the registrant’s disclosure controls and procedures (as defined in Rule 30a-3(c) under the Investment Company Act of 1940) are effective as of a date within 90 days of the filing date of this report, based on their evaluation of these controls and procedures required by Rule 30a-3(b) under the Investment Company Act of 1940 and Rules 13a-15(b) or 15d-15(b) under the Exchange Act of 1934.
(b) There were no changes in the registrant’s internal control over financial reporting (as defined in Rule 30a-3(d) under the Investment Company Act of 1940) that occurred during the period covered by this report that have materially affected, or are reasonably likely to materially affect, the registrant’s internal control over financial reporting.
| Item 12. | Disclosure of Securities Lending Activities for Closed-End Management Investment Companies. |
Not applicable to the registrant.
(a) (1) Code of Ethics is not filed as an exhibit; please refer to Item 2.
(a) (2) Section 302 Certifications are attached.
(a) (3) Any written solicitation to purchase securities under Rule 23c-1 – Not Applicable.
(a) (4) Change in Registrant’s independent public accountant – Not Applicable.
(b) Section 906 Certifications are attached.
SIGNATURES
Pursuant to the requirements of the Securities Exchange Act of 1934 and the Investment Company Act of 1940, the registrant has duly caused this report to be signed on its behalf by the undersigned, thereunto duly authorized.
iShares Trust
| | | | |
| | By: | | /s/ Dominik Rohe |
| | | | Dominik Rohe, President (Principal Executive Officer) |
Date: May 25, 2023
Pursuant to the requirements of the Securities Exchange Act of 1934 and the Investment Company Act of 1940, this report has been signed below by the following persons on behalf of the registrant and in the capacities and on the dates indicated.
| | | | |
| | By: | | /s/ Dominik Rohe |
| | | | Dominik Rohe, President (Principal Executive Officer) |
Date: May 25, 2023
| | | | |
| | By: | | /s/ Trent Walker |
| | | | Trent Walker, Treasurer and Chief Financial Officer (Principal Financial Officer) |
Date: May 25, 2023