UNITED STATES
SECURITIES AND EXCHANGE COMMISSION
Washington, D.C. 20549
FORM N-CSR
CERTIFIED SHAREHOLDER REPORT
OF REGISTERED MANAGEMENT INVESTMENT COMPANIES
Investment Company Act file number 811-09729
iShares Trust
(Exact name of registrant as specified in charter)
c/o BlackRock Fund Advisors
400 Howard Street, San Francisco, CA 94105
(Address of principal executive offices) (Zip code)
The Corporation Trust Company
1209 Orange Street, Wilmington, DE 19801
(Name and address of agent for service)
Registrant’s telephone number, including area code: (415) 670-2000
Date of fiscal year end: March 31, 2024
Date of reporting period: March 31, 2024
Item 1. Reports to Stockholders.
(a) The Report to Shareholders is attached herewith.
|
• iShares Copper and Metals Mining ETF | ICOP | NASDAQ |
• iShares Environmental Infrastructure and Industrials ETF | EFRA | NASDAQ |
• iShares Global 100 ETF | IOO | NYSE Arca |
• iShares Global Infrastructure ETF | IGF | NASDAQ |
• iShares Global Timber & Forestry ETF | WOOD | NASDAQ |
• iShares Lithium Miners and Producers ETF | ILIT | NASDAQ |
|

Rob Kapito
President, BlackRock Inc.
Dear Shareholder,
The combination of continued economic growth and cooling inflation provided a supportive backdrop for investors during the 12-month reporting period ended March 31, 2024. Higher interest rates helped to rein in inflation, and the Consumer Price Index decelerated substantially while remaining above pre-pandemic levels. A moderating labor market helped ease inflationary pressure, although wages continued to grow. Wage and job growth powered robust consumer spending, backstopping the economy. On October 7, 2023, Hamas launched a horrific attack on Israel. The ensuing war has had a significant humanitarian impact and could lead to heightened economic and market volatility. We see geopolitics as a structural market risk going forward. See our geopolitical risk dashboard at blackrock.com for more details.
Equity returns were robust during the period, as interest rates stabilized and the economy proved to be more resilient than many investors expected. The U.S. economy continued to show strength, and growth further accelerated in the second half of 2023. Large-capitalization U.S. stocks posted particularly substantial gains, supported by the performance of a few notable technology companies, while small-capitalization U.S. stocks’ advance was slower but still robust. Meanwhile, international developed market equities also gained strongly, while emerging market stocks advanced at a more modest pace.
The 10-year U.S. Treasury yield rose during the reporting period, as investors reacted to elevated inflation and attempted to anticipate future interest rate changes. However, higher yields drove positive returns overall for 10-year U.S. Treasuries and solid gains in shorter-duration U.S. Treasuries. The corporate bond market benefited from improving economic sentiment, although high-yield corporate bond prices fared significantly better than investment-grade bonds as demand from yield-seeking investors remained strong.
The U.S. Federal Reserve (the “Fed”), attempting to manage persistent inflation, raised interest rates twice during the 12-month period, but paused its tightening after its July meeting. The Fed also continued to reduce its balance sheet by not replacing some of the securities that reach maturity.
Supply constraints appear to have become an embedded feature of the new macroeconomic environment, making it difficult for developed economies to increase production without sparking higher inflation. Geopolitical fragmentation and an aging population risk further exacerbating these constraints, keeping the labor market tight and wage growth high. Although the Fed has stopped tightening for now, we believe that the new economic regime means that the Fed will need to maintain high rates for an extended period despite the market’s hopes for rapid interest rate cuts, as reflected in the ongoing rally. In this new regime, we anticipate greater volatility and dispersion of returns, creating more opportunities for selective portfolio management.
Looking at developed market stocks, we have an overweight stance on U.S. stocks overall, particularly given the promise of emerging AI technologies. We are also overweight Japanese stocks as shareholder-friendly policies generate increased investor interest, although we maintain an underweight stance on European stocks. In credit, there are selective opportunities in the near term despite tighter credit and financial conditions. For fixed income investing with a six- to twelve-month horizon, we see the most attractive investments in short-term U.S. Treasuries and hard-currency emerging market bonds.
Overall, our view is that investors need to think globally, position themselves to be prepared for a decarbonizing economy, and be nimble as market conditions change. We encourage you to talk with your financial advisor and visit iShares.com for further insight about investing in today’s markets.
Rob Kapito
President, BlackRock Inc.
Total Returns as of March 31, 2024 |
| | |
U.S. large cap equities
(S&P 500® Index) | | |
U.S. small cap equities
(Russell 2000® Index) | | |
International equities
(MSCI Europe, Australasia, Far East Index) | | |
Emerging market equities
(MSCI Emerging Markets Index) | | |
3-month Treasury bills
(ICE BofA 3-Month U.S. Treasury Bill Index) | | |
U.S. Treasury securities
(ICE BofA 10-Year U.S. Treasury Index) | | |
U.S. investment grade bonds
(Bloomberg U.S. Aggregate Bond Index) | | |
Tax-exempt municipal bonds
(Bloomberg Municipal Bond Index) | | |
U.S. high yield bonds
(Bloomberg U.S. Corporate High Yield 2% Issuer Capped Index) | | |
Past performance is not an indication of future results. Index performance is shown for illustrative purposes only. You cannot invest directly in an index. |
2This Page is not Part of Your Fund Report
iShares Trust
Global Market Overview
Global equity markets advanced during the 12 months ended March 31, 2024 (“reporting period”), supported by continued economic growth and moderating inflation in most parts of the world. The MSCI ACWI, a broad global equity index that includes both developed and emerging markets, returned 23.22% in U.S. dollar terms for the reporting period. Despite concerns about the impact of higher interest rates and rising prices, the global economy was resilient, posting moderate growth in 2023 at a similar pace to the prior year. Inflation began to subside in most regions of the world, as stabilizing energy prices and improved supply chains reduced pressure on consumers. However, geopolitical tensions were high during the reporting period, raising concerns about global economic disruptions from wars in Ukraine and Gaza. Following a terrorist attack on Israel by Hamas, Israel’s retaliation in Gaza and the resulting humanitarian impact raised tensions in the region, leading to counterstrikes between Israel, the U.S., and regional militant organizations. The events raised concerns among market participants that further escalation could lead to a broad regional war.
Among developed economies, the U.S. stood out, growing at a robust pace in 2023 despite elevated interest rates and persistent inflation. The U.S. consumer helped to power the expansion, as consumer spending continued to grow in both nominal and real (inflation-adjusted) terms. A strong labor market bolstered consumer spending, as employers continued to add jobs and average hourly wages increased notably. Consumer spending was also supported by higher asset values, as both home prices and strong equity performance increased household net worth. While improved supply chains eased goods inflation, the tight labor market kept labor costs near record highs, and growing services inflation was a significant driver of inflation’s overall persistence.
To counteract inflation, the U.S. Federal Reserve Bank (“Fed”) raised interest rates twice early in the reporting period, reaching the highest level since 2001. However, the Fed paused its interest rate increases thereafter as inflation edged down, keeping interest rates steady following its July 2023 meeting. The Fed also continued to decrease the size of its balance sheet by reducing the store of U.S. Treasuries it had accumulated to stabilize markets in the early phases of the coronavirus pandemic. Projections released by the Fed late in the reporting period included several interest rate decreases later in 2024, as it forecast that inflation would continue to moderate despite the robust economy.
European stocks posted strong gains as energy prices stabilized and inflation decelerated sharply. While growth in the Eurozone was nearly flat, the tepid economy meant that consumer spending was moderate, resulting in less upward pressure on prices. The European Central Bank (“ECB”) raised interest rates four times in the first half of the reporting period but declined to increase interest rates thereafter, citing progress in lowering inflation.
Asia-Pacific region stocks also advanced, albeit at a slower pace than other regions of the world. Japan returned to moderate growth in the fourth quarter of 2023 following a contraction in the third quarter. Solid exports, rising profits, and a series of corporate reforms bolstered Japanese equities. However, Chinese stocks were negatively impacted by investor concerns about government regulations and rising geopolitical tensions with the U.S. Meanwhile, emerging market stocks gained, helped by the pausing of interest rate increases from the Fed and the ECB. Stocks in India advanced significantly amid strong economic growth and robust corporate earnings, as India’s expanding middle class bolstered consumer spending.
42024 iShares Annual Report to Shareholders
Fund Summary as of March 31, 2024
iShares® Copper and Metals Mining ETF
Investment Objective
The iShares Copper and Metals Mining ETF (the “Fund”) seeks to track the investment results of an index composed of U.S. and non-U.S. equities of companies primarily engaged in copper and metal ore mining, as represented by the STOXX Global Copper and Metals Mining Index (the "Index"). The Fund invests in a representative sample of securities included in the Index that collectively has an investment profile similar to the Index. Due to the use of representative sampling, the Fund may or may not hold all of the securities that are included in the Index.
Performance
GROWTH OF $10,000 INVESTMENT(SINCE INCEPTION AT NET ASSET VALUE)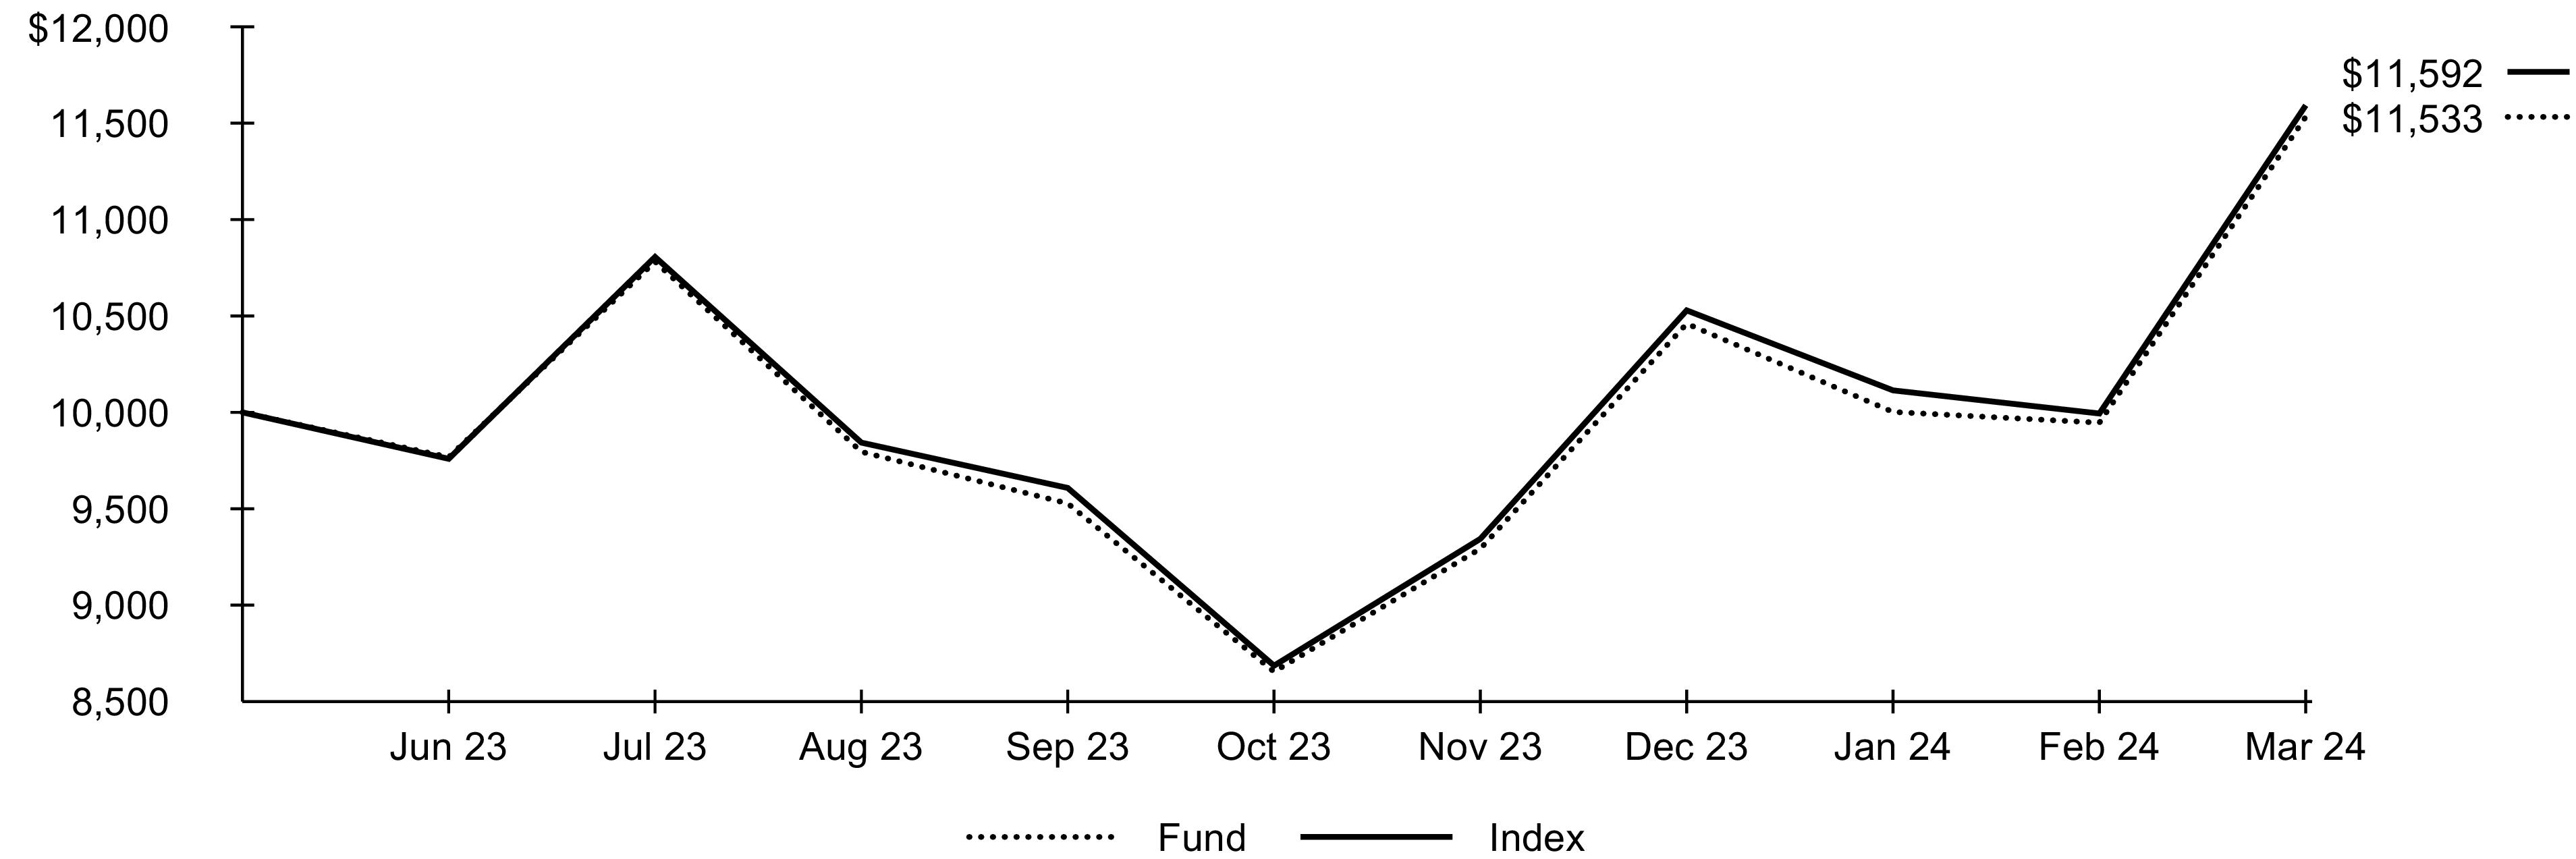
The inception date of the Fund was June 21, 2023. The first day of secondary market trading was June 23, 2023.
Past performance is not an indication of future results. Performance results do not reflect the deduction of taxes that a shareholder would pay on fund distributions or on the redemption or sale of fund shares. See “About Fund Performance” for more information.
Expense Example
| | |
Beginning
Account Value
(10/01/23) | Ending
Account Value
(03/31/24) | | Beginning
Account Value
(10/01/23) | Ending
Account Value
(03/31/24) | | |
| | | | | | |
| Expenses are equal to the annualized expense ratio, multiplied by the average account value over the period, multiplied by 183/366 (to reflect the one-half year period shown). Other fees, such as brokerage commissions and other fees to financial intermediaries, may be paid which are not reflected in the tables and examples above. See “Disclosure of Expenses” for more information. |
Fund Summary as of March 31, 2024 (continued)
iShares® Copper and Metals Mining ETF
Portfolio Management Commentary
Stocks of companies primarily engaged in copper and metal ore mining advanced for the reporting period. While the price of copper on global trading markets was nearly flat overall, prices fluctuated during the course of the reporting period. Global copper production in 2023 was similar to production in 2022, reflecting tepid industrial demand and a slow recovery in manufacturing in some countries, particularly China, one of the world’s largest consumers of copper. Nonetheless, ongoing decarbonization efforts drove significant investments in electrical infrastructure, electric vehicles, and windmills, all of which require substantial use of copper.
Copper prices, which tend to be highly sensitive to interest rates, shifted with expectations for central bank monetary policy during the reporting period. The Fed left interest rates unchanged late in the reporting period after a series of large interest rate increases, so copper prices fell, then recovered in anticipation of lower carrying costs and a boost in economic activity.
Canadian stocks contributed the most to the Index’s return. Following two interest rate increases early in the reporting period, the Bank of Canada kept interest rates steady. A large copper mining project hit its production target despite electrical grid instability, while cost management supported industry profitability.
Peruvian copper miners also contributed to the Index’s performance, despite lower earnings and production. One of Peru’s largest copper miners initiated legal action to counter illegal mining activities, which slowed the development of a large mining project.
Stocks of copper mining companies in the U.K. also advanced. A large miner that operates in Chile reported higher revenue and earnings while investing in the development of a new mine. The industry also benefited from cost management efforts and attempts to reduce carbon emissions.
Chinese stocks further contributed to the Index’s return, led by a miner with significant operations in Zambia and the Democratic Republic of Congo. Earnings per share increased despite lower revenue overall.
Portfolio Information
INDUSTRY ALLOCATION
| |
| |
Diversified Metals & Mining | |
| |
| |
TEN LARGEST HOLDINGS
| |
Grupo Mexico SAB de CV, Series B | |
| |
| |
| |
| |
Ivanhoe Mines Ltd., Class A | |
| |
First Quantum Minerals Ltd. | |
| |
| |
| Excludes money market funds. |
62024 iShares Annual Report to Shareholders
Fund Summary as of March 31, 2024
iShares® Environmental Infrastructure and Industrials ETF
Investment Objective
The iShares Environmental Infrastructure and Industrials ETF (the “Fund”) seeks to track the investment results of an index composed of U.S. and non-U.S. companies that provide infrastructure and industrials solutions aiming to support energy efficiency and emissions mitigation, pollution reduction or land and resource optimization, as represented by the FTSE Green Revenues Select Infrastructure and Industrials Index (the “Index”). The Fund invests in a representative sample of securities included in the Index that collectively has an investment profile similar to the Index. Due to the use of representative sampling, the Fund may or may not hold all of the securities that are included in the Index.
Performance
| Average Annual Total Returns | | |
| | | | | |
| | | | | |
| | | | | |
| | | | | |
GROWTH OF $10,000 INVESTMENT(SINCE INCEPTION AT NET ASSET VALUE)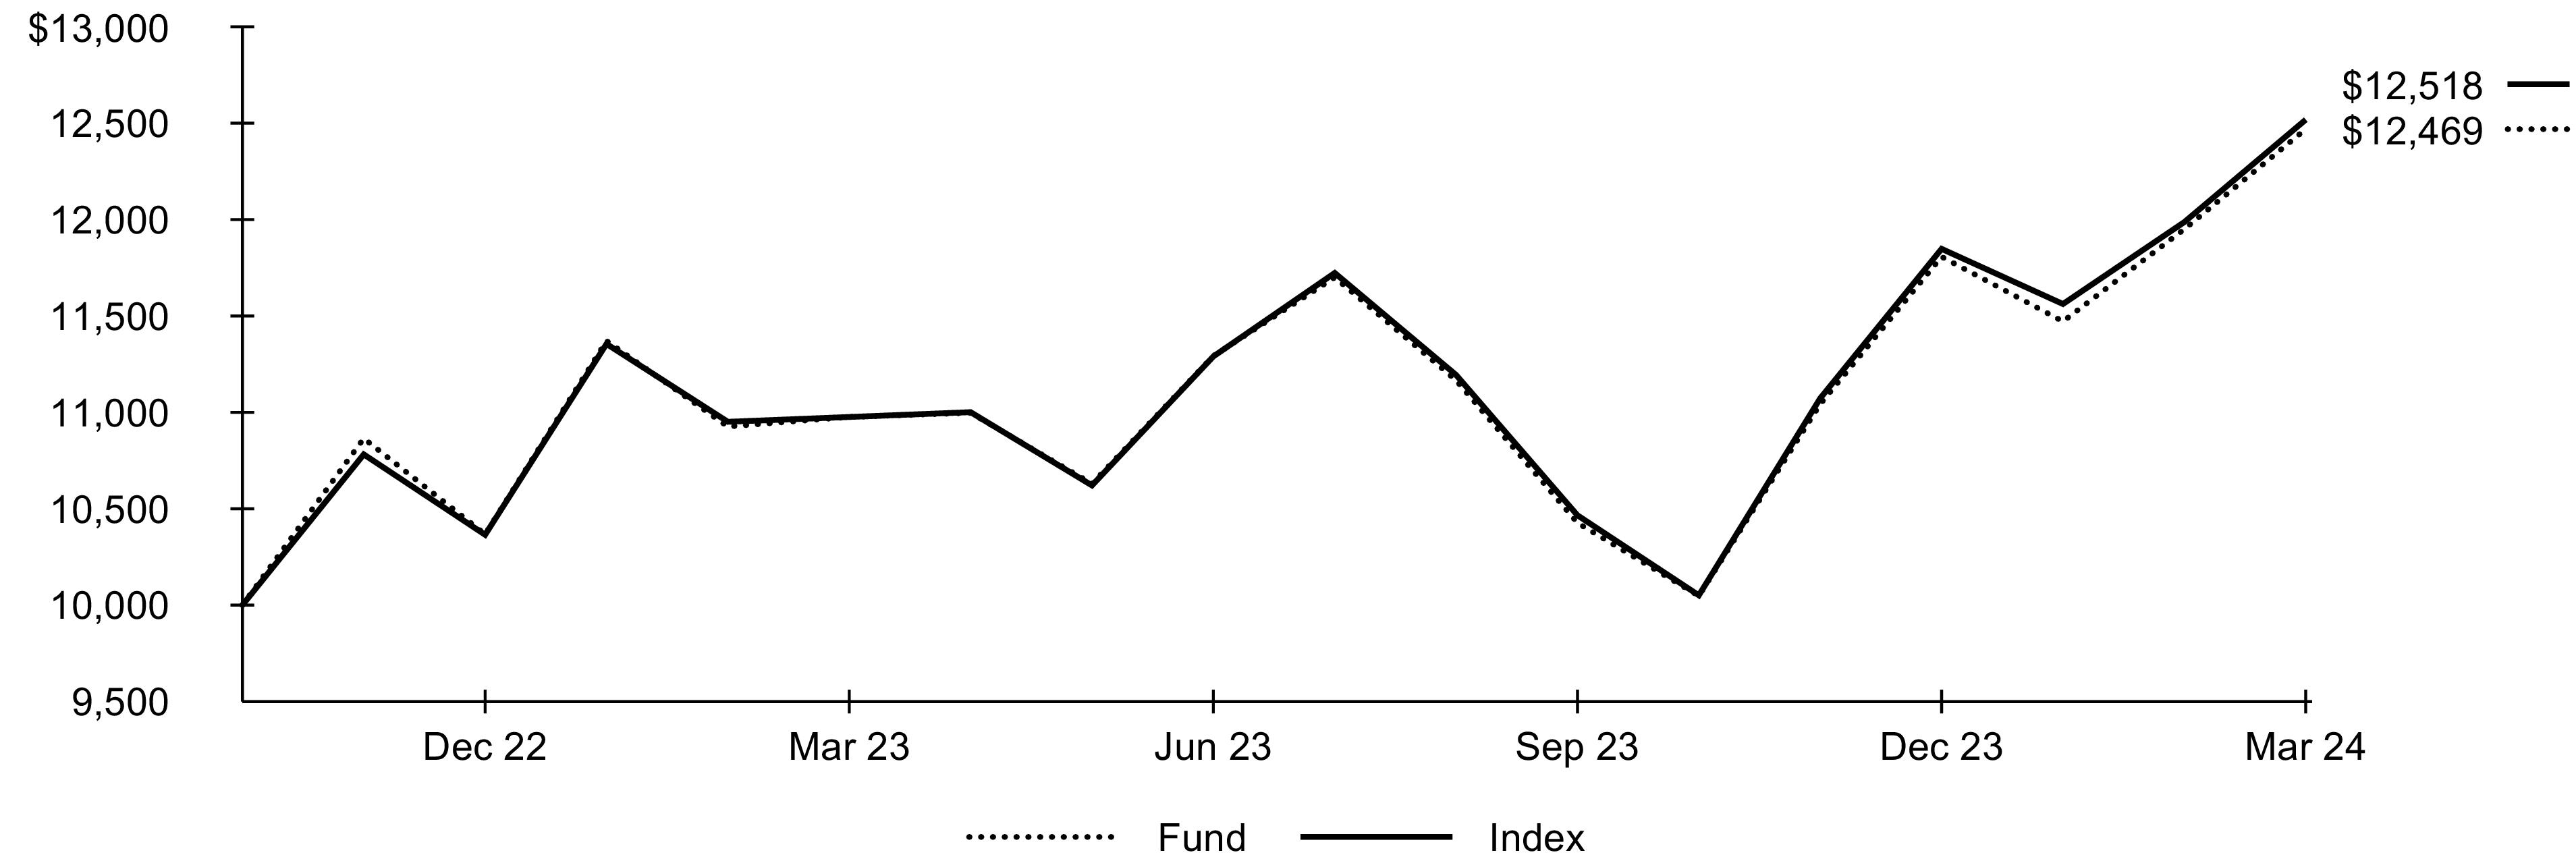
The inception date of the Fund was November 1, 2022. The first day of secondary market trading was November 3, 2022.
Past performance is not an indication of future results. Performance results do not reflect the deduction of taxes that a shareholder would pay on fund distributions or on the redemption or sale of fund shares. See “About Fund Performance” for more information.
Expense Example
| | |
Beginning
Account Value
(10/01/23) | Ending
Account Value
(03/31/24) | | Beginning
Account Value
(10/01/23) | Ending
Account Value
(03/31/24) | | |
| | | | | | |
| Expenses are equal to the annualized expense ratio, multiplied by the average account value over the period, multiplied by 183/366 (to reflect the one-half year period shown). Other fees, such as brokerage commissions and other fees to financial intermediaries, may be paid which are not reflected in the tables and examples above. See “Disclosure of Expenses” for more information. |
Fund Summary as of March 31, 2024 (continued)
iShares® Environmental Infrastructure and Industrials ETF
Portfolio Management Commentary
Global stocks of companies that provide infrastructure and industrial solutions for environmental issues posted a strong advance for the reporting period. Stocks in the U.S., which represented approximately 53% of the Index on average, contributed the most to the Index’s performance amid a global surge in infrastructure investment, solid U.S. economic growth and significant federal subsidies for certain types of infrastructure projects. In addition to several other notable bills, the 2022 Inflation Reduction Act allocated substantial funds for rebates and incentives to promote environmentally focused infrastructure. The combination of a strong economy and government subsidies drove a surge in construction and investment, leading to substantial gains among infrastructure stocks.
The U.S. industrials sector contributed the most to the Index’s return, led by the machinery industry. Strong demand for freight and transit train cars and related products drove revenue higher, enabling an increase in dividends. Robust sales of commercial water solutions and fluid treatment products helped to offset lower revenue from residential pool equipment.
Environmental infrastructure companies in the U.K. also advanced. In the industrials sector, the professional services industry drove gains amid solid revenue from sustainability assurance and testing services, particularly relating to battery technology and medical devices. The materials sector was another source of strength, as the potential acquisition of a paper packaging company sent stock prices higher. The Brazilian utilities sector further contributed to the Index’s return, as earnings and revenue exceeded analysts’ expectations.
On the downside, the materials sector in South Africa detracted from the Index’s return, as decreasing revenue due to lower platinum-group metal prices weighed on profit margins. In Belgium, the materials sector declined amid lower sales of components for rechargeable batteries.
Portfolio Information
TEN LARGEST HOLDINGS
| |
American Water Works Co. Inc. | |
Westinghouse Air Brake Technologies Corp. | |
| |
| |
| |
| |
Advanced Drainage Systems Inc. | |
| |
| |
| |
| Excludes money market funds. |
82024 iShares Annual Report to Shareholders
Fund Summary as of March 31, 2024
Investment Objective
The iShares Global 100 ETF (the “Fund”) seeks to track the investment results of an index composed of 100 large-capitalization global equities, as represented by the S&P Global 100TM (the “Index”). The Fund invests in a representative sample of securities included in the Index that collectively has an investment profile similar to the Index. Due to the use of representative sampling, the Fund may or may not hold all of the securities that are included in the Index.
Performance
| Average Annual Total Returns | | |
| | | | | | | |
| | | | | | | |
| | | | | | | |
| | | | | | | |
GROWTH OF $10,000 INVESTMENT(AT NET ASSET VALUE)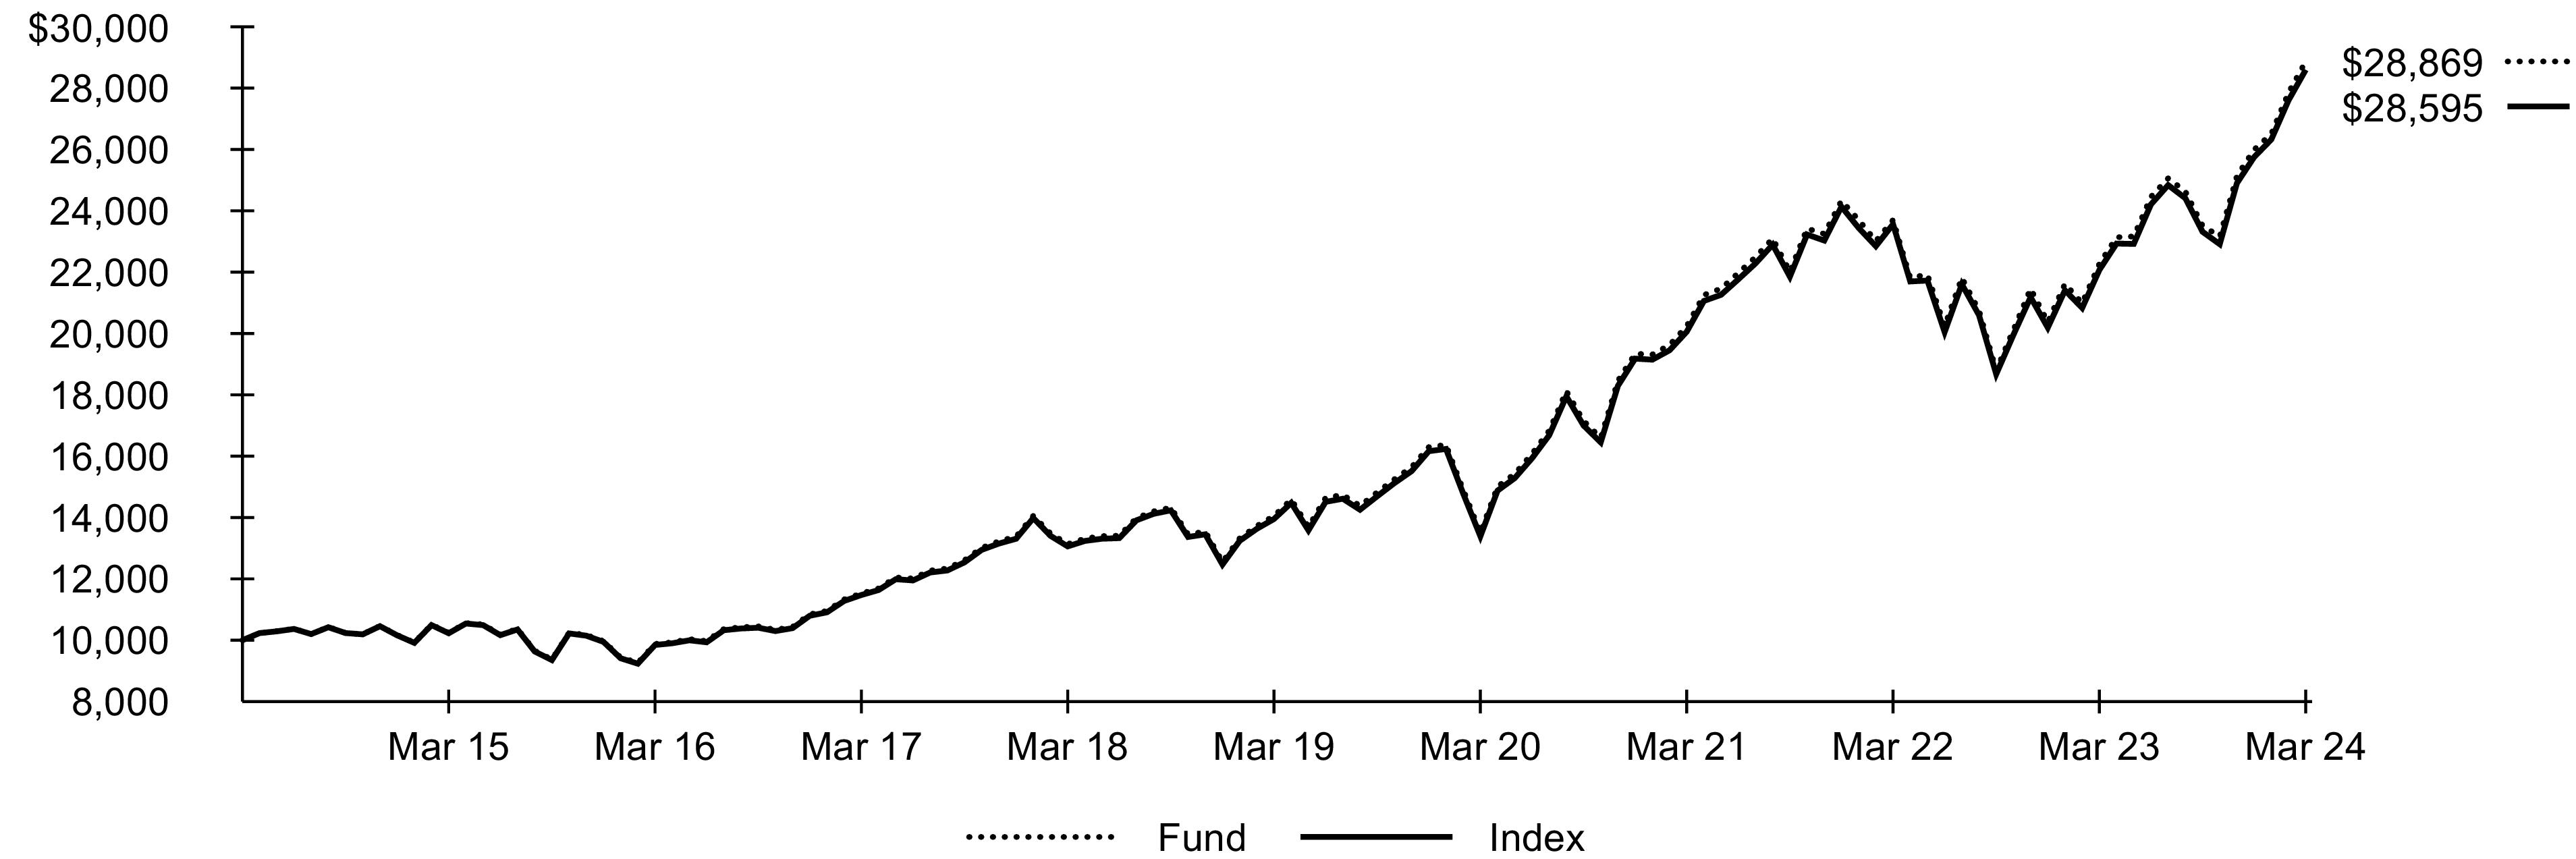
Past performance is not an indication of future results. Performance results do not reflect the deduction of taxes that a shareholder would pay on fund distributions or on the redemption or sale of fund shares. See “About Fund Performance” for more information.
Expense Example
| | |
Beginning
Account Value
(10/01/23) | Ending
Account Value
(03/31/24) | | Beginning
Account Value
(10/01/23) | Ending
Account Value
(03/31/24) | | |
| | | | | | |
| Expenses are equal to the annualized expense ratio, multiplied by the average account value over the period, multiplied by 183/366 (to reflect the one-half year period shown). Other fees, such as brokerage commissions and other fees to financial intermediaries, may be paid which are not reflected in the tables and examples above. See “Disclosure of Expenses” for more information. |
Fund Summary as of March 31, 2024 (continued)
Portfolio Management Commentary
Large-capitalization global stocks advanced strongly for the reporting period amid resilient global economic growth and cooling inflation in most parts of the world. Stocks from the U.S., which represented approximately 75% of the Index on average, contributed the most to the Index’s return.
Within the U.S., the information technology sector was the largest source of strength amid notable innovations in artificial intelligence (“AI”) technology. Rapid advances in generative AI, which allows users to generate outputs using simple natural language queries, drove a surge in investor enthusiasm for products and technologies associated with AI. The semiconductors industry gained the most, as companies purchased specialized chips used to provide computing capacity for AI applications, which require significant processing power. Additionally, the semiconductors industry continued to invest in building the next generation of processors for AI applications, further supporting stock prices.
The U.S. software and services industry also posted significant gains, driven by strength among systems software companies. Enthusiasm for generative AI products benefited a large company in the industry with a significant investment in a prominent consumer-facing AI platform, a chatbot that grew its user base more quickly than any other consumer application in history. Integration of AI into already existing productivity software also propelled gains, as many customers adopted new AI features that automated certain writing and coding tasks.
The U.S. consumer discretionary sector also contributed. As the U.S. economy continued to expand, consumers increased their spending at a robust pace, driving substantial gains in the sector. Despite rising interest rates and higher borrowing costs, spending remained resilient, as strong household balance sheets, higher wages, and elevated asset prices supported consumers. Higher online sales and new AI cloud services propelled gains in the broadline retail industry.
Japanese stocks further contributed to the Index’s performance, led by the consumer discretionary sector. Robust demand for hybrid electric vehicles and strong pricing bolstered revenues and profit margins in the automobiles and components industry. Stocks in the Netherlands also contributed, as the semiconductors and semiconductor equipment industry benefited from a recovery in demand for microchips.
Portfolio Information
SECTOR ALLOCATION
| |
| |
| |
| |
| |
| |
| |
| |
| |
| |
Other (each representing less than 1%) | |
TEN LARGEST COUNTRIES
Country/Geographic Region | |
| |
| |
| |
| |
| |
| |
| |
| |
| |
| |
| Excludes money market funds. |
102024 iShares Annual Report to Shareholders
Fund Summary as of March 31, 2024
iShares® Global Infrastructure ETF
Investment Objective
The iShares Global Infrastructure ETF (the “Fund”) seeks to track the investment results of an index composed of developed market equities in the infrastructure industry, as represented by the S&P Global Infrastructure IndexTM (the “Index”). The Fund invests in a representative sample of securities included in the Index that collectively has an investment profile similar to the Index. Due to the use of representative sampling, the Fund may or may not hold all of the securities that are included in the Index.
Performance
| Average Annual Total Returns | | |
| | | | | | | |
| | | | | | | |
| | | | | | | |
| | | | | | | |
GROWTH OF $10,000 INVESTMENT(AT NET ASSET VALUE)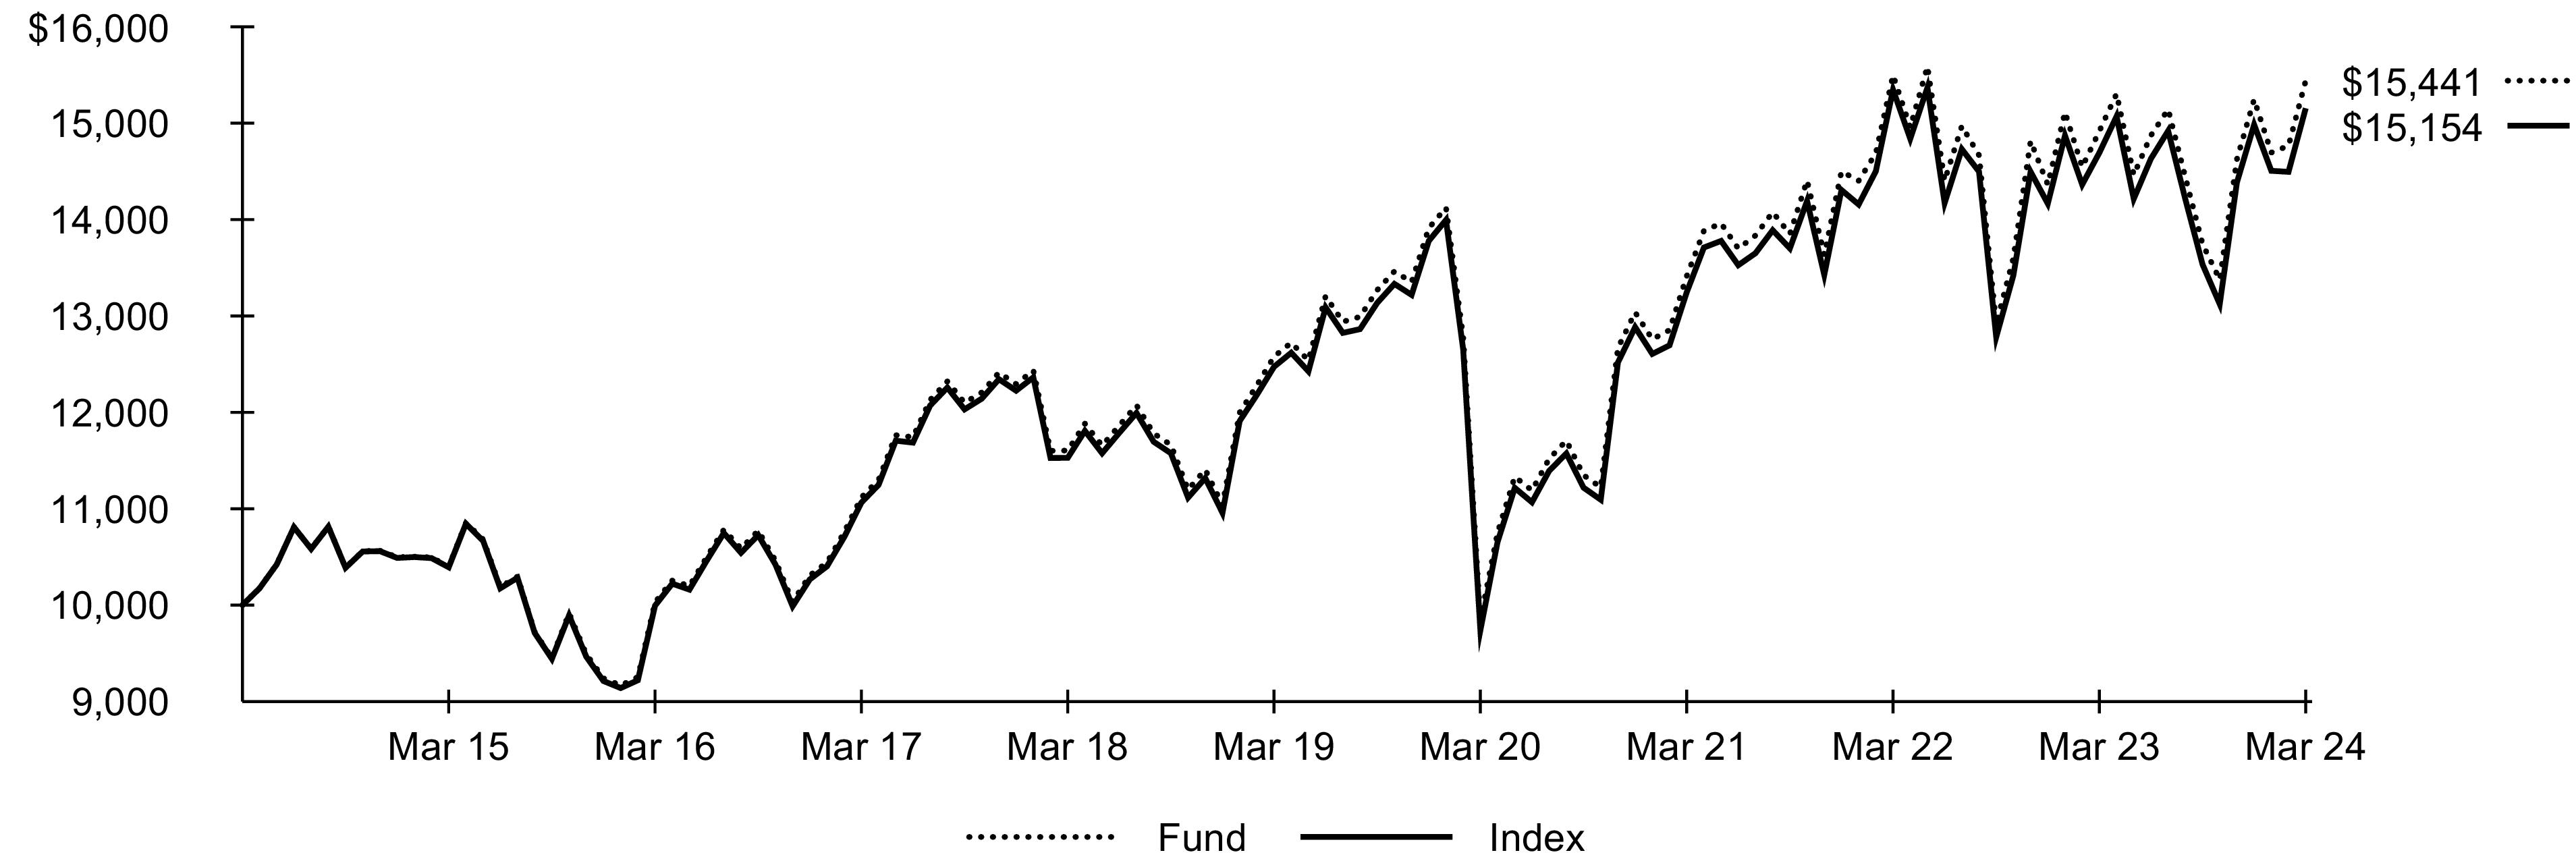
Past performance is not an indication of future results. Performance results do not reflect the deduction of taxes that a shareholder would pay on fund distributions or on the redemption or sale of fund shares. See “About Fund Performance” for more information.
Expense Example
| | |
Beginning
Account Value
(10/01/23) | Ending
Account Value
(03/31/24) | | Beginning
Account Value
(10/01/23) | Ending
Account Value
(03/31/24) | | |
| | | | | | |
| Expenses are equal to the annualized expense ratio, multiplied by the average account value over the period, multiplied by 183/366 (to reflect the one-half year period shown). Other fees, such as brokerage commissions and other fees to financial intermediaries, may be paid which are not reflected in the tables and examples above. See “Disclosure of Expenses” for more information. |
Fund Summary as of March 31, 2024 (continued)
iShares® Global Infrastructure ETF
Portfolio Management Commentary
Global infrastructure stocks advanced for the reporting period amid solid global economic growth. Stocks from the U.S., which represented approximately 39% of the Index on average, contributed the most to the Index’s performance amid solid U.S. economic growth and significant federal subsidies for certain types of infrastructure projects. The Infrastructure Investment and Jobs Act, passed in 2021, continued to disburse funds, while the CHIPS and Science act of 2022 promoted significant investments in microchip manufacturing. The combination of a strong economy and government subsidies drove a surge in infrastructure construction and investment, leading to substantial gains among infrastructure stocks.
The U.S. energy sector contributed the most to the Index’s return, as both oil and natural gas production in the U.S. reached all-time highs. Disruption to energy markets following Russia’s 2022 invasion of Ukraine and efforts by the government to stabilize energy prices drove investment in domestic production. The war also significantly impacted European energy markets, which imported large quantities of Russian natural gas prior to the invasion. European countries pivoted to alternative sources of gas, including U.S. liquefied natural gas. The surge in U.S. oil and natural gas production benefited the oil and gas storage and transportation industry, which provides energy infrastructure such as pipelines and storage facilities. Expansion in the industry drove strong earnings and allowed for investments in new projects while also raising dividends.
Spanish infrastructure stocks also contributed to the Index’s performance, as the Spanish economy posted faster growth than the E.U. average, bolstered by a strong recovery in tourism. The robust tourist economy drove gains in the industrials sector, where the airport services industry benefited from increased passenger traffic. Rising air travel in Spain and Latin America drove strong gains in revenues and profit, and approval for an airport fee increase by the Spanish government further buoyed the industry’s outlook.
On the downside, Chinese stocks detracted from the Index’s performance, amid slowing consumer spending and deflation. The transportation infrastructure industry in the industrials sector declined the most, as analysts adjusted their revenue forecasts down following an earnings report.
Portfolio Information
INDUSTRY ALLOCATION
| |
| |
| |
Oil & Gas Storage & Transportation | |
| |
| |
| |
| |
Other (each representing less than 1%) | |
TEN LARGEST COUNTRIES
Country/Geographic Region | |
| |
| |
| |
| |
| |
| |
| |
| |
| |
| |
| Excludes money market funds. |
122024 iShares Annual Report to Shareholders
Fund Summary as of March 31, 2024
iShares® Global Timber & Forestry ETF
Investment Objective
The iShares Global Timber & Forestry ETF (the “Fund”) seeks to track the investment results of an index composed of global equities in or related to the timber and forestry industry, as represented by the S&P Global Timber & Forestry IndexTM (the “Index”). The Fund invests in a representative sample of securities included in the Index that collectively has an investment profile similar to the Index. Due to the use of representative sampling, the Fund may or may not hold all of the securities that are included in the Index.
Performance
| Average Annual Total Returns | | |
| | | | | | | |
| | | | | | | |
| | | | | | | |
| | | | | | | |
| The NAV total return presented in the table for the one-year period differs from the same period return disclosed in the financial highlights. The total return in the financial highlights is calculated in the same manner but differs due to certain adjustments made for financial reporting purposes in accordance with U.S. generally accepted accounting principles. |
GROWTH OF $10,000 INVESTMENT(AT NET ASSET VALUE)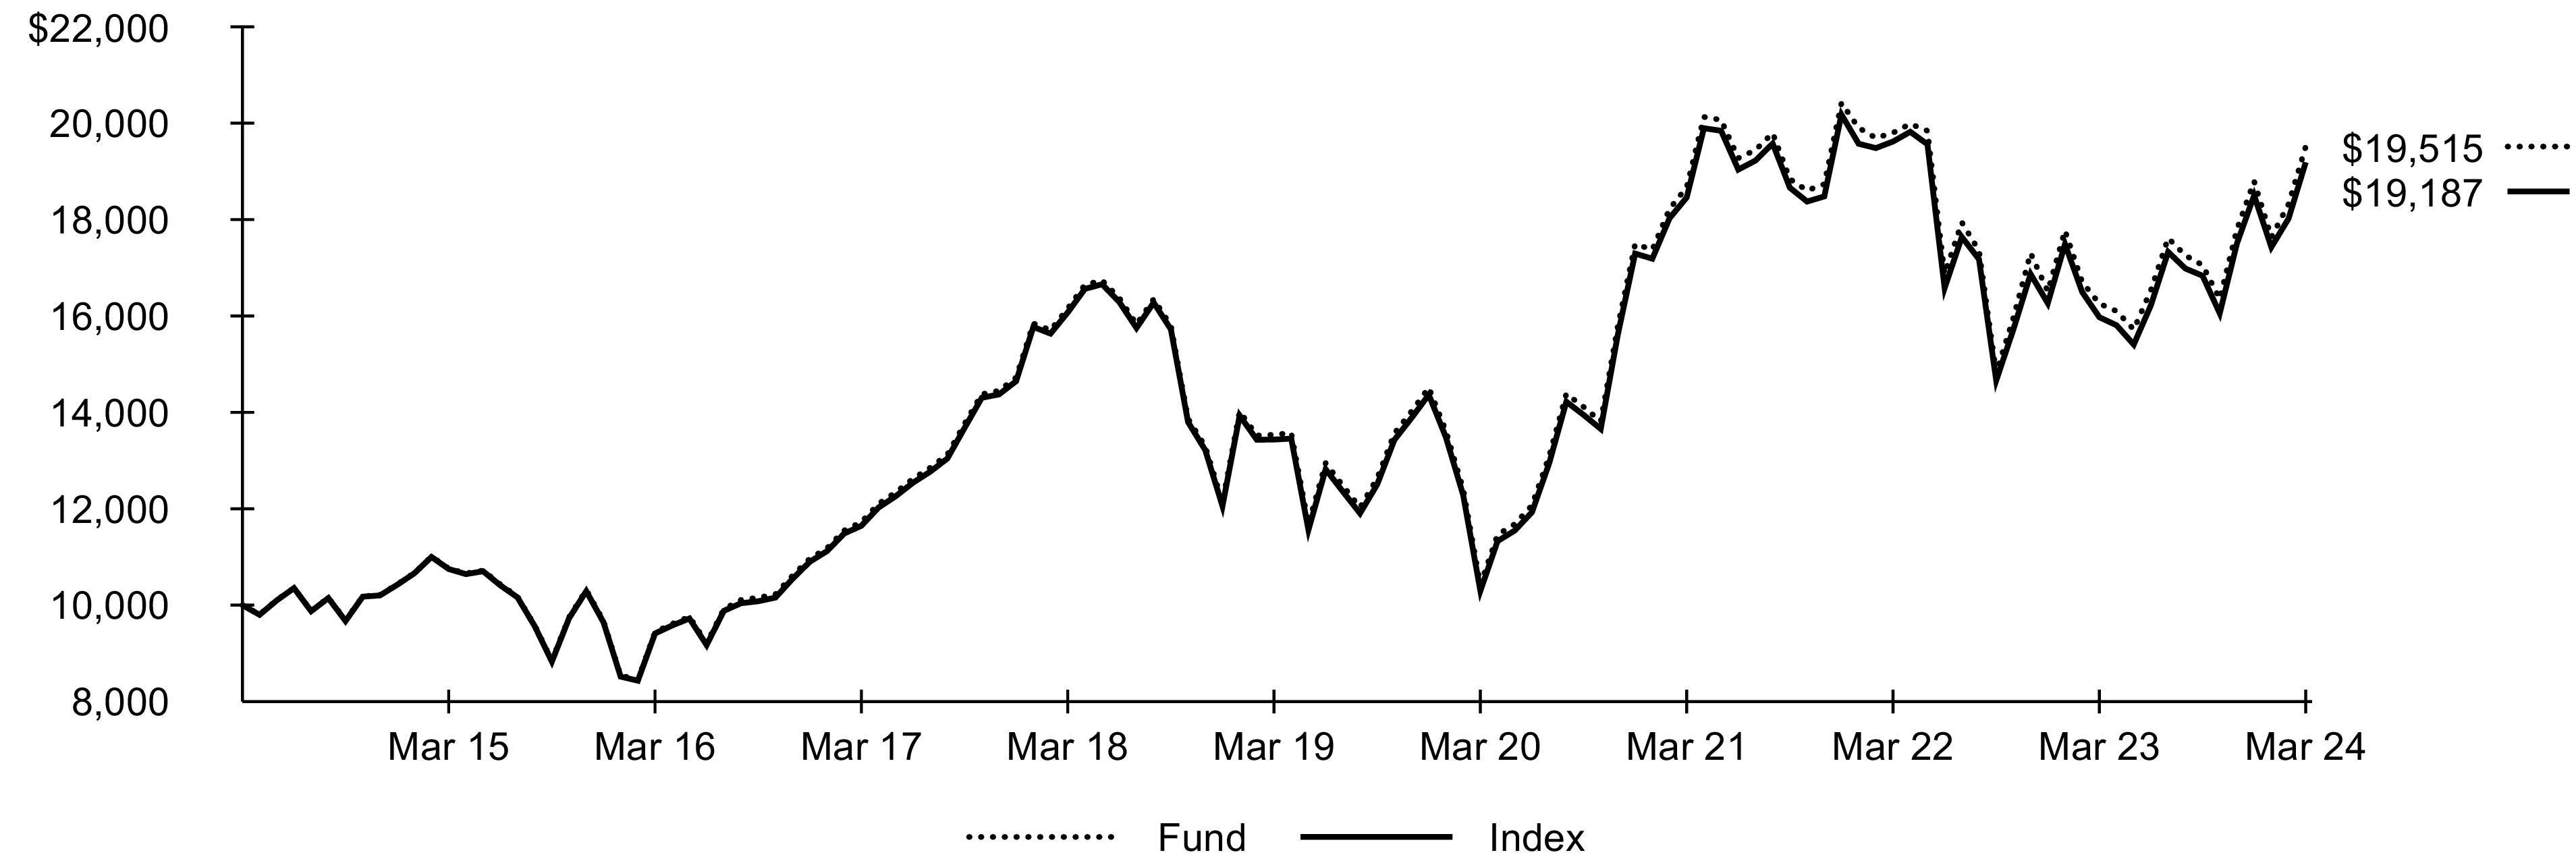
Past performance is not an indication of future results. Performance results do not reflect the deduction of taxes that a shareholder would pay on fund distributions or on the redemption or sale of fund shares. See “About Fund Performance” for more information.
Expense Example
| | |
Beginning
Account Value
(10/01/23) | Ending
Account Value
(03/31/24) | | Beginning
Account Value
(10/01/23) | Ending
Account Value
(03/31/24) | | |
| | | | | | |
| Expenses are equal to the annualized expense ratio, multiplied by the average account value over the period, multiplied by 183/366 (to reflect the one-half year period shown). Other fees, such as brokerage commissions and other fees to financial intermediaries, may be paid which are not reflected in the tables and examples above. See “Disclosure of Expenses” for more information. |
Fund Summary as of March 31, 2024 (continued)
iShares® Global Timber & Forestry ETF
Portfolio Management Commentary
Global timber and forestry stocks rose substantially during the reporting period, driven by a strong performance in the U.S. and Brazil, as the outlook for the global economy improved. U.S. equities contributed the most to the Index’s return, led by the containers and packaging industry within the materials sector. While the industry as a whole saw decreased demand for its products due to both slower economic growth and concerns about an eventual recession, sales volumes generally improved over the reporting period as markets became more optimistic about the economy achieving a soft landing. Within the industry, some leading manufacturers of packaging materials made concerted efforts to improve efficiency, reduce costs, and make strategic acquisitions, buoying investor sentiment.
Equities in Brazil also contributed significantly to the Index’s return, led by the paper products industry. The country’s exports of pulp, the primary raw material used in making paper, increased early in the reporting period, with a notable rise in exports to China and North America. However, the combination of increased supply and depressed economic activity in targeted markets led to falling pulp prices, creating a challenging market for paper producers. However, the outlook for U.S. and global economic growth improved significantly as the reporting period progressed. This improvement allowed major producers of paper to increase prices late in the reporting period, providing a material boost to revenue.
Equities in Japan also contributed, led by the homebuilding industry in the consumer discretionary sector. Early in the reporting period, monthly U.S. housing starts surged to their highest level since 1990, as a shortage of single-family homes and prospects for lower interest rates encouraged renewed building activity. As such, Japan-based homebuilding companies with a significant presence in the U.S. or that were active in acquiring U.S.-based homebuilding companies over the reporting period were able to benefit from increased activity.
Portfolio Information
INDUSTRY ALLOCATION
| |
| |
Paper & Plastic Packaging Products & Materials | |
| |
| |
| |
Oil & Gas Refining & Marketing | |
TEN LARGEST COUNTRIES
Country/Geographic Region | |
| |
| |
| |
| |
| |
| |
| |
| |
| |
| |
| Excludes money market funds. |
142024 iShares Annual Report to Shareholders
Fund Summary as of March 31, 2024
iShares® Lithium Miners and Producers ETF
Investment Objective
The iShares Lithium Miners and Producers ETF (the “Fund”) seeks to track the investment results of an index composed of U.S. and non-U.S. equities of companies primarily engaged in lithium ore mining and/or lithium compounds manufacturing, as represented by the STOXX Global Lithium Miners and Producers Index (the "Index"). The Fund invests in a representative sample of securities included in the Index that collectively has an investment profile similar to the Index. Due to the use of representative sampling, the Fund may or may not hold all of the securities that are included in the Index.
Performance
GROWTH OF $10,000 INVESTMENT(SINCE INCEPTION AT NET ASSET VALUE)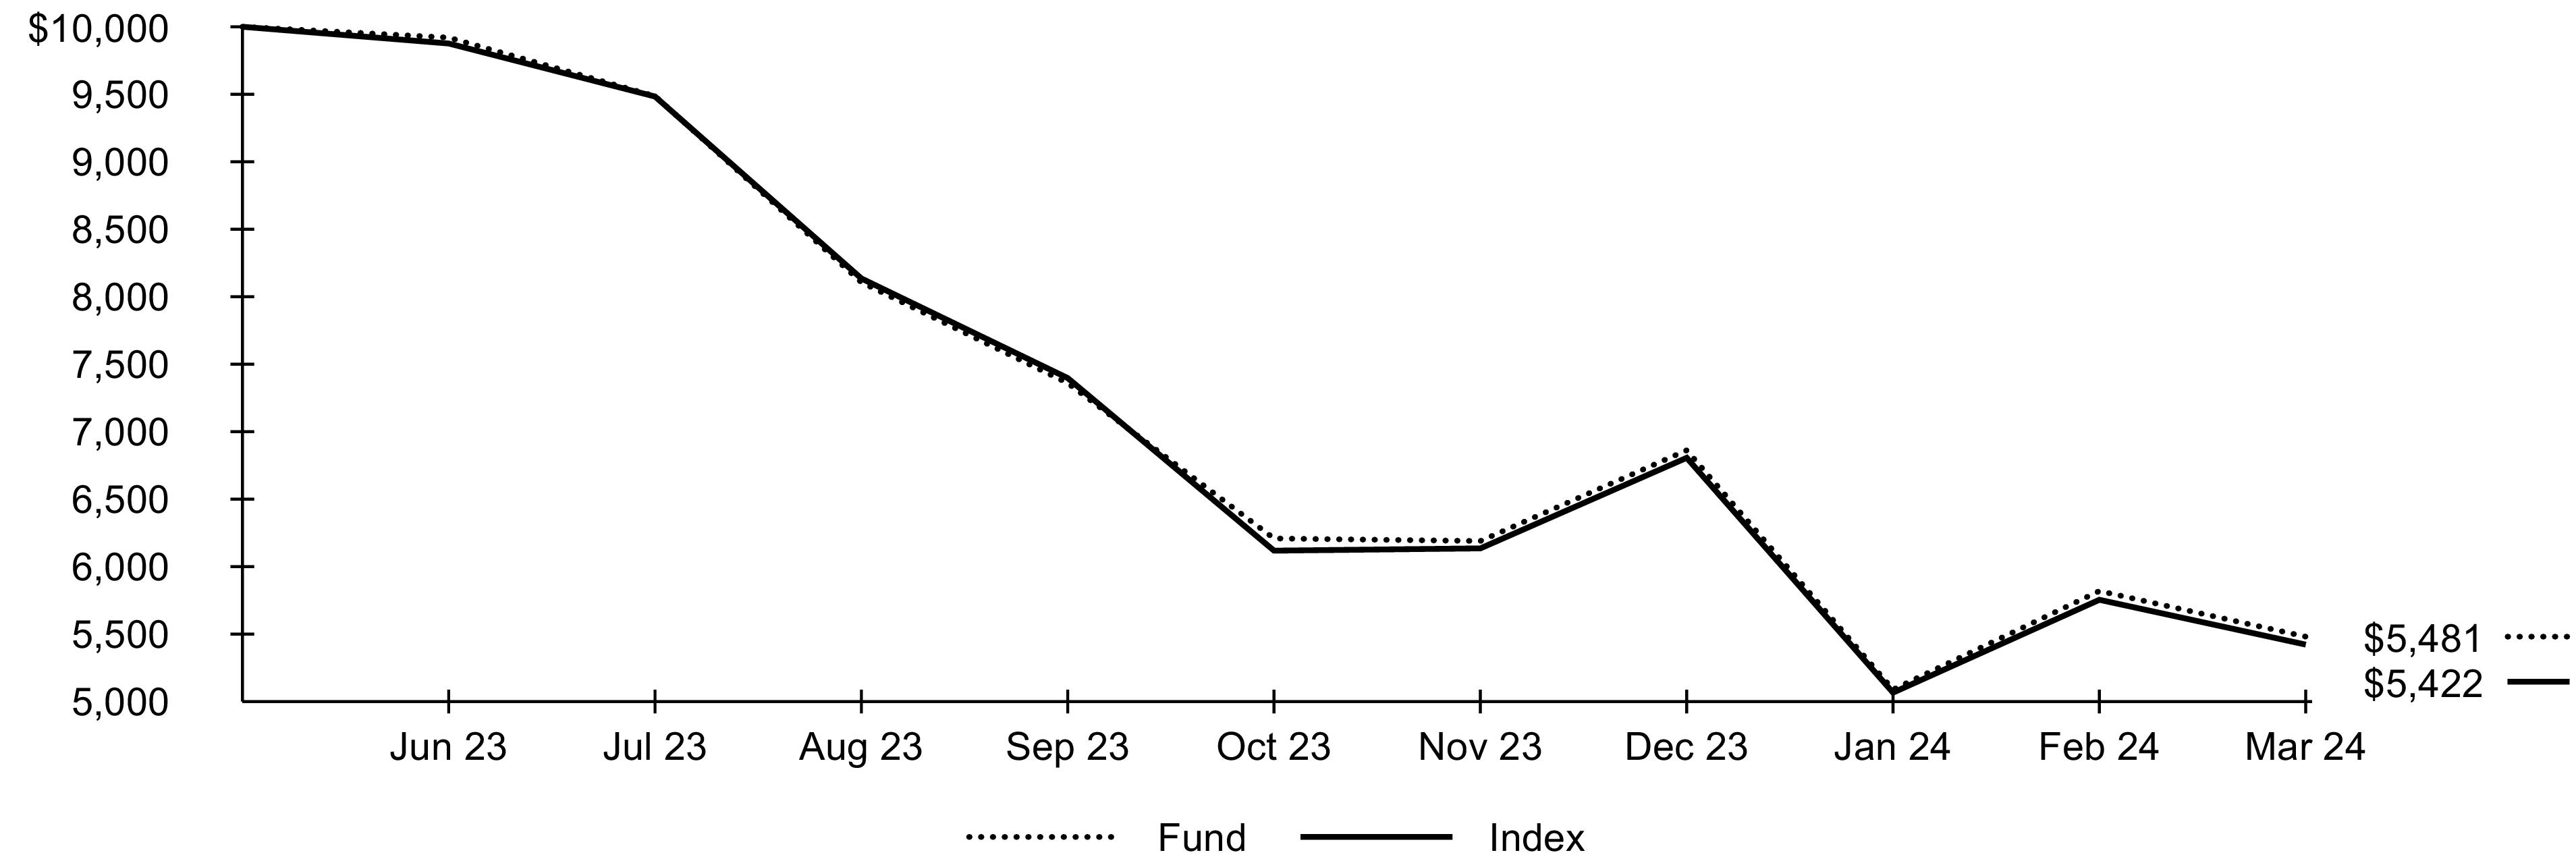
The inception date of the Fund was June 21, 2023. The first day of secondary market trading was June 23, 2023.
Past performance is not an indication of future results. Performance results do not reflect the deduction of taxes that a shareholder would pay on fund distributions or on the redemption or sale of fund shares. See “About Fund Performance” for more information.
Expense Example
| | |
Beginning
Account Value
(10/01/23) | Ending
Account Value
(03/31/24) | | Beginning
Account Value
(10/01/23) | Ending
Account Value
(03/31/24) | | |
| | | | | | |
| Expenses are equal to the annualized expense ratio, multiplied by the average account value over the period, multiplied by 183/366 (to reflect the one-half year period shown). Other fees, such as brokerage commissions and other fees to financial intermediaries, may be paid which are not reflected in the tables and examples above. See “Disclosure of Expenses” for more information. |
Fund Summary as of March 31, 2024 (continued)
iShares® Lithium Miners and Producers ETF
Portfolio Management Commentary
The stocks of global lithium miners and producers declined significantly for the reporting period amid a sharp decrease in the price of lithium. Lithium is an important component in the manufacture of some types of rechargeable batteries, in particular batteries for powering electric vehicles (“EVs”), which use a large proportion of mined lithium. Consequently, the price of lithium tends to fluctuate with expectations for EV production. Prior to the beginning of the reporting period, rapid increases in EV production drove lithium prices to record levels amid concerns that demand would outstrip supply. However, higher prices drove new exploration and production efforts, and lithium supply increased significantly in 2023. Meanwhile, a slowdown in EV sales, despite car makers offering discounted prices and selling below cost, led analysts to lower their outlook for EV adoption. This slowdown created a mismatch between lithium supply and demand, driving down the price of lithium and weighing on the stocks of lithium producers. Lithium’s sharp price decline required the industry to cut costs and curtail expansion plans.
Australian lithium mining stocks detracted the most from the Index’s performance. Revenue in the industry declined rapidly as the realized price of its principal product fell by 75%. A large Australian miner implemented a leadership change as the company investigated expanding its non-lithium mining operations to offset weakness from lithium revenue. Headwinds in the market for lithium also prompted restructuring activity, as companies reacted to difficult financial conditions. A large Australian lithium producer was acquired by a major U.S. producer, creating a new company that can operate across the lithium supply chain.
U.S. stocks also detracted from the Index’s return, despite government efforts to encourage domestic lithium production. Regulatory uncertainty, technical challenges, and low lithium prices worked against the U.S. lithium industry. The industry instituted cost-cutting measures that deferred spending, reduced headcount, and paused expansions into new projects.
Portfolio Information
INDUSTRY ALLOCATION
| |
Diversified Metals & Mining | |
| |
Electrical Components & Equipment | |
| |
Technology Hardware, Storage & Peripherals | |
TEN LARGEST HOLDINGS
| |
| |
Sociedad Quimica y Minera de Chile SA | |
| |
| |
| |
| |
SK IE Technology Co. Ltd. | |
| |
| |
Tianqi Lithium Corp., Class A | |
| Excludes money market funds. |
162024 iShares Annual Report to Shareholders
Past performance is not an indication of future results. Financial markets have experienced extreme volatility and trading in many instruments has been disrupted. These circumstances may continue for an extended period of time and may continue to affect adversely the value and liquidity of each Fund’s investments. As a result, current performance may be lower or higher than the performance data quoted. Performance data current to the most recent month-end is available at iShares.com. Performance results assume reinvestment of all dividends and capital gain distributions and do not reflect the deduction of taxes that a shareholder would pay on fund distributions or on the redemption or sale of fund shares. The investment return and principal value of shares will vary with changes in market conditions. Shares may be worth more or less than their original cost when they are redeemed or sold in the market. Performance for certain funds may reflect a waiver of a portion of investment advisory fees. Without such a waiver, performance would have been lower.
Net asset value or “NAV” is the value of one share of a fund as calculated in accordance with the standard formula for valuing mutual fund shares. Beginning August 10, 2020, the price used to calculate market return (“Market Price”) is the closing price. Prior to August 10, 2020, Market Price was determined using the midpoint between the highest bid and the lowest ask on the primary stock exchange on which shares of a fund are listed for trading, as of the time that such fund’s NAV is calculated. Since shares of a fund may not trade in the secondary market until after the fund’s inception, for the period from inception to the first day of secondary market trading in shares of the fund, the NAV of the fund is used as a proxy for the Market Price to calculate market returns. Market and NAV returns assume that dividends and capital gain distributions have been reinvested at Market Price and NAV, respectively.
An index is a statistical composite that tracks a specified financial market or sector. Unlike a fund, an index does not actually hold a portfolio of securities and therefore does not incur the expenses incurred by a fund. These expenses negatively impact fund performance. Also, index returns do not include brokerage commissions that may be payable on secondary market transactions. If brokerage commissions were included, index returns would be lower.
Disclosure of Expenses
Shareholders of each Fund may incur the following charges: (1) transactional expenses, including brokerage commissions on purchases and sales of fund shares and (2) ongoing expenses, including management fees and other fund expenses. The expense examples shown (which are based on a hypothetical investment of $1,000 invested at the beginning of the period and held through the end of the period) are intended to assist shareholders both in calculating expenses based on an investment in each Fund and in comparing these expenses with similar costs of investing in other funds.
The expense examples provide information about actual account values and actual expenses. Annualized expense ratios reflect contractual and voluntary fee waivers, if any. In order to estimate the expenses a shareholder paid during the period covered by this report, shareholders can divide their account value by $1,000 and then multiply the result by the number under the heading entitled “Expenses Paid During the Period.”
The expense examples also provide information about hypothetical account values and hypothetical expenses based on a fund’s actual expense ratio and an assumed rate of return of 5% per year before expenses. In order to assist shareholders in comparing the ongoing expenses of investing in the Funds and other funds, compare the 5% hypothetical examples with the 5% hypothetical examples that appear in the shareholder reports of the other funds.
The expenses shown in the expense examples are intended to highlight shareholders’ ongoing costs only and do not reflect any transactional expenses, such as brokerage commissions and other fees paid on purchases and sales of fund shares. Therefore, the hypothetical examples are useful in comparing ongoing expenses only and will not help shareholders determine the relative total expenses of owning different funds. If these transactional expenses were included, shareholder expenses would have been higher.
About Fund Performance/Disclosure of Expenses17
Schedule of InvestmentsMarch 31, 2024
iShares® Copper and Metals Mining ETF(Percentages shown are based on Net Assets)
| | |
|
|
| | |
Al Masane Al Kobra Mining Co. | | |
| | |
| | |
Baiyin Nonferrous Group Co. Ltd. | | |
| | |
| | |
Chengtun Mining Group Co. Ltd., Class A(a) | | |
China Nonferrous Mining Corp Ltd. | | |
| | |
| | |
| | |
| | |
First Quantum Minerals Ltd. | | |
| | |
| | |
Grupo Mexico SAB de CV, Series B | | |
| | |
Ivanhoe Mines Ltd., Class A(a)(b) | | |
Jiangxi Copper Co. Ltd., Class A | | |
Jinchuan Group International Resources Co. Ltd. | | |
| | |
| | |
| | |
| | |
| | |
| | |
Sandfire Resources Ltd.(a)(b) | | |
| | |
| | |
Metals & Mining (continued) |
Teck Resources Ltd., Class B | | |
| | |
WA1 Resources Ltd., NVS(a) | | |
Western Mining Co. Ltd., Class A | | |
| | |
Zijin Mining Group Co. Ltd., Class A | | |
| | |
Total Long-Term Investments — 99.6%
(Cost: $6,304,710) | |
|
Money Market Funds — 8.3% |
BlackRock Cash Funds: Institutional, SL Agency Shares, 5.50%(c)(d)(e) | | |
Total Short-Term Securities — 8.3%
(Cost: $585,686) | |
Total Investments — 107.9%
(Cost: $6,890,396) | |
Liabilities in Excess of Other Assets — (7.9)% | |
| |
| Non-income producing security. |
| All or a portion of this security is on loan. |
| |
| Annualized 7-day yield as of period end. |
| All or a portion of this security was purchased with the cash collateral from loaned securities. |
Affiliates
Investments in issuers considered to be affiliate(s) of the Fund during the period ended March 31, 2024 for purposes of Section 2(a)(3) of the Investment Company Act of 1940, as amended, were as follows:
| | | | | Change in
Unrealized
Appreciation
(Depreciation) | | | | Capital
Gain
Distributions
from
Underlying
Funds |
BlackRock Cash Funds: Institutional, SL Agency Shares | | | | | | | | | |
BlackRock Cash Funds: Treasury, SL Agency Shares(d) | | | | | | | | | |
| | | | | | | | | |
| Commencement of operations. |
| Represents net amount purchased (sold). |
| All or a portion represents securities lending income earned from the reinvestment of cash collateral from loaned securities, net of fees and collateral investment expenses, and other payments to and from borrowers of securities. |
| As of period end, the entity is no longer held. |
182024 iShares Annual Report to Shareholders
Schedule of Investments (continued)March 31, 2024
iShares® Copper and Metals Mining ETF
Derivative Financial Instruments Outstanding as of Period End
Futures Contracts
| | | | Value/
Unrealized
Appreciation
(Depreciation) |
| | | | |
Micro E-Mini Russell 2000 Index | | | | |
Derivative Financial Instruments Categorized by Risk Exposure
As of period end, the fair values of derivative financial instruments located in the Statements of Assets and Liabilities were as follows:
| | | | Foreign
Currency
Exchange
Contracts | | | |
Assets—Derivative Financial Instruments | | | | | | | |
| | | | | | | |
Unrealized appreciation on futures contracts(a) | | | | | | | |
| Net cumulative unrealized appreciation (depreciation) on futures contracts are reported in the Schedule of Investments. In the Statements of Assets and Liabilities, only current day's variation margin is reported in receivables or payables and the net cumulative unrealized appreciation (depreciation) is included in accumulated earnings (loss). |
For the period ended March 31, 2024, the effect of derivative financial instruments in the Statements of Operations was as follows:
| | | | Foreign
Currency
Exchange
Contracts | | | |
Net Realized Gain (Loss) from | | | | | | | |
| | | | | | | |
Net Change in Unrealized Appreciation (Depreciation) on | | | | | | | |
| | | | | | | |
Average Quarterly Balances of Outstanding Derivative Financial Instruments
| |
Average notional value of contracts — long | |
For more information about the Fund’s investment risks regarding derivative financial instruments, refer to the Notes to Financial Statements.
Fair Value Hierarchy as of Period End
Various inputs are used in determining the fair value of financial instruments. For a description of the input levels and information about the Fund’s policy regarding valuation of financial instruments, refer to the Notes to Financial Statements.
The following table summarizes the Fund’s financial instruments categorized in the fair value hierarchy. The breakdown of the Fund’s financial instruments into major categories is disclosed in the Schedule of Investments above.
Schedule of Investments19
Schedule of Investments (continued)March 31, 2024
iShares® Copper and Metals Mining ETF
Fair Value Hierarchy as of Period End (continued)
| | | | |
Derivative Financial Instruments(a) | | | | |
| | | | |
| | | | |
| Derivative financial instruments are futures contracts. Futures contracts are valued at the unrealized appreciation (depreciation) on the instrument. |
See notes to financial statements.
202024 iShares Annual Report to Shareholders
Schedule of InvestmentsMarch 31, 2024
iShares® Environmental Infrastructure and Industrials ETF(Percentages shown are based on Net Assets)
| | |
|
|
Advanced Drainage Systems Inc. | | |
China Lesso Group Holdings Ltd. | | |
Reliance Worldwide Corp. Ltd. | | |
| | |
| | |
|
| | |
Commercial Services & Supplies — 10.5% |
| | |
| | |
| | |
| | |
| | |
| | |
Construction & Engineering — 5.0% |
| | |
| | |
| | |
| | |
Containers & Packaging — 7.2% |
| | |
| | |
| | |
Electronic Equipment, Instruments & Components — 5.8% |
| | |
| | |
| | |
| | |
| | |
|
Construcciones y Auxiliar de Ferrocarriles SA | | |
| | |
Franklin Electric Co. Inc. | | |
| | |
| | |
Mueller Water Products Inc., Class A | | |
| | |
| | |
| | |
| | |
Torishima Pump Manufacturing Co. Ltd. | | |
Watts Water Technologies Inc., Class A | | |
Westinghouse Air Brake Technologies Corp. | | |
| | |
| | |
|
| | |
| | |
| | |
| | |
| | |
|
Qatar Electricity & Water Co. QSC | | |
| | |
| | |
Professional Services — 5.7% |
| | |
| | |
| | |
|
Aguas Andinas SA, Class A | | |
American States Water Co. | | |
American Water Works Co. Inc. | | |
Beijing Enterprises Water Group Ltd. | | |
California Water Service Group | | |
China Water Affairs Group Ltd. | | |
Cia de Saneamento de Minas Gerais Copasa MG | | |
Cia. de Saneamento Basico do Estado de Sao Paulo SABESP | | |
| | |
| | |
| | |
United Utilities Group PLC | | |
| | |
Total Common Stocks — 99.3%
(Cost: $3,962,000) | |
|
|
Marcopolo SA, Preference Shares, NVS | | |
Total Preferred Stocks — 0.4%
(Cost: $14,621) | |
|
|
Dawonsys Co. Ltd. (Expires 04/30/24, Strike Price KRW 10,210.00)(b) | | |
Total Rights — 0.0%
(Cost: $—) | |
Total Investments — 99.7%
(Cost: $3,976,621) | |
Other Assets Less Liabilities — 0.3% | |
| |
| Security exempt from registration pursuant to Rule 144A under the Securities Act of 1933, as amended. These securities may be resold in transactions exempt from registration to qualified institutional investors. |
| Non-income producing security. |
Schedule of Investments21
Schedule of Investments (continued)March 31, 2024
iShares® Environmental Infrastructure and Industrials ETF
Affiliates
Investments in issuers considered to be affiliate(s) of the Fund during the year ended March 31, 2024 for purposes of Section 2(a)(3) of the Investment Company Act of 1940, as amended, were as follows:
| | | | | Change in
Unrealized
Appreciation
(Depreciation) | | | | Capital
Gain
Distributions
from
Underlying
Funds |
BlackRock Cash Funds: Institutional, SL Agency Shares(a) | | | | | | | | | |
BlackRock Cash Funds: Treasury, SL Agency Shares(a) | | | | | | | | | |
| | | | | | | | | |
| As of period end, the entity is no longer held. |
| Represents net amount purchased (sold). |
| All or a portion represents securities lending income earned from the reinvestment of cash collateral from loaned securities, net of fees and collateral investment expenses, and other payments to and from borrowers of securities. |
Derivative Financial Instruments Outstanding as of Period End
Futures Contracts
| | | | Value/
Unrealized
Appreciation
(Depreciation) |
| | | | |
Micro E-Mini Russell 2000 Index | | | | |
Derivative Financial Instruments Categorized by Risk Exposure
As of period end, the fair values of derivative financial instruments located in the Statements of Assets and Liabilities were as follows:
| | | | Foreign
Currency
Exchange
Contracts | | | |
Liabilities—Derivative Financial Instruments | | | | | | | |
| | | | | | | |
Unrealized depreciation on futures contracts(a) | | | | | | | |
| Net cumulative unrealized appreciation (depreciation) on futures contracts are reported in the Schedule of Investments. In the Statements of Assets and Liabilities, only current day's variation margin is reported in receivables or payables and the net cumulative unrealized appreciation (depreciation) is included in accumulated earnings (loss). |
For the period ended March 31, 2024, the effect of derivative financial instruments in the Statements of Operations was as follows:
| | | | Foreign
Currency
Exchange
Contracts | | | |
Net Realized Gain (Loss) from | | | | | | | |
| | | | | | | |
Net Change in Unrealized Appreciation (Depreciation) on | | | | | | | |
| | | | | | | |
Average Quarterly Balances of Outstanding Derivative Financial Instruments
| |
Average notional value of contracts — long | |
For more information about the Fund’s investment risks regarding derivative financial instruments, refer to the Notes to Financial Statements.
222024 iShares Annual Report to Shareholders
Schedule of Investments (continued)March 31, 2024
iShares® Environmental Infrastructure and Industrials ETF
Fair Value Hierarchy as of Period End
Various inputs are used in determining the fair value of financial instruments. For a description of the input levels and information about the Fund’s policy regarding valuation of financial instruments, refer to the Notes to Financial Statements.
The following table summarizes the Fund’s financial instruments categorized in the fair value hierarchy. The breakdown of the Fund’s financial instruments into major categories is disclosed in the Schedule of Investments above.
| | | | |
| | | | |
| | | | |
| | | | |
| | | | |
| | | | |
| | | | |
| | | | |
Derivative Financial Instruments(a) | | | | |
| | | | |
| | | | |
| Derivative financial instruments are futures contracts. Futures contracts are valued at the unrealized appreciation (depreciation) on the instrument. |
See notes to financial statements.
Schedule of Investments23
Schedule of InvestmentsMarch 31, 2024
iShares® Global 100 ETF(Percentages shown are based on Net Assets)
| | |
|
|
| | |
|
| | |
|
| | |
| | |
| | |
| | |
LVMH Moet Hennessy Louis Vuitton SE | | |
| | |
| | |
| | |
| | |
|
| | |
| | |
| | |
Deutsche Bank AG, Registered | | |
Deutsche Telekom AG, Registered | | |
| | |
| | |
Muenchener Rueckversicherungs-Gesellschaft AG in Muenchen, Registered | | |
| | |
| | |
| | |
|
| | |
| | |
| | |
Mitsubishi UFJ Financial Group Inc. | | |
| | |
Seven & i Holdings Co. Ltd. | | |
| | |
| | |
| | |
|
| | |
| | |
| | |
|
Samsung Electronics Co. Ltd. | | |
|
Banco Bilbao Vizcaya Argentaria SA | | |
| | |
| | |
| | |
|
| | |
| | |
| | |
| | |
| | |
| | |
| | |
| | |
| | |
|
| | |
| | |
| | |
| | |
| | |
| | |
| | |
| | |
| | |
| | |
| | |
| | |
| | |
| | |
|
| | |
| | |
| | |
Alphabet Inc., Class A(a) | | |
Alphabet Inc., Class C, NVS(a) | | |
| | |
| | |
| | |
| | |
| | |
| | |
| | |
| | |
| | |
| | |
| | |
| | |
| | |
| | |
| | |
| | |
| | |
| | |
Goldman Sachs Group Inc. (The) | | |
Honeywell International Inc. | | |
| | |
| | |
International Business Machines Corp. | | |
| | |
Johnson Controls International PLC | | |
| | |
| | |
Marsh & McLennan Companies Inc. | | |
| | |
| | |
| | |
| | |
| | |
| | |
| | |
| | |
| | |
Philip Morris International Inc. | | |
Procter & Gamble Co. (The) | | |
| | |
| | |
Thermo Fisher Scientific Inc. | | |
242024 iShares Annual Report to Shareholders
Schedule of Investments (continued)March 31, 2024
iShares® Global 100 ETF(Percentages shown are based on Net Assets)
| | |
United States (continued) |
| | |
| | |
Total Long-Term Investments — 99.6%
(Cost: $3,247,328,653) | |
|
Money Market Funds — 0.2% |
BlackRock Cash Funds: Treasury, SL Agency Shares, 5.29%(b)(c) | | |
Total Short-Term Securities — 0.2%
(Cost: $9,330,000) | |
Total Investments — 99.8%
(Cost: $3,256,658,653) | |
Other Assets Less Liabilities — 0.2% | |
| |
| Non-income producing security. |
| |
| Annualized 7-day yield as of period end. |
Affiliates
Investments in issuers considered to be affiliate(s) of the Fund during the year ended March 31, 2024 for purposes of Section 2(a)(3) of the Investment Company Act of 1940, as amended, were as follows:
| | | | | Change in
Unrealized
Appreciation
(Depreciation) | | | | Capital
Gain
Distributions
from
Underlying
Funds |
BlackRock Cash Funds: Institutional, SL Agency Shares(a) | | | | | | | | | |
BlackRock Cash Funds: Treasury, SL Agency Shares | | | | | | | | | |
| | | | | | | | | |
| As of period end, the entity is no longer held. |
| Represents net amount purchased (sold). |
| All or a portion represents securities lending income earned from the reinvestment of cash collateral from loaned securities, net of fees and collateral investment expenses, and other payments to and from borrowers of securities. |
Derivative Financial Instruments Outstanding as of Period End
Futures Contracts
| | | | Value/
Unrealized
Appreciation
(Depreciation) |
| | | | |
| | | | |
| | | | |
| | | | |
Schedule of Investments25
Schedule of Investments (continued)March 31, 2024
Derivative Financial Instruments Categorized by Risk Exposure
As of period end, the fair values of derivative financial instruments located in the Statements of Assets and Liabilities were as follows:
| | | | Foreign
Currency
Exchange
Contracts | | | |
Assets—Derivative Financial Instruments | | | | | | | |
| | | | | | | |
Unrealized appreciation on futures contracts(a) | | | | | | | |
| Net cumulative unrealized appreciation (depreciation) on futures contracts are reported in the Schedule of Investments. In the Statements of Assets and Liabilities, only current day's variation margin is reported in receivables or payables and the net cumulative unrealized appreciation (depreciation) is included in accumulated earnings (loss). |
For the period ended March 31, 2024, the effect of derivative financial instruments in the Statements of Operations was as follows:
| | | | Foreign
Currency
Exchange
Contracts | | | |
Net Realized Gain (Loss) from | | | | | | | |
| | | | | | | |
Net Change in Unrealized Appreciation (Depreciation) on | | | | | | | |
| | | | | | | |
Average Quarterly Balances of Outstanding Derivative Financial Instruments
| |
Average notional value of contracts — long | |
For more information about the Fund’s investment risks regarding derivative financial instruments, refer to the Notes to Financial Statements.
Fair Value Hierarchy as of Period End
Various inputs are used in determining the fair value of financial instruments. For a description of the input levels and information about the Fund’s policy regarding valuation of financial instruments, refer to the Notes to Financial Statements.
The following table summarizes the Fund’s financial instruments categorized in the fair value hierarchy. The breakdown of the Fund’s financial instruments into major categories is disclosed in the Schedule of Investments above.
| | | | |
| | | | |
| | | | |
| | | | |
| | | | |
| | | | |
| | | | |
| | | | |
Derivative Financial Instruments(a) | | | | |
| | | | |
| | | | |
| Derivative financial instruments are futures contracts. Futures contracts are valued at the unrealized appreciation (depreciation) on the instrument. |
See notes to financial statements.
262024 iShares Annual Report to Shareholders
Schedule of InvestmentsMarch 31, 2024
iShares® Global Infrastructure ETF(Percentages shown are based on Net Assets)
| | |
|
|
Corp. America Airports SA(a) | | |
|
| | |
Dalrymple Bay Infrastructure Ltd.(b) | | |
| | |
| | |
| | |
|
Centrais Eletricas Brasileiras SA, ADR | | |
Cia. de Saneamento Basico do Estado de Sao Paulo SABESP, ADR | | |
Companhia Paranaense de Energia, ADR | | |
Ultrapar Participacoes SA, ADR | | |
| | |
|
| | |
| | |
| | |
| | |
Westshore Terminals Investment Corp. | | |
| | |
|
Anhui Expressway Co. Ltd., Class H | | |
Beijing Capital International Airport Co. Ltd., Class H(a)(b) | | |
CGN Power Co. Ltd., Class H(c) | | |
| | |
China Longyuan Power Group Corp. Ltd., Class H | | |
China Merchants Port Holdings Co. Ltd. | | |
China Resources Gas Group Ltd. | | |
China Resources Power Holdings Co. Ltd. | | |
COSCO SHIPPING Ports Ltd.(b) | | |
Jiangsu Expressway Co. Ltd., Class H | | |
| | |
Shenzhen Expressway Corp. Ltd., Class H | | |
Shenzhen International Holdings Ltd. | | |
Sichuan Expressway Co. Ltd., Class H | | |
Yuexiu Transport Infrastructure Ltd.(b) | | |
Zhejiang Expressway Co. Ltd., Class H | | |
| | |
|
| | |
| | |
Gaztransport Et Technigaz SA | | |
| | |
| | |
|
| | |
Fraport AG Frankfurt Airport Services Worldwide(a) | | |
| | |
|
| | |
| | |
| | |
|
Japan Airport Terminal Co. Ltd.(b) | | |
| | |
|
Grupo Aeroportuario del Centro Norte SAB de CV, ADR | | |
Grupo Aeroportuario del Pacifico SAB de CV, ADR | | |
Grupo Aeroportuario del Sureste SAB de CV, ADR | | |
| | |
|
Auckland International Airport Ltd. | | |
|
| | |
|
Hutchison Port Holdings Trust, Class U(b) | | |
| | |
SIA Engineering Co. Ltd.(b) | | |
| | |
|
| | |
| | |
| | |
|
Flughafen Zurich AG, Registered | | |
|
| | |
|
American Electric Power Co. Inc. | | |
American Water Works Co. Inc. | | |
| | |
| | |
| | |
Constellation Energy Corp. | | |
| | |
| | |
| | |
| | |
Equitrans Midstream Corp. | | |
| | |
| | |
| | |
| | |
| | |
Public Service Enterprise Group Inc. | | |
| | |
| | |
| | |
| | |
Williams Companies Inc. (The) | | |
| | |
| | |
Total Common Stocks — 99.5%
(Cost: $3,354,957,083) | |
Schedule of Investments27
Schedule of Investments (continued)March 31, 2024
iShares® Global Infrastructure ETF(Percentages shown are based on Net Assets)
| | |
|
|
Cia. Energetica de Minas Gerais, Preference Shares, ADR | | |
Total Preferred Stocks — 0.1%
(Cost: $3,989,789) | |
Total Long-Term Investments — 99.6%
(Cost: $3,358,946,872) | |
|
Money Market Funds — 0.4% |
BlackRock Cash Funds: Institutional, SL Agency Shares, 5.50%(d)(e)(f) | | |
BlackRock Cash Funds: Treasury, SL Agency Shares, 5.29%(d)(e) | | |
Total Short-Term Securities — 0.4%
(Cost: $13,360,594) | |
Total Investments — 100.0%
(Cost: $3,372,307,466) | |
Other Assets Less Liabilities — 0.0% | |
| |
| Non-income producing security. |
| All or a portion of this security is on loan. |
| Security exempt from registration pursuant to Rule 144A under the Securities Act of 1933, as amended. These securities may be resold in transactions exempt from registration to qualified institutional investors. |
| |
| Annualized 7-day yield as of period end. |
| All or a portion of this security was purchased with the cash collateral from loaned securities. |
Affiliates
Investments in issuers considered to be affiliate(s) of the Fund during the year ended March 31, 2024 for purposes of Section 2(a)(3) of the Investment Company Act of 1940, as amended, were as follows:
| | | | | Change in
Unrealized
Appreciation
(Depreciation) | | | | Capital
Gain
Distributions
from
Underlying
Funds |
BlackRock Cash Funds: Institutional, SL Agency Shares | | | | | | | | | |
BlackRock Cash Funds: Treasury, SL Agency Shares | | | | | | | | | |
| | | | | | | | | |
| Represents net amount purchased (sold). |
| All or a portion represents securities lending income earned from the reinvestment of cash collateral from loaned securities, net of fees and collateral investment expenses, and other payments to and from borrowers of securities. |
Derivative Financial Instruments Outstanding as of Period End
Futures Contracts
| | | | Value/
Unrealized
Appreciation
(Depreciation) |
| | | | |
| | | | |
| | | | |
| | | | |
Dow Jones U.S. Real Estate Index | | | | |
| | | | |
282024 iShares Annual Report to Shareholders
Schedule of Investments (continued)March 31, 2024
iShares® Global Infrastructure ETF
Derivative Financial Instruments Categorized by Risk Exposure
As of period end, the fair values of derivative financial instruments located in the Statements of Assets and Liabilities were as follows:
| | | | Foreign
Currency
Exchange
Contracts | | | |
Assets—Derivative Financial Instruments | | | | | | | |
| | | | | | | |
Unrealized appreciation on futures contracts(a) | | | | | | | |
| Net cumulative unrealized appreciation (depreciation) on futures contracts are reported in the Schedule of Investments. In the Statements of Assets and Liabilities, only current day's variation margin is reported in receivables or payables and the net cumulative unrealized appreciation (depreciation) is included in accumulated earnings (loss). |
For the period ended March 31, 2024, the effect of derivative financial instruments in the Statements of Operations was as follows:
| | | | Foreign
Currency
Exchange
Contracts | | | |
Net Realized Gain (Loss) from | | | | | | | |
| | | | | | | |
Net Change in Unrealized Appreciation (Depreciation) on | | | | | | | |
| | | | | | | |
Average Quarterly Balances of Outstanding Derivative Financial Instruments
| |
Average notional value of contracts — long | |
For more information about the Fund’s investment risks regarding derivative financial instruments, refer to the Notes to Financial Statements.
Fair Value Hierarchy as of Period End
Various inputs are used in determining the fair value of financial instruments. For a description of the input levels and information about the Fund’s policy regarding valuation of financial instruments, refer to the Notes to Financial Statements.
The following table summarizes the Fund’s financial instruments categorized in the fair value hierarchy. The breakdown of the Fund’s financial instruments into major categories is disclosed in the Schedule of Investments above.
| | | | |
| | | | |
| | | | |
| | | | |
| | | | |
| | | | |
| | | | |
| | | | |
| | | | |
Derivative Financial Instruments(a) | | | | |
| | | | |
| | | | |
| Derivative financial instruments are futures contracts. Futures contracts are valued at the unrealized appreciation (depreciation) on the instrument. |
See notes to financial statements.
Schedule of Investments29
Schedule of InvestmentsMarch 31, 2024
iShares® Global Timber & Forestry ETF(Percentages shown are based on Net Assets)
| | |
|
|
| | |
| | |
| | |
| | |
|
| | |
| | |
| | |
West Fraser Timber Co. Ltd. | | |
| | |
|
| | |
| | |
| | |
|
Nine Dragons Paper Holdings Ltd.(a) | | |
Shandong Sun Paper Industry JSC Ltd., Class A | | |
| | |
|
| | |
| | |
| | |
|
| | |
|
| | |
Nippon Paper Industries Co. Ltd. | | |
| | |
Sumitomo Forestry Co. Ltd. | | |
| | |
|
| | |
| | |
| | |
|
| | |
|
| | |
|
Ence Energia y Celulosa SA(b) | | |
|
| | |
| | |
|
| | |
Svenska Cellulosa AB SCA, Class B | | |
| | |
|
| | |
| | |
| | |
| | |
|
| | |
|
Clearwater Paper Corp.(a) | | |
| | |
Mercer International Inc. | | |
| | |
| | |
| | |
| | |
| | |
| | |
Total Long-Term Investments — 99.2%
(Cost: $192,110,598) | |
|
Money Market Funds — 0.2% |
BlackRock Cash Funds: Institutional, SL Agency Shares, 5.50%(c)(d)(e) | | |
BlackRock Cash Funds: Treasury, SL Agency Shares, 5.29%(c)(d) | | |
Total Short-Term Securities — 0.2%
(Cost: $439,395) | |
Total Investments — 99.4%
(Cost: $192,549,993) | |
Other Assets Less Liabilities — 0.6% | |
| |
| Non-income producing security. |
| All or a portion of this security is on loan. |
| |
| Annualized 7-day yield as of period end. |
| All or a portion of this security was purchased with the cash collateral from loaned securities. |
302024 iShares Annual Report to Shareholders
Schedule of Investments (continued)March 31, 2024
iShares® Global Timber & Forestry ETF
Affiliates
Investments in issuers considered to be affiliate(s) of the Fund during the year ended March 31, 2024 for purposes of Section 2(a)(3) of the Investment Company Act of 1940, as amended, were as follows:
| | | | | Change in
Unrealized
Appreciation
(Depreciation) | | | | Capital
Gain
Distributions
from
Underlying
Funds |
BlackRock Cash Funds: Institutional, SL Agency Shares | | | | | | | | | |
BlackRock Cash Funds: Treasury, SL Agency Shares | | | | | | | | | |
| | | | | | | | | |
| Represents net amount purchased (sold). |
| All or a portion represents securities lending income earned from the reinvestment of cash collateral from loaned securities, net of fees and collateral investment expenses, and other payments to and from borrowers of securities. |
Derivative Financial Instruments Outstanding as of Period End
Futures Contracts
| | | | Value/
Unrealized
Appreciation
(Depreciation) |
| | | | |
E-Mini Russell 1000 Value Index | | | | |
Derivative Financial Instruments Categorized by Risk Exposure
As of period end, the fair values of derivative financial instruments located in the Statements of Assets and Liabilities were as follows:
| | | | Foreign
Currency
Exchange
Contracts | | | |
Assets—Derivative Financial Instruments | | | | | | | |
| | | | | | | |
Unrealized appreciation on futures contracts(a) | | | | | | | |
| Net cumulative unrealized appreciation (depreciation) on futures contracts are reported in the Schedule of Investments. In the Statements of Assets and Liabilities, only current day's variation margin is reported in receivables or payables and the net cumulative unrealized appreciation (depreciation) is included in accumulated earnings (loss). |
For the period ended March 31, 2024, the effect of derivative financial instruments in the Statements of Operations was as follows:
| | | | Foreign
Currency
Exchange
Contracts | | | |
Net Realized Gain (Loss) from | | | | | | | |
| | | | | | | |
Net Change in Unrealized Appreciation (Depreciation) on | | | | | | | |
| | | | | | | |
Average Quarterly Balances of Outstanding Derivative Financial Instruments
| |
Average notional value of contracts — long | |
For more information about the Fund’s investment risks regarding derivative financial instruments, refer to the Notes to Financial Statements.
Schedule of Investments31
Schedule of Investments (continued)March 31, 2024
iShares® Global Timber & Forestry ETF
Fair Value Hierarchy as of Period End
Various inputs are used in determining the fair value of financial instruments. For a description of the input levels and information about the Fund’s policy regarding valuation of financial instruments, refer to the Notes to Financial Statements.
The following table summarizes the Fund’s financial instruments categorized in the fair value hierarchy. The breakdown of the Fund’s financial instruments into major categories is disclosed in the Schedule of Investments above.
| | | | |
| | | | |
| | | | |
| | | | |
| | | | |
| | | | |
| | | | |
| | | | |
Derivative Financial Instruments(a) | | | | |
| | | | |
| | | | |
| Derivative financial instruments are futures contracts. Futures contracts are valued at the unrealized appreciation (depreciation) on the instrument. |
See notes to financial statements.
322024 iShares Annual Report to Shareholders
Schedule of InvestmentsMarch 31, 2024
iShares® Lithium Miners and Producers ETF(Percentages shown are based on Net Assets)
| | |
|
|
| | |
Arcadium Lithium PLC, NVS(a) | | |
Canmax Technologies Co. Ltd., Class A | | |
Chengxin Lithium Group Co. Ltd., Class A | | |
| | |
CNGR Advanced Material Co. Ltd. | | |
Do-Fluoride New Materials Co. Ltd., Class A | | |
| | |
Ganfeng Lithium Group Co. Ltd., Class A | | |
Guangzhou Tinci Materials Technology Co. Ltd., Class A | | |
| | |
Shenzhen Capchem Technology Co. Ltd. | | |
Shenzhen Dynanonic Co. Ltd. | | |
Shenzhen Senior Technology Material Co. Ltd., Class A | | |
Sichuan Yahua Industrial Group Co. Ltd., Class A | | |
| | |
Tianqi Lithium Corp., Class A | | |
Yunnan Energy New Material Co. Ltd., Class A | | |
| | |
Electrical Equipment — 19.1% |
Beijing Easpring Material Technology Co. Ltd., Class A | | |
Hunan Changyuan Lico Co. Ltd. | | |
Hunan Yuneng New Energy Battery Material Co. Ltd., NVS | | |
Jiangsu Ruitai New Energy Materials Co. Ltd., NVS | | |
Jiangxi Special Electric Motor Co. Ltd., NVS(a) | | |
Ningbo Ronbay New Energy Technology Co. Ltd. | | |
Shijiazhuang Shangtai Technology Co. Ltd., NVS | | |
SK IE Technology Co. Ltd.(a)(c) | | |
Sociedad Quimica y Minera de Chile SA, ADR | | |
XTC New Energy Materials Xiamen Co. Ltd., NVS | | |
| | |
|
American Lithium Corp., NVS(a)(b) | | |
| | |
| | |
Latin Resources Ltd., NVS(a) | | |
Liontown Resources Ltd.(a) | | |
Lithium Americas Corp.(a)(b) | | |
| | |
| | |
| | |
Sigma Lithium Corp.(a)(b) | | |
| | |
Metals & Mining (continued) |
Sinomine Resource Group Co. Ltd., Class A | | |
Tibet Mineral Development Co. | | |
Vulcan Energy Resources Ltd.(a)(b) | | |
Winsome Resources Ltd., NVS(a) | | |
| | |
| | |
Technology Hardware, Storage & Peripherals — 7.6% |
| | |
Total Common Stocks — 99.5%
(Cost: $4,356,822) | |
|
|
Foosung Co. Ltd. (Expires 04/18/24, Strike Price KRW 6870)(a) | | |
Total Rights — 0.0%
(Cost: $—) | |
Total Long-Term Investments — 99.5%
(Cost: $4,356,822) | |
|
Money Market Funds — 12.7% |
BlackRock Cash Funds: Institutional, SL Agency Shares, 5.50%(d)(e)(f) | | |
Total Short-Term Securities — 12.7%
(Cost: $344,837) | |
Total Investments — 112.2%
(Cost: $4,701,659) | |
Liabilities in Excess of Other Assets — (12.2)% | |
| |
| Non-income producing security. |
| All or a portion of this security is on loan. |
| Security exempt from registration pursuant to Rule 144A under the Securities Act of 1933, as amended. These securities may be resold in transactions exempt from registration to qualified institutional investors. |
| |
| Annualized 7-day yield as of period end. |
| All or a portion of this security was purchased with the cash collateral from loaned securities. |
Affiliates
Investments in issuers considered to be affiliate(s) of the Fund during the period ended March 31, 2024 for purposes of Section 2(a)(3) of the Investment Company Act of 1940, as amended, were as follows:
| | | | | Change in
Unrealized
Appreciation
(Depreciation) | | | | Capital
Gain
Distributions
from
Underlying
Funds |
BlackRock Cash Funds: Institutional, SL Agency Shares | | | | | | | | | |
BlackRock Cash Funds: Treasury, SL Agency Shares(d) | | | | | | | | | |
| | | | | | | | | |
| Commencement of operations. |
Schedule of Investments33
Schedule of Investments (continued)March 31, 2024
iShares® Lithium Miners and Producers ETF
Affiliates (continued)
| Represents net amount purchased (sold). |
| All or a portion represents securities lending income earned from the reinvestment of cash collateral from loaned securities, net of fees and collateral investment expenses, and other payments to and from borrowers of securities. |
| As of period end, the entity is no longer held. |
Derivative Financial Instruments Categorized by Risk Exposure
For the period ended March 31, 2024, the effect of derivative financial instruments in the Statements of Operations was as follows:
| | | | Foreign
Currency
Exchange
Contracts | | | |
Net Realized Gain (Loss) from | | | | | | | |
| | | | | | | |
Forward foreign currency exchange contracts | | | | | | | |
| | | | | | | |
Average Quarterly Balances of Outstanding Derivative Financial Instruments
| |
Average notional value of contracts — long | |
For more information about the Fund’s investment risks regarding derivative financial instruments, refer to the Notes to Financial Statements.
Fair Value Hierarchy as of Period End
Various inputs are used in determining the fair value of financial instruments. For a description of the input levels and information about the Fund’s policy regarding valuation of financial instruments, refer to the Notes to Financial Statements.
The following table summarizes the Fund’s financial instruments categorized in the fair value hierarchy. The breakdown of the Fund’s financial instruments into major categories is disclosed in the Schedule of Investments above.
See notes to financial statements.
342024 iShares Annual Report to Shareholders
Statements of Assets and LiabilitiesMarch 31, 2024
| iShares
Copper and Metals Mining ETF | iShares
Environmental Infrastructure and Industrials ETF | | iShares
Global Infrastructure ETF |
| | | | |
Investments, at value—unaffiliated(a)(b) | | | | |
Investments, at value—affiliated(c) | | | | |
| | | | |
Cash pledged for futures contracts | | | | |
Foreign currency collateral pledged for futures contracts(d) | | | | |
Foreign currency, at value(e) | | | | |
| | | | |
| | | | |
Securities lending income—affiliated | | | | |
| | | | |
| | | | |
| | | | |
| | | | |
Variation margin on futures contracts | | | | |
| | | | |
| | | | |
Collateral on securities loaned, at value | | | | |
| | | | |
| | | | |
Deferred foreign capital gain tax | | | | |
| | | | |
IRS compliance fee for foreign withholding tax claims | | | | |
Variation margin on futures contracts | | | | |
| | | | |
Commitments and contingent liabilities | | | | |
| | | | |
| | | | |
| | | | |
Accumulated earnings (loss) | | | | |
| | | | |
| | | | |
| | | | |
| | | | |
| | | | |
| | | | |
(a) Investments, at cost—unaffiliated | | | | |
(b) Securities loaned, at value | | | | |
(c) Investments, at cost—affiliated | | | | |
(d) Foreign currency collateral pledged, at cost | | | | |
(e) Foreign currency, at cost | | | | |
See notes to financial statements.
Statements of Assets and Liabilities (continued)March 31, 2024
| iShares
Global Timber & Forestry ETF | iShares
Lithium Miners and Producers ETF |
| | |
Investments, at value—unaffiliated(a)(b) | | |
Investments, at value—affiliated(c) | | |
| | |
Cash pledged for futures contracts | | |
Foreign currency, at value(d) | | |
| | |
Securities lending income—affiliated | | |
| | |
| | |
| | |
| | |
| | |
Collateral on securities loaned, at value | | |
| | |
| | |
Variation margin on futures contracts | | |
| | |
Commitments and contingent liabilities | | |
| | |
| | |
| | |
| | |
| | |
| | |
| | |
| | |
| | |
| | |
(a) Investments, at cost—unaffiliated | | |
(b) Securities loaned, at value | | |
(c) Investments, at cost—affiliated | | |
(d) Foreign currency, at cost | | |
See notes to financial statements.
362024 iShares Annual Report to Shareholders
Statements of OperationsYear Ended March 31, 2024
| iShares
Copper and Metals Mining | iShares
Environmental Infrastructure and Industrials ETF | | iShares
Global Infrastructure ETF |
| | | | |
| | | | |
| | | | |
| | | | |
Securities lending income—affiliated—net | | | | |
Other income—unaffiliated | | | | |
| | | | |
Foreign withholding tax claims | | | | |
IRS compliance fee for foreign withholding tax claims | | | | |
| | | | |
| | | | |
| | | | |
| | | | |
| | | | |
| | | | |
| | | | |
REALIZED AND UNREALIZED GAIN (LOSS) | | | | |
Net realized gain (loss) from: | | | | |
| | | | |
| | | | |
Foreign currency transactions | | | | |
| | | | |
In-kind redemptions—unaffiliated(b) | | | | |
| | | | |
Net change in unrealized appreciation (depreciation) on: | | | | |
Investments—unaffiliated(c) | | | | |
| | | | |
Foreign currency translations | | | | |
| | | | |
| | | | |
Net realized and unrealized gain (loss) | | | | |
NET INCREASE IN NET ASSETS RESULTING FROM OPERATIONS | | | | |
(a) For the period from June 21, 2023 (commencement of operations) to to March 31, 2024. |
(b) See Note 2 of the Notes to Financial Statements. |
(c) Net of increase in deferred foreign capital gain tax of | | | | |
See notes to financial statements.
Statements of Operations (continued)Year Ended March 31, 2024
| iShares
Global Timber & Forestry ETF | iShares
Lithium Miners and Producers |
| | |
| | |
| | |
| | |
Securities lending income—affiliated—net | | |
| | |
| | |
| | |
| | |
| | |
| | |
| | |
| | |
| | |
REALIZED AND UNREALIZED GAIN (LOSS) | | |
Net realized gain (loss) from: | | |
| | |
| | |
Forward foreign currency exchange contracts | | |
Foreign currency transactions | | |
| | |
In-kind redemptions—unaffiliated(b) | | |
| | |
Net change in unrealized appreciation (depreciation) on: | | |
| | |
| | |
Foreign currency translations | | |
| | |
| | |
Net realized and unrealized gain (loss) | | |
NET INCREASE (DECREASE) IN NET ASSETS RESULTING FROM OPERATIONS | | |
(a) For the period from June 21, 2023 (commencement of operations) to to March 31, 2024. |
(b) See Note 2 of the Notes to Financial Statements. |
See notes to financial statements.
382024 iShares Annual Report to Shareholders
Statements of Changes in Net Assets
| iShares
Copper and Metals Mining ETF | iShares
Environmental Infrastructure and Industrials ETF |
| | | |
INCREASE (DECREASE) IN NET ASSETS | | | |
| | | |
| | | |
| | | |
Net change in unrealized appreciation (depreciation) | | | |
Net increase in net assets resulting from operations | | | |
DISTRIBUTIONS TO SHAREHOLDERS(b) | | | |
Decrease in net assets resulting from distributions to shareholders | | | |
CAPITAL SHARE TRANSACTIONS | | | |
Net increase in net assets derived from capital share transactions | | | |
| | | |
Total increase in net assets | | | |
| | | |
| | | |
| Commencement of operations. |
| Distributions for annual periods determined in accordance with U.S. federal income tax regulations. |
See notes to financial statements.
Statements of Changes in Net Assets(continued)
| | iShares
Global Infrastructure ETF |
| | | | |
INCREASE (DECREASE) IN NET ASSETS | | | | |
| | | | |
| | | | |
| | | | |
Net change in unrealized appreciation (depreciation) | | | | |
Net increase (decrease) in net assets resulting from operations | | | | |
DISTRIBUTIONS TO SHAREHOLDERS(a) | | | | |
Decrease in net assets resulting from distributions to shareholders | | | | |
CAPITAL SHARE TRANSACTIONS | | | | |
Net increase (decrease) in net assets derived from capital share transactions | | | | |
| | | | |
Total increase (decrease) in net assets | | | | |
| | | | |
| | | | |
| Distributions for annual periods determined in accordance with U.S. federal income tax regulations. |
See notes to financial statements.
402024 iShares Annual Report to Shareholders
Statements of Changes in Net Assets(continued)
| iShares
Global Timber & Forestry ETF | iShares
Lithium Miners and Producers ETF |
| | | |
INCREASE (DECREASE) IN NET ASSETS | | | |
| | | |
| | | |
| | | |
Net change in unrealized appreciation (depreciation) | | | |
Net increase (decrease) in net assets resulting from operations | | | |
DISTRIBUTIONS TO SHAREHOLDERS(b) | | | |
Decrease in net assets resulting from distributions to shareholders | | | |
CAPITAL SHARE TRANSACTIONS | | | |
Net increase (decrease) in net assets derived from capital share transactions | | | |
| | | |
Total increase (decrease) in net assets | | | |
| | | |
| | | |
| Commencement of operations. |
| Distributions for annual periods determined in accordance with U.S. federal income tax regulations. |
See notes to financial statements.
Financial Highlights(For a share outstanding throughout the period)
| iShares Copper and Metals Mining ETF |
| |
Net asset value, beginning of period | |
| |
Net realized and unrealized gain(c) | |
Net increase from investment operations | |
Distributions from net investment income(d) | |
Net asset value, end of period | |
| |
| |
Ratios to Average Net Assets(g) | |
| |
| |
| |
Net assets, end of period (000) | |
Portfolio turnover rate(i) | |
(a) Commencement of operations. |
(b) Based on average shares outstanding. |
(c) The amount reported for a share outstanding may not accord with the change in aggregate gains and losses in securities for the fiscal period due to the timing of capital share transactions in relation to the fluctuating market values of the Fund’s underlying securities. |
(d) Distributions for annual periods determined in accordance with U.S. federal income tax regulations. |
(e) Where applicable, assumes the reinvestment of distributions. |
|
(g) Excludes fees and expenses incurred indirectly as a result of investments in underlying funds. |
|
(i) Portfolio turnover rate excludes in-kind transactions, if any. |
See notes to financial statements.
422024 iShares Annual Report to Shareholders
Financial Highlights(continued)(For a share outstanding throughout each period)
| iShares Environmental Infrastructure and Industrials ETF |
| | |
Net asset value, beginning of period | | |
| | |
Net realized and unrealized gain(c) | | |
Net increase from investment operations | | |
Distributions from net investment income(d) | | |
Net asset value, end of period | | |
| | |
| | |
Ratios to Average Net Assets(g) | | |
| | |
| | |
| | |
Net assets, end of period (000) | | |
Portfolio turnover rate(i) | | |
(a) Commencement of operations. |
(b) Based on average shares outstanding. |
(c) The amounts reported for a share outstanding may not accord with the change in aggregate gains and losses in securities for the fiscal period due to the timing of capital share transactions in relation to the fluctuating market values of the Fund’s underlying securities. |
(d) Distributions for annual periods determined in accordance with U.S. federal income tax regulations. |
(e) Where applicable, assumes the reinvestment of distributions. |
|
(g) Excludes fees and expenses incurred indirectly as a result of investments in underlying funds. |
|
(i) Portfolio turnover rate excludes in-kind transactions, if any. |
See notes to financial statements.
Financial Highlights(continued)(For a share outstanding throughout each period)
| |
| | | | | |
Net asset value, beginning of year | | | | | |
| | | | | |
Net realized and unrealized gain (loss)(c) | | | | | |
Net increase (decrease) from investment operations | | | | | |
Distributions from net investment income(d) | | | | | |
Net asset value, end of year | | | | | |
| | | | | |
| | | | | |
Ratios to Average Net Assets(f) | | | | | |
| | | | | |
Total expenses excluding professional fees for foreign withholding tax claims | | | | | |
| | | | | |
| | | | | |
Net assets, end of year (000) | | | | | |
Portfolio turnover rate(g) | | | | | |
(a) Based on average shares outstanding. |
(b) Reflects the positive effect of foreign withholding tax claims, net of the associated professional fees, which resulted in the following increases for the years ended March 31, 2024 and March 31, 2023, respectively: • Net investment income per share by $0.03 and $0.06. • Total return by 0.04% and 0.08%. • Ratio of net investment income to average net assets by 0.04% and 0.09%. |
(c) The amounts reported for a share outstanding may not accord with the change in aggregate gains and losses in securities for the fiscal period due to the timing of capital share transactions in relation to the fluctuating market values of the Fund’s underlying securities. |
(d) Distributions for annual periods determined in accordance with U.S. federal income tax regulations. |
(e) Where applicable, assumes the reinvestment of distributions. |
(f) Excludes fees and expenses incurred indirectly as a result of investments in underlying funds. |
(g) Portfolio turnover rate excludes in-kind transactions, if any. |
See notes to financial statements.
442024 iShares Annual Report to Shareholders
Financial Highlights(continued)(For a share outstanding throughout each period)
| iShares Global Infrastructure ETF |
| | | | | |
Net asset value, beginning of year | | | | | |
| | | | | |
Net realized and unrealized gain (loss)(c) | | | | | |
Net increase (decrease) from investment operations | | | | | |
Distributions from net investment income(d) | | | | | |
Net asset value, end of year | | | | | |
| | | | | |
| | | | | |
Ratios to Average Net Assets(g) | | | | | |
| | | | | |
Total expenses excluding professional fees for foreign withholding tax claims | | | | | |
| | | | | |
| | | | | |
Net assets, end of year (000) | | | | | |
Portfolio turnover rate(h) | | | | | |
(a) Based on average shares outstanding. |
(b) Reflects the positive effect of foreign withholding tax claims, net of the associated professional fees, which resulted in the following increases for the years ended March 31, 2024 and March 31, 2023, respectively: • Net investment income per share by $ 0.04 and $ 0.00. • Total return by 0.08% and 0.01%. • Ratio of net investment income to average net assets by 0.08% and 0.01%. |
(c) The amounts reported for a share outstanding may not accord with the change in aggregate gains and losses in securities for the fiscal period due to the timing of capital share transactions in relation to the fluctuating market values of the Fund’s underlying securities. |
(d) Distributions for annual periods determined in accordance with U.S. federal income tax regulations. |
(e) Where applicable, assumes the reinvestment of distributions. |
(f) Includes payment received from an affiliate, which had no impact on the Fund’s total return. |
(g) Excludes fees and expenses incurred indirectly as a result of investments in underlying funds. |
(h) Portfolio turnover rate excludes in-kind transactions, if any. |
See notes to financial statements.
Financial Highlights(continued)(For a share outstanding throughout each period)
| iShares Global Timber & Forestry ETF |
| | | | | |
Net asset value, beginning of year | | | | | |
| | | | | |
Net realized and unrealized gain (loss)(c) | | | | | |
Net increase (decrease) from investment operations | | | | | |
Distributions from net investment income(d) | | | | | |
Net asset value, end of year | | | | | |
| | | | | |
| | | | | |
Ratios to Average Net Assets(f) | | | | | |
| | | | | |
Total expenses excluding professional fees for foreign withholding tax claims | | | | | |
| | | | | |
| | | | | |
Net assets, end of year (000) | | | | | |
Portfolio turnover rate(g) | | | | | |
(a) Based on average shares outstanding. |
(b) Reflects the positive effect of foreign withholding tax claims, net of the associated professional fees, which resulted in the following increases for years ended March 31, 2023 and March 31, 2022, respectively: • Net investment income per share by $0.05 and $0.07. • Total return by 0.07% and 0.09%. • Ratio of net investment income to average net assets by 0.06% and 0.07%. |
(c) The amounts reported for a share outstanding may not accord with the change in aggregate gains and losses in securities for the fiscal period due to the timing of capital share transactions in relation to the fluctuating market values of the Fund’s underlying securities. |
(d) Distributions for annual periods determined in accordance with U.S. federal income tax regulations. |
(e) Where applicable, assumes the reinvestment of distributions. |
(f) Excludes fees and expenses incurred indirectly as a result of investments in underlying funds. |
(g) Portfolio turnover rate excludes in-kind transactions, if any. |
See notes to financial statements.
462024 iShares Annual Report to Shareholders
Financial Highlights(continued)(For a share outstanding throughout the period)
| iShares Lithium Miners and Producers ETF |
| |
Net asset value, beginning of period | |
| |
Net realized and unrealized loss(c) | |
Net decrease from investment operations | |
Distributions from net investment income(d) | |
Net asset value, end of period | |
| |
| |
Ratios to Average Net Assets(g) | |
| |
| |
| |
Net assets, end of period (000) | |
Portfolio turnover rate(i) | |
(a) Commencement of operations. |
(b) Based on average shares outstanding. |
(c) The amount reported for a share outstanding may not accord with the change in aggregate gains and losses in securities for the fiscal period due to the timing of capital share transactions in relation to the fluctuating market values of the Fund’s underlying securities. |
(d) Distributions for annual periods determined in accordance with U.S. federal income tax regulations. |
(e) Where applicable, assumes the reinvestment of distributions. |
|
(g) Excludes fees and expenses incurred indirectly as a result of investments in underlying funds. |
|
(i) Portfolio turnover rate excludes in-kind transactions, if any. |
See notes to financial statements.
Notes to Financial Statements
1. ORGANIZATION
iShares Trust (the “Trust”) is registered under the Investment Company Act of 1940, as amended (the “1940 Act”), as an open-end management investment company. The Trust is organized as a Delaware statutory trust and is authorized to have multiple series or portfolios.
These financial statements relate only to the following funds (each, a “Fund” and collectively, the “Funds”):
| Diversification
Classification |
Copper and Metals Mining(a) | |
Environmental Infrastructure and Industrials | |
| |
| |
| |
Lithium Miners and Producers(a) | |
| The Funds commenced operations on June 21, 2023. |
| The Fund intends to be diversified in approximately the same proportion as its underlying index is diversified. The Fund may become non-diversified, as defined in the 1940 Act, solely as a result of a change in relative market capitalization or index weighting of one or more constituents of its underlying index. Shareholder approval will not be sought if the Fund crosses from diversified to non-diversified status due solely to a change in its relative market capitalization or index weighting of one or more constituents of its underlying index. |
2. SIGNIFICANT ACCOUNTING POLICIES
The financial statements are prepared in conformity with accounting principles generally accepted in the United States of America (“U.S. GAAP”), which may require management to make estimates and assumptions that affect the reported amounts of assets and liabilities in the financial statements, disclosure of contingent assets and liabilities at the date of the financial statements and the reported amounts of increases and decreases in net assets from operations during the reporting period. Actual results could differ from those estimates. Each Fund is considered an investment company under U.S. GAAP and follows the accounting and reporting guidance applicable to investment companies. Below is a summary of significant accounting policies:
Investment Transactions and Income Recognition: For financial reporting purposes, investment transactions are recorded on the dates the transactions are executed. Realized gains and losses on investment transactions are determined using the specific identification method. Dividend income and capital gain distributions, if any, are recorded on the ex-dividend date. Non-cash dividends, if any, are recorded on the ex-dividend date at fair value. Dividends from foreign securities where the ex-dividend date may have passed are subsequently recorded when the Funds are informed of the ex-dividend date. Under the applicable foreign tax laws, a withholding tax at various rates may be imposed on capital gains, dividends and interest. Upon notification from issuers or as estimated by management, a portion of the dividend income received from a real estate investment trust may be redesignated as a reduction of cost of the related investment and/or realized gain. Interest income, including amortization and accretion of premiums and discounts on debt securities, is recognized daily on an accrual basis.
Foreign Currency Translation: Each Fund’s books and records are maintained in U.S. dollars. Securities and other assets and liabilities denominated in foreign currencies are translated into U.S. dollars using prevailing market rates as quoted by one or more data service providers. Purchases and sales of investments are recorded at the rates of exchange prevailing on the respective dates of such transactions. Generally, when the U.S. dollar rises in value against a foreign currency, the investments denominated in that currency will lose value; the opposite effect occurs if the U.S. dollar falls in relative value.
Each Fund does not isolate the effect of fluctuations in foreign exchange rates from the effect of fluctuations in the market prices of investments for financial reporting purposes. Accordingly, the effects of changes in exchange rates on investments are not segregated in the Statements of Operations from the effects of changes in market prices of those investments, but are included as a component of net realized and unrealized gain (loss) from investments. Each Fund reports realized currency gains (losses) on foreign currency related transactions as components of net realized gain (loss) for financial reporting purposes, whereas such components are generally treated as ordinary income for U.S. federal income tax purposes.
Foreign Taxes: The Funds may be subject to foreign taxes (a portion of which may be reclaimable) on income, stock dividends, capital gains on investments, or certain foreign currency transactions. All foreign taxes are recorded in accordance with the applicable foreign tax regulations and rates that exist in the foreign jurisdictions in which each Fund invests. These foreign taxes, if any, are paid by each Fund and are reflected in its Statements of Operations as follows: foreign taxes withheld at source are presented as a reduction of income, foreign taxes on securities lending income are presented as a reduction of securities lending income, foreign taxes on stock dividends are presented as “Other foreign taxes”, and foreign taxes on capital gains from sales of investments and foreign taxes on foreign currency transactions are included in their respective net realized gain (loss) categories. Foreign taxes payable or deferred as of March 31, 2024, if any, are disclosed in the Statements of Assets and Liabilities.
The Funds file withholding tax reclaims in certain jurisdictions to recover a portion of amounts previously withheld. The Funds may record a reclaim receivable based on collectability, which includes factors such as the jurisdiction’s applicable laws, payment history and market convention. The Statements of Operations includes tax reclaims recorded as well as professional and other fees, if any, associated with recovery of foreign withholding taxes.
Bank Overdraft:Certain Funds had outstanding cash disbursements exceeding deposited cash amounts at the custodian during the reporting period. The Funds are obligated to repay the custodian for any overdraft, including any related costs or expenses, where applicable. For financial reporting purposes, overdraft fees, if any, are included in interest expense in the Statements of Operations.
482024 iShares Annual Report to Shareholders
Notes to Financial Statements (continued)
Collateralization: If required by an exchange or counterparty agreement, the Funds may be required to deliver/deposit cash and/or securities to/with an exchange, or broker-dealer or custodian as collateral for certain investments.
In-kind Redemptions: For financial reporting purposes, in-kind redemptions are treated as sales of securities resulting in realized capital gains or losses to the Funds. Because such gains or losses are not taxable to the Funds and are not distributed to existing Fund shareholders, the gains or losses are reclassified from accumulated net realized gain (loss) to paid-in capital at the end of the Funds’ tax year. These reclassifications have no effect on net assets or net asset value (“NAV”) per share.
Distributions: Dividends and distributions paid by each Fund are recorded on the ex-dividend dates. Distributions are determined on a tax basis and may differ from net investment income and net realized capital gains for financial reporting purposes. Dividends and distributions are paid in U.S. dollars and cannot be automatically reinvested in additional shares of the Funds.
Indemnifications: In the normal course of business, each Fund enters into contracts that contain a variety of representations that provide general indemnification. The Funds’ maximum exposure under these arrangements is unknown because it involves future potential claims against the Funds, which cannot be predicted with any certainty.
3. INVESTMENT VALUATION AND FAIR VALUE MEASUREMENTS
Investment Valuation Policies: Each Fund’s investments are valued at fair value (also referred to as “market value” within the financial statements) each day that the Fund’s listing exchange is open and, for financial reporting purposes, as of the report date. U.S. GAAP defines fair value as the price a fund would receive to sell an asset or pay to transfer a liability in an orderly transaction between market participants at the measurement date. The Board of Trustees of the Trust (the “Board”) of each Fund has approved the designation of BlackRock Fund Advisors (“BFA”), the Funds’ investment adviser, as the valuation designee for each Fund. Each Fund determines the fair values of its financial instruments using various independent dealers or pricing services under BFA’s policies. If a security’s market price is not readily available or does not otherwise accurately represent the fair value of the security, the security will be valued in accordance with BFA’s policies and procedures as reflecting fair value. BFA has formed a committee (the “Valuation Committee”) to develop pricing policies and procedures and to oversee the pricing function for all financial instruments, with assistance from other BlackRock pricing committees.
Fair Value Inputs and Methodologies: The following methods and inputs are used to establish the fair value of each Fund’s assets and liabilities:
• Equity investments traded on a recognized securities exchange are valued at that day’s official closing price, as applicable, on the exchange where the stock is primarily traded. Equity investments traded on a recognized exchange for which there were no sales on that day are valued at the last traded price.
• Investments in open-end U.S. mutual funds (including money market funds) are valued at that day’s published NAV.
• Futures contracts are valued based on that day’s last reported settlement or trade price on the exchange where the contract is traded.
Generally, trading in foreign instruments is substantially completed each day at various times prior to the close of trading on the New York Stock Exchange (“NYSE”). Each business day, the Funds use current market factors supplied by independent pricing services to value certain foreign instruments (“Systematic Fair Value Price”). The Systematic Fair Value Price is designed to value such foreign securities at fair value as of the close of trading on the NYSE, which follows the close of the local markets.
If events (e.g., market volatility, company announcement or a natural disaster) occur that are expected to materially affect the value of such investment, or in the event that application of these methods of valuation results in a price for an investment that is deemed not to be representative of the market value of such investment, or if a price is not available, the investment will be valued by the Valuation Committee, in accordance with BFA’s policies and procedures as reflecting fair value (“Fair Valued Investments”). The fair valuation approaches that may be used by the Valuation Committee include market approach, income approach and cost approach. Valuation techniques such as discounted cash flow, use of market comparables and matrix pricing are types of valuation approaches and are typically used in determining fair value. When determining the price for Fair Valued Investments, the Valuation Committee seeks to determine the price that each Fund might reasonably expect to receive or pay from the current sale or purchase of that asset or liability in an arm’s-length transaction. Fair value determinations shall be based upon all available factors that the Valuation Committee deems relevant and consistent with the principles of fair value measurement.
Fair value pricing could result in a difference between the prices used to calculate a fund’s NAV and the prices used by the fund’s underlying index, which in turn could result in a difference between the fund’s performance and the performance of the fund’s underlying index.
Fair Value Hierarchy: Various inputs are used in determining the fair value of financial instruments. These inputs to valuation techniques are categorized into a fair value hierarchy consisting of three broad levels for financial reporting purposes as follows:
• Level 1 – Unadjusted price quotations in active markets/exchanges for identical assets or liabilities that each Fund has the ability to access;
• Level 2 – Other observable inputs (including, but not limited to, quoted prices for similar assets or liabilities in markets that are active, quoted prices for identical or similar assets or liabilities in markets that are not active, inputs other than quoted prices that are observable for the assets or liabilities (such as interest rates, yield curves, volatilities, prepayment speeds, loss severities, credit risks and default rates) or other market-corroborated inputs); and
• Level 3 – Unobservable inputs based on the best information available in the circumstances, to the extent observable inputs are not available, (including the Valuation Committee’s assumptions used in determining the fair value of financial instruments).
Notes to Financial Statements49
Notes to Financial Statements (continued)
The hierarchy gives the highest priority to unadjusted quoted prices in active markets for identical assets or liabilities (Level 1 measurements) and the lowest priority to unobservable inputs (Level 3 measurements). Accordingly, the degree of judgment exercised in determining fair value is greatest for instruments categorized in Level 3. The inputs used to measure fair value may fall into different levels of the fair value hierarchy. In such cases, for disclosure purposes, the fair value hierarchy classification is determined based on the lowest level input that is significant to the fair value measurement in its entirety. Investments classified within Level 3 have significant unobservable inputs used by the Valuation Committee in determining the price for Fair Valued Investments. Level 3 investments include equity or debt issued by privately held companies or funds that may not have a secondary market and/or may have a limited number of investors. The categorization of a value determined for financial instruments is based on the pricing transparency of the financial instruments and is not necessarily an indication of the risks associated with investing in those securities.
4. SECURITIES AND OTHER INVESTMENTS
Securities Lending: Each Fund may lend its securities to approved borrowers, such as brokers, dealers and other financial institutions. The borrower pledges and maintains with the Fund collateral consisting of cash, an irrevocable letter of credit issued by an approved bank, or securities issued or guaranteed by the U.S. government. The initial collateral received by each Fund is required to have a value of at least 102% of the current market value of the loaned securities for securities traded on U.S. exchanges and a value of at least 105% for all other securities. The collateral is maintained thereafter at a value equal to at least 100% of the current value of the securities on loan. The market value of the loaned securities is determined at the close of each business day of the Fund and any additional required collateral is delivered to the Fund or excess collateral is returned by the Fund, on the next business day. During the term of the loan, each Fund is entitled to all distributions made on or in respect of the loaned securities but does not receive interest income on securities received as collateral. Loans of securities are terminable at any time and the borrower, after notice, is required to return borrowed securities within the standard time period for settlement of securities transactions.
As of period end, any securities on loan were collateralized by cash and/or U.S. Government obligations. Cash collateral invested in money market funds managed by BFA, or its affiliates is disclosed in the Schedule of Investments. Any non-cash collateral received cannot be sold, re-invested or pledged by the Fund, except in the event of borrower default. The securities on loan, if any, are also disclosed in each Fund’s Schedule of Investments. The market value of any securities on loan and the value of any related cash collateral are disclosed in the Statements of Assets and Liabilities.
Securities lending transactions are entered into by the Funds under Master Securities Lending Agreements (each, an “MSLA”) which provide the right, in the event of default (including bankruptcy or insolvency) for the non-defaulting party to liquidate the collateral and calculate a net exposure to the defaulting party or request additional collateral. In the event that a borrower defaults, the Funds, as lender, would offset the market value of the collateral received against the market value of the securities loaned. When the value of the collateral is greater than that of the market value of the securities loaned, the lender is left with a net amount payable to the defaulting party. However, bankruptcy or insolvency laws of a particular jurisdiction may impose restrictions on or prohibitions against such a right of offset in the event of an MSLA counterparty’s bankruptcy or insolvency. Under the MSLA, absent an event of default, the borrower can resell or re-pledge the loaned securities, and the Funds can reinvest cash collateral received in connection with loaned securities. Upon an event of default, the parties’ obligations to return the securities or collateral to the other party are extinguished, and the parties can resell or re-pledge the loaned securities or the collateral received in connection with the loaned securities in order to satisfy the defaulting party’s net payment obligation for all transactions under the MSLA. The defaulting party remains liable for any deficiency.
As of period end, the following table is a summary of the securities on loan by counterparty which are subject to offset under an MSLA:
iShares ETF and Counterparty | Securities Loaned
at Value | | Non-Cash Collateral
Received, at Fair Value(a) | |
| | | | |
| | | | |
Citigroup Global Markets, Inc. | | | | |
| | | | |
| | | | |
| | | | |
| | | | |
| | | | |
J.P. Morgan Securities LLC | | | | |
| | | | |
SG Americas Securities LLC | | | | |
State Street Bank & Trust Co. | | | | |
| | | | |
| | | | |
| | | | |
Lithium Miners and Producers | | | | |
| | | | |
| | | | |
Citigroup Global Markets, Inc. | | | | |
| | | | |
| | | | |
502024 iShares Annual Report to Shareholders
Notes to Financial Statements (continued)
| Collateral received, if any, in excess of the market value of securities on loan is not presented in this table. The total cash collateral received by each Fund is disclosed in the Fund’s Statements of Assets and Liabilities. |
The risks of securities lending include the risk that the borrower may not provide additional collateral when required or may not return the securities when due. To mitigate these risks, each Fund benefits from a borrower default indemnity provided by BlackRock, Inc. (“BlackRock”). BlackRock’s indemnity allows for full replacement of the securities loaned to the extent the collateral received does not cover the value of the securities loaned in the event of borrower default. Each Fund could incur a loss if the value of an investment purchased with cash collateral falls below the market value of the loaned securities or if the value of an investment purchased with cash collateral falls below the value of the original cash collateral received. Such losses are borne entirely by each Fund.
5. DERIVATIVE FINANCIAL INSTRUMENTS
Futures Contracts: Futures contracts are purchased or sold to gain exposure to, or manage exposure to, changes in interest rates (interest rate risk) and changes in the value of equity securities (equity risk) or foreign currencies (foreign currency exchange rate risk).
Futures contracts are exchange-traded agreements between the Funds and a counterparty to buy or sell a specific quantity of an underlying instrument at a specified price and on a specified date. Depending on the terms of a contract, it is settled either through physical delivery of the underlying instrument on the settlement date or by payment of a cash amount on the settlement date. Upon entering into a futures contract, the Funds are required to deposit initial margin with the broker in the form of cash or securities in an amount that varies depending on a contract’s size and risk profile. The initial margin deposit must then be maintained at an established level over the life of the contract. Amounts pledged, which are considered restricted, are included in cash pledged for futures contracts in the Statements of Assets and Liabilities.
Securities deposited as initial margin are designated in the Schedule of Investments and cash deposited, if any, are shown as cash pledged for futures contracts in the Statements of Assets and Liabilities. Pursuant to the contract, the Funds agree to receive from or pay to the broker an amount of cash equal to the daily fluctuation in market value of the contract (“variation margin”). Variation margin is recorded as unrealized appreciation (depreciation) and, if any, shown as variation margin receivable (or payable) on futures contracts in the Statements of Assets and Liabilities. When the contract is closed, a realized gain or loss is recorded in the Statements of Operations equal to the difference between the notional amount of the contract at the time it was opened and the notional amount at the time it was closed. The use of futures contracts involves the risk of an imperfect correlation in the movements in the price of futures contracts and interest rates, foreign currency exchange rates or underlying assets.
Forward Foreign Currency Exchange Contracts: Forward foreign currency exchange contracts are entered into to gain or reduce exposure to foreign currencies (foreign currency exchange rate risk).
A forward foreign currency exchange contract is an agreement between two parties to buy and sell a currency at a set exchange rate on a specified date. These contracts help to manage the overall exposure to the currencies in which some of the investments held by the Funds are denominated and in some cases, may be used to obtain exposure to a particular market.The contracts are traded over-the-counter (“OTC”) and not on an organized exchange.
The contract is marked-to-market daily and the change in market value is recorded as unrealized appreciation or depreciation in the Statements of Assets and Liabilities. When the contract is closed, a realized gain or loss is recorded in the Statements of Operations equal to the difference between the value at the time it was opened and the value at the time it was closed. Non-deliverable forward foreign currency exchange contracts are settled with the counterparty in cash without the delivery of foreign currency. The use of forward foreign currency exchange contracts involves the risk that the value of a contract changes unfavorably due to movements in the value of the referenced foreign currencies, and such value may exceed the amount(s) reflected in the Statements of Assets and Liabilities. Cash amounts pledged for forward foreign currency exchange contracts are considered restricted and are included in cash pledged as collateral for OTC derivatives in the Statements of Assets and Liabilities. A fund’s risk of loss from counterparty credit risk on OTC derivatives is generally limited to the aggregate unrealized gain netted against any collateral held by the Fund.
6. INVESTMENT ADVISORY AGREEMENT AND OTHER TRANSACTIONS WITH AFFILIATES
Investment Advisory Fees: Pursuant to an Investment Advisory Agreement with the Trust, BFA manages the investment of each Fund’s assets. BFA is a California corporation indirectly owned by BlackRock. Under the Investment Advisory Agreement, BFA is responsible for substantially all expenses of the Funds, except (i) interest and taxes; (ii) brokerage commissions and other expenses connected with the execution of portfolio transactions; (iii) distribution fees; (iv) the advisory fee payable to BFA; and (v) litigation expenses and any extraordinary expenses (in each case as determined by a majority of the independent trustees).
For its investment advisory services to each of the following Funds, BFA is entitled to an annual investment advisory fee, accrued daily and paid monthly by the Funds, based on the average daily net assets of each Fund as follows:
| |
| |
Environmental Infrastructure and Industrials | |
| |
Lithium Miners and Producers | |
Notes to Financial Statements51
Notes to Financial Statements (continued)
For its investment advisory services to each of the iShares Global Infrastructure and iShares Global Timber & Forestry ETFs, BFA is entitled to an annual investment advisory fee, accrued daily and paid monthly by the Funds, based on each Fund’s allocable portion of the aggregate of the average daily net assets of the Fund and certain other iShares funds as follows:
Aggregate Average Daily Net Assets | |
| |
Over $10 billion, up to and including $20 billion | |
Over $20 billion, up to and including $30 billion | |
Over $30 billion, up to and including $40 billion | |
| |
Distributor: BlackRock Investments, LLC, an affiliate of BFA, is the distributor for each Fund. Pursuant to the distribution agreement, BFA is responsible for any fees or expenses for distribution services provided to the Funds.
Securities Lending: The U.S. Securities and Exchange Commission (the “SEC”) has issued an exemptive order which permits BlackRock Institutional Trust Company, N.A. (“BTC”), an affiliate of BFA, to serve as securities lending agent for the Funds, subject to applicable conditions. As securities lending agent, BTC bears all operational costs directly related to securities lending, including any custodial costs. Each Fund is responsible for fees in connection with the investment of cash collateral received for securities on loan (the “collateral investment fees”). The cash collateral is invested in a money market fund, BlackRock Cash Funds: Institutional or BlackRock Cash Funds: Treasury, managed by BFA, or its affiliates. However, BTC has agreed to reduce the amount of securities lending income it receives in order to effectively limit the collateral investment fees each Fund bears to an annual rate of 0.04%. The SL Agency Shares of such money market fund will not be subject to a sales load, redemption fee, distribution fee or service fee. The money market fund in which the cash collateral has been invested may, under certain circumstances, impose a liquidity fee of up to 2% of the value redeemed or temporarily restrict redemptions for up to 10 business days during a 90 day period, in the event that the money market fund’s weekly liquid assets fall below certain thresholds.
Securities lending income is generally equal to the total of income earned from the reinvestment of cash collateral (and excludes collateral investment fees), and any fees or other payments to and from borrowers of securities. Each Fund retains a portion of the securities lending income and remits the remaining portion to BTC as compensation for its services as securities lending agent.
Pursuant to the current securities lending agreement, the iShares Global 100 ETF (the “Group 1 Fund”), retains 81% of securities lending income (which excludes collateral investment fees) and the amount retained can never be less than 70% of the total of securities lending income plus the collateral investment fees.
Pursuant to the current securities lending agreement, the iShares Copper and Metals Mining ETF, iShares Environmental Infrastructure and Industrials ETF, iShares Global Infrastructure ETF, iShares Global Timber & Forestry ETF and iShares Lithium Miners and Producers ETF (the “Group 2 Fund”), retains 82% of securities lending income (which excludes collateral investment fees) and the amount retained can never be less than 70% of the total of securities lending income plus the collateral investment fees.
In addition, commencing the business day following the date that the aggregate securities lending income plus the collateral investment fees generated across all 1940 Act iShares exchange-traded funds (the “iShares ETF Complex”) in a given calendar year exceeds a specified threshold: (1) the Group 1 Fund, pursuant to the securities lending agreement, will retain for the remainder of that calendar year 81% of securities lending income (which excludes collateral investment fees), and the amount retained can never be less than 70% of the total of securities lending income plus the collateral investment fees, and (2) each Group 2 Fund will retain for the remainder of that calendar year 85% of securities lending income (which excludes collateral investment fees), and the amount retained can never be less than 70% of the total of securities lending income plus the collateral investment fees.
The share of securities lending income earned by each Fund is shown as securities lending income – affiliated – net in its Statements of Operations. For the year ended March 31, 2024, the Funds paid BTC the following amounts for securities lending agent services:
| |
| |
Environmental Infrastructure and Industrials | |
| |
| |
| |
Lithium Miners and Producers | |
Officers and Trustees: Certain officers and/or trustees of the Trust are officers and/or trustees of BlackRock or its affiliates.
522024 iShares Annual Report to Shareholders
Notes to Financial Statements (continued)
Other Transactions: Cross trading is the buying or selling of portfolio securities between funds to which BFA (or an affiliate) serves as investment adviser. At its regularly scheduled quarterly meetings, the Board reviews such transactions as of the most recent calendar quarter for compliance with the requirements and restrictions set forth by Rule 17a-7.
For the year ended March 31, 2024, transactions executed by the Funds pursuant to Rule 17a-7 under the 1940 Act were as follows:
Each Fund may invest its positive cash balances in certain money market funds managed by BFA or an affiliate. The income earned on these temporary cash investments is shown as dividends – affiliated in the Statements of Operations.
A fund, in order to improve its portfolio liquidity and its ability to track its underlying index, may invest in shares of other iShares funds that invest in securities in the fund’s underlying index.
7. PURCHASES AND SALES
For the year ended March 31, 2024, purchases and sales of investments, excluding short-term securities and in-kind transactions, were as follows:
| | |
| | |
Environmental Infrastructure and Industrials | | |
| | |
| | |
| | |
Lithium Miners and Producers | | |
For the year ended March 31, 2024, in-kind transactions were as follows:
| | |
| | |
| | |
| | |
| | |
Lithium Miners and Producers | | |
8. INCOME TAX INFORMATION
Each Fund is treated as an entity separate from the Trust’s other funds for federal income tax purposes. It is each Fund’s policy to comply with the requirements of the Internal Revenue Code of 1986, as amended, applicable to regulated investment companies, and to distribute substantially all of its taxable income to its shareholders. Therefore, no U.S. federal income tax provision is required.
Management has analyzed tax laws and regulations and their application to the Funds as of March 31, 2024, inclusive of the open tax return years, and does not believe that there are any uncertain tax positions that require recognition of a tax liability in the Funds’ financial statements.
U.S. GAAP requires that certain components of net assets be adjusted to reflect permanent differences between financial and tax reporting. These reclassifications have no effect on net assets or NAV per share. As of March 31, 2024, permanent differences attributable to realized gains (losses) from in-kind redemptions were reclassified to the following accounts:
| | Accumulated
Earnings (Loss) |
| | |
| | |
| | |
Notes to Financial Statements53
Notes to Financial Statements (continued)
The tax character of distributions paid was as follows:
| | |
Environmental Infrastructure and Industrials | | |
| | |
| |
Lithium Miners and Producers | |
| |
As of March 31, 2024, the tax components of accumulated net earnings (losses) were as follows:
| Undistributed
Ordinary Income | | | | |
| | | | | |
Environmental Infrastructure and Industrials | | | | | |
| | | | | |
| | | | | |
| | | | | |
Lithium Miners and Producers | | | | | |
| Amounts available to offset future realized capital gains. |
| The difference between book-basis and tax-basis unrealized gains (losses) was attributable primarily to the tax deferral of losses on wash sales, the realization for tax purposes of unrealized gains (losses) on certain foreign currency and futures contracts and the realization for tax purposes of unrealized gains on investments in passive foreign investment companies. |
| The Funds have elected to defer these qualified late-year losses and recognize such losses in the next taxable year. |
A fund may own shares in certain foreign investment entities, referred to, under U.S. tax law, as “passive foreign investment companies.” Such fund may elect to mark-to-market annually the shares of each passive foreign investment company and would be required to distribute to shareholders any such marked-to-market gains.
As of March 31, 2024, gross unrealized appreciation and depreciation based on cost of investments (including short positions and derivatives, if any) for U.S. federal income tax purposes were as follows:
| | Gross Unrealized
Appreciation | Gross Unrealized
Depreciation | Net Unrealized
Appreciation
(Depreciation) |
| | | | |
Environmental Infrastructure and Industrials | | | | |
| | | | |
| | | | |
| | | | |
Lithium Miners and Producers | | | | |
542024 iShares Annual Report to Shareholders
Notes to Financial Statements (continued)
9. LINE OF CREDIT
The Funds, along with certain other iShares funds (“Participating Funds”), are parties to a $800 million credit agreement (“Syndicated Credit Agreement”) with a group of lenders, which expires on October 16, 2024. The line of credit may be used for temporary or emergency purposes, including redemptions, settlement of trades and rebalancing of portfolio holdings in certain target markets. The Funds may borrow up to the aggregate commitment amount subject to asset coverage and other limitations as specified in the Syndicated Credit Agreement. The Syndicated Credit Agreement has the following terms: a commitment fee of 0.15% per annum on the unused portion of the credit agreement and interest at a rate equal to the higher of (a) Daily Simple Secured Overnight Financing Rate (“SOFR”) plus 0.10% and 1.00% per annum or (b) the U.S. Federal Funds rate plus 1.00% per annum on amounts borrowed. The commitment fee is generally allocated to each Participating Fund based on the lesser of a Participating Fund’s relative exposure to certain target markets or a Participating Fund’s maximum borrowing amount as set forth by the terms of the Syndicated Credit Agreement.
During the year ended March 31, 2024, the Funds did not borrow under the Syndicated Credit Agreement.
10. PRINCIPAL RISKS
In the normal course of business, each Fund invests in securities or other instruments and may enter into certain transactions, and such activities subject the Fund to various risks, including, among others, fluctuations in the market (market risk) or failure of an issuer to meet all of its obligations. The value of securities or other instruments may also be affected by various factors, including, without limitation: (i) the general economy; (ii) the overall market as well as local, regional or global political and/or social instability; (iii) regulation, taxation or international tax treaties between various countries; or (iv) currency, interest rate or price fluctuations. Local, regional or global events such as war, acts of terrorism, the spread of infectious illness or other public health issues, recessions, or other events could have a significant impact on the Funds and their investments. Each Fund’s prospectus provides details of the risks to which the Fund is subject.
BFA uses an indexing approach to try to achieve each Fund’s investment objective. The Fund is not actively managed, and BFA generally does not attempt to take defensive positions under any market conditions, including declining markets.
The Funds may be exposed to additional risks when reinvesting cash collateral in money market funds that do not seek to maintain a stable NAV per share of $1.00, which may be subject to discretionary liquidity fees under certain circumstances.
Valuation Risk: The market values of equities, such as common stocks and preferred securities or equity related investments, such as futures and options, may decline due to general market conditions which are not specifically related to a particular company. They may also decline due to factors which affect a particular industry or industries. A fund may invest in illiquid investments. An illiquid investment is any investment that a fund reasonably expects cannot be sold or disposed of in current market conditions in seven calendar days or less without the sale or disposition significantly changing the market value of the investment. A fund may experience difficulty in selling illiquid investments in a timely manner at the price that it believes the investments are worth. Prices may fluctuate widely over short or extended periods in response to company, market or economic news. Markets also tend to move in cycles, with periods of rising and falling prices. This volatility may cause a fund’s NAV to experience significant increases or decreases over short periods of time. If there is a general decline in the securities and other markets, the NAV of a fund may lose value, regardless of the individual results of the securities and other instruments in which a fund invests.
Counterparty Credit Risk: The Funds may be exposed to counterparty credit risk, or the risk that an entity may fail to or be unable to perform on its commitments related to unsettled or open transactions, including making timely interest and/or principal payments or otherwise honoring its obligations. The Funds manage counterparty credit risk by entering into transactions only with counterparties that BFA believes have the financial resources to honor their obligations and by monitoring the financial stability of those counterparties. Financial assets, which potentially expose the Funds to market, issuer and counterparty credit risks, consist principally of financial instruments and receivables due from counterparties. The extent of the Funds’ exposure to market, issuer and counterparty credit risks with respect to these financial assets is approximately their value recorded in the Statements of Assets and Liabilities, less any collateral held by the Funds.
A derivative contract may suffer a mark-to-market loss if the value of the contract decreases due to an unfavorable change in the market rates or values of the underlying instrument. Losses can also occur if the counterparty does not perform under the contract.
With exchange-traded futures, there is less counterparty credit risk to the Funds since the exchange or clearinghouse, as counterparty to such instruments, guarantees against a possible default. The clearinghouse stands between the buyer and the seller of the contract; therefore, credit risk is limited to failure of the clearinghouse. While offset rights may exist under applicable law, a fund does not have a contractual right of offset against a clearing broker or clearinghouse in the event of a default (including the bankruptcy or insolvency). Additionally, credit risk exists in exchange-traded futures with respect to initial and variation margin that is held in a clearing broker’s customer accounts. While clearing brokers are required to segregate customer margin from their own assets, in the event that a clearing broker becomes insolvent or goes into bankruptcy and at that time there is a shortfall in the aggregate amount of margin held by the clearing broker for all its clients, typically the shortfall would be allocated on a pro rata basis across all the clearing broker’s customers, potentially resulting in losses to the Funds.
Geographic/Asset Class Risk: A diversified portfolio, where this is appropriate and consistent with a fund’s objectives, minimizes the risk that a price change of a particular investment will have a material impact on the NAV of a fund. The investment concentrations within each Fund’s portfolio are disclosed in its Schedule of Investments.
The Funds invest a significant portion of their assets in securities of issuers located in the United States. A decrease in imports or exports, changes in trade regulations, inflation and/or an economic recession in the United States may have a material adverse effect on the U.S. economy and the securities listed on U.S. exchanges. Proposed and adopted policy and legislative changes in the United States may also have a significant effect on U.S. markets generally, as well as on the value of certain securities.
Notes to Financial Statements55
Notes to Financial Statements (continued)
Governmental agencies project that the United States will continue to maintain elevated public debt levels for the foreseeable future which may constrain future economic growth. Circumstances could arise that could prevent the timely payment of interest or principal on U.S. government debt, such as reaching the legislative “debt ceiling.” Such non-payment would result in substantial negative consequences for the U.S. economy and the global financial system. If U.S. relations with certain countries deteriorate, it could adversely affect issuers that rely on the United States for trade. The United States has also experienced increased internal unrest and discord. If these trends were to continue, they may have an adverse impact on the U.S. economy and the issuers in which the the Funds invest.
Certain Funds invest a significant portion of their assets in securities of issuers located in Europe or with significant exposure to European issuers or countries. The European financial markets have recently experienced volatility and adverse trends due to concerns about economic downturns in, or rising government debt levels of, several European countries as well as acts of war in the region. These events may spread to other countries in Europe and may affect the value and liquidity of certain of the Funds’ investments.
Responses to the financial problems by European governments, central banks and others, including austerity measures and reforms, may not work, may result in social unrest and may limit future growth and economic recovery or have other unintended consequences. Further defaults or restructurings by governments and others of their debt could have additional adverse effects on economies, financial markets and asset valuations around the world. The United Kingdom has withdrawn from the European Union, and one or more other countries may withdraw from the European Union and/or abandon the Euro, the common currency of the European Union. These events and actions have adversely affected, and may in the future adversely affect, the value and exchange rate of the Euro and may continue to significantly affect the economies of every country in Europe, including countries that do not use the Euro and non-European Union member states. The impact of these actions, especially if they occur in a disorderly fashion, is not clear but could be significant and far reaching. In addition, Russia launched a large-scale invasion of Ukraine on February 24, 2022. The extent and duration of the military action, resulting sanctions and resulting future market disruptions in the region are impossible to predict, but have been, and may continue to be, significant and have a severe adverse effect on the region, including significant negative impacts on the economy and the markets for certain securities and commodities, such as oil and natural gas, as well as other sectors.
Certain Funds invest a significant portion of their assets in securities within a single or limited number of market sectors. When a fund concentrates its investments in this manner, it assumes the risk that economic, regulatory, political and social conditions affecting such sectors may have a significant impact on the fund and could affect the income from, or the value or liquidity of, the fund’s portfolio.
Significant Shareholder Redemption Risk: Certain shareholders may own or manage a substantial amount of fund shares and/or hold their fund investments for a limited period of time. Large redemptions of fund shares by these shareholders may force a fund to sell portfolio securities, which may negatively impact the fund’s NAV, increase the fund’s brokerage costs, and/or accelerate the realization of taxable income/gains and cause the fund to make additional taxable distributions to shareholders.
11. CAPITAL SHARE TRANSACTIONS
Capital shares are issued and redeemed by each Fund only in aggregations of a specified number of shares or multiples thereof (“Creation Units”) at NAV. Except when aggregated in Creation Units, shares of each Fund are not redeemable.
Transactions in capital shares were as follows:
| |
| | |
Copper and Metals Mining(a) | | |
| | |
| The Funds commenced operations on June 21, 2023. |
| | |
| | | | |
Environmental Infrastructure and Industrials | | | | |
| | | | |
| The Fund commenced operations on November 01, 2022. |
562024 iShares Annual Report to Shareholders
Notes to Financial Statements (continued)
| |
| | |
Lithium Miners and Producers(a) | | |
| | |
| The Funds commenced operations on June 21, 2023. |
The consideration for the purchase of Creation Units of a fund in the Trust generally consists of the in-kind deposit of a designated portfolio of securities and a specified amount of cash. Certain funds in the Trust may be offered in Creation Units solely or partially for cash in U.S. dollars. Authorized Participants purchasing and redeeming Creation Units may pay a purchase transaction fee and a redemption transaction fee directly to State Street Bank and Trust Company, the Trust’s administrator, to offset transfer and other transaction costs associated with the issuance and redemption of Creation Units, including Creation Units for cash. Authorized Participants transacting in Creation Units for cash may also pay an additional variable charge to compensate the relevant fund for certain transaction costs (i.e., stamp taxes, taxes on currency or other financial transactions, and brokerage costs) and market impact expenses relating to investing in portfolio securities. Such variable charges, if any, are included in shares sold in the table above.
From time to time, settlement of securities related to in-kind contributions or in-kind redemptions may be delayed. In such cases, securities related to in-kind transactions are reflected as a receivable or a payable in the Statements of Assets and Liabilities.
12. FOREIGN WITHHOLDING TAX CLAIMS
The Internal Revenue Service (“IRS”) has issued guidance to address U.S. income tax liabilities attributable to fund shareholders resulting from the recovery of foreign taxes withheld in prior calendar years. These withheld foreign taxes were passed through to shareholders in the form of foreign tax credits in the year the taxes were withheld. Assuming there are sufficient foreign taxes paid which iShares Global Infrastructure ETF is able to pass through to shareholders as a foreign tax credit in the current year, the Fund will be able to offset the prior years’ withholding taxes recovered against the foreign taxes paid in the current year. Accordingly, no federal income tax liability is recorded by the Fund.
The iShares Global 100 ETF is seeking a closing agreement with the Internal Revenue Service (“IRS”) to address any prior years’ U.S. income tax liabilities attributable to Fund shareholders resulting from the recovery of foreign taxes. The closing agreement would result in the Fund paying a compliance fee to the IRS, on behalf of its shareholders, representing the estimated tax savings generated from foreign tax credits claimed by Fund shareholders on their tax returns in prior years. The Fund has accrued a liability for the estimated IRS compliance fee related to foreign withholding tax claims, which is disclosed in the Statements of Assets and Liabilities. The actual IRS compliance fee may differ from the estimate and that difference may be material.
During the year, the iShares Global 100 ETF filed a closing agreement with the IRS related to the recovery of foreign taxes received in fiscal year 2022, and the related tax compliance fee, including interest, was paid to the IRS.
13. SUBSEQUENT EVENTS
Management has evaluated the impact of all subsequent events on the Funds through the date the financial statements were available to be issued and has determined that there were no subsequent events requiring adjustment or additional disclosure in the financial statements.
Notes to Financial Statements57
Report of Independent Registered Public Accounting Firm
To the Board of Trustees of
iShares Trust and Shareholders of each of the six funds listed in the table below
Opinions on the Financial Statements
We have audited the accompanying statements of assets and liabilities, including the schedules of investments, of each of the funds listed in the table below (six of the funds constituting iShares Trust, hereafter collectively referred to as the "Funds") as of March 31, 2024, the related statements of operations and of changes in net assets for each of the periods indicated in the table below, including the related notes, and the financial highlights for each of the periods indicated therein (collectively referred to as the “financial statements”). In our opinion, the financial statements present fairly, in all material respects, the financial position of each of the Funds listed in the table below as of March 31, 2024, the results of each of their operations and the changes in each of their net assets for the periods indicated in the table below, and each of the financial highlights for each of the periods indicated therein, in conformity with accounting principles generally accepted in the United States of America.
iShares Copper and Metals Mining ETF(1) |
iShares Environmental Infrastructure and Industrials ETF(2) |
iShares Global 100 ETF(3) |
iShares Global Infrastructure ETF(3) |
iShares Global Timber & Forestry ETF(3) |
iShares Lithium Miners and Producers ETF(1) |
(1) Statement of operations and statement of changes in net assets for the period June 21, 2023 (commencement of operations) to March 31, 2024.
(2) Statement of operations for the year ended March 31, 2024, and statement of changes in net assets for the year ended March 31, 2024 and for the period November 1, 2022 (commencement of operations) to March 31, 2023.
(3) Statement of operations for the year ended March 31, 2024 and statement of changes in net assets for each of the two years in the period ended March 31, 2024.
Basis for Opinions
These financial statements are the responsibility of the Funds’ management. Our responsibility is to express an opinion on the Funds’ financial statements based on our audits. We are a public accounting firm registered with the Public Company Accounting Oversight Board (United States) (PCAOB) and are required to be independent with respect to the Funds in accordance with the U.S. federal securities laws and the applicable rules and regulations of the Securities and Exchange Commission and the PCAOB.
We conducted our audits of these financial statements in accordance with the standards of the PCAOB. Those standards require that we plan and perform the audit to obtain reasonable assurance about whether the financial statements are free of material misstatement, whether due to error or fraud.
Our audits included performing procedures to assess the risks of material misstatement of the financial statements, whether due to error or fraud, and performing procedures that respond to those risks. Such procedures included examining, on a test basis, evidence regarding the amounts and disclosures in the financial statements. Our audits also included evaluating the accounting principles used and significant estimates made by management, as well as evaluating the overall presentation of the financial statements. Our procedures included confirmation of securities owned as of March 31, 2024 by correspondence with the custodian, transfer agent and brokers; when replies were not received from brokers, we performed other auditing procedures. We believe that our audits provide a reasonable basis for our opinions.
/s/PricewaterhouseCoopers LLP
Philadelphia, Pennsylvania
May 23, 2024
We have served as the auditor of one or more BlackRock investment companies since 2000.
582024 iShares Annual Report to Shareholders
Important Tax Information (unaudited)
The following amounts, or maximum amounts allowable by law, are hereby designated as qualified dividend income for individuals for the fiscal year ended March 31, 2024:
| |
| |
Environmental Infrastructure and Industrials | |
| |
| |
| |
Lithium Miners and Producers | |
The following amounts, or maximum amounts allowable by law, are hereby designated as qualified business income for individuals for the fiscal year ended March 31, 2024:
The Funds intend to pass through to their shareholders the following amounts, or maximum amounts allowable by law, of foreign source income earned and foreign taxes paid for the fiscal year ended March 31, 2024:
| Foreign Source
Income Earned | |
| | |
Environmental Infrastructure and Industrials | | |
| | |
| | |
Lithium Miners and Producers | | |
The following percentages, or maximum percentages allowable by law, of ordinary income distributions paid during the fiscal year ended March 31, 2024 qualified for the dividends-received deduction for corporate shareholders:
| Dividends-Received
Deduction |
| |
Environmental Infrastructure and Industrials | |
| |
| |
| |
Lithium Miners and Producers | |
Important Tax Information59
Statement Regarding Liquidity Risk Management Program (unaudited)
In compliance with Rule 22e-4 under the Investment Company Act of 1940, as amended (the “Liquidity Rule”), iShares Trust (the “Trust”) has adopted and implemented a liquidity risk management program (the “Program”) for iShares Copper and Metals Mining ETF, iShares Environmental Infrastructure and Industrials ETF, iShares Global 100 ETF, iShares Global Infrastructure ETF, iShares Global Timber & Forestry ETF and iShares Lithium Miners and Producers ETF (the “Funds” or “ETFs”), each a series of the Trust, which is reasonably designed to assess and manage each Fund’s liquidity risk.
The Board of Trustees (the “Board”) of the Trust, on behalf of the Funds, met on December 8, 2023 (the “Meeting”) to review the Program. The Board previously appointed BlackRock Fund Advisors (“BlackRock”), the investment adviser to the Funds, as the program administrator for each Fund’s Program. BlackRock also previously delegated oversight of the Program to the 40 Act Liquidity Risk Management Committee (the “Committee”). At the Meeting, the Committee, on behalf of BlackRock, provided the Board with a report that addressed the operation of the Program and assessed its adequacy and effectiveness of implementation, including the management of each Fund’s Highly Liquid Investment Minimum (“HLIM”) where applicable, and any material changes to the Program (the “Report”). The Report covered the period from October 1, 2022 through September 30, 2023 (the “Program Reporting Period”).
The Report described the Program’s liquidity classification methodology for categorizing each Fund’s investments (including derivative transactions) into one of four liquidity buckets. It also referenced the methodology used by BlackRock to establish each Fund’s HLIM and noted that the Committee reviews and ratifies the HLIM assigned to each Fund no less frequently than annually. The Report also discussed notable events affecting liquidity over the Program Reporting Period, including extended market holidays, delays in the repatriation of the local currency in certain non-U.S. countries, the continued illiquidity of Russian equity securities and the suspension of select sanctions in Venezuela.
The Report noted that the Program complied with the key factors for consideration under the Liquidity Rule for assessing, managing and periodically reviewing each Fund’s liquidity risk, as follows:
a) The Fund’s investment strategy and liquidity of portfolio investments during both normal and reasonably foreseeable stressed conditions. During the Program Reporting Period, the Committee reviewed whether each Fund’s strategy is appropriate for an open-end fund structure, with a focus on funds with more significant and consistent holdings of less liquid and illiquid assets. The Committee also factored a fund’s concentration in an issuer into the liquidity classification methodology by taking issuer position sizes into account. Derivative exposure was also considered in the calculation of a fund’s liquidity bucketing. Finally, a factor for consideration under the Liquidity Rule is a Fund’s use of borrowings for investment purposes. However, the Funds do not borrow for investment purposes.
b) Short-term and long-term cash flow projections during both normal and reasonably foreseeable stressed conditions. During the Program Reporting Period, the Committee reviewed historical redemption activity and used this information as a component to establish each ETF’s reasonably anticipated trading size utilized for liquidity classifications. The Committee may also take into consideration a fund’s shareholder ownership concentration (which, depending on product type and distribution channel, may or may not be available), a fund’s distribution channels, and the degree of certainty associated with a fund’s short-term and long-term cash flow projections.
c) Holdings of cash and cash equivalents, as well as borrowing arrangements. The Committee considered that ETFs generally do not hold more than de minimis amounts of cash. The Committee also considered that ETFs generally do not engage in borrowing.
d) The relationship between an ETF’s portfolio liquidity and the way in which, and the prices and spreads at which, ETF shares trade, including the efficiency of the arbitrage function and the level of active participation by market participants, including authorized participants. The Committee monitored the prevailing bid/ask spread and the ETF price premium (or discount) to NAV for all ETFs. However, there were no ETFs with persistent deviations of fund premium/discount or bid/ask spreads from long-term averages over the Program Reporting Period.
e) The effect of the composition of baskets on the overall liquidity of an ETF’s portfolio. In reviewing the linkage between the composition of custom baskets accepted by an ETF and any significant change in the liquidity profile of such ETF, the Committee reviewed changes in the proportion of each ETF’s portfolio comprised of less liquid and illiquid holdings to determine if applicable thresholds were met requiring enhanced review. There were no ETFs for which the custom baskets accepted by the ETF had a significant change in its liquidity profile.
There were no material changes to the Program during the Program Reporting Period other than the enhancement of certain model components in the Program’s classification methodology. The Report provided to the Board stated that the Committee concluded that based on the operation of the functions, as described in the Report, the Program is operating as intended and is effective in implementing the requirements of the Liquidity Rule.
602024 iShares Annual Report to Shareholders
Supplemental Information (unaudited)
Section 19(a) Notices
The amounts and sources of distributions reported are estimates and are being provided pursuant to regulatory requirements and are not being provided for tax reporting purposes. The actual amounts and sources for tax reporting purposes will depend upon each Fund’s investment experience during the year and may be subject to changes based on tax regulations. Shareholders will receive a Form 1099-DIV each calendar year that will inform them how to report these distributions for federal income tax purposes.
March 31, 2024
| Total Cumulative Distributions
for the Fiscal Year | % Breakdown of the Total Cumulative
Distributions for the Fiscal Year |
| | Net Realized
Capital Gains | | | | Net Realized
Capital Gains | | |
Copper and Metals Mining(a) | | | | | | | | |
| | | | | | | | |
| | | | | | | | |
Lithium Miners and Producers(a) | | | | | | | | |
| The Fund estimates that it has distributed more than its net investment income and net realized capital gains; therefore, a portion of the distribution may be a return of capital. A return of capital may occur, for example, when some or all of the shareholder's investment in the Fund is returned to the shareholder. A return of capital does not necessarily reflect the Fund’s investment performance and should not be confused with “yield” or “income”. When distributions exceed total return performance, the difference will incrementally reduce the Fund’s net asset value per share. |
Tailored Shareholder Reports for Open-End Mutual Funds and ETFs
Effective January 24, 2023, the SEC adopted rule and form amendments to require open-end mutual funds and ETFs to transmit concise and visually engaging streamlined annual and semiannual reports to shareholders that highlight key information. Other information, including financial statements, will no longer appear in a streamlined shareholder report but must be available online, delivered free of charge upon request, and filed on a semiannual basis on Form N-CSR. The rule and form amendments have a compliance date of July 24, 2024. At this time, management is evaluating the impact of these amendments on the shareholder reports for the Funds.
Premium/Discount Information
Information on the Fund's net asset value, market price, premiums and discounts, and bid-ask spreads can be found at iShares.com.
Supplemental Information61
Trustee and Officer Information (unaudited)
The Board of Trustees has responsibility for the overall management and operations of the Funds, including general supervision of the duties performed by BFA and other service providers. Each Trustee serves until he or she resigns, is removed, dies, retires or becomes incapacitated. Each officer shall hold office until his or her successor is elected and qualifies or until his or her death, resignation or removal. Trustees who are not “interested persons” (as defined in the 1940 Act) of the Trust are referred to as independent trustees (“Independent Trustees”).
The registered investment companies advised by BFA or its affiliates (the “BlackRock-advised Funds”) are organized into one complex of open-end equity, multi-asset, index and money market funds and ETFs (the “BlackRock Multi-Asset Complex”), one complex of closed-end funds and open-end non-index fixed-income funds (including ETFs) (the “BlackRock Fixed-Income Complex”) and one complex of ETFs (“Exchange-Traded Fund Complex”) (each, a “BlackRock Fund Complex”). Each Fund is included in the Exchange-Traded Fund Complex. Each Trustee also serves as a Director of iShares, Inc. and a Trustee of iShares U.S. ETF Trust and, as a result, oversees all of the funds within the Exchange-Traded Fund Complex, which consists of 404 funds as of March 31, 2024. With the exception of Stephen Cohen, Robert S. Kapito and Aaron Wasserman, the address of each Trustee and officer is c/o BlackRock, Inc., 400 Howard Street, San Francisco, CA 94105. The address of Mr. Kapito and Mr. Wasserman is c/o BlackRock, Inc., 50 Hudson Yards, New York, NY 10001. The address of Mr. Cohen is c/o BlackRock, Inc., Drapers Gardens, 12 Throgmorton Avenue, London EC2N 2DL United Kingdom. The Board has designated John E. Kerrigan as its Independent Board Chair. Additional information about the Funds’ Trustees and officers may be found in the Funds’ combined Statement of Additional Information, which is available without charge, upon request, by calling toll-free 1-800-iShares (1-800-474-2737).
|
| | Principal Occupation(s)
During Past 5 Years | Other Directorships Held by Trustee |
| | President of BlackRock, Inc. (since 2006); Vice Chairman of BlackRock, Inc. and Head of BlackRock’s Portfolio Management Group (since its formation in 1998) and BlackRock, Inc.’s predecessor entities (since 1988); Trustee, University of Pennsylvania (since 2009); President of Board of Directors, Hope & Heroes Children’s Cancer Fund (since 2002). | Director of BlackRock, Inc. (since 2006); Director of iShares, Inc. (since 2009); Trustee of iShares U.S. ETF Trust (since 2011). |
| | Senior Managing Director, Head of Global Product Solutions of BlackRock, Inc. (since 2024); Senior Managing Director, Head of Europe, Middle East and Africa Regions of BlackRock, Inc. (2021-2024); Head of iShares Index and Wealth in EMEA of BlackRock, Inc. (2017-2021); Global Head of Fixed Income Indexing of BlackRock, Inc. (2016-2017); Chief Investment Strategist for International Fixed Income and iShares of BlackRock, Inc. (2011-2015). | Director of iShares, Inc. (since 2024); Trustee of iShares U.S. ETF Trust (since 2024). |
(a) Robert S. Kapito is deemed to be an “interested person” (as defined in the 1940 Act) of the Trust due to his affiliations with BlackRock, Inc. and its affiliates. |
(b) Stephen Cohen is deemed to be an "interested person" (as defined in the 1940 Act) of the Trust due to his affiliations with BlackRock, Inc. and its affiliates. |
|
| | Principal Occupation(s)
During Past 5 Years | Other Directorships Held by Trustee |
| Trustee (since 2005); Independent Board Chair (since 2022). | Chief Investment Officer, Santa Clara University (since 2002). | Director of iShares, Inc. (since 2005); Trustee of iShares U.S. ETF Trust (since 2011); Independent Board Chair of iShares, Inc. and iShares U.S. ETF Trust (since 2022). |
| Trustee (since 2015); Risk Committee Chair (since 2016). | Consultant (since 2012); Member of the Audit Committee (2012-2018), Chair of the Nominating and Governance Committee (2017-2018) and Director of PHH Corporation (mortgage solutions) (2012-2018); Managing Director and Global Head of Financial Holding Company Governance & Assurance and the Global Head of Operational Risk Management of Morgan Stanley (2006-2012). | Director of iShares, Inc. (since 2015); Trustee of iShares U.S. ETF Trust (since 2015); Member of the Audit Committee (since 2016), Chair of the Audit Committee (since 2020) and Director of The Hanover Insurance Group, Inc. (since 2016). |
| Trustee (since 2017); Audit Committee Chair (since 2019). | Partner, KPMG LLP (2002-2016); Director of One Generation Away (since 2021). | Director of iShares, Inc. (since 2017); Trustee of iShares U.S. ETF Trust (since 2017). |
622024 iShares Annual Report to Shareholders
Trustee and Officer Information (unaudited) (continued)
Independent Trustees (continued) |
| | Principal Occupation(s) During Past 5 Years | Other Directorships Held by Trustee |
| Trustee (since 2005); Nominating and Governance and Equity Plus Committee Chairs (since 2022). | Chair of the Finance Committee (since 2019) and Trustee and Member of the Finance, Audit and Quality Committees of Stanford Health Care (since 2016); Trustee of WNET, New York’s public media company (since 2011) and Member of the Audit Committee (since 2018), Investment Committee (since 2011) and Personnel Committee (since 2022); Member of the Wyoming State Investment Funds Committee (since 2022); Trustee of Forward Funds (14 portfolios) (2009-2018); Trustee of Salient MF Trust (4 portfolios) (2015-2018); Director of the Jackson Hole Center for the Arts (since 2021). | Director of iShares, Inc. (since 2005); Trustee of iShares U.S. ETF Trust (since 2011). |
| Trustee (since 2017); 15(c) Committee Chair (since 2017). | Senior Managing Director of New York Life Insurance Company (2010-2015). | Director of iShares, Inc. (since 2017); Trustee of iShares U.S. ETF Trust (since 2017); Director of Jackson Financial Inc. (since 2021). |
| Trustee (since 2003); Securities Lending Committee Chair (since 2019). | Director of Real Estate Equity Exchange, Inc. (since 2005); Director of Cloudera Foundation (2017-2020); and Director of Reading Partners (2012-2016). | Director of iShares, Inc. (since 2003); Trustee of iShares U.S. ETF Trust (since 2011). |
| Trustee (since 2011); Fixed-Income Plus Committee Chair (since 2019). | Dean, and George Pratt Shultz Professor of Accounting, University of Chicago Booth School of Business (since 2017); Advisory Board Member (since 2016) and Director (since 2020) of C.M. Capital Corporation; Chair of the Board for the Center for Research in Security Prices, LLC (since 2020); Director of WellBe Senior Medical (since 2023); Robert K. Jaedicke Professor of Accounting, Stanford University Graduate School of Business (2001-2017); Professor of Law (by courtesy), Stanford Law School (2005-2017); Senior Associate Dean for Academic Affairs and Head of MBA Program, Stanford University Graduate School of Business (2010-2016). | Director of iShares, Inc. (since 2011); Trustee of iShares U.S. ETF Trust (since 2011). |
|
| | Principal Occupation(s)
During Past 5 Years |
| | Managing Director of BlackRock, Inc. (since 2015); Head of Global Product Solutions, Americas of BlackRock, Inc. (since 2024) and Head of Sustainable and Transition Solutions of BlackRock, Inc. (2022-2024); Global Head of Corporate Strategy of BlackRock, Inc. (2019-2022); Chief of Staff to the CEO of BlackRock, Inc. (2017-2019). |
| Treasurer and Chief Financial Officer (since 2020). | Managing Director of BlackRock, Inc. (since 2019); Chief Financial Officer of iShares Delaware Trust Sponsor LLC, BlackRock Funds, BlackRock Funds II, BlackRock Funds IV, BlackRock Funds V and BlackRock Funds VI (since 2021). |
| Chief Compliance Officer (iShares, Inc. and iShares Trust, since 2023; iShares U.S. ETF Trust, since 2023). | Managing Director of BlackRock, Inc. (since 2018); Chief Compliance Officer of the BlackRock Multi-Asset Complex, the BlackRock Fixed-Income Complex and the Exchange-Traded Fund Complex (since 2023); Deputy Chief Compliance Officer for the BlackRock Multi-Asset Complex, the BlackRock Fixed-Income Complex and the Exchange-Traded Fund Complex (2014-2023). |
| | Managing Director of BlackRock, Inc. (since 2023); Director of BlackRock, Inc. (2018-2022). |
| Executive Vice President (since 2022). | Managing Director of BlackRock, Inc. (since 2018); Head of U.S. iShares Product (since 2022); Head of EII U.S. Product Engineering of BlackRock, Inc. (since 2021); Co-Head of EII’s Americas Portfolio Engineering of BlackRock, Inc. (2020-2021); Head of Developed Markets Portfolio Engineering of BlackRock, Inc. (2016-2019). |
| Executive Vice President (since 2022). | Managing Director of BlackRock, Inc. (since 2009); Co-Head of Index Equity of BlackRock, Inc. (since 2022). |
Trustee and Officer Information63
Trustee and Officer Information (unaudited) (continued)
|
| | Principal Occupation(s) During Past 5 Years |
| Executive Vice President (since 2022). | Managing Director of BlackRock, Inc. (since 2010); Head of Fixed Income Index Investments in the Americas and Head of San Francisco Core Portfolio Management of BlackRock, Inc. (since 2020). |
Effective July 1, 2023, Aaron Wasserman replaced Charles Park as Chief Compliance Officer. |
Effective February 1, 2024, Salim Ramji resigned as Trustee of the Trust. |
Effective March 5, 2024, Stephen Cohen replaced Salim Ramji as Trustee of the Trust. |
Effective March 5, 2024, Dominik Rohé resigned as President of the Trust. |
Effective March 5, 2024, Jessica Tan replaced Dominik Rohé as President of the Trust. |
Effective April 8, 2024, Laura Fergerson was appointed as Trustee of the Trust. |
Effective April 8, 2024, James Lam was appointed as Trustee of the Trust. |
642024 iShares Annual Report to Shareholders
Electronic Delivery
Shareholders can sign up for e-mail notifications announcing that the shareholder report or prospectus has been posted on the iShares website at iShares.com. Once you have enrolled, you will no longer receive prospectuses and shareholder reports in the mail.
To enroll in electronic delivery:
• Go to icsdelivery.com.
• If your brokerage firm is not listed, electronic delivery may not be available. Please contact your broker-dealer or financial advisor.
Householding
Householding is an option available to certain fund investors. Householding is a method of delivery, based on the preference of the individual investor, in which a single copy of certain shareholder documents and Rule 30e-3 notices can be delivered to investors who share the same address, even if their accounts are registered under different names. Please contact your broker-dealer if you are interested in enrolling in householding and receiving a single copy of prospectuses and other shareholder documents, or if you are currently enrolled in householding and wish to change your householding status.
Availability of Quarterly Schedule of Investments
The Funds file their complete schedule of portfolio holdings with the SEC for the first and third quarters of each fiscal year as an exhibit to their reports on Form N-PORT. The Funds’ Forms N-PORT are available on the SEC’s website at sec.gov. Additionally, each Fund makes its portfolio holdings for the first and third quarters of each fiscal year available at iShares.com/fundreports.
Availability of Proxy Voting Policies and Proxy Voting Records
A description of the policies and procedures that the iShares Funds use to determine how to vote proxies relating to portfolio securities and information about how the iShares Funds voted proxies relating to portfolio securities during the most recent twelve-month period ending June 30 is available without charge, upon request (1) by calling toll-free 1-800-474-2737; (2) on the iShares website at iShares.com; and (3) on the SEC website at sec.gov.
A description of the Trust’s policies and procedures with respect to the disclosure of the Fund’s portfolio securities is available in the Fund Prospectus. The Fund discloses its portfolio holdings daily and provides information regarding its top holdings in Fund fact sheets at iShares.com.
Glossary of Terms Used in this Report
|
| American Depositary Receipt |
| |
| |
662024 iShares Annual Report to Shareholders
THIS PAGE INTENTIONALLY LEFT BLANK.
Want to know more?
iShares.com | 1-800-474-2737
This report is intended for the Funds’ shareholders. It may not be distributed to prospective investors unless it is preceded or accompanied by the current prospectus.
Investing involves risk, including possible loss of principal.
The iShares Funds are distributed by BlackRock Investments, LLC (together with its affiliates, “BlackRock”).
The iShares Funds are not sponsored, endorsed, issued, sold or promoted by FTSE International Limited, S&P Dow Jones Indices LLC or STOXX Ltd., nor do these companies make any representation regarding the advisability of investing in the iShares Funds. BlackRock is not affiliated with the companies listed above.
©2024 BlackRock, Inc. All rights reserved. iSHARES and BLACKROCK are registered trademarks of BlackRock, Inc. or its subsidiaries. All other marks are the property of their respective owners.
|
• iShares Global Comm Services ETF | IXP | NYSE Arca |
• iShares Global Consumer Discretionary ETF | RXI | NYSE Arca |
• iShares Global Consumer Staples ETF | KXI | NYSE Arca |
• iShares Global Energy ETF | IXC | NYSE Arca |
• iShares Global Financials ETF | IXG | NYSE Arca |
• iShares Global Healthcare ETF | IXJ | NYSE Arca |
• iShares Global Industrials ETF | EXI | NYSE Arca |
• iShares Global Materials ETF | MXI | NYSE Arca |
• iShares Global Tech ETF | IXN | NYSE Arca |
• iShares Global Utilities ETF | JXI | NYSE Arca |
|

Rob Kapito
President, BlackRock Inc.
Dear Shareholder,
The combination of continued economic growth and cooling inflation provided a supportive backdrop for investors during the 12-month reporting period ended March 31, 2024. Higher interest rates helped to rein in inflation, and the Consumer Price Index decelerated substantially while remaining above pre-pandemic levels. A moderating labor market helped ease inflationary pressure, although wages continued to grow. Wage and job growth powered robust consumer spending, backstopping the economy. On October 7, 2023, Hamas launched a horrific attack on Israel. The ensuing war has had a significant humanitarian impact and could lead to heightened economic and market volatility. We see geopolitics as a structural market risk going forward. See our geopolitical risk dashboard at blackrock.com for more details.
Equity returns were robust during the period, as interest rates stabilized and the economy proved to be more resilient than many investors expected. The U.S. economy continued to show strength, and growth further accelerated in the second half of 2023. Large-capitalization U.S. stocks posted particularly substantial gains, supported by the performance of a few notable technology companies, while small-capitalization U.S. stocks’ advance was slower but still robust. Meanwhile, international developed market equities also gained strongly, while emerging market stocks advanced at a more modest pace.
The 10-year U.S. Treasury yield rose during the reporting period, as investors reacted to elevated inflation and attempted to anticipate future interest rate changes. However, higher yields drove positive returns overall for 10-year U.S. Treasuries and solid gains in shorter-duration U.S. Treasuries. The corporate bond market benefited from improving economic sentiment, although high-yield corporate bond prices fared significantly better than investment-grade bonds as demand from yield-seeking investors remained strong.
The U.S. Federal Reserve (the “Fed”), attempting to manage persistent inflation, raised interest rates twice during the 12-month period, but paused its tightening after its July meeting. The Fed also continued to reduce its balance sheet by not replacing some of the securities that reach maturity.
Supply constraints appear to have become an embedded feature of the new macroeconomic environment, making it difficult for developed economies to increase production without sparking higher inflation. Geopolitical fragmentation and an aging population risk further exacerbating these constraints, keeping the labor market tight and wage growth high. Although the Fed has stopped tightening for now, we believe that the new economic regime means that the Fed will need to maintain high rates for an extended period despite the market’s hopes for rapid interest rate cuts, as reflected in the ongoing rally. In this new regime, we anticipate greater volatility and dispersion of returns, creating more opportunities for selective portfolio management.
Looking at developed market stocks, we have an overweight stance on U.S. stocks overall, particularly given the promise of emerging AI technologies. We are also overweight Japanese stocks as shareholder-friendly policies generate increased investor interest, although we maintain an underweight stance on European stocks. In credit, there are selective opportunities in the near term despite tighter credit and financial conditions. For fixed income investing with a six- to twelve-month horizon, we see the most attractive investments in short-term U.S. Treasuries and hard-currency emerging market bonds.
Overall, our view is that investors need to think globally, position themselves to be prepared for a decarbonizing economy, and be nimble as market conditions change. We encourage you to talk with your financial advisor and visit iShares.com for further insight about investing in today’s markets.
Rob Kapito
President, BlackRock Inc.
Total Returns as of March 31, 2024 |
| | |
U.S. large cap equities
(S&P 500® Index) | | |
U.S. small cap equities
(Russell 2000® Index) | | |
International equities
(MSCI Europe, Australasia, Far East Index) | | |
Emerging market equities
(MSCI Emerging Markets Index) | | |
3-month Treasury bills
(ICE BofA 3-Month U.S. Treasury Bill Index) | | |
U.S. Treasury securities
(ICE BofA 10-Year U.S. Treasury Index) | | |
U.S. investment grade bonds
(Bloomberg U.S. Aggregate Bond Index) | | |
Tax-exempt municipal bonds
(Bloomberg Municipal Bond Index) | | |
U.S. high yield bonds
(Bloomberg U.S. Corporate High Yield 2% Issuer Capped Index) | | |
Past performance is not an indication of future results. Index performance is shown for illustrative purposes only. You cannot invest directly in an index. |
2This Page is not Part of Your Fund Report
iShares Trust
Global Market Overview
Global equity markets advanced during the 12 months ended March 31, 2024 (“reporting period”), supported by continued economic growth and moderating inflation in most parts of the world. The MSCI ACWI, a broad global equity index that includes both developed and emerging markets, returned 23.22% in U.S. dollar terms for the reporting period. Despite concerns about the impact of higher interest rates and rising prices, the global economy was resilient, posting moderate growth in 2023 at a similar pace to the prior year. Inflation began to subside in most regions of the world, as stabilizing energy prices and improved supply chains reduced pressure on consumers. However, geopolitical tensions were high during the reporting period, raising concerns about global economic disruptions from wars in Ukraine and Gaza. Following a terrorist attack on Israel by Hamas, Israel’s retaliation in Gaza and the resulting humanitarian impact raised tensions in the region, leading to counterstrikes between Israel, the U.S., and regional militant organizations. The events raised concerns among market participants that further escalation could lead to a broad regional war.
Among developed economies, the U.S. stood out, growing at a robust pace in 2023 despite elevated interest rates and persistent inflation. The U.S. consumer helped to power the expansion, as consumer spending continued to grow in both nominal and real (inflation-adjusted) terms. A strong labor market bolstered consumer spending, as employers continued to add jobs and average hourly wages increased notably. Consumer spending was also supported by higher asset values, as both home prices and strong equity performance increased household net worth. While improved supply chains eased goods inflation, the tight labor market kept labor costs near record highs, and growing services inflation was a significant driver of inflation’s overall persistence.
To counteract inflation, the U.S. Federal Reserve Bank (“Fed”) raised interest rates twice early in the reporting period, reaching the highest level since 2001. However, the Fed paused its interest rate increases thereafter as inflation edged down, keeping interest rates steady following its July 2023 meeting. The Fed also continued to decrease the size of its balance sheet by reducing the store of U.S. Treasuries it had accumulated to stabilize markets in the early phases of the coronavirus pandemic. Projections released by the Fed late in the reporting period included several interest rate decreases later in 2024, as it forecast that inflation would continue to moderate despite the robust economy.
European stocks posted strong gains as energy prices stabilized and inflation decelerated sharply. While growth in the Eurozone was nearly flat, the tepid economy meant that consumer spending was moderate, resulting in less upward pressure on prices. The European Central Bank (“ECB”) raised interest rates four times in the first half of the reporting period but declined to increase interest rates thereafter, citing progress in lowering inflation.
Asia-Pacific region stocks also advanced, albeit at a slower pace than other regions of the world. Japan returned to moderate growth in the fourth quarter of 2023 following a contraction in the third quarter. Solid exports, rising profits, and a series of corporate reforms bolstered Japanese equities. However, Chinese stocks were negatively impacted by investor concerns about government regulations and rising geopolitical tensions with the U.S. Meanwhile, emerging market stocks gained, helped by the pausing of interest rate increases from the Fed and the ECB. Stocks in India advanced significantly amid strong economic growth and robust corporate earnings, as India’s expanding middle class bolstered consumer spending.
42024 iShares Annual Report to Shareholders
Fund Summary as of March 31, 2024
iShares® Global Comm Services ETF
Investment Objective
The iShares Global Comm Services ETF (the “Fund”) seeks to track the investment results of an index composed of global equities in the communication services sector, as represented by the S&P Global 1200 Communication Services 4.5/22.5/45 Capped IndexTM (the “Index”). The Fund invests in a representative sample of securities included in the Index that collectively has an investment profile similar to the Index. Due to the use of representative sampling, the Fund may or may not hold all of the securities that are included in the Index.
Performance
| Average Annual Total Returns | | |
| | | | | | | |
| | | | | | | |
| | | | | | | |
| | | | | | | |
GROWTH OF $10,000 INVESTMENT(AT NET ASSET VALUE)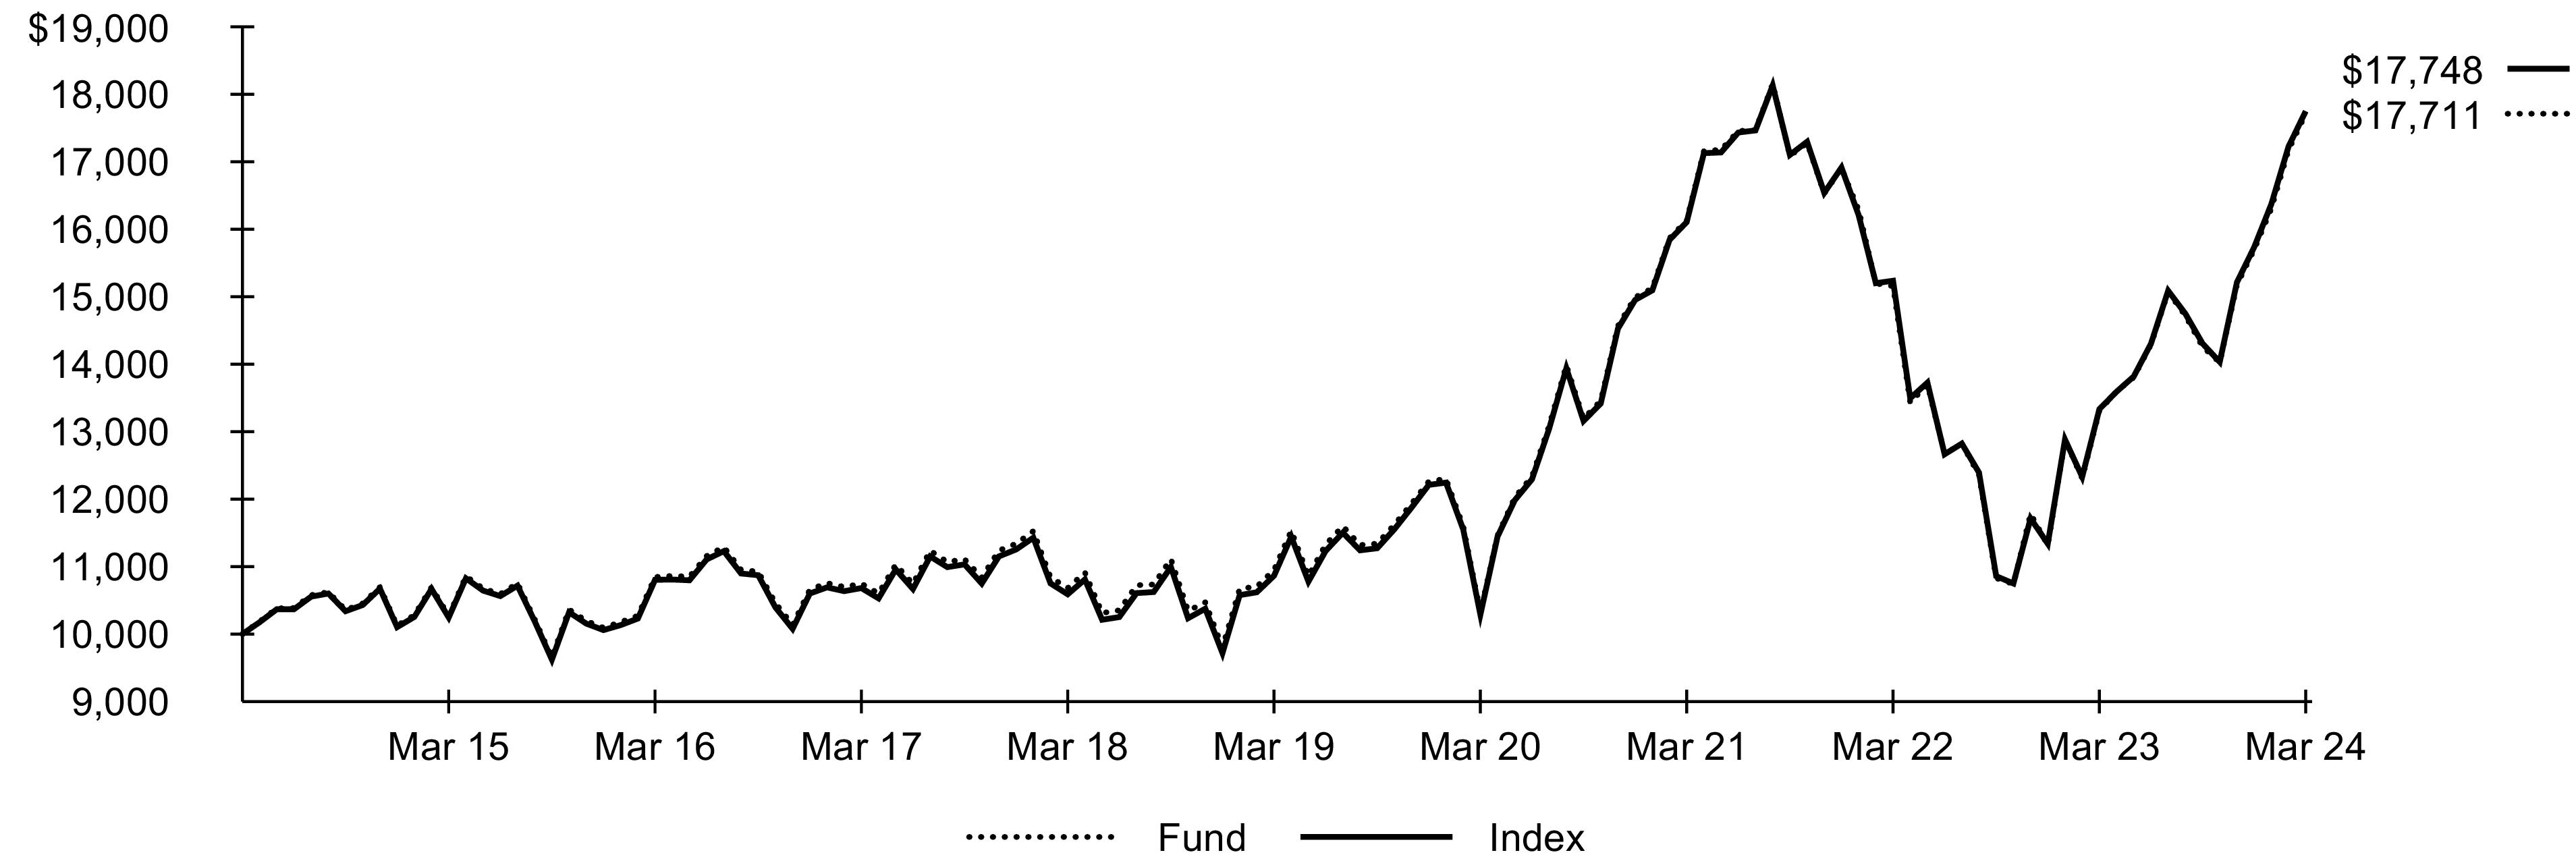
Index performance through June 23, 2019 reflects the performance of the S&P Global 1200 Communication Services Sector IndexTM. Index performance beginning on June 24, 2019 reflects the performance of S&P Global 1200 Communication Services 4.5/22.5/45 Capped IndexTM.
Past performance is not an indication of future results. Performance results do not reflect the deduction of taxes that a shareholder would pay on fund distributions or on the redemption or sale of fund shares. See “About Fund Performance” for more information.
Expense Example
| | |
Beginning
Account Value
(10/01/23) | Ending
Account Value
(03/31/24) | | Beginning
Account Value
(10/01/23) | Ending
Account Value
(03/31/24) | | |
| | | | | | |
| Expenses are equal to the annualized expense ratio, multiplied by the average account value over the period, multiplied by 183/366 (to reflect the one-half year period shown). Other fees, such as brokerage commissions and other fees to financial intermediaries, may be paid which are not reflected in the tables and examples above. See “Disclosure of Expenses” for more information. |
Fund Summary as of March 31, 2024 (continued)
iShares® Global Comm Services ETF
Portfolio Management Commentary
Global communication services stocks posted a strong advance for the reporting period amid continued global economic growth. Stocks in the U.S., which represented approximately 71% of the Index on average, gained the most, led by the interactive media and services industry. The environment for online advertising improved significantly during the reporting period, as digital advertising increased its total share of global advertising spending. Aggressive advertising campaigns from Chinese-based businesses supported the digital advertising market, while the upcoming U.S. presidential campaign and summer Olympic games led analysts to forecast continued strength.
Growth in the online advertising market drove large increases in both revenue and income and led a prominent company in the industry to initiate a dividend payment while continuing stock buybacks. Cost cutting efforts and reduced headcount also boosted profitability, as the industry refocused on core social media products. Implementation of AI tools that allow clients to partially automate and optimize advertising campaigns benefited the industry and fueled analysts’ optimism about continued growth. Strong sales of cloud computing products supported earnings, and a proposed deal between a large company in the industry and a smartphone manufacturer to license an AI product generated investor enthusiasm. The entertainment industry also posted a strong advance, as paid subscriptions to streaming services rose and a subscription-sharing product generated revenue amid measures to discourage account password sharing.
Stocks in Japan also contributed to the Index’s performance, particularly the wireless telecommunications services industry. An investment company in the industry gained amid rising equity prices and investments in AI companies.
On the downside, Chinese stocks detracted from the Index’s performance. The interactive media and services industry led the decline, pressured by new restrictions on online game spending proposed by the Chinese government. While the government later dropped the proposal, investors remained concerned about government interference in the industry. Consumer fatigue also dented revenue, as many gamers had previously increased their game purchases when COVID-19 restrictions were lifted and have since reduced their spending.
Portfolio Information
INDUSTRY ALLOCATION
| |
Interactive Media & Services | |
Diversified Telecommunication Services | |
| |
| |
Wireless Telecommunication Services | |
GEOGRAPHIC ALLOCATION
Country/Geographic Region | |
| |
| |
| |
| |
| |
| |
| |
| |
| |
Other (each representing less than 1%) | |
| Excludes money market funds. |
62024 iShares Annual Report to Shareholders
Fund Summary as of March 31, 2024
iShares® Global Consumer Discretionary ETF
Investment Objective
The iShares Global Consumer Discretionary ETF (the “Fund”) seeks to track the investment results of an index composed of global equities in the consumer discretionary sector, as represented by the S&P Global 1200 Consumer Discretionary (Sector) Capped IndexTM (the “Index”). The Fund invests in a representative sample of securities included in the Index that collectively has an investment profile similar to the Index. Due to the use of representative sampling, the Fund may or may not hold all of the securities that are included in the Index.
Performance
| Average Annual Total Returns | | |
| | | | | | | |
| | | | | | | |
| | | | | | | |
| | | | | | | |
GROWTH OF $10,000 INVESTMENT(AT NET ASSET VALUE)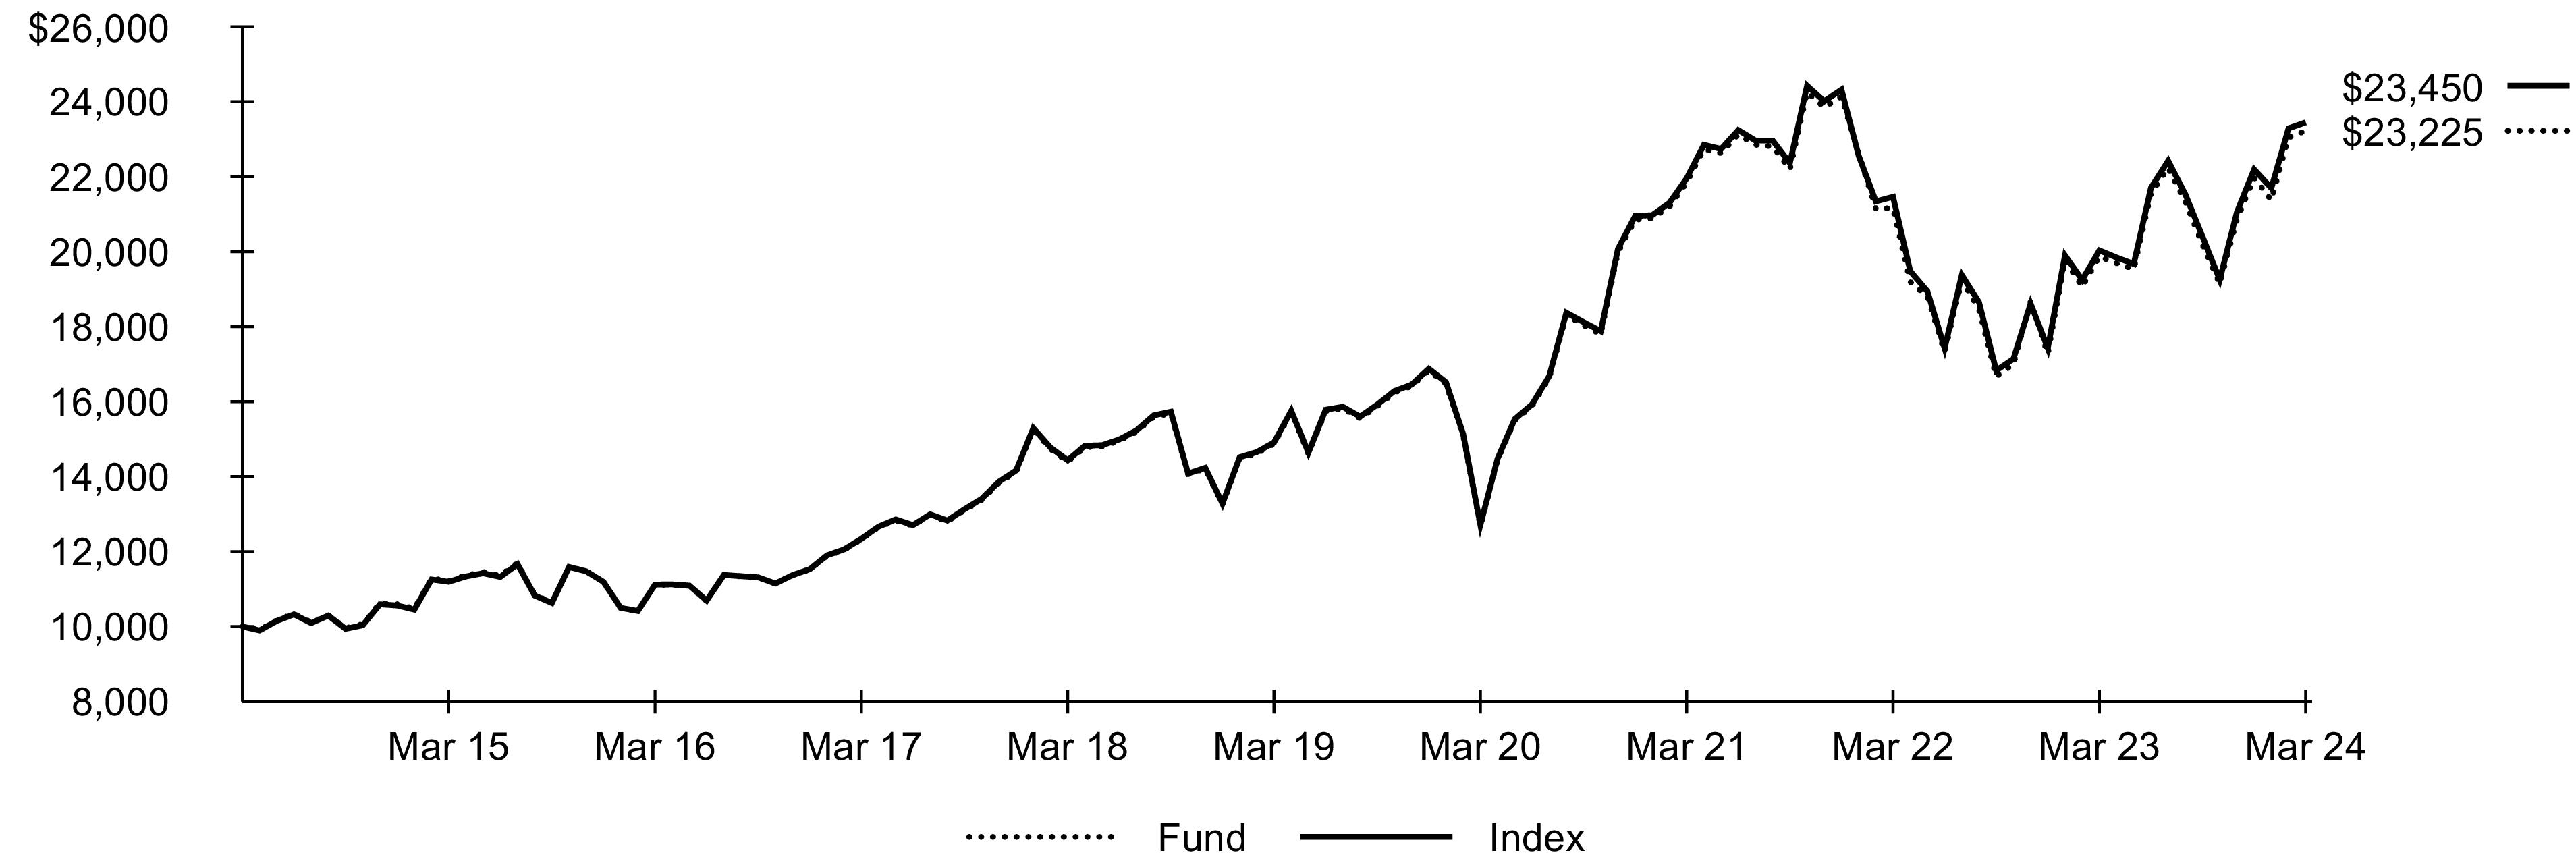
Index performance through September 22, 2019 reflects the performance of the S&P Global 1200 Consumer Discretionary Sector IndexTM. Index performance beginning on September 23, 2019 reflects the performance of the S&P Global 1200 Consumer Discretionary (Sector) Capped IndexTM.
| The NAV total return presented in the table for the one-year period differs from the same period return disclosed in the financial highlights. The total return in the financial highlights is calculated in the same manner but differs due to certain adjustments made for financial reporting purposes in accordance with U.S. generally accepted accounting principles. |
Past performance is not an indication of future results. Performance results do not reflect the deduction of taxes that a shareholder would pay on fund distributions or on the redemption or sale of fund shares. See “About Fund Performance” for more information.
Expense Example
| | |
Beginning
Account Value
(10/01/23) | Ending
Account Value
(03/31/24) | | Beginning
Account Value
(10/01/23) | Ending
Account Value
(03/31/24) | | |
| | | | | | |
| Expenses are equal to the annualized expense ratio, multiplied by the average account value over the period, multiplied by 183/366 (to reflect the one-half year period shown). Other fees, such as brokerage commissions and other fees to financial intermediaries, may be paid which are not reflected in the tables and examples above. See “Disclosure of Expenses” for more information. |
Fund Summary as of March 31, 2024 (continued)
iShares® Global Consumer Discretionary ETF
Portfolio Management Commentary
Global consumer discretionary stocks rose during the reporting period, led by a strong performance in the U.S., with notable strength in both Japan and Italy. U.S. equities contributed the most to the Index’s performance, with nearly half of the contributed return coming from the broadline retail industry. Within this industry, larger online retail companies benefited from an acceleration of demand for e-commerce and cloud-computing services. These services are increasingly used by a growing number of businesses, notably for artificial intelligence, as consumer demand for online services grows. Additionally, some companies in the broadline retail industry benefited from cost-saving efforts, including job cuts and reducing capital expenditures. The specialty retail industry was also a notable contributor to the Index’s return, particularly home improvement retail companies. Spending on home improvement surged during the coronavirus pandemic and remained stronger than expected over the reporting period.
Equities in Japan and Italy also contributed to the Index’s performance, led by the auto and components industry. Automobile sales were stronger than expected in 2023, as an improving global supply chain increased the availability of automobiles. In Japan, a weaker yen helped increase profits, while increased sales of electric vehicles benefited some of the country’s largest manufacturers. In Europe, 2023 automobile sales were significantly improved over the prior year and were particularly strong in Italy, one the region’s leaders in auto sales.
Conversely, Chinese equities detracted the most from the Index’s performance. Despite its strength in the U.S. market, the broadline retail industry declined sharply in China. While China’s broader economy — over half of which is driven by personal consumption — largely underperformed expectations, some of the largest retail companies also faced external pressures. Large e-commerce providers faced headwinds from restrictions on U.S. microchip exports and increased pressure from competitors offering more compelling social media or retail applications.
Portfolio Information
INDUSTRY ALLOCATION
| |
Consumer Discretionary Distribution & Retail | |
| |
| |
Consumer Durables & Apparel | |
GEOGRAPHIC ALLOCATION
Country/Geographic Region | |
| |
| |
| |
| |
| |
| |
| |
| |
| |
| |
| |
Other (each representing less than 1%) | |
| Excludes money market funds. |
82024 iShares Annual Report to Shareholders
Fund Summary as of March 31, 2024
iShares® Global Consumer Staples ETF
Investment Objective
The iShares Global Consumer Staples ETF (the “Fund”) seeks to track the investment results of an index composed of global equities in the consumer staples sector, as represented by the S&P Global 1200 Consumer Staples (Sector) Capped IndexTM (the “Index”). The Fund invests in a representative sample of securities included in the Index that collectively has an investment profile similar to the Index. Due to the use of representative sampling, the Fund may or may not hold all of the securities that are included in the Index.
Performance
| Average Annual Total Returns | | |
| | | | | | | |
| | | | | | | |
| | | | | | | |
| | | | | | | |
GROWTH OF $10,000 INVESTMENT(AT NET ASSET VALUE)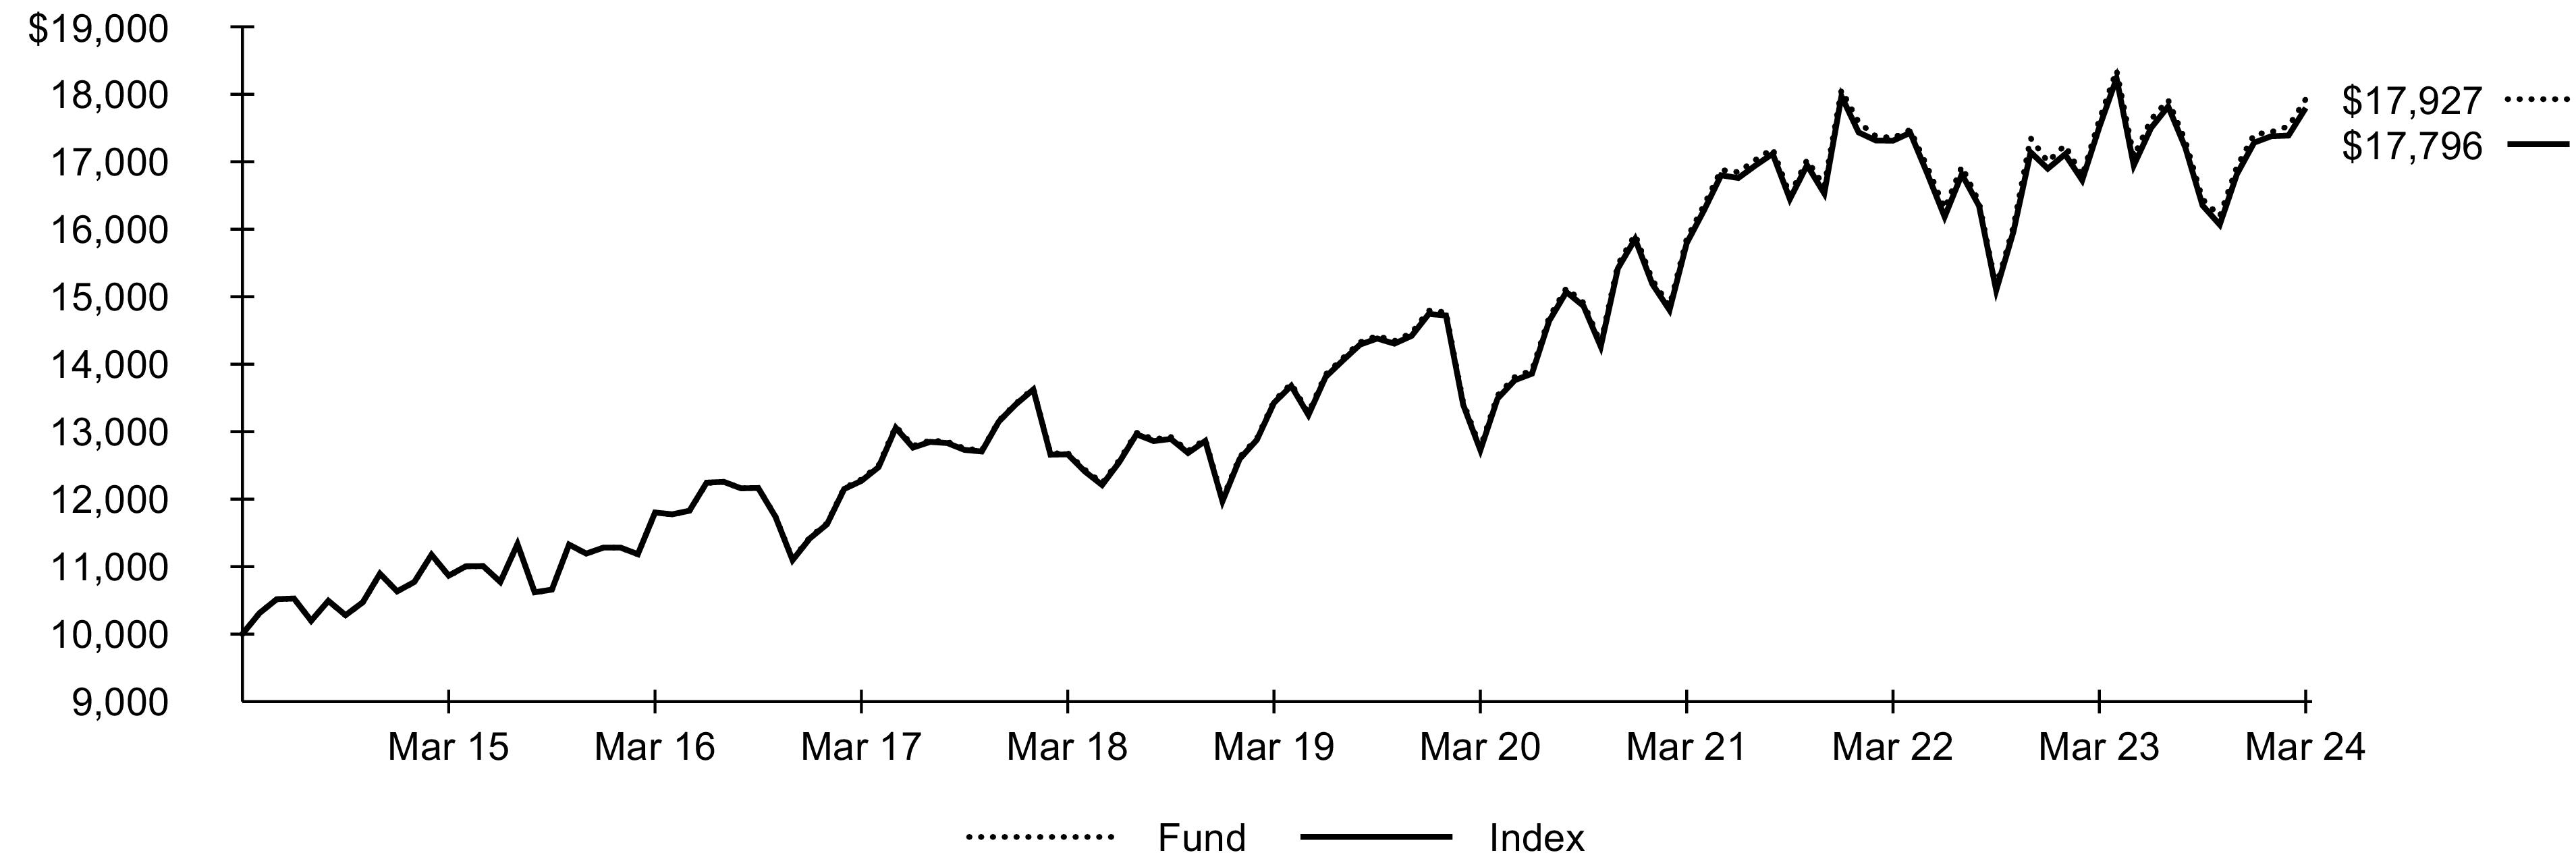
Index performance through June 23, 2019 reflects the performance of the S&P Global 1200 Consumer Staples Sector IndexTM. Index performance beginning on June 24, 2019 reflects the performance of the S&P Global 1200 Consumer Staples (Sector) Capped IndexTM.
Past performance is not an indication of future results. Performance results do not reflect the deduction of taxes that a shareholder would pay on fund distributions or on the redemption or sale of fund shares. See “About Fund Performance” for more information.
Expense Example
| | |
Beginning
Account Value
(10/01/23) | Ending
Account Value
(03/31/24) | | Beginning
Account Value
(10/01/23) | Ending
Account Value
(03/31/24) | | |
| | | | | | |
| Expenses are equal to the annualized expense ratio, multiplied by the average account value over the period, multiplied by 183/366 (to reflect the one-half year period shown). Other fees, such as brokerage commissions and other fees to financial intermediaries, may be paid which are not reflected in the tables and examples above. See “Disclosure of Expenses” for more information. |
Fund Summary as of March 31, 2024 (continued)
iShares® Global Consumer Staples ETF
Portfolio Management Commentary
Global consumer staples stocks rose modestly over the reporting period. While corporate earnings were generally supportive, optimism for lower interest rates and an eventual rebound in economic growth diminished demand in less economically sensitive sectors, including consumer staples. U.S. stocks contributed the most to the Index’s return, led by the consumer staples distribution and retail industry. For much of 2023, U.S. food price inflation was significantly higher than the general inflation rate. As food is a staple product by necessity, higher food prices increasingly drove consumers to larger, big-box retail stores, which generally offer lower prices. This was particularly evident in the substantial growth in store memberships, indicating consumers were more willing to make an investment to reduce costs over the longer term. Large companies that require an upfront membership fee also benefited from the ability to better control merchandise theft-based losses than other large retailers, further supporting the industry.
Outside of the U.S., stocks in Mexico and Canada were notable contributors to the Index’s return. In Mexico, the beverages industry contributed, supported by strong consumer demand, ambitious store expansion from industry-leading companies, and consumer enthusiasm for loyalty programs. In Canada, as in the U.S., the distribution and retail industry advanced, as loyalty and reward programs proved helpful in attracting customers seeking lower prices for staple goods.
Conversely, stocks in Switzerland detracted from the Index’s return. The packaged food and meats industry was the largest detractor, largely due to higher inflation reducing demand for food and beverage products. While inflation allowed some providers to make up for lower sales volumes by raising prices, inflation’s more recent decline weighed on that advantage. Additionally, the emergence of a new generation of weight-loss drugs, which suppress users’ appetites, raised concerns that many providers of packaged foods, particularly confectionary products, could see reduced demand for less-healthy products.
Portfolio Information
INDUSTRY ALLOCATION
| |
| |
Consumer Staples Merchandise Retail | |
| |
Soft Drinks & Non-alcoholic Beverages | |
| |
| |
| |
| |
| |
Agricultural Products & Services | |
| |
Other (each representing less than 1%) | |
GEOGRAPHIC ALLOCATION
Country/Geographic Region | |
| |
| |
| |
| |
| |
| |
| |
| |
| |
| |
Other (each representing less than 1%) | |
| Excludes money market funds. |
102024 iShares Annual Report to Shareholders
Fund Summary as of March 31, 2024
iShares® Global Energy ETF
Investment Objective
The iShares Global Energy ETF (the “Fund”) seeks to track the investment results of an index composed of global equities in the energy sector, as represented by the S&P Global 1200 Energy 4.5/22.5/45 Capped Index (the “Index”). The Fund invests in a representative sample of securities included in the Index that collectively has an investment profile similar to the Index. Due to the use of representative sampling, the Fund may or may not hold all of the securities that are included in the Index.
.
Performance
| Average Annual Total Returns | | |
| | | | | | | |
| | | | | | | |
| | | | | | | |
| | | | | | | |
S&P Global 1200 Energy Sector Index™ | | | | | | | |
S&P Global 1200 Energy 4.5/22.5/45 Capped Index(b) | | | | | | | |
GROWTH OF $10,000 INVESTMENT(AT NET ASSET VALUE)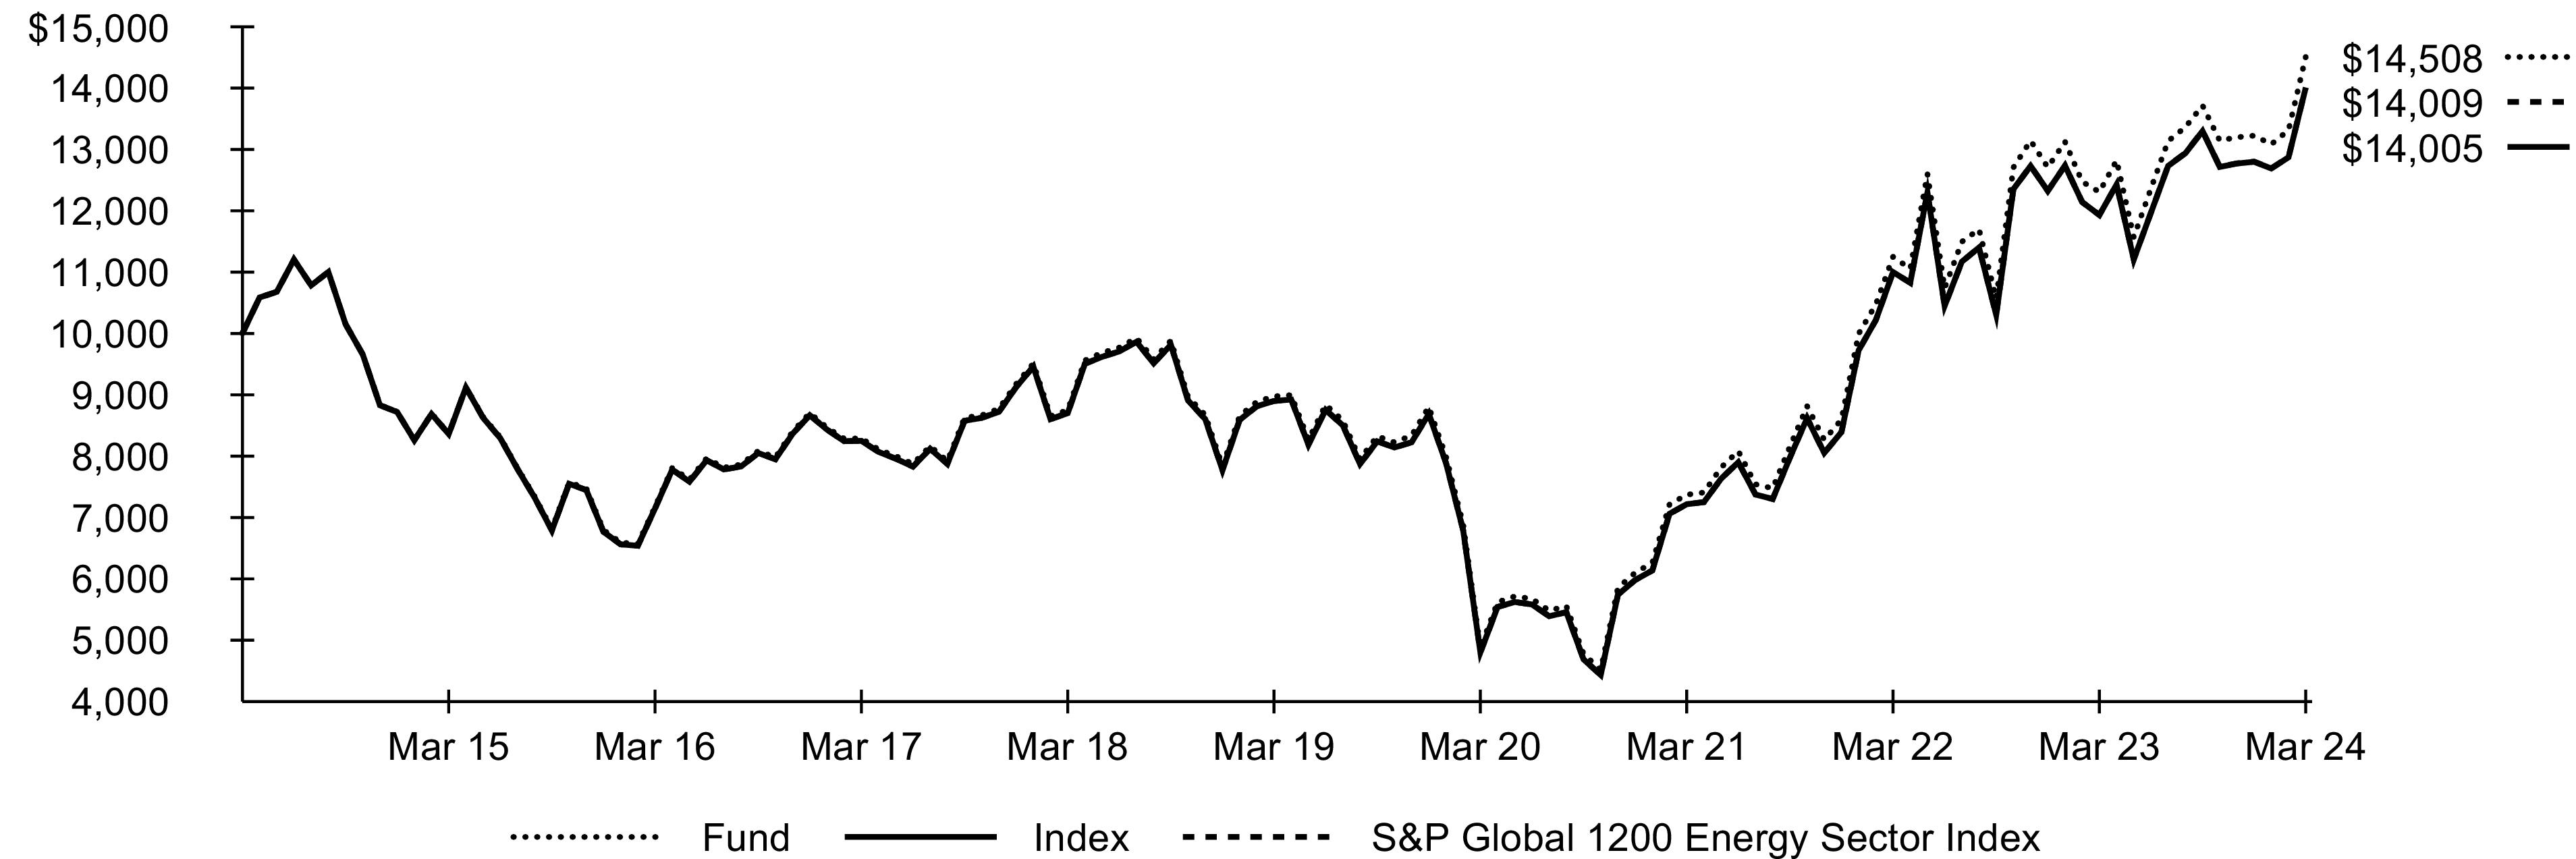
| Index performance through April 19, 2023 reflects the S&P Global 1200 Energy Sector Index™ performance of the Index. Index performance beginning on April 20, 2023 reflects the performance of the S&P Global 1200 Energy 4.5/22.5/45 Capped Index., which effective as of April 20, 2023, replaced the S&P Global 1200 Energy Sector Index™ as the underlying index of the fund. |
| The inception date of the S&P Global 1200 Energy 4.5/22.5/45 Capped Index was April 20, 2023. The cumulative total return for this index for the period April 20, 2023 through March 31, 2024 was 9.44%. |
Past performance is not an indication of future results. Performance results do not reflect the deduction of taxes that a shareholder would pay on fund distributions or on the redemption or sale of fund shares. See “About Fund Performance” for more information.
Expense Example
| | |
Beginning
Account Value
(10/01/23) | Ending
Account Value
(03/31/24) | | Beginning
Account Value
(10/01/23) | Ending
Account Value
(03/31/24) | | |
| | | | | | |
| Expenses are equal to the annualized expense ratio, multiplied by the average account value over the period, multiplied by 183/366 (to reflect the one-half year period shown). Other fees, such as brokerage commissions and other fees to financial intermediaries, may be paid which are not reflected in the tables and examples above. See “Disclosure of Expenses” for more information. |
Fund Summary as of March 31, 2024 (continued)
iShares® Global Energy ETF
Portfolio Management Commentary
Global energy stocks rose significantly during the reporting period, driven by strong performance in the U.S. and Canada. Oil prices rose amid production cuts by OPEC+, rising tensions in the Middle East, and expectations for increased energy demand amid signals that major developed economies would avoid recession.
U.S. equities contributed the most to the Index’s return, led by the oil and gas exploration and production industry. Rising oil prices encouraged more investment in generating new production through increased exploration, as increased production led to increased profits. Rapid, long-term urbanization and manufacturing growth in India and China, as well as the modest pace of renewable adoption in the developed world, suggested that capacity increases for both (nonrenewable) fossil fuels and renewable substitutes could be necessary to satisfy the global appetite for energy. Additionally, merger and acquisition (“M&A”) activity was relatively high within the industry over the reporting period. Some large companies’ stock price rose in anticipation of being acquired by even larger companies, which in turn were expected to benefit from increased economies of scale. One large shale producer acquired a large but privately held oil and gas company, vaulting the buyers into the top tier of publicly traded oil and gas producers.
The U.S. oil and gas refining and marketing and transportation industry also contributed to the Index’s return. Oil refining companies benefited from strong demand for already limited supplies of both gasoline and jet fuel. Intervention by an activist investor encouraged demand for a large oil refiner’s stock and buoyed optimism that the existing management team would deliver on its plan to reduce costs and boost profitability.
Equities in Canada also contributed, led by the oil and gas exploration and production industry. Much as in the U.S., Canadian oil and gas producers benefited from rising demand supporting increased production. One large provider set a production record amid increased demand from the U.S., boosting profits, reducing debt, and increasing its dividend payments.
Portfolio Information
INDUSTRY ALLOCATION
| |
| |
Oil & Gas Exploration & Production | |
Oil & Gas Storage & Transportation | |
Oil & Gas Refining & Marketing | |
Oil & Gas Equipment & Services | |
Other (each representing less than 1%) | |
GEOGRAPHIC ALLOCATION
Country/Geographic Region | |
| |
| |
| |
| |
| |
| |
| |
| |
| |
Other (each representing less than 1%) | |
| Excludes money market funds. |
122024 iShares Annual Report to Shareholders
Fund Summary as of March 31, 2024
iShares® Global Financials ETF
Investment Objective
The iShares Global Financials ETF (the “Fund”) seeks to track the investment results of an index composed of global equities in the financials sector, as represented by the S&P Global 1200 Financials Sector IndexTM (the “Index”). The Fund invests in a representative sample of securities included in the Index that collectively has an investment profile similar to the Index. Due to the use of representative sampling, the Fund may or may not hold all of the securities that are included in the Index.
Performance
| Average Annual Total Returns | | |
| | | | | | | |
| | | | | | | |
| | | | | | | |
| | | | | | | |
GROWTH OF $10,000 INVESTMENT(AT NET ASSET VALUE)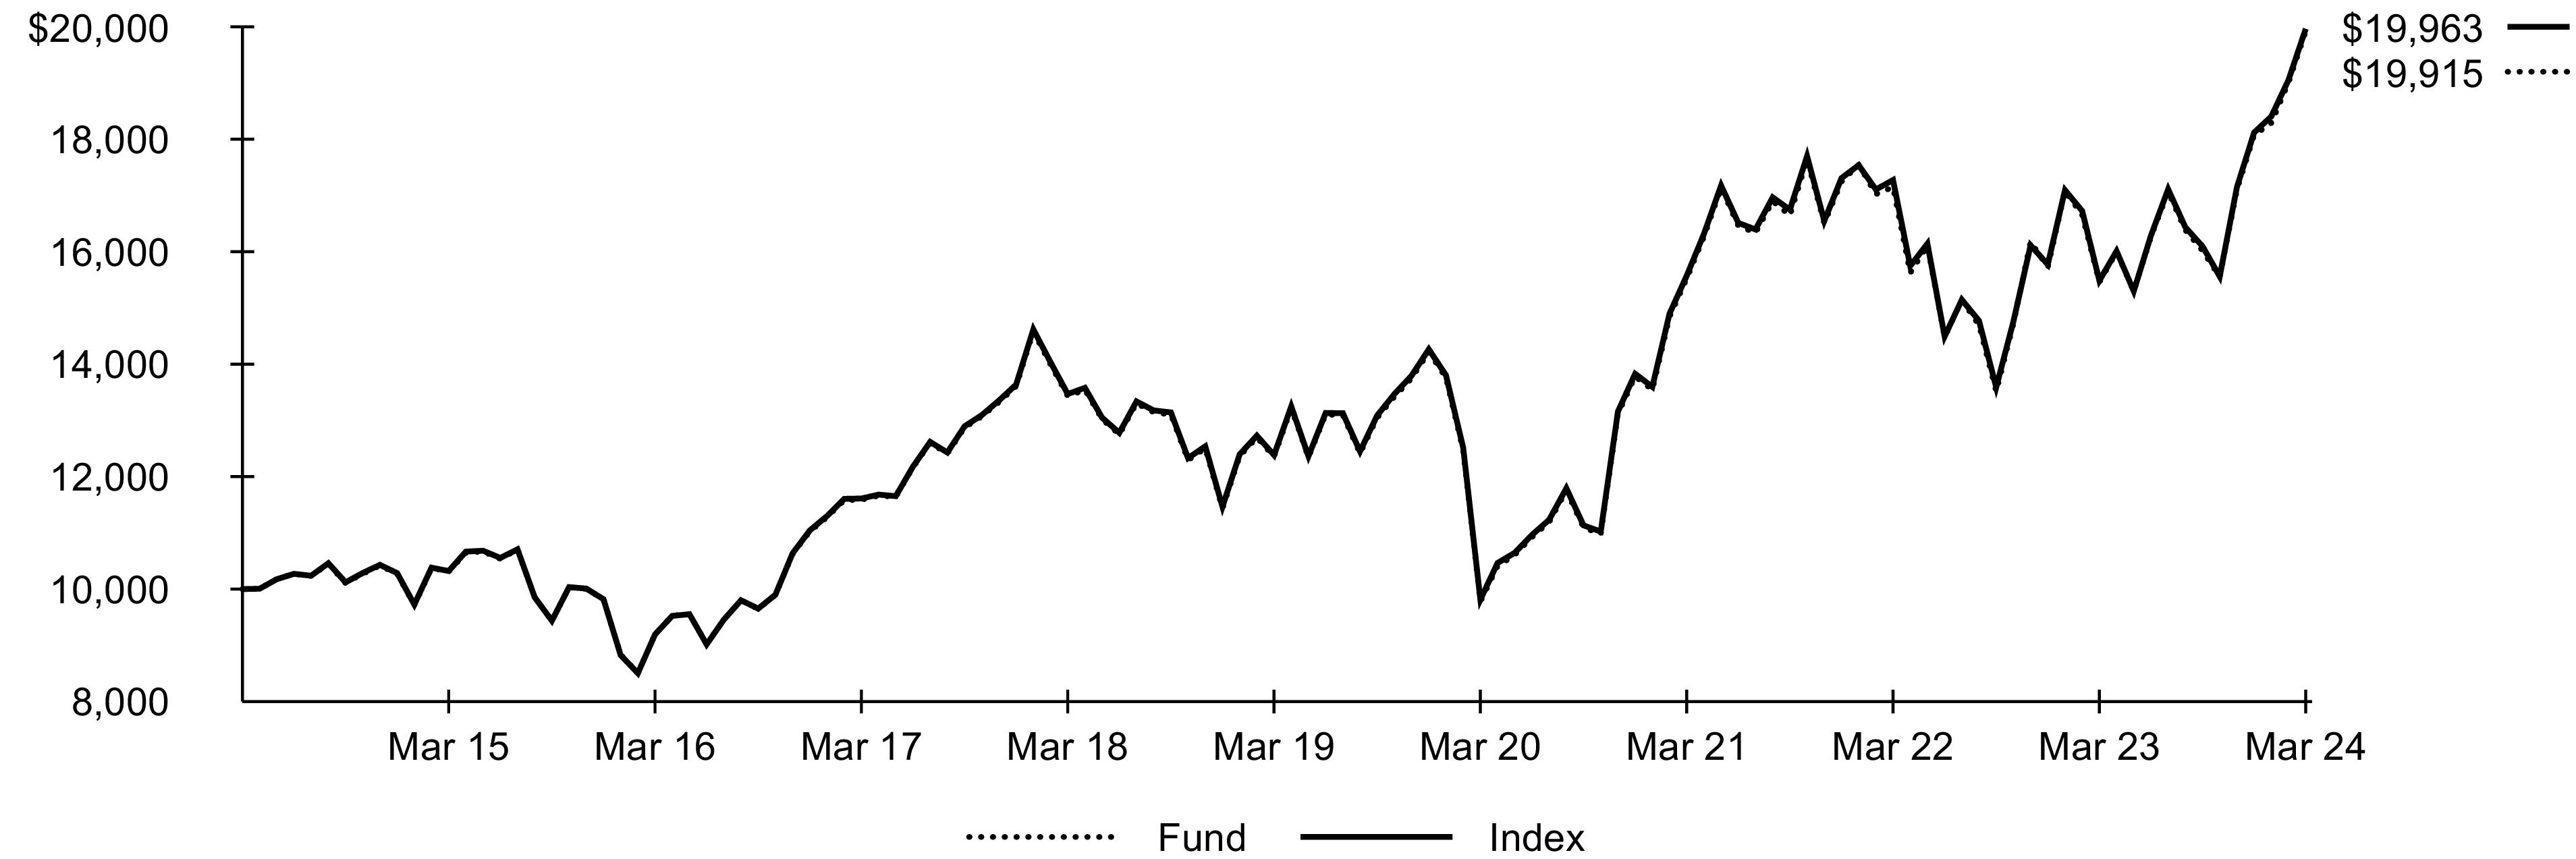
Past performance is not an indication of future results. Performance results do not reflect the deduction of taxes that a shareholder would pay on fund distributions or on the redemption or sale of fund shares. See “About Fund Performance” for more information.
Expense Example
| | |
Beginning
Account Value
(10/01/23) | Ending
Account Value
(03/31/24) | | Beginning
Account Value
(10/01/23) | Ending
Account Value
(03/31/24) | | |
| | | | | | |
| Expenses are equal to the annualized expense ratio, multiplied by the average account value over the period, multiplied by 183/366 (to reflect the one-half year period shown). Other fees, such as brokerage commissions and other fees to financial intermediaries, may be paid which are not reflected in the tables and examples above. See “Disclosure of Expenses” for more information. |
Fund Summary as of March 31, 2024 (continued)
iShares® Global Financials ETF
Portfolio Management Commentary
Global financials stocks posted a strong advance for the reporting period amid solid global economic growth. The U.S., which represented approximately 56% of the Index on average, contributed the most to the Index’s performance. The financial services industry was the top source of strength, as a large multi-sector holding company with investments in a broad array of companies was buoyed by rising equity prices. The industry benefited from strength among insurance companies, where rising premiums and higher investment income bolstered profitability. Additionally, growth in consumer spending and cross-border transactions bolstered earnings at companies that manage consumer payments.
The capital markets industry further contributed to the Index’s return, driven in part by the performance of investment banks. Despite a cool market for mergers and acquisition activity in 2023, strong revenue from asset and wealth management supported earnings growth in the industry. Many investment banks grew their private wealth management business to increase profitability and diversify revenue streams while triggering lower capital requirements.
The banking industry also advanced as robust net interest income (the difference between the interest received from a bank’s assets and the interest paid on deposits) supported earnings. While higher interest rates typically bolster banking profitability, banks also experienced a reduction in the value of their existing bond investments and were forced to raise deposit rates to retain customers. Consequently, the Fed’s shift in monetary policy benefited banks and raised investor hopes for an increase in loan activity and dealmaking should borrowing costs continue to subside.
Japanese banks also gained, helped by shifting policy from the Bank of Japan (“BOJ”). The BOJ altered its yield curve control policy (which it used to keep bond prices within a designated range), allowing bond yields to rise. It also changed its longstanding negative interest rate policy by raising interest rates in March 2024. The higher interest rates benefited Japanese banks by increasing their yields on deposits. Canadian banks also advanced, as dividends rose despite an increase in loan loss provisions that weighed on earnings.
Portfolio Information
GEOGRAPHIC ALLOCATION
Country/Geographic Region | |
| |
| |
| |
| |
| |
| |
| |
| |
| |
| |
| |
| |
| |
| |
| |
| |
Other (each representing less than 1%) | |
| Excludes money market funds. |
142024 iShares Annual Report to Shareholders
Fund Summary as of March 31, 2024
iShares® Global Healthcare ETF
Investment Objective
The iShares Global Healthcare ETF (the “Fund”) seeks to track the investment results of an index composed of global equities in the healthcare sector, as represented by the S&P Global 1200 Health Care Sector IndexTM (the “Index”). The Fund invests in a representative sample of securities included in the Index that collectively has an investment profile similar to the Index. Due to the use of representative sampling, the Fund may or may not hold all of the securities that are included in the Index.
Performance
| Average Annual Total Returns | | |
| | | | | | | |
| | | | | | | |
| | | | | | | |
| | | | | | | |
GROWTH OF $10,000 INVESTMENT(AT NET ASSET VALUE)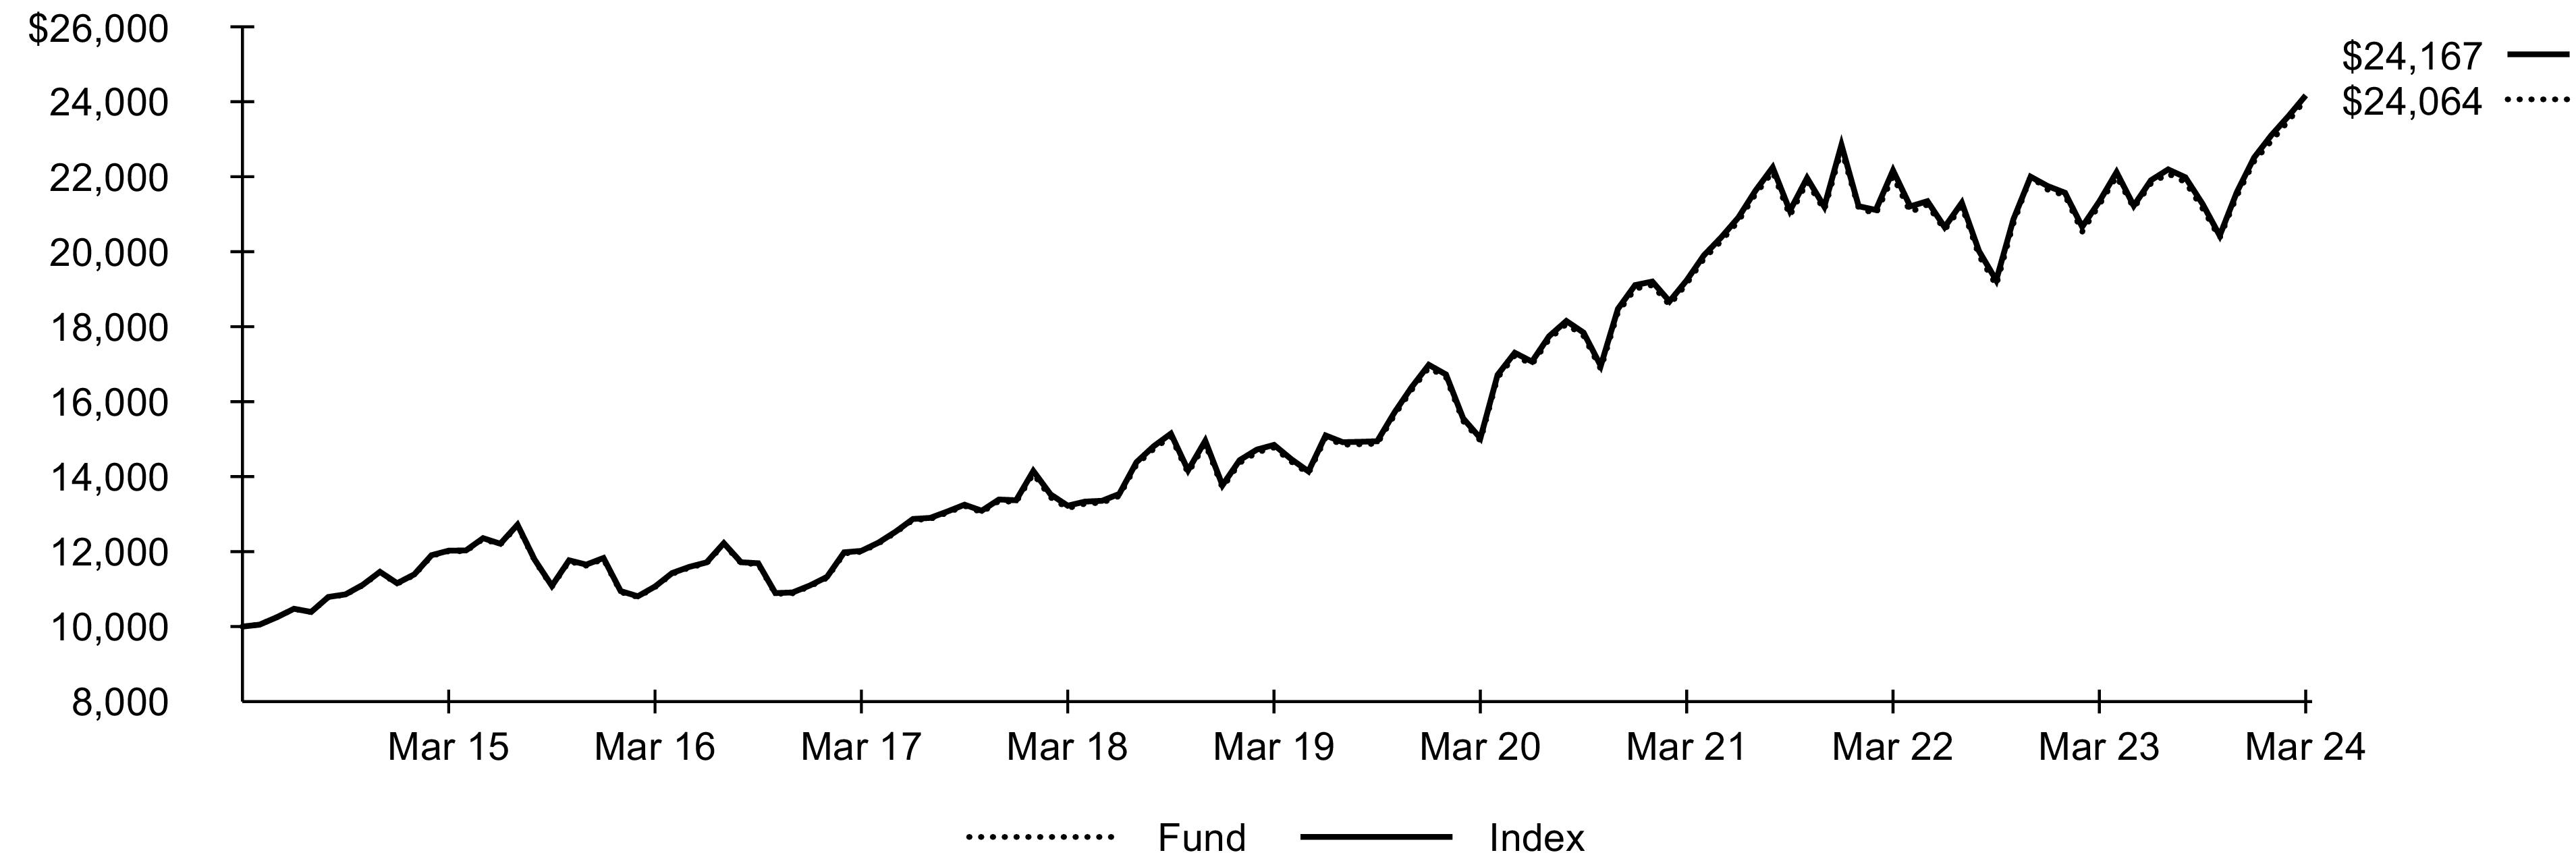
Past performance is not an indication of future results. Performance results do not reflect the deduction of taxes that a shareholder would pay on fund distributions or on the redemption or sale of fund shares. See “About Fund Performance” for more information.
Expense Example
| | |
Beginning
Account Value
(10/01/23) | Ending
Account Value
(03/31/24) | | Beginning
Account Value
(10/01/23) | Ending
Account Value
(03/31/24) | | |
| | | | | | |
| Expenses are equal to the annualized expense ratio, multiplied by the average account value over the period, multiplied by 183/366 (to reflect the one-half year period shown). Other fees, such as brokerage commissions and other fees to financial intermediaries, may be paid which are not reflected in the tables and examples above. See “Disclosure of Expenses” for more information. |
Fund Summary as of March 31, 2024 (continued)
iShares® Global Healthcare ETF
Portfolio Management Commentary
Global healthcare stocks advanced substantially during the reporting period, buoyed by the broader market advance. Optimism surrounding higher-than-expected economic growth dampened investor interest in sectors traditionally considered less economically sensitive, leading to a muted rally for healthcare stocks. On the upside, the rising popularity of weight-loss drugs — notably, those known as glucagon-like peptide-1 (“GLP-1”) agonists, which can control blood sugar and suppress appetite — drove gains for the healthcare sector.
U.S. healthcare stocks contributed the most to the Index’s performance, led by the pharmaceuticals industry. The rapidly expanding demand for weight-loss treatments, including GLP-1 medications originally developed for diabetes and later approved to combat obesity, propelled significant sales growth and improved outlooks for U.S. pharmaceuticals companies. Additionally, strong sales of established and newer drugs for various cancers and chronic conditions boosted profitability for U.S. pharmaceuticals manufacturers. An expansion into the medical technology market further supported gains for a major pharmaceutical firm, as demand for medical device usage rose along with the volume of surgical procedures, and a strong pace of product launches introduced new avenues for growth.
U.S. healthcare equipment and services companies also contributed to the Index’s return. The industry benefited from a rise in procedures, as patients sought surgeries delayed during the COVID-19 pandemic. A healthcare equipment company that makes robotic surgery tools earned higher revenue as an easing of restrictions in China led to more procedures. Among healthcare distributors, demand for weight-loss medications boosted profits for companies that deliver drugs to pharmacies. Healthcare services companies also posted gains, benefiting from growth in pharmacy and medical plan customers.
Danish and Swiss pharmaceuticals companies also buoyed the Index’s return. The soaring demand for weight-loss and diabetes medications drove record profits for a Danish pharmaceutical company. The release of a study highlighting potential cardiovascular benefits of the company’s GLP-1 drugs raised the possibility of an expanded market for the products, further supporting investor sentiment.
Portfolio Information
INDUSTRY ALLOCATION
| |
| |
Health Care Equipment & Supplies | |
Health Care Providers & Services | |
| |
Life Sciences Tools & Services | |
| |
GEOGRAPHIC ALLOCATION
Country/Geographic Region | |
| |
| |
| |
| |
| |
| |
| |
| |
Other (each representing less than 1%) | |
| Excludes money market funds. |
162024 iShares Annual Report to Shareholders
Fund Summary as of March 31, 2024
iShares® Global Industrials ETF
Investment Objective
The iShares Global Industrials ETF (the “Fund”) seeks to track the investment results of an index composed of global equities in the industrials sector, as represented by the S&P Global 1200 Industrials Sector IndexTM (the “Index”). The Fund invests in a representative sample of securities included in the Index that collectively has an investment profile similar to the Index. Due to the use of representative sampling, the Fund may or may not hold all of the securities that are included in the Index.
Performance
| Average Annual Total Returns | | |
| | | | | | | |
| | | | | | | |
| | | | | | | |
| | | | | | | |
GROWTH OF $10,000 INVESTMENT(AT NET ASSET VALUE)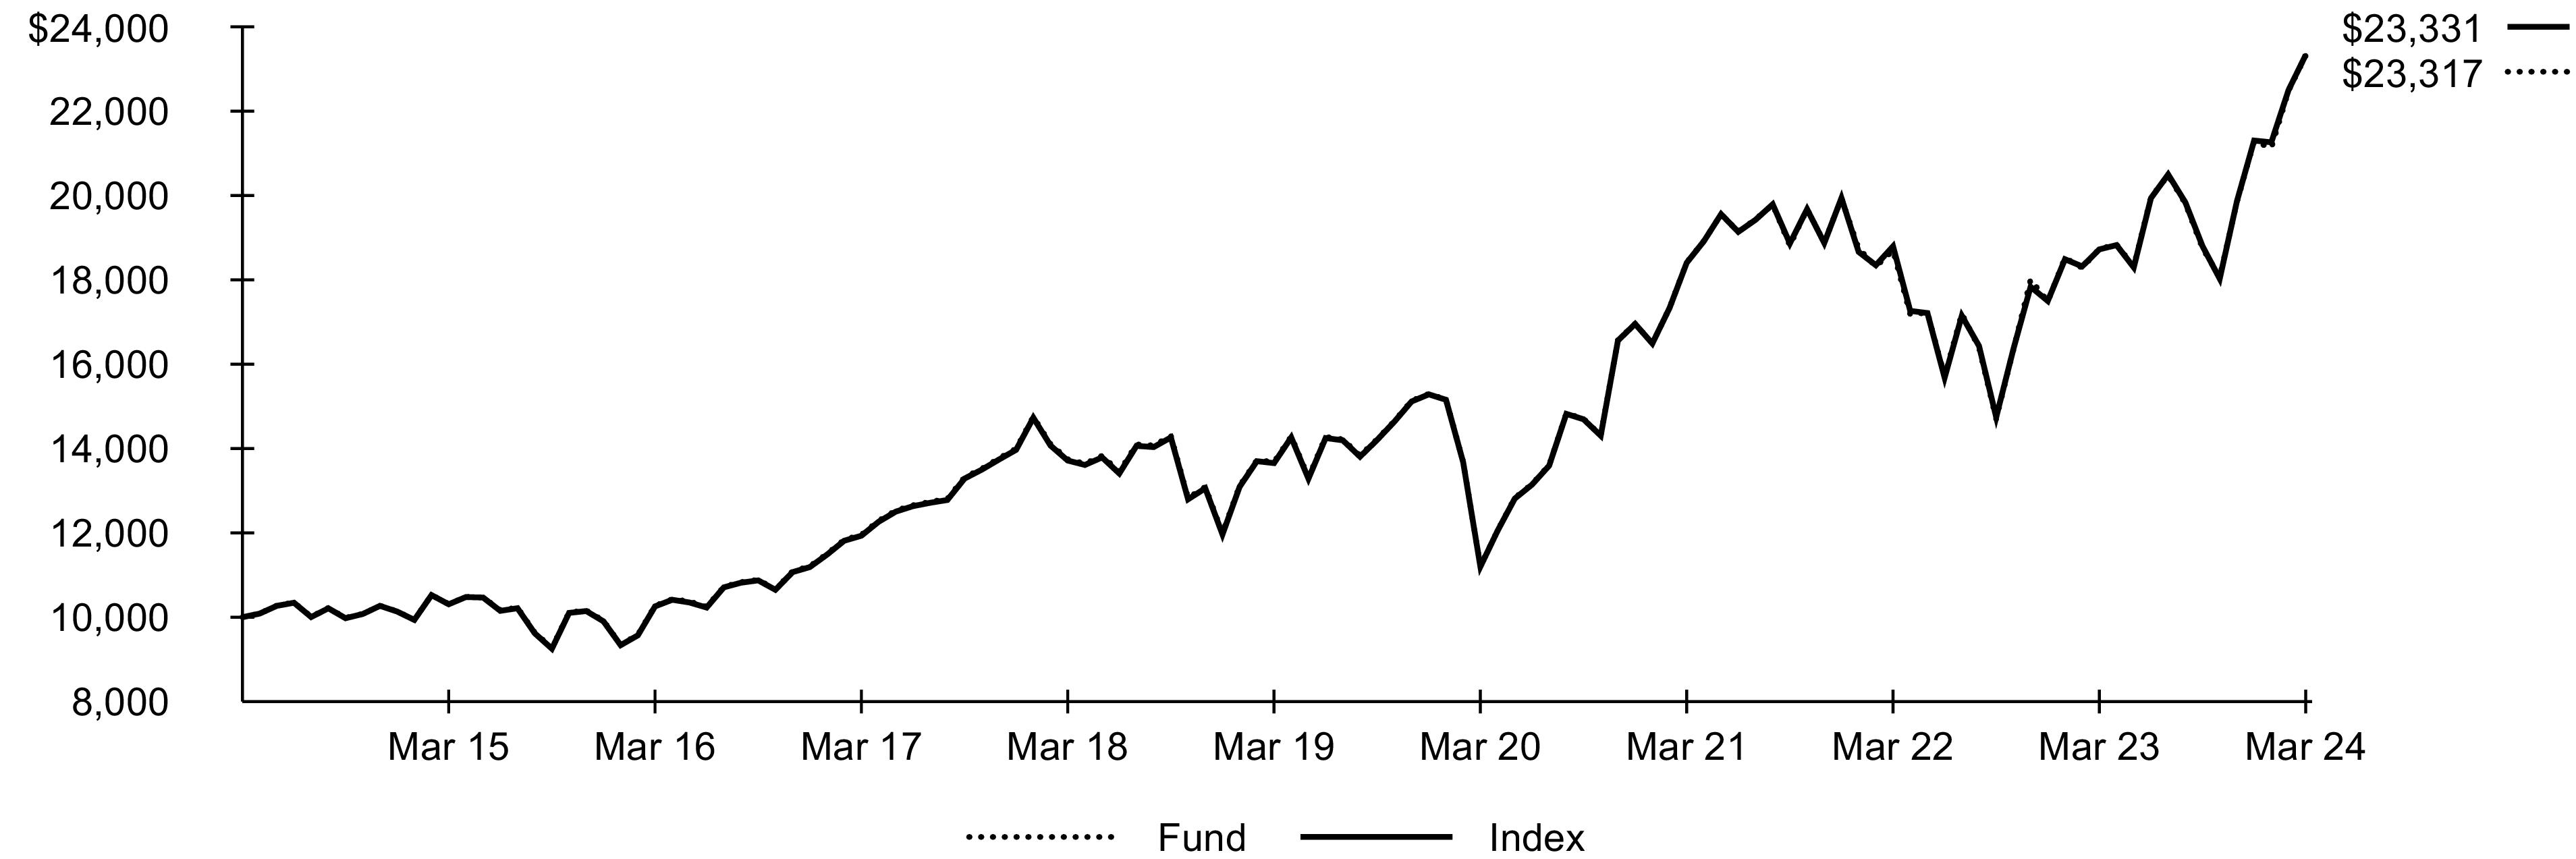
Past performance is not an indication of future results. Performance results do not reflect the deduction of taxes that a shareholder would pay on fund distributions or on the redemption or sale of fund shares. See “About Fund Performance” for more information.
Expense Example
| | |
Beginning
Account Value
(10/01/23) | Ending
Account Value
(03/31/24) | | Beginning
Account Value
(10/01/23) | Ending
Account Value
(03/31/24) | | |
| | | | | | |
| Expenses are equal to the annualized expense ratio, multiplied by the average account value over the period, multiplied by 183/366 (to reflect the one-half year period shown). Other fees, such as brokerage commissions and other fees to financial intermediaries, may be paid which are not reflected in the tables and examples above. See “Disclosure of Expenses” for more information. |
Fund Summary as of March 31, 2024 (continued)
iShares® Global Industrials ETF
Portfolio Management Commentary
Global industrials stocks rose significantly during the reporting period as most large economies exhibited ongoing growth despite rising interest rates. Supply chain constraints eased, which reduced inflation and helped boost sector-wide earnings growth. Manufacturing contracted in developed economies but rebounded as the period ended.
Stocks in the U.S. industrials sector, composing about 55% of the Index on average during the reporting period, contributed the most to the Index’s return. Wholesale price inflation on producer goods moderated by about a third during the period, easing cost pressures on industrial manufacturers, while factory orders grew.
Stocks in the construction machinery industry benefited from falling inventories at dealers, a sign of potentially rising demand. Higher prices helped boost profit margins, and increased spending on computer data centers raised demand for heavy machinery to build them. Spending from the $1 trillion 2021 Infrastructure Investment and Jobs Act further aided demand for construction equipment. Stocks within the industrial machinery, supplies, and components industry also contributed. Sales and profits increased for a wide array of firms in the industry, including manufacturers of precision engineering parts, air compressors, power tools, and elevators. Industrial conglomerates benefited from spinning off businesses and narrowing their focus, led by the decision of a leading aerospace parts producer to spin off its renewable energy and healthcare technologies divisions. Commercial aerospace revenue increased considerably amid strong demand for jet engines and reduced supply chain problems. Stocks in the electrical equipment and power management industry rose as AI increased demand for data centers relying on heavy power use, while electric vehicles further boosted electricity needs. In addition, order backlogs increased to record-high levels.
Japan’s industrials sector also contributed to the Index’s performance. Exports increased, helped by a weaker Japanese yen, even as Japan’s central bank raised interest rates for the first time in 17 years, benefiting stocks in trading companies and distributors. Many of those firms, which have broad product portfolios, also experienced increased foreign investment.
Portfolio Information
INDUSTRY ALLOCATION
| |
| |
| |
Commercial & Professional Services | |
GEOGRAPHIC ALLOCATION
Country/Geographic Region | |
| |
| |
| |
| |
| |
| |
| |
| |
| |
| |
Other (each representing less than 1%) | |
| Excludes money market funds. |
182024 iShares Annual Report to Shareholders
Fund Summary as of March 31, 2024
iShares® Global Materials ETF
Investment Objective
The iShares Global Materials ETF (the “Fund”) seeks to track the investment results of an index composed of global equities in the materials sector, as represented by the S&P Global 1200 Materials Sector IndexTM (the “Index”). The Fund invests in a representative sample of securities included in the Index that collectively has an investment profile similar to the Index. Due to the use of representative sampling, the Fund may or may not hold all of the securities that are included in the Index.
Performance
| Average Annual Total Returns | | |
| | | | | | | |
| | | | | | | |
| | | | | | | |
| | | | | | | |
GROWTH OF $10,000 INVESTMENT(AT NET ASSET VALUE)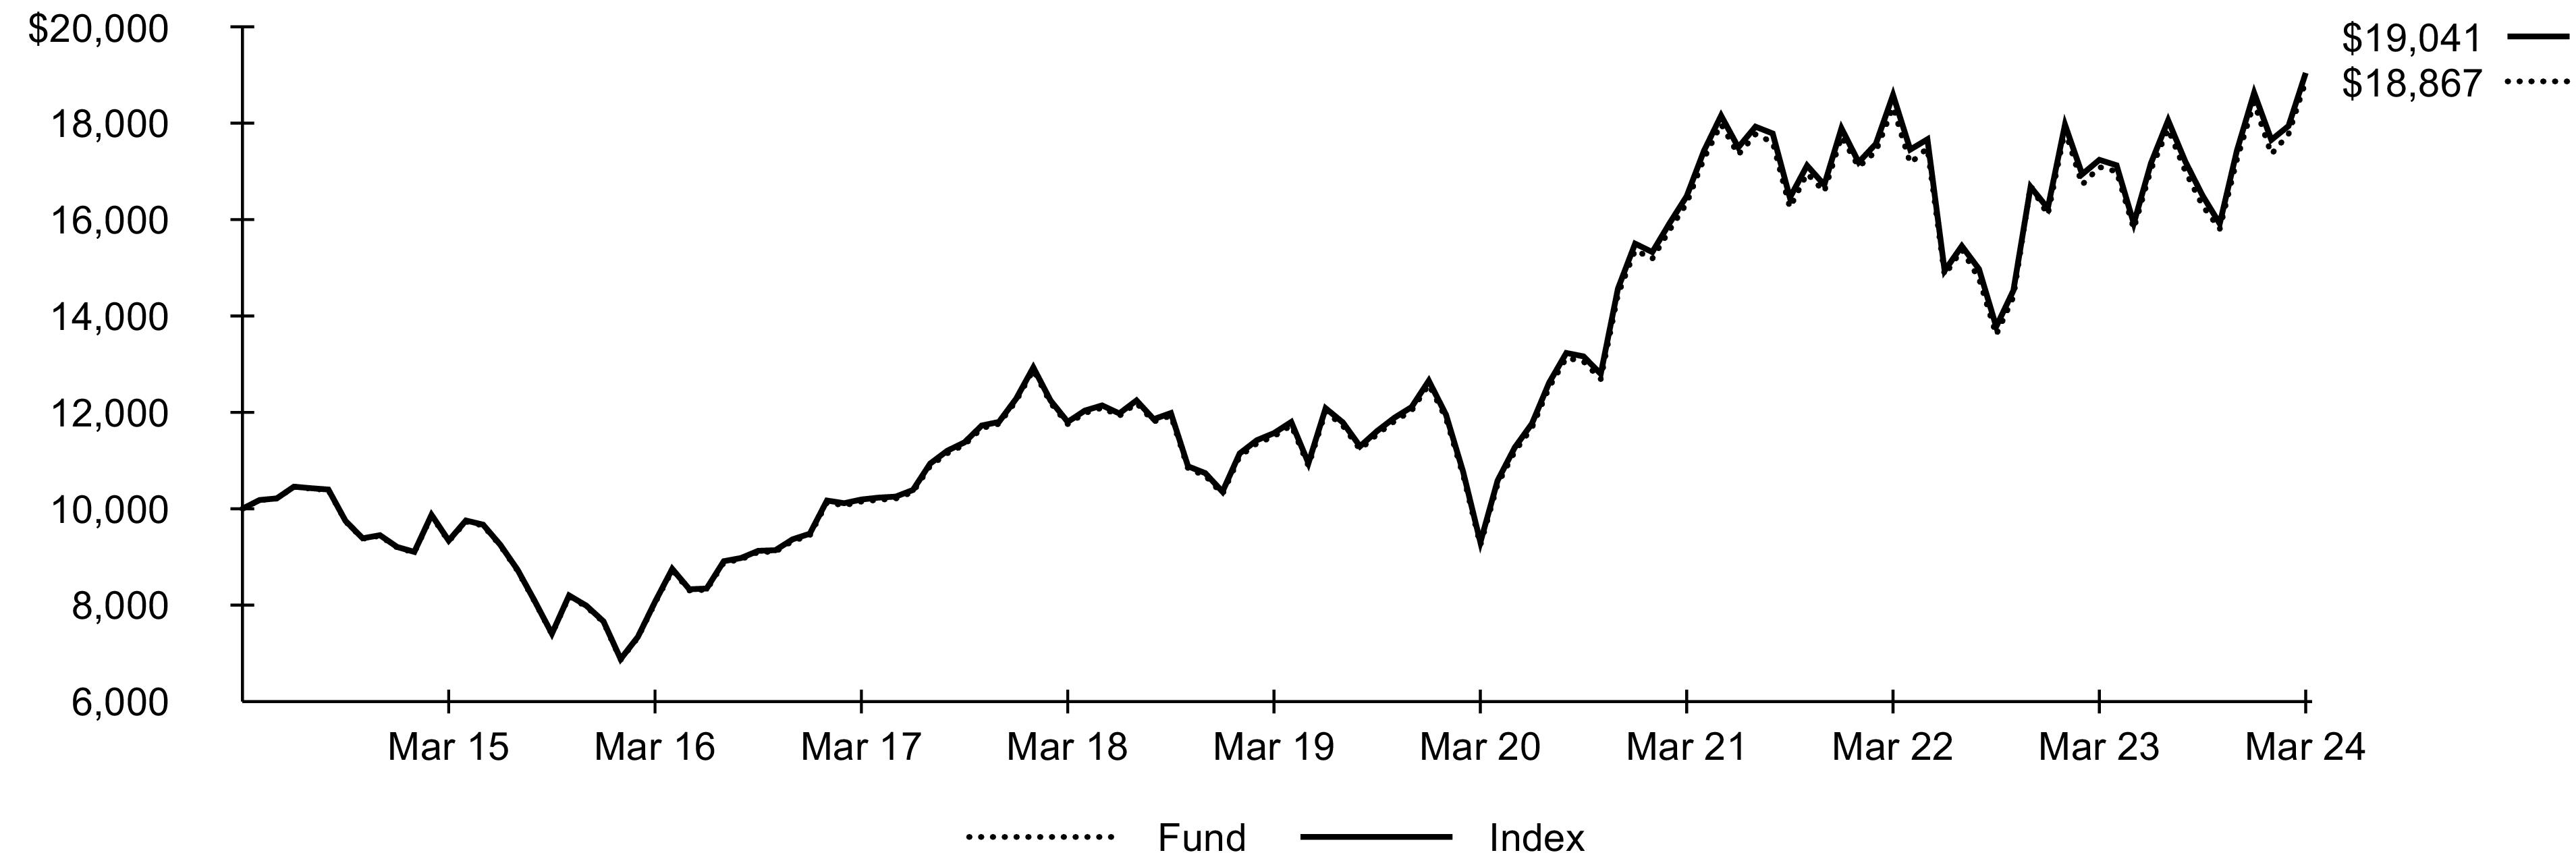
Past performance is not an indication of future results. Performance results do not reflect the deduction of taxes that a shareholder would pay on fund distributions or on the redemption or sale of fund shares. See “About Fund Performance” for more information.
Expense Example
| | |
Beginning
Account Value
(10/01/23) | Ending
Account Value
(03/31/24) | | Beginning
Account Value
(10/01/23) | Ending
Account Value
(03/31/24) | | |
| | | | | | |
| Expenses are equal to the annualized expense ratio, multiplied by the average account value over the period, multiplied by 183/366 (to reflect the one-half year period shown). Other fees, such as brokerage commissions and other fees to financial intermediaries, may be paid which are not reflected in the tables and examples above. See “Disclosure of Expenses” for more information. |
Fund Summary as of March 31, 2024 (continued)
iShares® Global Materials ETF
Portfolio Management Commentary
Global materials stocks advanced during the reporting period. Materials stocks, historically correlated with economic conditions, reflected global economies that advanced despite rising interest rates. Improvement in global supply chains eased bottlenecks in shipments of chemicals, aiding a modest production increase, and other materials. Meanwhile, the Israel/Hamas war and prospects for Fed interest cuts boosted the prices of precious metals such as gold. In addition, the ongoing global transition to green energy boosted demand for rare earth minerals and metals needed to facilitate it.
The U.S. materials sector contributed the most to the Index’s return. Within the chemicals industry, stocks in specialty chemicals companies increased. Paint and coatings suppliers enjoyed solid demand from retail and commercial buyers. Orders also increased from electrical, aerospace, healthcare, and construction businesses for environmental-friendly epoxy resins and adhesives. Demand for these products, combined with increased product prices, led to higher sales and profit margins. Rising product prices and projections for stable demand and declining costs also boosted profits for makers of industrial cleaning and sanitation products. In addition, the industrial gases industry advanced, as demand for gases such as oxygen, nitrogen, and hydrogen remained resilient. Providers increased profits by passing through higher production costs and employing long-term supply contracts with minimum customer purchase requirements. Demand for gas and related products, especially for hydrogen, led to order backlogs, as global clean energy investment rose to $1.8 trillion in 2023.
Stocks in the construction materials industry also contributed to the Index’s return. Manufacturers of building materials, including concrete and aggregates used in infrastructure projects, benefited from federal government programs designed to boost infrastructure spending. Their stocks also benefited from expectations for more stable mortgage rates and housing market conditions.
A leading supplier of building materials based in Ireland also contributed to the Index’s return. The surge in infrastructure spending in North America and Europe and price increases drove profits during the reporting period.
Portfolio Information
GEOGRAPHIC ALLOCATION
Country/Geographic Region | |
| |
| |
| |
| |
| |
| |
| |
| |
| |
| |
| |
| |
| |
Other (each representing less than 1%) | |
| Excludes money market funds. |
202024 iShares Annual Report to Shareholders
Fund Summary as of March 31, 2024
Investment Objective
The iShares Global Tech ETF (the “Fund”) seeks to track the investment results of an index composed of global equities in the technology sector, as represented by the S&P Global 1200 Information Technology 4.5/22.5/45 Capped Index (the “Index”). The Fund invests in a representative sample of securities included in the Index that collectively has an investment profile similar to the Index. Due to the use of representative sampling, the Fund may or may not hold all of the securities that are included in the Index.
Performance
| Average Annual Total Returns | | |
| | | | | | | |
| | | | | | | |
| | | | | | | |
| | | | | | | |
S&P Global 1200 Information Technology Sector Index™ | | | | | | | |
S&P Global 1200 Information Technology 4.5/22.5/45 Capped Index(c) | | | | | | | |
GROWTH OF $10,000 INVESTMENT(AT NET ASSET VALUE)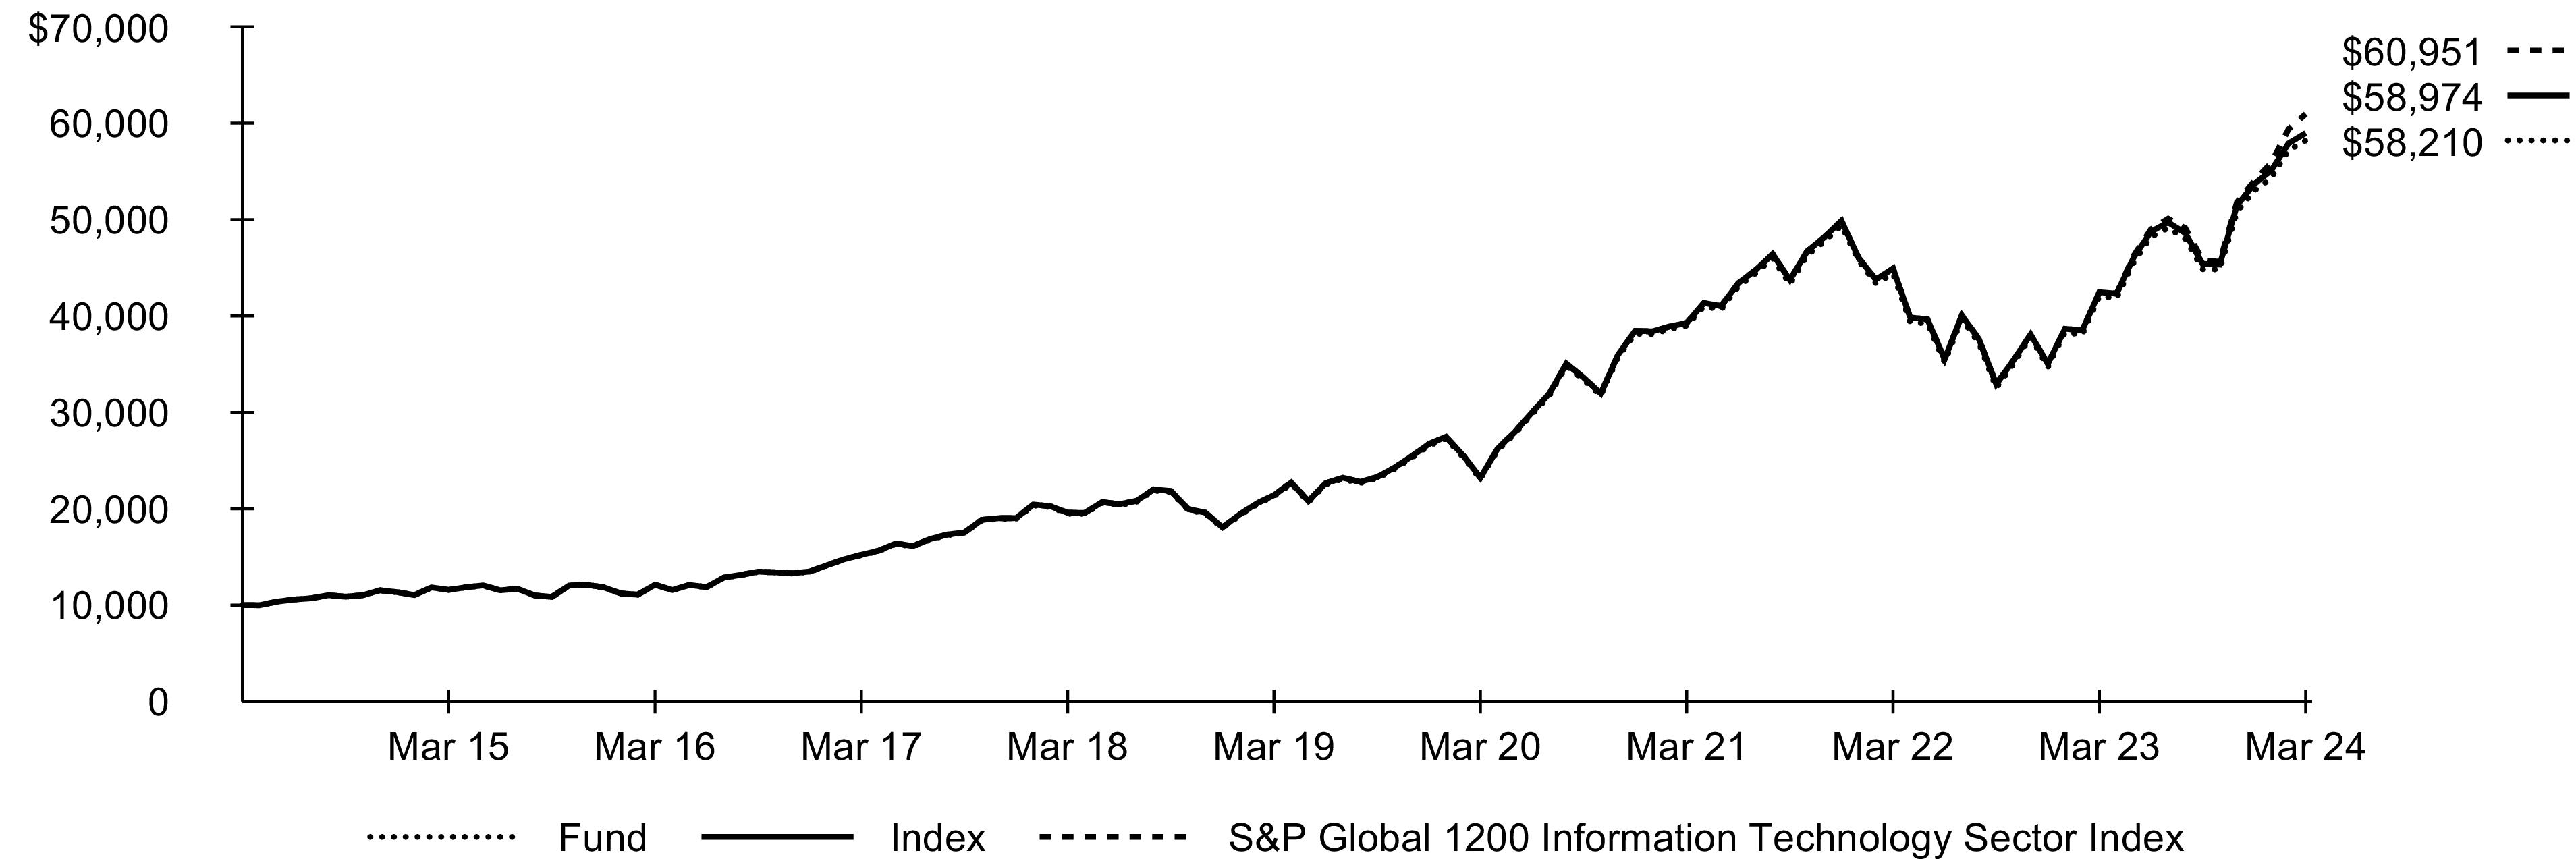
| The NAV total return presented in the table for the one-year period differs from the same period return disclosed in the financial highlights. The total return in the financial highlights is calculated in the same manner but differs due to certain adjustments made for financial reporting purposes in accordance with U.S. generally accepted accounting principles. |
| Index performance through April 19, 2023 reflects the S&PGlobal 1200 Information Technology Sector Index™performance of the Index. Index performance beginning on April 20, 2023 reflects the performance of the S&P Global 1200 Information Technology 4.5/22.5/45 Capped Index, which effective as of April 20, 2023, replaced the S&P Global 1200 Information Technology Sector Index™ as the underlying index of the fund. |
| The inception date of the S&P Global 1200 Information Technology 4.5/22.5/45 Capped Index was April 20, 2023. The cumulative total return for this index for the period April 20, 2023 through March 31, 2024 was 10.02%. |
Certain sectors and markets performed exceptionally well based on market conditions during the one-year period. Achieving such exceptional returns involves the risk of volatility and investors should not expect that such exceptional returns will be repeated.
Past performance is not an indication of future results. Performance results do not reflect the deduction of taxes that a shareholder would pay on fund distributions or on the redemption or sale of fund shares. See “About Fund Performance” for more information.
Expense Example
| | |
Beginning
Account Value
(10/01/23) | Ending
Account Value
(03/31/24) | | Beginning
Account Value
(10/01/23) | Ending
Account Value
(03/31/24) | | |
| | | | | | |
| Expenses are equal to the annualized expense ratio, multiplied by the average account value over the period, multiplied by 183/366 (to reflect the one-half year period shown). Other fees, such as brokerage commissions and other fees to financial intermediaries, may be paid which are not reflected in the tables and examples above. See “Disclosure of Expenses” for more information. |
Fund Summary as of March 31, 2024 (continued)
Portfolio Management Commentary
Global technology stocks advanced significantly for the reporting period, helped by continued global economic growth and notable innovations in artificial intelligence (“AI”) technology. Rapid advances in generative AI, which allows users to generate outputs using simple natural language queries, drove a surge in investor enthusiasm for products and technologies associated with AI. Stocks in the U.S., which represented approximately 81% of the Index on average, contributed the most to the Index’s performance. The U.S. semiconductors industry was the leading source of strength, as companies purchased specialized chips used to provide computing capacity for AI applications, which require significant processing power. Corporations seeking to use AI technologies invested significantly in this hardware, in some cases setting up separate budgetary allocations to expedite the increased investment. Consequently, industry revenues and earnings grew rapidly, driving strong equity performance. Additionally, the semiconductors industry continued to invest in building the next generation of processors for AI applications, further supporting stock prices.
The U.S. software industry also advanced, driven by strength among systems software companies. Enthusiasm for generative AI products benefited a large company in the industry with a significant investment in a prominent consumer-facing AI platform, a chatbot that grew its user base more rapidly than any other consumer application in history. Integration of AI into already existing productivity software also propelled gains, as many customers adopted new AI features that automated certain writing and coding tasks, in addition to summarization and advanced search functions. Cloud services revenue also accelerated, due in part to new AI features, beating analysts’ expectations and driving further earnings growth.
Technology companies in Taiwan also contributed to the Index’s return, helped by accelerating economic growth and rising exports. The semiconductors industry gained the most, buoyed by rising investor excitement surrounding AI applications. A large Taiwanese semiconductor manufacturer benefited from significant subsidies to build manufacturing facilities in the U.S. Japanese stocks also advanced due to increasing AI adoption, as growth in demand for semiconductor manufacturing equipment drove notable gains.
Portfolio Information
INDUSTRY ALLOCATION
| |
Semiconductors & Semiconductor Equipment | |
| |
Technology Hardware, Storage & Peripherals | |
| |
Electronic Equipment, Instruments & Components | |
| |
GEOGRAPHIC ALLOCATION
Country/Geographic Region | |
| |
| |
| |
| |
| |
| |
| |
Other (each representing less than 1%) | |
| Excludes money market funds. |
222024 iShares Annual Report to Shareholders
Fund Summary as of March 31, 2024
iShares® Global Utilities ETF
Investment Objective
The iShares Global Utilities ETF (the “Fund”) seeks to track the investment results of an index composed of global equities in the utilities sector, as represented by the S&P Global 1200 Utilities (Sector) Capped Index (the “Index”). The Fund invests in a representative sample of securities included in the Index that collectively has an investment profile similar to the Index. Due to the use of representative sampling, the Fund may or may not hold all of the securities that are included in the Index.
Performance
| Average Annual Total Returns | | |
| | | | | | | |
| | | | | | | |
| | | | | | | |
| | | | | | | |
GROWTH OF $10,000 INVESTMENT(AT NET ASSET VALUE)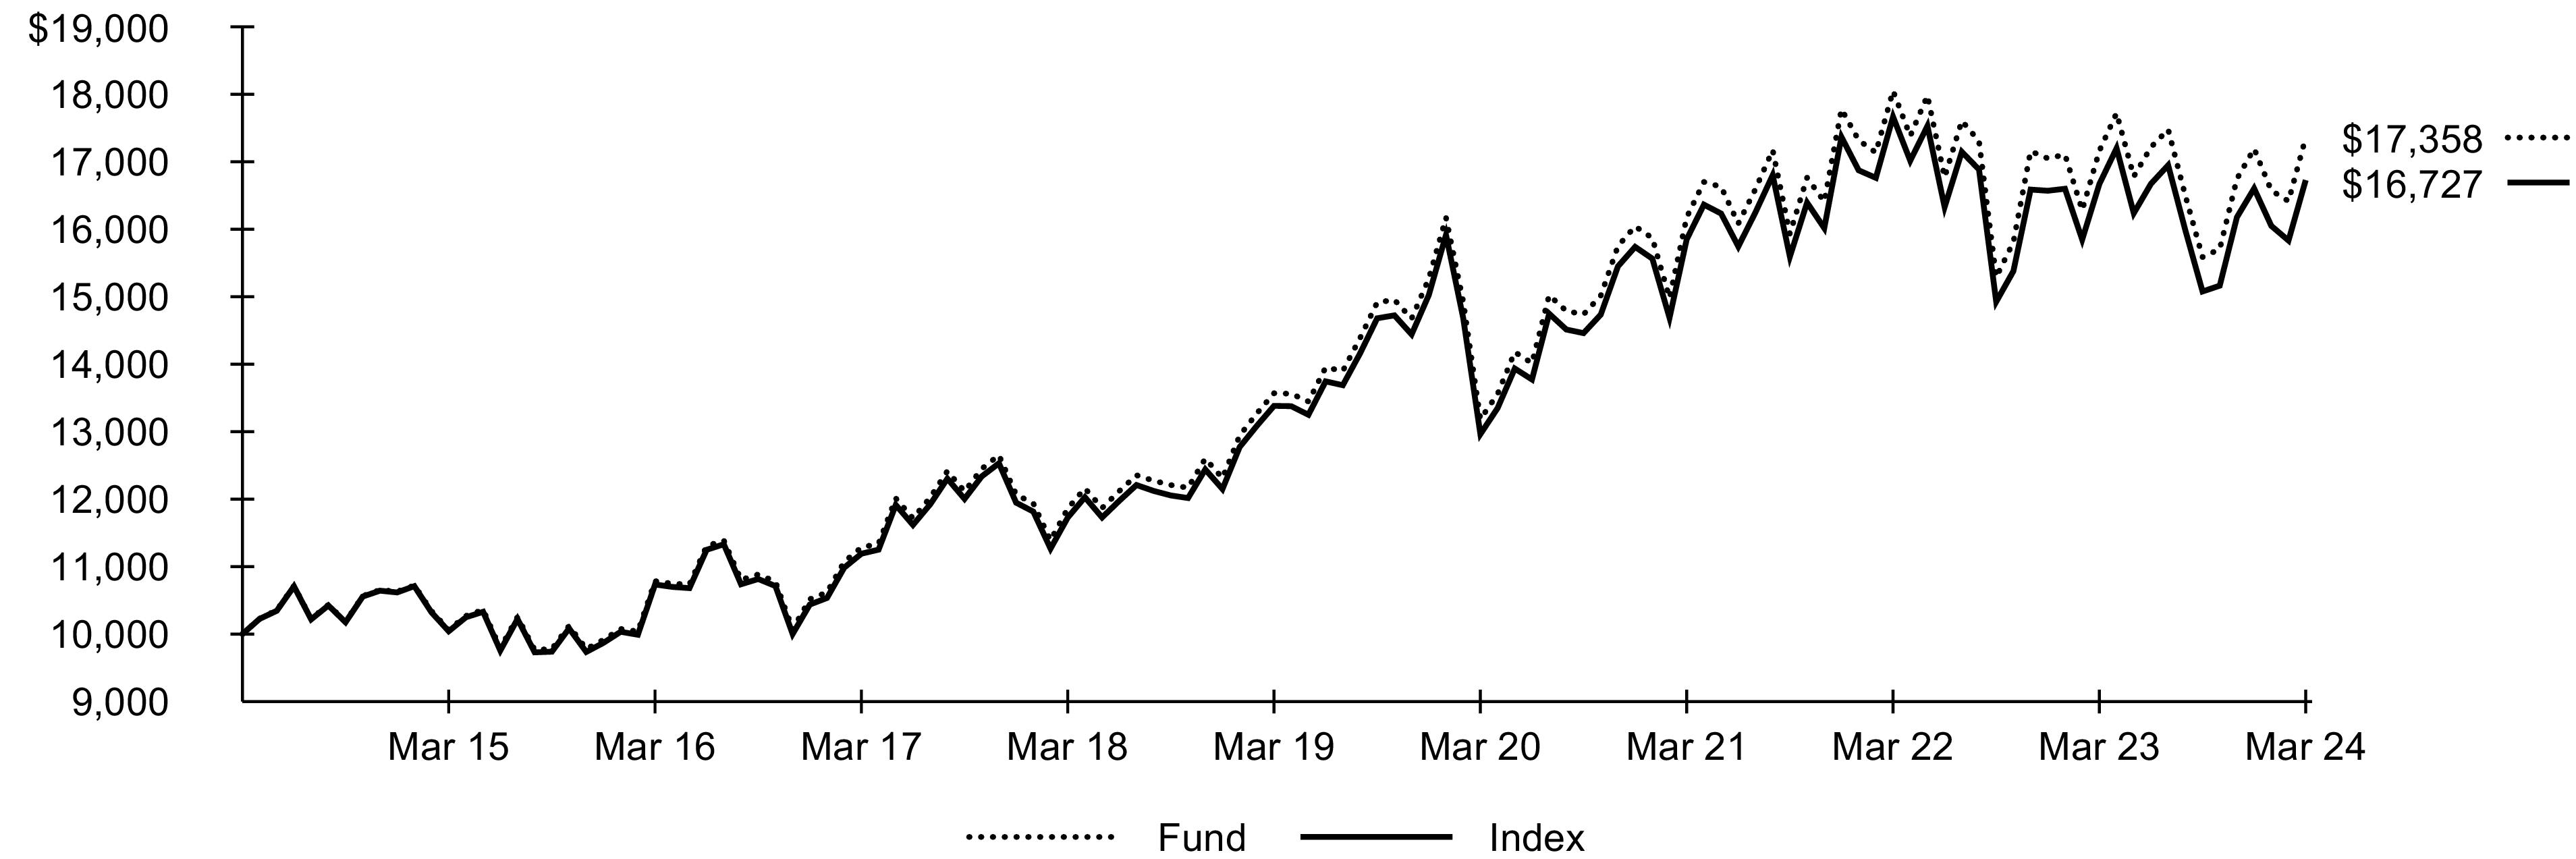
Past performance is not an indication of future results. Performance results do not reflect the deduction of taxes that a shareholder would pay on fund distributions or on the redemption or sale of fund shares. See “About Fund Performance” for more information.
Expense Example
| | |
Beginning
Account Value
(10/01/23) | Ending
Account Value
(03/31/24) | | Beginning
Account Value
(10/01/23) | Ending
Account Value
(03/31/24) | | |
| | | | | | |
| Expenses are equal to the annualized expense ratio, multiplied by the average account value over the period, multiplied by 183/366 (to reflect the one-half year period shown). Other fees, such as brokerage commissions and other fees to financial intermediaries, may be paid which are not reflected in the tables and examples above. See “Disclosure of Expenses” for more information. |
Fund Summary as of March 31, 2024 (continued)
iShares® Global Utilities ETF
Portfolio Management Commentary
Global utilities stocks increased marginally for the reporting period. Amid an uncertain economic outlook, the sector benefited from investors seeking relatively stable returns and dividend growth. That environment helped utilities stocks overcome headwinds from the highest interest rates since 2007, shortly before the global financial crisis. Utilities stocks generally underperform the broader stock market in high interest-rate environments – and did so for the reporting period – as capital-intensive utilities rely on borrowing to fund operations and investment. In addition, higher yields on bonds and cash provided additional competition from those asset classes for dividend-oriented utilities stocks.
Japan’s utilities stocks contributed the most to the Index’s return, despite only representing about 2.5% of the Index on average for the reporting period. In contrast with most global economies, Japan maintained low interest rates below 1% for the reporting period. Conversely, leading Japanese electric and gas utilities stocks offered dividend yields of 2-4%, and the stocks’ valuations rose. Meanwhile, after government approval, Japan’s electric utilities raised electricity prices substantially, further boosting their stock prices. In addition, resilient economic growth and reduced electricity generation costs amid falling coal and natural gas prices increased profits.
Utilities stocks in Italy also contributed to the Index’s performance. Power generators in Italy, which rely heavily on natural gas as fuel, benefited from charging substantially higher prices than those in rival European economies. That capability and rising renewable energy production enhanced profitability, as did considerably lower natural gas prices in the last half of the reporting period.
Utilities stocks in France also rose after leading utilities secured financing for large renewable energy projects and added renewable production capacity with long-term purchase agreements. Higher European power prices also increased profits, aided by the government’s decision to raise regulated electricity prices by 10%.
U.S. utilities stocks, on the other hand, detracted from performance. U.S. investors favored a handful of growth-oriented technology and communications companies’ stocks, particularly as the resilient U.S. economy raised the potential for interest rates to remain higher for longer, making utilities stocks relatively less attractive.
Portfolio Information
INDUSTRY ALLOCATION
| |
| |
| |
| |
| |
Independent Power and Renewable Electricity Producers | |
GEOGRAPHIC ALLOCATION
Country/Geographic Region | |
| |
| |
| |
| |
| |
| |
| |
| |
| |
Other (each representing less than 1%) | |
| Excludes money market funds. |
242024 iShares Annual Report to Shareholders
Past performance is not an indication of future results. Financial markets have experienced extreme volatility and trading in many instruments has been disrupted. These circumstances may continue for an extended period of time and may continue to affect adversely the value and liquidity of each Fund’s investments. As a result, current performance may be lower or higher than the performance data quoted. Performance data current to the most recent month-end is available at iShares.com. Performance results assume reinvestment of all dividends and capital gain distributions and do not reflect the deduction of taxes that a shareholder would pay on fund distributions or on the redemption or sale of fund shares. The investment return and principal value of shares will vary with changes in market conditions. Shares may be worth more or less than their original cost when they are redeemed or sold in the market. Performance for certain funds may reflect a waiver of a portion of investment advisory fees. Without such a waiver, performance would have been lower.
Net asset value or “NAV” is the value of one share of a fund as calculated in accordance with the standard formula for valuing mutual fund shares. Beginning August 10, 2020, the price used to calculate market return (“Market Price”) is the closing price. Prior to August 10, 2020, Market Price was determined using the midpoint between the highest bid and the lowest ask on the primary stock exchange on which shares of a fund are listed for trading, as of the time that such fund’s NAV is calculated. Market and NAV returns assume that dividends and capital gain distributions have been reinvested at Market Price and NAV, respectively.
An index is a statistical composite that tracks a specified financial market or sector. Unlike a fund, an index does not actually hold a portfolio of securities and therefore does not incur the expenses incurred by a fund. These expenses negatively impact fund performance. Also, index returns do not include brokerage commissions that may be payable on secondary market transactions. If brokerage commissions were included, index returns would be lower.
Disclosure of Expenses
Shareholders of each Fund may incur the following charges: (1) transactional expenses, including brokerage commissions on purchases and sales of fund shares and (2) ongoing expenses, including management fees and other fund expenses. The expense examples shown (which are based on a hypothetical investment of $1,000 invested at the beginning of the period and held through the end of the period) are intended to assist shareholders both in calculating expenses based on an investment in each Fund and in comparing these expenses with similar costs of investing in other funds.
The expense examples provide information about actual account values and actual expenses. Annualized expense ratios reflect contractual and voluntary fee waivers, if any. In order to estimate the expenses a shareholder paid during the period covered by this report, shareholders can divide their account value by $1,000 and then multiply the result by the number under the heading entitled “Expenses Paid During the Period.”
The expense examples also provide information about hypothetical account values and hypothetical expenses based on a fund’s actual expense ratio and an assumed rate of return of 5% per year before expenses. In order to assist shareholders in comparing the ongoing expenses of investing in the Funds and other funds, compare the 5% hypothetical examples with the 5% hypothetical examples that appear in the shareholder reports of the other funds.
The expenses shown in the expense examples are intended to highlight shareholders’ ongoing costs only and do not reflect any transactional expenses, such as brokerage commissions and other fees paid on purchases and sales of fund shares. Therefore, the hypothetical examples are useful in comparing ongoing expenses only and will not help shareholders determine the relative total expenses of owning different funds. If these transactional expenses were included, shareholder expenses would have been higher.
About Fund Performance/Disclosure of Expenses25
Schedule of InvestmentsMarch 31, 2024
iShares® Global Comm Services ETF(Percentages shown are based on Net Assets)
| | |
|
|
| | |
| | |
| | |
| | |
|
Telefonica Brasil SA, ADR NVS | | |
|
| | |
Rogers Communications Inc., Class B, NVS | | |
| | |
| | |
|
| | |
Kuaishou Technology(a)(b) | | |
| | |
| | |
| | |
|
| | |
|
| | |
| | |
| | |
| | |
|
Deutsche Telekom AG, Registered | | |
|
Telecom Italia SpA/Milano(a)(c) | | |
|
| | |
| | |
| | |
| | |
| | |
Nippon Telegraph & Telephone Corp. | | |
| | |
| | |
| | |
|
| | |
|
| | |
| | |
| | |
|
| | |
|
| | |
|
| | |
| | |
| | |
|
| | |
| | |
|
| | |
| | |
|
| | |
|
Chunghwa Telecom Co. Ltd. | | |
|
| | |
| | |
| | |
| | |
| | |
| | |
| | |
|
Alphabet Inc., Class A(a) | | |
Alphabet Inc., Class C, NVS(a) | | |
| | |
Charter Communications Inc., Class A(a) | | |
| | |
| | |
| | |
| | |
Interpublic Group of Companies Inc. (The) | | |
Live Nation Entertainment Inc.(a)(c) | | |
| | |
Meta Platforms Inc., Class A | | |
| | |
| | |
| | |
| | |
Paramount Global, Class B, NVS | | |
Take-Two Interactive Software Inc.(a)(c) | | |
| | |
Verizon Communications Inc. | | |
| | |
Warner Bros Discovery Inc.(a) | | |
| | |
Total Common Stocks — 99.7%
(Cost: $248,431,846) | |
|
|
Telecom Italia SpA, Preference Shares, NVS | | |
Total Preferred Stocks — 0.0%
(Cost: $273,520) | |
Total Long-Term Investments — 99.7%
(Cost: $248,705,366) | |
|
Money Market Funds — 0.8% |
BlackRock Cash Funds: Institutional, SL Agency Shares, 5.50%(d)(e)(f) | | |
262024 iShares Annual Report to Shareholders
Schedule of Investments (continued)March 31, 2024
iShares® Global Comm Services ETF(Percentages shown are based on Net Assets)
| | |
Money Market Funds (continued) |
BlackRock Cash Funds: Treasury, SL Agency Shares, 5.29%(d)(e) | | |
Total Short-Term Securities — 0.8%
(Cost: $2,178,079) | |
Total Investments — 100.5%
(Cost: $250,883,445) | |
Liabilities in Excess of Other Assets — (0.5)% | |
| |
| Non-income producing security. |
| Security exempt from registration pursuant to Rule 144A under the Securities Act of 1933, as amended. These securities may be resold in transactions exempt from registration to qualified institutional investors. |
| All or a portion of this security is on loan. |
| |
| Annualized 7-day yield as of period end. |
| All or a portion of this security was purchased with the cash collateral from loaned securities. |
Affiliates
Investments in issuers considered to be affiliate(s) of the Fund during the year ended March 31, 2024 for purposes of Section 2(a)(3) of the Investment Company Act of 1940, as amended, were as follows:
| | | | | Change in
Unrealized
Appreciation
(Depreciation) | | | | Capital
Gain
Distributions
from
Underlying
Funds |
BlackRock Cash Funds: Institutional, SL Agency Shares | | | | | | | | | |
BlackRock Cash Funds: Treasury, SL Agency Shares | | | | | | | | | |
| | | | | | | | | |
| Represents net amount purchased (sold). |
| All or a portion represents securities lending income earned from the reinvestment of cash collateral from loaned securities, net of fees and collateral investment expenses, and other payments to and from borrowers of securities. |
Derivative Financial Instruments Outstanding as of Period End
Futures Contracts
| | | | Value/
Unrealized
Appreciation
(Depreciation) |
| | | | |
| | | | |
E-Mini S&P Communication Services Select Sector Index | | | | |
| | | | |
| | | | |
Schedule of Investments27
Schedule of Investments (continued)March 31, 2024
iShares® Global Comm Services ETF
Derivative Financial Instruments Categorized by Risk Exposure
As of period end, the fair values of derivative financial instruments located in the Statements of Assets and Liabilities were as follows:
| | | | Foreign
Currency
Exchange
Contracts | | | |
Assets—Derivative Financial Instruments | | | | | | | |
| | | | | | | |
Unrealized appreciation on futures contracts(a) | | | | | | | |
| Net cumulative unrealized appreciation (depreciation) on futures contracts are reported in the Schedule of Investments. In the Statements of Assets and Liabilities, only current day's variation margin is reported in receivables or payables and the net cumulative unrealized appreciation (depreciation) is included in accumulated earnings (loss). |
For the period ended March 31, 2024, the effect of derivative financial instruments in the Statements of Operations was as follows:
| | | | Foreign
Currency
Exchange
Contracts | | | |
Net Realized Gain (Loss) from | | | | | | | |
| | | | | | | |
Net Change in Unrealized Appreciation (Depreciation) on | | | | | | | |
| | | | | | | |
Average Quarterly Balances of Outstanding Derivative Financial Instruments
| |
Average notional value of contracts — long | |
For more information about the Fund’s investment risks regarding derivative financial instruments, refer to the Notes to Financial Statements.
Fair Value Hierarchy as of Period End
Various inputs are used in determining the fair value of financial instruments. For a description of the input levels and information about the Fund’s policy regarding valuation of financial instruments, refer to the Notes to Financial Statements.
The following table summarizes the Fund’s financial instruments categorized in the fair value hierarchy. The breakdown of the Fund’s financial instruments into major categories is disclosed in the Schedule of Investments above.
| | | | |
| | | | |
| | | | |
| | | | |
| | | | |
| | | | |
| | | | |
| | | | |
| | | | |
Derivative Financial Instruments(a) | | | | |
| | | | |
| | | | |
| Derivative financial instruments are futures contracts. Futures contracts are valued at the unrealized appreciation (depreciation) on the instrument. |
See notes to financial statements.
282024 iShares Annual Report to Shareholders
Schedule of InvestmentsMarch 31, 2024
iShares® Global Consumer Discretionary ETF(Percentages shown are based on Net Assets)
| | |
|
|
| | |
| | |
| | |
| | |
|
| | |
|
Canadian Tire Corp. Ltd., Class A, NVS | | |
| | |
| | |
| | |
Restaurant Brands International Inc. | | |
| | |
|
| | |
|
Alibaba Group Holding Ltd. | | |
ANTA Sports Products Ltd. | | |
| | |
| | |
| | |
| | |
| | |
| | |
|
| | |
| | |
| | |
|
| | |
Cie. Generale des Etablissements Michelin SCA | | |
| | |
| | |
LVMH Moet Hennessy Louis Vuitton SE | | |
| | |
| | |
| | |
|
| | |
Bayerische Motoren Werke AG | | |
| | |
Delivery Hero SE, Class A(a)(b) | | |
| | |
| | |
| | |
| | |
| | |
|
Flutter Entertainment PLC(a) | | |
|
| | |
| | |
| | |
| | |
|
| | |
Bandai Namco Holdings Inc. | | |
| | |
|
| | |
| | |
| | |
| | |
| | |
| | |
| | |
| | |
Pan Pacific International Holdings Corp. | | |
| | |
| | |
| | |
| | |
| | |
| | |
Sumitomo Electric Industries Ltd. | | |
| | |
| | |
| | |
| | |
|
| | |
|
| | |
| | |
| | |
|
| | |
Industria de Diseno Textil SA | | |
| | |
|
| | |
H & M Hennes & Mauritz AB, Class B | | |
| | |
|
Cie. Financiere Richemont SA, Class A, Registered | | |
Swatch Group AG (The), Bearer | | |
Swatch Group AG (The), Registered | | |
| | |
|
| | |
Berkeley Group Holdings PLC | | |
| | |
| | |
| | |
InterContinental Hotels Group PLC | | |
| | |
| | |
| | |
| | |
| | |
| | |
| | |
|
| | |
| | |
| | |
| | |
| | |
| | |
Schedule of Investments29
Schedule of Investments (continued)March 31, 2024
iShares® Global Consumer Discretionary ETF(Percentages shown are based on Net Assets)
| | |
United States (continued) |
| | |
| | |
Caesars Entertainment Inc.(a) | | |
| | |
| | |
Chipotle Mexican Grill Inc., Class A(a) | | |
| | |
| | |
| | |
| | |
| | |
| | |
| | |
| | |
| | |
| | |
| | |
| | |
Hilton Worldwide Holdings Inc. | | |
| | |
| | |
| | |
| | |
| | |
Lululemon Athletica Inc.(a) | | |
Marriott International Inc./MD, Class A | | |
| | |
MGM Resorts International(a) | | |
Mohawk Industries Inc.(a) | | |
| | |
Norwegian Cruise Line Holdings Ltd.(a) | | |
| | |
O'Reilly Automotive Inc.(a) | | |
| | |
| | |
Ralph Lauren Corp., Class A | | |
| | |
Royal Caribbean Cruises Ltd.(a) | | |
| | |
| | |
| | |
| | |
| | |
| | |
| | |
| | |
United States (continued) |
| | |
| | |
| | |
Total Common Stocks — 98.7%
(Cost: $275,288,292) | |
|
|
Bayerische Motoren Werke AG, Preference Shares, NVS | | |
Dr Ing hc F Porsche AG, Preference Shares, NVS(b) | | |
Porsche Automobil Holding SE, Preference Shares, NVS | | |
Volkswagen AG, Preference Shares, NVS | | |
| | |
|
| | |
| | |
Series 2, Preference Shares, NVS | | |
| | |
Total Preferred Stocks — 0.9%
(Cost: $3,416,401) | |
Total Long-Term Investments — 99.6%
(Cost: $278,704,693) | |
|
Money Market Funds — 0.1% |
BlackRock Cash Funds: Treasury, SL Agency Shares, 5.29%(c)(d) | | |
Total Short-Term Securities — 0.1%
(Cost: $290,000) | |
Total Investments — 99.7%
(Cost: $278,994,693) | |
Other Assets Less Liabilities — 0.3% | |
| |
| Non-income producing security. |
| Security exempt from registration pursuant to Rule 144A under the Securities Act of 1933, as amended. These securities may be resold in transactions exempt from registration to qualified institutional investors. |
| |
| Annualized 7-day yield as of period end. |
302024 iShares Annual Report to Shareholders
Schedule of Investments (continued)March 31, 2024
iShares® Global Consumer Discretionary ETF
Affiliates
Investments in issuers considered to be affiliate(s) of the Fund during the year ended March 31, 2024 for purposes of Section 2(a)(3) of the Investment Company Act of 1940, as amended, were as follows:
| | | | | Change in
Unrealized
Appreciation
(Depreciation) | | | | Capital
Gain
Distributions
from
Underlying
Funds |
BlackRock Cash Funds: Institutional, SL Agency Shares(a) | | | | | | | | | |
BlackRock Cash Funds: Treasury, SL Agency Shares | | | | | | | | | |
| | | | | | | | | |
| As of period end, the entity is no longer held. |
| Represents net amount purchased (sold). |
| All or a portion represents securities lending income earned from the reinvestment of cash collateral from loaned securities, net of fees and collateral investment expenses, and other payments to and from borrowers of securities. |
Derivative Financial Instruments Outstanding as of Period End
Futures Contracts
| | | | Value/
Unrealized
Appreciation
(Depreciation) |
| | | | |
| | | | |
E-Mini Consumer Discretionary Select Sector Index | | | | |
| | | | |
| | | | |
Derivative Financial Instruments Categorized by Risk Exposure
As of period end, the fair values of derivative financial instruments located in the Statements of Assets and Liabilities were as follows:
| | | | Foreign
Currency
Exchange
Contracts | | | |
Assets—Derivative Financial Instruments | | | | | | | |
| | | | | | | |
Unrealized appreciation on futures contracts(a) | | | | | | | |
| Net cumulative unrealized appreciation (depreciation) on futures contracts are reported in the Schedule of Investments. In the Statements of Assets and Liabilities, only current day's variation margin is reported in receivables or payables and the net cumulative unrealized appreciation (depreciation) is included in accumulated earnings (loss). |
For the period ended March 31, 2024, the effect of derivative financial instruments in the Statements of Operations was as follows:
| | | | Foreign
Currency
Exchange
Contracts | | | |
Net Realized Gain (Loss) from | | | | | | | |
| | | | | | | |
Net Change in Unrealized Appreciation (Depreciation) on | | | | | | | |
| | | | | | | |
Schedule of Investments31
Schedule of Investments (continued)March 31, 2024
iShares® Global Consumer Discretionary ETF
Average Quarterly Balances of Outstanding Derivative Financial Instruments
| |
Average notional value of contracts — long | |
For more information about the Fund’s investment risks regarding derivative financial instruments, refer to the Notes to Financial Statements.
Fair Value Hierarchy as of Period End
Various inputs are used in determining the fair value of financial instruments. For a description of the input levels and information about the Fund’s policy regarding valuation of financial instruments, refer to the Notes to Financial Statements.
The following table summarizes the Fund’s financial instruments categorized in the fair value hierarchy. The breakdown of the Fund’s financial instruments into major categories is disclosed in the Schedule of Investments above.
| | | | |
| | | | |
| | | | |
| | | | |
| | | | |
| | | | |
| | | | |
| | | | |
| | | | |
Derivative Financial Instruments(a) | | | | |
| | | | |
| | | | |
| Derivative financial instruments are futures contracts. Futures contracts are valued at the unrealized appreciation (depreciation) on the instrument. |
See notes to financial statements.
322024 iShares Annual Report to Shareholders
Schedule of InvestmentsMarch 31, 2024
iShares® Global Consumer Staples ETF(Percentages shown are based on Net Assets)
| | |
|
|
| | |
| | |
Treasury Wine Estates Ltd. | | |
| | |
| | |
|
Anheuser-Busch InBev SA/NV | | |
|
| | |
| | |
| | |
|
Alimentation Couche-Tard Inc. | | |
| | |
| | |
| | |
| | |
| | |
|
| | |
|
| | |
|
| | |
|
| | |
| | |
| | |
| | |
| | |
|
| | |
| | |
| | |
|
| | |
|
| | |
| | |
Asahi Group Holdings Ltd. | | |
| | |
| | |
| | |
| | |
| | |
Nissin Foods Holdings Co. Ltd. | | |
Seven & i Holdings Co. Ltd. | | |
| | |
| | |
| | |
| | |
|
Arca Continental SAB de CV | | |
Fomento Economico Mexicano SAB de CV | | |
Grupo Bimbo SAB de CV, Series A | | |
| | |
|
Wal-Mart de Mexico SAB de CV | | |
| | |
|
| | |
| | |
Koninklijke Ahold Delhaize NV | | |
| | |
|
| | |
| | |
| | |
|
| | |
|
| | |
|
Barry Callebaut AG, Registered | | |
| | |
Chocoladefabriken Lindt & Spruengli AG, Participation Certificates, NVS | | |
Chocoladefabriken Lindt & Spruengli AG, Registered | | |
| | |
| | |
|
Associated British Foods PLC | | |
British American Tobacco PLC | | |
| | |
| | |
| | |
| | |
Marks & Spencer Group PLC | | |
| | |
Reckitt Benckiser Group PLC | | |
| | |
| | |
| | |
|
| | |
Archer-Daniels-Midland Co. | | |
Brown-Forman Corp., Class B | | |
| | |
| | |
| | |
| | |
| | |
| | |
Constellation Brands Inc., Class A | | |
| | |
| | |
| | |
Estee Lauder Companies Inc. (The), Class A | | |
| | |
| | |
| | |
| | |
| | |
| | |
| | |
| | |
Schedule of Investments33
Schedule of Investments (continued)March 31, 2024
iShares® Global Consumer Staples ETF(Percentages shown are based on Net Assets)
| | |
United States (continued) |
| | |
| | |
Lamb Weston Holdings Inc. | | |
McCormick & Co. Inc./MD, NVS | | |
Molson Coors Beverage Co., Class B | | |
Mondelez International Inc., Class A | | |
Monster Beverage Corp.(a) | | |
| | |
Philip Morris International Inc. | | |
Procter & Gamble Co. (The) | | |
| | |
| | |
Tyson Foods Inc., Class A | | |
Walgreens Boots Alliance Inc. | | |
| | |
| | |
Total Common Stocks — 99.0%
(Cost: $898,664,203) | |
|
|
Henkel AG & Co. KGaA, Preference Shares, NVS | | |
Total Preferred Stocks — 0.3%
(Cost: $3,464,998) | |
Total Long-Term Investments — 99.3%
(Cost: $902,129,201) | |
| | |
|
Money Market Funds — 0.1% |
BlackRock Cash Funds: Treasury, SL Agency Shares, 5.29%(b)(c) | | |
Total Short-Term Securities — 0.1%
(Cost: $930,000) | |
Total Investments — 99.4%
(Cost: $903,059,201) | |
Other Assets Less Liabilities — 0.6% | |
| |
| Non-income producing security. |
| |
| Annualized 7-day yield as of period end. |
Affiliates
Investments in issuers considered to be affiliate(s) of the Fund during the year ended March 31, 2024 for purposes of Section 2(a)(3) of the Investment Company Act of 1940, as amended, were as follows:
| | | | | Change in
Unrealized
Appreciation
(Depreciation) | | | | Capital
Gain
Distributions
from
Underlying
Funds |
BlackRock Cash Funds: Institutional, SL Agency Shares(a) | | | | | | | | | |
BlackRock Cash Funds: Treasury, SL Agency Shares | | | | | | | | | |
| | | | | | | | | |
| As of period end, the entity is no longer held. |
| Represents net amount purchased (sold). |
| All or a portion represents securities lending income earned from the reinvestment of cash collateral from loaned securities, net of fees and collateral investment expenses, and other payments to and from borrowers of securities. |
Derivative Financial Instruments Outstanding as of Period End
Futures Contracts
| | | | Value/
Unrealized
Appreciation
(Depreciation) |
| | | | |
E-Mini Consumer Staples Index | | | | |
| | | | |
342024 iShares Annual Report to Shareholders
Schedule of Investments (continued)March 31, 2024
iShares® Global Consumer Staples ETF
Futures Contracts (continued)
| | | | Value/ Unrealized Appreciation (Depreciation) |
| | | | |
| | | | |
Derivative Financial Instruments Categorized by Risk Exposure
As of period end, the fair values of derivative financial instruments located in the Statements of Assets and Liabilities were as follows:
| | | | Foreign
Currency
Exchange
Contracts | | | |
Assets—Derivative Financial Instruments | | | | | | | |
| | | | | | | |
Unrealized appreciation on futures contracts(a) | | | | | | | |
| Net cumulative unrealized appreciation (depreciation) on futures contracts are reported in the Schedule of Investments. In the Statements of Assets and Liabilities, only current day's variation margin is reported in receivables or payables and the net cumulative unrealized appreciation (depreciation) is included in accumulated earnings (loss). |
For the period ended March 31, 2024, the effect of derivative financial instruments in the Statements of Operations was as follows:
| | | | Foreign
Currency
Exchange
Contracts | | | |
Net Realized Gain (Loss) from | | | | | | | |
| | | | | | | |
Net Change in Unrealized Appreciation (Depreciation) on | | | | | | | |
| | | | | | | |
Average Quarterly Balances of Outstanding Derivative Financial Instruments
| |
Average notional value of contracts — long | |
For more information about the Fund’s investment risks regarding derivative financial instruments, refer to the Notes to Financial Statements.
Fair Value Hierarchy as of Period End
Various inputs are used in determining the fair value of financial instruments. For a description of the input levels and information about the Fund’s policy regarding valuation of financial instruments, refer to the Notes to Financial Statements.
The following table summarizes the Fund’s financial instruments categorized in the fair value hierarchy. The breakdown of the Fund’s financial instruments into major categories is disclosed in the Schedule of Investments above.
Schedule of Investments35
Schedule of Investments (continued)March 31, 2024
iShares® Global Consumer Staples ETF
Fair Value Hierarchy as of Period End (continued)
| | | | |
Derivative Financial Instruments(a) | | | | |
| | | | |
| | | | |
| Derivative financial instruments are futures contracts. Futures contracts are valued at the unrealized appreciation (depreciation) on the instrument. |
See notes to financial statements.
362024 iShares Annual Report to Shareholders
Schedule of InvestmentsMarch 31, 2024
iShares® Global Energy ETF(Percentages shown are based on Net Assets)
| | |
|
|
| | |
| | |
Woodside Energy Group Ltd. | | |
| | |
|
| | |
|
Petroleo Brasileiro SA, ADR | | |
|
| | |
Canadian Natural Resources Ltd. | | |
| | |
| | |
| | |
| | |
| | |
| | |
| | |
| | |
|
| | |
|
PetroChina Co. Ltd., Class H | | |
|
| | |
|
| | |
|
| | |
|
| | |
| | |
| | |
|
| | |
| | |
| | |
|
| | |
| | |
| | |
|
| | |
|
| | |
|
| | |
| | |
| | |
| | |
|
| | |
Baker Hughes Co., Class A | | |
| | |
| | |
| | |
| | |
| | |
| | |
| | |
| | |
| | |
| | |
| | |
| | |
| | |
Occidental Petroleum Corp. | | |
| | |
| | |
Pioneer Natural Resources Co. | | |
| | |
| | |
| | |
Williams Companies Inc. (The) | | |
| | |
Total Common Stocks — 98.4%
(Cost: $2,958,122,208) | |
|
|
Petroleo Brasileiro SA, Preference Shares, ADR | | |
Total Preferred Stocks — 1.2%
(Cost: $42,413,317) | |
Total Long-Term Investments — 99.6%
(Cost: $3,000,535,525) | |
|
Money Market Funds — 0.2% |
BlackRock Cash Funds: Treasury, SL Agency Shares, 5.29%(a)(b) | | |
Total Short-Term Securities — 0.2%
(Cost: $7,840,000) | |
Total Investments — 99.8%
(Cost: $3,008,375,525) | |
Other Assets Less Liabilities — 0.2% | |
| |
| |
| Annualized 7-day yield as of period end. |
Schedule of Investments37
Schedule of Investments (continued)March 31, 2024
iShares® Global Energy ETF
Affiliates
Investments in issuers considered to be affiliate(s) of the Fund during the year ended March 31, 2024 for purposes of Section 2(a)(3) of the Investment Company Act of 1940, as amended, were as follows:
| | | | | Change in
Unrealized
Appreciation
(Depreciation) | | | | Capital
Gain
Distributions
from
Underlying
Funds |
BlackRock Cash Funds: Institutional, SL Agency Shares(a) | | | | | | | | | |
BlackRock Cash Funds: Treasury, SL Agency Shares | | | | | | | | | |
| | | | | | | | | |
| As of period end, the entity is no longer held. |
| Represents net amount purchased (sold). |
| All or a portion represents securities lending income earned from the reinvestment of cash collateral from loaned securities, net of fees and collateral investment expenses, and other payments to and from borrowers of securities. |
Derivative Financial Instruments Outstanding as of Period End
Futures Contracts
| | | | Value/
Unrealized
Appreciation
(Depreciation) |
| | | | |
E-Mini Energy Select Sector Index | | | | |
| | | | |
| | | | |
Derivative Financial Instruments Categorized by Risk Exposure
As of period end, the fair values of derivative financial instruments located in the Statements of Assets and Liabilities were as follows:
| | | | Foreign
Currency
Exchange
Contracts | | | |
Assets—Derivative Financial Instruments | | | | | | | |
| | | | | | | |
Unrealized appreciation on futures contracts(a) | | | | | | | |
| Net cumulative unrealized appreciation (depreciation) on futures contracts are reported in the Schedule of Investments. In the Statements of Assets and Liabilities, only current day's variation margin is reported in receivables or payables and the net cumulative unrealized appreciation (depreciation) is included in accumulated earnings (loss). |
For the period ended March 31, 2024, the effect of derivative financial instruments in the Statements of Operations was as follows:
| | | | Foreign
Currency
Exchange
Contracts | | | |
Net Realized Gain (Loss) from | | | | | | | |
| | | | | | | |
Net Change in Unrealized Appreciation (Depreciation) on | | | | | | | |
| | | | | | | |
382024 iShares Annual Report to Shareholders
Schedule of Investments (continued)March 31, 2024
iShares® Global Energy ETF
Average Quarterly Balances of Outstanding Derivative Financial Instruments
| |
Average notional value of contracts — long | |
For more information about the Fund’s investment risks regarding derivative financial instruments, refer to the Notes to Financial Statements.
Fair Value Hierarchy as of Period End
Various inputs are used in determining the fair value of financial instruments. For a description of the input levels and information about the Fund’s policy regarding valuation of financial instruments, refer to the Notes to Financial Statements.
The following table summarizes the Fund’s financial instruments categorized in the fair value hierarchy. The breakdown of the Fund’s financial instruments into major categories is disclosed in the Schedule of Investments above.
| | | | |
| | | | |
| | | | |
| | | | |
| | | | |
| | | | |
| | | | |
| | | | |
| | | | |
Derivative Financial Instruments(a) | | | | |
| | | | |
| | | | |
| Derivative financial instruments are futures contracts. Futures contracts are valued at the unrealized appreciation (depreciation) on the instrument. |
See notes to financial statements.
Schedule of Investments39
Schedule of InvestmentsMarch 31, 2024
iShares® Global Financials ETF(Percentages shown are based on Net Assets)
| | |
|
|
| | |
| | |
Commonwealth Bank of Australia | | |
Insurance Australia Group Ltd. | | |
| | |
| | |
National Australia Bank Ltd. | | |
| | |
| | |
| | |
| | |
|
| | |
|
| | |
Groupe Bruxelles Lambert NV | | |
| | |
| | |
|
B3 SA - Brasil, Bolsa, Balcao | | |
| | |
| | |
| | |
|
| | |
Bank of Nova Scotia (The) | | |
Brookfield Asset Management Ltd. | | |
Brookfield Corp., Class A | | |
Canadian Imperial Bank of Commerce | | |
| | |
| | |
| | |
| | |
| | |
| | |
Toronto-Dominion Bank (The) | | |
| | |
|
| | |
Banco Santander Chile, ADR | | |
| | |
|
Bank of China Ltd., Class H | | |
China Construction Bank Corp., Class H | | |
China Merchants Bank Co. Ltd., Class H | | |
Industrial & Commercial Bank of China Ltd., Class H | | |
Ping An Insurance Group Co. of China Ltd., Class H | | |
| | |
|
| | |
|
| | |
| | |
| | |
|
| | |
| | |
|
| | |
| | |
| | |
| | |
| | |
| | |
Worldline SA/France(a)(b) | | |
| | |
|
| | |
| | |
Deutsche Bank AG, Registered | | |
| | |
| | |
Muenchener Rueckversicherungs-Gesellschaft AG in Muenchen, Registered | | |
| | |
|
| | |
Hong Kong Exchanges & Clearing Ltd. | | |
| | |
|
Bank of Ireland Group PLC | | |
|
Assicurazioni Generali SpA | | |
| | |
FinecoBank Banca Fineco SpA | | |
| | |
Mediobanca Banca di Credito Finanziario SpA | | |
| | |
| | |
| | |
|
Dai-ichi Life Holdings Inc. | | |
Daiwa Securities Group Inc. | | |
Japan Exchange Group Inc. | | |
Japan Post Holdings Co. Ltd. | | |
Mitsubishi UFJ Financial Group Inc. | | |
Mizuho Financial Group Inc. | | |
MS&AD Insurance Group Holdings Inc. | | |
| | |
| | |
| | |
| | |
Sumitomo Mitsui Financial Group Inc. | | |
Sumitomo Mitsui Trust Holdings Inc. | | |
| | |
Tokio Marine Holdings Inc. | | |
| | |
|
Grupo Financiero Banorte SAB de CV, Class O | | |
|
| | |
| | |
| | |
| | |
| | |
| | |
402024 iShares Annual Report to Shareholders
Schedule of Investments (continued)March 31, 2024
iShares® Global Financials ETF(Percentages shown are based on Net Assets)
| | |
|
| | |
| | |
|
| | |
|
| | |
|
| | |
Oversea-Chinese Banking Corp. Ltd. | | |
United Overseas Bank Ltd. | | |
| | |
|
| | |
Shinhan Financial Group Co. Ltd. | | |
| | |
|
Banco Bilbao Vizcaya Argentaria SA | | |
| | |
| | |
| | |
| | |
|
| | |
Industrivarden AB, Class A | | |
Industrivarden AB, Class C | | |
| | |
| | |
Skandinaviska Enskilda Banken AB, Class A | | |
Svenska Handelsbanken AB, Class A | | |
| | |
| | |
|
Baloise Holding AG, Registered | | |
| | |
Partners Group Holding AG | | |
Swiss Life Holding AG, Registered | | |
| | |
| | |
Zurich Insurance Group AG | | |
| | |
|
Cathay Financial Holding Co. Ltd. | | |
CTBC Financial Holding Co. Ltd. | | |
Fubon Financial Holding Co. Ltd. | | |
| | |
|
| | |
| | |
| | |
| | |
| | |
| | |
| | |
Intermediate Capital Group PLC | | |
Legal & General Group PLC | | |
| | |
London Stock Exchange Group PLC | | |
| | |
| | |
| | |
United Kingdom (continued) |
Phoenix Group Holdings PLC | | |
| | |
| | |
| | |
| | |
| | |
|
| | |
| | |
| | |
American International Group Inc. | | |
Ameriprise Financial Inc. | | |
| | |
Arch Capital Group Ltd.(a) | | |
| | |
| | |
| | |
Bank of New York Mellon Corp. (The) | | |
Berkshire Hathaway Inc., Class B(a) | | |
| | |
| | |
| | |
Capital One Financial Corp. | | |
| | |
Charles Schwab Corp. (The) | | |
| | |
Cincinnati Financial Corp. | | |
| | |
Citizens Financial Group Inc. | | |
| | |
| | |
| | |
Discover Financial Services | | |
| | |
FactSet Research Systems Inc. | | |
Fidelity National Information Services Inc. | | |
| | |
| | |
| | |
| | |
| | |
Goldman Sachs Group Inc. (The) | | |
Hartford Financial Services Group Inc. (The) | | |
Huntington Bancshares Inc./OH | | |
Intercontinental Exchange Inc. | | |
| | |
Jack Henry & Associates Inc. | | |
| | |
| | |
| | |
| | |
MarketAxess Holdings Inc. | | |
Marsh & McLennan Companies Inc. | | |
| | |
| | |
| | |
| | |
| | |
| | |
| | |
| | |
PNC Financial Services Group Inc. (The) | | |
Schedule of Investments41
Schedule of Investments (continued)March 31, 2024
iShares® Global Financials ETF(Percentages shown are based on Net Assets)
| | |
United States (continued) |
Principal Financial Group Inc. | | |
| | |
Prudential Financial Inc. | | |
Raymond James Financial Inc. | | |
| | |
| | |
| | |
| | |
| | |
Travelers Companies Inc. (The) | | |
| | |
| | |
| | |
| | |
| | |
| | |
| | |
Total Common Stocks — 98.6%
(Cost: $364,229,795) | |
|
|
Banco Bradesco SA, Preference Shares, ADR | | |
Itau Unibanco Holding SA, Preference Shares, ADR | | |
Itausa SA, Preference Shares, NVS | | |
| | |
Total Preferred Stocks — 0.6%
(Cost: $2,789,048) | |
Total Long-Term Investments — 99.2%
(Cost: $367,018,843) | |
| | |
|
Money Market Funds — 4.5% |
BlackRock Cash Funds: Institutional, SL Agency Shares, 5.50%(c)(e)(f) | | |
BlackRock Cash Funds: Treasury, SL Agency Shares, 5.29%(c)(e) | | |
Total Short-Term Securities — 4.5%
(Cost: $18,189,120) | |
Total Investments — 103.7%
(Cost: $385,207,963) | |
Liabilities in Excess of Other Assets — (3.7)% | |
| |
| Non-income producing security. |
| Security exempt from registration pursuant to Rule 144A under the Securities Act of 1933, as amended. These securities may be resold in transactions exempt from registration to qualified institutional investors. |
| |
| All or a portion of this security is on loan. |
| Annualized 7-day yield as of period end. |
| All or a portion of this security was purchased with the cash collateral from loaned securities. |
Affiliates
Investments in issuers considered to be affiliate(s) of the Fund during the year ended March 31, 2024 for purposes of Section 2(a)(3) of the Investment Company Act of 1940, as amended, were as follows:
| | | | | Change in
Unrealized
Appreciation
(Depreciation) | | | | Capital
Gain
Distributions
from
Underlying
Funds |
BlackRock Cash Funds: Institutional, SL Agency Shares | | | | | | | | | |
BlackRock Cash Funds: Treasury, SL Agency Shares | | | | | | | | | |
| | | | | | | | | |
| | | | | | | | | |
| Represents net amount purchased (sold). |
| All or a portion represents securities lending income earned from the reinvestment of cash collateral from loaned securities, net of fees and collateral investment expenses, and other payments to and from borrowers of securities. |
422024 iShares Annual Report to Shareholders
Schedule of Investments (continued)March 31, 2024
iShares® Global Financials ETF
Derivative Financial Instruments Outstanding as of Period End
Futures Contracts
| | | | Value/
Unrealized
Appreciation
(Depreciation) |
| | | | |
E-Mini Financial Select Sector Index | | | | |
| | | | |
| | | | |
| | | | |
Derivative Financial Instruments Categorized by Risk Exposure
As of period end, the fair values of derivative financial instruments located in the Statements of Assets and Liabilities were as follows:
| | | | Foreign
Currency
Exchange
Contracts | | | |
Assets—Derivative Financial Instruments | | | | | | | |
| | | | | | | |
Unrealized appreciation on futures contracts(a) | | | | | | | |
| Net cumulative unrealized appreciation (depreciation) on futures contracts are reported in the Schedule of Investments. In the Statements of Assets and Liabilities, only current day's variation margin is reported in receivables or payables and the net cumulative unrealized appreciation (depreciation) is included in accumulated earnings (loss). |
For the period ended March 31, 2024, the effect of derivative financial instruments in the Statements of Operations was as follows:
| | | | Foreign
Currency
Exchange
Contracts | | | |
Net Realized Gain (Loss) from | | | | | | | |
| | | | | | | |
Net Change in Unrealized Appreciation (Depreciation) on | | | | | | | |
| | | | | | | |
Average Quarterly Balances of Outstanding Derivative Financial Instruments
| |
Average notional value of contracts — long | |
For more information about the Fund’s investment risks regarding derivative financial instruments, refer to the Notes to Financial Statements.
Fair Value Hierarchy as of Period End
Various inputs are used in determining the fair value of financial instruments. For a description of the input levels and information about the Fund’s policy regarding valuation of financial instruments, refer to the Notes to Financial Statements.
The following table summarizes the Fund’s financial instruments categorized in the fair value hierarchy. The breakdown of the Fund’s financial instruments into major categories is disclosed in the Schedule of Investments above.
Schedule of Investments43
Schedule of Investments (continued)March 31, 2024
iShares® Global Financials ETF
Fair Value Hierarchy as of Period End (continued)
| | | | |
| | | | |
| | | | |
| | | | |
Derivative Financial Instruments(a) | | | | |
| | | | |
| | | | |
| Derivative financial instruments are futures contracts. Futures contracts are valued at the unrealized appreciation (depreciation) on the instrument. |
See notes to financial statements.
442024 iShares Annual Report to Shareholders
Schedule of InvestmentsMarch 31, 2024
iShares® Global Healthcare ETF(Percentages shown are based on Net Assets)
| | |
|
|
| | |
| | |
| | |
| | |
| | |
|
| | |
| | |
| | |
|
| | |
|
| | |
| | |
| | |
| | |
|
| | |
| | |
| | |
| | |
| | |
|
| | |
Fresenius Medical Care AG & Co. KGaA | | |
| | |
| | |
Siemens Healthineers AG(b) | | |
| | |
|
| | |
Chugai Pharmaceutical Co. Ltd. | | |
| | |
| | |
| | |
| | |
| | |
Ono Pharmaceutical Co. Ltd. | | |
| | |
| | |
| | |
Takeda Pharmaceutical Co. Ltd. | | |
| | |
| | |
|
Koninklijke Philips NV(a) | | |
| | |
| | |
|
| | |
|
| | |
|
| | |
|
| | |
| | |
|
Lonza Group AG, Registered | | |
| | |
| | |
| | |
| | |
Sonova Holding AG, Registered | | |
| | |
| | |
|
| | |
| | |
| | |
| | |
|
| | |
| | |
Agilent Technologies Inc. | | |
| | |
| | |
Baxter International Inc. | | |
| | |
| | |
Bio-Rad Laboratories Inc., Class A(a) | | |
| | |
Boston Scientific Corp.(a) | | |
| | |
| | |
| | |
| | |
| | |
Charles River Laboratories International Inc.(a) | | |
| | |
Cooper Companies Inc. (The) | | |
| | |
| | |
| | |
| | |
| | |
Edwards Lifesciences Corp.(a) | | |
| | |
| | |
GE HealthCare Technologies Inc., NVS(a) | | |
| | |
| | |
| | |
| | |
| | |
IDEXX Laboratories Inc.(a)(c) | | |
| | |
| | |
| | |
Intuitive Surgical Inc.(a) | | |
| | |
| | |
Laboratory Corp. of America Holdings | | |
| | |
| | |
| | |
Mettler-Toledo International Inc.(a) | | |
| | |
Molina Healthcare Inc.(a)(c) | | |
Schedule of Investments45
Schedule of Investments (continued)March 31, 2024
iShares® Global Healthcare ETF(Percentages shown are based on Net Assets)
| | |
United States (continued) |
| | |
| | |
Regeneron Pharmaceuticals Inc.(a) | | |
| | |
| | |
| | |
| | |
| | |
Thermo Fisher Scientific Inc. | | |
| | |
Universal Health Services Inc., Class B | | |
Vertex Pharmaceuticals Inc.(a) | | |
| | |
| | |
West Pharmaceutical Services Inc. | | |
Zimmer Biomet Holdings Inc. | | |
| | |
| | |
Total Common Stocks — 99.5%
(Cost: $3,432,675,777) | |
|
|
Sartorius AG, Preference Shares, NVS | | |
Total Preferred Stocks — 0.1%
(Cost: $5,207,009) | |
Total Long-Term Investments — 99.6%
(Cost: $3,437,882,786) | |
| | |
|
Money Market Funds — 0.6% |
BlackRock Cash Funds: Institutional, SL Agency Shares, 5.50%(d)(e)(f) | | |
BlackRock Cash Funds: Treasury, SL Agency Shares, 5.29%(d)(e) | | |
Total Short-Term Securities — 0.6%
(Cost: $23,020,398) | |
Total Investments — 100.2%
(Cost: $3,460,903,184) | |
Liabilities in Excess of Other Assets — (0.2)% | |
| |
| Non-income producing security. |
| Security exempt from registration pursuant to Rule 144A under the Securities Act of 1933, as amended. These securities may be resold in transactions exempt from registration to qualified institutional investors. |
| All or a portion of this security is on loan. |
| |
| Annualized 7-day yield as of period end. |
| All or a portion of this security was purchased with the cash collateral from loaned securities. |
Affiliates
Investments in issuers considered to be affiliate(s) of the Fund during the year ended March 31, 2024 for purposes of Section 2(a)(3) of the Investment Company Act of 1940, as amended, were as follows:
| | | | | Change in
Unrealized
Appreciation
(Depreciation) | | | | Capital
Gain
Distributions
from
Underlying
Funds |
BlackRock Cash Funds: Institutional, SL Agency Shares | | | | | | | | | |
BlackRock Cash Funds: Treasury, SL Agency Shares | | | | | | | | | |
| | | | | | | | | |
| Represents net amount purchased (sold). |
| All or a portion represents securities lending income earned from the reinvestment of cash collateral from loaned securities, net of fees and collateral investment expenses, and other payments to and from borrowers of securities. |
462024 iShares Annual Report to Shareholders
Schedule of Investments (continued)March 31, 2024
iShares® Global Healthcare ETF
Derivative Financial Instruments Outstanding as of Period End
Futures Contracts
| | | | Value/
Unrealized
Appreciation
(Depreciation) |
| | | | |
E-Mini Health Care Select Sector Index | | | | |
Derivative Financial Instruments Categorized by Risk Exposure
As of period end, the fair values of derivative financial instruments located in the Statements of Assets and Liabilities were as follows:
| | | | Foreign
Currency
Exchange
Contracts | | | |
Assets—Derivative Financial Instruments | | | | | | | |
| | | | | | | |
Unrealized appreciation on futures contracts(a) | | | | | | | |
| Net cumulative unrealized appreciation (depreciation) on futures contracts are reported in the Schedule of Investments. In the Statements of Assets and Liabilities, only current day's variation margin is reported in receivables or payables and the net cumulative unrealized appreciation (depreciation) is included in accumulated earnings (loss). |
For the period ended March 31, 2024, the effect of derivative financial instruments in the Statements of Operations was as follows:
| | | | Foreign
Currency
Exchange
Contracts | | | |
Net Realized Gain (Loss) from | | | | | | | |
| | | | | | | |
Net Change in Unrealized Appreciation (Depreciation) on | | | | | | | |
| | | | | | | |
Average Quarterly Balances of Outstanding Derivative Financial Instruments
| |
Average notional value of contracts — long | |
For more information about the Fund’s investment risks regarding derivative financial instruments, refer to the Notes to Financial Statements.
Fair Value Hierarchy as of Period End
Various inputs are used in determining the fair value of financial instruments. For a description of the input levels and information about the Fund’s policy regarding valuation of financial instruments, refer to the Notes to Financial Statements.
The following table summarizes the Fund’s financial instruments categorized in the fair value hierarchy. The breakdown of the Fund’s financial instruments into major categories is disclosed in the Schedule of Investments above.
Schedule of Investments47
Schedule of Investments (continued)March 31, 2024
iShares® Global Healthcare ETF
Fair Value Hierarchy as of Period End (continued)
| | | | |
Derivative Financial Instruments(a) | | | | |
| | | | |
| | | | |
| Derivative financial instruments are futures contracts. Futures contracts are valued at the unrealized appreciation (depreciation) on the instrument. |
See notes to financial statements.
482024 iShares Annual Report to Shareholders
Schedule of InvestmentsMarch 31, 2024
iShares® Global Industrials ETF(Percentages shown are based on Net Assets)
| | |
|
|
| | |
| | |
| | |
| | |
| | |
|
| | |
| | |
| | |
| | |
|
| | |
Canadian National Railway Co. | | |
Canadian Pacific Kansas City Ltd. | | |
| | |
| | |
| | |
| | |
|
Sociedad Quimica y Minera de Chile SA, ADR(b) | | |
|
AP Moller - Maersk A/S, Class A | | |
AP Moller - Maersk A/S, Class B, NVS | | |
| | |
Vestas Wind Systems A/S(a) | | |
| | |
|
| | |
| | |
| | |
| | |
|
| | |
| | |
| | |
| | |
| | |
| | |
| | |
| | |
| | |
| | |
| | |
| | |
| | |
| | |
|
| | |
| | |
Deutsche Post AG, Registered | | |
| | |
| | |
| | |
| | |
| | |
| | |
|
CK Hutchison Holdings Ltd. | | |
| | |
|
Techtronic Industries Co. Ltd. | | |
| | |
|
| | |
Ryanair Holdings PLC, ADR(b) | | |
| | |
|
| | |
|
| | |
| | |
Central Japan Railway Co. | | |
Dai Nippon Printing Co. Ltd. | | |
| | |
| | |
| | |
| | |
Hankyu Hanshin Holdings Inc. | | |
| | |
| | |
| | |
| | |
Kintetsu Group Holdings Co. Ltd. | | |
| | |
| | |
| | |
| | |
| | |
Mitsubishi Electric Corp. | | |
Mitsubishi Heavy Industries Ltd. | | |
| | |
| | |
| | |
| | |
| | |
Odakyu Electric Railway Co. Ltd. | | |
Recruit Holdings Co. Ltd. | | |
| | |
| | |
| | |
| | |
| | |
| | |
| | |
| | |
| | |
| | |
| | |
| | |
| | |
|
| | |
| | |
| | |
| | |
| | |
|
| | |
|
ACS Actividades de Construccion y Servicios SA | | |
Schedule of Investments49
Schedule of Investments (continued)March 31, 2024
iShares® Global Industrials ETF(Percentages shown are based on Net Assets)
| | |
|
| | |
| | |
|
| | |
| | |
| | |
| | |
| | |
| | |
Nibe Industrier AB, Class B | | |
| | |
| | |
| | |
| | |
| | |
| | |
|
| | |
Adecco Group AG, Registered | | |
| | |
Kuehne + Nagel International AG, Registered | | |
Schindler Holding AG, Participation Certificates, NVS | | |
Schindler Holding AG, Registered | | |
| | |
| | |
| | |
|
| | |
| | |
| | |
| | |
| | |
| | |
| | |
| | |
| | |
| | |
Rolls-Royce Holdings PLC(a) | | |
| | |
Spirax-Sarco Engineering PLC | | |
| | |
| | |
|
| | |
| | |
| | |
American Airlines Group Inc.(a)(b) | | |
| | |
Automatic Data Processing Inc. | | |
| | |
| | |
Broadridge Financial Solutions Inc. | | |
Builders FirstSource Inc.(a) | | |
| | |
| | |
CH Robinson Worldwide Inc. | | |
| | |
| | |
| | |
| | |
| | |
| | |
United States (continued) |
| | |
| | |
| | |
| | |
| | |
| | |
Expeditors International of Washington Inc. | | |
| | |
| | |
| | |
Generac Holdings Inc.(a)(b) | | |
| | |
| | |
Honeywell International Inc. | | |
| | |
| | |
Huntington Ingalls Industries Inc. | | |
| | |
| | |
| | |
Jacobs Solutions Inc., NVS | | |
JB Hunt Transport Services Inc. | | |
Johnson Controls International PLC | | |
L3Harris Technologies Inc. | | |
| | |
| | |
| | |
| | |
| | |
| | |
Old Dominion Freight Line Inc. | | |
| | |
| | |
| | |
| | |
| | |
| | |
| | |
Republic Services Inc., Class A | | |
| | |
| | |
| | |
| | |
| | |
| | |
Stanley Black & Decker Inc. | | |
| | |
| | |
| | |
Uber Technologies Inc.(a) | | |
| | |
United Airlines Holdings Inc.(a) | | |
United Parcel Service Inc., Class B | | |
| | |
| | |
Verisk Analytics Inc., Class A | | |
| | |
Westinghouse Air Brake Technologies Corp. | | |
| | |
502024 iShares Annual Report to Shareholders
Schedule of Investments (continued)March 31, 2024
iShares® Global Industrials ETF(Percentages shown are based on Net Assets)
| | |
United States (continued) |
| | |
| | |
Total Long-Term Investments — 99.5%
(Cost: $509,754,645) | |
|
Money Market Funds — 0.5% |
BlackRock Cash Funds: Institutional, SL Agency Shares, 5.50%(d)(e)(f) | | |
BlackRock Cash Funds: Treasury, SL Agency Shares, 5.29%(d)(e) | | |
Total Short-Term Securities — 0.5%
(Cost: $3,245,769) | |
Total Investments — 100.0%
(Cost: $513,000,414) | |
Liabilities in Excess of Other Assets — (0.0)% | |
| |
| Non-income producing security. |
| All or a portion of this security is on loan. |
| Security exempt from registration pursuant to Rule 144A under the Securities Act of 1933, as amended. These securities may be resold in transactions exempt from registration to qualified institutional investors. |
| |
| Annualized 7-day yield as of period end. |
| All or a portion of this security was purchased with the cash collateral from loaned securities. |
Affiliates
Investments in issuers considered to be affiliate(s) of the Fund during the year ended March 31, 2024 for purposes of Section 2(a)(3) of the Investment Company Act of 1940, as amended, were as follows:
| | | | | Change in
Unrealized
Appreciation
(Depreciation) | | | | Capital
Gain
Distributions
from
Underlying
Funds |
BlackRock Cash Funds: Institutional, SL Agency Shares | | | | | | | | | |
BlackRock Cash Funds: Treasury, SL Agency Shares | | | | | | | | | |
| | | | | | | | | |
| Represents net amount purchased (sold). |
| All or a portion represents securities lending income earned from the reinvestment of cash collateral from loaned securities, net of fees and collateral investment expenses, and other payments to and from borrowers of securities. |
Derivative Financial Instruments Outstanding as of Period End
Futures Contracts
| | | | Value/
Unrealized
Appreciation
(Depreciation) |
| | | | |
| | | | |
| | | | |
Schedule of Investments51
Schedule of Investments (continued)March 31, 2024
iShares® Global Industrials ETF
Futures Contracts (continued)
| | | | Value/ Unrealized Appreciation (Depreciation) |
| | | | |
| | | | |
Derivative Financial Instruments Categorized by Risk Exposure
As of period end, the fair values of derivative financial instruments located in the Statements of Assets and Liabilities were as follows:
| | | | Foreign
Currency
Exchange
Contracts | | | |
Assets—Derivative Financial Instruments | | | | | | | |
| | | | | | | |
Unrealized appreciation on futures contracts(a) | | | | | | | |
| Net cumulative unrealized appreciation (depreciation) on futures contracts are reported in the Schedule of Investments. In the Statements of Assets and Liabilities, only current day's variation margin is reported in receivables or payables and the net cumulative unrealized appreciation (depreciation) is included in accumulated earnings (loss). |
For the period ended March 31, 2024, the effect of derivative financial instruments in the Statements of Operations was as follows:
| | | | Foreign
Currency
Exchange
Contracts | | | |
Net Realized Gain (Loss) from | | | | | | | |
| | | | | | | |
Net Change in Unrealized Appreciation (Depreciation) on | | | | | | | |
| | | | | | | |
Average Quarterly Balances of Outstanding Derivative Financial Instruments
| |
Average notional value of contracts — long | |
For more information about the Fund’s investment risks regarding derivative financial instruments, refer to the Notes to Financial Statements.
Fair Value Hierarchy as of Period End
Various inputs are used in determining the fair value of financial instruments. For a description of the input levels and information about the Fund’s policy regarding valuation of financial instruments, refer to the Notes to Financial Statements.
The following table summarizes the Fund’s financial instruments categorized in the fair value hierarchy. The breakdown of the Fund’s financial instruments into major categories is disclosed in the Schedule of Investments above.
522024 iShares Annual Report to Shareholders
Schedule of Investments (continued)March 31, 2024
iShares® Global Industrials ETF
Fair Value Hierarchy as of Period End (continued)
| | | | |
Derivative Financial Instruments(a) | | | | |
| | | | |
| | | | |
| Derivative financial instruments are futures contracts. Futures contracts are valued at the unrealized appreciation (depreciation) on the instrument. |
See notes to financial statements.
Schedule of Investments53
Schedule of InvestmentsMarch 31, 2024
iShares® Global Materials ETF(Percentages shown are based on Net Assets)
| | |
|
|
| | |
| | |
| | |
James Hardie Industries PLC(a) | | |
| | |
Northern Star Resources Ltd. | | |
| | |
| | |
| | |
| | |
|
| | |
| | |
| | |
|
| | |
|
| | |
| | |
CCL Industries Inc., Class B, NVS | | |
First Quantum Minerals Ltd. | | |
| | |
| | |
| | |
Teck Resources Ltd., Class B | | |
Wheaton Precious Metals Corp. | | |
| | |
|
| | |
|
Novonesis A/S (Novozymes A/S), Class B | | |
|
| | |
| | |
| | |
|
| | |
| | |
| | |
| | |
|
| | |
| | |
| | |
| | |
| | |
|
| | |
| | |
| | |
|
| | |
| | |
Mitsubishi Chemical Group Corp. | | |
Nippon Paint Holdings Co. Ltd. | | |
| | |
| | |
| | |
|
Shin-Etsu Chemical Co. Ltd. | | |
Sumitomo Chemical Co. Ltd. | | |
Sumitomo Metal Mining Co. Ltd. | | |
| | |
| | |
|
| | |
Grupo Mexico SAB de CV, Series B | | |
| | |
|
| | |
|
| | |
| | |
| | |
|
| | |
|
| | |
| | |
| | |
|
| | |
| | |
Svenska Cellulosa AB SCA, Class B | | |
| | |
|
| | |
| | |
| | |
| | |
| | |
| | |
|
| | |
|
| | |
| | |
| | |
| | |
| | |
| | |
| | |
| | |
| | |
|
Air Products and Chemicals Inc. | | |
| | |
| | |
| | |
| | |
| | |
CF Industries Holdings Inc. | | |
| | |
| | |
| | |
| | |
| | |
542024 iShares Annual Report to Shareholders
Schedule of Investments (continued)March 31, 2024
iShares® Global Materials ETF(Percentages shown are based on Net Assets)
| | |
United States (continued) |
| | |
| | |
International Flavors & Fragrances Inc. | | |
| | |
| | |
LyondellBasell Industries NV, Class A | | |
Martin Marietta Materials Inc.(b) | | |
| | |
| | |
| | |
Packaging Corp. of America | | |
| | |
Sherwin-Williams Co. (The) | | |
| | |
| | |
| | |
| | |
Total Common Stocks — 98.8%
(Cost: $278,753,956) | |
|
|
Gerdau SA, Preference Shares, ADR | | |
|
LG Chem Ltd., Preference Shares, NVS | | |
Total Preferred Stocks — 0.3%
(Cost: $1,289,795) | |
Total Long-Term Investments — 99.1%
(Cost: $280,043,751) | |
| | |
|
Money Market Funds — 0.6% |
BlackRock Cash Funds: Institutional, SL Agency Shares, 5.50%(d)(e)(f) | | |
BlackRock Cash Funds: Treasury, SL Agency Shares, 5.29%(d)(e) | | |
Total Short-Term Securities — 0.6%
(Cost: $1,554,806) | |
Total Investments — 99.7%
(Cost: $281,598,557) | |
Other Assets Less Liabilities — 0.3% | |
| |
| Non-income producing security. |
| All or a portion of this security is on loan. |
| Security exempt from registration pursuant to Rule 144A under the Securities Act of 1933, as amended. These securities may be resold in transactions exempt from registration to qualified institutional investors. |
| |
| Annualized 7-day yield as of period end. |
| All or a portion of this security was purchased with the cash collateral from loaned securities. |
Affiliates
Investments in issuers considered to be affiliate(s) of the Fund during the year ended March 31, 2024 for purposes of Section 2(a)(3) of the Investment Company Act of 1940, as amended, were as follows:
| | | | | Change in
Unrealized
Appreciation
(Depreciation) | | | | Capital
Gain
Distributions
from
Underlying
Funds |
BlackRock Cash Funds: Institutional, SL Agency Shares | | | | | | | | | |
BlackRock Cash Funds: Treasury, SL Agency Shares | | | | | | | | | |
| | | | | | | | | |
| Represents net amount purchased (sold). |
| All or a portion represents securities lending income earned from the reinvestment of cash collateral from loaned securities, net of fees and collateral investment expenses, and other payments to and from borrowers of securities. |
Schedule of Investments55
Schedule of Investments (continued)March 31, 2024
iShares® Global Materials ETF
Derivative Financial Instruments Outstanding as of Period End
Futures Contracts
| | | | Value/
Unrealized
Appreciation
(Depreciation) |
| | | | |
| | | | |
| | | | |
MSCI Emerging Markets Index | | | | |
| | | | |
| | | | |
Derivative Financial Instruments Categorized by Risk Exposure
As of period end, the fair values of derivative financial instruments located in the Statements of Assets and Liabilities were as follows:
| | | | Foreign
Currency
Exchange
Contracts | | | |
Assets—Derivative Financial Instruments | | | | | | | |
| | | | | | | |
Unrealized appreciation on futures contracts(a) | | | | | | | |
Liabilities—Derivative Financial Instruments | | | | | | | |
| | | | | | | |
Unrealized depreciation on futures contracts(a) | | | | | | | |
| Net cumulative unrealized appreciation (depreciation) on futures contracts are reported in the Schedule of Investments. In the Statements of Assets and Liabilities, only current day's variation margin is reported in receivables or payables and the net cumulative unrealized appreciation (depreciation) is included in accumulated earnings (loss). |
For the period ended March 31, 2024, the effect of derivative financial instruments in the Statements of Operations was as follows:
| | | | Foreign
Currency
Exchange
Contracts | | | |
Net Realized Gain (Loss) from | | | | | | | |
| | | | | | | |
Net Change in Unrealized Appreciation (Depreciation) on | | | | | | | |
| | | | | | | |
Average Quarterly Balances of Outstanding Derivative Financial Instruments
| |
Average notional value of contracts — long | |
For more information about the Fund’s investment risks regarding derivative financial instruments, refer to the Notes to Financial Statements.
562024 iShares Annual Report to Shareholders
Schedule of Investments (continued)March 31, 2024
iShares® Global Materials ETF
Fair Value Hierarchy as of Period End
Various inputs are used in determining the fair value of financial instruments. For a description of the input levels and information about the Fund’s policy regarding valuation of financial instruments, refer to the Notes to Financial Statements.
The following table summarizes the Fund’s financial instruments categorized in the fair value hierarchy. The breakdown of the Fund’s financial instruments into major categories is disclosed in the Schedule of Investments above.
| | | | |
| | | | |
| | | | |
| | | | |
| | | | |
| | | | |
| | | | |
| | | | |
| | | | |
Derivative Financial Instruments(a) | | | | |
| | | | |
| | | | |
| | | | |
| | | | |
| | | | |
| Derivative financial instruments are futures contracts. Futures contracts are valued at the unrealized appreciation (depreciation) on the instrument. |
See notes to financial statements.
Schedule of Investments57
Schedule of InvestmentsMarch 31, 2024
iShares® Global Tech ETF(Percentages shown are based on Net Assets)
| | |
|
|
| | |
| | |
| | |
|
| | |
Constellation Software Inc./Canada | | |
| | |
| | |
| | |
|
Xiaomi Corp., Class B(a)(b) | | |
|
| | |
|
| | |
| | |
| | |
|
| | |
| | |
| | |
|
| | |
| | |
| | |
| | |
| | |
| | |
| | |
| | |
Murata Manufacturing Co. Ltd. | | |
| | |
Nomura Research Institute Ltd. | | |
| | |
| | |
| | |
Renesas Electronics Corp. | | |
| | |
| | |
| | |
| | |
| | |
|
| | |
| | |
BE Semiconductor Industries NV | | |
| | |
|
STMicroelectronics NV , New(c) | | |
|
Samsung Electronics Co. Ltd. | | |
| | |
| | |
| | |
|
| | |
| | |
|
Telefonaktiebolaget LM Ericsson, Class B | | |
| | |
|
Logitech International SA, Registered | | |
| | |
| | |
|
| | |
Hon Hai Precision Industry Co. Ltd. | | |
| | |
| | |
Taiwan Semiconductor Manufacturing Co. Ltd. | | |
United Microelectronics Corp. | | |
| | |
|
| | |
| | |
| | |
|
| | |
| | |
Advanced Micro Devices Inc.(a) | | |
Akamai Technologies Inc.(a) | | |
| | |
| | |
| | |
| | |
| | |
Arista Networks Inc.(a)(c) | | |
| | |
| | |
Cadence Design Systems Inc.(a) | | |
| | |
| | |
Cognizant Technology Solutions Corp., Class A | | |
| | |
Enphase Energy Inc.(a)(c) | | |
| | |
| | |
| | |
| | |
| | |
| | |
| | |
Hewlett Packard Enterprise Co. | | |
| | |
| | |
International Business Machines Corp. | | |
| | |
| | |
| | |
Keysight Technologies Inc.(a)(c) | | |
| | |
| | |
Microchip Technology Inc. | | |
| | |
| | |
Monolithic Power Systems Inc. | | |
| | |
| | |
| | |
582024 iShares Annual Report to Shareholders
Schedule of Investments (continued)March 31, 2024
iShares® Global Tech ETF(Percentages shown are based on Net Assets)
| | |
United States (continued) |
| | |
ON Semiconductor Corp.(a)(c) | | |
| | |
Palo Alto Networks Inc.(a)(c) | | |
| | |
| | |
| | |
| | |
| | |
Seagate Technology Holdings PLC | | |
| | |
| | |
Super Micro Computer Inc.(a) | | |
| | |
| | |
Teledyne Technologies Inc.(a) | | |
| | |
| | |
| | |
Tyler Technologies Inc.(a) | | |
| | |
| | |
Zebra Technologies Corp., Class A(a) | | |
| | |
Total Common Stocks — 99.3%
(Cost: $3,032,206,738) | |
|
|
Samsung Electronics Co. Ltd., Preference Shares, NVS | | |
Total Preferred Stocks — 0.3%
(Cost: $8,751,782) | |
|
|
Constellation Software Inc., Issued 08/29/23, 1 Share for 1 Warrant, Expires 03/31/40, Strike Price CAD )(d) | | |
Total Warrants — 0.0%
(Cost: $—) | |
Total Long-Term Investments — 99.6%
(Cost: $3,040,958,520) | |
| | |
|
Money Market Funds — 0.6% |
BlackRock Cash Funds: Institutional, SL Agency Shares, 5.50%(e)(f)(g) | | |
BlackRock Cash Funds: Treasury, SL Agency Shares, 5.29%(e)(f) | | |
Total Short-Term Securities — 0.6%
(Cost: $30,588,297) | |
Total Investments — 100.2%
(Cost: $3,071,546,817) | |
Liabilities in Excess of Other Assets — (0.2)% | |
| |
| Non-income producing security. |
| Security exempt from registration pursuant to Rule 144A under the Securities Act of 1933, as amended. These securities may be resold in transactions exempt from registration to qualified institutional investors. |
| All or a portion of this security is on loan. |
| Security is valued using significant unobservable inputs and is classified as Level 3 in the fair value hierarchy. |
| |
| Annualized 7-day yield as of period end. |
| All or a portion of this security was purchased with the cash collateral from loaned securities. |
Schedule of Investments59
Schedule of Investments (continued)March 31, 2024
Affiliates
Investments in issuers considered to be affiliate(s) of the Fund during the year ended March 31, 2024 for purposes of Section 2(a)(3) of the Investment Company Act of 1940, as amended, were as follows:
| | | | | Change in
Unrealized
Appreciation
(Depreciation) | | | | Capital
Gain
Distributions
from
Underlying
Funds |
BlackRock Cash Funds: Institutional, SL Agency Shares | | | | | | | | | |
BlackRock Cash Funds: Treasury, SL Agency Shares | | | | | | | | | |
| | | | | | | | | |
| Represents net amount purchased (sold). |
| All or a portion represents securities lending income earned from the reinvestment of cash collateral from loaned securities, net of fees and collateral investment expenses, and other payments to and from borrowers of securities. |
Derivative Financial Instruments Outstanding as of Period End
Futures Contracts
| | | | Value/
Unrealized
Appreciation
(Depreciation) |
| | | | |
E-Mini Technology Select Sector Index | | | | |
Derivative Financial Instruments Categorized by Risk Exposure
As of period end, the fair values of derivative financial instruments located in the Statements of Assets and Liabilities were as follows:
| | | | Foreign
Currency
Exchange
Contracts | | | |
Assets—Derivative Financial Instruments | | | | | | | |
| | | | | | | |
Unrealized appreciation on futures contracts(a) | | | | | | | |
| Net cumulative unrealized appreciation (depreciation) on futures contracts are reported in the Schedule of Investments. In the Statements of Assets and Liabilities, only current day's variation margin is reported in receivables or payables and the net cumulative unrealized appreciation (depreciation) is included in accumulated earnings (loss). |
For the period ended March 31, 2024, the effect of derivative financial instruments in the Statements of Operations was as follows:
| | | | Foreign
Currency
Exchange
Contracts | | | |
Net Realized Gain (Loss) from | | | | | | | |
| | | | | | | |
Net Change in Unrealized Appreciation (Depreciation) on | | | | | | | |
| | | | | | | |
Average Quarterly Balances of Outstanding Derivative Financial Instruments
| |
Average notional value of contracts — long | |
For more information about the Fund’s investment risks regarding derivative financial instruments, refer to the Notes to Financial Statements.
602024 iShares Annual Report to Shareholders
Schedule of Investments (continued)March 31, 2024
Fair Value Hierarchy as of Period End
Various inputs are used in determining the fair value of financial instruments. For a description of the input levels and information about the Fund’s policy regarding valuation of financial instruments, refer to the Notes to Financial Statements.
The following table summarizes the Fund’s financial instruments categorized in the fair value hierarchy. The breakdown of the Fund’s financial instruments into major categories is disclosed in the Schedule of Investments above.
| | | | |
| | | | |
| | | | |
| | | | |
| | | | |
| | | | |
| | | | |
| | | | |
| | | | |
| | | | |
Derivative Financial Instruments(a) | | | | |
| | | | |
| | | | |
| Derivative financial instruments are futures contracts. Futures contracts are valued at the unrealized appreciation (depreciation) on the instrument. |
See notes to financial statements.
Schedule of Investments61
Schedule of InvestmentsMarch 31, 2024
iShares® Global Utilities ETF(Percentages shown are based on Net Assets)
| | |
|
|
| | |
| | |
| | |
|
| | |
|
Centrais Eletricas Brasileiras SA | | |
|
Algonquin Power & Utilities Corp. | | |
Brookfield Infrastructure Partners LP(a) | | |
| | |
| | |
| | |
| | |
|
| | |
|
Interconexion Electrica SA ESP | | |
|
| | |
|
| | |
|
| | |
| | |
| | |
|
| | |
| | |
| | |
|
| | |
| | |
Terna - Rete Elettrica Nazionale | | |
| | |
|
Chubu Electric Power Co. Inc. | | |
Kansai Electric Power Co. Inc. (The) | | |
| | |
| | |
| | |
|
EDP - Energias de Portugal SA | | |
|
| | |
| | |
| | |
| | |
| | |
| | |
|
| | |
| | |
| | |
United Kingdom (continued) |
| | |
| | |
United Utilities Group PLC | | |
| | |
|
| | |
| | |
| | |
American Electric Power Co. Inc. | | |
American Water Works Co. Inc. | | |
| | |
| | |
| | |
| | |
Constellation Energy Corp. | | |
| | |
| | |
| | |
| | |
| | |
| | |
| | |
| | |
| | |
| | |
| | |
| | |
| | |
Pinnacle West Capital Corp. | | |
| | |
Public Service Enterprise Group Inc. | | |
| | |
| | |
| | |
| | |
| | |
Total Long-Term Investments — 99.5%
(Cost: $143,060,278) | |
|
Money Market Funds — 0.7% |
BlackRock Cash Funds: Treasury, SL Agency Shares, 5.29%(c)(d) | | |
Total Short-Term Securities — 0.7%
(Cost: $870,000) | |
Total Investments — 100.2%
(Cost: $143,930,278) | |
Liabilities in Excess of Other Assets — (0.2)% | |
| |
| Non-income producing security. |
| Security exempt from registration pursuant to Rule 144A under the Securities Act of 1933, as amended. These securities may be resold in transactions exempt from registration to qualified institutional investors. |
| |
| Annualized 7-day yield as of period end. |
622024 iShares Annual Report to Shareholders
Schedule of Investments (continued)March 31, 2024
iShares® Global Utilities ETF
Affiliates
Investments in issuers considered to be affiliate(s) of the Fund during the year ended March 31, 2024 for purposes of Section 2(a)(3) of the Investment Company Act of 1940, as amended, were as follows:
| | | | | Change in
Unrealized
Appreciation
(Depreciation) | | | | Capital
Gain
Distributions
from
Underlying
Funds |
BlackRock Cash Funds: Institutional, SL Agency Shares(a) | | | | | | | | | |
BlackRock Cash Funds: Treasury, SL Agency Shares | | | | | | | | | |
| | | | | | | | | |
| As of period end, the entity is no longer held. |
| Represents net amount purchased (sold). |
| All or a portion represents securities lending income earned from the reinvestment of cash collateral from loaned securities, net of fees and collateral investment expenses, and other payments to and from borrowers of securities. |
Derivative Financial Instruments Outstanding as of Period End
Futures Contracts
| | | | Value/
Unrealized
Appreciation
(Depreciation) |
| | | | |
E-Mini Utiliites Select Sector Index | | | | |
| | | | |
| | | | |
Derivative Financial Instruments Categorized by Risk Exposure
As of period end, the fair values of derivative financial instruments located in the Statements of Assets and Liabilities were as follows:
| | | | Foreign
Currency
Exchange
Contracts | | | |
Assets—Derivative Financial Instruments | | | | | | | |
| | | | | | | |
Unrealized appreciation on futures contracts(a) | | | | | | | |
| Net cumulative unrealized appreciation (depreciation) on futures contracts are reported in the Schedule of Investments. In the Statements of Assets and Liabilities, only current day's variation margin is reported in receivables or payables and the net cumulative unrealized appreciation (depreciation) is included in accumulated earnings (loss). |
For the period ended March 31, 2024, the effect of derivative financial instruments in the Statements of Operations was as follows:
| | | | Foreign
Currency
Exchange
Contracts | | | |
Net Realized Gain (Loss) from | | | | | | | |
| | | | | | | |
Net Change in Unrealized Appreciation (Depreciation) on | | | | | | | |
| | | | | | | |
Schedule of Investments63
Schedule of Investments (continued)March 31, 2024
iShares® Global Utilities ETF
Average Quarterly Balances of Outstanding Derivative Financial Instruments
| |
Average notional value of contracts — long | |
For more information about the Fund’s investment risks regarding derivative financial instruments, refer to the Notes to Financial Statements.
Fair Value Hierarchy as of Period End
Various inputs are used in determining the fair value of financial instruments. For a description of the input levels and information about the Fund’s policy regarding valuation of financial instruments, refer to the Notes to Financial Statements.
The following table summarizes the Fund’s financial instruments categorized in the fair value hierarchy. The breakdown of the Fund’s financial instruments into major categories is disclosed in the Schedule of Investments above.
| | | | |
| | | | |
| | | | |
| | | | |
| | | | |
| | | | |
| | | | |
| | | | |
Derivative Financial Instruments(a) | | | | |
| | | | |
| | | | |
| Derivative financial instruments are futures contracts. Futures contracts are valued at the unrealized appreciation (depreciation) on the instrument. |
See notes to financial statements.
642024 iShares Annual Report to Shareholders
Statements of Assets and LiabilitiesMarch 31, 2024
| iShares
Global Comm Services ETF | iShares
Global Consumer Discretionary ETF | iShares
Global Consumer Staples ETF | |
| | | | |
Investments, at value—unaffiliated(a)(b) | | | | |
Investments, at value—affiliated(c) | | | | |
| | | | |
Cash pledged for futures contracts | | | | |
Foreign currency collateral pledged for futures contracts(d) | | | | |
Foreign currency, at value(e) | | | | |
| | | | |
| | | | |
Securities lending income—affiliated | | | | |
| | | | |
| | | | |
| | | | |
| | | | |
Variation margin on futures contracts | | | | |
| | | | |
| | | | |
Collateral on securities loaned, at value | | | | |
| | | | |
| | | | |
| | | | |
IRS compliance fee for foreign withholding tax claims | | | | |
| | | | |
Variation margin on futures contracts | | | | |
| | | | |
Commitments and contingent liabilities | | | | |
| | | | |
| | | | |
| | | | |
Accumulated earnings (loss) | | | | |
| | | | |
| | | | |
| | | | |
| | | | |
| | | | |
| | | | |
(a) Investments, at cost—unaffiliated | | | | |
(b) Securities loaned, at value | | | | |
(c) Investments, at cost—affiliated | | | | |
(d) Foreign currency collateral pledged, at cost | | | | |
(e) Foreign currency, at cost | | | | |
See notes to financial statements.
Statements of Assets and Liabilities (continued)March 31, 2024
| iShares
Global Financials ETF | iShares
Global Healthcare ETF | iShares
Global Industrials ETF | iShares
Global Materials ETF |
| | | | |
Investments, at value—unaffiliated(a)(b) | | | | |
Investments, at value—affiliated(c) | | | | |
| | | | |
Cash pledged for futures contracts | | | | |
Foreign currency collateral pledged for futures contracts(d) | | | | |
Foreign currency, at value(e) | | | | |
| | | | |
| | | | |
Securities lending income—affiliated | | | | |
| | | | |
| | | | |
| | | | |
| | | | |
Variation margin on futures contracts | | | | |
| | | | |
| | | | |
Collateral on securities loaned, at value | | | | |
| | | | |
| | | | |
| | | | |
| | | | |
IRS compliance fee for foreign withholding tax claims | | | | |
| | | | |
| | | | |
Commitments and contingent liabilities | | | | |
| | | | |
| | | | |
| | | | |
Accumulated earnings (loss) | | | | |
| | | | |
| | | | |
| | | | |
| | | | |
| | | | |
| | | | |
(a) Investments, at cost—unaffiliated | | | | |
(b) Securities loaned, at value | | | | |
(c) Investments, at cost—affiliated | | | | |
(d) Foreign currency collateral pledged, at cost | | | | |
(e) Foreign currency, at cost | | | | |
See notes to financial statements.
662024 iShares Annual Report to Shareholders
Statements of Assets and Liabilities (continued)March 31, 2024
| | iShares
Global Utilities ETF |
| | |
Investments, at value—unaffiliated(a)(b) | | |
Investments, at value—affiliated(c) | | |
| | |
Cash pledged for futures contracts | | |
Foreign currency collateral pledged for futures contracts(d) | | |
Foreign currency, at value(e) | | |
| | |
Securities lending income—affiliated | | |
| | |
| | |
| | |
| | |
Variation margin on futures contracts | | |
| | |
| | |
| | |
Collateral on securities loaned, at value | | |
| | |
| | |
| | |
IRS compliance fee for foreign withholding tax claims | | |
| | |
Variation margin on futures contracts | | |
| | |
Commitments and contingent liabilities | | |
| | |
| | |
| | |
Accumulated earnings (loss) | | |
| | |
| | |
| | |
| | |
| | |
| | |
(a) Investments, at cost—unaffiliated | | |
(b) Securities loaned, at value | | |
(c) Investments, at cost—affiliated | | |
(d) Foreign currency collateral pledged, at cost | | |
(e) Foreign currency, at cost | | |
See notes to financial statements.
Statements of OperationsYear Ended March 31, 2024
| iShares
Global Comm Services ETF | iShares
Global Consumer Discretionary ETF | iShares
Global Consumer Staples ETF | |
| | | | |
| | | | |
| | | | |
| | | | |
Securities lending income—affiliated—net | | | | |
Other income—unaffiliated | | | | |
| | | | |
Foreign withholding tax claims | | | | |
IRS compliance fee for foreign withholding tax claims | | | | |
| | | | |
| | | | |
| | | | |
| | | | |
| | | | |
| | | | |
| | | | |
REALIZED AND UNREALIZED GAIN (LOSS) | | | | |
Net realized gain (loss) from: | | | | |
| | | | |
| | | | |
Foreign currency transactions | | | | |
| | | | |
In-kind redemptions—unaffiliated(a) | | | | |
| | | | |
Net change in unrealized appreciation (depreciation) on: | | | | |
| | | | |
| | | | |
Foreign currency translations | | | | |
| | | | |
| | | | |
Net realized and unrealized gain (loss) | | | | |
NET INCREASE (DECREASE) IN NET ASSETS RESULTING FROM OPERATIONS | | | | |
(a) See Note 2 of the Notes to Financial Statements. |
See notes to financial statements.
682024 iShares Annual Report to Shareholders
Statements of Operations (continued)Year Ended March 31, 2024
| iShares
Global Financials ETF | iShares
Global Healthcare ETF | iShares
Global Industrials ETF | iShares
Global Materials ETF |
| | | | |
| | | | |
| | | | |
| | | | |
Securities lending income—affiliated—net | | | | |
Other income—unaffiliated | | | | |
| | | | |
Foreign withholding tax claims | | | | |
IRS compliance fee for foreign withholding tax claims | | | | |
| | | | |
| | | | |
| | | | |
| | | | |
| | | | |
| | | | |
| | | | |
REALIZED AND UNREALIZED GAIN (LOSS) | | | | |
Net realized gain (loss) from: | | | | |
| | | | |
| | | | |
Foreign currency transactions | | | | |
| | | | |
In-kind redemptions—unaffiliated(a) | | | | |
In-kind redemptions—affiliated(a) | | | | |
| | | | |
Net change in unrealized appreciation (depreciation) on: | | | | |
| | | | |
| | | | |
Foreign currency translations | | | | |
| | | | |
| | | | |
Net realized and unrealized gain | | | | |
NET INCREASE IN NET ASSETS RESULTING FROM OPERATIONS | | | | |
(a) See Note 2 of the Notes to Financial Statements. |
See notes to financial statements.
Statements of Operations (continued)Year Ended March 31, 2024
| | iShares
Global Utilities ETF |
| | |
| | |
| | |
| | |
Securities lending income—affiliated—net | | |
Non-cash dividends—unaffiliated | | |
Other income—unaffiliated | | |
| | |
Foreign withholding tax claims | | |
IRS compliance fee for foreign withholding tax claims | | |
| | |
| | |
| | |
| | |
| | |
| | |
| | |
| | |
REALIZED AND UNREALIZED GAIN (LOSS) | | |
Net realized gain (loss) from: | | |
| | |
| | |
Foreign currency transactions | | |
| | |
In-kind redemptions—unaffiliated(a) | | |
| | |
Net change in unrealized appreciation (depreciation) on: | | |
| | |
| | |
Foreign currency translations | | |
| | |
| | |
Net realized and unrealized gain (loss) | | |
NET INCREASE IN NET ASSETS RESULTING FROM OPERATIONS | | |
(a) See Note 2 of the Notes to Financial Statements. |
See notes to financial statements.
702024 iShares Annual Report to Shareholders
Statements of Changes in Net Assets
| iShares
Global Comm Services ETF | iShares
Global Consumer Discretionary ETF |
| | | | |
INCREASE (DECREASE) IN NET ASSETS | | | | |
| | | | |
| | | | |
| | | | |
Net change in unrealized appreciation (depreciation) | | | | |
Net increase (decrease) in net assets resulting from operations | | | | |
DISTRIBUTIONS TO SHAREHOLDERS(a) | | | | |
Decrease in net assets resulting from distributions to shareholders | | | | |
CAPITAL SHARE TRANSACTIONS | | | | |
Net increase (decrease) in net assets derived from capital share transactions | | | | |
| | | | |
Total increase (decrease) in net assets | | | | |
| | | | |
| | | | |
| Distributions for annual periods determined in accordance with U.S. federal income tax regulations. |
See notes to financial statements.
Statements of Changes in Net Assets(continued)
| iShares
Global Consumer Staples ETF | |
| | | | |
INCREASE (DECREASE) IN NET ASSETS | | | | |
| | | | |
| | | | |
| | | | |
Net change in unrealized appreciation (depreciation) | | | | |
Net increase (decrease) in net assets resulting from operations | | | | |
DISTRIBUTIONS TO SHAREHOLDERS(a) | | | | |
Decrease in net assets resulting from distributions to shareholders | | | | |
CAPITAL SHARE TRANSACTIONS | | | | |
Net increase (decrease) in net assets derived from capital share transactions | | | | |
| | | | |
Total increase (decrease) in net assets | | | | |
| | | | |
| | | | |
| Distributions for annual periods determined in accordance with U.S. federal income tax regulations. |
See notes to financial statements.
722024 iShares Annual Report to Shareholders
Statements of Changes in Net Assets(continued)
| iShares
Global Financials ETF | iShares
Global Healthcare ETF |
| | | | |
INCREASE (DECREASE) IN NET ASSETS | | | | |
| | | | |
| | | | |
| | | | |
Net change in unrealized appreciation (depreciation) | | | | |
Net increase (decrease) in net assets resulting from operations | | | | |
DISTRIBUTIONS TO SHAREHOLDERS(a) | | | | |
Decrease in net assets resulting from distributions to shareholders | | | | |
CAPITAL SHARE TRANSACTIONS | | | | |
Net increase (decrease) in net assets derived from capital share transactions | | | | |
| | | | |
Total increase (decrease) in net assets | | | | |
| | | | |
| | | | |
| Distributions for annual periods determined in accordance with U.S. federal income tax regulations. |
See notes to financial statements.
Statements of Changes in Net Assets(continued)
| iShares
Global Industrials ETF | iShares
Global Materials ETF |
| | | | |
INCREASE (DECREASE) IN NET ASSETS | | | | |
| | | | |
| | | | |
| | | | |
Net change in unrealized appreciation (depreciation) | | | | |
Net increase (decrease) in net assets resulting from operations | | | | |
DISTRIBUTIONS TO SHAREHOLDERS(a) | | | | |
Decrease in net assets resulting from distributions to shareholders | | | | |
CAPITAL SHARE TRANSACTIONS | | | | |
Net increase (decrease) in net assets derived from capital share transactions | | | | |
| | | | |
Total increase (decrease) in net assets | | | | |
| | | | |
| | | | |
| Distributions for annual periods determined in accordance with U.S. federal income tax regulations. |
See notes to financial statements.
742024 iShares Annual Report to Shareholders
Statements of Changes in Net Assets(continued)
| | iShares
Global Utilities ETF |
| | | | |
INCREASE (DECREASE) IN NET ASSETS | | | | |
| | | | |
| | | | |
| | | | |
Net change in unrealized appreciation (depreciation) | | | | |
Net increase (decrease) in net assets resulting from operations | | | | |
DISTRIBUTIONS TO SHAREHOLDERS(a) | | | | |
Decrease in net assets resulting from distributions to shareholders | | | | |
CAPITAL SHARE TRANSACTIONS | | | | |
Net increase (decrease) in net assets derived from capital share transactions | | | | |
| | | | |
Total increase (decrease) in net assets | | | | |
| | | | |
| | | | |
| Distributions for annual periods determined in accordance with U.S. federal income tax regulations. |
See notes to financial statements.
Financial Highlights(For a share outstanding throughout each period)
| iShares Global Comm Services ETF |
| | | | | |
Net asset value, beginning of year | | | | | |
| | | | | |
Net realized and unrealized gain (loss)(c) | | | | | |
Net increase (decrease) from investment operations | | | | | |
Distributions from net investment income(d) | | | | | |
Net asset value, end of year | | | | | |
| | | | | |
| | | | | |
Ratios to Average Net Assets(f) | | | | | |
| | | | | |
Total expenses excluding professional fees for foreign withholding tax claims | | | | | |
| | | | | |
| | | | | |
Net assets, end of year (000) | | | | | |
Portfolio turnover rate(g) | | | | | |
(a) Based on average shares outstanding. |
(b) Reflects the positive effect of foreign withholding tax claims, net of the associated professional fees, which resulted in the following increases for the years ended March 31, 2024, March 31, 2023 and March 31, 2022 respectively: •Net investment income per share by $0.01, $0.03 and $0.10. • Total return by 0.02%, 0.05% and 0.15%. • Ratio of net investment income to average net assets by 0.01%, 0.06% and 0.12%. |
(c) The amounts reported for a share outstanding may not accord with the change in aggregate gains and losses in securities for the fiscal period due to the timing of capital share transactions in relation to the fluctuating market values of the Fund’s underlying securities. |
(d) Distributions for annual periods determined in accordance with U.S. federal income tax regulations. |
(e) Where applicable, assumes the reinvestment of distributions. |
(f) Excludes fees and expenses incurred indirectly as a result of investments in underlying funds. |
(g) Portfolio turnover rate excludes in-kind transactions, if any. |
See notes to financial statements.
762024 iShares Annual Report to Shareholders
Financial Highlights(continued)(For a share outstanding throughout each period)
| iShares Global Consumer Discretionary ETF |
| | | | | |
Net asset value, beginning of year | | | | | |
| | | | | |
Net realized and unrealized gain (loss)(c) | | | | | |
Net increase (decrease) from investment operations | | | | | |
Distributions from net investment income(d) | | | | | |
Net asset value, end of year | | | | | |
| | | | | |
| | | | | |
Ratios to Average Net Assets(g) | | | | | |
| | | | | |
| | | | | |
| | | | | |
Net assets, end of year (000) | | | | | |
Portfolio turnover rate(h) | | | | | |
(a) Based on average shares outstanding. |
(b) Reflects the positive effect of foreign withholding tax claims, net of the associated professional fees, which resulted in the following increases for the years ended March 31, 2024, March 31, 2023 and March 31, 2022 respectively: • Net investment income per share by $0.02, $0.01 and $0.03. • Total return by 0.02%, 0.00% and 0.02%. • Ratio of net investment income to average net assets by 0.01%, 0.01% and 0.02%. |
(c) The amounts reported for a share outstanding may not accord with the change in aggregate gains and losses in securities for the fiscal period due to the timing of capital share transactions in relation to the fluctuating market values of the Fund’s underlying securities. |
(d) Distributions for annual periods determined in accordance with U.S. federal income tax regulations. |
(e) Where applicable, assumes the reinvestment of distributions. |
(f) Includes payment received from an affiliate, which had no impact on the Fund’s total return. |
(g) Excludes fees and expenses incurred indirectly as a result of investments in underlying funds. |
(h) Portfolio turnover rate excludes in-kind transactions, if any. |
See notes to financial statements.
Financial Highlights(continued)(For a share outstanding throughout each period)
| iShares Global Consumer Staples ETF |
| | | | | |
Net asset value, beginning of year | | | | | |
| | | | | |
Net realized and unrealized gain (loss)(c) | | | | | |
Net increase (decrease) from investment operations | | | | | |
Distributions from net investment income(d) | | | | | |
Net asset value, end of year | | | | | |
| | | | | |
| | | | | |
Ratios to Average Net Assets(f) | | | | | |
| | | | | |
| | | | | |
| | | | | |
Net assets, end of year (000) | | | | | |
Portfolio turnover rate(g) | | | | | |
(a) Based on average shares outstanding. |
(b) Reflects the positive effect of foreign withholding tax claims, net of the associated professional fees, which resulted in the following increases for the year ended March 31, 2023: • Net investment income per share by $0.00. • Total return by 0.01%. • Ratio of net investment income to average net assets by 0.01%. |
(c) The amounts reported for a share outstanding may not accord with the change in aggregate gains and losses in securities for the fiscal period due to the timing of capital share transactions in relation to the fluctuating market values of the Fund’s underlying securities. |
(d) Distributions for annual periods determined in accordance with U.S. federal income tax regulations. |
(e) Where applicable, assumes the reinvestment of distributions. |
(f) Excludes fees and expenses incurred indirectly as a result of investments in underlying funds. |
(g) Portfolio turnover rate excludes in-kind transactions, if any. |
See notes to financial statements.
782024 iShares Annual Report to Shareholders
Financial Highlights(continued)(For a share outstanding throughout each period)
| iShares Global Energy ETF |
| | | | | |
Net asset value, beginning of year | | | | | |
| | | | | |
Net realized and unrealized gain (loss)(c) | | | | | |
Net increase (decrease) from investment operations | | | | | |
Distributions from net investment income(d) | | | | | |
Net asset value, end of year | | | | | |
| | | | | |
| | | | | |
Ratios to Average Net Assets(f) | | | | | |
| | | | | |
Total expenses excluding professional fees for foreign withholding tax claims | | | | | |
| | | | | |
| | | | | |
Net assets, end of year (000) | | | | | |
Portfolio turnover rate(g) | | | | | |
(a) Based on average shares outstanding. |
(b) Reflects the positive effect of foreign withholding tax claims, net of the associated professional fees, which resulted in the following increases for the year ended March 31, 2023: • Net investment income per share by $0.07. • Total return by 0.24%. • Ratio of net investment income to average net assets by 0.18%. |
(c) The amounts reported for a share outstanding may not accord with the change in aggregate gains and losses in securities for the fiscal period due to the timing of capital share transactions in relation to the fluctuating market values of the Fund’s underlying securities. |
(d) Distributions for annual periods determined in accordance with U.S. federal income tax regulations. |
(e) Where applicable, assumes the reinvestment of distributions. |
(f) Excludes fees and expenses incurred indirectly as a result of investments in underlying funds. |
(g) Portfolio turnover rate excludes in-kind transactions, if any. |
See notes to financial statements.
Financial Highlights(continued)(For a share outstanding throughout each period)
| iShares Global Financials ETF |
| | | | | |
Net asset value, beginning of year | | | | | |
| | | | | |
Net realized and unrealized gain (loss)(c) | | | | | |
Net increase (decrease) from investment operations | | | | | |
Distributions from net investment income(d) | | | | | |
Net asset value, end of year | | | | | |
| | | | | |
| | | | | |
Ratios to Average Net Assets(h) | | | | | |
| | | | | |
Total expenses excluding professional fees for foreign withholding tax claims | | | | | |
| | | | | |
| | | | | |
Net assets, end of year (000) | | | | | |
Portfolio turnover rate(i) | | | | | |
(a) Based on average shares outstanding. |
(b) Reflects the positive effect of foreign withholding tax claims, net of the associated professional fees, which resulted in the following increases for the years ended March 31, 2024, March 31, 2023 and March 31, 2022 respectively: • Net investment income per share by $0.01, $0.03 and $0.01. • Total return by 0.01%, 0.06% and 0.02%. • Ratio of net investment income to average net assets by 0.01%, 0.04% and 0.01%. |
(c) The amounts reported for a share outstanding may not accord with the change in aggregate gains and losses in securities for the fiscal period due to the timing of capital share transactions in relation to the fluctuating market values of the Fund’s underlying securities. |
(d) Distributions for annual periods determined in accordance with U.S. federal income tax regulations. |
(e) Where applicable, assumes the reinvestment of distributions. |
(f) Includes proceeds received from a class action litigation, which impacted the Fund’s total return. Not including these proceeds, the Fund’s total return would have been (9.92)% for the year ended March 31, 2023. |
(g) Includes payment received from an affiliate, which had no impact on the Fund’s total return. |
(h) Excludes fees and expenses incurred indirectly as a result of investments in underlying funds. |
(i) Portfolio turnover rate excludes in-kind transactions, if any. |
See notes to financial statements.
802024 iShares Annual Report to Shareholders
Financial Highlights(continued)(For a share outstanding throughout each period)
| iShares Global Healthcare ETF |
| | | | | |
Net asset value, beginning of year | | | | | |
| | | | | |
Net realized and unrealized gain (loss)(c) | | | | | |
Net increase (decrease) from investment operations | | | | | |
Distributions from net investment income(d) | | | | | |
Net asset value, end of year | | | | | |
| | | | | |
| | | | | |
Ratios to Average Net Assets(f) | | | | | |
| | | | | |
Total expenses excluding professional fees for foreign withholding tax claims | | | | | |
| | | | | |
| | | | | |
Net assets, end of year (000) | | | | | |
Portfolio turnover rate(g) | | | | | |
(a) Based on average shares outstanding. |
(b) Reflects the positive effect of foreign withholding tax claims, net of the associated professional fees, which resulted in the following increases for the years ended March 31, 2024 and March 31, 2023 respectively: • Net investment income per share by $0.00 and $0.01. • Total return by 0.01% and 0.01%. • Ratio of net investment income to average net assets by 0.01% and 0.01%. |
(c) The amounts reported for a share outstanding may not accord with the change in aggregate gains and losses in securities for the fiscal period due to the timing of capital share transactions in relation to the fluctuating market values of the Fund’s underlying securities. |
(d) Distributions for annual periods determined in accordance with U.S. federal income tax regulations. |
(e) Where applicable, assumes the reinvestment of distributions. |
(f) Excludes fees and expenses incurred indirectly as a result of investments in underlying funds. |
(g) Portfolio turnover rate excludes in-kind transactions, if any. |
See notes to financial statements.
Financial Highlights(continued)(For a share outstanding throughout each period)
| iShares Global Industrials ETF |
| | | | | |
Net asset value, beginning of year | | | | | |
| | | | | |
Net realized and unrealized gain (loss)(c) | | | | | |
Net increase (decrease) from investment operations | | | | | |
Distributions from net investment income(d) | | | | | |
Net asset value, end of year | | | | | |
| | | | | |
| | | | | |
Ratios to Average Net Assets(f) | | | | | |
| | | | | |
Total expenses excluding professional fees for foreign withholding tax claims | | | | | |
| | | | | |
| | | | | |
Net assets, end of year (000) | | | | | |
Portfolio turnover rate(g) | | | | | |
(a) Based on average shares outstanding. |
(b) Reflects the positive effect of foreign withholding tax claims, net of the associated professional fees, which resulted in the following increases for the years ended March 31, 2023 and March 31, 2022 respectively: • Net investment income per share by $0.02 and $0.05. • Total return by 0.01% and 0.05%. • Ratio of net investment income to average net assets by 0.01% and 0.04%. |
(c) The amounts reported for a share outstanding may not accord with the change in aggregate gains and losses in securities for the fiscal period due to the timing of capital share transactions in relation to the fluctuating market values of the Fund’s underlying securities. |
(d) Distributions for annual periods determined in accordance with U.S. federal income tax regulations. |
(e) Where applicable, assumes the reinvestment of distributions. |
(f) Excludes fees and expenses incurred indirectly as a result of investments in underlying funds. |
(g) Portfolio turnover rate excludes in-kind transactions, if any. |
See notes to financial statements.
822024 iShares Annual Report to Shareholders
Financial Highlights(continued)(For a share outstanding throughout each period)
| iShares Global Materials ETF |
| | | | | |
Net asset value, beginning of year | | | | | |
| | | | | |
Net realized and unrealized gain (loss)(c) | | | | | |
Net increase (decrease) from investment operations | | | | | |
Distributions from net investment income(d) | | | | | |
Net asset value, end of year | | | | | |
| | | | | |
| | | | | |
Ratios to Average Net Assets(f) | | | | | |
| | | | | |
Total expenses excluding professional fees for foreign withholding tax claims | | | | | |
| | | | | |
| | | | | |
Net assets, end of year (000) | | | | | |
Portfolio turnover rate(g) | | | | | |
(a) Based on average shares outstanding. |
(b) Reflects the positive effect of foreign withholding tax claims, net of the associated professional fees, which resulted in the following increases for the years ended March 31,2024, March 31, 2023 and March 31, 2022 respectively: • Net investment income per share by $0.05, $0.00 and $0.01. • Total return by 0.07%, 0.01% and (0.01%). • Ratio of net investment income to average net assets by 0.06%, 0.00% and 0.01%. |
(c) The amounts reported for a share outstanding may not accord with the change in aggregate gains and losses in securities for the fiscal period due to the timing of capital share transactions in relation to the fluctuating market values of the Fund’s underlying securities. |
(d) Distributions for annual periods determined in accordance with U.S. federal income tax regulations. |
(e) Where applicable, assumes the reinvestment of distributions. |
(f) Excludes fees and expenses incurred indirectly as a result of investments in underlying funds. |
(g) Portfolio turnover rate excludes in-kind transactions, if any. |
See notes to financial statements.
Financial Highlights(continued)(For a share outstanding throughout each period)
| |
| | | | | |
Net asset value, beginning of year | | | | | |
| | | | | |
Net realized and unrealized gain (loss)(d) | | | | | |
Net increase (decrease) from investment operations | | | | | |
Distributions from net investment income(e) | | | | | |
Net asset value, end of year | | | | | |
| | | | | |
| | | | | |
Ratios to Average Net Assets(g) | | | | | |
| | | | | |
| | | | | |
| | | | | |
Net assets, end of year (000) | | | | | |
Portfolio turnover rate(h) | | | | | |
(a) Per share amounts reflect a six-for-one stock split effective after the close of trading on July 16, 2021. |
(b) Based on average shares outstanding. |
(c) Reflects the positive effect of foreign withholding tax claims, net of the associated professional fees, which resulted in the following increases for the year ended March 31, 2023 and March 31,2022 respectively: • Net investment income per share by $0.00 and $0.00. • Total return by 0.01% and 0.01%. • Ratio of net investment income to average net assets by 0.00% and 0.00%. |
(d) The amounts reported for a share outstanding may not accord with the change in aggregate gains and losses in securities for the fiscal period due to the timing of capital share transactions in relation to the fluctuating market values of the Fund’s underlying securities. |
(e) Distributions for annual periods determined in accordance with U.S. federal income tax regulations. |
(f) Where applicable, assumes the reinvestment of distributions. |
(g) Excludes fees and expenses incurred indirectly as a result of investments in underlying funds. |
(h) Portfolio turnover rate excludes in-kind transactions, if any. |
See notes to financial statements.
842024 iShares Annual Report to Shareholders
Financial Highlights(continued)(For a share outstanding throughout each period)
| iShares Global Utilities ETF |
| | | | | |
Net asset value, beginning of year | | | | | |
| | | | | |
Net realized and unrealized gain (loss)(c) | | | | | |
Net increase (decrease) from investment operations | | | | | |
Distributions from net investment income(d) | | | | | |
Net asset value, end of year | | | | | |
| | | | | |
| | | | | |
Ratios to Average Net Assets(f) | | | | | |
| | | | | |
Total expenses excluding professional fees for foreign withholding tax claims | | | | | |
| | | | | |
| | | | | |
Net assets, end of year (000) | | | | | |
Portfolio turnover rate(g) | | | | | |
(a) Based on average shares outstanding. |
(b) Reflects the positive effect of foreign withholding tax claims, net of the associated professional fees, which resulted in the following increases for the years ended March 31, 2024 and March 31, 2023 respectively: • Net investment income per share by $0.31 and $0.06. • Total return by 0.56% and 0.12%. • Ratio of net investment income to average net assets by 0.53% and 0.11%. |
(c) The amounts reported for a share outstanding may not accord with the change in aggregate gains and losses in securities for the fiscal period due to the timing of capital share transactions in relation to the fluctuating market values of the Fund’s underlying securities. |
(d) Distributions for annual periods determined in accordance with U.S. federal income tax regulations. |
(e) Where applicable, assumes the reinvestment of distributions. |
(f) Excludes fees and expenses incurred indirectly as a result of investments in underlying funds. |
(g) Portfolio turnover rate excludes in-kind transactions, if any. |
See notes to financial statements.
Notes to Financial Statements
1. ORGANIZATION
iShares Trust (the “Trust”) is registered under the Investment Company Act of 1940, as amended (the “1940 Act”), as an open-end management investment company. The Trust is organized as a Delaware statutory trust and is authorized to have multiple series or portfolios.
These financial statements relate only to the following funds (each, a “Fund” and collectively, the “Funds”):
| Diversification
Classification |
| |
Global Consumer Discretionary | |
| |
| |
| |
| |
| |
| |
| |
| |
2. SIGNIFICANT ACCOUNTING POLICIES
The financial statements are prepared in conformity with accounting principles generally accepted in the United States of America (“U.S. GAAP”), which may require management to make estimates and assumptions that affect the reported amounts of assets and liabilities in the financial statements, disclosure of contingent assets and liabilities at the date of the financial statements and the reported amounts of increases and decreases in net assets from operations during the reporting period. Actual results could differ from those estimates. Each Fund is considered an investment company under U.S. GAAP and follows the accounting and reporting guidance applicable to investment companies. Below is a summary of significant accounting policies:
Investment Transactions and Income Recognition: For financial reporting purposes, investment transactions are recorded on the dates the transactions are executed. Realized gains and losses on investment transactions are determined using the specific identification method. Dividend income and capital gain distributions, if any, are recorded on the ex-dividend date. Non-cash dividends, if any, are recorded on the ex-dividend date at fair value. Dividends from foreign securities where the ex-dividend date may have passed are subsequently recorded when the Funds are informed of the ex-dividend date. Under the applicable foreign tax laws, a withholding tax at various rates may be imposed on capital gains, dividends and interest. Upon notification from issuers or as estimated by management, a portion of the dividend income received from a real estate investment trust may be redesignated as a reduction of cost of the related investment and/or realized gain.
Foreign Currency Translation: Each Fund’s books and records are maintained in U.S. dollars. Securities and other assets and liabilities denominated in foreign currencies are translated into U.S. dollars using prevailing market rates as quoted by one or more data service providers. Purchases and sales of investments are recorded at the rates of exchange prevailing on the respective dates of such transactions. Generally, when the U.S. dollar rises in value against a foreign currency, the investments denominated in that currency will lose value; the opposite effect occurs if the U.S. dollar falls in relative value.
Each Fund does not isolate the effect of fluctuations in foreign exchange rates from the effect of fluctuations in the market prices of investments for financial reporting purposes. Accordingly, the effects of changes in exchange rates on investments are not segregated in the Statements of Operations from the effects of changes in market prices of those investments, but are included as a component of net realized and unrealized gain (loss) from investments. Each Fund reports realized currency gains (losses) on foreign currency related transactions as components of net realized gain (loss) for financial reporting purposes, whereas such components are generally treated as ordinary income for U.S. federal income tax purposes.
Foreign Taxes: Certain Funds may be subject to foreign taxes (a portion of which may be reclaimable) on income, stock dividends, capital gains on investments, or certain foreign currency transactions. All foreign taxes are recorded in accordance with the applicable foreign tax regulations and rates that exist in the foreign jurisdictions in which each Fund invests. These foreign taxes, if any, are paid by each Fund and are reflected in its Statements of Operations as follows: foreign taxes withheld at source are presented as a reduction of income, foreign taxes on securities lending income are presented as a reduction of securities lending income, foreign taxes on stock dividends are presented as “Other foreign taxes”, and foreign taxes on capital gains from sales of investments and foreign taxes on foreign currency transactions are included in their respective net realized gain (loss) categories. Foreign taxes payable or deferred as of March 31, 2024, if any, are disclosed in the Statements of Assets and Liabilities.
Certain Funds file withholding tax reclaims in certain jurisdictions to recover a portion of amounts previously withheld. The Funds may record a reclaim receivable based on collectability, which includes factors such as the jurisdiction’s applicable laws, payment history and market convention. The Statements of Operations includes tax reclaims recorded as well as professional and other fees, if any, associated with recovery of foreign withholding taxes.
Bank Overdraft:Certain Funds had outstanding cash disbursements exceeding deposited cash amounts at the custodian during the reporting period. The Funds are obligated to repay the custodian for any overdraft, including any related costs or expenses, where applicable. For financial reporting purposes, overdraft fees, if any, are included in interest expense in the Statements of Operations.
Collateralization: If required by an exchange or counterparty agreement, the Funds may be required to deliver/deposit cash and/or securities to/with an exchange, or broker-dealer or custodian as collateral for certain investments.
862024 iShares Annual Report to Shareholders
Notes to Financial Statements (continued)
In-kind Redemptions: For financial reporting purposes, in-kind redemptions are treated as sales of securities resulting in realized capital gains or losses to the Funds. Because such gains or losses are not taxable to the Funds and are not distributed to existing Fund shareholders, the gains or losses are reclassified from accumulated net realized gain (loss) to paid-in capital at the end of the Funds’ tax year. These reclassifications have no effect on net assets or net asset value (“NAV”) per share.
Distributions: Dividends and distributions paid by each Fund are recorded on the ex-dividend dates. Distributions are determined on a tax basis and may differ from net investment income and net realized capital gains for financial reporting purposes. Dividends and distributions are paid in U.S. dollars and cannot be automatically reinvested in additional shares of the Funds.
Indemnifications: In the normal course of business, each Fund enters into contracts that contain a variety of representations that provide general indemnification. The Funds’ maximum exposure under these arrangements is unknown because it involves future potential claims against the Funds, which cannot be predicted with any certainty.
3. INVESTMENT VALUATION AND FAIR VALUE MEASUREMENTS
Investment Valuation Policies: Each Fund’s investments are valued at fair value (also referred to as “market value” within the financial statements) each day that the Fund’s listing exchange is open and, for financial reporting purposes, as of the report date. U.S. GAAP defines fair value as the price a fund would receive to sell an asset or pay to transfer a liability in an orderly transaction between market participants at the measurement date. The Board of Trustees of the Trust (the “Board”) of each Fund has approved the designation of BlackRock Fund Advisors (“BFA”), the Funds’ investment adviser, as the valuation designee for each Fund. Each Fund determines the fair values of its financial instruments using various independent dealers or pricing services under BFA’s policies. If a security’s market price is not readily available or does not otherwise accurately represent the fair value of the security, the security will be valued in accordance with BFA’s policies and procedures as reflecting fair value. BFA has formed a committee (the “Valuation Committee”) to develop pricing policies and procedures and to oversee the pricing function for all financial instruments, with assistance from other BlackRock pricing committees.
Fair Value Inputs and Methodologies: The following methods and inputs are used to establish the fair value of each Fund’s assets and liabilities:
• Equity investments traded on a recognized securities exchange are valued at that day’s official closing price, as applicable, on the exchange where the stock is primarily traded. Equity investments traded on a recognized exchange for which there were no sales on that day are valued at the last traded price.
• Investments in open-end U.S. mutual funds (including money market funds) are valued at that day’s published NAV.
• Futures contracts are valued based on that day’s last reported settlement or trade price on the exchange where the contract is traded.
Generally, trading in foreign instruments is substantially completed each day at various times prior to the close of trading on the New York Stock Exchange (“NYSE”). Each business day, the Funds use current market factors supplied by independent pricing services to value certain foreign instruments (“Systematic Fair Value Price”). The Systematic Fair Value Price is designed to value such foreign securities at fair value as of the close of trading on the NYSE, which follows the close of the local markets.
If events (e.g., market volatility, company announcement or a natural disaster) occur that are expected to materially affect the value of such investment, or in the event that application of these methods of valuation results in a price for an investment that is deemed not to be representative of the market value of such investment, or if a price is not available, the investment will be valued by the Valuation Committee, in accordance with BFA’s policies and procedures as reflecting fair value (“Fair Valued Investments”). The fair valuation approaches that may be used by the Valuation Committee include market approach, income approach and cost approach. Valuation techniques such as discounted cash flow, use of market comparables and matrix pricing are types of valuation approaches and are typically used in determining fair value. When determining the price for Fair Valued Investments, the Valuation Committee seeks to determine the price that each Fund might reasonably expect to receive or pay from the current sale or purchase of that asset or liability in an arm’s-length transaction. Fair value determinations shall be based upon all available factors that the Valuation Committee deems relevant and consistent with the principles of fair value measurement.
Fair value pricing could result in a difference between the prices used to calculate a fund’s NAV and the prices used by the fund’s underlying index, which in turn could result in a difference between the fund’s performance and the performance of the fund’s underlying index.
Fair Value Hierarchy: Various inputs are used in determining the fair value of financial instruments. These inputs to valuation techniques are categorized into a fair value hierarchy consisting of three broad levels for financial reporting purposes as follows:
• Level 1 – Unadjusted price quotations in active markets/exchanges for identical assets or liabilities that each Fund has the ability to access;
• Level 2 – Other observable inputs (including, but not limited to, quoted prices for similar assets or liabilities in markets that are active, quoted prices for identical or similar assets or liabilities in markets that are not active, inputs other than quoted prices that are observable for the assets or liabilities (such as interest rates, yield curves, volatilities, prepayment speeds, loss severities, credit risks and default rates) or other market-corroborated inputs); and
• Level 3 – Unobservable inputs based on the best information available in the circumstances, to the extent observable inputs are not available, (including the Valuation Committee’s assumptions used in determining the fair value of financial instruments).
The hierarchy gives the highest priority to unadjusted quoted prices in active markets for identical assets or liabilities (Level 1 measurements) and the lowest priority to unobservable inputs (Level 3 measurements). Accordingly, the degree of judgment exercised in determining fair value is greatest for instruments categorized in Level 3. The inputs used to measure fair value may fall into different levels of the fair value hierarchy. In such cases, for disclosure purposes, the fair value hierarchy classification is
Notes to Financial Statements87
Notes to Financial Statements (continued)
determined based on the lowest level input that is significant to the fair value measurement in its entirety. Investments classified within Level 3 have significant unobservable inputs used by the Valuation Committee in determining the price for Fair Valued Investments. Level 3 investments include equity or debt issued by privately held companies or funds that may not have a secondary market and/or may have a limited number of investors. The categorization of a value determined for financial instruments is based on the pricing transparency of the financial instruments and is not necessarily an indication of the risks associated with investing in those securities.
4. SECURITIES AND OTHER INVESTMENTS
Warrants: Warrants entitle a fund to purchase a specified number of shares of common stock and are non-income producing. The purchase price and number of shares are subject to adjustment under certain conditions until the expiration date of the warrants, if any. If the price of the underlying stock does not rise above the strike price before the warrant expires, the warrant generally expires without any value and a fund will lose any amount it paid for the warrant. Thus, investments in warrants may involve more risk than investments in common stock. Warrants may trade in the same markets as their underlying stock; however, the price of the warrant does not necessarily move with the price of the underlying stock.
Securities Lending: Each Fund may lend its securities to approved borrowers, such as brokers, dealers and other financial institutions. The borrower pledges and maintains with the Fund collateral consisting of cash, an irrevocable letter of credit issued by an approved bank, or securities issued or guaranteed by the U.S. government. The initial collateral received by each Fund is required to have a value of at least 102% of the current market value of the loaned securities for securities traded on U.S. exchanges and a value of at least 105% for all other securities. The collateral is maintained thereafter at a value equal to at least 100% of the current value of the securities on loan. The market value of the loaned securities is determined at the close of each business day of the Fund and any additional required collateral is delivered to the Fund or excess collateral is returned by the Fund, on the next business day. During the term of the loan, each Fund is entitled to all distributions made on or in respect of the loaned securities but does not receive interest income on securities received as collateral. Loans of securities are terminable at any time and the borrower, after notice, is required to return borrowed securities within the standard time period for settlement of securities transactions.
As of period end, any securities on loan were collateralized by cash and/or U.S. Government obligations. Cash collateral invested in money market funds managed by BFA, or its affiliates is disclosed in the Schedule of Investments. Any non-cash collateral received cannot be sold, re-invested or pledged by the Fund, except in the event of borrower default. The securities on loan, if any, are also disclosed in each Fund’s Schedule of Investments. The market value of any securities on loan and the value of any related cash collateral are disclosed in the Statements of Assets and Liabilities.
Securities lending transactions are entered into by the Funds under Master Securities Lending Agreements (each, an “MSLA”) which provide the right, in the event of default (including bankruptcy or insolvency) for the non-defaulting party to liquidate the collateral and calculate a net exposure to the defaulting party or request additional collateral. In the event that a borrower defaults, the Funds, as lender, would offset the market value of the collateral received against the market value of the securities loaned. When the value of the collateral is greater than that of the market value of the securities loaned, the lender is left with a net amount payable to the defaulting party. However, bankruptcy or insolvency laws of a particular jurisdiction may impose restrictions on or prohibitions against such a right of offset in the event of an MSLA counterparty’s bankruptcy or insolvency. Under the MSLA, absent an event of default, the borrower can resell or re-pledge the loaned securities, and the Funds can reinvest cash collateral received in connection with loaned securities. Upon an event of default, the parties’ obligations to return the securities or collateral to the other party are extinguished, and the parties can resell or re-pledge the loaned securities or the collateral received in connection with the loaned securities in order to satisfy the defaulting party’s net payment obligation for all transactions under the MSLA. The defaulting party remains liable for any deficiency.
As of period end, the following table is a summary of the securities on loan by counterparty which are subject to offset under an MSLA:
iShares ETF and Counterparty | Securities Loaned
at Value | | Non-Cash Collateral
Received, at Fair Value(a) | |
| | | | |
| | | | |
| | | | |
J.P. Morgan Securities LLC | | | | |
| | | | |
| | | | |
| | | | |
| | | | |
| | | | |
| | | | |
| | | | |
J.P. Morgan Securities LLC | | | | |
| | | | |
| | | | |
National Financial Services LLC | | | | |
| | | | |
SG Americas Securities LLC | | | | |
| | | | |
| | | | |
| | | | |
882024 iShares Annual Report to Shareholders
Notes to Financial Statements (continued)
iShares ETF and Counterparty | Securities Loaned at Value | Cash Collateral Received(a) | Non-Cash Collateral Received, at Fair Value(a) | |
| | | | |
| | | | |
J.P. Morgan Securities LLC | | | | |
Scotia Capital (USA), Inc. | | | | |
| | | | |
| | | | |
| | | | |
| | | | |
| | | | |
| | | | |
| | | | |
| | | | |
| | | | |
| | | | |
Scotia Capital (USA), Inc. | | | | |
SG Americas Securities LLC | | | | |
| | | | |
| | | | |
| Collateral received, if any, in excess of the market value of securities on loan is not presented in this table. The total cash collateral received by each Fund is disclosed in the Fund’s Statements of Assets and Liabilities. |
The risks of securities lending include the risk that the borrower may not provide additional collateral when required or may not return the securities when due. To mitigate these risks, each Fund benefits from a borrower default indemnity provided by BlackRock, Inc. (“BlackRock”). BlackRock’s indemnity allows for full replacement of the securities loaned to the extent the collateral received does not cover the value of the securities loaned in the event of borrower default. Each Fund could incur a loss if the value of an investment purchased with cash collateral falls below the market value of the loaned securities or if the value of an investment purchased with cash collateral falls below the value of the original cash collateral received. Such losses are borne entirely by each Fund.
5. DERIVATIVE FINANCIAL INSTRUMENTS
Futures Contracts: Futures contracts are purchased or sold to gain exposure to, or manage exposure to, changes in interest rates (interest rate risk) and changes in the value of equity securities (equity risk) or foreign currencies (foreign currency exchange rate risk).
Futures contracts are exchange-traded agreements between the Funds and a counterparty to buy or sell a specific quantity of an underlying instrument at a specified price and on a specified date. Depending on the terms of a contract, it is settled either through physical delivery of the underlying instrument on the settlement date or by payment of a cash amount on the settlement date. Upon entering into a futures contract, the Funds are required to deposit initial margin with the broker in the form of cash or securities in an amount that varies depending on a contract’s size and risk profile. The initial margin deposit must then be maintained at an established level over the life of the contract. Amounts pledged, which are considered restricted, are included in cash pledged for futures contracts in the Statements of Assets and Liabilities.
Securities deposited as initial margin are designated in the Schedule of Investments and cash deposited, if any, are shown as cash pledged for futures contracts in the Statements of Assets and Liabilities. Pursuant to the contract, the Funds agree to receive from or pay to the broker an amount of cash equal to the daily fluctuation in market value of the contract (“variation margin”). Variation margin is recorded as unrealized appreciation (depreciation) and, if any, shown as variation margin receivable (or payable) on futures contracts in the Statements of Assets and Liabilities. When the contract is closed, a realized gain or loss is recorded in the Statements of Operations equal to the difference between the notional amount of the contract at the time it was opened and the notional amount at the time it was closed. The use of futures contracts involves the risk of an imperfect correlation in the movements in the price of futures contracts and interest rates, foreign currency exchange rates or underlying assets.
6. INVESTMENT ADVISORY AGREEMENT AND OTHER TRANSACTIONS WITH AFFILIATES
Investment Advisory Fees: Pursuant to an Investment Advisory Agreement with the Trust, BFA manages the investment of each Fund’s assets. BFA is a California corporation indirectly owned by BlackRock. Under the Investment Advisory Agreement, BFA is responsible for substantially all expenses of the Funds, except (i) interest and taxes; (ii) brokerage commissions and other expenses connected with the execution of portfolio transactions; (iii) distribution fees; (iv) the advisory fee payable to BFA; and (v) litigation expenses and any extraordinary expenses (in each case as determined by a majority of the independent trustees).
Notes to Financial Statements89
Notes to Financial Statements (continued)
For its investment advisory services to each Fund, BFA is entitled to an annual investment advisory fee, accrued daily and paid monthly by the Funds, based on each Fund’s allocable portion of the aggregate of the average daily net assets of the Fund and certain other iShares funds as follows:
Aggregate Average Daily Net Assets | |
| |
Over $10 billion, up to and including $20 billion | |
Over $20 billion, up to and including $30 billion | |
Over $30 billion, up to and including $40 billion | |
| |
Distributor: BlackRock Investments, LLC, an affiliate of BFA, is the distributor for each Fund. Pursuant to the distribution agreement, BFA is responsible for any fees or expenses for distribution services provided to the Funds.
Securities Lending: The U.S. Securities and Exchange Commission (the “SEC”) has issued an exemptive order which permits BlackRock Institutional Trust Company, N.A. (“BTC”), an affiliate of BFA, to serve as securities lending agent for the Funds, subject to applicable conditions. As securities lending agent, BTC bears all operational costs directly related to securities lending, including any custodial costs. Each Fund is responsible for fees in connection with the investment of cash collateral received for securities on loan (the “collateral investment fees”). The cash collateral is invested in a money market fund, BlackRock Cash Funds: Institutional or BlackRock Cash Funds: Treasury, managed by BFA, or its affiliates. However, BTC has agreed to reduce the amount of securities lending income it receives in order to effectively limit the collateral investment fees each Fund bears to an annual rate of 0.04%. The SL Agency Shares of such money market fund will not be subject to a sales load, redemption fee, distribution fee or service fee. The money market fund in which the cash collateral has been invested may, under certain circumstances, impose a liquidity fee of up to 2% of the value redeemed or temporarily restrict redemptions for up to 10 business days during a 90 day period, in the event that the money market fund’s weekly liquid assets fall below certain thresholds.
Securities lending income is generally equal to the total of income earned from the reinvestment of cash collateral (and excludes collateral investment fees), and any fees or other payments to and from borrowers of securities. Each Fund retains a portion of the securities lending income and remits the remaining portion to BTC as compensation for its services as securities lending agent.
Pursuant to the current securities lending agreement, each of iShares Global Comm Services ETF and iShares Global Tech ETF (the “Group 1 Funds”), retains 81% of securities lending income (which excludes collateral investment fees) and the amount retained can never be less than 70% of the total of securities lending income plus the collateral investment fees.
Pursuant to the current securities lending agreement, each of iShares Global Consumer Discretionary ETF, iShares Global Consumer Staples ETF, iShares Global Energy ETF, iShares Global Financials ETF, iShares Global Healthcare ETF, iShares Global Industrials ETF, iShares Global Materials ETF and iShares Global Utilities ETF (the “Group 2 Funds”), retains 82% of securities lending income (which excludes collateral investment fees) and the amount retained can never be less than 70% of the total of securities lending income plus the collateral investment fees.
In addition, commencing the business day following the date that the aggregate securities lending income plus the collateral investment fees generated across all 1940 Act iShares exchange-traded funds (the “iShares ETF Complex”) in a given calendar year exceeds a specified threshold: (1) each Group 1 Fund, pursuant to the securities lending agreement, will retain for the remainder of that calendar year 81% of securities lending income (which excludes collateral investment fees), and the amount retained can never be less than 70% of the total of securities lending income plus the collateral investment fees, and (2) each Group 2 Fund will retain for the remainder of that calendar year 85% of securities lending income (which excludes collateral investment fees), and the amount retained can never be less than 70% of the total of securities lending income plus the collateral investment fees.
The share of securities lending income earned by each Fund is shown as securities lending income – affiliated – net in its Statements of Operations. For the year ended March 31, 2024, the Funds paid BTC the following amounts for securities lending agent services:
| |
| |
Global Consumer Discretionary | |
| |
| |
| |
| |
| |
| |
| |
| |
Officers and Trustees: Certain officers and/or trustees of the Trust are officers and/or trustees of BlackRock or its affiliates.
902024 iShares Annual Report to Shareholders
Notes to Financial Statements (continued)
Other Transactions: Cross trading is the buying or selling of portfolio securities between funds to which BFA (or an affiliate) serves as investment adviser. At its regularly scheduled quarterly meetings, the Board reviews such transactions as of the most recent calendar quarter for compliance with the requirements and restrictions set forth by Rule 17a-7.
For the year ended March 31, 2024, transactions executed by the Funds pursuant to Rule 17a-7 under the 1940 Act were as follows:
| | | |
| | | |
Global Consumer Discretionary | | | |
| | | |
| | | |
| | | |
| | | |
| | | |
| | | |
| | | |
| | | |
Each Fund may invest its positive cash balances in certain money market funds managed by BFA or an affiliate. The income earned on these temporary cash investments is shown as dividends – affiliated in the Statements of Operations.
A fund, in order to improve its portfolio liquidity and its ability to track its underlying index, may invest in shares of other iShares funds that invest in securities in the fund’s underlying index.
7. PURCHASES AND SALES
For the year ended March 31, 2024, purchases and sales of investments, excluding short-term securities and in-kind transactions, were as follows:
| | |
| | |
Global Consumer Discretionary | | |
| | |
| | |
| | |
| | |
| | |
| | |
| | |
| | |
For the year ended March 31, 2024, in-kind transactions were as follows:
| | |
| | |
Global Consumer Discretionary | | |
| | |
| | |
| | |
| | |
| | |
| | |
| | |
| | |
8. INCOME TAX INFORMATION
Each Fund is treated as an entity separate from the Trust’s other funds for federal income tax purposes. It is each Fund’s policy to comply with the requirements of the Internal Revenue Code of 1986, as amended, applicable to regulated investment companies, and to distribute substantially all of its taxable income to its shareholders. Therefore, no U.S. federal income tax provision is required.
Notes to Financial Statements91
Notes to Financial Statements (continued)
Management has analyzed tax laws and regulations and their application to the Funds as of March 31, 2024, inclusive of the open tax return years, and does not believe that there are any uncertain tax positions that require recognition of a tax liability in the Funds’ financial statements.
U.S. GAAP requires that certain components of net assets be adjusted to reflect permanent differences between financial and tax reporting. These reclassifications have no effect on net assets or NAV per share. As of March 31, 2024, permanent differences attributable to realized gains (losses) from in-kind redemptions were reclassified to the following accounts:
| | Accumulated
Earnings (Loss) |
| | |
Global Consumer Discretionary | | |
| | |
| | |
| | |
| | |
| | |
| | |
| | |
| | |
The tax character of distributions paid was as follows:
| | |
| | |
| | |
Global Consumer Discretionary | | |
| | |
| | |
| | |
| | |
| | |
| | |
| | |
| | |
| | |
| | |
| | |
| | |
| | |
| | |
| | |
| | |
| | |
As of March 31, 2024, the tax components of accumulated net earnings (losses) were as follows:
| Undistributed
Ordinary Income | | | |
| | | | |
Global Consumer Discretionary | | | | |
| | | | |
| | | | |
| | | | |
| | | | |
| | | | |
| | | | |
| | | | |
| | | | |
922024 iShares Annual Report to Shareholders
Notes to Financial Statements (continued)
| Amounts available to offset future realized capital gains. |
| The difference between book-basis and tax-basis unrealized gains (losses) was attributable primarily to the tax deferral of losses on wash sales, the realization for tax purposes of unrealized gains (losses) on certain futures contracts, timing and recognition of partnership income, characterization of corporate actions, the realization for tax purposes of unrealized gains on investments in passive foreign investment companies and foreign tax withholding reclaims. |
For the year ended March 31, 2024, the iShares Global Tech ETF utilized $39,159,512 of its capital loss carryforwards.
A fund may own shares in certain foreign investment entities, referred to, under U.S. tax law, as “passive foreign investment companies.” Such fund may elect to mark-to-market annually the shares of each passive foreign investment company and would be required to distribute to shareholders any such marked-to-market gains.
As of March 31, 2024, gross unrealized appreciation and depreciation based on cost of investments (including short positions and derivatives, if any) for U.S. federal income tax purposes were as follows:
| | Gross Unrealized
Appreciation | Gross Unrealized
Depreciation | Net Unrealized
Appreciation
(Depreciation) |
| | | | |
Global Consumer Discretionary | | | | |
| | | | |
| | | | |
| | | | |
| | | | |
| | | | |
| | | | |
| | | | |
| | | | |
9. LINE OF CREDIT
The iShares Global Comm Services ETF, iShares Global Consumer Discretionary ETF, iShares Global Consumer Staples ETF, iShares Global Energy ETF, iShares Global Financials ETF, iShares Global Industrials ETF, iShares Global Materials ETF, iShares Global Tech ETF and iShares Global Utilities ETF, along with certain other iShares funds (“Participating Funds”), are parties to a $800 million credit agreement (“Syndicated Credit Agreement”) with a group of lenders, which expires on October 16, 2024. The line of credit may be used for temporary or emergency purposes, including redemptions, settlement of trades and rebalancing of portfolio holdings in certain target markets. The Funds may borrow up to the aggregate commitment amount subject to asset coverage and other limitations as specified in the Syndicated Credit Agreement. The Syndicated Credit Agreement has the following terms: a commitment fee of 0.15% per annum on the unused portion of the credit agreement and interest at a rate equal to the higher of (a) Daily Simple Secured Overnight Financing Rate (“SOFR”) plus 0.10% and 1.00% per annum or (b) the U.S. Federal Funds rate plus 1.00% per annum on amounts borrowed. The commitment fee is generally allocated to each Participating Fund based on the lesser of a Participating Fund’s relative exposure to certain target markets or a Participating Fund’s maximum borrowing amount as set forth by the terms of the Syndicated Credit Agreement.
During the year ended March 31, 2024, the Funds did not borrow under the Syndicated Credit Agreement.
10. PRINCIPAL RISKS
In the normal course of business, each Fund invests in securities or other instruments and may enter into certain transactions, and such activities subject the Fund to various risks, including, among others, fluctuations in the market (market risk) or failure of an issuer to meet all of its obligations. The value of securities or other instruments may also be affected by various factors, including, without limitation: (i) the general economy; (ii) the overall market as well as local, regional or global political and/or social instability; (iii) regulation, taxation or international tax treaties between various countries; or (iv) currency, interest rate or price fluctuations. Local, regional or global events such as war, acts of terrorism, the spread of infectious illness or other public health issues, recessions, or other events could have a significant impact on the Funds and their investments. Each Fund’s prospectus provides details of the risks to which the Fund is subject.
BFA uses an indexing approach to try to achieve each Fund’s investment objective. The Fund is not actively managed, and BFA generally does not attempt to take defensive positions under any market conditions, including declining markets.
The Funds may be exposed to additional risks when reinvesting cash collateral in money market funds that do not seek to maintain a stable NAV per share of $1.00, which may be subject to discretionary liquidity fees under certain circumstances.
Valuation Risk: The market values of equities, such as common stocks and preferred securities or equity related investments, such as futures and options, may decline due to general market conditions which are not specifically related to a particular company. They may also decline due to factors which affect a particular industry or industries. A fund may invest in illiquid investments. An illiquid investment is any investment that a fund reasonably expects cannot be sold or disposed of in current market conditions in seven calendar days or less without the sale or disposition significantly changing the market value of the investment. A fund may experience difficulty in selling illiquid investments in a timely manner at the price that it believes the investments are worth. Prices may fluctuate widely over short or extended periods in response to company, market or economic news. Markets also tend to move in cycles, with periods of rising and falling prices. This volatility may cause a fund’s NAV to experience
Notes to Financial Statements93
Notes to Financial Statements (continued)
significant increases or decreases over short periods of time. If there is a general decline in the securities and other markets, the NAV of a fund may lose value, regardless of the individual results of the securities and other instruments in which a fund invests.
The price each Fund could receive upon the sale of any particular portfolio investment may differ from each Fund’s valuation of the investment, particularly for securities that trade in thin or volatile markets or that are valued using a fair valuation technique or a price provided by an independent pricing service. Changes to significant unobservable inputs and assumptions (i.e., publicly traded company multiples, growth rate, time to exit) due to the lack of observable inputs may significantly impact the resulting fair value and therefore each Fund’s results of operations. As a result, the price received upon the sale of an investment may be less than the value ascribed by each Fund, and each Fund could realize a greater than expected loss or lesser than expected gain upon the sale of the investment. Each Fund’s ability to value its investments may also be impacted by technological issues and/or errors by pricing services or other third-party service providers.
Counterparty Credit Risk: The Funds may be exposed to counterparty credit risk, or the risk that an entity may fail to or be unable to perform on its commitments related to unsettled or open transactions, including making timely interest and/or principal payments or otherwise honoring its obligations. The Funds manage counterparty credit risk by entering into transactions only with counterparties that BFA believes have the financial resources to honor their obligations and by monitoring the financial stability of those counterparties. Financial assets, which potentially expose the Funds to market, issuer and counterparty credit risks, consist principally of financial instruments and receivables due from counterparties. The extent of the Funds’ exposure to market, issuer and counterparty credit risks with respect to these financial assets is approximately their value recorded in the Statements of Assets and Liabilities, less any collateral held by the Funds.
A derivative contract may suffer a mark-to-market loss if the value of the contract decreases due to an unfavorable change in the market rates or values of the underlying instrument. Losses can also occur if the counterparty does not perform under the contract.
With exchange-traded futures, there is less counterparty credit risk to the Funds since the exchange or clearinghouse, as counterparty to such instruments, guarantees against a possible default. The clearinghouse stands between the buyer and the seller of the contract; therefore, credit risk is limited to failure of the clearinghouse. While offset rights may exist under applicable law, a fund does not have a contractual right of offset against a clearing broker or clearinghouse in the event of a default (including the bankruptcy or insolvency). Additionally, credit risk exists in exchange-traded futures with respect to initial and variation margin that is held in a clearing broker’s customer accounts. While clearing brokers are required to segregate customer margin from their own assets, in the event that a clearing broker becomes insolvent or goes into bankruptcy and at that time there is a shortfall in the aggregate amount of margin held by the clearing broker for all its clients, typically the shortfall would be allocated on a pro rata basis across all the clearing broker’s customers, potentially resulting in losses to the Funds.
Geographic/Asset Class Risk: A diversified portfolio, where this is appropriate and consistent with a fund’s objectives, minimizes the risk that a price change of a particular investment will have a material impact on the NAV of a fund. The investment concentrations within each Fund’s portfolio are disclosed in its Schedule of Investments.
The Funds invest a significant portion of their assets in securities of issuers located in the United States. A decrease in imports or exports, changes in trade regulations, inflation and/or an economic recession in the United States may have a material adverse effect on the U.S. economy and the securities listed on U.S. exchanges. Proposed and adopted policy and legislative changes in the United States may also have a significant effect on U.S. markets generally, as well as on the value of certain securities. Governmental agencies project that the United States will continue to maintain elevated public debt levels for the foreseeable future which may constrain future economic growth. Circumstances could arise that could prevent the timely payment of interest or principal on U.S. government debt, such as reaching the legislative “debt ceiling.” Such non-payment would result in substantial negative consequences for the U.S. economy and the global financial system. If U.S. relations with certain countries deteriorate, it could adversely affect issuers that rely on the United States for trade. The United States has also experienced increased internal unrest and discord. If these trends were to continue, they may have an adverse impact on the U.S. economy and the issuers in which the the Funds invest.
Certain Funds invest a significant portion of their assets in securities of issuers located in Europe or with significant exposure to European issuers or countries. The European financial markets have recently experienced volatility and adverse trends due to concerns about economic downturns in, or rising government debt levels of, several European countries as well as acts of war in the region. These events may spread to other countries in Europe and may affect the value and liquidity of certain of the Funds’ investments.
Responses to the financial problems by European governments, central banks and others, including austerity measures and reforms, may not work, may result in social unrest and may limit future growth and economic recovery or have other unintended consequences. Further defaults or restructurings by governments and others of their debt could have additional adverse effects on economies, financial markets and asset valuations around the world. The United Kingdom has withdrawn from the European Union, and one or more other countries may withdraw from the European Union and/or abandon the Euro, the common currency of the European Union. These events and actions have adversely affected, and may in the future adversely affect, the value and exchange rate of the Euro and may continue to significantly affect the economies of every country in Europe, including countries that do not use the Euro and non-European Union member states. The impact of these actions, especially if they occur in a disorderly fashion, is not clear but could be significant and far reaching. In addition, Russia launched a large-scale invasion of Ukraine on February 24, 2022. The extent and duration of the military action, resulting sanctions and resulting future market disruptions in the region are impossible to predict, but have been, and may continue to be, significant and have a severe adverse effect on the region, including significant negative impacts on the economy and the markets for certain securities and commodities, such as oil and natural gas, as well as other sectors.
Certain Funds invest a significant portion of their assets in securities within a single or limited number of market sectors. When a fund concentrates its investments in this manner, it assumes the risk that economic, regulatory, political and social conditions affecting such sectors may have a significant impact on the fund and could affect the income from, or the value or liquidity of, the fund’s portfolio.
942024 iShares Annual Report to Shareholders
Notes to Financial Statements (continued)
Significant Shareholder Redemption Risk: Certain shareholders may own or manage a substantial amount of fund shares and/or hold their fund investments for a limited period of time. Large redemptions of fund shares by these shareholders may force a fund to sell portfolio securities, which may negatively impact the fund’s NAV, increase the fund’s brokerage costs, and/or accelerate the realization of taxable income/gains and cause the fund to make additional taxable distributions to shareholders.
11. CAPITAL SHARE TRANSACTIONS
Capital shares are issued and redeemed by each Fund only in aggregations of a specified number of shares or multiples thereof (“Creation Units”) at NAV. Except when aggregated in Creation Units, shares of each Fund are not redeemable.
Transactions in capital shares were as follows:
| | |
| | | | |
| | | | |
| | | | |
| | | | |
| | | | |
Global Consumer Discretionary | | | | |
| | | | |
| | | | |
| | | | |
| | | | |
| | | | |
| | | | |
| | | | |
| | | | |
| | | | |
| | | | |
| | | | |
| | | | |
| | | | |
| | | | |
| | | | |
| | | | |
| | | | |
| | | | |
| | | | |
| | | | |
| | | | |
| | | | |
| | | | |
| | | | |
| | | | |
| | | | |
| | | | |
| | | | |
| | | | |
| | | | |
| | | | |
| | | | |
| | | | |
| | | | |
| | | | |
The consideration for the purchase of Creation Units of a fund in the Trust generally consists of the in-kind deposit of a designated portfolio of securities and a specified amount of cash. Certain funds in the Trust may be offered in Creation Units solely or partially for cash in U.S. dollars. Authorized Participants purchasing and redeeming
Notes to Financial Statements95
Notes to Financial Statements (continued)
Creation Units may pay a purchase transaction fee and a redemption transaction fee directly to State Street Bank and Trust Company, the Trust’s administrator, to offset transfer and other transaction costs associated with the issuance and redemption of Creation Units, including Creation Units for cash. Authorized Participants transacting in Creation Units for cash may also pay an additional variable charge to compensate the relevant fund for certain transaction costs (i.e., stamp taxes, taxes on currency or other financial transactions, and brokerage costs) and market impact expenses relating to investing in portfolio securities. Such variable charges, if any, are included in shares sold in the table above.
From time to time, settlement of securities related to in-kind contributions or in-kind redemptions may be delayed. In such cases, securities related to in-kind transactions are reflected as a receivable or a payable in the Statements of Assets and Liabilities.
12. FOREIGN WITHHOLDING TAX CLAIMS
The Internal Revenue Service (“IRS”) has issued guidance to address U.S. income tax liabilities attributable to fund shareholders resulting from the recovery of foreign taxes withheld in prior calendar years. These withheld foreign taxes were passed through to shareholders in the form of foreign tax credits in the year the taxes were withheld. Assuming there are sufficient foreign taxes paid which the iShares Global Materials ETF is able to pass through to shareholders as a foreign tax credit in the current year, the Fund will be able to offset the prior years’ withholding taxes recovered against the foreign taxes paid in the current year. Accordingly, no federal income tax liability is recorded by the Fund.
The iShares Global Comm Services ETF, iShares Global Energy ETF, iShares Global Financials ETF and iShares Global Utilities ETF are seeking a closing agreement with the Internal Revenue Service (“IRS”) to address any prior years’ U.S. income tax liabilities attributable to Fund shareholders resulting from the recovery of foreign taxes. The closing agreement would result in the Funds paying a compliance fee to the IRS, on behalf of its shareholders, representing the estimated tax savings generated from foreign tax credits claimed by Fund shareholders on their tax returns in prior years. The Funds have accrued a liability for the estimated IRS compliance fee related to foreign withholding tax claims, which is disclosed in the Statements of Assets and Liabilities. The actual IRS compliance fee may differ from the estimate and that difference may be material.
During the year, the iShares Global Comm Services ETF, iShares Global Financials ETF, iShares Global Industrials ETF and iShares Global Utilities ETF filed a closing agreement with the IRS related to the recovery of foreign taxes received in fiscal years 2021 and 2022, and the related tax compliance fee, including interest, was paid to the IRS.
13. SUBSEQUENT EVENTS
Management has evaluated the impact of all subsequent events on the Funds through the date the financial statements were available to be issued and has determined that there were no subsequent events requiring adjustment or additional disclosure in the financial statements.
962024 iShares Annual Report to Shareholders
Report of Independent Registered Public Accounting Firm
To the Board of Trustees of
iShares Trust and Shareholders of each of the ten funds listed in the table below
Opinions on the Financial Statements
We have audited the accompanying statements of assets and liabilities, including the schedules of investments, of each of the funds listed in the table below (ten of the funds constituting iShares Trust, hereafter collectively referred to as the "Funds") as of March 31, 2024, the related statements of operations for the year ended March 31, 2024, the statements of changes in net assets for each of the two years in the period ended March 31, 2024, including the related notes, and the financial highlights for each of the five years in the period ended March 31, 2024 (collectively referred to as the “financial statements”). In our opinion, the financial statements present fairly, in all material respects, the financial position of each of the Funds listed in the table below as of March 31, 2024, the results of each of their operations for the year then ended, the changes in each of their net assets for each of the two years in the period ended March 31, 2024 and each of the financial highlights for each of the five years in the period ended March 31, 2024 in conformity with accounting principles generally accepted in the United States of America.
iShares Global Comm Services ETF |
iShares Global Consumer Discretionary ETF |
iShares Global Consumer Staples ETF |
iShares Global Energy ETF |
iShares Global Financials ETF |
iShares Global Healthcare ETF |
iShares Global Industrials ETF |
iShares Global Materials ETF |
|
iShares Global Utilities ETF |
Basis for Opinions
These financial statements are the responsibility of the Funds’ management. Our responsibility is to express an opinion on the Funds’ financial statements based on our audits. We are a public accounting firm registered with the Public Company Accounting Oversight Board (United States) (PCAOB) and are required to be independent with respect to the Funds in accordance with the U.S. federal securities laws and the applicable rules and regulations of the Securities and Exchange Commission and the PCAOB.
We conducted our audits of these financial statements in accordance with the standards of the PCAOB. Those standards require that we plan and perform the audit to obtain reasonable assurance about whether the financial statements are free of material misstatement, whether due to error or fraud.
Our audits included performing procedures to assess the risks of material misstatement of the financial statements, whether due to error or fraud, and performing procedures that respond to those risks. Such procedures included examining, on a test basis, evidence regarding the amounts and disclosures in the financial statements. Our audits also included evaluating the accounting principles used and significant estimates made by management, as well as evaluating the overall presentation of the financial statements. Our procedures included confirmation of securities owned as of March 31, 2024 by correspondence with the custodian, transfer agent and brokers; when replies were not received from brokers, we performed other auditing procedures. We believe that our audits provide a reasonable basis for our opinions.
/s/PricewaterhouseCoopers LLP
Philadelphia, Pennsylvania
May 23, 2024
We have served as the auditor of one or more BlackRock investment companies since 2000.
Report of Independent Registered Public Accounting Firm97
Important Tax Information (unaudited)
The following amounts, or maximum amounts allowable by law, are hereby designated as qualified dividend income for individuals for the fiscal year ended March 31, 2024:
| |
| |
Global Consumer Discretionary | |
| |
| |
| |
| |
| |
| |
| |
| |
The Fund intends to pass through to its shareholders the following amount, or maximum amount allowable by law, of foreign source income earned and foreign taxes paid for the fiscal year ended March 31, 2024:
| Foreign Source
Income Earned | |
| | |
The following percentage, or maximum percentage allowable by law, of ordinary income distributions paid during the fiscal year ended March 31, 2024 qualified for the dividends-received deduction for corporate shareholders:
| Dividends-Received
Deduction |
| |
Global Consumer Discretionary | |
| |
| |
| |
| |
| |
| |
| |
| |
982024 iShares Annual Report to Shareholders
Statement Regarding Liquidity Risk Management Program (unaudited)
In compliance with Rule 22e-4 under the Investment Company Act of 1940, as amended (the “Liquidity Rule”), iShares Trust (the “Trust”) has adopted and implemented a liquidity risk management program (the “Program”) for iShares Global Comm Services ETF, iShares Global Consumer Discretionary ETF, iShares Global Consumer Staples ETF, iShares Global Energy ETF, iShares Global Financials ETF, iShares Global Healthcare ETF, iShares Global Industrials ETF, iShares Global Materials ETF, iShares Global Tech ETF and iShares Global Utilities ETF (the “Funds” or “ETFs”), each a series of the Trust, which is reasonably designed to assess and manage each Fund’s liquidity risk.
The Board of Trustees (the “Board”) of the Trust, on behalf of the Funds, met on December 8, 2023 (the “Meeting”) to review the Program. The Board previously appointed BlackRock Fund Advisors (“BlackRock”), the investment adviser to the Funds, as the program administrator for each Fund’s Program. BlackRock also previously delegated oversight of the Program to the 40 Act Liquidity Risk Management Committee (the “Committee”). At the Meeting, the Committee, on behalf of BlackRock, provided the Board with a report that addressed the operation of the Program and assessed its adequacy and effectiveness of implementation, including the management of each Fund’s Highly Liquid Investment Minimum (“HLIM”) where applicable, and any material changes to the Program (the “Report”). The Report covered the period from October 1, 2022 through September 30, 2023 (the “Program Reporting Period”).
The Report described the Program’s liquidity classification methodology for categorizing each Fund’s investments (including derivative transactions) into one of four liquidity buckets. It also referenced the methodology used by BlackRock to establish each Fund’s HLIM and noted that the Committee reviews and ratifies the HLIM assigned to each Fund no less frequently than annually. The Report also discussed notable events affecting liquidity over the Program Reporting Period, including extended market holidays, delays in the repatriation of the local currency in certain non-U.S. countries, the continued illiquidity of Russian equity securities and the suspension of select sanctions in Venezuela.
The Report noted that the Program complied with the key factors for consideration under the Liquidity Rule for assessing, managing and periodically reviewing each Fund’s liquidity risk, as follows:
a) The Fund’s investment strategy and liquidity of portfolio investments during both normal and reasonably foreseeable stressed conditions. During the Program Reporting Period, the Committee reviewed whether each Fund’s strategy is appropriate for an open-end fund structure, with a focus on funds with more significant and consistent holdings of less liquid and illiquid assets. The Committee also factored a fund’s concentration in an issuer into the liquidity classification methodology by taking issuer position sizes into account. Derivative exposure was also considered in the calculation of a fund’s liquidity bucketing. Finally, a factor for consideration under the Liquidity Rule is a Fund’s use of borrowings for investment purposes. However, the Funds do not borrow for investment purposes.
b) Short-term and long-term cash flow projections during both normal and reasonably foreseeable stressed conditions. During the Program Reporting Period, the Committee reviewed historical redemption activity and used this information as a component to establish each ETF’s reasonably anticipated trading size utilized for liquidity classifications. The Committee may also take into consideration a fund’s shareholder ownership concentration (which, depending on product type and distribution channel, may or may not be available), a fund’s distribution channels, and the degree of certainty associated with a fund’s short-term and long-term cash flow projections.
c) Holdings of cash and cash equivalents, as well as borrowing arrangements. The Committee considered that ETFs generally do not hold more than de minimis amounts of cash. The Committee also considered that ETFs generally do not engage in borrowing.
d) The relationship between an ETF’s portfolio liquidity and the way in which, and the prices and spreads at which, ETF shares trade, including the efficiency of the arbitrage function and the level of active participation by market participants, including authorized participants. The Committee monitored the prevailing bid/ask spread and the ETF price premium (or discount) to NAV for all ETFs. However, there were no ETFs with persistent deviations of fund premium/discount or bid/ask spreads from long-term averages over the Program Reporting Period.
e) The effect of the composition of baskets on the overall liquidity of an ETF’s portfolio. In reviewing the linkage between the composition of custom baskets accepted by an ETF and any significant change in the liquidity profile of such ETF, the Committee reviewed changes in the proportion of each ETF’s portfolio comprised of less liquid and illiquid holdings to determine if applicable thresholds were met requiring enhanced review. There were no ETFs for which the custom baskets accepted by the ETF had a significant change in its liquidity profile.
There were no material changes to the Program during the Program Reporting Period other than the enhancement of certain model components in the Program’s classification methodology. The Report provided to the Board stated that the Committee concluded that based on the operation of the functions, as described in the Report, the Program is operating as intended and is effective in implementing the requirements of the Liquidity Rule.
Statement Regarding Liquidity Risk Management Program99
Supplemental Information (unaudited)
Section 19(a) Notices
The amounts and sources of distributions reported are estimates and are being provided pursuant to regulatory requirements and are not being provided for tax reporting purposes. The actual amounts and sources for tax reporting purposes will depend upon each Fund’s investment experience during the year and may be subject to changes based on tax regulations. Shareholders will receive a Form 1099-DIV each calendar year that will inform them how to report these distributions for federal income tax purposes.
March 31, 2024
| Total Cumulative Distributions
for the Fiscal Year | % Breakdown of the Total Cumulative
Distributions for the Fiscal Year |
| | Net Realized
Capital Gains | | | | Net Realized
Capital Gains | | |
| | | | | | | | |
| | | | | | | | |
| | | | | | | | |
| | | | | | | | |
| | | | | | | | |
| The Fund estimates that it has distributed more than its net investment income and net realized capital gains; therefore, a portion of the distribution may be a return of capital. A return of capital may occur, for example, when some or all of the shareholder's investment in the Fund is returned to the shareholder. A return of capital does not necessarily reflect the Fund’s investment performance and should not be confused with “yield” or “income”. When distributions exceed total return performance, the difference will incrementally reduce the Fund’s net asset value per share. |
Tailored Shareholder Reports for Open-End Mutual Funds and ETFs
Effective January 24, 2023, the SEC adopted rule and form amendments to require open-end mutual funds and ETFs to transmit concise and visually engaging streamlined annual and semiannual reports to shareholders that highlight key information. Other information, including financial statements, will no longer appear in a streamlined shareholder report but must be available online, delivered free of charge upon request, and filed on a semiannual basis on Form N-CSR. The rule and form amendments have a compliance date of July 24, 2024. At this time, management is evaluating the impact of these amendments on the shareholder reports for the Funds.
Premium/Discount Information
Information on the Fund's net asset value, market price, premiums and discounts, and bid-ask spreads can be found at iShares.com.
Regulation under the Alternative Investment Fund Managers Directive
The Alternative Investment Fund Managers Directive, and its United Kingdom (“UK”) equivalent, (the “AIFMD”) impose detailed and prescriptive obligations on fund managers established in the European Union (the “EU”) and the UK. These do not currently apply to managers established outside of the EU or UK, such as BFA (the “Company”). However, the Company is required to comply with certain disclosure, reporting and transparency obligations of the AIFMD because it has registered the iShares Global Consumer Staples ETF and iShares Global Energy ETF (the “Funds”) to be marketed to investors in the EU and/or UK.
Report on Remuneration
BlackRock has a clear and well-defined pay-for-performance philosophy, and compensation programs which support that philosophy.
BlackRock operates a total compensation model for remuneration which includes a base salary, which is contractual, and a discretionary bonus scheme. Although all employees are eligible to receive a discretionary bonus, there is no contractual obligation to make a discretionary bonus award to any employees. For senior management and staff who have the ability to materially affect the risk profile of the Funds, a significant percentage of variable remuneration is deferred over time. All employees are subject to a clawback policy.
Remuneration decisions for employees are made once annually in January following the end of the performance year, based on BlackRock’s full-year financial results and other non-financial goals and objectives. Alongside financial performance, individual total compensation is also based on strategic and operating results and other considerations such as management and leadership capabilities. No set formulas are established and no fixed benchmarks are used in determining annual incentive awards.
Annual incentive awards are paid from a bonus pool which is reviewed throughout the year by BlackRock's independent compensation committee, taking into account both actual and projected financial information together with information provided by the Enterprise Risk and Regulatory Compliance departments in relation to any activities, incidents or events that warrant consideration in making compensation decisions. Individuals are not involved in setting their own remuneration.
Each of the control functions (Enterprise Risk, Legal & Compliance, Finance, Human Resources and Internal Audit) each have their own organizational structures which are independent of the business units and therefore staff members in control functions are remunerated independently of the businesses they oversee. Functional bonus
1002024 iShares Annual Report to Shareholders
Supplemental Information (unaudited) (continued)
pools for those control functions are determined with reference to the performance of each individual function and the remuneration of the senior members of control functions is directly overseen by BlackRock's independent remuneration committee.
The Company is required under the AIFMD to make quantitative disclosures of remuneration. These disclosures are made in line with BlackRock’s interpretation of currently available regulatory guidance on quantitative remuneration disclosures. As market or regulatory practice develops BlackRock may consider it appropriate to make changes to the way in which quantitative remuneration disclosures are calculated. Where such changes are made, this may result in disclosures in relation to a fund not being comparable to the disclosures made in the prior year, or in relation to other BlackRock fund disclosures in that same year. BlackRock bases its proportionality approach on a combination of factors that it is entitled to take into account based on relevant guidelines.
Remuneration information at an individual AIF level is not readily available. Disclosures are provided in relation to (a) the staff of the Company; (b) staff who are senior management; (c) staff who have the ability to materially affect the risk profile of the Funds; and (d) staff of companies to which portfolio management and risk management has been formally delegated.
All individuals included in the aggregated figures disclosed are rewarded in line with BlackRock’s remuneration policy for their responsibilities across the relevant BlackRock business area. As all individuals have a number of areas of responsibilities, only the portion of remuneration for those individuals’ services attributable to the Funds is included in the aggregate figures disclosed.
Members of staff and senior management of the Company typically provide both AIFMD and non-AIFMD related services in respect of multiple funds, clients and functions of the Company and across the broader BlackRock group. Conversely, members of staff and senior management of the broader BlackRock group may provide both AIFMD and non-AIFMD related services in respect of multiple funds, clients and functions of the broader BlackRock group and of the Company. Therefore, the figures disclosed are a sum of individuals’ portion of remuneration attributable to the Company according to an objective apportionment methodology which acknowledges the multiple-service nature of the Company and the broader BlackRock group. Accordingly, the figures are not representative of any individual’s actual remuneration or their remuneration structure.
The amount of the total remuneration awarded to the Company’s staff in respect of the Company’s financial year ending December 31, 2023 was USD 5.43m. This figure is comprised of fixed remuneration of USD 0.74m and variable remuneration of USD 4.68m. There was a total of 8 beneficiaries of the remuneration described above.
The amount of the aggregate remuneration awarded by the Company in respect of the Company’s financial year ending December 31, 2023, to its senior management was USD 3.66m, and to other members of its staff whose actions potentially have a material impact on the risk profile of the Company or its funds was USD 1.77m.
Disclosures Under the EU Sustainable Finance Disclosure Regulation
The iShares Global Consumer Staples ETF and iShares Global Energy ETF (the “Funds”) are registered under the Alternative Investment Fund Managers Directive to be marketed to European Union (“EU”) investors, as noted above. As a result, certain disclosures are required under the EU Sustainable Finance Disclosure Regulation (“SFDR”).
Each Fund has not been categorized under the SFDR as an “Article 8” or “Article 9” product. In addition, each Fund’s investment strategy does not take into account the criteria for environmentally sustainable economic activities under the EU sustainable investment taxonomy regulation or principal adverse impacts (“PAIs”) on sustainability factors under the SFDR. PAIs are identified under the SFDR as the material impacts of investment decisions on sustainability factors relating to environmental, social and employee matters, respect for human rights, and anti-corruption and anti-bribery matters.
Supplemental Information101
Trustee and Officer Information (unaudited)
The Board of Trustees has responsibility for the overall management and operations of the Funds, including general supervision of the duties performed by BFA and other service providers. Each Trustee serves until he or she resigns, is removed, dies, retires or becomes incapacitated. Each officer shall hold office until his or her successor is elected and qualifies or until his or her death, resignation or removal. Trustees who are not “interested persons” (as defined in the 1940 Act) of the Trust are referred to as independent trustees (“Independent Trustees”).
The registered investment companies advised by BFA or its affiliates (the “BlackRock-advised Funds”) are organized into one complex of open-end equity, multi-asset, index and money market funds and ETFs (the “BlackRock Multi-Asset Complex”), one complex of closed-end funds and open-end non-index fixed-income funds (including ETFs) (the “BlackRock Fixed-Income Complex”) and one complex of ETFs (“Exchange-Traded Fund Complex”) (each, a “BlackRock Fund Complex”). Each Fund is included in the Exchange-Traded Fund Complex. Each Trustee also serves as a Director of iShares, Inc. and a Trustee of iShares U.S. ETF Trust and, as a result, oversees all of the funds within the Exchange-Traded Fund Complex, which consists of 404 funds as of March 31, 2024. With the exception of Stephen Cohen, Robert S. Kapito and Aaron Wasserman, the address of each Trustee and officer is c/o BlackRock, Inc., 400 Howard Street, San Francisco, CA 94105. The address of Mr. Kapito and Mr. Wasserman is c/o BlackRock, Inc., 50 Hudson Yards, New York, NY 10001. The address of Mr. Cohen is c/o BlackRock, Inc., Drapers Gardens, 12 Throgmorton Avenue, London EC2N 2DL United Kingdom. The Board has designated John E. Kerrigan as its Independent Board Chair. Additional information about the Funds’ Trustees and officers may be found in the Funds’ combined Statement of Additional Information, which is available without charge, upon request, by calling toll-free 1-800-iShares (1-800-474-2737).
|
| | Principal Occupation(s)
During Past 5 Years | Other Directorships Held by Trustee |
| | President of BlackRock, Inc. (since 2006); Vice Chairman of BlackRock, Inc. and Head of BlackRock’s Portfolio Management Group (since its formation in 1998) and BlackRock, Inc.’s predecessor entities (since 1988); Trustee, University of Pennsylvania (since 2009); President of Board of Directors, Hope & Heroes Children’s Cancer Fund (since 2002). | Director of BlackRock, Inc. (since 2006); Director of iShares, Inc. (since 2009); Trustee of iShares U.S. ETF Trust (since 2011). |
| | Senior Managing Director, Head of Global Product Solutions of BlackRock, Inc. (since 2024); Senior Managing Director, Head of Europe, Middle East and Africa Regions of BlackRock, Inc. (2021-2024); Head of iShares Index and Wealth in EMEA of BlackRock, Inc. (2017-2021); Global Head of Fixed Income Indexing of BlackRock, Inc. (2016-2017); Chief Investment Strategist for International Fixed Income and iShares of BlackRock, Inc. (2011-2015). | Director of iShares, Inc. (since 2024); Trustee of iShares U.S. ETF Trust (since 2024). |
(a) Robert S. Kapito is deemed to be an “interested person” (as defined in the 1940 Act) of the Trust due to his affiliations with BlackRock, Inc. and its affiliates. |
(b) Stephen Cohen is deemed to be an "interested person" (as defined in the 1940 Act) of the Trust due to his affiliations with BlackRock, Inc. and its affiliates. |
|
| | Principal Occupation(s)
During Past 5 Years | Other Directorships Held by Trustee |
| Trustee (since 2005); Independent Board Chair (since 2022). | Chief Investment Officer, Santa Clara University (since 2002). | Director of iShares, Inc. (since 2005); Trustee of iShares U.S. ETF Trust (since 2011); Independent Board Chair of iShares, Inc. and iShares U.S. ETF Trust (since 2022). |
| Trustee (since 2015); Risk Committee Chair (since 2016). | Consultant (since 2012); Member of the Audit Committee (2012-2018), Chair of the Nominating and Governance Committee (2017-2018) and Director of PHH Corporation (mortgage solutions) (2012-2018); Managing Director and Global Head of Financial Holding Company Governance & Assurance and the Global Head of Operational Risk Management of Morgan Stanley (2006-2012). | Director of iShares, Inc. (since 2015); Trustee of iShares U.S. ETF Trust (since 2015); Member of the Audit Committee (since 2016), Chair of the Audit Committee (since 2020) and Director of The Hanover Insurance Group, Inc. (since 2016). |
| Trustee (since 2017); Audit Committee Chair (since 2019). | Partner, KPMG LLP (2002-2016); Director of One Generation Away (since 2021). | Director of iShares, Inc. (since 2017); Trustee of iShares U.S. ETF Trust (since 2017). |
1022024 iShares Annual Report to Shareholders
Trustee and Officer Information (unaudited) (continued)
Independent Trustees (continued) |
| | Principal Occupation(s) During Past 5 Years | Other Directorships Held by Trustee |
| Trustee (since 2005); Nominating and Governance and Equity Plus Committee Chairs (since 2022). | Chair of the Finance Committee (since 2019) and Trustee and Member of the Finance, Audit and Quality Committees of Stanford Health Care (since 2016); Trustee of WNET, New York’s public media company (since 2011) and Member of the Audit Committee (since 2018), Investment Committee (since 2011) and Personnel Committee (since 2022); Member of the Wyoming State Investment Funds Committee (since 2022); Trustee of Forward Funds (14 portfolios) (2009-2018); Trustee of Salient MF Trust (4 portfolios) (2015-2018); Director of the Jackson Hole Center for the Arts (since 2021). | Director of iShares, Inc. (since 2005); Trustee of iShares U.S. ETF Trust (since 2011). |
| Trustee (since 2017); 15(c) Committee Chair (since 2017). | Senior Managing Director of New York Life Insurance Company (2010-2015). | Director of iShares, Inc. (since 2017); Trustee of iShares U.S. ETF Trust (since 2017); Director of Jackson Financial Inc. (since 2021). |
| Trustee (since 2003); Securities Lending Committee Chair (since 2019). | Director of Real Estate Equity Exchange, Inc. (since 2005); Director of Cloudera Foundation (2017-2020); and Director of Reading Partners (2012-2016). | Director of iShares, Inc. (since 2003); Trustee of iShares U.S. ETF Trust (since 2011). |
| Trustee (since 2011); Fixed-Income Plus Committee Chair (since 2019). | Dean, and George Pratt Shultz Professor of Accounting, University of Chicago Booth School of Business (since 2017); Advisory Board Member (since 2016) and Director (since 2020) of C.M. Capital Corporation; Chair of the Board for the Center for Research in Security Prices, LLC (since 2020); Director of WellBe Senior Medical (since 2023); Robert K. Jaedicke Professor of Accounting, Stanford University Graduate School of Business (2001-2017); Professor of Law (by courtesy), Stanford Law School (2005-2017); Senior Associate Dean for Academic Affairs and Head of MBA Program, Stanford University Graduate School of Business (2010-2016). | Director of iShares, Inc. (since 2011); Trustee of iShares U.S. ETF Trust (since 2011). |
|
| | Principal Occupation(s)
During Past 5 Years |
| | Managing Director of BlackRock, Inc. (since 2015); Head of Global Product Solutions, Americas of BlackRock, Inc. (since 2024) and Head of Sustainable and Transition Solutions of BlackRock, Inc. (2022-2024); Global Head of Corporate Strategy of BlackRock, Inc. (2019-2022); Chief of Staff to the CEO of BlackRock, Inc. (2017-2019). |
| Treasurer and Chief Financial Officer (since 2020). | Managing Director of BlackRock, Inc. (since 2019); Chief Financial Officer of iShares Delaware Trust Sponsor LLC, BlackRock Funds, BlackRock Funds II, BlackRock Funds IV, BlackRock Funds V and BlackRock Funds VI (since 2021). |
| Chief Compliance Officer (iShares, Inc. and iShares Trust, since 2023; iShares U.S. ETF Trust, since 2023). | Managing Director of BlackRock, Inc. (since 2018); Chief Compliance Officer of the BlackRock Multi-Asset Complex, the BlackRock Fixed-Income Complex and the Exchange-Traded Fund Complex (since 2023); Deputy Chief Compliance Officer for the BlackRock Multi-Asset Complex, the BlackRock Fixed-Income Complex and the Exchange-Traded Fund Complex (2014-2023). |
| | Managing Director of BlackRock, Inc. (since 2023); Director of BlackRock, Inc. (2018-2022). |
| Executive Vice President (since 2022). | Managing Director of BlackRock, Inc. (since 2018); Head of U.S. iShares Product (since 2022); Head of EII U.S. Product Engineering of BlackRock, Inc. (since 2021); Co-Head of EII’s Americas Portfolio Engineering of BlackRock, Inc. (2020-2021); Head of Developed Markets Portfolio Engineering of BlackRock, Inc. (2016-2019). |
| Executive Vice President (since 2022). | Managing Director of BlackRock, Inc. (since 2009); Co-Head of Index Equity of BlackRock, Inc. (since 2022). |
Trustee and Officer Information103
Trustee and Officer Information (unaudited) (continued)
|
| | Principal Occupation(s) During Past 5 Years |
| Executive Vice President (since 2022). | Managing Director of BlackRock, Inc. (since 2010); Head of Fixed Income Index Investments in the Americas and Head of San Francisco Core Portfolio Management of BlackRock, Inc. (since 2020). |
Effective July 1, 2023, Aaron Wasserman replaced Charles Park as Chief Compliance Officer. |
Effective February 1, 2024, Salim Ramji resigned as Trustee of the Trust. |
Effective March 5, 2024, Stephen Cohen replaced Salim Ramji as Trustee of the Trust. |
Effective March 5, 2024, Dominik Rohé resigned as President of the Trust. |
Effective March 5, 2024, Jessica Tan replaced Dominik Rohé as President of the Trust. |
Effective April 8, 2024, Laura Fergerson was appointed as Trustee of the Trust. |
Effective April 8, 2024, James Lam was appointed as Trustee of the Trust. |
1042024 iShares Annual Report to Shareholders
Electronic Delivery
Shareholders can sign up for e-mail notifications announcing that the shareholder report or prospectus has been posted on the iShares website at iShares.com. Once you have enrolled, you will no longer receive prospectuses and shareholder reports in the mail.
To enroll in electronic delivery:
• Go to icsdelivery.com.
• If your brokerage firm is not listed, electronic delivery may not be available. Please contact your broker-dealer or financial advisor.
Householding
Householding is an option available to certain fund investors. Householding is a method of delivery, based on the preference of the individual investor, in which a single copy of certain shareholder documents and Rule 30e-3 notices can be delivered to investors who share the same address, even if their accounts are registered under different names. Please contact your broker-dealer if you are interested in enrolling in householding and receiving a single copy of prospectuses and other shareholder documents, or if you are currently enrolled in householding and wish to change your householding status.
Availability of Quarterly Schedule of Investments
The Funds file their complete schedule of portfolio holdings with the SEC for the first and third quarters of each fiscal year as an exhibit to their reports on Form N-PORT. The Funds’ Forms N-PORT are available on the SEC’s website at sec.gov. Additionally, each Fund makes its portfolio holdings for the first and third quarters of each fiscal year available at iShares.com/fundreports.
Availability of Proxy Voting Policies and Proxy Voting Records
A description of the policies and procedures that the iShares Funds use to determine how to vote proxies relating to portfolio securities and information about how the iShares Funds voted proxies relating to portfolio securities during the most recent twelve-month period ending June 30 is available without charge, upon request (1) by calling toll-free 1-800-474-2737; (2) on the iShares website at iShares.com; and (3) on the SEC website at sec.gov.
A description of the Trust’s policies and procedures with respect to the disclosure of the Fund’s portfolio securities is available in the Fund Prospectus. The Fund discloses its portfolio holdings daily and provides information regarding its top holdings in Fund fact sheets at iShares.com.
Glossary of Terms Used in this Report
|
| American Depositary Receipt |
| |
1062024 iShares Annual Report to Shareholders
THIS PAGE INTENTIONALLY LEFT BLANK.
Want to know more?
iShares.com | 1-800-474-2737
This report is intended for the Funds’ shareholders. It may not be distributed to prospective investors unless it is preceded or accompanied by the current prospectus.
Investing involves risk, including possible loss of principal.
The iShares Funds are distributed by BlackRock Investments, LLC (together with its affiliates, “BlackRock”).
The iShares Funds are not sponsored, endorsed, issued, sold or promoted by S&P Dow Jones Indices LLC, nor does this company make any representation regarding the advisability of investing in the iShares Funds. BlackRock is not affiliated with the company listed above.
©2024 BlackRock, Inc. All rights reserved. iSHARES and BLACKROCK are registered trademarks of BlackRock, Inc. or its subsidiaries. All other marks are the property of their respective owners.
|
• iShares Asia 50 ETF | AIA | NASDAQ |
• iShares Blockchain and Tech ETF | IBLC | NYSE Arca |
• iShares Emerging Markets Infrastructure ETF | EMIF | NASDAQ |
• iShares Europe ETF | IEV | NYSE Arca |
• iShares Future Metaverse Tech and Communications ETF | IVRS | NYSE Arca |
• iShares India 50 ETF | INDY | NASDAQ |
• iShares International Developed Property ETF | WPS | NYSE Arca |
• iShares International Developed Small Cap Value Factor ETF | ISVL | Cboe BZX |
• iShares International Dividend Growth ETF | IGRO | Cboe BZX |
• iShares Latin America 40 ETF | ILF | NYSE Arca |
|

Rob Kapito
President, BlackRock Inc.
Dear Shareholder,
The combination of continued economic growth and cooling inflation provided a supportive backdrop for investors during the 12-month reporting period ended March 31, 2024. Higher interest rates helped to rein in inflation, and the Consumer Price Index decelerated substantially while remaining above pre-pandemic levels. A moderating labor market helped ease inflationary pressure, although wages continued to grow. Wage and job growth powered robust consumer spending, backstopping the economy. On October 7, 2023, Hamas launched a horrific attack on Israel. The ensuing war has had a significant humanitarian impact and could lead to heightened economic and market volatility. We see geopolitics as a structural market risk going forward. See our geopolitical risk dashboard at blackrock.com for more details.
Equity returns were robust during the period, as interest rates stabilized and the economy proved to be more resilient than many investors expected. The U.S. economy continued to show strength, and growth further accelerated in the second half of 2023. Large-capitalization U.S. stocks posted particularly substantial gains, supported by the performance of a few notable technology companies, while small-capitalization U.S. stocks’ advance was slower but still robust. Meanwhile, international developed market equities also gained strongly, while emerging market stocks advanced at a more modest pace.
The 10-year U.S. Treasury yield rose during the reporting period, as investors reacted to elevated inflation and attempted to anticipate future interest rate changes. However, higher yields drove positive returns overall for 10-year U.S. Treasuries and solid gains in shorter-duration U.S. Treasuries. The corporate bond market benefited from improving economic sentiment, although high-yield corporate bond prices fared significantly better than investment-grade bonds as demand from yield-seeking investors remained strong.
The U.S. Federal Reserve (the “Fed”), attempting to manage persistent inflation, raised interest rates twice during the 12-month period, but paused its tightening after its July meeting. The Fed also continued to reduce its balance sheet by not replacing some of the securities that reach maturity.
Supply constraints appear to have become an embedded feature of the new macroeconomic environment, making it difficult for developed economies to increase production without sparking higher inflation. Geopolitical fragmentation and an aging population risk further exacerbating these constraints, keeping the labor market tight and wage growth high. Although the Fed has stopped tightening for now, we believe that the new economic regime means that the Fed will need to maintain high rates for an extended period despite the market’s hopes for rapid interest rate cuts, as reflected in the ongoing rally. In this new regime, we anticipate greater volatility and dispersion of returns, creating more opportunities for selective portfolio management.
Looking at developed market stocks, we have an overweight stance on U.S. stocks overall, particularly given the promise of emerging AI technologies. We are also overweight Japanese stocks as shareholder-friendly policies generate increased investor interest, although we maintain an underweight stance on European stocks. In credit, there are selective opportunities in the near term despite tighter credit and financial conditions. For fixed income investing with a six- to twelve-month horizon, we see the most attractive investments in short-term U.S. Treasuries and hard-currency emerging market bonds.
Overall, our view is that investors need to think globally, position themselves to be prepared for a decarbonizing economy, and be nimble as market conditions change. We encourage you to talk with your financial advisor and visit iShares.com for further insight about investing in today’s markets.
Rob Kapito
President, BlackRock Inc.
Total Returns as of March 31, 2024 |
| | |
U.S. large cap equities
(S&P 500® Index) | | |
U.S. small cap equities
(Russell 2000® Index) | | |
International equities
(MSCI Europe, Australasia, Far East Index) | | |
Emerging market equities
(MSCI Emerging Markets Index) | | |
3-month Treasury bills
(ICE BofA 3-Month U.S. Treasury Bill Index) | | |
U.S. Treasury securities
(ICE BofA 10-Year U.S. Treasury Index) | | |
U.S. investment grade bonds
(Bloomberg U.S. Aggregate Bond Index) | | |
Tax-exempt municipal bonds
(Bloomberg Municipal Bond Index) | | |
U.S. high yield bonds
(Bloomberg U.S. Corporate High Yield 2% Issuer Capped Index) | | |
Past performance is not an indication of future results. Index performance is shown for illustrative purposes only. You cannot invest directly in an index. |
2This Page is not Part of Your Fund Report
iShares Trust
Global Market Overview
Global equity markets advanced during the 12 months ended March 31, 2024 (“reporting period”), supported by continued economic growth and moderating inflation in most parts of the world. The MSCI ACWI, a broad global equity index that includes both developed and emerging markets, returned 23.22% in U.S. dollar terms for the reporting period. Despite concerns about the impact of higher interest rates and rising prices, the global economy was resilient, posting moderate growth in 2023 at a similar pace to the prior year. Inflation began to subside in most regions of the world, as stabilizing energy prices and improved supply chains reduced pressure on consumers. However, geopolitical tensions were high during the reporting period, raising concerns about global economic disruptions from wars in Ukraine and Gaza. Following a terrorist attack on Israel by Hamas, Israel’s retaliation in Gaza and the resulting humanitarian impact raised tensions in the region, leading to counterstrikes between Israel, the U.S., and regional militant organizations. The events raised concerns among market participants that further escalation could lead to a broad regional war.
Among developed economies, the U.S. stood out, growing at a robust pace in 2023 despite elevated interest rates and persistent inflation. The U.S. consumer helped to power the expansion, as consumer spending continued to grow in both nominal and real (inflation-adjusted) terms. A strong labor market bolstered consumer spending, as employers continued to add jobs and average hourly wages increased notably. Consumer spending was also supported by higher asset values, as both home prices and strong equity performance increased household net worth. While improved supply chains eased goods inflation, the tight labor market kept labor costs near record highs, and growing services inflation was a significant driver of inflation’s overall persistence.
To counteract inflation, the U.S. Federal Reserve Bank (“Fed”) raised interest rates twice early in the reporting period, reaching the highest level since 2001. However, the Fed paused its interest rate increases thereafter as inflation edged down, keeping interest rates steady following its July 2023 meeting. The Fed also continued to decrease the size of its balance sheet by reducing the store of U.S. Treasuries it had accumulated to stabilize markets in the early phases of the coronavirus pandemic. Projections released by the Fed late in the reporting period included several interest rate decreases later in 2024, as it forecast that inflation would continue to moderate despite the robust economy.
European stocks posted strong gains as energy prices stabilized and inflation decelerated sharply. While growth in the Eurozone was nearly flat, the tepid economy meant that consumer spending was moderate, resulting in less upward pressure on prices. The European Central Bank (“ECB”) raised interest rates four times in the first half of the reporting period but declined to increase interest rates thereafter, citing progress in lowering inflation.
Asia-Pacific region stocks also advanced, albeit at a slower pace than other regions of the world. Japan returned to moderate growth in the fourth quarter of 2023 following a contraction in the third quarter. Solid exports, rising profits, and a series of corporate reforms bolstered Japanese equities. However, Chinese stocks were negatively impacted by investor concerns about government regulations and rising geopolitical tensions with the U.S. Meanwhile, emerging market stocks gained, helped by the pausing of interest rate increases from the Fed and the ECB. Stocks in India advanced significantly amid strong economic growth and robust corporate earnings, as India’s expanding middle class bolstered consumer spending.
42024 iShares Annual Report to Shareholders
Fund Summary as of March 31, 2024
Investment Objective
The iShares Asia 50 ETF (the “Fund”) seeks to track the investment results of an index composed of 50 of the largest Asian equities, as represented by the S&P Asia 50TM (the “Index”). The Fund invests in a representative sample of securities included in the Index that collectively has an investment profile similar to the Index. Due to the use of representative sampling, the Fund may or may not hold all of the securities that are included in the Index.
Performance
| Average Annual Total Returns | | |
| | | | | | | |
| | | | | | | |
| | | | | | | |
| | | | | | | |
| For financial reporting purposes, the market values of certain investments were adjusted as of the report date to reflect a March 29, 2024 price in instances where Asian markets were open for trading on that date. The Fund’s net asset value (“NAV”) was struck as of March 28, 2024, as U.S. markets were closed on March 29, 2024 due to a holiday. Accordingly, the NAV per share presented herein is different than the information previously published as of March 28, 2024. |
GROWTH OF $10,000 INVESTMENT(AT NET ASSET VALUE)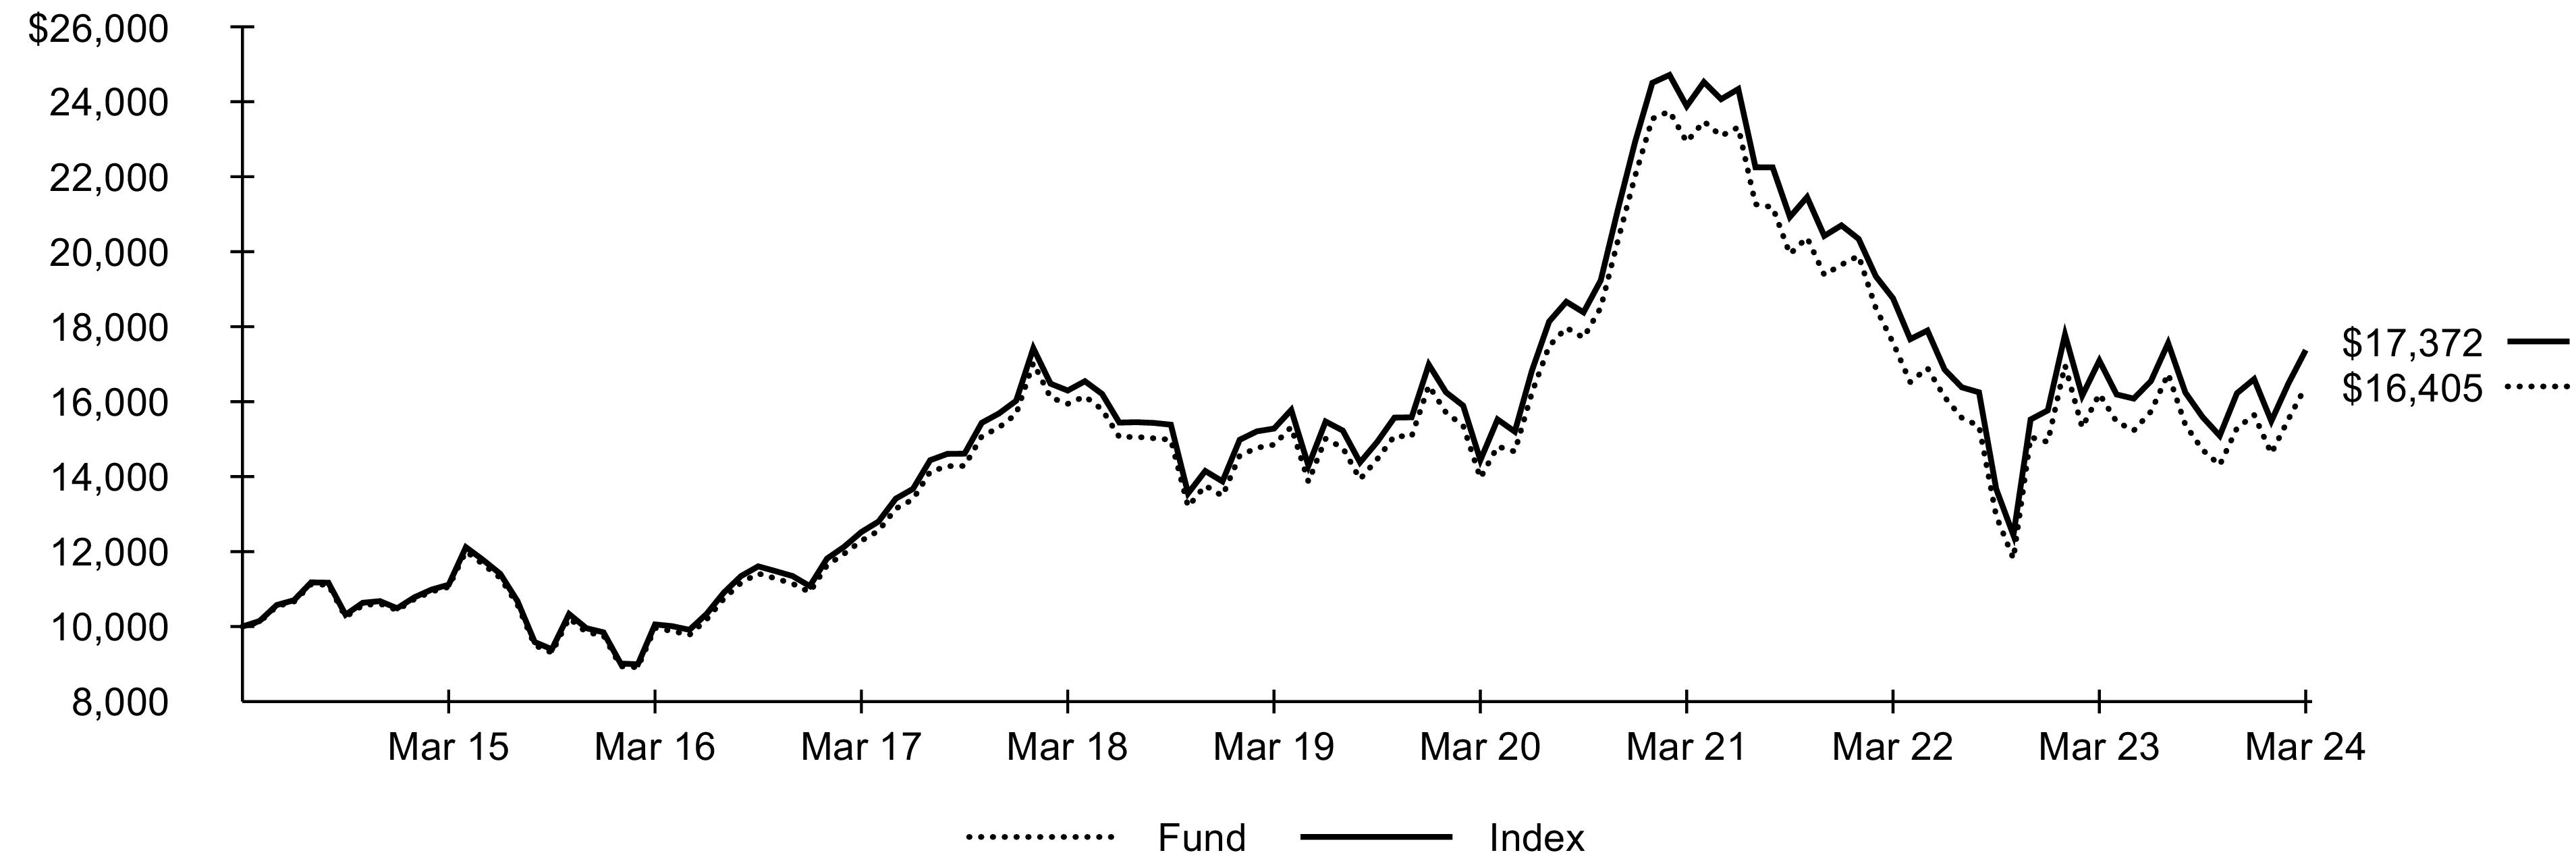
Past performance is not an indication of future results. Performance results do not reflect the deduction of taxes that a shareholder would pay on fund distributions or on the redemption or sale of fund shares. See “About Fund Performance” for more information.
Expense Example
| | |
Beginning
Account Value
(10/01/23) | Ending
Account Value
(03/31/24) | | Beginning
Account Value
(10/01/23) | Ending
Account Value
(03/31/24) | | |
| | | | | | |
| Expenses are equal to the annualized expense ratio, multiplied by the average account value over the period, multiplied by 183/366 (to reflect the one-half year period shown). Other fees, such as brokerage commissions and other fees to financial intermediaries, may be paid which are not reflected in the tables and examples above. See “Disclosure of Expenses” for more information. |
Fund Summary as of March 31, 2024 (continued)
Portfolio Management Commentary
Large-capitalization stocks in Asia rose modestly for the reporting period amid persistent global inflation, a prolonged economic slowdown in China, and ongoing geopolitical pressures. Taiwanese stocks contributed the most to the Index’s return, as the Taiwanese economy expanded steadily after the first quarter of 2023. Export demand surged beyond market expectations, consumer confidence improved to its highest level in two years, and the Taiwanese stock market attracted a record inflow of foreign investment.
The Taiwanese information technology sector advanced notably, led by the semiconductors industry. Demand for artificial intelligence (“AI”) applications and the hardware that drives the technology improved revenue for the world’s largest contract semiconductor chip maker. Stock in the semiconductor producer also rose after the company announced its plan to build a plant in Germany to meet rising demand for chips used in automotive applications.
South Korean stocks also contributed to the Index’s performance, as the country’s economy benefited from increased export demand in its information technology sector. Stocks in the technology hardware, storage, and peripherals industry rose after a large producer of memory chips reported new sales interest in the mass production of its high-bandwidth memory chips designed to be used in AI development. Stocks in Singapore further aided the Index’s return, as high interest rates bolstered banks’ net interest margins.
Chinese stocks detracted the most from the Index’s performance, as the sluggish Chinese economy entered a deflationary phase marked by falling consumer prices, a tumultuous, debt-laden property market, tepid factory activity, and a declining currency. The consumer discretionary sector was the largest source of weakness, as languishing consumer spending, driven in part by lower incomes, impacted e-commerce companies in the broadline retail industry. Stocks in the restaurants industry also declined, as heightened competition among delivery service providers constrained profitability. China’s communication services sector was a further detractor, as ongoing economic and regulatory turmoil weighed on revenue in the interactive media and services industry.
Portfolio Information
SECTOR ALLOCATION
| |
| |
| |
| |
| |
| |
| |
| |
Other (each representing less than 1%) | |
GEOGRAPHIC ALLOCATION
Country/Geographic Region | |
| |
| |
| |
| |
| |
| Excludes money market funds. |
62024 iShares Annual Report to Shareholders
Fund Summary as of March 31, 2024
iShares® Blockchain and Tech ETF
Investment Objective
The iShares Blockchain and Tech ETF (the “Fund”) seeks to track the investment results of an index composed of U.S. and non-U.S. companies that are involved in the development, innovation, and utilization of blockchain and crypto technologies; as represented by the NYSE FactSet Global Blockchain Technologies Index (the “Index”). The Fund invests in a representative sample of securities included in the Index that collectively has an investment profile similar to the Index. Due to the use of representative sampling, the Fund may or may not hold all of the securities that are included in the Index.
Performance
| Average Annual Total Returns | | |
| | | | | |
| | | | | |
| | | | | |
| | | | | |
| The NAV total return presented in the table for the one-year period differs from the same period return disclosed in the financial highlights. The total return in the financial highlights is calculated in the same manner but differs due to certain adjustments made for financial reporting purposes in accordance with U.S. generally accepted accounting principles. |
GROWTH OF $10,000 INVESTMENT(SINCE INCEPTION AT NET ASSET VALUE)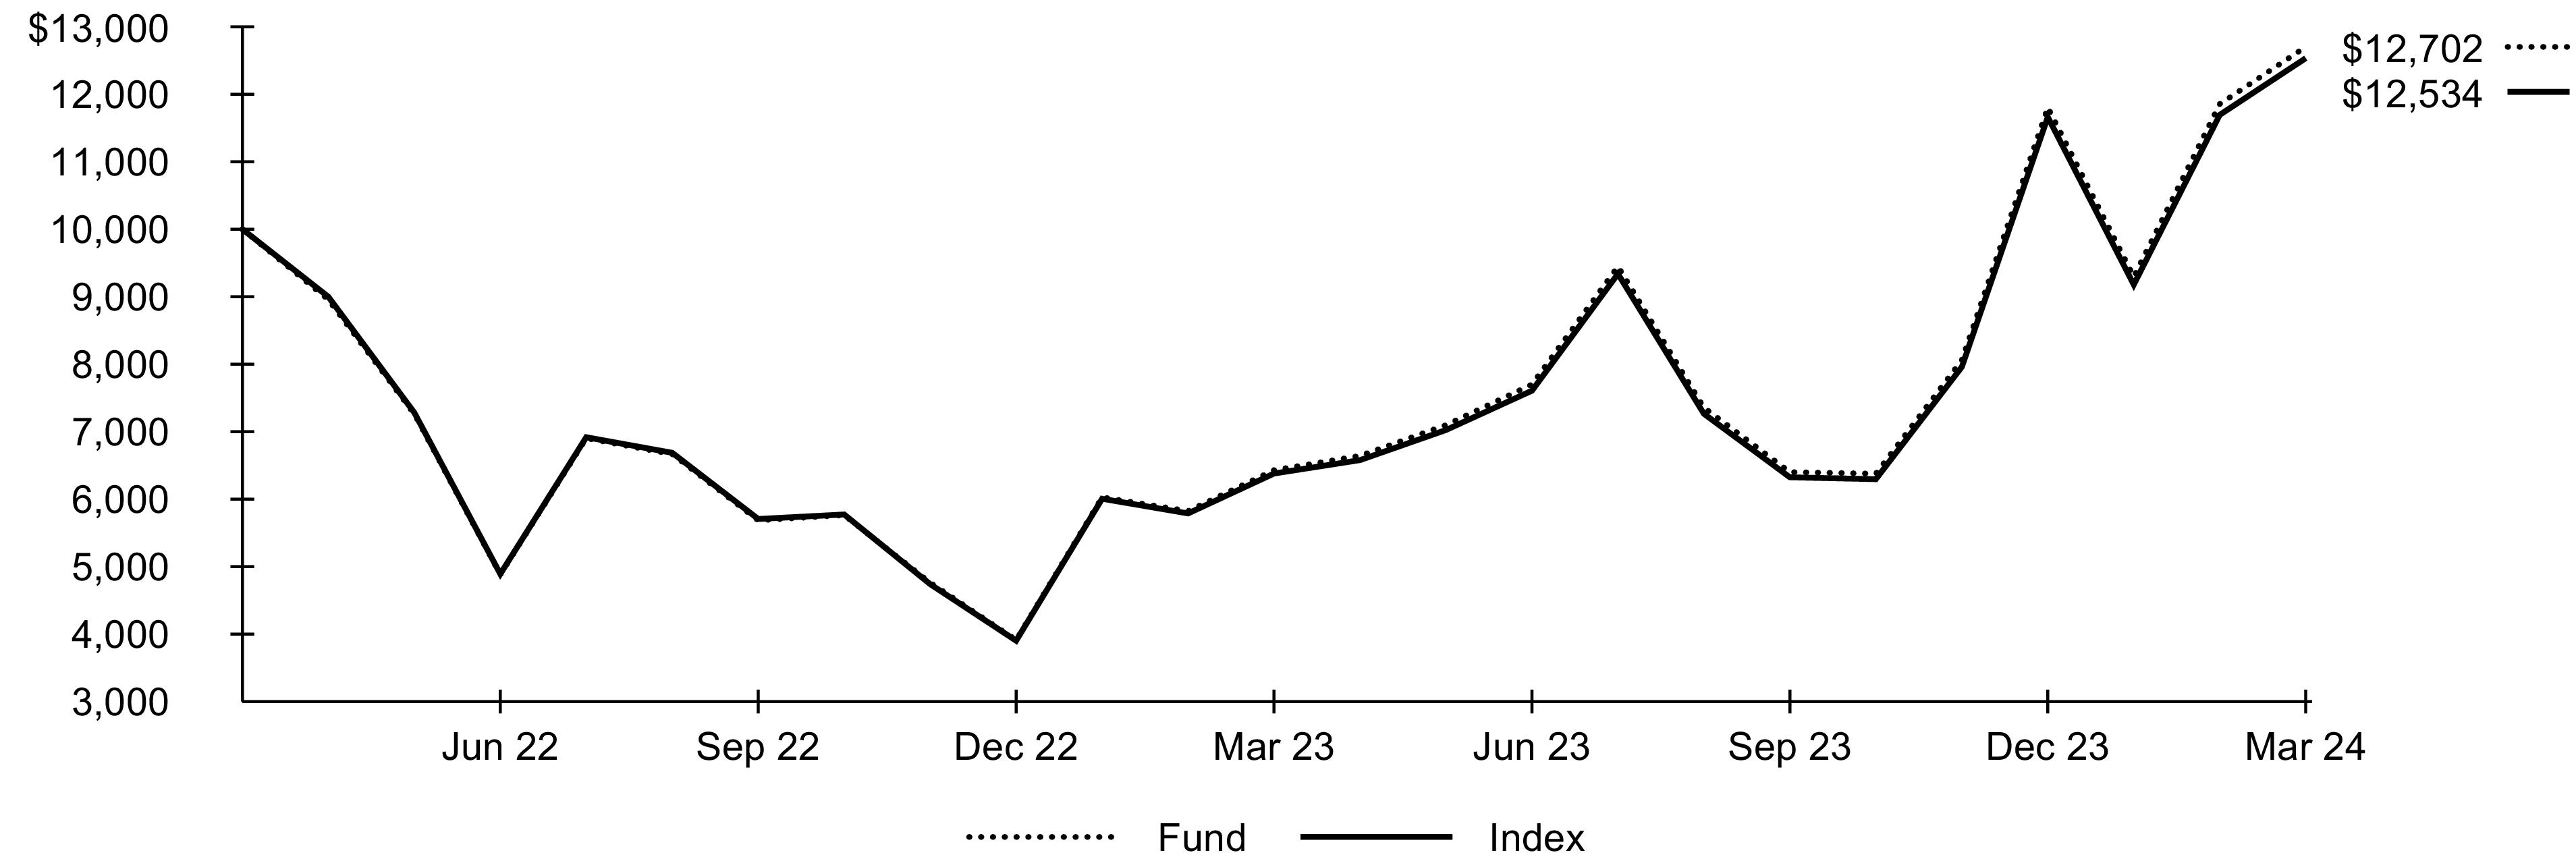
The inception date of the Fund was April 25, 2022. The first day of secondary market trading was April 27, 2022.
Certain sectors and markets performed exceptionally well based on market conditions during the one-year period. Achieving such exceptional returns involves the risk of volatility and investors should not expect that such exceptional returns will be repeated.
Past performance is not an indication of future results. Performance results do not reflect the deduction of taxes that a shareholder would pay on fund distributions or on the redemption or sale of fund shares. See “About Fund Performance” for more information.
Expense Example
| | |
Beginning
Account Value
(10/01/23) | Ending
Account Value
(03/31/24) | | Beginning
Account Value
(10/01/23) | Ending
Account Value
(03/31/24) | | |
| | | | | | |
| Expenses are equal to the annualized expense ratio, multiplied by the average account value over the period, multiplied by 183/366 (to reflect the one-half year period shown). Other fees, such as brokerage commissions and other fees to financial intermediaries, may be paid which are not reflected in the tables and examples above. See “Disclosure of Expenses” for more information. |
Fund Summary as of March 31, 2024 (continued)
iShares® Blockchain and Tech ETF
Portfolio Management Commentary
Global stocks of companies involved in the development, innovation, and utilization of blockchain and cryptocurrency technologies advanced significantly for the reporting period, amid substantial price gains for leading cryptocurrencies and increased adoption of blockchain applications across industries. The price of bitcoin more than doubled during the reporting period, due in part to a decrease in the yield on the 10-year U.S. Treasury, which led some investors to seek income from riskier market segments, including cryptocurrency. Additionally, a surge of investment by institutions and individuals in newly available cryptocurrency ETFs further supported the bitcoin rally. During the reporting period, the high-profile prosecution of a former cryptocurrency executive for fraud drew considerable public scrutiny, but some industry insiders viewed the guilty verdict as a positive development with the potential to increase trust in companies that trade cryptocurrencies.
Stocks in the U.S., which represented approximately 68% of the Index on average for the reporting period, contributed the most to the Index’s performance, led by the application software industry. Companies in the industry that derive the bulk of their revenue from bitcoin mining — the energy-intensive process of creating new bitcoins by solving cryptographic problems — advanced in an environment of rising bitcoin prices and increased global adoption of bitcoin as an alternative currency. A focus on increased efficiency in operations and capital expenditure drove higher-than-expected earnings for an established bitcoin miner. The acquisition of additional mining facilities significantly increased the company’s computational power for completing transactions, boosting investor sentiment.
Lower winter temperatures enabled increased production and correspondingly robust revenue for an application software company that chiefly uses alternative energy sources, such as nuclear, hydroelectric, and solar power, in its bitcoin mining operations. The company also reduced its debt substantially, further supporting investor optimism.
The application software industries in Canada and Australia also contributed to the Index’s performance. In both countries, bitcoin mining companies advanced as they expanded their power capacity for data mining.
Portfolio Information
TEN LARGEST HOLDINGS
| |
Coinbase Global Inc., Class A | |
| |
Marathon Digital Holdings Inc. | |
| |
| |
| |
| |
| |
International Business Machines Corp. | |
| |
| Excludes money market funds. |
82024 iShares Annual Report to Shareholders
Fund Summary as of March 31, 2024
iShares® Emerging Markets Infrastructure ETF
Investment Objective
The iShares Emerging Markets Infrastructure ETF (the “Fund”) seeks to track the investment results of an index composed of 30 of the largest equities in the emerging markets infrastructure industry, as represented by the S&P Emerging Markets Infrastructure IndexTM (the “Index”). The Fund invests in a representative sample of securities included in the Index that collectively has an investment profile similar to the Index. Due to the use of representative sampling, the Fund may or may not hold all of the securities that are included in the Index.
Performance
| Average Annual Total Returns | | |
| | | | | | | |
| | | | | | | |
| | | | | | | |
| | | | | | | |
GROWTH OF $10,000 INVESTMENT(AT NET ASSET VALUE)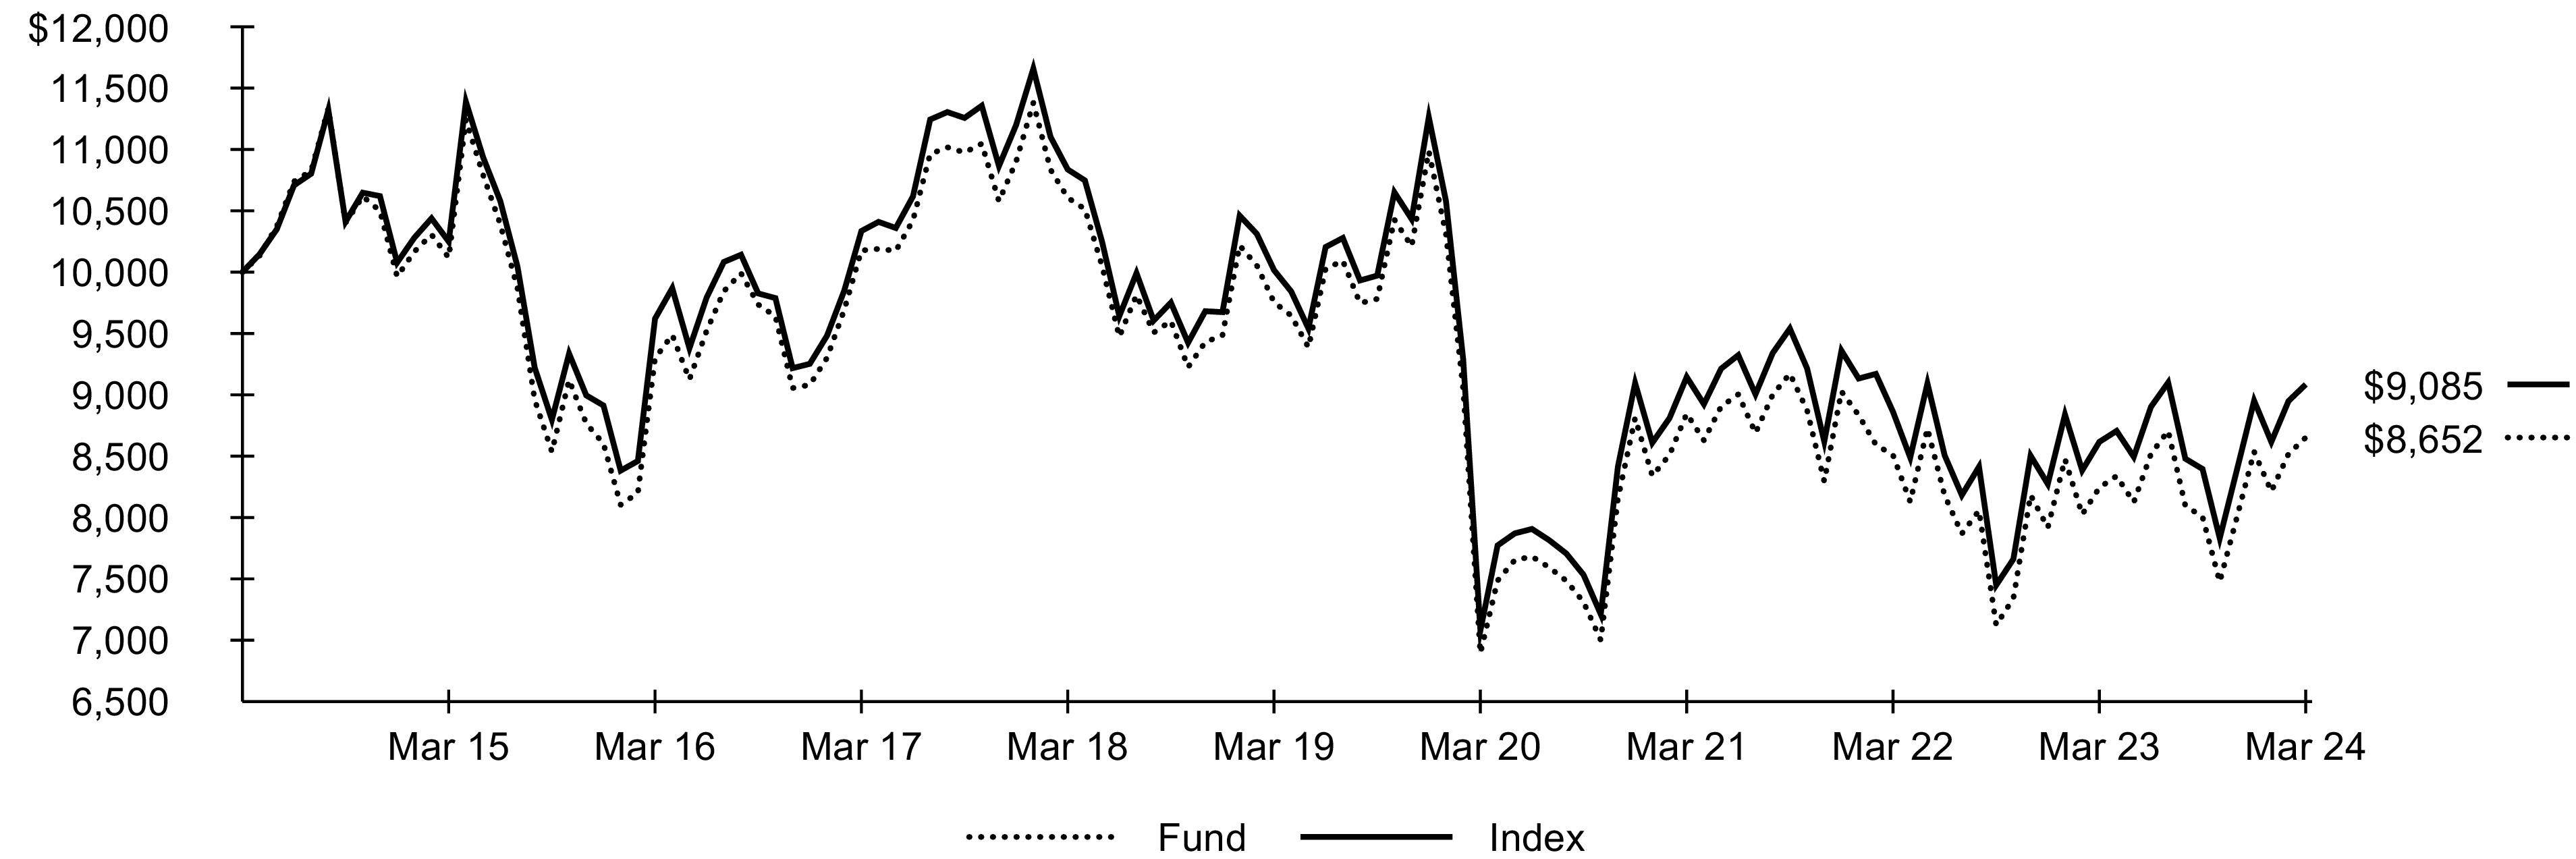
Past performance is not an indication of future results. Performance results do not reflect the deduction of taxes that a shareholder would pay on fund distributions or on the redemption or sale of fund shares. See “About Fund Performance” for more information.
Expense Example
| | |
Beginning
Account Value
(10/01/23) | Ending
Account Value
(03/31/24) | | Beginning
Account Value
(10/01/23) | Ending
Account Value
(03/31/24) | | |
| | | | | | |
| Expenses are equal to the annualized expense ratio, multiplied by the average account value over the period, multiplied by 183/366 (to reflect the one-half year period shown). Other fees, such as brokerage commissions and other fees to financial intermediaries, may be paid which are not reflected in the tables and examples above. See “Disclosure of Expenses” for more information. |
Fund Summary as of March 31, 2024 (continued)
iShares® Emerging Markets Infrastructure ETF
Portfolio Management Commentary
Emerging market infrastructure stocks advanced for the reporting period, as global economic growth continued and inflation cooled while supply chains improved. Brazilian stocks contributed the most to the Index’s performance, as consumer spending continued to rise sharply despite flat economic growth in the last half of 2023. Inflation in Brazil decelerated after peaking in September 2023, and the central bank of Brazil was one of the few global central banks to lower interest rates, with six decreases during the reporting period.
The Brazilian utilities sector gained the most, led by the electric utilities industry. Earnings grew amid increased cost efficiency and process improvements, while growth in power transmission revenue also benefited the industry. Water utilities also advanced, as earnings and revenue in the industry exceeded analysts’ expectations. The Brazilian energy sector further contributed to the Index’s performance, as oil and gas production in the country rose sharply in 2023, particularly offshore production. High levels of energy extraction benefited the oil and gas storage and transportation industry, which provides energy infrastructure such as pipelines, gas stations, and storage facilities. Strong earnings due in part to improved efficiency and increased bulk-liquid storage capacity helped a large company in the industry strengthen its balance sheet and receive a credit upgrade.
Qatari energy stocks also contributed to the Index’s performance. Following the disruption to energy markets from Russia’s invasion of Ukraine, European countries sought to find alternate supplies of natural gas and invested in liquid natural gas (“LNG”) facilities. Qatar expanded its LNG exports, driving increased production in Qatar, benefiting LNG fleet operators in the oil and gas storage and transportation industry. Korean stocks also gained, as earnings in the electric utilities industry were supported by multiple electricity rate increases.
On the downside, Chinese infrastructure stocks detracted from the Index’s performance. Chinese economic growth slowed and exports stalled. Property markets faced headwinds from overbuilding, pressuring the utilities sector, as a write-down of properties held in the water utilities industry weighed on earnings.
Portfolio Information
GEOGRAPHIC ALLOCATION
Country/Geographic Region | |
| |
| |
| |
| |
| |
| |
| |
| |
| Excludes money market funds. |
102024 iShares Annual Report to Shareholders
Fund Summary as of March 31, 2024
Investment Objective
The iShares Europe ETF (the “Fund”) seeks to track the investment results of an index composed of European equities, as represented by the S&P Europe 350TM (the “Index”). The Fund invests in a representative sample of securities included in the Index that collectively has an investment profile similar to the Index. Due to the use of representative sampling, the Fund may or may not hold all of the securities that are included in the Index.
Performance
| Average Annual Total Returns | | |
| | | | | | | |
| | | | | | | |
| | | | | | | |
| | | | | | | |
GROWTH OF $10,000 INVESTMENT(AT NET ASSET VALUE)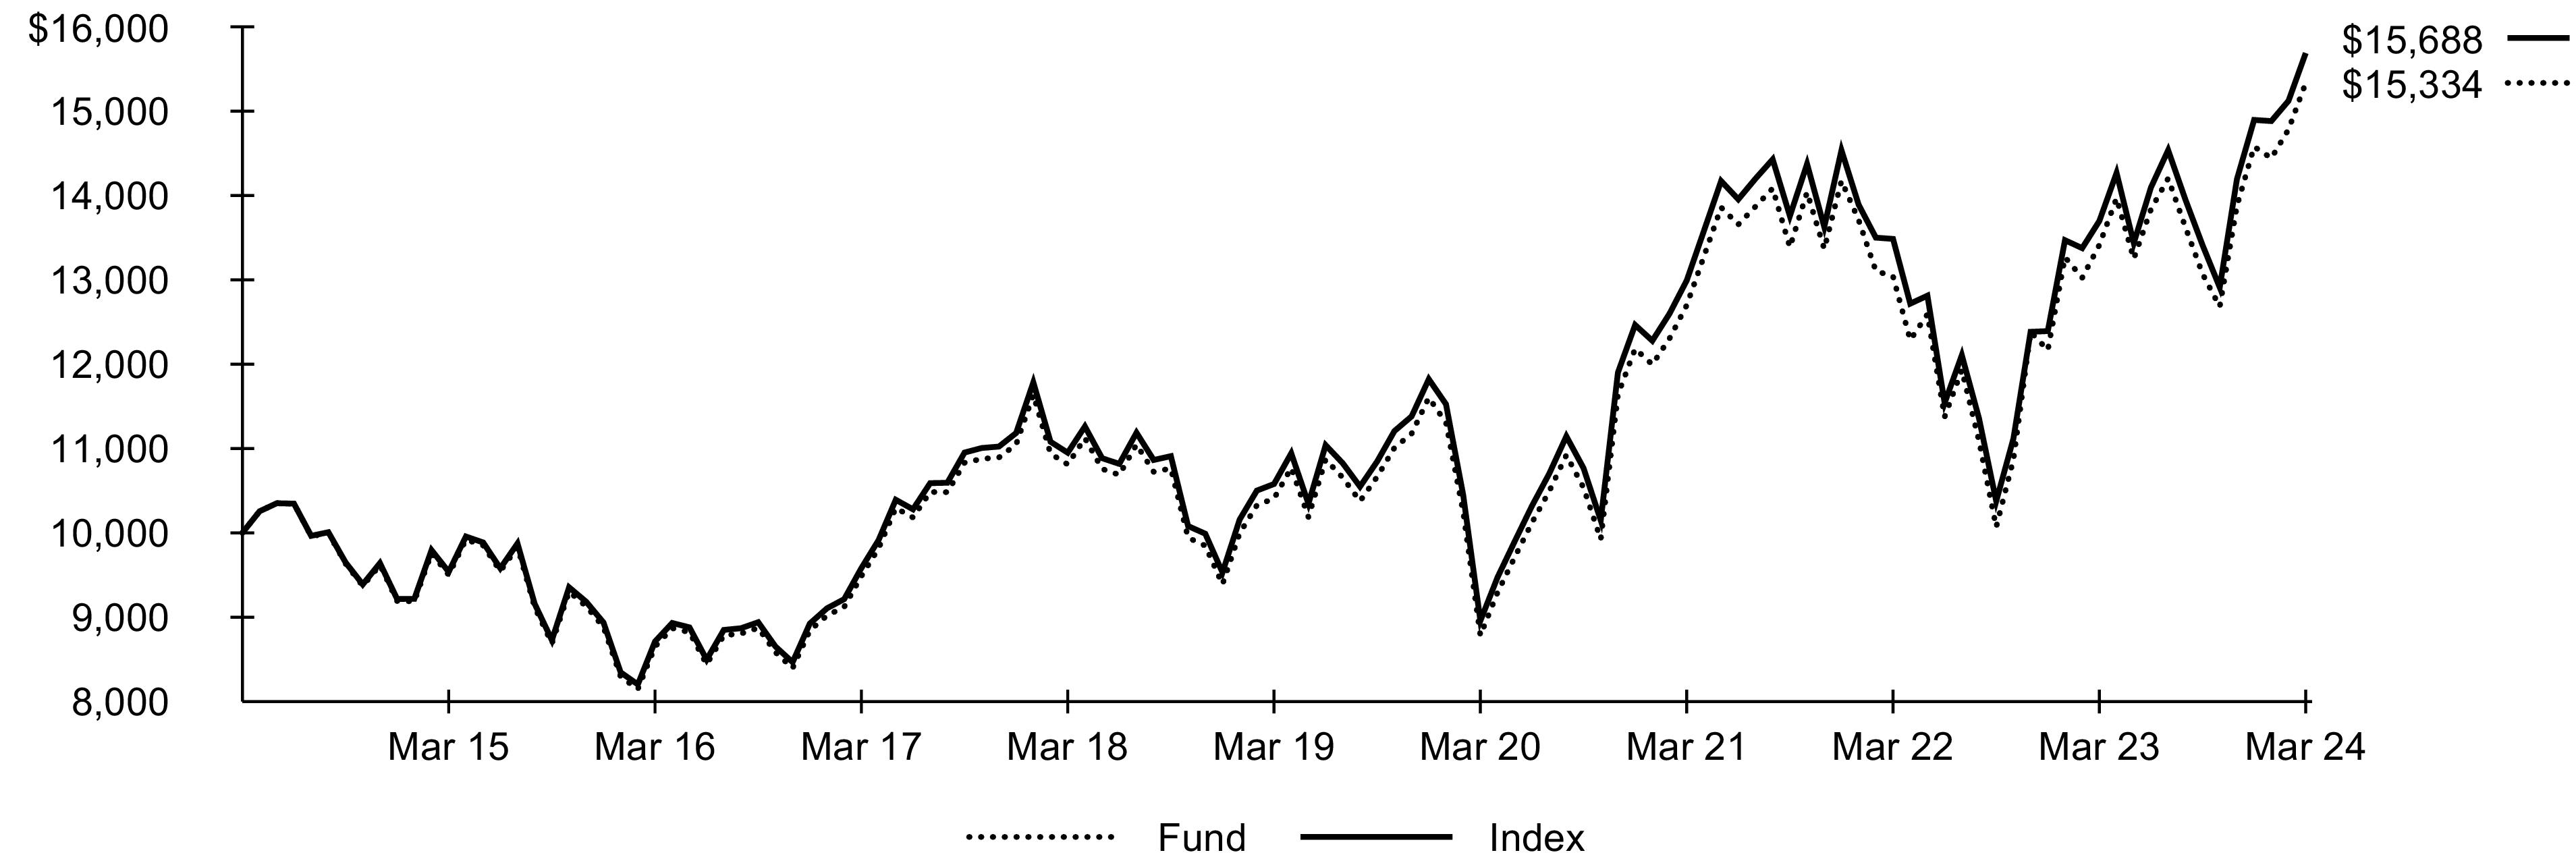
Past performance is not an indication of future results. Performance results do not reflect the deduction of taxes that a shareholder would pay on fund distributions or on the redemption or sale of fund shares. See “About Fund Performance” for more information.
Expense Example
| | |
Beginning
Account Value
(10/01/23) | Ending
Account Value
(03/31/24) | | Beginning
Account Value
(10/01/23) | Ending
Account Value
(03/31/24) | | |
| | | | | | |
| Expenses are equal to the annualized expense ratio, multiplied by the average account value over the period, multiplied by 183/366 (to reflect the one-half year period shown). Other fees, such as brokerage commissions and other fees to financial intermediaries, may be paid which are not reflected in the tables and examples above. See “Disclosure of Expenses” for more information. |
Fund Summary as of March 31, 2024 (continued)
Portfolio Management Commentary
European stocks rose during the reporting period, as global investors in search of higher earnings yields increased their allocations to European equities, particularly in the first quarter of 2024. Although European economies were largely stagnant, as tight monetary policy across the E.U. constrained manufacturing activity, Eurozone household confidence increased amid moderating inflation. Although the British and German economies tipped into technical recession in the fourth quarter of 2023, investors viewed a strengthening British pound as an indicator of an improving economy, reflecting increased government spending and rising wages. In addition, France’s economy grew modestly.
Stocks in the U.K. contributed the most to the Index’s return, led by the industrials sector, as increased defense spending aided the aerospace and defense industry. Investors also reacted positively to the implementation of a restructuring plan at a large aircraft engine maker. High interest rates boosted stocks of U.K. banks, which drove contribution from the financials sector. A large multinational bank further benefited from the acquisition of a wealth management business in Asia.
French industrials stocks also contributed to the Index’s performance, as the French economy benefited from rising export demand and a catch-up in industrial production as gas prices steadied. The capital goods industry gained, as companies reported robust profit growth and record order backlogs. Aerospace and defense stocks rose, as travel rebounded and airlines scrambled to expand and upgrade aging inventory to meet demand.
Stocks in the financials sector propelled Germany’s contribution to the Index’s return, proving a bright spot in an industrial economy weighed down by high borrowing and energy costs. Investors reacted positively to earnings growth within the insurance industry and the announcement of new stock buyback programs.
In the Netherlands, a recovery in demand for semiconductor chips drove contribution from the semiconductors and semiconductor equipment industry in the information technology sector. In Denmark, the healthcare sector aided performance, as strong global demand for diabetes and weight-loss drugs boosted stocks in the pharmaceuticals, biotechnology, and life sciences industry.
Portfolio Information
GEOGRAPHIC ALLOCATION
Country/Geographic Region | |
| |
| |
| |
| |
| |
| |
| |
| |
| |
| |
| |
| |
Other (each representing less than 1%) | |
| Excludes money market funds. |
122024 iShares Annual Report to Shareholders
Fund Summary as of March 31, 2024
iShares® Future Metaverse Tech and Communications ETF
Investment Objective
The iShares Future Metaverse Tech and Communications ETF (the “Fund”) seeks to track the investment results of an index composed of U.S. and non-U.S. companies that provide products and services that are expected to contribute to the metaverse in areas including virtual platforms, social media, gaming, 3D software, digital assets, and virtual and augmented reality, as represented by the Morningstar Global Metaverse & Virtual Interaction Select Index (the “Index”). The Fund invests in a representative sample of securities included in the Index that collectively has an investment profile similar to the Index. Due to the use of representative sampling, the Fund may or may not hold all of the securities that are included in the Index.
Performance
| Average Annual Total Returns | | |
| | | | | |
| | | | | |
| | | | | |
| | | | | |
| The NAV total return presented in the table for the one-year period differs from the same period return disclosed in the financial highlights. The total return in the financial highlights is calculated in the same manner but differs due to certain adjustments made for financial reporting purposes in accordance with U.S. generally accepted accounting principles. |
GROWTH OF $10,000 INVESTMENT(SINCE INCEPTION AT NET ASSET VALUE)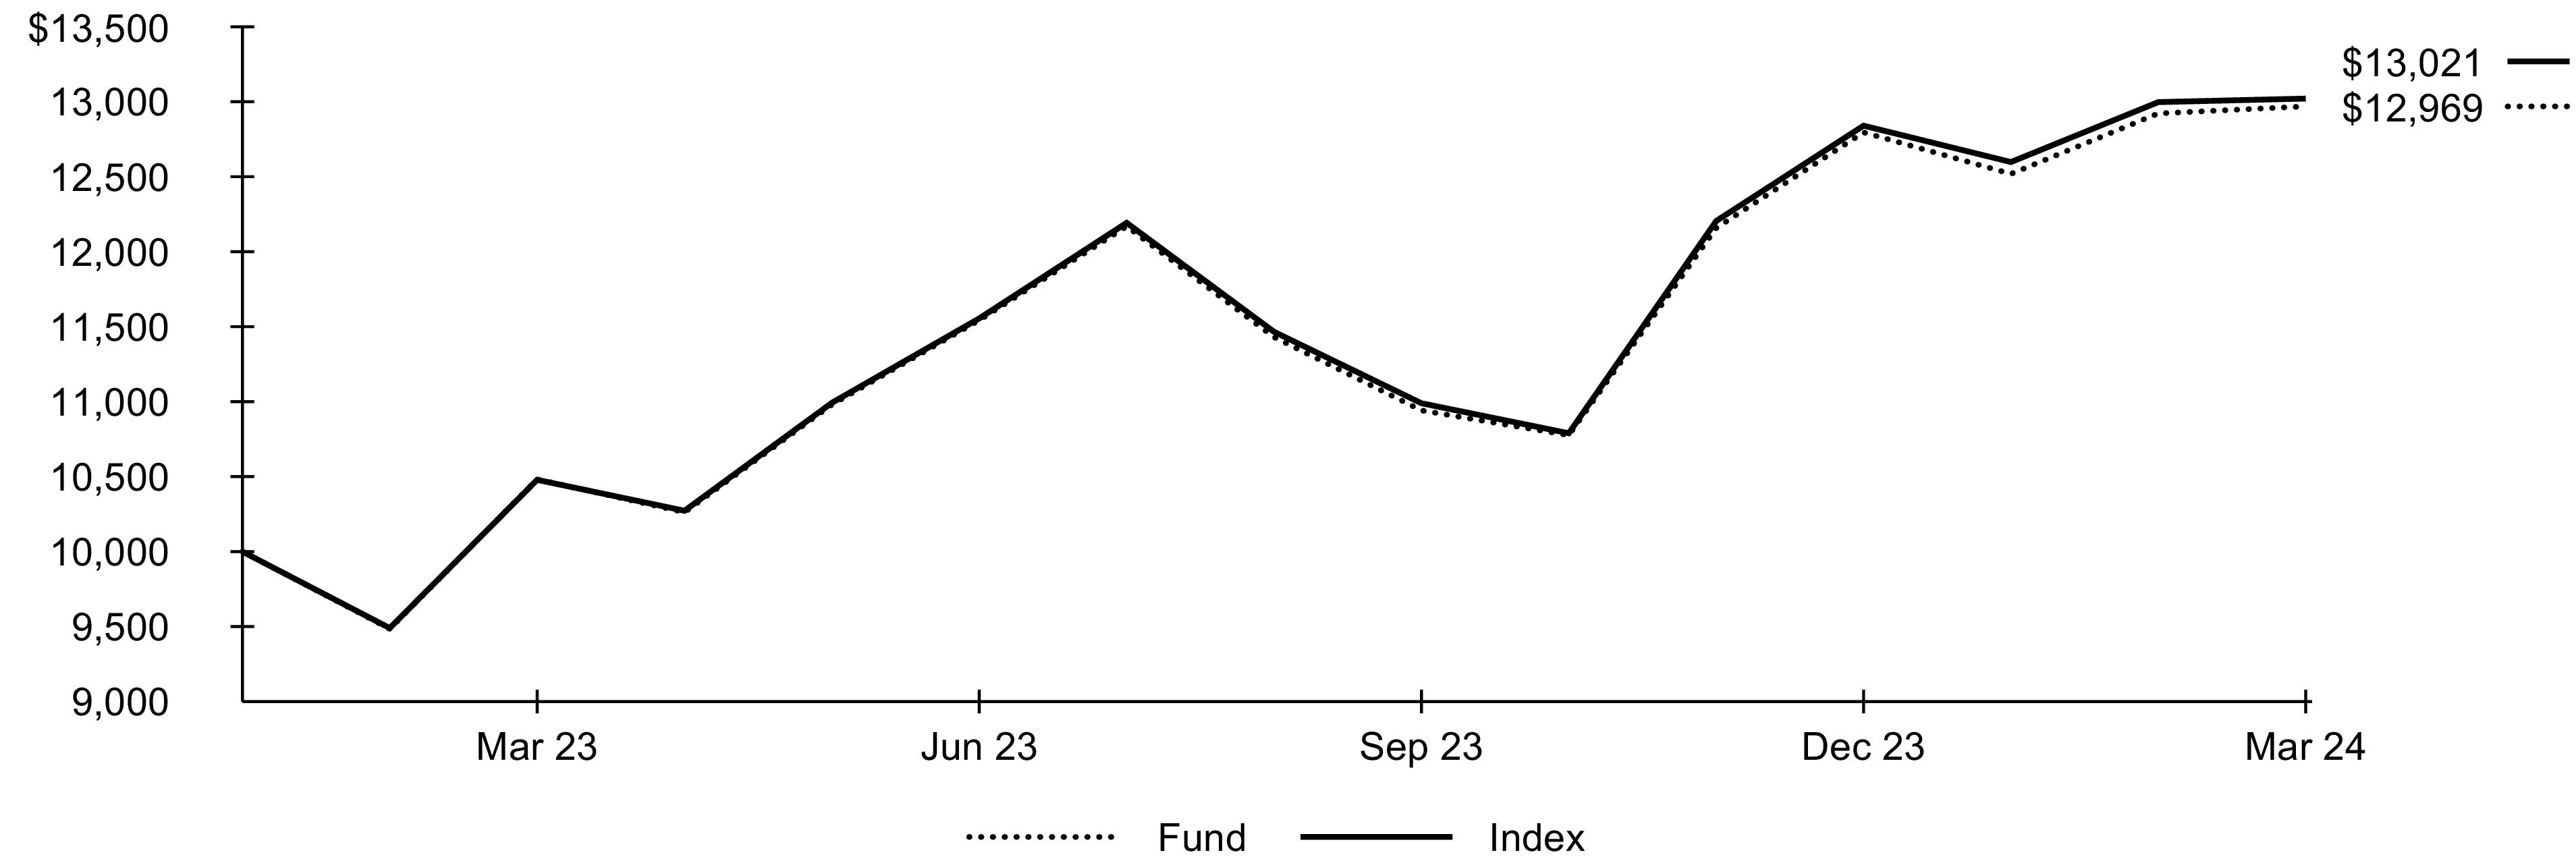
The inception date of the Fund was February 14, 2023. The first day of secondary market trading was February 16, 2023.
Past performance is not an indication of future results. Performance results do not reflect the deduction of taxes that a shareholder would pay on fund distributions or on the redemption or sale of fund shares. See “About Fund Performance” for more information.
Expense Example
| | |
Beginning
Account Value
(10/01/23) | Ending
Account Value
(03/31/24) | | Beginning
Account Value
(10/01/23) | Ending
Account Value
(03/31/24) | | |
| | | | | | |
| Expenses are equal to the annualized expense ratio, multiplied by the average account value over the period, multiplied by 183/366 (to reflect the one-half year period shown). Other fees, such as brokerage commissions and other fees to financial intermediaries, may be paid which are not reflected in the tables and examples above. See “Disclosure of Expenses” for more information. |
Fund Summary as of March 31, 2024 (continued)
iShares® Future Metaverse Tech and Communications ETF
Portfolio Management Commentary
Stocks of companies that provide products and services related to the metaverse advanced during the reporting period, helped by continued global economic growth and notable innovations in artificial intelligence (“AI”) technology. Rapid advances in generative AI, which allows users to generate outputs using simple natural language queries, drove a surge in investor enthusiasm for products and technologies associated with AI. Stocks in the U.S., which represented approximately 69% of the Index on average for the reporting period, contributed the most to the Index’s performance. The U.S. information technology sector was the leading source of strength, led by the semiconductors industry, as companies purchased specialized chips used to provide computing capacity for AI applications, which require significant processing power. Corporations seeking to use AI technologies invested significantly in this hardware, in some cases setting up separate budgetary allocations to expedite the increased investment. Consequently, industry revenue and earnings grew rapidly, driving strong equity performance. Additionally, the semiconductors industry continued to invest in building the next generation of processors for AI applications, further buoying investor sentiment.
The communication services sector also contributed significantly to the Index’s performance, led by the interactive media and services industry. Growth in the online advertising market drove large increases in both revenue and income. Implementation of AI tools that allow clients to partially automate and optimize advertising campaigns benefited the industry and buoyed analysts’ optimism about continued growth. Cost cutting efforts, including multiple rounds of layoffs, also boosted profitability, as the industry refocused on core social media products. Strong sales of cloud computing products supported earnings, and a proposed deal between a large company in the industry and a smartphone manufacturer to license an AI product generated investor enthusiasm.
The information technology sector in South Korea contributed notably to the Index’s return, as the semiconductors industry benefited from a memory-chip maker’s deal with a U.S. company to provide components for AI accelerators. The communication services sector in Japan also contributed, as higher-than-expected sales of game consoles drove gains for the media and entertainment industry.
Portfolio Information
INDUSTRY ALLOCATION
| |
| |
| |
Interactive Media & Services | |
| |
Semiconductors & Semiconductor Equipment | |
Technology Hardware, Storage & Peripherals | |
| |
TEN LARGEST HOLDINGS
| |
Meta Platforms Inc., Class A | |
| |
| |
| |
| |
| |
Take-Two Interactive Software Inc. | |
| |
| |
| |
| Excludes money market funds. |
142024 iShares Annual Report to Shareholders
Fund Summary as of March 31, 2024
Investment Objective
The iShares India 50 ETF (the “Fund”) seeks to track the investment results of an index composed of 50 of the largest Indian equities, as represented by the Nifty 50 Index (the “Index”) and determined by the Index provider, NSE Indices Ltd. The Fund invests in a representative sample of securities included in the Index that collectively has an investment profile similar to the Index. Due to the use of representative sampling, the Fund may or may not hold all of the securities that are included in the Index.
Performance
| Average Annual Total Returns | | |
| | | | | | | |
| | | | | | | |
| | | | | | | |
| | | | | | | |
| The NAV total return presented in the table for the one-year period differs from the same period return disclosed in the financial highlights. The total return in the financial highlights is calculated in the same manner but differs due to certain adjustments made for financial reporting purposes in accordance with U.S. generally accepted accounting principles. |
GROWTH OF $10,000 INVESTMENT(AT NET ASSET VALUE)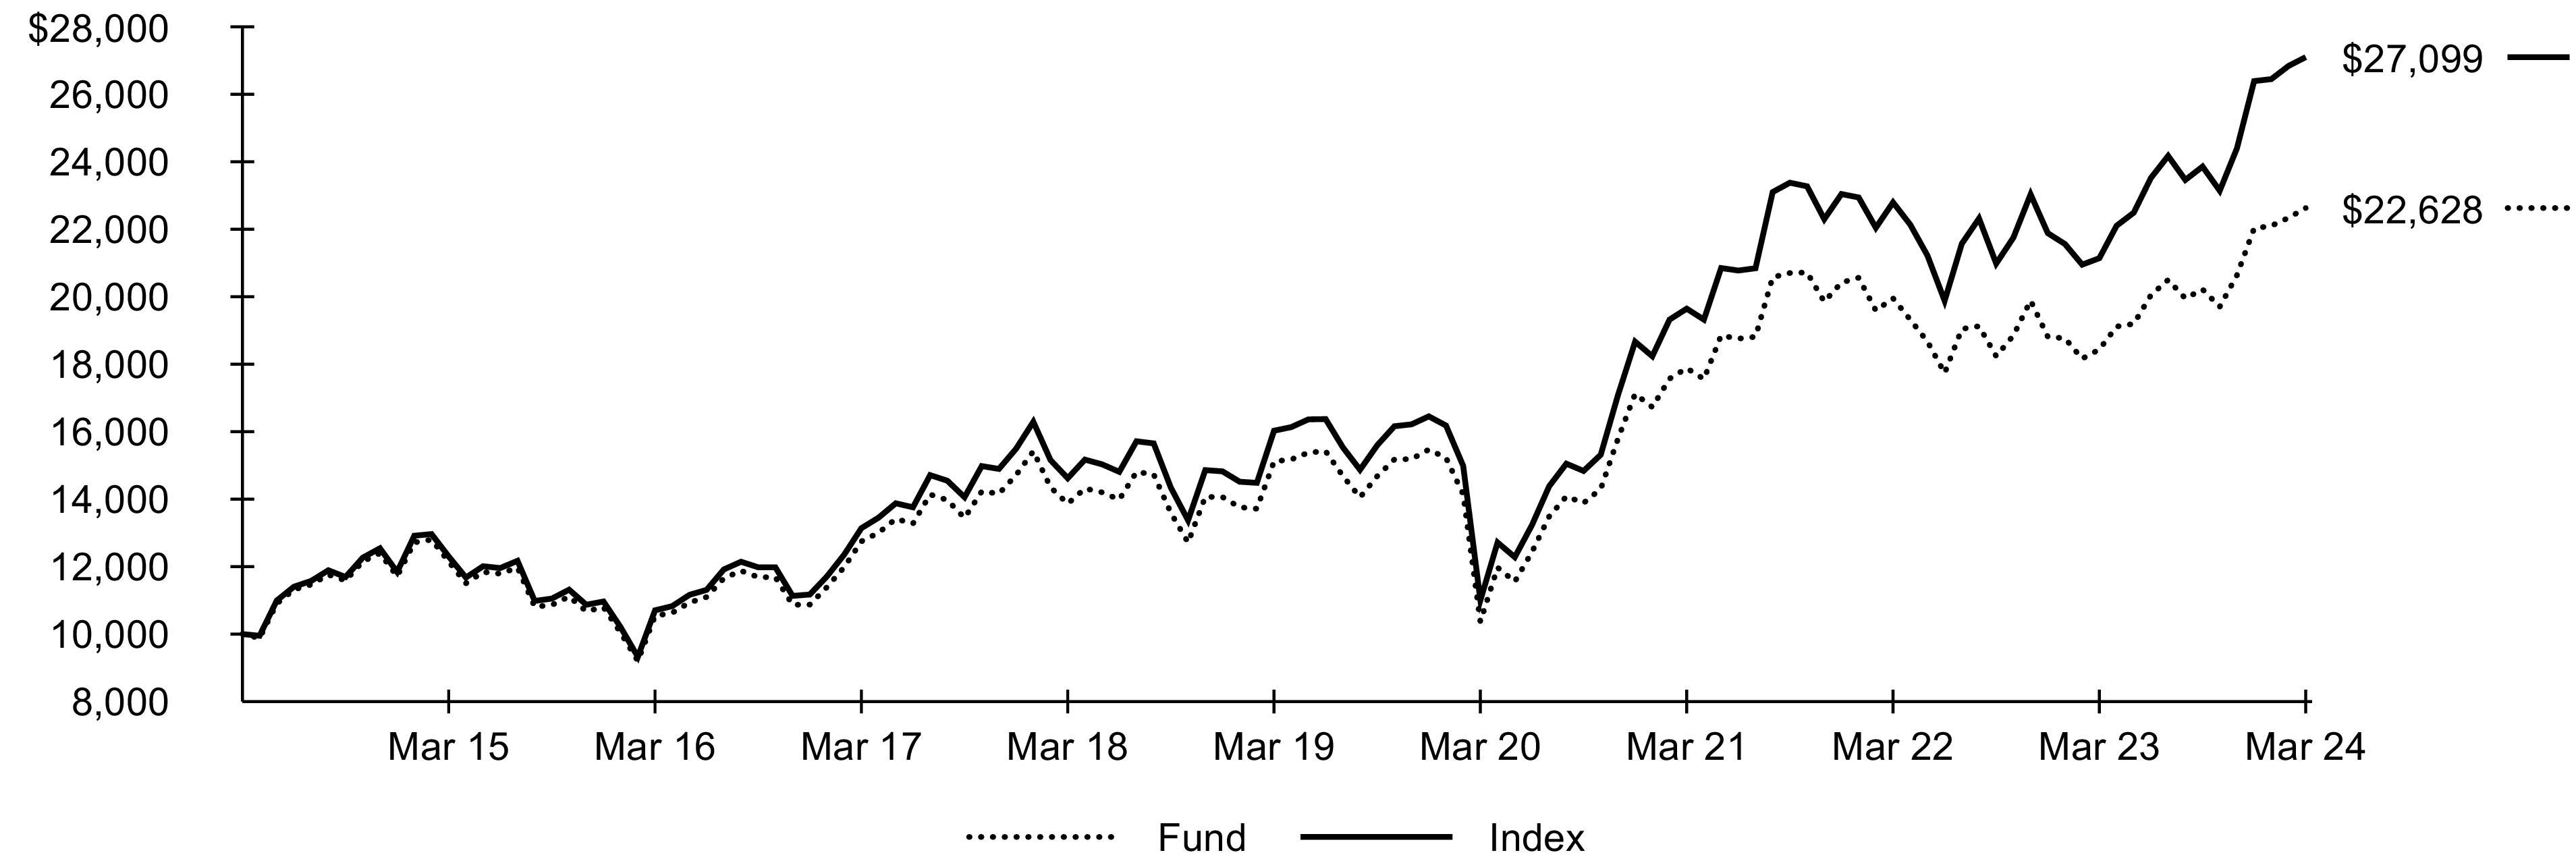
Past performance is not an indication of future results. Performance results do not reflect the deduction of taxes that a shareholder would pay on fund distributions or on the redemption or sale of fund shares. See “About Fund Performance” for more information.
Expense Example
| | |
Beginning
Account Value
(10/01/23) | Ending
Account Value
(03/31/24) | | Beginning
Account Value
(10/01/23) | Ending
Account Value
(03/31/24) | | |
| | | | | | |
| Expenses are equal to the annualized expense ratio, multiplied by the average account value over the period, multiplied by 183/366 (to reflect the one-half year period shown). Other fees, such as brokerage commissions and other fees to financial intermediaries, may be paid which are not reflected in the tables and examples above. See “Disclosure of Expenses” for more information. |
Fund Summary as of March 31, 2024 (continued)
Portfolio Management Commentary
Large-capitalization Indian stocks advanced sharply for the reporting period amid robust economic growth in what is now the world’s most populous nation. Strength in construction and manufacturing underpinned the rapid economic expansion, as the Indian government’s investments in infrastructure and manufacturing incentives proved beneficial.
The energy sector contributed the most to the Index’s performance, benefiting from a rise in oil prices toward the end of the reporting period. Indian energy companies capitalized on the country’s increased imports of Russian oil, a development that began after Russia invaded Ukraine. Importing relatively inexpensive oil from Russia helped India grow its refining capabilities and its exports of products derived from refined crude. Increased production of coal to meet the nation’s rising demand for power buoyed coal and consumable fuels companies. A slowdown in the rollout of renewable energy sources for power generation in India ensured continued reliance on coal, further supporting coal stocks.
The consumer discretionary sector also contributed to the Index’s return, led by the automobiles industry. Sales of commercial and private vehicles by Indian automakers rose substantially, both domestically and abroad, as supply-chain holdups and chip shortages lessened. Industry analysts viewed increased production of vehicles as a positive indicator of shrinking debt levels, further supporting investor sentiment toward automobile manufacturers.
Another area of strength for the Index was the industrials sector. Indian construction and engineering companies benefited from substantial growth in infrastructure projects, as the government’s goal to reach developed nation status by 2047 translated into construction of roads, bridges, airports, and power facilities. The sizeable pipeline of government-funded infrastructure slated to be built in the coming years bolstered the positive investor sentiment toward the industry.
The financials sector also contributed to the Index’s return. Within the banking industry, growth in deposits and loans drove higher-than-expected net interest income and profits. Despite compression in net interest margins that pressured the stocks of some Indian banks, the industry overall reported solid earnings, driven in part by growth in loans to retail customers and smaller businesses.
Portfolio Information
TEN LARGEST HOLDINGS
| |
| |
| |
| |
| |
| |
Tata Consultancy Services Ltd. | |
| |
| |
| |
| |
| Excludes money market funds. |
162024 iShares Annual Report to Shareholders
Fund Summary as of March 31, 2024
iShares® International Developed Property ETF
Investment Objective
The iShares International Developed Property ETF (the “Fund”) seeks to track the investment results of an index composed of real estate equities in developed non-U.S. markets, as represented by the S&P Developed ex-U.S. Property IndexTM (the “Index”). The Fund invests in a representative sample of securities included in the Index that collectively has an investment profile similar to the Index. Due to the use of representative sampling, the Fund may or may not hold all of the securities that are included in the Index.
Performance
| Average Annual Total Returns | | |
| | | | | | | |
| | | | | | | |
| | | | | | | |
| | | | | | | |
| The NAV total return presented in the table for the one-year period differs from the same period return disclosed in the financial highlights. The total return in the financial highlights is calculated in the same manner but differs due to certain adjustments made for financial reporting purposes in accordance with U.S. generally accepted accounting principles. |
GROWTH OF $10,000 INVESTMENT(AT NET ASSET VALUE)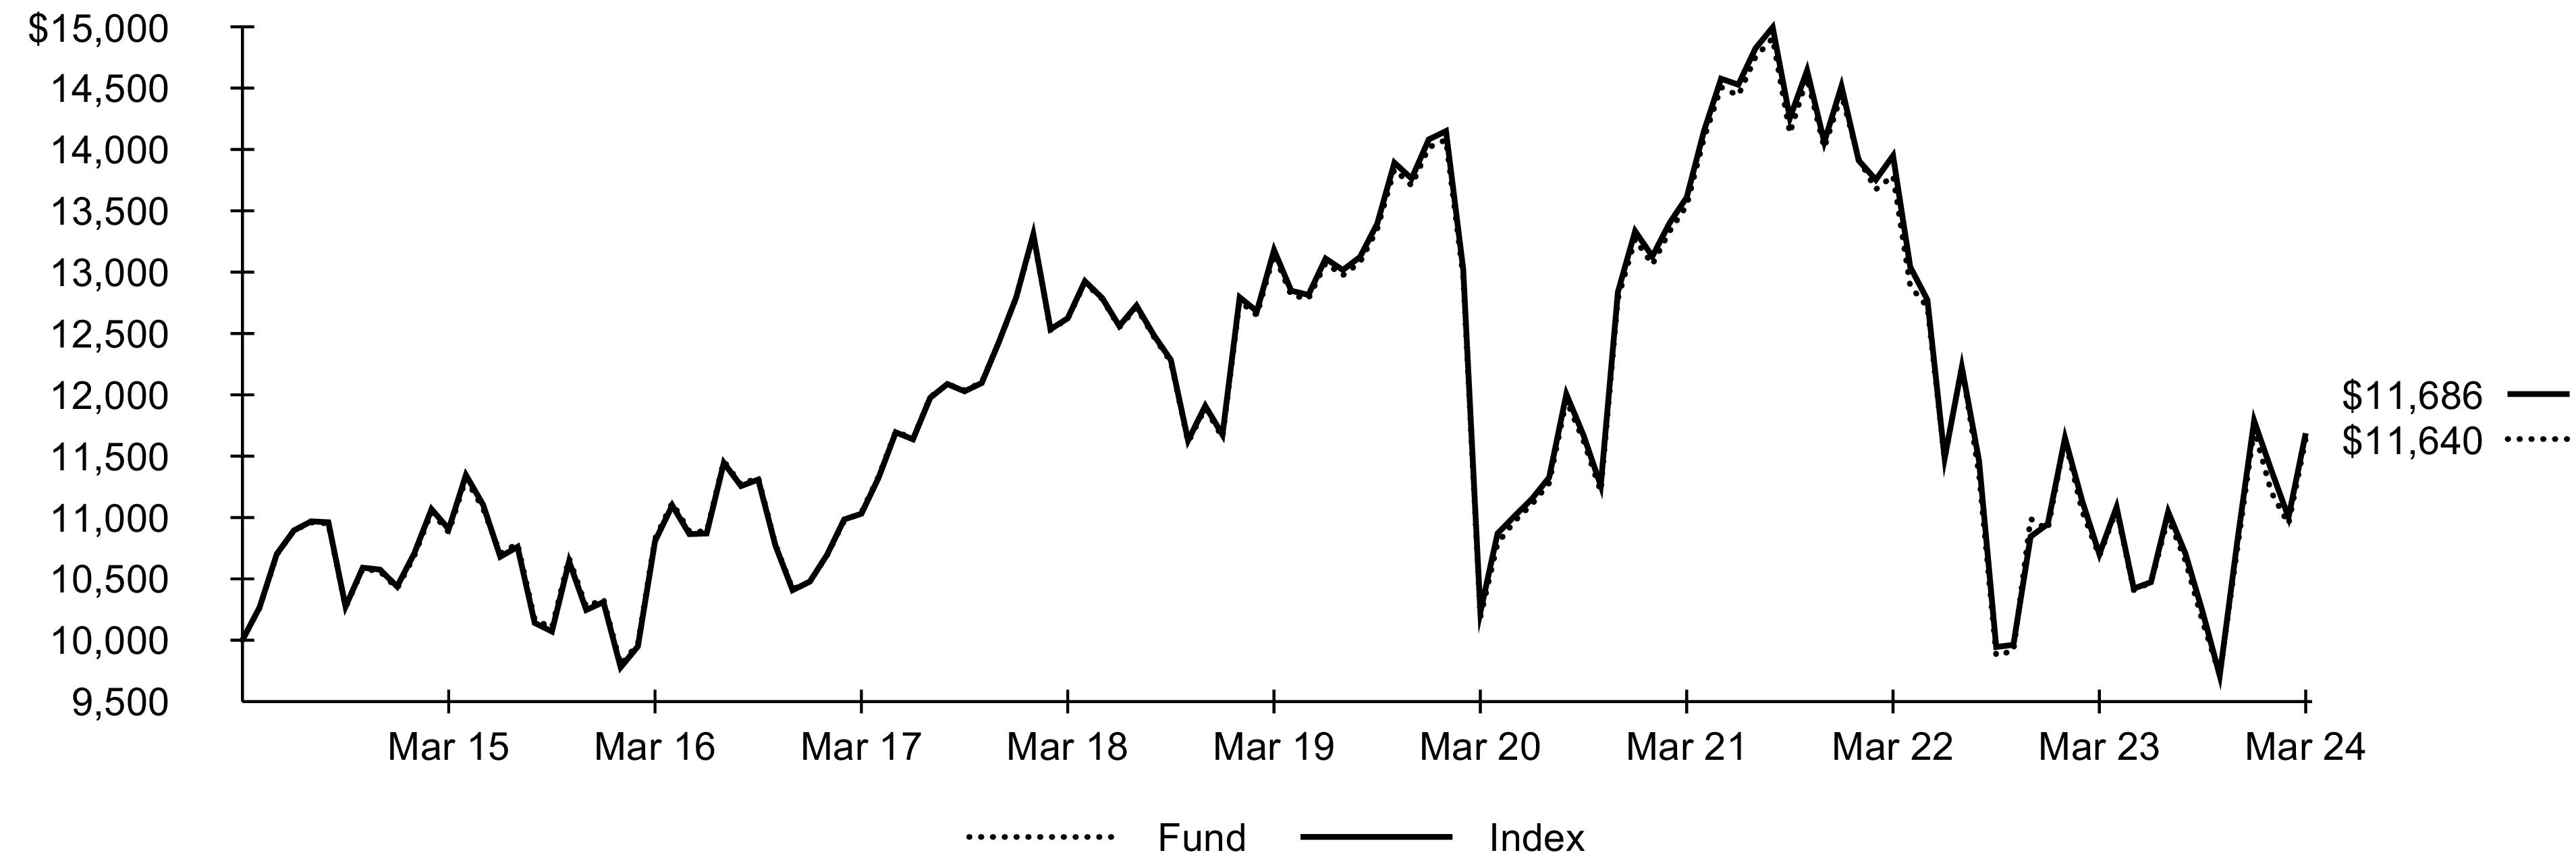
Past performance is not an indication of future results. Performance results do not reflect the deduction of taxes that a shareholder would pay on fund distributions or on the redemption or sale of fund shares. See “About Fund Performance” for more information.
Expense Example
| | |
Beginning
Account Value
(10/01/23) | Ending
Account Value
(03/31/24) | | Beginning
Account Value
(10/01/23) | Ending
Account Value
(03/31/24) | | |
| | | | | | |
| Expenses are equal to the annualized expense ratio, multiplied by the average account value over the period, multiplied by 183/366 (to reflect the one-half year period shown). Other fees, such as brokerage commissions and other fees to financial intermediaries, may be paid which are not reflected in the tables and examples above. See “Disclosure of Expenses” for more information. |
Fund Summary as of March 31, 2024 (continued)
iShares® International Developed Property ETF
Portfolio Management Commentary
International developed property stocks advanced during the reporting period, as global economic growth persisted, inflation moderated, and key central banks stopped raising interest rates. Investor optimism regarding prospects for lower borrowing costs and an upturn in leasing and investment increased along with expectations for potential interest rate cuts. The pace of declines in transaction volume moderated in Asia and stabilized in Europe, and office space use stabilized on both continents after declining since the onset of the pandemic.
Japan’s real estate sector contributed the most to the Index’s return. The country’s low cost of debt helped it attract the largest amount of cross-regional property investment capital in Asia. Diversified equity real estate investment trusts (“REITs”) benefited from the Japanese yen’s depreciation against the U.S. dollar and increased tourism that boosted the hotel market. Japan’s office vacancy rate also remained lower than in most other developed countries. Stock of a leading REIT reached an all-time high after a U.S. asset manager demanded it launch a large stock repurchase program. Japan’s leading property developers also benefited from a large U.S. holding company’s announced plans to increase its stake in their parent companies.
Australia’s industrial REITs also contributed to the Index’s performance, led by the country’s largest REIT. Its focus on higher-demand industrial properties, particularly data centers at the heart of the artificial intelligence boom, helped insulate it from weakness in other commercial property markets. In addition, inflation fell more quickly than expected, heightening anticipation of interest rate cuts that might lower mortgage costs. Rents also remained relatively steady despite the property market’s overall weakness.
On the downside, Hong Kong’s real estate sector detracted from performance. The declines in stocks of property developers and REITs mirrored China’s ongoing property crisis. China’s largest property developer was ordered to liquidate after several failed refinancing attempts and allegations of fraud committed by its founder. Other large Chinese developers also neared default. Additionally, Hong Kong real estate developers cited excessive taxes on property transactions for the city’s largest real estate slump in two decades.
Portfolio Information
INDUSTRY ALLOCATION
| |
Diversified Real Estate Activities | |
Real Estate Operating Companies | |
| |
| |
| |
| |
Multi-Family Residential REITs | |
| |
| |
| |
| |
Other (each representing less than 1%) | |
GEOGRAPHIC ALLOCATION
Country/Geographic Region | |
| |
| |
| |
| |
| |
| |
| |
| |
| |
| |
| |
| |
Other (each representing less than 1%) | |
| Excludes money market funds. |
182024 iShares Annual Report to Shareholders
Fund Summary as of March 31, 2024
iShares® International Developed Small Cap Value Factor ETF
Investment Objective
The iShares International Developed Small Cap Value Factor ETF (the “Fund”) seeks to track the investment results of an index composed of international developed market small-capitalization stocks, excluding the U.S. and Korea, with prominent value characteristics, as represented by the FTSE Developed ex US ex Korea Small Cap Focused Value Index (the “Index”). The Fund invests in a representative sample of securities included in the Index that collectively has an investment profile similar to the Index. Due to the use of representative sampling, the Fund may or may not hold all of the securities that are included in the Index.
Performance
| Average Annual Total Returns | | |
| | | | | |
| | | | | |
| | | | | |
| | | | | |
GROWTH OF $10,000 INVESTMENT(SINCE INCEPTION AT NET ASSET VALUE)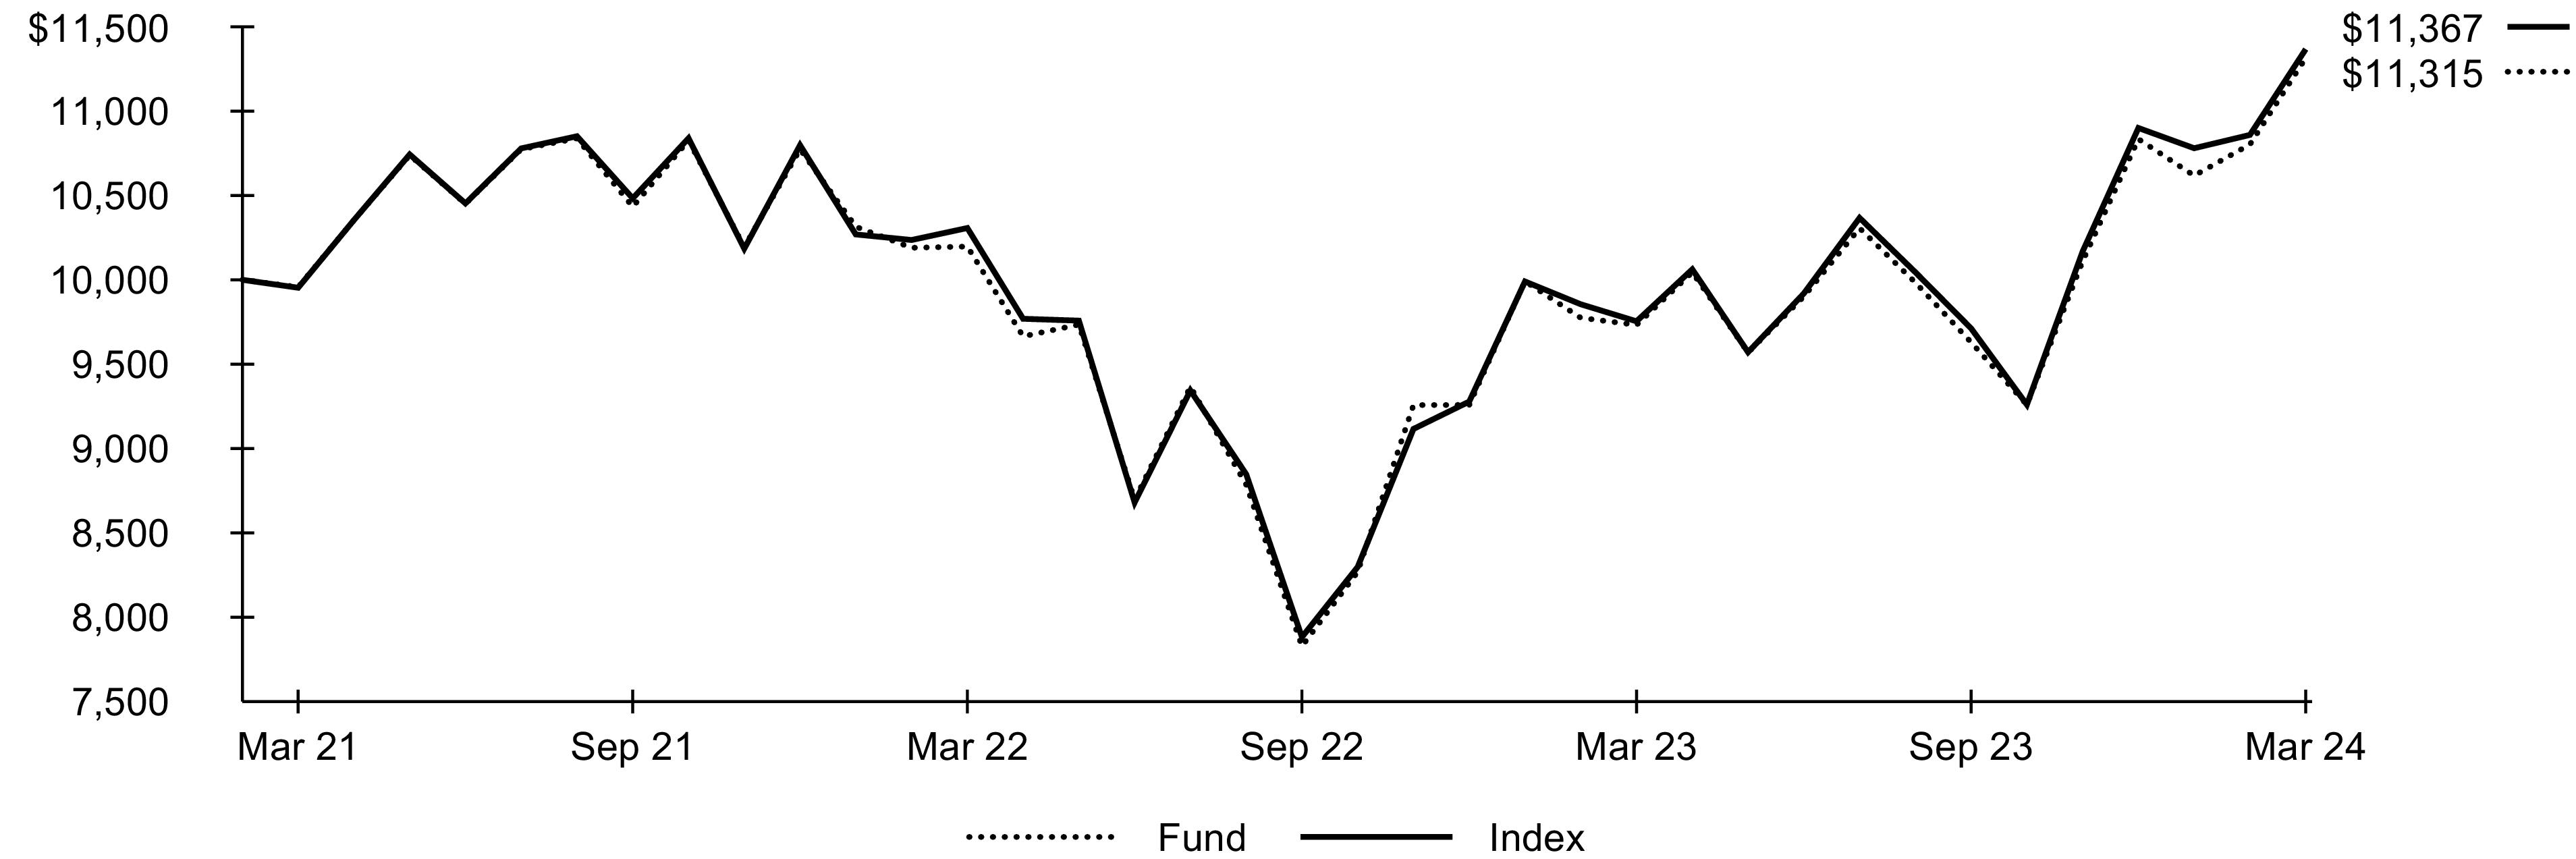
The inception date of the Fund was March 23, 2021. The first day of secondary market trading was March 25, 2021.
Past performance is not an indication of future results. Performance results do not reflect the deduction of taxes that a shareholder would pay on fund distributions or on the redemption or sale of fund shares. See “About Fund Performance” for more information.
Expense Example
| | |
Beginning
Account Value
(10/01/23) | Ending
Account Value
(03/31/24) | | Beginning
Account Value
(10/01/23) | Ending
Account Value
(03/31/24) | | |
| | | | | | |
| Expenses are equal to the annualized expense ratio, multiplied by the average account value over the period, multiplied by 183/366 (to reflect the one-half year period shown). Other fees, such as brokerage commissions and other fees to financial intermediaries, may be paid which are not reflected in the tables and examples above. See “Disclosure of Expenses” for more information. |
Fund Summary as of March 31, 2024 (continued)
iShares® International Developed Small Cap Value Factor ETF
Portfolio Management Commentary
International developed market small-capitalization stocks with prominent value characteristics posted a strong advance for the reporting period. Japanese stocks contributed the most to the Index’s performance, as the Japanese economy was helped by rising exports and a series of investor-friendly corporate reforms. The Japanese yen declined relative to the U.S. dollar, weighing on the value of stocks denominated in U.S. dollars, but also making export-oriented businesses more competitive internationally.
In this environment, the Japanese industrials sector gained the most, helped by strength in the capital goods industry. Strong sales of construction and engineering services related to environmental energy and recycling facilities bolstered revenue in the industry. Surging demand for semiconductors also benefited the industry, as orders increased significantly at a manufacturer of clean room systems for semiconductor manufacturing. The Japanese materials sector also gained, driven by the chemicals industry, which benefited from the development of new markets for acrylic rubber.
Canadian energy stocks also contributed to the Index’s performance, as Canadian oil and natural gas production hit all-time highs. Increased production helped offset lower earnings due to declining prices for natural gas. Progress on a major pipeline connecting Canadian oilfields with a Pacific port also benefited oil, gas, and consumable fuels companies. Meanwhile, the financials sector in the U.K. advanced due in part to increased loan volumes and corporate deposits.
The Index’s selection process is designed to maximize exposure to small-capitalization stocks with prominent value characteristics, with screens to eliminate stocks with low liquidity, high volatility, high leverage, negative sentiment, and negative momentum. Reflecting those constraints, the Index outperformed the broader market, as represented by the MSCI World Ex USA Small Cap. The economic environment during the reporting period was supportive of small-capitalization value stocks, while stock selection within sectors also drove relative performance. In particular, stock selection in the industrials, energy, and materials sectors were the largest contributors to the Index’s return relative to the broader market.
Portfolio Information
GEOGRAPHIC ALLOCATION
Country/Geographic Region | |
| |
| |
| |
| |
| |
| |
| |
| |
| |
| |
| |
| |
| |
| |
| |
Other (each representing less than 1%) | |
| Excludes money market funds. |
202024 iShares Annual Report to Shareholders
Fund Summary as of March 31, 2024
iShares® International Dividend Growth ETF
Investment Objective
The iShares International Dividend Growth ETF (the “Fund”) seeks to track the investment results of an index composed of international equities with a history of consistently growing dividends, as represented by the Morningstar® Global ex-US Dividend Growth IndexSM (the “Index”). The Fund invests in a representative sample of securities included in the Index that collectively has an investment profile similar to the Index. Due to the use of representative sampling, the Fund may or may not hold all of the securities that are included in the Index.
Performance
| Average Annual Total Returns | | |
| | | | | | | |
| | | | | | | |
| | | | | | | |
| | | | | | | |
GROWTH OF $10,000 INVESTMENT(SINCE INCEPTION AT NET ASSET VALUE)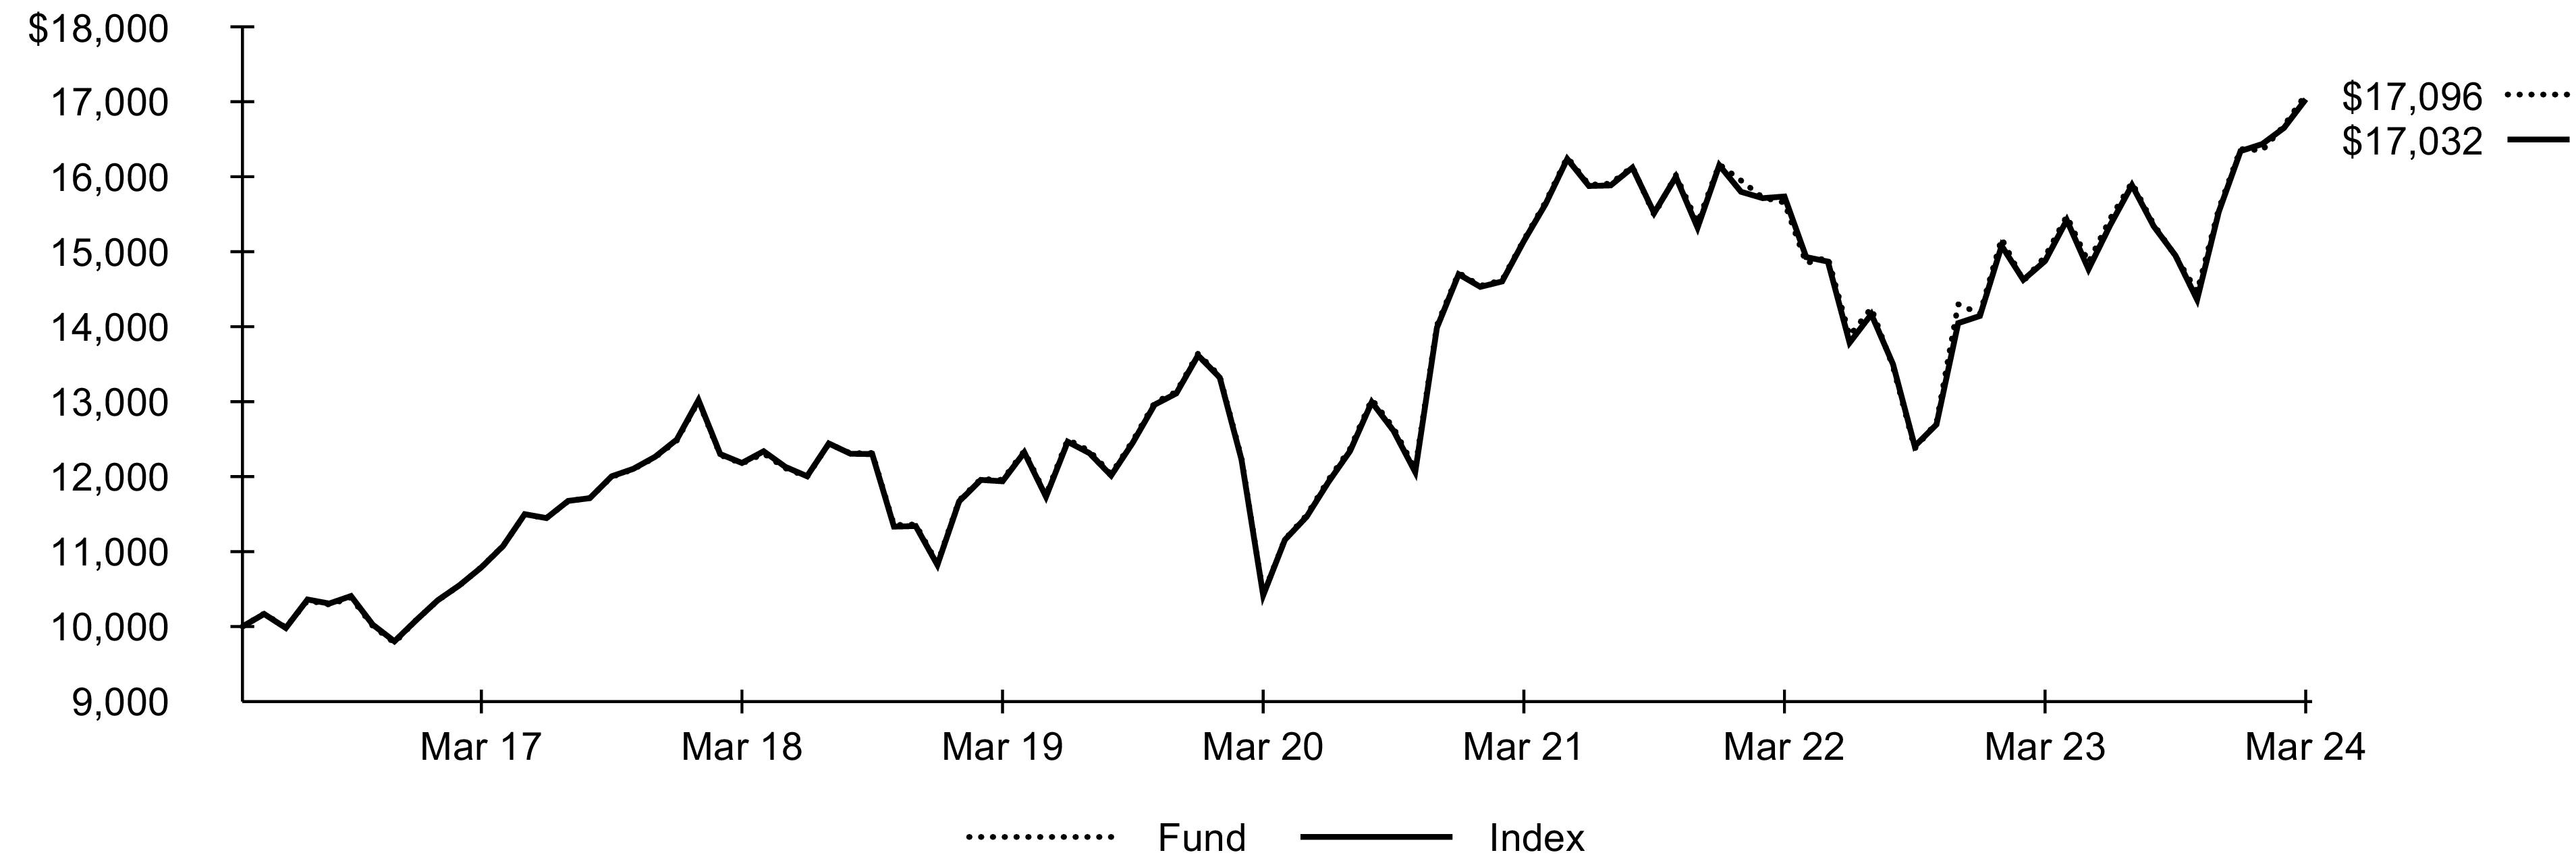
The inception date of the Fund was May 17, 2016. The first day of secondary market trading was May 19, 2016.
Past performance is not an indication of future results. Performance results do not reflect the deduction of taxes that a shareholder would pay on fund distributions or on the redemption or sale of fund shares. See “About Fund Performance” for more information.
Expense Example
| | |
Beginning
Account Value
(10/01/23) | Ending
Account Value
(03/31/24) | | Beginning
Account Value
(10/01/23) | Ending
Account Value
(03/31/24) | | |
| | | | | | |
| Expenses are equal to the annualized expense ratio, multiplied by the average account value over the period, multiplied by 183/366 (to reflect the one-half year period shown). Other fees, such as brokerage commissions and other fees to financial intermediaries, may be paid which are not reflected in the tables and examples above. See “Disclosure of Expenses” for more information. |
Fund Summary as of March 31, 2024 (continued)
iShares® International Dividend Growth ETF
Portfolio Management Commentary
International dividend growth stocks advanced for the reporting period amid continued growth in the global economy. Japanese stocks contributed the most to the Index’s return, as the Japanese economy was helped by rising exports and a series of investor-friendly corporate reforms. The financials sector helped performance, as the banking industry posted strong gains amid shifting policy from the Bank of Japan (“BOJ”). The BOJ altered its yield curve control policy (which it used to keep bond prices within a designated range), allowing bond yields to rise. It also changed its longstanding negative interest rate policy by raising interest rates in March 2024. The higher interest rates benefited Japanese banks by increasing their yields on deposits, which are kept at the Bank of Japan. Improving financial conditions at Japanese banks also enabled increases in dividend payouts. Higher bond yields drove gains in the Japanese insurance industry. Interest earned on bonds represents an important source of income for insurers, and elevated bond yields led to an increase in interest income.
Japanese industrials stocks also gained, particularly in the trading company and distribution industry. While earnings from commodities-related businesses declined due to slumping commodities prices, solid cash flows enabled continued stock repurchases and dividend payments.
Canadian stocks also contributed to the Index’s return. Following two interest rate increases early in the reporting period, the Bank of Canada kept interest rates steady. Canadian insurance companies gained the most, as elevated interest rates meant that interest income increased. Canadian banks were another source of strength, as dividends rose amid growth in domestic deposits and strong loan volumes. German stocks also advanced, as the software industry benefited from a prominent company’s announcement of a restructuring plan to pivot toward artificial intelligence applications.
On the downside, dividend growth stocks from China detracted from the Index’s return. The insurance industry declined amid a steep decrease in earnings from asset management. Rising medical claims and concerns about the Chinese economy also negatively impacted the insurance industry in Hong Kong.
Portfolio Information
GEOGRAPHIC ALLOCATION
Country/Geographic Region | |
| |
| |
| |
| |
| |
| |
| |
| |
| |
| |
| |
| |
| |
| |
| |
| |
Other (each representing less than 1%) | |
| Excludes money market funds. |
222024 iShares Annual Report to Shareholders
Fund Summary as of March 31, 2024
iShares® Latin America 40 ETF
Investment Objective
The iShares Latin America 40 ETF (the “Fund”) seeks to track the investment results of an index composed of 40 of the largest Latin American equities, as represented by the S&P Latin America 40TM (the “Index”). The Fund invests in a representative sample of securities included in the Index that collectively has an investment profile similar to the Index. Due to the use of representative sampling, the Fund may or may not hold all of the securities that are included in the Index.
Performance
| Average Annual Total Returns | | |
| | | | | | | |
| | | | | | | |
| | | | | | | |
| | | | | | | |
GROWTH OF $10,000 INVESTMENT(AT NET ASSET VALUE)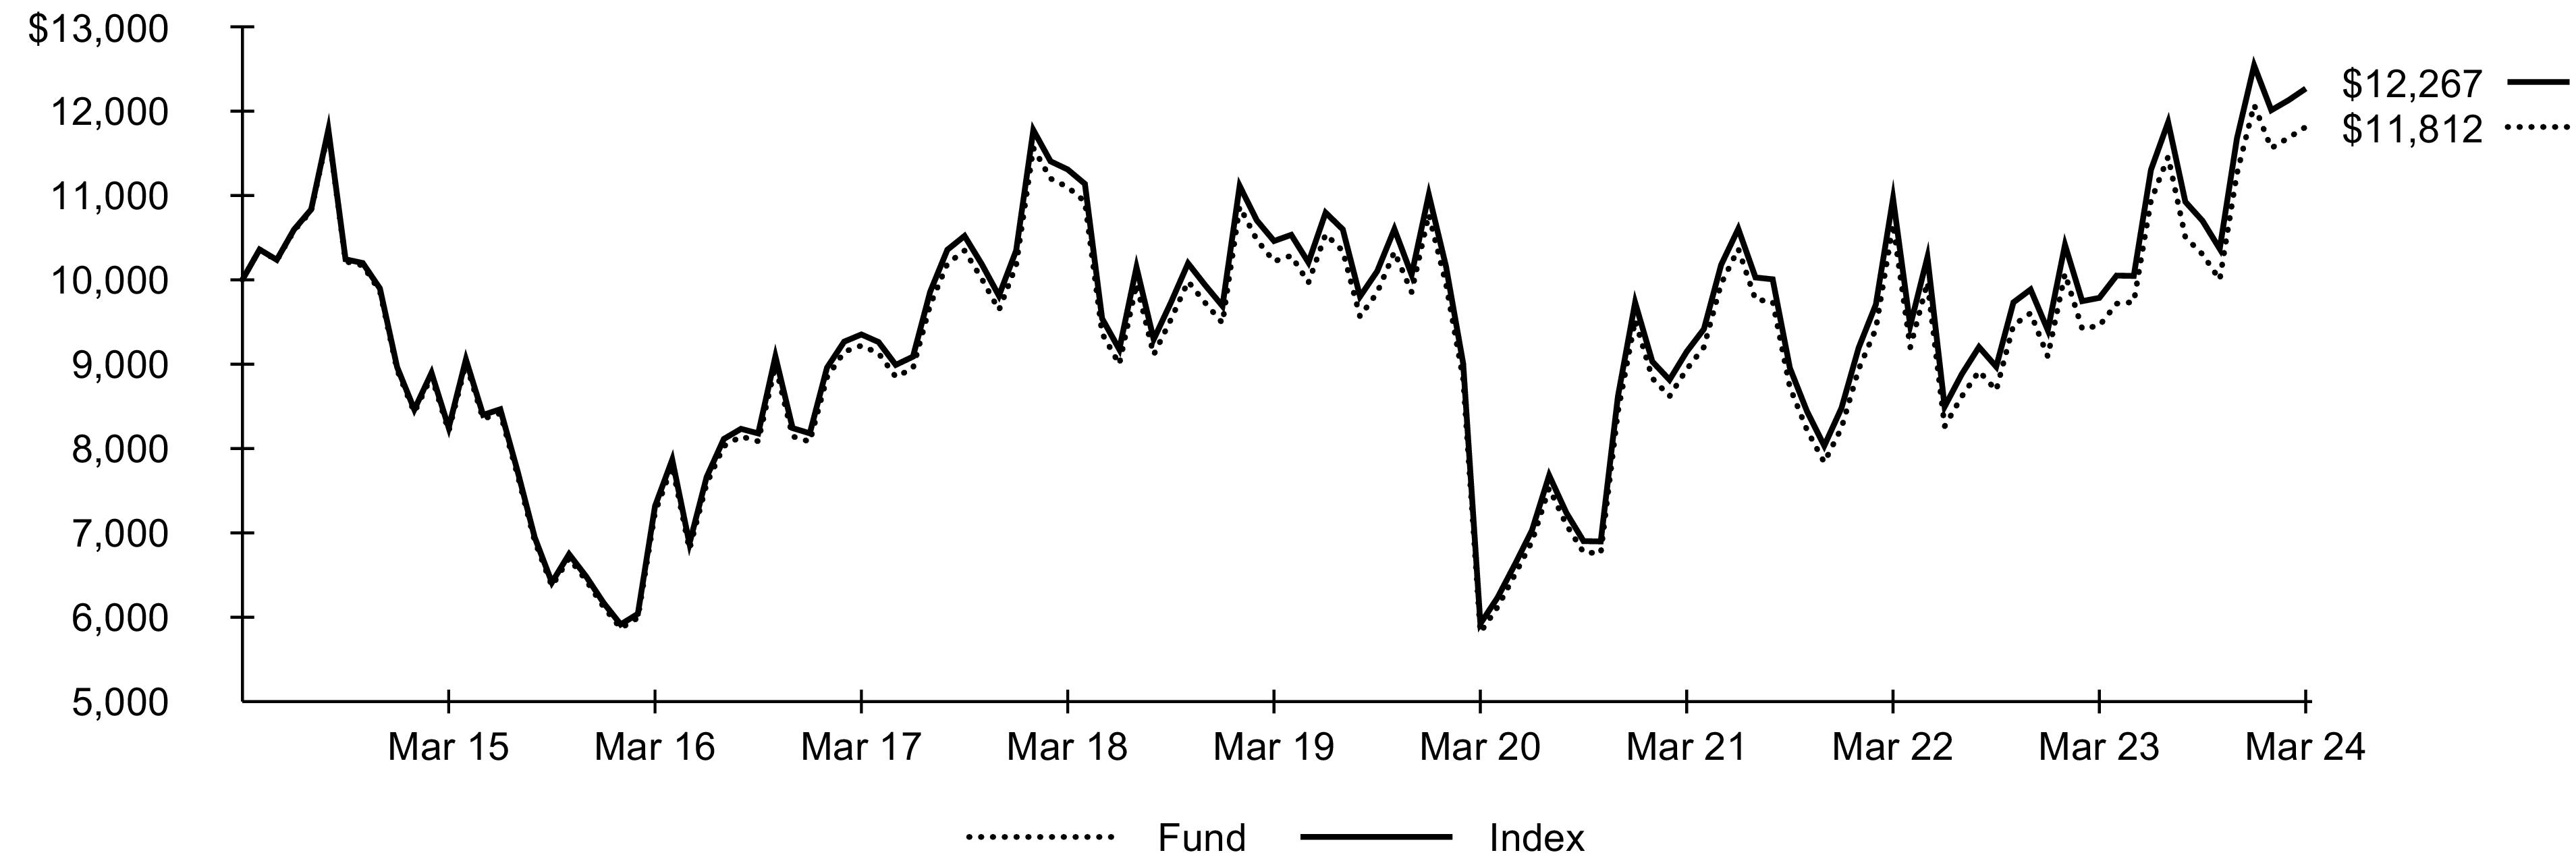
Past performance is not an indication of future results. Performance results do not reflect the deduction of taxes that a shareholder would pay on fund distributions or on the redemption or sale of fund shares. See “About Fund Performance” for more information.
Expense Example
| | |
Beginning
Account Value
(10/01/23) | Ending
Account Value
(03/31/24) | | Beginning
Account Value
(10/01/23) | Ending
Account Value
(03/31/24) | | |
| | | | | | |
| Expenses are equal to the annualized expense ratio, multiplied by the average account value over the period, multiplied by 183/366 (to reflect the one-half year period shown). Other fees, such as brokerage commissions and other fees to financial intermediaries, may be paid which are not reflected in the tables and examples above. See “Disclosure of Expenses” for more information. |
Fund Summary as of March 31, 2024 (continued)
iShares® Latin America 40 ETF
Portfolio Management Commentary
Large-capitalization Latin American stocks advanced strongly for the reporting period. The region underwent an economic slowdown, although growth outpaced expectations in its two largest economies, Brazil and Mexico, supported by strength in consumer spending.
Brazil was the largest contributor to the Index’s return, as a resilient economy, political stability, interest rate cuts, and an easing in the inflation rate drove gains for Brazilian equities. The financials sector was a significant source of strength, particularly the banking industry. Substantial growth in new customers drove a surge in profits for a banking and financial services company that offers digital-only products. The fast-growing online bank also increased its revenues from existing customers with successful cross-selling, greater usage of its credit cards, and efforts to attract a wealthier demographic. A rise in net interest income from expanding loan portfolios, including higher agribusiness lending in a strong environment for corn and soybean production, also supported Brazilian banks. Additionally, in advance of the central bank’s introduction of a digital version of the Brazilian real, moves to accommodate consumer interest in digital assets boosted industry profits.
The energy sector in Brazil also contributed to the Index’s performance. In the integrated oil and gas industry, rising oil prices drove substantial price increases for gasoline and diesel fuel, buoying investor sentiment. Higher-than-expected production of oil and natural gas, due to robust output from floating production units, further supported the industry.
In Mexico, the materials sector led contributions to the Index’s return. Robust sales and higher prices for cement in the U.S., a key export market, aided performance in the construction materials industry, despite a decline in cement volumes due to unfavorable weather and weakened demand. A stronger Mexican peso also supported gains for construction materials companies. The Mexican consumer staples sector also contributed, as beverage producers benefited from strong consumer demand, ambitious store expansion from industry-leading companies, and consumer enthusiasm for loyalty programs. In Peru, the materials sector contributed as higher prices for silver and copper drove solid earnings for mining companies.
Portfolio Information
GEOGRAPHIC ALLOCATION
Country/Geographic Region | |
| |
| |
| |
| |
| |
| Excludes money market funds. |
242024 iShares Annual Report to Shareholders
Past performance is not an indication of future results. Financial markets have experienced extreme volatility and trading in many instruments has been disrupted. These circumstances may continue for an extended period of time and may continue to affect adversely the value and liquidity of each Fund’s investments. As a result, current performance may be lower or higher than the performance data quoted. Performance data current to the most recent month-end is available at iShares.com. Performance results assume reinvestment of all dividends and capital gain distributions and do not reflect the deduction of taxes that a shareholder would pay on fund distributions or on the redemption or sale of fund shares. The investment return and principal value of shares will vary with changes in market conditions. Shares may be worth more or less than their original cost when they are redeemed or sold in the market. Performance for certain funds may reflect a waiver of a portion of investment advisory fees. Without such a waiver, performance would have been lower.
Net asset value or “NAV” is the value of one share of a fund as calculated in accordance with the standard formula for valuing mutual fund shares. Beginning August 10, 2020, the price used to calculate market return (“Market Price”) is the closing price. Prior to August 10, 2020, Market Price was determined using the midpoint between the highest bid and the lowest ask on the primary stock exchange on which shares of a fund are listed for trading, as of the time that such fund’s NAV is calculated. Since shares of a fund may not trade in the secondary market until after the fund’s inception, for the period from inception to the first day of secondary market trading in shares of the fund, the NAV of the fund is used as a proxy for the Market Price to calculate market returns. Market and NAV returns assume that dividends and capital gain distributions have been reinvested at Market Price and NAV, respectively.
An index is a statistical composite that tracks a specified financial market or sector. Unlike a fund, an index does not actually hold a portfolio of securities and therefore does not incur the expenses incurred by a fund. These expenses negatively impact fund performance. Also, index returns do not include brokerage commissions that may be payable on secondary market transactions. If brokerage commissions were included, index returns would be lower.
Disclosure of Expenses
Shareholders of each Fund may incur the following charges: (1) transactional expenses, including brokerage commissions on purchases and sales of fund shares and (2) ongoing expenses, including management fees and other fund expenses. The expense examples shown (which are based on a hypothetical investment of $1,000 invested at the beginning of the period and held through the end of the period) are intended to assist shareholders both in calculating expenses based on an investment in each Fund and in comparing these expenses with similar costs of investing in other funds.
The expense examples provide information about actual account values and actual expenses. Annualized expense ratios reflect contractual and voluntary fee waivers, if any. In order to estimate the expenses a shareholder paid during the period covered by this report, shareholders can divide their account value by $1,000 and then multiply the result by the number under the heading entitled “Expenses Paid During the Period.”
The expense examples also provide information about hypothetical account values and hypothetical expenses based on a fund’s actual expense ratio and an assumed rate of return of 5% per year before expenses. In order to assist shareholders in comparing the ongoing expenses of investing in the Funds and other funds, compare the 5% hypothetical examples with the 5% hypothetical examples that appear in the shareholder reports of the other funds.
The expenses shown in the expense examples are intended to highlight shareholders’ ongoing costs only and do not reflect any transactional expenses, such as brokerage commissions and other fees paid on purchases and sales of fund shares. Therefore, the hypothetical examples are useful in comparing ongoing expenses only and will not help shareholders determine the relative total expenses of owning different funds. If these transactional expenses were included, shareholder expenses would have been higher.
About Fund Performance/Disclosure of Expenses25
Schedule of InvestmentsMarch 31, 2024
iShares® Asia 50 ETF(Percentages shown are based on Net Assets)
| | |
|
|
Alibaba Group Holding Ltd. | | |
ANTA Sports Products Ltd. | | |
| | |
Bank of China Ltd., Class H | | |
| | |
China Construction Bank Corp., Class H | | |
China Merchants Bank Co. Ltd., Class H | | |
Industrial & Commercial Bank of China Ltd., Class H | | |
| | |
Kuaishou Technology(a)(b) | | |
| | |
| | |
| | |
PetroChina Co. Ltd., Class H | | |
Ping An Insurance Group Co. of China Ltd., Class H | | |
| | |
| | |
Xiaomi Corp., Class B(a)(b) | | |
| | |
|
| | |
CK Hutchison Holdings Ltd. | | |
Hong Kong Exchanges & Clearing Ltd. | | |
| | |
Sun Hung Kai Properties Ltd. | | |
Techtronic Industries Co. Ltd. | | |
| | |
|
| | |
Oversea-Chinese Banking Corp. Ltd. | | |
United Overseas Bank Ltd. | | |
| | |
|
| | |
| | |
| | |
| | |
| | |
| | |
| | |
| | |
Samsung Electronics Co. Ltd. | | |
| | |
Shinhan Financial Group Co. Ltd. | | |
| | |
| | |
|
Cathay Financial Holding Co. Ltd. | | |
Chunghwa Telecom Co. Ltd. | | |
CTBC Financial Holding Co. Ltd. | | |
| | |
|
| | |
| | |
Fubon Financial Holding Co. Ltd. | | |
Hon Hai Precision Industry Co. Ltd. | | |
| | |
| | |
Taiwan Semiconductor Manufacturing Co. Ltd. | | |
United Microelectronics Corp. | | |
| | |
Total Common Stocks — 97.6%
(Cost: $1,396,170,367) | |
|
|
| | |
| | |
Series 2, Preference Shares, NVS | | |
LG Chem Ltd., Preference Shares, NVS | | |
Samsung Electronics Co. Ltd., Preference Shares, NVS | | |
| | |
Total Preferred Stocks — 1.9%
(Cost: $21,153,791) | |
Total Long-Term Investments — 99.5%
(Cost: $1,417,324,158) | |
|
Money Market Funds — 0.3% |
BlackRock Cash Funds: Institutional, SL Agency Shares, 5.50%(d)(e)(f) | | |
BlackRock Cash Funds: Treasury, SL Agency Shares, 5.29%(d)(e) | | |
Total Short-Term Securities — 0.3%
(Cost: $3,932,843) | |
Total Investments — 99.8%
(Cost: $1,421,257,001) | |
Other Assets Less Liabilities — 0.2% | |
| |
| Non-income producing security. |
| Security exempt from registration pursuant to Rule 144A under the Securities Act of 1933, as amended. These securities may be resold in transactions exempt from registration to qualified institutional investors. |
| All or a portion of this security is on loan. |
| |
| Annualized 7-day yield as of period end. |
| All or a portion of this security was purchased with the cash collateral from loaned securities. |
262024 iShares Annual Report to Shareholders
Schedule of Investments (continued)March 31, 2024
Affiliates
Investments in issuers considered to be affiliate(s) of the Fund during the year ended March 31, 2024 for purposes of Section 2(a)(3) of the Investment Company Act of 1940, as amended, were as follows:
| | | | | Change in
Unrealized
Appreciation
(Depreciation) | | | | Capital
Gain
Distributions
from
Underlying
Funds |
BlackRock Cash Funds: Institutional, SL Agency Shares | | | | | | | | | |
BlackRock Cash Funds: Treasury, SL Agency Shares | | | | | | | | | |
| | | | | | | | | |
| Represents net amount purchased (sold). |
| All or a portion represents securities lending income earned from the reinvestment of cash collateral from loaned securities, net of fees and collateral investment expenses, and other payments to and from borrowers of securities. |
Derivative Financial Instruments Outstanding as of Period End
Futures Contracts
| | | | Value/
Unrealized
Appreciation
(Depreciation) |
| | | | |
| | | | |
| | | | |
MSCI Emerging Markets Index | | | | |
| | | | |
Derivative Financial Instruments Categorized by Risk Exposure
As of period end, the fair values of derivative financial instruments located in the Statements of Assets and Liabilities were as follows:
| | | | Foreign
Currency
Exchange
Contracts | | | |
Liabilities—Derivative Financial Instruments | | | | | | | |
| | | | | | | |
Unrealized depreciation on futures contracts(a) | | | | | | | |
| Net cumulative unrealized appreciation (depreciation) on futures contracts are reported in the Schedule of Investments. In the Statements of Assets and Liabilities, only current day's variation margin is reported in receivables or payables and the net cumulative unrealized appreciation (depreciation) is included in accumulated earnings (loss). |
For the period ended March 31, 2024, the effect of derivative financial instruments in the Statements of Operations was as follows:
| | | | Foreign
Currency
Exchange
Contracts | | | |
Net Realized Gain (Loss) from | | | | | | | |
| | | | | | | |
Net Change in Unrealized Appreciation (Depreciation) on | | | | | | | |
| | | | | | | |
Schedule of Investments27
Schedule of Investments (continued)March 31, 2024
Average Quarterly Balances of Outstanding Derivative Financial Instruments
| |
Average notional value of contracts — long | |
For more information about the Fund’s investment risks regarding derivative financial instruments, refer to the Notes to Financial Statements.
Fair Value Hierarchy as of Period End
Various inputs are used in determining the fair value of financial instruments. For a description of the input levels and information about the Fund’s policy regarding valuation of financial instruments, refer to the Notes to Financial Statements.
The following table summarizes the Fund’s financial instruments categorized in the fair value hierarchy. The breakdown of the Fund’s financial instruments into major categories is disclosed in the Schedule of Investments above.
| | | | |
| | | | |
| | | | |
| | | | |
| | | | |
| | | | |
| | | | |
| | | | |
| | | | |
Derivative Financial Instruments(a) | | | | |
| | | | |
| | | | |
| Derivative financial instruments are futures contracts. Futures contracts are valued at the unrealized appreciation (depreciation) on the instrument. |
See notes to financial statements.
282024 iShares Annual Report to Shareholders
Schedule of InvestmentsMarch 31, 2024
iShares® Blockchain and Tech ETF(Percentages shown are based on Net Assets)
| | |
|
|
| | |
| | |
Coinbase Global Inc., Class A(a) | | |
Galaxy Digital Holdings Ltd.(a) | | |
Robinhood Markets Inc.(a) | | |
| | |
Voyager Digital Ltd.(a)(b) | | |
| | |
Financial Services — 10.0% |
| | |
| | |
| | |
| | |
|
| | |
Interactive Media & Services — 0.4% |
| | |
|
Core Scientific Inc.(a)(d) | | |
| | |
International Business Machines Corp. | | |
| | |
| | |
|
| | |
Semiconductors & Semiconductor Equipment — 7.7% |
Advanced Micro Devices Inc.(a) | | |
| | |
Amlogic Shanghai Co. Ltd. | | |
| | |
| | |
|
Argo Blockchain PLC, ADR(a) | | |
| | |
Bitdeer Technologies Group, NVS(a)(d) | | |
Bitfarms Ltd/Canada(a)(d) | | |
| | |
| | |
|
| | |
Hive Digital Technologies Ltd., NVS(a)(d) | | |
| | |
| | |
Marathon Digital Holdings Inc.(a) | | |
| | |
| | |
| | |
| | |
Technology Hardware, Storage & Peripherals — 2.7% |
| | |
GRG Banking Equipment Co. Ltd., Class A | | |
| | |
Total Long-Term Investments — 99.8%
(Cost: $14,585,253) | |
|
Money Market Funds — 12.2% |
BlackRock Cash Funds: Institutional, SL Agency Shares, 5.50%(e)(f)(g) | | |
Total Short-Term Securities — 12.2%
(Cost: $2,894,072) | |
Total Investments — 112.0%
(Cost: $17,479,325) | |
Liabilities in Excess of Other Assets — (12.0)% | |
| |
| Non-income producing security. |
| Security is valued using significant unobservable inputs and is classified as Level 3 in the fair value hierarchy. |
| Security exempt from registration pursuant to Rule 144A under the Securities Act of 1933, as amended. These securities may be resold in transactions exempt from registration to qualified institutional investors. |
| All or a portion of this security is on loan. |
| |
| Annualized 7-day yield as of period end. |
| All or a portion of this security was purchased with the cash collateral from loaned securities. |
Schedule of Investments29
Schedule of Investments (continued)March 31, 2024
iShares® Blockchain and Tech ETF
Affiliates
Investments in issuers considered to be affiliate(s) of the Fund during the year ended March 31, 2024 for purposes of Section 2(a)(3) of the Investment Company Act of 1940, as amended, were as follows:
| | | | | Change in
Unrealized
Appreciation
(Depreciation) | | | | Capital
Gain
Distributions
from
Underlying
Funds |
BlackRock Cash Funds: Institutional, SL Agency Shares | | | | | | | | | |
BlackRock Cash Funds: Treasury, SL Agency Shares(c) | | | | | | | | | |
| | | | | | | | | |
| Represents net amount purchased (sold). |
| All or a portion represents securities lending income earned from the reinvestment of cash collateral from loaned securities, net of fees and collateral investment expenses, and other payments to and from borrowers of securities. |
| As of period end, the entity is no longer held. |
Derivative Financial Instruments Categorized by Risk Exposure
For the period ended March 31, 2024, the effect of derivative financial instruments in the Statements of Operations was as follows:
| | | | Foreign
Currency
Exchange
Contracts | | | |
Net Realized Gain (Loss) from | | | | | | | |
| | | | | | | |
Net Change in Unrealized Appreciation (Depreciation) on | | | | | | | |
| | | | | | | |
Average Quarterly Balances of Outstanding Derivative Financial Instruments
| |
Average notional value of contracts — long | |
For more information about the Fund’s investment risks regarding derivative financial instruments, refer to the Notes to Financial Statements.
Fair Value Hierarchy as of Period End
Various inputs are used in determining the fair value of financial instruments. For a description of the input levels and information about the Fund’s policy regarding valuation of financial instruments, refer to the Notes to Financial Statements.
The following table summarizes the Fund’s financial instruments categorized in the fair value hierarchy. The breakdown of the Fund’s financial instruments into major categories is disclosed in the Schedule of Investments above.
See notes to financial statements.
302024 iShares Annual Report to Shareholders
Schedule of InvestmentsMarch 31, 2024
iShares® Emerging Markets Infrastructure ETF(Percentages shown are based on Net Assets)
| | |
|
|
| | |
Centrais Eletricas Brasileiras SA, ADR | | |
Cia. de Saneamento Basico do Estado de Sao Paulo SABESP, ADR | | |
Companhia Paranaense de Energia, ADR | | |
Ultrapar Participacoes SA, ADR | | |
| | |
|
Beijing Capital International Airport Co. Ltd., Class H(a) | | |
CGN Power Co. Ltd., Class H(b) | | |
| | |
China Longyuan Power Group Corp. Ltd., Class H | | |
China Merchants Port Holdings Co. Ltd. | | |
China Oilfield Services Ltd., Class H | | |
China Resources Gas Group Ltd. | | |
China Resources Power Holdings Co. Ltd. | | |
China Suntien Green Energy Corp. Ltd., Class H | | |
COSCO Shipping Energy Transportation Co. Ltd., Class H | | |
COSCO SHIPPING Ports Ltd. | | |
Huaneng Power International Inc., Class H(a) | | |
Jiangsu Expressway Co. Ltd., Class H | | |
| | |
Shenzhen International Holdings Ltd. | | |
Yuexiu Transport Infrastructure Ltd. | | |
Zhejiang Expressway Co. Ltd., Class H | | |
| | |
|
Grupo Aeroportuario del Centro Norte SAB de CV, ADR | | |
Grupo Aeroportuario del Pacifico SAB de CV, ADR | | |
Grupo Aeroportuario del Sureste SAB de CV, ADR | | |
| | |
|
Qatar Gas Transport Co. Ltd. | | |
|
Korea Electric Power Corp., ADR(a)(c) | | |
|
Airports of Thailand PCL, NVDR(c) | | |
United Arab Emirates — 2.9% |
| | |
Total Common Stocks — 96.5%
(Cost: $17,991,978) | |
| | |
|
|
Cia. Energetica de Minas Gerais, Preference Shares, ADR | | |
|
Transneft PJSC, Preference Shares, NVS(a)(d) | | |
Total Preferred Stocks — 3.2%
(Cost: $1,966,158) | |
Total Long-Term Investments — 99.7%
(Cost: $19,958,136) | |
|
Money Market Funds — 7.7% |
BlackRock Cash Funds: Institutional, SL Agency Shares, 5.50%(e)(f)(g) | | |
BlackRock Cash Funds: Treasury, SL Agency Shares, 5.29%(e)(f) | | |
Total Short-Term Securities — 7.7%
(Cost: $1,688,427) | |
Total Investments — 107.4%
(Cost: $21,646,563) | |
Liabilities in Excess of Other Assets — (7.4)% | |
| |
| Non-income producing security. |
| Security exempt from registration pursuant to Rule 144A under the Securities Act of 1933, as amended. These securities may be resold in transactions exempt from registration to qualified institutional investors. |
| All or a portion of this security is on loan. |
| Security is valued using significant unobservable inputs and is classified as Level 3 in the fair value hierarchy. |
| |
| Annualized 7-day yield as of period end. |
| All or a portion of this security was purchased with the cash collateral from loaned securities. |
Schedule of Investments31
Schedule of Investments (continued)March 31, 2024
iShares® Emerging Markets Infrastructure ETF
Affiliates
Investments in issuers considered to be affiliate(s) of the Fund during the year ended March 31, 2024 for purposes of Section 2(a)(3) of the Investment Company Act of 1940, as amended, were as follows:
| | | | | Change in
Unrealized
Appreciation
(Depreciation) | | | | Capital
Gain
Distributions
from
Underlying
Funds |
BlackRock Cash Funds: Institutional, SL Agency Shares | | | | | | | | | |
BlackRock Cash Funds: Treasury, SL Agency Shares | | | | | | | | | |
| | | | | | | | | |
| Represents net amount purchased (sold). |
| All or a portion represents securities lending income earned from the reinvestment of cash collateral from loaned securities, net of fees and collateral investment expenses, and other payments to and from borrowers of securities. |
Derivative Financial Instruments Outstanding as of Period End
Futures Contracts
| | | | Value/
Unrealized
Appreciation
(Depreciation) |
| | | | |
MSCI Emerging Markets Index | | | | |
Derivative Financial Instruments Categorized by Risk Exposure
As of period end, the fair values of derivative financial instruments located in the Statements of Assets and Liabilities were as follows:
| | | | Foreign
Currency
Exchange
Contracts | | | |
Assets—Derivative Financial Instruments | | | | | | | |
| | | | | | | |
Unrealized appreciation on futures contracts(a) | | | | | | | |
| Net cumulative unrealized appreciation (depreciation) on futures contracts are reported in the Schedule of Investments. In the Statements of Assets and Liabilities, only current day's variation margin is reported in receivables or payables and the net cumulative unrealized appreciation (depreciation) is included in accumulated earnings (loss). |
For the period ended March 31, 2024, the effect of derivative financial instruments in the Statements of Operations was as follows:
| | | | Foreign
Currency
Exchange
Contracts | | | |
Net Realized Gain (Loss) from | | | | | | | |
| | | | | | | |
Net Change in Unrealized Appreciation (Depreciation) on | | | | | | | |
| | | | | | | |
Average Quarterly Balances of Outstanding Derivative Financial Instruments
| |
Average notional value of contracts — long | |
For more information about the Fund’s investment risks regarding derivative financial instruments, refer to the Notes to Financial Statements.
322024 iShares Annual Report to Shareholders
Schedule of Investments (continued)March 31, 2024
iShares® Emerging Markets Infrastructure ETF
Fair Value Hierarchy as of Period End
Various inputs are used in determining the fair value of financial instruments. For a description of the input levels and information about the Fund’s policy regarding valuation of financial instruments, refer to the Notes to Financial Statements.
The following table summarizes the Fund’s financial instruments categorized in the fair value hierarchy. The breakdown of the Fund’s financial instruments into major categories is disclosed in the Schedule of Investments above.
| | | | |
| | | | |
| | | | |
| | | | |
| | | | |
| | | | |
| | | | |
| | | | |
| | | | |
Derivative Financial Instruments(a) | | | | |
| | | | |
| | | | |
| Derivative financial instruments are futures contracts. Futures contracts are valued at the unrealized appreciation (depreciation) on the instrument. |
See notes to financial statements.
Schedule of Investments33
Schedule of InvestmentsMarch 31, 2024
iShares® Europe ETF(Percentages shown are based on Net Assets)
| | |
|
|
| | |
| | |
| | |
| | |
|
| | |
Anheuser-Busch InBev SA/NV | | |
| | |
Groupe Bruxelles Lambert NV | | |
| | |
| | |
| | |
| | |
| | |
|
AP Moller - Maersk A/S, Class A | | |
AP Moller - Maersk A/S, Class B, NVS | | |
| | |
| | |
| | |
| | |
| | |
| | |
| | |
Novonesis A/S (Novozymes A/S), Class B | | |
| | |
| | |
| | |
Vestas Wind Systems A/S(a) | | |
| | |
|
| | |
| | |
| | |
| | |
| | |
| | |
| | |
| | |
| | |
| | |
| | |
| | |
|
| | |
| | |
| | |
| | |
| | |
| | |
| | |
| | |
| | |
| | |
| | |
| | |
| | |
Cie. Generale des Etablissements Michelin SCA | | |
| | |
| | |
|
| | |
| | |
| | |
| | |
| | |
| | |
| | |
| | |
| | |
| | |
| | |
| | |
| | |
| | |
LVMH Moet Hennessy Louis Vuitton SE | | |
| | |
| | |
| | |
| | |
| | |
| | |
| | |
| | |
| | |
| | |
| | |
| | |
| | |
Unibail-Rodamco-Westfield, New(a) | | |
| | |
| | |
| | |
Worldline SA/France(a)(b) | | |
| | |
|
| | |
| | |
| | |
| | |
Bayerische Motoren Werke AG | | |
| | |
| | |
| | |
| | |
| | |
| | |
Delivery Hero SE, Class A(a)(b) | | |
Deutsche Bank AG, Registered | | |
| | |
Deutsche Post AG, Registered | | |
Deutsche Telekom AG, Registered | | |
| | |
Fresenius Medical Care AG & Co. KGaA | | |
| | |
| | |
| | |
| | |
| | |
| | |
| | |
| | |
| | |
342024 iShares Annual Report to Shareholders
Schedule of Investments (continued)March 31, 2024
iShares® Europe ETF(Percentages shown are based on Net Assets)
| | |
|
| | |
Muenchener Rueckversicherungs-Gesellschaft AG in Muenchen, Registered | | |
| | |
| | |
| | |
| | |
| | |
| | |
Siemens Healthineers AG(b) | | |
| | |
| | |
| | |
| | |
| | |
|
Bank of Ireland Group PLC | | |
| | |
Flutter Entertainment PLC(a) | | |
| | |
| | |
Ryanair Holdings PLC, ADR | | |
| | |
| | |
|
Assicurazioni Generali SpA | | |
| | |
| | |
| | |
| | |
FinecoBank Banca Fineco SpA | | |
| | |
Mediobanca Banca di Credito Finanziario SpA | | |
| | |
| | |
| | |
| | |
| | |
Telecom Italia SpA/Milano(a)(c) | | |
| | |
Terna - Rete Elettrica Nazionale | | |
| | |
| | |
|
| | |
| | |
| | |
| | |
| | |
| | |
| | |
BE Semiconductor Industries NV | | |
| | |
| | |
| | |
| | |
| | |
| | |
Koninklijke Ahold Delhaize NV | | |
| | |
Koninklijke Philips NV(a) | | |
| | |
|
| | |
| | |
| | |
| | |
| | |
| | |
| | |
|
| | |
| | |
| | |
| | |
| | |
| | |
| | |
| | |
| | |
|
EDP - Energias de Portugal SA | | |
| | |
| | |
| | |
|
STMicroelectronics NV , New(c) | | |
|
ACS Actividades de Construccion y Servicios SA | | |
| | |
| | |
Banco Bilbao Vizcaya Argentaria SA | | |
| | |
| | |
| | |
| | |
| | |
| | |
| | |
| | |
Industria de Diseno Textil SA | | |
| | |
| | |
| | |
| | |
| | |
|
| | |
| | |
| | |
| | |
| | |
| | |
| | |
| | |
| | |
| | |
| | |
H & M Hennes & Mauritz AB, Class B | | |
| | |
Industrivarden AB, Class A | | |
Industrivarden AB, Class C | | |
| | |
Schedule of Investments35
Schedule of Investments (continued)March 31, 2024
iShares® Europe ETF(Percentages shown are based on Net Assets)
| | |
|
Nibe Industrier AB, Class B | | |
| | |
| | |
Skandinaviska Enskilda Banken AB, Class A | | |
| | |
| | |
| | |
Svenska Cellulosa AB SCA, Class B | | |
Svenska Handelsbanken AB, Class A | | |
| | |
| | |
Telefonaktiebolaget LM Ericsson, Class B | | |
| | |
| | |
| | |
| | |
|
| | |
Adecco Group AG, Registered | | |
| | |
Baloise Holding AG, Registered | | |
Barry Callebaut AG, Registered | | |
Chocoladefabriken Lindt & Spruengli AG, Participation Certificates, NVS | | |
Chocoladefabriken Lindt & Spruengli AG, Registered | | |
Cie. Financiere Richemont SA, Class A, Registered | | |
| | |
| | |
| | |
| | |
| | |
Kuehne + Nagel International AG, Registered | | |
Logitech International SA, Registered | | |
Lonza Group AG, Registered | | |
| | |
| | |
Partners Group Holding AG | | |
| | |
| | |
| | |
Schindler Holding AG, Participation Certificates, NVS | | |
Schindler Holding AG, Registered | | |
| | |
| | |
| | |
Sonova Holding AG, Registered | | |
| | |
Swatch Group AG (The), Bearer | | |
Swatch Group AG (The), Registered | | |
Swiss Life Holding AG, Registered | | |
Swiss Prime Site AG, Registered | | |
| | |
| | |
| | |
| | |
| | |
Zurich Insurance Group AG | | |
| | |
|
| | |
| | |
| | |
United Kingdom (continued) |
| | |
| | |
| | |
| | |
Associated British Foods PLC | | |
| | |
| | |
| | |
| | |
| | |
| | |
Berkeley Group Holdings PLC | | |
| | |
British American Tobacco PLC | | |
British Land Co. PLC (The) | | |
| | |
| | |
| | |
| | |
| | |
| | |
| | |
| | |
| | |
| | |
| | |
| | |
| | |
| | |
| | |
| | |
| | |
| | |
| | |
| | |
InterContinental Hotels Group PLC | | |
Intermediate Capital Group PLC | | |
| | |
| | |
| | |
| | |
Land Securities Group PLC | | |
Legal & General Group PLC | | |
| | |
London Stock Exchange Group PLC | | |
| | |
Marks & Spencer Group PLC | | |
| | |
| | |
| | |
| | |
| | |
| | |
| | |
| | |
Phoenix Group Holdings PLC | | |
| | |
Reckitt Benckiser Group PLC | | |
| | |
| | |
| | |
| | |
362024 iShares Annual Report to Shareholders
Schedule of Investments (continued)March 31, 2024
iShares® Europe ETF(Percentages shown are based on Net Assets)
| | |
United Kingdom (continued) |
Rolls-Royce Holdings PLC(a) | | |
| | |
| | |
| | |
| | |
| | |
| | |
| | |
Spirax-Sarco Engineering PLC | | |
| | |
| | |
| | |
| | |
| | |
| | |
United Utilities Group PLC | | |
| | |
| | |
| | |
| | |
| | |
Total Common Stocks — 98.9%
(Cost: $1,583,121,422) | |
|
|
Bayerische Motoren Werke AG, Preference Shares, NVS | | |
Dr Ing hc F Porsche AG, Preference Shares, NVS(b) | | |
Henkel AG & Co. KGaA, Preference Shares, NVS | | |
Porsche Automobil Holding SE, Preference Shares, NVS | | |
Sartorius AG, Preference Shares, NVS | | |
| | |
|
Volkswagen AG, Preference Shares, NVS | | |
| | |
|
Telecom Italia SpA, Preference Shares, NVS | | |
Total Preferred Stocks — 0.7%
(Cost: $17,373,470) | |
Total Long-Term Investments — 99.6%
(Cost: $1,600,494,892) | |
|
Money Market Funds — 0.4% |
BlackRock Cash Funds: Institutional, SL Agency Shares, 5.50%(d)(e)(f) | | |
BlackRock Cash Funds: Treasury, SL Agency Shares, 5.29%(d)(e) | | |
Total Short-Term Securities — 0.4%
(Cost: $6,030,215) | |
Total Investments — 100.0%
(Cost: $1,606,525,107) | |
Other Assets Less Liabilities — 0.0% | |
| |
| Non-income producing security. |
| Security exempt from registration pursuant to Rule 144A under the Securities Act of 1933, as amended. These securities may be resold in transactions exempt from registration to qualified institutional investors. |
| All or a portion of this security is on loan. |
| |
| Annualized 7-day yield as of period end. |
| All or a portion of this security was purchased with the cash collateral from loaned securities. |
Affiliates
Investments in issuers considered to be affiliate(s) of the Fund during the year ended March 31, 2024 for purposes of Section 2(a)(3) of the Investment Company Act of 1940, as amended, were as follows:
| | | | | Change in
Unrealized
Appreciation
(Depreciation) | | | | Capital
Gain
Distributions
from
Underlying
Funds |
BlackRock Cash Funds: Institutional, SL Agency Shares | | | | | | | | | |
BlackRock Cash Funds: Treasury, SL Agency Shares | | | | | | | | | |
| | | | | | | | | |
| Represents net amount purchased (sold). |
| All or a portion represents securities lending income earned from the reinvestment of cash collateral from loaned securities, net of fees and collateral investment expenses, and other payments to and from borrowers of securities. |
Schedule of Investments37
Schedule of Investments (continued)March 31, 2024
Derivative Financial Instruments Outstanding as of Period End
Futures Contracts
| | | | Value/
Unrealized
Appreciation
(Depreciation) |
| | | | |
| | | | |
| | | | |
| | | | |
Derivative Financial Instruments Categorized by Risk Exposure
As of period end, the fair values of derivative financial instruments located in the Statements of Assets and Liabilities were as follows:
| | | | Foreign
Currency
Exchange
Contracts | | | |
Assets—Derivative Financial Instruments | | | | | | | |
| | | | | | | |
Unrealized appreciation on futures contracts(a) | | | | | | | |
| Net cumulative unrealized appreciation (depreciation) on futures contracts are reported in the Schedule of Investments. In the Statements of Assets and Liabilities, only current day's variation margin is reported in receivables or payables and the net cumulative unrealized appreciation (depreciation) is included in accumulated earnings (loss). |
For the period ended March 31, 2024, the effect of derivative financial instruments in the Statements of Operations was as follows:
| | | | Foreign
Currency
Exchange
Contracts | | | |
Net Realized Gain (Loss) from | | | | | | | |
| | | | | | | |
Net Change in Unrealized Appreciation (Depreciation) on | | | | | | | |
| | | | | | | |
Average Quarterly Balances of Outstanding Derivative Financial Instruments
| |
Average notional value of contracts — long | |
For more information about the Fund’s investment risks regarding derivative financial instruments, refer to the Notes to Financial Statements.
Fair Value Hierarchy as of Period End
Various inputs are used in determining the fair value of financial instruments. For a description of the input levels and information about the Fund’s policy regarding valuation of financial instruments, refer to the Notes to Financial Statements.
The following table summarizes the Fund’s financial instruments categorized in the fair value hierarchy. The breakdown of the Fund’s financial instruments into major categories is disclosed in the Schedule of Investments above.
382024 iShares Annual Report to Shareholders
Schedule of Investments (continued)March 31, 2024
Fair Value Hierarchy as of Period End (continued)
| | | | |
Derivative Financial Instruments(a) | | | | |
| | | | |
| | | | |
| Derivative financial instruments are futures contracts. Futures contracts are valued at the unrealized appreciation (depreciation) on the instrument. |
See notes to financial statements.
Schedule of Investments39
Schedule of InvestmentsMarch 31, 2024
iShares® Future Metaverse Tech and Communications ETF(Percentages shown are based on Net Assets)
| | |
|
Communications Equipment — 0.1% |
| | |
|
| | |
| | |
| | |
| | |
| | |
| | |
| | |
Take-Two Interactive Software Inc.(a) | | |
Ubisoft Entertainment SA(a)(b) | | |
| | |
Household Durables — 7.7% |
| | |
| | |
| | |
Interactive Media & Services — 15.3% |
Alphabet Inc., Class A(a) | | |
Kuaishou Technology(a)(c) | | |
| | |
Meta Platforms Inc., Class A | | |
Snap Inc., Class A, NVS(a) | | |
| | |
| | |
Semiconductors & Semiconductor Equipment — 4.2% |
Advanced Micro Devices Inc.(a) | | |
| | |
| | |
| | |
| | |
| | |
| | |
|
| | |
| | |
| | |
| | |
|
Cadence Design Systems Inc.(a)(b) | | |
| | |
| | |
| | |
| | |
| | |
Unity Software Inc.(a)(b) | | |
Zoom Video Communications Inc., Class A(a) | | |
| | |
Technology Hardware, Storage & Peripherals — 3.5% |
| | |
Samsung Electronics Co. Ltd. | | |
| | |
Total Long-Term Investments — 99.9%
(Cost: $5,947,360) | |
|
Money Market Funds — 6.8% |
BlackRock Cash Funds: Institutional, SL Agency Shares, 5.50%(d)(e)(f) | | |
Total Short-Term Securities — 6.8%
(Cost: $448,297) | |
Total Investments — 106.7%
(Cost: $6,395,657) | |
Liabilities in Excess of Other Assets — (6.7)% | |
| |
| Non-income producing security. |
| All or a portion of this security is on loan. |
| Security exempt from registration pursuant to Rule 144A under the Securities Act of 1933, as amended. These securities may be resold in transactions exempt from registration to qualified institutional investors. |
| |
| Annualized 7-day yield as of period end. |
| All or a portion of this security was purchased with the cash collateral from loaned securities. |
Affiliates
Investments in issuers considered to be affiliate(s) of the Fund during the year ended March 31, 2024 for purposes of Section 2(a)(3) of the Investment Company Act of 1940, as amended, were as follows:
| | | | | Change in
Unrealized
Appreciation
(Depreciation) | | | | Capital
Gain
Distributions
from
Underlying
Funds |
BlackRock Cash Funds: Institutional, SL Agency Shares | | | | | | | | | |
BlackRock Cash Funds: Treasury, SL Agency Shares(c) | | | | | | | | | |
| | | | | | | | | |
| Represents net amount purchased (sold). |
| All or a portion represents securities lending income earned from the reinvestment of cash collateral from loaned securities, net of fees and collateral investment expenses, and other payments to and from borrowers of securities. |
| As of period end, the entity is no longer held. |
402024 iShares Annual Report to Shareholders
Schedule of Investments (continued)March 31, 2024
iShares® Future Metaverse Tech and Communications ETF
Fair Value Hierarchy as of Period End
Various inputs are used in determining the fair value of financial instruments. For a description of the input levels and information about the Fund’s policy regarding valuation of financial instruments, refer to the Notes to Financial Statements.
The following table summarizes the Fund’s financial instruments categorized in the fair value hierarchy. The breakdown of the Fund’s financial instruments into major categories is disclosed in the Schedule of Investments above.
See notes to financial statements.
Schedule of Investments41
Schedule of InvestmentsMarch 31, 2024
iShares® India 50 ETF(Percentages shown are based on Net Assets)
| | |
|
|
| | |
| | |
| | |
| | |
| | |
| | |
| | |
|
| | |
| | |
| | |
| | |
| | |
| | |
| | |
|
| | |
Construction & Engineering — 4.5% |
| | |
Construction Materials — 2.0% |
| | |
| | |
| | |
|
| | |
| | |
| | |
Electric Utilities — 1.3% |
Power Grid Corp. of India Ltd. | | |
Financial Services — 0.9% |
| | |
|
Britannia Industries Ltd. | | |
| | |
Tata Consumer Products Ltd. | | |
| | |
Health Care Providers & Services — 0.7% |
Apollo Hospitals Enterprise Ltd. | | |
Independent Power and Renewable Electricity Producers — 1.6% |
| | |
|
HDFC Life Insurance Co. Ltd.(a) | | |
SBI Life Insurance Co. Ltd.(a) | | |
| | |
|
| | |
| | |
| | |
Tata Consultancy Services Ltd. | | |
| | |
| | |
| | |
| | |
Life Sciences Tools & Services — 0.4% |
| | |
|
| | |
| | |
| | |
| | |
Oil, Gas & Consumable Fuels — 12.9% |
Bharat Petroleum Corp. Ltd. | | |
| | |
Oil & Natural Gas Corp. Ltd. | | |
| | |
| | |
Personal Care Products — 2.1% |
| | |
|
| | |
Dr. Reddy's Laboratories Ltd. | | |
Sun Pharmaceutical Industries Ltd. | | |
| | |
Textiles, Apparel & Luxury Goods — 1.6% |
| | |
|
| | |
Trading Companies & Distributors — 0.9% |
| | |
Transportation Infrastructure — 1.0% |
Adani Ports & Special Economic Zone Ltd. | | |
Wireless Telecommunication Services — 3.2% |
| | |
Total Long-Term Investments — 99.8%
(Cost: $705,790,222) | |
|
Money Market Funds — 1.9% |
BlackRock Cash Funds: Treasury, SL Agency Shares, 5.29%(b)(c) | | |
Total Short-Term Securities — 1.9%
(Cost: $16,250,000) | |
Total Investments — 101.7%
(Cost: $722,040,222) | |
Liabilities in Excess of Other Assets — (1.7)% | |
| |
| Security exempt from registration pursuant to Rule 144A under the Securities Act of 1933, as amended. These securities may be resold in transactions exempt from registration to qualified institutional investors. |
| |
| Annualized 7-day yield as of period end. |
422024 iShares Annual Report to Shareholders
Schedule of Investments (continued)March 31, 2024
Affiliates
Investments in issuers considered to be affiliate(s) of the Fund during the year ended March 31, 2024 for purposes of Section 2(a)(3) of the Investment Company Act of 1940, as amended, were as follows:
| | | | | Change in
Unrealized
Appreciation
(Depreciation) | | | | Capital
Gain
Distributions
from
Underlying
Funds |
BlackRock Cash Funds: Treasury, SL Agency Shares | | | | | | | | | |
| Represents net amount purchased (sold). |
Derivative Financial Instruments Outstanding as of Period End
Futures Contracts
| | | | Value/
Unrealized
Appreciation
(Depreciation) |
| | | | |
| | | | |
Derivative Financial Instruments Categorized by Risk Exposure
As of period end, the fair values of derivative financial instruments located in the Statements of Assets and Liabilities were as follows:
| | | | Foreign
Currency
Exchange
Contracts | | | |
Assets—Derivative Financial Instruments | | | | | | | |
| | | | | | | |
Unrealized appreciation on futures contracts(a) | | | | | | | |
| Net cumulative unrealized appreciation (depreciation) on futures contracts are reported in the Schedule of Investments. In the Statements of Assets and Liabilities, only current day's variation margin is reported in receivables or payables and the net cumulative unrealized appreciation (depreciation) is included in accumulated earnings (loss). |
For the period ended March 31, 2024, the effect of derivative financial instruments in the Statements of Operations was as follows:
| | | | Foreign
Currency
Exchange
Contracts | | | |
Net Realized Gain (Loss) from | | | | | | | |
| | | | | | | |
Net Change in Unrealized Appreciation (Depreciation) on | | | | | | | |
| | | | | | | |
Average Quarterly Balances of Outstanding Derivative Financial Instruments
| |
Average notional value of contracts — long | |
For more information about the Fund’s investment risks regarding derivative financial instruments, refer to the Notes to Financial Statements.
Schedule of Investments43
Schedule of Investments (continued)March 31, 2024
Fair Value Hierarchy as of Period End
Various inputs are used in determining the fair value of financial instruments. For a description of the input levels and information about the Fund’s policy regarding valuation of financial instruments, refer to the Notes to Financial Statements.
The following table summarizes the Fund’s financial instruments categorized in the fair value hierarchy. The breakdown of the Fund’s financial instruments into major categories is disclosed in the Schedule of Investments above.
| | | | |
| | | | |
| | | | |
| | | | |
| | | | |
| | | | |
| | | | |
| | | | |
Derivative Financial Instruments(a) | | | | |
| | | | |
| | | | |
| Derivative financial instruments are futures contracts. Futures contracts are valued at the unrealized appreciation (depreciation) on the instrument. |
See notes to financial statements.
442024 iShares Annual Report to Shareholders
Schedule of InvestmentsMarch 31, 2024
iShares® International Developed Property ETF(Percentages shown are based on Net Assets)
| | |
|
|
| | |
| | |
| | |
| | |
| | |
| | |
| | |
| | |
Charter Hall Long Wale REIT | | |
| | |
Charter Hall Social Infrastructure REIT | | |
| | |
| | |
| | |
GDI Property Group Partnership | | |
| | |
| | |
Growthpoint Properties Australia Ltd. | | |
| | |
| | |
| | |
Hotel Property Investments Ltd. | | |
Ingenia Communities Group | | |
| | |
Lifestyle Communities Ltd. | | |
| | |
| | |
| | |
| | |
| | |
| | |
| | |
| | |
| | |
|
| | |
| | |
| | |
|
| | |
Care Property Invest NV(b) | | |
| | |
| | |
| | |
Shurgard Self Storage Ltd. | | |
| | |
| | |
| | |
| | |
|
| | |
| | |
| | |
| | |
| | |
Canadian Apartment Properties REIT | | |
| | |
| | |
| | |
| | |
| | |
|
Dream Office REIT, NVS(a) | | |
DREAM Unlimited Corp., Class A | | |
| | |
| | |
| | |
| | |
| | |
| | |
Morguard North American Residential REIT | | |
| | |
NorthWest Healthcare Properties REIT | | |
| | |
| | |
| | |
| | |
| | |
StorageVault Canada Inc., NVS | | |
| | |
True North Commercial REIT, NVS | | |
| | |
|
Gemdale Properties & Investment Corp. Ltd.(a) | | |
| | |
| | |
|
| | |
| | |
| | |
|
| | |
| | |
| | |
| | |
| | |
| | |
| | |
| | |
Unibail-Rodamco-Westfield, New(b) | | |
| | |
|
| | |
| | |
| | |
| | |
| | |
Grand City Properties SA(b) | | |
| | |
Instone Real Estate Group SE(c) | | |
| | |
| | |
| | |
| | |
| | |
|
| | |
| | |
| | |
| | |
Hang Lung Properties Ltd. | | |
Henderson Land Development Co. Ltd. | | |
Hongkong Land Holdings Ltd. | | |
Schedule of Investments45
Schedule of Investments (continued)March 31, 2024
iShares® International Developed Property ETF(Percentages shown are based on Net Assets)
| | |
|
Hysan Development Co. Ltd. | | |
| | |
| | |
New World Development Co. Ltd.(a) | | |
| | |
Shun Tak Holdings Ltd.(b) | | |
| | |
Sun Hung Kai Properties Ltd. | | |
| | |
| | |
Wharf Holdings Ltd. (The)(a) | | |
Wharf Real Estate Investment Co. Ltd. | | |
| | |
|
Irish Residential Properties REIT PLC | | |
|
Africa Israel Residences Ltd. | | |
| | |
Alony Hetz Properties & Investments Ltd. | | |
| | |
| | |
| | |
| | |
Big Shopping Centers Ltd.(b) | | |
Blue Square Real Estate Ltd. | | |
| | |
| | |
Gav-Yam Lands Corp. Ltd.(a) | | |
| | |
| | |
Israel Land Development Co. Ltd. (The) | | |
Isras Investment Co. Ltd. | | |
| | |
| | |
Menivim- The New REIT Ltd. | | |
Mivne Real Estate KD Ltd. | | |
Norstar Holdings Inc.(a)(b) | | |
Prashkovsky Investments and Construction Ltd. | | |
Property & Building Corp. Ltd.(b) | | |
| | |
Sella Capital Real Estate Ltd. | | |
Summit Real Estate Holdings Ltd. | | |
YH Dimri Construction & Development Ltd. | | |
| | |
|
Immobiliare Grande Distribuzione SIIQ SpA | | |
|
| | |
Advance Logistics Investment Corp. | | |
Advance Residence Investment Corp. | | |
| | |
AEON REIT Investment Corp. | | |
| | |
Comforia Residential REIT Inc. | | |
| | |
| | |
Daito Trust Construction Co. Ltd. | | |
Daiwa House Industry Co. Ltd. | | |
Daiwa House REIT Investment Corp. | | |
Daiwa Office Investment Corp. | | |
| | |
|
Daiwa Securities Living Investments Corp. | | |
| | |
ESCON Japan REIT Investment Corp. | | |
Frontier Real Estate Investment Corp. | | |
| | |
Global One Real Estate Investment Corp. | | |
| | |
| | |
| | |
Health Care & Medical Investment Corp. | | |
Heiwa Real Estate Co. Ltd. | | |
Heiwa Real Estate REIT Inc. | | |
Hoshino Resorts REIT Inc. | | |
| | |
| | |
Ichigo Hotel REIT Investment Corp. | | |
| | |
Ichigo Office REIT Investment Corp. | | |
Industrial & Infrastructure Fund Investment Corp. | | |
Invincible Investment Corp. | | |
| | |
Japan Hotel REIT Investment Corp. | | |
Japan Logistics Fund Inc. | | |
Japan Metropolitan Fund Invest | | |
Japan Prime Realty Investment Corp. | | |
Japan Property Management Center Co. Ltd. | | |
Japan Real Estate Investment Corp. | | |
| | |
| | |
| | |
Keihanshin Building Co. Ltd. | | |
Kenedix Office Investment Corp. | | |
LA Holdings Co. Ltd/Japan | | |
| | |
| | |
Marimo Regional Revitalization REIT Inc. | | |
| | |
| | |
Mitsubishi Estate Co. Ltd. | | |
Mitsubishi Estate Logistics REIT Investment Corp. | | |
| | |
Mitsui Fudosan Logistics Park Inc. | | |
Mori Hills REIT Investment Corp. | | |
| | |
Nippon Accommodations Fund Inc. | | |
Nippon Building Fund Inc. | | |
Nippon Hotel & Residential Investment Corp. | | |
Nippon Prologis REIT Inc. | | |
NIPPON REIT Investment Corp. | | |
Nisshin Group Holdings Co. Ltd. | | |
Nomura Real Estate Holdings Inc. | | |
Nomura Real Estate Master Fund Inc. | | |
NTT UD REIT Investment Corp. | | |
| | |
| | |
| | |
| | |
Samty Residential Investment Corp. | | |
| | |
| | |
SOSiLA Logistics REIT Inc. | | |
| | |
462024 iShares Annual Report to Shareholders
Schedule of Investments (continued)March 31, 2024
iShares® International Developed Property ETF(Percentages shown are based on Net Assets)
| | |
|
Star Asia Investment Corp. | | |
Star Mica Holdings Co. Ltd. | | |
| | |
Starts Proceed Investment Corp. | | |
Sumitomo Realty & Development Co. Ltd. | | |
Sun Frontier Fudousan Co. Ltd. | | |
Takara Leben Real Estate Investment Corp. | | |
| | |
| | |
| | |
| | |
Tokyu Fudosan Holdings Corp. | | |
| | |
| | |
Tosei REIT Investment Corp. | | |
United Urban Investment Corp. | | |
XYMAX REIT Investment Corp. | | |
| | |
|
| | |
Brack Capital Properties NV(b) | | |
| | |
Eurocommercial Properties NV | | |
| | |
| | |
| | |
| | |
|
| | |
| | |
| | |
Precinct Properties Group | | |
| | |
|
| | |
|
| | |
| | |
| | |
| | |
| | |
CapitaLand Integrated Commercial Trust | | |
CapitaLand Investment Ltd/Singapore | | |
CDL Hospitality Trusts(a) | | |
| | |
| | |
Digital Core REIT Management Pte Ltd. | | |
Eagle Hospitality Trust(b)(d) | | |
| | |
| | |
Far East Hospitality Trust | | |
Frasers Centrepoint Trust | | |
Frasers Logistics & Commercial Trust | | |
| | |
| | |
Keppel Pacific Oak U.S. REIT | | |
| | |
Lendlease Global Commercial REIT | | |
Manulife US Real Estate Investment Trust | | |
Mapletree Industrial Trust | | |
| | |
|
Mapletree Logistics Trust | | |
Mapletree Pan Asia Commercial Trust | | |
| | |
| | |
| | |
| | |
| | |
| | |
| | |
| | |
|
D&D Platform REIT Co. Ltd., NVS | | |
ESR Kendall Square REIT Co. Ltd. | | |
Haesung Industrial Co. Ltd. | | |
| | |
| | |
| | |
| | |
Shinhan Alpha REIT Co. Ltd. | | |
| | |
| | |
| | |
| | |
|
| | |
Inmobiliaria Colonial SOCIMI SA | | |
Lar Espana Real Estate SOCIMI SA | | |
Merlin Properties SOCIMI SA | | |
| | |
| | |
|
Atrium Ljungberg AB, Class B | | |
| | |
| | |
Cibus Nordic Real Estate AB publ | | |
Corem Property Group AB, Class B | | |
| | |
| | |
Fastighets AB Balder, Class B(b) | | |
| | |
Neobo Fastigheter AB(a)(b) | | |
| | |
| | |
| | |
Platzer Fastigheter Holding AB, Class B | | |
| | |
| | |
Samhallsbyggnadsbolaget i Norden AB(a) | | |
| | |
| | |
| | |
|
Allreal Holding AG, Registered | | |
| | |
Mobimo Holding AG, Registered | | |
Peach Property Group AG(b) | | |
PSP Swiss Property AG, Registered | | |
Swiss Prime Site AG, Registered | | |
| | |
|
Abrdn Property Income Trust Ltd. | | |
Schedule of Investments47
Schedule of Investments (continued)March 31, 2024
iShares® International Developed Property ETF(Percentages shown are based on Net Assets)
| | |
United Kingdom (continued) |
| | |
| | |
Balanced Commercial Property Trust Ltd. | | |
| | |
British Land Co. PLC (The) | | |
| | |
Custodian Property Income REIT PLC | | |
| | |
Empiric Student Property PLC | | |
| | |
Great Portland Estates PLC | | |
| | |
| | |
| | |
Impact Healthcare REIT PLC, Class B | | |
Land Securities Group PLC | | |
| | |
LondonMetric Property PLC | | |
| | |
Picton Property Income Ltd. | | |
Primary Health Properties PLC | | |
| | |
| | |
| | |
| | |
| | |
| | |
| | |
Supermarket Income REIT PLC | | |
Target Healthcare REIT PLC | | |
Triple Point Social Housing REIT PLC(c) | | |
| | |
U.K. Commercial Property REIT Ltd. | | |
| | |
| | |
| | |
| | |
| | |
Total Common Stocks — 99.1%
(Cost: $53,064,974) | |
| | |
|
|
| | |
Total Rights — 0.0%
(Cost: $—) | |
Total Long-Term Investments — 99.1%
(Cost: $53,064,974) | |
|
Money Market Funds — 2.0% |
BlackRock Cash Funds: Institutional, SL Agency Shares, 5.50%(e)(f)(g) | | |
BlackRock Cash Funds: Treasury, SL Agency Shares, 5.29%(e)(f) | | |
Total Short-Term Securities — 2.0%
(Cost: $766,091) | |
Total Investments — 101.1%
(Cost: $53,831,065) | |
Liabilities in Excess of Other Assets — (1.1)% | |
| |
| All or a portion of this security is on loan. |
| Non-income producing security. |
| Security exempt from registration pursuant to Rule 144A under the Securities Act of 1933, as amended. These securities may be resold in transactions exempt from registration to qualified institutional investors. |
| Security is valued using significant unobservable inputs and is classified as Level 3 in the fair value hierarchy. |
| |
| Annualized 7-day yield as of period end. |
| All or a portion of this security was purchased with the cash collateral from loaned securities. |
Affiliates
Investments in issuers considered to be affiliate(s) of the Fund during the year ended March 31, 2024 for purposes of Section 2(a)(3) of the Investment Company Act of 1940, as amended, were as follows:
| | | | | Change in
Unrealized
Appreciation
(Depreciation) | | | | Capital
Gain
Distributions
from
Underlying
Funds |
BlackRock Cash Funds: Institutional, SL Agency Shares | | | | | | | | | |
BlackRock Cash Funds: Treasury, SL Agency Shares | | | | | | | | | |
| | | | | | | | | |
| Represents net amount purchased (sold). |
| All or a portion represents securities lending income earned from the reinvestment of cash collateral from loaned securities, net of fees and collateral investment expenses, and other payments to and from borrowers of securities. |
482024 iShares Annual Report to Shareholders
Schedule of Investments (continued)March 31, 2024
iShares® International Developed Property ETF
Derivative Financial Instruments Outstanding as of Period End
Futures Contracts
| | | | Value/
Unrealized
Appreciation
(Depreciation) |
| | | | |
| | | | |
Dow Jones U.S. Real Estate Index | | | | |
| | | | |
Derivative Financial Instruments Categorized by Risk Exposure
As of period end, the fair values of derivative financial instruments located in the Statements of Assets and Liabilities were as follows:
| | | | Foreign
Currency
Exchange
Contracts | | | |
Assets—Derivative Financial Instruments | | | | | | | |
| | | | | | | |
Unrealized appreciation on futures contracts(a) | | | | | | | |
| Net cumulative unrealized appreciation (depreciation) on futures contracts are reported in the Schedule of Investments. In the Statements of Assets and Liabilities, only current day's variation margin is reported in receivables or payables and the net cumulative unrealized appreciation (depreciation) is included in accumulated earnings (loss). |
For the period ended March 31, 2024, the effect of derivative financial instruments in the Statements of Operations was as follows:
| | | | Foreign
Currency
Exchange
Contracts | | | |
Net Realized Gain (Loss) from | | | | | | | |
| | | | | | | |
Net Change in Unrealized Appreciation (Depreciation) on | | | | | | | |
| | | | | | | |
Average Quarterly Balances of Outstanding Derivative Financial Instruments
| |
Average notional value of contracts — long | |
For more information about the Fund’s investment risks regarding derivative financial instruments, refer to the Notes to Financial Statements.
Fair Value Hierarchy as of Period End
Various inputs are used in determining the fair value of financial instruments. For a description of the input levels and information about the Fund’s policy regarding valuation of financial instruments, refer to the Notes to Financial Statements.
The following table summarizes the Fund’s financial instruments categorized in the fair value hierarchy. The breakdown of the Fund’s financial instruments into major categories is disclosed in the Schedule of Investments above.
Schedule of Investments49
Schedule of Investments (continued)March 31, 2024
iShares® International Developed Property ETF
Fair Value Hierarchy as of Period End (continued)
| | | | |
Derivative Financial Instruments(a) | | | | |
| | | | |
| | | | |
| Derivative financial instruments are futures contracts. Futures contracts are valued at the unrealized appreciation (depreciation) on the instrument. |
See notes to financial statements.
502024 iShares Annual Report to Shareholders
Schedule of InvestmentsMarch 31, 2024
iShares® International Developed Small Cap Value Factor ETF(Percentages shown are based on Net Assets)
| | |
|
|
| | |
| | |
Aussie Broadband Ltd.(a)(b) | | |
| | |
| | |
| | |
| | |
| | |
Charter Hall Social Infrastructure REIT | | |
| | |
| | |
| | |
Growthpoint Properties Australia Ltd. | | |
| | |
| | |
| | |
| | |
| | |
| | |
Ingenia Communities Group | | |
| | |
| | |
| | |
| | |
Nine Entertainment Co. Holdings Ltd. | | |
| | |
| | |
| | |
| | |
| | |
Reliance Worldwide Corp. Ltd. | | |
Sandfire Resources Ltd.(a) | | |
| | |
Ventia Services Group Pty Ltd. | | |
Viva Energy Group Ltd.(c) | | |
| | |
| | |
| | |
|
| | |
| | |
Vienna Insurance Group AG Wiener Versicherung Gruppe | | |
| | |
| | |
|
| | |
| | |
| | |
| | |
| | |
X-Fab Silicon Foundries SE(a)(c) | | |
| | |
|
| | |
| | |
| | |
| | |
Brookfield Renewable Corp., Class A | | |
| | |
| | |
|
| | |
| | |
| | |
| | |
| | |
| | |
| | |
| | |
| | |
| | |
| | |
| | |
| | |
| | |
North West Co. Inc. (The) | | |
| | |
Paramount Resources Ltd., Class A | | |
| | |
| | |
| | |
| | |
| | |
Transcontinental Inc., Class A | | |
West Fraser Timber Co. Ltd. | | |
| | |
| | |
|
| | |
| | |
| | |
| | |
| | |
|
| | |
| | |
| | |
| | |
| | |
| | |
| | |
|
| | |
| | |
| | |
| | |
| | |
| | |
| | |
Television Francaise 1 SA | | |
| | |
| | |
| | |
|
| | |
| | |
| | |
| | |
| | |
| | |
Hornbach Holding AG & Co. KGaA | | |
| | |
Schedule of Investments51
Schedule of Investments (continued)March 31, 2024
iShares® International Developed Small Cap Value Factor ETF(Percentages shown are based on Net Assets)
| | |
|
| | |
| | |
| | |
| | |
| | |
United Internet AG, Registered(d) | | |
Vitesco Technologies Group AG(a) | | |
| | |
|
CITIC Telecom International Holdings Ltd. | | |
Luk Fook Holdings International Ltd. | | |
| | |
| | |
|
| | |
| | |
| | |
|
| | |
| | |
Formula Systems 1985 Ltd. | | |
Menora Mivtachim Holdings Ltd. | | |
Migdal Insurance & Financial Holdings Ltd. | | |
| | |
|
Banca Popolare di Sondrio SpA | | |
| | |
| | |
| | |
| | |
| | |
| | |
| | |
| | |
|
| | |
| | |
| | |
| | |
| | |
| | |
| | |
| | |
| | |
| | |
| | |
| | |
| | |
Arisawa Manufacturing Co. Ltd. | | |
| | |
Asahi Diamond Industrial Co. Ltd. | | |
| | |
Aska Pharmaceutical Holdings Co. Ltd. | | |
| | |
| | |
| | |
Bando Chemical Industries Ltd. | | |
| | |
| | |
Bell System24 Holdings Inc. | | |
| | |
| | |
|
| | |
| | |
| | |
| | |
| | |
| | |
| | |
| | |
| | |
| | |
| | |
Daiki Aluminium Industry Co. Ltd. | | |
Daishi Hokuetsu Financial Group Inc. | | |
Daito Pharmaceutical Co. Ltd. | | |
| | |
Doutor Nichires Holdings Co. Ltd. | | |
| | |
| | |
| | |
| | |
| | |
| | |
| | |
| | |
| | |
| | |
Fuji Seal International Inc. | | |
Fukuyama Transporting Co. Ltd. | | |
| | |
Futaba Industrial Co. Ltd. | | |
| | |
| | |
| | |
| | |
| | |
| | |
| | |
| | |
| | |
| | |
| | |
| | |
| | |
| | |
| | |
| | |
| | |
| | |
| | |
Iriso Electronics Co. Ltd. | | |
Ishihara Sangyo Kaisha Ltd. | | |
| | |
| | |
| | |
Japan Petroleum Exploration Co. Ltd. | | |
Japan Wool Textile Co. Ltd. (The) | | |
| | |
| | |
| | |
Juroku Financial Group Inc. | | |
| | |
Kaga Electronics Co. Ltd. | | |
522024 iShares Annual Report to Shareholders
Schedule of Investments (continued)March 31, 2024
iShares® International Developed Small Cap Value Factor ETF(Percentages shown are based on Net Assets)
| | |
|
| | |
| | |
Katakura Industries Co. Ltd. | | |
| | |
| | |
| | |
| | |
| | |
| | |
| | |
Konoike Transport Co. Ltd. | | |
KPP Group Holdings Co. Ltd. | | |
| | |
Kumiai Chemical Industry Co. Ltd. | | |
| | |
| | |
| | |
| | |
Kyokuto Securities Co. Ltd. | | |
| | |
| | |
| | |
Makino Milling Machine Co. Ltd. | | |
| | |
| | |
Marusan Securities Co. Ltd. | | |
| | |
| | |
| | |
| | |
Megmilk Snow Brand Co. Ltd. | | |
| | |
Meisei Industrial Co. Ltd. | | |
Mimasu Semiconductor Industry Co. Ltd. | | |
| | |
Mitsubishi Pencil Co. Ltd. | | |
Mitsubishi Shokuhin Co. Ltd. | | |
Mitsui DM Sugar Holdings Co. Ltd. | | |
Mitsui-Soko Holdings Co. Ltd. | | |
Moriroku Holdings Co. Ltd. | | |
Musashi Seimitsu Industry Co. Ltd. | | |
Musashino Bank Ltd. (The) | | |
| | |
Nakayama Steel Works Ltd. | | |
| | |
| | |
| | |
| | |
| | |
Nihon Parkerizing Co. Ltd. | | |
| | |
| | |
| | |
| | |
Nippon Coke & Engineering Co. Ltd. | | |
| | |
Nippon Densetsu Kogyo Co. Ltd. | | |
Nippon Light Metal Holdings Co. Ltd. | | |
Nippon Road Co. Ltd. (The) | | |
| | |
| | |
Nippon Yakin Kogyo Co. Ltd. | | |
| | |
|
Nishimatsu Construction Co. Ltd. | | |
Nishi-Nippon Financial Holdings Inc. | | |
| | |
| | |
Nissei ASB Machine Co. Ltd. | | |
Nisshin Oillio Group Ltd. (The) | | |
| | |
| | |
| | |
| | |
| | |
Noritake Co. Ltd./Nagoya Japan | | |
| | |
NS United Kaiun Kaisha Ltd. | | |
| | |
| | |
| | |
Okinawa Financial Group Inc. | | |
| | |
| | |
| | |
Pacific Industrial Co. Ltd. | | |
| | |
| | |
| | |
| | |
| | |
| | |
| | |
Rheon Automatic Machinery Co. Ltd. | | |
| | |
| | |
| | |
| | |
| | |
| | |
Sakai Moving Service Co. Ltd. | | |
| | |
| | |
| | |
| | |
San-In Godo Bank Ltd. (The) | | |
Sanoh Industrial Co. Ltd. | | |
Sanyo Chemical Industries Ltd. | | |
| | |
Sanyo Special Steel Co. Ltd. | | |
| | |
| | |
| | |
| | |
| | |
| | |
Senshu Ikeda Holdings Inc. | | |
Shibaura Machine Co. Ltd. | | |
| | |
Shikoku Kasei Holdings Corp. | | |
Shin-Etsu Polymer Co. Ltd. | | |
Shinmaywa Industries Ltd. | | |
| | |
| | |
| | |
Sinfonia Technology Co. Ltd. | | |
Schedule of Investments53
Schedule of Investments (continued)March 31, 2024
iShares® International Developed Small Cap Value Factor ETF(Percentages shown are based on Net Assets)
| | |
|
| | |
| | |
SKY Perfect JSAT Holdings Inc. | | |
| | |
| | |
| | |
Sumitomo Densetsu Co. Ltd. | | |
Sumitomo Osaka Cement Co. Ltd. | | |
| | |
Sumitomo Seika Chemicals Co. Ltd. | | |
Sumitomo Warehouse Co. Ltd. (The) | | |
Sun Frontier Fudousan Co. Ltd. | | |
| | |
| | |
| | |
| | |
| | |
Takasago International Corp. | | |
Takasago Thermal Engineering Co. Ltd. | | |
| | |
| | |
| | |
| | |
| | |
| | |
| | |
| | |
| | |
Tokyo Kiraboshi Financial Group Inc. | | |
Tokyo Steel Manufacturing Co. Ltd. | | |
| | |
| | |
| | |
| | |
| | |
| | |
| | |
| | |
| | |
Tsurumi Manufacturing Co. Ltd. | | |
| | |
| | |
| | |
| | |
United Super Markets Holdings Inc. | | |
Universal Entertainment Corp. | | |
| | |
| | |
| | |
Warabeya Nichiyo Holdings Co. Ltd. | | |
| | |
| | |
| | |
| | |
Yodogawa Steel Works Ltd. | | |
Yokogawa Bridge Holdings Corp. | | |
| | |
ZERIA Pharmaceutical Co. Ltd. | | |
| | |
|
| | |
Eurocommercial Properties NV | | |
| | |
|
Flow Traders Ltd., NVS(b) | | |
| | |
| | |
| | |
| | |
|
Summerset Group Holdings Ltd. | | |
|
| | |
| | |
| | |
| | |
| | |
| | |
|
| | |
|
| | |
| | |
| | |
|
Far East Hospitality Trust | | |
| | |
Frasers Centrepoint Trust | | |
| | |
Raffles Medical Group Ltd. | | |
Riverstone Holdings Ltd./Singapore(b) | | |
| | |
| | |
|
| | |
Atresmedia Corp. de Medios de Comunicacion SA | | |
Cia. de Distribucion Integral Logista Holdings SA | | |
| | |
Construcciones y Auxiliar de Ferrocarriles SA | | |
Ence Energia y Celulosa SA | | |
| | |
| | |
| | |
| | |
Laboratorios Farmaceuticos Rovi SA | | |
| | |
| | |
| | |
| | |
|
| | |
| | |
| | |
| | |
| | |
| | |
| | |
| | |
| | |
| | |
| | |
| | |
Electrolux Professional AB, Class B | | |
542024 iShares Annual Report to Shareholders
Schedule of Investments (continued)March 31, 2024
iShares® International Developed Small Cap Value Factor ETF(Percentages shown are based on Net Assets)
| | |
|
| | |
| | |
| | |
| | |
| | |
Modern Times Group MTG AB, Class B(a) | | |
| | |
| | |
| | |
|
ALSO Holding AG, Registered | | |
| | |
Bucher Industries AG, Registered | | |
Burckhardt Compression Holding AG | | |
Comet Holding AG, Registered | | |
| | |
| | |
| | |
Interroll Holding AG, Registered | | |
| | |
LEM Holding SA, Registered | | |
| | |
Montana Aerospace AG(a)(c) | | |
Schweiter Technologies AG, NVS | | |
| | |
Siegfried Holding AG, Registered | | |
| | |
| | |
St. Galler Kantonalbank AG, Class A, Registered | | |
| | |
| | |
Swissquote Group Holding SA, Registered | | |
Valiant Holding AG, Registered | | |
Ypsomed Holding AG, Registered(b) | | |
| | |
|
| | |
| | |
Bank of Georgia Group PLC | | |
| | |
| | |
| | |
| | |
| | |
| | |
| | |
| | |
| | |
| | |
Jupiter Fund Management PLC | | |
| | |
| | |
| | |
| | |
Mitchells & Butlers PLC(a) | | |
| | |
United Kingdom (continued) |
| | |
| | |
| | |
| | |
| | |
| | |
| | |
| | |
| | |
| | |
| | |
| | |
Total Common Stocks — 98.9%
(Cost: $163,568,462) | |
|
|
Draegerwerk AG & Co. KGaA, Preference Shares, NVS | | |
|
Danieli & C Officine Meccaniche SpA, Preference Shares, NVS | | |
Total Preferred Stocks — 0.3%
(Cost: $378,374) | |
Total Long-Term Investments — 99.2%
(Cost: $163,946,836) | |
|
Money Market Funds — 1.6% |
BlackRock Cash Funds: Institutional, SL Agency Shares, 5.50%(e)(f)(g) | | |
BlackRock Cash Funds: Treasury, SL Agency Shares, 5.29%(e)(f) | | |
Total Short-Term Securities — 1.6%
(Cost: $3,023,727) | |
Total Investments — 100.8%
(Cost: $166,970,563) | |
Liabilities in Excess of Other Assets — (0.8)% | |
| |
| Non-income producing security. |
| All or a portion of this security is on loan. |
| Security exempt from registration pursuant to Rule 144A under the Securities Act of 1933, as amended. These securities may be resold in transactions exempt from registration to qualified institutional investors. |
| This security may be resold to qualified foreign investors and foreign institutional buyers under Regulation S of the Securities Act of 1933. |
| |
| Annualized 7-day yield as of period end. |
| All or a portion of this security was purchased with the cash collateral from loaned securities. |
Schedule of Investments55
Schedule of Investments (continued)March 31, 2024
iShares® International Developed Small Cap Value Factor ETF
Affiliates
Investments in issuers considered to be affiliate(s) of the Fund during the year ended March 31, 2024 for purposes of Section 2(a)(3) of the Investment Company Act of 1940, as amended, were as follows:
| | | | | Change in
Unrealized
Appreciation
(Depreciation) | | | | Capital
Gain
Distributions
from
Underlying
Funds |
BlackRock Cash Funds: Institutional, SL Agency Shares | | | | | | | | | |
BlackRock Cash Funds: Treasury, SL Agency Shares | | | | | | | | | |
| | | | | | | | | |
| Represents net amount purchased (sold). |
| All or a portion represents securities lending income earned from the reinvestment of cash collateral from loaned securities, net of fees and collateral investment expenses, and other payments to and from borrowers of securities. |
Derivative Financial Instruments Outstanding as of Period End
Futures Contracts
| | | | Value/
Unrealized
Appreciation
(Depreciation) |
| | | | |
| | | | |
| | | | |
| | | | |
| | | | |
Derivative Financial Instruments Categorized by Risk Exposure
As of period end, the fair values of derivative financial instruments located in the Statements of Assets and Liabilities were as follows:
| | | | Foreign
Currency
Exchange
Contracts | | | |
Assets—Derivative Financial Instruments | | | | | | | |
| | | | | | | |
Unrealized appreciation on futures contracts(a) | | | | | | | |
| Net cumulative unrealized appreciation (depreciation) on futures contracts are reported in the Schedule of Investments. In the Statements of Assets and Liabilities, only current day's variation margin is reported in receivables or payables and the net cumulative unrealized appreciation (depreciation) is included in accumulated earnings (loss). |
For the period ended March 31, 2024, the effect of derivative financial instruments in the Statements of Operations was as follows:
| | | | Foreign
Currency
Exchange
Contracts | | | |
Net Realized Gain (Loss) from | | | | | | | |
| | | | | | | |
Net Change in Unrealized Appreciation (Depreciation) on | | | | | | | |
| | | | | | | |
562024 iShares Annual Report to Shareholders
Schedule of Investments (continued)March 31, 2024
iShares® International Developed Small Cap Value Factor ETF
Average Quarterly Balances of Outstanding Derivative Financial Instruments
| |
Average notional value of contracts — long | |
For more information about the Fund’s investment risks regarding derivative financial instruments, refer to the Notes to Financial Statements.
Fair Value Hierarchy as of Period End
Various inputs are used in determining the fair value of financial instruments. For a description of the input levels and information about the Fund’s policy regarding valuation of financial instruments, refer to the Notes to Financial Statements.
The following table summarizes the Fund’s financial instruments categorized in the fair value hierarchy. The breakdown of the Fund’s financial instruments into major categories is disclosed in the Schedule of Investments above.
| | | | |
| | | | |
| | | | |
| | | | |
| | | | |
| | | | |
| | | | |
| | | | |
| | | | |
Derivative Financial Instruments(a) | | | | |
| | | | |
| | | | |
| Derivative financial instruments are futures contracts. Futures contracts are valued at the unrealized appreciation (depreciation) on the instrument. |
See notes to financial statements.
Schedule of Investments57
Schedule of InvestmentsMarch 31, 2024
iShares® International Dividend Growth ETF(Percentages shown are based on Net Assets)
| | |
|
|
| | |
| | |
| | |
| | |
| | |
| | |
| | |
| | |
| | |
| | |
| | |
Northern Star Resources Ltd. | | |
| | |
| | |
| | |
| | |
| | |
|
Telekom Austria AG, Class A | | |
|
| | |
| | |
| | |
| | |
|
| | |
| | |
| | |
|
| | |
Alimentation Couche-Tard Inc. | | |
| | |
Brookfield Asset Management Ltd. | | |
Canadian Imperial Bank of Commerce | | |
Canadian National Railway Co. | | |
Canadian Natural Resources Ltd. | | |
Canadian Tire Corp. Ltd., Class A, NVS | | |
| | |
| | |
CCL Industries Inc., Class B, NVS | | |
Cogeco Communications Inc. | | |
| | |
Empire Co. Ltd., Class A, NVS | | |
| | |
| | |
Finning International Inc. | | |
| | |
| | |
| | |
| | |
| | |
| | |
| | |
| | |
| | |
| | |
| | |
| | |
| | |
| | |
|
| | |
North West Co. Inc. (The) | | |
| | |
| | |
| | |
Premium Brands Holdings Corp., Class A | | |
| | |
| | |
| | |
| | |
| | |
| | |
| | |
| | |
| | |
Toronto-Dominion Bank (The) | | |
| | |
| | |
Wheaton Precious Metals Corp. | | |
| | |
|
Apeloa Pharmaceutical Co. Ltd., Class A | | |
Asymchem Laboratories Tianjin Co. Ltd., Class A | | |
Bank of Chengdu Co. Ltd., Class A | | |
Bank of Communications Co. Ltd., Class A | | |
China Coal Energy Co. Ltd. | | |
China Coal Energy Co. Ltd., Class H | | |
China Construction Bank Corp., Class A | | |
| | |
China Merchants Bank Co. Ltd., Class A | | |
China Merchants Bank Co. Ltd., Class H | | |
China Merchants Energy Shipping Co. Ltd., Class A | | |
China National Nuclear Power Co. Ltd., Class A | | |
China Overseas Property Holdings Ltd. | | |
China Railway Group Ltd., Class A | | |
CSPC Pharmaceutical Group Ltd. | | |
| | |
Greentown China Holdings Ltd. | | |
Guangdong Construction Engineering Group Co. Ltd. | | |
Guangzhou Baiyunshan Pharmaceutical Holdings Co. Ltd. | | |
Guangzhou Kingmed Diagnostics Group Co. Ltd., Class A | | |
Haier Smart Home Co. Ltd., Class A | | |
Huaibei Mining Holdings Co. Ltd. | | |
Huaxia Bank Co. Ltd., Class A | | |
IEIT Systems Co. Ltd., Class A | | |
Industrial & Commercial Bank of China Ltd., Class A | | |
Jiangsu King's Luck Brewery JSC Ltd., Class A | | |
Jiangsu Pacific Quartz Co. Ltd., NVS | | |
Kweichow Moutai Co. Ltd., Class A | | |
Luzhou Laojiao Co. Ltd., Class A | | |
Metallurgical Corp. of China Ltd., Class A | | |
NAURA Technology Group Co. Ltd., Class A | | |
Ping An Insurance Group Co. of China Ltd., Class A | | |
Shanghai Tunnel Engineering Co. Ltd., Class A | | |
| | |
Sinoma Science & Technology Co. Ltd., Class A | | |
Tsingtao Brewery Co. Ltd., Class A | | |
Tsingtao Brewery Co. Ltd., Class H | | |
Wuliangye Yibin Co. Ltd., Class A | | |
Xi'An Shaangu Power Co. Ltd. | | |
582024 iShares Annual Report to Shareholders
Schedule of Investments (continued)March 31, 2024
iShares® International Dividend Growth ETF(Percentages shown are based on Net Assets)
| | |
|
Zhangzhou Pientzehuang Pharmaceutical Co. Ltd., Class A | | |
Zhengzhou Coal Mining Machinery Group Co. Ltd. | | |
Zhongsheng Group Holdings Ltd. | | |
| | |
|
| | |
| | |
| | |
|
| | |
| | |
| | |
| | |
Scandinavian Tobacco Group A/S, Class A(a) | | |
| | |
|
| | |
| | |
| | |
|
| | |
| | |
| | |
| | |
|
| | |
| | |
| | |
| | |
| | |
| | |
| | |
| | |
| | |
| | |
| | |
|
| | |
|
| | |
| | |
United Laboratories International Holdings Ltd. (The) | | |
| | |
|
| | |
| | |
| | |
| | |
| | |
| | |
| | |
Honeywell Automation India Ltd. | | |
| | |
| | |
| | |
| | |
| | |
| | |
| | |
|
| | |
Persistent Systems Ltd., NVS | | |
| | |
| | |
| | |
| | |
Sun Pharmaceutical Industries Ltd. | | |
| | |
| | |
ZF Commercial Vehicle Control Systems India Ltd. | | |
| | |
|
| | |
|
| | |
| | |
| | |
|
| | |
| | |
| | |
| | |
| | |
| | |
Recordati Industria Chimica e Farmaceutica SpA | | |
| | |
Terna - Rete Elettrica Nazionale | | |
| | |
|
| | |
| | |
| | |
| | |
| | |
| | |
| | |
| | |
| | |
| | |
| | |
| | |
| | |
| | |
| | |
| | |
| | |
| | |
| | |
| | |
| | |
| | |
| | |
Heiwa Real Estate Co. Ltd. | | |
| | |
| | |
| | |
| | |
| | |
Japan Elevator Service Holdings Co. Ltd. | | |
| | |
Schedule of Investments59
Schedule of Investments (continued)March 31, 2024
iShares® International Dividend Growth ETF(Percentages shown are based on Net Assets)
| | |
|
| | |
| | |
| | |
| | |
| | |
| | |
KeePer Technical Laboratory Co. Ltd. | | |
Keihanshin Building Co. Ltd. | | |
Kobayashi Pharmaceutical Co. Ltd. | | |
| | |
| | |
| | |
| | |
Kurita Water Industries Ltd. | | |
Kusuri no Aoki Holdings Co. Ltd. | | |
| | |
| | |
| | |
| | |
Maruzen Showa Unyu Co. Ltd. | | |
| | |
| | |
| | |
Mimasu Semiconductor Industry Co. Ltd. | | |
| | |
Mitsubishi Research Institute Inc. | | |
Mitsubishi UFJ Financial Group Inc. | | |
| | |
| | |
| | |
MS&AD Insurance Group Holdings Inc. | | |
Murata Manufacturing Co. Ltd. | | |
| | |
NEC Networks & System Integration Corp. | | |
| | |
| | |
| | |
Nippon Parking Development Co. Ltd. | | |
Nippon Sanso Holdings Corp. | | |
| | |
Nippon Telegraph & Telephone Corp. | | |
| | |
Nisshin Seifun Group Inc. | | |
| | |
| | |
Nomura Real Estate Holdings Inc. | | |
Nomura Research Institute Ltd. | | |
| | |
| | |
Okinawa Cellular Telephone Co. | | |
Open House Group Co. Ltd. | | |
| | |
| | |
| | |
Pan Pacific International Holdings Corp. | | |
| | |
| | |
| | |
Rohto Pharmaceutical Co. Ltd. | | |
| | |
| | |
| | |
| | |
|
| | |
| | |
Seven & i Holdings Co. Ltd. | | |
Shin-Etsu Chemical Co. Ltd. | | |
Shin-Etsu Polymer Co. Ltd. | | |
| | |
Ship Healthcare Holdings Inc. | | |
| | |
SHO-BOND Holdings Co. Ltd. | | |
| | |
| | |
| | |
| | |
| | |
Sumitomo Mitsui Financial Group Inc. | | |
Sumitomo Realty & Development Co. Ltd. | | |
| | |
| | |
Takeuchi Manufacturing Co. Ltd. | | |
| | |
| | |
| | |
| | |
Tokio Marine Holdings Inc. | | |
Tokyo Steel Manufacturing Co. Ltd. | | |
| | |
Tri Chemical Laboratories Inc. | | |
| | |
| | |
| | |
Yamaguchi Financial Group Inc. | | |
| | |
Yokogawa Bridge Holdings Corp. | | |
| | |
| | |
|
| | |
| | |
| | |
|
Corporativo Fragua SAB de CV | | |
Grupo Bimbo SAB de CV, Series A | | |
Grupo Comercial Chedraui SA de CV | | |
Orbia Advance Corp. SAB de CV | | |
| | |
|
| | |
| | |
| | |
| | |
| | |
|
| | |
| | |
Summerset Group Holdings Ltd. | | |
| | |
|
| | |
| | |
602024 iShares Annual Report to Shareholders
Schedule of Investments (continued)March 31, 2024
iShares® International Dividend Growth ETF(Percentages shown are based on Net Assets)
| | |
|
| | |
| | |
|
International Container Terminal Services Inc. | | |
|
| | |
| | |
| | |
|
| | |
|
Mouwasat Medical Services Co. | | |
|
| | |
PSG Financial Services Ltd. | | |
| | |
|
| | |
Hankook Tire & Technology Co. Ltd. | | |
| | |
| | |
| | |
NICE Information Service Co. Ltd. | | |
| | |
| | |
| | |
Youngone Holdings Co. Ltd. | | |
| | |
| | |
|
| | |
| | |
| | |
| | |
|
| | |
| | |
Atrium Ljungberg AB, Class B | | |
| | |
| | |
| | |
| | |
| | |
Platzer Fastigheter Holding AB, Class B | | |
| | |
|
ALSO Holding AG, Registered | | |
Chocoladefabriken Lindt & Spruengli AG, Participation Certificates, NVS | | |
Chocoladefabriken Lindt & Spruengli AG, Registered | | |
Coca-Cola HBC AG, Class DI(b) | | |
| | |
| | |
| | |
Interroll Holding AG, Registered | | |
Logitech International SA, Registered | | |
| | |
| | |
| | |
|
| | |
| | |
Siegfried Holding AG, Registered | | |
| | |
Tecan Group AG, Registered | | |
| | |
| | |
|
| | |
| | |
| | |
| | |
Sinbon Electronics Co. Ltd. | | |
Topco Scientific Co. Ltd. | | |
Unimicron Technology Corp. | | |
Universal Vision Biotechnology Co. Ltd. | | |
| | |
| | |
|
Gulf Energy Development PCL, NVDR | | |
|
| | |
|
| | |
| | |
| | |
| | |
| | |
| | |
| | |
| | |
| | |
| | |
| | |
| | |
| | |
| | |
| | |
Hikma Pharmaceuticals PLC | | |
| | |
| | |
London Stock Exchange Group PLC | | |
| | |
| | |
| | |
| | |
| | |
| | |
| | |
Spirax-Sarco Engineering PLC | | |
| | |
| | |
Total Common Stocks — 99.2%
(Cost: $581,603,623) | |
|
|
FUCHS SE, Preference Shares, NVS | | |
Schedule of Investments61
Schedule of Investments (continued)March 31, 2024
iShares® International Dividend Growth ETF(Percentages shown are based on Net Assets)
| | |
|
LG Corp., Preference Shares, NVS | | |
Total Preferred Stocks — 0.1%
(Cost: $444,746) | |
Total Long-Term Investments — 99.3%
(Cost: $582,048,369) | |
|
Money Market Funds — 0.1% |
BlackRock Cash Funds: Institutional, SL Agency Shares, 5.50%(d)(e)(f) | | |
BlackRock Cash Funds: Treasury, SL Agency Shares, 5.29%(d)(e) | | |
Total Short-Term Securities — 0.1%
(Cost: $360,805) | |
Total Investments — 99.4%
(Cost: $582,409,174) | |
Other Assets Less Liabilities — 0.6% | |
| |
| Security exempt from registration pursuant to Rule 144A under the Securities Act of 1933, as amended. These securities may be resold in transactions exempt from registration to qualified institutional investors. |
| Non-income producing security. |
| All or a portion of this security is on loan. |
| |
| Annualized 7-day yield as of period end. |
| All or a portion of this security was purchased with the cash collateral from loaned securities. |
Affiliates
Investments in issuers considered to be affiliate(s) of the Fund during the year ended March 31, 2024 for purposes of Section 2(a)(3) of the Investment Company Act of 1940, as amended, were as follows:
| | | | | Change in
Unrealized
Appreciation
(Depreciation) | | | | Capital
Gain
Distributions
from
Underlying
Funds |
BlackRock Cash Funds: Institutional, SL Agency Shares | | | | | | | | | |
BlackRock Cash Funds: Treasury, SL Agency Shares | | | | | | | | | |
| | | | | | | | | |
| Represents net amount purchased (sold). |
| All or a portion represents securities lending income earned from the reinvestment of cash collateral from loaned securities, net of fees and collateral investment expenses, and other payments to and from borrowers of securities. |
Derivative Financial Instruments Outstanding as of Period End
Futures Contracts
| | | | Value/
Unrealized
Appreciation
(Depreciation) |
| | | | |
| | | | |
| | | | |
| | | | |
622024 iShares Annual Report to Shareholders
Schedule of Investments (continued)March 31, 2024
iShares® International Dividend Growth ETF
Derivative Financial Instruments Categorized by Risk Exposure
As of period end, the fair values of derivative financial instruments located in the Statements of Assets and Liabilities were as follows:
| | | | Foreign
Currency
Exchange
Contracts | | | |
Assets—Derivative Financial Instruments | | | | | | | |
| | | | | | | |
Unrealized appreciation on futures contracts(a) | | | | | | | |
| Net cumulative unrealized appreciation (depreciation) on futures contracts are reported in the Schedule of Investments. In the Statements of Assets and Liabilities, only current day's variation margin is reported in receivables or payables and the net cumulative unrealized appreciation (depreciation) is included in accumulated earnings (loss). |
For the period ended March 31, 2024, the effect of derivative financial instruments in the Statements of Operations was as follows:
| | | | Foreign
Currency
Exchange
Contracts | | | |
Net Realized Gain (Loss) from | | | | | | | |
| | | | | | | |
Net Change in Unrealized Appreciation (Depreciation) on | | | | | | | |
| | | | | | | |
Average Quarterly Balances of Outstanding Derivative Financial Instruments
| |
Average notional value of contracts — long | |
For more information about the Fund’s investment risks regarding derivative financial instruments, refer to the Notes to Financial Statements.
Fair Value Hierarchy as of Period End
Various inputs are used in determining the fair value of financial instruments. For a description of the input levels and information about the Fund’s policy regarding valuation of financial instruments, refer to the Notes to Financial Statements.
The following table summarizes the Fund’s financial instruments categorized in the fair value hierarchy. The breakdown of the Fund’s financial instruments into major categories is disclosed in the Schedule of Investments above.
| | | | |
| | | | |
| | | | |
| | | | |
| | | | |
| | | | |
| | | | |
| | | | |
| | | | |
Derivative Financial Instruments(a) | | | | |
| | | | |
| | | | |
| Derivative financial instruments are futures contracts. Futures contracts are valued at the unrealized appreciation (depreciation) on the instrument. |
The Fund may hold assets and/or liabilities in which the fair value approximates the carrying amount for financial statement purposes. As of period end, bank borrowings payable of $1,175 are categorized as Level 2 within the fair value hierarchy.
See notes to financial statements.
Schedule of Investments63
Schedule of InvestmentsMarch 31, 2024
iShares® Latin America 40 ETF(Percentages shown are based on Net Assets)
| | |
|
|
| | |
B3 SA - Brasil, Bolsa, Balcao | | |
| | |
| | |
Centrais Eletricas Brasileiras SA | | |
| | |
| | |
| | |
| | |
Petroleo Brasileiro SA, ADR | | |
| | |
Telefonica Brasil SA, ADR NVS | | |
| | |
| | |
| | |
|
| | |
Banco Santander Chile, ADR | | |
| | |
| | |
| | |
| | |
| | |
Sociedad Quimica y Minera de Chile SA, ADR(c) | | |
| | |
|
| | |
| | |
Interconexion Electrica SA ESP | | |
| | |
|
| | |
Arca Continental SAB de CV | | |
| | |
Fibra Uno Administracion SA de CV | | |
Fomento Economico Mexicano SAB de CV | | |
Grupo Bimbo SAB de CV, Series A | | |
Grupo Financiero Banorte SAB de CV, Class O | | |
Grupo Mexico SAB de CV, Series B | | |
Wal-Mart de Mexico SAB de CV | | |
| | |
|
| | |
| | |
|
| | |
| | |
Total Common Stocks — 78.2%
(Cost: $1,270,647,240) | |
|
|
Banco Bradesco SA, Preference Shares, ADR | | |
Gerdau SA, Preference Shares, ADR | | |
Itau Unibanco Holding SA, Preference Shares, ADR(c) | | |
Itausa SA, Preference Shares, NVS | | |
Petroleo Brasileiro SA, Preference Shares, ADR | | |
| | |
Total Preferred Stocks — 20.4%
(Cost: $386,890,490) | |
Total Long-Term Investments — 98.6%
(Cost: $1,657,537,730) | |
|
Money Market Funds — 0.9% |
BlackRock Cash Funds: Institutional, SL Agency Shares, 5.50%(d)(e)(f) | | |
BlackRock Cash Funds: Treasury, SL Agency Shares, 5.29%(d)(e) | | |
Total Short-Term Securities — 0.9%
(Cost: $14,791,021) | |
Total Investments — 99.5%
(Cost: $1,672,328,751) | |
Other Assets Less Liabilities — 0.5% | |
| |
| Non-income producing security. |
| Security exempt from registration pursuant to Rule 144A under the Securities Act of 1933, as amended. These securities may be resold in transactions exempt from registration to qualified institutional investors. |
| All or a portion of this security is on loan. |
| |
| Annualized 7-day yield as of period end. |
| All or a portion of this security was purchased with the cash collateral from loaned securities. |
642024 iShares Annual Report to Shareholders
Schedule of Investments (continued)March 31, 2024
iShares® Latin America 40 ETF
Affiliates
Investments in issuers considered to be affiliate(s) of the Fund during the year ended March 31, 2024 for purposes of Section 2(a)(3) of the Investment Company Act of 1940, as amended, were as follows:
| | | | | Change in
Unrealized
Appreciation
(Depreciation) | | | | Capital
Gain
Distributions
from
Underlying
Funds |
BlackRock Cash Funds: Institutional, SL Agency Shares | | | | | | | | | |
BlackRock Cash Funds: Treasury, SL Agency Shares | | | | | | | | | |
| | | | | | | | | |
| Represents net amount purchased (sold). |
| All or a portion represents securities lending income earned from the reinvestment of cash collateral from loaned securities, net of fees and collateral investment expenses, and other payments to and from borrowers of securities. |
Derivative Financial Instruments Outstanding as of Period End
Futures Contracts
| | | | Value/
Unrealized
Appreciation
(Depreciation) |
| | | | |
| | | | |
| | | | |
| | | | |
Derivative Financial Instruments Categorized by Risk Exposure
As of period end, the fair values of derivative financial instruments located in the Statements of Assets and Liabilities were as follows:
| | | | Foreign
Currency
Exchange
Contracts | | | |
Assets—Derivative Financial Instruments | | | | | | | |
| | | | | | | |
Unrealized appreciation on futures contracts(a) | | | | | | | |
| Net cumulative unrealized appreciation (depreciation) on futures contracts are reported in the Schedule of Investments. In the Statements of Assets and Liabilities, only current day's variation margin is reported in receivables or payables and the net cumulative unrealized appreciation (depreciation) is included in accumulated earnings (loss). |
For the period ended March 31, 2024, the effect of derivative financial instruments in the Statements of Operations was as follows:
| | | | Foreign
Currency
Exchange
Contracts | | | |
Net Realized Gain (Loss) from | | | | | | | |
| | | | | | | |
Forward foreign currency exchange contracts | | | | | | | |
| | | | | | | |
Net Change in Unrealized Appreciation (Depreciation) on | | | | | | | |
| | | | | | | |
Schedule of Investments65
Schedule of Investments (continued)March 31, 2024
iShares® Latin America 40 ETF
Average Quarterly Balances of Outstanding Derivative Financial Instruments
| |
Average notional value of contracts — long | |
For more information about the Fund’s investment risks regarding derivative financial instruments, refer to the Notes to Financial Statements.
Fair Value Hierarchy as of Period End
Various inputs are used in determining the fair value of financial instruments. For a description of the input levels and information about the Fund’s policy regarding valuation of financial instruments, refer to the Notes to Financial Statements.
The following table summarizes the Fund’s financial instruments categorized in the fair value hierarchy. The breakdown of the Fund’s financial instruments into major categories is disclosed in the Schedule of Investments above.
| | | | |
| | | | |
| | | | |
| | | | |
| | | | |
| | | | |
| | | | |
| | | | |
| | | | |
Derivative Financial Instruments(a) | | | | |
| | | | |
| | | | |
| Derivative financial instruments are futures contracts. Futures contracts are valued at the unrealized appreciation (depreciation) on the instrument. |
See notes to financial statements.
662024 iShares Annual Report to Shareholders
Statements of Assets and LiabilitiesMarch 31, 2024
| | iShares
Blockchain and Tech ETF | iShares
Emerging Markets Infrastructure ETF | |
| | | | |
Investments, at value—unaffiliated(a)(b) | | | | |
Investments, at value—affiliated(c) | | | | |
| | | | |
Cash pledged for futures contracts | | | | |
Foreign currency collateral pledged for futures contracts(d) | | | | |
Foreign currency, at value(e) | | | | |
| | | | |
| | | | |
Securities lending income—affiliated | | | | |
| | | | |
| | | | |
| | | | |
Variation margin on futures contracts | | | | |
| | | | |
| | | | |
| | | | |
Collateral on securities loaned, at value | | | | |
| | | | |
| | | | |
| | | | |
IRS compliance fee for foreign withholding tax claims | | | | |
| | | | |
| | | | |
Commitments and contingent liabilities | | | | |
| | | | |
| | | | |
| | | | |
Accumulated earnings (loss) | | | | |
| | | | |
| | | | |
| | | | |
| | | | |
| | | | |
| | | | |
(a) Investments, at cost—unaffiliated | | | | |
(b) Securities loaned, at value | | | | |
(c) Investments, at cost—affiliated | | | | |
(d) Foreign currency collateral pledged, at cost | | | | |
(e) Foreign currency, at cost | | | | |
See notes to financial statements.
Statements of Assets and Liabilities (continued)March 31, 2024
| iShares
Future Metaverse Tech and Communications ETF | | iShares
International Developed Property ETF | iShares
International Developed Small Cap Value Factor ETF |
| | | | |
Investments, at value—unaffiliated(a)(b) | | | | |
Investments, at value—affiliated(c) | | | | |
| | | | |
Cash pledged for futures contracts | | | | |
Foreign currency collateral pledged for futures contracts(d) | | | | |
Foreign currency, at value(e) | | | | |
| | | | |
Securities lending income—affiliated | | | | |
| | | | |
| | | | |
| | | | |
Variation margin on futures contracts | | | | |
| | | | |
| | | | |
| | | | |
Collateral on securities loaned, at value | | | | |
| | | | |
Deferred foreign capital gain tax | | | | |
| | | | |
| | | | |
Variation margin on futures contracts | | | | |
| | | | |
Commitments and contingent liabilities | | | | |
| | | | |
| | | | |
| | | | |
Accumulated earnings (loss) | | | | |
| | | | |
| | | | |
| | | | |
| | | | |
| | | | |
| | | | |
(a) Investments, at cost—unaffiliated | | | | |
(b) Securities loaned, at value | | | | |
(c) Investments, at cost—affiliated | | | | |
(d) Foreign currency collateral pledged, at cost | | | | |
(e) Foreign currency, at cost | | | | |
See notes to financial statements.
682024 iShares Annual Report to Shareholders
Statements of Assets and Liabilities (continued)March 31, 2024
| iShares
International Dividend Growth ETF | iShares
Latin America 40 ETF |
| | |
Investments, at value—unaffiliated(a)(b) | | |
Investments, at value—affiliated(c) | | |
Cash pledged for futures contracts | | |
Foreign currency collateral pledged for futures contracts(d) | | |
Foreign currency, at value(e) | | |
| | |
Securities lending income—affiliated | | |
| | |
| | |
| | |
Variation margin on futures contracts | | |
| | |
| | |
| | |
| | |
Collateral on securities loaned, at value | | |
| | |
Deferred foreign capital gain tax | | |
| | |
| | |
| | |
Commitments and contingent liabilities | | |
| | |
| | |
| | |
Accumulated earnings (loss) | | |
| | |
| | |
| | |
| | |
| | |
| | |
(a) Investments, at cost—unaffiliated | | |
(b) Securities loaned, at value | | |
(c) Investments, at cost—affiliated | | |
(d) Foreign currency collateral pledged, at cost | | |
(e) Foreign currency, at cost | | |
See notes to financial statements.
Statements of OperationsYear Ended March 31, 2024
| | iShares
Blockchain and Tech ETF | iShares
Emerging Markets Infrastructure ETF | |
| | | | |
| | | | |
| | | | |
| | | | |
Securities lending income—affiliated—net | | | | |
Other income—unaffiliated | | | | |
| | | | |
Foreign withholding tax claims | | | | |
IRS compliance fee for foreign withholding tax claims | | | | |
| | | | |
| | | | |
| | | | |
| | | | |
| | | | |
| | | | |
| | | | |
| | | | |
| | | | |
REALIZED AND UNREALIZED GAIN (LOSS) | | | | |
Net realized gain (loss) from: | | | | |
| | | | |
| | | | |
Foreign currency transactions | | | | |
| | | | |
In-kind redemptions—unaffiliated(a) | | | | |
| | | | |
Net change in unrealized appreciation (depreciation) on: | | | | |
| | | | |
| | | | |
Foreign currency translations | | | | |
| | | | |
| | | | |
Net realized and unrealized gain (loss) | | | | |
NET INCREASE IN NET ASSETS RESULTING FROM OPERATIONS | | | | |
(a) See Note 2 of the Notes to Financial Statements. |
See notes to financial statements.
702024 iShares Annual Report to Shareholders
Statements of Operations (continued)Year Ended March 31, 2024
| iShares
Future Metaverse Tech and Communications ETF | | iShares
International Developed Property ETF | iShares
International Developed Small Cap Value Factor ETF |
| | | | |
| | | | |
| | | | |
| | | | |
Securities lending income—affiliated—net | | | | |
| | | | |
Foreign withholding tax claims | | | | |
| | | | |
| | | | |
| | | | |
| | | | |
| | | | |
| | | | |
| | | | |
| | | | |
Investment advisory fees waived | | | | |
Total expenses after fees waived | | | | |
| | | | |
REALIZED AND UNREALIZED GAIN (LOSS) | | | | |
Net realized gain (loss) from: | | | | |
Investments—unaffiliated(a) | | | | |
| | | | |
Foreign currency transactions | | | | |
| | | | |
In-kind redemptions—unaffiliated(b) | | | | |
| | | | |
Net change in unrealized appreciation (depreciation) on: | | | | |
Investments—unaffiliated(c) | | | | |
| | | | |
Foreign currency translations | | | | |
| | | | |
| | | | |
Net realized and unrealized gain | | | | |
NET INCREASE IN NET ASSETS RESULTING FROM OPERATIONS | | | | |
(a) Net of foreign capital gain tax and capital gain tax refund, if applicable of | | | | |
(b) See Note 2 of the Notes to Financial Statements. |
(c) Net of reduction/increase in deferred foreign capital gain tax of | | | | |
See notes to financial statements.
Statements of Operations (continued)Year Ended March 31, 2024
| iShares
International Dividend Growth ETF | iShares
Latin America 40 ETF |
| | |
| | |
| | |
| | |
Securities lending income—affiliated—net | | |
| | |
Foreign withholding tax claims | | |
| | |
| | |
| | |
| | |
| | |
| | |
| | |
| | |
| | |
REALIZED AND UNREALIZED GAIN (LOSS) | | |
Net realized gain (loss) from: | | |
Investments—unaffiliated(a) | | |
| | |
Forward foreign currency exchange contracts | | |
Foreign currency transactions | | |
| | |
In-kind redemptions—unaffiliated(b) | | |
| | |
Net change in unrealized appreciation (depreciation) on: | | |
Investments—unaffiliated(c) | | |
| | |
Foreign currency translations | | |
| | |
| | |
Net realized and unrealized gain | | |
NET INCREASE IN NET ASSETS RESULTING FROM OPERATIONS | | |
(a) Net of foreign capital gain tax and capital gain tax refund, if applicable of | | |
(b) See Note 2 of the Notes to Financial Statements. |
(c) Net of increase in deferred foreign capital gain tax of | | |
See notes to financial statements.
722024 iShares Annual Report to Shareholders
Statements of Changes in Net Assets
| | iShares
Blockchain and Tech ETF |
| | | | |
INCREASE (DECREASE) IN NET ASSETS | | | | |
| | | | |
| | | | |
| | | | |
Net change in unrealized appreciation (depreciation) | | | | |
Net increase (decrease) in net assets resulting from operations | | | | |
DISTRIBUTIONS TO SHAREHOLDERS(b) | | | | |
Decrease in net assets resulting from distributions to shareholders | | | | |
CAPITAL SHARE TRANSACTIONS | | | | |
Net increase (decrease) in net assets derived from capital share transactions | | | | |
| | | | |
Total increase (decrease) in net assets | | | | |
| | | | |
| | | | |
| Commencement of operations. |
| Distributions for annual periods determined in accordance with U.S. federal income tax regulations. |
See notes to financial statements.
Statements of Changes in Net Assets(continued)
| iShares
Emerging Markets Infrastructure ETF | |
| | | | |
INCREASE (DECREASE) IN NET ASSETS | | | | |
| | | | |
| | | | |
| | | | |
Net change in unrealized appreciation (depreciation) | | | | |
Net increase (decrease) in net assets resulting from operations | | | | |
DISTRIBUTIONS TO SHAREHOLDERS(a) | | | | |
Decrease in net assets resulting from distributions to shareholders | | | | |
CAPITAL SHARE TRANSACTIONS | | | | |
Net increase (decrease) in net assets derived from capital share transactions | | | | |
| | | | |
Total increase (decrease) in net assets | | | | |
| | | | |
| | | | |
| Distributions for annual periods determined in accordance with U.S. federal income tax regulations. |
See notes to financial statements.
742024 iShares Annual Report to Shareholders
Statements of Changes in Net Assets(continued)
| iShares
Future Metaverse Tech and Communications ETF | |
| | | | |
INCREASE (DECREASE) IN NET ASSETS | | | | |
| | | | |
| | | | |
| | | | |
Net change in unrealized appreciation (depreciation) | | | | |
Net increase (decrease) in net assets resulting from operations | | | | |
DISTRIBUTIONS TO SHAREHOLDERS(c) | | | | |
Decrease in net assets resulting from distributions to shareholders | | | | |
CAPITAL SHARE TRANSACTIONS | | | | |
Net increase (decrease) in net assets derived from capital share transactions | | | | |
| | | | |
Total increase (decrease) in net assets | | | | |
| | | | |
| | | | |
| Commencement of operations. |
| Consolidated Statement of Changes in Net Assets. |
| Distributions for annual periods determined in accordance with U.S. federal income tax regulations. |
See notes to financial statements.
Statements of Changes in Net Assets(continued)
| iShares
International Developed Property ETF | iShares
International Developed Small Cap Value Factor ETF |
| | | | |
INCREASE (DECREASE) IN NET ASSETS | | | | |
| | | | |
| | | | |
| | | | |
Net change in unrealized appreciation (depreciation) | | | | |
Net increase (decrease) in net assets resulting from operations | | | | |
DISTRIBUTIONS TO SHAREHOLDERS(a) | | | | |
Decrease in net assets resulting from distributions to shareholders | | | | |
CAPITAL SHARE TRANSACTIONS | | | | |
Net increase (decrease) in net assets derived from capital share transactions | | | | |
| | | | |
Total increase (decrease) in net assets | | | | |
| | | | |
| | | | |
| Distributions for annual periods determined in accordance with U.S. federal income tax regulations. |
See notes to financial statements.
762024 iShares Annual Report to Shareholders
Statements of Changes in Net Assets(continued)
| iShares
International Dividend Growth ETF | iShares
Latin America 40 ETF |
| | | | |
INCREASE (DECREASE) IN NET ASSETS | | | | |
| | | | |
| | | | |
| | | | |
Net change in unrealized appreciation (depreciation) | | | | |
Net increase (decrease) in net assets resulting from operations | | | | |
DISTRIBUTIONS TO SHAREHOLDERS(a) | | | | |
Decrease in net assets resulting from distributions to shareholders | | | | |
CAPITAL SHARE TRANSACTIONS | | | | |
Net increase (decrease) in net assets derived from capital share transactions | | | | |
| | | | |
Total increase (decrease) in net assets | | | | |
| | | | |
| | | | |
| Distributions for annual periods determined in accordance with U.S. federal income tax regulations. |
See notes to financial statements.
Financial Highlights(For a share outstanding throughout each period)
| |
| | | | | |
Net asset value, beginning of year | | | | | |
| | | | | |
Net realized and unrealized gain (loss)(b) | | | | | |
Net increase (decrease) from investment operations | | | | | |
Distributions from net investment income(c) | | | | | |
Net asset value, end of year | | | | | |
| | | | | |
| | | | | |
Ratios to Average Net Assets(f) | | | | | |
| | | | | |
| | | | | |
| | | | | |
Net assets, end of year (000) | | | | | |
Portfolio turnover rate(g) | | | | | |
(a) Based on average shares outstanding. |
(b) The amounts reported for a share outstanding may not accord with the change in aggregate gains and losses in securities for the fiscal period due to the timing of capital share transactions in relation to the fluctuating market values of the Fund’s underlying securities. |
(c) Distributions for annual periods determined in accordance with U.S. federal income tax regulations. |
(d) For financial reporting purposes, the market values of certain investments were adjusted as of the report date. Accordingly, the NAV per share and total return presented herein is different than the information previously published as of March 28, 2024. |
(e) Where applicable, assumes the reinvestment of distributions. |
(f) Excludes fees and expenses incurred indirectly as a result of investments in underlying funds. |
(g) Portfolio turnover rate excludes in-kind transactions, if any. |
See notes to financial statements.
782024 iShares Annual Report to Shareholders
Financial Highlights(continued)(For a share outstanding throughout each period)
| iShares Blockchain and Tech ETF |
| | |
Net asset value, beginning of period | | |
| | |
Net realized and unrealized gain(c) | | |
Net increase from investment operations | | |
Distributions from net investment income(d) | | |
Net asset value, end of period | | |
| | |
| | |
Ratios to Average Net Assets(g) | | |
| | |
| | |
| | |
Net assets, end of period (000) | | |
Portfolio turnover rate(i) | | |
(a) Commencement of operations. |
(b) Based on average shares outstanding. |
(c) The amounts reported for a share outstanding may not accord with the change in aggregate gains and losses in securities for the fiscal period due to the timing of capital share transactions in relation to the fluctuating market values of the Fund’s underlying securities. |
(d) Distributions for annual periods determined in accordance with U.S. federal income tax regulations. |
(e) Where applicable, assumes the reinvestment of distributions. |
|
(g) Excludes fees and expenses incurred indirectly as a result of investments in underlying funds. |
|
(i) Portfolio turnover rate excludes in-kind transactions, if any. |
See notes to financial statements.
Financial Highlights(continued)(For a share outstanding throughout each period)
| iShares Emerging Markets Infrastructure ETF |
| | | | | |
Net asset value, beginning of year | | | | | |
| | | | | |
Net realized and unrealized gain (loss)(b) | | | | | |
Net increase (decrease) from investment operations | | | | | |
Distributions from net investment income(c) | | | | | |
Net asset value, end of year | | | | | |
| | | | | |
| | | | | |
Ratios to Average Net Assets(e) | | | | | |
| | | | | |
| | | | | |
| | | | | |
Net assets, end of year (000) | | | | | |
Portfolio turnover rate(f) | | | | | |
(a) Based on average shares outstanding. |
(b) The amounts reported for a share outstanding may not accord with the change in aggregate gains and losses in securities for the fiscal period due to the timing of capital share transactions in relation to the fluctuating market values of the Fund’s underlying securities. |
(c) Distributions for annual periods determined in accordance with U.S. federal income tax regulations. |
(d) Where applicable, assumes the reinvestment of distributions. |
(e) Excludes fees and expenses incurred indirectly as a result of investments in underlying funds. |
(f) Portfolio turnover rate excludes in-kind transactions, if any. |
See notes to financial statements.
802024 iShares Annual Report to Shareholders
Financial Highlights(continued)(For a share outstanding throughout each period)
| |
| | | | | |
Net asset value, beginning of year | | | | | |
| | | | | |
Net realized and unrealized gain (loss)(c) | | | | | |
Net increase (decrease) from investment operations | | | | | |
Distributions from net investment income(d) | | | | | |
Net asset value, end of year | | | | | |
| | | | | |
| | | | | |
Ratios to Average Net Assets(f) | | | | | |
| | | | | |
Total expenses excluding professional fees for foreign withholding tax claims | | | | | |
| | | | | |
| | | | | |
Net assets, end of year (000) | | | | | |
Portfolio turnover rate(g) | | | | | |
(a) Based on average shares outstanding. |
(b) Reflects the positive effect of foreign withholding tax claims, net of the associated professional fees, which resulted in the following increases for the years ended March 31, 2024, March 31, 2023 and March 31, 2022 respectively: • Net investment income per share by $0.04, $0.27 and $0.18. • Total return by 0.10%, 0.56% and 0.36%. • Ratio of net investment income to average net assets by 0.08%, 0.60% and 0.34%. |
(c) The amounts reported for a share outstanding may not accord with the change in aggregate gains and losses in securities for the fiscal period due to the timing of capital share transactions in relation to the fluctuating market values of the Fund’s underlying securities. |
(d) Distributions for annual periods determined in accordance with U.S. federal income tax regulations. |
(e) Where applicable, assumes the reinvestment of distributions. |
(f) Excludes fees and expenses incurred indirectly as a result of investments in underlying funds. |
(g) Portfolio turnover rate excludes in-kind transactions, if any. |
See notes to financial statements.
Financial Highlights(continued)(For a share outstanding throughout each period)
| iShares Future Metaverse Tech and Communications ETF |
| | |
Net asset value, beginning of period | | |
| | |
Net realized and unrealized gain(c) | | |
Net increase from investment operations | | |
Distributions from net investment income(d) | | |
Net asset value, end of period | | |
| | |
| | |
Ratios to Average Net Assets(g) | | |
| | |
| | |
| | |
Net assets, end of period (000) | | |
Portfolio turnover rate(i) | | |
(a) Commencement of operations. |
(b) Based on average shares outstanding. |
(c) The amounts reported for a share outstanding may not accord with the change in aggregate gains and losses in securities for the fiscal period due to the timing of capital share transactions in relation to the fluctuating market values of the Fund’s underlying securities. |
(d) Distributions for annual periods determined in accordance with U.S. federal income tax regulations. |
(e) Where applicable, assumes the reinvestment of distributions. |
|
(g) Excludes fees and expenses incurred indirectly as a result of investments in underlying funds. |
|
(i) Portfolio turnover rate excludes in-kind transactions, if any. |
See notes to financial statements.
822024 iShares Annual Report to Shareholders
Financial Highlights(continued)(For a share outstanding throughout each period)
| |
| | | | | |
Net asset value, beginning of year | | | | | |
| | | | | |
Net realized and unrealized gain (loss)(c) | | | | | |
Net increase (decrease) from investment operations | | | | | |
| | | | | |
From net investment income | | | | | |
| | | | | |
| | | | | |
Net asset value, end of year | | | | | |
| | | | | |
| | | | | |
Ratios to Average Net Assets(f) | | | | | |
| | | | | |
| | | | | |
| | | | | |
Net assets, end of year (000) | | | | | |
Portfolio turnover rate(h) | | | | | |
(a) Consolidated Financial Highlights. |
(b) Based on average shares outstanding. |
(c) The amounts reported for a share outstanding may not accord with the change in aggregate gains and losses in securities for the fiscal period due to the timing of capital share transactions in relation to the fluctuating market values of the Fund’s underlying securities. |
(d) Distributions for annual periods determined in accordance with U.S. federal income tax regulations. |
(e) Where applicable, assumes the reinvestment of distributions. |
(f) Excludes fees and expenses incurred indirectly as a result of investments in underlying funds. |
(g) Includes non-recurring expense of Interest expense. Without this cost, total expenses would have been 0.89%. |
(h) Portfolio turnover rate excludes in-kind transactions, if any. |
See notes to financial statements.
Financial Highlights(continued)(For a share outstanding throughout each period)
| iShares International Developed Property ETF |
| | | | | |
Net asset value, beginning of year | | | | | |
| | | | | |
Net realized and unrealized gain (loss)(c) | | | | | |
Net increase (decrease) from investment operations | | | | | |
Distributions from net investment income(d) | | | | | |
Net asset value, end of year | | | | | |
| | | | | |
| | | | | |
Ratios to Average Net Assets(f) | | | | | |
| | | | | |
Total expenses excluding professional fees for foreign withholding tax claims | | | | | |
| | | | | |
| | | | | |
Net assets, end of year (000) | | | | | |
Portfolio turnover rate(g) | | | | | |
(a) Based on average shares outstanding. |
(b) Reflects the positive effect of foreign withholding tax claims, net of the associated professional fees, which resulted in the following increases for the years ended March 31, 2023 and March 31, 2022, respectively: • Net investment income per share by $0.01 and $0.04. • Total return by 0.04% and 0.12%. • Ratio of net investment income to average net assets by 0.04% and 0.09%. |
(c) The amounts reported for a share outstanding may not accord with the change in aggregate gains and losses in securities for the fiscal period due to the timing of capital share transactions in relation to the fluctuating market values of the Fund’s underlying securities. |
(d) Distributions for annual periods determined in accordance with U.S. federal income tax regulations. |
(e) Where applicable, assumes the reinvestment of distributions. |
(f) Excludes fees and expenses incurred indirectly as a result of investments in underlying funds. |
(g) Portfolio turnover rate excludes in-kind transactions, if any. |
See notes to financial statements.
842024 iShares Annual Report to Shareholders
Financial Highlights(continued)(For a share outstanding throughout each period)
| iShares International Developed Small Cap Value Factor ETF |
| | | | |
Net asset value, beginning of period | | | | |
| | | | |
Net realized and unrealized gain (loss)(c) | | | | |
Net increase (decrease) from investment operations | | | | |
Distributions from net investment income(d) | | | | |
Net asset value, end of period | | | | |
| | | | |
| | | | |
Ratios to Average Net Assets(h) | | | | |
| | | | |
Total expenses after fees waived | | | | |
Total expenses excluding professional fees for foreign withholding tax claims | | | | |
| | | | |
| | | | |
Net assets, end of period (000) | | | | |
Portfolio turnover rate(j) | | | | |
(a) Commencement of operations. |
(b) Based on average shares outstanding. |
(c) The amounts reported for a share outstanding may not accord with the change in aggregate gains and losses in securities for the fiscal period due to the timing of capital share transactions in relation to the fluctuating market values of the Fund’s underlying securities. |
(d) Distributions for annual periods determined in accordance with U.S. federal income tax regulations. |
(e) Where applicable, assumes the reinvestment of distributions. |
(f) Reflects the positive effect of foreign withholding tax claims, net of the associated professional fees, which resulted in the following increases for the year ended March 31, 2024: • Total return by 0.01%. • Ratio of net investment income to average net assets by 0.01%. |
|
(h) Excludes fees and expenses incurred indirectly as a result of investments in underlying funds. |
|
(j) Portfolio turnover rate excludes in-kind transactions, if any. |
See notes to financial statements.
Financial Highlights(continued)(For a share outstanding throughout each period)
| iShares International Dividend Growth ETF |
| | | | | |
Net asset value, beginning of year | | | | | |
| | | | | |
Net realized and unrealized gain (loss)(c) | | | | | |
Net increase (decrease) from investment operations | | | | | |
Distributions from net investment income(d) | | | | | |
Net asset value, end of year | | | | | |
| | | | | |
| | | | | |
Ratios to Average Net Assets(f) | | | | | |
| | | | | |
| | | | | |
| | | | | |
Net assets, end of year (000) | | | | | |
Portfolio turnover rate(g) | | | | | |
(a) Based on average shares outstanding. |
(b) Reflects the positive effect of foreign withholding tax claims, net of the associated professional fees, which resulted in the following increases for the year ended March 31, 2024: • Net investment income per share by $0.01. • Total return by 0.01%. • Ratio of net investment income to average net assets by 0.01%. |
(c) The amounts reported for a share outstanding may not accord with the change in aggregate gains and losses in securities for the fiscal period due to the timing of capital share transactions in relation to the fluctuating market values of the Fund’s underlying securities. |
(d) Distributions for annual periods determined in accordance with U.S. federal income tax regulations. |
(e) Where applicable, assumes the reinvestment of distributions. |
(f) Excludes fees and expenses incurred indirectly as a result of investments in underlying funds. |
(g) Portfolio turnover rate excludes in-kind transactions, if any. |
See notes to financial statements.
862024 iShares Annual Report to Shareholders
Financial Highlights(continued)(For a share outstanding throughout each period)
| iShares Latin America 40 ETF |
| | | | | |
Net asset value, beginning of year | | | | | |
| | | | | |
Net realized and unrealized gain (loss)(b) | | | | | |
Net increase (decrease) from investment operations | | | | | |
Distributions from net investment income(c) | | | | | |
Net asset value, end of year | | | | | |
| | | | | |
| | | | | |
Ratios to Average Net Assets(e) | | | | | |
| | | | | |
| | | | | |
| | | | | |
Net assets, end of year (000) | | | | | |
Portfolio turnover rate(f) | | | | | |
(a) Based on average shares outstanding. |
(b) The amounts reported for a share outstanding may not accord with the change in aggregate gains and losses in securities for the fiscal period due to the timing of capital share transactions in relation to the fluctuating market values of the Fund’s underlying securities. |
(c) Distributions for annual periods determined in accordance with U.S. federal income tax regulations. |
(d) Where applicable, assumes the reinvestment of distributions. |
(e) Excludes fees and expenses incurred indirectly as a result of investments in underlying funds. |
(f) Portfolio turnover rate excludes in-kind transactions, if any. |
See notes to financial statements.
Notes to Financial Statements
1. ORGANIZATION
iShares Trust (the “Trust”) is registered under the Investment Company Act of 1940, as amended (the “1940 Act”), as an open-end management investment company. The Trust is organized as a Delaware statutory trust and is authorized to have multiple series or portfolios.
These financial statements relate only to the following funds (each, a “Fund” and collectively, the “Funds”):
| Diversification
Classification |
| |
| |
Emerging Markets Infrastructure | |
| |
Future Metaverse Tech and Communications | |
| |
International Developed Property | |
International Developed Small Cap Value Factor | |
International Dividend Growth | |
| |
| The Fund's classification changed from non-diversified to diversified during the reporting period. |
Basis of Consolidation: The accompanying consolidated financial statements for iShares India 50 ETF included the accounts of its subsidiary in the Republic of Mauritius, which was a wholly-owned subsidiary (the "Subsidiary") of the Fund that invested in Indian securities. On March 29, 2023, iShares India 50 ETF filed to liquidate its Subsidiary with the Mauritius Financial Services Commission.
2. SIGNIFICANT ACCOUNTING POLICIES
The financial statements are prepared in conformity with accounting principles generally accepted in the United States of America (“U.S. GAAP”), which may require management to make estimates and assumptions that affect the reported amounts of assets and liabilities in the financial statements, disclosure of contingent assets and liabilities at the date of the financial statements and the reported amounts of increases and decreases in net assets from operations during the reporting period. Actual results could differ from those estimates. Each Fund is considered an investment company under U.S. GAAP and follows the accounting and reporting guidance applicable to investment companies. Below is a summary of significant accounting policies:
Investment Transactions and Income Recognition: For financial reporting purposes, investment transactions are recorded on the dates the transactions are executed. Realized gains and losses on investment transactions are determined using the specific identification method. Dividend income and capital gain distributions, if any, are recorded on the ex-dividend date. Non-cash dividends, if any, are recorded on the ex-dividend date at fair value. Dividends from foreign securities where the ex-dividend date may have passed are subsequently recorded when the Funds are informed of the ex-dividend date. Under the applicable foreign tax laws, a withholding tax at various rates may be imposed on capital gains, dividends and interest. Upon notification from issuers or as estimated by management, a portion of the dividend income received from a real estate investment trust may be redesignated as a reduction of cost of the related investment and/or realized gain. Interest income, including amortization and accretion of premiums and discounts on debt securities, is recognized daily on an accrual basis.
Foreign Currency Translation: Each Fund’s books and records are maintained in U.S. dollars. Securities and other assets and liabilities denominated in foreign currencies are translated into U.S. dollars using prevailing market rates as quoted by one or more data service providers. Purchases and sales of investments are recorded at the rates of exchange prevailing on the respective dates of such transactions. Generally, when the U.S. dollar rises in value against a foreign currency, the investments denominated in that currency will lose value; the opposite effect occurs if the U.S. dollar falls in relative value.
Each Fund does not isolate the effect of fluctuations in foreign exchange rates from the effect of fluctuations in the market prices of investments for financial reporting purposes. Accordingly, the effects of changes in exchange rates on investments are not segregated in the Statements of Operations from the effects of changes in market prices of those investments, but are included as a component of net realized and unrealized gain (loss) from investments. Each Fund reports realized currency gains (losses) on foreign currency related transactions as components of net realized gain (loss) for financial reporting purposes, whereas such components are generally treated as ordinary income for U.S. federal income tax purposes.
Foreign Taxes: The Funds may be subject to foreign taxes (a portion of which may be reclaimable) on income, stock dividends, capital gains on investments, or certain foreign currency transactions. All foreign taxes are recorded in accordance with the applicable foreign tax regulations and rates that exist in the foreign jurisdictions in which each Fund invests. These foreign taxes, if any, are paid by each Fund and are reflected in its Statements of Operations as follows: foreign taxes withheld at source are presented as a reduction of income, foreign taxes on securities lending income are presented as a reduction of securities lending income, foreign taxes on stock dividends are presented as “Other foreign taxes”, and foreign taxes on capital gains from sales of investments and foreign taxes on foreign currency transactions are included in their respective net realized gain (loss) categories. Foreign taxes payable or deferred as of March 31, 2024, if any, are disclosed in the Statements of Assets and Liabilities.
The Funds file withholding tax reclaims in certain jurisdictions to recover a portion of amounts previously withheld. The Funds may record a reclaim receivable based on collectability, which includes factors such as the jurisdiction’s applicable laws, payment history and market convention. The Statements of Operations includes tax reclaims recorded as well as professional and other fees, if any, associated with recovery of foreign withholding taxes.
882024 iShares Annual Report to Shareholders
Notes to Financial Statements (continued)
Bank Overdraft:Certain Funds had outstanding cash disbursements exceeding deposited cash amounts at the custodian during the reporting period. The Funds are obligated to repay the custodian for any overdraft, including any related costs or expenses, where applicable. For financial reporting purposes, overdraft fees, if any, are included in interest expense in the Statements of Operations.
Collateralization: If required by an exchange or counterparty agreement, the Funds may be required to deliver/deposit cash and/or securities to/with an exchange, or broker-dealer or custodian as collateral for certain investments.
In-kind Redemptions: For financial reporting purposes, in-kind redemptions are treated as sales of securities resulting in realized capital gains or losses to the Funds. Because such gains or losses are not taxable to the Funds and are not distributed to existing Fund shareholders, the gains or losses are reclassified from accumulated net realized gain (loss) to paid-in capital at the end of the Funds’ tax year. These reclassifications have no effect on net assets or net asset value (“NAV”) per share.
Distributions: Dividends and distributions paid by each Fund are recorded on the ex-dividend dates. Distributions are determined on a tax basis and may differ from net investment income and net realized capital gains for financial reporting purposes. Dividends and distributions are paid in U.S. dollars and cannot be automatically reinvested in additional shares of the Funds.
Indemnifications: In the normal course of business, each Fund enters into contracts that contain a variety of representations that provide general indemnification. The Funds’ maximum exposure under these arrangements is unknown because it involves future potential claims against the Funds, which cannot be predicted with any certainty.
3. INVESTMENT VALUATION AND FAIR VALUE MEASUREMENTS
Investment Valuation Policies: Each Fund’s investments are valued at fair value (also referred to as “market value” within the financial statements) each day that the Fund’s listing exchange is open and, for financial reporting purposes, as of the report date. U.S. GAAP defines fair value as the price a fund would receive to sell an asset or pay to transfer a liability in an orderly transaction between market participants at the measurement date. The Board of Trustees of the Trust (the “Board”) of each Fund has approved the designation of BlackRock Fund Advisors (“BFA”), the Funds’ investment adviser, as the valuation designee for each Fund. Each Fund determines the fair values of its financial instruments using various independent dealers or pricing services under BFA’s policies. If a security’s market price is not readily available or does not otherwise accurately represent the fair value of the security, the security will be valued in accordance with BFA’s policies and procedures as reflecting fair value. BFA has formed a committee (the “Valuation Committee”) to develop pricing policies and procedures and to oversee the pricing function for all financial instruments, with assistance from other BlackRock pricing committees.
Fair Value Inputs and Methodologies: The following methods and inputs are used to establish the fair value of each Fund’s assets and liabilities:
• Equity investments traded on a recognized securities exchange are valued at that day’s official closing price, as applicable, on the exchange where the stock is primarily traded. Equity investments traded on a recognized exchange for which there were no sales on that day are valued at the last traded price.
• Investments in open-end U.S. mutual funds (including money market funds) are valued at that day’s published NAV.
• Futures contracts are valued based on that day’s last reported settlement or trade price on the exchange where the contract is traded.
Generally, trading in foreign instruments is substantially completed each day at various times prior to the close of trading on the New York Stock Exchange (“NYSE”). Each business day, the Funds use current market factors supplied by independent pricing services to value certain foreign instruments (“Systematic Fair Value Price”). The Systematic Fair Value Price is designed to value such foreign securities at fair value as of the close of trading on the NYSE, which follows the close of the local markets.
If events (e.g., market volatility, company announcement or a natural disaster) occur that are expected to materially affect the value of such investment, or in the event that application of these methods of valuation results in a price for an investment that is deemed not to be representative of the market value of such investment, or if a price is not available, the investment will be valued by the Valuation Committee, in accordance with BFA’s policies and procedures as reflecting fair value (“Fair Valued Investments”). The fair valuation approaches that may be used by the Valuation Committee include market approach, income approach and cost approach. Valuation techniques such as discounted cash flow, use of market comparables and matrix pricing are types of valuation approaches and are typically used in determining fair value. When determining the price for Fair Valued Investments, the Valuation Committee seeks to determine the price that each Fund might reasonably expect to receive or pay from the current sale or purchase of that asset or liability in an arm’s-length transaction. Fair value determinations shall be based upon all available factors that the Valuation Committee deems relevant and consistent with the principles of fair value measurement.
Fair value pricing could result in a difference between the prices used to calculate a fund’s NAV and the prices used by the fund’s underlying index, which in turn could result in a difference between the fund’s performance and the performance of the fund’s underlying index.
Fair Value Hierarchy: Various inputs are used in determining the fair value of financial instruments. These inputs to valuation techniques are categorized into a fair value hierarchy consisting of three broad levels for financial reporting purposes as follows:
• Level 1 – Unadjusted price quotations in active markets/exchanges for identical assets or liabilities that each Fund has the ability to access;
• Level 2 – Other observable inputs (including, but not limited to, quoted prices for similar assets or liabilities in markets that are active, quoted prices for identical or similar assets or liabilities in markets that are not active, inputs other than quoted prices that are observable for the assets or liabilities (such as interest rates, yield curves, volatilities, prepayment speeds, loss severities, credit risks and default rates) or other market-corroborated inputs); and
Notes to Financial Statements89
Notes to Financial Statements (continued)
• Level 3 – Unobservable inputs based on the best information available in the circumstances, to the extent observable inputs are not available, (including the Valuation Committee’s assumptions used in determining the fair value of financial instruments).
The hierarchy gives the highest priority to unadjusted quoted prices in active markets for identical assets or liabilities (Level 1 measurements) and the lowest priority to unobservable inputs (Level 3 measurements). Accordingly, the degree of judgment exercised in determining fair value is greatest for instruments categorized in Level 3. The inputs used to measure fair value may fall into different levels of the fair value hierarchy. In such cases, for disclosure purposes, the fair value hierarchy classification is determined based on the lowest level input that is significant to the fair value measurement in its entirety. Investments classified within Level 3 have significant unobservable inputs used by the Valuation Committee in determining the price for Fair Valued Investments. Level 3 investments include equity or debt issued by privately held companies or funds that may not have a secondary market and/or may have a limited number of investors. The categorization of a value determined for financial instruments is based on the pricing transparency of the financial instruments and is not necessarily an indication of the risks associated with investing in those securities.
4. SECURITIES AND OTHER INVESTMENTS
Securities Lending: Each Fund may lend its securities to approved borrowers, such as brokers, dealers and other financial institutions. The borrower pledges and maintains with the Fund collateral consisting of cash, an irrevocable letter of credit issued by an approved bank, or securities issued or guaranteed by the U.S. government. The initial collateral received by each Fund is required to have a value of at least 102% of the current market value of the loaned securities for securities traded on U.S. exchanges and a value of at least 105% for all other securities. The collateral is maintained thereafter at a value equal to at least 100% of the current value of the securities on loan. The market value of the loaned securities is determined at the close of each business day of the Fund and any additional required collateral is delivered to the Fund or excess collateral is returned by the Fund, on the next business day. During the term of the loan, each Fund is entitled to all distributions made on or in respect of the loaned securities but does not receive interest income on securities received as collateral. Loans of securities are terminable at any time and the borrower, after notice, is required to return borrowed securities within the standard time period for settlement of securities transactions.
As of period end, any securities on loan were collateralized by cash and/or U.S. Government obligations. Cash collateral invested in money market funds managed by BFA, or its affiliates is disclosed in the Schedule of Investments. Any non-cash collateral received cannot be sold, re-invested or pledged by the Fund, except in the event of borrower default. The securities on loan, if any, are also disclosed in each Fund’s Schedule of Investments. The market value of any securities on loan and the value of any related cash collateral are disclosed in the Statements of Assets and Liabilities.
Securities lending transactions are entered into by the Funds under Master Securities Lending Agreements (each, an “MSLA”) which provide the right, in the event of default (including bankruptcy or insolvency) for the non-defaulting party to liquidate the collateral and calculate a net exposure to the defaulting party or request additional collateral. In the event that a borrower defaults, the Funds, as lender, would offset the market value of the collateral received against the market value of the securities loaned. When the value of the collateral is greater than that of the market value of the securities loaned, the lender is left with a net amount payable to the defaulting party. However, bankruptcy or insolvency laws of a particular jurisdiction may impose restrictions on or prohibitions against such a right of offset in the event of an MSLA counterparty’s bankruptcy or insolvency. Under the MSLA, absent an event of default, the borrower can resell or re-pledge the loaned securities, and the Funds can reinvest cash collateral received in connection with loaned securities. Upon an event of default, the parties’ obligations to return the securities or collateral to the other party are extinguished, and the parties can resell or re-pledge the loaned securities or the collateral received in connection with the loaned securities in order to satisfy the defaulting party’s net payment obligation for all transactions under the MSLA. The defaulting party remains liable for any deficiency.
As of period end, the following table is a summary of the securities on loan by counterparty which are subject to offset under an MSLA:
iShares ETF and Counterparty | Securities Loaned
at Value | | Non-Cash Collateral
Received, at Fair Value(a) | |
| | | | |
| | | | |
| | | | |
| | | | |
| | | | |
| | | | |
J.P. Morgan Securities LLC | | | | |
| | | | |
| | | | |
Wells Fargo Securities LLC | | | | |
| | | | |
Emerging Markets Infrastructure | | | | |
| | | | |
| | | | |
J.P. Morgan Securities LLC | | | | |
| | | | |
| | | | |
Wells Fargo Securities LLC | | | | |
| | | | |
902024 iShares Annual Report to Shareholders
Notes to Financial Statements (continued)
iShares ETF and Counterparty | Securities Loaned at Value | Cash Collateral Received(a) | Non-Cash Collateral Received, at Fair Value(a) | |
| | | | |
| | | | |
| | | | |
| | | | |
J.P. Morgan Securities LLC | | | | |
| | | | |
Future Metaverse Tech and Communications | | | | |
| | | | |
| | | | |
J.P. Morgan Securities LLC | | | | |
| | | | |
| | | | |
International Developed Property | | | | |
| | | | |
| | | | |
| | | | |
J.P. Morgan Securities LLC | | | | |
| | | | |
| | | | |
SG Americas Securities LLC | | | | |
| | | | |
| | | | |
International Developed Small Cap Value Factor | | | | |
| | | | |
| | | | |
| | | | |
| | | | |
| | | | |
J.P. Morgan Securities LLC | | | | |
Nomura Securities International, Inc. | | | | |
| | | | |
International Dividend Growth | | | | |
| | | | |
| | | | |
J.P. Morgan Securities LLC | | | | |
| | | | |
| | | | |
| Collateral received, if any, in excess of the market value of securities on loan is not presented in this table. The total cash collateral received by each Fund is disclosed in the Fund’s Statements of Assets and Liabilities. |
| The market value of the loaned securities is determined as of March 31, 2024. Additional collateral is delivered to the Fund on the next business day in accordance with the MSLA. The net amount would be subject to the borrower default indemnity in the event of default by a counterparty. |
The risks of securities lending include the risk that the borrower may not provide additional collateral when required or may not return the securities when due. To mitigate these risks, each Fund benefits from a borrower default indemnity provided by BlackRock, Inc. (“BlackRock”). BlackRock’s indemnity allows for full replacement of the securities loaned to the extent the collateral received does not cover the value of the securities loaned in the event of borrower default. Each Fund could incur a loss if the value of an investment purchased with cash collateral falls below the market value of the loaned securities or if the value of an investment purchased with cash collateral falls below the value of the original cash collateral received. Such losses are borne entirely by each Fund.
5. DERIVATIVE FINANCIAL INSTRUMENTS
Futures Contracts: Futures contracts are purchased or sold to gain exposure to, or manage exposure to, changes in interest rates (interest rate risk) and changes in the value of equity securities (equity risk) or foreign currencies (foreign currency exchange rate risk).
Futures contracts are exchange-traded agreements between the Funds and a counterparty to buy or sell a specific quantity of an underlying instrument at a specified price and on a specified date. Depending on the terms of a contract, it is settled either through physical delivery of the underlying instrument on the settlement date or by payment of a cash amount on the settlement date. Upon entering into a futures contract, the Funds are required to deposit initial margin with the broker in the form of cash or securities
Notes to Financial Statements91
Notes to Financial Statements (continued)
in an amount that varies depending on a contract’s size and risk profile. The initial margin deposit must then be maintained at an established level over the life of the contract. Amounts pledged, which are considered restricted, are included in cash pledged for futures contracts in the Statements of Assets and Liabilities.
Securities deposited as initial margin are designated in the Schedule of Investments and cash deposited, if any, are shown as cash pledged for futures contracts in the Statements of Assets and Liabilities. Pursuant to the contract, the Funds agree to receive from or pay to the broker an amount of cash equal to the daily fluctuation in market value of the contract (“variation margin”). Variation margin is recorded as unrealized appreciation (depreciation) and, if any, shown as variation margin receivable (or payable) on futures contracts in the Statements of Assets and Liabilities. When the contract is closed, a realized gain or loss is recorded in the Statements of Operations equal to the difference between the notional amount of the contract at the time it was opened and the notional amount at the time it was closed. The use of futures contracts involves the risk of an imperfect correlation in the movements in the price of futures contracts and interest rates, foreign currency exchange rates or underlying assets.
Forward Foreign Currency Exchange Contracts: Forward foreign currency exchange contracts are entered into to gain or reduce exposure to foreign currencies (foreign currency exchange rate risk).
A forward foreign currency exchange contract is an agreement between two parties to buy and sell a currency at a set exchange rate on a specified date. These contracts help to manage the overall exposure to the currencies in which some of the investments held by the Funds are denominated and in some cases, may be used to obtain exposure to a particular market.The contracts are traded over-the-counter (“OTC”) and not on an organized exchange.
The contract is marked-to-market daily and the change in market value is recorded as unrealized appreciation or depreciation in the Statements of Assets and Liabilities. When the contract is closed, a realized gain or loss is recorded in the Statements of Operations equal to the difference between the value at the time it was opened and the value at the time it was closed. Non-deliverable forward foreign currency exchange contracts are settled with the counterparty in cash without the delivery of foreign currency. The use of forward foreign currency exchange contracts involves the risk that the value of a contract changes unfavorably due to movements in the value of the referenced foreign currencies, and such value may exceed the amount(s) reflected in the Statements of Assets and Liabilities. Cash amounts pledged for forward foreign currency exchange contracts are considered restricted and are included in cash pledged as collateral for OTC derivatives in the Statements of Assets and Liabilities. A fund’s risk of loss from counterparty credit risk on OTC derivatives is generally limited to the aggregate unrealized gain netted against any collateral held by the Fund.
6. INVESTMENT ADVISORY AGREEMENT AND OTHER TRANSACTIONS WITH AFFILIATES
Investment Advisory Fees: Pursuant to an Investment Advisory Agreement with the Trust, BFA manages the investment of each Fund’s assets. BFA is a California corporation indirectly owned by BlackRock. Under the Investment Advisory Agreement, BFA is responsible for substantially all expenses of the Funds, except (i) interest and taxes; (ii) brokerage commissions and other expenses connected with the execution of portfolio transactions; (iii) distribution fees; (iv) the advisory fee payable to BFA; and (v) litigation expenses and any extraordinary expenses (in each case as determined by a majority of the independent trustees).
For its investment advisory services to each of the following Funds, BFA is entitled to an annual investment advisory fee, accrued daily and paid monthly by the Funds, based on the average daily net assets of each Fund as follows:
| |
| |
| |
Emerging Markets Infrastructure | |
Future Metaverse Tech and Communications | |
| |
International Developed Property | |
International Developed Small Cap Value Factor | |
International Dividend Growth | |
Effective June 30, 2023, for its investment advisory services to the iShares International Developed Small Cap Value Factor ETF, BFA is entitled to an annual investment advisory fee of 0.30%, accrued daily and paid monthly by the Fund, based on the average daily net assets of the Fund. Prior to June 30, 2023, BFA was entitled to an annual investment advisory fee of 0.40%, accrued daily and paid monthly by the Fund, based on the average daily net assets of the Fund.
For its investment advisory services to the iShares Europe ETF, BFA is entitled to an annual investment advisory fee, accrued daily and paid monthly by the Fund, based on the Fund’s allocable portion of the aggregate of the average daily net assets of the Fund and certain other iShares funds, as follows:
Aggregate Average Daily Net Assets | |
| |
Over $12 billion, up to and including $18 billion | |
Over $18 billion, up to and including $24 billion | |
Over $24 billion, up to and including $30 billion | |
| |
922024 iShares Annual Report to Shareholders
Notes to Financial Statements (continued)
For its investment advisory services to the iShares Latin America 40 ETF, BFA is entitled to an annual investment advisory fee, accrued daily and paid monthly by the Fund, based on the Fund’s allocable portion of the aggregate of the average daily net assets of the Fund and certain other iShares funds, as follows:
Aggregate Average Daily Net Assets | |
| |
Over $46 billion, up to and including $81 billion | |
Over $81 billion, up to and including $111 billion | |
Over $111 billion, up to and including $141 billion | |
Over $141 billion, up to and including $171 billion | |
| |
Expense Waivers: A fund may incur its pro rata share of fees and expenses attributable to its investments in other investment companies (“acquired fund fees and expenses”). The total of the investment advisory fee and acquired fund fees and expenses, if any, is a fund’s total annual operating expenses. Total expenses as shown in the Statements of Operations does not include acquired fund fees and expenses.
For the iShares Emerging Markets Infrastructure ETF, BFA has contractually agreed to waive a portion of its investment advisory fee for the Fund through July 31, 2027 in an amount equal to the acquired fund fees and expenses, if any, attributable to the Fund’s investments in other iShares funds.
For the iShares International Developed Small Cap Value Factor ETF, BFA had contractually agreed to waive a portion of its investment advisory fee through July 31, 2024 in order to limit the Fund’s total annual operating expenses after fee waiver to 0.30% of average daily net assets. The contractual waiver was terminated as of June 30, 2023.
These amounts are included in investment advisory fees waived in the Statements of Operations. For the year ended March 31, 2024, the amounts waived in investment advisory fees pursuant to these arrangements were as follows:
| |
International Developed Small Cap Value Factor | |
Distributor: BlackRock Investments, LLC, an affiliate of BFA, is the distributor for each Fund. Pursuant to the distribution agreement, BFA is responsible for any fees or expenses for distribution services provided to the Funds.
Securities Lending: The U.S. Securities and Exchange Commission (the “SEC”) has issued an exemptive order which permits BlackRock Institutional Trust Company, N.A. (“BTC”), an affiliate of BFA, to serve as securities lending agent for the Funds, subject to applicable conditions. As securities lending agent, BTC bears all operational costs directly related to securities lending, including any custodial costs. Each Fund is responsible for fees in connection with the investment of cash collateral received for securities on loan (the “collateral investment fees”). The cash collateral is invested in a money market fund, BlackRock Cash Funds: Institutional or BlackRock Cash Funds: Treasury, managed by BFA, or its affiliates. However, BTC has agreed to reduce the amount of securities lending income it receives in order to effectively limit the collateral investment fees each Fund bears to an annual rate of 0.04%. The SL Agency Shares of such money market fund will not be subject to a sales load, redemption fee, distribution fee or service fee. The money market fund in which the cash collateral has been invested may, under certain circumstances, impose a liquidity fee of up to 2% of the value redeemed or temporarily restrict redemptions for up to 10 business days during a 90 day period, in the event that the money market fund’s weekly liquid assets fall below certain thresholds.
Securities lending income is generally equal to the total of income earned from the reinvestment of cash collateral (and excludes collateral investment fees), and any fees or other payments to and from borrowers of securities. Each Fund retains a portion of the securities lending income and remits the remaining portion to BTC as compensation for its services as securities lending agent.
Pursuant to the current securities lending agreement, the iShares Blockchain and Tech ETF (the “Group 1 Funds”), retains 81% of securities lending income (which excludes collateral investment fees) and the amount retained can never be less than 70% of the total of securities lending income plus the collateral investment fees.
Pursuant to the current securities lending agreement, each of iShares Asia 50 ETF, iShares Emerging Markets Infrastructure ETF, iShares Europe ETF, iShares Future Metaverse Tech and Communications ETF, iShares India 50 ETF, iShares International Developed Property ETF, iShares International Developed Small Cap Value Factor ETF, iShares International Dividend Growth ETF and iShares Latin America 40 ETF (the “Group 2 Funds”), retains 82% of securities lending income (which excludes collateral investment fees) and the amount retained can never be less than 70% of the total of securities lending income plus the collateral investment fees.
In addition, commencing the business day following the date that the aggregate securities lending income plus the collateral investment fees generated across all 1940 Act iShares exchange-traded funds (the “iShares ETF Complex”) in a given calendar year exceeds a specified threshold: (1) the Group 1 Fund, pursuant to the securities lending agreement, will retain for the remainder of that calendar year 81% of securities lending income (which excludes collateral investment fees), and the amount retained can never be less than 70% of the total of securities lending income plus the collateral investment fees, and (2) each Group 2 Fund will retain for the remainder of that calendar year 85% of securities lending income (which excludes collateral investment fees), and the amount retained can never be less than 70% of the total of securities lending income plus the collateral investment fees.
Notes to Financial Statements93
Notes to Financial Statements (continued)
The share of securities lending income earned by each Fund is shown as securities lending income – affiliated – net in its Statements of Operations. For the year ended March 31, 2024, the Funds paid BTC the following amounts for securities lending agent services:
| |
| |
| |
Emerging Markets Infrastructure | |
| |
Future Metaverse Tech and Communications | |
International Developed Property | |
International Developed Small Cap Value Factor | |
International Dividend Growth | |
| |
Officers and Trustees: Certain officers and/or trustees of the Trust are officers and/or trustees of BlackRock or its affiliates.
Other Transactions: Cross trading is the buying or selling of portfolio securities between funds to which BFA (or an affiliate) serves as investment adviser. At its regularly scheduled quarterly meetings, the Board reviews such transactions as of the most recent calendar quarter for compliance with the requirements and restrictions set forth by Rule 17a-7.
For the year ended March 31, 2024, transactions executed by the Funds pursuant to Rule 17a-7 under the 1940 Act were as follows:
| | | |
| | | |
| | | |
Emerging Markets Infrastructure | | | |
| | | |
International Developed Property | | | |
International Developed Small Cap Value Factor | | | |
International Dividend Growth | | | |
| | | |
Each Fund may invest its positive cash balances in certain money market funds managed by BFA or an affiliate. The income earned on these temporary cash investments is shown as dividends – affiliated in the Statements of Operations.
A fund, in order to improve its portfolio liquidity and its ability to track its underlying index, may invest in shares of other iShares funds that invest in securities in the fund’s underlying index.
7. PURCHASES AND SALES
For the year ended March 31, 2024, purchases and sales of investments, excluding short-term securities and in-kind transactions, were as follows:
| | |
| | |
| | |
Emerging Markets Infrastructure | | |
| | |
Future Metaverse Tech and Communications | | |
| | |
International Developed Property | | |
International Developed Small Cap Value Factor | | |
International Dividend Growth | | |
| | |
942024 iShares Annual Report to Shareholders
Notes to Financial Statements (continued)
For the year ended March 31, 2024, in-kind transactions were as follows:
| | |
| | |
| | |
Emerging Markets Infrastructure | | |
| | |
Future Metaverse Tech and Communications | | |
International Developed Property | | |
International Developed Small Cap Value Factor | | |
International Dividend Growth | | |
| | |
8. INCOME TAX INFORMATION
Each Fund is treated as an entity separate from the Trust’s other funds for federal income tax purposes. It is each Fund’s policy to comply with the requirements of the Internal Revenue Code of 1986, as amended, applicable to regulated investment companies, and to distribute substantially all of its taxable income to its shareholders. Therefore, no U.S. federal income tax provision is required.
Management has analyzed tax laws and regulations and their application to the Funds as of March 31, 2024, inclusive of the open tax return years, and does not believe that there are any uncertain tax positions that require recognition of a tax liability in the Funds’ financial statements.
U.S. GAAP requires that certain components of net assets be adjusted to reflect permanent differences between financial and tax reporting. These reclassifications have no effect on net assets or NAV per share. As of March 31, 2024, permanent differences attributable to certain deemed distributions, net operating loss and realized gains (losses) from in-kind redemptions were reclassified to the following accounts:
| | Accumulated
Earnings (Loss) |
| | |
Emerging Markets Infrastructure | | |
| | |
Future Metaverse Tech and Communications | | |
| | |
International Developed Property | | |
International Dividend Growth | | |
| | |
The tax character of distributions paid was as follows:
| | |
Emerging Markets Infrastructure | | |
| | |
| | |
| | |
Notes to Financial Statements95
Notes to Financial Statements (continued)
| | |
Future Metaverse Tech and Communications | | |
| | |
| | |
| | |
| | |
International Developed Property | | |
| | |
International Developed Small Cap Value Factor | | |
| | |
International Dividend Growth | | |
| | |
| | |
| | |
As of March 31, 2024, the tax components of accumulated net earnings (losses) were as follows:
| Undistributed
Ordinary Income | Undistributed
Long-Term Capital Gains | | | | | |
| | | | | | | |
| | | | | | | |
Emerging Markets Infrastructure | | | | | | | |
| | | | | | | |
Future Metaverse Tech and Communications | | | | | | | |
| | | | | | | |
International Developed Property | | | | | | | |
International Developed Small Cap Value Factor | | | | | | | |
International Dividend Growth | | | | | | | |
| | | | | | | |
| Amounts available to offset future realized capital gains. |
| The difference between book-basis and tax-basis unrealized gains (losses) was attributable primarily to the tax deferral of losses on wash sales, the timing and recognition of realized gains / losses for tax purposes, the realization for tax purposes of unrealized gains (losses) on certain foreign currency and futures contracts, timing and recognition of partnership income, characterization of corporate actions and the realization for tax purposes of unrealized gains on investments in passive foreign investment companies. |
| The Funds have elected to defer these qualified late-year losses and recognize such losses in the next taxable year. |
For the year ended March 31, 2024, the iShares Blockchain and Tech ETF utilized $56,416 of its capital loss carryforwards.
A fund may own shares in certain foreign investment entities, referred to, under U.S. tax law, as “passive foreign investment companies.” Such fund may elect to mark-to-market annually the shares of each passive foreign investment company and would be required to distribute to shareholders any such marked-to-market gains.
962024 iShares Annual Report to Shareholders
Notes to Financial Statements (continued)
As of March 31, 2024, gross unrealized appreciation and depreciation based on cost of investments (including short positions and derivatives, if any) for U.S. federal income tax purposes were as follows:
| | Gross Unrealized
Appreciation | Gross Unrealized
Depreciation | Net Unrealized
Appreciation
(Depreciation) |
| | | | |
| | | | |
Emerging Markets Infrastructure | | | | |
| | | | |
Future Metaverse Tech and Communications | | | | |
| | | | |
International Developed Property | | | | |
International Developed Small Cap Value Factor | | | | |
International Dividend Growth | | | | |
| | | | |
9. LINE OF CREDIT
The iShares Asia 50 ETF, iShares Emerging Markets Infrastructure ETF, iShares Future Metaverse Tech and Communications ETF, iShares India 50 ETF, iShares International Dividend Growth ETF and iShares Latin America 40 ETF, along with certain other iShares funds (“Participating Funds”), are parties to a $800 million credit agreement (“Syndicated Credit Agreement”) with a group of lenders, which expires on October 16, 2024. The line of credit may be used for temporary or emergency purposes, including redemptions, settlement of trades and rebalancing of portfolio holdings in certain target markets. The Funds may borrow up to the aggregate commitment amount subject to asset coverage and other limitations as specified in the Syndicated Credit Agreement. The Syndicated Credit Agreement has the following terms: a commitment fee of 0.15% per annum on the unused portion of the credit agreement and interest at a rate equal to the higher of (a) Daily Simple Secured Overnight Financing Rate (“SOFR”) plus 0.10% and 1.00% per annum or (b) the U.S. Federal Funds rate plus 1.00% per annum on amounts borrowed. The commitment fee is generally allocated to each Participating Fund based on the lesser of a Participating Fund’s relative exposure to certain target markets or a Participating Fund’s maximum borrowing amount as set forth by the terms of the Syndicated Credit Agreement.
During the year ended March 31, 2024, the iShares Asia 50 ETF, iShares Emerging Markets Infrastructure ETF, iShares Future Metaverse Tech and Communications ETF, iShares India 50 ETF and iShares Latin America 40 ETF did not borrow under the Syndicated Credit Agreement.
For the year ended March 31, 2024, the maximum amount borrowed, the average daily borrowing and the weighted average interest rate, if any, under the Syndicated Credit Agreement were as follows:
| | | Weighted
Average
Interest Rates |
International Dividend Growth | | | |
10. PRINCIPAL RISKS
In the normal course of business, each Fund invests in securities or other instruments and may enter into certain transactions, and such activities subject the Fund to various risks, including, among others, fluctuations in the market (market risk) or failure of an issuer to meet all of its obligations. The value of securities or other instruments may also be affected by various factors, including, without limitation: (i) the general economy; (ii) the overall market as well as local, regional or global political and/or social instability; (iii) regulation, taxation or international tax treaties between various countries; or (iv) currency, interest rate or price fluctuations. Local, regional or global events such as war, acts of terrorism, the spread of infectious illness or other public health issues, recessions, or other events could have a significant impact on the Funds and their investments. Each Fund’s prospectus provides details of the risks to which the Fund is subject.
BFA uses an indexing approach to try to achieve each Fund’s investment objective. The Fund is not actively managed, and BFA generally does not attempt to take defensive positions under any market conditions, including declining markets.
The Funds may be exposed to additional risks when reinvesting cash collateral in money market funds that do not seek to maintain a stable NAV per share of $1.00, which may be subject to discretionary liquidity fees under certain circumstances.
Market Risk: Investments in the securities of issuers domiciled in countries with emerging capital markets involve certain additional risks that do not generally apply to investments in securities of issuers in more developed capital markets, such as (i) low or nonexistent trading volume, resulting in a lack of liquidity and increased volatility in prices for such securities; (ii) lack of reliable settlement procedures and significant delays in registering the transfer of securities; (iii) uncertain national policies and social, political and economic instability, increasing the potential for expropriation of assets, confiscatory taxation, high rates of inflation or unfavorable diplomatic developments; (iv) lack of publicly available or reliable information about issuers as a result of not being subject to the same degree of regulatory requirements and accounting, auditing and financial reporting standards; and (v) possible fluctuations in exchange rates, differing legal systems and the existence or possible imposition of exchange controls, custodial restrictions or other foreign or U.S. governmental laws or restrictions applicable to such investments.
Notes to Financial Statements97
Notes to Financial Statements (continued)
Valuation Risk: The market values of equities, such as common stocks and preferred securities or equity related investments, such as futures and options, may decline due to general market conditions which are not specifically related to a particular company. They may also decline due to factors which affect a particular industry or industries. A fund may invest in illiquid investments. An illiquid investment is any investment that a fund reasonably expects cannot be sold or disposed of in current market conditions in seven calendar days or less without the sale or disposition significantly changing the market value of the investment. A fund may experience difficulty in selling illiquid investments in a timely manner at the price that it believes the investments are worth. Prices may fluctuate widely over short or extended periods in response to company, market or economic news. Markets also tend to move in cycles, with periods of rising and falling prices. This volatility may cause a fund’s NAV to experience significant increases or decreases over short periods of time. If there is a general decline in the securities and other markets, the NAV of a fund may lose value, regardless of the individual results of the securities and other instruments in which a fund invests.
The price each Fund could receive upon the sale of any particular portfolio investment may differ from each Fund’s valuation of the investment, particularly for securities that trade in thin or volatile markets or that are valued using a fair valuation technique or a price provided by an independent pricing service. Changes to significant unobservable inputs and assumptions (i.e., publicly traded company multiples, growth rate, time to exit) due to the lack of observable inputs may significantly impact the resulting fair value and therefore each Fund’s results of operations. As a result, the price received upon the sale of an investment may be less than the value ascribed by each Fund, and each Fund could realize a greater than expected loss or lesser than expected gain upon the sale of the investment. Each Fund’s ability to value its investments may also be impacted by technological issues and/or errors by pricing services or other third-party service providers.
Counterparty Credit Risk: The Funds may be exposed to counterparty credit risk, or the risk that an entity may fail to or be unable to perform on its commitments related to unsettled or open transactions, including making timely interest and/or principal payments or otherwise honoring its obligations. The Funds manage counterparty credit risk by entering into transactions only with counterparties that BFA believes have the financial resources to honor their obligations and by monitoring the financial stability of those counterparties. Financial assets, which potentially expose the Funds to market, issuer and counterparty credit risks, consist principally of financial instruments and receivables due from counterparties. The extent of the Funds’ exposure to market, issuer and counterparty credit risks with respect to these financial assets is approximately their value recorded in the Statements of Assets and Liabilities, less any collateral held by the Funds.
A derivative contract may suffer a mark-to-market loss if the value of the contract decreases due to an unfavorable change in the market rates or values of the underlying instrument. Losses can also occur if the counterparty does not perform under the contract.
With exchange-traded futures, there is less counterparty credit risk to the Funds since the exchange or clearinghouse, as counterparty to such instruments, guarantees against a possible default. The clearinghouse stands between the buyer and the seller of the contract; therefore, credit risk is limited to failure of the clearinghouse. While offset rights may exist under applicable law, a fund does not have a contractual right of offset against a clearing broker or clearinghouse in the event of a default (including the bankruptcy or insolvency). Additionally, credit risk exists in exchange-traded futures with respect to initial and variation margin that is held in a clearing broker’s customer accounts. While clearing brokers are required to segregate customer margin from their own assets, in the event that a clearing broker becomes insolvent or goes into bankruptcy and at that time there is a shortfall in the aggregate amount of margin held by the clearing broker for all its clients, typically the shortfall would be allocated on a pro rata basis across all the clearing broker’s customers, potentially resulting in losses to the Funds.
Geographic/Asset Class Risk: A diversified portfolio, where this is appropriate and consistent with a fund’s objectives, minimizes the risk that a price change of a particular investment will have a material impact on the NAV of a fund. The investment concentrations within each Fund’s portfolio are disclosed in its Schedule of Investments.
Certain Funds invest a significant portion of their assets in issuers located in a single country or a limited number of countries. When a fund concentrates its investments in this manner, it assumes the risk that economic, regulatory, political and social conditions in that country or those countries may have a significant impact on the fund and could affect the income from, or the value or liquidity of, the Fund’s portfolio. Unanticipated or sudden political or social developments may cause uncertainty in the markets and as a result adversely affect the Fund’s investments. Foreign issuers may not be subject to the same uniform accounting, auditing and financial reporting standards and practices as used in the United States. Foreign securities markets may also be more volatile and less liquid than U.S. securities and may be less subject to governmental supervision not typically associated with investing in U.S. securities. Investment percentages in specific countries are presented in the Schedule of Investments.
Certain Funds invest a significant portion of their assets in securities of issuers located in Europe or with significant exposure to European issuers or countries. The European financial markets have recently experienced volatility and adverse trends due to concerns about economic downturns in, or rising government debt levels of, several European countries as well as acts of war in the region. These events may spread to other countries in Europe and may affect the value and liquidity of certain of the Funds’ investments.
Responses to the financial problems by European governments, central banks and others, including austerity measures and reforms, may not work, may result in social unrest and may limit future growth and economic recovery or have other unintended consequences. Further defaults or restructurings by governments and others of their debt could have additional adverse effects on economies, financial markets and asset valuations around the world. The United Kingdom has withdrawn from the European Union, and one or more other countries may withdraw from the European Union and/or abandon the Euro, the common currency of the European Union. These events and actions have adversely affected, and may in the future adversely affect, the value and exchange rate of the Euro and may continue to significantly affect the economies of every country in Europe, including countries that do not use the Euro and non-European Union member states. The impact of these actions, especially if they occur in a disorderly fashion, is not clear but could be significant and far reaching. In addition, Russia launched a large-scale invasion of Ukraine on February 24, 2022. The extent and duration of the military action, resulting sanctions and resulting future market disruptions in the region are impossible to predict, but have been, and may continue to be, significant and have a severe adverse effect on the region, including significant negative impacts on the economy and the markets for certain securities and commodities, such as oil and natural gas, as well as other sectors.
982024 iShares Annual Report to Shareholders
Notes to Financial Statements (continued)
Certain Funds invest a significant portion of their assets in securities of issuers located in China or with significant exposure to Chinese issuers. Investments in Chinese securities, including certain Hong Kong-listed securities, involve risks specific to China. China may be subject to considerable degrees of economic, political and social instability and demonstrates significantly higher volatility from time to time in comparison to developed markets. Chinese markets generally continue to experience inefficiency, volatility and pricing anomalies resulting from governmental influence, a lack of publicly available information and/or political and social instability. Internal social unrest or confrontations with other neighboring countries may disrupt economic development in China and result in a greater risk of currency fluctuations, currency non-convertibility, interest rate fluctuations and higher rates of inflation. Incidents involving China’s or the region’s security may cause uncertainty in Chinese markets and may adversely affect the Chinese economy and a fund’s investments. Reduction in spending on Chinese products and services, supply chain diversification, institution of tariffs, sanctions or other trade barriers, or a downturn in any of the economies of China’s key trading partners may have an adverse impact on the Chinese economy. In addition, measures may be taken to limit the flow of capital and/or sanctions may be imposed, which could prohibit or restrict the ability to own or transfer fund assets and may also include retaliatory actions, such as seizure of fund assets.
Certain Funds invest a significant portion of their assets in securities of issuers located in Asia or with significant exposure to Asian issuers or countries. The Asian financial markets have recently experienced volatility and adverse trends due to concerns in several Asian countries regarding monetary policy, government intervention in the markets, rising government debt levels or economic downturns. These events may spread to other countries in Asia and may affect the value and liquidity of certain of the Funds’ investments.
Certain Funds invest a significant portion of their assets in securities within a single or limited number of market sectors. When a fund concentrates its investments in this manner, it assumes the risk that economic, regulatory, political and social conditions affecting such sectors may have a significant impact on the fund and could affect the income from, or the value or liquidity of, the fund’s portfolio.
Significant Shareholder Redemption Risk: Certain shareholders may own or manage a substantial amount of fund shares and/or hold their fund investments for a limited period of time. Large redemptions of fund shares by these shareholders may force a fund to sell portfolio securities, which may negatively impact the fund’s NAV, increase the fund’s brokerage costs, and/or accelerate the realization of taxable income/gains and cause the fund to make additional taxable distributions to shareholders.
11. CAPITAL SHARE TRANSACTIONS
Capital shares are issued and redeemed by each Fund only in aggregations of a specified number of shares or multiples thereof (“Creation Units”) at NAV. Except when aggregated in Creation Units, shares of each Fund are not redeemable.
Transactions in capital shares were as follows:
| | |
| | | | |
Emerging Markets Infrastructure | | | | |
| | | | |
| | | | |
| | | | |
| | | | |
| | | | |
| | | | |
| | | | |
Notes to Financial Statements99
Notes to Financial Statements (continued)
| | |
| | | | |
Future Metaverse Tech and Communications(b) | | | | |
| | | | |
| | | | |
| | | | |
| | |
| | | | |
| | | | |
| | | | |
| | | | |
| | | | |
International Developed Property | | | | |
| | | | |
| | | | |
| | | | |
International Developed Small Cap Value Factor | | | | |
| | | | |
International Dividend Growth | | | | |
| | | | |
| | | | |
| | | | |
| | | | |
| | | | |
| | | | |
| | | | |
| The Fund commenced operations on April 25, 2022. |
| The Fund commenced operations on February 14, 2023. |
The consideration for the purchase of Creation Units of a fund in the Trust generally consists of the in-kind deposit of a designated portfolio of securities and a specified amount of cash. Certain funds in the Trust may be offered in Creation Units solely or partially for cash in U.S. dollars. Authorized Participants purchasing and redeeming Creation Units may pay a purchase transaction fee and a redemption transaction fee directly to State Street Bank and Trust Company, the Trust’s administrator, to offset transfer and other transaction costs associated with the issuance and redemption of Creation Units, including Creation Units for cash. Authorized Participants transacting in Creation Units for cash may also pay an additional variable charge to compensate the relevant fund for certain transaction costs (i.e., stamp taxes, taxes on currency or other financial transactions, and brokerage costs) and market impact expenses relating to investing in portfolio securities. Such variable charges, if any, are included in shares sold in the table above.
From time to time, settlement of securities related to in-kind contributions or in-kind redemptions may be delayed. In such cases, securities related to in-kind transactions are reflected as a receivable or a payable in the Statements of Assets and Liabilities.
12. FOREIGN WITHHOLDING TAX CLAIMS
The Internal Revenue Service (“IRS”) has issued guidance to address U.S. income tax liabilities attributable to fund shareholders resulting from the recovery of foreign taxes withheld in prior calendar years. These withheld foreign taxes were passed through to shareholders in the form of foreign tax credits in the year the taxes were withheld. Assuming there are sufficient foreign taxes paid which each of the iShares Europe ETF, iShares International Developed Small Cap Value Factor ETF and iShares International Dividend Growth ETF is able to pass through to shareholders as a foreign tax credit in the current year, each of the Funds will be able to offset the prior years’ withholding taxes recovered against the foreign taxes paid in the current year. Accordingly, no federal income tax liability is recorded by the Funds.
The iShares Europe ETF is seeking a closing agreement with the Internal Revenue Service (“IRS”) to address any prior years’ U.S. income tax liabilities attributable to Fund shareholders resulting from the recovery of foreign taxes. The closing agreement would result in the Fund paying a compliance fee to the IRS, on behalf of its shareholders, representing the estimated tax savings generated from foreign tax credits claimed by Fund shareholders on their tax returns in prior years. The Fund has accrued a liability for the estimated IRS compliance fee related to foreign withholding tax claims, which is disclosed in the Statements of Assets and Liabilities. The actual IRS compliance fee may differ from the estimate and that difference may be material.
1002024 iShares Annual Report to Shareholders
Notes to Financial Statements (continued)
13. SUBSEQUENT EVENTS
Management has evaluated the impact of all subsequent events on the Funds through the date the financial statements were available to be issued and has determined that there were no subsequent events requiring adjustment or additional disclosure in the financial statements.
Notes to Financial Statements101
Report of Independent Registered Public Accounting Firm
To the Board of Trustees of
iShares Trust and Shareholders of each of the ten funds listed in the table below
Opinions on the Financial Statements
We have audited the accompanying statements of assets and liabilities, including the schedules of investments, of each of the funds listed in the table below (ten of the funds constituting iShares Trust, hereafter collectively referred to as the "Funds") as of March 31, 2024, the related statements of operations and of changes in net assets for each of the periods indicated in the table below, including the related notes, and the financial highlights for each of the periods indicated in the table below (collectively referred to as the “financial statements”). In our opinion, the financial statements present fairly, in all material respects, the financial position of each of the Funds listed in the table below as of March 31, 2024, the results of each of their operations and the changes in each of their net assets for the periods indicated in the table below, and each of the financial highlights for each of the periods indicated in the table below, in conformity with accounting principles generally accepted in the United States of America.
|
iShares Blockchain and Tech ETF(2) |
iShares Emerging Markets Infrastructure ETF(1) |
|
iShares Future Metaverse Tech and Communications ETF(3) |
|
iShares International Developed Property ETF(1) |
iShares International Developed Small Cap Value Factor ETF(1) |
iShares International Dividend Growth ETF(1) |
iShares Latin America 40 ETF(1) |
(1) Statement of operations for the year ended March 31, 2024, statement of changes in net assets for each of the two years in the period ended March 31, 2024 and the financial highlights for each of the five years in the period ended March 31, 2024.
(2) Statement of operations for the year ended March 31, 2024, and statement of changes in net assets and the financial highlights for the year ended March 31, 2024 and the period April 25, 2022 (commencement of operations) to March 31, 2023.
(3) Statement of operations for the year ended March 31, 2024, and statement of changes in net assets and the financial highlights for the year ended March 31, 2024 and the period February 14, 2023 (commencement of operations) to March 31, 2023.
(4) Statement of operations for the year ended March 31, 2024, statement of changes in net assets for the year ended March 31, 2024, consolidated statement of changes in net assets for the year ended March 31, 2023, the financial highlights for the year ended March 31, 2024 and the consolidated financial highlights for each of the four years in the period ended March 31, 2023.
Basis for Opinions
These financial statements are the responsibility of the Funds’ management. Our responsibility is to express an opinion on the Funds’ financial statements based on our audits. We are a public accounting firm registered with the Public Company Accounting Oversight Board (United States) (PCAOB) and are required to be independent with respect to the Funds in accordance with the U.S. federal securities laws and the applicable rules and regulations of the Securities and Exchange Commission and the PCAOB.
We conducted our audits of these financial statements in accordance with the standards of the PCAOB. Those standards require that we plan and perform the audit to obtain reasonable assurance about whether the financial statements are free of material misstatement, whether due to error or fraud.
Our audits included performing procedures to assess the risks of material misstatement of the financial statements, whether due to error or fraud, and performing procedures that respond to those risks. Such procedures included examining, on a test basis, evidence regarding the amounts and disclosures in the financial statements. Our audits also included evaluating the accounting principles used and significant estimates made by management, as well as evaluating the overall presentation of the financial statements. Our procedures included confirmation of securities owned as of March 31, 2024 by correspondence with the custodian, transfer agent and brokers; when replies were not received from brokers, we performed other auditing procedures. We believe that our audits provide a reasonable basis for our opinions.
/s/PricewaterhouseCoopers LLP
Philadelphia, Pennsylvania
May 23, 2024
We have served as the auditor of one or more BlackRock investment companies since 2000.
1022024 iShares Annual Report to Shareholders
Important Tax Information (unaudited)
The following amounts, or maximum amounts allowable by law, are hereby designated as qualified dividend income for individuals for the fiscal year ended March 31, 2024:
| |
| |
| |
Emerging Markets Infrastructure | |
| |
Future Metaverse Tech and Communications | |
| |
International Developed Property | |
International Developed Small Cap Value Factor | |
International Dividend Growth | |
| |
The Funds intend to pass through to their shareholders the following amounts, or maximum amounts allowable by law, of foreign source income earned and foreign taxes paid for the fiscal year ended March 31, 2024:
| Foreign Source
Income Earned | |
| | |
Emerging Markets Infrastructure | | |
| | |
| | |
International Developed Property | | |
International Developed Small Cap Value Factor | | |
International Dividend Growth | | |
| | |
The following percentages, or maximum percentages allowable by law, of ordinary income distributions paid during the fiscal year ended March 31, 2024 qualified for the dividends-received deduction for corporate shareholders:
| Dividends-Received
Deduction |
| |
Future Metaverse Tech and Communications | |
| |
The Funds hereby designate the following amounts, or maximum amounts allowable by law, as capital gain dividends, subject to a long-term capital gains tax rate as noted below, for the fiscal year ended March 31, 2024:
| 20% Rate Long-Term
Capital Gain Dividends |
Future Metaverse Tech and Communications | |
| |
Important Tax Information103
Statement Regarding Liquidity Risk Management Program (unaudited)
In compliance with Rule 22e-4 under the Investment Company Act of 1940, as amended (the “Liquidity Rule”), iShares Trust (the “Trust”) has adopted and implemented a liquidity risk management program (the “Program”) for iShares Asia 50 ETF, iShares Blockchain and Tech ETF, iShares Emerging Markets Infrastructure ETF, iShares Europe ETF, iShares Future Metaverse Tech and Communications ETF, iShares India 50 ETF, iShares International Developed Property ETF, iShares International Developed Small Cap Value Factor ETF, iShares International Dividend Growth ETF and iShares Latin America 40 ETF (the “Funds” or “ETFs”), each a series of the Trust, which is reasonably designed to assess and manage each Fund’s liquidity risk.
The Board of Trustees (the “Board”) of the Trust, on behalf of the Funds, met on December 8, 2023 (the “Meeting”) to review the Program. The Board previously appointed BlackRock Fund Advisors (“BlackRock”), the investment adviser to the Funds, as the program administrator for each Fund’s Program. BlackRock also previously delegated oversight of the Program to the 40 Act Liquidity Risk Management Committee (the “Committee”). At the Meeting, the Committee, on behalf of BlackRock, provided the Board with a report that addressed the operation of the Program and assessed its adequacy and effectiveness of implementation, including the management of each Fund’s Highly Liquid Investment Minimum (“HLIM”) where applicable, and any material changes to the Program (the “Report”). The Report covered the period from October 1, 2022 through September 30, 2023 (the “Program Reporting Period”).
The Report described the Program’s liquidity classification methodology for categorizing each Fund’s investments (including derivative transactions) into one of four liquidity buckets. It also referenced the methodology used by BlackRock to establish each Fund’s HLIM and noted that the Committee reviews and ratifies the HLIM assigned to each Fund no less frequently than annually. The Report also discussed notable events affecting liquidity over the Program Reporting Period, including extended market holidays, delays in the repatriation of the local currency in certain non-U.S. countries, the continued illiquidity of Russian equity securities and the suspension of select sanctions in Venezuela.
The Report noted that the Program complied with the key factors for consideration under the Liquidity Rule for assessing, managing and periodically reviewing each Fund’s liquidity risk, as follows:
a) The Fund’s investment strategy and liquidity of portfolio investments during both normal and reasonably foreseeable stressed conditions. During the Program Reporting Period, the Committee reviewed whether each Fund’s strategy is appropriate for an open-end fund structure, with a focus on funds with more significant and consistent holdings of less liquid and illiquid assets. The Committee also factored a fund’s concentration in an issuer into the liquidity classification methodology by taking issuer position sizes into account. Derivative exposure was also considered in the calculation of a fund’s liquidity bucketing. Finally, a factor for consideration under the Liquidity Rule is a Fund’s use of borrowings for investment purposes. However, the Funds do not borrow for investment purposes.
b) Short-term and long-term cash flow projections during both normal and reasonably foreseeable stressed conditions. During the Program Reporting Period, the Committee reviewed historical redemption activity and used this information as a component to establish each ETF’s reasonably anticipated trading size utilized for liquidity classifications. The Committee may also take into consideration a fund’s shareholder ownership concentration (which, depending on product type and distribution channel, may or may not be available), a fund’s distribution channels, and the degree of certainty associated with a fund’s short-term and long-term cash flow projections.
c) Holdings of cash and cash equivalents, as well as borrowing arrangements. The Committee considered that ETFs generally do not hold more than de minimis amounts of cash. The Committee also considered that ETFs generally do not engage in borrowing.
d) The relationship between an ETF’s portfolio liquidity and the way in which, and the prices and spreads at which, ETF shares trade, including the efficiency of the arbitrage function and the level of active participation by market participants, including authorized participants. The Committee monitored the prevailing bid/ask spread and the ETF price premium (or discount) to NAV for all ETFs. However, there were no ETFs with persistent deviations of fund premium/discount or bid/ask spreads from long-term averages over the Program Reporting Period.
e) The effect of the composition of baskets on the overall liquidity of an ETF’s portfolio. In reviewing the linkage between the composition of custom baskets accepted by an ETF and any significant change in the liquidity profile of such ETF, the Committee reviewed changes in the proportion of each ETF’s portfolio comprised of less liquid and illiquid holdings to determine if applicable thresholds were met requiring enhanced review. There were no ETFs for which the custom baskets accepted by the ETF had a significant change in its liquidity profile.
There were no material changes to the Program during the Program Reporting Period other than the enhancement of certain model components in the Program’s classification methodology. The Report provided to the Board stated that the Committee concluded that based on the operation of the functions, as described in the Report, the Program is operating as intended and is effective in implementing the requirements of the Liquidity Rule.
1042024 iShares Annual Report to Shareholders
Supplemental Information (unaudited)
Section 19(a) Notices
The amounts and sources of distributions reported are estimates and are being provided pursuant to regulatory requirements and are not being provided for tax reporting purposes. The actual amounts and sources for tax reporting purposes will depend upon each Fund’s investment experience during the year and may be subject to changes based on tax regulations. Shareholders will receive a Form 1099-DIV each calendar year that will inform them how to report these distributions for federal income tax purposes.
March 31, 2024
| Total Cumulative Distributions
for the Fiscal Year | % Breakdown of the Total Cumulative
Distributions for the Fiscal Year |
| | Net Realized
Capital Gains | | | | Net Realized
Capital Gains | | |
| | | | | | | | |
Emerging Markets Infrastructure | | | | | | | | |
| | | | | | | | |
Future Metaverse Tech and Communications(a) | | | | | | | | |
| | | | | | | | |
International Developed Property | | | | | | | | |
International Developed Small Cap Value Factor(a) | | | | | | | | |
| | | | | | | | |
| The Fund estimates that it has distributed more than its net investment income and net realized capital gains; therefore, a portion of the distribution may be a return of capital. A return of capital may occur, for example, when some or all of the shareholder's investment in the Fund is returned to the shareholder. A return of capital does not necessarily reflect the Fund’s investment performance and should not be confused with “yield” or “income”. When distributions exceed total return performance, the difference will incrementally reduce the Fund’s net asset value per share. |
Tailored Shareholder Reports for Open-End Mutual Funds and ETFs
Effective January 24, 2023, the SEC adopted rule and form amendments to require open-end mutual funds and ETFs to transmit concise and visually engaging streamlined annual and semiannual reports to shareholders that highlight key information. Other information, including financial statements, will no longer appear in a streamlined shareholder report but must be available online, delivered free of charge upon request, and filed on a semiannual basis on Form N-CSR. The rule and form amendments have a compliance date of July 24, 2024. At this time, management is evaluating the impact of these amendments on the shareholder reports for the Funds.
Premium/Discount Information
Information on the Fund's net asset value, market price, premiums and discounts, and bid-ask spreads can be found at iShares.com.
Regulation under the Alternative Investment Fund Managers Directive
The Alternative Investment Fund Managers Directive, and its United Kingdom (“UK”) equivalent, (the “AIFMD”) impose detailed and prescriptive obligations on fund managers established in the European Union (the “EU”) and the UK. These do not currently apply to managers established outside of the EU or UK, such as BFA (the “Company”). However, the Company is required to comply with certain disclosure, reporting and transparency obligations of the AIFMD because it has registered the iShares India 50 ETF (the “Fund”) to be marketed to investors in the EU and/or UK.
Report on Remuneration
BlackRock has a clear and well-defined pay-for-performance philosophy, and compensation programs which support that philosophy.
BlackRock operates a total compensation model for remuneration which includes a base salary, which is contractual, and a discretionary bonus scheme. Although all employees are eligible to receive a discretionary bonus, there is no contractual obligation to make a discretionary bonus award to any employees. For senior management and staff who have the ability to materially affect the risk profile of the Fund, a significant percentage of variable remuneration is deferred over time. All employees are subject to a clawback policy.
Remuneration decisions for employees are made once annually in January following the end of the performance year, based on BlackRock’s full-year financial results and other non-financial goals and objectives. Alongside financial performance, individual total compensation is also based on strategic and operating results and other considerations such as management and leadership capabilities. No set formulas are established and no fixed benchmarks are used in determining annual incentive awards.
Annual incentive awards are paid from a bonus pool which is reviewed throughout the year by BlackRock's independent compensation committee, taking into account both actual and projected financial information together with information provided by the Enterprise Risk and Regulatory Compliance departments in relation to any activities, incidents or events that warrant consideration in making compensation decisions. Individuals are not involved in setting their own remuneration.
Supplemental Information105
Supplemental Information (unaudited) (continued)
Each of the control functions (Enterprise Risk, Legal & Compliance, Finance, Human Resources and Internal Audit) each have their own organizational structures which are independent of the business units and therefore staff members in control functions are remunerated independently of the businesses they oversee. Functional bonus pools for those control functions are determined with reference to the performance of each individual function and the remuneration of the senior members of control functions is directly overseen by BlackRock's independent remuneration committee.
The Company is required under the AIFMD to make quantitative disclosures of remuneration. These disclosures are made in line with BlackRock’s interpretation of currently available regulatory guidance on quantitative remuneration disclosures. As market or regulatory practice develops BlackRock may consider it appropriate to make changes to the way in which quantitative remuneration disclosures are calculated. Where such changes are made, this may result in disclosures in relation to a fund not being comparable to the disclosures made in the prior year, or in relation to other BlackRock fund disclosures in that same year. BlackRock bases its proportionality approach on a combination of factors that it is entitled to take into account based on relevant guidelines.
Remuneration information at an individual AIF level is not readily available. Disclosures are provided in relation to (a) the staff of the Company; (b) staff who are senior management; (c) staff who have the ability to materially affect the risk profile of the Fund; and (d) staff of companies to which portfolio management and risk management has been formally delegated.
All individuals included in the aggregated figures disclosed are rewarded in line with BlackRock’s remuneration policy for their responsibilities across the relevant BlackRock business area. As all individuals have a number of areas of responsibilities, only the portion of remuneration for those individuals’ services attributable to the Fund is included in the aggregate figures disclosed.
Members of staff and senior management of the Company typically provide both AIFMD and non-AIFMD related services in respect of multiple funds, clients and functions of the Company and across the broader BlackRock group. Conversely, members of staff and senior management of the broader BlackRock group may provide both AIFMD and non-AIFMD related services in respect of multiple funds, clients and functions of the broader BlackRock group and of the Company. Therefore, the figures disclosed are a sum of individuals’ portion of remuneration attributable to the Company according to an objective apportionment methodology which acknowledges the multiple-service nature of the Company and the broader BlackRock group. Accordingly, the figures are not representative of any individual’s actual remuneration or their remuneration structure.
The amount of the total remuneration awarded to the Company’s staff in respect of the Company’s financial year ending December 31, 2023 was USD 5.43m. This figure is comprised of fixed remuneration of USD 0.74m and variable remuneration of USD 4.68m. There was a total of 8 beneficiaries of the remuneration described above.
The amount of the aggregate remuneration awarded by the Company in respect of the Company’s financial year ending December 31, 2023, to its senior management was USD 3.66m, and to other members of its staff whose actions potentially have a material impact on the risk profile of the Company or its funds was USD 1.77m.
Disclosures Under the EU Sustainable Finance Disclosure Regulation
The iShares India 50 ETF (the “Fund”) is registered under the Alternative Investment Fund Managers Directive to be marketed to European Union (“EU”) investors, as noted above. As a result, certain disclosures are required under the EU Sustainable Finance Disclosure Regulation (“SFDR”).
The Fund has not been categorized under the SFDR as an “Article 8” or “Article 9” product. In addition, the Fund’s investment strategy does not take into account the criteria for environmentally sustainable economic activities under the EU sustainable investment taxonomy regulation or principal adverse impacts (“PAIs”) on sustainability factors under the SFDR. PAIs are identified under the SFDR as the material impacts of investment decisions on sustainability factors relating to environmental, social and employee matters, respect for human rights, and anti-corruption and anti-bribery matters.
1062024 iShares Annual Report to Shareholders
Trustee and Officer Information (unaudited)
The Board of Trustees has responsibility for the overall management and operations of the Funds, including general supervision of the duties performed by BFA and other service providers. Each Trustee serves until he or she resigns, is removed, dies, retires or becomes incapacitated. Each officer shall hold office until his or her successor is elected and qualifies or until his or her death, resignation or removal. Trustees who are not “interested persons” (as defined in the 1940 Act) of the Trust are referred to as independent trustees (“Independent Trustees”).
The registered investment companies advised by BFA or its affiliates (the “BlackRock-advised Funds”) are organized into one complex of open-end equity, multi-asset, index and money market funds and ETFs (the “BlackRock Multi-Asset Complex”), one complex of closed-end funds and open-end non-index fixed-income funds (including ETFs) (the “BlackRock Fixed-Income Complex”) and one complex of ETFs (“Exchange-Traded Fund Complex”) (each, a “BlackRock Fund Complex”). Each Fund is included in the Exchange-Traded Fund Complex. Each Trustee also serves as a Director of iShares, Inc. and a Trustee of iShares U.S. ETF Trust and, as a result, oversees all of the funds within the Exchange-Traded Fund Complex, which consists of 404 funds as of March 31, 2024. With the exception of Stephen Cohen, Robert S. Kapito and Aaron Wasserman, the address of each Trustee and officer is c/o BlackRock, Inc., 400 Howard Street, San Francisco, CA 94105. The address of Mr. Kapito and Mr. Wasserman is c/o BlackRock, Inc., 50 Hudson Yards, New York, NY 10001. The address of Mr. Cohen is c/o BlackRock, Inc., Drapers Gardens, 12 Throgmorton Avenue, London EC2N 2DL United Kingdom. The Board has designated John E. Kerrigan as its Independent Board Chair. Additional information about the Funds’ Trustees and officers may be found in the Funds’ combined Statement of Additional Information, which is available without charge, upon request, by calling toll-free 1-800-iShares (1-800-474-2737).
|
| | Principal Occupation(s)
During Past 5 Years | Other Directorships Held by Trustee |
| | President of BlackRock, Inc. (since 2006); Vice Chairman of BlackRock, Inc. and Head of BlackRock’s Portfolio Management Group (since its formation in 1998) and BlackRock, Inc.’s predecessor entities (since 1988); Trustee, University of Pennsylvania (since 2009); President of Board of Directors, Hope & Heroes Children’s Cancer Fund (since 2002). | Director of BlackRock, Inc. (since 2006); Director of iShares, Inc. (since 2009); Trustee of iShares U.S. ETF Trust (since 2011). |
| | Senior Managing Director, Head of Global Product Solutions of BlackRock, Inc. (since 2024); Senior Managing Director, Head of Europe, Middle East and Africa Regions of BlackRock, Inc. (2021-2024); Head of iShares Index and Wealth in EMEA of BlackRock, Inc. (2017-2021); Global Head of Fixed Income Indexing of BlackRock, Inc. (2016-2017); Chief Investment Strategist for International Fixed Income and iShares of BlackRock, Inc. (2011-2015). | Director of iShares, Inc. (since 2024); Trustee of iShares U.S. ETF Trust (since 2024). |
(a) Robert S. Kapito is deemed to be an “interested person” (as defined in the 1940 Act) of the Trust due to his affiliations with BlackRock, Inc. and its affiliates. |
(b) Stephen Cohen is deemed to be an "interested person" (as defined in the 1940 Act) of the Trust due to his affiliations with BlackRock, Inc. and its affiliates. |
|
| | Principal Occupation(s)
During Past 5 Years | Other Directorships Held by Trustee |
| Trustee (since 2005); Independent Board Chair (since 2022). | Chief Investment Officer, Santa Clara University (since 2002). | Director of iShares, Inc. (since 2005); Trustee of iShares U.S. ETF Trust (since 2011); Independent Board Chair of iShares, Inc. and iShares U.S. ETF Trust (since 2022). |
| Trustee (since 2015); Risk Committee Chair (since 2016). | Consultant (since 2012); Member of the Audit Committee (2012-2018), Chair of the Nominating and Governance Committee (2017-2018) and Director of PHH Corporation (mortgage solutions) (2012-2018); Managing Director and Global Head of Financial Holding Company Governance & Assurance and the Global Head of Operational Risk Management of Morgan Stanley (2006-2012). | Director of iShares, Inc. (since 2015); Trustee of iShares U.S. ETF Trust (since 2015); Member of the Audit Committee (since 2016), Chair of the Audit Committee (since 2020) and Director of The Hanover Insurance Group, Inc. (since 2016). |
| Trustee (since 2017); Audit Committee Chair (since 2019). | Partner, KPMG LLP (2002-2016); Director of One Generation Away (since 2021). | Director of iShares, Inc. (since 2017); Trustee of iShares U.S. ETF Trust (since 2017). |
Trustee and Officer Information107
Trustee and Officer Information (unaudited) (continued)
Independent Trustees (continued) |
| | Principal Occupation(s) During Past 5 Years | Other Directorships Held by Trustee |
| Trustee (since 2005); Nominating and Governance and Equity Plus Committee Chairs (since 2022). | Chair of the Finance Committee (since 2019) and Trustee and Member of the Finance, Audit and Quality Committees of Stanford Health Care (since 2016); Trustee of WNET, New York’s public media company (since 2011) and Member of the Audit Committee (since 2018), Investment Committee (since 2011) and Personnel Committee (since 2022); Member of the Wyoming State Investment Funds Committee (since 2022); Director of the Jackson Hole Center for the Arts (since 2021); Trustee of Forward Funds (14 portfolios) (2009-2018); Trustee of Salient MF Trust (4 portfolios) (2015-2018). | Director of iShares, Inc. (since 2005); Trustee of iShares U.S. ETF Trust (since 2011). |
| Trustee (since 2017); 15(c) Committee Chair (since 2017). | Senior Managing Director of New York Life Insurance Company (2010-2015). | Director of iShares, Inc. (since 2017); Trustee of iShares U.S. ETF Trust (since 2017); Director of Jackson Financial Inc. (since 2021). |
| Trustee (since 2003); Securities Lending Committee Chair (since 2019). | Director of Real Estate Equity Exchange, Inc. (since 2005); Director of Cloudera Foundation (2017-2020); and Director of Reading Partners (2012-2016). | Director of iShares, Inc. (since 2003); Trustee of iShares U.S. ETF Trust (since 2011). |
| Trustee (since 2011); Fixed-Income Plus Committee Chair (since 2019). | Dean, and George Pratt Shultz Professor of Accounting, University of Chicago Booth School of Business (since 2017); Advisory Board Member (since 2016) and Director (since 2020) of C.M. Capital Corporation; Chair of the Board for the Center for Research in Security Prices, LLC (since 2020); Robert K. Jaedicke Professor of Accounting, Stanford University Graduate School of Business (2001-2017); Professor of Law (by courtesy), Stanford Law School (2005-2017); Senior Associate Dean for Academic Affairs and Head of MBA Program, Stanford University Graduate School of Business (2010-2016). | Director of iShares, Inc. (since 2011); Trustee of iShares U.S. ETF Trust (since 2011). |
|
| | Principal Occupation(s)
During Past 5 Years |
| | Managing Director of BlackRock, Inc. (since 2015); Head of Global Product Solutions, Americas of BlackRock, Inc. (since 2024) and Head of Sustainable and Transition Solutions of BlackRock, Inc. (2022-2024); Global Head of Corporate Strategy of BlackRock, Inc. (2019-2022); Chief of Staff to the CEO of BlackRock, Inc. (2017-2019). |
| Treasurer and Chief Financial Officer (since 2020). | Managing Director of BlackRock, Inc. (since 2019); Chief Financial Officer of iShares Delaware Trust Sponsor LLC, BlackRock Funds, BlackRock Funds II, BlackRock Funds IV, BlackRock Funds V and BlackRock Funds VI (since 2021). |
| Chief Compliance Officer (iShares, Inc. and iShares Trust, since 2023; iShares U.S. ETF Trust, since 2023). | Managing Director of BlackRock, Inc. (since 2018); Chief Compliance Officer of the BlackRock Multi-Asset Complex, the BlackRock Fixed-Income Complex and the Exchange-Traded Fund Complex (since 2023); Deputy Chief Compliance Officer for the BlackRock Multi-Asset Complex, the BlackRock Fixed-Income Complex and the Exchange-Traded Fund Complex (2014-2023). |
| | Managing Director of BlackRock, Inc. (since 2023); Director of BlackRock, Inc. (2018-2022). |
| Executive Vice President (since 2022). | Managing Director of BlackRock, Inc. (since 2018); Head of U.S. iShares Product (since 2022); Head of EII U.S. Product Engineering of BlackRock, Inc. (since 2021); Co-Head of EII’s Americas Portfolio Engineering of BlackRock, Inc. (2020-2021); Head of Developed Markets Portfolio Engineering of BlackRock, Inc. (2016-2019). |
| Executive Vice President (since 2022). | Managing Director of BlackRock, Inc. (since 2009); Co-Head of Index Equity of BlackRock, Inc. (since 2022). |
1082024 iShares Annual Report to Shareholders
Trustee and Officer Information (unaudited) (continued)
|
| | Principal Occupation(s) During Past 5 Years |
| Executive Vice President (since 2022). | Managing Director of BlackRock, Inc. (since 2010); Head of Fixed Income Index Investments in the Americas and Head of San Francisco Core Portfolio Management of BlackRock, Inc. (since 2020). |
Effective July 1, 2023, Aaron Wasserman replaced Charles Park as Chief Compliance Officer. |
Effective February 1, 2024, Salim Ramji resigned as Trustee of the Trust. |
Effective March 5, 2024, Stephen Cohen replaced Salim Ramji as Trustee of the Trust. |
Effective March 5, 2024, Dominik Rohé resigned as President of the Trust. |
Effective March 5, 2024, Jessica Tan replaced Dominik Rohé as President of the Trust. |
Effective April 8, 2024, Laura Fergerson was appointed as Trustee of the Trust. |
Effective April 8, 2024, James Lam was appointed as Trustee of the Trust. |
Trustee and Officer Information109
Electronic Delivery
Shareholders can sign up for e-mail notifications announcing that the shareholder report or prospectus has been posted on the iShares website at iShares.com. Once you have enrolled, you will no longer receive prospectuses and shareholder reports in the mail.
To enroll in electronic delivery:
• Go to icsdelivery.com.
• If your brokerage firm is not listed, electronic delivery may not be available. Please contact your broker-dealer or financial advisor.
Householding
Householding is an option available to certain fund investors. Householding is a method of delivery, based on the preference of the individual investor, in which a single copy of certain shareholder documents and Rule 30e-3 notices can be delivered to investors who share the same address, even if their accounts are registered under different names. Please contact your broker-dealer if you are interested in enrolling in householding and receiving a single copy of prospectuses and other shareholder documents, or if you are currently enrolled in householding and wish to change your householding status.
Availability of Quarterly Schedule of Investments
The Funds file their complete schedule of portfolio holdings with the SEC for the first and third quarters of each fiscal year as an exhibit to their reports on Form N-PORT. The Funds’ Forms N-PORT are available on the SEC’s website at sec.gov. Additionally, each Fund makes its portfolio holdings for the first and third quarters of each fiscal year available at iShares.com/fundreports.
Availability of Proxy Voting Policies and Proxy Voting Records
A description of the policies and procedures that the iShares Funds use to determine how to vote proxies relating to portfolio securities and information about how the iShares Funds voted proxies relating to portfolio securities during the most recent twelve-month period ending June 30 is available without charge, upon request (1) by calling toll-free 1-800-474-2737; (2) on the iShares website at iShares.com; and (3) on the SEC website at sec.gov.
A description of the Trust’s policies and procedures with respect to the disclosure of the Fund’s portfolio securities is available in the Fund Prospectus. The Fund discloses its portfolio holdings daily and provides information regarding its top holdings in Fund fact sheets at iShares.com.
1102024 iShares Annual Report to Shareholders
Glossary of Terms Used in this Report
|
| American Depositary Receipt |
| Non-Voting Depositary Receipt |
| |
| Public Joint Stock Company |
| Real Estate Investment Trust |
Glossary of Terms Used in this Report111
THIS PAGE INTENTIONALLY LEFT BLANK.
THIS PAGE INTENTIONALLY LEFT BLANK.
THIS PAGE INTENTIONALLY LEFT BLANK.
THIS PAGE INTENTIONALLY LEFT BLANK.
Want to know more?
iShares.com | 1-800-474-2737
This report is intended for the Funds’ shareholders. It may not be distributed to prospective investors unless it is preceded or accompanied by the current prospectus.
Investing involves risk, including possible loss of principal.
The iShares Funds are distributed by BlackRock Investments, LLC (together with its affiliates, “BlackRock”).
The iShares Funds are not sponsored, endorsed, issued, sold or promoted by ICE Data Indices, LLC, FTSE International Limited, India Index Services & Products Ltd., Morningstar Inc. or S&P Dow Jones Indices LLC, nor do these companies make any representation regarding the advisability of investing in the iShares Funds. BlackRock is not affiliated with the companies listed above.
©2024 BlackRock, Inc. All rights reserved. iSHARES and BLACKROCK are registered trademarks of BlackRock, Inc. or its subsidiaries. All other marks are the property of their respective owners.
|
• iShares JPX-Nikkei 400 ETF | JPXN | NYSE Arca |
|

Rob Kapito
President, BlackRock Inc.
Dear Shareholder,
The combination of continued economic growth and cooling inflation provided a supportive backdrop for investors during the 12-month reporting period ended March 31, 2024. Higher interest rates helped to rein in inflation, and the Consumer Price Index decelerated substantially while remaining above pre-pandemic levels. A moderating labor market helped ease inflationary pressure, although wages continued to grow. Wage and job growth powered robust consumer spending, backstopping the economy. On October 7, 2023, Hamas launched a horrific attack on Israel. The ensuing war has had a significant humanitarian impact and could lead to heightened economic and market volatility. We see geopolitics as a structural market risk going forward. See our geopolitical risk dashboard at blackrock.com for more details.
Equity returns were robust during the period, as interest rates stabilized and the economy proved to be more resilient than many investors expected. The U.S. economy continued to show strength, and growth further accelerated in the second half of 2023. Large-capitalization U.S. stocks posted particularly substantial gains, supported by the performance of a few notable technology companies, while small-capitalization U.S. stocks’ advance was slower but still robust. Meanwhile, international developed market equities also gained strongly, while emerging market stocks advanced at a more modest pace.
The 10-year U.S. Treasury yield rose during the reporting period, as investors reacted to elevated inflation and attempted to anticipate future interest rate changes. However, higher yields drove positive returns overall for 10-year U.S. Treasuries and solid gains in shorter-duration U.S. Treasuries. The corporate bond market benefited from improving economic sentiment, although high-yield corporate bond prices fared significantly better than investment-grade bonds as demand from yield-seeking investors remained strong.
The U.S. Federal Reserve (the “Fed”), attempting to manage persistent inflation, raised interest rates twice during the 12-month period, but paused its tightening after its July meeting. The Fed also continued to reduce its balance sheet by not replacing some of the securities that reach maturity.
Supply constraints appear to have become an embedded feature of the new macroeconomic environment, making it difficult for developed economies to increase production without sparking higher inflation. Geopolitical fragmentation and an aging population risk further exacerbating these constraints, keeping the labor market tight and wage growth high. Although the Fed has stopped tightening for now, we believe that the new economic regime means that the Fed will need to maintain high rates for an extended period despite the market’s hopes for rapid interest rate cuts, as reflected in the ongoing rally. In this new regime, we anticipate greater volatility and dispersion of returns, creating more opportunities for selective portfolio management.
Looking at developed market stocks, we have an overweight stance on U.S. stocks overall, particularly given the promise of emerging AI technologies. We are also overweight Japanese stocks as shareholder-friendly policies generate increased investor interest, although we maintain an underweight stance on European stocks. In credit, there are selective opportunities in the near term despite tighter credit and financial conditions. For fixed income investing with a six- to twelve-month horizon, we see the most attractive investments in short-term U.S. Treasuries and hard-currency emerging market bonds.
Overall, our view is that investors need to think globally, position themselves to be prepared for a decarbonizing economy, and be nimble as market conditions change. We encourage you to talk with your financial advisor and visit iShares.com for further insight about investing in today’s markets.
Rob Kapito
President, BlackRock Inc.
Total Returns as of March 31, 2024 |
| | |
U.S. large cap equities
(S&P 500® Index) | | |
U.S. small cap equities
(Russell 2000® Index) | | |
International equities
(MSCI Europe, Australasia, Far East Index) | | |
Emerging market equities
(MSCI Emerging Markets Index) | | |
3-month Treasury bills
(ICE BofA 3-Month U.S. Treasury Bill Index) | | |
U.S. Treasury securities
(ICE BofA 10-Year U.S. Treasury Index) | | |
U.S. investment grade bonds
(Bloomberg U.S. Aggregate Bond Index) | | |
Tax-exempt municipal bonds
(Bloomberg Municipal Bond Index) | | |
U.S. high yield bonds
(Bloomberg U.S. Corporate High Yield 2% Issuer Capped Index) | | |
Past performance is not an indication of future results. Index performance is shown for illustrative purposes only. You cannot invest directly in an index. |
2This Page is not Part of Your Fund Report
iShares Trust
Global Market Overview
Global equity markets advanced during the 12 months ended March 31, 2024 (“reporting period”), supported by continued economic growth and moderating inflation in most parts of the world. The MSCI ACWI, a broad global equity index that includes both developed and emerging markets, returned 23.22% in U.S. dollar terms for the reporting period. Despite concerns about the impact of higher interest rates and rising prices, the global economy was resilient, posting moderate growth in 2023 at a similar pace to the prior year. Inflation began to subside in most regions of the world, as stabilizing energy prices and improved supply chains reduced pressure on consumers. However, geopolitical tensions were high during the reporting period, raising concerns about global economic disruptions from wars in Ukraine and Gaza. Following a terrorist attack on Israel by Hamas, Israel’s retaliation in Gaza and the resulting humanitarian impact raised tensions in the region, leading to counterstrikes between Israel, the U.S., and regional militant organizations. The events raised concerns among market participants that further escalation could lead to a broad regional war.
Among developed economies, the U.S. stood out, growing at a robust pace in 2023 despite elevated interest rates and persistent inflation. The U.S. consumer helped to power the expansion, as consumer spending continued to grow in both nominal and real (inflation-adjusted) terms. A strong labor market bolstered consumer spending, as employers continued to add jobs and average hourly wages increased notably. Consumer spending was also supported by higher asset values, as both home prices and strong equity performance increased household net worth. While improved supply chains eased goods inflation, the tight labor market kept labor costs near record highs, and growing services inflation was a significant driver of inflation’s overall persistence.
To counteract inflation, the U.S. Federal Reserve Bank (“Fed”) raised interest rates twice early in the reporting period, reaching the highest level since 2001. However, the Fed paused its interest rate increases thereafter as inflation edged down, keeping interest rates steady following its July 2023 meeting. The Fed also continued to decrease the size of its balance sheet by reducing the store of U.S. Treasuries it had accumulated to stabilize markets in the early phases of the coronavirus pandemic. Projections released by the Fed late in the reporting period included several interest rate decreases later in 2024, as it forecast that inflation would continue to moderate despite the robust economy.
European stocks posted strong gains as energy prices stabilized and inflation decelerated sharply. While growth in the Eurozone was nearly flat, the tepid economy meant that consumer spending was moderate, resulting in less upward pressure on prices. The European Central Bank (“ECB”) raised interest rates four times in the first half of the reporting period but declined to increase interest rates thereafter, citing progress in lowering inflation.
Asia-Pacific region stocks also advanced, albeit at a slower pace than other regions of the world. Japan returned to moderate growth in the fourth quarter of 2023 following a contraction in the third quarter. Solid exports, rising profits, and a series of corporate reforms bolstered Japanese equities. However, Chinese stocks were negatively impacted by investor concerns about government regulations and rising geopolitical tensions with the U.S. Meanwhile, emerging market stocks gained, helped by the pausing of interest rate increases from the Fed and the ECB. Stocks in India advanced significantly amid strong economic growth and robust corporate earnings, as India’s expanding middle class bolstered consumer spending.
42024 iShares Annual Report to Shareholders
Fund Summary as of March 31, 2024
iShares® JPX-Nikkei 400 ETF
Investment Objective
The iShares JPX-Nikkei 400 ETF (the “Fund”) seeks to track the investment results of a broad-based benchmark composed of Japanese equities, as represented by the JPX-Nikkei Index 400 (the “Index”). The Fund invests in a representative sample of securities included in the Index that collectively has an investment profile similar to the Index. Due to the use of representative sampling, the Fund may or may not hold all of the securities that are included in the Index.
Performance
| Average Annual Total Returns | | |
| | | | | | | |
| | | | | | | |
| | | | | | | |
| | | | | | | |
GROWTH OF $10,000 INVESTMENT(AT NET ASSET VALUE)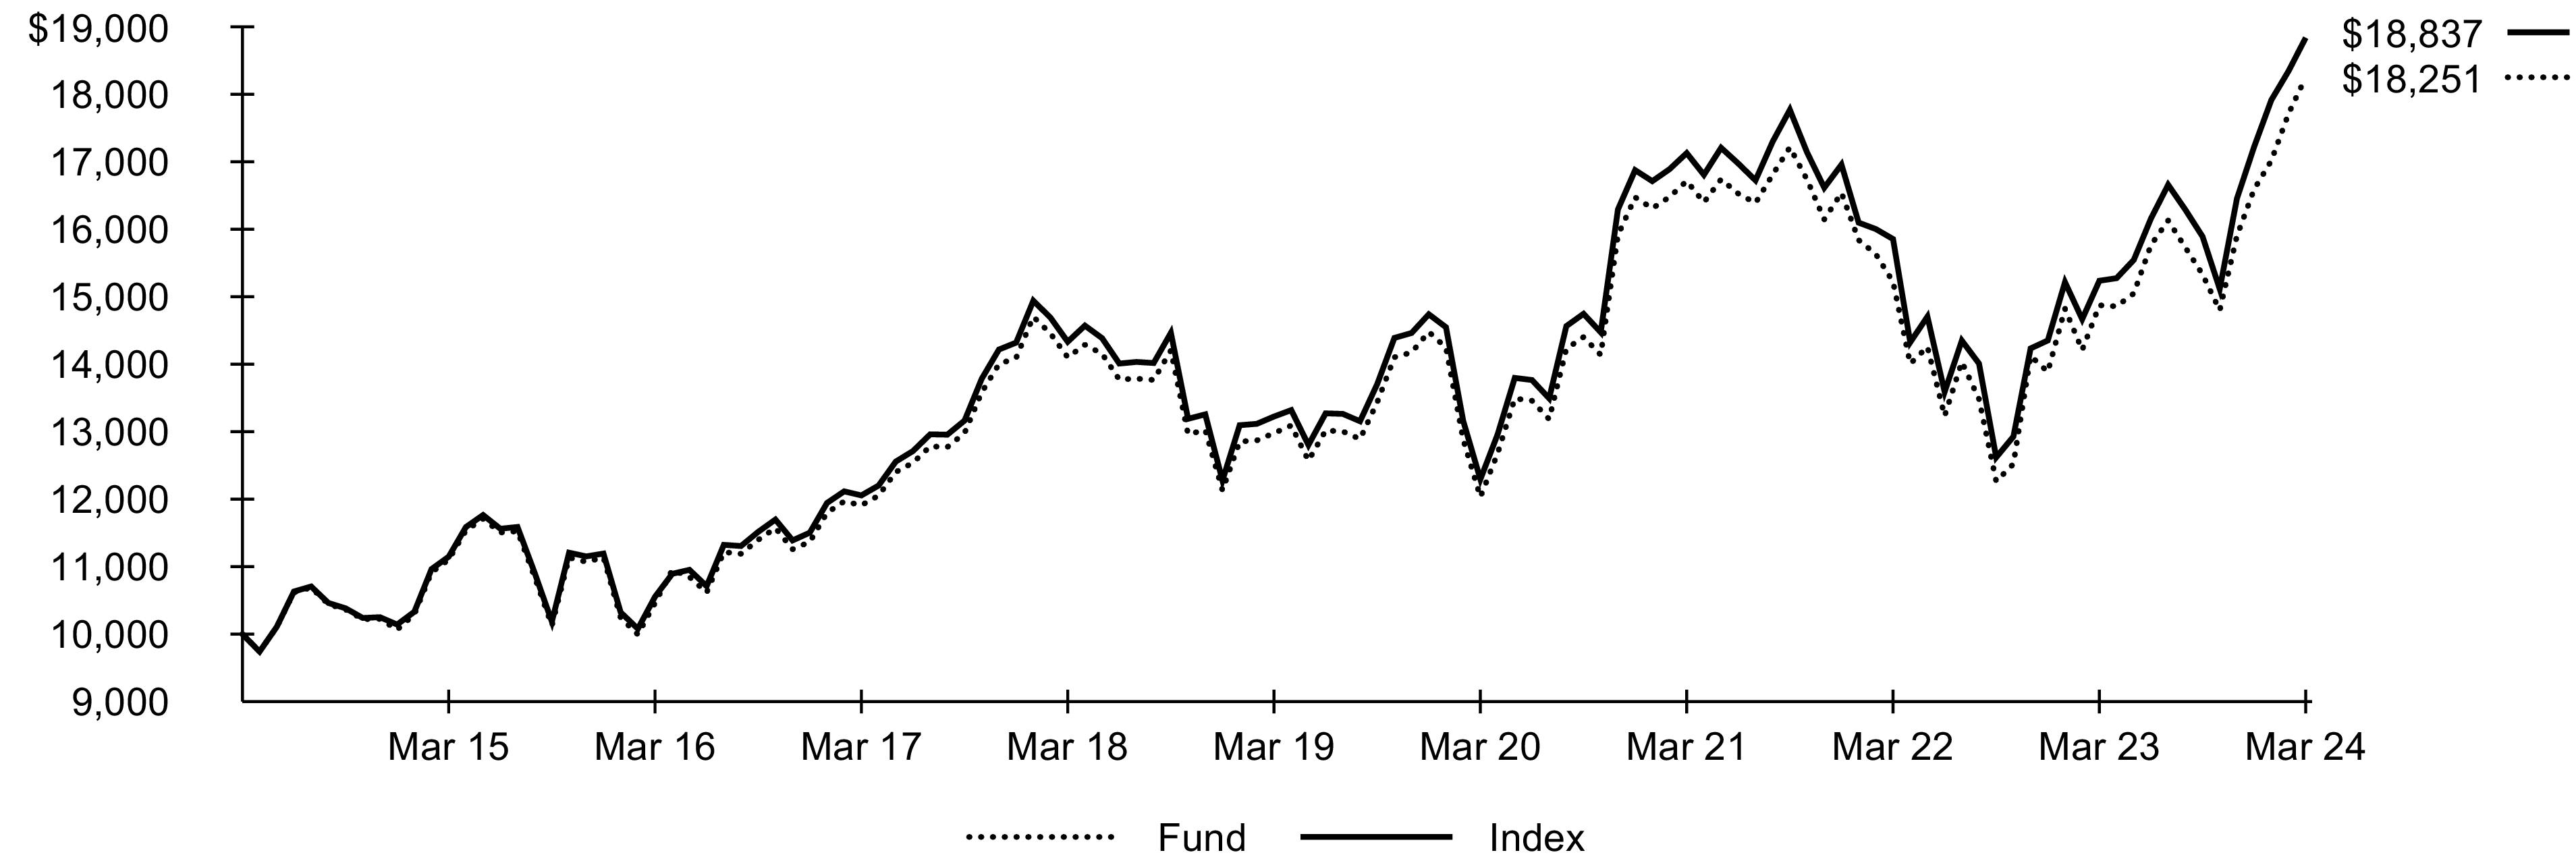
Index performance through September 3, 2015 reflects the performance of the S&P/TOPIX 150TM. Index performance beginning on September 4, 2015 reflects the performance of the JPX-Nikkei Index 400.
Past performance is not an indication of future results. Performance results do not reflect the deduction of taxes that a shareholder would pay on fund distributions or on the redemption or sale of fund shares. See “About Fund Performance” for more information.
Expense Example
| | |
Beginning
Account Value
(10/01/23) | Ending
Account Value
(03/31/24) | | Beginning
Account Value
(10/01/23) | Ending
Account Value
(03/31/24) | | |
| | | | | | |
| Expenses are equal to the annualized expense ratio, multiplied by the average account value over the period, multiplied by 183/366 (to reflect the one-half year period shown). Other fees, such as brokerage commissions and other fees to financial intermediaries, may be paid which are not reflected in the tables and examples above. See “Disclosure of Expenses” for more information. |
Fund Summary as of March 31, 2024 (continued)
iShares® JPX-Nikkei 400 ETF
Portfolio Management Commentary
Japanese equities advanced during the reporting period amid an improved economic environment. Japan’s economy returned to modest growth in the fourth quarter of 2023 and the country’s exports increased even as the Bank of Japan (“BOJ”) raised interest rates for the first time in 17 years. Robust corporate earnings and a depreciation in the Japanese yen further supported equity gains.
Japan’s industrials sector contributed the most to the Index’s performance, led by the trading companies and distributors industry. Companies in the industry with business segments tied to commodities reported significant profit gains in the wake of surging energy prices. These higher profits, derived in part from natural gas operations, enabled stock repurchases that boosted investor sentiment. The Japanese machinery industry also advanced, as manufacturers of defense equipment benefited from increased defense spending by Japan to counter potential threats from China and North Korea.
The financials sector contributed significantly to the Index’s performance, as the banking industry posted strong gains amid shifting policy from the BOJ. In addition to raising interest rates, the BOJ altered its yield curve control policy (which it used to keep bond prices within a designated range), allowing bond yields to rise. The higher interest rates benefited Japanese banks by increasing their yields on deposits. Higher bond yields also drove gains in the Japanese insurance industry, as interest earned on bonds represents an important source of income for insurers.
The Japanese information technology sector also contributed, led by semiconductor materials and equipment companies, as growing adoption of artificial intelligence drove higher demand for semiconductor manufacturing hardware. Greater demand from China for chipmaking tools amid U.S. export restrictions on the industry also played a key role in the industry’s gains.
Portfolio Information
TEN LARGEST HOLDINGS
| |
| |
| |
| |
| |
Shin-Etsu Chemical Co. Ltd. | |
Recruit Holdings Co. Ltd. | |
Mitsubishi UFJ Financial Group Inc. | |
| |
Sumitomo Mitsui Financial Group Inc. | |
Tokio Marine Holdings Inc. | |
| Excludes money market funds. |
62024 iShares Annual Report to Shareholders
Past performance is not an indication of future results. Financial markets have experienced extreme volatility and trading in many instruments has been disrupted. These circumstances may continue for an extended period of time and may continue to affect adversely the value and liquidity of the Fund’s investments. As a result, current performance may be lower or higher than the performance data quoted. Performance data current to the most recent month-end is available at iShares.com. Performance results assume reinvestment of all dividends and capital gain distributions and do not reflect the deduction of taxes that a shareholder would pay on fund distributions or on the redemption or sale of fund shares. The investment return and principal value of shares will vary with changes in market conditions. Shares may be worth more or less than their original cost when they are redeemed or sold in the market. Performance for certain funds may reflect a waiver of a portion of investment advisory fees. Without such a waiver, performance would have been lower.
Net asset value or “NAV” is the value of one share of a fund as calculated in accordance with the standard formula for valuing mutual fund shares. Beginning August 10, 2020, the price used to calculate market return (“Market Price”) is the closing price. Prior to August 10, 2020, Market Price was determined using the midpoint between the highest bid and the lowest ask on the primary stock exchange on which shares of a fund are listed for trading, as of the time that such fund’s NAV is calculated. Market and NAV returns assume that dividends and capital gain distributions have been reinvested at Market Price and NAV, respectively.
An index is a statistical composite that tracks a specified financial market or sector. Unlike a fund, an index does not actually hold a portfolio of securities and therefore does not incur the expenses incurred by a fund. These expenses negatively impact fund performance. Also, index returns do not include brokerage commissions that may be payable on secondary market transactions. If brokerage commissions were included, index returns would be lower.
Disclosure of Expenses
Shareholders of the Fund may incur the following charges: (1) transactional expenses, including brokerage commissions on purchases and sales of fund shares and (2) ongoing expenses, including management fees and other fund expenses. The expense example shown (which is based on a hypothetical investment of $1,000 invested at the beginning of the period and held through the end of the period) is intended to assist shareholders both in calculating expenses based on an investment in the Fund and in comparing these expenses with similar costs of investing in other funds.
The expense example provides information about actual account values and actual expenses. Annualized expense ratios reflect contractual and voluntary fee waivers, if any. In order to estimate the expenses a shareholder paid during the period covered by this report, shareholders can divide their account value by $1,000 and then multiply the result by the number under the heading entitled “Expenses Paid During the Period.”
The expense example also provides information about hypothetical account values and hypothetical expenses based on a fund’s actual expense ratio and an assumed rate of return of 5% per year before expenses. In order to assist shareholders in comparing the ongoing expenses of investing in the Fund and other funds, compare the 5% hypothetical example with the 5% hypothetical examples that appear in the shareholder reports of the other funds.
The expenses shown in the expense example are intended to highlight shareholders’ ongoing costs only and do not reflect any transactional expenses, such as brokerage commissions and other fees paid on purchases and sales of fund shares. Therefore, the hypothetical example is useful in comparing ongoing expenses only and will not help shareholders determine the relative total expenses of owning different funds. If these transactional expenses were included, shareholder expenses would have been higher.
About Fund Performance/Disclosure of Expenses7
Schedule of InvestmentsMarch 31, 2024
iShares® JPX-Nikkei 400 ETF(Percentages shown are based on Net Assets)
| | |
|
Air Freight & Logistics — 0.4% |
AZ-COM MARUWA Holdings Inc. | | |
Mitsui-Soko Holdings Co. Ltd. | | |
Nippon Express Holdings Inc. | | |
| | |
| | |
Senko Group Holdings Co. Ltd. | | |
| | |
| | |
| | |
Automobile Components — 2.6% |
| | |
| | |
| | |
Koito Manufacturing Co. Ltd. | | |
| | |
| | |
| | |
Sumitomo Electric Industries Ltd. | | |
Sumitomo Rubber Industries Ltd. | | |
| | |
| | |
| | |
Yokohama Rubber Co. Ltd. (The) | | |
| | |
|
| | |
| | |
| | |
| | |
| | |
| | |
| | |
| | |
|
| | |
Concordia Financial Group Ltd. | | |
Fukuoka Financial Group Inc. | | |
Mebuki Financial Group Inc. | | |
Mitsubishi UFJ Financial Group Inc. | | |
Mizuho Financial Group Inc. | | |
| | |
| | |
Sumitomo Mitsui Financial Group Inc. | | |
Sumitomo Mitsui Trust Holdings Inc. | | |
| | |
|
Asahi Group Holdings Ltd. | | |
| | |
Suntory Beverage & Food Ltd. | | |
| | |
| | |
|
| | |
| | |
| | |
|
| | |
| | |
Pan Pacific International Holdings Corp. | | |
| | |
Broadline Retail (continued) |
| | |
| | |
| | |
|
| | |
| | |
| | |
| | |
| | |
| | |
|
Daiwa Securities Group Inc. | | |
| | |
Japan Exchange Group Inc. | | |
| | |
| | |
| | |
| | |
|
| | |
| | |
| | |
| | |
| | |
| | |
| | |
| | |
| | |
| | |
| | |
Mitsubishi Chemical Group Corp. | | |
Mitsubishi Gas Chemical Co. Inc. | | |
| | |
Nippon Paint Holdings Co. Ltd. | | |
Nippon Sanso Holdings Corp. | | |
| | |
| | |
| | |
Shin-Etsu Chemical Co. Ltd. | | |
Sumitomo Bakelite Co. Ltd. | | |
Sumitomo Chemical Co. Ltd. | | |
| | |
| | |
Tokyo Ohka Kogyo Co. Ltd. | | |
| | |
| | |
| | |
| | |
Commercial Services & Supplies — 0.5% |
| | |
Japan Elevator Service Holdings Co. Ltd. | | |
| | |
| | |
Sohgo Security Services Co. Ltd. | | |
| | |
Construction & Engineering — 1.1% |
| | |
| | |
| | |
| | |
| | |
82024 iShares Annual Report to Shareholders
Schedule of Investments (continued)March 31, 2024
iShares® JPX-Nikkei 400 ETF(Percentages shown are based on Net Assets)
| | |
Construction & Engineering (continued) |
| | |
| | |
| | |
| | |
| | |
SHO-BOND Holdings Co. Ltd. | | |
| | |
| | |
|
| | |
AEON Financial Service Co. Ltd. | | |
| | |
| | |
| | |
Consumer Staples Distribution & Retail — 1.6% |
Cosmos Pharmaceutical Corp. | | |
Create SD Holdings Co. Ltd. | | |
| | |
Kusuri no Aoki Holdings Co. Ltd. | | |
| | |
| | |
| | |
Seven & i Holdings Co. Ltd. | | |
| | |
| | |
| | |
| | |
| | |
| | |
Containers & Packaging — 0.0% |
| | |
|
| | |
Diversified Telecommunication Services — 1.3% |
Internet Initiative Japan Inc. | | |
Nippon Telegraph & Telephone Corp. | | |
| | |
| | |
Electric Utilities — 0.5% |
Chubu Electric Power Co. Inc. | | |
Kansai Electric Power Co. Inc. (The) | | |
| | |
Electrical Equipment — 1.7% |
| | |
Mitsubishi Electric Corp. | | |
| | |
| | |
Electronic Equipment, Instruments & Components — 4.5% |
| | |
| | |
Canon Marketing Japan Inc. | | |
Daiwabo Holdings Co. Ltd. | | |
| | |
| | |
| | |
| | |
| | |
Kaga Electronics Co. Ltd. | | |
| | |
| | |
Electronic Equipment, Instruments & Components (continued) |
| | |
| | |
Murata Manufacturing Co. Ltd. | | |
| | |
| | |
| | |
| | |
| | |
| | |
|
| | |
GungHo Online Entertainment Inc. | | |
Koei Tecmo Holdings Co. Ltd. | | |
| | |
| | |
| | |
Square Enix Holdings Co. Ltd. | | |
| | |
| | |
Financial Services — 1.1% |
Fuyo General Lease Co. Ltd. | | |
| | |
Mitsubishi HC Capital Inc. | | |
| | |
| | |
| | |
| | |
| | |
|
| | |
| | |
| | |
| | |
| | |
Morinaga Milk Industry Co. Ltd. | | |
| | |
| | |
Nissin Foods Holdings Co. Ltd. | | |
| | |
| | |
| | |
| | |
|
| | |
| | |
| | |
| | |
Health Care Equipment & Supplies — 2.8% |
| | |
| | |
| | |
| | |
| | |
| | |
| | |
| | |
| | |
Health Care Providers & Services — 0.2% |
| | |
| | |
Schedule of Investments (continued)March 31, 2024
iShares® JPX-Nikkei 400 ETF(Percentages shown are based on Net Assets)
| | |
Health Care Providers & Services (continued) |
| | |
| | |
Ship Healthcare Holdings Inc. | | |
| | |
Health Care Technology — 0.2% |
| | |
Hotels, Restaurants & Leisure — 0.3% |
Food & Life Companies Ltd. | | |
McDonald's Holdings Co. Japan Ltd. | | |
| | |
| | |
Household Durables — 2.8% |
| | |
Iida Group Holdings Co. Ltd. | | |
Open House Group Co. Ltd. | | |
| | |
| | |
| | |
Sekisui Chemical Co. Ltd. | | |
| | |
| | |
Sumitomo Forestry Co. Ltd. | | |
| | |
Household Products — 0.5% |
| | |
| | |
| | |
| | |
Independent Power and Renewable Electricity Producers — 0.1% |
Electric Power Development Co. Ltd. | | |
| | |
| | |
| | |
| | |
Industrial Conglomerates — 2.0% |
| | |
| | |
| | |
|
Dai-ichi Life Holdings Inc. | | |
MS&AD Insurance Group Holdings Inc. | | |
| | |
Tokio Marine Holdings Inc. | | |
| | |
Interactive Media & Services — 0.2% |
| | |
| | |
| | |
|
| | |
| | |
| | |
| | |
| | |
| | |
| | |
NEC Networks & System Integration Corp. | | |
| | |
Nomura Research Institute Ltd. | | |
| | |
|
| | |
| | |
| | |
| | |
| | |
| | |
| | |
| | |
| | |
|
Bandai Namco Holdings Inc. | | |
| | |
| | |
| | |
| | |
| | |
|
| | |
| | |
| | |
| | |
| | |
| | |
Hitachi Construction Machinery Co. Ltd. | | |
| | |
| | |
| | |
| | |
| | |
| | |
| | |
Mitsubishi Heavy Industries Ltd. | | |
| | |
| | |
| | |
| | |
| | |
Sumitomo Heavy Industries Ltd. | | |
Takeuchi Manufacturing Co. Ltd. | | |
| | |
| | |
| | |
Marine Transportation — 0.9% |
Kawasaki Kisen Kaisha Ltd. | | |
| | |
| | |
| | |
|
| | |
Hakuhodo DY Holdings Inc. | | |
| | |
| | |
|
| | |
Daiki Aluminium Industry Co. Ltd. | | |
| | |
| | |
| | |
Mitsui Mining & Smelting Co. Ltd. | | |
| | |
Sumitomo Metal Mining Co. Ltd. | | |
102024 iShares Annual Report to Shareholders
Schedule of Investments (continued)March 31, 2024
iShares® JPX-Nikkei 400 ETF(Percentages shown are based on Net Assets)
| | |
Metals & Mining (continued) |
Tokyo Steel Manufacturing Co. Ltd. | | |
| | |
Oil, Gas & Consumable Fuels — 1.2% |
Cosmo Energy Holdings Co. Ltd. | | |
| | |
| | |
| | |
| | |
| | |
| | |
Paper & Forest Products — 0.1% |
| | |
Personal Care Products — 1.0% |
| | |
Kobayashi Pharmaceutical Co. Ltd. | | |
| | |
Rohto Pharmaceutical Co. Ltd. | | |
| | |
| | |
|
| | |
Chugai Pharmaceutical Co. Ltd. | | |
| | |
| | |
JCR Pharmaceuticals Co. Ltd. | | |
| | |
| | |
Ono Pharmaceutical Co. Ltd. | | |
| | |
| | |
Takeda Pharmaceutical Co. Ltd. | | |
| | |
Professional Services — 2.3% |
BayCurrent Consulting Inc. | | |
Bell System24 Holdings Inc. | | |
| | |
| | |
Fullcast Holdings Co. Ltd. | | |
MEITEC Group Holdings Inc. | | |
Nihon M&A Center Holdings Inc. | | |
| | |
Recruit Holdings Co. Ltd. | | |
| | |
| | |
| | |
| | |
| | |
Real Estate Management & Development — 2.8% |
Daito Trust Construction Co. Ltd. | | |
Daiwa House Industry Co. Ltd. | | |
| | |
| | |
Mitsubishi Estate Co. Ltd. | | |
| | |
Nomura Real Estate Holdings Inc. | | |
| | |
| | |
Sumitomo Realty & Development Co. Ltd. | | |
| | |
| | |
Real Estate Management & Development (continued) |
Tokyu Fudosan Holdings Corp. | | |
| | |
Semiconductors & Semiconductor Equipment — 6.3% |
| | |
| | |
| | |
| | |
| | |
Renesas Electronics Corp. | | |
| | |
| | |
Shinko Electric Industries Co. Ltd. | | |
| | |
| | |
| | |
| | |
| | |
|
| | |
| | |
| | |
| | |
| | |
| | |
|
| | |
| | |
| | |
| | |
| | |
| | |
| | |
| | |
| | |
| | |
| | |
| | |
| | |
| | |
| | |
Technology Hardware, Storage & Peripherals — 1.0% |
| | |
| | |
| | |
| | |
| | |
| | |
| | |
Textiles, Apparel & Luxury Goods — 0.1% |
| | |
|
| | |
Trading Companies & Distributors — 7.7% |
| | |
| | |
| | |
| | |
| | |
| | |
Schedule of Investments11
Schedule of Investments (continued)March 31, 2024
iShares® JPX-Nikkei 400 ETF(Percentages shown are based on Net Assets)
| | |
Trading Companies & Distributors (continued) |
| | |
| | |
| | |
| | |
| | |
| | |
Wireless Telecommunication Services — 3.9% |
| | |
| | |
| | |
| | |
Total Long-Term Investments — 99.0%
(Cost: $81,324,607) | |
|
Money Market Funds — 0.1% |
BlackRock Cash Funds: Institutional, SL Agency Shares, 5.50%(c)(d)(e) | | |
| | |
Money Market Funds (continued) |
BlackRock Cash Funds: Treasury, SL Agency Shares, 5.29%(c)(d) | | |
Total Short-Term Securities — 0.1%
(Cost: $116,961) | |
Total Investments — 99.1%
(Cost: $81,441,568) | |
Other Assets Less Liabilities — 0.9% | |
| |
| Non-income producing security. |
| All or a portion of this security is on loan. |
| |
| Annualized 7-day yield as of period end. |
| All or a portion of this security was purchased with the cash collateral from loaned securities. |
Affiliates
Investments in issuers considered to be affiliate(s) of the Fund during the year ended March 31, 2024 for purposes of Section 2(a)(3) of the Investment Company Act of 1940, as amended, were as follows:
| | | | | Change in
Unrealized
Appreciation
(Depreciation) | | | | Capital
Gain
Distributions
from
Underlying
Funds |
BlackRock Cash Funds: Institutional, SL Agency Shares | | | | | | | | | |
BlackRock Cash Funds: Treasury, SL Agency Shares | | | | | | | | | |
| | | | | | | | | |
| Represents net amount purchased (sold). |
| All or a portion represents securities lending income earned from the reinvestment of cash collateral from loaned securities, net of fees and collateral investment expenses, and other payments to and from borrowers of securities. |
Derivative Financial Instruments Outstanding as of Period End
Futures Contracts
| | | | Value/
Unrealized
Appreciation
(Depreciation) |
| | | | |
| | | | |
122024 iShares Annual Report to Shareholders
Schedule of Investments (continued)March 31, 2024
iShares® JPX-Nikkei 400 ETF
Derivative Financial Instruments Categorized by Risk Exposure
As of period end, the fair values of derivative financial instruments located in the Statement of Assets and Liabilities were as follows:
| | | | Foreign
Currency
Exchange
Contracts | | | |
Assets—Derivative Financial Instruments | | | | | | | |
| | | | | | | |
Unrealized appreciation on futures contracts(a) | | | | | | | |
| Net cumulative unrealized appreciation (depreciation) on futures contracts are reported in the Schedule of Investments. In the Statement of Assets and Liabilities, only current day's variation margin is reported in receivables or payables and the net cumulative unrealized appreciation (depreciation) is included in accumulated earnings (loss). |
For the period ended March 31, 2024, the effect of derivative financial instruments in the Statement of Operations was as follows:
| | | | Foreign
Currency
Exchange
Contracts | | | |
Net Realized Gain (Loss) from | | | | | | | |
| | | | | | | |
Net Change in Unrealized Appreciation (Depreciation) on | | | | | | | |
| | | | | | | |
Average Quarterly Balances of Outstanding Derivative Financial Instruments
| |
Average notional value of contracts — long | |
For more information about the Fund’s investment risks regarding derivative financial instruments, refer to the Notes to Financial Statements.
Fair Value Hierarchy as of Period End
Various inputs are used in determining the fair value of financial instruments. For a description of the input levels and information about the Fund’s policy regarding valuation of financial instruments, refer to the Notes to Financial Statements.
The following table summarizes the Fund’s financial instruments categorized in the fair value hierarchy. The breakdown of the Fund’s financial instruments into major categories is disclosed in the Schedule of Investments above.
| | | | |
| | | | |
| | | | |
| | | | |
| | | | |
| | | | |
| | | | |
| | | | |
Derivative Financial Instruments(a) | | | | |
| | | | |
| | | | |
| Derivative financial instruments are futures contracts. Futures contracts are valued at the unrealized appreciation (depreciation) on the instrument. |
See notes to financial statements.
Schedule of Investments13
Statement of Assets and LiabilitiesMarch 31, 2024
| |
| |
Investments, at value—unaffiliated(a)(b) | |
Investments, at value—affiliated(c) | |
| |
Foreign currency collateral pledged for futures contracts(d) | |
Foreign currency, at value(e) | |
| |
| |
Securities lending income—affiliated | |
| |
| |
| |
Variation margin on futures contracts | |
| |
| |
Collateral on securities loaned, at value | |
| |
| |
| |
| |
Commitments and contingent liabilities | |
| |
| |
| |
| |
| |
| |
| |
| |
| |
| |
(a) Investments, at cost—unaffiliated | |
(b) Securities loaned, at value | |
(c) Investments, at cost—affiliated | |
(d) Foreign currency collateral pledged, at cost | |
(e) Foreign currency, at cost | |
See notes to financial statements.
142024 iShares Annual Report to Shareholders
Statement of OperationsYear Ended March 31, 2024
| |
| |
| |
| |
Securities lending income—affiliated—net | |
| |
| |
| |
| |
| |
| |
| |
REALIZED AND UNREALIZED GAIN (LOSS) | |
Net realized gain (loss) from: | |
| |
| |
Foreign currency transactions | |
| |
In-kind redemptions—unaffiliated(a) | |
| |
Net change in unrealized appreciation (depreciation) on: | |
| |
| |
Foreign currency translations | |
| |
| |
Net realized and unrealized gain | |
NET INCREASE IN NET ASSETS RESULTING FROM OPERATIONS | |
(a) See Note 2 of the Notes to Financial Statements. |
See notes to financial statements.
Statements of Changes in Net Assets
| iShares
JPX-Nikkei 400 ETF |
| | |
INCREASE (DECREASE) IN NET ASSETS | | |
| | |
| | |
| | |
Net change in unrealized appreciation (depreciation) | | |
Net increase (decrease) in net assets resulting from operations | | |
DISTRIBUTIONS TO SHAREHOLDERS(a) | | |
Decrease in net assets resulting from distributions to shareholders | | |
CAPITAL SHARE TRANSACTIONS | | |
Net increase (decrease) in net assets derived from capital share transactions | | |
| | |
Total increase (decrease) in net assets | | |
| | |
| | |
| Distributions for annual periods determined in accordance with U.S. federal income tax regulations. |
See notes to financial statements.
162024 iShares Annual Report to Shareholders
Financial Highlights(For a share outstanding throughout each period)
| iShares JPX-Nikkei 400 ETF |
| | | | | |
Net asset value, beginning of year | | | | | |
| | | | | |
Net realized and unrealized gain (loss)(b) | | | | | |
Net increase (decrease) from investment operations | | | | | |
Distributions from net investment income(c) | | | | | |
Net asset value, end of year | | | | | |
| | | | | |
| | | | | |
Ratios to Average Net Assets(e) | | | | | |
| | | | | |
| | | | | |
| | | | | |
Net assets, end of year (000) | | | | | |
Portfolio turnover rate(f) | | | | | |
(a) Based on average shares outstanding. |
(b) The amounts reported for a share outstanding may not accord with the change in aggregate gains and losses in securities for the fiscal period due to the timing of capital share transactions in relation to the fluctuating market values of the Fund’s underlying securities. |
(c) Distributions for annual periods determined in accordance with U.S. federal income tax regulations. |
(d) Where applicable, assumes the reinvestment of distributions. |
(e) Excludes fees and expenses incurred indirectly as a result of investments in underlying funds. |
(f) Portfolio turnover rate excludes in-kind transactions, if any. |
See notes to financial statements.
Notes to Financial Statements
1. ORGANIZATION
iShares Trust (the “Trust”) is registered under the Investment Company Act of 1940, as amended (the “1940 Act”), as an open-end management investment company. The Trust is organized as a Delaware statutory trust and is authorized to have multiple series or portfolios.
These financial statements relate only to the following fund (the “Fund”):
| Diversification
Classification |
| |
2. SIGNIFICANT ACCOUNTING POLICIES
The financial statements are prepared in conformity with accounting principles generally accepted in the United States of America (“U.S. GAAP”), which may require management to make estimates and assumptions that affect the reported amounts of assets and liabilities in the financial statements, disclosure of contingent assets and liabilities at the date of the financial statements and the reported amounts of increases and decreases in net assets from operations during the reporting period. Actual results could differ from those estimates. The Fund is considered an investment company under U.S. GAAP and follows the accounting and reporting guidance applicable to investment companies. Below is a summary of significant accounting policies:
Investment Transactions and Income Recognition: For financial reporting purposes, investment transactions are recorded on the dates the transactions are executed. Realized gains and losses on investment transactions are determined using the specific identification method. Dividend income and capital gain distributions, if any, are recorded on the ex-dividend date. Non-cash dividends, if any, are recorded on the ex-dividend date at fair value. Dividends from foreign securities where the ex-dividend date may have passed are subsequently recorded when the Fund is informed of the ex-dividend date. Under the applicable foreign tax laws, a withholding tax at various rates may be imposed on capital gains, dividends and interest.
Foreign Currency Translation: The Fund’s books and records are maintained in U.S. dollars. Securities and other assets and liabilities denominated in foreign currencies are translated into U.S. dollars using prevailing market rates as quoted by one or more data service providers. Purchases and sales of investments are recorded at the rates of exchange prevailing on the respective dates of such transactions. Generally, when the U.S. dollar rises in value against a foreign currency, the investments denominated in that currency will lose value; the opposite effect occurs if the U.S. dollar falls in relative value.
The Fund does not isolate the effect of fluctuations in foreign exchange rates from the effect of fluctuations in the market prices of investments for financial reporting purposes. Accordingly, the effects of changes in exchange rates on investments are not segregated in the Statement of Operations from the effects of changes in market prices of those investments, but are included as a component of net realized and unrealized gain (loss) from investments. The Fund reports realized currency gains (losses) on foreign currency related transactions as components of net realized gain (loss) for financial reporting purposes, whereas such components are generally treated as ordinary income for U.S. federal income tax purposes. However, the currency hedged fund has elected to treat realized gains (losses) from certain foreign currency contracts as capital gain (loss) for U.S. federal income tax purposes.
Foreign Taxes: The Fund may be subject to foreign taxes (a portion of which may be reclaimable) on income, stock dividends, capital gains on investments, or certain foreign currency transactions. All foreign taxes are recorded in accordance with the applicable foreign tax regulations and rates that exist in the foreign jurisdictions in which the Fund invests. These foreign taxes, if any, are paid by the Fund and are reflected in its Statement of Operations as follows: foreign taxes withheld at source are presented as a reduction of income, foreign taxes on securities lending income are presented as a reduction of securities lending income, foreign taxes on stock dividends are presented as “Other foreign taxes”, and foreign taxes on capital gains from sales of investments and foreign taxes on foreign currency transactions are included in their respective net realized gain (loss) categories. Foreign taxes payable or deferred as of March 31, 2024, if any, are disclosed in the Statement of Assets and Liabilities.
The Fund files withholding tax reclaims in certain jurisdictions to recover a portion of amounts previously withheld. The Fund may record a reclaim receivable based on collectability, which includes factors such as the jurisdiction’s applicable laws, payment history and market convention. The Statement of Operations includes tax reclaims recorded as well as professional and other fees, if any, associated with recovery of foreign withholding taxes.
Collateralization: If required by an exchange or counterparty agreement, the Fund may be required to deliver/deposit cash and/or securities to/with an exchange, or broker-dealer or custodian as collateral for certain investments.
In-kind Redemptions: For financial reporting purposes, in-kind redemptions are treated as sales of securities resulting in realized capital gains or losses to the Fund. Because such gains or losses are not taxable to the Fund and are not distributed to existing Fund shareholders, the gains or losses are reclassified from accumulated net realized gain (loss) to paid-in capital at the end of the Fund’s tax year. These reclassifications have no effect on net assets or net asset value (“NAV”) per share.
Distributions: Dividends and distributions paid by the Fund are recorded on the ex-dividend dates. Distributions are determined on a tax basis and may differ from net investment income and net realized capital gains for financial reporting purposes. Dividends and distributions are paid in U.S. dollars and cannot be automatically reinvested in additional shares of the Fund.
Indemnifications: In the normal course of business, the Fund enters into contracts that contain a variety of representations that provide general indemnification. The Fund’s maximum exposure under these arrangements is unknown because it involves future potential claims against the Fund, which cannot be predicted with any certainty.
182024 iShares Annual Report to Shareholders
Notes to Financial Statements (continued)
3. INVESTMENT VALUATION AND FAIR VALUE MEASUREMENTS
Investment Valuation Policies: The Fund’s investments are valued at fair value (also referred to as “market value” within the financial statements) each day that the Fund’s listing exchange is open and, for financial reporting purposes, as of the report date. U.S. GAAP defines fair value as the price a fund would receive to sell an asset or pay to transfer a liability in an orderly transaction between market participants at the measurement date. The Board of Trustees of the Trust (the “Board”) of the Fund has approved the designation of BlackRock Fund Advisors (“BFA”), the Fund’s investment adviser, as the valuation designee for the Fund. The Fund determines the fair values of its financial instruments using various independent dealers or pricing services under BFA’s policies. If a security’s market price is not readily available or does not otherwise accurately represent the fair value of the security, the security will be valued in accordance with BFA’s policies and procedures as reflecting fair value. BFA has formed a committee (the “Valuation Committee”) to develop pricing policies and procedures and to oversee the pricing function for all financial instruments, with assistance from other BlackRock pricing committees.
Fair Value Inputs and Methodologies: The following methods and inputs are used to establish the fair value of the Fund’s assets and liabilities:
• Equity investments traded on a recognized securities exchange are valued at that day’s official closing price, as applicable, on the exchange where the stock is primarily traded. Equity investments traded on a recognized exchange for which there were no sales on that day are valued at the last traded price.
• Investments in open-end U.S. mutual funds (including money market funds) are valued at that day’s published NAV.
• Futures contracts are valued based on that day’s last reported settlement or trade price on the exchange where the contract is traded.
Generally, trading in foreign instruments is substantially completed each day at various times prior to the close of trading on the New York Stock Exchange (“NYSE”). Each business day, the Fund uses current market factors supplied by independent pricing services to value certain foreign instruments (“Systematic Fair Value Price”). The Systematic Fair Value Price is designed to value such foreign securities at fair value as of the close of trading on the NYSE, which follows the close of the local markets.
If events (e.g., market volatility, company announcement or a natural disaster) occur that are expected to materially affect the value of such investment, or in the event that application of these methods of valuation results in a price for an investment that is deemed not to be representative of the market value of such investment, or if a price is not available, the investment will be valued by the Valuation Committee, in accordance with BFA’s policies and procedures as reflecting fair value (“Fair Valued Investments”). The fair valuation approaches that may be used by the Valuation Committee include market approach, income approach and cost approach. Valuation techniques such as discounted cash flow, use of market comparables and matrix pricing are types of valuation approaches and are typically used in determining fair value. When determining the price for Fair Valued Investments, the Valuation Committee seeks to determine the price that the Fund might reasonably expect to receive or pay from the current sale or purchase of that asset or liability in an arm’s-length transaction. Fair value determinations shall be based upon all available factors that the Valuation Committee deems relevant and consistent with the principles of fair value measurement.
Fair value pricing could result in a difference between the prices used to calculate a fund’s NAV and the prices used by the fund’s underlying index, which in turn could result in a difference between the fund’s performance and the performance of the fund’s underlying index.
Fair Value Hierarchy: Various inputs are used in determining the fair value of financial instruments. These inputs to valuation techniques are categorized into a fair value hierarchy consisting of three broad levels for financial reporting purposes as follows:
• Level 1 – Unadjusted price quotations in active markets/exchanges for identical assets or liabilities that the Fund has the ability to access;
• Level 2 – Other observable inputs (including, but not limited to, quoted prices for similar assets or liabilities in markets that are active, quoted prices for identical or similar assets or liabilities in markets that are not active, inputs other than quoted prices that are observable for the assets or liabilities (such as interest rates, yield curves, volatilities, prepayment speeds, loss severities, credit risks and default rates) or other market-corroborated inputs); and
• Level 3 – Unobservable inputs based on the best information available in the circumstances, to the extent observable inputs are not available, (including the Valuation Committee’s assumptions used in determining the fair value of financial instruments).
The hierarchy gives the highest priority to unadjusted quoted prices in active markets for identical assets or liabilities (Level 1 measurements) and the lowest priority to unobservable inputs (Level 3 measurements). Accordingly, the degree of judgment exercised in determining fair value is greatest for instruments categorized in Level 3. The inputs used to measure fair value may fall into different levels of the fair value hierarchy. In such cases, for disclosure purposes, the fair value hierarchy classification is determined based on the lowest level input that is significant to the fair value measurement in its entirety. Investments classified within Level 3 have significant unobservable inputs used by the Valuation Committee in determining the price for Fair Valued Investments. Level 3 investments include equity or debt issued by privately held companies or funds that may not have a secondary market and/or may have a limited number of investors. The categorization of a value determined for financial instruments is based on the pricing transparency of the financial instruments and is not necessarily an indication of the risks associated with investing in those securities.
4. SECURITIES AND OTHER INVESTMENTS
Securities Lending: The Fund may lend its securities to approved borrowers, such as brokers, dealers and other financial institutions. The borrower pledges and maintains with the Fund collateral consisting of cash, an irrevocable letter of credit issued by an approved bank, or securities issued or guaranteed by the U.S. government. The initial collateral received by the Fund is required to have a value of at least 102% of the current market value of the loaned securities for securities traded on U.S. exchanges and a value of at least 105% for all other securities. The collateral is maintained thereafter at a value equal to at least 100% of the current value of the securities on loan. The market value of the loaned securities is determined at the close of each business day of the Fund and any additional required collateral is delivered to the Fund or excess
Notes to Financial Statements19
Notes to Financial Statements (continued)
collateral is returned by the Fund, on the next business day. During the term of the loan, the Fund is entitled to all distributions made on or in respect of the loaned securities but does not receive interest income on securities received as collateral. Loans of securities are terminable at any time and the borrower, after notice, is required to return borrowed securities within the standard time period for settlement of securities transactions.
As of period end, any securities on loan were collateralized by cash and/or U.S. Government obligations. Cash collateral invested in money market funds managed by BFA, or its affiliates is disclosed in the Schedule of Investments. Any non-cash collateral received cannot be sold, re-invested or pledged by the Fund, except in the event of borrower default. The securities on loan, if any, are also disclosed in the Fund’s Schedule of Investments. The market value of any securities on loan and the value of any related cash collateral are disclosed in the Statement of Assets and Liabilities.
Securities lending transactions are entered into by the Fund under Master Securities Lending Agreements (each, an “MSLA”) which provide the right, in the event of default (including bankruptcy or insolvency) for the non-defaulting party to liquidate the collateral and calculate a net exposure to the defaulting party or request additional collateral. In the event that a borrower defaults, the Fund, as lender, would offset the market value of the collateral received against the market value of the securities loaned. When the value of the collateral is greater than that of the market value of the securities loaned, the lender is left with a net amount payable to the defaulting party. However, bankruptcy or insolvency laws of a particular jurisdiction may impose restrictions on or prohibitions against such a right of offset in the event of an MSLA counterparty’s bankruptcy or insolvency. Under the MSLA, absent an event of default, the borrower can resell or re-pledge the loaned securities, and the Fund can reinvest cash collateral received in connection with loaned securities. Upon an event of default, the parties’ obligations to return the securities or collateral to the other party are extinguished, and the parties can resell or re-pledge the loaned securities or the collateral received in connection with the loaned securities in order to satisfy the defaulting party’s net payment obligation for all transactions under the MSLA. The defaulting party remains liable for any deficiency.
As of period end, the following table is a summary of the securities on loan by counterparty which are subject to offset under an MSLA:
iShares ETF and Counterparty | Securities Loaned
at Value | | Non-Cash Collateral
Received, at Fair Value(a) | |
| | | | |
J.P. Morgan Securities LLC | | | | |
| | | | |
| | | | |
Nomura Securities International, Inc. | | | | |
| | | | |
| Collateral received, if any, in excess of the market value of securities on loan is not presented in this table. The total cash collateral received by the Fund is disclosed in the Fund’s Statements of Assets and Liabilities. |
The risks of securities lending include the risk that the borrower may not provide additional collateral when required or may not return the securities when due. To mitigate these risks, the Fund benefits from a borrower default indemnity provided by BlackRock, Inc. (“BlackRock”). BlackRock’s indemnity allows for full replacement of the securities loaned to the extent the collateral received does not cover the value of the securities loaned in the event of borrower default. The Fund could incur a loss if the value of an investment purchased with cash collateral falls below the market value of the loaned securities or if the value of an investment purchased with cash collateral falls below the value of the original cash collateral received. Such losses are borne entirely by the Fund.
5. DERIVATIVE FINANCIAL INSTRUMENTS
Futures Contracts: Futures contracts are purchased or sold to gain exposure to, or manage exposure to, changes in interest rates (interest rate risk) and changes in the value of equity securities (equity risk) or foreign currencies (foreign currency exchange rate risk).
Futures contracts are exchange-traded agreements between the Fund and a counterparty to buy or sell a specific quantity of an underlying instrument at a specified price and on a specified date. Depending on the terms of a contract, it is settled either through physical delivery of the underlying instrument on the settlement date or by payment of a cash amount on the settlement date. Upon entering into a futures contract, the Fund is required to deposit initial margin with the broker in the form of cash or securities in an amount that varies depending on a contract’s size and risk profile. The initial margin deposit must then be maintained at an established level over the life of the contract. Amounts pledged, which are considered restricted, are included in cash pledged for futures contracts in the Statement of Assets and Liabilities.
Securities deposited as initial margin are designated in the Schedule of Investments and cash deposited, if any, are shown as cash pledged for futures contracts in the Statement of Assets and Liabilities. Pursuant to the contract, the Fund agrees to receive from or pay to the broker an amount of cash equal to the daily fluctuation in market value of the contract (“variation margin”). Variation margin is recorded as unrealized appreciation (depreciation) and, if any, shown as variation margin receivable (or payable) on futures contracts in the Statement of Assets and Liabilities. When the contract is closed, a realized gain or loss is recorded in the Statement of Operations equal to the difference between the notional amount of the contract at the time it was opened and the notional amount at the time it was closed. The use of futures contracts involves the risk of an imperfect correlation in the movements in the price of futures contracts and interest rates, foreign currency exchange rates or underlying assets.
202024 iShares Annual Report to Shareholders
Notes to Financial Statements (continued)
6. INVESTMENT ADVISORY AGREEMENT AND OTHER TRANSACTIONS WITH AFFILIATES
Investment Advisory Fees: Pursuant to an Investment Advisory Agreement with the Trust, BFA manages the investment of the Fund’s assets. BFA is a California corporation indirectly owned by BlackRock. Under the Investment Advisory Agreement, BFA is responsible for substantially all expenses of the Fund, except (i) interest and taxes; (ii) brokerage commissions and other expenses connected with the execution of portfolio transactions; (iii) distribution fees; (iv) the advisory fee payable to BFA; and (v) litigation expenses and any extraordinary expenses (in each case as determined by a majority of the independent trustees).
For its investment advisory services to the Fund, BFA is entitled to an annual investment advisory fee of 0.48%, accrued daily and paid monthly by the Fund, based on the average daily net assets of the Fund.
Distributor: BlackRock Investments, LLC, an affiliate of BFA, is the distributor for the Fund. Pursuant to the distribution agreement, BFA is responsible for any fees or expenses for distribution services provided to the Fund.
Securities Lending: The U.S. Securities and Exchange Commission (the “SEC”) has issued an exemptive order which permits BlackRock Institutional Trust Company, N.A. (“BTC”), an affiliate of BFA, to serve as securities lending agent for the Fund, subject to applicable conditions. As securities lending agent, BTC bears all operational costs directly related to securities lending, including any custodial costs. The Fund is responsible for fees in connection with the investment of cash collateral received for securities on loan (the “collateral investment fees”). The cash collateral is invested in a money market fund, BlackRock Cash Funds: Institutional or BlackRock Cash Funds: Treasury, managed by BFA, or its affiliates. However, BTC has agreed to reduce the amount of securities lending income it receives in order to effectively limit the collateral investment fees the Fund bears to an annual rate of 0.04%. The SL Agency Shares of such money market fund will not be subject to a sales load, redemption fee, distribution fee or service fee. The money market fund in which the cash collateral has been invested may, under certain circumstances, impose a liquidity fee of up to 2% of the value redeemed or temporarily restrict redemptions for up to 10 business days during a 90 day period, in the event that the money market fund’s weekly liquid assets fall below certain thresholds.
Securities lending income is generally equal to the total of income earned from the reinvestment of cash collateral (and excludes collateral investment fees), and any fees or other payments to and from borrowers of securities. The Fund retains a portion of the securities lending income and remits the remaining portion to BTC as compensation for its services as securities lending agent.
Pursuant to the current securities lending agreement, the Fund retains 82% of securities lending income (which excludes collateral investment fees), and the amount retained can never be less than 70% of the total of securities lending income plus the collateral investment fees.
In addition, commencing the business day following the date that the aggregate securities lending income plus the collateral investment fees generated across all 1940 Act iShares exchange-traded funds (the “iShares ETF Complex”) in that calendar year exceeds a specified threshold, the Fund, pursuant to the securities lending agreement, will retain for the remainder of that calendar year 85% of securities lending income (which excludes collateral investment fees), and the amount retained can never be less than 70% of the total of securities lending income plus the collateral investment fees.
The share of securities lending income earned by the Fund is shown as securities lending income – affiliated – net in its Statement of Operations. For the year ended March 31, 2024, the Fund paid BTC $174 for securities lending agent services.
Officers and Trustees: Certain officers and/or trustees of the Trust are officers and/or trustees of BlackRock or its affiliates.
Other Transactions: Cross trading is the buying or selling of portfolio securities between funds to which BFA (or an affiliate) serves as investment adviser. At its regularly scheduled quarterly meetings, the Board reviews such transactions as of the most recent calendar quarter for compliance with the requirements and restrictions set forth by Rule 17a-7.
For the year ended March 31, 2024, transactions executed by the Fund pursuant to Rule 17a-7 under the 1940 Act were as follows:
The Fund may invest its positive cash balances in certain money market funds managed by BFA or an affiliate. The income earned on these temporary cash investments is shown as dividends – affiliated in the Statement of Operations.
A fund, in order to improve its portfolio liquidity and its ability to track its underlying index, may invest in shares of other iShares funds that invest in securities in the fund’s underlying index.
7. PURCHASES AND SALES
For the year ended March 31, 2024, purchases and sales of investments, excluding short-term securities and in-kind transactions, were as follows:
Notes to Financial Statements21
Notes to Financial Statements (continued)
For the year ended March 31, 2024, in-kind transactions were as follows:
8. INCOME TAX INFORMATION
The Fund is treated as an entity separate from the Trust’s other funds for federal income tax purposes. It is the Fund’s policy to comply with the requirements of the Internal Revenue Code of 1986, as amended, applicable to regulated investment companies, and to distribute substantially all of its taxable income to its shareholders. Therefore, no U.S. federal income tax provision is required.
Management has analyzed tax laws and regulations and their application to the Fund as of March 31, 2024, inclusive of the open tax return years, and does not believe that there are any uncertain tax positions that require recognition of a tax liability in the Fund’s financial statements.
U.S. GAAP requires that certain components of net assets be adjusted to reflect permanent differences between financial and tax reporting. These reclassifications have no effect on net assets or NAV per share. As of March 31, 2024, permanent differences attributable to realized gains (losses) from in-kind redemptions were reclassified to the following accounts:
| | Accumulated
Earnings (Loss) |
| | |
The tax character of distributions paid was as follows:
As of March 31, 2024, the tax components of accumulated net earnings (losses) were as follows:
| Undistributed
Ordinary Income | | | |
| | | | |
| Amounts available to offset future realized capital gains. |
| The difference between book-basis and tax-basis unrealized gains (losses) was attributable primarily to the tax deferral of losses on wash sales and the realization for tax purposes of unrealized gains on investments in passive foreign investment companies. |
A fund may own shares in certain foreign investment entities, referred to, under U.S. tax law, as “passive foreign investment companies.” Such fund may elect to mark-to-market annually the shares of each passive foreign investment company and would be required to distribute to shareholders any such marked-to-market gains.
As of March 31, 2024, gross unrealized appreciation and depreciation based on cost of investments (including short positions and derivatives, if any) for U.S. federal income tax purposes were as follows:
| | Gross Unrealized
Appreciation | Gross Unrealized
Depreciation | Net Unrealized
Appreciation
(Depreciation) |
| | | | |
9. LINE OF CREDIT
The Fund, along with certain other iShares funds (“Participating Funds”), is a party to a $800 million credit agreement (“Syndicated Credit Agreement”) with a group of lenders, which expires on October 16, 2024. The line of credit may be used for temporary or emergency purposes, including redemptions, settlement of trades and rebalancing of portfolio holdings in certain target markets. The Funds may borrow up to the aggregate commitment amount subject to asset coverage and other limitations as specified in the Syndicated Credit Agreement. The Syndicated Credit Agreement has the following terms: a commitment fee of 0.15% per annum on the unused portion of the credit agreement and interest at a rate equal to the higher of (a) Daily Simple Secured Overnight Financing Rate (“SOFR”) plus 0.10% and 1.00% per annum or (b)
222024 iShares Annual Report to Shareholders
Notes to Financial Statements (continued)
the U.S. Federal Funds rate plus 1.00% per annum on amounts borrowed. The commitment fee is generally allocated to each Participating Fund based on the lesser of a Participating Fund’s relative exposure to certain target markets or a Participating Fund’s maximum borrowing amount as set forth by the terms of the Syndicated Credit Agreement.
During the year ended March 31, 2024, the Fund did not borrow under the Syndicated Credit Agreement.
10. PRINCIPAL RISKS
In the normal course of business, the Fund invests in securities or other instruments and may enter into certain transactions, and such activities subject the Fund to various risks, including, among others, fluctuations in the market (market risk) or failure of an issuer to meet all of its obligations. The value of securities or other instruments may also be affected by various factors, including, without limitation: (i) the general economy; (ii) the overall market as well as local, regional or global political and/or social instability; (iii) regulation, taxation or international tax treaties between various countries; or (iv) currency, interest rate or price fluctuations. Local, regional or global events such as war, acts of terrorism, the spread of infectious illness or other public health issues, recessions, or other events could have a significant impact on the Fund and its investments. The Fund’s prospectus provides details of the risks to which the Fund is subject.
BFA uses an indexing approach to try to achieve the Fund’s investment objective. The Fund is not actively managed, and BFA generally does not attempt to take defensive positions under any market conditions, including declining markets.
The Fund may be exposed to additional risks when reinvesting cash collateral in money market funds that do not seek to maintain a stable NAV per share of $1.00, which may be subject to discretionary liquidity fees under certain circumstances.
Valuation Risk: The market values of equities, such as common stocks and preferred securities or equity related investments, such as futures and options, may decline due to general market conditions which are not specifically related to a particular company. They may also decline due to factors which affect a particular industry or industries. A fund may invest in illiquid investments. An illiquid investment is any investment that a fund reasonably expects cannot be sold or disposed of in current market conditions in seven calendar days or less without the sale or disposition significantly changing the market value of the investment. A fund may experience difficulty in selling illiquid investments in a timely manner at the price that it believes the investments are worth. Prices may fluctuate widely over short or extended periods in response to company, market or economic news. Markets also tend to move in cycles, with periods of rising and falling prices. This volatility may cause a fund’s NAV to experience significant increases or decreases over short periods of time. If there is a general decline in the securities and other markets, the NAV of a fund may lose value, regardless of the individual results of the securities and other instruments in which a fund invests.
Counterparty Credit Risk: The Fund may be exposed to counterparty credit risk, or the risk that an entity may fail to or be unable to perform on its commitments related to unsettled or open transactions, including making timely interest and/or principal payments or otherwise honoring its obligations. The Fund manages counterparty credit risk by entering into transactions only with counterparties that BFA believes have the financial resources to honor their obligations and by monitoring the financial stability of those counterparties. Financial assets, which potentially expose the Fund to market, issuer and counterparty credit risks, consist principally of financial instruments and receivables due from counterparties. The extent of the Fund’s exposure to market, issuer and counterparty credit risks with respect to these financial assets is approximately their value recorded in the Statement of Assets and Liabilities, less any collateral held by the Fund.
A derivative contract may suffer a mark-to-market loss if the value of the contract decreases due to an unfavorable change in the market rates or values of the underlying instrument. Losses can also occur if the counterparty does not perform under the contract.
With exchange-traded futures, there is less counterparty credit risk to the Fund since the exchange or clearinghouse, as counterparty to such instruments, guarantees against a possible default. The clearinghouse stands between the buyer and the seller of the contract; therefore, credit risk is limited to failure of the clearinghouse. While offset rights may exist under applicable law, a fund does not have a contractual right of offset against a clearing broker or clearinghouse in the event of a default (including the bankruptcy or insolvency). Additionally, credit risk exists in exchange-traded futures with respect to initial and variation margin that is held in a clearing broker’s customer accounts. While clearing brokers are required to segregate customer margin from their own assets, in the event that a clearing broker becomes insolvent or goes into bankruptcy and at that time there is a shortfall in the aggregate amount of margin held by the clearing broker for all its clients, typically the shortfall would be allocated on a pro rata basis across all the clearing broker’s customers, potentially resulting in losses to the Fund.
Geographic/Asset Class Risk: A diversified portfolio, where this is appropriate and consistent with a fund’s objectives, minimizes the risk that a price change of a particular investment will have a material impact on the NAV of a fund. The investment concentrations within the Fund’s portfolio are disclosed in its Schedule of Investments.
The Fund invests a significant portion of its assets in issuers located in a single country or a limited number of countries. When a fund concentrates its investments in this manner, it assumes the risk that economic, regulatory, political and social conditions in that country or those countries may have a significant impact on the fund and could affect the income from, or the value or liquidity of, the Fund’s portfolio. Unanticipated or sudden political or social developments may cause uncertainty in the markets and as a result adversely affect the Fund's investments. Foreign issuers may not be subject to the same uniform accounting, auditing and financial reporting standards and practices as used in the United States. Foreign securities markets may also be more volatile and less liquid than U.S. securities and may be less subject to governmental supervision not typically associated with investing in U.S. securities.
Notes to Financial Statements23
Notes to Financial Statements (continued)
The Fund invests a significant portion of its assets in securities of issuers located in Asia or with significant exposure to Asian issuers or countries. The Asian financial markets have recently experienced volatility and adverse trends due to concerns in several Asian countries regarding monetary policy, government intervention in the markets, rising government debt levels or economic downturns. These events may spread to other countries in Asia and may affect the value and liquidity of certain of the Fund’s investments.
Significant Shareholder Redemption Risk: Certain shareholders may own or manage a substantial amount of fund shares and/or hold their fund investments for a limited period of time. Large redemptions of fund shares by these shareholders may force a fund to sell portfolio securities, which may negatively impact the fund’s NAV, increase the fund’s brokerage costs, and/or accelerate the realization of taxable income/gains and cause the fund to make additional taxable distributions to shareholders.
11. CAPITAL SHARE TRANSACTIONS
Capital shares are issued and redeemed by the Fund only in aggregations of a specified number of shares or multiples thereof (“Creation Units”) at NAV. Except when aggregated in Creation Units, shares of the Fund are not redeemable.
Transactions in capital shares were as follows:
The consideration for the purchase of Creation Units of a fund in the Trust generally consists of the in-kind deposit of a designated portfolio of securities and a specified amount of cash. Certain funds in the Trust may be offered in Creation Units solely or partially for cash in U.S. dollars. Authorized Participants purchasing and redeeming Creation Units may pay a purchase transaction fee and a redemption transaction fee directly to State Street Bank and Trust Company, the Trust’s administrator, to offset transfer and other transaction costs associated with the issuance and redemption of Creation Units, including Creation Units for cash. Authorized Participants transacting in Creation Units for cash may also pay an additional variable charge to compensate the relevant fund for certain transaction costs (i.e., stamp taxes, taxes on currency or other financial transactions, and brokerage costs) and market impact expenses relating to investing in portfolio securities. Such variable charges, if any, are included in shares sold in the table above.
From time to time, settlement of securities related to in-kind contributions or in-kind redemptions may be delayed. In such cases, securities related to in-kind transactions are reflected as a receivable or a payable in the Statement of Assets and Liabilities.
12. SUBSEQUENT EVENTS
Management has evaluated the impact of all subsequent events on the Fund through the date the financial statements were available to be issued and has determined that there were no subsequent events requiring adjustment or additional disclosure in the financial statements.
242024 iShares Annual Report to Shareholders
Report of Independent Registered Public Accounting Firm
To the Board of Trustees of
iShares Trust and Shareholders of iShares JPX-Nikkei 400 ETF
Opinion on the Financial Statements
We have audited the accompanying statement of assets and liabilities, including the schedule of investments, of iShares JPX-Nikkei 400 ETF (one of the funds constituting iShares Trust, referred to hereafter as the "Fund") as of March 31, 2024, the related statement of operations for the year ended March 31, 2024, the statement of changes in net assets for each of the two years in the period ended March 31, 2024, including the related notes, and the financial highlights for each of the five years in the period ended March 31, 2024 (collectively referred to as the “financial statements”). In our opinion, the financial statements present fairly, in all material respects, the financial position of the Fund as of March 31, 2024, the results of its operations for the year then ended, the changes in its net assets for each of the two years in the period ended March 31, 2024 and the financial highlights for each of the five years in the period ended March 31, 2024 in conformity with accounting principles generally accepted in the United States of America.
Basis for Opinion
These financial statements are the responsibility of the Fund’s management. Our responsibility is to express an opinion on the Fund’s financial statements based on our audits. We are a public accounting firm registered with the Public Company Accounting Oversight Board (United States) (PCAOB) and are required to be independent with respect to the Fund in accordance with the U.S. federal securities laws and the applicable rules and regulations of the Securities and Exchange Commission and the PCAOB.
We conducted our audits of these financial statements in accordance with the standards of the PCAOB. Those standards require that we plan and perform the audit to obtain reasonable assurance about whether the financial statements are free of material misstatement, whether due to error or fraud.
Our audits included performing procedures to assess the risks of material misstatement of the financial statements, whether due to error or fraud, and performing procedures that respond to those risks. Such procedures included examining, on a test basis, evidence regarding the amounts and disclosures in the financial statements. Our audits also included evaluating the accounting principles used and significant estimates made by management, as well as evaluating the overall presentation of the financial statements. Our procedures included confirmation of securities owned as of March 31, 2024 by correspondence with the custodian, transfer agent and brokers; when replies were not received from brokers, we performed other auditing procedures. We believe that our audits provide a reasonable basis for our opinion.
/s/PricewaterhouseCoopers LLP
Philadelphia, Pennsylvania
May 23, 2024
We have served as the auditor of one or more BlackRock investment companies since 2000.
Report of Independent Registered Public Accounting Firm25
Important Tax Information (unaudited)
The following amount, or maximum amount allowable by law, are hereby designated as qualified dividend income for individuals for the fiscal year ended March 31, 2024:
The Fund intends to pass through to its shareholders the following amount, or maximum amount allowable by law, of foreign source income earned and foreign taxes paid for the fiscal year ended March 31, 2024:
| Foreign Source
Income Earned | |
| | |
262024 iShares Annual Report to Shareholders
Statement Regarding Liquidity Risk Management Program (unaudited)
In compliance with Rule 22e-4 under the Investment Company Act of 1940, as amended (the “Liquidity Rule”), iShares Trust (the “Trust”) has adopted and implemented a liquidity risk management program (the “Program”) for iShares JPX-Nikkei 400 ETF (the “Fund” or “ETF”), a series of the Trust, which is reasonably designed to assess and manage the Fund’s liquidity risk.
The Board of Trustees (the “Board”) of the Trust, on behalf of the Fund, met on December 8, 2023 (the “Meeting”) to review the Program. The Board previously appointed BlackRock Fund Advisors (“BlackRock”), the investment adviser to the Fund, as the program administrator for the Fund’s Program. BlackRock also previously delegated oversight of the Program to the 40 Act Liquidity Risk Management Committee (the “Committee”). At the Meeting, the Committee, on behalf of BlackRock, provided the Board with a report that addressed the operation of the Program and assessed its adequacy and effectiveness of implementation, including the management of the Fund’s Highly Liquid Investment Minimum (“HLIM”) where applicable, and any material changes to the Program (the “Report”). The Report covered the period from October 1, 2022 through September 30, 2023 (the “Program Reporting Period”).
The Report described the Program’s liquidity classification methodology for categorizing the Fund’s investments (including derivative transactions) into one of four liquidity buckets. It also referenced the methodology used by BlackRock to establish the Fund’s HLIM and noted that the Committee reviews and ratifies the HLIM assigned to the Fund no less frequently than annually. The Report also discussed notable events affecting liquidity over the Program Reporting Period, including extended market holidays, delays in the repatriation of the local currency in certain non-U.S. countries, the continued illiquidity of Russian equity securities and the suspension of select sanctions in Venezuela.
The Report noted that the Program complied with the key factors for consideration under the Liquidity Rule for assessing, managing and periodically reviewing the Fund’s liquidity risk, as follows:
a) The Fund’s investment strategy and liquidity of portfolio investments during both normal and reasonably foreseeable stressed conditions. During the Program Reporting Period, the Committee reviewed whether the Fund’s strategy is appropriate for an open-end fund structure, with a focus on funds with more significant and consistent holdings of less liquid and illiquid assets. The Committee also factored a fund’s concentration in an issuer into the liquidity classification methodology by taking issuer position sizes into account. Derivative exposure was also considered in the calculation of a fund’s liquidity bucketing. Finally, a factor for consideration under the Liquidity Rule is a Fund’s use of borrowings for investment purposes. However, the Funds do not borrow for investment purposes.
b) Short-term and long-term cash flow projections during both normal and reasonably foreseeable stressed conditions. During the Program Reporting Period, the Committee reviewed historical redemption activity and used this information as a component to establish each ETF’s reasonably anticipated trading size utilized for liquidity classifications. The Committee may also take into consideration a fund’s shareholder ownership concentration (which, depending on product type and distribution channel, may or may not be available), a fund’s distribution channels, and the degree of certainty associated with a fund’s short-term and long-term cash flow projections.
c) Holdings of cash and cash equivalents, as well as borrowing arrangements. The Committee considered that ETFs generally do not hold more than de minimis amounts of cash. The Committee also considered that ETFs generally do not engage in borrowing.
d) The relationship between an ETF’s portfolio liquidity and the way in which, and the prices and spreads at which, ETF shares trade, including the efficiency of the arbitrage function and the level of active participation by market participants, including authorized participants. The Committee monitored the prevailing bid/ask spread and the ETF price premium (or discount) to NAV for all ETFs. However, there were no ETFs with persistent deviations of fund premium/discount or bid/ask spreads from long-term averages over the Program Reporting Period.
e) The effect of the composition of baskets on the overall liquidity of an ETF’s portfolio. In reviewing the linkage between the composition of custom baskets accepted by an ETF and any significant change in the liquidity profile of such ETF, the Committee reviewed changes in the proportion of each ETF’s portfolio comprised of less liquid and illiquid holdings to determine if applicable thresholds were met requiring enhanced review. There were no ETFs for which the custom baskets accepted by the ETF had a significant change in its liquidity profile.
There were no material changes to the Program during the Program Reporting Period other than the enhancement of certain model components in the Program’s classification methodology. The Report provided to the Board stated that the Committee concluded that based on the operation of the functions, as described in the Report, the Program is operating as intended and is effective in implementing the requirements of the Liquidity Rule.
Statement Regarding Liquidity Risk Management Program27
Supplemental Information (unaudited)
Section 19(a) Notices
The amounts and sources of distributions reported are estimates and are being provided pursuant to regulatory requirements and are not being provided for tax reporting purposes. The actual amounts and sources for tax reporting purposes will depend upon the Fund’s investment experience during the year and may be subject to changes based on tax regulations. Shareholders will receive a Form 1099-DIV each calendar year that will inform them how to report these distributions for federal income tax purposes.
March 31, 2024
| Total Cumulative Distributions
for the Fiscal Year | % Breakdown of the Total Cumulative
Distributions for the Fiscal Year |
| | Net Realized
Capital Gains | | | | Net Realized
Capital Gains | | |
| | | | | | | | |
| The Fund estimates that it has distributed more than its net investment income and net realized capital gains; therefore, a portion of the distribution may be a return of capital. A return of capital may occur, for example, when some or all of the shareholder's investment in the Fund is returned to the shareholder. A return of capital does not necessarily reflect the Fund’s investment performance and should not be confused with “yield” or “income”. When distributions exceed total return performance, the difference will incrementally reduce the Fund’s net asset value per share. |
Tailored Shareholder Reports for Open-End Mutual Funds and ETFs
Effective January 24, 2023, the SEC adopted rule and form amendments to require open-end mutual funds and ETFs to transmit concise and visually engaging streamlined annual and semiannual reports to shareholders that highlight key information. Other information, including financial statements, will no longer appear in a streamlined shareholder report but must be available online, delivered free of charge upon request, and filed on a semiannual basis on Form N-CSR. The rule and form amendments have a compliance date of July 24, 2024. At this time, management is evaluating the impact of these amendments on the shareholder reports for the Funds.
Premium/Discount Information
Information on the Fund's net asset value, market price, premiums and discounts, and bid-ask spreads can be found at iShares.com.
282024 iShares Annual Report to Shareholders
Trustee and Officer Information (unaudited)
The Board of Trustees has responsibility for the overall management and operations of the Funds, including general supervision of the duties performed by BFA and other service providers. Each Trustee serves until he or she resigns, is removed, dies, retires or becomes incapacitated. Each officer shall hold office until his or her successor is elected and qualifies or until his or her death, resignation or removal. Trustees who are not “interested persons” (as defined in the 1940 Act) of the Trust are referred to as independent trustees (“Independent Trustees”).
The registered investment companies advised by BFA or its affiliates (the “BlackRock-advised Funds”) are organized into one complex of open-end equity, multi-asset, index and money market funds and ETFs (the “BlackRock Multi-Asset Complex”), one complex of closed-end funds and open-end non-index fixed-income funds (including ETFs) (the “BlackRock Fixed-Income Complex”) and one complex of ETFs (“Exchange-Traded Fund Complex”) (each, a “BlackRock Fund Complex”). Each Fund is included in the Exchange-Traded Fund Complex. Each Trustee also serves as a Director of iShares, Inc. and a Trustee of iShares U.S. ETF Trust and, as a result, oversees all of the funds within the Exchange-Traded Fund Complex, which consists of 404 funds as of March 31, 2024. With the exception of Stephen Cohen, Robert S. Kapito and Aaron Wasserman, the address of each Trustee and officer is c/o BlackRock, Inc., 400 Howard Street, San Francisco, CA 94105. The address of Mr. Kapito and Mr. Wasserman is c/o BlackRock, Inc., 50 Hudson Yards, New York, NY 10001. The address of Mr. Cohen is c/o BlackRock, Inc., Drapers Gardens, 12 Throgmorton Avenue, London EC2N 2DL United Kingdom. The Board has designated John E. Kerrigan as its Independent Board Chair. Additional information about the Funds’ Trustees and officers may be found in the Funds’ combined Statement of Additional Information, which is available without charge, upon request, by calling toll-free 1-800-iShares (1-800-474-2737).
|
| | Principal Occupation(s)
During Past 5 Years | Other Directorships Held by Trustee |
| | President of BlackRock, Inc. (since 2006); Vice Chairman of BlackRock, Inc. and Head of BlackRock’s Portfolio Management Group (since its formation in 1998) and BlackRock, Inc.’s predecessor entities (since 1988); Trustee, University of Pennsylvania (since 2009); President of Board of Directors, Hope & Heroes Children’s Cancer Fund (since 2002). | Director of BlackRock, Inc. (since 2006); Director of iShares, Inc. (since 2009); Trustee of iShares U.S. ETF Trust (since 2011). |
| | Senior Managing Director, Head of Global Product Solutions of BlackRock, Inc. (since 2024); Senior Managing Director, Head of Europe, Middle East and Africa Regions of BlackRock, Inc. (2021-2024); Head of iShares Index and Wealth in EMEA of BlackRock, Inc. (2017-2021); Global Head of Fixed Income Indexing of BlackRock, Inc. (2016-2017); Chief Investment Strategist for International Fixed Income and iShares of BlackRock, Inc. (2011-2015). | Director of iShares, Inc. (since 2024); Trustee of iShares U.S. ETF Trust (since 2024). |
(a) Robert S. Kapito is deemed to be an “interested person” (as defined in the 1940 Act) of the Trust due to his affiliations with BlackRock, Inc. and its affiliates. |
(b) Stephen Cohen is deemed to be an "interested person" (as defined in the 1940 Act) of the Trust due to his affiliations with BlackRock, Inc. and its affiliates. |
|
| | Principal Occupation(s)
During Past 5 Years | Other Directorships Held by Trustee |
| Trustee (since 2005); Independent Board Chair (since 2022). | Chief Investment Officer, Santa Clara University (since 2002). | Director of iShares, Inc. (since 2005); Trustee of iShares U.S. ETF Trust (since 2011); Independent Board Chair of iShares, Inc. and iShares U.S. ETF Trust (since 2022). |
| Trustee (since 2015); Risk Committee Chair (since 2016). | Consultant (since 2012); Member of the Audit Committee (2012-2018), Chair of the Nominating and Governance Committee (2017-2018) and Director of PHH Corporation (mortgage solutions) (2012-2018); Managing Director and Global Head of Financial Holding Company Governance & Assurance and the Global Head of Operational Risk Management of Morgan Stanley (2006-2012). | Director of iShares, Inc. (since 2015); Trustee of iShares U.S. ETF Trust (since 2015); Member of the Audit Committee (since 2016), Chair of the Audit Committee (since 2020) and Director of The Hanover Insurance Group, Inc. (since 2016). |
| Trustee (since 2017); Audit Committee Chair (since 2019). | Partner, KPMG LLP (2002-2016); Director of One Generation Away (since 2021). | Director of iShares, Inc. (since 2017); Trustee of iShares U.S. ETF Trust (since 2017). |
Trustee and Officer Information29
Trustee and Officer Information (unaudited) (continued)
Independent Trustees (continued) |
| | Principal Occupation(s) During Past 5 Years | Other Directorships Held by Trustee |
| Trustee (since 2005); Nominating and Governance and Equity Plus Committee Chairs (since 2022). | Chair of the Finance Committee (since 2019) and Trustee and Member of the Finance, Audit and Quality Committees of Stanford Health Care (since 2016); Trustee of WNET, New York’s public media company (since 2011) and Member of the Audit Committee (since 2018), Investment Committee (since 2011) and Personnel Committee (since 2022); Member of the Wyoming State Investment Funds Committee (since 2022); Trustee of Forward Funds (14 portfolios) (2009-2018); Trustee of Salient MF Trust (4 portfolios) (2015-2018); Director of the Jackson Hole Center for the Arts (since 2021). | Director of iShares, Inc. (since 2005); Trustee of iShares U.S. ETF Trust (since 2011). |
| Trustee (since 2017); 15(c) Committee Chair (since 2017). | Senior Managing Director of New York Life Insurance Company (2010-2015). | Director of iShares, Inc. (since 2017); Trustee of iShares U.S. ETF Trust (since 2017); Director of Jackson Financial Inc. (since 2021). |
| Trustee (since 2003); Securities Lending Committee Chair (since 2019). | Director of Real Estate Equity Exchange, Inc. (since 2005); Director of Cloudera Foundation (2017-2020); and Director of Reading Partners (2012-2016). | Director of iShares, Inc. (since 2003); Trustee of iShares U.S. ETF Trust (since 2011). |
| Trustee (since 2011); Fixed-Income Plus Committee Chair (since 2019). | Dean, and George Pratt Shultz Professor of Accounting, University of Chicago Booth School of Business (since 2017); Advisory Board Member (since 2016) and Director (since 2020) of C.M. Capital Corporation; Chair of the Board for the Center for Research in Security Prices, LLC (since 2020); Director of WellBe Senior Medical (since 2023); Robert K. Jaedicke Professor of Accounting, Stanford University Graduate School of Business (2001-2017); Professor of Law (by courtesy), Stanford Law School (2005-2017); Senior Associate Dean for Academic Affairs and Head of MBA Program, Stanford University Graduate School of Business (2010-2016). | Director of iShares, Inc. (since 2011); Trustee of iShares U.S. ETF Trust (since 2011). |
|
| | Principal Occupation(s)
During Past 5 Years |
| | Managing Director of BlackRock, Inc. (since 2015); Head of Global Product Solutions, Americas of BlackRock, Inc. (since 2024) and Head of Sustainable and Transition Solutions of BlackRock, Inc. (2022-2024); Global Head of Corporate Strategy of BlackRock, Inc. (2019-2022); Chief of Staff to the CEO of BlackRock, Inc. (2017-2019). |
| Treasurer and Chief Financial Officer (since 2020). | Managing Director of BlackRock, Inc. (since 2019); Chief Financial Officer of iShares Delaware Trust Sponsor LLC, BlackRock Funds, BlackRock Funds II, BlackRock Funds IV, BlackRock Funds V and BlackRock Funds VI (since 2021). |
| Chief Compliance Officer (iShares, Inc. and iShares Trust, since 2023; iShares U.S. ETF Trust, since 2023). | Managing Director of BlackRock, Inc. (since 2018); Chief Compliance Officer of the BlackRock Multi-Asset Complex, the BlackRock Fixed-Income Complex and the Exchange-Traded Fund Complex (since 2023); Deputy Chief Compliance Officer for the BlackRock Multi-Asset Complex, the BlackRock Fixed-Income Complex and the Exchange-Traded Fund Complex (2014-2023). |
| | Managing Director of BlackRock, Inc. (since 2023); Director of BlackRock, Inc. (2018-2022). |
| Executive Vice President (since 2022). | Managing Director of BlackRock, Inc. (since 2018); Head of U.S. iShares Product (since 2022); Head of EII U.S. Product Engineering of BlackRock, Inc. (since 2021); Co-Head of EII’s Americas Portfolio Engineering of BlackRock, Inc. (2020-2021); Head of Developed Markets Portfolio Engineering of BlackRock, Inc. (2016-2019). |
| Executive Vice President (since 2022). | Managing Director of BlackRock, Inc. (since 2009); Co-Head of Index Equity of BlackRock, Inc. (since 2022). |
302024 iShares Annual Report to Shareholders
Trustee and Officer Information (unaudited) (continued)
|
| | Principal Occupation(s) During Past 5 Years |
| Executive Vice President (since 2022). | Managing Director of BlackRock, Inc. (since 2010); Head of Fixed Income Index Investments in the Americas and Head of San Francisco Core Portfolio Management of BlackRock, Inc. (since 2020). |
Effective July 1, 2023, Aaron Wasserman replaced Charles Park as Chief Compliance Officer. |
Effective February 1, 2024, Salim Ramji resigned as Trustee of the Trust. |
Effective March 5, 2024, Stephen Cohen replaced Salim Ramji as Trustee of the Trust. |
Effective March 5, 2024, Dominik Rohé resigned as President of the Trust. |
Effective March 5, 2024, Jessica Tan replaced Dominik Rohé as President of the Trust. |
Effective April 8, 2024, Laura Fergerson was appointed as Trustee of the Trust. |
Effective April 8, 2024, James Lam was appointed as Trustee of the Trust. |
Trustee and Officer Information31
Electronic Delivery
Shareholders can sign up for e-mail notifications announcing that the shareholder report or prospectus has been posted on the iShares website at iShares.com. Once you have enrolled, you will no longer receive prospectuses and shareholder reports in the mail.
To enroll in electronic delivery:
• Go to icsdelivery.com.
• If your brokerage firm is not listed, electronic delivery may not be available. Please contact your broker-dealer or financial advisor.
Householding
Householding is an option available to certain fund investors. Householding is a method of delivery, based on the preference of the individual investor, in which a single copy of certain shareholder documents and Rule 30e-3 notices can be delivered to investors who share the same address, even if their accounts are registered under different names. Please contact your broker-dealer if you are interested in enrolling in householding and receiving a single copy of prospectuses and other shareholder documents, or if you are currently enrolled in householding and wish to change your householding status.
Availability of Quarterly Schedule of Investments
The Fund files its complete schedule of portfolio holdings with the SEC for the first and third quarters of each fiscal year as an exhibit to its reports on Form N-PORT. The Fund’s Forms N-PORT are available on the SEC’s website at sec.gov. Additionally, the Fund makes its portfolio holdings for the first and third quarters of each fiscal year available at iShares.com/fundreports.
Availability of Proxy Voting Policies and Proxy Voting Records
A description of the policies and procedures that the iShares Funds use to determine how to vote proxies relating to portfolio securities and information about how the iShares Funds voted proxies relating to portfolio securities during the most recent twelve-month period ending June 30 is available without charge, upon request (1) by calling toll-free 1-800-474-2737; (2) on the iShares website at iShares.com; and (3) on the SEC website at sec.gov.
A description of the Trust’s policies and procedures with respect to the disclosure of the Fund’s portfolio securities is available in the Fund Prospectus. The Fund discloses its portfolio holdings daily and provides information regarding its top holdings in Fund fact sheets at iShares.com.
322024 iShares Annual Report to Shareholders
THIS PAGE INTENTIONALLY LEFT BLANK.
THIS PAGE INTENTIONALLY LEFT BLANK.
THIS PAGE INTENTIONALLY LEFT BLANK.
Want to know more?
iShares.com | 1-800-474-2737
This report is intended for the Fund’s shareholders. It may not be distributed to prospective investors unless it is preceded or accompanied by the current prospectus.
Investing involves risk, including possible loss of principal.
The iShares Funds are distributed by BlackRock Investments, LLC (together with its affiliates, “BlackRock”).
The iShares Funds are not sponsored, endorsed, issued, sold or promoted by the Japan Exchange Group, Inc., JPX Market Innovation & Research, Inc. or Nikkei, Inc., nor do these companies make any representation regarding the advisability of investing in the iShares Funds. BlackRock is not affiliated with the companies listed above.
©2024 BlackRock, Inc. All rights reserved. iSHARES and BLACKROCK are registered trademarks of BlackRock, Inc. or its subsidiaries. All other marks are the property of their respective owners.
(b) Not Applicable
The registrant has adopted a code of ethics, as of the end of the period covered by this report, applicable to the registrant’s principal executive officer, principal financial officer, principal accounting officer or controller, or persons performing similar functions. During the period covered by this report, the registrant has not amended the code of ethics and there have been no waivers granted under the code of ethics. The registrant undertakes to provide a copy of the code of ethics to any person upon request, without charge, by calling 1-800-474-2737.
| Item 3. | Audit Committee Financial Expert. |
The registrant’s Board of Trustees has determined that the registrant has more than one audit committee financial expert, as that term is defined under Item 3(b) and 3(c), serving on its audit committee. The audit committee financial experts serving on the registrant’s audit committee are Richard L. Fagnani and Madhav V. Rajan, all of whom are independent, as that term is defined under Item 3(a)(2).
| Item 4. | Principal Accountant Fees and Services. |
The principal accountant fees disclosed in items 4(a), 4(b), 4(c), 4(d) and 4(g) are for the twenty series of the registrant for which the fiscal year-end is March 31, 2024 (the “Funds”), and whose annual financial statements are reported in Item 1.
(a) Audit Fees – The aggregate fees billed for each of the last two fiscal years for professional services rendered by the principal accountant for the audit of the Funds’ annual financial statements or services that are normally provided by the accountant in connection with statutory and regulatory filings or engagements for those fiscal years were $283,700 for the fiscal year ended March 31, 2023 and $270,400 for the fiscal year ended March 31, 2024.
(b) Audit-Related Fees – There were no fees billed for the fiscal years ended March 31, 2023 and March 31, 2024 for assurance and related services by the principal accountant that were reasonably related to the performance of the audit of the Fund’s financial statements and are not reported under (a) of this Item.
(c) Tax Fees – The aggregate fees billed in each of the last two fiscal years for professional services rendered by the principal accountant for tax compliance, tax advice and tax planning for the Funds were $203,700 for the fiscal year ended March 31, 2023 and $194,000 for the fiscal year ended March 31, 2024. These services related to the review of the Funds’ tax returns and excise tax calculations.
(d) All Other Fees – There were no other fees billed in each of the fiscal years ended March 31, 2023 and March 31, 2024 for products and services provided by the principal accountant, other than the services reported in (a) through (c) of this Item.
(e) (1) The registrant’s audit committee charter, as amended, provides that the audit committee is responsible for the approval, prior to appointment, of the engagement of the principal accountant to annually audit and provide their opinion on the registrant’s financial statements. The audit committee must also approve, prior to appointment, the engagement of the principal accountant to provide non-audit services to the registrant or to any entity controlling, controlled by or under common control with the registrant’s investment adviser (“Adviser Affiliate”) that provides ongoing services to the registrant, if the engagement relates directly to the operations and financial reporting of the registrant.
(2) There were no services described in (b) through (d) above that were approved by the audit committee pursuant to paragraph (c)(7)(i)(C) of Rule 2-01 of Regulation S-X.
(f) Not Applicable
(g) The aggregate non-audit fees billed by the registrant’s principal accountant for services rendered to the Funds, and rendered to the registrant’s investment adviser, and any Adviser Affiliate that provides ongoing services to the registrant for the last two fiscal years were $203,700 for the fiscal year ended March 31, 2023 and $194,000 for the fiscal year ended March 31, 2024.
(h) The registrant’s audit committee has considered whether the provision of non-audit services rendered to the registrant’s investment adviser and any Adviser Affiliate that provides ongoing services to the registrant that were not pre-approved pursuant to paragraph (c)(7)(ii) of Rule 2-01 of Regulation S-X, if any, is compatible with maintaining the principal accountant’s independence, and has determined that the provision of these services, if any, does not compromise the principal accountant’s independence.
(i) Not Applicable
(j) Not Applicable
| Item 5. | Audit Committee of Listed Registrants. |
(a) The registrant is a listed issuer as defined in Rule 10A-3 under the Exchange Act of 1934 and has a separately-designated standing audit committee established in accordance with Section 3(a)(58)(A) of the Exchange Act of 1934. The registrant’s audit committee members are Richard L. Fagnani, Cecilia H. Herbert and Madhav V. Rajan.
(b) Not applicable.
(a) Schedules of investments are included as part of the reports to shareholders filed under Item 1 of this Form.
(b) Not applicable.
| Item 7. | Disclosure of Proxy Voting Policies and Procedures for Closed-End Management Investment Companies. |
Not applicable to the registrant.
| Item 8. | Portfolio Managers of Closed-End Management Investment Companies. |
Not applicable to the registrant.
| Item 9. | Purchases of Equity Securities by Closed-End Management Investment Company and Affiliated Purchasers. |
Not applicable to the registrant.
| Item 10. | Submission of Matters to a Vote of Security Holders. |
There were no material changes to the procedures by which shareholders may recommend nominees to the registrant’s Board of Trustees.
| Item 11. | Controls and Procedures. |
(a) The President (the registrant’s Principal Executive Officer) and Treasurer and Chief Financial Officer (the registrant’s Principal Financial Officer) have concluded that the registrant’s disclosure controls and procedures (as defined in Rule 30a-3(c) under the Investment Company Act of 1940) are effective as of a date within 90 days of the filing date of this report, based on their evaluation of these controls and procedures required by Rule 30a-3(b) under the Investment Company Act of 1940 and Rules 13a-15(b) or 15d-15(b) under the Exchange Act of 1934.
(b) There were no changes in the registrant’s internal control over financial reporting (as defined in Rule 30a-3(d) under the Investment Company Act of 1940) that occurred during the period covered by this report that have materially affected, or are reasonably likely to materially affect, the registrant’s internal control over financial reporting.
| Item 12. | Disclosure of Securities Lending Activities for Closed-End Management Investment Companies. |
Not applicable to the registrant.
| Item 13. | Recovery of Erroneously Awarded Compensation. |
Not applicable
(a) (1) Code of Ethics is not filed as an exhibit; please refer to Item 2.
(a) (2) Section 302 Certifications are attached.
(a) (3) Any written solicitation to purchase securities under Rule 23c-1 – Not Applicable
(a) (4) Change in Registrant’s independent public accountant – Not Applicable
(b) Section 906 Certifications are attached.
SIGNATURES
Pursuant to the requirements of the Securities Exchange Act of 1934 and the Investment Company Act of 1940, the registrant has duly caused this report to be signed on its behalf by the undersigned, thereunto duly authorized.
iShares Trust
| | | | |
| | By: | | /s/ Jessica Tan |
| | | | Jessica Tan, President (Principal Executive Officer) |
Date: May 23, 2024
Pursuant to the requirements of the Securities Exchange Act of 1934 and the Investment Company Act of 1940, this report has been signed below by the following persons on behalf of the registrant and in the capacities and on the dates indicated.
| | | | |
| | By: | | /s/ Jessica Tan |
| | | | Jessica Tan, President (Principal Executive Officer) |
Date: May 23, 2024
| | | | |
| | By: | | /s/ Trent Walker |
| | | | Trent Walker, Treasurer and Chief Financial Officer (Principal Financial Officer) |
Date: May 23, 2024