UNITED STATES
SECURITIES AND EXCHANGE COMMISSION
Washington, D.C. 20549
FORM 10-K
(Mark One) | | | | | |
| ☑ | ANNUAL REPORT PURSUANT TO SECTION 13 OR 15(d) OF THE SECURITIES EXCHANGE ACT OF 1934 |
For the fiscal year ended December 31, 2024
OR
| | | | | |
| ☐ | TRANSITION REPORT PURSUANT TO SECTION 13 OR 15(d) OF THE SECURITIES EXCHANGE ACT OF 1934 |
For the transition period from to .
Commission File Number: 001-33155
IPG PHOTONICS CORPORATION
(Exact name of registrant as specified in its charter) | | | | | | | | |
| Delaware | | 04-3444218 |
| (State or other jurisdiction of incorporation or organization) | | (IRS Employer Identification No.) |
| 377 Simarano Drive, Marlborough, Massachusetts | | 01752 |
| (Address of principal executive offices) | | (Zip Code) |
Registrant's telephone number, including area code: (508) 373-1100
Securities registered pursuant to Section 12(b) of the Act: | | | | | | | | |
| Title of Class | Trading Symbol | Name of Exchange on Which Registered |
| Common Stock, Par Value $0.0001 per share | IPGP | The Nasdaq Stock Market LLC |
Securities registered pursuant to Section 12(g) of the Act: None
Indicate by check mark if the registrant is a well-known seasoned issuer, as defined in Rule 405 of the Securities Act. Yes ☑ No ☐
Indicate by check mark if the registrant is not required to file reports pursuant to Section 13 or Section 15(d) of the Act. Yes ☐ No ☑
Indicate by check mark whether the registrant (1) has filed all reports required to be filed by Section 13 or 15(d) of the Securities Exchange Act of 1934 during the preceding 12 months (or for such shorter period that the registrant was required to file such reports), and (2) has been subject to such filing requirements for the past 90 days. Yes ☑ No ☐
Indicate by check mark whether the registrant has submitted electronically every Interactive Data File required to be submitted pursuant to Rule 405 of Regulation S-T (§ 232.405 of this chapter) during the preceding 12 months (or for such shorter period that the registrant was required to submit such files). Yes ☑ No ☐
Indicate by check mark whether the registrant is a large accelerated filer, an accelerated filer, a non-accelerated filer, a smaller reporting company or emerging growth company. See the definitions of "large accelerated filer," "accelerated filer," "smaller reporting company" and "emerging growth company" in Rule 12b-2 of the Exchange Act.
| | | | | | | | | | | |
| Large accelerated filer | ☑ | Accelerated filer | ☐ |
| Non-accelerated filer | ☐ | Smaller reporting company | ☐ |
| | Emerging growth company | ☐ |
If an emerging growth company, indicate by check mark if the registrant has elected not to use the extended transition period for complying with any new or revised financial accounting standards provided pursuant to Section 13(a) of the Exchange Act. ☐
Indicate by check mark whether the registrant has filed a report on and attestation to its management’s assessment of the effectiveness of its internal control over financial reporting under Section 404(b) of the Sarbanes-Oxley Act (15 U.S.C. 7262(b)) by the registered public accounting firm that prepared or issued its audit report. ☑
If securities are registered pursuant to Section 12(b) of the Act, indicate by check mark whether the financial statements of the registrant included in the filing reflect the correction of an error to previously issued financial statements. ☐
Indicate by check mark whether any of those error corrections are restatements that required a recovery analysis of incentive-based compensation received by any of the registrant’s executive officers during the relevant recovery period pursuant to §240.10D-1(b). ☐
Indicate by check mark whether the registrant is a shell company (as defined in Rule 12b-2 of the Act). Yes ☐ No ☑
The aggregate market value of the registrant's common stock held by non-affiliates of the registrant was approximately $2.3 billion, calculated based upon the closing price as reported by the Nasdaq Global Select Market on June 30, 2024. For purposes of this disclosure, shares of common stock held by persons who own 5% or more of the outstanding common stock and shares of common stock held by each officer and director have been excluded in that such persons may be deemed to be "affiliates" as that term is defined under the Rules and Regulations of the Exchange Act. This determination of affiliate status is not necessarily conclusive.
As of February 18, 2025, 42,548,561 shares of the registrant's common stock were outstanding.
DOCUMENTS INCORPORATED BY REFERENCE
None
TABLE OF CONTENTS
| | | | | | | | |
| | |
| PART I | |
| ITEM 1. | BUSINESS | |
| ITEM 1A. | RISK FACTORS | |
| ITEM 1B. | UNRESOLVED STAFF COMMENTS | |
| ITEM 1C. | CYBERSECURITY | |
| ITEM 2. | PROPERTIES | |
| ITEM 3. | LEGAL PROCEEDINGS | |
| ITEM 4. | MINE SAFETY DISCLOSURES | |
| | |
| PART II | |
| ITEM 5. | MARKET FOR REGISTRANT'S COMMON EQUITY, RELATED STOCKHOLDER MATTERS AND ISSUER PURCHASES OF EQUITY SECURITIES | |
| ITEM 6. | RESERVED | |
| ITEM 7. | MANAGEMENT’S DISCUSSION AND ANALYSIS OF FINANCIAL CONDITION AND RESULTS OF OPERATIONS | |
| ITEM 7A. | QUANTITATIVE AND QUALITATIVE DISCLOSURES ABOUT MARKET RISK | |
| ITEM 8. | FINANCIAL STATEMENTS AND SUPPLEMENTARY DATA | |
| ITEM 9. | CHANGES IN AND DISAGREEMENTS WITH ACCOUNTANTS ON ACCOUNTING AND FINANCIAL DISCLOSURE | |
| ITEM 9A. | CONTROLS AND PROCEDURES | |
| ITEM 9B. | OTHER INFORMATION | |
| ITEM 9C. | DISCLOSURE REGARDING FOREIGN JURISDICTIONS THAT PREVENT INSPECTIONS | |
| | |
| PART III | |
| ITEM 10. | DIRECTORS, EXECUTIVE OFFICERS AND CORPORATE GOVERNANCE | |
| ITEM 11. | EXECUTIVE COMPENSATION | |
| ITEM 12. | SECURITY OWNERSHIP OF CERTAIN BENEFICIAL OWNERS AND MANAGEMENT AND RELATED STOCKHOLDER MATTERS | |
| ITEM 13. | CERTAIN RELATIONSHIPS AND RELATED TRANSACTIONS, AND DIRECTOR INDEPENDENCE | |
| ITEM 14. | PRINCIPAL ACCOUNTING FEES AND SERVICES | |
|
| PART IV | |
| ITEM 15. | EXHIBITS AND FINANCIAL STATEMENT SCHEDULES | |
| ITEM 16. | FORM 10-K SUMMARY | |
| |
| SIGNATURES | |
| |
| INDEX TO FINANCIAL STATEMENTS | |
This Annual Report on Form 10-K contains certain forward-looking statements within the meaning of Section 27A of the Securities Act of 1933, as amended, and Section 21E of the Securities Exchange Act of 1934, as amended, and we intend that such forward-looking statements be subject to the safe harbors created thereby. For this purpose, any statements contained in this Annual Report on Form 10-K except for historical information are forward-looking statements. Without limiting the generality of the foregoing, words such as "may," "will," "expect," "believe," "anticipate," "intend," "target," "project," "intend," "plan," "seek," "strive," endeavor," goal," "could," "estimate," or "continue" or the negative or other variations thereof or comparable terminology are intended to identify forward-looking statements. In addition, any statements that refer to projections of our future financial performance, trends in our businesses, or other characterizations of future events or circumstances are forward-looking statements.
The forward-looking statements included herein are based on current expectations of our management based on available information and involve a number of risks and uncertainties, all of which are difficult or impossible to accurately predict and many of which are beyond our control. As such, our actual results may differ significantly from those expressed in any forward-looking statements. Factors that may cause or contribute to such differences include, but are not limited to, those discussed in more detail in Item 1 (Business) and Item 1A (Risk Factors) of Part I and Item 7 (Management's Discussion and Analysis of Financial Condition and Results of Operations) of Part II of this Annual Report on Form 10-K. Readers should carefully review these risks, as well as the additional risks described in other documents we file from time to time with the Securities and Exchange Commission (the "SEC"). In light of the significant risks and uncertainties inherent in the forward-looking information included herein, the inclusion of such information should not be regarded as a representation by us or any other person that such results will be achieved, and readers are cautioned not to rely on such forward-looking information. We undertake no obligation to revise the forward-looking statements contained herein to reflect events or circumstances after the date hereof or to reflect the occurrence of unanticipated events.
PART I
ITEM 1. BUSINESS
Our Company
IPG Photonics Corporation ("IPG", the "Company", the "Registrant", "we", "us" or "our") develops, manufactures and sells high-performance fiber lasers, fiber amplifiers, diode lasers and laser-based systems that are used for diverse applications in materials processing, medical and advanced applications. Fiber lasers combine the advantages of semiconductor diodes, such as long life and high efficiency, with the high amplification and precise beam qualities of specialty optical fibers to deliver superior performance, reliability and usability.
We sell our products globally to original equipment manufacturers ("OEMs"), system integrators and end users. We market our products internationally, primarily through our direct sales force. Our major manufacturing facilities are located in the United States and Germany. We have sales service offices and applications laboratories worldwide.
We are vertically integrated such that we design and manufacture most of the key components used in our finished products, from semiconductor diodes to optical fiber preforms, finished fiber lasers and amplifiers. We manufacture complementary products used with our lasers including optical delivery cables, fiber couplers, beam switches, optical processing heads, in-line sensors and chillers. Our vertically integrated operations allow us to control quality, rapidly develop and integrate advanced products and protect our proprietary technology.
We are listed on the Nasdaq Global Select Market (ticker: IPGP). We began operations in 1990, and we were incorporated in Delaware in 1998. Our principal executive offices are located at 377 Simarano Drive, Marlborough, Massachusetts 01752, and our telephone number is (508) 373-1100.
Industry Overview
Laser technology has revolutionized a broad range of applications and products in manufacturing, automotive, aerospace, medical, research, consumer electronics, semiconductors and communications. A laser converts electrical energy to optical energy that can be focused and shaped, creating a powerful, concentrated beam that causes materials to melt, vaporize or change their character. In a laser, an energy source excites or pumps a gain medium, which converts the energy from the source into an emission consisting of particles of light, called photons, at particular wavelengths. Lasers provide flexible, non-contact and high-speed ways to process and treat various materials and enable automated production, miniaturization and increasing product complexity.
Lasers are utilized in materials processing applications requiring very high power densities, such as cutting, welding, marking, engraving, additive manufacturing, ablation and cleaning, printing, drilling and cladding. Historically, machine tools such as grinding machines, mechanical saws, milling machines, lathes, presses, water jet cutters, plasma cutters and welding machines have been used to cut, join, form or otherwise process metal in the production of finished goods such as automobiles, consumer appliances, electronics and heavy machinery. Also, lasers are utilized in applications that require consistent and stable operation with lower power densities, such as heating, cleaning and drying. Laser-based systems are gaining share within the materials processing market because of the greater precision, processing speeds and flexibility enabled by this technology. Beyond materials processing, lasers are well-suited for imaging and inspection applications and the ability to confine laser light to narrow wavelengths makes them particularly effective in medical, non-destructive inspection and sensing applications.
Fiber Lasers
Fiber lasers use semiconductor diodes as the energy source to pump a gain medium consisting of specialty optical fibers, which are infused with rare earth ions. These fibers are called active fibers and are comparable in diameter to a human hair. The laser emission is created within optical fibers and delivered through a flexible optical fiber cable. As a result of their different design and components, fiber lasers are more reliable, efficient, robust, compact and easier to operate than gas, crystal and solid state lasers that were initially used in industrial applications. In addition, fiber lasers free the end users from fine mechanical adjustments and the high maintenance costs that are typical for other laser technologies.
Although low power fiber lasers were introduced four decades ago, their increased adoption in the last twenty years has been driven primarily by our improvements in their output power levels and cost, as well as their superior performance, lower cost of ownership and greater reliability compared with other laser and non-laser technologies. We successfully increased output power levels, efficiency and reliability by improving optical components such as diodes and active fibers that increased their power capacities and improved their performance. Fiber lasers now offer output powers that exceed those of other laser technologies in many categories. Our substantial advancements in diode technology, packaging design and other optical components together with increased production volumes over the last two decades reduced the cost and increased the reliability
of our products. As a result, the average cost per watt of output power has decreased dramatically and our fiber lasers effectively compete in many applications that used other laser technologies and non-laser solutions historically. We believe that fiber lasers provide a combination of benefits that include: superior performance; enhanced end user productivity; lower cost of ownership and environmentally friendly operation; greater ease of use; a more compact footprint; and greater choice of wavelengths and more precise beam control. Our strategy is to target new applications where fiber lasers provide benefits compared to use of other laser technologies and non-laser solutions. There remain applications and processes where other laser and non-laser technologies may provide superior performance with respect to particular features or applications notwithstanding the benefits offered by fiber lasers.
Our Competitive Strengths
Our key strengths and competitive advantages include the following:
Leading Producer of Fiber Laser Technology. As a pioneer and technology leader in fiber lasers, we are able to leverage our expertise to drive the proliferation of fiber lasers in existing and new applications.
Vertically Integrated Development and Manufacturing. We develop and manufacture most of our key high-volume specialty components, along with optical heads and other products used in conjunction with our lasers, which we believe enhances our ability to meet customer requirements and accelerate product development.
Manufacturing Scale. We have invested extensively in our production capabilities allowing us to efficiently manufacture and deliver large volumes of fiber lasers in short delivery cycles which provide us with a competitive advantage.
Breadth and Depth of Expertise. Our extensive know-how in materials sciences and experience in optical, electrical, mechanical and semiconductor engineering enable us to develop and manufacture proprietary components, products, accessories and systems and assist customers in improving their manufacturing using our fiber lasers.
Broad Product Portfolio and Ability to Meet Customer Requirements. Our broad range of standard and custom fiber lasers operating at various wavelengths and pulse durations allow us to meet varied customer requirements. Further, our vertically integrated manufacturing and broad technology expertise allow us to design, prototype and commence high-volume commercial production of our products rapidly.
Diverse Customer Base, End Markets and Applications. Our diverse customer base, end markets and applications provide us with many growth opportunities. In 2024, we shipped products to thousands of customers worldwide. Our principal end markets and representative applications within those markets include:
Materials Processing Markets | | | | | | | | |
| End Market | Applications | Principal Products |
| General Manufacturing | Welding, brazing, hardening and cladding | Continuous Wave ("CW") lasers (1-125 kW) and IPG systems |
| Flat sheet, tube and 3D cutting | CW lasers (1-50 kW) and IPG systems |
| Marking, engraving and printing | NS pulsed lasers (10-1,000 W) and Quasi-CW ("QCW") lasers (100-2,000 W) |
| Surface cleaning and texturing, paint and coating stripping | Nanosecond ("NS") pulsed lasers (100-3,000 W), single-mode CW lasers (1-5 kW) and IPG systems |
| Heating and drying | Diode lasers (1-40 kW) |
| Additive Manufacturing | CW lasers (200-6,000 W) |
| Automotive (including Electric Vehicles) | Welding, cleaning, drying, and cutting, including foil cutting | CW and QCW lasers, NS pulsed lasers and IPG systems |
| Cutting of high-strength steel and aluminum | CW lasers (1-20 kW) |
| Welding tailored blanks, frames and auto parts | CW lasers (1-50 kW) |
| Seam welding and brazing | CW lasers( 1-20 kW) and IPG systems |
| Consumer Goods | Micro welding, cutting and marking | QCW and NS pulsed lasers |
| Marking of polymers and other non-metals | Infrared ("IR"), green and ultraviolet ("UV") pulsed lasers |
| Medical Devices | Stent, pacemaker and other medical device manufacturing | CW, NS, Picosecond ("PS") and Femtosecond ("FS") pulsed lasers and IPG systems |
| Energy/Renewable Energy | Hardening and welding of tubes and pipes | CW lasers (4-50 kW) and IPG systems |
| Cladding of turbine blades and drill bits | CW lasers (1-20 kW) |
| Solar cell processing | Green NS pulsed lasers |
| Aerospace, Rail and Shipbuilding | Welding/cutting thick steel plates, titanium | CW lasers (1-50 kW) and IPG systems |
| Percussion drilling of aerospace parts | QCW lasers (1-2 kW) |
| Surface cleaning and texturing, paint and coating stripping and drying | NS pulsed lasers (100-3,000 W), single-mode CW lasers (1-5 kW), diode lasers (1-40 kW) and IPG systems |
| Micro Electronics | Wafer inspection and annealing, disk mastering, flat panel display, LED lift-off | Ultraviolet CW and NS pulsed lasers |
| Processing of glass, ceramics, sapphire, silicon, diamond, Teflon, PCB, CFRP and other non-metals | IR, green and UV NS pulsed lasers, PS and FS pulsed lasers, QCW lasers |
Other Markets | | | | | | | | |
| End Market | Applications | Principal Products |
| Aerospace and Defense | Directed energy | Single-mode CW lasers, amplifiers and diode lasers |
| IR countermeasures, thermal imaging | Mid-IR NS pulsed lasers |
| Medical Procedures | Surgery, urology and soft tissue | Mid-infrared, thulium, FS and laser systems |
| Therapeutic procedures | Diode lasers |
| Aesthetic procedures - skin, wrinkle/hair/tattoo removal | Erbium, thulium, green lasers |
| Dental procedures | Diode lasers |
| Diagnostic procedures | Mid-infrared and FS |
| OEM Instrument Manufacturing | Biomedical analytical instruments, metrology, disinfection/sterilization, environmental and security monitoring, quantum computing | FS, PS, NS and CW lasers, Mid-infrared, IR, visible and UV lasers |
| Scientific | Academic research: sensing, imaging, microscopy, spectroscopy, quantum optics | Mid-infrared, IR, visible and UV lasers; diode, FS, PS, NS and CW lasers, linearly polarized and single frequency lasers and amplifiers |
Products
We design and manufacture a broad range of high-performance fiber lasers and amplifiers. We also make direct diode lasers, packaged semiconductor diodes, laser and non-laser systems and laser based medical systems. Many of our products are designed to be used as general-purpose energy or light sources, making them useful in diverse applications and markets.
Our laser products are based on a common proprietary technology platform using many of the same core components, such as semiconductor diodes and specialty fibers, which we configure to our customers' specifications. Our engineers and scientists work closely with OEMs, system integrators and end users to develop and customize our products for their needs. Because of our flexible and modular product architecture, we offer products in different configurations according to the desired application, including modules, rack-mounted units and tabletop units. Our engineers and other technical experts work directly with the customer in our application and development centers to develop and configure the optimal solution for such customer's requirements. We also manufacture certain complementary products that are used with our lasers, such as optical delivery cables, fiber couplers, beam switches, optical processing heads, process measuring and monitoring technologies and chillers.
Lasers
Our laser products include medium (1 to 999 watts) and high (1,000 watts and above) output power lasers from 0.3 to 5.2 microns in wavelength. These lasers may be CW, QCW or pulsed. Our pulsed line includes nanosecond, picosecond and femtosecond lasers. We offer lasers with different gain mediums and wavelengths. The gain mediums are ytterbium, erbium and thulium, as well as Raman and hybrid fiber-solid state lasers using our crystal technology. We produce hybrid fiber-solid state lasers at green and ultraviolet wavelengths for a range of micro processing applications and in the mid-IR spectrum for sensing, imaging and spectroscopy applications. We also sell fiber pigtailed packaged diodes as components for pumping applications, and fiber coupled direct diode laser systems that use semiconductor diodes rather than optical fibers as their gain medium. In addition, we offer high-energy pulsed lasers, multi-wavelength lasers, tunable lasers, single-polarization and single-frequency lasers, as well as other versions of our products.
We believe that we produce the highest power solid-state lasers in the industry. Our ytterbium fiber lasers reach power levels of up to 125,000 watts. We also make single-mode and low-mode output ytterbium fiber lasers with power levels of up to 20,000 watts and single-mode, erbium and thulium fiber lasers with power levels of up to 4,000 watts.
For 2024 fiscal year, high power continuous wave ("CW") lasers accounted for 34% of revenue and were 41% and 43% of revenue, in 2023 and 2022, respectively. Pulsed lasers accounted for 15%, 14%, and 18% of revenue in 2024, 2023 and 2022, respectively.
Accessories
We manufacture and sell accessories that include high power optical fiber delivery cables, fiber couplers, beam switches, chillers and scanners for our fiber lasers. We are expanding our line of cutting and welding optical processing heads for use with our fiber lasers and sell devices for in-line coherent monitoring for welding.
Systems
In addition to selling laser sources, we also offer integrated laser systems for particular geographic markets or custom-developed for a customer's manufacturing requirements. We offer a LightWELD product line, which is a handheld laser welding system to provide fabricators a laser-based solution for welding. We also offer 2D compact flat sheet cutter systems and multi-axis systems for fine welding, cutting and drilling. We produce high precision laser systems for the medical technology industry. We also offer a welding seam stepper and picker, which is an automated fiber laser welding tool providing customers increased processing speeds, better quality and the elimination of certain clamping tools. Our subsidiary Genesis Systems Group, LLC provides laser and non-laser robotic welding and automation solutions. IPG also develops and sells specialized fiber laser systems for unique material processing applications as requested by customers desiring complete laser-based solutions. For the 2024, 2023 and 2022 fiscal years, laser and non-laser systems accounted for 14%, 13%, and 11%, respectively, of revenues.
Our Markets
We broadly classify our principal end markets as material processing, medical procedures, advanced applications and communications. With the sale of our telecom transmission product lines in August 2022, we no longer intend to target
communications as a principal market. The following table shows the allocation of our net sales (in thousands) among our principal markets:
| | | | | | | | | | | | | | | | | | | | | | | | | | | | | | | | | | | | | | |
| | | Year Ended December 31, |
| | | 2024 | | 2023 | | 2022 |
| | | | | % of Total | | | | % of Total | | | | % of Total |
| Materials processing | | $ | 857,336 | | | 87.7 | % | | $ | 1,152,804 | | | 89.5 | % | | $ | 1,291,262 | | | 90.3 | % |
| Medical procedures | | 61,040 | | | 6.3 | % | | 71,571 | | | 5.6 | % | | 70,402 | | | 4.9 | % |
| Advanced applications | | 53,778 | | | 5.5 | % | | 55,576 | | | 4.3 | % | | 54,308 | | | 3.8 | % |
| Communications | | 4,980 | | | 0.5 | % | | 7,488 | | | 0.6 | % | | 13,575 | | | 1.0 | % |
| Total | | $ | 977,134 | | | 100.0 | % | | $ | 1,287,439 | | | 100.0 | % | | $ | 1,429,547 | | | 100.0 | % |
These estimates are based upon customer information and when customer information has not been provided, upon our best information and belief.
Materials Processing
The most significant materials processing applications for fiber lasers are welding and brazing and cutting. Other applications include marking and engraving, cleaning, additive manufacturing such as laser sintering and 3D printing, precision processing, drilling, heat treating, annealing and heating and drying.
Welding and Brazing Applications. Laser welding offers several important advantages compared to conventional welding technology as it is non-contact, precise, easy to automate, provides high process speed and results in narrow-seamed, high-quality welds that generally require little or no post-processing machining. The high beam quality of our fiber lasers coupled with high CW power offer deep penetration welding as well as shallow conduction mode welding. Adjustable mode beam (AMB) lasers allow beam tunability for spatterless, precise high-quality welding required in electric vehicle battery manufacturing. In addition, fiber lasers enable remote welding "on the fly," a flexible method of three-dimensional welding in which the laser beam is positioned by a robot-guided scanner. Remote welding stations equipped with fiber lasers are used for welding door panels, seat backs, spot and lap welds over the entire auto body frame ("body-in-white") and tailor welded blanks for automotive applications. We also offer a real-time weld monitoring system to determine weld quality in an integrated solution. Our LightWELD product line offers a handheld laser welding system that is easier to learn and operate than traditional solutions and offers high process consistency. Our products are used also for laser brazing of visible joints in automobiles such as tailgates, roof joints and columns. Brazing is a method of joining sheet metal by using a melted filler material similar to soldering but requiring higher temperatures.
Cutting Applications. Laser-based cutting technology has several advantages compared to alternative technologies. Laser cutting is fast, flexible and highly precise and can be used to cut complex contours on flat, tubular or three-dimensional materials. The laser source can be programmed to process many different kinds of materials such as steel, aluminum, brass, copper, glass, ceramic and plastic at various thicknesses. Laser cutting technology is a non-contact process that is easy to integrate into an automated production line and is not subject to wear of the cutting medium. We sell mid and high power ytterbium fiber lasers for laser cutting. Our high power pulsed lasers are used in thin foil cutting applications in electric vehicle battery production. High electrical efficiency, low maintenance and operating cost, excellent beam quality, wide operating power range, power stability and small spot size are some of the qualities offered by IPG fiber lasers for many cutting applications, which enable customers to cut a variety of materials faster.
Medical Procedures
We sell our commercial fiber and diode laser modules, subassemblies and complete systems to medical device manufacturers that incorporate our products into their devices. Our ultrafast, CW and QCW ytterbium, erbium, thulium fiber and hybrid lasers with average power from 1 to 200 watts, and diode laser systems can be used in various medical and biomedical applications. We have also developed and are now selling medical laser systems and consumable fibers for applications, including benign prostatic hyperplasia and lithotripsy, as an OEM and, in certain territories, as an IPG-branded product. Aesthetic applications addressed by IPG lasers include skin rejuvenation, hair removal, and treatment of pigmented and vascular lesions.
Advanced Applications
Our fiber lasers and amplifiers are utilized by commercial firms and by academic and government institutions worldwide for advanced and scientific applications. These markets may sell specialty products developed by us or our commercial products. Representative applications include directed energy, spectroscopy, optical trapping, remote sensing, LIDAR and materials characterization.
Technology
Our products are based on our proprietary technology platform that we have developed and refined since our formation. The following technologies are key elements in our products.
Specialty Optical Fibers
We have extensive expertise in the disciplines and techniques that form the basis for the multi-clad active and passive optical fibers used in our products. We believe that our large portfolio of specialty active and passive optical fibers has a number of advantages as compared to other commercially available optical fibers. Using our knowledge of optical fibers, we recently extended our product line by manufacturing fibers used as a consumable component with our proprietary medical laser systems.
Semiconductor Diode Laser Processing and Packaging Technologies
We use multiple multi-mode, or broad area, single-emitter diodes rather than diode bars or stacks as a pump source. We believe that multi-mode single-emitter diodes are the most efficient and reliable pumping source presently available, surpassing diode bars and stacks in efficiency, brightness and reliability. Single-emitter diodes have substantially reduced cooling requirements and typically have long lifetimes at high operating currents, compared to typical lifetimes of diode bars.
We developed advanced molecular beam epitaxy techniques to grow aluminum indium gallium arsenide wafers for our diodes. This method yields high-quality optoelectronic material for low-defect density and high uniformity of optoelectronic parameters. In addition, we have developed numerous proprietary wafer processes and testing and qualification procedures in order to create a high energy output in a reliable and high power diode. Our diode is packaged to dissipate heat produced by the diode and withstands vibration, shock, high temperature, humidity and other environmental conditions, enabling world-class reliability and efficiency of the products.
Specialty Components and Combining Techniques
We developed a wide range of advanced optical components that are capable of handling high optical power levels and contribute to the superior performance, efficiency and reliability of our products. In addition to fibers and diodes, our optical component portfolio includes fiber gratings, couplers, isolators, combiners, and crystals. We also developed special methods and expertise in splicing fibers together with low optical energy loss and on-line loss testing. We believe that our internal development and manufacturing of key optical components allows us to lower our manufacturing costs and improve product performance and reliability.
Side Pumping of Fibers and Fiber Block Technologies
Our technology platform allows us to efficiently combine a large number of multi-mode single-emitter semiconductor diodes with our active optical fibers that are used in all of our products. A key element of this technology is that we pump our fiber lasers through the cladding surrounding the active core. We splice our specialty active optical fibers with other optical components and package them in a sealed box, which we call a fiber block. The fiber blocks are compact and are designed to eliminate the risk of contamination or misalignment due to mechanical vibrations and shocks as well as temperature or humidity variations. Our design is scalable and modular, permitting us to make products with high output power by coupling a large number of diodes with fiber blocks, which can be combined in parallel and serially.
High-Stress Testing
We employ high-stress techniques in testing components and final products that help increase reliability and accelerate product development. For example, we test all of our diodes with high current and temperatures to identify and eliminate potentially unreliable diodes. We also have built a large database of diode test results that allows us to predict the estimated lifetime of our diodes. This testing allows us to eliminate defective diodes prior to further assembly and thus increase reliability.
Research and Development
We perform research and development to develop new products or components, improve existing products or components, develop new applications for our products and improve our manufacturing processes.
We research, develop and manufacture most of the key components of our lasers. In addition to our cladding-pumped specialty fiber platform, we have core competencies in high power multi-mode and single-mode semiconductor diodes, diode packaging, specialty active and passive optical fibers, high-performance optical components, crystal growth and processing, fiber gain blocks and fiber modules, thin film optical coatings, as well as splicing and combining techniques and high-stress test
methods. The strategy of developing our proprietary components has allowed us to leverage our optical experience and large volume requirements to lower the cost of our products.
Our research and development supports expanding and improving our product line by increasing power levels, improving beam quality and electrical efficiency, decreasing the size of our products and lowering the cost per watt. We are engaged in research projects to expand the spectral range of products that we offer. We are investing our research and development funds on laser systems and products for medical applications.
We have assembled a team of scientists and engineers with specialized experience and knowledge in fiber lasers and amplifiers, materials science, optics, critical components, testing and manufacturing process design, and laser application development. Our team of experienced scientists and engineers works closely with many of our customers to develop and introduce custom products and laser processing that address specific applications and performance requirements.
We incurred research and development costs of approximately $109.8 million, $98.7 million and $116.1 million for the years ended December 31, 2024, 2023 and 2022, respectively. We expect to continue our commitment to research and development and to introduce new products, systems and complementary products. See Item 7, "Management's Discussion and Analysis of Financial Condition and Results of Operations."
Intellectual Property
We rely on the technical expertise, creativity, and knowledge of our personnel, and we utilize trade secret, patent, trademark, copyright and contractual protections to maintain our competitive position and protect our proprietary rights in our products and technology. While our intellectual property rights are important to our success, we believe that our business as a whole is not materially dependent on any particular patent, trademark, copyright or other intellectual property right. IPG has used, registered or applied to register a number of trademark registrations in the United States and in other countries.
As of December 31, 2024, we have over 850 patents issued and over 350 pending patent applications worldwide. Intellectual property rights, including those that we own, those that we license and those of others, involve significant risks. See Item 1A, "Risk Factors — We are subject to litigation alleging that we infringe third-party intellectual property rights. Intellectual property claims could result in costly litigation and harm our business." and "Risk Factors — Our inability to protect our intellectual property and proprietary technologies could result in the unauthorized use of our technologies by third parties, hurt our competitive position and adversely affect our operating results."
Manufacturing
Vertical integration is one of our core business strategies through which we control our proprietary processes and technologies as well as the supply of key components and assemblies. Our vertically integrated manufacturing operations include the manufacturing or assembly of optical preforms, specialty fiber, semiconductor wafers, semiconductor diode chips and packaged semiconductor diodes, specialty optical components, fiber blocks, fiber laser modules, power supplies, circuit boards, electronics and control systems and software, crystals, chillers, housings and cabinets and final assembly of finished product. In addition, we make some of the automated production systems, tools and fixtures and testing systems that we use in our own manufacturing processes. Over the last several years, we added additional production capabilities, including multi-wafer growth reactors, diode test stations, fiber preform and fiber drawing equipment and mid and high power laser production and testing, in order to increase our capacity as well as reduce the risks associated with our production processes.
We operate our own semiconductor foundry for the production of multi-mode single-emitter diodes used as pump sources in our lasers. We also process, package and extensively test all of our diodes. We developed proprietary components and accessories, manufacturing tools, equipment and techniques over many years in an effort to address the major issues that had been inhibiting the development of fiber laser technology and to provide products that differentiate us from our competitors. In addition, we have acquired the technology to produce additional components, such as volume Bragg gratings and crystals. Using our technology platform, we configure standard laser and amplifier products based upon each customer's specifications. We have developed proprietary testing methodologies that allow us to develop higher power components and products in short periods of time, enable us to introduce products to the market more quickly, capitalize on new opportunities and provide superior service to our customers. In our materials processing systems business, we manufacture standard configuration systems and also systems customized for specific customer requirements. We purchase common and specialized mechanical, electrical and optical parts and raw materials from vendors.
Sales, Marketing and Support
We market our products internationally primarily through our direct sales force. Our direct sales force sells to end users, OEMs and systems integrators. Once our fiber laser products are designed into an OEM system, the OEM's sales force markets its systems, allowing us to leverage our sales capability through the OEM sales channels because the OEMs typically have several salespersons in locations other than where our sales offices are located. We have sales and service offices and
application development centers in the Americas, Europe and Asia. To a lesser extent, we market through agreements with independent sales representatives and distributors, but we do use such channels more widely for our LightWELD product. In 2023, we entered into a strategic partnership with Miller Electric Mfg. LLC, a leading worldwide manufacturer of arc welding products, to further promote laser solutions for handheld welding applications. We typically provide one to five-year parts and service warranties on lasers. Most of the Company's sales offices provide support to customers in their respective geographic areas.
Customers
We sell our products globally to OEMs, system integrators and end users in a wide range of diverse markets who have the in-house engineering capability to integrate our products into their own systems. We also sell complete laser and non-laser solutions to end users for their production needs. We have thousands of customers worldwide.
Competition
Our markets are highly competitive and characterized by rapidly changing technology, continuously evolving customer requirements and reduced average selling prices over time. In the materials processing market, we compete with makers of fiber lasers and other lasers, such as Coherent, Inc., Laserline GmbH, Lumentum Holdings Inc., Maxphotonics Co., Ltd., MKS Instruments, Inc., nLight, Inc., Trumpf GmbH + Co. KG and Wuhan Raycus Fiber Laser Technologies Co. Ltd., as well as other smaller competitors. Some of our customers have developed products for their own use which are competitive to our products. Such vertical integration by our customers could reduce the market opportunity for our products. Many of our fiber laser competitors are increasing the output powers of their fiber lasers and reducing sales prices to compete with our products.
We also compete with our customers that produce their own laser technology as well as with manufacturers of non-laser methods and tools, such as traditional non-laser welding, cutting dies, mechanical cutters and plasma cutters in the materials processing market.
Some of our competitors are larger than we are and have substantially greater financial, managerial and technical resources, more extensive distribution and service networks, greater sales and marketing capacity, and larger installed customer bases than we do.
Backlog
At December 31, 2024, our backlog of orders (generally scheduled for shipment within one year) was approximately $636.2 million compared to $691.4 million at December 31, 2023. At December 31, 2024, our backlog included $371.1 million of orders with firm shipment dates and $265.1 million of frame agreements that we expect to ship within one year, compared to $401.1 million of orders with firm shipment dates and $290.3 million of frame agreements at December 31, 2023. Frame agreements are non-binding indications of customer pricing and volume levels but are not firm customer purchase obligations with delivery dates. Orders used to compute backlog are generally cancellable without substantial penalties or any penalties. We anticipate shipping a substantial majority of the present backlog during fiscal year 2025. However, our backlog at any given date is not necessarily indicative of actual sales for any future period.
Employees and Human Capital Management
Our employees are our most valuable assets. They contribute to IPG’s success and, in particular, the skilled and experienced employees within our manufacturing, sales, service, research and development and quality assurance departments are instrumental in driving operational execution and strong financial performance, advancing innovation and maintaining a strong quality and compliance program.
As of December 31, 2024, we had approximately 4,740 full-time employees, including 410 in research and development, 3,550 in manufacturing and service operations, 380 in sales and marketing, and 400 in general and administrative functions. As a global company, our employees are distributed throughout our more than thirty locations in twenty-four countries. Of our total full-time employees, approximately 1,940 were in the United States and 1,630 were in Germany. We have never experienced a work stoppage, and none of our employees at our principal manufacturing facilities are subject to a collective bargaining agreement.
The success and growth of IPG’s business is dependent in large part on our ability to attract, retain and develop a diverse population of talented and high-performing employees at all levels of our organization. For our research, engineering and production management positions, we require employees with university and graduate-level degrees in physics, optics, electrical, mechanical and software engineering. Globally, the demand for employees with such levels of education is high and competitive.
To succeed in these conditions, IPG implements key recruitment and retention strategies, objectives and effectiveness measures as part of the overall management of our business. These core strategies are advanced through the following programs, policies and initiatives:
Competitive Pay and Benefits. IPG’s compensation programs are designed to align the compensation of our employees, who operate in a highly competitive and technologically challenging environment, with IPG’s business performance and to provide the proper incentives to attract, retain and motivate employees to achieve superior performance. The structure of our compensation programs balances incentive earnings for both short-term and long-term performance. Specifically:
•We provide employee wages that are competitive and consistent with employee’s positions, skill levels, experience, knowledge and geographic location.
•All employees participate in our annual cash bonus program, allowing them to share in the profitability and business performance of IPG. We also generally provide equity grants and an employee stock purchase plan to salaried employees consistent with geographic compensation practices and subject to regulatory compliance. These programs further align our employees’ financial interests with the performance of the business and the interests of our stockholders.
•We generally provide annual increases and incentive compensation based on merit.
•We purchase compensation data from a compensation and benefits consulting firm to allow us to ensure we provide competitive compensation in each of the geographic locations in which we operate.
•We align our executives’ annual and long-term equity compensation with our stockholders’ interests by linking realizable pay with operating metrics and stock performance.
•We provide comprehensive benefit options designed to retain our employees and support their families in living healthier and more secure lives.
Employee recruitment, retention and development. IPG is committed to attracting the best talent from a broad array of sources to meet the current and future demands of our business. We have established relationships with trade schools, world-class universities, professional associations and industry groups to proactively attract talented and capable new hires. IPG sponsors formal apprentice and internship programs to build leadership capabilities for the future. IPG has a strong employee value proposition with a culture of innovation, driven by entrepreneurial spirit and embraced within an environment of individual respect, dignity and caring.
We monitor employee turnover rates as our success depends upon retaining and investing in our highly trained manufacturing and technical staff. IPG strives to decrease voluntary turnover rates and thereby increase employee tenure by ensuring a combination of competitive compensation, individual developmental opportunities and personal career enrichment and growth. Our retention at the technical, professional and executive levels is high.
Executive Officers of the Registrant
The following table sets forth certain information regarding our executive officers as of February 20, 2025:
| | | | | | | | | | | | | | |
| Name | | Age | | Position with the Company |
| Mark M. Gitin, Ph.D. | | 58 | | Chief Executive Officer |
| Angelo P. Lopresti | | 61 | | General Counsel, Secretary and Senior Vice President |
| Timothy P.V. Mammen | | 55 | | Chief Financial Officer and Senior Vice President |
| Trevor D. Ness | | 52 | | Senior Vice President, Sales and Strategic Business Development |
| Igor Samartsev, Ph.D. | | 61 | | Senior Vice President, Chief Scientist |
Mark M. Gitin, Ph.D. has served as the Chief Executive Officer of the company since June 2024. Previously, Dr. Gitin served in a number of positions at MKS Instruments, including Executive Vice President and General Manager of MKS's Photonics Solutions Division since 2023. Prior to that, he served as Senior Vice President and General Manager of the Photonics Solutions Division from 2019 to 2023, and Vice President and General Manager of MKS's Photonics Business Unit from 2017 to 2019 and in 2018 he also assumed responsibility for the Instruments and Motion Business Unit. Prior to joining MKS, from March 1995 to September 2017, Dr. Gitin held various management positions covering a wide range of technologies at Coherent, Inc., including Vice President of Strategic Marketing, Vice President of Business Development, and Vice President and General Manager of the Diodes, Fibers and Systems Business Unit. Dr. Gitin holds a B.S. in Electrical Engineering from University of California, Davis and an M.Eng. and Ph.D. in Electrical Engineering from Cornell University.
Angelo P. Lopresti has served as our General Counsel, Secretary and Vice President since February 2001. He was promoted to Senior Vice President in February 2013. Prior to joining us, Mr. Lopresti was a partner at the law firm of
Winston & Strawn LLP from 1999 to 2001. He was a partner at the law firm of Hertzog, Calamari & Gleason from 1998 to 1999 and an associate there from 1991 to 1998. He served on the board of Coastway Bancorp, Inc. from 2016 to 2018, prior to its acquisition by HarborOne Bancorp, Inc. Mr. Lopresti holds a B.A. in Economics from Trinity College and a J.D. from the New York University School of Law.
Timothy P.V. Mammen has served as our Chief Financial Officer since July 2000 and as Vice President since November 2000. He was promoted to Senior Vice President in February 2013. Between May 1999 and July 2000, Mr. Mammen served as the Group Finance Director and General Manager of the United Kingdom operations for IPFD. Mr. Mammen was Finance Director and General Manager of United Partners Plc, a commodities trading firm, from 1995 to 1999 and, prior to that, he worked in the finance department of E.I. du Pont de Nemours and Company. Mr. Mammen holds an Upper Second B.Sc. Honours degree in International Trade and Development from the London School of Economics and Political Science. He is a Chartered Accountant and a member of the Institute of Chartered Accountants of Scotland.
Trevor D. Ness has served as our Senior Vice President, Sales and Strategic Business Development since February 18, 2022. Prior to that, he was Senior Vice President, World Wide Sales and Marketing, from February 2013 to 2022. From January 2011 until February 2013, he served as our Vice President-Asian Operations. Prior to joining us, Mr. Ness was Director of GSI Precision Technologies China from May 2005 to December 2010 and prior to that he held technical sales management roles with GSI Group, Inc. and Cobham Plc, located in UK, Japan and Taiwan. Through 2000, Mr. Ness performed a variety of roles in the UK, including Service and Aftersales Management. Mr. Ness holds a B.S. in Geology from Imperial College, a H.N.C. from Bournemouth University and an M.B.A. from The Open University.
Igor Samartsev, Ph.D. has served as our Senior Vice President, Chief Scientist since February 2022. Prior to that, he was Chief Technology Officer from 2011 to 2022 and Deputy General Manager of one of our foreign subsidiaries from 2005 to 2011 after having served in technical leadership roles there. Dr. Samartsev holds a Ph.D. in Physics from the Imperial College London.
Seasonality
Our net sales can fluctuate from quarter to quarter with general economic trends, specific industry cycles, holidays in foreign countries such as Lunar New Year in the first quarter of our fiscal year and the timing of capital expenditures by our customers.
Government Regulation
Regulatory Compliance
The majority of our laser and amplifier products sold in the United States are classified as Class IV Laser Products under the applicable rules and regulations of the Center for Devices and Radiological Health ("CDRH") of the U.S. Food and Drug Administration ("FDA"). The same classification system is applied in the European markets. Safety rules are formulated with "Deutsche Industrie Norm" (i.e., German Industrial Standards) or International Organization for Standardization ("ISO") standards, which are internationally harmonized. CDRH regulations generally require a self-certification procedure pursuant to which a manufacturer must submit a filing to the CDRH with respect to each product incorporating a laser device, make periodic reports of sales and purchases and comply with product labeling standards, product safety and design features and informational requirements.
Our business activities are subject to various export controls and trade and economic sanctions laws and regulations, including, without limitation, the U.S. Commerce Department’s Export Administration Regulations, the U.S. Treasury Department’s Office of Foreign Assets Control’s trade and economic sanctions programs, the U.S. Department of State’s Nonproliferation Sanctions and International Traffic in Arms Regulations, as well as those of the European Community and Germany, which we collectively refer to as Trade Controls. We further discuss the impact of such Trade Controls under "Risk Factors" in Item 1A "—We must comply with and could be impacted by various export controls and trade and economic sanctions laws and regulations that could negatively affect our business and may change due to diplomatic and political considerations outside of our control."
Environmental Regulation
Our operations are subject to various federal, state, local and international laws governing the environment, including those relating to the storage, use, discharge, disposal, product composition and labeling of, human exposure to and hazardous and toxic materials. In the event of an accident involving such materials, we could be liable for damages and such liability could exceed the amount of our liability insurance coverage and the resources of our business.
We face increasing complexity in our product design and procurement operations due to the evolving nature of environmental compliance regulations and standards, as well as specific customer compliance requirements. These regulations and standards have an impact on the material composition of our products entering specific markets. For example, the European Union ("EU") adopted the Restriction of the use of Certain Hazardous Substances in Electrical and Electronic Equipment (RoHS) and Registration, Evaluation, Authorization and Restriction of Chemicals (REACH), and China enacted the Management Methods for Controlling Pollution Caused by Electronic Information Products Regulation (China-RoHS). In addition to these regulations and directives, we may face costs and liabilities in connection with product take-back legislation.
Climate and Sustainability Reporting and Regulation
We operate in various jurisdictions around the world, including the U.S. and certain states, the European Union, and the United Kingdom, that have adopted or proposed laws related to climate and sustainability reporting. For example, the European Parliament adopted the Corporate Sustainability Reporting Directive (CSRD), which will introduce additional due diligence and disclosure requirements addressing sustainability that we expect will apply to us in the coming years. These and future laws, regulations or policies could significantly increase our operational and compliance burdens and costs.
For further discussion of risks relating to the regulations to which we are subject, see Item 1A. Risk Factors.
Availability of Reports
Our annual reports on Form 10-K, quarterly reports on Form 10-Q, current reports on Form 8-K and any amendments to such reports are available free of charge on our website at www.ipgphotonics.com as soon as reasonably practicable after such reports are electronically filed with, or furnished to, the Securities and Exchange Commission ("SEC"). The SEC maintains an internet site that contains reports, proxy and information statements and other information regarding issuers that file electronically with the SEC at www.sec.gov. We will also provide electronic or paper copies of such reports free of charge, upon request made to our Corporate Secretary. The information included on our website is not a part of, nor is it incorporated by reference into, this annual report on Form 10-K.
ITEM 1A. RISK FACTORS
The factors described below are the principal risks that could materially adversely affect our operating results and financial condition. Other factors may exist that we do not consider significant based on information that is currently available. In addition, new risks may emerge at any time and we cannot predict those risks or estimate the extent to which they may affect us.
Risks Relating to Economic Conditions
Uncertainty and adverse changes in the general economic conditions of markets in which we participate negatively affect our business.
Current and future conditions in the economy have an inherent degree of uncertainty. As a result, it is difficult to estimate the level of growth or contraction for the economy as a whole. It is even more difficult to estimate growth or contraction in various parts, sectors and regions of the economy, including the materials processing, medical procedures and advanced applications in which we participate. Because all components of our budgeting and forecasting are dependent upon estimates of growth or contraction in the markets and applications we serve and demand for our products, the prevailing economic uncertainties render estimates of future income and expenditures very difficult to make. A significant portion of our sales are to customers in China, which accounted for 25%, 28% and 34% of net sales in 2024, 2023 and 2022, respectively. Slowing economic growth or recession, tariff-trade wars or other adverse economic developments or uncertainty in any of our key markets, including in China, may result in a decrease in our sales. In addition, the new presidential administration has articulated that it may impose substantial new or increased tariffs on foreign imports into the U.S. Adverse changes have occurred and may occur in the future as a result of declining or flat global or regional economic conditions, fluctuations in currency and commodity prices, wavering confidence, capital expenditure reductions, unemployment, declines in stock markets, contraction of credit availability, declines in real estate values, or other factors affecting economic conditions generally. These changes may negatively affect the sales of our products, increase exposure to losses from bad debts, increase the cost and decrease the availability of financing, increase the risk of loss on investments, or increase costs associated with manufacturing and distributing products. An economic downturn could have a material adverse effect on our business, financial condition and results of operations.
Downturns in the markets we serve, particularly materials processing, could have a material adverse effect on our sales and profitability.
Our business depends substantially upon capital expenditures by manufacturers in the materials processing market, which includes general manufacturing, automotive, aerospace, other transportation, heavy industry, electronics and photovoltaic industries. Approximately 88% of our revenues in 2024 were from customers in the materials processing market. Although applications in this market are broad, sales for these applications are cyclical and have historically experienced sudden and severe downturns and periods of oversupply, resulting in significantly reduced demand for capital equipment, including the products that we manufacture and market. For the foreseeable future, our operations will continue to depend upon capital expenditures by customers in these industries or markets, which, in turn, depend upon the demand, as well as forecasted demand, for their products or services. A softening of demand for our customers' products and services, whether caused by a weakening of the U.S. or global economies or other factors, may result in decreased revenue or growth for our customers and may lead to decreased demand for our products, which would reduce our sales and margins. We may not be able to respond by decreasing our expenses quickly enough or sufficiently, due in part, to our fixed overhead structure related to our vertically integrated operations and our commitments to continuing investment in research and development and infrastructure for long term growth.
Risks Relating to Industry Dynamics and Competition
The markets for our products are highly competitive and currently subject to significant price and technological competition, and if we are unable to compete successfully, it could result in reduced sales, reduced gross margins or the loss of market share.
We operate in industries that are characterized by significant price and technological competition. We compete with makers of fiber lasers, solid-state lasers, direct diode lasers, high power CO2, YAG and disc lasers. These include public and private companies such as Coherent, Inc., Laserline GmbH, Lumentum Holdings Inc., Maxphotonics Co., Ltd., MKS Instruments, Inc., nLight, Inc., Trumpf GmbH + Co. KG, and Wuhan Raycus Fiber Laser Technologies Co. Ltd., as well as other smaller competitors. Several of these are larger and have substantially greater financial, managerial and technical resources, more extensive distribution and service networks, greater sales and marketing capacity, and larger installed customer bases than we do. Many of our fiber laser competitors are increasing the output powers, improving the quality of their fiber lasers and decreasing prices to compete with our products. Many of our competitors in Asia are beginning to export their fiber lasers and fiber laser-based systems to non-Asia markets, which may impact our pricing and sales in such markets. Our current or potential customers may decide to develop and produce products for their own use which are competitive to our products. Such vertical integration could reduce the market opportunity for our products. We also compete in the materials processing, advanced and medical applications markets with end users that produce their own solid-state and gas lasers as well as with manufacturers of non-laser methods and tools, such as traditional non-laser welding, cutting dies mechanical cutters and plasma cutters in the materials processing market and other energy-based devices in the medical market.
We may not be able to successfully differentiate our current and proposed products from our competitors' products and current or prospective customers may not consider our products to be superior to competitors' products. To maintain our competitive position, we believe that we will be required to continue a high level of investment in research and development, application development, manufacturing facilities and customer service and support, and to react to market pricing conditions. As a result of the foregoing factors, competitive pressures have resulted in price reductions, reduced margins, loss of sales and loss of market share.
The laser industry is experiencing declining average selling prices, which could cause our gross margins to decline and harm our operating results.
Our products are experiencing and may in the future continue to experience a significant decline in average selling prices ("ASPs") as a result of increased competition, pressure to reduce prices from significant customers and new product and technology introductions. Market participants, particularly in China, have reduced and may continue to reduce, prices of competing products to gain market share. If the ASPs of our products decline further and we are unable to increase our unit volumes, introduce new or enhanced products with higher margins or reduce manufacturing costs to offset anticipated decreases in the prices of our existing products, our operating results may be adversely affected. In addition, because of our significant fixed costs, we are limited in our ability to reduce total costs quickly in response to any revenue shortfalls. Because of these factors, we have experienced and we may experience in the future material adverse fluctuations in our operating results on a quarterly or annual basis if the ASPs of our products continue to decline.
Our ability to maintain or increase sales depends upon our ability to develop new products, penetrate new applications and end markets for fiber lasers and maintain or increase our market share in existing applications.
Our level of sales will depend on our ability to generate sales of fiber lasers in new and developing markets including applications for lasers where they have not been used previously and in applications that use other lasers, such as CO2 and YAG lasers. Historically, a significant portion of our revenue growth has been derived from sales of fiber lasers primarily for applications where CO2 and YAG lasers historically have been used. We have made significant sales into the cutting, welding and marking and engraving applications, large applications where the use of other laser technologies was well established. As fiber lasers increase penetration in core materials processing applications and there is more competition in these core material processing applications, the development of new applications, end markets and products outside our core applications becomes more important to our ability to generate sales growth. In order to maintain or increase market demand for our products, we will need to devote substantial resources to:
•demonstrate the effectiveness of fiber lasers in new applications for materials processing, medical and advanced applications;
•successfully develop new product lines, such as the handheld welder, UV, visible and ultrafast fiber lasers with competitive features that extend our product line;
•increase our direct and indirect sales efforts;
•effectively meet growing competition and pricing pressures; and
•continue to reduce our manufacturing costs and enhance our competitive position.
Potential customers may have substantial investments and know-how related to their existing laser and non-laser technologies and processes. They may perceive risks relating to the reliability, quality, usefulness and profitability of integrating fiber lasers in their systems when compared to other laser or non-laser technologies available in the market or that they manufacture themselves. Despite fiber lasers having better performance and prices compared to other lasers or tools, OEM customers may be reluctant to switch incumbent suppliers or we may miss the design cycles of our customers. Many of our target markets, such as the automotive, machine tool and other manufacturing, communications and medical industries, have historically adopted new technologies slowly. These markets often require long test and qualification periods or lengthy government approval processes before adopting new technologies.
If we are unable to successfully implement our strategy to develop new applications and end markets for our products or develop new products, our revenues, operating results and financial condition could be adversely affected. In addition, any newly developed or enhanced products may not achieve market acceptance or may be rendered obsolete or less competitive by the introduction of new products by other companies.
We depend on our OEM customers and system integrators to incorporate our products into their systems.
Our sales depend in part on our ability to maintain existing and secure new OEM customers. Our revenues also depend in part upon the ability of our current and potential OEM customers and system integrators to incorporate our laser and amplifier products. The commercial success of these systems depends to a substantial degree on the efforts of these OEM customers and system integrators to develop and market products that incorporate our technologies. Relationships and experience with traditional laser makers, limited marketing resources, reluctance to invest in research and development and other factors affecting these OEM customers and third-party system integrators could have a substantial impact upon our financial results. If OEM customers or integrators are not able to adapt existing tools or develop new systems to take advantage of the features and benefits of fiber lasers or if they perceive us to be an actual or potential competitor, then the opportunities to increase our revenues and profitability may be severely limited or delayed. Furthermore, if our OEM customers or third-party system integrators experience financial or other difficulties that adversely affect their operations, our financial condition or results of operations may also be adversely affected.
Risks Relating to Our Operations
Our vertically integrated business results in high levels of fixed costs and inventory levels that may adversely impact our gross profits and our operating results in the event that demand for our products declines or we maintain excess inventory levels.
We have a high fixed cost base due to our vertically integrated business model. Approximately 75% of our approximately 4,740 employees as of December 31, 2024 were employed in our manufacturing operations. We may not adjust these fixed costs quickly enough or sufficiently to adapt to rapidly changing market conditions. Our gross profit, in absolute dollars and as
a percentage of net sales, is impacted by our sales volume, the corresponding absorption of fixed manufacturing overhead expenses and manufacturing yields. In addition, because we are a vertically integrated manufacturer and design and manufacture our key specialty components, insufficient demand for our products may subject us to the risks of high inventory carrying costs and increased inventory obsolescence. If our capacity and production levels are not properly sized in relation to expected demand, we may need to record write-downs for excess or obsolete inventory. Because we are vertically integrated, the rate at which we turn inventory has historically been low when compared to our cost of sales. We do not expect this to change significantly in the future and believe that we will have to maintain a relatively high level of inventory compared to our cost of sales. As a result, we expect to have a significant amount of working capital invested in inventory. Changes in our level of inventory lead to an increase in cash generated from our operations when inventory is sold or a decrease in cash generated from our operations at times when the amount of inventory increases. Decreases in inventory may decrease our overhead absorption and decrease our gross margins and profitability.
Our manufacturing capacity and operations may not be appropriate for future levels of demand and may adversely affect our gross margins.
We have added and are continuing to add substantial manufacturing capacity at our facilities in the United States, Germany, Italy and Poland. A significant portion of our manufacturing facilities and production equipment, such as our semiconductor production and processing equipment, diode packaging equipment and diode burn-in stations, are special-purpose in nature and cannot be adapted easily to make other products. If the demand for fiber lasers or amplifiers does not increase or if our revenue decreases from current levels, we may have significant excess manufacturing capacity and under-absorption of our fixed costs, which could in turn adversely affect our gross margins and profitability.
To maintain our competitive position and to meet anticipated demand for our products, we invest significantly in the expansion of our manufacturing and operations throughout the world and may do so in the future. Recent expansions of capacity were required to offset the loss of capacity at our factories in Russia and Belarus due to sanctions. In connection with these projects, we may incur cost overruns, construction delays, project cancellations, labor difficulties or regulatory issues which could cause our capital expenditures to be higher than what we currently anticipate, possibly by a material amount, which would in turn adversely impact our operating results. Moreover, we may experience higher costs due to yield loss, production inefficiencies, equipment problems and lower margins until any operational issues associated with the opening of new manufacturing facilities are resolved.
Because we lack long-term purchase commitments from our customers, our sales can be difficult to predict, which could lead to excess or obsolete inventory and adversely affect our operating results.
We generally do not enter into long-term agreements with our customers obligating them to purchase our fiber lasers or amplifiers. Our business is characterized by short-term purchase orders and shipment schedules and, in some cases, orders may be canceled or delayed without significant penalty or any penalty. As a result, it is difficult to forecast our revenues and to determine the appropriate levels of inventory required to meet future demand. In addition, due to the absence of long-term volume purchase agreements, we forecast our revenues and plan our production and inventory levels based upon the demand forecasts of our OEM customers, end users and distributors, which are highly unpredictable and can fluctuate substantially. This could lead to increased inventory levels and increased carrying costs and risk of excess or obsolete inventory due to unanticipated reductions in purchases by our customers. In addition, provisions have been recorded as a result of changes in market prices of certain components, the value of those inventories that was realizable through finished product sales due to declines in certain end market demand and uncertainties related to the recoverability of the value of inventories due to technological and product changes, and excess quantities. If our OEM customers, end users or distributors fail to accurately forecast the demand for our products, fail to accurately forecast the timing of such demand, or are unable to consistently negotiate acceptable purchase order terms with customers, our results of operations may be adversely affected.
We depend upon internal production and on outside single or limited-source suppliers for many of our key components and raw materials, including cutting-edge optics and materials. Any interruption in the supply or availability of these key components and raw materials could adversely affect our results of operations.
We rely exclusively on our own production capabilities to manufacture certain of our key components, such as semiconductor diodes, specialty optical fibers and optical components. We do not have redundant production lines for some of our components, such as our diodes and some other components, which are made at a single manufacturing facility. These are not readily available from other sources at our current costs and may not be available at all. If our manufacturing activities were obstructed or hampered significantly, it could take a considerable length of time and capital investment, or it could increase our costs, to resume manufacturing or find alternative sources of supply. Many of the tools and equipment we use are custom-designed, and it could take a significant period of time to repair or replace them. Our primary manufacturing facilities are
located in the United States and Germany, and we have added production in Italy and Poland. Despite our efforts to mitigate the impact of any flood, fire, natural disaster, political unrest, act of terrorism, war, trade sanctions, outbreak of disease or other similar event, our business could be adversely affected to the extent that we do not have redundant production capabilities if any of our major manufacturing facilities or equipment should become inoperable, inaccessible, damaged or destroyed.
Also, we purchase certain raw materials used to manufacture our products and other components, such as semiconductor wafer substrates, diode packages, modulators, micro-optics, bulk optics and high power beam delivery products, from single or limited-source suppliers. We typically purchase our components and materials through purchase orders or agreed-upon terms and conditions and we do not have guaranteed supply arrangements with many of these suppliers. These suppliers are relatively small private companies that may discontinue their operations at any time and may be particularly susceptible to prevailing economic conditions. Some of our suppliers are also our competitors. Some of our suppliers may not be able to meet demand from our because of global demand for their components. As a result, we experienced and may in the future experience longer lead times or delays in fulfillment of our orders. Furthermore, other than our current suppliers, there are a limited number of entities from whom we could obtain these supplies. We do not anticipate that we would be able to purchase these components or raw materials that we require in a short period of time or at the same cost from other sources in commercial quantities or that have our required performance specifications. Any interruption or delay in the supply of any of these components or materials, or the inability to obtain these components and materials from alternate sources at acceptable prices and within a reasonable amount of time, could adversely affect our business. If our suppliers face financial or other difficulties, if our suppliers do not maintain sufficient inventory on hand or if there are significant changes in demand for the components and materials we obtain from them, they could limit the availability of these components and materials to us, which in turn could adversely affect our business.
We must comply with and could be impacted by various export controls and trade and economic sanctions laws and regulations that could negatively affect our business and may change due to diplomatic and political considerations outside of our control.
A significant part of our business involves the export and import of components and products among many countries, including the U.S., Germany and China. Historically, we also exported and imported a limited number of components and products in Russia and Belarus with entities we operated in those regions, and our subsidiary in India imports a limited number of medical devices from our former Russian subsidiary pursuant to an agreement entered into in connection with the disposition of such subsidiary in 2024. The U.S. government and governments of other countries in which we do business have Trade Controls that impact our ability to export, re-export or transfer products, software and technology originating in those countries. Trade Controls may require that we obtain a license before we can export, re-export or transfer certain products, software or technology. The requirement to obtain a license could put us at a competitive disadvantage by restricting our ability to sell products to customers in certain countries or by giving rise to delays or expenses related to obtaining a license. We have experienced and, in the future, may experience delays in obtaining export licenses based on issues solely within the control of the applicable government agency. Licenses may also include conditions that limit the use, resale, transfer, re-export, modification, disassembly, or transfer of a product, software or technology after it is exported without first obtaining permission from the relevant government agency. Delays in obtaining or failure to obtain required export licenses may require us to defer shipments for substantial periods or cancel orders. Any of these circumstances could adversely affect our operations and, as a result, our financial results could suffer. Although we have implemented compliance measures designed to prevent transactions prohibited by current or future Trade Controls, we have previously identified, and may continue to identify, instances in which we exported products without obtaining the required export authorizations and/or submitting the required requests. As a result, we have submitted a limited number of voluntary self-disclosures regarding compliance with export control laws and regulations with the U.S. Department of Commerce’s Bureau of Industry and Security (“BIS”). BIS issued warning letters to the Company in response to the self-disclosures. Our failure to comply with these laws and regulations could result in costly government investigations, government sanctions, including substantial monetary penalties, civil or criminal penalties, denial of export privileges, debarment from government contracts, and a loss of revenues and reputational harm.
Our manufacturing facilities in the U.S. and Germany provide finished products to China, our largest market. Should the United States or the European Union implement targeted or broad-based Trade Controls, our production and/or deliveries as well as results of operations and/or financial condition could be affected.
In addition, Trade Controls and their implementation are fluid and may change due to diplomatic and political considerations outside of our control. While the Company has a trade compliance program, there is a risk that IPG may not be able to comply due to the number, complexity and fast-changing nature of sanctions. Trade Controls and other governmental responses to political escalations may require us to take certain actions, including increasing costs and abandoning operations or writing-down asset values, or respond to nationalization or expropriation of assets abroad, adversely affect prevailing market prices of our common stock, have a reputational impact, or otherwise have a material adverse impact on us, our business and financial results.
We may experience lower than expected manufacturing yields, which would adversely affect our gross margins.
The manufacture of semiconductor diodes and the packaging of them is a highly complex process. Manufacturers often encounter difficulties in achieving acceptable product yields from diode and packaging operations. We have from time to time experienced lower than anticipated manufacturing yields for our diodes and packaged diodes. This occurs during the production of new designs and the installation and start-up of new process technologies and new equipment. If we do not achieve planned yields, our product costs could increase resulting in lower gross margins, and key component availability would decrease.
We are highly dependent on the significant experience and specialized expertise of our senior management and scientific staff. The unavailability or loss of one or more of these key employees or our failure to attract other highly skilled personnel necessary to compete successfully could harm our business and results of operations.
Our future success is substantially dependent on the continued service and performance of our executive officers. Although the board engages in executive succession planning, our inability to effectively and immediately transition knowledge or responsibilities to successors in the event of an unexpected absence or departure could harm our business and disrupt our operations. We also rely on our highly trained team of scientists, many of whom have numerous years of experience and specialized expertise in optical fibers, semiconductors and optical component technology, and other key engineering, sales, marketing, manufacturing and support personnel, any of whom may depart for a variety of reasons, which could harm our business. Competition for qualified personnel in our industry is intense, particularly for physicists, software engineers and other technical staff. If we fail to attract, integrate and retain the necessary personnel, it could delay the development or introduction of new products, negatively impact our ability to market, sell or support our products, and significantly harm our business.
Risks Relating to Intellectual Property, Litigation, Information Systems and Regulations
We are subject to litigation alleging that we infringe third-party intellectual property rights. Intellectual property claims could result in costly litigation and harm our business.
There has been significant litigation involving intellectual property rights in many technology-based industries, including our own. We face risks and uncertainties in connection with such litigation, including the risk that patents issued to others may harm our ability to do business; that there could be existing patents of which we are unaware that could be pertinent to our business; and that it is not possible for us to know whether there are patent applications pending that our products might infringe upon. Moreover, the frequency with which new patents are granted and the diversity of jurisdictions in which they are granted make it impractical and expensive for us to monitor all patents that may be relevant to our business.
From time to time, we have been notified of allegations and claims that we may be infringing patents or intellectual property rights owned by third parties. We have defended against several patent infringement claims in the past and we engage in patent office opposition proceedings internationally for patents owned by others. In December 2024, affiliates of Trumpf SE & Co. KG filed two different patent lawsuits in two different Unified Patent Courts located in Germany against IPG Laser GmbH & Co. KG, our German subsidiary, alleging infringement of two patents granted by the European Patent Office by our adjustable mode beam lasers.
There can be no assurance that we will be able to dispose of any claims or other allegations made or asserted against us without them having a material impact on our results of operations. Even if we ultimately are successful on the merits of any such litigation or re-examination, legal and administrative proceedings related to intellectual property are typically expensive and time-consuming, generate negative publicity and divert financial and managerial resources. Some litigants may have greater financial resources than we have and may be able to sustain the costs of complex intellectual property litigation more easily than we can.
If we do not prevail in any intellectual property litigation brought against us, it could affect our ability to sell our products and materially harm our business, financial condition and results of operations. These developments could adversely affect our ability to compete for customers and increase our revenues. Plaintiffs in intellectual property cases often seek, and sometimes obtain, injunctive relief. Intellectual property litigation commenced against us could force us to take actions that could be harmful to our business, including the following:
•stop selling our products or using the technology that contains the allegedly infringing intellectual property;
•pay actual monetary damages, royalties, lost profits or increased damages and the plaintiff's attorneys' fees; and
•attempt to license the relevant intellectual property which may not be available on reasonable terms.
In addition, intellectual property lawsuits can be brought by third parties against OEMs and end users that incorporate our products into their systems or processes. In some cases, we indemnify OEMs against third-party infringement claims relating to
our products and we often make representations affirming, among other things, that our products do not infringe the intellectual property rights of others. As a result, we may incur liabilities in connection with lawsuits against our customers. Any such lawsuits, whether or not they have merit, could be time-consuming to defend, damage our reputation or result in substantial and unanticipated costs.
Our inability to protect our intellectual property and proprietary technologies could result in the unauthorized use of our technologies by third parties, hurt our competitive position and adversely affect our operating results.
We rely on patents, trade secret laws, contractual agreements, technical know-how and other unpatented proprietary information to protect our products, product development and manufacturing activities from unauthorized copying by third parties. Our patents do not cover all of our technologies, systems, products and product components and may not prevent third parties from unauthorized copying of our technologies, products and product components. We have significant international operations and are subject to foreign laws which differ in many respects from U.S. laws. Policing unauthorized use of our trade secret technologies throughout the world and proving misappropriation of our technologies are particularly difficult, especially due to the number of our employees and operations in numerous foreign countries. The steps that we take to acquire ownership of our employees' inventions and trade secrets in foreign countries may not have been effective under all such local laws, which could expose us to potential claims or the inability to protect intellectual property developed by our employees. Furthermore, any changes in, or unexpected interpretations of, the trade secret and other intellectual property laws in any country in which we operate may adversely affect our ability to enforce our trade secret and intellectual property positions. Costly and time-consuming litigation could be necessary to determine the scope of our confidential information and trade secret protection. However, there can be no assurance that confidentiality agreements we enter into with consultants, suppliers, employees and others will not be breached, that we will be able to effectively enforce them or that we will have adequate remedies for any breach.
Given our reliance on trade secret laws, others may independently develop similar or alternative technologies or duplicate our technologies and commercialize discoveries that we have made. Therefore, our intellectual property efforts may be insufficient to maintain our competitive advantage or to stop other parties from commercializing similar products or technologies. Many countries outside of the United States afford little or no protection to trade secrets and other intellectual property rights. Intellectual property litigation can be time-consuming and expensive, and there is no guarantee that we will have the resources to fully enforce our rights. If we are unable to prevent misappropriation or infringement of our intellectual property rights, or the independent development or design of similar technologies, our competitive position and operating results could suffer.
Our information systems are subject to cyber-attacks, interruptions and failures. If unauthorized access is obtained to our information systems, we may incur significant legal and financial exposure and liabilities.
Like many multinational corporations, we maintain several information technology systems, including software products licensed from third parties. These systems vary from country to country. Any system, network or internet failures, misuse by system users, the hacking into or disruption caused by the unauthorized access by third parties or loss of license rights could disrupt our ability to timely and accurately manufacture and ship products or to report our financial information in compliance with the timelines mandated by the SEC. Any such failure, misuse, hacking, disruptions or loss would likely cause a diversion of management's attention from the underlying business and could harm our operations. In addition, a significant failure of our various information technology systems could adversely affect our ability to complete an evaluation of our internal controls and attestation activities pursuant to Section 404 of the Sarbanes-Oxley Act of 2002 under the updated framework issued in 2013.
As part of our day-to-day business, we store our data and certain data about our customers, employees and service providers in our information technology system. While our system is designed with access security, if a third party gains unauthorized access to our data or technology, including information regarding our customers, employees and service providers, such security breach could expose us to a risk of loss of this information, loss of business, litigation and possible liability. Our security measures may be breached as a result of third-party action, including intentional misconduct by computer hackers, employee error, malfeasance or otherwise. Additionally, third parties may attempt to fraudulently induce employees or customers into disclosing sensitive information such as usernames, passwords or other information in order to gain access to our customers' data or our data, including our intellectual property and other confidential business information, employee information or our information technology systems. Because the techniques used to obtain unauthorized access, or to sabotage systems, change frequently and generally are not recognized until launched against a target, we may be unable to anticipate or detect these techniques or to implement adequate preventative measures. Any unauthorized access could negatively impact our customers' products, result in a loss of confidence by our customers, damage our reputation, disrupt our business, result in a misappropriation of our assets (including cash), lead to legal liability and negatively impact our future sales. Additionally, such actions could result in significant costs associated with loss of our intellectual property, impairment of our ability to conduct our
operations, rebuilding our network and systems, prosecuting and defending litigation, responding to regulatory inquiries or actions, paying damages or taking other remedial steps. In addition, we may incur significant costs designed to prevent or mitigate the damage related to cybersecurity incidents. For instance, we may retain additional employees or consultants, implement new policies and procedures, and install information technology to detect and prevent identity theft, data breaches, or system disruptions. We would incur any such costs with the intent that proactively preventing a cybersecurity incident ultimately helps to mitigate potential cybersecurity liability. As previously disclosed, on September 14, 2020, the Company detected a ransomware attack impacting certain of our operational and information technology systems that we do not believe had a material impact on the Company's business, operations or financial condition.
The costs to address the foregoing security problems and security vulnerabilities before or after a cyber-incident could be significant. Our remediation efforts may not be successful and could result in interruptions, delays, a cessation of service, and a loss of existing or potential customers, impeding our sales, manufacturing, distribution, and other critical functions.
We may face particular privacy, data security and data protection risks due to laws and regulations regulating the protection or security of personal and other sensitive data.
We may face particular privacy, data security and data protection risks due to laws and regulations regulating the protection or security of personal and other sensitive data, including in particular several laws and regulations that have recently been enacted or adopted or are likely to be enacted or adopted in the future. For instance, in 2018, the European General Data Protection Regulation (“GDPR”) imposed additional obligations and risk upon our business and substantially increased the penalties to which we could be subject in the event of any non-compliance. GDPR requires companies to satisfy requirements regarding the handling of personal data (generally, of EU residents), including its use, protection and the rights of affected persons regarding their data. Failure to comply with GDPR requirements could result in penalties of up to 4% of worldwide revenue. In addition, several other jurisdictions around the world have recently enacted privacy laws or regulations similar to GDPR. For instance, in 2020, California enacted the California Consumer Privacy Act (“CCPA”), giving consumers many of the same rights as those available under GDPR. Several laws similar to the CCPA have been approved in the United States at the state level and more are being proposed at the federal and state levels. GDPR and other similar laws and regulations, as well as any associated inquiries or investigations or any other government actions, may be costly to comply with, result in negative publicity, increase our operating costs, require significant management time and attention, and subject us to remedies that may harm our business. We are evaluating these requirements and taking measures to ensure compliance with all applicable privacy and data protection-related laws and regulations. Because there is limited interpretation and enforcement of many of these laws and regulations, some measures initially might not satisfy standard or best practices that will be established in the coming years.
Changes in tax rates, tax liabilities or tax accounting rules could affect future results.
As a global company, we are subject to taxation in the United States and various other countries and jurisdictions. Significant judgment is required to determine worldwide tax liabilities, particularly related to intercompany pricing we apply to products shipped between various tax jurisdictions, commonly referred to as transfer pricing. Our future tax rates could be affected by changes in the composition of earnings in countries or states with differing tax rates, transfer pricing rules, changes in the valuation of our deferred tax assets and liabilities, or changes in the tax laws. In addition, we are subject to regular examination of our income tax returns by the Internal Revenue Service ("IRS") and other tax authorities. From time to time the United States, foreign and state governments make substantive changes to tax rules and the application of rules to companies, including various announcements from the United States government potentially impacting our ability to defer taxes on international earnings. We regularly assess the likelihood of favorable or unfavorable outcomes resulting from these examinations to determine the adequacy of our provision for income taxes. Although we believe our tax estimates are reasonable, there can be no assurance that any final determination will not be materially different than the treatment reflected in our historical income tax provisions and accruals, which could materially and adversely affect our operating results and financial condition.
If we or our third-party vendors fail to comply with FDA regulations or similar legal requirements in foreign jurisdictions relating to the manufacturing, labeling or marketing of our products or any component part, we may be subject to fines, injunctions and penalties, and our ability to commercially distribute and sell our products may be negatively impacted.
We now make fiber laser systems and accessories targeted at specific medical applications. In addition, we sell our commercial fiber and diode laser modules, subassemblies and systems to OEMs that incorporate them into their medical products. With respect to such products, some of our manufacturing facilities, and the manufacturing facilities of any of our third-party component manufacturers or critical suppliers, are required to comply with the FDA’s Quality System Regulation and those of other countries (“QSR”), which sets forth minimum standards for the procedures, execution and documentation of the design, testing, production, control, quality assurance, labeling, packaging, sterilization, storage, and shipping of the
products we sell in the medical industry, and related regulations, including Medical Device Reporting (“MDR”) regulations regarding reporting of certain malfunctions and adverse events potentially associated with our products. The FDA and other regulatory agencies may evaluate our compliance with the QSR, MDR and other regulations, among other ways, through periodic announced or unannounced inspections which could disrupt our operations and interrupt our manufacturing and sales. If in conducting an inspection of our manufacturing facilities, or the manufacturing facilities of any of our third-party component manufacturers or critical suppliers, an investigator from the FDA or another regulatory agency observes conditions or practices believed to violate the QSR, the investigator may document their observations on a Form FDA 483 that is issued at the conclusion of the inspection. A manufacturer that receives an FDA 483 may respond in writing and explain any corrective actions taken in response to the inspectional observations. The FDA will typically review the facility’s written response and may re-inspect to determine the facility’s compliance with the QSR and other applicable regulatory requirements. Failure to take adequate and timely corrective actions to remedy objectionable conditions listed on an FDA 483 could result in the FDA taking administrative or enforcement actions. Among these may be the FDA’s issuance of a Warning Letter to a manufacturer, which informs it that the FDA considers the observed violations to be of “regulatory significance” that, if not corrected, could result in further enforcement action.
FDA enforcement actions, which include seizure, injunction, criminal prosecution, and civil penalties, could result in total or partial suspension of a facility’s production and/or distribution, product recalls, fines, suspension of the FDA’s review of product applications, and/or the FDA’s issuance of adverse publicity. Thus, an adverse inspection could force a shutdown of our manufacturing operations for products servicing the medical industry or a recall of such products. Adverse inspections could also delay FDA approval of our products for the medical industry.
Failure to maintain effective internal controls may cause a loss of investor confidence in the reliability of our financial statements or to cause us to delay filing our periodic reports with the SEC and adversely affect our stock price.
The SEC, as directed by Section 404 of the Sarbanes-Oxley Act of 2002, adopted rules requiring public companies to include a report of management on internal control over financial reporting in their annual reports on Form 10-K that contain an assessment by management of the effectiveness of our internal control over financial reporting. In addition, our independent registered public accounting firm must attest to and report on the effectiveness of our internal control over financial reporting. We have extensive and complex international manufacturing and sales and service locations which may make us more vulnerable to weaknesses in our internal controls. Although we test our internal control over financial reporting in order to ensure compliance with the Section 404 requirements, our failure to maintain adequate internal controls over financial reporting could result in an adverse reaction in the financial marketplace due to a loss of investor confidence in the reliability of our financial statements or a delay in our ability to timely file our periodic reports with the SEC, which ultimately could negatively impact our stock price.
Our products could contain defects, which may reduce sales of those products, harm market acceptance of our fiber laser and other products or result in claims against us.
The manufacture of our products involves highly complex and precise processes. Despite testing by us and our customers, errors have been found, and may be found in the future, in our products. These defects may cause us to incur significant warranty, support and repair costs, incur additional costs related to a recall, divert the attention of our engineering personnel from our product development efforts and harm our relationships with our customers. These problems could result in, among other things, loss of revenues or a delay in revenue recognition, loss of market share, harm to our reputation or a delay or loss of market acceptance of our fiber laser products. Additionally, a recall, particularly in our products used or incorporated in medical devices, could result in significant costs and lost sales and customers, enforcement actions and/or investigations by state and federal governments or other enforcement bodies, as well as negative publicity and damage to our reputation that could reduce future demand for our products. The development and sale of medical devices and component products involves an inherent risk of product liability claims. Defects, integration issues or other performance problems in our fiber laser and other products could also result in personal injury or financial or other damages to our customers, which in turn could damage market acceptance of our products and result in significant product liability claims being brought against us. A product liability claim brought against us, even if unsuccessful, could be time-consuming and costly to defend. If a product liability action were determined against us, it could result in significant damages, including punitive damages, and our consolidated financial position, results of operations or cash flows could be materially adversely affected.
We are subject to government regulations, including tariffs and duties that could restrict our international sales and negatively affect our business.
The United States, Germany, the European Union, China, Japan, South Korea and many other foreign governments impose tariffs and duties on the import of products, including some of those which we sell. In recent years, the U.S. instituted
changes in trade policies that included the negotiation or termination of trade agreements, the imposition of higher tariffs on imports into the United States, including, in particular, on Russian and Chinese-made goods, economic sanctions on individuals, corporations or countries and other government regulations affecting trade between the United States and other countries where we conduct our business.
Policy changes and proposals could require time-consuming and expensive alterations to our business operations and may result in greater restrictions and economic uncertainty and disincentives on international trade, which could negatively impact our competitiveness in jurisdictions around the world as well as lead to an increase in costs in our supply chain. We are a multinational corporation, with manufacturing located both in the United States and internationally and with approximately 75% of our net sales arising from foreign customers. As such, we may be more susceptible to negative impacts from these tariffs or change in trade policies than other less internationally focused enterprises. In addition, new tariffs and other changes in U.S. trade policy could trigger retaliatory actions by affected countries, and certain foreign governments, including the Chinese government (which has imposed retaliatory tariffs on a range of U.S. goods including certain optical and electronic products and components), may impose trade sanctions on certain U.S. manufactured goods. Such changes by the United States and other countries have the potential to adversely impact U.S. and worldwide economic conditions, our industry and the global demand for our products, and as a result, could negatively affect our business, financial condition and results of operations.
We are subject to various environmental laws and regulations that could impose substantial costs upon us and may adversely affect our business, operating results and financial condition.
Some of our operations use substances regulated under various federal, state, local and international laws governing the environment, including those relating to the storage, use, discharge, disposal, product composition and labeling of, and human exposure to, hazardous and toxic materials. We could incur costs, fines and civil or criminal sanctions, third-party property damage or personal injury claims, or could be required to incur substantial investigation or remediation costs, if we were to violate or become liable under environmental laws. Compliance with current or future environmental laws and regulations could restrict our ability to expand our facilities or require us to acquire additional expensive equipment, modify our manufacturing processes, or incur other significant expenses in order to remain in compliance with such laws and regulations. There can be no assurance that violations of environmental laws or regulations will not occur in the future as a result of the lack of, or failure to obtain, permits, human error, accident, equipment failure or other causes.
Risks Relating to Our Common Stock
Certain trusts and a company created by the late founder of the Company collectively control over 35% of our voting power and have a significant influence on the outcome of director elections and other matters requiring stockholder approval, including a change in corporate control.
IP Fibre Devices (UK) Ltd. ("IPFD"), together with trusts created by the late founder of the Company, Dr. Valentin P. Gapontsev, beneficially own approximately 37% of our common stock. Dr. Scherbakov, our former CEO and current director, is the sole managing director of IPFD. Trustees of the trusts include an executive officer of the Company, a third-party corporate trustee, and Dr. Scherbakov. Dr. Scherbakov, as managing director of IPFD, and the other trustees have significant influence on the outcome of matters requiring stockholder approval, including election of our directors, stockholder proposals and approval of significant corporate transactions. IPFD and the trusts may vote their shares of our common stock in ways that other stockholders may consider would be adverse to the interests of the other stockholders. These significant ownership interests could delay, prevent or cause a change in control of the Company and might affect the market price of our common stock.
Future sales of our common stock by our existing shareholders could cause our stock price to decline.
Sales of a substantial number of shares of our common stock by our existing stockholders (including the trusts established by Dr. Gapontsev and IPFD) in the public market or the perception that these sales might occur, could depress the market price of our common stock and could impair our ability to raise capital through the sale of additional equity securities or other securities convertible into or exchangeable for equity securities, regardless of whether there is any relationship between such sales and the performance of our business.
Provisions in our charter documents and Delaware law, and our severance arrangements, could prevent or delay a change in control of our company, even if a change in control would be beneficial to our stockholders.
Provisions of our certificate of incorporation and by-laws, including certain provisions that will take effect when founder of the Company, the late Dr. Valentin P. Gapontsev, together with his affiliates and associates, ceases to beneficially own an
aggregate of 25% or more of our outstanding voting securities, may discourage, delay or prevent a merger, acquisition or change of control, even if it would be beneficial to our stockholders. The existence of these provisions could also limit the price that investors might be willing to pay in the future for shares of our common stock. These provisions include:
•authorizing the issuance of "blank check" preferred stock;
•establishing a classified board and providing that directors thereon may only be removed for cause;
•providing that directors fill board vacancies;
•prohibiting stockholder action by written consent;
•limiting the ability of stockholders to call a special meeting of stockholders;
•establishing advance notice requirements for nominations for election to the board of directors and for proposing matters to be submitted to a stockholder vote;
•supermajority stockholder approval to change certificate of incorporation and by-laws and
•lack of cumulative voting for director elections.
Section 203 of the Delaware General Corporation Law, which will apply to the Company following such time as the late Dr. Gapontsev, together with his affiliates and associates, ceases to beneficially own 25% or more of the total voting power of our outstanding shares, may prohibit business combinations with stockholders owning 15% or more of our outstanding voting stock. The terms of our employment agreements and severance plan with executives include change-of-control severance provisions which provide for the payment of cash following a termination of employment following a change of control. These provisions may discourage, delay or prevent a merger or acquisition, make a merger or acquisition costlier for a potential acquirer, or make removal of incumbent directors or officers more difficult.
General Risk Factors
We have experienced, and expect to experience in the future, fluctuations in our quarterly operating results. These fluctuations may increase the volatility of our stock price and may be difficult to predict.
We have experienced, and expect to continue to experience, fluctuations in our quarterly operating results. We believe that fluctuations in quarterly results may cause the market price of our common stock to fluctuate, perhaps substantially. Factors which may have an influence on our operating results in a particular quarter include those below and others included in the Risk Factors:
•the increase, decrease, cancellation or rescheduling of significant customer orders;
•the timing of revenue recognition based on the installation or acceptance of certain products shipped to our customers;
•the timing of customer qualification of our products and commencement of volume sales of systems that include our products;
•the gain or loss of a key customer;
•product or customer mix;
•competitive pricing pressures and new market entrants;
•our ability to design, manufacture and introduce new products on a cost-effective and timely basis;
•our ability to manage our inventory levels and any provisions for excess or obsolete inventory;
•our ability to collect outstanding accounts receivable balances;
•incurring expenses to develop and improve application and support capabilities, the benefits of which may not be realized until future periods, if at all;
•incurring expenses related to impairment of values for goodwill, intangibles and other long-lived assets;
•different capital expenditure and budget cycles for our customers, which affect the timing of their spending;
•expenses associated with acquisition-related activities;
•regional epidemics or a global pandemic, such as COVID-19; and
•our ability to control expenses.
These factors make it difficult for us to accurately predict our operating results. In addition, our ability to accurately predict our operating results is complicated by the fact that many of our products have long sales cycles, some lasting as long as twelve months or more. Once a sale is made, our delivery schedule typically ranges from four weeks to four months, and therefore our sales will often reflect orders shipped in the same quarter that they are received and will not enhance our ability to predict our results for future quarters. In addition, long sales cycles may cause us to incur significant expenses without offsetting revenues since customers typically expend significant effort in evaluating, testing and qualifying our products before making a decision to purchase them. Moreover, customers may cancel or reschedule shipments, and production difficulties could delay shipments. Accordingly, our results of operations are subject to significant fluctuations from quarter to quarter, and we may not be able to accurately predict when these fluctuations will occur.
Our inability to manage risks associated with our international customers and operations could adversely affect our business.
We have significant facilities in and our products are sold in numerous countries. A substantial majority of our revenues are derived from customers outside the United States. In addition, we have substantial tangible assets outside of the United States. We anticipate that foreign sales will continue to account for a significant portion of our revenues in the foreseeable future. Our operations and sales in these markets are subject to risks inherent in international business activities, including the following and others mentioned in the Risk Factors:
•fluctuations in the values of foreign currencies;
•changes, including recession, and other general economic uncertainties affecting the macroeconomic and local economic communities in which we and our customers operate or serve;
•longer accounts receivable collection periods and less developed credit assessment and collection procedures;
•compliance with domestic and foreign laws and regulations, unexpected changes in those laws and regulatory requirements, including uncertainties regarding taxes, tariffs, quotas, export controls, export licenses, trade sanctions and other trade barriers, and any corresponding retaliatory actions by affected countries, including China and Russia;
•certification requirements;
•less effective protection of intellectual property rights in some countries;
•potentially adverse tax consequences;
•different capital expenditure and budget cycles for our customers, which affect the timing of their spending;
•political, legal and economic instability, foreign conflicts, labor unrest and the impact of regional and global infectious illnesses in the countries in which we and our customers, suppliers, manufacturers and subcontractors are located;
•preference for locally produced products;
•difficulties and costs of staffing and managing international operations across different geographic areas and cultures;
•seasonal reductions in business activities;
•fluctuations in freight rates and transportation disruptions;
•investment restrictions or requirements;
•repatriation restrictions or requirements;
•export and import restrictions; and
•limitations on the ability of our employees to travel without restriction to certain countries in which we operate.
Political, economic and monetary instability and changes in governmental regulations or policies, including trade tariffs and protectionism, could adversely affect both our ability to effectively operate our foreign sales offices and the ability of our foreign suppliers to supply us with required materials or services. Any interruption or delay in the supply of our required components, products, materials or services, or our inability to obtain these components, materials, products or services from alternate sources at acceptable prices and within a reasonable amount of time, could impair our ability to meet scheduled product deliveries to our customers and could cause customers to cancel orders.
We are subject to risks of doing business in Belarus, which historically provided mechanical parts to our German subsidiary and former Russian subsidiary and which does not currently provide parts to our affiliates outside of Belarus. We are also subject to risks of doing business in China, as approximately 25% of our sales in 2024 were to Chinese customers. The results of our operations, business prospects and facilities in China and Belarus are subject to the economic and political
environment there and global geopolitical conditions. The future economic direction of these emerging market countries remains largely dependent upon the effectiveness of economic, financial and monetary measures undertaken by the government, together with tax, legal, regulatory and political developments. Sanctions imposed by or on countries in which we have operations or do business has and could disrupt our supply of critical components, including among our manufacturing facilities in the U.S., Germany, Italy, Poland, and Belarus, and has caused us to shift all work occurring in Belarus to other countries. In addition, sanctions targeting the banking sector have and may impact the transfer of cash to and from countries in which we operate, including our ability to fund operations or repatriate surplus liquidity. At December 31, 2024, we had $4.7 million cash in Belarus. Such disruptions could negatively affect our ability to provide critical components to affiliates or produce finished goods for customers, which could increase our costs, require capital expenditures and harm our results of operations and financial condition. Further, Belarus adopted rules that impose conditions on sale of assets by U.S. and western companies that could decrease the value of assets, as well as limit payments to sellers. Our failure to manage the risks associated with our operations in China and Belarus and our other existing and potential future international business operations could have a material adverse effect upon our results of operations.
Foreign currency risk may negatively affect our net sales, cost of sales and operating margins and could result in exchange losses.
We conduct our business and incur costs in the local currency of most countries in which we operate. In 2024 our net sales outside the United States represented a substantial majority of our total sales. We incur currency transaction risk whenever one of our operating subsidiaries enters into either a purchase or a sales transaction using a different currency from the currency in which it operates or holds assets or liabilities in currencies different than their functional currency. Changes in exchange rates can also affect our results of operations when the value of sales and expenses of foreign subsidiaries are translated to U.S. dollars. We cannot accurately predict the impact of future exchange rate fluctuations on our results of operations. Further, given the volatility of exchange rates, we may not be able to effectively manage our currency risks, and any volatility in currency exchange rates may increase the price of our products in local currency to our foreign customers or increase the manufacturing cost of our products, which may have an adverse effect on our financial condition, cash flows and profitability. We incurred a foreign exchange loss of $5.5 million in 2024 and a gain of $1.4 million in 2023.
We pursue acquisitions and investments in new businesses, products, patents or technologies. These involve risks which could disrupt our business and may harm our financial results and condition.
We may make acquisitions of and investments in new businesses, products, patents and technologies and expand into new geographic areas, or we may acquire operations, products or technologies that expand our current capabilities. Although we have pursued relatively small acquisitions in the past, we may pursue larger transactions in the future. Acquisitions present a number of potential risks and challenges that could, if not met, disrupt our business operations, increase our operating costs, reduce consolidated margins, cause us to incur impairment charges and reduce the value of the acquired company, asset or technology to us. We may not be able to effectively integrate acquired businesses, business cultures, products, patents or technologies into our existing business and products, or retain key employees. As a result of the rapid pace of technological change in our industry, we may misjudge the long-term potential of an acquired business, product, patent or technology, or the acquisition may not be complementary to our existing business. Furthermore, potential acquisitions and investments, whether or not consummated, may divert our management's attention, require considerable cash outlays at the expense of our existing operations, incur unanticipated costs or liabilities, including the costs associated with improving the internal controls of the acquired company. In addition, to complete future acquisitions, we may issue equity securities, incur debt, assume contingent liabilities or have amortization expenses and write-downs of acquired assets, which could adversely affect our profitability and result in dilution to our existing and future stockholders.
We may incur impairments to goodwill or long-lived assets, which would negatively affect our results of operations.
We review our goodwill for impairment annually and other long-lived assets, including intangible assets identified in business combinations whenever events or changes in circumstances indicate that the carrying amount of these assets may not be recoverable. Negative industry or economic trends, including reduced estimates of future cash flows, disruptions to our business including those from government regulations, sanctions or tariffs, slower growth rates, lack of growth in our relevant business units or differences in the estimated product acceptance rates could lead to impairment charges against our long-lived assets, including goodwill and other intangible assets.
Our valuation methodology for assessing impairment requires management to make significant judgments and assumptions based on historical experience and to rely heavily on projections of future operating performance at many points during the analysis. Also, the process of evaluating the potential impairment of long-lived assets is subjective. We operate in a highly competitive environment and projections of future operating results and cash flows may vary significantly from actual
results. Additionally, if our analysis indicates potential impairment to long-lived assets in one or more of our reporting units, we may be required to record additional charges to earnings in our financial statements, which could negatively affect our results of operations. In 2022, long-lived asset impairments related to our Russian operations were $79.0 million. In 2024, long-lived asset impairments related to our Belarusian operations were $26.6 million.
We are exposed to credit risk and fluctuations in the market values of our cash, cash equivalents and marketable securities.
Given the global nature of our business, we have both domestic and international investments. At December 31, 2024, 70% of our cash, cash equivalents and marketable securities were in the United States and 30% were outside the United States. Credit ratings and pricing of our investments can be negatively affected by liquidity, credit deterioration, prevailing interest rates, financial results, economic risk, political risk, sovereign risk or other factors. Also, our investments may be negatively affected by events that impact the banks or depositories that hold our investments. As a result, the value and liquidity of our cash, cash equivalents and marketable securities may fluctuate substantially. Therefore, although we have not realized any significant losses on our cash, cash equivalents and marketable securities, future fluctuations in their value could result in a significant realized loss.
Our ability to access financial markets to raise capital or finance a portion of our working capital requirements and support our liquidity needs may be adversely affected by factors beyond our control and could negatively impact our ability to finance our operations, meet certain obligations, implement our operating strategy or complete acquisitions.
We occasionally borrow under our existing credit facilities to fund operations, including working capital investments. Our major credit line in the United States expires in April 2025. Uncertainty or disruptions in financial markets may negatively impact our ability to access additional financing or to refinance our existing credit facilities or existing debt arrangements on favorable terms or at all, which could negatively affect our ability to fund current and future expansion as well as future acquisitions and development. These disruptions may include turmoil in the financial services industry, unprecedented volatility in the markets where our outstanding securities trade, changes in reference rates for interest such as the discontinuation of LIBOR in 2023 and general economic downturns in the areas where we do business. If we are unable to access funds at competitive rates, or if our short-term or long-term borrowing costs increase, our ability to finance our operations, meet our short-term obligations and implement our operating strategy could be adversely affected. We also may in the future be required to raise capital through public or private financing or other arrangements. Such financing may not be available on acceptable terms, or at all, and our failure to raise capital when needed could harm our business.
Our short-term investment portfolio and certain cash balances could experience a decline in market value or otherwise become illiquid, which could materially and adversely affect our financial results.
As of December 31, 2024, we had approximately $620 million of cash and cash equivalents and $310 million in short-term investments. See Note 3, "Fair Value Measurements" in the Notes to Consolidated Financial Statements in Part IV, Annual Report for further information about our cash equivalents and short-term investments. We currently do not use derivative financial instruments to adjust our investment portfolio risk or income profile. These investments, as well as any cash deposited in bank accounts, are subject to general credit, liquidity, market and interest rate risks, which may be exacerbated by unusual events, such as the U.S. debt ceiling crisis, which affected various sectors of the financial markets and led to global credit and liquidity issues. For example, in March 2023, certain US banks were closed and the Federal Deposit Insurance Corporation (FDIC) was appointed as receiver. While we were not directly impacted by these closures and did not have any deposits with these banks, there can be no assurance that our current or future banks will not face similar risks, and that we would be able to recover in full our deposits in the event of similar closures. We regularly maintain cash balances that are not insured or are in excess of the FDIC’s insurance limit. If the global financial markets continue to experience volatility or deteriorate, our investment portfolio and cash balances may be impacted and some or all of our investments may become illiquid or otherwise experience loss which could adversely impact our financial results and position.
ITEM 1B. UNRESOLVED STAFF COMMENTS
None.
ITEM 1C. CYBERSECURITY
The Company understands the importance of preventing, assessing, identifying and managing material risks associated with cybersecurity threats.
Cyber Risk Management and Strategy
We have implemented a number of technical and organizational safeguards designed to manage our risks from cybersecurity threats and to protect against, detect and prepare to respond to cybersecurity incidents. These include employee training, incident response capability reviews and exercises, cybersecurity insurance and business continuity mechanisms. Additionally, we engage a third-party cybersecurity firm to assist with security features such as network and endpoint monitoring, cloud system monitoring and assessment of our incident response procedures.
Our incident response plan coordinates the activities that we and our third-party cybersecurity provider take to prepare, to respond and to recover from cybersecurity incidents. We have processes designed to triage, assess severity, investigate, escalate, contain and remediate an incident. We also have processes to comply with potentially applicable legal obligations and mitigate brand and reputational damage. As part of the above processes, we engage with consultants to review our cybersecurity program to help identify areas for continued focus, improvement, and compliance.
We have adopted cybersecurity control principles based on the National Institute of Standards and Technology Cybersecurity Framework (NIST), the Center for Internet Security (CIS) and ISO 27001. Further, our cybersecurity controls are designed to comply with applicable laws concerning protection of private information, including the EU General Data Protection Regulation (GDPR), Brazil’s Lei General de Proteção de Dados Pessoais (LGPD) and the California Consumer Privacy Act of 2018 (CCPA).
Our processes include assessing cybersecurity risks associated with our use of third-party service providers in the normal course of business, including those in our supply chain or who have access to our customer and employee data or our systems. Additionally, we assess cybersecurity considerations in the selection and oversight of our third-party service providers, including due diligence on the third parties that have access to our systems and facilities that house systems and data.
Governance Related to Cybersecurity Risks
The Company’s Global Director, Information Security (Security Director) directs the Company’s cybersecurity team. He reports to the Company’s Global Director of Information Technologies (IT Director), who reports to the Chief Executive Officer of the Company. The Security Director is responsible for assessing and managing the Company’s cyber risk management program, informing senior management, as appropriate, regarding the prevention, detection, mitigation and remediation of cybersecurity incidents and supervising such efforts generally by the cybersecurity team. Our Security Director is a Certified Information Systems Security Professional (CISSP) and has over 20 years of experience in cybersecurity in a broad range of industries. Our IT Director has a master’s degree in information systems and has prior experience managing global security efforts. Our Security Director manages a team of cybersecurity professionals with relevant experience and expertise, including in cybersecurity threat assessments and detection, mitigation technologies, cybersecurity training, incident response, cyber forensics, insider threats and regulatory compliance.
In addition, the Company’s IT Steering Committee (ITSC) considers, among other IT matters, risks relating to cybersecurity and applicable mitigation plans to address such risks. The ITSC is comprised of certain members of the Company’s senior management. The IT Director and Security Director attend each ITSC meeting. The ITSC generally meets quarterly during the year with the IT Director and Security Director to review risk mitigation activities as well as updated status of global security operations and metrics, including the prevention, detection, mitigation and remediation of cyber incidents. The IT Director, Security Director and ITSC monitor the prevention, mitigation, detection and remediation of cybersecurity incidents through their management of, and participation in the cybersecurity risk management and strategy processes, including the operation of the Company’s incident response plan. The Company has an established process led by our Security Director governing our assessment, response and notifications internally and externally upon the occurrence of a cybersecurity incident.
Our Board of Directors (the "Board") is responsible for overseeing our enterprise risk management activities in general, and each of our Board committees assists the Board in the role of risk oversight. The full Board receives an update on the Company’s risks, risk management process and the risk trends related to cybersecurity at least annually, which includes a
review of key performance indicators, recent threats and the Company’s management of such threats. The Audit Committee specifically assists the Board in its oversight of risks related to cybersecurity. The Security Director and IT Director brief the Audit Committee on information security and cybersecurity annually and as necessary in response to certain incidents.
Although risks from cybersecurity incidents and threats have to date not materially impacted us, our business strategy, results of operations or financial condition, we have from time to time and will continue to experience threats to and security incidents related to our and our third party vendors’ data and systems. For more information, please see “Item 1A, Risk Factors.”
ITEM 2. PROPERTIES
Our significant facilities at December 31, 2024 include the following:
| | | | | | | | | | | | | | | | | | | | | | | | | | |
| Location | | Owned or Leased | | Lease Expiration | | Approximate Size (sq. ft.) | | Primary Activity |
| Burbach, Germany | | Owned | | | | 581,600 | | | Optical fiber, components, final assembly, complete device manufacturing, R&D, administration |
| Oxford, Massachusetts | | Owned | | | | 550,300 | | | Diodes, components, complete device manufacturing, R&D, administration |
| Minsk, Belarus | | Owned | | | | 410,900 | | | Manufacturing |
| Marlborough, Massachusetts | | Owned | | | | 402,800 | | | Components, manufacturing, applications, sales, R&D, administration |
| Davenport, Iowa | | Owned | | | | 99,300 | | | Systems integration, sales, administration |
| Davenport, Iowa | | Leased | | January 2026 | | 9,600 | | | Systems integration, sales, administration |
Our corporate headquarters is in Marlborough, Massachusetts. As of December 31, 2024, we occupied more than 2.8 million square feet of facilities worldwide. Of this we own 2.4 million square feet and lease 0.4 million square feet of building space, of which the majority is used for manufacturing. Our major manufacturing facilities are located in the United States and Germany. We have ceased new investments in our Belarusian operations. We have and will continue to expand our manufacturing operations in Germany and the United States, in part to replace the lost capacity at our factories in Russia and Belarus due to sanctions, to meet the demand for our products and our sales and support needs. We conduct our major research and development activities in Oxford and Marlborough, Massachusetts and Burbach, Germany.
We own additional facilities and land for various purposes, such as sales and support and applications labs. We believe the existing facilities are in good operating condition and are suitable for the conduct of our operations.
ITEM 3. LEGAL PROCEEDINGS
From time to time, we are party to various legal claims and legal proceedings and other disputes incidental to our business, such as employment, intellectual property or product issues. For a discussion of the risks associated with such matters, see Item 1A. "Risk Factors — We are subject to litigation alleging that we infringe third-party intellectual property rights. Intellectual property claims could result in costly litigation and harm our business." and "Risk Factors — We must comply with and could be impacted by various export controls and trade and economic sanctions laws and regulations that could negatively affect our business and may change due to diplomatic and political considerations outside of our control."
In December 2024, affiliates of Trumpf SE & Co. KG (“Trumpf”) filed patent lawsuits in two different Unified Patent Courts located in Germany against IPG Laser GmbH & Co. KG alleging infringement of two patents granted by the European Patent Office by our adjustable mode beam (AMB) lasers. Our AMB lasers are used in the welding of electric vehicle batteries as well as structural welding. The matter is still in its early stages and we intend to defend it vigorously.
ITEM 4. MINE SAFETY DISCLOSURES
Not applicable.
PART II
ITEM 5. MARKET FOR THE REGISTRANT’S COMMON EQUITY, RELATED STOCKHOLDER MATTERS AND ISSUER PURCHASES OF EQUITY SECURITIES
Our common stock is quoted on the Nasdaq Global Select Market under the symbol "IPGP." As of February 18, 2025, there were 42,548,561 shares of our common stock outstanding held by 30 holders of record, which does not include beneficial owners of common stock whose shares are held in the names of various securities brokers, dealers and registered clearing agencies.
Stock Price Performance Graph
The following Stock Price Performance Graph and related information includes comparisons required by the SEC. The graph does not constitute "soliciting material" and should not be deemed "filed" or incorporated by reference into any other filings under the Securities Act of 1933, as amended, or the Securities Exchange Act of 1934, as amended, except to the extent that we specifically incorporate this information by reference into such filing.
The following graph presents the cumulative shareholder returns for our Common Stock compared with the Russell 3000 Index and the S&P Composite 1500 - Electronic Equipment, Instruments & Components Index. We include the Russell 3000 Index because we became a member of this index in 2022. We include the S&P Composite 1500 - Electronic Equipment, Instruments & Components Index because outstanding performance stock units awarded to executive officers and outstanding at December 31, 2024 use this index when comparing total shareholder return and due to our being an index member, industry similarities, our internal use to monitor executive compensation, and the fact that it contains several direct competitors.
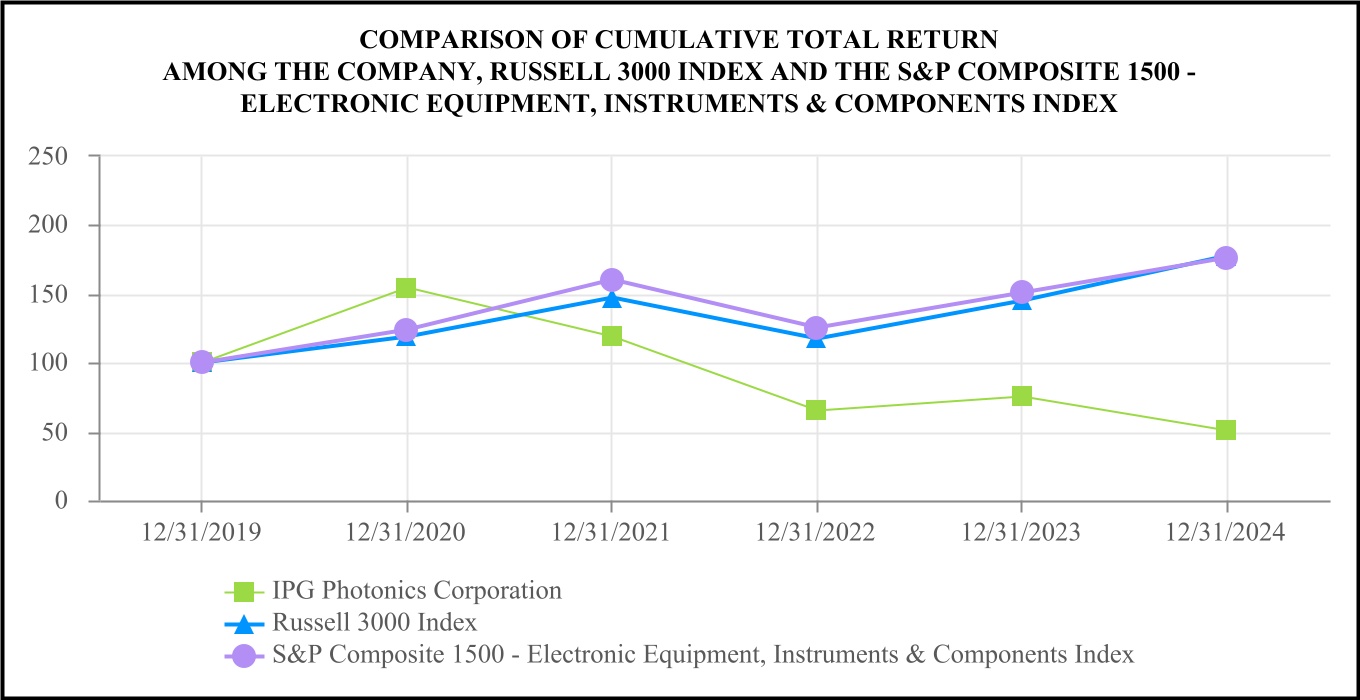
The above graph represents and compares the value, through December 31, 2024, of a hypothetical investment of $100 made at the closing price on December 31, 2019 in each of (i) our common stock, (ii) Russell 3000 Index, and (iii) the S&P Composite 1500 - Electronic Equipment, Instruments & Components Index, in each case assuming the reinvestment of dividends. The stock price performance shown in this graph is not necessarily indicative of, and not is intended to suggest, future stock price performance.
| | | | | | | | | | | | | | | | | | | | | | | | | | | | | | | | | | | | | | |
| | | Base Period | | 5-Year Cumulative Total Return |
| | | 12/31/2019 | | 12/31/2020 | | 12/31/2021 | | 12/31/2022 | | 12/31/2023 | | 12/31/2024 |
| IPG Photonics Corporation | | $ | 100.00 | | | $ | 154.42 | | | $ | 118.78 | | | $ | 65.33 | | | $ | 74.90 | | | $ | 50.18 | |
| | | | | | | | | | | | |
| Russell 3000 Index | | $ | 100.00 | | | $ | 118.82 | | | $ | 147.35 | | | $ | 117.17 | | | $ | 145.24 | | | $ | 177.40 | |
| S&P Composite 1500 - Electronic Equipment, Instruments & Components Index | | $ | 100.00 | | | $ | 123.86 | | | $ | 160.00 | | | $ | 125.15 | | | $ | 150.70 | | | $ | 175.92 | |
Dividends
We do not anticipate paying cash dividends in the foreseeable future. Any future determination related to our dividend policy will be made at the discretion of our Board, taking into account any contractual and legal restrictions on our payment of dividends.
Recent Sales of Unregistered Securities; Use of Proceeds from Registered Securities
None.
Issuer Purchases of Equity Securities
The following table shows repurchases of our common stock in the fiscal quarter ended December 31, 2024:
| | | | | | | | | | | | | | | | | | | | | | | | | | | | |
| Date | | Total Number of Shares (or Units) Purchased (1) | | | | Average Price Paid per Share (or Unit) | | Total Number of Shares (or Units) Purchased as Part of Publicly Announced Plans or Programs (2) | | Maximum Number (or Approximate Dollar Value) of Shares (or Units) that May Yet Be Purchased Under the Plans or Programs |
| | | | | | | | | | |
| | | | | | | | | | |
| | | | | | | | | | |
| | | | | | | | | | |
| | | | | | | | | | |
| | | | | | | | | | |
| | | | | | | | | | |
| | | | | | | | | | |
| | | | | | | | | | |
| October 1, 2024 — October 31, 2024 | | 651,392 | | | | | $ | 75.68 | | | 651,392 | | | $ | 57,487 | |
| November 1, 2024 — November 30, 2024 | | 91,234 | | | | | 83.14 | | | 90,020 | | | 50,000 | |
| December 1, 2024 — December 31, 2024 | | — | | | | | — | | | — | | | 50,000 | |
| Total | | 742,626 | | | | | $ | 76.60 | | | 741,412 | | | $ | 50,000 | |
(1)Total number of shares (or units) purchased includes shares repurchased as part of publicly announced plans or programs and "withhold to cover" tax liabilities upon vesting of restricted stock awards. For the fourth quarter of 2024, a total of 1,214 shares were withheld to cover at an average price of $81.45.
(2)On February 13, 2024, we announced that our Board of Directors authorized the purchase of up to $300 million of IPG common stock (the "February 2024 authorization"), exclusive of any fees, commissions or other expenses. Share repurchases under these purchase authorization were made periodically in open-market transactions using our working capital, and were subject to market conditions, legal requirements and other factors. The share purchase program authorizations did not obligate us to repurchase any dollar amount or number of our shares, and repurchases could be commenced or suspended from time to time without prior notice.
We repurchased 741,412 shares in the fourth quarter of 2024 under the February 2024 authorization.
ITEM 6. RESERVED
ITEM 7. MANAGEMENT’S DISCUSSION AND ANALYSIS OF FINANCIAL CONDITION AND RESULTS OF OPERATIONS
The following discussion and analysis of our financial condition and results of operations should be read in conjunction with our consolidated financial statements and related notes included in this Annual Report on Form 10-K. This discussion contains forward-looking statements that involve risks and uncertainties. Our actual results could differ materially from those anticipated in these forward-looking statements as a result of certain factors including, but not limited to, those discussed under Item 1A, "Risk Factors." The following analysis generally discusses 2024 and 2023 items and year-to-year comparisons between 2024 and 2023. Discussions of 2022 items and year-to-year comparisons between 2023 and 2022 that are not included in this Form 10-K can be found in “Management’s Discussion and Analysis of Financial Condition and Results of Operations” in our Annual Report on Form 10-K for the fiscal year ended December 31, 2023 filed with the SEC on February 21, 2024.
Overview
We develop, manufacture and sell high-performance fiber lasers, fiber amplifiers, diode lasers and laser-based systems that are used for diverse applications, primarily in materials processing, medical and advanced applications. We also manufacture and sell complementary products used with our lasers including optical delivery cables, fiber couplers, beam switches, optical processing heads, in-line sensors and chillers. We sell our products globally to original equipment manufacturers ("OEMs"), system integrators and end users. We market our products internationally, primarily through our
direct sales force. Our major manufacturing facilities are located in the United States and Germany. In response to the risks from the Russia-Ukraine conflict and related sanctions, we have ceased new investment in our Belarusian operations and expanded our manufacturing operations in Germany, the United States and Italy, and have added manufacturing capacity in Poland to meet the demand for our products and our sales and support needs. We have sales and service offices and applications laboratories worldwide.
We are vertically integrated such that we design and manufacture most of the key components used in our finished products, from semiconductor diodes to optical fiber preforms, finished fiber lasers and complementary products. Our vertically integrated operations allow us to reduce manufacturing costs, control quality, rapidly develop and integrate advanced products and protect our proprietary technology.
Description of Our Net Sales, Costs and Expenses
Net sales. We derive net sales primarily from the sale of fiber lasers, fiber amplifiers, diode lasers, laser and non-laser based systems and complementary products. We sell our products to OEMs that supply materials processing laser systems, medical laser systems and other laser systems to end users. We also sell our laser products and laser and non-laser based systems to end users. Our scientists and engineers work closely with OEMs, systems integrators and end users to analyze their system requirements and match appropriate fiber laser, amplifier or system specifications to those requirements. Our sales cycle varies substantially, ranging from a period of a few weeks to as long as one year or more, but is typically several months.
Sales of our products are generally recognized upon shipment, provided that no obligations remain and collection of the receivable is reasonably assured. Sales of customized large scale material processing systems are recognized over time. Our sales typically are made on a purchase order basis rather than through long-term purchase commitments.
We develop our products to standard specifications and use a common set of components within our product architectures. Our major products are based upon a common technology platform. We continually enhance these and other products by improving their components and developing new components and new product designs.
Cost of sales. Our cost of sales consists primarily of the cost of raw materials and components, direct labor expenses and manufacturing overhead. We are vertically integrated and currently manufacture all critical components for our products as well as assemble finished products. We believe our vertical integration allows us to increase efficiencies, leverage our scale and lower our cost of sales. Cost of sales also includes personnel costs and overhead related to our manufacturing, engineering and service operations, related occupancy and equipment costs, shipping costs and reserves for inventory obsolescence and for warranty obligations. Inventories are written off and charged to cost of sales when identified as excess or obsolete.
Due to our vertical integration strategy and ongoing investment in plant and machinery, we maintain a relatively high fixed manufacturing overhead. We may not be able to or choose not to adjust these fixed costs to adapt to rapidly changing market conditions. Our gross margin is therefore significantly affected by our sales volume and the corresponding utilization of capacity and absorption of fixed manufacturing overhead expenses.
Sales and marketing. Our sales and marketing expense consists primarily of costs related to compensation, trade shows, professional and technical conferences, travel, facilities, amortization of intangible assets identified from acquisitions, depreciation of equipment used for demonstration purposes and other marketing costs.
Research and development. Our research and development expense consists primarily of compensation, development expenses related to the design of our products and certain components, the cost of materials and components to build prototype devices for testing, facilities costs and depreciation of equipment and facilities that have an alternative future use used for research and development purposes. Costs related to product development are recorded as research and development expenses in the period in which they are incurred.
General and administrative. Our general and administrative expense consists primarily of compensation and associated costs for executive management, finance, legal, human resources, information technology and other administrative personnel, outside legal and professional fees, insurance premiums and fees, allocated facilities costs, depreciation of facilities and other corporate expenses such as charges and benefits related to the change in allowance for credit losses.
Factors and Trends That Affect Our Operations and Financial Results
In reading our financial statements, you should be aware of the following factors and trends that our management believes are important in understanding our financial performance.
Sale of our Russian Operations. On August 29, 2024, we completed the sale of our Russian subsidiary, Scientific and Technical Association “IRE-Polus”, pursuant to a share purchase agreement with a purchaser entity associated with Softline
Projects LLC and existing management of IRE-Polus for $51.1 million. We recorded a loss on divestiture of $197.7 million for the quarter ended September 30, 2024, which was included in Net loss (gain) from divestiture and sale of assets in our Consolidated Statements of Operations. The loss included $59.3 million related to the carrying value of net assets of our Russian subsidiary that was in excess of net proceeds received on the sale. Included in the net assets sold was cash and cash equivalents of $74.0 million. Also included in the loss was $135.3 million related to the cumulative translation adjustment component of other comprehensive loss that was previously included in stockholders' equity of our Consolidated Balance Sheets. As a result of the Russia-Ukraine conflict and related sanctions, our ability to ship and receive components from our Russian operations was significantly curtailed. In response, we expanded our manufacturing capacity in Germany, the United States and Italy, and added new manufacturing capacity in Poland which effectively offset our inability to utilize the Russian operations.
Belarusian Operations. We manufacture laser cabinets and other mechanical components in Belarus. In response to the Russia-Ukraine conflict, the EU issued additional sanctions impacting commerce with Belarus on June 29, 2024, which restricted the supply of laser cabinets and other mechanical components from our factory in Belarus to our Germany operations after October 2, 2024. As a result of the sanctions and their impact on our Belarus operations, we completed an impairment analysis of our Belarus assets during the third quarter of 2024 and recorded $26.6 million of impairment of long-lived asset in our Consolidated Statements of Operations. At December 31, 2024, the remaining value of the long-lived assets in Belarus was $3.8 million, net working capital excluding cash was immaterial and cash was $4.7 million. The net asset value of our Belarus subsidiary has been reduced by $18.6 million due to the cumulative translation effect of the Belarusian ruble compared to the U.S. dollar, which is included in the accumulated other comprehensive loss component of stockholders' equity. We may incur additional asset impairment charges related to the Belarus operations and the other comprehensive loss that is currently in the equity section of our Consolidated Balance Sheets could be charged to our Consolidated Statements of Operations.
We continue to review our operations in Belarus including potential strategic alternatives. We have qualified third party vendors to supply components previously supplied from Belarus and have begun purchasing from them. Our Board of Directors monitors and continues to assess risks associated with our Belarusian operations.
Supply Chain. We experienced supply chain issues related to the Covid epidemic and related to sanctions that affected the flow of goods to and from our factories in Russia and Belarus. These issues caused us to maintain higher levels of inventory in order to minimize the risk of disruption in production. While these supply chain issues are no longer having a significant impact on our operations, we have experienced increases in our provisions for excess and obsolete inventory as a result of higher inventory levels. In 2024, we recorded additional inventory provisions of $29.5 million attributed to items previously considered safety stock and items that became technologically obsolete.
Net sales. Net sales decreased by 24% in 2024, decreased by 10% in 2023 and decreased 2% in 2022. Our growth rates are subject to several factors, many of which are not under our control.
Our business depends substantially upon capital expenditures by end users, particularly by manufacturers using our products for materials processing, which includes general manufacturing, automotive including electric vehicles ("EV"), other transportation, aerospace, heavy industry, consumer, semiconductor and electronics. Approximately 88% of our revenues in 2024 were from customers using our products for materials processing. Although applications within materials processing are broad, the capital equipment market in general is cyclical and historically has experienced sudden and severe downturns. For the foreseeable future, our operations will continue to depend upon capital expenditures by end users of materials processing equipment and will be subject to the broader fluctuations of capital equipment spending.
In recent years, our net sales and margins have been negatively impacted by tariffs and trade policy. New tariffs and other changes in U.S. trade policy could trigger retaliatory actions by affected countries, and certain foreign governments. We are also susceptible to global or regional disruptions such as political instability, geopolitical conflicts, acts of terrorism, significant fluctuations in currency values, natural disasters and pandemics to the extent that they affect macroeconomic conditions, global supply chains or individual IPG locations.
The average selling prices of our products generally decrease as the products mature. These decreases result from factors such as increased competition, decreased manufacturing costs and increased unit volumes. We may also reduce selling prices in order to penetrate new markets and applications. Furthermore, we may negotiate discounted selling prices from time to time with certain customers that place high unit-volume orders.
The secular shift to fiber laser technology in large materials processing applications, such as welding and cutting applications, had a positive effect on our sales trends in the past such that our sales trends were often better than other capital equipment manufacturers in both positive and negative economic cycles. As the secular shift to fiber laser technology matures in such applications, our sales trends are more susceptible to economic cycles, which can broadly affect the demand for capital
equipment including machine tools and industrial lasers, and competition from other fiber laser manufacturers. Additionally, as our technology matures, we become subject to more competition which can affect sales trends.
Gross margin. Our total gross margin in any period can be significantly affected by a number of factors, including net sales, production volumes, competitive factors, product mix, and by other factors such as changes in foreign exchange rates relative to the U.S. dollar. Many of these factors are not under our control. The following are examples of factors affecting gross margin:
•As our products mature, we can experience additional competition, which tends to decrease average selling prices and affects gross margin;
•Our gross margin can be significantly affected by product mix. Within each of our product categories, the gross margin is generally higher for devices with greater average power, higher technical complexity or demanding performance parameters. These higher power products often have better performance, more difficult specifications to attain and fewer competing products in the marketplace;
•Higher power lasers also use a greater number of optical components, improving absorption of fixed overhead costs and enabling economies of scale in manufacturing;
•The gross margin for certain specialty products may be higher because there are fewer or sometimes no equivalent competing products;
•Customers that purchase devices in greater unit volumes generally are provided lower prices per device than customers that purchase fewer units. In general, lower selling prices to high unit volume customers reduce gross margin although this may be partially offset by improved absorption of fixed overhead costs associated with larger product volumes, which drive economies of scale;
•Gross margin on systems can be lower than gross margin for our lasers and sub-systems, depending on the configuration, volume and competitive forces, among other factors;
•Persistent inflation leading to increases in average manufacturing salaries as well as an increase in the purchase price of components including, but not limited to, electronic components and metal parts could negatively impact gross margin if we are not able to pass those increases on to customers by increasing the selling price of our products;
•Changes in relative exchange rates between currencies we receive when selling our products and currencies we use to pay our manufacturing expenses; and finally,
•Our gross margin from products on new manufacturing lines can be lower due to production inefficiencies, lower yields and high scrap costs.
We expect that some new technologies, products and systems will have returns above our cost of capital but may have gross margins below our corporate average. If we are able to develop opportunities that are significant in size, competitively advantageous or leverage our existing technology base and leadership, our current gross margin levels may not be maintained. Instead, we aim to deliver industry-leading levels of gross margins by growing sales, by taking market share in existing markets, or by developing new applications and markets we address, by reducing the cost of our products and by optimizing the efficiency of our manufacturing operations.
We invested $98.5 million, $110.5 million and $110.1 million in capital expenditures in 2024, 2023 and 2022, respectively. Most of this investment relates to expansion of our manufacturing capacity and, to a lesser extent, research and development and sales-related facilities. We received $28.6 million, $31.2 million and $26.9 million in proceeds from the sale of property, plant and equipment in 2024, 2023 and 2022, respectively.
A high proportion of our costs is fixed so costs are generally difficult to adjust or may take time to adjust in response to changes in demand. In addition, our fixed costs increase as we expand our capacity. If we expand capacity faster than is required by sales growth, gross margins could be negatively affected. Gross margins generally decline if production volumes are lower as a result of a decrease in sales or a reduction in inventory because the absorption of fixed manufacturing costs will be reduced. Gross margins generally improve when the opposite occurs. If both sales and inventory decrease in the same period, the decline in gross margin may be greater if we cannot reduce fixed costs or choose not to reduce fixed costs to match the decrease in the level of production. If we experience a decline in sales that reduces absorption of our fixed costs, or if we have production issues, our gross margins will be negatively affected.
We also regularly review our inventory for items that are slow-moving, have been rendered obsolete or are determined to be excess. Any provision for such slow-moving, obsolete or excess inventory affects our gross margins. For example, we recorded provisions for slow-moving, obsolete or excess inventory and other inventory related charges totaling $82.5 million, $45.5 million and $128.0 million in 2024, 2023 and 2022, respectively. Inventory provisions of $29.5 million in 2024 were attributed to items previously considered safety stock and items that became technologically obsolete. Inventory provision and related charges of $74.1 million in 2022 were attributable to Russian operations.
Selling and general and administrative expenses. In the past, we invested in selling and general and administrative costs in order to support continued growth in the Company. As the secular shift to fiber laser technology matures, our sales growth becomes more susceptible to the cyclical trends typical of capital equipment manufacturers. Accordingly, our future management of and investments in selling and general and administrative expenses will also be influenced by these trends, although we may still invest in selling or general and administrative functions to support certain initiatives even in economic down cycles. Certain general and administrative expenses are not related to the level of sales and may vary quarter to quarter based primarily upon the level of acquisitions, litigation and project related consulting expenses.
Research and development expenses. We plan to continue to invest in research and development to improve our existing components and products and develop new components, products, systems and applications technology. We believe that these investments will sustain our position as a leader in the fiber laser industry and will support development of new products that can address new markets and growth opportunities. The amount of research and development expense we incur may vary from period to period.
Goodwill and long-lived assets impairments. We review our intangible assets and property, plant and equipment for impairment when events or changes in circumstances indicate the carrying value may not be recoverable. Goodwill is required to be tested for impairment at least annually. Negative industry or economic trends, including reduced estimates of future cash flows, disruptions to our business, slower growth rates, lack of growth in our relevant business units, differences in the estimated product acceptance rates, or market prices below the carrying value of long-lived assets evaluated for sale could lead to impairment charges against our long-lived assets, including goodwill and other intangible assets.
As noted above, we recorded $26.6 million impairment of long-lived assets included in Impairment of long-lived assets in our Consolidated Statements of Operations. After impairment, the remaining carrying value of the long-lived assets in Belarus is $3.8 million.
Our valuation methodology for assessing impairment requires management to make significant judgments and assumptions based on historical experience and to rely heavily on projections of future operating performance at many points during the analysis. Also, the process of evaluating the potential impairment of goodwill is subjective. We operate in a highly competitive environment and projections of future operating results and cash flows may vary significantly from actual results. If our analysis indicates potential impairment to goodwill in one or more of our reporting units, we may be required to record charges to earnings in our financial statements, which could negatively affect our results of operations.
Foreign exchange. Because we are a U.S.-based company doing business globally, we have both translational and transactional exposure to fluctuations in foreign currency exchange rates. Changes in the relative exchange rate between the U.S. dollar and the foreign currencies in which our subsidiaries operate directly affects our sales, costs and earnings. Differences in the relative exchange rates between where we sell our products and where we incur manufacturing and other operating costs (primarily in the U.S. and Germany) also affects our costs and earnings. Certain currencies experiencing significant exchange rate fluctuations like the euro, the Russian ruble, the Chinese yuan and Japanese yen have had and could have an additional significant impact on our sales, costs and earnings. Our ability to adjust the foreign currency selling prices of products in response to changes in exchange rates is limited and may not offset the impact of the changes in exchange rates on the translated value of sales or costs. In addition, if we increase the selling price of our products in local currencies, this could have a negative impact on the demand for our products.
Income taxes. On December 15, 2022, the European Union (EU) Member States formally adopted the EU’s Pillar Two Directive, which generally provides for a minimum effective tax rate of 15%, as established by the Organization for Economic Co-operation and Development ("OECD") Pillar Two Framework that was supported by over 130 countries worldwide. The EU effective dates were January 1, 2024, and January 1, 2025, for different aspects of the directive. The impact of the Pillar Two Framework on our income tax provision in 2024 was not material. We are continuing to evaluate the potential impact of the Pillar Two Framework on future periods, pending legislative adoption by additional individual countries.
Major customers. While we have historically depended on a few customers for a large percentage of our annual net sales, the composition of this group can change from year to year. Net sales derived from our five largest customers as a percentage of our annual net sales were 13%, 13% and 15% in 2024, 2023 and 2022, respectively. One of our customers accounted for 12% and 14% of our net accounts receivable as of December 31, 2024 and 2023, respectively. We seek to add new customers and to
expand our relationships with existing customers. We anticipate that the composition of our significant customers will continue to change. We generally do not enter into agreements with our customers obligating them to purchase a fixed number or large volume of our products. If any of our significant customers substantially reduced their purchases from us, our results would be adversely affected.
Critical Accounting Policies and Estimates
The preparation of financial statements in conformity with accounting principles generally accepted in the United States ("GAAP") requires management to make estimates and assumptions that affect the reported amounts of assets and liabilities and disclosure of contingent assets and liabilities at the date of the financial statements and the reported amounts of net sales and expenses. Refer to Note 1, "Nature of Business and Summary of Significant Accounting Policies," in our consolidated financial statements for additional information. By their nature, these estimates and judgments are subject to an inherent degree of uncertainty. We base our estimates and judgments on our historical experience and on other assumptions that we believe are reasonable under the circumstances, the results of which form the basis for making the judgments about the carrying values of assets and liabilities that are not readily apparent from other sources. Actual results could differ from those estimates, which may materially affect our operating results and financial position. We have identified the following items that require the most significant judgment and often involve complex estimation:
Revenue Recognition. Revenue is recognized when transfer of control to the customer occurs (i.e., when our performance obligation is satisfied) in an amount reflecting the consideration that we expect to be entitled. For the majority of our revenue, this typically occurs at a point in time such as shipment or delivery date, but can occur over time for certain of our customized large scale materials processing systems contracts. We also recognize revenue over time for sales of extended warranties. When goods or services have been delivered to the customer, but all conditions for revenue recognition have not been met, deferred revenue and deferred costs are recorded on our Consolidated Balance Sheets.
Judgments and Uncertainties: Recognizing revenue at shipment or delivery involves some judgment, particularly when we receive orders with multiple delivery dates. We allocate the transaction price of the contract to each delivery date based upon the standalone selling price of each distinct product in the contract. We invoice for each scheduled delivery upon shipment and recognize revenue for such delivery when transfer of control has occurred. Recognizing revenue over time for customized large scale materials processing systems contracts is based on our judgment that these systems do not have an alternative use and we have an enforceable right to payment for performance completed to date. Recognizing revenue over time also requires estimation of the progress towards completion based on the projected costs of the contract.
Sensitivity of Estimate to Change: Recognizing revenue at a point in time is sensitive to changes in shipping or delivery dates. Revenue recognition over time is sensitive to the actual costs incurred as compared to the projected total cost of the project. We monitor the actual and projected costs of these contracts closely. A change in the projected cost of a project will affect the estimated percentage of completion, the amount of revenue recognized and estimated gross margin.
Inventory. We maintain a reserve for excess or obsolete inventory items. The reserve is based upon a review of inventory materials on hand, which we compare with historic usage, estimated future usage and age. In addition, we review the inventory and compare recorded costs with estimates of current market value. Write-downs are recorded to reduce the carrying value to the net realizable value with respect to any part with costs in excess of current market value. In the fourth quarter of 2022, we performed a review of the inventory in Russia in light of new sanctions which restricted our Russian factory's ability to supply components and finished goods to other IPG locations. We recorded $74.1 million of additional inventory provision and related charges as a result of that review in 2022. In the third quarter of 2024, we recorded $29.5 million of additional inventory provision that was attributed to items previously considered safety stock and items that became technologically obsolete.
Judgments and Uncertainties: Estimating demand and current market values is inherently difficult, particularly given that we make highly specialized components and products. We determine the valuation of excess and obsolete inventory by making our best estimate considering the current quantities of inventory on hand and our forecast of the need for this inventory to support future sales of our products. We often have limited information on which to base our forecasts. If future sales differ from these forecasts, the valuation of excess and obsolete inventory may change and additional inventory provisions may be required.
Sensitivity of Estimate to Change: Because of our vertical integration, a significant or sudden decrease in sales could result in a significant change in the estimates of excess or obsolete inventory valuation. Because our calculation of slow-moving, excess or obsolete inventory is based on historical and estimated future use of inventory items, the calculation is affected by sales trends. In 2024, we recorded inventory provision of $29.5 million for items previously considered safety stock and items that became technologically obsolete. In 2023, as sales decreased the inventory provision related to slow-moving, excess or obsolete inventory increased. In 2022, we recorded inventory provision and related charges of $74.1 million as a
result of the review of the inventory in Russia. For the rest of our operations, as safety stock increased excess and obsolete inventory reserves increased during 2022.
Long-lived Asset Impairment. Long-lived assets including definite-lived intangible assets are amortized on a straight-line basis over the estimated useful life. We review these assets for impairment when conditions exist that indicate the carrying amount of the assets may not be recoverable. Such conditions could include significant adverse changes in the business climate, current-period operating or cash flow losses, significant declines in forecasted operations, or a current expectation that an asset group will be disposed of before the end of its useful life. We perform undiscounted operating cash flow analyses to determine if an impairment exists. When testing for impairment of long-lived assets held for use, we group assets at the lowest level for which cash flows are separately identifiable. If an impairment is determined to exist, the loss is calculated based on estimated fair value based on a probability-weighted average of valuations using the discounted cash flow method under the income approach. We recorded long-lived asset impairment charge of $27.0 million, $1.2 million, and $79.9 million in 2024, 2023 and 2022, respectively. Impairment charges in 2022 and 2024 primarily related to the impairment of our Russian and Belarus long-lived assets, respectively, as a result of new sanctions that impacted our business there.
Judgments and Uncertainties: Our valuation methodology for assessing impairment requires management to make significant judgments and assumptions based on historical experience and to rely heavily on projections of future operating performance at many points during the analysis. Estimating undiscounted operating cash flow used to determine if there is indication of impairment of a long-lived asset requires us to make assumptions and estimates regarding our future plans, as well as industry, economic, and regulatory conditions. Fair value estimates performed to determine impairment charge amounts are subject to underlying changes in estimates and market conditions. Assumptions used in long-lived asset impairment are made at a point in time and require significant judgment; therefore, they are subject to change based on the facts and circumstances present at each impairment test date.
Sensitivity of Estimate to Change: Undiscounted cash flows and fair value are sensitive to changes in underlying assumptions, estimates, and market factors. Negative industry or economic trends, including reduced estimates of future cash flows, disruptions to our business, slower growth rates, lack of growth in our relevant business units, differences in the estimated product acceptance rates, or market prices below the carrying value of long-lived assets evaluated for sale could lead to impairment charges against our long-lived assets.
Income Taxes and Deferred Taxes. Our annual tax rate is based on the income generated in the jurisdictions in which we operate, the statutory tax rates in those jurisdictions and tax planning opportunities available to the Company. We file federal and state income tax returns in the United States and income tax returns in all the foreign jurisdictions in which we operate.
Judgments and Uncertainties: We estimate our income tax expense in each jurisdiction we operate in after considering, among other factors, the pricing of inter-company transactions on an arm’s length basis, the differing tax rates between jurisdictions, allocation factors, tax credits, nondeductible items and changes in enacted tax rates. Significant judgment is required in determining the pricing of inter-company transactions, our annual tax expense and in evaluating our tax positions in the various jurisdictions in which we operate. As we continue to expand globally, there is a risk that, due to complexity within and diversity among the various jurisdictions in which we do business, a governmental agency may disagree with the manner in which we have computed our taxes. Additionally, due to the lack of uniformity among all of the foreign and domestic taxing authorities, there may be situations where the tax treatment of an item in one jurisdiction is different from the tax treatment in another jurisdiction or that the transaction causes a tax liability to arise in another jurisdiction.
In addition, we review the deferred tax assets in each jurisdiction and the positive and negative evidence that would support a conclusion that a valuation allowance is or is not needed. Where it is more likely than not that some portion of the deferred tax assets will not be realized, we record a valuation allowance against the deferred tax assets. The decision to establish a valuation allowance or reverse it is based on management’s judgment based on the weight of available evidence including forecasts of future taxable income and the future reversal of existing taxable temporary differences.
Sensitivity of Estimate to Change: We provide reserves for potential payments of tax to various tax authorities related to uncertain tax positions and other issues. Reserves recorded are based on a determination of tax benefits claimed in our tax filings and whether these positions are more likely than not to be realized following the resolution of any potential tax audits related to the tax benefit, assuming that the matter in question will be reviewed by the tax authorities. Potential interest and penalties associated with such uncertain tax positions are recorded as a component of income tax expense. As of December 31, 2024, we had $13.9 million of unrecognized tax benefits, excluding interest and penalties, recorded in other long-term liabilities and deferred income taxes on our Consolidated Balance Sheets. This tax liability increased by $0.2 million for tax positions taken in the current year offset by reductions of $3.4 million for changes in prior period positions.
Results of Operations
The following table sets forth selected statement of operations data for the periods indicated in dollar amounts and expressed as a percentage of net sales:
| | | | | | | | | | | | | | | | | | | | | | | | | | | | | | | | | | | |
| | Year Ended December 31, |
| | 2024 | | 2023 | | 2022 |
| | (In thousands, except percentages and per share data) |
| Net sales | $ | 977,134 | | | 100.0 | % | | $ | 1,287,439 | | | 100.0 | % | | $ | 1,429,547 | | | 100.0 | % |
| Cost of sales | 638,979 | | | 65.4 | | | 745,741 | | | 57.9 | | | 874,134 | | | 61.1 | |
| Gross profit | 338,155 | | | 34.6 | | | 541,698 | | | 42.1 | | | 555,413 | | | 38.9 | |
| Operating expenses: | | | | | | | | | | | |
| Sales and marketing | 89,582 | | | 9.2 | | | 85,679 | | | 6.7 | | | 76,643 | | | 5.3 | |
| Research and development | 109,783 | | | 11.2 | | | 98,704 | | | 7.7 | | | 116,114 | | | 8.1 | |
| General and administrative | 124,313 | | | 12.7 | | | 125,749 | | | 9.7 | | | 131,253 | | | 9.2 | |
| | | | | | | | | | | |
| Net loss (gain) from divestitures and sale of assets | 190,201 | | | 19.5 | | | — | | | — | | | (31,846) | | | (2.2) | |
| Impairment of long-lived assets | 27,006 | | | 2.7 | | | 1,237 | | | 0.1 | | | 79,949 | | | 5.6 | |
| Restructuring charges (recoveries), net | — | | | — | | | (288) | | | — | | | 9,697 | | | 0.7 | |
| Loss (gain) on foreign exchange | 5,524 | | | 0.6 | | | (1,356) | | | (0.1) | | | 4,103 | | | 0.3 | |
| Total operating expenses | 546,409 | | | 55.9 | | | 309,725 | | | 24.1 | | | 385,913 | | | 27.0 | |
| Operating (loss) income | (208,254) | | | (21.3) | | | 231,973 | | | 18.0 | | | 169,500 | | | 11.8 | |
| Interest income, net | 45,467 | | | 4.7 | | | 41,735 | | | 3.2 | | | 12,620 | | | 0.9 | |
| Other income, net | 899 | | | 0.1 | | | 1,167 | | | 0.1 | | | 1,231 | | | 0.1 | |
| (Loss) income before provision for income taxes | (161,888) | | | (16.5) | | | 274,875 | | | 21.3 | | | 183,351 | | | 12.8 | |
| Provision for income taxes | 19,638 | | | 2.0 | | | 55,997 | | | 4.3 | | | 72,589 | | | 5.1 | |
| Net (loss) income | (181,526) | | | (18.5) | | | 218,878 | | | 17.0 | | | 110,762 | | | 7.7 | |
| Less: net income attributable to non-controlling interest | — | | | — | | | — | | | — | | | 853 | | | 0.1 | |
| Net (loss) income attributable to IPG Photonics Corporation common stockholders | $ | (181,526) | | | (18.5) | % | | $ | 218,878 | | | 17.0 | % | | $ | 109,909 | | | 7.6 | % |
| Net (loss) income attributable to IPG Photonics Corporation per common share: | | | | | | | | | | | |
| Basic | $ | (4.09) | | | | | $ | 4.64 | | | | | $ | 2.17 | | | |
| Diluted | $ | (4.09) | | | | | $ | 4.63 | | | | | $ | 2.16 | | | |
| Weighted average common shares outstanding: | | | | | | | | | | | |
| Basic | 44,336 | | | | | 47,154 | | | | | 50,761 | | | |
| Diluted | 44,336 | | | | | 47,320 | | | | | 50,925 | | | |
Comparison of Year Ended December 31, 2024 to Year Ended December 31, 2023
Net sales. Net sales decreased by $310.3 million, or 24.1%, to $977.1 million in 2024 from $1,287.4 million in 2023. The table below sets forth sales by application:
| | | | | | | | | | | | | | | | | | | | | | | | | | | | | | | | | | | | | | |
| | Year Ended December 31, | | | | |
| | | 2024 | | 2023 | | Change |
| | (In thousands, except for percentages) | | | | |
| Sales by Application | | | | % of Total | | | | % of Total | | | | |
| Materials Processing | | $ | 857,336 | | | 87.7 | % | | $ | 1,152,804 | | | 89.5 | % | | $ | (295,468) | | | (25.6) | % |
| Other Applications | | 119,798 | | | 12.3 | % | | 134,635 | | | 10.5 | % | | (14,837) | | | (11.0) | % |
| Total | | $ | 977,134 | | | 100.0 | % | | $ | 1,287,439 | | | 100.0 | % | | $ | (310,305) | | | (24.1) | % |
The table below sets forth sales by type of product and other revenue:
| | | | | | | | | | | | | | | | | | | | | | | | | | | | | | | | | | | | | | |
| | Year Ended December 31, | | | | |
| | | 2024 | | 2023 | | Change |
| | (In thousands, except for percentages) | | | | |
| Sales by Product | | | | % of Total | | | | % of Total | | | | |
| High Power Continuous Wave ("CW") Lasers | | $ | 332,743 | | | 34.1 | % | | $ | 524,981 | | | 40.8 | % | | $ | (192,238) | | | (36.6) | % |
| Medium Power CW Lasers | | 63,685 | | | 6.5 | % | | 71,672 | | | 5.6 | % | | (7,987) | | | (11.1) | % |
| Pulsed Lasers | | 146,759 | | | 15.0 | % | | 185,581 | | | 14.4 | % | | (38,822) | | | (20.9) | % |
| Quasi-Continuous Wave ("QCW") Lasers | | 48,016 | | | 4.9 | % | | 48,648 | | | 3.8 | % | | (632) | | | (1.3) | % |
| Laser and Non-Laser Systems | | 139,145 | | | 14.3 | % | | 161,177 | | | 12.5 | % | | (22,032) | | | (13.7) | % |
| Other Revenue including Other Lasers, Amplifiers, Service, Parts, Accessories and Change in Deferred Revenue | | 246,786 | | | 25.2 | % | | 295,380 | | | 22.9 | % | | (48,594) | | | (16.5) | % |
| Total | | $ | 977,134 | | | 100.0 | % | | $ | 1,287,439 | | | 100.0 | % | | $ | (310,305) | | | (24.1) | % |
Materials Processing
Sales for materials processing applications decreased primarily due to lower sales of high power CW lasers, pulsed lasers, and other laser products and services.
•High power CW laser sales decreased due to lower sales for cutting and welding applications, and were primarily impacted by softer industrial demand and a decrease in e-mobility investments. Pulsed laser sales decreased due to lower demand in foil cutting and micro-machining applications.
Other Applications
Sales from other applications decreased primarily due to decreased demand for lasers used in medical procedures.
Our net sales were derived from customers in the following geographic regions:
| | | | | | | | | | | | | | | | | | | | | | | | | | | | | | | | | | | | | | |
| | | Year Ended December 31, | | | | |
| | | 2024 | | 2023 | | Change |
| | (In thousands, except for percentages) | | | | |
| Sales by Geography | | | | % of Total | | | | % of Total | | | | |
North America (1) | | $ | 258,888 | | | 26.5 | % | | $ | 313,986 | | | 24.4 | % | | $ | (55,098) | | | (17.5) | % |
| Europe: | | | | | | | | | | | | |
| Germany | | 87,800 | | | 9.0 | % | | 88,026 | | | 6.8 | % | | (226) | | | (0.3) | % |
| Other Europe | | 197,152 | | | 20.1 | % | | 291,336 | | | 22.6 | % | | (94,184) | | | (32.3) | % |
| Asia: | | | | | | | | | | | | |
| China | | 244,996 | | | 25.1 | % | | 355,321 | | | 27.6 | % | | (110,325) | | | (31.0) | % |
| Japan | | 62,352 | | | 6.4 | % | | 72,333 | | | 5.6 | % | | (9,981) | | | (13.8) | % |
| Other Asia | | 113,232 | | | 11.6 | % | | 142,378 | | | 11.1 | % | | (29,146) | | | (20.5) | % |
| Rest of World | | 12,714 | | | 1.3 | % | | 24,059 | | | 1.9 | % | | (11,345) | | | (47.2) | % |
| Total | | $ | 977,134 | | | 100.0 | % | | $ | 1,287,439 | | | 100.0 | % | | $ | (310,305) | | | (24.1) | % |
(1)The substantial majority of sales in North America are to customers in the United States.
Cost of sales and gross margin. Cost of sales decreased by $106.7 million, or 14.3%, to $639.0 million in 2024 from $745.7 million in 2023. Our gross margin decreased to 34.6% in 2024 from 42.1% in 2023. Gross margin decreased mainly due to increased provisions for excess and obsolete inventory, specifically additional inventory provisions of $29.5 million attributed to items previously considered safety stock and items that became technologically obsolete. In addition to provisions for inventory reserves, gross margin declined due to an increase in unabsorbed manufacturing costs, partially offset by a decrease in cost of product sold from inventory and shipping costs and tariffs, as a percentage of sales. Expenses related to provisions for excess or obsolete inventory and other valuation adjustments increased by $37.0 million to $82.5 million, or
8.4% of sales, for the year ended December 31, 2024, as compared to $45.5 million, or 3.5% of sales, for the year ended December 31, 2023.
Sales and marketing expense. Sales and marketing expense increased by $3.9 million, or 4.6%, to $89.6 million in 2024 from $85.7 million in 2023. This change was primarily a result of an increase of $3.5 million in personnel and related costs and $2.3 million in premises expense, partially offset by $2.2 million in lower depreciation and amortization expense. As a percentage of sales, sales and marketing expense was 9.2% and 6.7% of sales in 2024 and 2023, respectively.
Research and development expense. Research and development expense increased by $11.1 million, or 11.2%, to $109.8 million in 2024 from $98.7 million in 2023. This change was primarily a result of an increase of $8.3 million in personnel and related costs, an increase of $5.8 million in premises expense, partially offset by a decrease of $3.6 million in materials and other R&D expense. As a percentage of sales, research and development expense increased to 11.2% in 2024 from 7.7% in 2023. We expect to continue to invest in research and development efforts for new and continuing products.
General and administrative expense. General and administrative expense decreased by $1.4 million, or 1.1%, to $124.3 million in 2024 from $125.7 million in 2023. This change was primarily a result of a decrease of $3.8 million in personnel and related costs, partially offset by an increase of $1.0 million in legal, $0.8 million in information systems, and $0.6 million in accounting expense. As a percentage of sales, general and administrative expense increased to 12.7% in 2024 from 9.8% in 2023.
Effect of exchange rates on sales, gross margin and operating expenses. We estimate that if exchange rates had been the same as one year ago, sales in 2024 would have been $15.6 million higher, gross margin would have been $9.2 million higher and sales and marketing, research and development and general and administrative expenses would have been $3.8 million higher. These estimates assume constant exchange rates between fiscal year 2024 and fiscal year 2023 and are calculated using the average exchange rates for the twelve-month period ended December 31, 2023 for the respective currencies, which were US$1=Euro 0.92, US$1=Japanese yen 141, US$1=Chinese yuan 7.08 and US$1=Russian ruble 85.
Net loss (gain) from divestiture and sale of assets. We incurred a net loss of $190.2 million in 2024 as compared to no loss or gain in 2023. The loss primarily related to a loss of $197.7 million upon the divestiture of our Russian operations, partially offset by a gain on sale of assets of $7.5 million related to the sales of a building and land in the U.S. and a building in the U.K.
Impairment of long-lived assets. We recorded a non-cash long-lived asset impairment charge of $27.0 million in 2024 as compared to $1.2 million in 2023. The impairment of long-lived assets in 2024 was primarily related to an impairment of the assets in Belarus of $26.6 million as a result of new EU sanctions that will limit our ability to supply laser cabinets and other mechanical components from our factory in Belarus. The impairment of long-lived assets in 2023 was related to the right-of-use ("ROU") asset for a leased building associated with our Submarine Network Division business that was previously divested. Attempts to sublease the space have been unsuccessful. As of December 31, 2023, the ROU asset related to this lease has been reduced to zero.
Restructuring charges (recoveries), net. We recorded no restructuring charges nor recoveries in 2024 as compared to a net restructuring gain of $0.3 million in 2023 primarily related to the completion of our restructuring program at our Russian subsidiary.
Loss (gain) on foreign exchange. We incurred a foreign exchange loss of $5.5 million in 2024 as compared to a gain of $1.4 million in 2023. The losses in 2024 was primarily attributable to depreciation of the Chinese yuan and Korean won, partially offset by the gain from depreciation of the Euro, as compared to the U.S. dollar.
Interest income, net. Interest income, net was $45.5 million in 2024 compared to $41.7 million in 2023. The change in interest income, net, was driven by an increase in yields on cash equivalents and short term investments as a result of higher market interest rates as compared to prior year rates.
Provision for income taxes. Provision for income taxes was $19.6 million in 2024 compared to $56.0 million in 2023, representing an effective tax rate of (12.1)% in 2024 and 20.4% in 2023. The decrease in tax expense was due primarily to a reduction in taxable income. In 2024 we had tax expense on a loss before income due to the effect of discrete items. Total discrete adjustments in 2024 increased tax expense by $46.0 million. Discrete items include an increase in tax expense of $43.2 million related the loss on divestiture of Russian operations that had no tax benefit. Other discrete items for 2024 included a $3.2 million benefit related to a decrease in uncertain tax positions and the results of tax audits. This benefit was offset by an increase in tax expense of $5.4 million for equity-based compensation deductions reflected in book income in excess of the deductions allowed for tax purposes. Discrete adjustments in 2023 resulted in a $5.7 million decrease in tax expense, which includes (i) $4.3 million decrease in the valuation allowance primarily due to current year profits in our Russian subsidiary and
(ii) $3.5 million related to a decrease in uncertain tax positions and the results of tax audits. These benefits were partly offset by an increase in tax expense of $1.8 million for equity-based compensation deductions reflected in book income in excess of the deductions allowed for tax purposes.
Net (loss) income attributed to IPG Photonics Corporation. Net (loss) income attributable to IPG Photonics Corporation decreased by $400.4 million to a net loss of $181.5 million in 2024 from a net income of $218.9 million in 2023. Net loss attributable to IPG Photonics Corporation as a percentage of our net sales decreased by 35.6% to (18.6)% in 2024 from 17.0% in 2023 due to the factors described above.
Liquidity and Capital Resources
We believe that our existing cash and cash equivalents, short-term investments, our cash flows from operations and our existing lines of credit provide us with the financial flexibility to meet our liquidity and capital needs. We expect to continue making investments in capital expenditures, assess acquisition opportunities, carry out research and development and investment in resources to strengthen our organization. The extent and timing of such expenditures may vary from period to period. Our future long-term capital requirements will depend on many factors including our level of sales, the impact of the economic environment on our growth, the timing and extent of spending to support development efforts, expansion of global sales and marketing activities, government regulation including trade sanctions, the timing and introductions of new products, the need to ensure access to adequate manufacturing capacity and the market acceptance of our current and future products.
As of December 31, 2024, we had no off-balance sheet arrangements that have, or are reasonably likely to have, a current or future material effect on our consolidated financial condition, results of operations, liquidity, capital expenditures or capital resources.
The following table presents our principal sources of liquidity: | | | | | | | | | | | | | | |
| | As of December 31, |
| | 2024 | | 2023 |
| | (In thousands) |
| Cash and cash equivalents | | $ | 620,040 | | | $ | 514,674 | |
| Short-term investments | | 310,152 | | | 662,807 | |
| Unused credit lines and overdraft facilities | | 78,115 | | | 78,506 | |
| Working capital (excluding cash and cash equivalents and short-term investments) | | 295,784 | | | 522,312 | |
Included in cash and cash equivalents is $4.7 million of cash located in Belarus, as of December 31, 2024.
Short-term investments at December 31, 2024 consist of liquid investments including commercial paper, corporate bonds, U.S. Treasury and agency obligations, and term deposits with original maturities of greater than three months but less than one year. See Note 3, "Fair Value Measurements" in the notes to the consolidated financial statements for further information about our short-term investments.
The following table details our line-of-credit facilities as of December 31, 2024:
| | | | | | | | | | | | | | | | | | | | | | | | | | |
| | | | | | | | |
| Description | | Total Facility/ Note | | Interest Rate | | Maturity | | Security |
U.S. Revolving Line of Credit (1) | | $75.0 million | | SOFR plus 0.9% to 1.6%, depending on our performance | | April 2025 | | Unsecured |
Euro Credit Facility (Germany) (2) | | Euro 5.0 million
($5.2 million) | | €STR rate plus 0.97% | | December 2028 | | Unsecured, guaranteed by parent company |
Euro Facility (3) | | Euro 1.5 million
($1.6 million) | | 4.3% | | September 2025 | | Common pool of assets of Italian subsidiary |
(1) This facility is available to certain foreign subsidiaries in their respective local currencies. At December 31, 2024, there were no amounts drawn on this line, however, there were $2.1 million of guarantees issued against the line which reduces total availability.
(2) This facility is available to certain foreign subsidiaries in their respective local currencies. At December 31, 2024, there were no amounts drawn on this line, however, there were $1.5 million of guarantees issued against the line which reduces total availability.
(3) At December 31, 2024, there were no drawings. This facility renews annually.
Our largest committed credit line is with Bank of America N.A. in the amount of $75.0 million, which is not syndicated. We are required to meet certain financial covenants associated with our U.S. revolving line of credit. These covenants, tested quarterly, include an interest coverage ratio and a funded debt to earnings before interest, taxes, depreciation and amortization ("EBITDA") ratio. The interest coverage covenant requires that we maintain a trailing twelve-month ratio of EBITDA to interest on all obligations that is at least 3.0:1.0. The funded debt to EBITDA covenant requires that the sum of all indebtedness for borrowed money on a consolidated basis be less than three times our trailing twelve months EBITDA. Funded debt is decreased by our cash and available marketable securities not classified as long-term investments in the U.S. in excess of $50 million up to a maximum of $500 million. We were in compliance with all such financial covenants as of and for the three months ended December 31, 2024.
See Note 12, "Financing Arrangements" in the notes to the consolidated financial statements for further information about our facilities.
The following table summarizes our material cash commitments at December 31, 2024 and the effect such commitments are expected to have on our liquidity and cash flows in future periods. We intend to use our existing cash, cash equivalents and short term investments as well as cash generated from operations as sources of funds for these material commitments.
| | | | | | | | | | | | | | | | | | | | |
| | | Payments Due in |
| | | Total | | Less Than 1 Year | | | | | | |
| | (In thousands) |
| Operating lease obligations | | $ | 19,925 | | | $ | 5,515 | | | | | | | |
| Purchase obligations | | 71,238 | | | 69,576 | | | | | | | |
| | | | | | | | | | |
| | | | | | | | | | |
Total (1) | | $ | 91,163 | | | $ | 75,091 | | | | | | | |
(1)Excludes obligations related to ASC 740, reserves for uncertain tax positions, because we are unable to provide a reasonable estimate of the timing of future payments relating to the remainder of these obligations. See Note 17, "Income Taxes" to the consolidated financial statements.
The following table presents cash flow activities: | | | | | | | | | | | | | | |
| | As of December 31, |
| | 2024 | | 2023 |
| | (In thousands) |
| Cash provided by operating activities | | $ | 247,896 | | | $ | 295,986 | |
| Cash provided by (used in) investing activities | | 208,732 | | | (237,554) | |
| Cash used in financing activities | | (339,621) | | | (236,380) | |
Operating activities. Net cash provided by operating activities decreased by $48.1 million to $247.9 million in 2024 from $296.0 million in 2023 primarily due to a decrease in net income after adding back non-cash expenses, partially offset by an increase in cash provided by working capital. Our largest working capital items are inventory and accounts receivable. Items such as accounts payable to third parties, prepaid expenses and other current assets and accrued expenses and other liabilities are not as significant as our working capital investment in accounts receivable and inventory because of the amount of value added within IPG due to our vertically integrated structure. Accruals and payables for personnel costs including bonuses and income and other taxes payable are largely dependent on the timing of payments for those items. The decrease in cash flow from operating activities in 2024 primarily resulted from:
•a decrease in cash provided by net income after adjusting for non-cash operating activities, mainly due to lower sales; and
•an increase in cash used by income and other taxes payable due to the timing of estimated tax payments made and refunds received from filing tax returns, an installment due on the transition tax liability from the Tax Reform Act of 2017, and excise tax paid on our stock repurchase program.
The decrease in cash provided by operating activities were partially offset by:
•an increase in cash provided by accounts receivable due to the timing of collections and lower sales;
•an increase in cash provided by inventory as supply chain disruptions moderated requiring less investment in safety stock and due to a targeted plan to reduce inventory levels;
•an increase in cash provided by the timing of payments made for accounts payable and prepayments; and
•a decrease in cash used by accrued expenses from lower payouts related to accrued compensation and bonuses.
Investing activities. Net cash provided by investing activities was $208.7 million in 2024 as compared to cash used in investing activities of $237.6 million in 2023. The cash provided by investing activities in 2024 primarily related to $370.3 million of net proceeds of short-term investments and $28.6 million of proceeds from the sale of property, plant and equipment, partially offset by $98.5 million of cash used for property, plant and equipment, $66.7 million of cash used for the acquisition of cleanLASER and $25.3 million of net cash outflow from the divestiture of our Russian operation. The cash proceeds from the sale of our Russian operation were lower than the cash and cash equivalents on hand, resulting in a cash outflow from divestiture. The cash used in investing activities in 2023 primarily related to $158.9 million of net cash used for purchases of short-term investments, and $110.5 million of proceeds from the sale of property, plant and equipment, partially offset by $31.2 million of proceeds from the sale of property, plant and equipment.
In 2025, we expect to incur approximately $105.0 million to $115.0 million in capital expenditures. Capital expenditures include investments in property, facilities and equipment to replace capacity in Russia or increase redundant capacity for critical components and upgrade or replace equipment at other facilities that is beyond its useful life. The timing and extent of any capital expenditures in and between periods can have a significant effect on our cash flow. Many of the capital expenditure projects that we undertake have long lead times and are difficult to cancel or defer to a later period. We intend to finance our capital expenditures with existing cash, cash equivalents and short term investments as well as with cash generated from operations.
Financing activities. Net cash used in financing activities was $339.6 million and $236.4 million in 2024 and 2023, respectively. The cash used in financing activities in 2024 was primarily related to the purchase of $343.8 million of treasury stock, partially offset by net proceeds of $4.2 million from the exercise of stock options net of amounts disbursed in relation to shares withheld to cover employee income taxes due upon the vesting and release of restricted stock units and shares issued under our employee stock purchase plan. The cash used in financing activities in 2023 was primarily related to the purchase of $223.5 million of treasury stock, $16.0 million of principal payments on our long-term borrowings; partially offset by net proceeds of $3.1 million from the exercise of stock options net of amounts disbursed in relation to shares withheld to cover employee income taxes due upon the vesting and release of restricted stock units and shares issued under our employee stock purchase plan.
Recent Accounting Pronouncements
See Note 1, "Nature of Business and Summary of Significant Accounting Policies" in the notes to the consolidated financial statements for a full description of recent accounting pronouncements, including the respective dates of adoption or expected adoption and effects on our consolidated financial statements contained in Part IV of this Annual Report.
ITEM 7A. QUANTITATIVE AND QUALITATIVE DISCLOSURES ABOUT MARKET RISK
We are exposed to market risk in the ordinary course of business, which consists primarily of interest rate risk associated with our cash and cash equivalents and foreign exchange rate risk.
Interest rate risk. Certain interest rates are variable and fluctuate with current market conditions. Our investments have limited exposure to market risk. We maintain a portfolio of cash, cash equivalents and short-term investments, consisting primarily of money market funds and term deposits, commercial paper, U.S. government and agency securities, term deposits, and corporate bonds. None of these investments have a maturity date in excess of one year. Because of the short-term nature of these instruments, a sudden change in market interest rates would not be expected to have a material impact on our financial condition or results of operations.
We are also exposed to market risk as a result of increases or decreases in the amount of interest expense we must pay on our borrowings on our bank credit facilities. Although our U.S. revolving line of credit and our Euro credit facilities have variable rates, we do not believe that a 10% change in market interest rates would have a material impact on our financial position or results of operations.
Exchange rates. Due to our international operations, a significant portion of our net sales, cost of sales and operating expenses are denominated in currencies other than the U.S. dollar, principally the Euro and the Chinese yuan. Changes in the exchange rate of the U.S. dollar versus the functional currencies of our subsidiaries affect the translated value and relative level of sales and net income that we report from one period to the next. In addition, our subsidiaries may have assets or liabilities denominated in a currency other than their functional currency which results in foreign exchange transaction gains and losses due to changes in the value of the functional currency versus the currency the assets and liabilities are denominated in. In 2024 we incurred a loss on foreign exchange transactions of $5.5 million as compared to a gain of $1.4 million in 2023. As our Chinese and South Korean subsidiaries have net U.S. dollar denominated liabilities, the depreciation of the Chinese yuan and South Korean won relative to the U.S. dollar contributed to most of the foreign exchange loss in 2024, partially offset by gain
on the depreciation of the Euro as our German subsidiary has net U.S. dollar denominated assets. Management attempts to minimize these exposures by partially or fully off-setting foreign currency denominated assets and liabilities at our subsidiaries that operate in different functional currencies. The effectiveness of this strategy can be limited by the volume of underlying transactions at various subsidiaries and by our ability to accelerate or delay inter-company cash settlements. As a result, we are unable to create a perfect offset of the foreign currency denominated assets and liabilities. Furthermore, if we expect a currency movement to be beneficial to us in the short or medium term, we have, on occasions, chosen not to hedge or otherwise offset the underlying assets or liabilities. However, it is difficult to predict foreign currency movements accurately.
At December 31, 2024, our material foreign currency exposure is net U.S. dollar denominated assets at subsidiaries where the Euro is the functional currency and U.S. dollar denominated liabilities where the Chinese yuan and the South Korean won is the functional currency. The net U.S. dollar denominated assets are comprised of cash, third party receivables and inter-company receivables offset by third party and inter-company U.S. dollar denominated payables. The U.S. dollar denominated liabilities are comprised of inter-company payables. A 5% change in the relative exchange rate of the U.S. dollar to the Euro applied to the net U.S. dollar asset balances as of December 31, 2024, would result in a foreign exchange gain of $1.1 million if the U.S. dollar appreciated and a $1.2 million foreign exchange loss if the U.S. dollar depreciated. A 5% change in the relative exchange rate of the U.S. dollar to the Chinese yuan applied to the net U.S. dollar liability balances as of December 31, 2024, would result in a foreign exchange loss of $0.4 million if the U.S. dollar appreciated and a $0.4 million foreign exchange gain if the U.S. dollar depreciated. A 5% change in the relative exchange rate of the U.S. dollar to the South Korea won applied to the net U.S. dollar liability balances as of December 31, 2024, would result in a foreign exchange loss of $0.4 million if the U.S. dollar appreciated and a $0.5 million foreign exchange gain if the U.S. dollar depreciated. Volatility between the U.S. dollar and the currencies to which we are exposed may be increased by changes in central bank policy, primarily related to interest rates.
In addition, we are exposed to foreign currency translation risk for those subsidiaries whose functional currency is not the U.S. dollar as changes in the value of their functional currency relative to the U.S. dollar affect the translated amounts of our assets and liabilities. Changes in the translated value of assets and liabilities due to changes in functional currency exchange rates relative to the U.S. dollar result in foreign currency translation adjustments that are a component of other comprehensive income or loss on the Consolidated Statements of Comprehensive (Loss) Income.
Foreign currency derivative instruments can also be used to hedge exposures and reduce the risks of certain foreign currency transactions; however, these instruments provide only limited protection and can carry significant cost. We have no foreign currency derivative instrument hedges as of December 31, 2024. We will continue to analyze our exposure to currency exchange rate fluctuations and may engage in financial hedging techniques in the future to attempt to minimize the effect of these potential fluctuations. Exchange rate fluctuations may adversely affect our financial results in the future.
ITEM 8. FINANCIAL STATEMENTS AND SUPPLEMENTARY DATA
| | | | | | | | | | | | | | |
| This information is incorporated by reference from pages | F-1 | through | | of this report. |
ITEM 9. CHANGES IN AND DISAGREEMENTS WITH ACCOUNTANTS ON ACCOUNTING AND FINANCIAL DISCLOSURE
None.
ITEM 9A. CONTROLS AND PROCEDURES
Evaluation of Disclosure Controls and Procedures
Under the supervision of our Chief Executive Officer and our Chief Financial Officer, our management has evaluated the effectiveness of the design and operation of our "disclosure controls and procedures" (as defined in Rules 13a-15(e) and 15d-15(e) promulgated under the Securities Exchange Act of 1934, as amended (the "Exchange Act")), as of the end of the period covered by this Annual Report on Form 10-K (the "Evaluation Date") utilizing the Committee of Sponsoring Organizations of the Treadway Commission's Internal Control - Integrated Framework ("COSO") Updated Framework issued in 2013. Based upon that evaluation, our Chief Executive Officer and our Chief Financial Officer have concluded that, as of the Evaluation Date, our disclosure controls and procedures are effective to ensure that information we are required to disclose in reports that we file or submit under the Exchange Act is recorded, processed, summarized and reported within the time periods specified in the SEC's rules and forms. Disclosure controls and procedures include, without limitation, controls and procedures designed to ensure that information required to be disclosed by an issuer in the reports that it files or submits under the Exchange Act is accumulated and communicated to the issuer's management, including its principal executive and principal financial officers, or persons performing similar functions, as appropriate to allow timely decisions regarding required disclosure.
Management's Annual Report on Internal Control Over Financial Reporting
Our management, including our Chief Executive Officer and Chief Financial Officer, is responsible for establishing and maintaining adequate internal control over financial reporting (as defined in Exchange Act Rules 13a-15(f) and 15d-15(f)) for the Company and its subsidiaries. Internal control over financial reporting is a process designed to provide reasonable assurance regarding the reliability of financial reporting and the preparation of financial statements for external purposes in accordance with generally accepted accounting principles. Our management conducted an assessment of the effectiveness of our internal control over financial reporting as of the Evaluation Date based on criteria established in COSO utilizing the Updated Framework issued in 2013. Based on this assessment, our management concluded that, as of the Evaluation Date, our internal control over financial reporting was effective.
Our independent registered public accounting firm, Deloitte & Touche LLP, has audited our internal control over financial reporting, as stated in their report below.
Changes in Internal Controls
There was no change in our internal control over financial reporting (as defined in Rule 13a-15(f) under the Exchange Act) that occurred during the last fiscal quarter that has materially affected, or is reasonably likely to materially affect, our internal control over financial reporting.
Limitations on Effectiveness of Controls
Our management, including our Chief Executive Officer and Chief Financial Officer, does not expect that the disclosure controls and procedures or internal control over financial reporting will prevent or detect all error and all fraud. A control system, no matter how well designed and operated, can provide only reasonable, not absolute, assurance that the objectives of the control system are met. Further, the design of a control system must reflect the fact that there are resource constraints, and the benefits of controls must be considered relative to their costs. Due to the inherent limitations in all control systems, no evaluation of controls can provide absolute assurance that all control issues, errors and instances of fraud, if any, within the company have been or will be detected.
REPORT OF INDEPENDENT REGISTERED PUBLIC ACCOUNTING FIRM
To the stockholders and the Board of Directors of IPG Photonics Corporation
Opinion on Internal Control over Financial Reporting
We have audited the internal control over financial reporting of IPG Photonics Corporation and subsidiaries (the “Company”) as of December 31, 2024, based on criteria established in Internal Control — Integrated Framework (2013) issued by the Committee of Sponsoring Organizations of the Treadway Commission (COSO). In our opinion, the Company maintained, in all material respects, effective internal control over financial reporting as of December 31, 2024, based on criteria established in Internal Control — Integrated Framework (2013) issued by COSO.
We have also audited, in accordance with the standards of the Public Company Accounting Oversight Board (United States) (PCAOB), the consolidated financial statements as of and for the year ended December 31, 2024, of the Company and our report dated February 20, 2025, expressed an unqualified opinion on those financial statements.
Basis for Opinion
The Company’s management is responsible for maintaining effective internal control over financial reporting and for its assessment of the effectiveness of internal control over financial reporting, included in the accompanying Management's Annual Report on Internal Control Over Financial Reporting. Our responsibility is to express an opinion on the Company’s internal control over financial reporting based on our audit. We are a public accounting firm registered with the PCAOB and are required to be independent with respect to the Company in accordance with the U.S. federal securities laws and the applicable rules and regulations of the Securities and Exchange Commission and the PCAOB.
We conducted our audit in accordance with the standards of the PCAOB. Those standards require that we plan and perform the audit to obtain reasonable assurance about whether effective internal control over financial reporting was maintained in all material respects. Our audit included obtaining an understanding of internal control over financial reporting, assessing the risk that a material weakness exists, testing and evaluating the design and operating effectiveness of internal control based on the assessed risk, and performing such other procedures as we considered necessary in the circumstances. We believe that our audit provides a reasonable basis for our opinion.
Definition and Limitations of Internal Control over Financial Reporting
A company’s internal control over financial reporting is a process designed to provide reasonable assurance regarding the reliability of financial reporting and the preparation of financial statements for external purposes in accordance with generally accepted accounting principles. A company’s internal control over financial reporting includes those policies and procedures that (1) pertain to the maintenance of records that, in reasonable detail, accurately and fairly reflect the transactions and dispositions of the assets of the company; (2) provide reasonable assurance that transactions are recorded as necessary to permit preparation of financial statements in accordance with generally accepted accounting principles, and that receipts and expenditures of the company are being made only in accordance with authorizations of management and directors of the company; and (3) provide reasonable assurance regarding prevention or timely detection of unauthorized acquisition, use, or disposition of the company’s assets that could have a material effect on the financial statements.
Because of its inherent limitations, internal control over financial reporting may not prevent or detect misstatements. Also, projections of any evaluation of effectiveness to future periods are subject to the risk that controls may become inadequate because of changes in conditions, or that the degree of compliance with the policies or procedures may deteriorate.
/s/ Deloitte & Touche LLP
Boston, Massachusetts
February 20, 2025
ITEM 9B. OTHER INFORMATION
During the Registrant's last fiscal quarter ended December 31, 2024, the following executive officer of the Registrant terminated and entered into a new Rule 10b5-1 trading arrangement plan intended to satisfy the affirmative defense conditions of Rule 10b5-1(c) (the "Rule 10b5-1 trading arrangement"):
•on December 13, 2024, Mr. Angelo Lopresti, Senior Vice President, General Counsel and Corporate Secretary of the Registrant, terminated the Rule 10b5-1 trading arrangement for the sale of up to 10,000 shares over a period beginning June 13, 2024 and ending June 12, 2025 on the open market at prevailing prices, subject to minimum price thresholds; and
•on December 13, 2024, Mr. Angelo Lopresti, Senior Vice President, General Counsel and Corporate Secretary of the Registrant, entered into the Rule 10b5-1 trading arrangement for the sale of up to 10,000 shares over a period beginning March 17, 2025 and ending December 1, 2025 on the open market at prevailing prices, subject to minimum price thresholds.
Other than those disclosed above, none of our directors or executive officers adopted, modified, or terminated a "Rule 10b5-1 trading arrangement" or "non-Rule 10b5-1 trading arrangement," in each case as defined in Item 408 of Regulation S-K during the quarter.
ITEM 9C. DISCLOSURE REGARDING FOREIGN JURISDICTIONS THAT PREVENT INSPECTIONS
Not applicable.
PART III
ITEM 10. DIRECTORS, EXECUTIVE OFFICERS AND CORPORATE GOVERNANCE
The Company has an insider trading policy governing the purchase, sale and other dispositions of the Company’s securities that applies to all Company personnel, including directors, officers, employees, and other covered persons. The Company also follows procedures for the repurchase of its securities. The Company believes that its insider trading policy and repurchase procedures are reasonably designed to promote compliance with insider trading laws, rules and regulations, and listing standards applicable to the Company. A copy of the Company’s insider trading policy is filed as Exhibit 19.1 to this Form 10-K.
Our Board of Directors (the "Board") is comprised of eleven (11) members as of February 19, 2025:
| | | | | | | | |
| Name | Age | Position |
| Gregory Beecher | 67 | Director |
| Michael Child | 70 | Director |
| Jeanmarie Desmond | 58 | Director |
| Gregory Dougherty | 65 | Director |
| Mark Gitin, Ph.D. | 58 | Chief Executive Officer and Director |
| Kolleen Kennedy | 65 | Director |
| Eric Meurice | 68 | Director |
| Natalia Pavlova | 46 | Director |
| John Peeler | 70 | Director, Non-Executive Chair |
| Eugene Scherbakov, Ph.D. | 77 | Director |
| Agnes Tang | 51 | Director |
The following is biographical information of each of the directors and a summary of the respective directors’ skills and qualifications to serve on the Company’s Board of Directors.
GREG BEECHER. Mr. Beecher joined IPG’s Board in January 2023. Mr. Beecher previously served as a Vice President and Chief Financial Officer of Teradyne, Inc. ("Teradyne"), a supplier of automation equipment, from March 2001 to April 2019. Prior to Teradyne, Mr. Beecher served as an Audit Partner at PricewaterhouseCoopers LLP, a provider of business advisory services, from September 1993 to March 2001. He served as a director of MKS Instruments, Inc., a process control instrumentation company, from 2006 to 2020. He also served as a director of Hittite Microwave Corporation, a designer and manufacturer of high performance integrated circuits, modules, subsystems and instrumentation, from 2013 to 2014, and of MatrixOne, a product lifecycle management software provider, from 2003 to 2006, prior to their acquisitions by larger technology companies. Mr. Beecher has served as a trustee on the Isabella Stewart Gardner Museum, an art museum, since 2020. He was previously a licensed Certified Public Accountant in Massachusetts and Vermont from July 1985 to June 2013 and from December 1993 to July 1999, respectively. Mr. Beecher holds a B.S. from the University of Hartford and an M.S. in accounting from Northeastern University.
Mr. Beecher’s extensive financial background, including his previous experience as an audit partner at a public accounting firm and his role as Chief Financial Officer of a publicly traded technology company, as well as his prior service as an outside director to public companies, provides valuable insights for our Board, the Audit Committee and the Nominating and Corporate Governance Committee ("NCGC"). Mr. Beecher is familiar with a large range of management, corporate and board responsibilities and brings valuable perspectives to the Board as an independent director.
MICHAEL CHILD. Mr. Child has served as a member of IPG's Board since September 2000. Mr. Child has been employed by TA Associates, Inc., a private equity investment firm, since July 1982, where he currently serves as Senior Advisor and, prior to January 2011, was a Managing Director. Mr. Child served on the boards of Finisar Corporation, a developer and manufacturer of optical subsystems and components for networks, Eagle Test Systems, Inc., a manufacturer of semiconductor test equipment, and Ultratech Inc., a developer and manufacturer of advanced packaging lithography systems and laser processing technologies. Mr. Child holds a B.S. in Electrical Engineering from the University of California at Davis and an M.B.A. from the Stanford University Graduate School of Business. From September 2011 until December 2015, Mr. Child was a Lecturer at the Stanford University Graduate School of Business.
Mr. Child is an established and experienced investor, including in technology companies, from his three decades of experience at TA Associates, Inc. Over the course of his career, he has overseen numerous investments and sales of portfolio companies, and served on the boards of many public and private companies. Through his experiences, he has gained valuable knowledge in the management, operations and finance of technology growth companies.
JEANMARIE DESMOND. Ms. Desmond has served as a member of IPG's Board since 2021. Ms. Desmond was the Executive Vice President and Chief Financial Officer of DuPont de Nemours, Inc., a global multi-industry specialty solutions company (“DuPont”), from April 2019 to February 2020. Ms. Desmond served as Vice President and Co-Controller for DuPont from August 2017 to April 2019, and as finance leader for the Specialty Products division following the merger of DuPont with Dow Chemical. Ms. Desmond served in various leadership roles within DuPont in her 30-year career with the company. She also served on the board and was treasurer of the Delaware Prosperity Partnership, a public-private partnership overseeing economic development in Delaware from September 2017 to September 2022. Since 2020, she has served on the board of Trinseo PLC, a materials solutions provider and a manufacturer of plastics, latex binders and synthetic rubber. In October 2021, she joined the board of Sylvamo Corporation, a global producer of uncoated paper. Ms. Desmond earned a B.S. in Accounting from Mt. St. Mary’s University and is a certified public accountant (inactive).
Ms. Desmond brings to the Board substantial finance and accounting experience and extensive experience in technology-driven companies. Her long management experience in a number of key strategic areas including finance leadership and operations financial planning and analysis, tax, internal audit, accounting controls, risk management, mergers and acquisitions, investor relations and public-private partnership brings depth to the skillsets of the Board.
GREGORY DOUGHERTY. Mr. Dougherty has served as a member of IPG's Board since January 2019. Mr. Dougherty served as a director of Fabrinet, a provider of advanced optical packaging and precision optical, electro-mechanical, and electronic manufacturing services to original equipment manufacturers of complex products, from February 2019 to January 2022. Mr. Dougherty served as Chief Executive Officer of Oclaro, Inc., a maker of optical components and modules for the long-haul, metro and data center markets, from June 2013 and has served as a director of Oclaro from April 2009, until its December 2018 acquisition. Prior to Oclaro, Mr. Dougherty served as a director of Avanex Corporation, a leading global provider of intelligent photonic solutions, from April 2005 to April 2009. Mr. Dougherty also served as a director of Picarro, Inc., a manufacturer of ultra-sensitive gas spectroscopy equipment using laser-based technology, from October 2002 to August 2013, and as its Interim Chief Executive Officer from January 2003 to April 2004. From February 2001 until September 2002, Mr. Dougherty was the Chief Operating Officer at JDS Uniphase Corporation (“JDS”), an optical technology company. Prior to JDS he was the Chief Operating Officer of SDL, Inc., a maker of laser diodes, from March 1997 to February 2001 when they were acquired by JDS. Mr. Dougherty serves on the boards of AvicenaTech, Corp., a privately held provider of advanced LED-based optical interconnects for computing since October 2024, Infinera Corporation, a provider of optical transport networking equipment, software and services to telecommunications service providers and others, since January 2019, and MaxLinear, Inc., a provider of radio frequency (RF), analog and mixed-signal integrated circuits, since March 2020. Mr. Dougherty earned a B.S. in optics from the University of Rochester.
Mr. Dougherty contributes to the Board significant leadership, operations, sales, marketing and general management experience in optics and components for telecommunications and other applications. For over three decades, Mr. Dougherty has worked in the optical and components industry and can provide the Board with insight into the industry and conditions in which the Company operates. Having been recently a CEO at a publicly-held company and now serving as a member on the boards of optical and electronics companies, he is familiar with a large range of management, corporate and board responsibilities and brings valuable perspectives to the Board as an independent director.
MARK GITIN, PH.D. Dr. Gitin was appointed CEO of the Company and to the Company's Board of Directors on June 5, 2024. Prior to IPG, Dr. Gitin served as Executive Vice President and General Manager, Photonics Solutions Division of MKS Instruments, Inc. Dr. Gitin joined MKS in September 2017 as Vice President and General Manager of the Photonics Business Unit and in 2018, also assumed responsibility for the Instruments and Motion Business Unit. Prior to joining MKS, from March 1995 to September 2017, Dr. Gitin held various management positions covering a wide range of technologies at Coherent, Inc., including Vice President of Strategic Marketing, Vice President of Business Development, and Vice President and General Manager of the Diodes, Fibers and Systems Business Unit. Dr. Gitin holds a B.S. in Electrical Engineering from University of California, Davis and an M.Eng. and Ph.D. in Electrical Engineering from Cornell University.
Dr. Gitin has more than 30 years of experience in the lasers and optics sector and possesses extensive technical and scientific expertise. Dr. Gitin brings a strong track record as a strategic industry leader with the ability to identify and execute growth opportunities. As the Chief Executive Officer, Dr. Gitin reports to the Board and has responsibility for managing the general business and affairs of the Company. Dr. Gitin's service as chief executive officer of the Company provides the Board with direct knowledge and understanding of the Company’s operations.
KOLLEEN KENNEDY. Ms. Kennedy joined IPG’s Board in August 2023. Ms. Kennedy retired as President, Proton Solutions & Chief Growth Officer at Varian Medical Systems (“Varian”), a supplier of healthcare solutions and services, in December 2021. Ms. Kennedy served in several strategic roles at Varian over 24 years, including President, Proton Solutions and Chief Growth Officer from October 2018 to December 2021, Executive Vice President and President, Oncology Systems from October 2014 to September 2018, and Senior Vice President and President, Oncology Systems from October 2011 to September 2014. Prior to Varian, Ms. Kennedy was with Siemens Medical Systems and Radiation Oncology Computer Systems in oncology product sales and marketing. Ms. Kennedy serves as a member of the board of ICU Medical, Inc.,
manufacturer of medical technologies, since December 2021 and the non-profit Wayne State University Foundation since April 2018. Ms. Kennedy holds B.S. degrees in Radiation Oncology and Psychology from the Wayne State University and a M.S. in Medical Physics from the University of Colorado Denver.
Ms. Kennedy’s experience as President and Chief Growth Officer brings enhanced skills in identifying and nurturing growth opportunities, strategic planning, and business development to the Board. Ms. Kennedy also possesses a strong blend of leadership experience, medical device industry-specific knowledge, operational, acquisition and strategic planning skills that provide the Board with an independent director with the requisite background to evaluate and guide the Company in addressing opportunities and challenges with our medical products and the markets we serve.
ERIC MEURICE. Mr. Meurice has served as a member of IPG's Board since June 2014. Mr. Meurice was President and Chief Executive Officer of ASML Holding NV, a provider of semiconductor manufacturing equipment and technology, from October 2004 to June 2013, and Chairman until March 2014. From 2001 to 2004, he was Executive Vice President of the Thomson Television Division of Thomson, SA, an electronics manufacturer. From 1995 to 2001, he served as head of Dell Computer’s Western, Eastern Europe and EMEA emerging market businesses. Before 1995, he gained significant technology experience at ITT Semiconductors and at Intel Corporation. Mr. Meurice served on the boards of Soitec S.A., a semiconductor materials manufacturer, from July 2018 to July 2024, UMICORE S.A., a recycling and materials company, from April 2015 to April 2023, NXP Semiconductors N.V., a semiconductor company, from April 2014 to June 2019, Meyer Burger Technology AG, a solar equipment vendor, from May 2018 to May 2019, ARM Holdings plc, a semiconductor intellectual property supplier, from July 2013 to March 2014, and Verigy Ltd., a manufacturer of semiconductor test equipment, until its acquisition by Advantest Corporation in 2011. Mr. Meurice serves on the boards of Global Blue Group Holding AG, a leader in currency and value added tax processing, since September 2020, and Intel Corporation, a leading developer of process technology and a major manufacturer of semiconductors, since December 2024. Mr. Meurice also serves as chair of the supervisory board of Nearfield Instruments B.V., a privately held deliverer of in-line process control solutions to the semiconductor manufacturing industry, since March 2023. Mr. Meurice earned a Master’s degree in Mechanics and Energy Generation at the Ecole Centrale de Paris, a Master’s degree in Economics from la Sorbonne University, Paris, and an M.B.A. from the Stanford University Graduate School of Business.
Mr. Meurice has extensive skills and experience as a manager of several rapidly-growing, complex and global businesses in the capital equipment and electronics fields with several billions of dollars in revenues, most recently as former President and Chief Executive Officer of ASML Holding NV. He has experience managing a publicly-held company as well as experience on serving on several public company boards in the equipment and technology fields. Mr. Meurice also has a record of proven leadership as a strategic thinker, operator and marketer at the businesses he managed.
NATALIA PAVLOVA. Ms. Pavlova has served as a member of IPG's Board since January 2021. She serves as a Trustee to the VPG Foundation, a family foundation supporting the philanthropic endeavors of IPG's founder, Valentin P. Gapontsev, and is a member of the Board of Trustees of Worcester Polytechnic Institute (WPI) since November 2024. Ms. Pavlova has served in a variety of roles at non-profit art institutions including the Worcester Art Museum (WAM), The Willard House and Clock Museum, and the Rhode Island School of Design (RISD Museum). She also worked in sales and marketing roles at IPG previously. Ms. Pavlova holds a Qualification for Fine Art Critic and Historian of Art and Culture from the Russian State University for the Humanities, and an M.S. in Arts Administration from Boston University. She is the spouse of co-founder and Senior Vice President, Chief Scientist, Igor Samartsev.
As a significant stockholder with family association to founders of the Company as well as having served as an employee of the Company in sales and marketing, Ms. Pavlova’s membership on the Board provides it with further engagement by individuals having a long-term perspective and strong economic ties with the Company. Among her specific attributes that qualify her to serve as a member of the Board, Ms. Pavlova possesses extensive knowledge of our history and culture. Ms. Pavlova strengthens the connection between the Company’s founding members and our Board, thereby assisting in the alignment of the Board with the interests of all IPG stockholders. Her experience working for nonprofit organizations adds different perspectives to the boardroom.
JOHN PEELER. Mr. Peeler became IPG's non-executive Chair of the Board on October 29, 2021. Mr. Peeler was appointed to IPG's Board in 2012 and served as the Lead Independent Director from 2017 to 2021. Mr. Peeler has been acting CEO of Jumplights Corp., a privately held producer of LED horticultural lighting, since June 2021. He was previously the Chief Executive Officer of Veeco Instruments Inc. (“Veeco”) from July 2007 until September 2018, and Chairman or Executive Chairman of its board of directors from May 2012 until May 2020. Veeco is a developer and manufacturer of MOCVD, molecular beam epitaxy, ion beam and other advanced semiconductor processes equipment. He was Executive Vice President of JDS and President of the Communications Test & Measurement Group of JDS, which he joined upon the closing of JDS’s merger with Acterna, Inc. in August 2005. Before joining JDS, Mr. Peeler served as President and Chief Executive Officer of Acterna. He has a B.S. and M.E. in Electrical Engineering from the University of Virginia.
Over the course of his career, Mr. Peeler has managed several high-growth technology companies. In addition, he has developed managerial leadership skills through his former position as Chief Executive Officer of Veeco, a publicly-traded
company with substantial international operations. His managerial positions have provided him with in-depth knowledge of the service needs of customers in demanding markets, including semiconductor capital equipment, various manufacturing models, research and development, marketing and sales. In these roles, he has also been responsible for attracting and incentivizing executives on his team. These experiences have provided him important insights in support of his positions as non-executive Chair and a member of the Compensation Committee and the NCGC.
EUGENE SCHERBAKOV, PH.D. Dr. Scherbakov has served as a member of IPG's Board since September 2000. He previously served as Chief Executive Officer of IPG from May 2021 to June 2024, Chief Operating Officer of IPG since February 2017, Managing Director of IPG Laser GmbH, IPG's German subsidiary, since August 2000 and Senior Vice President-Europe since February 2013. He served as the Technical Director of IPG Laser from 1995 to August 2000. From 1983 to 1995, Dr. Scherbakov was a senior scientist in fiber optics and head of the optical communications laboratory at the General Physics Institute, Russian Academy of Science in Moscow. Dr. Scherbakov graduated from the Moscow Physics and Technology Institute with an M.S. in Physics. In addition, Dr. Scherbakov attended the Russian Academy of Science in Moscow, where he received a Ph.D. in Quantum Electronics from its Lebedev Physics Institute and a Doctor of Science degree in Laser Physics from its General Physics Institute.
Having previously served as our Chief Executive Officer and as Managing Director of IPG Laser GmbH, which produces a large volume of our products and is the source of many developments in products, technology and applications, Dr. Scherbakov developed extensive knowledge of the Company’s business across our many international branches. His long-term service with the Company provides the Board with a detailed understanding of the Company’s operations, sales and customers. He also brings extensive technological knowledge of fiber lasers, their components and manufacturing processes to the Board.
AGNES TANG. Ms. Tang has served as a member of IPG's Board since March 2022. Ms. Tang is a Founding Partner at Ducera Partners LLC, which offers strategic advisory, mergers and acquisitions, capital advisory, liability, management and restructuring advisory services. Prior to joining Ducera in 2015, Ms. Tang was a Managing Director in the New York Office of Perella Weinberg Partners from 2008 to 2015. Prior to joining Perella Weinberg, Ms. Tang was an investment banking professional at Houlihan Lokey, and a strategy consultant at The Oliver Wyman Group, a business division of Marsh & McLennan Companies. Ms. Tang joined the board of McClatchy Media Company, a privately held publishing company, in January 2025. Ms. Tang received a B.A. in Economics from Northwestern University and a M.B.A. from the Harvard Business School.
Ms. Tang's experience working across a range of industry sectors and different size companies provides her with a broad perspective in how companies manage to maximize business opportunity potential. Specializing in situations with multi-dimensional complexities and risks, Ms. Tang has more than twenty years of experience working to find creative solutions for companies at strategic crossroads. She brings to the Board a combination of strategy, operational and financial acumen and a commitment to partnership and collaboration.
Pursuant to General Instruction G(3) of Form 10-K, additional information required hereunder relating to our executive officers is contained in Part I of this Annual Report on Form 10-K under the caption "Executive Officers of the Registrant."
Delinquent Section 16(a) Reports
Section 16(a) of the Exchange Act requires our directors and executive officers, and persons who beneficially own more than 10% of a registered class of our equity securities to file reports of ownership of, and transactions in, our securities with the SEC. These directors, executive officers and 10% stockholders are also required to furnish us with copies of all Section 16(a) forms that they file.
Based solely on its review of such forms received by it and the written representations of its Reporting Persons, the Company has determined that no such persons known to it was delinquent with respect to his or her reporting obligations as set forth in Section 16(a) of the Exchange Act, except that a Form 4 was not timely filed with respect to the annual RSU awards to Greg Beecher, Michael Child, Jeanmarie Desmond, Greg Dougherty, Kolleen Kennedy, Eric Meurice, Natalia Pavlova, John Peeler and Agnes Tang on June 18, 2024 that was due to be filed on June 21, 2024 but, filed on June 28, 2024.
Role in Ethics
All directors, officers and employees are required to abide by IPG’s Code of Business Conduct to ensure that our business is conducted in a consistently legal and ethical manner. These policies form the foundation of a comprehensive process that includes compliance with corporate policies and procedures and a Company-wide focus on uncompromising integrity in every aspect of our operations. Our Code of Business Conduct covers many topics, including antitrust and competition law, conflicts of interest, financial reporting, protection of confidential information, and compliance with all laws and regulations applicable to the conduct of our business. All of our directors and employees receive bi-annual training on our Code of Business Conduct, which can be found on our website at www.ipgphotonics.com in the investor section under "Governance—Governance Documents." If the Board grants any waivers from our Code of Business Conduct to any directors or executive officers, or if we amend our Code of Business Conduct, we will, if required, disclose these matters via updates on our website. Information on our website does not constitute part of this Form 10-K.
Audit Committee
The Board has three standing committees. The Audit Committee and the Compensation Committee are each composed entirely of non-employee, independent directors. All of the members of the NCGC are non-employees, but Ms. Pavlova, as the spouse of an executive officer, is not considered independent. The Audit Committee has been established in accordance with Section 3(a)(58)(A) of the Securities Exchange Act of 1934, as amended. The Audit Committee is comprised of Jeanmarie Desmond (Chair), Gregory Beecher, Gregory Dougherty and Agnes Tang. The Board has determined that each member of the Audit Committee is independent and financially literate. The Board has designated Ms. Desmond and Mr. Beecher, who are each independent directors under the Nasdaq listing standings and the SEC's audit committee requirements, as “audit committee financial experts” pursuant to the SEC’s final rules implementing Section 407 of the Sarbanes-Oxley Act.
ITEM 11. EXECUTIVE COMPENSATION
Compensation Discussion and Analysis
Executive Overview
This Compensation Discussion and Analysis provides a review of our executive compensation philosophy and program, and Compensation Committee decisions for fiscal year 2024. The discussion in this section focuses on the compensation of the Named Executive Officers ("NEOs") for fiscal year 2024, who were:
| | | | | |
| MARK GITIN, PH.D. | Chief Executive Officer (beginning June 5, 2024) |
| TIMOTHY MAMMEN | Senior Vice President and Chief Financial Officer |
| TREVOR NESS | Senior Vice President, Sales and Strategic Business Development |
| ANGELO LOPRESTI | Senior Vice President, General Counsel and Secretary |
| IGOR SAMARTSEV, PH.D. | Senior Vice President, Chief Scientist |
| EUGENE SCHERBAKOV, PH.D. | Former Chief Executive Officer (through June 4, 2024) |
| ALEXANDER OVTCHINNIKOV, PH.D. | Former Senior Vice President, Chief Technology Officer (through September 15, 2024) |
Detailed bios of our executive officers are included in Item 1 of this Annual Report.
Leadership Transition
As the culmination of an orderly and thorough succession planning process led by our independent directors, our Board of Directors appointed Dr. Mark Gitin as our CEO and as a member of the Board, succeeding Dr. Eugene Scherbakov. Dr. Gitin joined IPG on June 5, 2024 with over 25 years of management and operating experience in the optics and laser industry. The Company entered into an employment agreement with Dr. Gitin on April 25, 2024, which includes provisions for his base salary, annual cash incentive compensation and new hire equity awards, as well as relocation assistance.
Dr. Eugene Scherbakov transitioned from the role of CEO on June 4, 2025. Given Dr. Scherbakov's long tenure with the Company, the Board viewed it as desirable to retain the services of Dr. Scherbakov to support a successful CEO transition. As a result, the Company also entered into an advisor agreement (the “Advisor Agreement”) with Dr. Scherbakov pursuant to which Dr. Scherbakov provides advisory services to assist with the CEO transition through June 5, 2026. Dr. Scherbakov remains a member of the Board without additional compensation for such service.
Please see the “Compensation Related to Leadership Transitions” section below for additional information.
2024 Pay and Performance Highlights
•Salaries flat (only increased salaries for two executives with expanded responsibilities)
•Annual bonus plan payout for 2024 performance: 63% of total annual target opportunity
•Payout for 2022-2024 performance share units: 33% of target
•Hired a new CEO with a strong track record as a strategic industry leader with an ability to identify and execute on growth opportunities.
In 2024, IPG maintained a compensation program consistent with the prior year and its pay for performance philosophy. IPG's revenue declined 25% compared to the prior year, with lower sales in materials processing, medical and advanced applications. Revenue continued to be negatively impacted by softer industrial demand across many geographies and weakness in demand in e-mobility and renewable energy markets. Additionally, increased competition impacted sales in cutting while weaker electric vehicle battery investment reduced sales in welding. In August 2024, IPG successfully exited Russia through the sale of its business there, which reduced sales in the second half and resulted in a charge of $198 million. Gross margin decreased in 2024 due to increased inventory provisions and reduced absorption of manufacturing expenses as a result of lower revenue. However, cash flow generation remained strong with cash flow from operating activities of $247.9 million. IPG finished the year with a strong balance sheet, with cash, cash equivalents and short-term investments of $930.2 million as of December 31, 2024. The Company allocated capital in 2024 through the return of $343.8 million to stockholders in share repurchases, as well as investments in new product development and the acquisition of cleanLaser, a maker of laser cleaning systems.
As a result of difficult conditions in its markets and business, the Compensation Committee of the Board determined that decisive action was necessary to support executive management in navigating these significant challenges and changes, to stabilize and retain the management team and to create value for stockholders over the long-term. As described in more detail below, such action included engagement of a new CEO with a competitive compensation package, an adjustment to the annual incentive plan with a lower payout potential, a redesign of performance share units (“PSUs”) and an enhanced long-term incentive opportunity for certain NEOs.
Stockholder-Minded Compensation Practices
Practices We Employ
•Align our NEO Pay with Performance: Strong links of compensation to Company performance and stockholder returns for annual and long-term incentives.
•Balance Annual and Long-Term Incentives: Incentive programs provide an appropriate balance of annual and long-term incentives and include multiple measures of performance.
•Use Long-Term Incentives to Link Executive Pay to Company Performance: Over half of NEO pay consists of long-term incentives.
•Cap Annual Incentive Compensation.
•Annual Risk Assessment of Compensation Program.
•Independent Compensation Consultant: The Compensation Committee retains a compensation consultant, who is independent and without conflicts of interest with the Company.
•Stock Ownership Requirements: Officers and directors are subject to stock ownership guidelines to further align their interests with those of our stockholders.
•Clawbacks on Executive Compensation: We maintain a compensation recovery policy covering cash and equity.
•Anti-Pledging Policy and Anti-Hedging Policy Applicable to Executives and Directors.
Practices We Avoid
•No Guaranteed Annual Incentive Plan Bonuses: Our annual incentive compensation plan is performance-based and does not include any minimum payout levels.
•No Excise Tax Gross-Ups: We do not provide excise tax gross reimbursements for change in control payouts.
•No Excessive Perquisites: We provide limited perquisites to our NEOs.
•No Single-Trigger Change in Control Payments or Benefits. Severance and equity acceleration for NEOs generally require a “double-trigger” of both a change-in-control and qualifying termination of employment.
•No Stock Option Repricing without Stockholder Approval. Our equity plans prohibit repricing underwater stock options.
•No Supplemental Executive Retirement Plans, Executive Pensions or Excessive Retirement Benefits.
Stockholder Feedback
At our 2024 annual meeting of stockholders, our stockholders overwhelmingly approved our executive compensation structure in a “say-on-pay” advisory vote, with over 96% of votes cast in favor of our executive compensation structure. After considering the results of the 2024 vote, the Compensation Committee determined to maintain its general pay philosophy and practices. Proposal 2 described herein is the "say-on-pay" advisory vote.
2024 Compensation of Named Executive Officers
Our Business and Our Compensation Philosophy
The guiding principles of our executive compensation philosophy and practices continue to be pay-for-performance, accountability for annual and long-term performance, alignment to stockholders’ interests and providing competitive pay to attract and retain executives. We believe our compensation program strikes the appropriate balance between utilizing responsible, measured pay practices and effectively incentivizing our executives to dedicate themselves fully to value creation for our stockholders.
Our executive compensation program is designed to focus our executive officers on both annual and long-term financial and operational performance without encouraging unnecessary risk. Approximately 76% and 79% of the total direct target compensation opportunities for our current CEO and other NEOs (average, excluding our former CEO), respectively, in 2024 was at risk. "At risk" compensation includes awards that are subject to performance conditions and/or stock price performance. Because Dr. Gitin received a new hire bonus for 2024 with a fixed payout pursuant to the terms of his employment agreement, the amount of "at risk" compensation for Dr. Gitin for 2024 was lower than is typical for our CEO.
The 2024 compensation program for our NEOs had three primary components: annual base salary, annual cash incentives and long-term equity incentives. The amounts below illustrate the average allocation of fiscal year compensation components at target for our current CEO and the average for our other NEOs (excluding our former CEO) in 2024 as a group.
The following is an overview of the primary compensation program elements for our NEOs.
| | | | | | | | | | | | | | | | | |
| Form of Compensation | | Performance Period | Performance Criteria | Objectives |
| Base Salary |
CEO | OTHER NEOs | | Ongoing | Alignment of salary with performance is evaluated on an annual basis | •Provides a competitive fixed component of cash compensation to attract and retain talented and experienced executives with the knowledge and skills necessary to achieve the Company’s strategic business objectives •Reflect scope of roles and responsibilities, contributions, skills, knowledge, experience and seniority |
| | | | | |
| Annual Incentive |
CEO | OTHER NEOs | | One year | Net sales and Adjusted EBIT | •Provides variable cash compensation opportunity that rewards achievement of corporate goals, with an additional compensation opportunity based upon individual performance •Motivates achievement of short-term performance goals designed to enhance value of IPG •Foster a shared commitment among executives through establishment of uniform Company financial goals |
| | | | | |
| Long-Term Incentives |
CEO | OTHER NEOs | | Three years | Attainment of revenue growth and profitability targets | •Rewards successful achievement of three- year performance goals designed to enhance long-term value of IPG •Intended to satisfy long-term retention objectives |
| Vests over three years | Service-based vesting; ultimate value based on stock price performance | •Rewards the creation of long-term value •Recognizes potential future contributions •Intended to satisfy long-term retention objectives |
Base Salary
We provide base salary to our NEOs and other employees to compensate them for services rendered on a day-to-day basis during the fiscal year. Unlike annual cash incentives and long-term equity incentives, base salary is not subject to performance risk. The Compensation Committee reviews data provided by its independent compensation consultant and considers the following factors when setting base salaries of the NEOs: experience, skills, seniority, knowledge and responsibilities of the executive and the individual’s performance assessment provided by the CEO. With respect to the CEO, the Compensation Committee additionally considers the performance of the Company as a whole in its recommendation to the independent directors, who set CEO compensation.
In February 2024, the Compensation Committee evaluated the base salaries and total cash compensation for the then-serving NEOs with the assistance of Frederic W. Cook & Co., Inc. ("FW Cook"), its independent compensation consultant. The base salaries for Drs. Scherbakov and Samartsev, and Messrs. Mammen and Lopresti were unchanged from 2023 levels. However, the Compensation Committee approved increasing the base salaries of Mr. Ness and Dr. Ovtchinnikov by 5% because of their expanded executive responsibilities following the passing of the Company’s Chief Operating Officer at the end of 2023. Mr. Ness assumed oversight of the medical and systems businesses, procurement, technical support and service, and Dr. Ovtchinnikov took over management of our electrical and software engineering, our Canadian operations, facilities and safety.
On April 25, 2024, the Company and Dr. Gitin entered into an employment agreement, which provides for an initial annual base salary of $775,000. The Compensation Committee engaged FW Cook to provide market data on peer compensation for CEOs as well as advice on the terms of his compensation package and new chief executive hiring practices. The Compensation Committee considered the data and advice from the independent compensation consultant in establishing Dr. Gitin’s compensation and employment terms.
Annual Incentives
A significant portion of an executive's potential short-term compensation is in the form of annual cash incentive pay tied to the achievement of goals set by the Compensation Committee under our Senior Executive Annual Incentive Plan ("AIP") administered by the Compensation Committee. The Compensation Committee determines who is eligible to receive awards under the AIP, defines performance goals and objectives for executives, establishes target awards for each participant for the relevant performance period, and determines the percentage of the target award that should be allocated to the achievement of each of the chosen performance goals. Generally, after the end of the fiscal year, the independent directors and the Compensation Committee determine the amount of the CEO’s and each of the other NEO’s actual annual incentive award, respectively, based upon their evaluation of achievement against pre-determined goals.
Financial performance above target results in a payout of a higher percentage of a NEO's target bonus, up to 200% of the NEO’s total target cash bonus. Performance below target results in a lower bonus payout for that goal if a minimum threshold is met, with 37.5% of the NEO’s total target cash bonus as the minimum in such circumstance, or no payout if the minimum threshold is not met. The CEO can earn up to 25% of his target award based upon personal goals and objectives determined by the independent directors. The other NEOs are also eligible for payouts up to 25% of the target award based on their individual performance in support of the CEO’s goals and other objectives, the recommendation of the CEO and other factors the Compensation Committee deems relevant. The maximum opportunity under the AIP is 225% of the total target payout.

In February 2024, The Compensation Committee approved annual performance targets and targeted individual payouts for the Company’s then-serving NEOs for fiscal year 2024. Consistent with prior years, the Compensation Committee identified two financial performance measures: net sales and adjusted EBIT, each as determined under the AIP, and assigned a 50% weighting factor to each financial performance goal. Net sales under the AIP is the same as net sales as reported in our financial statements and adjusted EBIT is defined as earnings before interest and taxes, excluding stock-based compensation and foreign exchange transaction gains and losses. The Compensation Committee chose to focus on net sales and adjusted EBIT so that our NEOs would be incentivized to deliver the types of financial performance that benefit our stockholders, namely, sales and profits. The total payout targets were set at 110% of base salary for Dr. Scherbakov and 80% of base salary for the other NEOs, except for Dr. Samartsev, whose annual incentive target was set at 50% of base salary. The target payouts as a percentage of salary were consistent with 2023.
Financial Objective and Funding Mechanism/Determination
In February 2024, the Compensation Committee set the financial performance goals for the year based upon the best available information at the time. The goals were challenging and were expected to incentivize the NEOs to advance IPG’s strategic and operational priorities. The funding levels for the 2024 AIP, as originally set in February 2024, for the achievement of the performance criteria range from 0% to 267% of the target financial performance payout, depending on the achievement of such criteria. The following table sets forth the original threshold, targets and maximum financial performance levels under the AIP approved in February (the "Original AIP"):
| | | | | | | | | | | |
| Original AIP |
| 2024 Financial Performance Goals |
| Financial Metric | Threshold
(50% funding) | Target
(100% funding) | Maximum
(267% funding) |
|
| Net Sales ($M) | 1,065 | 1,183 | 1,302 |
| Adjusted EBIT ($M) | 144 | 214 | 265 |
In August 2024, the broader macroeconomic environment led the Board to revise expectations for fiscal 2024. As a result, the Committee undertook a review and determined that financial performance measures and targets in the Original AIP were no longer appropriate to incentivize management to create long-term stockholder value in light of macroeconomic uncertainty, which impacted industrial and e-mobility markets and were outside of management's control. This uncertainty weighed on demand, leading to substantially lower revenue compared to the Company's 2024 annual operating plan earlier approved by the Board. The Compensation Committee considered, among other factors, the challenging demand environment across the Company's key economic regions and that uncertainty across all major geographies was likely to weigh on demand for the remainder of the year. The Committee also considered independent third-party market data and purchasing managers indices which reflected lower levels of industrial purchasing across the Company’s principal markets. In light of the Board's revised expectations for performance for the remainder of 2024, and taking into account management’s strong financial and operational execution to date in the year, including cost reductions, inventory reductions and planning to sell its Russian operations which position the Company for improved performance as the global demand environment recovers, and the need to retain and motivate the management in a year of CEO leadership transition, the Committee approved a revised AIP in August 2024 (the "Revised AIP") to align annual cash incentive pay more closely with the Company's goals and revised expectations for 2024.
The financial performance measure under the Revised AIP was net sales for the second half of 2024 and the total payout for financial and personal performance under the Revised AIP was capped at 62.5% of the original target payout, which corresponds to payout at threshold performance under the Original AIP. The Compensation Committee chose net sales as the sole financial measure for the Revised AIP because of the uncertainty of earnings in light of cost cutting measures that were in development then, potential restructuring charges, the potential financial impacts from the sale our Russian operations, and additional sanctions impacting the Company's supply chain. The following table sets forth the threshold, targets and maximum financial performance levels under the Revised AIP.
| | | | | | | | | | | | | | |
| Revised AIP | |
| 2024 Financial Performance Goals | |
| Financial Metric | Threshold
(50% funding) | Target
(100% funding) | Maximum
(100% funding) | 2024 Results |
|
| Net Sales 2H2024 ($M) | 385 | 428 | 471 | 467 |
Pursuant to the terms of his employment agreement, Dr. Gitin, who commenced employment in June 2024, received a new hire bonus for fiscal year 2024 equal to 100% of his base salary, payable at the same time as payouts for the other NEOs under the 2024 AIP, and was not a participant in the Original AIP or the Revised AIP. Drs. Scherbakov and Ovtchinnikov were not impacted by the Revised AIP because they were no longer executive officers at the time of payout of the Revised AIP.
Individual Performance Factor
Individual objectives are set for each NEO to support the Company’s strategic objectives and are tied to the areas of responsibilities of each NEO. Below is a summary of the primary 2024 objectives for each NEO who received a personal performance award in 2024:
| | | | | |
| Name | 2024 Goals |
|
| Timothy Mammen | Update procedures and processes, complete and account for sale of Russian operations, implement new financial reporting and analysis, improve and develop finance organization |
| Trevor Ness | Improve management of medical business, achieve sales targets, support systems business success and corporate development activities |
| Angelo Lopresti | Assist in CEO transition, complete sale of Russian operations, support corporate development activities, improve and develop legal department |
| Igor Samartsev | Increase innovation and reliability in engineering solutions, accelerate time to market for new products, improve innovations pipeline |
In addition, a portion of the individual performance achievement for each NEO was based on increasing collaboration within the leadership team and functional group. The Compensation Committee evaluated individual performance of each non-CEO NEO employed at year-end based Dr. Gitin’s recommendation, which was based on his assessment of their individual achievement of 2024 goals. The individual performance achievement for each of the non-CEO NEOs employed at year-end is set forth in the table below.
2024 Payouts
The table below includes the Revised AIP payouts to our NEOs in office at the end of 2024. Drs. Scherbakov and Ovtchinnikov were not eligible to receive bonuses under the 2024 AIP and Dr. Gitin did not participate in the Revised AIP in light of his new hire bonus.
| | | | | | | | | | | | | | | | | | | | | | | | | | | | | | | | | | | |
| | Target(1) | | Actual | |
| Name | Annual Base Salary | Target Annual Incentive % | Corporate Performance Target (weighting) | Personal Performance Target (weighting) | Target Annual
Incentive $ | | Financial | | Personal | Final
Award $ | Final Award as
% of Target |
| Performance % | | Performance % |
| Timothy Mammen | $538,700 | | 80 | % | 75 | % | 25 | % | $430,960 | | | 100 | % | + | 96.25 | % | $265,300 | | 61.6 | % |
| Trevor Ness | $501,000 | | 80 | % | 75 | % | 25 | % | $400,800 | | | 100 | % | + | 94.75 | % | $245,200 | | 61.2 | % |
| Angelo Lopresti | $485,500 | | 80 | % | 75 | % | 25 | % | $388,400 | | | 100 | % | + | 100 | % | $242,800 | | 62.5 | % |
| Igor Samartsev | $424,200 | | 50 | % | 75 | % | 25 | % | $212,100 | | | 100 | % | + | 90 | % | $127,200 | | 60.0 | % |
(1)The "threshold" and "maximum" amounts under the AIP are provided in the 2024 Grants of Plan-Based Awards table. Under the Revised AIP, payout for financial and personal performance was capped at 62.5% of the original target payout.
Historical AIP Performance
The following graphic shows AIP payouts compared to targets for fiscal years 2022 to 2024, demonstrating the strong connection between pay and performance in the Company's annual incentive compensation practices.
 * For 2024, represents payouts to continuing NEOs and excludes new hire bonus to newly hired CEO.
Long-Term Incentives
The goal of our equity-based award program is to provide employees and executives with the perspective of an owner having a long-term financial stake in our success, further increasing alignment with stockholders. Our equity-based incentives align the interests of our executives and stockholders by motivating executives to increase long-term stockholder value.
In 2024, our equity-based award program for our NEOs included PSUs and RSUs, with each award type representing half of the overall 2024 long-term incentive award opportunity (at target for the PSUs). The type and proportion of the equity grants reflected a review by our Compensation Committee, with the assistance of FW Cook, of equity award practices at peer companies. The Committee believes that granting a balance of PSUs and RSUs appropriately aligns executive compensation with the achievement of the Company’s strategic goals and long-term stockholder value creation. Additionally, the value of the PSUs and RSUs is tied to the Company's stock price, which further links pay to performance.
2024 EQUITY ELEMENTS
(at target)
In February 2024, the Compensation Committee evaluated the size of long-term incentive award against applicable market comparisons. In addition to market comparisons, the Compensation Committee retains the flexibility to adjust individual award levels, taking into account variations in the individual’s job experience and responsibility. In 2024, the Compensation Committee used competitive market data from the total compensation study of peer companies and broader market survey data to gain perspective of appropriately competitive executive compensation. The Compensation Committee analyzed several aspects of the equity grant program, including (i) the degree to which executives have incentives to remain employed by the Company through unvested award value and (ii) the aggregate equity usage in terms of (a) annual usage, typically called burn
rate, and (b) cumulative equity delivery, typically called overhang, to determine the dilutive effect of equity awards on investors.
In setting equity award values for 2024, the Compensation Committee also took into consideration the actual performance of the NEOs in driving long-term stockholder value during the prior periods’ challenges and uncertainties facing IPG, including competition, geopolitical events and dynamic economic and market environments. In order to provide additional incentive, to further align the interests of the NEOs with our stockholders, and to motivate the NEOs to drive continued future performance in 2024 and beyond, the Compensation Committee approved a one-time, additional equity award opportunity for NEOs other than the CEO as part of the annual grant cycle in 2024.
The form and value of such awards were determined after considering a variety of factors and using input from the Compensation Committee’s independent compensation consultant. In evaluating the size of 2024 equity grants and the one-time, additional equity award, the Compensation Committee considered the value of the unvested equity awards held by the executive team prior to and after the granting of 2024 equity awards. Prior to the 2024 grants, all of our NEOs held less than 1x their annual equity award grant in unvested equity awards (taking into account the vesting event in March 2024), which the Compensation Committee determined was not sufficiently motivating or retentive.
The one-time, additional equity award was in the form of additional RSUs and PSUs in proportion to the annual equity awards, with three-year vesting and a three-year performance period for retention and to incent long-term performance. The Compensation Committee believed the additional value was reasonable, consistent with our pay-for-performance philosophy, and it was intended to support retention and further align the long-term interests of the NEOs with those of our stockholders. The enhanced target value opportunities for the NEOs, other than Drs. Scherbakov and Samartsev, represented 40% of the regular annual equity awards. Dr. Samartsev received an enhanced equity award that represented 10% of his regular annual equity award. The Committee did not provide a one-time enhanced equity award to Dr. Scherbakov.
The 2024 equity awards are comprised of PSUs that are earned based upon organic revenue growth (at target, 25% of award value), and operating margin (at target, 25% of award value), and service-based RSUs (50% of award value). The Committee chose organic revenue growth and adjusted operating margin as the PSU performance metrics because they are generally accepted as two fundamental drivers of sustained stockholder value and provide clearer line-of-sight measurements than many alternative measures. The Committee determined that the 2024 PSUs would be eligible to be earned based on annual performance over a three-year performance period starting on January 1, 2024.
Performance for each measure is based on the annual growth rate for the period measured against revenue or operating margin actually achieved in the prior period. Organic revenue and operating margin targets for 2024 were set based upon the annual budget approved by the Board with the intent to incentivize and reward the NEOs for achieving targeted revenue growth. Organic revenue means total revenues, as determined under GAAP and recorded in our audited financial statements, adjusted to exclude the impact of acquisitions and dispositions, other than acquisitions that account for additional revenue of $50 million or less in the relevant year. Operating margin is calculated by dividing our GAAP operating income by GAAP net sales. For purposes of this calculation, operating income is adjusted to exclude stock-based compensation, the impact of all restructurings, impairments, legal settlements, employee separation costs, product liability charges and foreign exchange transaction gains and losses, to the extent such items were not contemplated and included in the target upon which the operating margin goals were based.
Performance below the target results in below target payout, subject to a threshold performance level below which no award would be earned, and performance above the target results in payout above target, subject to a maximum cap of 200% of the target award. The Committee lowered the threshold payout to 25% of target from 60% in the prior year. Forward-looking targets for our PSUs are not disclosed because these targets involve confidential financial information, the disclosure of which would result in competitive harm and be detrimental to our operating performance. However, the Compensation Committee has set such goals at challenging levels that they believe are difficult to achieve and would require sustained performance against our annual operating plan. The chart below under "Historical PSU Payouts" sets forth the payouts under the PSUs over the last several years illustrating the difficulty of attaining the performance goals set by the Compensation Committee. The goals will be disclosed at the end of the performance period along with the achievement levels and corresponding vesting of the performance-based restricted stock awards, if any.
The PSUs granted in 2024 cliff vest to the extent earned in March 2027. They serve as a valuable retention tool and motivate executives to achieve our longer-term business objectives. RSUs vest annually in March over a three-year period and also encourage retention. PSUs and RSUs granted in 2024 are entitled to dividends equivalents, should any dividends be paid. Any dividends equivalents on shares underlying the PSUs and RSUs are not paid unless and until the corresponding awards vest.
The table below provides information on grants of PSUs and RSUs to the NEOs in 2024. As described below, Dr. Gitin's awards were granted in June 2024 in connection with his appointment as CEO and have the same performance measures as those granted to other NEOs in February 2024.
| | | | | | | | | | | | | | | | | | | | | | | | | | |
| Annual Grant | 2024 Enhanced LTI Opportunity |
| Name | Equity Incentive
as a Percentage
of Base Salary
(%) | Service-Based
Restricted
Stock Units
(#) | Operating
Margin PSUs
(at Target)
(#) | Organic Revenue Growth PSUs
(at Target)
(#) | Equity Incentive
as a Percentage
of Base Salary
(%) | Service-Based
Restricted
Stock Units
(#) | Operating
Margin PSUs
(at Target)
(#) | Organic Revenue Growth PSUs
(at Target)
(#) |
| Mark Gitin | 645 | 28,791 | | 14,395 | | 14,395 | | — | | — | | — | | — | |
| Timothy Mammen | 300 | 9,343 | | 4,671 | | 4,671 | | 120 | | 3,737 | | 1,868 | | 1,868 | |
| Trevor Ness | 275 | 7,964 | | 3,982 | | 3,982 | | 110 | | 3,186 | | 1,593 | | 1,593 | |
| Angelo Lopresti | 275 | 7,719 | | 3,859 | | 3,859 | | 110 | | 3,088 | | 1,544 | | 1,544 | |
| Igor Samartsev | 110 | 2,697 | | 1,348 | | 1,348 | | 5.5 | | 135 | | 67 | | 67 | |
| Eugene A. Scherbakov | 578 | 28,877 | | 14,438 | | 14,438 | | — | | — | | — | | — | |
| Alexander Ovtchinnikov | 275 | 8,030 | | 4,015 | | 4,015 | | 110 | | 3,212 | | 1,606 | | 1,606 | |
Historical Performance of Performance-Based Stock Units.
Half of PSUs granted in 2021 (which vested in 2024) were eligible to be earned based on the ratio of operating cash flow to adjusted net income ("OCF PSUs") over a three-year performance period beginning January 1, 2021 and ending December 31, 2023. Such OCF PSUs vested in March 2024 at 66.3% of target. PSUs granted in 2021 that were eligible to be earned based on three-year relative total stockholder return ("TSR") compared to the approved index were not earned, as performance was below threshold.
The following table shows the performance of the 2021 OCF PSUs:
| | | | | | | | | | | | | | | | | |
| Financial Metric | Threshold
(50% vesting) | Target
(100% vesting) | Maximum
(200% vesting) | Results | % Vesting |
|
| Operating Cash Flow to Adjusted Net Income (Ratio) | 58% | 83% | 108% | 75% | 66.3% |
The following table shows the relative TSR performance assessment beginning on the grant date of March 1, 2021 and ending on March 1, 2024.
| | | | | | | | | | | | | | | | | |
| Measurement | Minimum
(0% vesting) | Target
(100% vesting) | Maximum
(200% vesting) | Actual Result | % Vesting |
|
Three-year relative TSR (beginning March 1, 2021)
(% of index performance) | 75% | 100% | 150% | TSR of (66.82)% | —% |
| TSR of 7.48% | TSR of 9.97% | TSR of 14.96% |
Half of PSUs granted in 2022 (which vested in 2025) were based upon organic revenue growth and half were based on average adjusted operating margin over a three-year performance period beginning January 1, 2022 and ending December 31, 2024. As three-year performance was below threshold for PSUs granted in 2022, the NEOs did not earn any payouts on the performance-based long-term incentives vesting in March 2025.
The following graphic shows payouts compared to targets for PSUs granted in 2017 (vesting in 2020) to 2022 (vesting in 2025), demonstrating the strong connection between pay and performance in the Company's long-term incentive compensation practices.
Compensation Related to Leadership Transitions
The Board appointed Dr. Gitin as CEO of the Company, effective June 5, 2024, and also appointed Dr. Gitin to the Board of Directors. Dr. Gitin does not receive any additional compensation for his service on the Board.
As a condition of accepting employment, the Company and Dr. Gitin entered into an employment agreement (the “Gitin Employment Agreement”) with an initial term commencing on June 5, 2024 and ending on December 31, 2025. The term of the Gitin Employment Agreement will automatically renew for successive one-year periods unless Dr. Gitin or the Company provides at least 180 days’ prior written notice or unless the agreement is earlier terminated according with its provisions. Under the terms of the Gitin Employment Agreement, Dr. Gitin received an initial annual base salary of $775,000, which is subject to periodic review by the Board. Dr. Gitin is also eligible to earn an annual cash bonus calculated as a percentage of his base salary. The Gitin Employment Agreement provided Dr. Gitin a new hire bonus equal to 100% of his base salary for fiscal year 2024, provided that his employment was not terminated by the Company for “cause” or by Dr. Gitin without “good reason” (each as defined in the Gitin Employment Agreement) prior to the date that bonuses were paid for fiscal year 2024. Dr. Gitin also received initial equity awards with a target aggregate grant date fair value of $5,000,000, with 50% in the form of PSUs that are earned only if pre-determined financial performance metrics are achieved and 50% in the form of RSUs. The Compensation Committee determined the target aggregate value after consultation with its independent compensation consultant and taking into account both the Company’s customary target annual equity award and a partial buyout of equity forfeited upon Dr. Gitin's departure from his former employer. The RSUs vest in three equal annual installments following Dr. Gitin’s start date. The PSUs vest on the third anniversary of Dr. Gitin’s start date, subject to achievement of the applicable performance metrics. The PSUs have the same performance criteria and measurement periods as those granted to the Company’s other NEOs in February 2024.
After reviewing competitive market references, the Company granted Dr. Gitin a relocation stipend of $500,000 to facilitate his relocation from California to Massachusetts and provided him with temporary housing for up to six months. Dr. Gitin is also eligible to participate in the employee benefit plans and programs made available by the Company to senior executives generally, subject to the terms of those plans.
The compensation payable to Dr. Gitin under the Gitin Employment Agreement in the event of a qualifying termination of his employment with the Company is described in Post-Employment Compensation and Other Employment Agreements below.
In connection with the CEO transition, the Board viewed it as desirable to retain the services of Dr. Scherbakov through the period of transition, and to provide appropriate compensation to Dr. Scherbakov for supporting the transition to Dr. Gitin. Therefore, the Company entered into the Advisor Agreement with Dr. Scherbakov pursuant to which Dr. Scherbakov provides advisory services to assist in the transition of Dr. Gitin through June 5, 2026 or the earlier termination of Dr. Scherbakov’s services for “cause” or Dr. Scherbakov’s death or “disability” (each as defined in the Advisor Agreement). Dr. Scherbakov remains a member of the Board without additional compensation for such service. Under the Advisor Agreement, the Company pays Dr. Scherbakov a consulting fee of €1,240,000 through June 5, 2025, a consulting fee of €800,000 from June 6, 2025 to June 5, 2026 and an additional cash payment of approximately €400 per month to cover out of pocket payments for
health insurance premiums during the term of the Advisor Agreement. In addition, pursuant to the terms of those awards, Dr. Scherbakov continues to vest in his outstanding equity awards for so long as he continues to provide services to the Company.
Dr. Ovtchinnikov retired from the Company, effective September 15, 2024. The Company and Dr. Ovtchinnikov entered into a services agreement pursuant to which Dr. Ovtchinnikov agreed to provide to the Company consulting services through March 31, 2025 for a consulting fee of $17,000 per month. Outstanding equity awards previously granted to Dr. Ovtchinnikov continue to vest for so long as he continues to provide consulting services to the Company pursuant to the services agreement. The Company also pays the cost of monthly COBRA premiums for Dr. Ovtchinnikov and his dependents until March 16, 2026.
Other Compensation
Severance Benefits. The severance benefits that we offer to our NEOs assist us in recruiting and retaining talented individuals and are consistent with the range of severance benefits offered by our peer group. The severance provisions of our NEO employment agreements are summarized in Potential Payments upon Termination or Change in Control below.
Retirement Benefits. We do not offer an executive retirement plan or a non-qualified deferred compensation plan. Executives in the United States are eligible to participate in our 401(k) retirement savings plan on the same terms as all other U.S. employees. Our 401(k) retirement savings plan is a tax-qualified plan and therefore is subject to certain Internal Revenue Code limitations on the dollar amounts of deferrals and Company contributions that can be made to plan accounts. These limitations apply to our more highly-compensated employees (including the NEOs). We make matching contributions to our employees at a rate of 50% of deferrals subject to a maximum of 6% of eligible compensation under the 401(k) retirement savings plan, including the NEOs, who participate in the plan as set forth in the Summary Compensation Table. Dr. Scherbakov has historically participated in a German government-sponsored retirement program.
Other Benefits. Our executives are eligible to participate in our employee benefit plans, subject to the terms of those plans, including medical, dental, life and disability insurance and vacation plans as well as an employee stock purchase plan, which is intended to be qualified under Section 423 of the Internal Revenue Code. The employee stock purchase plan allows participants to purchase Company shares at a price equal to 85% of the lesser of the fair market value at the first day or last day of the six month offering period, subject to limitations on the amount of shares. These plans generally are available to all salaried employees and do not discriminate in favor of executives. Benefits are intended to be competitive with the overall market in order to facilitate attraction and retention of highly-qualified employees.
Executive Compensation Decision-Making
Role of Compensation Committee
The Compensation Committee determines, approves and administers the compensation programs for our executive officers, including our NEOs. The Compensation Committee recommends to the independent directors the CEO’s annual base salary, annual incentive opportunity and long-term incentive opportunity. The independent directors approve the CEO’s compensation and our Compensation Committee approves the compensation for other executive officers in consultation with our CEO. Our Compensation Committee is also responsible for making recommendations to the Board with respect to the adoption of equity plans and certain other benefit plans. The Compensation Committee and the independent directors meet in executive sessions when determining executive compensation.
The Compensation Committee may delegate authority whenever it deems appropriate. In 2024, the Compensation Committee delegated authority to grant equity awards for non-executives to the CEO, subject to certain conditions, including amounts of awards and review of awards by the Compensation Committee.
Role of Management
The CEO participates in the establishment of compensation levels and payouts for individual performance for other NEOs. He assesses the performance of all NEOs and recommends to the Compensation Committee the overall levels of achievement and personal performance in the year. Upon request, the NEOs provide supplemental material to the Compensation Committee to assist in the determination and implementation of compensation, policies and practices. The CEO is not involved in decisions regarding the setting of any component of his compensation. The CEO and other members of senior management attend Compensation Committee meetings at the invitation of the Compensation Committee.
Role of Independent Consultant
The Compensation Committee engaged FW Cook, an independent compensation consultant, to analyze our executive and non-employee director compensation programs and advise on incentive design and other compensation-related policies and programs. The consultation included non-executive compensation data and valuation services for equity incentives. FW Cook does not perform any other work for the Company. The Compensation Committee reviewed the independence of FW Cook in light of SEC rules and Nasdaq listing standards regarding compensation consultants. Based on such review, the Compensation Committee determined that there were no actual or potential conflicts of interest with FW Cook in 2024.
Pay Positioning Strategy and Peer Group
Our Compensation Committee’s policy is to set executive pay in accordance with the objectives of the Company’s compensation programs as described above. In the Compensation Committee’s view, the Company’s executive compensation program provides an overall level of compensation opportunity that is competitive with peer companies. Actual compensation levels may be greater or less than target compensation levels provided by similar companies based upon annual and long-term Company performance, as well as individual performance, contributions, skills, seniority, knowledge, experience and responsibilities.
The Committee does not benchmark specific compensation elements or total compensation to any specific percentile relative to the peer companies or the broader United States market. Instead, the Committee applies judgment and discretion in establishing targeted pay levels, taking into account not only competitive market data, but also factors such as Company, business and individual performance, scope of responsibility, critical needs and skill sets, leadership potential, length of tenure and succession planning. No single factor takes precedence over any other, nor is any formula used in making these decisions.
In late 2023, FW Cook performed an analysis of similarly-situated public companies and supplemented the peer group with broader, size-appropriate comparisons in the high technology industry using applicable survey data. Consistent with prior years, in 2024 the Compensation Committee used competitive compensation data from the annual total compensation study of peer companies to inform its decisions about overall compensation opportunities and specific compensation elements.
The Compensation Committee reviews this peer group annually with input from its independent compensation consultant to ensure that the comparisons are meaningful. In this review, the Compensation Committee considers several factors: it considers the current peer group to determine appropriateness, the peers used by institutional governance advisors, the companies that list our Company as a peer to understand crossover peers and broader research based upon established selection criteria to identify potential future peers. The Committee then develops criteria for business sector, including but not limited to revenue and market capitalization. In determining peer companies for 2024, the Compensation Committee reviewed peer companies with then recent revenue and average market capitalization between approximately 0.2x to 5.0x the Company's size at that time for laser-related companies and 0.4x to 2.5x the Company's size for non-laser related companies.
Based upon the process and applying the criteria above, the Compensation Committee, with input from FW Cook, approved adding Allegro MicroSystems Inc. and OSI Systems, Inc. to our 2024 peer group and removing National Instruments, Inc. from our 2024 peer group because it was acquired in October 2023.
For 2024, the peer companies were:
| | | | | | | | |
| | |
| Advanced Energy Industries, Inc. | Albany International Corp. | Allegro MicroSystems, Inc. |
| | |
| Barnes Group, Inc. | Cognex Corporation | Coherent Corp. |
| | |
| Dolby Laboratories, Inc. | Donaldson Company, Inc. | FormFactor, Inc. |
| | |
| Graco, Inc. | IDEX Corporation | ITT, Inc. |
| | |
| Kadant Inc. | Littlefuse, Inc. | Lumentum Holdings Inc. |
| | |
| MKS Instruments, Inc. | Nordson Corporation | Novanta, Inc. |
| | |
| Onto Innovation Inc. | OSI Systems, Inc. | Watts Water Technologies, Inc. |
| | |
The peer companies selected by the Compensation Committee are companies that operate in the semiconductor equipment and electronic manufacturing industries, and are comparable in terms of revenue and market capitalization.
COMPANY VS. PEER GROUP
Other Factors Affecting Compensation
Tax Deductibility under Section 162(m). Section 162(m) of the Internal Revenue Code (“Section 162(m)”) limits the deductibility for federal income tax purposes of certain compensation paid in any year by a publicly held corporation to its “covered employees” as defined by Section 162(m) (generally, our current and former NEOs) to $1 million per executive (the “$1 million cap”). While our Board and Compensation Committee consider the potential effects of Section 162(m) of the Code on the compensation paid to our NEOs, the Compensation Committee believes it is appropriate to retain the flexibility to authorize compensation that may exceed the $1 million cap if, in the Compensation Committee’s judgment, it is in the Company’s best interest to do so. We generally will continue to emphasize performance-based compensation, even though it may no longer be deductible.
Accounting Considerations. We consider the accounting implications of our executive compensation program. In addition, accounting treatment is just one of many factors impacting plan design and pay determinations. Our executive compensation program is designed to achieve a favorable accounting and tax treatment so long as doing so does not conflict with the intended plan design or program objectives.
Compensation Risk
Management conducts an annual risk assessment of the Company’s compensation policies and practices for all employees, including non-executives, and reports its findings to the Compensation Committee. In 2024, management concluded that the Company’s compensation policies and practices are balanced and do not motivate imprudent risk taking. Management believes that the Company's compensation policies do not create risks that are reasonably likely to have a material adverse effect on the Company. In reaching this conclusion, they considered the following factors:
•our compensation program is designed to provide a mix of both fixed and variable incentive compensation;
•our senior executives are subject to stock ownership guidelines, which we believe incentivize our executives to consider the long-term interests of the Company and our stockholders and discourage excessive risk-taking that could negatively impact our stock price;
•our senior executives are subject to compensation recovery policy, which discourages excessive risk-taking that could negatively affect our stock price;
•our incentive compensation programs are designed with vesting terms that are relatively consistent, spread out over several years, and do not contain steep payout “cliffs” that might encourage short-term business decisions in order to meet a vesting or payout threshold; and
•our senior executive incentive compensation program caps the amounts that may be paid for performance above target level.
Other Policies
Anti-Hedging and Anti-Pledging. The Board adopted policies prohibiting hedging transactions and the pledging of our common stock. Under our insider trading policy, no director or employee may engage in shorting shares of our common stock or any type of securities that we may issue, or buying or selling puts, calls or derivatives related to our common stock. Additionally, directors and officers of the Company may not pledge any Company shares.
Executive Officer Stock Ownership Guidelines. The Board adopted stock ownership guidelines to closely align the interests of our executives with those of our long-term stockholders. Generally, the CEO must hold five times his annual salary in Company equity, and senior executive officers must hold at least two times their respective annual salaries in Company equity. Unvested RSUs subject solely to time-based vesting count toward required stock ownership levels, however stock options (whether vested or unvested) and unvested PSUs do not. Indirect ownership of shares through a separate legal entity counts toward fulfillment of the ownership guidelines. Ownership requirements are to be achieved no later than four years after being appointed as an executive officer, except that prior to such time the officer is expected to retain a certain portion of stock issued upon exercise of stock options or vesting of RSUs and PSUs until the minimum ownership levels are attained. As of December 31, 2024, each of our NEOs exceeded their respective ownership requirements or was within the four-year phase-in period.
Clawback Policies. In July 2023, the Compensation Committee approved a new clawback policy. The Incentive Based Compensation Recoupment Policy (the "Required Clawback Policy”) complies with the SEC’s clawback rules as required under the Dodd-Frank Wall Street Reform and Consumer Protection Act (the “Dodd Frank Act”), and provides that in the event the Company is required to prepare a “financial restatement” (as defined in the Required Clawback Policy), the Company will, subject to certain limited exceptions as described in the Required Clawback Policy, recover certain incentive based compensation from “covered persons” (i.e., current and former “executive officers”, defined to include any president/CEO, principal financial officer, principal accounting officer (or if there is no such accounting officer, the controller), any vice president in charge of a principal business unit, division or function, or any officer or person who performs a policy making functions who served during the performance period applicable to “incentive based compensation” and received “incentive based compensation” after beginning service in any such role). Compensation to be recovered under the Required Clawback Policy includes “incentive based compensation” received during the three-year period prior to the “restatement date” (as defined in the Required Clawback Policy) that exceeds the amount that otherwise would have been received by the “covered person” had such compensation been determined based on the restated amounts in the financial restatement. Under the Required Clawback Policy, “incentive based compensation” includes any cash or equity compensation that is granted, earned or vested based, in whole or in part, upon the attainment of a financial reporting measure. The Required Clawback Policy applies to "incentive based compensation” received by a “covered person” on or after October 2, 2023.
The Board had previously adopted a compensation recovery policy in 2015 that allows the Company to recapture cash and equity performance-based compensation from executives if the amount of the award was based upon achieving certain financial results that were later restated due to the participant’s misconduct. This policy remains in effect and would apply to compensation received prior to October 2, 2023 that is not covered by the Required Clawback Policy. In addition, all equity award agreements covering equity awarded to executives since 2007 contain a provision under which employees may be required to forfeit equity awards or profit from equity awards if they engage in certain conduct, including competing against the Company, disclosing confidential information, or soliciting its employees or customers.
Policy Regarding Options and Similar Equity Awards
We do not currently grant new awards of stock options, stock appreciation rights or similar option-like equity awards. Accordingly, we have no specific policy or practice on the timing of grants of such awards in relation to the disclosure of material nonpublic information. In the event we determine to grant new awards of stock options or similar equity awards in the future, the Compensation Committee will evaluate the appropriate steps to take in relation to the foregoing.
Compensation Committee Interlocks and Insider Participation
Messrs. Dougherty, Meurice and Peeler and Ms. Desmond served as members of our Compensation Committee in 2024. None of these persons has at any time been an officer or employee of our Company or any of our subsidiaries or had any other relationship with the Company requiring disclosure herein. During fiscal year 2024, none of the Company’s executive officers served as a member of the board of directors or compensation committee of another entity in which one of the executive officers of such entity served as a member of the Company’s Board or Compensation Committee.
Compensation Committee Report
The Compensation Committee of the Board has reviewed and discussed with management the Compensation Discussion and Analysis. Based on this review and discussion, the Compensation Committee recommended to the Board that the Compensation Discussion and Analysis be included in the Company’s Proxy Statement for the Company’s 2025 Annual Meeting of Stockholders and in the Company’s Annual Report on Form 10-K for the year ended December 31, 2024.
COMPENSATION COMMITTEE
Gregory Dougherty, Chair
Jeanmarie Desmond
Eric Meurice
John Peeler
The information in the Compensation Committee Report shall not be considered “soliciting material” or “filed” with the SEC, nor shall this information be incorporated by reference into any previous or future filings under the Securities Act of 1933, as amended, or the Securities Exchange Act of 1934, as amended, except to the extent that the Company incorporates it by specific reference.
Executive Compensation Tables
Summary Compensation Table
The following table provides information regarding the total compensation of our NEOs for fiscal year 2024 and, to the extent such NEOs were NEOs in either the 2024 or 2023 proxy statements, fiscal years 2023 and/or 2022 compensation, as applicable.
| | | | | | | | | | | | | | | | | | | | | | | |
| Name and Principal Position | Year | Salary
($) | Bonus
($) | Stock
Awards
($)(1) | Non-Equity
Incentive Plan
Compensation
($)(2) | All Other
Compensation
($)(3) | Total
($) |
Mark Gitin
Chief Executive Officer(4) | 2024 | 411,346 | | 775,000 | | 4,999,759 | | — | | 514,720 | | 6,700,825 | |
Timothy Mammen
Chief Financial Officer and
Senior Vice President | 2024 | 538,700 | | — | | 2,262,403 | | 265,300 | | 9,286 | | 3,075,689 | |
| 2023 | 538,700 | | — | | 1,616,014 | | 102,353 | | 9,900 | | 2,266,967 | |
| 2022 | 520,500 | | — | | 1,561,276 | | 270,900 | | 9,150 | | 2,363,758 | |
Trevor Ness
Senior Vice President, Sales and Strategic Business Development | 2024 | 494,106 | | — | | 1,928,590 | | 245,200 | | 10,350 | | 2,678,246 | |
| 2023 | 477,100 | | — | | 1,311,831 | | 90,649 | | 9,900 | | 1,889,480 | |
Angelo Lopresti
Senior Vice President, General
Counsel and Secretary | 2024 | 485,500 | | — | | 1,869,006 | | 242,800 | | 10,350 | | 2,607,656 | |
| 2023 | 485,500 | | — | | 1,334,917 | | 92,245 | | 9,900 | | 1,922,562 | |
| 2022 | 469,100 | | — | | 1,289,844 | | 244,100 | | 9,150 | | 2,015,806 | |
Igor Samartsev
Senior Vice President, Chief Scientist | 2024 | 424,200 | | — | | 489,822 | | 127,200 | | 9,363 | | 1,050,585 | |
| | | | | | |
Eugene Scherbakov
Former Chief Executive Officer(5)(6) | 2024 | 315,202 | | — | | 4,994,479 | | — | | 789,777 | | 6,099,458 | |
| 2023 | 864,890 | | — | | 4,416,887 | | 166,491 | | 277,284 | | 5,725,552 | |
| 2022 | 785,174 | | — | | 4,999,721 | | 540,200 | | 310,425 | | 6,635,520 | |
Alexander Ovtchinnikov
Former Senior Vice President,
Chief Technology Officer(7) | 2024 | 371,873 | | — | | 1,944,416 | | — | | 122,114 | | 2,438,403 | |
| 2023 | 481,000 | | — | | 1,322,718 | | 91,390 | | 9,900 | | 1,905,008 | |
| 2022 | 464,700 | | — | | 1,277,805 | | 241,800 | | 9,150 | | 1,993,455 | |
(1)During the periods in the table above, the Company granted PSUs and service-based RSUs, which are reflected in the Stock Awards column. The value of the PSUs is based on the probable outcome of the performance conditions (at the grant date), calculated in accordance with ASC Topic 718 disregarding forfeitures related to service-based vesting. For PSUs granted in 2024, the values of the award at the grant date assuming the highest level of performance conditions will be achieved are $4,999,671, $2,262,317, $1,928,504, $1,869,006, $489,823, $4,994,393 and $1,944,416 for Dr. Gitin, Messrs. Mammen, Ness and Lopresti, and Drs. Samartsev, Scherbakov and Ovtchinnikov, respectively. There is no assurance that any of the performance targets will be achieved, that the service-based awards will vest or that the any of the recipients will realize the values listed above.
(2)Represents amounts earned under our Revised AIP for services rendered in 2024, and amounts earned under our AIP for services rendered in 2023 and 2022, respectively.
(3)The amount reported for Dr. Gitin for 2024 consists of a relocation stipend ($500,000) and temporary housing ($14,720) pursuant to the terms of the Gitin Employment Agreement entered into in connection with his appointment as CEO in June 2024. The amounts reported for Messrs. Mammen, Ness and Lopresti and Dr. Samartsev for 2024 consists of matching 401(k) contributions. The amount reported for Dr. Scherbakov for 2024 consists of U.S. tax preparation fees ($3,000) and dental insurance ($569), tax gross-ups associated with the foregoing U.S.-based benefits ($2,330), the expense of an automobile in Germany ($12,715), as well as consulting fees ($771,163) earned following his transition to an advisor on June 5, 2024 pursuant to the terms of his Advisor Agreement with the Company. The amount reported for Dr. Ovtchinnikov for 2024 consists of consulting fees ($59,500) and COBRA medical and dental coverage ($3,852) following his transition to an advisor on September 16, 2024 pursuant to the terns of his services agreement with the Company, vacation payout at termination ($48,567) and matching 401(k) contributions ($10,195).
(4)Dr. Gitin commenced employment on June 5, 2024. His annual base salary for 2024 was $775,000. The amount reported in the Bonus column for Dr. Gitin represents a new hire bonus paid pursuant to the terms of the Gitin Employment Agreement in connection with his appointment as CEO.
(5)On June 5, 2024, Dr. Scherbakov transitioned from his role as CEO to an advisor to the Company. The amount reported for 2024 in the Salary column for Dr. Scherbakov represents his base salary for services as CEO through June 4, 2024.
(6)A portion of the amounts paid to Dr. Scherbakov were denominated in Euros. Dr. Scherbakov’s salary as CEO in 2024, 2023 and 2022 was approved in Euro. Amounts paid in Euros were translated into U.S. dollars at the average daily exchange rates for the full years. The average daily rates in 2024, 2023 and 2022 for the Euro were 0.92, 0.92 and 0.95, respectively. As a result of compensation being paid in a currency that fluctuates against the U.S. dollar, the amount of salary paid may vary slightly from the salary stated in an employment agreement or approved by the Compensation Committee.
(7)On September 15, 2024, Dr. Ovtchinnikov transitioned from his role as Senior Vice President, Chief Technology Officer to an advisor to the Company. The amount reported for 2024 in the Salary column for Dr. Ovtchinnikov’s represents his base salary earned for services as Senior Vice President, Chief Technology Officer through September 15, 2024.
2024 Grants of Plan-Based Awards
| | | | | | | | | | | | | | | | | | | | | | | | | | | | | | | | |
| Name | Grant
Date | Estimated Possible Payouts Under Non-Equity Incentive Plan Awards ($)(1)(2) | | Estimated Future Payouts Under Equity Incentive Plan Awards (#)(3) | All Other Stock Awards: Number of Shares
of Stock or Units
(#)(4) | Grant Date
Fair Value
of Stock
and Option
Awards
($)(5) |
| Threshold | Target | Maximum(3) | | Threshold | Target | Maximum |
| Mark Gitin | 6/5/2024 | — | | — | | — | | | 7,197 | | 28,790 | | 57,580 | | — | | 2,499,836 | |
| 6/5/2024 | — | | — | | — | | | — | | — | | — | | 28,791 | | 2,499,923 | |
| Timothy Mammen | 2/16/2024 | 269,350 | | 430,960 | | 969,660 | | | — | | — | | — | | — | | — | |
| 2/16/2024 | — | | — | | — | | | 3,270 | | 13,080 | | 26,160 | | — | | 1,131,158 | |
| 2/16/2024 | — | | — | | — | | | — | | — | | — | | 13,081 | | 1,131,245 | |
| Trevor Ness | 2/16/2024 | 250,500 | | 400,800 | | 901,800 | | | — | | — | | — | | — | | — | |
| 2/16/2024 | — | | — | | — | | | 2,787 | | 11,150 | | 22,300 | | — | | 964,252 | |
| 2/16/2024 | — | | — | | — | | | — | | — | | — | | 11,151 | | 964,338 | |
| Angelo Lopresti | 2/16/2024 | 242,750 | | 388,400 | | 873,900 | | | — | | — | | — | | — | | — | |
| 2/16/2024 | — | | — | | — | | | 2,701 | | 10,806 | | 21,612 | | — | | 934,503 | |
| 2/16/2024 | — | | — | | — | | | — | | — | | — | | 10,806 | | 934,503 | |
| Igor Samartsev | 2/16/2024 | 132,563 | | 212,100 | | 477,225 | | | — | | — | | — | | — | | — | |
| 2/16/2024 | — | | — | | — | | | 708 | | 2,832 | | 5,664 | | — | | 244,911 | |
| 2/16/2024 | — | | — | | — | | | — | | — | | — | | 2,832 | | 244,911 | |
Eugene
Scherbakov | 2/16/2024 | 597,462 | | 955,940 | | 2,150,864 | | | — | | — | | — | | — | | — | |
| 2/16/2024 | — | | — | | — | | | 7,219 | | 28,876 | | 57,752 | | — | | 2,497,196 | |
| 2/16/2024 | — | | — | | — | | | — | | — | | — | | 28,877 | | 2,497,283 | |
| Alexander Ovtchinnikov | 2/16/2024 | 252,550 | | 404,080 | | 909,180 | | | — | | — | | — | | — | | — | |
| 2/16/2024 | — | | — | | — | | | 2,810 | | 11,242 | | 22,484 | | — | | 972,208 | |
| 2/16/2024 | — | | — | | — | | | — | | — | | — | | 11,242 | | 972,208 | |
(1)Amounts shown include possible payouts under the AIP for 2024 financial performance at threshold, target and maximum levels plus individual performance at the maximum level for each NEO as approved by the Compensation Committee in February 2024. As discussed in Compensation Discussion and Analysis—Annual Incentives above, in August 2024, the Compensation Committee revised the possible threshold, target and maximum payouts under the AIP to $188,545, $269,350 and $269,350 for Mr. Mammen, $175,350, $250,500 and $250,500 for Mr. Ness, $169,925, $242,750 and $242,750 for Mr. Lopresti, and $92,815, $132,563 and $132,563 for Dr. Samartsev. The performance measures under the AIP and the Revised AIP are discussed in Compensation Discussion and Analysis—Annual Incentives above. Actual amounts paid for 2024 performance are shown in the “Non-Equity Incentive Plan Compensation” column in the Summary Compensation Table above. Drs. Scherbakov and Ovtchinnikov were not eligible to receive a payout under the AIP or the Revised AIP as discussed above and Dr. Gitin did not participate in the Revised AIP.
(2)Dr. Scherbakov’s salary as CEO for 2024 was approved in Euro. The amounts included as possible payouts under the AIP for 2024 financial performance at threshold, target and maximum levels plus individual performance at the maximum level for Dr. Scherbakov were translated into U.S. Dollars at the average daily exchange rate for 2024.
(3)For a description of the PSUs, see Compensation Discussion and Analysis–Long-Term Incentives above.
(4)The amounts reported reflect service-based RSUs granted under our 2006 Incentive Compensation Plan, which vest in three annual installments commencing on March 1, 2025.
(5)Valuation based on the fair value of such awards as of the grant date determined pursuant to ASC Topic 718. The assumptions that we used with respect to the valuation of equity awards are set forth in Note 15 to our Consolidated Financial Statements in this Annual Report. Regardless of the value placed on an equity award on the grant date, the actual value of the equity award will depend on the market value of our common stock when such equity award vests, and, with respect to PSUs, on the Company's performance relative to the applicable performance metrics under such PSUs, as described above under Compensation Discussion and Analysis-Long Term Incentives. For PSUs granted in 2024, the maximum number of PSUs that can be earned is two times the target number of PSUs and the values of the award at the grant date assuming the highest level of performance conditions will be achieved are $4,999,671, $2,262,317, $1,928,504, $1,869,006, $489,823, $4,994,393 and $1,944,416 for Dr. Gitin, Messrs. Mammen, Ness and Lopresti, and Drs. Samartsev, Scherbakov and Ovtchinnikov, respectively.
2024 Outstanding Equity Awards at Fiscal Year-End
| | | | | | | | | | | | | | | | | | | | | | | | | | | | | | | | |
| | Option Awards(1) | | Stock Awards(1) |
| Name |
Grant Date | Securities
Underlying
Unexercised
Options
(#)
Exercisable | Securities
Underlying
Unexercised
Options
(#)
Unexercisable | Option
Exercise
Price
($)(2) | Option
Expiration
Date | | Number
of Shares
or Units
of Stock
That
Have Not
Vested
(#) | Market
Value of
Shares
or Units
of Stock
That
Have
Not
Vested
($)(3) | Equity
incentive
plan awards:
Number of
unearned
shares, units
or other rights
that have not
vested
(#)(4) | Equity
incentive
plan awards:
Market or
payout value
of unearned
shares, units
or other
rights that
have not
vested
($)(4) |
| Mark Gitin | 6/5/2024 | — | | — | | — | | | | 28,791 | | 2,093,682 | | 7,197 | | 523,366 | |
| Timothy Mammen | 2/22/2018 | 6,642 | | — | | 239.72 | | 2/22/2028 | | — | | — | | — | | — | |
| 2/15/2019 | 8,654 | | — | | 154.88 | | 2/15/2029 | | — | | — | | — | | — | |
| 2/19/2021 | — | | — | | — | | | | 808 | | 58,758 | | — | | — | |
| 2/18/2022 | — | | — | | — | | | | 1,902 | | 138,313 | | — | | — | |
| 2/17/2023 | — | | — | | — | | | | 4,107 | | 298,661 | | 3,696 | | 268,773 | |
| 2/16/2024 | — | | — | | — | | | | 13,081 | | 951,250 | | 3,270 | | 237,794 | |
| Trevor Ness | 2/22/2018 | 5,689 | | — | | 239.72 | | 2/21/2028 | | — | | — | | — | | — | |
| 2/15/2019 | 6,212 | | — | | 154.88 | | 2/14/2029 | | — | | — | | — | | — | |
| 2/19/2021 | — | | — | | — | | | | 656 | | 47,704 | | — | | — | |
| 2/18/2022 | — | | — | | — | | | | 1,545 | | 112,352 | | — | | — | |
| 2/17/2023 | — | | — | | — | | | | 3,334 | | 242,448 | | 3,000 | | 218,160 | |
| 2/16/2024 | — | | — | | — | | | | 11,151 | | 810,901 | | 2,787 | | 202,671 | |
Angelo
Lopresti | 2/25/2015 | 5,661 | | — | | 97.65 | | 2/25/2025 | | — | | — | | — | | — | |
| 2/18/2016 | 5,861 | | — | | 81.89 | | 2/18/2026 | | — | | — | | — | | — | |
| 2/17/2017 | 7,184 | | — | | 119.50 | | 2/17/2027 | | — | | — | | — | | — | |
| 2/22/2018 | 5,786 | | — | | 239.72 | | 2/22/2028 | | — | | — | | — | | — | |
| 2/15/2019 | 7,540 | | — | | 154.88 | | 2/15/2029 | | — | | — | | — | | — | |
| 2/19/2021 | — | | — | | — | | | | 668 | | 48,577 | | — | | — | |
| 2/28/2022 | — | | — | | — | | | | 1,572 | | 114,316 | | — | | — | |
| 2/17/2023 | — | | — | | — | | | | 3,393 | | 246,739 | | 3,052 | | 221,941 | |
| 2/16/2024 | — | | — | | — | | | | 10,806 | | 785,812 | | 2,701 | | 196,417 | |
| Igor Samartsev | 2/25/2015 | 3,247 | | — | | 97.65 | | 2/25/2025 | | — | | — | | — | | — | |
| 2/18/2016 | 3,363 | | — | | 81.89 | | 2/18/2026 | | — | | — | | — | | — | |
| 2/17/2017 | 3,200 | | — | | 119.50 | | 2/17/2027 | | — | | — | | — | | — | |
| 2/22/2018 | 2,758 | | — | | 239.72 | | 2/22/2028 | | — | | — | | — | | — | |
| 2/15/2019 | 3,594 | | — | | 154.88 | | 2/15/2029 | | — | | — | | — | | — | |
| 2/19/2021 | | | | | | 265 | | 19,271 | | — | | — | |
| 2/18/2022 | | | | | | 624 | | 45,377 | | — | | — | |
| 2/17/2023 | | | | | | 1,348 | | 98,027 | | 1,212 | | 88,137 | |
| 2/16/2024 | | | | | | 2,832 | | 205,943 | | 708 | | 51,486 | |
| | | | | | | | | | | | | | | | | | | | | | | | | | | | | | | | |
| | Option Awards(1) | | Stock Awards(1) |
| Name |
Grant Date | Securities
Underlying
Unexercised
Options
(#)
Exercisable | Securities
Underlying
Unexercised
Options
(#)
Unexercisable | Option
Exercise
Price
($)(2) | Option
Expiration
Date | | Number
of Shares
or Units
of Stock
That
Have Not
Vested
(#) | Market
Value of
Shares
or Units
of Stock
That
Have
Not
Vested
($)(3) | Equity
incentive
plan awards:
Number of
unearned
shares, units
or other rights
that have not
vested
(#)(4) | Equity
incentive
plan awards:
Market or
payout value
of unearned
shares, units
or other
rights that
have not
vested
($)(4) |
Eugene
Scherbakov | 2/25/2015 | 7,326 | | — | | 97.65 | | 2/25/2025 | | — | | — | | — | | — | |
| 2/18/2016 | 7,592 | | — | | 81.89 | | 2/18/2026 | | — | | — | | — | | — | |
| 2/17/2017 | 10,367 | | — | | 119.50 | | 2/17/2027 | | — | | — | | — | | — | |
| 2/22/2018 | 13,744 | | — | | 239.72 | | 2/22/2028 | | — | | — | | — | | — | |
| 2/15/2019 | 17,908 | | — | | 154.88 | | 2/15/2029 | | — | | — | | — | | — | |
| 2/19/2021 | — | | — | | — | | | | 1,310 | | 95,263 | | — | | — | |
| 5/7/2021 | — | | — | | — | | | | 1,267 | | 92,136 | | — | | — | |
| 2/18/2022 | — | | — | | — | | | | 6,091 | | 442,938 | | — | | — | |
| 2/17/2023 | — | | — | | — | | | | 11,225 | | 816,282 | | 10,101 | | 734,545 | |
| 2/16/2024 | — | | — | | — | | | | 28,877 | | 2,099,935 | | 7,219 | | 524,966 | |
| Alexander Ovtchinnikov | 2/17/2017 | 7,119 | | — | | 119.50 | | 2/17/2027 | | — | | — | | — | | — | |
| 2/22/2018 | 5,734 | | — | | 239.72 | | 2/22/2028 | | — | | — | | — | | — | |
| 2/15/2019 | 7,472 | | — | | 154.88 | | 2/15/2029 | | — | | — | | — | | — | |
| 2/19/2021 | — | | — | | — | | | | 661 | | 48,068 | | — | | — | |
| 2/18/2022 | — | | — | | — | | | | 1,557 | | 113,225 | | — | | — | |
| 2/17/2023 | — | | — | | — | | | | 3,362 | | 244,485 | | 3,025 | | 219,978 | |
| 2/16/2024 | — | | — | | — | | | | 11,242 | | 817,518 | | 2,810 | | 204,343 | |
(1)The vesting dates assume the continued service of the NEO through the applicable vesting date. Service-based RSUs granted prior to 2022 vest in four annual installments commencing on March 1 of the year following the grant. Service-based RSUs granted in February 2022 and subsequent years vest in three annual installments commencing on March 1 of the year following the grant. PSUs granted in 2024, 2023 and 2022 vest in one installment on March 1 of 2027, 2026 and 2025, respectively, if at all. However, (a) RSUs granted on May 7, 2021 to Dr. Scherbakov vest in four annual installments commencing on May 7, 2022 and PSUs granted on May 7, 2021 to Dr. Scherbakov vest in one installment on May 7, 2024, and (b) the RSUs granted on June 5, 2024 to Dr. Gitin vest in three annual installments commencing on June 5, 2025 and PSUs granted on June 5, 2024 to Dr. Gitin vest in one installment on June 5, 2027.
(2)Represents the closing price of a share of our common stock on the grant date.
(3)Based upon the closing common stock price on December 31, 2024, the last trading day of 2024, which was $72.72 per share.
(4)The three-year PSU performance measurement periods end March 1, 2026 and 2025 for PSUs granted in 2023 and 2022, respectively. The PSUs granted in 2024 are eligible to be earned over a three-year performance period starting on January 1, 2024. The number of shares that can be earned ranges from 0% to 200% of the target number of PSUs based upon achievement of pre-determined performance metrics and the amounts presented above assume attainment of the threshold performance levels. See "2024 Compensation of Named Executive Officers—Long-Term Incentives—Historical Performance of Performance-Based Stock Units" for more information on the vesting of PSUs granted in 2021 and 2022.
Option Exercises and Stock Vested in 2024
The following table provides information on NEO stock option exercises and vesting of RSUs and PSUs during 2024. PSUs granted in 2021 were eligible to vest in March 2024. IPG performance fell below threshold for PSUs based on three-year relative TSR compared to the approved index, resulting in no shares paid out for such awards. For PSUs based on the ratio of operating cash flow to adjusted net income over a three-year performance period beginning January 1, 2021, IPG performance resulted in a distribution of common stock at 66.3% of target.
| | | | | | | | | | | | | | | | | |
| Option Awards | | Stock Awards |
| Name | Number of
Shares Acquired
on Exercise
(#) | Value Realized
on Exercise
($)(1) | | Number of
Shares Acquired
on Vesting
(#) | Value Realized
on Vesting
($)(2) |
| Mark Gitin | — | | — | | | — | | — | |
| Timothy Mammen | — | — | | 7,087 | 621,317 |
| Trevor Ness | — | — | | 5,774 | 506,207 |
| Angelo Lopresti | — | — | | 5,874 | 514,974 |
| Igor Samartsev | — | — | | 2,333 | 204,534 |
| Eugene Scherbakov | 13,000 | 202,636 | | 19,729 | 1,735,005 |
| Alexander Ovtchinnikov | — | — | | 5,820 | 510,239 |
(1)The value realized is based on the difference between the reported closing common stock price on the date of exercise and the exercise price of the stock option; the dollar amount represents the pre-tax value received on exercise.
(2)The value realized is based on the closing common stock prices on the vesting dates of service-based RSUs and PSUs; the dollar amount represents the pre-tax value received on vesting.
Post-Employment Compensation and Other Employment Agreements
The Company has entered into employment agreements with each of the NEOs, effective through December 31, 2024 (or December 31, 2025 for Dr. Gitin) and was party to employment agreements with Drs. Scherbakov and Ovtchinnikov during their employment. Upon expiration, the currently effective employment agreements automatically renew for successive one-year periods, unless the Company or a NEO provides written notice of non-renewal at least six months prior to the end of the then-current term. In the event of a change in control, the agreements would extend through the second anniversary of the change in control. The employment agreements set the annual base salaries and stipulate that the Compensation Committee may adjust the salaries annually, as noted in Compensation Discussion and Analysis - Base Salary above. The agreements entitle these executive officers to participate in bonus plans, standard insurance plans such as life, short-term disability and long-term disability insurance and retirement benefits, such as the 401(k) retirement savings plan and equity award plans described above, on similar terms and on a similar basis as such benefits are available to executives at similar levels within the Company.
Termination without "cause" or for "good reason"
If the Company terminates the employment of any of the NEOs without cause (as defined in the respective employment agreements and, for Dr. Gitin, including a non-renewal of the term of the Gitin Employment Agreement by the Company) or any of the NEOs terminates his employment for good reason (as defined in the respective employment agreements) (such terminations are referred to below as “Involuntary Terminations”), then the NEO would receive:
•continuation of salary for twenty-four months for the CEO and eighteen months for the other NEOs;
•a pro-rata portion of the annual bonus that the NEO would have received had he remained employed through the end of the applicable bonus period, based on actual performance, provided that, with respect to any personal performance evaluation element of the annual bonus calculation, if all financial metric components meet or exceed the target level of performance, the NEO shall be deemed awarded 100% of the potential personal performance evaluation bonus; if no financial metric bonus is awarded, no personal performance evaluation bonus will be deemed awarded, and amounts in between the threshold and target levels of performance will be determined by linear interpolation (such portion based on the percentage of the year that the NEO was employed by the Company) (the "Pro-Rated Bonus");
•cash reimbursement for continuation of health benefits for up to twenty-four months for the CEO and eighteen months for the other NEOs; and
•accelerated vesting of time-based RSU awards held by Dr. Gitin and equity compensation awards held by the other NEOs that otherwise would have vested within twelve months following the termination of employment, except that awards granted to Dr. Gitin in connection with his appointment as CEO in June 2024 will vest in their entirety, with
PSUs vesting at target performance and, for purposes of accelerated vesting, time-based RSUs held by Dr. Gitin shall be deemed to vest in equal monthly installments over three years.
Termination without "cause" or for "good reason" within 24 months following a change in control
Upon an Involuntary Termination within twenty-four months following a change in control of the Company, the NEO would be entitled to continuation of salary and reimbursement of COBRA premiums for health benefits for twenty-four months or, in the case of Dr. Gitin, a lump-sum payment equal to twenty-four months of his base salary and reimbursement for health premiums for up to twenty-four months, the Pro-Rated Bonus for the year of termination plus a payment of two times the average annual bonus paid to the NEO for the three full years preceding the year of termination, or, in the case of Dr. Gitin, two times his target annual bonus for the year in which the change in control occurs if such change of control occurs before three completed years of employment. Under the employment agreements, all equity awards vest fully upon an Involuntary Termination that occurs within two years of a change in control, with PSUs vesting at target performance. Upon a change in control, the term of the employment agreements would automatically be extended to the second anniversary of the change in control if such date is later than expiration of the current term.
If the total value of all payments and benefits, including any equity vesting (“total payments”), made to a NEO in connection with or on account of a change in control would result in an excise tax under the provisions of Internal Revenue Code Section 4999 (the “golden parachute tax”), the total payments will be reduced so that the maximum amount of total payments (after reduction) is $1.00 less than the amount that would cause the total payments to be subject to the golden parachute tax; provided, however, that the total payments will only be reduced to the extent that the after-tax value of amounts received by the NEO after application of the above reduction would exceed the after-tax value of the total payments received without application of such reduction (so called “best after-tax treatment”).
Death
If a NEO's employment is terminated by death, the NEO will receive a Pro-Rated Bonus, and all RSUs outstanding on such date will immediately vest and all PSUs outstanding on such date will immediately vest at one hundred percent (100%) of target level.
Disability
If a NEO's employment is terminated due to "disability" (as defined in the respective employment agreement), the NEO will receive a Pro-Rated Bonus for the year of termination.
With respect to equity awards granted after July 2021, if a NEO's employment is terminated due to disability, such RSUs outstanding on such date shall immediately vest and such PSUs outstanding on such date will vest, if at all, on the vesting date set forth in the award agreement on a pro-rated basis at the actual achievement level earned at the end of the performance period.
With respect to equity awards granted prior to July 2021, if a NEO's employment is terminated due to disability, such unvested awards will immediately be forfeited as of such date.
Termination following non-renewal
If the term of the employment agreement of any of the NEOs other than Dr. Gitin terminates and the Company does not offer such NEO continued employment in the same or a substantially similar position or in a higher position than the NEO's position at the end of the term and at a compensation level that is the same or substantially similar to the compensation level in effect at the end of the employment period, then such NEO may resign from employment and would receive continuation of salary and health benefits for twelve months, plus a Pro-Rated Bonus.
For Cause or Other Than for Good Reason
Under the employment agreements, the Company would not be obligated to provide any severance payments or benefits if employment were terminated by the Company for cause or by the NEO other than for good reason.
Additional Terms
Severance payments to the NEOs are conditioned upon the release of claims by the NEO in favor of the Company. Each of the NEOs entered into a separate restrictive agreement that prohibits each from competing with the Company for a period of one year after the termination of his employment with the Company for any reason and from hiring or attempting to hire the Company’s employees or soliciting customers or suppliers of the Company for a period ending eighteen months following the termination of his employment for any reason. Each of the NEOs is entitled to receive his base salary for the period during which the Company enforces the non-competition provisions of the agreement but not for more than one year following termination of his employment.
Potential Payments upon Termination or Change in Control
The following table provides information regarding compensation and benefits that would be payable to our NEOs as of December 31, 2024, upon an Involuntary Termination absent a change in control and within twenty-four months following a change in control and upon terminations in other circumstances. The incentive plan severance was calculated using the actual amount awarded under the Revised AIP. There can be no assurance that the event triggering payments would produce the same or similar results as those described below if such event occurs on any other date or at any other price, or if any other assumption used to estimate the potential payments and benefits is changed. Any actual payments and benefits may be different due to a number of factors that affect the nature and amount of any potential payments or benefits.
Drs. Scherbakov and Ovtchinnikov terminated employment on June 4, 2024 and September 15, 2024, respectively, and were not entitled to severance payments or benefits in connection with their termination of employment. Drs. Scherbakov and Ovtchinnikov are eligible for payments and continued vesting of equity awards during the periods in which they are providing consulting services to the Company, as described in Compensation Discussion and Analysis – Compensation Related to Leadership Transitions above.
| | | | | | | | | | | | | | | | | | | | |
| Name | Benefit | Termination
Without Cause
or For Good
Reason
($) | Termination
Without Cause or
For Good Reason
Following a Change
in Control
($)(1) | Termination
upon
Death
($) | Termination
following
Disability
($)(1) | Termination
following Non-
Renewal
($) |
| Mark Gitin | Salary Severance and
Benefits Continuation | 1,605,686 | | 1,605,686 | | — | | — | | 1,605,686 | |
| Bonus Severance | 775,000 | | 2,325,000 | | 775,000 | | 775,000 | | 775,000 | |
| Equity Acceleration | 4,187,290 | | 4,187,290 | | 4,187,290 | | 2,791,551 | | 4,187,290 | |
| Total | 6,567,976 | | 8,117,976 | | 4,962,290 | | 3,566,551 | | 6,567,976 | |
| Timothy Mammen | Salary Severance and
Benefits Continuation | 849,815 | | 1,133,086 | | — | | — | | 566,543 | |
| Incentive Plan Severance | 265,300 | | 1,120,535 | | 265,300 | | 265,300 | | 265,300 | |
| Equity Acceleration | 663,485 | | 3,261,056 | | 3,261,056 | | 2,003,921 | | — | |
| Total | 1,778,600 | | 5,514,677 | | 3,526,356 | | 2,269,221 | | 831,843 | |
| Trevor Ness | Salary Severance and
Benefits Continuation | 789,640 | | 1,052,853 | | — | | — | | 526,427 | |
| Incentive Plan Severance | 245,200 | | 1,002,766 | | 245,200 | | 245,200 | | 245,200 | |
| Equity Acceleration | 551,581 | | 2,724,673 | | 2,724,673 | | 1,678,378 | | — | |
| Total | 1,586,421 | | 4,780,292 | | 2,969,873 | | 1,923,578 | | 771,627 | |
| Angelo Lopresti | Salary Severance and
Benefits Continuation | 728,250 | | 971,000 | | — | | — | | 485,500 | |
| Incentive Plan Severance | 242,800 | | 1,013,497 | | 242,800 | | 242,800 | | 242,800 | |
| Equity Acceleration | 548,200 | | 2,694,058 | | 2,694,058 | | 1,655,471 | | — | |
| Total | 1,519,250 | | 4,678,555 | | 2,936,858 | | 1,898,271 | | 728,300 | |
| Igor Samartsev | Salary Severance and
Benefits Continuation | 682,642 | | 910,189 | | — | | — | | 455,095 | |
| Incentive Plan Severance | 127,200 | | 647,607 | | 127,200 | | 127,200 | | 127,200 | |
| Equity Acceleration | 182,309 | | 857,587 | | 857,587 | | 515,924 | | — | |
| Total | 992,151 | | 2,415,383 | | 984,787 | | 643,124 | | 582,295 | |
(1)Equity acceleration is calculated at the full value of service-based RSUs. For PSUs tied to the performance period ending on December 31, 2024, the actual number of PSUs earned was used in the calculation; for PSUs tied to performance beyond 2024, the target number of PSUs was used in the calculations.
CEO Pay Ratio
As required by Section 953(b) of the Dodd-Frank Wall Street Reform and Consumer Protection Act and Item 402(u) of Regulation S-K, we are providing the following information on the relationship of the annual total compensation of our employees and the annual total compensation of Dr. Mark Gitin, our CEO.
Determining our Median Employee: As of December 31, 2024, the measurement date, we employed 4,602 employees, 58% of whom were located outside of the U.S. This includes all full-time, part-time, and temporary employees. It does not include independent contractors. Prior to the measurement date, IPG completed the disposition of its Russian subsidiary, IRE-Polus, and employees of IRE-Polus are therefore not included in this total.
As permitted by applicable SEC rules, in identifying our median employee, we used the "de minimis" exemption to exclude from our employee population 224 workers in the following jurisdictions (employees excluded in parenthesis): Mexico (54), India (44), Korea (40), Turkey (18), United Kingdom (15), Brazil (12), Czech Republic (9), France (8), Spain (6), Thailand (5), Taiwan (5), Malaysia (3), Vietnam (2) and Singapore (1).
The SEC rules required us to identify our median employee by use of a consistently applied compensation measure (“CACM”). We chose a CACM that closely approximates the annual total cash compensation of our employees. Specifically, we identified the median employee as of December 31, 2024, by looking at total wages and bonuses paid in 2024. An average 2024 U.S. dollar exchange rate was applied to compensation reported in a foreign currency. After applying our CACM methodology and excluding the employees listed above, we identified the median employee.
Calculating the Pay Ratio: As required by the SEC rules, we calculated our median employee’s total annual compensation in accordance with the requirements of Item 402(c)(2)(x) of Regulation S-K (which is the calculation method for reporting total compensation in the Summary Compensation Table). The total compensation of our median employee was $42,185.
With respect to the annual total compensation of our CEO, we annualized the compensation of Dr. Gitin (2024 base salary and annual bonus earned in respect of 2024 performance), who was appointed in June 2024, and otherwise included the amounts set forth for him in the Summary Compensation Table above. We determined that the 2024 annualized total compensation of our CEO was $7,064,479. As a result, the estimated ratio of the annual total compensation of our CEO to median employee in 2024 was approximately 167 to 1.
The pay ratio included in this information is a reasonable estimate calculated in a manner consistent with rules promulgated by the SEC. The SEC rules for identifying the median compensated employee allow companies to adopt a variety of methodologies, to apply certain exclusions and to make reasonable estimates and assumptions that reflect their employee populations and compensation practices. Accordingly, the pay ratio reported by other companies may not be comparable to the pay ratio reported above, as other companies have different employee populations and compensation practices and may use different methodologies, exclusions, estimates and assumptions in calculating their own pay ratios. This information is being provided solely for compliance with SEC disclosure rules. The Compensation Committee does not consider this ratio when evaluating compensation arrangements.
Director Compensation
In 2024, our non-employee directors received the following annual compensation from us:
| | | | | |
| Amount |
| Board Retainer | $ | 40,000 | |
| Non-Executive Chair Retainer | $ | 80,000 | |
| Audit Committee Retainers | |
| Chair | $ | 25,000 | |
| Non-Chair | $ | 12,500 | |
| Compensation Committee Retainers | |
| Chair | $ | 22,500 | |
| Non-Chair | $ | 10,000 | |
| NCGC Retainers | |
| Chair | $ | 17,500 | |
| Non-Chair | $ | 7,500 | |
| Annual Equity Award | $ | 250,000 | |
We provide cash compensation through retainers for Board and committee service, as well as additional cash retainers to the non-executive Chair of the Board and chairs of our standing Board committees. We do not provide Board and committee meeting fees. Compensating our directors in this manner simplifies the administration of our program and creates greater equality in rewarding service on committees of the Board. The additional retainers for Board or committee leadership compensate directors for the additional responsibilities and time commitments involved with chair responsibilities.
Following our annual meeting of stockholders in 2024, non-employee directors, received an equity award of service-based restricted stock units ("RSUs") with a value of approximately $250,000. The awards vest in a single installment on the earlier of the first anniversary of the date of grant or the next annual meeting of stockholders.
Upon election to the Board, each new non-employee director receives a grant of approximately $250,000 in RSUs vesting on the first anniversary of the date of grant subject to the director’s continued service on the Board through the vesting date. If the election to the Board for a new director occurs other than at an annual meeting of stockholders, the subsequent annual equity grant is pro-rated based upon time the director served since first election. Any director who retires after at least eight years of service on the Board will be entitled to full vesting of all RSUs then held by the director.
We pay for, provide or reimburse directors for expenses, including business class travel, incurred to attend Board and committee meetings and director education programs. We do not pay our non-employee directors any additional payments or perquisites. Our directors do not have a retirement plan. Directors who are also employees receive no additional compensation for service on the Board.
Director Compensation Table
The following table summarizes the compensation of each of our non-employee directors for 2024:
| | | | | | | | | | | |
| Name | Fees Earned or Paid in Cash ($) | Stock Awards ($)(1) | Total ($) |
| Gregory Beecher | 60,000 | | 249,950 | | 309,950 | |
| Michael Child | 42,776 | | 249,950 | | 292,726 | |
| Jeanmarie Desmond | 75,000 | | 249,950 | | 324,950 | |
| Gregory Dougherty | 75,000 | | 249,950 | | 324,950 | |
| Kolleen Kennedy | 44,724 | | 249,950 | | 294,674 | |
| Eric Meurice | 66,989 | | 249,950 | | 316,939 | |
| Natalia Pavlova | 44,724 | | 249,950 | | 294,674 | |
| John Peeler | 132,776 | | 249,950 | | 382,726 | |
| Agnes Tang | 52,500 | | 249,950 | | 302,450 | |
(1)The amount reported is equal to the fair value of the RSU awards as of the grant date determined pursuant to Financial Accounting Standards Board Accounting Standards Codification Topic 718 ("ASC Topic 718") disregarding any estimates of forfeitures related to service-based vesting. The assumptions that we used with respect to the valuation of RSU awards are set forth in Note 15 to our Consolidated Financial Statements in our Annual Report.
Outstanding Equity Awards
The following table provides information regarding unexercised stock options and unvested RSUs held by each of our non-employee directors on December 31, 2024:
| | | | | | | | |
| Name | Unvested Restricted
Stock Units (#) | Total Number of Shares Underlying
Option Awards Held (#) |
| Gregory Beecher | 3,022 | | — | |
| Michael Child | 3,022 | | 10,578 | |
| Jeanmarie Desmond | 3,022 | | — | |
| Gregory Dougherty | 3,022 | | 3,259 | |
| Kolleen Kennedy | 3,022 | | — | |
| Eric Meurice | 3,022 | | 10,578 | |
| Natalia Pavlova | 3,022 | | — | |
| John Peeler | 3,022 | | 7,576 | |
| Agnes Tang | 3,022 | | — | |
The Company no longer grants stock options to non-employee directors. All previously-granted options were vested as of December 31, 2024.
Our Charter limits the dollar amount of personal liability of our directors for breaches by them of their fiduciary duties. Our Charter requires us to indemnify our directors to the fullest extent permitted by the Delaware General Corporation Law ("DGCL"). We have also entered into indemnification agreements with all of our directors and we have purchased directors’ and officers’ liability insurance.
Director Stock Ownership Guidelines
The Board adopted stock ownership guidelines to more closely align the interests of our directors with those of our long-term stockholders. Under the guidelines, non-employee directors are expected to maintain a minimum investment in our common stock of five times their annual cash Board retainers (excluding committee or leadership retainers).
Unvested time-based RSUs count toward required stock ownership levels; stock options (whether vested or unvested) do not. Ownership requirements are to be achieved no later than four years after the election as a director, except that prior to such time the director is expected to retain a certain portion of stock issued upon exercise of stock options or vesting of RSUs until the minimum ownership level is attained. All directors were in compliance with our stock ownership guidelines as of December 31, 2024.
ITEM 12. SECURITY OWNERSHIP OF CERTAIN BENEFICIAL OWNERS AND MANAGEMENT AND RELATED STOCKHOLDER MATTERS
The following table provides information about the beneficial ownership of our common stock as of February 18, 2025 by:
•each NEO,
•each person who is a director or nominee,
•all executive officers and directors as a group and
•each person or entity known by us to own beneficially more than five percent of our common stock.
Percentage of beneficial ownership is based on 42,548,561 shares of common stock outstanding as of February 18, 2025.
| | | | | | | | | | | | | | |
Name(1) | Shares
Owned | Right to
Acquire
Shares within
60 Days | Total
Beneficial
Ownership(2) | Percent |
| Gregory Beecher | 2,999 | — | 2,999 | * |
Michael Child(3) | 65,603 | 10,578 | 76,181 | * |
| Jeanmarie Desmond | 4,319 | — | 4,319 | * |
| Gregory Dougherty | 9,117 | 3,259 | 12,376 | * |
| Mark Gitin | — | — | — | * |
| Kolleen Kennedy | 2,296 | — | 2,296 | * |
Angelo Lopresti(4) | 8,745,828 | 39,570 | 8,785,398 | 20.6 | % |
| Timothy Mammen | 51,682 | 24,419 | 76,101 | * |
| Eric Meurice | 16,294 | 11,366 | 27,660 | * |
| Trevor Ness | 17,087 | 19,486 | 36,573 | * |
| Alexander Ovtchinnikov | 57,538 | 27,971 | 85,509 | * |
Natalia Pavlova(5) | 937,171 | 18,669 | 955,840 | 2.2 | % |
| John Peeler | 8,959 | 7,576 | 16,535 | * |
Igor Samartsev(5) | 937,171 | 18,669 | 955,840 | 2.2 | % |
Eugene Scherbakov(4)(6) | 15,661,126 | 79,575 | 15,740,701 | 36.9 | % |
| Agnes Tang | 3,763 | — | 3,763 | * |
All executive officers and directors as a group
(15 persons) | 16,823,034 | 214,498 | 17,037,532 | 39.8 | % |
| Other >5% Stockholders | | | | |
IQ EQ Trust Company, U.S., LLC(4)(7)(8) | 9,001,848 | — | 9,001,848 | 21.2 | % |
Valentin Gapontsev Trust I(8) | 7,200,599 | — | 7,200,599 | 16.9 | % |
IP Fibre Devices (UK) Ltd.(1)(6) | 6,914,004 | — | 6,914,004 | 16.2 | % |
First Eagle Investment Management, LLC(9) | 4,257,637 | — | 4,257,637 | 10.0 | % |
The Vanguard Group(10) | 3,044,812 | | 3,044,812 | 7.2 | % |
BlackRock, Inc.(11) | 2,761,451 | — | 2,761,451 | 6.5 | % |
* Less than 1.0%
(1)The contact address for each person or entity is in care of IPG Photonics Corporation, 377 Simarano Drive, Marlborough, Massachusetts 01752.
(2)In accordance with SEC rules, beneficial ownership includes any shares for which a person or entity has sole or shared voting power or investment power and any shares for which the person or entity has the right to acquire beneficial ownership within 60 days after March 31, 2025 through the exercise of any option or the vesting of RSUs or PSUs.
(3)Includes 3,274 shares held in the name of Jewell Partners LLC, in which Mr. Child is partial owner and Managing Member, and 1,638 shares held by TA Money Purchase Plan for the benefit of Mr. Child.
(4)Includes (a) 7,200,600 shares owned of record by Valentin Gapontsev Trust I (“Gapontsev Trust I”), (b) 626,891 shares beneficially owned by Valentin Gapontsev Trust II (“Gapontsev Trust II”), and (c) 899,720 shares beneficially owned by Valentin Gapontsev Trust III (“Gapontsev Trust III”), because such person and entity is a trustee of each trust. Gapontsev Trust I, Gapontsev Trust II and Gapontsev Trust III were formed by the late founder of the Company and former Executive Chairman of the Board, Valentin Gapontsev.
(5)Ms. Pavlova is the spouse of Dr. Igor Samartsev, the Company's Senior Vice President, Chief Scientist. Under SEC rules, the shares beneficially owned by each are deemed to be beneficially owned by the other. Also includes 10,000 shares held by Ms. Pavlova’s mother. Ms. Pavlova and Dr. Samartsev disclaim beneficial ownership of such shares.
(6)Dr. Scherbakov is the sole managing director of IPFD and has sole voting and investment power with respect to the shares held of record by IPFD. The following officers and directors of the Company or related parties have economic interests in IPFD: Gapontsev Trust I (48%), Mr. Samartsev (8%), Dr. Scherbakov (8%), the Estate of Valentin Gapontsev (3%) and Gapontsev Trust III (2%). Each such person and entity (other than Dr. Scherbakov) does not possess voting or investment power with respect to such interest and each disclaims beneficial ownership of the shares held by IPFD except to the extent of his or its economic interest therein.
(7)Includes 298,638 shares owned of record by the Valentin Gapontsev Trust Agreement, a trust formed by Valentin Gapontsev of which IQ EQ Trust Company, U.S., LLC is the sole trustee.
(8)The address of the entity is 3 Executive Park Drive, Suite 302, Bedford, NH 03110. Based solely on a Schedule 13D/A filed with the SEC on January 4, 2024.
(9)The address of First Eagle Investment Management, LLC is 1345 Avenue of Americas 48th Floor New York, NY 10105. Based solely on a Schedule 13G/A filed with the SEC on February 8, 2024.
(10)The address of The Vanguard Group is 100 Vanguard Boulevard, Malvern, PA 19355. Based solely on a Schedule 13G/A filed with the SEC on February 13, 2024.
(11)The address of BlackRock, Inc. is 55 East 52nd Street, New York, NY 10055. Based solely on a Schedule 13G filed with the SEC on January 29, 2024.
The information regarding securities authorized for issuance under our equity compensation plans is set forth below:
| | | | | | | | | | | | | | | | | | | | |
| Plan Category | | Number of Securities to be Issued upon Exercise of Outstanding Options, RSUs and PSUs (a) | | Weighted-Average Exercise Price of Outstanding Options, RSUs and PSUs (b) | | Number of Securities Remaining Available for Future Issuance under Equity Compensation Plans (Excluding Securities Reflected in Column (a)) (c) |
Equity Compensation Plans Approved by Security Holders (1) | | 1,604,214 | | | $ | 123.24 | | | 2,272,037 | |
| Equity Compensation Plans Not Approved by Security Holders | | — | | | | | — | |
| Total | | 1,604,214 | | | | | 2,272,037 | |
(1)As of December 31, 2024, there were 2,205,922 shares available for future issuance under the 2006 Incentive Compensation Plan and 66,115 shares available for future issuance under the employee stock purchase plan.
ITEM 13. CERTAIN RELATIONSHIPS AND RELATED TRANSACTIONS, AND DIRECTOR INDEPENDENCE
The Board adopted a written related person transaction policy that requires the Audit Committee to approve or ratify any transaction or series of transactions exceeding $120,000 in which our Company is a participant and any related person has a direct or indirect material interest (other than solely as a result of being a director or trustee or less than 10% owner of another entity) ("Related Party Transactions"). Related persons include our directors, director nominees and officers and their immediate family members and persons sharing their households. It also includes persons controlling more than 5% of our outstanding common stock. Subject to certain exceptions in the policy, related parties are required to notify the Audit Committee of the Related Party Transaction for an assessment of whether the transaction or proposed transaction should be permitted. Management also has established procedures for monitoring transactions that could be subject to approval or ratification under the Related Party Transactions policy.
In deciding whether to approve or ratify the Related Party Transaction, the Audit Committee considers relevant facts and circumstances. The committee takes into account, among other factors, whether the transaction is on terms no more favorable than terms generally available to an unaffiliated third party under the same or similar circumstances and the extent of the related person’s interest in the transaction. Once a Related Party Transaction has been identified, the Audit Committee reviews all of the relevant facts and circumstances and approves or disapproves entry into the transaction. Members of the Audit Committee having an interest in a transaction excuse themselves for the consideration and approval of the transaction in which they have an interest. Certain transactions are exempt from the policy including compensation paid by the Company for service as a director or an officer which is approved by the Compensation Committee or the Board.
Pursuant to our Corporate Governance Guidelines, we expect each of our directors to ensure that other existing and future commitments do not conflict with or materially interfere with his or her service as a director. In addition, directors are required to inform the chair of the NCGC and the Chair of the Board prior to joining the board of another public company to ensure that any potential conflicts, excessive time demands or other issues are carefully considered.
The Audit Committee reviewed and approved the following Related Party Transaction for 2024 in compliance with our policy:
•From time to time, certain institutional investors may become beneficial owners of 5% or more of the voting securities of the Company and, as a result, are considered a related person under the policy. These organizations may provide services to the Company or its benefit plans. In 2024, participants in our 401(k) Retirement Plan paid approximately $132,400 in fees to affiliates of The Vanguard Group representing expense ratios associated with the Vanguard investment funds in the 401(k) Retirement Plan.
On February 20, 2025, we entered into a Registration Rights Letter with The Valentin Gapontsev Trust I and The Valentin Gapontsev Trust III (the “Gapontsev Trusts”) pursuant to which we granted the Gapontsev Trusts certain registration rights relating to an aggregate of 2,150,000 shares of common stock held by the Gapontsev Trusts. The Gapontsev Trusts have agreed to pay all expenses of the registration of such shares pursuant to the Registration Rights Letter, including, without limitation, SEC filing fees and the fees and expenses of the Company’s counsel and independent registered public accountants and all underwriting discounts and selling commissions, if any and any other related legal expenses incurred by the Gapontsev Trusts.
Director Independence
Eight of our eleven directors are independent as defined by Nasdaq and SEC rules. Nasdaq listing standards governing independence require that a majority of the members of the Board be independent as defined by Nasdaq. Also, our Corporate Governance Guidelines require that a majority of the Board members be independent. Our Corporate Governance Guidelines also require that an independent director must have no material relationship with the Company, directly or indirectly, that might interfere with the exercise of independent judgment in the performance of director responsibilities.
The NCGC conducted its annual review of the independence of the directors (and director nominees) in March 2024, taking into account relevant facts and circumstances, and reported its findings to the full Board. The NCGC determines independence on the basis of the standards specified by Nasdaq, the additional standards referenced in our Corporate Governance Guidelines, and other facts and circumstances the Board considers relevant. During this review, the NCGC examined all direct and indirect transactions or relationships between the Company or any of its subsidiaries and each current independent director and any immediate family member of the independent director and determined that no material relationships with the Company existed during 2023 or to date in 2024. On the basis of this review, the NCGC determined that each of the following directors qualifies as an independent director as defined in Nasdaq guidelines, SEC rules and under our Corporate Governance Guidelines: Gregory Beecher, Michael Child, Jeanmarie Desmond, Kolleen Kennedy, Gregory Dougherty, Eric Meurice, John Peeler and Agnes Tang. Additionally, the Board determined that each member of the Audit Committee and the Compensation Committee meets the independence standards specific for members of such committees under Nasdaq guidelines and SEC rules. Dr. Mark Gitin, out CEO is not independent. Ms. Pavlova is not considered independent because she is the spouse of Dr. Igor Samartsev, an executive officer of the Company. Dr. Eugene Scherbakov is not considered independent because he served as an executive officer of the Company within the last three (3) years.
ITEM 14. PRINCIPAL ACCOUNTING FEES AND SERVICES
The fees for services provided by Deloitte & Touche LLP, member firm of Deloitte Touche Tohmatsu, and their respective affiliates, currently serves as our independent registered public accounting firm and audited our consolidated financial statements for the year ended December 31, 2024, to the Company were:
| | | | | | | | |
| Fees |
| Fee Category | 2024 | | 2023 | |
| Audit fees | $ | 2,542,500 | | $ | 2,529,772 | |
| Audit-related fees | — | | — | |
| Tax fees | — | | — | |
| All other fees | 1,895 | | 1,895 | |
| Total Fees | $ | 2,544,395 | | $ | 2,531,667 | |
Audit fees. These fees comprise fees for professional services rendered in connection with the audit of the Company’s consolidated financial statements that are customary under auditing standards generally accepted in the United States. Audit fees also include fees for the audits of statutory financial statements, consents and reviews related to SEC filings and quarterly services with respect to the preparation of our unaudited quarterly financial statements.
Audit-related fees. These fees comprise fees for services that are reasonably related to the performance of the audit or review of the Company’s financial statements.
Tax fees. Fees for tax services consist of fees for tax compliance services and tax planning and advice services. Tax compliance services are services rendered based upon facts already in existence or transactions that have already occurred to document, compute and obtain government approval for amounts to be included in tax filings. Tax planning and advice are services rendered with respect to proposed transactions or that alter a transaction to obtain a particular tax result.
All other fees. These are fees for any services not included in the other three categories.
Policy on Pre-Approval of Audit and Permissible Non-Audit Services. The Audit Committee pre-approves all audit and permissible non-audit services provided by the independent registered public accounting firm. These services may include audit services, audit-related services and tax services as well as specifically designated non-audit services that, in the opinion of the Audit Committee, will not impair the independence of the independent registered public accounting firm. Pre-approval is generally provided for each fiscal year, and any pre-approval is detailed as to the particular service or category of services and is generally subject to a specific budget. The independent registered public accounting firm and our management are required to periodically report to the Audit Committee regarding the extent of services provided by the independent registered public accounting firm in accordance with the pre-approval, including the fees for the services performed to date. In addition, the Audit Committee also may pre-approve particular services on a case-by-case basis, as required. All of the services performed by Deloitte & Touche LLP in 2024 were pre-approved by the Audit Committee.
PART IV
ITEM 15. EXHIBITS AND FINANCIAL STATEMENT SCHEDULES
a.The following documents are filed as part of this Annual Report on Form 10-K:
1.Financial Statements.
See Index to Financial Statements on page F-1.
2.Financial Statement Schedules.
All schedules are omitted because they are not applicable or the required information is shown on the financial statements or notes thereto.
3.Exhibits.
| | | | | | | | | | | |
| Exhibit Number | | Description | |
| 3.1 | | | |
| | |
| 3.2 | | | |
| | |
| 4.1 | | | |
| | |
| 4.2 | | | |
| | | |
10.1† | | | |
| | |
10.2† | | | |
| | | |
10.3† | | | |
| | | |
10.4† | | | |
| | |
10.5† | | | |
| | |
10.6† | | | |
| | | |
10.7† | | | |
| | | |
10.8† | | | |
| | | |
10.9† | | | |
| | | |
10.10† | | | |
| | | |
10.11† | | | |
| | | |
10.12† | | | |
| | | |
10.13† | | | |
| | | |
| | | | | | | | | | | |
| Exhibit Number | | Description | |
10.14† | | | |
| | | |
10.15† | | | |
| | | |
| 10.16 | | | |
| | |
| 10.17 | | | |
| | | |
| 10.18 | | | |
| | | |
| 19* | | | |
| | | |
| 21.1* | | | |
| | | |
| 23.1* | | | |
| | | |
| 31.1* | | | |
| | | |
| 31.2* | | | |
| | | |
| 32.1** | | | |
| | | |
| 97* | | | |
| | | |
| 101.INS* | | Inline XBRL Instance Document | |
| | | |
| 101.SCH* | | Inline XBRL Taxonomy Extension Schema | |
| | | |
| 101.CAL* | | Inline XBRL Taxonomy Extension Calculation Linkbase | |
| | | |
| 101.DEF* | | Inline XBRL Taxonomy Definition Linkbase | |
| | | |
| 101.LAB* | | Inline XBRL Taxonomy Extension Label Linkbase | |
| | | |
| 101.PRE* | | Inline XBRL Taxonomy Extension Presentation Linkbase | |
| | | |
| 104* | | Cover Page Interactive Data File (formatted as inline XBRL and contained in Exhibit 101) | |
* Filed herewith.
** Furnished herewith. The certification attached as Exhibit 32.1 that accompanies this Annual Report on Form 10-K is deemed furnished and not filed with the SEC and is not to be incorporated by reference into any filing of the Company under the Securities Act or the Exchange Act, whether made before or after the date of this Annual Report on Form 10-K, irrespective of any general incorporation.
† Identifies management contract or compensatory plans or arrangements required to be filed as an exhibit.
b.Exhibits.
See (a)(3) above.
c.Additional Financial Statement Schedules.
All schedules are omitted because they are not applicable or the required information is shown on the financial statements or notes thereto.
ITEM 16. FORM 10-K SUMMARY
None.
SIGNATURES
Pursuant to the requirements of Section 13 or 15(d) of the Securities Exchange Act of 1934, the Registrant has duly caused this report to be signed on its behalf by the undersigned, thereunto duly authorized, on February 20, 2025.
| | | | | |
IPG PHOTONICS CORPORATION |
|
| By: | /s/ Mark M. Gitin |
| | Mark M. Gitin Chief Executive Officer |
KNOW ALL PERSONS BY THESE PRESENTS, that each person whose signature appears below constitutes and appoints Mark M. Gitin and Angelo P. Lopresti, jointly and severally, his or her attorneys-in-fact, each with the power of substitution, for him or her in any and all capacities, to sign any amendments to this Annual Report on Form 10-K, and to file the same, with exhibits thereto and other documents in connection therewith, with the Securities and Exchange Commission, hereby ratifying and confirming all that each of said attorneys-in-fact, or his substitute or substitutes, may do or cause to be done by virtue hereof.
Pursuant to the requirements of the Securities Exchange Act of 1934, this report has been signed below by the following persons on behalf of the Registrant and in the capacities and on the dates indicated.
| | | | | | | | | | | | | | |
| | | | |
| Signature | | Title | | Date |
| | |
/s/ Mark M. Gitin Mark M. Gitin | | Chief Executive Officer and Director
(Principal Executive Officer) | | February 19, 2025 |
| | |
/s/ Timothy P.V. Mammen Timothy P.V. Mammen | | Senior Vice President, Chief Financial Officer (Principal Financial Officer) | | February 19, 2025 |
| | |
/s/ Thomas J. Burgomaster Thomas J. Burgomaster | | Vice President, Corporate Controller and Chief Accounting Officer (Principal Accounting Officer) | | February 19, 2025 |
| | | | |
/s/ Gregory Beecher Gregory Beecher | | Director | | February 19, 2025 |
| | | | |
/s/ Michael Child Michael Child | | Director | | February 19, 2025 |
| | | | |
/s/ Jeanmarie Desmond Jeanmarie Desmond | | Director | | February 19, 2025 |
| | |
/s/ Gregory Dougherty Gregory Dougherty | | Director | | February 19, 2025 |
| | | | |
/s/ Kolleen Kennedy Kolleen Kennedy | | Director | | February 19, 2025 |
| | | | |
/s/ Eric Meurice Eric Meurice | | Director | | February 19, 2025 |
| | |
/s/ Natalia Pavlova Natalia Pavlova | | Director | | February 19, 2025 |
| | |
/s/ John Peeler John Peeler | | Non-Executive Chair of the Board and Director | | February 19, 2025 |
| | |
/s/ Eugene A. Scherbakov Eugene A. Scherbakov | | Director | | February 19, 2025 |
| | | | |
/s/ Agnes Tang Agnes Tang | | Director | | February 19, 2025 |
INDEX TO FINANCIAL STATEMENTS
| | | | | | | | | | | | | | |
| | | | |
| Report of Independent Registered Public Accounting Firm (PCAOB ID: 34) | | | | |
| Consolidated Balance Sheets as of December 31, 2024 and 2023 | | | | |
| Consolidated Statements of Operations for the Years Ended December 31, 2024, 2023, and 2022 | | | | |
| Consolidated Statements of Comprehensive (Loss) Income for the Years Ended December 31, 2024, 2023, and 2022 | | | | |
| Consolidated Statements of Equity for the Years Ended December 31, 2024, 2023, and 2022 | | | | |
| Consolidated Statements of Cash Flows for the Years Ended December 31, 2024, 2023, and 2022 | | | | |
| Notes to Consolidated Financial Statements | | | | |
REPORT OF INDEPENDENT REGISTERED PUBLIC ACCOUNTING FIRM
To the stockholders and the Board of Directors of IPG Photonics Corporation
Opinion on the Financial Statements
We have audited the accompanying consolidated balance sheets of IPG Photonics Corporation and subsidiaries (the "Company") as of December 31, 2024 and 2023, the related consolidated statements of operations, comprehensive (loss) income, equity, and cash flows for each of the three years in the period ended December 31, 2024, and the related notes (collectively referred to as the "financial statements"). In our opinion, the financial statements present fairly, in all material respects, the financial position of the Company as of December 31, 2024 and 2023, and the results of its operations and its cash flows for each of the three years in the period ended December 31, 2024, in conformity with accounting principles generally accepted in the United States of America.
We have also audited, in accordance with the standards of the Public Company Accounting Oversight Board (United States) (PCAOB), the Company's internal control over financial reporting as of December 31, 2024, based on criteria established in Internal Control - Integrated Framework (2013) issued by the Committee of Sponsoring Organizations of the Treadway Commission and our report dated February 20, 2025, expressed an unqualified opinion on the Company's internal control over financial reporting.
Basis for Opinion
These financial statements are the responsibility of the Company's management. Our responsibility is to express an opinion on the Company's financial statements based on our audits. We are a public accounting firm registered with the PCAOB and are required to be independent with respect to the Company in accordance with the U.S. federal securities laws and the applicable rules and regulations of the Securities and Exchange Commission and the PCAOB.
We conducted our audits in accordance with the standards of the PCAOB. Those standards require that we plan and perform the audit to obtain reasonable assurance about whether the financial statements are free of material misstatement, whether due to error or fraud. Our audits included performing procedures to assess the risks of material misstatement of the financial statements, whether due to error or fraud, and performing procedures that respond to those risks. Such procedures included examining, on a test basis, evidence regarding the amounts and disclosures in the financial statements. Our audits also included evaluating the accounting principles used and significant estimates made by management, as well as evaluating the overall presentation of the financial statements. We believe that our audits provide a reasonable basis for our opinion.
Critical Audit Matter
The critical audit matter communicated below is a matter arising from the current-period audit of the financial statements that was communicated or required to be communicated to the audit committee and that (1) relates to accounts or disclosures that are material to the financial statements and (2) involved our especially challenging, subjective, or complex judgments. The communication of a critical audit matter does not alter in any way our opinion on the financial statements, taken as a whole, and we are not, by communicating the critical audit matter below, providing a separate opinion on the critical audit matter or on the accounts or disclosures to which it relates.
Excess or Obsolete Inventory Reserve: Refer to Notes 1 and 4 to the financial statements
Critical Audit Matter Description
The Company evaluates inventory each reporting period for excess quantities and obsolescence, establishing reserves when necessary based upon historic usage, estimated future usage and age. Once recorded, these reserves are considered permanent adjustments to the carrying value of inventory. As of December 31, 2024, the Company has inventories of $284.8 million, net of excess quantities and obsolescence reserves.
We identified the reserve for excess quantities and obsolete inventory as a critical audit matter because of the significant estimates and assumptions management makes to quantify the reserve, including the determination of expected demand, especially when considering the vertically integrated nature of the Company's operations, as well as parts subject to technological obsolescence. This required a high degree of auditor judgment and an increased extent of effort when performing audit procedures to evaluate the policy and the reasonableness of assumptions including expected demand.
How the Critical Audit Matter Was Addressed in the Audit
Our audit procedures related to management’s judgments underlying the calculation of excess or obsolete inventory reserve, included the following, among others:
•We tested the effectiveness of controls over inventory, including those over the estimation of reserves for excess quantities and obsolescence.
•We evaluated the reasonableness of the Company's excess and obsolete reserve policy, considering historical experience and the underlying assumptions.
•We tested the calculation of the excess and obsolete reserve pursuant to the Company’s policy, including the completeness and accuracy of the data used in the calculation.
•We evaluated management’s ability to estimate future demand by comparing actual inventory usage to estimates made in prior years.
•We considered the existence of contradictory evidence based on consideration of internal communication to management and the board of directors, Company press releases, and analysts’ reports, as well as any changes within the business.
/s/ Deloitte & Touche LLP
Boston, Massachusetts
February 20, 2025
We have served as the Company's auditor since 1999.
IPG PHOTONICS CORPORATION
CONSOLIDATED BALANCE SHEETS | | | | | | | | | | | |
| December 31, |
| | 2024 | | 2023 |
| | (In thousands, except share and per share data) |
| ASSETS |
| Current assets: | | | |
| Cash and cash equivalents | $ | 620,040 | | | $ | 514,674 | |
| Short-term investments | 310,152 | | | 662,807 | |
| Accounts receivable, net | 171,131 | | | 219,053 | |
| Inventories | 284,780 | | | 453,874 | |
| Prepaid income taxes | 17,592 | | | 26,038 | |
| Prepaid expenses and other current assets | 27,300 | | | 38,208 | |
| | | |
| Total current assets | 1,430,995 | | | 1,914,654 | |
| Deferred income taxes, net | 115,031 | | | 88,788 | |
| Goodwill | 67,241 | | | 38,540 | |
| Intangible assets, net | 55,376 | | | 26,234 | |
| Property, plant and equipment, net | 588,375 | | | 602,257 | |
| Other assets | 32,246 | | | 28,425 | |
| Total assets | $ | 2,289,264 | | | $ | 2,698,898 | |
| LIABILITIES AND EQUITY |
| Current liabilities: | | | |
| | | |
| | | |
| | | |
| Accounts payable | $ | 35,385 | | | $ | 28,618 | |
| Accrued expenses and other liabilities | 152,048 | | | 181,350 | |
| | | |
| Income taxes payable | 17,586 | | | 4,893 | |
| Total current liabilities | 205,019 | | | 214,861 | |
| Other long-term liabilities and deferred income taxes | 59,774 | | | 68,652 | |
| | | |
| Total liabilities | 264,793 | | | 283,513 | |
| | | |
| Commitments and contingencies (Note 14) | | | |
| IPG Photonics Corporation equity: | | | |
| Common stock, $0.0001 par value, 175,000,000 shares authorized; 56,632,974 and 42,548,561 shares issued and outstanding, respectively, at December 31, 2024; 56,317,438 and 46,320,671 shares issued and outstanding, respectively, at December 31, 2023. | 6 | | | 6 | |
| Treasury stock, at cost, 14,084,413 and 9,996,767 shares held at December 31, 2024 and December 31, 2023, respectively. | (1,505,321) | | | (1,161,505) | |
| Additional paid-in capital | 1,035,285 | | | 994,020 | |
| Retained earnings | 2,613,868 | | | 2,795,394 | |
| Accumulated other comprehensive loss | (119,367) | | | (212,530) | |
| Total IPG Photonics Corporation stockholders' equity | 2,024,471 | | | 2,415,385 | |
| | | |
| | | |
| Total liabilities and equity | $ | 2,289,264 | | | $ | 2,698,898 | |
See notes to consolidated financial statements.
IPG PHOTONICS CORPORATION
CONSOLIDATED STATEMENTS OF OPERATIONS
| | | | | | | | | | | | | | | | | |
| | Year Ended December 31, |
| | 2024 | | 2023 | | 2022 |
| | (In thousands, except per share data) |
| Net sales | $ | 977,134 | | | $ | 1,287,439 | | | $ | 1,429,547 | |
| Cost of sales | 638,979 | | | 745,741 | | | 874,134 | |
| Gross profit | 338,155 | | | 541,698 | | | 555,413 | |
| Operating expenses: | | | | | |
| Sales and marketing | 89,582 | | | 85,679 | | | 76,643 | |
| Research and development | 109,783 | | | 98,704 | | | 116,114 | |
| General and administrative | 124,313 | | | 125,749 | | | 131,253 | |
| | | | | |
| Net loss (gain) from divestitures and sale of assets | 190,201 | | | — | | | (31,846) | |
| Impairment of long-lived assets | 27,006 | | | 1,237 | | | 79,949 | |
| Restructuring (recoveries) charges, net | — | | | (288) | | | 9,697 | |
| Loss (gain) on foreign exchange | 5,524 | | | (1,356) | | | 4,103 | |
| Total operating expenses | 546,409 | | | 309,725 | | | 385,913 | |
| Operating (loss) income | (208,254) | | | 231,973 | | | 169,500 | |
| Other income, net: | | | | | |
| Interest income, net | 45,467 | | | 41,735 | | | 12,620 | |
| Other income, net | 899 | | | 1,167 | | | 1,231 | |
| Total other income | 46,366 | | | 42,902 | | | 13,851 | |
| (Loss) income before provision for income taxes | (161,888) | | | 274,875 | | | 183,351 | |
| Provision for income taxes | 19,638 | | | 55,997 | | | 72,589 | |
| Net (loss) income | (181,526) | | | 218,878 | | | 110,762 | |
| Less: net income attributable to non-controlling interests | — | | | — | | | 853 | |
| Net (loss) income attributable to IPG Photonics Corporation common stockholders | $ | (181,526) | | | $ | 218,878 | | | $ | 109,909 | |
| Net (loss) income attributable to IPG Photonics Corporation per common share: | | | | | |
| Basic | $ | (4.09) | | | $ | 4.64 | | | $ | 2.17 | |
| Diluted | $ | (4.09) | | | $ | 4.63 | | | $ | 2.16 | |
| Weighted average shares outstanding: | | | | | |
| Basic | 44,336 | | | 47,154 | | | 50,761 | |
| Diluted | 44,336 | | | 47,320 | | | 50,925 | |
See notes to consolidated financial statements.
IPG PHOTONICS CORPORATION
CONSOLIDATED STATEMENTS OF COMPREHENSIVE (LOSS) INCOME | | | | | | | | | | | | | | | | | |
| | Year Ended December 31, |
| | 2024 | | 2023 | | 2022 |
| | (In thousands) |
| Net (loss) income | $ | (181,526) | | | $ | 218,878 | | | $ | 110,762 | |
| Other comprehensive income (loss), net of tax: | | | | | |
| Foreign currency translation adjustments and other | 93,163 | | | (7,854) | | | (14,838) | |
| | | | | |
| Unrealized (loss) gain on derivatives | — | | | (152) | | | 336 | |
| | | | | |
| | | | | |
| | | | | |
| Total other comprehensive income (loss) | 93,163 | | | (8,006) | | | (14,502) | |
| Comprehensive (loss) income | (88,363) | | | 210,872 | | | 96,260 | |
| Less: comprehensive income attributable to non-controlling interest | — | | | — | | | 924 | |
| Comprehensive (loss) income attributable to IPG Photonics Corporation | $ | (88,363) | | | $ | 210,872 | | | $ | 95,336 | |
See notes to consolidated financial statements.
IPG PHOTONICS CORPORATION
CONSOLIDATED STATEMENTS OF EQUITY | | | | | | | | | | | | | | | | | | | | | | | | | | | | | | | | | | | | | | | | | | | | | | | | | | | | | |
| Year Ended December 31, |
| Common Stock | | Treasury Stock | | Additional Paid In Capital | | Retained Earnings | | Accumulated Other Comprehensive (Loss) Income | | Non-
controlling Interest | | Total Stockholders' Equity |
| (In thousands, except share data) | Shares | | Amount | | Shares | | Amount | | | | | |
| Balance, January 1, 2022 | 53,010,265 | | | $ | 6 | | | (2,777,981) | | | $ | (438,503) | | | $ | 908,423 | | | $ | 2,466,607 | | | $ | (189,951) | | | $ | 639 | | | $ | 2,747,221 | |
| Vesting of RSUs and PSUs, net of shares withheld for taxes, and exercise of stock options | 167,193 | | | — | | | — | | | — | | | 693 | | | — | | | — | | | — | | | 693 | |
| Common stock issued under employee stock purchase plan | 62,233 | | | — | | | — | | | — | | | 4,890 | | | — | | | — | | | — | | | 4,890 | |
| Purchased common stock | (5,101,434) | | | — | | | (5,101,434) | | | (499,506) | | | — | | | — | | | — | | | — | | | (499,506) | |
| Stock-based compensation | — | | | — | | | — | | | — | | | 38,302 | | | — | | | — | | | — | | | 38,302 | |
| | | | | | | | | | | | | | | | | |
| | | | | | | | | | | | | | | | | |
| Net income | — | | | — | | | — | | | — | | | — | | | 109,909 | | | — | | | 853 | | | 110,762 | |
| Foreign currency translation adjustments and other | — | | | — | | | — | | | — | | | — | | | — | | | (14,909) | | | 71 | | | (14,838) | |
| Purchase of non-controlling interests | — | | | — | | | — | | | — | | | (937) | | | — | | | — | | | (1,563) | | | (2,500) | |
| Unrealized gain on derivatives, net of tax | — | | | — | | | — | | | — | | | — | | | — | | | 336 | | | — | | | 336 | |
| | | | | | | | | | | | | | | | | |
| | | | | | | | | | | | | | | | | |
| Balance, December 31, 2022 | 48,138,257 | | | $ | 6 | | | (7,879,415) | | | $ | (938,009) | | | $ | 951,371 | | | $ | 2,576,516 | | | $ | (204,524) | | | $ | — | | | $ | 2,385,360 | |
| Vesting of RSUs and PSUs, net of shares withheld for taxes, and exercise of stock options | 241,782 | | | — | | | — | | | — | | | (1,891) | | | — | | | — | | | — | | | (1,891) | |
| Common stock issued under employee stock purchase plan | 57,984 | | | — | | | — | | | — | | | 5,038 | | | — | | | — | | | — | | | 5,038 | |
| Purchased common stock | (2,117,352) | | | — | | | (2,117,352) | | | (223,496) | | | — | | | — | | | — | | | — | | | (223,496) | |
| Stock-based compensation | — | | | — | | | — | | | — | | | 39,502 | | | — | | | — | | | — | | | 39,502 | |
| | | | | | | | | | | | | | | | | |
| | | | | | | | | | | | | | | | | |
| Net income | — | | | — | | | — | | | — | | | — | | | 218,878 | | | — | | | — | | | 218,878 | |
| Foreign currency translation adjustments and other | — | | | — | | | — | | | — | | | — | | | — | | | (7,854) | | | — | | | (7,854) | |
| | | | | | | | | | | | | | | | | |
| Unrealized loss on derivatives, net of tax | — | | | — | | | — | | | — | | | — | | | — | | | (152) | | | — | | | (152) | |
| | | | | | | | | | | | | | | | | |
| | | | | | | | | | | | | | | | | |
| Balance, December 31, 2023 | 46,320,671 | | | $ | 6 | | | (9,996,767) | | | $ | (1,161,505) | | | $ | 994,020 | | | $ | 2,795,394 | | | $ | (212,530) | | | $ | — | | | $ | 2,415,385 | |
| Vesting of RSUs and PSUs, net of shares withheld for taxes, and exercise of stock options | 241,475 | | | — | | | — | | | — | | | (728) | | | — | | | — | | | — | | | (728) | |
| Common stock issued under employee stock purchase plan | 74,061 | | | — | | | — | | | — | | | 4,923 | | | — | | | — | | | — | | | 4,923 | |
| Purchased common stock | (4,087,646) | | | — | | | (4,087,646) | | | (343,816) | | | — | | | — | | | — | | | — | | | (343,816) | |
| Stock-based compensation | — | | | — | | | — | | | — | | | 37,070 | | | — | | | — | | | — | | | 37,070 | |
| | | | | | | | | | | | | | | | | |
| | | | | | | | | | | | | | | | | |
| | | | | | | | | | | | | | | | | |
| Net loss | — | | | — | | | — | | | — | | | — | | | (181,526) | | | — | | | — | | | (181,526) | |
| Foreign currency translation adjustments and other | — | | | — | | | — | | | — | | | — | | | — | | | 93,163 | | | — | | | 93,163 | |
| | | | | | | | | | | | | | | | | |
| | | | | | | | | | | | | | | | | |
| | | | | | | | | | | | | | | | | |
| Balance, December 31, 2024 | 42,548,561 | | | $ | 6 | | | (14,084,413) | | | $ | (1,505,321) | | | $ | 1,035,285 | | | $ | 2,613,868 | | | $ | (119,367) | | | $ | — | | | $ | 2,024,471 | |
See notes to consolidated financial statements.
IPG PHOTONICS CORPORATION
CONSOLIDATED STATEMENTS OF CASH FLOWS | | | | | | | | | | | | | | | | | |
| | Year Ended December 31, |
| | 2024 | | 2023 | | 2022 |
| | (In thousands) |
| Cash flows from operating activities: | | | | | |
| Net (loss) income | $ | (181,526) | | | $ | 218,878 | | | $ | 110,762 | |
| Adjustments to reconcile net income to net cash provided by (used in) operating activities: | | | | | |
| Depreciation and amortization | 61,443 | | | 69,621 | | | 90,564 | |
| Deferred income taxes | (25,660) | | | (13,789) | | | (27,575) | |
| Stock-based compensation | 37,070 | | | 39,502 | | | 38,302 | |
| | | | | |
| Impairment of long-lived assets and restructuring (recoveries), net | 27,006 | | | (486) | | | 79,949 | |
| Unrealized loss (gain) on foreign currency transactions | 1,161 | | | (4,334) | | | (592) | |
| Net loss (gain) from divestitures and sales of assets | 190,201 | | | — | | | (31,846) | |
| Provisions for inventory, warranty and bad debt | 90,377 | | | 61,058 | | | 153,652 | |
| Amortization of premium/discount on investments | (17,657) | | | (25,102) | | | (4,557) | |
| Other | 3,962 | | | 5,194 | | | 6,211 | |
| Changes in assets and liabilities that provided (used) cash, net of acquisitions: | | | | | |
| Accounts receivable | 46,827 | | | (10,395) | | | 34,100 | |
| Inventories | 47,725 | | | 1,823 | | | (189,013) | |
| Prepaid expenses and other current assets | 6,527 | | | (2,025) | | | 22,545 | |
| Accounts payable | (1,526) | | | (16,319) | | | (12,174) | |
| Accrued expenses and other liabilities | (37,355) | | | (44,693) | | | (43,547) | |
| Income and other taxes payable | (679) | | | 17,053 | | | (14,132) | |
| | | | | |
| Net cash provided by operating activities | 247,896 | | | 295,986 | | | 212,649 | |
| Cash flows from investing activities: | | | | | |
| Purchases of and deposits on property, plant and equipment | (98,524) | | | (110,483) | | | (110,141) | |
| | | | | |
| Proceeds from sales of property, plant and equipment | 28,578 | | | 31,241 | | | 26,862 | |
| Purchases of short-term investments | (713,151) | | | (1,232,863) | | | (1,117,022) | |
| Proceeds from sale of short-term investments | 1,083,464 | | | 1,073,993 | | | 1,446,355 | |
| Acquisitions of businesses, net of cash acquired | (66,738) | | | — | | | (2,000) | |
| Net cash (outflow) inflow from divestiture | (25,324) | | | — | | | 52,941 | |
| Other | 427 | | | 558 | | | (43) | |
| Net cash provided (used in) by investing activities | 208,732 | | | (237,554) | | | 296,952 | |
| Cash flows from financing activities: | | | | | |
| | | | | |
| | | | | |
| | | | | |
| | | | | |
| Principal payments on long-term borrowings | — | | | (16,031) | | | (18,126) | |
| Proceeds from issuance of common stock under employee stock option and purchase plans less payments for taxes related to net share settlement of equity awards | 4,195 | | | 3,147 | | | 5,583 | |
| | | | | |
| | | | | |
| Purchase of treasury stock, at cost | (343,816) | | | (223,496) | | | (499,506) | |
| | | | | |
| Purchase of non-controlling interests | — | | | — | | | (2,500) | |
| Net cash used in financing activities | (339,621) | | | (236,380) | | | (514,549) | |
| Effect of changes in exchange rates on cash and cash equivalents | (11,641) | | | (5,587) | | | (5,948) | |
| Net increase (decrease) in cash and cash equivalents | 105,366 | | | (183,535) | | | (10,896) | |
| Cash and cash equivalents — Beginning of year | 514,674 | | | 698,209 | | | 709,105 | |
| Cash and cash equivalents — End of year | $ | 620,040 | | | $ | 514,674 | | | $ | 698,209 | |
| Supplemental disclosure of cash flow information: | | | | | |
| Cash paid for interest | $ | 277 | | | $ | 1,284 | | | $ | 3,214 | |
| Cash paid for income taxes | $ | 40,632 | | | $ | 62,916 | | | $ | 113,200 | |
| Non-cash transactions: | | | | | |
| Demonstration units transferred from inventory to other assets | $ | 6,720 | | | $ | 5,404 | | | $ | 5,178 | |
| Inventory transferred to machinery and equipment | $ | 3,158 | | | $ | 2,767 | | | $ | 4,172 | |
| Additions to property, plant and equipment included in accounts payable | $ | 5,971 | | | $ | 3,251 | | | $ | 1,073 | |
| Leased assets obtained in exchange for new operating lease liabilities | $ | 6,195 | | | $ | 4,457 | | | $ | 7,566 | |
| | | | | |
| | | | | |
| | | | | |
| | | | | |
| | | | | |
See notes to consolidated financial statements.
IPG PHOTONICS CORPORATION
NOTES TO CONSOLIDATED FINANCIAL STATEMENTS
(In thousands, except share and per share data)
1. NATURE OF BUSINESS AND SUMMARY OF SIGNIFICANT ACCOUNTING POLICIES
Nature of Business — IPG Photonics Corporation (the "Company" or "IPG") develops, manufactures and sells high-performance fiber lasers, fiber amplifiers, and diode lasers that are used for diverse applications, primarily in materials processing. The Company was incorporated as a Delaware corporation in December 1998. Its world headquarters is located in Marlborough, Massachusetts. It also has facilities and sales offices elsewhere in North and South America, Europe and Asia.
Principles of Consolidation — The accompanying financial statements include the accounts of the Company and its majority-owned subsidiaries. All intercompany accounts and transactions have been eliminated.
Use of Estimates — The preparation of financial statements in conformity with accounting principles generally accepted in the United States of America requires management to make estimates and assumptions that affect the reported amounts of assets and liabilities, disclosure of contingent assets and liabilities at the date of the financial statements and the reported amounts of revenue and expenses during the reporting period. The Company bases its estimates on historical experience and on various other assumptions that are believed to be reasonable under the circumstances. Actual results could differ from those estimates.
Foreign Currency — The financial information for entities outside the United States is measured using local currencies as the functional currency. Assets and liabilities are translated into U.S. dollars at the exchange rate in effect on the respective balance sheet dates. Income and expenses are translated into U.S. dollars based on the average rate of exchange for the corresponding period. Exchange rate differences resulting from translation adjustments are accounted for directly as a component of accumulated other comprehensive (loss) income.
Cash and Cash Equivalents and Short-Term Investments — Cash and cash equivalents consist primarily of highly liquid investments, such as money market fund deposits, commercial paper, U.S. government and government agency, term deposits, and corporate bonds with maturities of three months or less at the date of purchase with insignificant interest rate risk. Short-term investments consist of liquid investments including commercial paper, corporate bonds, U.S. government and government agency notes and term deposits with original maturities of greater than three months but less than one year with insignificant interest rate risk. Fixed-term securities included in cash equivalents and short-term investments are held-to-maturity and accounted for at amortized cost.
Accounts Receivable and Allowance for Credit Losses — Accounts receivable include $26,361 and $17,313 of bank acceptance drafts at December 31, 2024 and 2023, respectively. Bank acceptance drafts are bank guarantees of payment on specified dates. The weighted average maturity of these bank acceptance drafts is approximately 101 days. The Company maintains an allowance for credit losses to provide for the estimated amount of accounts receivable that will not be collected. The allowance is based upon an estimate of expected credit losses over the life of outstanding receivables. The estimate involves an assessment of customer creditworthiness, historical payment experience, an assumption of future expected credit losses, and the age of outstanding receivables.
Activity related to the allowance for credit losses was as follows:
| | | | | | | | | | | | | | | | | | | | |
| | 2024 | | 2023 | | 2022 |
| Balance at January 1 | | $ | 1,763 | | | $ | 2,639 | | | $ | 2,108 | |
| Provision for credit losses, net of recoveries | | 1,370 | | | 36 | | | 712 | |
| Uncollectible accounts written off | | (588) | | | (840) | | | (125) | |
| Foreign currency translation | | (83) | | | (72) | | | (56) | |
| Balance at December 31 | | $ | 2,462 | | | $ | 1,763 | | | $ | 2,639 | |
Inventories — Inventories are stated at the lower of cost and net realizable value on a first-in, first-out basis. Inventories include parts and components that may be specialized in nature and subject to obsolescence. The Company periodically reviews the quantities and carrying values of inventories to assess whether the inventories are recoverable. The costs associated with provisions for excess quantities, technological obsolescence, or scrap related to out of specification components are charged to cost of sales as incurred.
Business Combination — The fair value of the consideration exchanged in a business combination is allocated to tangible assets and identifiable intangible assets acquired and liabilities assumed at acquisition date fair value. Goodwill is measured as the excess of the consideration transferred over the net fair value of identifiable assets acquired and liabilities assumed. The
IPG PHOTONICS CORPORATION
NOTES TO CONSOLIDATED FINANCIAL STATEMENTS
(In thousands, except share and per share data)
accounting for an acquisition involves a considerable amount of judgment and estimation. Cost, income, market or a combination of approaches may be used to establish the fair value of consideration exchanged, assets acquired, and liabilities assumed, depending on the nature of those items. The valuation approach is determined in accordance with generally accepted valuation methods. Key areas of estimation and judgment may include the selection of valuation approaches, cost of capital, market characteristics, cost structure, impacts of synergies, and estimates of terminal value, among other factors.
The Company's estimates and assumptions used as part of the purchase price allocation process are inherently uncertain and subject to refinement. During the measurement period, which may be up to one year from the acquisition date, the Company may record adjustments to the assets acquired and liabilities assumed, with a corresponding offset to goodwill. Upon conclusion of the measurement period, or final determination of the value of the assets acquired and liabilities assumed, whichever comes first, any subsequent adjustments are recorded to results of operations.
Goodwill — Goodwill is the amount by which the cost of the acquired net assets in a business acquisition exceeded the fair values of the net identifiable assets on the date of purchase. Goodwill is assessed for impairment at least annually, on a reporting unit basis, or more frequently when events and circumstances occur indicating that the recorded goodwill may be impaired. The process of evaluating the potential impairment of goodwill is subjective and requires significant judgment at many points during the analysis. If the carrying value of a reporting unit exceeds its fair value, the implied fair value of goodwill is compared with the carrying value of goodwill. If the carrying value of goodwill exceeds the implied fair value, an impairment loss is recorded in an amount equal to that excess. The results of the goodwill assessments for the years ended December 31, 2024 and 2023 are discussed in Note 8, "Goodwill and Intangible Assets."
Intangible Assets — Intangible assets result from the Company's various business acquisitions. Intangible assets are reported at cost, less accumulated amortization, and are amortized on a straight-line basis either over their estimated useful lives of one year to thirteen years or over the period the economic benefits of the intangible asset are consumed.
Property, Plant and Equipment — Property, plant and equipment are stated at cost, less accumulated depreciation. Depreciation is determined using the straight-line method based on the estimated useful lives of the related assets. In the case of leasehold improvements, the estimated useful lives of the related assets do not exceed the remaining terms of the corresponding leases. The following table presents the assigned economic useful lives of property, plant and equipment:
| | | | | | | | | | | |
| | | |
| Category | | Economic Useful Life |
| Buildings | | 20-30 years |
| Machinery and equipment | | 5-10 years |
| Office furniture and fixtures | | 5-7 years |
Expenditures for maintenance and repairs are charged to operating expenses when they are incurred. The estimated useful life of certain machinery and equipment was increased from 7 years to 10 years based upon the Company's experience of historical usage. The change in estimate did not have a material effect in 2024.
Long-Lived Assets — Long-lived assets, which consist primarily of property, plant and equipment, identifiable intangible assets and right-of-use ("ROU") assets, are reviewed by management for impairment whenever events or changes in circumstances indicate that the carrying amount may not be recoverable. When undiscounted expected future cash flows are less than the carrying value, an impairment loss is recorded equal to the amount by which the carrying value exceeds the fair value of assets. The impact of the long-lived assets impairment for the years ended December 31, 2024 and 2023 are discussed in Note 5, "Divestiture, Impairment of Long-lived Assets and Sale of Assets."
Included in other long-term assets is certain demonstration equipment. The demonstration equipment is amortized over the respective estimated economic lives, generally 3 years. The carrying value of the demonstration equipment totaled $5,480 and $3,726 at December 31, 2024 and 2023, respectively. Amortization expense of demonstration equipment for the years ended December 31, 2024, 2023 and 2022, was $3,111, $3,480 and $2,387, respectively.
Authorized Capital — The Company has authorized capital stock consisting of 175,000,000 shares of common stock, par value $0.0001 per share, and 5,000,000 shares of preferred stock, par value $0.0001 per share. There are no shares of preferred stock outstanding as of December 31, 2024.
Revenue Recognition — Revenue is recognized when transfer of control to the customer occurs in an amount reflecting the consideration that the Company expects to be entitled. In order to achieve this core principle, the Company applies the
IPG PHOTONICS CORPORATION
NOTES TO CONSOLIDATED FINANCIAL STATEMENTS
(In thousands, except share and per share data)
following five step approach: (1) identify the contract with a customer, (2) identify the performance obligations in the contract, (3) determine the transaction price, (4) allocate the transaction price to the performance obligations in the contract, and (5) recognize revenue when a performance obligation is satisfied.
The Company considers customer purchase orders, which in some cases are governed by master sales agreements, to be contracts with a customer. As part of its consideration of the contract, the Company evaluates certain factors including the customer's ability to pay (or credit risk). For each contract, the Company considers the promise to transfer products, each of which is identified as a distinct performance obligation. In determining the transaction price, the Company evaluates whether the price is subject to refund or adjustment to determine the net consideration to which the Company expects to be entitled. As the Company's standard payment terms are less than one year, the Company has elected the practical expedient under ASC 606-10-32-18 to not assess whether a contract has a significant financing component. The Company allocates the transaction price to each distinct product based on its relative standalone selling price.
The Company often receives orders with the customer's schedule of delivery dates for products that may extend across several reporting periods. The Company allocates the transaction price of the contract to each delivery based on the product standalone selling price. As scheduled delivery dates are generally within one year, under the optional exemption provided by ASC 606-10-50-14 revenues allocated to future shipments of partially completed contracts are not disclosed.
Rights of return are not generally included in customer contracts. Returns are infrequent and are recorded as a reduction of revenue.
In certain subsidiaries the Company provides sales commissions to sales representatives based on sales volume. The Company has determined that the incentive portion of its sales commissions qualify as contract costs. The Company has elected the practical expedient in ASC 340-40-25-4 to expense sales commissions when incurred as the amortization period of the asset that would otherwise have been recognized is one year or less.
Revenue Recognition at a Point in Time — Revenues recognized at a point in time consist primarily of product, installation and service sales. The Company recognizes revenue for laser and spare part sales following the transfer of control of such products to the customer, which typically occurs upon shipment or delivery depending on the terms of the underlying contracts. Installation revenue is recognized upon completion of the installation service, which typically occurs within 90 days of delivery. When sales contracts contain multiple performance obligations, such as the shipment or delivery of products and installation, the Company allocates the transaction price to each performance obligation identified in the contract based on relative standalone selling prices and recognizes the related revenue as control of each individual product or service is transferred to the customer, in satisfaction of the corresponding performance obligations.
Revenue Recognition over Time — The Company offers extended warranty agreements, which extend the standard warranty periods. Extended warranties are sold separately from products and represent a distinct performance obligation. Revenue related to the performance obligation for extended warranties is recognized over time as the customer simultaneously receives and consumes the benefits provided by the Company. The customer receives the assurance that the product will operate in accordance with agreed-upon specifications evenly during the extended warranty period regardless of whether they make a claim during that period, and therefore, revenue at time of sale is deferred and recognized over the time period of the extended warranty period.
The Company enters into contracts to sell customized large scale materials processing systems through its subsidiary Genesis Systems Group, LLC, for which revenue is generally recognized over time, depending on the terms of the contract. Recognizing revenue over time for these contracts is based on the Company’s judgment that the customized large scale materials processing systems do not have an alternative use and the Company has an enforceable right to payment for performance completed to date.
The determination of the revenue to be recognized in a given period for performance obligations over time is based on the input method. The Company generally uses the total cost-to-cost input method of progress because it best depicts the transfer of control to the customer that occurs as costs are incurred. Under the cost-to-cost method, the extent of progress towards completion is measured based on the proportion of costs incurred to date to the total estimated costs at completion of the performance obligation.
Customer Deposits and Deferred Revenue — When the Company receives consideration from a customer or such consideration is unconditionally due prior to transferring goods or services under the terms of a sales contract, the Company
IPG PHOTONICS CORPORATION
NOTES TO CONSOLIDATED FINANCIAL STATEMENTS
(In thousands, except share and per share data)
records customer deposits or deferred revenue, which represent contract liabilities. The Company recognizes deferred revenue as net sales after control of the goods or services has been transferred to the customer and all revenue recognition criteria are met.
Warranties — The Company typically provides one to five-year warranties on lasers and amplifiers. Warranties are limited and provide that the product meets specifications and is free from defects in materials and workmanship. Most of the Company's sales offices provide support to customers in their respective geographic areas. The Company estimates the warranty accrual considering past claims experience, the number of units still covered by warranty and the average life of the remaining warranty period. The warranty accrual has generally been sufficient to cover product warranty repair and replacement costs.
Stock-based Compensation — The Company accounts for stock-based compensation expense using the fair value of the awards granted. The Company issues equity incentive awards in the form of time-based restricted stock units ("RSUs") and performance-based restricted stock units ("PSUs"). The fair value for RSUs is based on the closing share price of the Company's common stock on the date of grant. PSUs are aligned to specified performance targets such as financial metrics or the relative return of the Company's common stock compared to an index ("TSR PSUs"). The fair value of PSUs aligned to specified financial performance metrics is determined based on the number of units expected to vest upon achievement of the performance conditions. The fair value for TSR PSUs is based on a Monte Carlo simulation model. The Company recognizes stock-based compensation as an expense on a straight-line basis, over the requisite service period. The Company accounts for forfeitures as they occur.
The Company has an employee stock purchase plan ("ESPP") offered to its U.S. and German employees. The Company uses the Black-Scholes model to calculate the purchase date fair value of the shares issued under the employee stock purchase plan and recognize expense related to shares purchased ratably over the offering period. The description of the Company's stock-based compensation plans and the assumptions it uses to calculate the fair value of stock-based compensation is described in Note 15, "Stock-based Compensation."
Advertising Expense — The cost of advertising is expensed as incurred. The Company conducts substantially all of its sales and marketing efforts through trade shows, professional and technical conferences, direct sales and the Company's website. The Company's advertising costs were not material for the periods presented.
Research and Development — Research and development costs are expensed as incurred.
Restructuring — The Company records charges associated with approved restructuring plans to reorganize operations, to remove redundant headcount and infrastructure associated with business acquisitions or to improve the efficiency of business processes. Restructuring charges can include severance costs to eliminate a specific number of positions, infrastructure charges to vacate facilities and consolidate operations and contract cancellation costs. The Company records restructuring charges when they are probable and estimable. The Company accrues for severance and other employee separation costs under these plans when the plan is communicated to employees and an amount per employee can be reasonably estimated either by the communicated terms, or by legal requirements, if applicable. The results of a restructuring program completed during the year ended December 31, 2023 are discussed in Note 6, "Restructuring."
Income Taxes — Deferred tax assets and liabilities are recognized for the future tax consequences of temporary differences between the financial statement carrying amounts and the tax basis of assets and liabilities and net operating loss and credit carryforwards. These differences are valued using enacted rates in effect when those differences are expected to reverse. Valuation allowances are provided against deferred tax assets that are not deemed to be recoverable. The Company recognizes tax positions that are more likely than not to be sustained upon examination by relevant tax authorities. The tax positions are measured at the greatest amount of tax benefit that is more than 50 percent likely to be realized upon ultimate settlement.
The Company provides reserves for potential payments of tax to various tax authorities related to uncertain tax positions and other issues. The reserves are based on a determination of whether a tax benefit claimed in its tax filings is more likely than not to be realized following the resolution of any potential tax audits related to the tax benefit, assuming that the matter in question will be reviewed by the tax authorities.
Concentration of Credit Risk — Financial instruments that potentially subject the Company to credit risk consist primarily of cash and cash equivalents, short-term investments and accounts receivable. The Company maintains substantially all of its cash and cash equivalents and short-term investments in various financial institutions, which it believes to be high-
IPG PHOTONICS CORPORATION
NOTES TO CONSOLIDATED FINANCIAL STATEMENTS
(In thousands, except share and per share data)
credit quality financial institutions. The Company grants credit to customers in the ordinary course of business and provides a reserve for potential credit losses. Such losses historically have been within management's expectations.
One of the Company's customers accounted for 12% and 14% of the Company's net accounts receivable as of December 31, 2024 and 2023, respectively. The Company has historically depended on a few customers for a significant percentage of its annual net sales. The composition of this group can change from year to year. Net sales derived from the Company's five largest customers as a percentage of its annual net sales were 13%, 13% and 15% in 2024, 2023 and 2022, respectively.
Comprehensive (Loss) Income — Comprehensive income or loss includes charges and credits to equity that are not the result of transactions with stockholders. Included within comprehensive income or loss is the cumulative foreign currency translation adjustment, and unrealized gains or losses on derivatives. These adjustments are accumulated within the Consolidated Statements of Comprehensive (Loss) Income.
Total components of accumulated other comprehensive loss were as follows:
| | | | | | | | | | | | | | | | | | | | | | |
| | Foreign currency translation adjustments and other | | Unrealized (loss) gain on derivatives, net of tax | | | | Total |
| Balance, January 1, 2022 | | $ | (189,767) | | | $ | (184) | | | | | $ | (189,951) | |
| Other comprehensive (loss) income, net of tax: | | | | | | | | |
| Foreign currency translation adjustments and other before reclassification, net of tax of $156 | | (15,117) | | | — | | | | | (15,117) | |
| Reclassification for foreign currency translation adjustments and other included in net income | | 208 | | | — | | | | | 208 | |
| Unrealized gain on derivatives, net of tax of $104 | | — | | | 336 | | | | | 336 | |
| Total other comprehensive (loss) income | | (14,909) | | | 336 | | | | | (14,573) | |
| Balance, December 31, 2022 | | $ | (204,676) | | | $ | 152 | | | | | $ | (204,524) | |
| Other comprehensive loss, net of tax: | | | | | | | | |
| Foreign currency translation adjustments and other before reclassification, net of tax of $151 | | (7,854) | | | — | | | | | (7,854) | |
| Unrealized (loss) on derivatives, net of tax benefit of $46 | | — | | | (152) | | | | | (152) | |
| Total other comprehensive loss | | (7,854) | | | (152) | | | | | (8,006) | |
| Balance, December 31, 2023 | | $ | (212,530) | | | $ | — | | | | | $ | (212,530) | |
| Other comprehensive loss, net of tax: | | | | | | | | |
| Foreign currency translation adjustments and other before reclassification, net of tax of $161 | | (43,507) | | | — | | | | | (43,507) | |
| | | | | | | | |
| Reclassification for foreign currency translation adjustments related to the divestiture of Russian operations to net loss, net of tax expense of $1,324 | | 136,670 | | | — | | | | | 136,670 | |
| Total other comprehensive income | | 93,163 | | | — | | | | | 93,163 | |
| Balance, December 31, 2024 | | $ | (119,367) | | | $ | — | | | | | $ | (119,367) | |
Derivative Instruments — The Company's primary market exposures are to interest rates and foreign exchange rates. The Company from time to time may use certain derivative financial instruments to help manage these exposures. The Company executes these instruments with financial institutions it judges to be credit-worthy. The Company does not hold or issue derivative financial instruments for trading or speculative purposes. The Company recognizes all derivative financial instruments as either assets or liabilities at fair value in the Consolidated Balance Sheets.
(Losses) Earnings Per Share — Basic net (loss) income per common share is computed by dividing net income attributable to common shareholders of the Company by the weighted-average number of common shares outstanding during the reporting period. Diluted net income per common share is computed similarly to basic net income per common share,
IPG PHOTONICS CORPORATION
NOTES TO CONSOLIDATED FINANCIAL STATEMENTS
(In thousands, except share and per share data)
except that it includes the potential dilution that could occur if dilutive securities were exercised. Information about potentially dilutive and antidilutive shares for the reporting period is provided in Note 18, "Net (Loss) Income Attributable to IPG Photonics Corporation Per Share."
Leases — The Company determines if an arrangement is a lease at inception. Operating leases are included in other assets, accrued expenses and other liabilities, and other long-term liabilities and deferred income taxes on the Company's Consolidated Balance Sheets.
ROU assets and lease liabilities are recognized based on the present value of the future minimum lease payments over the lease term at commencement date. As most of the Company's leases do not provide an implicit rate, IPG uses its incremental borrowing rate based on the information available at commencement date in determining the present value of future payments. The ROU assets include any lease payments made and initial direct costs incurred and exclude lease incentives. Lease terms may include options to extend or terminate the lease when it is reasonably certain that the Company will exercise that option. Lease expense for minimum lease payments is recognized on a straight-line basis over the lease term. Leases with an initial term of 12 months or less are not recorded on the balance sheet; the Company recognizes lease expense for these leases on a straight-line basis over the lease term. The Company has lease agreements with lease and non-lease components, which are accounted for as a single lease component.
Recent Accounting Pronouncements
Adopted Pronouncements — In November 2023, the FASB issued ASU No. 2023-07, "Segment Reporting (Topic 280): Improvements to Reportable Segment Disclosures" ("ASU 2023-07"), which improves reportable segment disclosure requirements, primarily through enhanced disclosures about significant segment expenses on an annual and interim basis. Under the new guidance an entity is required to disclose the title and position of the chief operating decision maker ("CODM") and an explanation of how the CODM uses the reported measure(s) of segment profit or loss in assessing segment performance and deciding how to allocate resources. The ASU also requires that an entity that has a single reportable segment provide all the disclosures required by this ASU and all existing segment disclosures in Topic 280. ASU 2023-07 is effective for fiscal years beginning after December 15, 2023, and interim periods within fiscal years beginning after December 15, 2024. The Company has adopted ASU 2023-07. Refer to Note 19, "Segment Reporting."
Pronouncements Currently Under Evaluation — In December 2023, the FASB issued ASU No. 2023-09, "Income Taxes (Topic 740): Improvements to Income Tax Disclosures" ("ASU 2023-07"), which requires an entity on an annual basis to disclose specific categories in the rate reconciliation and provide additional information for reconciling items that meet a quantitative threshold. The guidance also requires an entity to disclose on an annual basis information about income taxes paid. ASU 2023-07 is effective for fiscal years beginning after December 15, 2024. The Company is evaluating the impact of this ASU and does not expect this standard will have a material impact on the Company's disclosures.
In November 2024, the FASB issued ASU No. 2024-03, "Income Statement - Reporting Comprehensive Income - Expense Aggregation Disclosures (Subtopic 220-40)" ("ASU 2024-03"), which requires more detailed disaggregated disclosure of income statement expenses. ASU 2024-03 is effective for fiscal years beginning after December 15, 2026, and interim periods beginning after December 15, 2027. The Company is evaluating the impact of this ASU and does not expect this standard will have a material impact.
2. REVENUE FROM CONTRACTS WITH CUSTOMERS
Sales are derived from products for different applications: fiber lasers, diode lasers, systems and accessories for materials processing, fiber lasers, amplifiers and diodes for advanced applications, and fiber lasers, systems and fibers for medical applications.
IPG PHOTONICS CORPORATION
NOTES TO CONSOLIDATED FINANCIAL STATEMENTS
(In thousands, except share and per share data)
The following tables represent a disaggregation of revenue from contracts with customers for the years ended December 31, 2024, 2023 and 2022:
| | | | | | | | | | | | | | | | | |
| Year Ended December 31, |
| 2024 | | 2023 | | 2022 |
| Sales by Application | | | | | |
| Materials processing | $ | 857,336 | | | $ | 1,152,804 | | | $ | 1,291,262 | |
| Other applications | 119,798 | | | 134,635 | | | 138,285 | |
| Total | $ | 977,134 | | | $ | 1,287,439 | | | $ | 1,429,547 | |
| | | | | | | | | | | | | | | | | |
| |
| | | | | |
| Sales by Product | | | | | |
| High Power Continuous Wave ("CW") Lasers | $ | 332,743 | | | $ | 524,981 | | | $ | 613,734 | |
| Medium Power CW Lasers | 63,685 | | | 71,672 | | | 77,079 | |
| Pulsed Lasers | 146,759 | | | 185,581 | | | 250,677 | |
| Quasi-Continuous Wave ("QCW") Lasers | 48,016 | | | 48,648 | | | 50,212 | |
| Laser and Non-Laser Systems | 139,145 | | | 161,177 | | | 153,471 | |
| Other Revenue including Other Lasers, Amplifiers, Service, Parts, Accessories and Change in Deferred Revenue | 246,786 | | | 295,380 | | | 284,374 | |
| Total | $ | 977,134 | | | $ | 1,287,439 | | | $ | 1,429,547 | |
| | | | | | | | | | | | | | | | | |
| |
| | | | | |
| Sales by Geography | | | | | |
| North America | $ | 258,888 | | | $ | 313,986 | | | $ | 338,713 | |
| Europe: | | | | | |
| Germany | 87,800 | | | 88,026 | | | 85,491 | |
| Other Europe | 197,152 | | | 291,336 | | | 294,481 | |
| Asia: | | | | | |
| China | 244,996 | | | 355,321 | | | 479,926 | |
| Japan | 62,352 | | | 72,333 | | | 57,865 | |
| Other | 113,232 | | | 142,378 | | | 152,373 | |
| Rest of World | 12,714 | | | 24,059 | | | 20,698 | |
| Total | $ | 977,134 | | | $ | 1,287,439 | | | $ | 1,429,547 | |
| | | | | | | | | | | | | | | | | |
| Timing of Revenue Recognition | | | | | |
| Goods and services transferred at a point in time | $ | 942,209 | | | $ | 1,239,551 | | | $ | 1,377,996 | |
| Goods and services transferred over time | 34,925 | | | 47,888 | | | 51,551 | |
| Total | $ | 977,134 | | | $ | 1,287,439 | | | $ | 1,429,547 | |
The Company recognizes revenue over time on contracts for the sale of large scale materials processing systems. The timing of customer payments on these contracts generally differs from the timing of revenue recognized. If revenue recognized exceeds customer payments, a contract asset is recorded and if customer payments exceed revenue recognized, a contract liability is recorded. Contract assets are included within prepaid expense and other current assets on the Consolidated Balance Sheets. Contract liabilities are included within accrued expenses and other current liabilities on the Consolidated Balance Sheets. Certain deferred revenues related to extended warranties in excess of one year from the balance sheet date are included within other long-term liabilities and deferred income taxes on the Consolidated Balance Sheets.
IPG PHOTONICS CORPORATION
NOTES TO CONSOLIDATED FINANCIAL STATEMENTS
(In thousands, except share and per share data)
The following table reflects the changes in the Company's contract assets and liabilities for the years ended December 31, 2024 and 2023:
| | | | | | | | | | | | | | | | | | | | | | | | | | | | | | | | | | | |
| December 31, | | January 1, | | | | December 31, | | January 1, | | |
| 2024 | | 2024 | | Change | | 2023 | | 2023 | | Change |
| Contract assets | | | | | | | | | | | |
| Contract assets | $ | 4,737 | | | $ | 9,383 | | | $ | (4,646) | | | $ | 9,383 | | | $ | 8,620 | | | $ | 763 | |
| Contract liabilities | | | | | | | | | | | |
| Contract liabilities - current | 56,454 | | | 69,219 | | | (12,765) | | | 69,219 | | | 80,068 | | | (10,849) | |
| Contract liabilities - long-term | 2,882 | | | 2,851 | | | 31 | | | 2,851 | | | 3,142 | | | (291) | |
During the years ended December 31, 2024 and 2023, the Company recognized revenue of $54,105 and $62,247, respectively, that was included in the contract liabilities at the beginning of the period.
The following table represents the Company's remaining performance obligations from contracts that are recognized over time as of December 31, 2024:
| | | | | | | | | | | | | | | | | | | | | | | | | | | | | | | | | | | | | | | | | | | | |
| | Remaining Performance Obligations |
| | 2025 | | 2026 | | 2027 | | 2028 | | 2029 | | Thereafter | | Total |
| Revenue expected to be recognized for extended warranty agreements | | $ | 2,542 | | | $ | 1,410 | | | $ | 947 | | | $ | 355 | | | $ | 132 | | | $ | 38 | | | $ | 5,424 | |
| Revenue to be earned over time from contracts to sell large scale materials processing systems | | 11,425 | | | 1,238 | | | — | | | — | | | — | | | — | | | 12,663 | |
| | | | | | | | | | | | | | |
| Total | | $ | 13,967 | | | $ | 2,648 | | | $ | 947 | | | $ | 355 | | | $ | 132 | | | $ | 38 | | | $ | 18,087 | |
3. FAIR VALUE MEASUREMENTS
The Company's financial instruments consisted of cash equivalents, short-term investments, accounts receivable, accounts payable, and revolving lines of credit.
The valuation techniques used to measure fair value are based upon observable and unobservable inputs. Observable inputs reflect market data obtained from independent sources, while unobservable inputs reflect internal market assumptions. These two types of inputs create the following fair value hierarchy: Level 1, defined as observable inputs such as quoted prices for identical instruments in active markets; Level 2, defined as inputs other than quoted prices in active markets that are either directly or indirectly observable; and Level 3, defined as unobservable inputs for which little or no market data exists, therefore requiring an entity to develop its own assumptions. The Company classifies its financial instruments according to the prescribed criteria.
The carrying amounts of money market fund deposits, cash equivalent term deposits, accounts receivable, and accounts payable and revolving lines of credit are considered reasonable estimates of their fair market value due to the short maturity of most of these instruments or as a result of the competitive market interest rates, which have been negotiated. The fair value of the Company's commercial paper, U.S. Treasury and agency obligations, term deposits, and corporate bonds are based on Level 2 inputs.
IPG PHOTONICS CORPORATION
NOTES TO CONSOLIDATED FINANCIAL STATEMENTS
(In thousands, except share and per share data)
The following table presents fair value information related to the Company's assets and liabilities measured at amortized cost on the Consolidated Balance Sheets:
| | | | | | | | | | | | | | | | | | | | | | | |
| Fair Value Measurements at December 31, 2024 |
| | Total | | Level 1 | | Level 2 | | Level 3 |
| Assets | | | | | | | |
| Cash equivalents: | | | | | | | |
| Money market fund deposits | $ | 77,855 | | | $ | 77,855 | | | $ | — | | | $ | — | |
| Commercial paper | 163,589 | | | — | | | 163,589 | | | — | |
| U.S. Treasury and agency obligations | 47,770 | | | — | | | 47,770 | | | — | |
| | | | | | | |
| Term deposits | 45,079 | | | — | | | 45,079 | | | — | |
| Corporate bonds | 15,777 | | | — | | | 15,777 | | | — | |
| Total cash equivalents | 350,070 | | | 77,855 | | | 272,215 | | | — | |
| Short-term investments: | | | | | | | |
| Commercial paper | 219,355 | | | — | | | 219,355 | | | — | |
| Corporate bonds | 60,306 | | | — | | | 60,306 | | | — | |
| U.S. Treasury and agency obligations | 27,348 | | | — | | | 27,348 | | | — | |
| | | | | | | |
| Term deposits | 3,048 | | | — | | | 3,048 | | | — | |
| | | | | | | |
| Total short-term investments | 310,057 | | | — | | | 310,057 | | | — | |
| Total | $ | 660,127 | | | $ | 77,855 | | | $ | 582,272 | | | $ | — | |
| | | | | | | | | | | | | | | | | | | | | | | |
| | Fair Value Measurements at December 31, 2023 |
| | Total | | Level 1 | | Level 2 | | Level 3 |
| Assets | | | | | | | |
| Cash equivalents: | | | | | | | |
| Money market fund deposits | $ | 171,632 | | | $ | 171,632 | | | $ | — | | | $ | — | |
| Term deposits | 83,965 | | | — | | | 83,965 | | | — | |
| Corporate bonds | 23,516 | | | — | | | 23,516 | | | — | |
| Commercial paper | 6,369 | | | — | | | 6,369 | | | — | |
| Total cash equivalents | 285,482 | | | 171,632 | | | 113,850 | | | — | |
| | | | | | | |
| Short-term investments: | | | | | | | |
| Commercial paper | 244,571 | | | — | | | 244,571 | | | — | |
| Corporate bonds | 243,915 | | | — | | | 243,915 | | | — | |
| U.S. Treasury and agency obligations | 171,316 | | | — | | | 171,316 | | | — | |
| | | | | | | |
| Term deposits | 3,009 | | | — | | | 3,009 | | | — | |
| | | | | | | |
| Total short-term investments | 662,811 | | | — | | | 662,811 | | | — | |
| Total | $ | 948,293 | | | $ | 171,632 | | | $ | 776,661 | | | $ | — | |
There were no impairments for the investments considered held-to-maturity at December 31, 2024 and December 31, 2023. There were no current expected credit loss allowances for the investments considered held-to-maturity at December 31, 2024 and 2023. The Company holds highly-rated held-to-maturity instruments that are within one year of maturity.
The following table presents the effective maturity dates of debt investments, which are held-to-maturity:
| | | | | | | | | | | | | | | | | | | | | | | |
| December 31, 2024 | | December 31, 2023 |
| Book Value | | Fair Value | | Book Value | | Fair Value |
| Investment maturity | | | | | | | |
| | | | | | | |
| Less than 1 year | $ | 310,152 | | | $ | 310,057 | | | $ | 662,807 | | | $ | 662,811 | |
| | | | | | | |
| | | | | | | |
| | | | | | | |
| | | | | | | |
IPG PHOTONICS CORPORATION
NOTES TO CONSOLIDATED FINANCIAL STATEMENTS
(In thousands, except share and per share data)
4. INVENTORIES
Inventories consist of the following:
| | | | | | | | | | | |
| December 31, |
| | 2024 | | 2023 |
| Components and raw materials | $ | 150,257 | | | $ | 263,652 | |
| Work-in-process | 28,973 | | | 47,997 | |
| Finished goods | 105,550 | | | 142,225 | |
| Total | $ | 284,780 | | | $ | 453,874 | |
The Company recorded inventory provisions of $82,515, $45,499 and $127,960 for the years ended December 31, 2024, 2023 and 2022, respectively. These provisions relate to the recoverability of the value of inventories due to excess quantities and technological changes. Within the inventory provision recorded in 2024, $29,487 was attributed to items previously considered safety stock and items that became technologically obsolete. The inventory provision and related charges recorded in 2022 included $74,055 related to recoverability of Russian inventories. These provisions are reported as a reduction to components and raw materials, work-in-process and finished goods.
5. DIVESTITURE, IMPAIRMENT OF LONG-LIVED ASSETS AND SALE OF ASSETS
During the third quarter of 2024, the Company recorded a loss on divestiture of $197,651, which was included in Net loss (gain) from divestiture and sale of assets in the Company's Consolidated Statements of Operations. As a result of the Russia-Ukraine conflict and related sanctions, the Company's ability to ship and receive components from its Russian operations was significantly curtailed. On August 29, 2024, the Company completed the sale of its Russian subsidiary, pursuant to a share purchase agreement with a purchaser entity associated with Softline Projects LLC and existing management of IRE-Polus for $51,096. The loss mainly consisted of $59,293 related to the carrying value of net assets of the Russian subsidiary that was in excess of net proceeds received on the sale and $135,346 related to the cumulative translation adjustment component of other comprehensive income that was previously included in stockholders' equity of the Company's Consolidated Balance Sheets.
During the third quarter of 2024, the Company evaluated its Belarusian operations. On June 29, 2024, the European Union (“EU”) issued new sanctions for Belarus. The sanctions, effective July 1 2024, allowed shipments to the Company's German operations related to existing contracts to continue through October 2, 2024. The Company completed fulfillment of existing contracts in September 2024. The Company is no longer able to supply laser cabinets and other mechanical components from the Company's factory in Belarus. As a result, the Company completed an impairment analysis of the assets in Belarus during the third quarter of 2024. The Company recorded $26,566 of impairment of long-lived assets, primarily fixed assets that was included in the total impairment of long-lived assets of $27,006 in the Company's Consolidated Statements of Operations. The long-lived asset impairment charge was based on a probability-weighted average of valuations using the discounted cash flow method under the income approach to estimate the fair value of the long-lived assets in Belarus.
During the third quarter of 2022, the Company completed the sale of its telecommunications transmission product line for $56,222. The Company recorded a gain on divestiture of $21,918 for the year ended December 31, 2022, which was included in the Company's Consolidated Statements of Operations. As part of the transaction and just prior to closing, the Company also acquired the remaining non-controlling interests related to the business that was sold for $2,500.
During the fourth quarter of 2022, the Company completed the sale of its corporate aircraft for $25,693 and recorded a gain of $9,928 which was included in Net loss (gain) from divestiture and sale of assets in the Company's Consolidated Statements of Operation. The Company also completed an impairment analysis of assets in Russia during the fourth quarter of 2022 and recorded $79,030 of impairment of long-lived assets which was included in Impairment of long-lived assets in the Company's Consolidated Statements of Operations. The long-lived asset impairment charge was based on a probability-weighted average of valuations using the discounted cash flow method under the income approach, the guideline public company method and the guideline transaction method under the market approach, to estimate the fair value of the long-lived assets in Russia.
6. RESTRUCTURING
In the fourth quarter of 2022, the Company implemented a restructuring program at its Russian subsidiary. In 2023, the Company substantially completed the restructuring program. As a result, the remaining restructuring accrual was reversed
IPG PHOTONICS CORPORATION
NOTES TO CONSOLIDATED FINANCIAL STATEMENTS
(In thousands, except share and per share data)
resulting in net restructuring recoveries of $288 for the year ended December 31 2023. The Company incurred restructuring charges of $9,697 for the year ended December 31, 2022.
The restructuring accrual was included in accrued expenses and other liabilities in the Company's Consolidated Balance Sheets. Activities related to the restructuring accrual were as follows:
| | | | | | | |
| | | 2023 |
| Balance at January 1 | | | $ | 4,869 | |
| Charges | | | 1,436 | |
| Cash payments | | | (3,719) | |
| Recoveries | | | (1,724) | |
| Foreign exchange adjustment | | | (862) | |
| Balance at December 31 | | | $ | — | |
| | | |
7. BUSINESS COMBINATION
During the fourth quarter of 2024, the Company acquired 100% of the shares of Clean‐Lasersysteme GmbH ("cleanLASER"), a leader in laser cleaning systems for $66,738, net of cash acquired, subject to a net working capital adjustment to be finalized in 2025. The purchase of cleanLASER strengthens IPG’s global position in high-precision laser systems for cleaning applications by bringing additional know-how, complementary market exposure, and product and technology synergies. As a result of the acquisition, the Company recorded intangible assets of $35,495, with a weighted-average remaining useful life of 10 years. The intangible assets comprised of $17,233 related to developed technology and product know-how with a weighted-average estimated useful life of 9 years, $14,795 related to customer relationships and backlog with weighted-average remaining useful life of 11 years and $3,467 trademark and trade name with a weighted-average estimated useful life of 9 years. The excess of the acquisition consideration over the fair value of the assets acquired and liabilities assumed has been allocated to goodwill, which amounted to $29,652, none of which will be deductible for tax purposes.
The purchase price allocations included in the Company's financial statements are not complete. They represent the preliminary fair value estimates as of the date of purchase and are subject to subsequent adjustment as the Company obtains additional information during the measurement period.
The Company has a continued employment arrangement with one of the sellers subject to a potential earn-out payment based upon the achievement of certain financial and non-financial milestones. The Company has treated this potential payment as compensation expense that will be recorded pro-ratably over the employment arrangement period of 24 months. The amount the Company has accrued related to this arrangement is not material as of December 31, 2024.
Pro forma results of operations for the acquisition of cleanLASER have not been presented because the effects of the acquisition is not material to the Company's consolidated financial results. Revenue and earnings attributable to the acquired operation since the date of the acquisition is included in the Company's Consolidated Statements of Operations and not presented separately because it is not material.
8. GOODWILL AND INTANGIBLE ASSETS
The following table sets forth the changes in the carrying amount of goodwill for the years ended December 31, 2024 and 2023:
| | | | | | | | | | | |
| | 2024 | | 2023 |
| Balance at January 1 | $ | 38,540 | | | $ | 38,325 | |
| | | |
| Goodwill arising from business combination | 29,652 | | | — | |
| | | |
| | | |
| Foreign exchange adjustment | (951) | | | 215 | |
| Balance at December 31 | $ | 67,241 | | | $ | 38,540 | |
IPG PHOTONICS CORPORATION
NOTES TO CONSOLIDATED FINANCIAL STATEMENTS
(In thousands, except share and per share data)
The Company performed the 2024 and 2023 annual impairment test as of October 1, 2024 and 2023, respectively, and no impairments were recorded as a result of the tests. The carrying balance of goodwill at December 31, 2024, and 2023 was net of accumulated impairments of $44,589.
Intangible assets, subject to amortization, consisted of the following:
| | | | | | | | | | | | | | | | | | | | | | | | | | | | | | | | | | | | | | | | | | | | | | | |
| | December 31, 2024 | | December 31, 2023 |
| Gross Carrying Amount | | Accumulated Amortization | | Net Carrying Amount | | Weighted- Average Lives | | Gross Carrying Amount | | Accumulated Amortization | | Net Carrying Amount | | Weighted- Average Lives |
| Customer relationships | $ | 62,671 | | | $ | (29,747) | | | $ | 32,924 | | | 11 years | | $ | 48,216 | | | $ | (25,973) | | | $ | 22,243 | | | 11 years |
| Technology, and Production know-how | 40,823 | | | (22,891) | | | 17,932 | | | 8 years | | 26,928 | | | (25,509) | | | 1,419 | | | 7 years |
| Trademark and trade name | 15,665 | | | (11,145) | | | 4,520 | | | 8 years | | 12,130 | | | (9,606) | | | 2,524 | | | 8 years |
| Patents | 8,034 | | | (8,034) | | | — | | | 8 years | | 8,035 | | | (7,987) | | | 48 | | | 8 years |
| Total | $ | 127,193 | | | $ | (71,817) | | | $ | 55,376 | | | | | $ | 95,309 | | | $ | (69,075) | | | $ | 26,234 | | | |
Amortization expense for the years ended December 31, 2024, 2023 and 2022 was $5,933, $7,895 and $10,454, respectively.
The estimated future amortization expense for intangibles as of December 31, 2024 is as follows:
| | | | | | | | | | | | | | | | | | | | | | | | | | | | | | | | | | | | | | |
| 2025 | | 2026 | | 2027 | | 2028 | | 2029 | | Thereafter | | Total |
| $ | 9,431 | | | $ | 7,643 | | | $ | 7,430 | | | $ | 7,059 | | | $ | 6,821 | | | $ | 16,992 | | | $ | 55,376 | |
9. PROPERTY, PLANT AND EQUIPMENT
Property, plant and equipment consist of the following:
| | | | | | | | | | | | | | |
| | | December 31, |
| | | 2024 | | 2023 |
| Land | | $ | 40,799 | | | $ | 52,506 | |
| Buildings | | 419,641 | | | 446,031 | |
| Machinery and equipment | | 468,140 | | | 457,968 | |
| Office furniture and fixtures | | 81,538 | | | 81,313 | |
| Construction-in-progress | | 152,680 | | | 118,341 | |
| Total property, plant and equipment | | 1,162,798 | | | 1,156,159 | |
| Accumulated depreciation | | (574,423) | | | (553,902) | |
| Total property, plant and equipment — net | | $ | 588,375 | | | $ | 602,257 | |
The Company recorded depreciation expense of $52,399, $58,245 and $76,063 for the years ended December 31, 2024, 2023 and 2022, respectively.
IPG PHOTONICS CORPORATION
NOTES TO CONSOLIDATED FINANCIAL STATEMENTS
(In thousands, except share and per share data)
Long-lived assets include property, plant and equipment, related deposits on such assets and demonstration equipment. The geographic locations of the Company's long-lived assets, net, based on physical location of the assets, as of December 31, 2024 and 2023 are as follows:
| | | | | | | | | | | | | | |
| | | December 31, |
| | | 2024 | | 2023 |
| United States | | $ | 375,757 | | | $ | 384,088 | |
| Germany | | 167,867 | | | 132,218 | |
| Canada | | 13,520 | | | 6,615 | |
| Japan | | 11,919 | | | 9,024 | |
| Italy | | 9,539 | | | 10,747 | |
| Poland | | 8,703 | | | 9,596 | |
| China | | 4,396 | | | 4,328 | |
| Belarus | | 3,779 | | | 31,833 | |
| Other | | 9,320 | | | 25,283 | |
| Total | | $ | 604,800 | | | $ | 613,732 | |
10. OTHER LIABILITIES
Accrued expenses and other liabilities consist of the following:
| | | | | | | | | | | |
| December 31, |
| | 2024 | | 2023 |
| Accrued compensation | $ | 56,568 | | | $ | 67,053 | |
| Contract liabilities | 56,454 | | | 69,219 | |
| Current portion of accrued warranty | 21,398 | | | 27,283 | |
| Short-term lease liabilities | 4,835 | | | 4,597 | |
| Other | 12,793 | | | 13,198 | |
| Total | $ | 152,048 | | | $ | 181,350 | |
Other long-term liabilities and deferred income taxes consist of the following:
| | | | | | | | | | | |
| December 31, |
| 2024 | | 2023 |
| Deferred income taxes | $ | 14,206 | | | $ | 1,508 | |
| Unrecognized tax benefits | 13,855 | | | 17,176 | |
| Long-term lease liabilities | 13,124 | | | 13,664 | |
| Accrued warranty | 12,954 | | | 19,926 | |
| Transition tax related to 2017 U.S. tax reform act | — | | | 11,009 | |
| Other | 5,635 | | | 5,369 | |
| Total | $ | 59,774 | | | $ | 68,652 | |
IPG PHOTONICS CORPORATION
NOTES TO CONSOLIDATED FINANCIAL STATEMENTS
(In thousands, except share and per share data)
11. PRODUCT WARRANTIES
Activity related to the warranty accrual was as follows:
| | | | | | | | | | | | | | | | | | | | |
| | 2024 | | 2023 | | 2022 |
| Balance at January 1 | | $ | 47,209 | | | $ | 52,862 | | | $ | 49,864 | |
| Provision for warranty accrual | | 5,810 | | | 13,596 | | | 22,565 | |
| Warranty claims | | (15,611) | | | (19,801) | | | (17,829) | |
| Warranty related to business divested | | (1,603) | | | — | | | — | |
| Foreign currency translation | | (1,453) | | | 552 | | | (1,738) | |
| Balance at December 31 | | $ | 34,352 | | | $ | 47,209 | | | $ | 52,862 | |
Accrued warranty reported in the accompanying Consolidated Balance Sheets as of December 31, 2024 and December 31, 2023 consists of $21,398 and $27,283 in accrued expenses and other liabilities and $12,954 and $19,926 in other long-term liabilities and deferred income taxes, respectively.
12. FINANCING ARRANGEMENTS
Revolving Line of Credit Facilities:
The Company maintains an unsecured revolving line of credit with a principal amount of $75,000, expiring in April 2025. The line of credit bears interest at a variable rate of the Secured Overnight Financing Rate ("SOFR") plus 0.90% to 1.60% depending on the Company's financial performance. Part of this credit facility is available to the Company's foreign subsidiaries including those in India, China, Japan and Brazil based on management discretion. At December 31, 2024, there were no outstanding drawings, however, there were $2,103 of guarantees issued against the line which reduced the total availability. At December 31, 2024, the remaining availability under this line was $72,897. In addition, the Company maintains Euro line of credit facilities with a total principal amount of €6,500 ($6,751 as of December 31, 2024), which are available to certain European subsidiaries. At December 31, 2024 there were no amounts drawn on the Euro lines of credit, and there were $1,533 of guarantees issued against the facility, which reduce the amount of the facility available to draw.
The Company is required to meet certain financial covenants associated with its U.S. revolving line of credit and long-term debt facility. These covenants, tested quarterly, include an interest coverage ratio and a funded debt to earnings before interest, taxes, depreciation and amortization ("EBITDA") ratio. The interest coverage covenant requires that the Company maintains a trailing twelve-month ratio of EBITDA to interest on all obligations that is at least 3.0:1.0. The funded debt to EBITDA covenant requires that the sum of all indebtedness for borrowed money on a consolidated basis be less than three times its trailing twelve months EBITDA. Funded debt is decreased by its cash and available marketable securities not classified as long-term investments in the U.S. in excess of $50,000 up to a maximum of $500,000.
13. LEASES
The Company leases certain warehouses, office spaces, land, vehicles and equipment under operating lease agreements. The remaining terms of these leases range from less than 1 year to 17 years. The operating lease expense for the years ended December 31, 2024, 2023 and 2022, totaled $6,364, $4,529 and $8,112, respectively. The cash paid for amounts included in the measurement of lease liabilities included in the operating cash flows from operating leases was $5,668, $6,110 and $7,192 for the years ended December 31, 2024, 2023 and 2022, respectively. The Company does not have any finance lease arrangements.
The Company's operating lease assets and lease liabilities consist of the following as of December 31, 2024 and 2023:
| | | | | | | | | | | | | | | | | | | | |
| | | | Year Ended December 31, |
| Account | | Classification | | 2024 | | 2023 |
| Right-of-use assets | | Other assets | | $ | 14,524 | | | $ | 13,947 | |
| Short-term lease liabilities | | Accrued expenses and other liabilities | | 4,835 | | | 4,597 | |
| Long-term lease liabilities | | Other long-term liabilities and deferred income taxes | | 13,124 | | | 13,664 | |
| Total lease liabilities | | | | $ | 17,959 | | | $ | 18,261 | |
IPG PHOTONICS CORPORATION
NOTES TO CONSOLIDATED FINANCIAL STATEMENTS
(In thousands, except share and per share data)
The table below presents the maturities of operating lease liabilities as of December 31, 2024:
| | | | | |
| 2025 | $ | 5,515 | |
| 2026 | 4,491 | |
| 2027 | 3,453 | |
| 2028 | 2,780 | |
| 2029 | 1,545 | |
| Thereafter | 2,141 | |
| Total future minimum lease payments | 19,925 | |
| Less: imputed interest | (1,966) | |
| Present value of lease liabilities | $ | 17,959 | |
Other information relevant to the Company's operating leases consist of the following as of December 31, 2024 and 2023:
| | | | | | | | | | | |
| Year Ended December 31, |
| 2024 | | 2023 |
| Weighted-average remaining lease term | 5.41 years | | 6.66 years |
| Weighted-average discount rate | 4.62 | % | | 4.39 | % |
14. COMMITMENTS AND CONTINGENCIES
Employment Agreements — The Company has entered into employment agreements with certain members of senior management. The terms of these agreements are up to two years and include non-competition, non-solicitation and nondisclosure provisions, as well as provisions for defined severance for terminations of employment under certain conditions and a change of control of the Company. The Company also maintains a severance plan for certain of its senior management providing for defined severance for terminations of employment under certain conditions and a change of control of the Company.
Contractual Obligations — The Company has entered into various purchase obligations that include agreements for construction of buildings, raw materials and equipment. Obligations under these agreements were $71,238 and $27,404 as of December 31, 2024 and 2023, respectively, and the obligations related to raw materials and equipment are generally expected to be fulfilled within one year.
Legal Proceedings — From time to time, the Company may be involved in legal disputes and other proceedings in the ordinary course of its business. These matters may include allegations of infringement of intellectual property, commercial disputes and employment matters. As of December 31, 2024, management believes these matters will not have a material effect, either individually or in the aggregate, on the Company's consolidated financial statements.
In December 2024, affiliates of Trumpf SE & Co. KG (“Trumpf”) filed patent lawsuits in two different Unified Patent Courts located in Germany against IPG Laser GmbH & Co. KG alleging infringement of two patents granted by the European Patent Office by the Company's adjustable mode beam (AMB) lasers. The Company's AMB lasers are used in the welding of electric vehicle batteries as well as structural welding. The matter is still in its early stages and the Company intends to defend it vigorously. No loss was deemed probable at December 31, 2024 and therefore no amounts have been accrued in respect of this contingency.
As of December 31, 2024 and through the date of the Company's subsequent review period of February 20, 2025, the Company is aware of no other ongoing legal proceedings that management estimates could have a material effect on the Company's consolidated financial statements.
IPG PHOTONICS CORPORATION
NOTES TO CONSOLIDATED FINANCIAL STATEMENTS - (Continued)
(In thousands, except share and per share data)
15. STOCK-BASED COMPENSATION
Stock-based compensation, including the employee stock purchase plan, is included in the following financial statement captions:
| | | | | | | | | | | | | | | | | | | | |
| | | Year Ended December 31, |
| | | 2024 | | 2023 | | 2022 |
| Cost of sales | | $ | 8,687 | | | $ | 7,929 | | | $ | 11,741 | |
| Sales and marketing | | 5,941 | | | 5,421 | | | 4,889 | |
| Research and development | | 10,239 | | | 9,396 | | | 7,585 | |
| General and administrative | | 12,283 | | | 16,858 | | | 14,120 | |
| Total stock-based compensation | | 37,150 | | | 39,604 | | | 38,335 | |
| Tax effect of stock-based compensation | | (8,191) | | | (8,660) | | | (8,261) | |
| Net stock-based compensation | | $ | 28,959 | | | $ | 30,944 | | | $ | 30,074 | |
Incentive Plans — In 2006, the Company's stockholders approved the 2006 Incentive Compensation Plan (as amended and restated from time to time, the "2006 Plan"), which provides for the issuance of stock options, PSUs, RSUs, other equity-based awards and cash awards to the Company's directors, employees, consultants and advisors. Also in 2006, the Company's stockholders approved the Non-Employee Directors Stock Plan (the "Directors Plan") for non-employee directors, which was subsequently merged into the 2006 Plan. The Company's stockholders approved amendments to the 2006 Plan in May 2006 and May 2023, including an increase in the authorized shares. A total of 11,479,192 shares are reserved under the 2006 Plan. At December 31, 2024, 2,205,922 shares of the Company's stock were available for future grant under the 2006 Plan. The Company may grant stock options only at an exercise price equal to or greater than the fair market value of its common stock on the date of grant. Equity awards generally vest over periods of one to three years and, in the case of stock options, generally expire ten years after the date of the grant. The vesting of awards under the 2006 Plan accelerate following the occurrence of certain change of control events if the participant's employment is terminated within two years by the Company without cause or by the participant for good reason or if an entity acquires control of the Company and does not agree to assume existing awards or replace with equivalent value awards. Awards granted to non-employee directors automatically become vested upon a change of control. All shares issued under the 2006 Plan are registered shares, newly issued by the Company.
The Company granted certain RSUs and PSUs to executive officers and other senior managers. The RSUs provide for time-based vesting of a fixed number of shares generally over three years. The PSUs provide the holder with the right to receive shares of the Company's common stock after the applicable award vesting period, generally three years. The final number of shares, if any, delivered upon vesting of PSUs are determined over the relevant performance period, generally three years. Outstanding PSUs as of December 31, 2024 are based on financial metrics. In the case of TSR PSUs, performance was measured by the Company's total shareholder return over the performance period compared to the S&P 1500 Composite / Electronic Equipment & Instruments Index. In the case of all other PSUs, performance is measured against internal financial metrics established by the Company's Board. The final number of shares to be delivered under the PSUs range from 0% to 200% of the target award amount.
IPG PHOTONICS CORPORATION
NOTES TO CONSOLIDATED FINANCIAL STATEMENTS - (Continued)
(In thousands, except share and per share data)
The Company has not granted stock options since 2020. The following table summarizes the option activity for the year ended December 31, 2024:
| | | | | | | | | | | | | | | | | | | | | | | | | | |
| | Number of Options | | Weighted-Average Exercise Price | | Weighted-Average Remaining Contractual Life | | Aggregate Intrinsic Value |
| | | | | | | | |
| | | | | | | | |
| | | | | | | | |
| | | | | | | | |
| | | | | | | | |
| | | | | | | | |
| | | | | | | | |
| | | | | | | | |
| | | | | | | | |
| Outstanding at January 1, 2024 | | 769,162 | | | $ | 144.38 | | | | | |
| Granted | | — | | | — | | | | | |
| Exercised | | (83,126) | | | 71.34 | | | | | |
| Forfeited | | (70,673) | | | 155.85 | | | | | |
| Outstanding at December 31, 2024 | | 615,363 | | | $ | 153.29 | | | 2.65 years | | $ | — | |
| | | | | | | | |
| Exercisable at December 31, 2024 | | 595,038 | | | $ | 152.84 | | | 2.64 years | | $ | — | |
The intrinsic value of the options exercised during the years ended December 31, 2024, 2023 and 2022 was $1,747, $4,085 and $6,069, respectively. All option awards were vested during the year ended December 31, 2024. Cash received from option exercises during the year ended December 31, 2024 was $5,923. Tax benefit received from option exercises during the year ended December 31, 2024 was $446.
The following table summarizes the RSUs activity for the year ended December 31, 2024:
| | | | | | | | | | | | | | |
| | Number of Shares | | Weighted-Average Grant-Date Fair Value |
| Nonvested at January 1, 2024 | | 475,931 | | | $ | 142.51 | |
| Granted | | 528,835 | | | 86.09 | |
| Vested | | (225,834) | | | 143.41 | |
| Forfeited | | (35,666) | | | 111.65 | |
| Nonvested at December 31, 2024 | | 743,266 | | | $ | 103.41 | |
The fair value of each restricted stock unit is the market price of Company stock on the date of grant. The weighted average grant date fair value of restricted stock units granted during the years ended December 31, 2024, 2023 and 2022 was $86.09, $128.71 and $131.32, respectively. The intrinsic value of the RSUs that vested during the years ended December 31, 2024, 2023 and 2022, was $19,634, $23,082 and $14,750, respectively. The total compensation cost related to nonvested RSU awards not yet recorded at December 31, 2024 was $44,763 which is expected to be recognized over a weighted-average of 1.8 years. The aggregate fair value of awards vested during the years ended December 31, 2024, 2023 and 2022 was $32,386, $28,319, $22,779, respectively.
The following table summarizes TSR PSUs activity for the year ended December 31, 2024:
| | | | | | | | | | | | | | |
| | Number of Shares | | Weighted-Average Grant-Date Fair Value |
| Nonvested at January 1, 2024 | | 14,908 | | | $ | 233.75 | |
| Granted | | — | | | — | |
| Vested | | — | | | — | |
| Canceled / Forfeited | | (14,908) | | | 233.75 | |
| Nonvested at December 31, 2024 | | — | | | $ | — | |
The Company has not granted TSR PSUs since 2021. For the year ended December 31, 2022, the weighted average grant date fair value for new grants was $0.00. TSR PSUs are expensed at 100% of the target goal. The intrinsic value of the TSR PSUs vested during the years ended December 31, 2024, 2023 and 2022 was nil, $128, and nil, respectively. The aggregate fair value of awards vested during the years ended December 31, 2024, 2023 and 2022 was nil, $331, and nil, respectively. There are no remaining nonvested TSR PSUs at December 31, 2024.
IPG PHOTONICS CORPORATION
NOTES TO CONSOLIDATED FINANCIAL STATEMENTS - (Continued)
(In thousands, except share and per share data)
The following table summarizes financial metric-based PSUs activity for the year ended December 31, 2024:
| | | | | | | | | | | | | | | | | |
| | Number of Shares | | Weighted-Average Grant-Date Fair Value | | | |
| Nonvested at January 1, 2024 | | 128,346 | | | $ | 144.61 | | | | |
| Granted | | 128,788 | | | 86.54 | | | | |
| Vested | | (9,863) | | | 72.72 | | | | |
| Canceled / Forfeited | | (1,686) | | | 110.40 | | | | |
| Nonvested at December 31, 2024 | | 245,585 | | | $ | 107.97 | | | | |
For the years ended December 31, 2024, 2023 and 2022, the weighted average grant date fair value for new grants was $86.54, $131.13, and $136.64. Expense for the financial metric-based PSUs was recognized at 0% to 38% of the target goals. The total compensation cost related to nonvested awards not yet recorded at December 31, 2024 was $3,259, which is expected to be recognized over a weighted average period of 2.3 years.
The Company has an employee stock purchase plan ("ESPP") offered to its U.S. and German employees. The plan allows employees who participate to purchase shares of common stock through payroll deductions at a 15% discount to the lower of the stock price on the first day or the last day of the six-month purchase period. Payroll deductions may not exceed 10% of the employee's compensation and are subject to other limitations.
The assumptions used in the Black-Scholes model for the calculation of the ESPP fair values were as follows:
| | | | | | | | | | | | | | | | | | | | |
| | 2024 | | 2023 | | 2022 |
| Performance term (year) | | 0.5 | | 0.5 | | 0.5 |
| Volatility | | 36% - 38% | | 35% - 37% | | 41% - 52% |
| Risk-free rate of return | | 5.26% - 5.37% | | 4.76% - 5.47% | | 0.19% - 2.52% |
| Dividend yield | | 0.10% | | 0.10% | | 0.10% |
| Fair value per share | | $20.45 - $26.92 | | $23.42 - $33.55 | | $26.68 - $45.91 |
Compensation expense related to the employee stock purchase plan was $1,602, $1,595 and $1,924 for the years ended December 31, 2024, 2023 and 2022, respectively. During the years ended December 31, 2024, 2023 and 2022, 74,061, 57,984 and 62,233 shares, respectively, were issued at an average price of $66.48, $86.89 and $78.57, respectively, under the employee stock purchase plan. As of December 31, 2024, there were 66,115 shares available for issuance under the employee stock purchase plan.
16. EMPLOYEE BENEFIT PLANS
The Company maintains a defined contribution retirement plan offered to its eligible U.S. employees, as well as plans at certain foreign and domestic subsidiaries. The Company makes matching contributions to each plan, which amounted to approximately $6,069, $6,496 and $6,344, respectively, for the years ended December 31, 2024, 2023 and 2022.
17. INCOME TAXES
Income (loss) before the impact of income taxes consisted of the following:
| | | | | | | | | | | | | | | | | | | | |
| | Year Ended December 31, |
| | 2024 | | 2023 | | 2022 |
| U.S. | | $ | 4,879 | | | $ | 131,601 | | | $ | 135,041 | |
| Foreign | | (166,767) | | | 143,274 | | | 48,310 | |
| Total | | $ | (161,888) | | | $ | 274,875 | | | $ | 183,351 | |
IPG PHOTONICS CORPORATION
NOTES TO CONSOLIDATED FINANCIAL STATEMENTS - (Continued)
(In thousands, except share and per share data)
The Company's provision for income taxes consisted of the following:
| | | | | | | | | | | | | | | | | | | | |
| | Year Ended December 31, |
| | 2024 | | 2023 | | 2022 |
| Current: | | | | | | |
| Federal | | $ | 13,992 | | | $ | 22,908 | | | $ | 39,435 | |
| State | | 2,906 | | | 4,623 | | | 3,697 | |
| Foreign | | 28,400 | | | 42,255 | | | 57,032 | |
| Total current | | 45,298 | | | 69,786 | | | 100,164 | |
| Deferred: | | | | | | |
| Federal | | (15,535) | | | (10,306) | | | (25,979) | |
| State | | (2,283) | | | (1,635) | | | (2,121) | |
| Foreign | | (7,842) | | | (1,848) | | | 525 | |
| Total deferred | | (25,660) | | | (13,789) | | | (27,575) | |
| Provision for income taxes | | $ | 19,638 | | | $ | 55,997 | | | $ | 72,589 | |
A reconciliation of income tax expense at the U.S. federal statutory income tax rate to the recorded tax provision were as follows:
| | | | | | | | | | | | | | | | | | | | |
| | Year Ended December 31, |
| | 2024 | | 2023 | | 2022 |
| Tax at statutory rate | | $ | (33,996) | | | $ | 57,724 | | | $ | 38,504 | |
| Non-U.S. rate differential — net | | 8,676 | | | 12,685 | | | 21,352 | |
| State income taxes — net | | 2,949 | | | 3,380 | | | 4,904 | |
| Stock-based compensation — tax detriment | | 5,385 | | | 1,835 | | | 2,736 | |
| Foreign derived intangible income benefit ("FDII") | | (3,371) | | | (9,322) | | | (14,576) | |
| | | | | | |
| Prior year and audit adjustments | | (636) | | | (4,793) | | | (2,240) | |
| Tax effect of loss from divestiture | | 42,152 | | | — | | | — | |
| Withholding and other taxes on intercompany dividends | | 3,360 | | | — | | | 1,005 | |
| | | | | | |
| Federal and state tax credits | | (8,723) | | | (6,375) | | | (5,238) | |
| Foreign investment tax credit | | — | | | — | | | (9,559) | |
| Change in reserves, including interest and penalties | | (2,866) | | | 2,379 | | | (3,355) | |
| Change in valuation allowance | | 6,470 | | | (2,548) | | | 36,993 | |
| Other — net | | 238 | | | 1,032 | | | 2,063 | |
| Provision for income taxes | | $ | 19,638 | | | $ | 55,997 | | | $ | 72,589 | |
IPG PHOTONICS CORPORATION
NOTES TO CONSOLIDATED FINANCIAL STATEMENTS - (Continued)
(In thousands, except share and per share data)
The tax effects of temporary differences that give rise to significant portions of the deferred tax assets and deferred tax liabilities were as follows:
| | | | | | | | | | | | | | |
| | Year Ended December 31, |
| | 2024 | | 2023 |
| Property, plant and equipment | | $ | (6,166) | | | $ | (5,019) | |
| Intangible assets | | 47,617 | | | 43,020 | |
| Inventory provisions | | 42,760 | | | 46,808 | |
| Allowances and accrued liabilities | | 1,880 | | | 951 | |
| Withholding and other taxes on intercompany dividends | | (3,360) | | | (1,504) | |
| Other tax credits | | 24,115 | | | 20,864 | |
| Deferred compensation | | 20,728 | | | 22,682 | |
| Net operating loss carryforwards | | 6,401 | | | 8,299 | |
| Valuation allowance | | (33,150) | | | (48,821) | |
| Net deferred tax assets | | $ | 100,825 | | | $ | 87,280 | |
The Company accrues taxes on dividend distributions to the extent that foreign subsidiaries have cash in excess of their operational needs. The Company has recorded $3,360 and $1,504 as a deferred tax liability on December 31, 2024 and 2023, respectively, for certain withholding and dividend taxes related to possible future distributions of excess cash from certain non-U.S. subsidiaries to their respective parent companies. In both 2024 and 2023, the German subsidiary paid a dividend to the U.S. parent company of $80,282 and $107,941, respectively. There were no federal or withholding taxes due on the distributions from Germany to the U.S., but in both years the Company accrued a nominal amount of state tax relating to the distribution.
With regard to the other non-U.S. subsidiaries, the Company continues to consider the earnings from these entities to be indefinitely reinvested to the extent the cash balance in each subsidiary is not greater than the current needs for operations and expansion. At December 31, 2024 and 2023, the cumulative undistributed earnings in non-U.S. subsidiaries were approximately $687,579 and $944,867, respectively, and excluded earnings for possible future distributions for which tax has been accrued. Of the $257,288 decrease in cumulative undistributed earnings in non-U.S. subsidiaries in 2024, $172,878 relates to the sale of the Company's Russian operations.
In determining the Company’s 2024 and 2023 tax provisions, the Company calculated the deferred tax assets and liabilities for each separate tax entity. The Company then considered a number of factors including the positive and negative evidence regarding the realization of deferred tax assets to determine whether a valuation allowance should be recognized with respect to the deferred tax assets.
As of December 31, 2024 and 2023, the Company had state tax credit carryforwards (net of federal tax effect) of $24,133 and $20,704, respectively. The state tax credit carryforwards begin expiring in 2025. The Company has determined that some of the state credits will more likely than not expire before they can be used and has recorded a valuation allowance of $21,425 and $17,996 as of December 31, 2024 and 2023, respectively.
The Company has tax loss carryforwards in foreign jurisdictions totaling $46,486 and $25,747 as of December 31, 2024 and 2023, respectively. The Company believes it is more likely than not that most of the loss carryforwards will expire before they can be used and has provided a valuation allowance against the tax benefit of the losses in foreign jurisdictions of $11,484 and $6,952 at December 31, 2024 and 2023, respectively. The Company sold its Russian subsidiary in 2024 which decreased the valuation allowance on Russian deferred tax assets by $23,873. There are no significant valuation allowances against other deferred tax assets as of December 31, 2024.
The Company provides reserves for potential payments of tax to various tax authorities related to uncertain tax positions and other issues. Reserves recorded are based on a determination of the amount of a tax benefit taken by the Company that is more likely than not to be realized, assuming that the matter in question will be reviewed by the tax authorities.
IPG PHOTONICS CORPORATION
NOTES TO CONSOLIDATED FINANCIAL STATEMENTS - (Continued)
(In thousands, except share and per share data)
The following is a tabular reconciliation of the total amounts of unrecognized tax benefits:
| | | | | | | | | | | | | | | | | | | | |
| | 2024 | | 2023 | | 2022 |
| Balance at January 1 | | $ | 17,176 | | | $ | 15,841 | | | $ | 19,209 | |
| Change in prior period positions | | (433) | | | (1,306) | | | (3,921) | |
| Settlement of prior period position | | (3,347) | | | — | | | — | |
| Additions for tax positions in current and prior periods | | 566 | | | 3,041 | | | 735 | |
| Foreign exchange adjustments | | (107) | | | (400) | | | (182) | |
| Balance at December 31 | | $ | 13,855 | | | $ | 17,176 | | | $ | 15,841 | |
The liability for uncertain tax benefits is included in other long-term liabilities and deferred income taxes at December 31, 2024 and 2023. Substantially all of the uncertain tax benefits recorded as of December 31, 2024 will benefit the Company's effective tax rate, if recognized.
Estimated penalties and interest related to the potential underpayment of income taxes were a net expense of $349 and $646 for the years ended December 31, 2024 and 2023, respectively, and are included within the provision for income taxes. Total accrued penalties and interest related to the underpayment of income taxes were $2,497 and $2,043 at December 31, 2024 and 2023, respectively.
The Company's uncertain tax positions are related to tax years that remain subject to examination by the relevant taxing authorities. The Company is currently under a tax audit in Germany for tax years 2021 through 2023 and in China for tax years 2013 through 2022. Open tax years by major jurisdictions are:
| | | | | | | | |
| Jurisdiction | | Open Tax Years |
| United States | | 2021 - 2024 |
| Germany | | 2021 - 2024 |
| China | | 2013 - 2024 |
IPG PHOTONICS CORPORATION
NOTES TO CONSOLIDATED FINANCIAL STATEMENTS - (Continued)
(In thousands, except share and per share data)
18. NET (LOSS) INCOME ATTRIBUTABLE TO IPG PHOTONICS CORPORATION PER SHARE
The following table sets forth the computation of diluted net (loss) income attributable to IPG Photonics Corporation per share:
| | | | | | | | | | | | | | | | | |
| Year Ended December 31, |
| | 2024 | | 2023 | | 2022 |
| Net (loss) income attributable to IPG Photonics Corporation common stockholders | $ | (181,526) | | | $ | 218,878 | | | $ | 109,909 | |
| | | | | |
| | | | | |
| Basic weighted average common shares | 44,335,857 | | | 47,154,217 | | | 50,761,096 | |
| Dilutive effect of common stock equivalents | — | | | 165,858 | | | 163,646 | |
| Diluted weighted average common shares | 44,335,857 | | | 47,320,075 | | | 50,924,742 | |
| Basic net (loss) income attributable to IPG Photonics Corporation per common share | $ | (4.09) | | | $ | 4.64 | | | $ | 2.17 | |
| | | | | |
| | | | | |
| Diluted net (loss) income attributable to IPG Photonics Corporation per common share | $ | (4.09) | | | $ | 4.63 | | | $ | 2.16 | |
| | | | | |
| | | | | |
The computation of diluted weighted average common shares excludes certain common stock equivalents, including non-qualified stock options, PSUs, RSUs and the ESPP because the effect of including them would be anti-dilutive. The weighted average anti-dilutive shares outstanding for the years ended December 31, 2024, 2023 and 2022, respectively, were as follows:
| | | | | | | | | | | | | | | | | |
| Year Ended December 31, |
| 2024 | | 2023 | | 2022 |
| Restricted stock units | 715,728 | | | 246,481 | | | 344,810 | |
| Non-qualified stock options | 696,189 | | | 533,402 | | | 594,290 | |
| Performance stock units | 235,897 | | | 51,851 | | | 81,348 | |
| Employee stock purchase plan | 42,900 | | | 30,951 | | | — | |
| Total weighed average anti-dilutive shares outstanding | 1,690,714 | | | 862,685 | | | 1,020,448 | |
On February 13, 2024, the Company announced that its board of directors has authorized the purchase of up to $300,000 of IPG common stock. This authorization is in addition to the Company's previously authorized stock repurchase programs.
For the years ended December 31, 2024, 2023 and 2022, respectively, the Company repurchased 4,087,646 shares, 2,117,352 shares, and 5,101,434 shares of its common stock with an average price of $83.30, $104.68 and $97.89 per share in the open market, respectively. The May 2023 authorization to repurchase common stock was completed in 2024. As of December 31, 2024 the remaining amount authorized under the February 2024 authorization was up to $50,000. The impact on the reduction of weighted average shares for years ended December 31, 2024, 2023 and 2022 was 2,195,177 shares, 1,167,412 shares and 2,393,478 shares, respectively.
19. SEGMENT REPORTING
The Company operates in one segment which involves the design, development, production and distribution of fiber lasers, laser and non-laser systems, fiber amplifiers, and related optical components. The Company has a single, company-wide management team that administers all properties as a whole rather than as discrete operating segments. The CODM, who is the Company's chief executive officer, measures financial performance as a single enterprise, and not on geography, legal entity, or end market basis. Throughout the year, the chief operating decision maker allocates capital resources on a project-by-project basis across the Company's entire asset base, as reflected in the Company's Consolidated Balance Sheets, to maximize profitability without regard to geography, legal entity, or end market basis. The Company operates in a number of countries throughout the world in a variety of product lines. Information regarding product lines and geographic financial information is provided in Note 2, "Revenue from Contracts with Customers" and Note 9, "Property, Plant and Equipment." The accounting policies used in the Company's segment reporting are the same as those described in Note 1, "Nature of Business and Summary of Significant Accounting Policies."
IPG PHOTONICS CORPORATION
NOTES TO CONSOLIDATED FINANCIAL STATEMENTS - (Continued)
(In thousands, except share and per share data)
The CODM primarily utilizes "Net (loss) income attributable to IPG Photonics Corporation common stockholders," as well as "Net (loss) income attributable to IPG Photonics Corporation per common share” included in the Company's Consolidated Statements of Operations as the key indicators in assessing the enterprise’s performance and allocating resources. In evaluating the Net (loss) income attributable to IPG Photonics Corporation common stockholders, the CODM also reviews gross profit as well the Company's (loss) income before foreign exchange and other segment items to set and evaluate performance targets.
The following table presents the break-down of Net (loss) income attributable to IPG Photonics Corporation common stockholders, including significant segment expenses.
| | | | | | | | | | | | | | | | | |
| | Year Ended December 31, |
| | 2024 | | 2023 | | 2022 |
| | (In thousands, except per share data) |
| Net sales | $ | 977,134 | | | $ | 1,287,439 | | | $ | 1,429,547 | |
Cost of product sold (a) | 478,176 | | | 602,746 | | | 708,715 | |
| Manufacturing, service and other operations salaries, bonus, and benefits, including contractor costs | 258,776 | | | 305,324 | | | 319,347 | |
Other manufacturing expenses (b) | 125,163 | | | 158,553 | | | 198,762 | |
| Capitalized labor and overhead | (223,136) | | | (320,882) | | | (352,690) | |
| Cost of sales | 638,979 | | | 745,741 | | | 874,134 | |
| Gross profit | 338,155 | | | 541,698 | | | 555,413 | |
Sales and marketing, research and development and general and administrative (c) | 323,678 | | | 310,132 | | | 324,010 | |
| Income before foreign exchange and other segment items | 14,477 | | | 231,566 | | | 231,403 | |
| Less: Loss (gain) on foreign exchange | 5,524 | | | (1,356) | | | 4,103 | |
Less: Other segment items (d) | 216,308 | | | (218) | | | 57,422 | |
| Add: Interest income, net | 45,467 | | | 41,735 | | | 12,620 | |
| Less: Provision for income taxes | 19,638 | | | 55,997 | | | 72,589 | |
| Net (loss) income attributable to IPG Photonics Corporation common stockholders | $ | (181,526) | | | $ | 218,878 | | | $ | 109,909 | |
(a) Includes cost materials, shipping costs, scrap, and inventory reserves.
(b) Includes depreciation and amortization, service, warranty, and other manufacturing expenses.
(c) Sales and marketing, research and development and general and administrative expenses are disclosed by period in the Company's Consolidated Statements of Operations.
(d) Other segment items include net loss (gain) on divestiture and sale of assets, impairment of long-lived assets, restructuring charges (recoveries), net, other income, net, and net income attributable to non-controlling interests.