UNITED STATES
SECURITIES AND EXCHANGE COMMISSION
Washington, D.C. 20549
FORM 10-K
☒ ANNUAL REPORT PURSUANT TO SECTION 13 OR 15(d) OF THE SECURITIES EXCHANGE ACT OF 1934
OR
☐ TRANSITION REPORT PURSUANT TO SECTION 13 OR 15(d) OF THE SECURITIES EXCHANGE ACT OF 1934
For the fiscal year ended December 31, 2024
Commission file number 000-32191
T. ROWE PRICE GROUP, INC.
(Exact name of registrant as specified in its charter)
| | | | | | | | |
| Maryland | | 52-2264646 |
| State of incorporation | | IRS Employer Identification No. |
100 East Pratt Street, Baltimore, Maryland 21202
Address, including zip code, of principal executive offices
(410) 345-2000
Registrant’s telephone number, including area code
Securities registered pursuant to Section 12(b) of the Act: | | | | | | | | |
| Common stock, $0.20 par value per share | TROW | The NASDAQ Stock Market LLC |
| (Title of class) | (Ticker symbol) | (Name of exchange on which registered) |
Securities registered pursuant to Section 12(g) of the Act: None.
Indicate by check mark if the registrant is a well-known seasoned issuer, as defined in Rule 405 of the Securities Act. ☒ Yes ☐ No
Indicate by check mark if the registrant is not required to file reports pursuant to Section 13 or Section 15(d) of the Act. ☐ Yes ☒ No
Indicate by check mark whether the registrant (1) has filed all reports required to be filed by Section 13 or 15(d) of the Securities Exchange Act of 1934 during the preceding 12 months, and (2) has been subject to such filing requirements for the past 90 days. ☒ Yes ☐ No
Indicate by check mark whether the registrant has submitted electronically every Interactive Data File required to be submitted pursuant to Rule 405 of Regulations S-T (§ 232.405 of this chapter) during the preceding 12 months (or for such shorter period the registrant was required to submit such files). ☒ Yes ☐ No
Indicate by check mark whether the registrant is a large accelerated filer, an accelerated filer, a non-accelerated filer, or a smaller reporting company. See the definitions of “large accelerated filer,” “accelerated filer” and “smaller reporting company” in Rule 12b-2 of the Exchange Act.
| | | | | | | | | | | |
| Large accelerated filer | ☒ | Accelerated filer | ☐ |
| Non-accelerated filer (do not check if smaller reporting company) | ☐ | Smaller reporting company | ☐ |
| Emerging growth company | ☐ |
If an emerging growth company, indicate by check mark if the registrant has elected not to use the extended transition period for complying with any new or revised financial accounting standards provided pursuant to Section 13(a) of the Exchange Act.¨
Indicate by check mark whether the registrant has filed a report on and attestation to its management’s assessment of the effectiveness of its internal control over financial reporting under Section 404(b) of the Sarbanes-Oxley Act (15 U.S.C. 7262(b)) by the registered public accounting firm that prepared or issued its audit report. ☒
If securities are registered pursuant to Section 12(b) of the Act, indicate by check mark whether the financial statements of the registrant included in the filing reflect the correction of an error to previously issued financial statements. ☐
Indicate by check mark whether any of those error corrections are restatements that required a recovery analysis of incentive-based compensation received by any of the registrant's executive officers during the relevant recovery period pursuant to Section 240.10D-1(b). ☐
Indicate by check mark whether the registrant is a shell company (as defined in Rule 12b-2 of the Act). ☐ Yes ☒ No
The aggregate market value of the common equity (all voting) held by non-affiliates (excludes executive officers and directors) computed using $115.31 per share (the NASDAQ Official Closing Price on June 30, 2024, the last business day of the registrant’s most recently completed second fiscal quarter) was $25.3 billion.
The number of shares outstanding of the registrant's common stock as of the latest practicable date, February 11, 2025, is 222,634,484.
DOCUMENTS INCORPORATED BY REFERENCE: Certain portions of the registrant's Definitive Proxy Statement for the 2025 Annual Meeting of Stockholders, to be filed pursuant to Regulation 14A of the general rules and regulations under the Act, are incorporated by reference into Part III of this report.
Exhibit index begins on page 96.
| | | | | | | | |
| | PAGE |
| | |
| ITEM 1. | Business | |
| ITEM 1A. | | |
| ITEM 1B. | | |
| ITEM 1C. | Cybersecurity | |
| ITEM 2. | | |
| ITEM 3. | | |
| ITEM 4. | | |
| | |
| | |
| | |
| ITEM 5. | | |
| ITEM 6. | Reserved | |
| ITEM 7. | | |
| ITEM 7A. | | |
| ITEM 8. | | |
| ITEM 9. | | |
| ITEM 9A. | Controls and Procedures | |
| ITEM 9B. | Other Information | |
| ITEM 9C. | Disclosure Regarding Foreign Jurisdictions that Prevent Inspections | |
| | |
| | |
| ITEM 10. | | |
| ITEM 11. | | |
| ITEM 12. | | |
| ITEM 13. | | |
| ITEM 14. | | |
| | |
| | |
| ITEM 15. | | |
| ITEM 16. | Form 10-K Summary | |
| |
PART I
Item 1.Business.
T. Rowe Price Group, Inc. ("T. Rowe Price Group", "T. Rowe Price", "the firm", "we", "us", or "our") is a financial services holding company that provides global investment advisory services through its subsidiaries to investors worldwide. We are driven by our purpose: to identify and actively invest in opportunities to help people thrive in an evolving world. With more than 85 years of experience, we provide a broad range of investment solutions across equity, fixed income, multi-asset, and alternative capabilities for clients around the world— from individuals to advisors to institutions to retirement plan sponsors. We also provide certain investment advisory clients with related administrative services, including distribution, mutual fund transfer agent, accounting, and shareholder services; participant recordkeeping and transfer agent services for defined contribution retirement plans; brokerage; trust services; and non-discretionary advisory services through model delivery. We take an active, independent approach to investing, offering our dynamic perspective and meaningful partnership, so our clients can feel more confident.
The late Thomas Rowe Price, Jr., founded our firm in 1937, and the common stock of T. Rowe Price Associates, Inc. was first offered to the public in 1986. The T. Rowe Price Group, Inc. corporate holding company structure was established in 2000. Our common stock trades on the NASDAQ Global Select Market under the symbol "TROW".
Our core capabilities have enabled us to deliver excellent operating results since our initial public offering. We maintain a strong corporate culture focused on delivering superior long-term investment performance and world-class service to our clients. We distribute our broad array of active investment solutions through a diverse set of distribution channels and vehicles to meet the needs of our clients globally. These vehicles include an array of U.S. mutual funds, collective investment trusts, exchange-traded funds, subadvised funds, separately managed accounts, and other sponsored products. The other sponsored products include: open-ended investment products offered to investors outside the U.S., products offered through variable annuity life insurance plans in the U.S., affiliated private investment funds, business development companies, an interval fund, and collateralized loan obligations.
The investment management industry has been evolving and industry participants are facing several challenging trends including passive investments taking market share from traditional active strategies; continued downward fee pressure; demand for new investment vehicles to meet client needs; and an ever-changing regulatory landscape.
Despite these challenging trends, we believe there are significant opportunities that align to our core capabilities. Our ongoing financial strength and discipline allows us to respond to these opportunities with several strategic, multi-year initiatives that are designed to strengthen our long-term competitive position and to:
•Sustain our leadership position in retirement.
•Access growth of the U.S. wealth management channel through improved vehicle capabilities, technology, specialist sales, and content.
•Focus on further global growth in select high-opportunity countries where we have existing business by investing more in resources, products, and marketing.
•Broaden our reach in the private and alternatives market by leveraging our distribution channels and expanding our investment capabilities.
•Enhance our relationships with clients and renew our individual investor base by investing in our ability to provide exceptional service and unique offerings.
•Strengthen our distribution technology to enhance the digital client experience and client reporting.
•Attract and retain top talent and enable effective hybrid collaboration.
•Nurture our brand globally and leverage it effectively across channels and geographies.
•Deliver strong financial results and balance sheet strength for our stockholders over the long term.
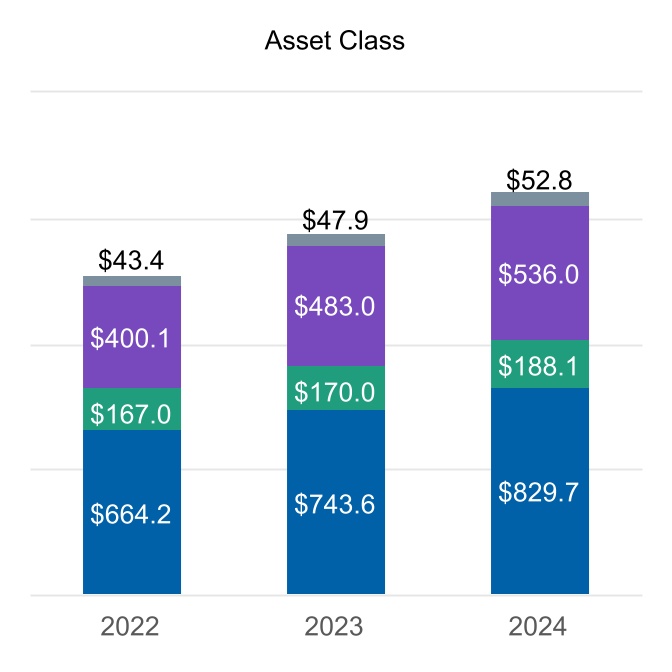
ASSETS UNDER MANAGEMENT (AUM).
Our consolidated net revenues and net income are derived largely from investment advisory services provided by our subsidiaries, primarily T. Rowe Price Associates (TRPA), T. Rowe Price Investment Management (TRPIM), Oak Hill Advisors (OHA), and T. Rowe Price International Ltd (TRPIL). Our revenues depend largely on the total value and composition of our assets under management. Accordingly, fluctuations in financial markets and in the composition of assets under management impact our revenues and results of operations.
At December 31, 2024, we had $1,606.6 billion in assets under management, an increase of $162.1 billion from the end of 2023. This increase in assets under management was driven by market appreciation, net of distributions not reinvested, of $205.3 billion, offset by net cash outflows of $43.2 billion.
In 2024, our target date retirement products experienced net cash inflows of $16.3 billion. The assets under management in our target date retirement products totaled $475.6 billion at December 31, 2024, or 29.6% of our managed assets at December 31, 2024, compared to 28.3% at the end of 2023.
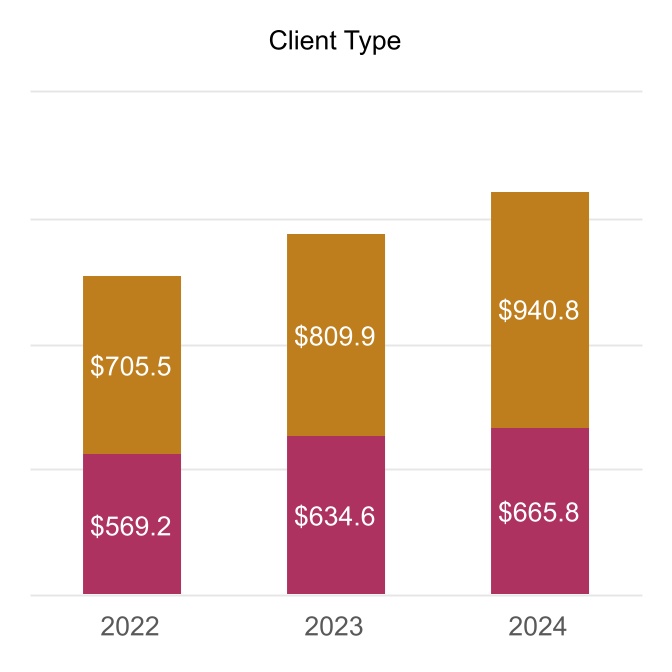
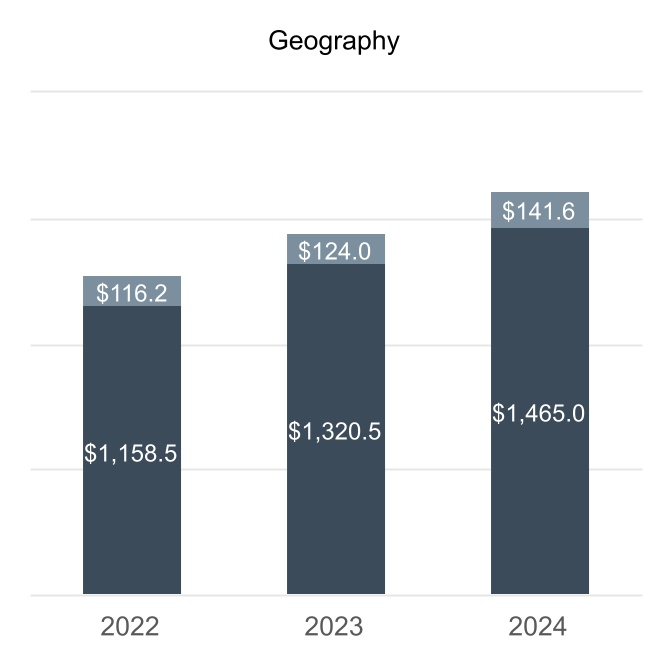
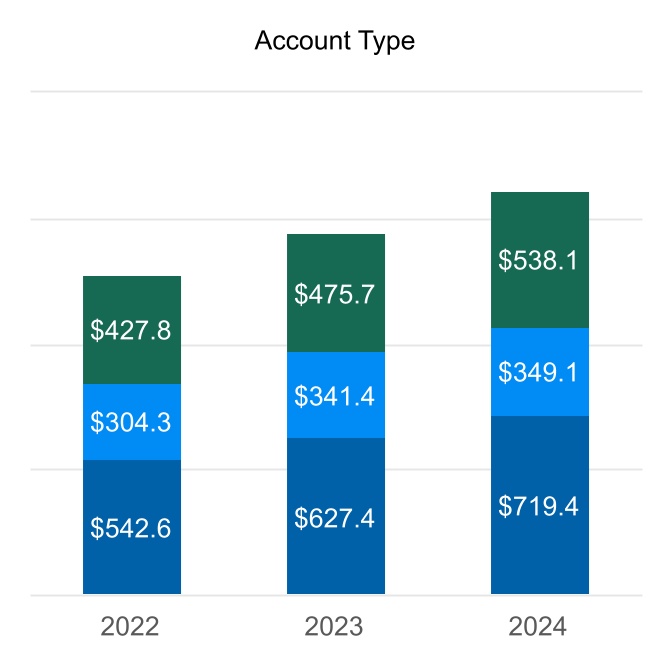
The following charts show our AUM (in billions) by asset class, client type, geography, and account type as of December 31 for the prior three years:
| | | | | | | | | | | |
| Equity | | Institutional(3) |
| Fixed Income, including money market | | Retail(4) |
| Multi-Asset(1) | | |
| Alternatives(2) | | |
(1)The underlying AUM of the multi-asset portfolios have been aggregated and presented in this category and not reported in the equity and fixed income rows.
(2)The alternatives asset class includes strategies authorized to invest more than 50% of its holdings in private credit, leveraged loans, mezzanine, real assets/CRE, structured products, stressed/distressed, non-investment grade CLOs, special situations, business development companies, or that have absolute return as its investment objective. Generally, only those strategies with longer than daily liquidity are included. Unfunded capital commitments of $16.2 billion at December 31, 2024, $11.6 billion at December 31, 2023, and $10.5 billion at December 31, 2022 are not reflected in AUM above.
(3)Institutional includes assets sourced from institutions along with defined contribution assets that are sourced through intermediaries and our full-service recordkeeping business.
(4)Retail includes assets sourced through our direct-marketed business and financial intermediaries.
| | | | | | | | | | | |
| United States | | U.S. Defined Contribution |
| APAC, EMEA, Canada | | Other Retirement |
| | | Other Accounts |
Additional information concerning our assets under management, results of operations, and financial condition during the past three years is contained in Part II, Item 7. Management’s Discussion and Analysis of Financial Condition and Results of Operations as well as our consolidated financial statements, which are included in Item 8. of this Form 10-K.
INVESTMENT MANAGEMENT SERVICES.
Investment Capabilities
We manage a broad range of investment strategies in equity, fixed income, multi-asset, and alternatives across sectors, styles and regions. Our strategies are designed to meet the varied and changing needs and objectives of investors and are delivered across a range of vehicles. We also offer specialized advisory services, including management of stable value investment contracts, customized multi-asset solutions, and a distribution management service for the disposition of equity securities our clients receive from third-party venture capital investment pools.
The following tables set forth our broad investment capabilities as of December 31, 2024.
| | | | | | | | | | | | | | | | | | | | |
| Equity |
| Growth | Core | Value | Concentrated | Integrated (Quantitative & Fundamental) | Impact |
| U.S.: | All-Cap, Large-Cap, Mid-Cap, Small-Cap, Sectors | Large-Cap, Mid-Cap, Small-Cap | Large-Cap, Mid-Cap, Small-Cap | Large-Cap (Value) | Large-Cap (Growth & Value, Lower Volatility), Multi-Cap, Small-Cap | Large-Cap |
| Global / International: | All-Cap, Large-Cap, Small-Cap, Sectors, Regional | Large-Cap | Large-Cap, Regional | Large-Cap, Regional | Large-Cap (Core) | Large-Cap |
| | | | | | | | | | | | | | | | | | | | |
| Fixed Income |
| Cash | Low Duration | High Yield / Bank Loans | Government | Securitized | Investment Grade Credit |
| U.S.: | Taxable Money, Tax-Exempt Money | Stable Value, Short-Term Bond, Short Duration Income, Ultra-Short Term Bond | Credit Opportunities, Floating Rate, High Yield | Inflation Protection, Treasury | Securitized Credit, CLO, GNMA | Investment Grade, Corporate Income Bond |
| Global / International: | N/O | N/O | Euro High Yield, High Income, Global High Yield | Global Government Bond | N/O | Euro Investment Grade Corporate, Global Investment Grade Corporate |
| | | | | | | | | | | | | | | | | |
| |
| Multi-Sector | Dynamic Suite | Emerging Markets | Municipal
(Tax-Free) | Impact |
| U.S.: | QM Bond, Core Bond, Core Plus, Investment Grade Core, Total Return | N/O | N/O | High Yield, Intermediate Muni, Intermediate, Long-Term, Short/Intermediate | N/O |
| Global / International: | Global Multi-Sector, Global Aggregate, International Bond, Euro Aggregate | Dynamic Credit, Dynamic Global Bond, Dynamic Global Bond Investment Grade, Dynamic Emerging Markets Bond | Bond, Corporate, Corporate High Yield, Investment Grade, Local Currency, Asia Credit | N/O | Global Impact Credit |
N/O - Not offered
| | | | | | | | | | | | | | | | | |
| Multi-Asset |
| U.S. / Global / International: | Target Date, Custom Target Date | Target Allocation | Global Allocation |
| Global Income | Managed Volatility | Custom Solutions | Real Assets | Retirement Income |
| | | | | | | | | | | | | | | | | |
| Alternatives |
| U.S. / Global / International: | Private Credit | Leveraged Loans | Mezzanine | Real Assets / CRE | Structured Products |
| Stressed / Distressed | CLOs - Non-Investment Grade | Special Situations | MA Alternatives |
Our research staff conducts fundamental and quantitative security analysis primarily from offices located in the U.S. and U.K. with additional staff based in Australia, China, Hong Kong, Japan, and Singapore. We also use research provided by brokerage firms and security analysts in a supportive capacity and information received from private economists, political observers, commentators, government experts, and market analysts.
We introduce new strategies, investment vehicles, or other products to complement and expand our investment offerings, to respond to competitive developments in the financial marketplace, and to meet the changing needs of our clients. A new strategy is solely dependent on our belief we have the appropriate investment management expertise and its objective will be useful to investors over a long period.
We typically provide seed capital for certain investment products to begin building an investment performance history in advance of the portfolio receiving sustainable client assets. The length of time we hold our seed capital investment will vary for each investment product as it is highly dependent on how long it takes to generate cash flows into the product from unrelated investors or, in the case of certain alternative products, the investment term. Generally, we ensure the investment product has a sustainable level of assets from unrelated shareholders before we consider redemption of our seed capital investment in order to maintain the product's net asset value or its performance record. At December 31, 2024, we had seed capital investments in our products of $1.3 billion. Additionally, we invest our capital in certain alternative products we manage to further align our interest with those of our clients. These investments are commonly referred to as co-investments and totaled $0.3 billion at December 31, 2024.
We may also close or limit investments to new investors across investment products in order to maintain the integrity of the investment strategy and to protect the interests of its existing shareholders and investors. At present, the following strategies, which represent about 7% of total assets under management at December 31, 2024, are generally closed to new investors:
| | | | | |
| Strategy | Year closed |
| U.S. Small-Cap Core | 2013 |
| Capital Appreciation | 2014 |
Distribution Channels and Products
We distribute our products across a diversified client base across five primary distribution channels in three broad geographical regions: Americas; Europe, Middle East and Africa ("EMEA"); and Asia Pacific ("APAC"). We service clients in 54 countries around the world. Investors domiciled outside the U.S. represented about 9% of total assets under management at the end of 2024.
The following table outlines the five distribution channels and products through which our assets under management are sourced as of December 31, 2024.
| | | | | | | | | | | | | | | | | | | | | | | |
| Vehicle | | Retail | | Institutional |
| | Americas financial intermediaries | EMEA & APAC financial intermediaries | Individual U.S. investors on a direct basis | | U.S. Defined Contribution | Institutional investors |
| | | | | | | |
| U.S. Mutual Funds | | x | | x | | x | x |
| Collective Investment Trusts | | | | | | x | x |
| Exchange-Traded Funds | | x | | x | | | x |
| College Savings Plans | | x | | x | | | |
| Model Portfolios | | x | x | x(6) | | | |
Separately Managed Accounts (SMAs)(1) | | x | x | | | | |
| Subadvised Accounts | | x | x | | | | |
| Separate Accounts | | | | x | | x | x |
SICAVs(2) / FCPs(3) | | | x | | | | x |
| Canadian Pooled Funds | | x | | | | | x |
OEICs(4) | | | x | | | | x |
Japanese ITMs(5) | | | x | | | | x |
| Australian Unit Trusts | | | x | | | | x |
| Private Funds | | | | | | | x |
| Collateralized Loan Obligations | | | | | | | x |
| Business Development Company (BDC) | | x | | | | | x |
(1) Includes both model delivery and manager traded SMAs,. (2)Société d'Investissement à Capital Variable (Luxembourg), (3)Fonds Commun de Placement (Luxembourg), (4)Open-Ended Investment Company (U.K.), (5)Japanese Investment Trust Management Funds, (6) Provided through our ActivePlus and Retirement Advisory Service Portfolios.
INVESTMENT ADVISORY FEES.
We derive substantially all of our net revenue from investment advisory fees that are earned pursuant to agreements with our sponsored products and clients. Nearly 57% of our investment advisory fees are earned from our sponsored U.S. mutual funds, with the remaining investment advisory fees earned from our collective investment trusts, subadvised funds, separately managed accounts, and other sponsored products. The other sponsored investment portfolios include: open-ended investment products offered to investors outside the U.S., products offered through variable annuity life insurance plans in the U.S., exchange traded funds, affiliated private investment funds, business development companies, and sponsored collateralized loan obligations.
Our investment advisory fees are generally computed using the value of assets under management at a contracted annual fee rate or an effective fee rate for those products with a tiered-fee rate structure. For the majority of our revenue, the value of the assets under management used to calculate the fees are based on a daily valuation. The contracted fee rate(s) applied to the fund or account’s assets under management will vary depending on the services provided, the asset class, and vehicle. For example, fee rates are typically higher for equities and alternatives compared to multi-asset and fixed income products. Additionally, fees rates are typically higher for commingled vehicles including U.S. mutual funds, private investment funds and collective investment trusts compared to separately managed accounts and subadvised funds.
Investment management agreements typically provide the ability for termination upon relatively short notice with little or no penalty. Specifically, our sponsored U.S. mutual fund investment management agreements must be approved, and fees are annually reviewed by the Boards of the respective funds, including a majority of directors who are not interested persons of the funds or of T. Rowe Price Group (as defined in the Investment Company Act of 1940). Additionally, fund shareholders must approve material changes to these investment management agreements. Each agreement automatically terminates in the event of its assignment (as defined in the Investment Company Act) and, generally, either party may terminate the agreement without penalty after a 60-day notice. The termination of one or more of the U.S. mutual fund agreements could have a material adverse effect on our results of operations.
We also earn performance-based investment advisory fees on certain separately managed accounts and affiliated private investment funds. These performance-based fees are recognized and reported separately in the consolidated income statement when performance returns exceed the stated hurdle at the end of the performance period, which can lead to an uneven recognition pattern in a given year.
We distribute certain of our sponsored products outside the U.S. through distribution agents and other financial intermediaries. The fees we earn for distributing and marketing these products are part of the investment advisory fees earned for managing the product assets. We recognize any related distribution fees paid to financial intermediaries in distribution and servicing costs.
CAPITAL ALLOCATION-BASED INCOME.
We recognize income earned from general partner interests in certain affiliated private investment funds that are entitled to a disproportionate allocation of income, also referred to as carried interest. We record our proportionate share of the investment funds' income assuming the funds were liquidated at each reporting date pursuant to each investment fund's governing agreements. The income will fluctuate period-to-period and the realization of accrued carried interest occurs over a number of years. A portion of this income is allocated to certain employees that have non-controlling interests in the entities that hold the general partner's investments.
ADMINISTRATIVE, DISTRIBUTION, AND SERVICING FEES.
Administrative Services
We provide certain ancillary administrative services to our investment advisory clients. These administrative services are provided by several of our subsidiaries and include mutual fund transfer agent, fund/portfolio accounting, distribution, and shareholder services; recordkeeping services for defined contribution retirement plans investing in our sponsored vehicles and vehicles outside the T. Rowe Price complex; transfer agent services for defined contribution retirement plans investing in our sponsored U.S. mutual funds; brokerage; trust services; and non-discretionary advisory services.
Distribution and Servicing
Our subsidiary, T. Rowe Price Investment Services, is the principal distributor of our U.S. mutual funds and contracts with third-party financial intermediaries who distribute these share classes. Certain of the U.S. mutual funds offer Advisor Class and R Class shares that are distributed to investors and defined contribution retirement plans, respectively. These share classes pay 12b-1 fees of 25 and 50 basis points, respectively, out of fund assets, for distribution, administration, and personal services. In addition, U.S. mutual funds offered to investors through variable annuity life insurance plans have a share class that pays a 12b-1 fee of 25 basis points. We pay all of the 12b-1 fees earned to financial intermediaries who source assets under management into these share classes and provide distribution, administration, and personal services on our behalf.
REGULATION.
All aspects of our business are subject to extensive federal, state, and foreign laws and regulations. These laws and regulations are primarily intended to benefit or protect our clients and product shareholders. They generally grant supervisory agencies and bodies broad administrative powers, including the power to limit or restrict the conduct of our business if we fail to comply with laws and regulations. Possible sanctions that may be imposed on us, if we fail to comply, include the suspension of individual employees, limitations on engaging in certain business activities for specified periods of time, revocation of our investment adviser and other registrations, censures, and fines. Furthermore, the regulations to which we are subject continue to change over time, resulting in uncertainty for our business as we must adapt to new laws and regulatory regimes and could significantly increase our reporting, disclosure and compliance obligations, including for cybersecurity and climate-related disclosures.
As a global company which offers its products to customers in a variety of jurisdictions, our subsidiaries are registered with or licensed by various U.S. and/or non-U.S. regulators. We are subject to various securities/financial services, compliance, corporate governance, disclosure, privacy, cybersecurity, technology, anti-bribery and anti-corruption, anti-money laundering, anti-terrorist financing, and economic, trade and sanctions laws and regulations, both domestically and internationally, as well as to various cross-border rules and regulations, and the data
protection laws and regulations of numerous jurisdictions, including the General Data Protection Regulation (“GDPR”) of the European Union (“EU”) and the California Consumer Privacy Act (“CCPA”). We also must comply with complex and changing tax regimes in the jurisdictions where we operate our business.
The following table shows the securities and financial services regulator to certain of our subsidiaries:
| | | | | | | | | | | |
| Regulator | | T. Rowe Price Entity |
| Within the U.S. |
| Securities & Exchange Commission | | - T. Rowe Price Associates | - T. Rowe Price Hong Kong |
| | - T. Rowe Price International | - T. Rowe Price Japan |
| | - T. Rowe Price Australia | - T. Rowe Price Singapore |
| | - T. Rowe Price (Canada) | - T. Rowe Price Advisory Services |
| | - T. Rowe Price Investment Management | - Oak Hill Advisors |
| | - Oak Hill Advisors (Europe) | - OHA (UK) |
| | -OHA Private Credit Advisors | - OHA Private Credit Advisors II |
| | | |
| | All entities above are registered as investment advisers under the Investment Advisers Act of 1940, which imposes substantive regulation around, among other things, fiduciary duties to clients, transactions with clients, effective compliance programs, conflicts of interest, advertising, recordkeeping, reporting, and disclosure requirements. |
| State of Maryland, Office of Financial Regulation | | - T. Rowe Price Trust Company |
| | | |
| Outside the U.S. | | | |
| Financial Conduct Authority | | - T. Rowe Price International | |
| | - T. Rowe Price UK |
| | - Oak Hill Advisors (Europe) |
| | - OHA (UK) | |
| Securities and Futures Commission | | - T. Rowe Price Hong Kong | |
| | - Oak Hill Advisors (Hong Kong) |
| Monetary Authority of Singapore | | - T. Rowe Price Singapore | |
| Several provincial securities commissions in Canada | | - T. Rowe Price (Canada) | |
| Commission de Surveillance du Secteur Financier | | - T. Rowe Price (Luxembourg) Management Sàrl |
| | - OHA Services Sàrl | |
| Australian Securities and Investments Commission | | - T. Rowe Price Australia | |
| | - Oak Hill Advisors (Australia) Pty |
| Japan Financial Services Agency | | - T. Rowe Price Japan | |
| Swiss Financial Market Supervisory Authority | | - T. Rowe Price (Switzerland) |
Serving the needs of retirement savers is an important focus of our business. Such activities are subject to regulators such as the U.S. Department of Labor, and applicable laws and regulations including the Employee Retirement Income Security Act of 1974 ("ERISA").
Registrations
•Our subsidiaries providing transfer agent services, T. Rowe Price Services and T. Rowe Price Retirement Plan Services, are registered under the Securities Exchange Act of 1934.
•T. Rowe Price Investment Services (TRPIS) is an SEC registered introducing broker-dealer and member of the Financial Industry Regulatory Authority ("FINRA") and the Securities Investor Protection Corporation. This
subsidiary is the principal underwriter and distributor for our sponsored U.S. mutual funds and exchange-traded funds, and may also offer and make recommendations for certain funds that are not offered to the general public such as privately placed funds. Investors may open a brokerage account with TRPIS in order to buy and sell securities. Pershing, a third-party clearing broker and an affiliate of BNY Mellon, maintains our brokerage’s customer accounts and clears all transactions.
•T. Rowe Price Associates and certain subsidiaries are registered as commodity trading advisors and/or commodity pool operators with the Commodity Futures Trading Commission and are members of the National Futures Association.
Net Capital Requirements
Certain subsidiaries are subject to net capital requirements, including those of various federal, state, and international regulatory agencies. Each of our subsidiary's net capital, as defined, meets or exceeds all minimum requirements as of December 31, 2024.
For further discussion of the potential impact of current or proposed legal or regulatory requirements, please see the Legal and Regulatory risk factors included in Item 1A. of this Form 10-K.
COMPETITION.
As a member of the financial services industry, we are subject to substantial competition in all aspects of our business. A significant number of proprietary and other sponsors’ investment products are sold to the public by other investment management firms, broker-dealers, mutual fund companies, banks, and insurance companies. We compete with brokerage and investment banking firms, insurance companies, banks, traditional and alternative asset management companies, hedge funds, and other financial institutions and funds in all aspects of our business and in every country in which we offer our products and services. Some of these financial institutions have greater resources, may have more developed brand awareness in particular markets, or offer additional services to clients than we do. We compete with other providers of investment advisory services based primarily on the availability and objectives of the investment products offered, investment performance, fees and related expenses, and the scope and quality of investment advice and other client services.
We have and will continue to face significant competition from passive oriented investment strategies. As a result, such products have taken market share from active managers. While we cannot predict how much market share these competitors will continue to gain, we believe there will always be demand for good active management investment products.
In order to maintain and enhance our competitive position, we may review acquisition and venture opportunities and, if appropriate, engage in discussions and negotiations that could lead to an acquisition transaction or other financial relationships with another entity.
HUMAN CAPITAL.
At T. Rowe Price, our people are our greatest asset. Our culture of collaboration, diversity and inclusion enables us to identify and challenge our best ideas to arrive at well-informed decisions for our clients. To attract and retain the highest quality talent, we invest in the associate experience and develop talent and succession plans; deliver individual and firmwide training and development opportunities for our associates to learn and grow; and provide strong, competitive, and regionally specific benefits and programs that promote the health and wellness of our associates.
As of December 31, 2024, we employed 8,158 associates, an increase of 3.2% from the 7,906 associates employed at the end of 2023. We add temporary and part-time personnel to complement our staff from time to time to meet periodic and special project demands, primarily for technology and collective investment fund administrative services.
Investing In Our People
To help our clients achieve their long-term investment goals, we help our associates achieve their long-term career goals. We continuously seek to identify new opportunities for our associates to expand their experience and grow their skills while cultivating an environment that allows them to be and bring their best selves to work every day. As a result of our associates developing these skills, we can promote from within. We fill approximately one-third of our open positions with internal applicants, and most of our portfolio managers have been promoted from within. We facilitate the professional development of our associates by advancing their knowledge, skills, and experience; providing them access to in-person, virtual, and online training programs; and offering a generous tuition reimbursement program. Our comprehensive learning platform allows associates to grow in ways that matter to them, while offering customized and bespoke learning paths to build critical capabilities that advance our business priorities.
We encourage associates to participate in one of the four mentorship programs offered by the firm, which include mentoring, reciprocal mentoring, and mentor circle programs. Launched in 2022 and continuously enhanced, T. Rowe Price’s mentorship program enrollment has grown across the firm.
We believe a critical driver of our firm’s future growth is our ability to cultivate leaders. Our leaders balance business credibility, accountability, and leadership capability to maximize potential, drive client value, and activate our culture. Reflecting this, we offer leadership experiences that include a series of leadership speaker events and access to virtual and in-person leadership development programs led by professors at leading universities and institutions.
Attracting and Retaining Talent
We recruit and engage candidates with different backgrounds and experiences who bring new perspectives. Our talent acquisition team continually enhances our recruitment and outreach strategies for all qualified applicants. Our talent strategy has garnered recognitions, including Forbes’ World’s Best Employers, World's Most Admired Companies from Fortune, Top Workplaces Culture Excellence from Energage, and America's Most Responsible Companies from Newsweek, among others.
We publish our Equal Employment Opportunity ("EEO") data on our website at https://www.troweprice.com/content/dam/trowecorp/Pdfs/eeo-fact-sheet.pdf. In addition, we publish our annual sustainability report, which includes transparency into our data, a copy of which can be found on our website at https://www.troweprice.com/corporate/us/en/what-we-do/esg-approach/esg-corporate.html.
Offering Benefits to Further Our Commitment
We offer employee benefit solutions, including both health care and retirement benefits, where applicable; fitness club reimbursement; life insurance; and an Employee Assistance Program to support well-being. Benefit competitiveness and design is assessed for a given country, and offerings reflect our global principles and local market practice. For example, retirement programs are uniquely designed to support associates in meeting retirement goals while also reflecting regional and country-specific practices in APAC, EMEA, and North America.
Focus on Family
We have always emphasized the importance of spending quality time away from work. In addition to generous vacation time, the firm offers fully paid maternity leave for birth mothers and fully paid parental leave to all new mothers and fathers. We also provide adoption assistance to associates looking to expand their families. In the U.S., the UK, and Canada, we offer our associates backup childcare and elder care. We also launched an APAC Family Program working group designed to support working parents and caregivers throughout the region in the workplace.
AVAILABLE INFORMATION.
We intend to use our website, troweprice.com, as means of disclosing material non-public information and for complying with our disclosure obligations under Regulation FD. These disclosures will be included in the Investor Relations section of our website, investors.troweprice.com. We make our annual reports on Form 10-K, quarterly reports on Form 10-Q, current reports on Form 8-K, and amendments to those reports filed or furnished pursuant to
Section 13(a) of the Exchange Act, available free of charge in this section of our website as soon as reasonably practicable after they have been filed with the SEC. In addition, our website includes the following information:
•our financial statement information from our periodic SEC filings in the form of XBRL data files that may be used to facilitate computer-assisted investor analysis;
•corporate governance information including our governance guidelines, committee charters, senior officer code of ethics and conduct, and other governance-related policies;
•other news and announcements that we may post from time to time that investors might find useful or interesting, including our monthly assets under management disclosure and periodic investor presentations; and
•opportunities to sign up for email alerts and RSS feeds to have information pushed in real time.
Accordingly, investors should monitor this section of our website, in addition to following our press releases, SEC filings, and public webcasts, all of which will be referenced on the website. Unless otherwise expressly stated, the information found on our website is not incorporated into this or any other report we file with, or furnish to, the SEC. Specifically, information in our sustainability report is not incorporated by reference into this Form 10-K.
The SEC maintains a website that contains the materials we file with the SEC at www.sec.gov.
Item 1A. Risk Factors.
An investment in our common stock involves various risks, including those mentioned below and those that are discussed from time to time in our periodic filings with the SEC. Investors should carefully consider these risks, along with the other information contained in this report, before making an investment decision regarding our common stock. There may be additional risks of which we are currently unaware, or which we currently consider immaterial. Any of these risks could have a material adverse effect on our business, financial condition, results of operations, liquidity, reputation, and value of our common stock.
RISKS RELATING TO OUR BUSINESS AND THE FINANCIAL SERVICES INDUSTRY.
Our revenues are based on the market value and composition of the assets under our management, all of which are subject to fluctuation caused by factors outside of our control.
We derive our revenues primarily from investment advisory services provided by our subsidiaries to individual and institutional investors. Our investment advisory fees typically are calculated as a percentage of the market value of the assets under our management. As a result, our revenues are dependent on the value and composition of the assets under our management, all of which are subject to substantial fluctuation due to many factors, including:
•Investment Performance. If the investment performance of our managed investment portfolios is less than that of our competitors or applicable third-party benchmarks, we could lose existing and potential clients and suffer a decrease in assets under management. Poor performance relative to other competing products tends to result in decreased sales and increased redemptions with corresponding decreases in our revenues.
•General Financial Market Declines. We derive a significant portion of our revenues from advisory fees on managed investment portfolios. A downturn in financial markets would cause the value of assets under our management to decrease, and may also cause investors to withdraw their investments, thereby further decreasing the level of assets under our management.
•Investment Concentration. The allocation of investment products for assets under management within market segments or strategies may impact associated fees that can vary depending on product offerings.
•Investor Mobility. Our investors may generally withdraw their funds at any time, without advance notice and with little to no significant penalty. Any redemptions and other withdrawals from, or shifting among, our investment portfolios could reduce our assets under management. These could be caused by investors reducing their investments in our portfolios in general or in the market segments in which we focus; investors
taking profits from their investments; portfolio risk characteristics, which could cause investors to move assets to other investment managers; and investor and market sentiments.
•Capacity Constraints. Prolonged periods of strong relative investment performance and/or strong investor inflows has resulted in, and may result in, capacity constraints within certain strategies, which can lead to, among other things, the closure of those strategies to new investors.
•Investing Trends. Changes in investing trends, particularly investor preference for passive or alternative investment products as well as increasing investor preference for environmentally and socially responsible investment products, and changes in retirement savings trends, may reduce interest in our products and may alter our mix of assets under management.
•Interest Rate Changes. Investor interest in and the valuation of our fixed income and multi-asset investment portfolios are affected by changes in, as well as uncertainty about interest rates.
•Geo-Political Exposure. Our managed investment portfolios may have significant investments in markets that are subject to risk of loss from political or diplomatic developments, government policies, wars, conflicts or civil unrest (such as the Russian invasion of Ukraine, the threat that Russia’s military aggression may expand, and the recent conflicts in the Middle East, including the Israel-Hamas war, and potential escalation of such conflicts), trade wars or tariffs (including those imposed or threatened by the U.S.), currency fluctuations, illiquidity and capital controls, and changes in legislation related to ownership limitations.
A decrease in the value of our assets under management, or an adverse change in their composition, particularly in market segments where our assets are concentrated, could have a material adverse effect on our investment advisory fees and revenues. For any period in which revenues decline, net income and operating margins will likely decline by a greater proportion because certain expenses will be fixed over that finite period and may not decrease in proportion to the decrease in revenues.
A majority of our revenues are based on contracts with collective investment funds that are subject to termination without cause and on short notice.
We provide investment advisory, distribution, and other administrative services to collective investment funds under various agreements. Investment advisory services are provided to each sponsored investment fund under individual investment management agreements, which can be terminated on short notice. In addition, the Board of each T. Rowe Price U.S. mutual fund must annually approve the terms of the investment management and service agreements. If a T. Rowe Price collective investment fund seeks to lower the fees that we receive or terminate its contract with us, we would experience a decline in fees earned from the collective investment funds, which could have a material adverse effect on our revenues and net income.
We operate in an intensely competitive industry. Competitive pressures may result in a loss of clients and their assets or compel us to reduce the fees we charge to clients, thereby reducing our revenues and net income.
We are subject to competition in all aspects of our business from other financial institutions. Some of these financial institutions have greater resources than we do and may offer a broader range of financial products across more markets. Some competitors operate in a different regulatory environment than we do which may give them certain competitive advantages in the investment products and portfolio structures that they offer. We compete with other providers of investment advisory services primarily based on the availability and objectives of the investment products offered, investment performance, fees and related expenses, and the scope and quality of investment advice, other client services and technology offerings. Some institutions have proprietary products, distribution channels or technology offerings that make it more difficult for us to compete with them. In addition, in recent years, there has been continued consolidation in the asset management industry, which continues to alter our competitive landscape, has led to fee compression, and requires us to modify or adapt our product offerings to attract and retain customers. Substantially all of our investment products are available without sales or redemption fees, which means that investors may be more willing to transfer assets to competing products. If our clients reduce their investments with us, and we are not able to attract new clients, our AUM, revenue and earnings could decline.
The market environment in recent years has led investors to increasingly favor lower fee passive investment products. As a result, investment advisors that emphasize passive products have gained and may continue to gain market share from active managers like us. While we believe there will always be demand for strong performing active management, we cannot predict how much market share these competitors will gain.
Furthermore, many aspects of the asset management industry are seeing increased regulatory activity and scrutiny, in particular related to environmental, social, and governance ("ESG") practices and related matters, transparency and unbundling of fees, inducements, conflicts of interest, risk management, cybersecurity, technology, privacy and data protection, diversity, equity and inclusion, and compensation. We may respond to these regulatory matters or may be impacted by these actions in a manner different from our competitors, which may impact our AUM or result in the loss of clients and their assets.
As part of our continued efforts to attract and retain clients, we develop and launch new products and services, which may require expenditure of resources and may expose us to new regulatory or compliance requirements as well as increased risk of operational or client service errors.
In the event that we decide to reduce the fees we charge for investment advisory services in response to competitive pressures, which we have done selectively in the past, revenues and operating margins could be adversely impacted. Fee reductions may vary depending on strategy and product offerings, which could result in investment rebalancing or reallocation adversely impacting revenues and operating margins.
The failure or negative performance of products offered by competitors may cause our products, which are similar, to be impacted irrespective of our performance.
Many competitors offer similar products to those offered by us, and the failure or negative performance of competitors’ products could lead to a loss of confidence in similar products we offer, irrespective of the performance of such products. Any loss of confidence in a product type could lead to withdrawals, redemptions and liquidity issues in such products, which may cause our AUM, revenue and earnings to decline.
Our operations are complex and a failure to properly execute operational processes could have an adverse effect on our reputation and decrease our revenues.
We provide global investment management and administrative services to our clients. In certain cases, we rely on third-party service providers for the execution and delivery of these services. There can be no assurance that these service providers will properly perform these processes or that there will not be interruptions in services from these third parties. Failure to properly execute or oversee these services could have an adverse impact on our business, financial results and reputation, and subject us to regulatory sanctions, fines, penalties, or litigation.
New investment strategies, investment vehicles, distribution channels, advancement in technology and digital wealth and distribution tools, or other evolutions of or additions to our business may increase the risk that our existing systems may not be adequate to control the risks introduced by such changes. Business changes may require us to update our processes or technology and may increase risk to meeting our business objectives. In addition, our existing information systems and technology platforms might not be able to accommodate our business operations, and the cost of maintaining or upgrading such systems might increase from its current level. If any of these scenarios were to arise, it could disrupt our operations, increase our expenses or result in financial exposure, regulatory inquiry, litigation or reputational damage.
Our business model is dependent on our personnel, who as part of their roles support disclosure and internal controls, compliance, supervision, technology and training to provide comfort that our activities do not violate applicable guidelines, rules and regulations or adversely affect our clients, counterparties or us. We also rely on the personnel of others involved in our business, such as third-party service providers, intermediaries or other vendors. Our personnel and the personnel of others involved in our business may make errors or engage in fraudulent or malicious activities, that are not always immediately detected or that cannot be easily remediated, which may disrupt our operations, cause losses, lead to regulatory fines or sanctions, litigation, or otherwise damage our reputation.
The quantitative models we use may contain errors, which could result in financial losses or adversely impact product performance and client relationships.
We use various quantitative models (including ones supported by AI and machine-learning algorithms) to support investment decisions and investment processes, including those related to portfolio management and portfolio risk analysis, as well as those related to client investment or savings advice or guidance. Any errors in the underlying
models or model assumptions could have unanticipated and adverse consequences on our business and reputation.
Any damage to our reputation could harm our business and lead to a loss of revenues and net income or access to capital.
We have spent many years developing our reputation for integrity, strong investment performance, and superior client service. Our brand is a valuable intangible asset, but it is vulnerable to a variety of threats that can be difficult or impossible to control, and costly or even impossible to remediate, if damaged. Regulatory inquiries and rumors can tarnish or substantially damage our reputation, even if those inquiries are satisfactorily addressed. For example, ESG issues have been the subject of increased focus by regulators, clients and other stakeholders. Various clients and stakeholders have divergent views on ESG matters, with some aiming to increase their exposure to ESG investing and some choosing not to invest in products or strategies with an ESG investment objective, including in the countries in which we operate and invest, as well as states and localities where we serve public sector clients. These differences pose challenges for us to manage divergent goals and preferences, and increase the risk that any action or lack thereof by us concerning ESG, or any actual or perceived failure to adequately address the ESG expectations will be viewed negatively by some stakeholders, which could adversely impact our reputation and business. We also communicate certain initiatives and goals for our corporate and investing activities related to ESG matters. We could be scrutinized or criticized for the scope or nature of any such initiatives or goals, and may not be able to accomplish them within our anticipated timeframe or at all. Our global presence and investments on behalf of our clients around the world could also lead to heightened scrutiny and criticism in an increasingly fragmented geopolitical landscape.
Misconduct by our personnel or third-party service providers could likewise adversely impact our reputation and lead to a loss of client assets. While we maintain policies, procedures, and controls to reduce the likelihood of unauthorized activities, we are subject to the risk that our personnel or third parties acting on our behalf may circumvent controls or act in a manner inconsistent with our policies and procedures. Real or perceived conflicts between our clients’ interests and our own, as well as any fraudulent activity or other exposure of client assets or information, may impair our reputation and subject us to litigation or regulatory action. Any damage to our brand could impede our ability to attract and retain clients and key personnel, and reduce the amount of assets under our management, any of which could have a material adverse effect on our revenues and net income.
Failure to comply with client contractual requirements and/or investment guidelines could result in costs of correction, damage awards or regulatory fines and penalties against us and loss of revenues due to client terminations.
Many of the agreements under which we manage assets or provide products or services specify investment guidelines or requirements, such as adherence to investment restrictions or limits, that we are required to observe in the provision of our services. Laws and regulations impose similar requirements for certain investment products. While we maintain various compliance procedures and other controls to seek to prevent, detect and correct such errors, any failure to comply with these guidelines or requirements could result in damage to our reputation or in our clients seeking to recover losses, withdrawing their assets or terminating their contracts. Regulators likewise may commence enforcement actions for violations of such requirements, which could lead to fines and penalties against us. Any such events could cause our revenues and profitability to decline, and significant errors for which we are responsible could have a material adverse impact on our reputation, results of operations, financial condition or liquidity.
Our alternatives products include investments in private credit, real estate, and equity investments in private companies, which may expose us to new or increased risks and liabilities and to reputational harm.
Our alternatives products include investments in private credit, real estate, and equity investments in private companies, which may expose our investment products, clients and us to new or increased risks and liabilities. These may include:
•risks related to the potential illiquidity, valuation and disposition of such investments;
•risks related to emerging and less established companies that have, among other things, short operating histories, not yet achieved or sustained profitability, new technologies and products, nascent control functions, quickly evolving markets and limited financial resources;
•credit risks, including interest-rate movements and an issuer’s ability to make principal and interest payments on the debt it issues;
•risks related to investment in “distressed” securities, including abrupt and erratic market movements and above-average price volatility;
•risks associated with a lack of diversification, such that any adverse change in one or a small number of issuers could have a material adverse effect on an investment product or client’s investments;
•risks relating to the use of leverage, including as a result of changes in interest rates or an inability to timely obtain and effectively deploy leverage;
•failures on the part of third-party managers, service providers or sub-contractors appointed in connection with investments or projects to adequately perform their contractual duties or operate in accordance with applicable laws;
•exposure to stringent and complex foreign, federal, state and local laws, ordinances and regulations;
•changes to the supply and demand for properties and/or tenancies;
•risks related to the availability, cost, coverage and other limitations on insurance; and
•the financial resources of tenants or loan counterparties; and contingent liabilities on disposition of investments.
These (and similar) risks may expose our investment products, clients and us, to the extent of our investment in such investment products, to expenses and liabilities, including costs associated with delays or remediation and increased legal or regulatory costs, all of which could impact the returns earned by our investment products and clients. These risks could also result in direct liability for us by exposing us to losses, regulatory sanctions or litigation, including claims for compensatory or punitive damages. The occurrence of any such events may expose us to reputational harm, or cause our AUM, revenues and net income to decline.
Our expenses are subject to significant fluctuations that could materially decrease net income.
Our operating results are dependent on the level of our expenses, which can vary significantly for many reasons, including:
•expenses incurred in connection with our multi-year strategic plan to strengthen our long-term competitive position;
•variations in the level of total compensation expense due to changes in, among other things, bonuses, stock-based awards, employee benefit costs due to regulatory or plan design changes, labor market conditions, our employee count and mix, competitive factors, market performance, and inflation;
•changes in the level of our advertising and promotion expenses, including the costs of expanding investment advisory services to investors outside of the U.S. and further penetrating U.S. distribution channels;
•expenses and capital costs incurred to maintain and enhance our administrative and operating services infrastructure, such as technology assets, depreciation, amortization, and research and development;
•changes in the costs incurred for third-party service providers that perform certain administrative and operating services, including as a result of changes in market conditions, labor costs and inflation;
•changes in expenses that are correlated to our assets under management, such as distribution and servicing fees;
•a future impairment of investments that is recognized in our consolidated balance sheet;
•a future impairment of goodwill or other intangible assets that is recognized in our consolidated balance sheet;
•unanticipated material fluctuations in foreign currency exchange rates applicable to the costs of our operations abroad;
•unanticipated costs incurred to protect investor accounts and client goodwill;
•future changes to legal and regulatory requirements and potential litigation; and
•disruptions of infrastructure and third-party services such as communications, power, cloud services, transfer agent, investment management, trading, and accounting systems.
Under our agreements with the U.S. mutual funds, we charge the funds certain administrative fees and related expenses based upon contracted terms. If we fail to accurately estimate our underlying expense levels or are required to incur expenses relating to the U.S. mutual funds that are not otherwise paid by the funds, our operating results will be adversely affected. While we are under no obligation to provide financial support to our investment products, any financial support provided would reduce capital available for other purposes and may have an adverse effect on revenues and net income.
Our hedging strategies utilized to mitigate risk may not be effective, which could impact our earnings.
We employ hedging strategies related to our supplemental savings plan and other incentive plans in order to hedge the liability related to the plans. In the event that our hedging strategies are not effective, the resulting impact may adversely affect our results of operations, cash flows or financial condition.
Changes in tax laws or exposure to additional tax liabilities may impact our financial position or the marketability of the products and services we offer our clients.
We are subject to income taxes as well as non-income-based taxes and complex tax regimes in both the United States and various foreign jurisdictions in which we operate. We cannot predict future changes in the tax regulations to which we are subject, and any such changes could have a material impact on our tax liability or result in increased costs of our tax compliance efforts. For example, a financial transaction tax on stocks, bonds and a broad range of financial instruments has been proposed in the United States and the EU.
Additionally, changes in the status of tax deferred investment options, including retirement plans, tax-free municipal bonds, the capital gains and corporate dividend tax rates, and other individual and corporate tax rates could cause investors to view certain investment products less favorably and reduce investor demand for products and services we offer, which could have an adverse effect on our assets under management and revenues.
Examinations and audits by tax authorities could result in additional tax payments for prior periods, which could impact our financial results.
Based on the global nature of our business, from time to time we are subject to tax audits in various jurisdictions. The calculation of our tax liabilities involves dealing with uncertainties in the application of complex tax regulations in a multitude of jurisdictions across our global operations. Tax authorities may disagree with certain positions we have taken and assess additional taxes (and, in certain cases, interest, fines, or penalties). We have a process to evaluate whether to record tax liabilities for anticipated tax audit issues based on our estimate of whether, and the extent to which, additional income taxes will be due, and adjust these liabilities in light of changing facts and circumstances. Due to the complexity of some of these uncertainties, however, the ultimate resolution may result in a payment that is materially different from our estimates and impact our financial results.
We have contracted with third-party financial intermediaries that distribute our investment products and such relationships may not be available or profitable to us in the future.
Third-party financial intermediaries we contract with generally offer their clients various investment products in addition to, and in competition with, our investment products, and have no contractual obligation to encourage investment in our products. It would be difficult for us to acquire or retain the management of those assets without the assistance of the intermediaries, and we cannot assure that we will be able to maintain an adequate number of investment product offerings and successful distribution relationships.
In addition, some investors rely on third-party financial planners, registered investment advisers, and other consultants or financial professionals to advise them on the choice of an investment adviser and investment products. These professionals and consultants may favor a competing investment product for reasons we cannot control. We cannot assure that our investment products will be among their recommended choices in the future. Further, their recommendations can change over time and we could lose their recommendation and their clients' assets under our management. Increasing competition for these distribution and sales channels as well as regulatory changes and initiatives may cause our distribution costs to rise, could cause further cost increases in the future, or could otherwise negatively impact the distribution of our products. Mergers, acquisitions, and other
ownership or management changes could also adversely impact our relationships with these third-party intermediaries. As a result of these changes, more of our revenues may be concentrated with fewer intermediaries, which may impact our dependence on these intermediaries. A failure to maintain our third-party distribution and sales channels, or a failure to maintain strong business relationships with our distributors and other intermediaries, may impair our distribution and sales operations. Any inability to access and successfully sell our products to clients through such third-party channels could have a negative effect on our level of AUM and adversely impact our business. Moreover, we can provide no assurance that we will continue to have access to the third-party financial intermediaries that currently distribute our products on favorable terms or at all, or that we will continue to have the opportunity to offer all or some of our existing products through them. The presence of any of the adverse conditions discussed above would reduce revenues and net income, possibly by material amounts.
Natural disasters and other unpredictable events could adversely affect our operations and financial results.
The occurrence of extreme events, such as armed conflicts, terrorist attacks, epidemic, pandemic or disease outbreaks (such as the COVID-19 pandemic), infrastructure failures, natural disasters or extreme weather events (which may increase in intensity or frequency as a result of climate change), and other events outside of our control could adversely affect our revenues, expenses, and net income by:
•decreasing investment valuations in, and returns on, the investment portfolios that we manage;
•causing disruptions in national or global economies that decrease investor confidence and make investment products generally less attractive;
•incapacitating or inflicting losses of lives among our personnel;
•interrupting our business operations or those of critical service providers or other providers;
•affecting the availability of infrastructure upon which our operations depend, such as road networks and electrical power grids;
•triggering technology delays or failures; and
•requiring substantial capital expenditures and operating expenses to remediate damage, replace our facilities, and restore our operations.
A significant portion of our business operations are concentrated in the Baltimore, Maryland region; Colorado Springs, Colorado; Forth Worth, Texas; New York City, New York; and London, England. In addition, we maintain offices with our personnel in many other global locations, including Sydney, Australia; Hong Kong; Singapore; Tokyo, Japan; and Luxembourg, some of which are in areas that are particularly vulnerable to extreme events. We have developed various backup systems and contingency plans, but we cannot be assured that those preparations will be adequate in all circumstances that could arise, or that material interruptions and disruptions will not occur. We also rely to varying degrees on outside service providers for service delivery in addition to technology and disaster contingency support, and we cannot be assured that these service providers will be able to perform in an adequate and timely manner. If we lose the availability of any personnel, or, if we are unable to respond adequately to such an event in a timely manner, we may be unable to service our clients or timely resume our business operations, which could lead to financial losses, a tarnished reputation and loss of clients that could result in a decrease in assets under management, lower revenues, and materially reduced net income, particularly if our responses to such events are less adequate than those of our competitors.
Our business, financial condition, and results of operation may be adversely affected by pandemics, epidemics or disease outbreaks.
Pandemics, epidemics or disease outbreaks, as well as measures enacted to prevent their spread, may create significant volatility, uncertainty and disruption to the global economy and may impact our business, financial condition and results of operations. For example, the coronavirus pandemic adversely affected global financial markets and impacted global supply chains. Concerns and uncertainty regarding pandemics, epidemics or disease outbreaks could lead to increased volatility in global capital and credit markets, adversely affect our operations, key executives and other personnel, clients, investors, service providers and other vendors, suppliers, and other third parties, and negatively impact our assets under management, revenues, income, business and operations. Since our revenue is based on the market value and composition of the assets under our management, the impact of such
events on global financial markets and our clients’ investment decisions could adversely affect our revenue and operating results.
Furthermore, while we have in place robust and well-established plans for operational resiliency and business continuity that address the potential impact of pandemics, epidemics or disease outbreaks to our personnel and our facilities, and to date have been successful in navigating the challenges presented by the COVID-19 pandemic, no assurance can be given that the steps we have taken will continue to be effective or appropriate against future pandemics, epidemics or disease outbreaks. In the event that our personnel become incapacitated by pandemics, epidemics or disease outbreaks, our business operations may be impacted, which could lead to reputational and financial harm.
Our investment income and asset levels may be negatively impacted by fluctuations in our investment portfolio.
Separately from the investments we manage for our clients, we currently have a substantial investment portfolio
in a variety of asset classes including equities, fixed income products, multi-asset products, financial instruments, real estate and alternative investments. Investments in these products are generally made to establish a track record, meet purchase size requirements for trading blocks or demonstrate economic alignment with other investors in our funds. All of these investments are subject to investment market risk, and our non-operating investment income could be adversely affected by the realization of losses upon the disposition of our investments or the recognition of significant impairments or unrealized losses on these investments. In addition, related investment income has fluctuated significantly over the years depending upon the performance of our corporate investments, including the impact of market conditions and interest rates, and the size of our corporate money market and longer-term collective investment fund holdings. Fluctuations in other investment income are expected to occur in the future. Redemptions and other withdrawals from, or shifting among, client portfolios also reduce our investment income. These changes could be caused by investors reducing their investments in client portfolios in general or in the market segments in which we focus; investors taking profits from their investments; and portfolio risk characteristics, which could cause investors to move assets to other investment managers. Poor performance relative to other competing products tends to result in decreased sales and increased redemptions with corresponding decreases in our revenues, which may have a material adverse effect on us.
The soundness of other financial services institutions could adversely affect us or the client portfolios we manage.
Financial services institutions are interrelated as a result of trading, clearing, counterparty or other relationships. We, and the client portfolios that we manage, have exposure to many different counterparties, and routinely execute transactions with counterparties in the financial services industry. Many of these transactions expose us or such client portfolios to credit risk in the event of default of its counterparty. While we regularly conduct assessments of counterparty risks, the risk of non-performance by such parties is subject to sudden swings in the financial and credit markets. Such non-performance could produce a financial loss for us or the portfolios we manage. In addition, concerns regarding the soundness of other financial services institutions may generate public concerns regarding us or the financial services industry more broadly, which could harm our reputation and adversely affect our results of operations and financial condition, even if the underlying matters impacting other financial institutions are of limited or no direct applicability to us.
We may review and pursue strategic transactions in order to maintain or enhance our competitive position and these could pose risks.
From time to time, we consider strategic opportunities, including potential acquisitions, dispositions, consolidations, organizational restructurings, joint ventures or similar transactions, any of which may impact our business. We cannot be certain that we will be able to identify, consummate and successfully complete such transactions, and no assurance can be given with respect to the timing, likelihood or business effect of any possible transaction. These initiatives typically involve a number of risks and present financial, managerial and operational challenges to our ongoing business operations. In addition, acquisitions and related transactions involve risks, including unanticipated problems regarding integration of investor account and investment security recordkeeping, additional or new regulatory requirements, operating facilities and technologies, and new personnel; adverse effects on our earnings in the event acquired intangible assets or goodwill become impaired; distracting management and other key personnel from our existing businesses; and the existence of liabilities or contingencies not disclosed to or otherwise known by us prior to closing a transaction.
We own a 23% investment in UTI Asset Management Company Ltd ("UTI"), an Indian asset management company, and we may consider non-controlling minority investments in other entities in the future. We may not realize future returns from such investments or any collaborative activities that may develop in the future.
Climate change-related risks could adversely affect our business, products, operations and clients, which may cause our AUM, revenues and earnings to decline.
Our business and the assets we manage on behalf of clients could be impacted by climate change-related risks. Climate change may present risk to our business through changes in the physical climate or from the process of transitioning to a lower-carbon economy. Climate-related physical risks arise from the direct impacts of a changing climate in the short-, medium- and long-term. Such risks may include an increase in the intensity and frequency of extreme weather events, changes in temperature, rising sea levels and increase of wildfires, which may damage infrastructure and facilities, increase energy costs, negatively impact workforces, as well as disrupt connectivity or supply chains. Within our investment portfolios, changes in weather patterns around the world can impact companies in which we invest on behalf of our clients. Weather pattern changes may cause investment professionals to re-evaluate investments in affected companies. Valuations may be impacted resulting in declines in asset values and potential loss of revenue. Climate-related transition risks arise from exposure to the transition to a lower-carbon economy through policy, regulatory, technology and market changes. For instance, new regulations and changes in existing regulations may lead to increased compliance costs, enhanced reporting obligations, regulation of existing products and/or services, exposure to litigation, and aggressive or inconsistent levels of regulatory enforcement globally. Additionally, climate change may influence client preferences by increasing the demand for investment products oriented toward climate change mitigation. Conversely, a climate-related backlash could negatively impact demand for climate or transition related products. Climate change may also impact our reputation if we are perceived to fall short of our own corporate commitments or stakeholder expectations. Any of these risks may have a material adverse effect on our AUM, revenue and earnings.
We are exposed to risks arising from our international operations.
We operate in a number of jurisdictions outside of the United States. Our international operations require us to comply with the legal and regulatory requirements of various foreign jurisdictions and expose us to political environments and risks that can compare less favorably than those in the United States. Our foreign business operations are also subject to the following risks:
•difficulty in managing, operating, and marketing our international operations;
•the inability to transact in various investments or to repatriate the proceeds from our investments from countries outside the U.S.;
•the potential nationalization of our property or that of the companies in our investment portfolios;
•fluctuations in currency exchange rates which may result in substantial negative effects on assets under our management, revenues, expenses, and assets in our U.S. dollar based financial statements; and
•significant adverse changes in international legal and regulatory environments.
Our financial condition and liquidity would be adversely affected by losses on our seed capital and co-investments.
We have capital held in investment products we manage in a variety of asset classes, including equities, fixed income products, multi-asset products, financial instruments, real estate and alternative investments. Investments in these products are generally made to establish a track record, meet purchase size requirements for trading blocks or demonstrate economic alignment with other investors in our funds. Adverse market conditions may result in the need to write down the value of these seed capital and co-investments, which may adversely affect our results of operations or liquidity.
HUMAN CAPITAL RISKS.
Our success depends on our key personnel and our investment performance and financial results could be negatively affected by the loss of their services.
Our success depends on our highly skilled personnel, including our portfolio managers, investment analysts, sales and client relationship personnel, technology and operations professionals, and corporate officers, many of whom have specialized expertise and extensive experience in our industry. Professionals with financial services experience across functional areas are in demand, and we face significant competition for highly qualified personnel. Changes in workplace environment, such as return to office arrangements and remote and hybrid work models, have presented challenges to attracting and retaining talent. While our personnel can generally terminate their employment with us at any time, with most required to provide little to no notice, we have recently adopted more significant notification requirements for certain key positions, which may cause some personnel or candidates to be less willing to continue their employment with us or join our firm. We cannot assure that we will be able to attract or retain key personnel. In addition, due to the global nature of our investment advisory business, our key personnel may have reasons to travel to regions susceptible to higher risk of civil unrest, organized crime or terrorism, and we may be unable to ensure the safety of personnel traveling to these regions.
We have near- and long-term succession planning processes, including programs to develop our future leaders, which are intended to address future talent needs and minimize the impact of losing key talent. However, in order to retain or replace our key personnel, we may be required to increase compensation, which would decrease net income. The loss of key personnel could also damage our reputation and make it more difficult to attract and retain personnel and investors, and in turn cause our assets under management to decrease, which could have a material adverse effect on our revenues and net income.
TECHNOLOGY RISKS.
We require significant quantities and types of technology to operate our business and would be adversely affected if we or our third party providers fail to maintain adequate and secure technology to conduct or expand our operations or if our technology became inoperative or obsolete.
We depend on significant quantities of technology and, in many cases, highly specialized, proprietary or third-party licensed technology to support our business functions, including among others:
•securities analysis,
•securities trading,
•portfolio management,
•client service,
•accounting and internal financial reporting processes and controls,
•data security and integrity, and
•regulatory compliance and reporting.
All of our technology systems, including those provided or operated by third-party service providers, are vulnerable to disability or failures due to cyberattacks, natural disasters or extreme weather events (which may increase in frequency or intensity as a result of climate change), power failures, acts of war or terrorism, sabotage, coding errors, system outages, and other causes. An outage, suspension or termination of vendor-provided services, software licenses or related support, upgrades, and maintenance could cause system delays or interruption. Although we believe we have robust business and disaster recovery plans, if our technology systems, including those provided or operated by third-party service providers, were to fail and we were unable to recover in a timely way, we would be unable to fulfill critical business functions, which could lead to a loss of clients and could harm our reputation. A technological breakdown or disruption in services could also interfere with our ability to comply with financial reporting and controls and other regulatory requirements, exposing us to regulatory action and liability to our clients.
In addition, our continued success depends on our ability to effectively integrate operations across many systems and/or countries, and to adopt new or adapt existing technologies to meet client, industry, and regulatory demands, including, for example, generative AI technology. We might be required to make significant capital expenditures to maintain a competitive technology stack. If we are unable to upgrade our technology stack in a timely fashion, we may lose clients and fail to maintain regulatory compliance, which could affect our results of operations and severely damage our reputation.
A cyberattack or a failure to implement effective information and cybersecurity policies, procedures and capabilities could disrupt operations and cause financial losses.
We are dependent on the effectiveness of the information and cybersecurity policies, procedures and capabilities we maintain to protect our systems and data. An externally caused data security incident, such as a cyberattack, phishing scam, virus, ransomware attack, denial-of-service attack, or an attack launched from within our systems could compromise the integrity of confidential client or competitive information and materially interrupt our business operations. In addition, our third-party service providers and other intermediaries, with which we conduct business, could also be subject to cyberattacks or other data security events, and we cannot ensure that such third parties have all appropriate controls in place to protect the integrity and confidentiality of our data that is in their custody or to allow them to continue their business operations, including their services to us, in a timely manner.
There have been increasing numbers of publicized cybersecurity incidents in recent years impacting financial services firms as well as firms in other industries, including incidents of increasing sophistication and scope, all of which have resulted in greater harm. Our use of third-party service providers could heighten this risk. Should the technology operations on which we rely be compromised, we may have to make significant investments to upgrade, repair or replace our technology infrastructure or third-party service providers and may not be able to make such investments on a timely basis. Although we maintain insurance coverage, under terms that we believe are reasonable, prudent and adequate for the purpose of our business, it may be insufficient to protect us against all losses and costs stemming from breaches of security, cyberattacks and other types of unlawful activity, or any resulting disruptions from such events.
We could be subject to losses if we fail to properly safeguard and maintain confidential data or our intellectual property.
As part of our normal operations, we maintain and transmit personal and confidential data about our clients, personnel and other parties, as well as proprietary data and intellectual property relating to our business operations. Our business operations rely on such data being available as and when needed, and not being subjected to loss or unauthorized access or alteration. We maintain a system of internal controls designed to provide reasonable assurance that both inadvertent errors and fraudulent activity, including misappropriation of assets, fraudulent financial reporting, and unauthorized access to sensitive or confidential data, is either prevented or detected in a timely manner. We also leverage cloud-based solutions for the transmission and storage of data. Our systems, or those of the third-party service providers we use to maintain or transmit such data, could be accessed by unauthorized users or corrupted by computer viruses or other malicious software code. Additionally, authorized persons could inadvertently or intentionally release or alter confidential or proprietary data. Any of these types of events could, among other things:
•seriously damage our reputation,
•result in a loss of confidence in our business and products,
•allow competitors access to our proprietary business data,
•materially impair our business operations,
•subject us to liability for a failure to safeguard data of clients, personnel, and other parties,
•result in the termination of contracts by our existing clients,
•subject us to disclosure obligations, regulatory investigations, actions or fines, and potential litigation involving regulators, stockholders, or other members of the public, and
•require significant capital and operating expenditures to investigate and remediate the breach, and organizational costs to mitigate against future incidents.
Furthermore, if any person, including any of our personnel, negligently disregards or intentionally overrides or circumvents our established controls with respect to personal or confidential data, or otherwise mismanages or misappropriates that data, we could be subject to significant monetary damages, regulatory enforcement actions, fines and/or criminal prosecution in one or more jurisdictions.
The recent advancements in and increased use of artificial intelligence (AI) present risks and challenges that may adversely impact our business.
We or our third-party vendors, clients or counterparties have developed, and may continue to develop or incorporate AI technology in certain business processes, services or products. The development and use of AI present a number of risks and challenges to our business. The legal and regulatory environment relating to AI is uncertain and rapidly evolving, in the U.S., and internationally, and includes regulation targeted specifically at AI technology, as well as provisions in intellectual property, privacy, consumer protection, employment and other laws applicable to the use of AI. For example, any failure to properly safeguard and maintain personal data in connection with our use of AI creates risk of us violating privacy laws and regulations in jurisdictions we operate in, and could subject us to disclosure obligations, regulatory investigations, actions or fines, and litigation. These evolving laws and regulations could require changes in our implementation of AI technology, increase our compliance costs and the risk of non-compliance, and restrict or impede our ability to develop, adopt and deploy AI technologies efficiently and effectively. AI models, particularly generative AI models, may produce output or take action that is incorrect or outdated, that result in the release of personal, confidential or proprietary information, that reflect biases included in the data on which they are trained or introduced during the training or fine tuning process, that infringe on the intellectual property rights of others, or that is otherwise harmful. In addition, the complexity of many AI models makes it challenging to understand why they are generating particular outputs. This limited transparency increases the challenges associated with assessing the proper operation of AI technology, understanding and monitoring the capabilities of the AI technology developed by third parties, and, to that extent, are dependent in part on the manner in which those third parties develop and train their models, including risks arising from the inclusion of any unauthorized material in the training data for their models, and the effectiveness of the steps these third parties have taken to limit the risks associated with the output of their models, matters over which we may have limited visibility. Any of these risks could expose us to liability or adverse legal or regulatory consequences and harm our reputation and the public perception of our business or the effectiveness of our security measures. In addition to our use of AI technologies, we are exposed to risks arising from the use of AI technologies by bad actors to commit fraud and misappropriate funds and to facilitate cyberattacks. Generative AI, if used to perpetrate fraud or launch cyberattacks, could result in losses, liquidity outflows, or other adverse effects at a particular financial institution or exchange. If our use of AI becomes controversial, we may experience brand or reputational harm, competitive harm, or legal liability.
LEGAL AND REGULATORY RISKS.
Compliance within a complex regulatory and legal environment which continues to evolve imposes significant financial and strategic costs on our business, and non-compliance could result in fines and penalties.
There is uncertainty associated with the regulatory and compliance environments in which we operate. Our business is subject to extensive and complex, overlapping and/or conflicting, and frequently changing rules, regulations, policies and legal interpretations, around the world. Additionally, over the past several years the pace and scope of new rules, regulations, policies and legal interpretations has increased both in the U.S. and globally, which requires additional resources and expense in order for us to digest and institute processes to comply.
Furthermore, in recent years several governments have proposed or enacted policies, legislation, and executive actions relating to ESG and DEI initiatives for the private sector. More recently, interested parties on both sides of the debate have sought to utilize the courts, social media and other means to change the practices of companies. We communicate certain approaches regarding environmental, social, diversity, and other ESG-related matters in our regulatory filings or in other public disclosures. We could be criticized for the accuracy or completeness of the disclosure and for the scope or nature of such initiatives or approaches, or for any changes to them over time.
If we are unable to maintain compliance with applicable laws and regulations, we could be subject to criminal and civil liability, the suspension of our personnel, fines, penalties, sanctions, injunctive relief, exclusion from certain markets, or temporary or permanent loss of licenses or registrations necessary to conduct our business. A regulatory proceeding, even if it does not result in a finding of wrongdoing or sanctions, could consume a substantial amount of time, management attention, and expense. Any regulatory investigation and any failure to maintain compliance with applicable laws and regulations could severely damage our reputation, adversely affect our ability to conduct business and decrease revenue and net income, and potentially result in complex and costly litigation.
Legal and regulatory developments in the mutual fund, retirement and investment advisory industry could increase our regulatory burden, impose significant financial and strategic costs on our business, and cause a loss of, or impact the servicing of, our clients and fund shareholders.
Our regulatory environment is frequently altered by new laws and regulations and by revisions to, and evolving interpretations of, existing regulations. New laws and regulations present areas of uncertainty susceptible to alternative interpretations; regulators and prospective litigants may not agree with reasoned interpretations we adopt. Future changes could require us to modify or curtail our investment offerings and business operations which may impact our expenses and profitability. Additionally, some laws and regulations may not directly apply to our business but may impact the capital markets, service providers, or have other indirect effects on our ability to provide services to our clients.
Potential impacts of current or proposed legal or regulatory requirements include, without limitation, the following:
•There has been increasing focus on the framework of the U.S. retirement system at the federal and state levels. We could experience adverse business impacts if legislative and regulatory changes limit retirement plans to certain products and services, or favor certain investment vehicles, that we do not offer, materially limit retirement savings opportunities or foster substantial outflows from retirement savings plans for non-retirement purposes.
•There has been substantial regulatory and legislative activity at federal and state levels regarding standards of care for financial services firms, related to both retirement and taxable accounts. Actions taken by applicable regulatory or legislative bodies may impact our business activities and increase our costs. In September 2024, a new rule expanding the definition of, and requirements for, an investment advice fiduciary under ERISA (“Retirement Security Rule”) became effective, which applies to retirement plans and accounts that comprise a majority of our accounts. We are assessing the impact of the Retirement Security Rule on our business.
•The Commodity Futures Trading Commission ("CFTC") regulations may limit the ability of certain investment products to use futures, swaps, and other derivatives. We have registered certain subsidiaries with the CFTC, subjecting us to additional regulatory requirements and costs, but also providing us additional flexibility to utilize such products. Nonetheless, there are still certain limitations on our investment products due to CFTC rules.
•There has been increased global regulatory focus on the manner in which intermediaries are paid for distribution of mutual funds or other collective investments funds. Changes to long-standing market practices related to fees or enhanced disclosure requirements may negatively impact sales of mutual funds or other collective investments funds by intermediaries, especially if such requirements are not applied to other investment products.
•We remain subject to various state, federal and international laws and regulations (and associated judicial decisions) related to privacy, data collection and use, including the EU’s GDPR and laws enacted by a growing number of U.S. states; cybersecurity; current and emerging technology, including AI and automated decision-making; storage, localization, retention and destruction of data; disclosure, transfer, availability, security and integrity of data; notification of regulators and/or impacted parties regarding adverse data-related events, including the SEC’s cybersecurity disclosure rules; amended Regulation S-P; and other similar matters that can concern the data of our clients and/or personnel. Requirements in these areas continue to expand and evolve throughout the globe, most commonly in ways that increase the complexity and costs of compliance. For example, the SEC proposed new rules in 2023 that would require broker-dealers and investment advisers, when engaging or communicating with investors using predictive data analytics, to evaluate such technologies for conflicts of interest and, where identified, eliminate or neutralize the conflict of interest. If adopted as proposed, these rules could encompass a wide range of forward-looking uses of technology applications and impose significant operational burdens and costs. Future changes to laws and regulations in these areas
could impose significant limitations on our operations, require changes to our business, or restrict our collection, use or storage of data or related technologies, which may increase our compliance expenses and make our business more costly or less efficient to conduct.
•Regulators have imposed certain clearing, margin, trade reporting, electronic trading and recordkeeping requirements on market participants aimed at market stabilization and risk reduction, such as the Dodd-Frank Wall Street Reform and Consumer Protection Act and related regulations in the U.S. and the European Market Infrastructure Regulation in the EU. These requirements have introduced operational complexity and additional costs to derivatives portfolios.
•New laws or regulations involving ESG integration and disclosure may materially impact the asset management industry. For example, the EU’s Sustainable Finance Disclosure Regulation imposes mandatory ESG disclosure obligations on asset managers and other financial markets participants, requiring all covered firms to disclose how financial products integrate sustainability risks in the investment process, including whether they consider adverse sustainability impacts, and sustainability-related information for products promoting sustainable objectives. The availability of such disclosures may impact the investment decisions of European investors. In addition, the EU’s Corporate Sustainability Reporting Directive imposes enhanced sustainability reporting requirements for certain EU companies and non-EU companies, with phased reporting requirements beginning in 2025 for certain companies. In the U.S., states have proposed or adopted laws and regulations to pursue similar initiatives, such as California’s Climate Accountability Package, federal regulations on ESG disclosures, such as the SEC's proposed climate disclosure rules that have been stayed, are expected to halt under the new administration in the U.S. Conversely, some U.S. states have adopted or proposed legislation or otherwise have taken official positions restricting or prohibiting state government entities from doing certain business with entities they believe are discriminating against particular industries or considering ESG factors in their investment processes and proxy voting. As jurisdictions globally continue to develop legal frameworks on ESG and sustainability regulations, our industry and business may face increasingly fragmented regulatory frameworks, which may result in complex and potentially conflicting compliance obligations and legal and regulatory uncertainty.
•Recently, several significant administrative law cases were decided by the U.S. Supreme Court, most notably Loper Bright Enterprises v. Raimondo, which overruled Chevron U.S.A., Inc. v. Natural Resources Defense Council, Inc. In Loper Bright, the Supreme Court held that the U.S. Administrative Procedure Act required courts to exercise their independent judgment when deciding whether an agency had acted within its statutory authority, and that courts may not defer to an agency interpretation solely because a statute is ambiguous, overruling the long-held Chevron decision that had required that courts defer to reasonable agency interpretations of statutes and agency action. These decisions may result in additional legal challenges to regulations and guidance issued by federal regulatory agencies that we or the companies we invest in have relied on and intend to rely on in the future. Any such challenges, if successful, could have a material impact on our business because we may make decisions based on legal guidance that may be overruled. In addition to potential changes to regulations and agency guidance as a result of legal challenges, these decisions may result in increased regulatory uncertainty and delays in and other impacts to the agency rulemaking process, any of which could adversely impact our business and operations.
We cannot predict the nature of future changes to the legal and regulatory requirements applicable to our business, nor the extent of the impacts that will result from current or future proposals. However, any such changes are likely to increase the costs of compliance and the complexity of our operations, as well as result in changes to our product or service offerings. The changing regulatory landscape may also impact a number of service providers that provide services to us and, to the extent such service providers alter their operations or increase their fees, it may impact our expenses or those of the products we offer.
We may become involved in legal and regulatory proceedings that may not be covered by insurance.
We are subject to regulatory and governmental inquiries and civil litigation. An adverse outcome of any such proceeding could involve substantial financial penalties and costs. From time to time, various claims against us arise in the ordinary course of business, including employment-related claims. There also has been an increase in litigation and in regulatory investigations in the financial services industry in recent years, including client claims, class action suits, and government actions claiming substantial monetary damages and penalties.
We carry insurance in amounts and under terms that we believe are appropriate, however, we cannot be assured that our insurance will cover every liability and loss to which we may be exposed, or that our insurance policies will
continue to be available at acceptable terms and fees. Certain insurance coverage may not be available or may be prohibitively expensive in future periods. As our insurance policies come up for renewal, we may need to assume higher deductibles or co-insurance liabilities, or pay higher premiums, which would increase our expenses and reduce our net income.
Net capital requirements may impede the business operations of our subsidiaries.
Certain of our subsidiaries are subject to net capital requirements imposed by various federal, state, and foreign authorities. Any significant change in the required net capital, an operating loss, or an extraordinary charge against net capital could adversely affect the ability of our subsidiaries to expand or maintain their operations if we were unable to make additional investments in them, which could impact our earnings.
We may be impacted adversely by claims or litigation, including claims or litigation relating to our fiduciary responsibilities.
Our businesses involve the risk that clients or others may sue us, claiming that we or third parties for whom they say we are responsible have failed to perform under a contract or otherwise failed to carry out a duty perceived to be owed to them. Our trust and investment management businesses are particularly subject to this risk. Claims made or actions brought against us, whether founded or unfounded, may result in lawsuits, injunctions, settlements, damages, fines, or penalties, which could have a material adverse effect on our financial condition or results of operations or require changes to our business. Even if we defend ourselves successfully, the cost of litigation is often substantial, and public reports regarding claims made against us may cause damage to our reputation among existing and prospective clients or negatively impact the confidence of counterparties, rating agencies and stockholders, consequently affecting our earnings negatively.
We may be adversely affected by increased governmental and regulatory scrutiny or negative publicity.
Political and public sentiment regarding financial institutions has in the past resulted, and may in the future result, in a significant amount of adverse press coverage, as well as adverse statements or charges by regulators or other government officials. Press coverage and other public statements that assert some form of wrongdoing (including, in some cases, press coverage and public statements that do not directly involve us) often result in some type of investigation by regulators, legislators and law enforcement officials or in lawsuits. Responding to these investigations and lawsuits, regardless of the ultimate outcome of the proceeding, is time-consuming and expensive and can divert the time and effort of our senior management from our business. Penalties and fines sought by regulatory authorities have increased substantially and certain regulators have been more likely in recent years to commence enforcement actions or to support legislation targeted at the financial services industry. Governmental authorities may also be more likely to pursue criminal or other actions, including seeking admissions of wrongdoing or guilty pleas, in connection with the resolution of an inquiry or investigation to the extent a company is viewed as having previously engaged in criminal, regulatory or other misconduct. Adverse publicity, governmental scrutiny and legal and enforcement proceedings can also have a negative impact on our reputation and on the morale and performance of our personnel, which could adversely affect our businesses and results of operations. The financial services industry generally and asset management in particular have been subject to negative publicity. Our reputation and businesses may be adversely affected by negative publicity or information regarding our businesses and personnel, whether or not accurate or true, that may be posted on social media or other internet forums or published by news organizations.
As noted above, we are subject to numerous laws and regulations governing privacy and the protection of personal or other data in the U.S., EU and other jurisdictions we operate in. Any failure to properly safeguard and maintain confidential data creates risk that we could be found to be in violation of laws and regulations and subject us to disclosure obligations, regulatory investigations, actions or fines, and litigation.
Item 1B. Unresolved Staff Comments.
None.
Item 1C. Cybersecurity.
Technology is a key component of our business operations, and cybersecurity is a significant consideration for the firm. T. Rowe Price has a holistic firm-wide approach to risk management including material risks from cybersecurity threats. The firm’s overall risk management activities are designed to identify, assess, report, and manage risks that could affect the firm in achieving its objectives and goals. This risk management framework operates across our business lines and integrates business operational resiliency and technology related risks such as cybersecurity threats. As part of the firm’s risk identification and assessment framework, key risks from cybersecurity threats specific to our environment are identified and assessed for adequacy of controls. Management identifies risk inherent to cybersecurity threats, estimates the significance of the risks, assesses the likelihood of their occurrence, establishes acceptable risk tolerance levels, and implements appropriate measures to monitor those risks. Action plans may be developed for identified control issues and management is responsible for addressing these issues.
Although management is responsible for the firm’s day to day cybersecurity operations, the Board of Directors ("the Board") oversees the firm’s cybersecurity program. The Board does not delegate this responsibility to a committee, nor does the Board identify a cybersecurity expert to consider the firm’s activities and make recommendations or provide advice to the Board. Instead, many of our directors have significant technology experience gained through their prior work experience and through their positions on other boards of directors, all of which provides the Board with insight and practical guidance in overseeing the firm’s technology and operations as well as our continuing investment in and development of our cybersecurity program.
Our CEO has ultimate responsibility for developing strategy and overseeing execution to meet the firm’s objectives. The CEO has delegated to our Chief Operating Officer (COO) oversight of this operational execution. The COO has several leaders within the COO organization who develop and oversee the firm’s risk management, technology, and information security practices. These executive leaders play a critical role in cybersecurity risk management and strategy, as further described below.
The firm’s Chief Risk Officer (CRO) leads the Enterprise Risk program, providing the framework and tools used by all business teams across the firm, including technology, to identify, assess, and manage risks from cybersecurity threats in coordination with the firm's Chief Information Security Officer (CISO). The Enterprise Risk team provides guidance and support in identifying, assessing, and monitoring all aspects of risks from cybersecurity threats. The Enterprise Risk function conducts risk assessments for technology and cybersecurity, and coordinates with Internal Audit and Global Compliance to provide risk assurance activities.
Enterprise Risk is primarily responsible for reporting risks from cybersecurity threats to executive leadership and our Enterprise Risk Management Committee (ERMC). The ERMC supports the efforts of the CRO in providing corporate-wide oversight of our firm’s risk management efforts and provides a path for risk escalation. This committee monitors risk management activities, including cybersecurity matters, and reports periodically and more frequently, as necessary, to our Board of Directors and Audit Committee. For example, at each quarterly meeting the Audit Committee receives an update concerning the company’s cybersecurity metrics. In addition, at least annually the Board receives a technology and cybersecurity update led by the senior management from the company’s technology and information security teams. Cybersecurity risk management practices operate enterprise-wide, across T. Rowe Price legal entities, including Oak Hill Advisors (OHA). In addition, OHA has established an independent risk committee, which includes responsibilities for prompt escalation of key risks and incidents such as cybersecurity to the T. Rowe Price CRO.
T. Rowe Price maintains documented Enterprise Incident Management and Reporting Policies and Procedures, outlining responsibilities and requirements for escalation of various types of incidents, including cybersecurity threats and incidents. Our process is designed to investigate incidents efficiently, identify root cause, communicate with the affected parties as appropriate, spot trends, and recommend improvements to mitigate risk. These procedures incorporate incident materiality determination within senior executive levels and operate firm-wide.
Global Technology and Business Unit management are also responsible for implementing internal controls to manage risks from cybersecurity threats to an appropriate level and in line with the firm’s risk appetite. Cybersecurity risks are managed across all lines of business, requiring support and participation across all levels in the organization. Within Global Technology, Enterprise Security is responsible for maintaining security policies, standards, and guidelines and routinely works with our Enterprise Risk, Compliance, Internal Audit, and other key technology and corporate stakeholders to establish security controls, enforce them, and monitor their adherence on an ongoing basis. Enterprise Security also conducts regular phishing tests and manages annual employee training
focused on raising awareness, highlighting the important role our employees play in protecting the firm from cybersecurity threats. Business Continuity and Disaster Recovery programs execute regular testing across business and technology teams to demonstrate resilience. The CISO regularly reviews the cybersecurity program and strategy with various risk committees, including the ERMC, Management Committee, and the Audit Committee. This ensures risks from cybersecurity threats are properly managed and our enterprise-wide cybersecurity program is aligned with the business needs and defined risk tolerances or risk appetite.
The cybersecurity program includes regular assessment on the effectiveness of the firm's risk mitigation strategies. Assessments include third-party validation to help ensure our internal controls and safeguards adhere to security and compliance standards. We annually undergo external examinations, such as Sarbanes-Oxley relating to financial reporting, System and Organization Controls (SOC) 1, and SOC 2 for key operational Business Units. In addition, we periodically engage with third-party partners to perform an independent evaluation of our cybersecurity program as well as external network penetration testing. This complements our internal assessments, such as application security testing, vulnerability management, and penetration testing. The firm participates in various industry threat intelligence information sharing forums to stay current on evolving cyber risks and threats. The results of these assessments are discussed with and reviewed by the Audit Committee, and shared with the Board, annually.
Within the firm's global risk department, governance processes are established, including a formal Supplier Risk Management program overseeing third-party relationships based on documented risk thresholds. The Supplier Risk Management program performs regular assessments, including information security reviews. Ongoing monitoring is performed through our centralized risk function as well as by business line supplier managers to raise new threats or weaknesses associated with a third-party service. In accordance with our Enterprise Incident Management Policy, any third-party cybersecurity incident is reported and evaluated for further review and impact analysis.
We have previously been the target of cybersecurity attacks and expect such attempts to continue, potentially with more frequency or sophistication. Although no cybersecurity incident during the year ended December 31, 2024, resulted in an interruption of our operations, known losses of critical data, nor a material impact on the firm’s strategy, financial condition or results of operations. The scope and impact of any future incident cannot be predicted. See “Item 1A. Risk Factors–Technology Risks” for more information on how a material cybersecurity incident may impact us.
Item 2.Properties.
Our corporate headquarters occupies 446,000 square feet of space under lease at 100 East Pratt Street in Baltimore, Maryland. In December 2020, we announced that we are moving our headquarters to a complex to be built with approximately 553,000 square feet of space under lease in Baltimore, Maryland. We will vacate the space at 100 East Pratt Street once the new headquarters is fully completed, which is expected in early 2025.
We have offices in 17 markets around the world, including the U.S.
Our operating and servicing activities are largely conducted at owned facilities in campus settings comprising 1.1 million square feet on two parcels of land in close proximity to Baltimore in Owings Mills, Maryland, and about 290,000 square feet in Colorado Springs, Colorado. We also maintain a nearly 60,000 square foot technology support facility in Hagerstown, Maryland.
We lease certain offices in the U.S., including offices in New York City, our business operations recovery site in Maryland, and offices in Fort Worth, San Francisco, Washington D.C. and Philadelphia. We lease all our offices outside the U.S., with London and Hong Kong being our largest.
Information concerning our anticipated capital expenditures in 2025 is set forth in the capital resources and liquidity and material cash commitments discussions in Item 7. of this Form 10-K and our future minimum rental payments under noncancellable operating leases at December 31, 2024, is set forth in Note 7 to our audited consolidated financial statements in Item 8. of this Form 10-K.
Item 3.Legal Proceedings.
For information about our legal proceedings, please see Note 16 to our audited consolidated financial statements in Item 8. of this Form 10-K.
Item 4.Mine Safety Disclosures.
Not applicable.
Information about our Executive Officers.
The following information includes the names, ages, and positions of our executive officers as of February 14, 2025. There are no arrangements or understandings pursuant to which any person serves as an officer. The first eleven individuals are members of our management committee.
Robert W. Sharps (53), Chair of the Board since 2024, Chief Executive Officer since 2022, a Director and President since 2021, Head of Investments from 2018 to 2021, Group Chief Investment Officer from 2017 to 2021, Co-Head of Global Equity from 2017 to 2018, Lead Portfolio Manager, Institutional U.S. Large-Cap Equity Growth Strategy from 2001 to 2016, and a Vice President from 2001 to 2021.
Jennifer B. Dardis (51), Chief Financial Officer and Treasurer since 2021, Head of Finance in 2021, Head of Corporate Strategy from 2016 to 2021, and a Vice President since 2010.
Glenn R. August (63), Chief Executive Officer of OHA, a Director and Vice President since 2021. He co-founded the predecessor investment firm to OHA in 1987 and took responsibility for the firm’s credit and distressed investment activities in 1990.
Arif Husain (52), Head of Global Fixed Income since 2024 and Chief Investment Officer since 2023, Head of International Fixed Income from 2022 to 2023, Portfolio Manager for the Dynamic Global Bond Fund from 2015 to 2023 and Global Government Bond High Quality Strategy from 2019 to 2023, and a Vice President since 2013.
Stephon A. Jackson (62), Head of T. Rowe Price Investment Management since 2020, Associate Head of U.S Equity from 2020 to 2021, and a Vice President since 2007.
Kimberly H. Johnson (52), Chief Operating Officer since 2022, and a Vice President since 2022. Prior to joining T. Rowe Price, she was Fannie Mae's Executive Vice President and Chief Operating Officer from 2018 to 2022, and its Chief Risk Officer, from 2015 to 2018.
Josh Nelson (47), Head of Global Equity since 2025, Head of U.S. Equity from 2022 to 2024, Associate Head of U.S. Equity in 2021, Director of Equity Research North America from 2019 to 2021, and a Vice President since 2007.
David Oestreicher (57), General Counsel since 2020, Corporate Secretary since 2012, and a Vice President since 2001. From 2009 through 2020, Mr. Oestreicher was the Chief Legal Counsel.
Sebastien Page (48), Head of Global Multi-Asset and a Vice President since 2015 and Chief Investment Officer since 2022.
Dorothy C. Sawyer (57), Head of Global Distribution since 2024, Head of U.S. Intermediaries and Retirement Plan Services from 2022 to 2023, Head of Individual Investors and Retirement Plan Services from 2019 to 2021, Head of Human Resources from 2018 to 2019, and a Vice President since 2012.
Eric L. Veiel (53), Head of Global Investments and Chief Investment Officer since 2024. Head of Global Equity and Chief Investment Officer From 2022 to 2023, Co-Head of Global Equity from 2018 to 2021, Head of U.S. Equity from 2016 to 2021, Director of Equity Research North America from 2014 to 2015, and a Vice President since 2006.
Jessica M. Hiebler (49), Principal Accounting Officer since 2010, Controller since 2020 and a Vice President since 2009.
PART II
Item 5.Market for Registrant’s Common Equity, Related Stockholder Matters and Issuer Purchases of Equity Securities.
Our common stock ($0.20 par value per share) trades on the NASDAQ Global Select Market under the symbol TROW. Dividends per share during the past two years were:
| | | | | | | | | | | | | | | | | | | | | | | |
| 1st
quarter | | 2nd
quarter | | 3rd
quarter | | 4th
quarter |
| 2024 | $ | 1.24 | | | $ | 1.24 | | | $ | 1.24 | | | $ | 1.24 | |
| 2023 | $ | 1.22 | | | $ | 1.22 | | | $ | 1.22 | | | $ | 1.22 | |
See Part III, Item 12. "Security Ownership of Certain Beneficial Owners and Management and Related Stockholder Matters" for information relating to shares authorized for issuance under our equity compensation plans.
The following table presents repurchase activity during the fourth quarter of 2024.
| | | | | | | | | | | | | | | | | | | | | | | | | | |
| Month | | Total number of
shares purchased | | Average price
paid per share | | Total number of shares purchased as part of publicly announced program(1) | | Maximum number of
shares that may yet
be purchased under
the program |
| October | | 3,951 | | | $ | 110.30 | | | — | | | 4,000,489 | |
| November | | 17,125 | | | $ | 121.70 | | | — | | | 4,000,489 | |
| December | | 630,014 | | | $ | 115.36 | | | 623,136 | | | 18,377,353 | |
| Total | | 651,090 | | | $ | 115.50 | | | 623,136 | | | |
(1) In March 2020 the Board approved a share repurchase program of approximately 24.1 million shares and in December 2024, the Board approved an increase to the program of approximately 15.0 million shares. The share repurchase program does not have an expiration date.
Shares repurchased by us in a quarter may include repurchases conducted pursuant to publicly announced board authorizations, outstanding shares surrendered to the firm to pay the exercise price in connection with swap exercises of employee stock options and shares withheld to cover the minimum tax withholding obligation associated with the vesting of restricted stock awards. Of the total number of shares purchased during the fourth quarter of 2024, 27,954 were related to shares surrendered in connection with employee stock option exercises and none were related to shares withheld to cover tax withholdings associated with the vesting of restricted stock awards.
The following table details the changes in and status of the Board of Directors’ outstanding publicly announced authorization.
| | | | | | | | | | | | | | | | | | | | | | | | | | |
| Authorization dates | | 12/31/2023 | | Additional shares authorized | | Total number of
shares purchased | | Maximum number of shares that may yet be purchased at 12/31/2024 |
| March 2020 | | 6,348,517 | | | — | | | (2,971,164) | | | 3,377,353 | |
| December 2024 | | — | | | 15,000,000 | | | — | | | 15,000,000 | |
| | 6,348,517 | | | 15,000,000 | | | (2,971,164) | | | 18,377,353 | |
We have 878 stockholders of record and approximately 480,000 beneficial stockholder accounts held by brokers, banks, and other intermediaries holding our common stock. Common stock owned outright by our associates and directors, combined with outstanding vested stock options and unvested restricted stock awards, total nearly 6% of our outstanding stock and outstanding vested stock options at December 31, 2024.
Item 6.Reserved.
Item 7. Management’s Discussion and Analysis of Financial Condition and Results of Operations.
OVERVIEW.
Our revenues and net income are derived primarily from investment advisory services provided to individual and institutional investors in a broad range of investment solutions across equity, fixed income, multi-asset, and alternative capabilities. We also provide certain investment advisory clients with related administrative services, including distribution, mutual fund transfer agent, accounting, and shareholder services; participant recordkeeping and transfer agent services for defined contribution retirement plans; brokerage; trust services; and non-discretionary advisory services.
Investment advisory fees depend largely on the total value and composition of assets under our management. Accordingly, fluctuations in financial markets and in the composition of assets under management affect our revenues and results of operations.
We incur significant expenditures to develop new products and services and improve and expand our capabilities and distribution channels in order to attract new clients and additional investments from our existing clients. These efforts often involve costs that precede any future revenues we may recognize from an increase to our assets under management.
The investment management industry has been evolving and industry participants are facing challenging trends including passive investments taking market share from traditional active strategies; continued downward fee pressure; demand for new investment vehicles to meet client needs; and an ever-changing regulatory landscape. In this regard, we have ample liquidity and resources that allow us to take advantage of attractive growth opportunities. We are investing in key capabilities, including investment professionals, distribution professionals, technologies, and new product offerings in order to provide our clients with strong investment management expertise and service.
MARKET TRENDS.
U.S. stocks produced strong gains for the second consecutive year in 2024, and various equity indexes reached new all-time highs during the year. The equity market was buoyed by generally favorable corporate earnings and by continuing interest in companies expected to benefit from AI developments. Although inflation remained above the Federal Reserve’s long-term 2% target, the central bank shifted its focus toward the moderating labor market in the second half of the year and began reducing interest rates starting in September. In the final months of the year, equity investors generally welcomed not only looser monetary policy, but also diminished political uncertainty following U.S. elections in early November. Market volatility increased, however, as investors curtailed their expectations for short-term interest rate cuts in 2025.
Developed non-U.S. equity markets were mostly positive in 2024, helped by looser monetary policies from various central banks around the world. However, returns to U.S. investors were hurt by a stronger dollar versus major non-U.S. currencies. In Europe, equity markets were widely mixed in U.S. dollar terms, whereas developed Asian markets were mostly positive.
Emerging equity markets generally appreciated and outperformed stocks in developed non-U.S. markets in U.S. dollar terms. Emerging Asian markets were mostly positive in dollar terms, though South Korean stocks fell sharply due in large part to late-year political turmoil. Equities in the emerging Europe, Middle East, and Africa (EMEA) region were also mostly positive. In Latin America, stocks in regional heavyweights Brazil and Mexico fell sharply, though some smaller markets produced positive returns.
Returns of several major equity market indexes for 2024 are as follows:
| | | | | |
| S&P 500 Index | 25.0% |
NASDAQ Composite Index(1) | 28.6% |
| Russell 2000 Index | 11.5% |
| MSCI EAFE (Europe, Australasia, and Far East) Index | 4.4% |
| MSCI Emerging Markets Index | 8.1% |
(1) Returns exclude dividends
Global bond returns were mostly positive in 2024, as many central banks around the world reduced short-term interest rates due to easing inflation pressures. In the U.S., Treasury bill yields declined as the Federal Reserve reduced the federal funds target rate by 100 basis points (1.00%) in three steps starting in mid-September. Intermediate- and long-term U.S. Treasury yields fluctuated throughout the year, but ultimately increased for the year amid expectations for fewer interest rate cuts in 2025 due to inflation remaining above the Federal Reserve’s 2% long-term goal. The 10-year U.S. Treasury note yield was 4.58% at December 31, 2024 compared to 3.88% at December 31, 2023 .
In the U.S. investment-grade universe, sector performance was broadly positive. Non-agency commercial mortgage-backed securities and asset-backed securities produced solid gains. Corporate bonds rose to a lesser degree. Mortgage-backed securities performed in line with the broad investment-grade market. Treasuries lagged with slight positive returns. Tax-free municipal bonds slightly trailed the broad taxable bond market. High yield corporate bonds produced solid gains and strongly outperformed the investment-grade bond market.
Bonds in developed non-U.S. markets produced negative returns in U.S. dollar terms due to weaker currencies versus the dollar and rising bond yields in some countries. Easing inflation pressures enabled central banks in Europe and the UK to reduce interest rates a few times. In Japan, longer-term interest rates rose as the Bank of Japan increased short-term rates in March, ending a multi-year period of negative interest rates. The Bank of Japan also unexpectedly raised rates at the end of July. In the emerging markets fixed income universe, dollar-denominated bonds produced gains in U.S. dollar terms, but local currency bonds produced negative returns, as most developing markets currencies declined versus the dollar.
Returns of several major bond market indexes for 2024 are as follows:
| | | | | |
| Bloomberg Barclays U.S. Aggregate Bond Index | 1.3% |
| J.P. Morgan Global High Yield Index | 9.0% |
| Bloomberg Barclays Municipal Bond Index | 1.1% |
| Bloomberg Barclays Global Aggregate Ex-U.S. Dollar Bond Index | (4.2)% |
| J.P. Morgan Emerging Markets Bond Index Plus | 7.7% |
| Bank of America US High Yield Index | 8.2% |
| Credit Suisse Leveraged Loan Index | 9.1% |
ASSETS UNDER MANAGEMENT.
Assets under management ended 2024 at $1,606.6 billion, an increase of $162.1 billion from the end of 2023. This increase was driven by net market appreciation and income, net of distributions not reinvested, of $205.3 billion, offset by net cash outflows of $43.2 billion.
The following table details changes in our assets under management by asset class during the last three years:
| | | | | | | | | | | | | | | | | | | | | | | | | | | | | | | | |
| (in billions) | | Equity | | Fixed income, including money market | | Multi-asset(1) | | Alternatives(2) | | Total |
| Assets under management at December 31, 2021 | | $ | 992.7 | | | $ | 175.7 | | | $ | 477.7 | | | $ | 41.7 | | | $ | 1,687.8 | |
| | | | | | | | | | |
| Net cash flows prior to manager-driven distributions | | (72.7) | | | 4.1 | | | 4.9 | | | 4.6 | | | (59.1) | |
| Manager-driven distributions | | — | | | — | | | — | | | (2.6) | | | (2.6) | |
| Net cash flows | | (72.7) | | | 4.1 | | | 4.9 | | | 2.0 | | | (61.7) | |
Net market appreciation (depreciation) and income(3) | | (255.8) | | | (12.8) | | | (82.5) | | | (0.3) | | | (351.4) | |
| | | | | | | | | | |
| Change during the period | | (328.5) | | | (8.7) | | | (77.6) | | | 1.7 | | | (413.1) | |
| | | | | | | | | | |
| Assets under management at December 31, 2022 | | 664.2 | | | 167.0 | | | 400.1 | | | 43.4 | | | 1,274.7 | |
| | | | | | | | | | |
| Net cash flows prior to manager-driven distributions | | (85.4) | | | (6.8) | | | 9.1 | | | 3.9 | | | (79.2) | |
| Manager-driven distributions | | — | | | — | | | — | | | (2.6) | | | (2.6) | |
| Net cash flows | | (85.4) | | | (6.8) | | | 9.1 | | | 1.3 | | | (81.8) | |
Net market appreciation (depreciation) and income(3) | | 164.8 | | | 9.8 | | | 73.8 | | | 3.2 | | | 251.6 | |
| | | | | | | | | | |
| Change during the period | | 79.4 | | | 3.0 | | | 82.9 | | | 4.5 | | | 169.8 | |
| | | | | | | | | | |
| Assets under management at December 31, 2023 | | 743.6 | | | 170.0 | | | 483.0 | | | 47.9 | | | 1,444.5 | |
| | | | | | | | | | |
| Net cash flows prior to manager-driven distributions | | (52.0) | | | 12.6 | | | (6.5) | | | 6.4 | | | (39.5) | |
| Manager-driven distributions | | — | | | — | | | — | | | (3.7) | | | (3.7) | |
| Net cash flows | | (52.0) | | | 12.6 | | | (6.5) | | | 2.7 | | | (43.2) | |
Net market appreciation (depreciation) and income(3) | | 138.1 | | | 5.5 | | | 59.5 | | | 2.2 | | | 205.3 | |
| | | | | | | | | | |
| Change during the period | | 86.1 | | | 18.1 | | | 53.0 | | | 4.9 | | | 162.1 | |
| | | | | | | | | | |
| | | | | | | | | | |
| | | | | | | | | | |
| Assets under management at December 31, 2024 | | $ | 829.7 | | | $ | 188.1 | | | $ | 536.0 | | | $ | 52.8 | | | $ | 1,606.6 | |
(1) The underlying AUM of the multi-asset portfolios have been aggregated and presented in this category and not reported in the equity and fixed income columns.
(2) The alternatives asset class includes strategies authorized to invest more than 50% of its holdings in private credit, leveraged loans, mezzanine, real assets/CRE, structured products, stressed/distressed, non-investment grade CLOs, special situations, business development companies, or that have absolute return as its investment objective. Generally, only those strategies with longer than daily liquidity are included. Unfunded capital commitments of $16.2 billion at December 31, 2024, $11.6 billion at December 31, 2023, and $10.5 billion at December 31, 2022 are not reflected in AUM above.
(3) Reflects net distributions not reinvested of $5.9 billion in 2024, $2.9 billion in 2023, and $3.3 billion in 2022.
Investment advisory clients outside the U.S. accounted for 8.8% of our assets under management at December 31, 2024, 8.6% at December 31, 2023, and 9.1% at December 31, 2022.
The following table details our assets under management and net flows in our target date retirement products, which are included in the multi-asset column shown above:
| | | | | | | | | | | | | | | | | |
| (in billions) | 2024 | | 2023 | | 2022 |
| Assets under management | $ | 475.6 | | | $ | 408.4 | | | $ | 334.2 | |
| Net cash flows | $ | 16.3 | | | $ | 13.1 | | | $ | 11.3 | |
Our net cash outflows in 2024 were driven primarily by growth-oriented equity strategies and a multi-asset sub-advised variable annuity outflow. These outflows were partially offset by net cash inflows in our target date retirement products, fixed income and alternative strategies. Financial intermediaries were the main sources of net outflows in 2024. Geographically, while the EMEA and APAC regions experienced net inflows, these were outweighed by outflows in the Americas. For 2023, net outflows were driven primarily by our growth-oriented equity strategies sourced from Americas financial intermediaries and institutional clients. These outflows were partially offset by net cash inflows in our multi-asset strategies, predominately our target date retirement products, and alternative strategies. From a geography perspective, net outflows were predominantly from U.S. clients invested in equity strategies though all regions experienced net outflows. For 2022, net outflows were driven primarily by our growth-oriented equity strategies sourced from U.S. intermediaries. These outflows were partially offset by net cash inflows in our international fixed income, multi-asset, and alternative strategies. From a geographical perspective, the Americas and EMEA regions experienced net outflows predominantly in equities, while APAC had positive net flows.
We provide strategic investment advice solutions for certain portfolios. These advice solutions, the vast majority of which are overseen by our multi-asset division, may include strategic asset allocation, and in certain portfolios, asset selection and/or tactical asset allocation overlays. We also offer advice solutions through retail separately managed accounts and separately managed accounts model delivery. As of December 31, 2024, total assets in these solutions were $557 billion, of which $542 billion are reported in assets under management in the tables above.
We provide participant accounting and plan administration for defined contribution retirement plans that primarily invest in the firm's U.S. mutual funds, collective investment trusts and funds managed outside of the firm's complex. As of December 31, 2024, our assets under administration were $282 billion, of which $159 billion were assets we manage.
INVESTMENT PERFORMANCE(1).
Strong investment performance and brand awareness is a key driver to attracting and retaining assets—and to our long-term success. The following table presents investment performance for the one-, three-, five-, and 10-years ended December 31, 2024. Past performance is no guarantee of future results.
| | | | | | | | | | | | | | | | | | | | | | | | | | |
% of U.S. mutual funds that outperformed Morningstar median(2),(3) |
| | 1 year | | 3 years | | 5 years | | 10 years |
| Equity | | 51% | | 51% | | 46% | | 67% |
| Fixed Income | | 48% | | 52% | | 55% | | 63% |
| Multi-Asset | | 63% | | 63% | | 69% | | 82% |
| | | | | | | | |
| All Funds | | 54% | | 56% | | 56% | | 70% |
| | | | | | | | |
% of U.S. mutual funds that outperformed passive peer median(2),(4) |
| | 1 year | | 3 years | | 5 years | | 10 years |
| Equity | | 55% | | 47% | | 43% | | 55% |
| Fixed Income | | 52% | | 52% | | 61% | | 63% |
| Multi-Asset | | 55% | | 60% | | 68% | | 64% |
| | | | | | | | |
| All Funds | | 54% | | 53% | | 56% | | 60% |
| | | | | | | | |
% of composites that outperformed benchmarks(5) |
| | 1 year | | 3 years | | 5 years | | 10 years |
| Equity | | 39% | | 29% | | 40% | | 61% |
| Fixed Income | | 60% | | 45% | | 56% | | 73% |
| | | | | | | | |
| | | | | | | | |
| All Composites | | 48% | | 36% | | 46% | | 65% |
| | | | | | | | | | | | | | | | | | | | | | | | | | |
| AUM Weighted Performance | | | | | | | | |
% of U.S. mutual funds AUM that outperformed Morningstar median(2),(3) |
| | 1 year | | 3 years | | 5 years | | 10 years |
| Equity | | 57% | | 58% | | 49% | | 80% |
| Fixed Income | | 66% | | 62% | | 64% | | 78% |
| Multi-Asset | | 70% | | 68% | | 90% | | 94% |
| | | | | | | | |
| All Funds | | 61% | | 61% | | 59% | | 83% |
| | | | | | | | |
% of U.S. mutual funds AUM that outperformed passive peer median(2),(4) |
| | 1 year | | 3 years | | 5 years | | 10 years |
| Equity | | 64% | | 36% | | 29% | | 55% |
| Fixed Income | | 68% | | 68% | | 85% | | 73% |
| Multi-Asset | | 71% | | 58% | | 95% | | 95% |
| | | | | | | | |
| All Funds | | 66% | | 43% | | 48% | | 66% |
| | | | | | | | |
% of composites AUM that outperformed benchmarks(5) |
| | 1 year | | 3 years | | 5 years | | 10 years |
| Equity | | 50% | | 21% | | 42% | | 53% |
| Fixed Income | | 65% | | 37% | | 47% | | 69% |
| | | | | | | | |
| | | | | | | | |
| All Composites | | 52% | | 24% | | 43% | | 55% |
| | | | | | | | |
|
|
As of December 31, 2024, 54 of 90 (60.0%) of our rated U.S. mutual funds (across primary share classes) received an overall rating of 4 or 5 stars. By comparison, 32.5% of Morningstar's fund population is given a rating of 4 or 5 stars(6). In addition, 63.0%(6) of AUM in our rated U.S. mutual funds (across primary share classes) ended 2024 with an overall rating of 4 or 5 stars.
(1) The investment performance reflects that of T. Rowe Price sponsored mutual funds and composites AUM.
(2) Source: © 2025 Morningstar, Inc. All rights reserved. The information contained herein: 1) is proprietary to Morningstar and/or its content providers; 2) may not be copied or distributed; and 3) is not warranted to be accurate, complete, or timely. Neither Morningstar nor its content providers are responsible for any damages or losses arising from any use of this information.
(3) Source: Morningstar. Primary share class only. Excludes money market mutual funds, funds with an operating history of less than one year, T. Rowe Price passive funds, and T. Rowe Price funds that are clones of other funds. The top chart reflects the percentage of T. Rowe Price funds with 1 year, 3 year, 5 year, and 10 year track record that are outperforming the Morningstar category median. The bottom chart reflects the percentage of T. Rowe Price funds AUM that has outperformed for the time periods indicated. Total Fund AUM included for this analysis includes $322B for 1 year, $318B for 3 years, $317B for 5 years, and $316B for 10 years.
(4) Passive Peer Median was created by T. Rowe Price using data from Morningstar. Primary share class only. Excludes money market mutual funds, funds with an operating history of less than one year, funds with fewer than three peers, T. Rowe Price passive funds, and T. Rowe Price funds that are clones of other funds. This analysis compares T. Rowe Price active funds with the applicable universe of passive/index open-end funds and ETFs of peer firms. The top chart reflects the percentage of T. Rowe Price funds with 1 year, 3 year, 5 year, and 10 year track record that are outperforming the passive peer universe. The bottom chart reflects the percentage of T. Rowe Price funds AUM that has outperformed for the time periods indicated. Total AUM included for this analysis includes $306B for 1 year, $302B for 3 years, $262B for 5 years, and $257B for 10 years.
(5)Composite net returns are calculated using the highest applicable separate account fee schedule. Excludes money market composites. All composites compared to official GIPS composite primary benchmark. The top chart reflects the percentage of T. Rowe Price composites with 1 year, 3 year, 5 year, and 10 year track record that are outperforming their benchmarks. The bottom chart reflects the percentage of T. Rowe Price composite AUM that has outperformed for the time periods indicated. Total AUM included for this analysis includes $1,423B for 1 year, $1,420B for 3 years, $1,418B for 5 years, and $1,367B for 10 years.
(6) The Morningstar Rating™ for funds is calculated for funds with at least a three-year history. Exchange-traded funds and open-ended mutual funds are considered a single population for comparative purposes. It is calculated based on a Morningstar Risk-Adjusted Return measure that accounts for variation in a managed product's monthly excess performance, placing more emphasis on downward variations and rewarding consistent performance. Morningstar gives its best ratings of 5 or 4 stars to the top 32.5% of all funds (of the 32.5%,10% get 5 stars and 22.5% get 4 stars). The Overall Morningstar Rating™ is derived from a weighted average of the performance figures associated with a fund’s 3, 5, and 10 year (if applicable) Morningstar Rating™ metrics.
RESULTS OF OPERATIONS.
The following table and discussion set forth information regarding our consolidated financial results for 2024, 2023 and 2022 on a U.S. GAAP basis and a non-GAAP basis. The non-GAAP basis adjusts for the impact of our consolidated investment products, the impact of market movements on the deferred compensation liabilities and related economic hedges, investment income related to certain other investments, acquisition-related amortization and costs, impairment charges, and certain nonrecurring charges and gains, if any.
| | | | | | | | | | | | | | | | | | | | | | | | | | | | | | | | | | | | | | | | | |
| | | 2024 compared to 2023 | | 2023 compared to 2022 |
| (in millions, except per-share data) | 2024 | | 2023 | | 2022 | | Change | | % Change (1) | | Change | | % Change (1) |
| | | | | | | | | | | | | |
| U.S. GAAP basis | | | | | | | | | | | | | |
Investment advisory fees(2) | $ | 6,399.7 | | | $ | 5,709.5 | | | $ | 5,962.7 | | | $ | 690.2 | | | 12.1 | % | | $ | (253.2) | | | (4.2) | % |
Performance-based advisory fees(2) | $ | 59.3 | | | $ | 38.2 | | | $ | 6.4 | | | $ | 21.1 | | | 55.2 | % | | $ | 31.8 | | | n/m |
Capital allocation-based income(3) | $ | 46.6 | | | $ | 161.9 | | | $ | (54.3) | | | $ | (115.3) | | | n/m | | $ | 216.2 | | | n/m |
| Net revenues | $ | 7,093.6 | | | $ | 6,460.5 | | | $ | 6,488.4 | | | $ | 633.1 | | | 9.8 | % | | $ | (27.9) | | | (0.4) | % |
| Operating expenses | $ | 4,760.3 | | | $ | 4,474.3 | | | $ | 4,114.7 | | | $ | 286.0 | | | 6.4 | % | | $ | 359.6 | | | 8.7 | % |
| Net operating income | $ | 2,333.3 | | | $ | 1,986.2 | | | $ | 2,373.7 | | | $ | 347.1 | | | 17.5 | % | | $ | (387.5) | | | (16.3) | % |
| Non-operating income | $ | 486.3 | | | $ | 504.1 | | | $ | (425.5) | | | $ | (17.8) | | | (3.5) | % | | $ | 929.6 | | | n/m |
| Net income to T. Rowe Price Group | $ | 2,100.1 | | | $ | 1,788.7 | | | $ | 1,557.9 | | | $ | 311.4 | | | 17.4 | % | | $ | 230.8 | | | 14.8 | % |
| Diluted earnings per common share | $ | 9.15 | | | $ | 7.76 | | | $ | 6.70 | | | $ | 1.39 | | | 17.9 | % | | $ | 1.06 | | | 15.8 | % |
| | | | | | | | | | | | | |
| | | | | | | | | | | | | |
Adjusted basis(4) | | | | | | | | | | | | | |
| Operating expenses | $ | 4,498.8 | | | $ | 4,260.7 | | | $ | 4,087.8 | | | $ | 238.1 | | | 5.6 | % | | $ | 172.9 | | | 4.2 | % |
| Operating expenses, excluding accrued carried interest related compensation | $ | 4,456.3 | | | $ | 4,190.7 | | | $ | 4,070.2 | | | $ | 265.6 | | | 6.3 | % | | $ | 120.5 | | | 3.0 | % |
| Net operating income | $ | 2,685.9 | | | $ | 2,263.2 | | | $ | 2,500.5 | | | $ | 422.7 | | | 18.7 | % | | $ | (237.3) | | | (9.5) | % |
| Non-operating income (loss) | $ | 148.7 | | | $ | 140.8 | | | $ | (24.4) | | | $ | 7.9 | | | 5.6 | % | | $ | 165.2 | | | n/m |
| Net income to T. Rowe Price Group | $ | 2,139.5 | | | $ | 1,750.1 | | | $ | 1,864.8 | | | $ | 389.4 | | | 22.3 | % | | $ | (114.7) | | | (6.2) | % |
| Diluted earnings per common share | $ | 9.33 | | | $ | 7.59 | | | $ | 8.02 | | | $ | 1.74 | | | 22.9 | % | | $ | (0.43) | | | (5.4) | % |
| | | | | | | | | | | | | |
| Assets under management (AUM) (in billions) | | | | | | | | | | |
| Average AUM | $ | 1,561.9 | | | $ | 1,362.3 | | | $ | 1,398.4 | | | $ | 199.6 | | | 14.7 | % | | $ | (36.1) | | | (2.6) | % |
| Ending AUM | $ | 1,606.6 | | | $ | 1,444.5 | | | $ | 1,274.7 | | | $ | 162.1 | | | 11.2 | % | | $ | 169.8 | | | 13.3 | % |
| | | | | | | | | | | | | |
| Investment advisory annualized effective fee rate (EFR) (in bps) | | | | | | |
| EFR without performance-based fees | 41.0 | | 41.9 | | 42.6 | | (0.9) | | | (2.1) | % | | (0.7) | | | (1.6) | % |
| EFR with performance-based fees | 41.4 | | 42.2 | | 42.7 | | (0.8) | | | (1.9) | % | | (0.5) | | | (1.2) | % |
(1) The percentage change is not meaningful (n/m).
(2) Performance-based advisory fees were previously included in investment advisory fees. Prior periods were recast to reflect this change.
(3) Capital allocation-based income represents the change in accrued carried interest.
(4) See the reconciliation to the comparable U.S. GAAP measures at the end of the Results of Operations section of this Management's Discussion and Analysis.
Results Overview - 2024 compared to 2023
Investment advisory fees are earned based on the value and composition of our assets under management, which change based on fluctuations in financial markets, investment performance, and net cash flows. As our average assets under management increase or decrease in a given period, the level of our investment advisory fees for that same period generally fluctuate in a similar manner. Our annualized effective fee rates can be impacted by market or cash flow related shifts among asset and share classes, shifts among vehicles, price changes in existing products, and asset level changes in products with tiered-fee structures.
Investment advisory fees earned in 2024 increased 12.1% compared to 2023 as average assets under management increased $199.6 billion, or 14.7%, to $1,561.9 billion.
The average annualized effective fee rate, excluding performance-based advisory fees, earned on our assets under management was 41.0 basis points in 2024, compared to 41.9 basis points earned in 2023. Our effective fee rate has declined largely due to a mix shift in assets toward lower fee products and asset classes from client flows and transfers, partially offset by higher market returns. The average annualized fee rate, excluding performance-based fees, was 40.5 basis points for the fourth quarter of 2024.
Operating expenses were $4,760.3 million in 2024, an increase of 6.4% compared to 2023. The increase was primarily driven by higher compensation costs, distribution and servicing costs, and advertising and promotion costs. Additionally, 2023 included a $82.4 million reduction in operating expenses related to the remeasurement of the contingent consideration liability compared to a $13.4 million reduction in 2024.
On a non-GAAP basis, operating expenses were $4,498.8 million, an increase of 5.6% compared to 2023. The increase in our non-GAAP operating expenses was primarily driven by higher costs across compensation and benefits, distribution and servicing, advertising, professional fees, and a non-recurring recovery of general and administrative costs recognized in 2023. These increases were partially offset by lower external research fees, lower accrued carried interest compensation, and higher capitalized labor. In 2024, the firm changed its approach to paying for external research, consistent with regulations and general industry practice.
We currently estimate our 2025 non-GAAP operating expenses, excluding non-GAAP accrued carried interest compensation, will grow in the range of 4%-6% from the 2024 amount of $4,456.3 million. We could elect to adjust our expense growth should unforeseen circumstances arise, including significant market movements.
Operating margin was 32.9% in 2024 compared to 30.7% in 2023. The increase is primarily driven by net revenue growth outpacing operating expense growth primarily due to higher average assets under management.
Diluted earnings per share was $9.15 in 2024 compared to $7.76 in 2023. The increase in GAAP basis diluted earnings per share was primarily due to higher operating income and a lower effective tax rate.
On a non-GAAP basis, diluted earnings per share was $9.33 in 2024 compared to $7.59 in 2023. The increase was primarily due to higher operating income and a lower effective tax rate.
See our non-GAAP reconciliations later in this Management's Discussion and Analysis section.
Results Overview - 2023 compared to 2022
Investment advisory fees are earned based on the value and composition of our assets under management, which change based on fluctuations in financial markets and net cash flows. As our average assets under management increase or decrease in a given period, the level of our investment advisory fees for that same period generally fluctuates in a similar manner. Our annualized effective fee rates can be impacted by market or cash flow related shifts among asset and share classes, price changes in existing products, and asset level changes in products with tiered-fee structures.
Investment advisory fees earned in 2023 decreased 3.7% over the comparable 2022 period as average assets under our management decreased $36.1 billion, or 2.6%, to $1,362.3 billion.
The average annualized effective fee rate earned on our assets under management was 41.9 basis points in 2023, compared to 42.6 basis points earned in 2022. Our effective fee rate has declined largely due to a mix shift toward lower fee asset classes and vehicles as a result of net equity outflows, partially offset by higher market returns. The average annualized fee rate earned on our assets under management was 41.5 basis points for the fourth quarter of 2023.
Operating expenses were $4,474.3 million in 2023, an increase of 8.7% over the comparable 2022 period. The impact of market movements on the supplemental savings plan liability accounted for about 70% of the increase in U.S. GAAP operating expenses. Non-operating income has a corresponding increase due to our economic hedge of the liability.
On a non-GAAP basis, operating expenses were $4,260.7 million, a 4.2% increase over the comparable 2022 period. The increase in our non-GAAP operating expenses was primarily driven by higher costs across compensation and benefits, accrued carried interest related compensation expense, technology, facility, advertising, and professional fees. These increases were offset in part by higher capitalized labor, lower stock-based compensation, and a non-recurring recovery of general and administrative costs incurred in 2022.
Operating margin was 30.7% in 2023, compared to 36.6% in 2022. The decrease in our operating margin in 2023 compared to 2022 is primarily driven by a decrease in investment advisory fees as a result of lower average assets under management and higher operating expenses.
Diluted earnings per share. Diluted earnings per share was $7.76 in 2023 compared to $6.70 in 2022. The increase in 2023 GAAP basis diluted earnings per share from 2022 was primarily due to net investment income in 2023 compared to net investment losses in 2022. These increases were partially offset by lower operating income and a higher effective tax rate.
On a non-GAAP basis, diluted earnings per share was $7.59 in 2023 compared to $8.02 in 2022. The decrease in 2023 was primarily due to lower operating income and a higher effective tax rate. These decreases were offset by net investment income earned on our cash and discretionary investment portfolio in 2023 compared to net investment losses in 2022.
See our non-GAAP reconciliations later in this Management's Discussion and Analysis section.
Net revenues
| | | | | | | | | | | | | | | | | | | | | | | | | | | | | | | | | | | | | | | | | |
| | | 2024 compared to 2023 | | 2023 compared to 2022 |
| (in millions) | 2024 | | 2023 | | 2022 | | $ Change | | % Change(1) | | $ Change | | % Change(1) |
Investment advisory fees(2) | | | | | | | | | | | | | |
| Equity | $ | 3,864.7 | | | $ | 3,442.3 | | | $ | 3,758.4 | | | $ | 422.4 | | | 12.3 | % | | $ | (316.1) | | | (8.4) | % |
| Fixed income, including money markets | 410.7 | | | 400.4 | | | 426.3 | | | 10.3 | | | 2.6 | % | | (25.9) | | | (6.1) | % |
| Multi-asset | 1,814.1 | | | 1,583.4 | | | 1,508.9 | | | 230.7 | | | 14.6 | % | | 74.5 | | | 4.9 | % |
| Alternatives | 310.2 | | | 283.4 | | | 269.1 | | | 26.8 | | | 9.5 | % | | 14.3 | | | 5.3 | % |
| 6,399.7 | | | 5,709.5 | | | 5,962.7 | | | 690.2 | | | 12.1 | % | | (253.2) | | | (4.2) | % |
Performance-based advisory fees(2) | 59.3 | | | 38.2 | | | 6.4 | | | 21.1 | | | 55.2 | % | | 31.8 | | | n/m |
| Capital allocation-based income | 46.6 | | | 161.9 | | | (54.3) | | | (115.3) | | | n/m | | 216.2 | | | n/m |
| Administrative, distribution, and servicing fees | | | | | | | | | | | | | |
| Administrative fees | 498.8 | | | 467.5 | | | 481.4 | | | 31.3 | | | 6.7 | % | | (13.9) | | | (2.9) | % |
| Distribution and servicing fees | 89.2 | | | 83.4 | | | 92.2 | | | 5.8 | | | 7.0 | % | | (8.8) | | | (9.5) | % |
| 588.0 | | | 550.9 | | | 573.6 | | | 37.1 | | | 6.7 | % | | (22.7) | | | (4.0) | % |
| Net revenues | $ | 7,093.6 | | | $ | 6,460.5 | | | $ | 6,488.4 | | | $ | 633.1 | | | 9.8 | % | | $ | (27.9) | | | (0.4) | % |
| | | | | | | | | | | | | |
| Average AUM (in billions): | | | | | | | | | | | | | |
| Equity | $ | 804.3 | | | $ | 705.2 | | | $ | 763.6 | | | $ | 99.1 | | | 14.1 | % | | $ | (58.4) | | | (7.6) | % |
| Fixed income, including money market | 178.6 | | | 169.3 | | | 173.4 | | | 9.3 | | | 5.5 | % | | (4.1) | | | (2.4) | % |
| Multi-asset | 529.0 | | | 442.3 | | | 418.7 | | | 86.7 | | | 19.6 | % | | 23.6 | | | 5.6 | % |
| Alternatives | 50.0 | | | 45.5 | | | 42.7 | | | 4.5 | | | 9.9 | % | | 2.8 | | | 6.6 | % |
| Average AUM | $ | 1,561.9 | | | $ | 1,362.3 | | | $ | 1,398.4 | | | $ | 199.6 | | | 14.7 | % | | $ | (36.1) | | | (2.6) | % |
| | | | | | | | | | | | | |
| Ending AUM (in billions) | $ | 1,606.6 | | | $ | 1,444.5 | | | $ | 1,274.7 | | | $ | 162.1 | | | 11.2 | % | | $ | 169.8 | | | 13.3 | % |
(1) n/m - the percentage change is not meaningful.
(2) Performance-based advisory fees were previously included in investment advisory fees. Prior periods were recast to reflect this change.
Investment advisory fees. The relationship between the change in average assets under management and the change in investment advisory fees for 2024, 2023 and 2022 are presented above.
In 2024, the increase in investment advisory fees was due to higher average AUM as stronger market returns and appreciation were offset by net outflows over the last two years.
In 2023, the decline in overall advisory revenues was driven by lower average AUM and a mix shift toward lower fee asset classes and vehicles. A lower starting AUM and net outflows in 2023 were the primary drivers of a lower average AUM in 2023. These impacts were partially offset by stronger overall market returns in 2023.
Performance-based advisory fees in each period were primarily related to alternative strategies.
Capital allocation-based income increased net revenues by $46.6 million. The 2024 amount includes an increase of $134.1 million in accrued carried interest from investments in affiliated investment funds, partially offset by $87.5 million of non-cash amortization and impairments related to acquisition-date asset basis differences. Impairments recognized in 2024 were $36.6 million, and should market and performance conditions deteriorate, additional impairments may be recognized in future periods. The firm realized carried interest of $139.6 million compared to $109.8 million in the 2023 period.
For 2023, capital allocation-based income increased net revenues by $161.9 million. This amount includes an increase of $223.2 million in accrued carried interest, partially offset by $61.3 million of non-cash amortization and impairments related to the difference in the acquisition closing date fair value and the carrying value on the date they were acquired.
A portion of the capital allocation-based income is passed through as compensation and recognized in compensation and related costs, with the unpaid amount reported as non-controlling interest on the consolidated balance sheet. In 2024, the compensation expense was $5.4 million, consisting of $42.5 million related to the accrued carried interest offset in part by $37.1 million in amortization and impairment charges. For 2023, we recognized compensation expense of $44.6 million, consisting of $70.0 million in compensation expense related to the accrued carried interest offset in part by $25.4 million in amortization and impairment charges.
Administrative, distribution, and servicing fees in 2024 were $588.0 million, an increase of $37.1 million compared to 2023. The increase was primarily driven by higher average assets on which we earn non-discretionary advisory services revenue and higher transfer agent servicing activities provided to the T. Rowe Price mutual funds.
For 2023, the decrease was primarily driven by lower transfer agent servicing activities provided to the T. Rowe Price mutual funds, and lower 12b-1 revenue earned from the Advisor and R share classes of the U.S. mutual funds as a result of lower average assets under management in these share classes. The decrease in 12b-1 revenue was offset entirely by a decrease in the costs paid to third-party intermediaries that source these assets and is reported in distribution and servicing expense.
Net revenues are presented after the elimination of $3.6 million for 2024, $2.1 million for 2023, and $2.0 million for 2022, earned from our consolidated investment products. The corresponding expenses recognized by these consolidated investment products were also eliminated from operating expenses.
Operating expenses
| | | | | | | | | | | | | | | | | | | | | | | | | | | | | | | | | | | | | | | | | |
| | | 2024 compared to 2023 | | 2023 compared to 2022 |
| (in millions) | 2024 | | 2023 | | 2022 | | $ Change | | % Change | | $ Change | | % Change |
| Compensation, benefits, and related costs | $ | 2,603.4 | | | $ | 2,450.7 | | | $ | 2,405.8 | | | $ | 152.7 | | | 6.2 | % | | $ | 44.9 | | | 1.9 | % |
| Acquisition-related retention agreements | 44.8 | | | 55.0 | | | 70.2 | | | (10.2) | | | (18.5) | % | | (15.2) | | | (21.7) | % |
| Capital allocation-based income compensation | 5.4 | | | 44.6 | | | (22.9) | | | (39.2) | | | n/m | | 67.5 | | | n/m |
| Deferred compensation liabilities | 104.3 | | | 123.2 | | | (132.3) | | | (18.9) | | | (15.3) | % | | 255.5 | | | n/m |
| Compensation and related costs | 2,757.9 | | | 2,673.5 | | | 2,320.8 | | | 84.4 | | | 3.2 | % | | 352.7 | | | 15.2 | % |
| Distribution and servicing costs | 354.1 | | | 289.9 | | | 301.5 | | | 64.2 | | | 22.1 | % | | (11.6) | | | (3.8) | % |
| Advertising and promotion | 129.6 | | | 114.2 | | | 97.3 | | | 15.4 | | | 13.5 | % | | 16.9 | | | 17.4 | % |
| Product and recordkeeping related costs | 297.5 | | | 291.0 | | | 300.1 | | | 6.5 | | | 2.2 | % | | (9.1) | | | (3.0) | % |
| Technology, occupancy, and facility costs | 644.1 | | | 632.6 | | | 560.5 | | | 11.5 | | | 1.8 | % | | 72.1 | | | 12.9 | % |
| General, administrative, and other | 433.8 | | | 421.3 | | | 412.2 | | | 12.5 | | | 3.0 | % | | 9.1 | | | 2.2 | % |
| Change in fair value of contingent consideration | (13.4) | | | (82.4) | | | (161.2) | | | 69.0 | | | (83.7) | % | | 78.8 | | | (48.9) | % |
| Acquisition-related amortization and impairment costs | 156.7 | | | 134.2 | | | 283.5 | | | 22.5 | | | 16.8 | % | | (149.3) | | | (52.7) | % |
| | | | | | | | | | | | | |
| Total operating expenses | $ | 4,760.3 | | | $ | 4,474.3 | | | $ | 4,114.7 | | | $ | 286.0 | | | 6.4 | % | | $ | 359.6 | | | 8.7 | % |
| | | | | | | | | | | | | |
Total adjusted operating expenses(1) | $ | 4,498.8 | | | $ | 4,260.7 | | | $ | 4,087.8 | | | $ | 238.1 | | | 5.6 | % | | $ | 172.9 | | | 4.2 | % |
(1) See the reconciliation to the comparable U.S. GAAP measures at the end of the Results of Operations section of this Management's Discussion and Analysis.
Compensation, benefits and related costs were $2,603.4 million, an increase of $152.7 million, or 6.2%, compared to 2023. The increase was driven by a higher bonus pool on an increase in revenue and higher salaries and related benefits partially offset by higher capitalized labor and lower other employee related costs. The firm employed 8,158 associates at December 31, 2024, an increase of 3.2% from the end of 2023.
For 2023, compensation, benefits and related costs were $2,450.7 million, an increase of $44.9 million, or 1.9%, compared to 2022. The increase was driven by $99.1 million in higher salaries and related benefits as a result of base salary increases in January 2023 and July 2022. These increases were offset by higher capitalized labor, lower non-cash stock-based compensation, and lower other employee-related costs.
Distribution and servicing costs were $354.1 million for 2024, an increase of $64.2 million, or 22.1%, compared to $289.9 million in 2023. The increase was primarily driven by higher average assets under management distributed through intermediaries.
For 2023, distribution and services costs were $289.9 million, a decrease of $11.6 million, or 3.8%, compared to 2022. The decrease was primarily driven by lower average assets under management in certain share classes of the U.S. mutual funds that earn 12b-1 fees and SICAVs. These decreases were partially offset by higher costs incurred to distribute certain products through U.S. intermediaries as the average assets under management in these products were higher.
The costs in this expense category primarily include amounts paid to third-party intermediaries that source the assets of certain share classes of our U.S. mutual funds, ETFs and our international products, such as our Japanese ITMs and SICAVs. These costs were offset entirely by the distribution revenue we earn and report in net revenues: 12b-1 revenue is recognized in administrative, distribution, and servicing fees for the Advisor and R share classes of the U.S. mutual funds and investment advisory fees for our international products.
Advertising and promotion costs were $129.6 million for 2024, an increase of $15.4 million, or 13.5%, compared to 2023. The increase was primarily driven by higher media advertising.
For 2023, advertising and promotion costs were $114.2 million, an increase of $16.9 million, or 17.4%, compared to 2022. The increase was primarily driven by higher media advertising and agency costs in 2023.
Product and recordkeeping related costs were $297.5 million for 2024, an increase of $6.5 million, or 2.2%, compared to 2023. The increase was primarily driven by higher product related costs to be reimbursed from our sponsored investment products partially offset by lower recordkeeping related costs.
For 2023, product and recordkeeping related costs were $291.0 million for 2023, a decrease of $9.1 million, or 3.0%, compared to 2022. The decrease was driven by lower recordkeeping related costs.
Technology, occupancy, and facility costs were $644.1 million for 2024, an increase of $11.5 million or 1.8%, compared to 2023. The increase was due to ongoing investment in our technology capabilities, primarily hosted solutions, partially offset by lower facility costs as 2023 included the rent cost of two London facilities until we occupied our new building in September 2023.
For 2023, technology, occupancy, and facility costs were $632.6 million, an increase of $72.1 million or 12.9%, compared to 2022. The increase was primarily due to ongoing investment in our technology capabilities, including depreciation and hosting solution licenses, and increased office facility costs, mainly related to rent expense associated with a new London office that we began leasing in the second half of 2022 and occupied in September 2023.
General, administrative, and other costs were $433.8 million for 2024, an increase of $12.5 million or 3.0%, compared to 2023. The increase was primarily due to a cost recovery recognized in 2023 that did not recur in 2024, higher professional fees and travel costs. These increases were partially offset by lower external research fees and other general and administrative costs. In 2024, the firm changed its approach to paying for external research, consistent with regulations and general industry practice.
For 2023, general, administrative, and other costs were $421.3 million, an increase of $9.1 million or 2.2% compared to 2022. The increase was primarily due to higher professional fees and travel costs, partially offset by a $20.8 million recovery of nonrecurring costs that were incurred in 2022.
Change in fair value of contingent consideration. Our contingent consideration consists of an earnout arrangement as part of the 2021 acquisition of OHA in which additional purchase price may be due to the sellers upon satisfying or exceeding certain defined revenue targets. Each reporting period, we record the fair value of the contingent consideration due under this arrangement. Reduced revenue expectations have resulted in a reduction in the fair value of the contingent consideration liability of $13.4 million in 2024, $82.4 million in 2023, and $161.2 million in 2022. The fair value of the contingent consideration liability as of December 31, 2024 is zero.
Acquisition-related amortization and impairment costs primarily relate to the indefinite- and definite-lived intangible assets identified and separately recognized, at fair value, on acquisition date. In 2024, we recognized acquisition-related amortization and impairment costs of $156.7 million, an increase of $22.5 million or 16.8%, compared to 2023. The increase was primarily driven by impairment charges related to the trade name intangible asset.
For 2023, we recognized acquisition-related amortization and impairment costs of $134.2 million, a decrease of $149.3 million, compared to 2022. The decrease was primarily driven by an insignificant amount of impairment charges in 2023 for certain intangibles compared to $175.1 million in 2022.
The impairment charges for both periods were the result of reduced growth expectations for both investment management and incentive fees and higher discount rate compared to when the acquisition closed in 2021.
The remaining weighted average amortization period for our definite-lived intangible assets is 3.7 years. Should conditions that led us to recognize these impairment charges worsen, additional impairments may be recognized in future periods.
Non-operating income (loss)
Non-operating income was $486.3 million in 2024 compared to $504.1 million in 2023 and a non-operating loss of $425.5 million in 2022. Non-operating activity for the years ended December 31, 2024, 2023 and 2022 are as follows:
| | | | | | | | | | | | | | | | | | | | | | | | | | | | | |
| | | | | | | 2024 compared to 2023 | | 2023 compared to 2022 |
| (in millions) | 2024 | | 2023 | | 2022 | | $ Change | | $ Change |
| Net gains (losses) from non-consolidated sponsored investment products | | | | | | | | | |
| Cash and discretionary investments | | | | | | | | | |
| Dividend income | $ | 138.6 | | | $ | 109.1 | | | $ | 34.7 | | | $ | 29.5 | | | $ | 74.4 | |
| Market related gains (losses) and equity in earnings (losses) | 4.8 | | | 24.5 | | | (59.1) | | | (19.7) | | | 83.6 | |
| Total cash and discretionary investments | 143.4 | | | 133.6 | | | (24.4) | | | 9.8 | | | 158.0 | |
| Seed capital investments | | | | | | | | | |
| Dividend income | 2.4 | | | 1.8 | | | 0.8 | | | 0.6 | | | 1.0 | |
| Market related gains (losses) and equity in earnings (losses) | 62.0 | | | 50.3 | | | (60.1) | | | 11.7 | | | 110.4 | |
| Total seed capital investments | 64.4 | | | 52.1 | | | (59.3) | | | 12.3 | | | 111.4 | |
| Total cash, discretionary, and seed investments | 207.8 | | | 185.7 | | | (83.7) | | | 22.1 | | | 269.4 | |
| Net gains recognized upon deconsolidation | (0.4) | | | — | | | 3.0 | | | (0.4) | | | (3.0) | |
| Investments used to hedge the deferred compensation liabilities | 96.4 | | | 123.6 | | | (139.4) | | | (27.2) | | | 263.0 | |
| Total net gains (losses) from non-consolidated investment products | 303.8 | | | 309.3 | | | (220.1) | | | (5.5) | | | 529.4 | |
| Other investment income | 59.4 | | | 45.9 | | | 15.4 | | | 13.5 | | | 30.5 | |
| Net gains (losses) on investments | 363.2 | | | 355.2 | | | (204.7) | | | 8.0 | | | 559.9 | |
| Net gains (losses) on consolidated investment portfolios | 130.3 | | | 164.6 | | | (203.5) | | | (34.3) | | | 368.1 | |
| Other losses, including foreign currency losses | (7.2) | | | (15.7) | | | (17.3) | | | 8.5 | | | 1.6 | |
| Non-operating income (loss) | $ | 486.3 | | | $ | 504.1 | | | $ | (425.5) | | | $ | (17.8) | | | $ | 929.6 | |
| | | | | | | | | |
Adjusted non-operating income (loss)(1) | $ | 148.7 | | | $ | 140.8 | | | $ | (24.4) | | | $ | 7.9 | | | $ | 165.2 | |
(1) See the reconciliation to the comparable U.S. GAAP measures at the end of the Results of Operations section of this Management's Discussion and Analysis.
In 2024 and 2023, strong market returns contributed to the increased valuation and gains of our investment portfolio, along with higher cash balances and interest rates increased dividend income. In 2022, our overall investment portfolio valuations were negatively impacted by market declines caused by the continued elevated inflation, supply chain disruptions, and a more aggressive pace of Federal Reserve interest rate increases.
The impact of consolidating investment products on the individual lines of our consolidated statements of income for 2024, 2023, and 2022 is as follows:
| | | | | | | | | | | | | | | | | | | | | | | | | | | | | | | | |
| | | 2024 compared to 2023 | | | | 2023 compared to 2022 |
| (in millions) | 2024 | | 2023 | | 2022 | | $ Change | | | | $ Change | |
| Operating expenses reflected in net operating income | $ | (9.8) | | | $ | (11.1) | | | $ | (8.2) | | | $ | 1.3 | | | | | $ | (2.9) | | |
| Net investment income (loss) reflected in non-operating income | 130.3 | | | 164.6 | | | (203.5) | | | (34.3) | | | | | 368.1 | | |
| Impact on income before taxes | $ | 120.5 | | | $ | 153.5 | | | $ | (211.7) | | | $ | (33.0) | | | | | $ | 365.2 | | |
| | | | | | | | | | | | |
| Net income (loss) attributable to our interest in the consolidated investment products | $ | 84.8 | | | $ | 106.5 | | | $ | (103.4) | | | $ | (21.7) | | | | | $ | 209.9 | | |
| Net income (loss) attributable to redeemable non-controlling interests (unrelated third-party investors) | 35.7 | | | 47.0 | | | (108.3) | | | (11.3) | | | | | 155.3 | | |
| Impact on income before taxes | $ | 120.5 | | | $ | 153.5 | | | $ | (211.7) | | | $ | (33.0) | | | | | $ | 365.2 | | |
Provision for income taxes
The following table reconciles the statutory federal income tax rate to our effective tax rate for the years ended December 31, 2024, 2023, and 2022:
| | | | | | | | | | | | | | | | | |
| 2024 | | 2023 | | 2022 |
| Statutory U.S. federal income tax rate | 21.0 | % | | 21.0 | % | | 21.0 | % |
| | | | | |
| | | | | |
State income taxes for current year, net of federal income tax benefits(1) | 2.9 | | | 2.3 | | | 3.4 | |
Net income attributable to redeemable non-controlling interests(2) | (0.3) | | | (0.5) | | | 1.3 | |
| Net excess tax benefits from stock-based compensation plans activity | (0.2) | | | 0.1 | | | (0.4) | |
| Valuation allowance | 0.2 | | | 3.4 | | | — | |
| Other items | 0.7 | | | — | | | 0.3 | |
| Effective income tax rate | 24.3 | % | | 26.3 | % | | 25.6 | % |
(1) State income tax benefits are reflected in the total benefits for net income attributable to redeemable non-controlling interests and stock-based compensation plans activity.
(2) Net income attributable to redeemable non-controlling interests represents the portion of earnings held in the firm's consolidated investment products, which are not taxable to the firm despite being included in pre-tax income.
Our effective tax rate for 2024 was 24.3%, compared to 26.3% for 2023 and 25.6% for 2022. The decrease in our effective tax rate in 2024 from 2023 was primarily due to lower valuation allowances recognized in 2024. These favorable impacts were slightly offset by higher state taxes.
For 2023, the increase in our effective tax rate from 2022 was primarily due to an increase in the valuation allowances recorded mainly against UK-based deferred tax assets, including net operating losses, and a decrease in discrete tax benefits associated with option exercises and restricted stock vests. These unfavorable impacts were partially offset by a favorable impact of net gains attributable to redeemable non-controlling interests held in our consolidated investment products and state tax liability settlements.
The non-GAAP tax rate primarily adjusts for the impact of the consolidated investment products, including net income attributable to redeemable non-controlling interests. Our non-GAAP effective tax rates were 24.5% for 2024, 27.2% for 2023, and 24.7% for 2022.
Our effective tax rate will continue to experience volatility in future periods due to, among other things, the impact on the stock-based compensation tax benefits recognized from market fluctuations in our stock price and timing of option exercises, changes in the mix of our earnings among countries with differing tax laws, and changes in the valuation allowance of foreign-based deferred tax assets. As of December 31, 2024, the total valuation allowance recorded was $118.9 million, of which nearly all is related to UK-based deferred tax assets. We intend to continue maintaining a full valuation allowance on these and future deferred tax assets until there is sufficient evidence to support the reversal of all or some portion of these allowances. Our U.S. GAAP effective tax rate is also impacted by changes in the proportion of net income that is attributable to our redeemable non-controlling interests, non-controlling interests reflected in permanent equity and the remeasurement of the contingent consideration liability.
We currently estimate our effective tax rates for the full-year 2025 will be in the range of 23.0% to 27.0% on a GAAP basis, and 23.0% to 26.0% on a non-GAAP basis.
The Organization of Economic Co-operation and Development has issued Pillar Two Model Rules (Pillar Two) introducing a global 15% minimum tax effective January 1, 2024 within certain countries where we operate. For countries that have adopted Pillar Two in 2024, it did not have a material impact on the company's consolidated results of operations, cash flows, and overall financial position. We will continue to monitor and evaluate the impacts of future Pillar Two legislation proposed or enacted in jurisdictions that have not yet adopted the rules.
NON-GAAP INFORMATION AND RECONCILIATION.
We believe the non-GAAP financial measures below provide relevant and meaningful information to investors about our core operating results. These measures have been established in order to increase transparency for the purpose of evaluating our core business, for comparing current results with prior period results, and to enable more appropriate comparison with industry peers. However, non-GAAP financial measures should not be considered a substitute for financial measures calculated in accordance with U.S. GAAP and may be calculated differently by other companies.
The following schedules reconcile certain U.S. GAAP financial measures for each of the last three years.
| | | | | | | | | | | | | | | | | | | | | | | | | | | | | | | | | | | |
| 2024 |
| (in millions, except per-share amount) | Operating expenses | | Net operating income | | Non-operating income (loss) | | Provision (benefit) for income taxes(6) | | Net income attributable to T. Rowe Price Group, Inc. | | Diluted earnings per share(7) |
| U.S. GAAP Basis (FS line item) | $ | 4,760.3 | | | $ | 2,333.3 | | | $ | 486.3 | | | $ | 683.8 | | | $ | 2,100.1 | | | $ | 9.15 | |
| Non-GAAP adjustments: | | | | | | | | | | | |
| Acquisition-related: | | | | | | | | | | | |
Investment and NCI amortization and impairments(1) (Capital allocation-based income and Compensation and related costs) | 37.1 | | | 50.4 | | | — | | | 10.2 | | | 40.2 | | | 0.18 | |
Acquisition-related retention arrangements(1) (Compensation and related costs) | (44.8) | | | 44.8 | | | — | | | 10.4 | | | 34.4 | | | 0.15 | |
Contingent consideration(1) | 13.4 | | | (13.4) | | | — | | | (1.8) | | | (11.6) | | | (0.05) | |
Intangible assets amortization and impairments(1) | (156.7) | | | 156.7 | | | — | | | 32.2 | | | 124.5 | | | 0.54 | |
| | | | | | | | | | | |
| Total acquisition-related | (151.0) | | | 238.5 | | | — | | | 51.0 | | | 187.5 | | | 0.82 | |
Deferred compensation liabilities(3) (Compensation and related costs) | (104.3) | | | 104.3 | | | (96.4) | | | 1.7 | | | 6.2 | | | 0.03 | |
Consolidated investment products(4) | (6.2) | | | 9.8 | | | (130.3) | | | (17.5) | | | (67.3) | | | (0.29) | |
Other non-operating income(5) | — | | | — | | | (110.9) | | | (23.9) | | | (87.0) | | | (0.38) | |
| Adjusted Non-GAAP Basis | $ | 4,498.8 | | | $ | 2,685.9 | | | $ | 148.7 | | | $ | 695.1 | | | $ | 2,139.5 | | | $ | 9.33 | |
| | | | | | | | | | | | | | | | | | | | | | | | | | | | | | | | | | | |
| 2023 |
| (in millions, except per-share amount) | Operating expenses | | Net operating income | | Non-operating income (loss) | | Provision (benefit) for income taxes(6) | | Net income attributable to T. Rowe Price Group, Inc. | | Diluted earnings per share(7) |
| U.S. GAAP Basis (FS line item) | $ | 4,474.3 | | | $ | 1,986.2 | | | $ | 504.1 | | | $ | 654.6 | | | $ | 1,788.7 | | | $ | 7.76 | |
| Non-GAAP adjustments: | | | | | | | | | | | |
| Acquisition-related: | | | | | | | | | | | |
Investment and NCI amortization and impairments(1) (Capital allocation-based income and Compensation and related costs) | 25.4 | | | 35.9 | | | — | | | 7.9 | | | 28.0 | | | 0.12 | |
Acquisition-related retention arrangements(1) (Compensation and related costs) | (55.0) | | | 55.0 | | | — | | | 10.8 | | | 44.2 | | | 0.19 | |
Contingent consideration(1) | 82.4 | | | (82.4) | | | — | | | (10.6) | | | (71.8) | | | (0.31) | |
Intangible assets amortization and impairments(1) | (134.2) | | | 134.2 | | | — | | | 28.8 | | | 105.4 | | | 0.46 | |
| | | | | | | | | | | |
| Total acquisition-related | (81.4) | | | 142.7 | | | — | | | 36.9 | | | 105.8 | | | 0.46 | |
Deferred compensation liabilities(3) (Compensation and related costs) | (123.2) | | | 123.2 | | | (123.6) | | | 0.5 | | | (0.9) | | | — | |
Consolidated investment products(4) | (9.0) | | | 11.1 | | | (164.6) | | | (22.3) | | | (84.2) | | | (0.37) | |
Other non-operating income(5) | — | | | — | | | (75.1) | | | (15.8) | | | (59.3) | | | (0.26) | |
| Adjusted Non-GAAP Basis | $ | 4,260.7 | | | $ | 2,263.2 | | | $ | 140.8 | | | $ | 653.9 | | | $ | 1,750.1 | | | $ | 7.59 | |
| | | | | | | | | | | | | | | | | | | | | | | | | | | | | | | | | | | |
| 2022 |
| (in millions, except per-share amount) | Operating expenses | | Net operating income | | Non-operating income (loss) | | Provision (benefit) for income taxes(6) | | Net income attributable to T. Rowe Price Group, Inc. | | Diluted earnings per share(7) |
| U.S. GAAP Basis (FS line item) | $ | 4,114.7 | | | $ | 2,373.7 | | | $ | (425.5) | | | $ | 498.6 | | | $ | 1,557.9 | | | $ | 6.70 | |
| Non-GAAP adjustments: | | | | | | | | | | | |
| Acquisition-related: | | | | | | | | | | | |
Investment and NCI amortization and impairments(1) (Capital allocation-based income and Compensation and related costs) | 40.5 | | | 57.5 | | | — | | | 15.5 | | | 42.0 | | | 0.18 | |
Acquisition-related retention arrangements(1) (Compensation and related costs) | (70.2) | | | 70.2 | | | — | | | 18.9 | | | 51.3 | | | 0.22 | |
Contingent consideration(1) | 161.2 | | | (161.2) | | | — | | | (43.3) | | | (117.9) | | | (0.52) | |
Intangible assets amortization and impairments(1) | (283.5) | | | 283.5 | | | — | | | 76.2 | | | 207.3 | | | 0.89 | |
Transaction costs(2) (General, administrative and other) | (0.9) | | | 0.9 | | | — | | | 0.2 | | | 0.7 | | | 0.01 | |
| Total acquisition-related | (152.9) | | — | | 250.9 | | — | | — | | — | | 67.5 | | — | | 183.4 | | — | | 0.78 | |
Deferred compensation liabilities(3) (Compensation and related costs) | 132.3 | | | (132.3) | | | 139.4 | | | 1.9 | | | 5.2 | | | 0.02 | |
Consolidated investment products(4) | (6.3) | | | 8.2 | | | 203.5 | | | 27.8 | | | 75.6 | | | 0.33 | |
Other non-operating income(5) | — | | | — | | | 58.2 | | | 15.5 | | | 42.7 | | | 0.19 | |
| Adjusted Non-GAAP Basis | $ | 4,087.8 | | | $ | 2,500.5 | | | $ | (24.4) | | | $ | 611.3 | | | $ | 1,864.8 | | | $ | 8.02 | |
(1) These non-GAAP adjustments remove the impact of acquisition-related amortization and costs, including amortization of intangible assets, the recurring fair value remeasurements of the contingent consideration liability, amortization of acquired investment and non-controlling interest basis differences and amortization of compensation-related arrangements. We believe adjusting for these charges helps the reader's ability to understand our core operating results and increases comparability period to period.
(2) This non-GAAP adjustment removes acquisition-related transactions costs. We believe adjusting for these charges helps the reader's ability to understand our core operating results and increases comparability period to period.
(3) This non-GAAP adjustment removes the compensation expense impact from market valuation changes in the deferred compensation liabilities, which include the supplemental savings plan and, beginning in the fourth quarter of 2024, restricted fund units, and the related net gains (losses) on investments designated as economic hedges against the related liabilities. The liabilities are adjusted for appreciation (depreciation) of hypothetical investments chosen by participants. We use investment products to economically hedge the market risk associated with the supplemental savings plan liability and the expected settlement value of unvested restricted fund units. We believe it is useful to offset the non-operating investment income (loss) recognized on the economic hedges against the related compensation expense and remove the net impact to help the reader's ability to understand the firm's core operating results and to increase comparability period to period.
(4) This non-GAAP adjustment removes the impact the consolidated investment products have on our U.S. GAAP consolidated statements of income. Specifically, we add back the operating expenses and subtract the investment income of the consolidated investment products. The adjustment to operating expenses represents the operating expenses of the consolidated investment products, net of the elimination of related investment advisory and administrative fees. The adjustment to net income attributable to T. Rowe Price Group, Inc. represents the net income of the consolidated investment products, net of redeemable non-controlling interests. We believe adjusting for the impact of the consolidated investment products helps the reader’s ability to understand our core operating results and increases comparability period to period.
(5) This non-GAAP adjustment represents non-operating income (loss) and the net gains (losses) earned on the firm's investment portfolio that are not designated as economic hedges of the deferred compensation liabilities and that are not part of the cash and discretionary investment portfolio. We retain in our non-GAAP measures the investment gains recognized on the cash and discretionary investments as these assets and related income (loss) are considered part of the firm's core operations. We believe adjusting for the remaining non-operating income (loss) helps the reader’s ability to understand the firm's core operating results and increases comparability period to period. Additionally, we do not emphasize the impact of this portion of non-operating income (loss) when managing and evaluating the firm's performance.
(6) The income tax impacts were calculated in order to achieve an overall non-GAAP effective tax rate of 24.5% for 2024, 27.2% for 2023 and 24.7% for 2022.
(7) This non-GAAP measure was calculated by applying the two-class method to adjusted net income attributable to
T. Rowe Price Group and dividing by the weighted-average common shares outstanding assuming dilution. The calculation of net income allocated to common stockholders is as follows:
| | | | | | | | | | | | | | | | | | | | |
| | Year ended |
| (in millions) | | 2024 | | 2023 | | 2022 |
| Adjusted net income attributable to T. Rowe Price Group | | $ | 2,139.5 | | | $ | 1,750.1 | | | $ | 1,864.8 | |
| Less: net income allocated to outstanding restricted stock and stock unit holders | | 56.8 | | | 43.4 | | | 43.3 | |
| Adjusted net income allocated to common stockholders | | $ | 2,082.7 | | | $ | 1,706.7 | | | $ | 1,821.5 | |
CAPITAL RESOURCES AND LIQUIDITY.
During 2024, stockholders’ equity attributable to T. Rowe Price Group, Inc. increased from $9.5 billion to $10.3 billion, and tangible book value increased to $7.5 billion at December 31, 2024 from $6.5 billion at December 31, 2023.
Sources of Liquidity
We have ample liquidity, including cash and investments in T. Rowe Price products as follows:
| | | | | | | | | | | |
| (in millions) | 12/31/2024 | | 12/31/2023 |
| Cash and cash equivalents | $ | 2,649.8 | | | $ | 2,066.6 | |
| Discretionary investments | 457.1 | | | 463.7 | |
| Total cash and discretionary investments | 3,106.9 | | | 2,530.3 | |
| Redeemable seed capital investments | 1,262.3 | | | 1,370.9 | |
| Investments used to hedge the deferred compensation liabilities | 1,110.9 | | | 894.6 | |
| Total cash and investments in T. Rowe Price products | $ | 5,480.1 | | | $ | 4,795.8 | |
Our discretionary investment portfolio is comprised primarily of short duration fixed income ETFs, which typically yield higher than money market rates. Of our cash and cash equivalents, $653.9 million at December 31, 2024, and $699.0 million at December 31, 2023 were held by our subsidiaries located outside the U.S. Our cash and discretionary investment portfolio experienced market gains of $148.7 million in 2024 and $140.8 million in 2023. Given the availability of our financial resources and cash expected to be generated through future operations, we do not maintain an available external source of additional liquidity.
Our seed capital investments are redeemable, although we generally expect to be invested for several years for the products to build an investment performance history and until unrelated third-party investors substantially reduce our relative ownership percentage.
The cash and investment presentation on the consolidated balance sheet is based on how we account for the cash or investment. The following table details how our interests in cash and investments relate to where they are presented in the consolidated balance sheet as of December 31, 2024.
| | | | | | | | | | | | | | | | | | | | | | | | | | |
| (in millions) | | Cash and cash equivalents | | Investments | | Net assets of consolidated investment products(1) | | Total |
| Cash and discretionary investments | | $ | 2,649.8 | | | $ | 319.6 | | | $ | 137.5 | | | $ | 3,106.9 | |
| Seed capital investments | | — | | | 391.6 | | | 870.7 | | | 1,262.3 | |
| Investments used to hedge the deferred compensation liabilities | | — | | | 1,081.2 | | | 29.7 | | | 1,110.9 | |
| Total cash and investments in T. Rowe Price products attributable to T. Rowe Price Group, Inc. | | 2,649.8 | | | 1,792.4 | | | 1,037.9 | | | 5,480.1 | |
Investments in affiliated private investment funds(2) | | — | | | 696.8 | | | — | | | 696.8 | |
| Investments in CLOs | | — | | | 67.4 | | | — | | | 67.4 | |
| Investment in UTI and other investments | | — | | | 443.9 | | | — | | | 443.9 | |
| Total cash and investments attributable to T. Rowe Price Group, Inc. | | 2,649.8 | | | 3,000.5 | | | 1,037.9 | | | 6,688.2 | |
| Redeemable non-controlling interests | | — | | | — | | | 944.0 | | | 944.0 | |
As reported on consolidated balance sheet at December 31, 2024 | | $ | 2,649.8 | | | $ | 3,000.5 | | | $ | 1,981.9 | | | $ | 7,632.2 | |
(1)The consolidated investment products are generally those products we provided seed capital at the time of their formation and we have a controlling interest. The $1,037.9 million represents the total value at December 31, 2024 of our interest in the consolidated investment products. The total net assets of the investment products at December 31, 2024 of $1,981.9 million includes assets of $2,044.0 million, less liabilities of $62.1 million as reflected in the consolidated balance sheet in Item 8. Financial Statements of this Form 10-K.
(2) Includes $160.7 million of non-controlling interests in consolidated entities and represents the portion of these investments, held by third parties, that we cannot sell in order to obtain cash for general operations.
Our consolidated balance sheet reflects the assets and liabilities of those investment products we consolidate, as well as redeemable non-controlling interests for the portion of these investment products that are held by unrelated third-party investors. Although we can redeem our net interest in these investment products at any time, we cannot directly access or sell the assets held by the products to obtain cash for general operations. Additionally, the assets of these investment products are not available to our general creditors. Our interest in these investment products was primarily used as initial seed capital and is recategorized as discretionary when it is determined by management that the seed capital is no longer needed. We assess the discretionary products and, when we decide to liquidate our interest, we seek to do so in a way as to not impact the product and, ultimately, the unrelated third-party investors.
Uses of Liquidity
We paid $4.96 per share in regular dividends in 2024, an increase of 1.6% over the $4.88 per share paid in 2023. Further, we expended $334.5 million in 2024 to repurchase nearly 3.0 million shares, or 1.3%, of our outstanding common stock at an average price of $112.57 per share. These dividends and repurchases were expended using existing cash balances and cash generated from operations. We generally repurchase our common stock over time to offset the dilution created by our equity-based compensation plans.
Since the end of 2021, we have returned $4.8 billion to stockholders through stock repurchases and our regular quarterly dividends, as follows:
| | | | | | | | | | | | | | | | | | | |
| (in millions) | Recurring dividend | | | | Stock repurchases | | Total cash returned to stockholders |
| 2022 | $ | 1,108.8 | | | | | $ | 855.3 | | | $ | 1,964.1 | |
| 2023 | 1,121.9 | | | | | 254.3 | | | 1,376.2 | |
| 2024 | 1,135.2 | | | | | 334.5 | | | 1,469.7 | |
| Total | $ | 3,365.9 | | | | | $ | 1,444.1 | | | $ | 4,810.0 | |
We anticipate property and equipment expenditures for the full-year 2025 to be about $300 million, of which more than three-quarters is planned for technology initiatives. We expect to fund our anticipated capital expenditures with operating cash flows and other available resources.
The following tables summarize the cash flows for 2024, 2023 and 2022, that are attributable to T. Rowe Price Group Inc., our consolidated investment products, and the related eliminations required in preparing the consolidated statement of cash flows.
| | | | | | | | | | | | | | | | | | | | | | | |
| 2024 |
| (in millions) | Cash flow attributable to T. Rowe Price Group, Inc. | | Cash flow attributable to consolidated investment products | | Eliminations | | As reported |
| Cash flows from operating activities | | | | | | | |
| Net income (loss) | $ | 2,100.1 | | | $ | 120.5 | | | $ | (84.8) | | | $ | 2,135.8 | |
| Adjustments to reconcile net income (loss) to net cash provided by (used in) operating activities | | | | | | | |
| Depreciation, amortization and impairments of property, equipment and software | 254.1 | | | — | | | — | | | 254.1 | |
| Amortization and impairment of acquisition-related assets and retention agreements | 250.1 | | | — | | | — | | | 250.1 | |
| Fair value remeasurement of contingent consideration liability | (13.4) | | | — | | | — | | | (13.4) | |
| Stock-based compensation expense | 247.3 | | | — | | | — | | | 247.3 | |
| | | | | | | |
| | | | | | | |
| Net (gains) losses recognized on investments | (425.0) | | | — | | | 84.8 | | | (340.2) | |
| Total non-cash adjustments | 313.1 | | | — | | | 84.8 | | | 397.9 | |
| Net investments in sponsored investment products used to economically hedge deferred compensation liabilities | (123.2) | | | — | | | 30.0 | | | (93.2) | |
| Net change in trading securities held by consolidated investment products | — | | | (760.4) | | | — | | | (760.4) | |
| | | | | | | |
| | | | | | | |
| Other changes | 23.9 | | | 6.1 | | | (24.5) | | | 5.5 | |
| Net cash provided by (used in) operating activities | 2,313.9 | | | (633.8) | | | 5.5 | | | 1,685.6 | |
| Net cash provided by (used in) investing activities | (187.9) | | | (15.8) | | | 26.2 | | | (177.5) | |
| Net cash provided by (used in) financing activities | (1,542.8) | | | 637.9 | | | (31.7) | | | (936.6) | |
| Effect of exchange rate changes on cash and cash equivalents of consolidated investment products | — | | | (2.4) | | | — | | | (2.4) | |
| Net change in cash and cash equivalents during year | 583.2 | | | (14.1) | | | — | | | 569.1 | |
| Cash and cash equivalents at beginning of year | 2,066.6 | | | 77.2 | | | — | | | 2,143.8 | |
| Cash and cash equivalents at end of year | $ | 2,649.8 | | | $ | 63.1 | | | $ | — | | | $ | 2,712.9 | |
| | | | | | | | | | | | | | | | | | | | | | | |
| 2023 |
| (in millions) | Cash flow attributable to T. Rowe Price Group, Inc. | | Cash flow attributable to consolidated investment products | | Eliminations | | As reported |
| Cash flows from operating activities | | | | | | | |
| Net income (loss) | $ | 1,788.7 | | | $ | 153.5 | | | $ | (106.5) | | | $ | 1,835.7 | |
| Adjustments to reconcile net income (loss) to net cash provided by (used in) operating activities | | | | | | | |
| Depreciation, amortization and impairments of property, equipment and software | 254.8 | | | — | | | — | | | 254.8 | |
| Amortization and impairment of acquisition-related assets and retention agreements | 226.8 | | | — | | | — | | | 226.8 | |
| Fair value remeasurement of contingent consideration liability | (82.4) | | | — | | | — | | | (82.4) | |
| Stock-based compensation expense | 265.6 | | | — | | | — | | | 265.6 | |
| | | | | | | |
| | | | | | | |
| Net (gains) losses recognized on investments | (567.3) | | | — | | | 106.5 | | | (460.8) | |
| Total non-cash adjustments | 97.5 | | | — | | | 106.5 | | | 204.0 | |
| Net (investments) redemptions in sponsored investment products used to economically hedge deferred compensation liabilities | (10.3) | | | — | | | 66.4 | | | 56.1 | |
| Net change in trading securities held by consolidated investment products | — | | | (1,070.3) | | | — | | | (1,070.3) | |
| | | | | | | |
| | | | | | | |
| Other changes | 182.7 | | | 27.9 | | | (17.0) | | | 193.6 | |
| Net cash provided by (used in) operating activities | 2,058.6 | | | (888.9) | | | 49.4 | | | 1,219.1 | |
| Net cash provided by (used in) investing activities | (310.2) | | | (56.8) | | | 495.2 | | | 128.2 | |
| Net cash provided by (used in) financing activities | (1,437.4) | | | 903.4 | | | (544.6) | | | (1,078.6) | |
| Effect of exchange rate changes on cash and cash equivalents of consolidated investment products | — | | | 0.4 | | | — | | | 0.4 | |
| Net change in cash and cash equivalents during year | 311.0 | | | (41.9) | | | — | | | 269.1 | |
| Cash and cash equivalents at beginning of year | 1,755.6 | | | 119.1 | | | — | | | 1,874.7 | |
| Cash and cash equivalents at end of year | $ | 2,066.6 | | | $ | 77.2 | | | $ | — | | | $ | 2,143.8 | |
| | | | | | | | | | | | | | | | | | | | | | | |
| 2022 |
| (in millions) | Cash flow attributable to T. Rowe Price Group, Inc. | | Cash flow attributable to consolidated investment products | | Eliminations | | As reported |
| Cash flows from operating activities | | | | | | | |
| Net income (loss) | $ | 1,557.9 | | | $ | (211.7) | | | $ | 103.4 | | | $ | 1,449.6 | |
| Adjustments to reconcile net income (loss) to net cash provided by (used in) operating activities | | | | | | | |
| Depreciation, amortization and impairments of property, equipment and software | 225.7 | | | — | | | — | | | 225.7 | |
| Amortization and impairment of acquisition-related assets and retention agreements | 420.1 | | | — | | | — | | | 420.1 | |
| Fair value remeasurement of contingent consideration liability | (161.2) | | | — | | | — | | | (161.2) | |
| Stock-based compensation expense | 285.4 | | | — | | | — | | | 285.4 | |
| | | | | | | |
| | | | | | | |
| Net (gains) losses recognized on investments | 314.0 | | | — | | | (103.4) | | | 210.6 | |
| Total non-cash adjustments | 1,084.0 | | | — | | | (103.4) | | | 980.6 | |
| Net investments in sponsored investment products used to economically hedge deferred compensation liabilities | (18.8) | | | — | | | — | | | (18.8) | |
| Net change in trading securities held by consolidated investment products | — | | | 87.9 | | | — | | | 87.9 | |
| | | | | | | |
| | | | | | | |
| Other changes | (182.8) | | | 46.6 | | | (3.7) | | | (139.9) | |
| Net cash provided by (used in) operating activities | 2,440.3 | | | (77.2) | | | (3.7) | | | 2,359.4 | |
| Net cash provided by (used in) investing activities | (179.3) | | | (8.7) | | | 146.5 | | | (41.5) | |
| Net cash provided by (used in) financing activities | (2,028.5) | | | 94.4 | | | (142.8) | | | (2,076.9) | |
| Effect of exchange rate changes on cash and cash equivalents of consolidated investment products | — | | | 9.5 | | | — | | | 9.5 | |
| Net change in cash and cash equivalents during year | 232.5 | | | 18.0 | | | — | | | 250.5 | |
| Cash and cash equivalents at beginning of year | 1,523.1 | | | 101.1 | | | — | | | 1,624.2 | |
| Cash and cash equivalents at end of year | $ | 1,755.6 | | | $ | 119.1 | | | $ | — | | | $ | 1,874.7 | |
Operating activities
During 2024, operating activities attributable to T. Rowe Price Group, Inc. provided cash flows of $2,313.9 million, an increase of $255.3 million from $2,058.6 million provided during 2023. The increase was primarily driven by a $311.4 million increase in net income and a $215.6 million increase in the add-back for non-cash items as detailed in the 2024 table above. These increases to operating cash flows were offset in part by a $158.8 million decrease in cash flows related to timing differences associated with the cash settlement of our assets and liabilities. Additionally, in 2024, we made $112.9 million more net investments in sponsored investment products used to economically hedge our deferred compensation liabilities compared to 2023. The remaining change in reported cash flows from operating activities was attributable to the net change in trading securities held in our consolidated investment products’ underlying portfolios.
During 2023, operating activities attributable to T. Rowe Price Group, Inc. provided cash flows of $2,058.6 million, a decrease of $381.7 million from $2,440.3 million provided during 2022. The decrease was primarily driven by a $986.5 million decrease in the add-back for non-cash items as detailed in the 2023 table above. These decreases to operating cash flows were offset in part by a $230.8 million increase in net income and $365.5 million increase in cash flows related to timing differences associated with the cash settlement of our assets and liabilities. Additionally, in 2023, we expended $8.5 million less in net investments in sponsored investment products used to economically hedge our deferred compensation liabilities compared to 2022. The remaining change in reported cash flows from operating activities was attributable to the net change in trading securities held in our consolidated investment products’ underlying portfolios.
Investing activities
Net cash used in investing activities that are attributable to T. Rowe Price Group Inc. totaled $187.9 million in 2024 compared to $310.2 million in 2023. Net investing activities from our investments in sponsored investment products generated net proceeds of $407.1 million in 2024 compared to $36.1 million in 2023. In 2024, we increased our property and equipment expenditures by $115.5 million and our other investing activity by $133.2 million. We eliminate our capital in those investment products we consolidate in preparing our consolidated statements of cash flows. The remaining change in reported cash flows from investing activities of $41.0 million is related to the net cash removed from our balance sheet from consolidating and deconsolidating investment products.
Net cash used in investing activities that are attributable to T. Rowe Price Group totaled $310.2 million in 2023 compared to $179.3 million in 2022. During 2023, net proceeds from the sale of investments of $36.1 million were lower compared to $62.0 million during 2022. In 2023, we increased our property and equipment expenditures by $70.3 million and our other investing activity by $34.7 million. We eliminate our capital in those investment products we consolidate in preparing our consolidated statements of cash flows. The remaining change in reported cash flows from investing activities of $48.1 million is primarily related to the net cash removed from our balance sheet from consolidating and deconsolidating investment products.
Financing Activities
Net cash used in financing activities attributable to T. Rowe Price Group totaled $1,542.8 million in 2024 compared to $1,437.4 million in 2023. During 2024, we used $337.2 million to repurchase nearly 3.0 million shares compared to $254.4 million to repurchase 2.4 million shares in 2023. The $13.9 million increase in dividends paid in 2024 was a result of the 1.6% increase in our quarterly dividend per share. In addition, in 2024, net distributions to non-controlling interests in consolidated entities decreased by $6.6 million and cash flow related to common stock issued under stock compensation plans decreased by $15.3 million compared to 2023. The remaining change in reported cash flows from financing activities is attributable to a $247.4 million increase in net subscriptions from redeemable non-controlling interest holders of our consolidated investment products during 2024.
Net cash used in financing activities attributable to T. Rowe Price Group totaled $1,437.4 million in 2023 compared to $2,028.5 million in 2022. During 2023, we used $254.4 million to repurchase 2.4 million shares compared to $849.8 million to repurchase 6.8 million shares in 2022. The $14.3 million increase in dividends paid in 2023 is a result of the 1.7% increase in our quarterly dividend per share in 2023. In addition, net distributions to non-controlling interests in consolidated entities increased by $8.2 million and cash flow related to common stock issued under stock compensation plans increased by $18.2 million during 2023 compared to 2022. The remaining change in reported cash flows from financing activities is primarily attributable to a $407.2 million increase in net subscriptions from redeemable non-controlling interest holders of our consolidated investment products during 2023.
MATERIAL CASH COMMITMENTS.
Our material cash commitments primarily include our obligations related to our deferred compensation liabilities, facility leases, our headquarters build out, and other contractual amounts that will be due for the purchase of goods or services to be used in our operations. Some of these contractual amounts may be cancellable under certain conditions and may involve termination fees. We expect to fund these cash commitments from future cash flows from operations.
Our obligations under our deferred compensation liabilities are disclosed on our consolidated balance sheet with more information included in Note 12 and Note 17 to the consolidated financial statements. Our lease obligations are disclosed in Note 7 to the consolidated financial statements. Additionally, there are unrecognized tax benefits discussed in Note 10 to our consolidated financial statements. The note references above are in Item 8. of this Form 10-K.
While most of our other material cash commitments consist of goods and services used in our operations, these commitments primarily consist of obligations related to long-term software licensing and maintenance contracts, construction in process, and service contracts.
We also have outstanding commitments to fund additional contributions to investment partnerships totaling $202.5 million. The vast majority of these additional contributions will be made to investment partnerships in which we have
an existing investment. In addition to such amounts, a percentage of prior distributions may be called under certain circumstances.
As part of the OHA acquisition, T. Rowe Price committed $500 million to fund OHA product launches through 2026. As of December 31, 2024, T. Rowe Price has $360 million remaining to commit to OHA products. T. Rowe Price has also entered into certain earnout and other arrangements as part of that acquisition. For more detail on these arrangements, see Note 5 and Note 16 to our consolidated financial statements in Item 8. of this Form 10-K.
CRITICAL ACCOUNTING POLICIES AND ESTIMATES.
The preparation of financial statements often requires the selection of specific accounting methods and policies from among several acceptable alternatives. Further, significant estimates and judgments may be required in selecting and applying those methods and policies in the recognition of the assets and liabilities in our consolidated balance sheets, the revenues and expenses in our consolidated statements of income, and the information that is contained in our significant accounting policies and notes to the consolidated financial statements. These policies and estimates are considered critical because they had a material impact or are reasonably likely to have a material impact on our consolidated financial statements and because they require management to make significant judgments, assumptions or estimates. Making these estimates and judgments requires the analysis of information concerning events that may not yet be complete and of facts and circumstances that may change over time. Accordingly, actual amounts or future results can differ materially from those estimates that we currently include in our consolidated financial statements, significant accounting policies, and notes.
We present those significant accounting policies used in the preparation of our consolidated financial statements as an integral part of those statements within this 2024 Annual Report on Form 10-K. In the following discussion, we highlight and explain further certain of those policies and estimates that are most critical to the preparation and understanding of our financial statements.
Consolidation
We consolidate all subsidiaries and sponsored investment products in which we have a controlling financial interest. We are deemed to have a controlling interest when we own the majority of the voting interest of an entity or are deemed to be the primary beneficiary of a variable interest entity ("VIE"). VIEs are entities that lack sufficient equity to finance its activities or the equity holders do not have defined power to direct the activities of the entity normally associated with an equity investment. Our analysis to determine whether an entity is a VIE or a voting interest entity ("VOE") involves judgment and considers several factors, including an entity’s legal organization, capital structure, the rights of the equity investment holders, our ownership interest in the entity, and our contractual involvement with the entity. We continually review and reconsider our VIE or VOE conclusions upon the occurrence of certain events, such as changes to our ownership interest, changes to an entity’s legal structure, or amendments to governing documents. Our VIEs are primarily sponsored investment products and our variable interest consists of our equity ownership in and investment management fees earned from these entities.
We are the primary beneficiary if we have the power to direct the activities of the VIE that most significantly impact its economic performance and the obligation to absorb losses of the entity or the right to receive benefits from the VIE that could potentially be significant. Our SICAV funds and other investment products regulated outside the U.S. are determined to be VIEs. We have interests in certain investment partnerships that are also considered VIEs, including entities that have interests in general partners of affiliated private investment funds, which are also VIEs. We consolidate the entities that hold the interest in the general partners; however, the entities are not the primary beneficiaries of the affiliated private investment funds.
Other-than-temporary impairments of equity method investments
We evaluate our equity method investments for impairment when events or changes in circumstances indicate that the carrying value of the investment exceeds its fair value, and the decline in fair value is other than temporary. For our investments in our affiliated private investment funds, we consider the length of time and the extent to which market value has been less than cost, any specific events that may influence the operations of the funds and our intent and ability to retain the investment for a period of time to allow for any anticipated recovery in market value. We generally believe an assessment period of four consecutive quarters of sustained market losses is a reasonable period to allow for an anticipated market recovery.
Intangible assets
Indefinite-lived intangible assets are tested for impairment annually, in the fourth quarter, or more frequently if events or changes in circumstances indicate that it is more likely than not that the intangible asset is impaired. Management must first determine the level at which indefinite-lived intangible assets are tested for impairment (i.e., unit of account). We have concluded that the trade name and investment advisory agreement indefinite-lived intangible assets will be considered their own separate unit of account. Once the unit of account is determined, management has the option to first assess indefinite-lived intangible assets for qualitative factors to determine whether it is necessary to perform a quantitative impairment test. If a quantitative impairment test is required, the impairment test consists of a comparison of the fair value of an intangible asset with its carrying amount. If the carrying amount of the intangible asset exceeds its fair value, an impairment loss is recognized in an amount equal to that excess. If required, fair value is generally determined using a discounted cash flow analysis where estimated future cash flows are discounted to arrive at a single present value amount. This approach includes inputs that require significant management judgment, the most relevant of which include revenue growth, discount rates, and effective tax rates. Changes in these inputs could produce different fair value amounts and therefore different impairment conclusions. During 2024, we recognized $31.1 million of non-cash impairment charges on the trade name intangible asset. The maximum future impairment of indefinite-lived intangible assets that we could incur is the amount recognized in our consolidated balance sheets within intangible assets, $151.6 million as of December 31, 2024.
Definite-lived intangible assets are reviewed for impairment whenever events or circumstances indicate that the asset group's carrying amount may not be recoverable (i.e., the carrying amount is more than the undiscounted estimated future cash flows). Management must first determine the level at which definite-lived intangible assets are tested for impairment (i.e., asset group). The determination of the asset group is judgmental and the intangible assets can be grouped based on the lowest level for which identifiable cash flows are largely independent of identifiable cash flows for other groups of assets. Since each affiliated private investment fund has identifiable cash flows separate from other funds, we determined that the asset group for testing is each individual affiliated private investment fund. Once the asset group is identified, we next determine whether there are any triggering events that would cause us to believe that the carrying value would not be recoverable. If there is a triggering event, then we would perform a test of recoverability. Based on that test, if the carrying value is not recoverable, then a fair value measurement is required of the asset group to determine if the fair value is less than the asset group's carrying amount. If required, fair value would be determined using a discounted cash flow analysis where estimated future cash flows are discounted to arrive at a single present value amount. This approach includes inputs that require significant management judgment, the most relevant of which include revenue growth, discount rates, and effective tax rates. Any impairment loss would be the difference between the fair value of the asset group and its carrying amount. During 2024, we recognized immaterial non-cash impairment charges on these intangible assets.
Goodwill
We internally conduct, manage, and report our operations as one reportable business segment - investment advisory business. This reflects how the chief operating decision maker allocates resources and assesses performance. Accordingly, we have one reporting unit - our investment advisory business, consistent with our single operating segment, to which all goodwill has been assigned.
We evaluate the carrying amount of goodwill in our consolidated balance sheets for possible impairment on an annual basis in the fourth quarter of each year using a fair value approach. Goodwill would be considered impaired whenever its carrying amount exceeds the fair value of our investment advisory business. Our annual testing has demonstrated that the fair value of our investment advisory business (our market capitalization) exceeds our carrying amount (our stockholders’ equity) and, therefore, no impairment exists. Should we reach a different conclusion in the future, additional work would be performed to ascertain the amount of the noncash impairment charge to be recognized. We must also perform impairment testing at other times if an event or circumstance occurs indicating that it is more likely than not that an impairment has been incurred. The maximum future impairment of goodwill that we could incur is the amount recognized in our consolidated balance sheets, $2.6 billion as of December 31, 2024.
Provision for income taxes
After compensation and related costs, our provision for income taxes on our earnings is our largest annual expense. We operate in numerous states and countries through our various subsidiaries and must allocate our income, expenses, and earnings under the various laws and regulations of each of these taxing jurisdictions. Accordingly, our provision for income taxes represents our total estimate of the liability that we have incurred in doing business each year in all of our locations. Annually, we file tax returns that represent our filing positions with each jurisdiction and settle our return liabilities. Each jurisdiction has the right to audit those returns and may take different positions with respect to income and expense allocations and taxable earnings determinations. From time to time, we may also provide for estimated liabilities associated with uncertain tax return filing positions that are subject to, or in the process of, being audited by various tax authorities. Because the determination of our annual provision is subject to judgments and estimates, it is likely that actual results will vary from those recognized in our financial statements. As a result, we recognize additions to, or reductions of, income tax expense during a reporting period that pertain to prior period provisions as our estimated liabilities are revised and actual tax returns and tax audits are settled. We recognize any such prior period adjustment in the discrete quarterly period in which it is determined.
We recognize deferred tax assets to the extent that we believe that these assets are more likely than not to be realized. In making such a determination, we consider all available positive and negative evidence, including
future reversals of existing taxable temporary differences, projected future taxable income, tax-planning strategies, and results of recent operations. If we determine that we would be able to realize our deferred tax assets in the future in excess of their net recorded amount, we would make an adjustment to the deferred tax asset valuation allowance, which would reduce the provision for income taxes.
NEWLY ISSUED BUT NOT YET ADOPTED ACCOUNTING GUIDANCE.
See Note 1 - Basis of Preparation and Summary of Significant Accounting Policies within Item 8. Financial Statements for a discussion of newly issued but not yet adopted accounting guidance.
FORWARD-LOOKING INFORMATION.
From time to time, information or statements provided by or on behalf of T. Rowe Price, including those within this report, may contain certain forward-looking information, including information or anticipated information relating to: our revenues, net income, and earnings per share of common stock; changes in the amount and composition of our assets under management; our expense levels; our effective tax rate; legal or regulatory developments; geopolitical instability; interest rates and currency fluctuations; and our expectations regarding financial markets, future transactions, dividends, stock repurchases, investments, new products and services, capital expenditures, changes in our effective fee rate, and other industry or market conditions. Readers are cautioned that any forward-looking information provided by or on behalf of T. Rowe Price is not a guarantee of future performance. Actual results may differ materially from those in forward-looking information because of various factors including, but not limited to, those discussed below and in Item 1A. Risk Factors, of this Form 10-K Annual Report. Further, forward-looking statements speak only as of the date on which they are made, and we undertake no obligation to update any forward-looking statement to reflect events or circumstances after the date on which it is made or to reflect the occurrence of unanticipated events.
Our future revenues and results of operations will fluctuate primarily due to changes in the total value and composition of assets under our management. Such changes result from many factors, including, among other things: client-related cash inflows and outflows in our products, performance fees, capital allocation-based income, fluctuations in global financial markets that result in appreciation or depreciation of the assets under our management, our introduction of new investment products, and changes in retirement savings trends relative to participant-directed investments and defined contribution plans.
The ability to attract and retain investors’ assets under our management is dependent on investor sentiment and confidence; the relative investment performance of the T. Rowe Price mutual funds and other managed investment products compared to competing offerings and market indexes; the ability to maintain our investment management and administrative fees at appropriate levels; the impact of changes in interest rates and inflation; competitive conditions in the mutual fund, asset management, and broader financial services sectors; our level of success in implementing our strategy to expand our business; and our ability to attract and retain key personnel. Our revenues are substantially dependent on fees earned under contracts with the T. Rowe Price funds and could be adversely affected if the independent directors of one or more of the T. Rowe Price funds terminated or significantly altered the
terms of the investment management or related administrative services agreements. Non-operating investment income will also fluctuate primarily due to the size of our investments, changes in their market valuations, and any other-than-temporary impairments that may arise or, in the case of our equity method investments, our proportionate share of the investees’ net income.
Our future results are also dependent upon the level of our expenses, which are subject to fluctuation for the following or other reasons: changes in the level of our advertising and promotion expenses in response to market conditions, including our efforts to expand our investment advisory business to investors outside the U.S. and to further penetrate our distribution channels within the U.S.; the pace and level of spending to support key strategic priorities; variations in the level of total compensation expense due to, among other things, bonuses, restricted stock units and other equity grants, other incentive awards, our supplemental savings plan, changes in our employee count and mix, and competitive factors; any goodwill, intangible asset or other asset impairment that may arise; fluctuation in foreign currency exchange rates applicable to the costs of our international operations; expenses and capital costs, such as technology assets, depreciation, amortization, and research and development, incurred to maintain and enhance our administrative and operating services infrastructure; the timing of the assumption of all third party research payments, unanticipated costs that may be incurred to protect investor accounts and the goodwill of our clients; and disruptions of services, including those provided by third parties, such as fund and product recordkeeping, facilities, communications, power, and the mutual fund transfer agent and accounting systems, as a result of extreme events, cyberattacks or otherwise.
Our business is also subject to substantial governmental regulation, and changes in legal, regulatory, accounting, tax, and compliance requirements may have a substantial effect on our operations and results, including, but not limited to, effects on costs that we incur and effects on investor interest in investment products and investing in general or in particular classes of mutual funds or other investments.
Item 7A. Quantitative and Qualitative Disclosures About Market Risk.
EQUITY PRICE RISK.
Our investments in sponsored investment products are carried at fair value, and, as such, these investments are subject to market risk. The following table presents the equity price risk from our investments. Investments in our sponsored investment products generally moderate market risk as they are diversified and invest in a number of different financial instruments. T. Rowe Price manages its cash and discretionary investments exposure to market risk by diversifying its investments among various fixed income portfolios. In addition, investment holdings may be altered from time to time in response to changes in market risks and other factors, as management deems appropriate. We do not actively hedge the market risk related to our seed capital investments.
In order to quantify the sensitivity of our investments to changes in market valuations, we have chosen to use a variant of each product's net asset value to quantify the equity price risk, as we believe the volatility in each product's net asset value best reflects the underlying risk potential as well as the market trends surrounding each of its investment objectives. The potential future loss of value, before any income tax benefits, of these investments at December 31, 2024 was determined by using the lower of each product’s lowest net asset value per share during 2024 or its net asset value per share at December 31, 2024, reduced by 10%. In considering this presentation, it is important to note that: not all products experienced their lowest net asset value per share on the same day; it is likely that the composition of the investment portfolio would be changed if adverse market conditions persisted; and we could experience future losses in excess of those presented below.
Additionally, the underlying holdings of our assets under management are also subject to market risk, which may arise from changes in equity prices, credit ratings, foreign currency exchange rates, and interest rates.
| | | | | | | | | | | | | | | | | | | | | | | |
| (in millions) | Fair value 12/31/2024 | | Potential lower value | | Potential
loss |
| Investments in sponsored products | | | | | | | |
| Discretionary investments | $ | 258.8 | | | $ | 232.9 | | | $ | 25.9 | | | 10 | % |
| Seed capital not consolidated | 262.8 | | | 231.0 | | | 31.8 | | | 12 | % |
| Investments designated as an economic hedge of deferred compensation liabilities | 992.8 | | | 859.1 | | | 133.7 | | | 13 | % |
| Investments in affiliated collateralized loan obligations | 6.3 | | | 5.7 | | | 0.6 | | | 10 | % |
| Total | $ | 1,520.7 | | | $ | 1,328.7 | | | $ | 192.0 | | | 13 | % |
| Direct investment in consolidated investment products | | | | | | | |
| Discretionary investments | $ | 137.5 | | | $ | 123.8 | | | $ | 13.7 | | | 10 | % |
| Seed capital | 870.7 | | | 775.2 | | | 95.5 | | | 11 | % |
| Investments designated as an economic hedge of deferred compensation liabilities | 29.7 | | | 26.2 | | | 3.5 | | | 12 | % |
| Total | $ | 1,037.9 | | | $ | 925.2 | | | $ | 112.7 | | | 11 | % |
| | | | | | | |
| Investment partnerships and other investments held at fair value | $ | 62.6 | | | $ | 55.7 | | | $ | 6.9 | | | 11 | % |
Any losses arising from the change in fair value of investments in T. Rowe Price products would result in a corresponding decrease, net of tax, in our net income attributable to T. Rowe Price Group, Inc.
The direct investment in consolidated investment products represents our portion of the net assets of the consolidated investment product. Upon consolidation of these products, our direct investment is eliminated, and the net assets of the products are combined in our consolidated balance sheet, together with redeemable non-controlling interests, which represents the portion of the products that is owned by unrelated third-party investors.
Further, we have investments that are used to economically hedge the change in our deferred compensation liabilities. Since we are hedging the liabilities, the impact on our net income attributable to T. Rowe Price Group, Inc. would result from any ineffectiveness of this economic hedge.
CURRENCY TRANSLATION RISK.
Certain of our investments, including a few consolidated investment products, expose us to currency translation risk when the financial statements are translated into U.S. dollars ("USD"). Our most significant exposure relates to the translation of the financial statements of our equity method investment in UTI ($173.5 million at December 31, 2024). UTI's financial statements are denominated in Indian rupees ("INR") and are translated to USD each reporting period. We do not use derivative financial instruments to manage this currency risk, so both positive and negative fluctuations in the INR against the USD will affect accumulated other comprehensive income (loss) and the carrying amount of our investment. We had a cumulative translation loss, net of tax, of $49.5 million at December 31, 2024, related to our investment in UTI. Given the nature of UTI’s business, should conditions deteriorate in markets in which they operate, we are at risk for loss up to our carrying amount.
We operate in several countries outside the U.S. of which the United Kingdom is the most prominent. We incur operating expenses and have assets and liabilities denominated in currencies other than USD associated with these operations, although our revenues are predominately realized in USD. The majority of our currency translation risk on our consolidated balance sheet at December 31, 2024, related to cash and non-consolidated investments of $230.1 million that are denominated in foreign currencies. We do not believe that foreign currency fluctuations materially affect our results of operations.
Item 8.Financial Statements.
| | | | | |
| | Page |
| Index to Financial Statements: | |
| Consolidated Balance Sheets at December 31, 2024 and 2023 | |
Consolidated Statements of Income for each of the years in the three-year period ended
December 31, 2024 | |
| Consolidated Statements of Comprehensive Income for each of the years in the three-year period ended December 31, 2024 | |
Consolidated Statements of Cash Flows for each of the years in the three-year period ended
December 31, 2024 | |
| Consolidated Statements of Stockholders' Equity for each of the years in the three-year period ended December 31, 2024 | |
| |
| |
CONSOLIDATED BALANCE SHEETS
(in millions, except share data)
| | | | | | | | | | | |
| 12/31/2024 | | 12/31/2023 |
| ASSETS | | | |
| Cash and cash equivalents | $ | 2,649.8 | | | $ | 2,066.6 | |
| Accounts receivable and accrued revenue | 877.4 | | | 807.9 | |
| Investments | 3,000.5 | | | 2,554.7 | |
| Assets of consolidated investment products ($1,555.6 million at December 31, 2024 and $1,204.4 million at December 31, 2023, related to variable interest entities) | 2,044.0 | | | 1,959.3 | |
| Operating lease assets | 226.8 | | | 241.1 | |
| Property, equipment and software, net | 977.0 | | | 806.6 | |
| Intangible assets | 368.1 | | | 507.3 | |
| Goodwill | 2,642.8 | | | 2,642.8 | |
| Other assets | 685.6 | | | 692.5 | |
| Total assets | $ | 13,472.0 | | | $ | 12,278.8 | |
| | | |
| LIABILITIES | | | |
| Accounts payable and accrued expenses | $ | 353.5 | | | $ | 422.9 | |
| Liabilities of consolidated investment products ($46.2 million at December 31, 2024 and $35.2 million at December 31, 2023, related to variable interest entities) | 62.1 | | | 54.2 | |
| Operating lease liabilities | 278.7 | | | 308.5 | |
| Accrued compensation and related costs | 219.8 | | | 240.8 | |
| Deferred compensation liabilities | 1,020.7 | | | 895.0 | |
| | | |
| Income taxes payable | 87.1 | | | 66.2 | |
| | | |
| Total liabilities | 2,021.9 | | | 1,987.6 | |
| | | |
| Commitments and contingent liabilities | | | |
| | | |
| Redeemable non-controlling interests | 944.0 | | | 594.1 | |
| | | |
| STOCKHOLDERS’ EQUITY | | | |
Preferred stock, undesignated, $0.20 par value—authorized and unissued 20,000,000 shares | — | | | — | |
| Common stock, $0.20 par value—authorized 750,000,000; issued 222,966,000 shares at December 31, 2024 and 223,938,000 at December 31, 2023 | 44.6 | | | 44.8 | |
| Additional capital in excess of par value | 311.9 | | | 431.7 | |
| Retained earnings | 10,040.6 | | | 9,076.1 | |
| Accumulated other comprehensive loss | (51.7) | | | (47.5) | |
| Total stockholders' equity attributable to T. Rowe Price Group, Inc. | 10,345.4 | | | 9,505.1 | |
| Non-controlling interests in consolidated entities | 160.7 | | | 192.0 | |
| Total permanent stockholders' equity | 10,506.1 | | | 9,697.1 | |
| Total liabilities, redeemable non-controlling interests and permanent stockholders’ equity | $ | 13,472.0 | | | $ | 12,278.8 | |
The accompanying notes to consolidated financial statements are an integral part of these statements.
Page 58
CONSOLIDATED STATEMENTS OF INCOME
(in millions, except per-share amounts)
| | | | | | | | | | | | | | | | | |
| 2024 | | 2023 | | 2022 |
| Revenues | | | | | |
| Investment advisory fees | $ | 6,399.7 | | | $ | 5,709.5 | | | $ | 5,962.7 | |
| Performance-based advisory fees | 59.3 | | | 38.2 | | | 6.4 | |
| Capital allocation-based income | 46.6 | | | 161.9 | | | (54.3) | |
| Administrative, distribution, and servicing fees | 588.0 | | | 550.9 | | | 573.6 | |
| Net revenues | 7,093.6 | | | 6,460.5 | | | 6,488.4 | |
| | | | | |
| Operating expenses | | | | | |
| Compensation and related costs | 2,757.9 | | | 2,673.5 | | | 2,320.8 | |
| Distribution and servicing | 354.1 | | | 289.9 | | | 301.5 | |
| Advertising and promotion | 129.6 | | | 114.2 | | | 97.3 | |
| Product and recordkeeping related costs | 297.5 | | | 291.0 | | | 300.1 | |
| Technology, occupancy, and facility costs | 644.1 | | | 632.6 | | | 560.5 | |
| General, administrative, and other | 433.8 | | | 421.3 | | | 412.2 | |
| Change in fair value of contingent consideration | (13.4) | | | (82.4) | | | (161.2) | |
| Acquisition-related amortization and impairment costs | 156.7 | | | 134.2 | | | 283.5 | |
| Total operating expenses | 4,760.3 | | | 4,474.3 | | | 4,114.7 | |
| | | | | |
| Net operating income | 2,333.3 | | | 1,986.2 | | | 2,373.7 | |
| | | | | |
| Non-operating income (loss) | | | | | |
| Net gains (losses) on investments | 363.2 | | | 355.2 | | | (204.7) | |
| Net gains (losses) on consolidated investment products | 130.3 | | | 164.6 | | | (203.5) | |
| Other losses, including foreign currency losses | (7.2) | | | (15.7) | | | (17.3) | |
| Total non-operating income (loss) | 486.3 | | | 504.1 | | | (425.5) | |
| | | | | |
| Income before income taxes | 2,819.6 | | | 2,490.3 | | | 1,948.2 | |
| Provision for income taxes | 683.8 | | | 654.6 | | | 498.6 | |
| Net income | 2,135.8 | | | 1,835.7 | | | 1,449.6 | |
| Less: net income (loss) attributable to redeemable non-controlling interests | 35.7 | | | 47.0 | | | (108.3) | |
| Net income attributable to T. Rowe Price Group, Inc. | $ | 2,100.1 | | | $ | 1,788.7 | | | $ | 1,557.9 | |
| | | | | |
| Earnings per share on common stock of T. Rowe Price Group, Inc. | | | | | |
| Basic | $ | 9.18 | | | $ | 7.78 | | | $ | 6.73 | |
| Diluted | $ | 9.15 | | | $ | 7.76 | | | $ | 6.70 | |
The accompanying notes to consolidated financial statements are an integral part of these statements.
Page 59
CONSOLIDATED STATEMENTS OF COMPREHENSIVE INCOME
(in millions)
| | | | | | | | | | | | | | | | | |
| 2024 | | 2023 | | 2022 |
| Net income | $ | 2,135.8 | | | $ | 1,835.7 | | | $ | 1,449.6 | |
| Other comprehensive income (loss) | | | | | |
| Currency translation adjustments: | | | | | |
| Consolidated investment products—variable interest entities | (14.0) | | | 21.7 | | | (34.9) | |
| Reclassification of (gains) losses recognized in non-operating investment income upon deconsolidation of certain investment products | 0.4 | | | — | | | (3.0) | |
| Total currency translation adjustments of consolidated investment products—variable interest entities | (13.6) | | | 21.7 | | | (37.9) | |
| Equity method investments | 0.7 | | | (1.6) | | | (14.6) | |
| | | | | |
| | | | | |
| | | | | |
| | | | | |
| | | | | |
| | | | | |
| | | | | |
| | | | | |
| | | | | |
| | | | | |
| | | | | |
| Other comprehensive income (loss) before income taxes | (12.9) | | | 20.1 | | | (52.5) | |
| Net deferred tax benefits (income taxes) | 3.7 | | | (1.9) | | | 5.0 | |
| Total other comprehensive income (loss) | (9.2) | | | 18.2 | | | (47.5) | |
| Total comprehensive income | 2,126.6 | | | 1,853.9 | | | 1,402.1 | |
| Less: comprehensive income (loss) attributable to redeemable non-controlling interests | 30.7 | | | 59.7 | | | (129.1) | |
| Comprehensive income attributable to T. Rowe Price Group, Inc. | $ | 2,095.9 | | | $ | 1,794.2 | | | $ | 1,531.2 | |
The accompanying notes to consolidated financial statements are an integral part of these statements.
Page 60
CONSOLIDATED STATEMENTS OF CASH FLOWS
(in millions)
| | | | | | | | | | | | | | | | | |
| 2024 | | 2023 | | 2022 |
| Cash flows from operating activities | | | | | |
| Net income | $ | 2,135.8 | | | $ | 1,835.7 | | | $ | 1,449.6 | |
| Adjustments to reconcile net income to net cash provided by operating activities | | | | | |
| Depreciation, amortization and impairment of property, equipment and software | 254.1 | | | 254.8 | | | 225.7 | |
| Amortization and impairment of acquisition-related assets and retention arrangements | 250.1 | | | 226.8 | | | 420.1 | |
| Fair value remeasurement of contingent consideration liability | (13.4) | | | (82.4) | | | (161.2) | |
| Stock-based compensation expense | 247.3 | | | 265.6 | | | 285.4 | |
| | | | | |
| | | | | |
| Net (gains) losses recognized on other investments | (340.2) | | | (460.8) | | | 210.6 | |
| Net (investments) redemptions in investment products used to economically hedge deferred compensation liabilities | (93.2) | | | 56.1 | | | (18.8) | |
| Net change in securities held by consolidated investment products | (760.4) | | | (1,070.3) | | | 87.9 | |
| Other changes in assets and liabilities | 5.5 | | | 193.6 | | | (139.9) | |
| Net cash provided by operating activities | 1,685.6 | | | 1,219.1 | | | 2,359.4 | |
| | | | | |
| Cash flows from investing activities | | | | | |
| Purchases of sponsored investment products | (100.1) | | | (85.3) | | | (55.1) | |
| Dispositions of sponsored investment products | 533.4 | | | 616.6 | | | 263.6 | |
| Net cash of investment products upon deconsolidation | (15.8) | | | (56.8) | | | (8.7) | |
| Additions to property and equipment | (423.4) | | | (307.9) | | | (237.6) | |
| | | | | |
| Other investing activity | (171.6) | | | (38.4) | | | (3.7) | |
| Net cash provided by (used in) investing activities | (177.5) | | | 128.2 | | | (41.5) | |
| | | | | |
| Cash flows from financing activities | | | | | |
| Repurchases of common stock | (337.2) | | | (254.4) | | | (849.8) | |
| Common share issuances under stock-based compensation plans | (33.3) | | | (18.0) | | | (36.2) | |
| Dividends paid to common stock and equity-award holders | (1,135.6) | | | (1,121.7) | | | (1,107.4) | |
| Net distributions to non-controlling interests in consolidated entities | (36.7) | | | (43.3) | | | (35.1) | |
| Net subscriptions (redemptions) from redeemable non-controlling interest holders | 606.2 | | | 358.8 | | | (48.4) | |
| Net cash used in financing activities | (936.6) | | | (1,078.6) | | | (2,076.9) | |
| Effect of exchange rate changes on cash and cash equivalents of consolidated investment products | (2.4) | | | 0.4 | | | 9.5 | |
| Net change in cash and cash equivalents during year | 569.1 | | | 269.1 | | | 250.5 | |
| Cash and cash equivalents at beginning of year, including $77.2 million at December 31, 2023, $119.1 million at December 31, 2022 and $101.1 million at December 31, 2021 held by consolidated investment products | 2,143.8 | | | 1,874.7 | | | 1,624.2 | |
| Cash and cash equivalents at end of year, including $63.1 million at December 31, 2024, $77.2 million at December 31, 2023, and $119.1 million at December 31, 2022, held by consolidated investment products | $ | 2,712.9 | | | $ | 2,143.8 | | | $ | 1,874.7 | |
The accompanying notes to consolidated financial statements are an integral part of these statements.
Page 61
CONSOLIDATED STATEMENTS OF STOCKHOLDERS’ EQUITY (shares in thousands; dollars in millions) | | | | | | | | | | | | | | | | | | | | | | | | | | | | | | | | | | | | | | | | | | | | | | | | | | | | | |
| Common
shares
outstanding | | Common
stock | | Additional
capital in
excess of par value | | Retained
earnings | | AOCI(1) | | Total
stockholders’
equity attributable to T. Rowe Price Group, Inc. | | Non-controlling interests in consolidated entities | | Total permanent stockholders' equity | | Redeemable non-controlling interests |
| Balances at December 31, 2021 | 229,175 | | | $ | 45.8 | | | $ | 919.8 | | | $ | 8,083.6 | | | $ | (26.5) | | | $ | 9,022.7 | | | $ | 248.7 | | | $ | 9,271.4 | | | $ | 982.3 | |
| | | | | | | | | | | | | | | | | |
| | | | | | | | | | | | | | | | | |
| | | | | | | | | | | | | | | | | |
| Net income (loss) | — | | | — | | | — | | | 1,557.9 | | | — | | | 1,557.9 | | | (22.9) | | | 1,535.0 | | | (108.3) | |
| Other comprehensive income (loss), net of tax | — | | | — | | | — | | | — | | | (26.5) | | | (26.5) | | | — | | | (26.5) | | | (21.0) | |
| Dividends declared ($4.80 per share) | — | | | — | | | — | | | (1,108.7) | | | — | | | (1,108.7) | | | — | | | (1,108.7) | | | — | |
| | | | | | | | | | | | | | | | | |
| Common stock-based compensation plans activity: | | | | | | | | | | | | | | | | | |
| Shares issued upon option exercises | 522 | | | 0.1 | | | 28.2 | | | — | | | — | | | 28.3 | | | — | | | 28.3 | | | — | |
| Restricted shares issued, net of shares withheld for taxes | 9 | | | — | | | — | | | — | | | — | | | — | | | — | | | — | | | — | |
| Shares issued upon vesting of restricted stock units, net of shares withheld for taxes | 1,355 | | | 0.3 | | | (64.6) | | | — | | | — | | | (64.3) | | | — | | | (64.3) | | | — | |
| | | | | | | | | | | | | | | | | |
| Stock-based compensation expense | — | | | — | | | 285.4 | | | — | | | — | | | 285.4 | | | — | | | 285.4 | | | — | |
| Restricted stock units issued as dividend equivalents | — | | | — | | | 0.5 | | | (0.5) | | | — | | | — | | | — | | | — | | | — | |
| Common shares repurchased | (6,751) | | | (1.3) | | | (731.4) | | | (122.6) | | | — | | | (855.3) | | | — | | | (855.3) | | | — | |
| | | | | | | | | | | | | | | | | |
| | | | | | | | | | | | | | | | | |
| Net distributions to non-controlling interests in consolidated entities | — | | | — | | | — | | | — | | | — | | | — | | | (35.1) | | | (35.1) | | | — | |
| Net redemptions from consolidated investment products | — | | | — | | | — | | | — | | | — | | | — | | | — | | | — | | | (49.3) | |
| Net deconsolidations of investment products | — | | | — | | | — | | | — | | | — | | | — | | | — | | | — | | | (147.0) | |
| Balances at December 31, 2022 | 224,310 | | | 44.9 | | | 437.9 | | | 8,409.7 | | | (53.0) | | | 8,839.5 | | | 190.7 | | | 9,030.2 | | | 656.7 | |
| | | | | | | | | | | | | | | | | |
| | | | | | | | | | | | | | | | | |
| | | | | | | | | | | | | | | | | |
| Net income (loss) | — | | | — | | | — | | | 1,788.7 | | | — | | | 1,788.7 | | | 44.6 | | | 1,833.3 | | | 47.0 | |
| Other comprehensive income (loss), net of tax | — | | | — | | | — | | | — | | | 5.5 | | | 5.5 | | | — | | | 5.5 | | | 12.7 | |
| Dividends declared ($4.88 per share) | — | | | — | | | — | | | (1,121.9) | | | — | | | (1,121.9) | | | — | | | (1,121.9) | | | — | |
| | | | | | | | | | | | | | | | | |
| Common stock-based compensation plans activity: | | | | | | | | | | | | | | | | | |
| Shares issued upon option exercises | 585 | | | 0.1 | | | 35.6 | | | — | | | — | | | 35.7 | | | — | | | 35.7 | | | — | |
| Restricted shares withheld for taxes, net of shares issued | 57 | | | — | | | — | | | — | | | — | | | — | | | — | | | — | | | — | |
| Shares issued upon vesting of restricted stock units, net of shares withheld for taxes | 1,413 | | | 0.3 | | | (54.0) | | | — | | | — | | | (53.7) | | | — | | | (53.7) | | | — | |
| | | | | | | | | | | | | | | | | |
| Stock-based compensation expense | — | | | — | | | 265.6 | | | — | | | — | | | 265.6 | | | — | | | 265.6 | | | — | |
| Restricted stock units issued as dividend equivalents | — | | | — | | | 0.4 | | | (0.4) | | | — | | | — | | | — | | | — | | | — | |
| Common shares repurchased | (2,427) | | | (0.5) | | | (253.8) | | | | | — | | | (254.3) | | | — | | | (254.3) | | | — | |
| | | | | | | | | | | | | | | | | |
| Net distributions to non-controlling interests in consolidated entities | — | | | — | | | — | | | — | | | — | | | — | | | (43.3) | | | (43.3) | | | — | |
| Net subscriptions into consolidated investment products | — | | | — | | | — | | | — | | | — | | | — | | | — | | | — | | | 356.9 | |
| Net deconsolidations of investment products | — | | | — | | | — | | | — | | | — | | | — | | | — | | | — | | | (479.2) | |
| Balances at December 31, 2023 | 223,938 | | | $ | 44.8 | | | $ | 431.7 | | | $ | 9,076.1 | | | $ | (47.5) | | | $ | 9,505.1 | | | $ | 192.0 | | | $ | 9,697.1 | | | $ | 594.1 | |
The accompanying notes to consolidated financial statements are an integral part of these statements.
Page 62
CONSOLIDATED STATEMENTS OF STOCKHOLDERS’ EQUITY (shares in thousands; dollars in millions)
| | | | | | | | | | | | | | | | | | | | | | | | | | | | | | | | | | | | | | | | | | | | | | | | | | | | | |
| Common
shares
outstanding | | Common
stock | | Additional
capital in
excess of par value | | Retained
earnings | | AOCI(1) | | Total
stockholders’
equity attributable to T. Rowe Price Group, Inc. | | Non-controlling interests in consolidated entities | | Total permanent stockholders' equity | | Redeemable non-controlling interests |
| Balances at December 31, 2023 | 223,938 | | | $ | 44.8 | | | $ | 431.7 | | | $ | 9,076.1 | | | $ | (47.5) | | | $ | 9,505.1 | | | $ | 192.0 | | | $ | 9,697.1 | | | $ | 594.1 | |
| | | | | | | | | | | | | | | | | |
| | | | | | | | | | | | | | | | | |
| | | | | | | | | | | | | | | | | |
| Net income (loss) | — | | | — | | | — | | | 2,100.1 | | | — | | | 2,100.1 | | | 5.4 | | | 2,105.5 | | | 35.7 | |
| Other comprehensive income (loss), net of tax | — | | | — | | | — | | | — | | | (4.2) | | | (4.2) | | | — | | | (4.2) | | | (5.0) | |
| Dividends declared ($4.96 per share) | — | | | — | | | — | | | (1,135.2) | | | — | | | (1,135.2) | | | — | | | (1,135.2) | | | — | |
| | | | | | | | | | | | | | | | | |
| Common stock-based compensation plans activity: | | | | | | | | | | | | | | | | | |
| Shares issued upon option exercises | 577 | | | 0.1 | | | 36.3 | | | — | | | — | | | 36.4 | | | — | | | 36.4 | | | — | |
| Restricted shares withheld for taxes, net of shares issued | 7 | | | — | | | (0.3) | | | — | | | — | | | (0.3) | | | — | | | (0.3) | | | — | |
| Shares issued upon vesting of restricted stock units, net of shares withheld for taxes | 1,415 | | | 0.3 | | | (69.6) | | | — | | | — | | | (69.3) | | | — | | | (69.3) | | | — | |
| | | | | | | | | | | | | | | | | |
| Stock-based compensation expense | — | | | — | | | 247.3 | | | — | | | — | | | 247.3 | | | — | | | 247.3 | | | — | |
| Restricted stock units issued as dividend equivalents | — | | | — | | | 0.4 | | | (0.4) | | | — | | | — | | | — | | | — | | | — | |
| | | | | | | | | | | | | | | | | |
| Common shares repurchased | (2,971) | | | (0.6) | | | (333.9) | | | — | | | — | | | (334.5) | | | — | | | (334.5) | | | — | |
| | | | | | | | | | | | | | | | | |
| Net distributions to non-controlling interests in consolidated entities | — | | | — | | | — | | | — | | | — | | | — | | | (36.7) | | | (36.7) | | | — | |
| | | | | | | | | | | | | | | | | |
| Net subscriptions into consolidated investment products | — | | | — | | | — | | | — | | | — | | | — | | | — | | | — | | | 592.0 | |
| Net deconsolidations of investment products | — | | | — | | | — | | | — | | | — | | | — | | | — | | | — | | | (272.8) | |
| Balances at December 31, 2024 | 222,966 | | | $ | 44.6 | | | $ | 311.9 | | | $ | 10,040.6 | | | $ | (51.7) | | | $ | 10,345.4 | | | $ | 160.7 | | | $ | 10,506.1 | | | $ | 944.0 | |
(1) Accumulated other comprehensive income
The accompanying notes to consolidated financial statements are an integral part of these statements.
Page 63
NOTES TO CONSOLIDATED FINANCIAL STATEMENTS
NOTE 1 – BASIS OF PREPARATION AND SUMMARY OF SIGNIFICANT ACCOUNTING POLICIES.
T. Rowe Price Group, Inc. derives its consolidated revenues and net income primarily from investment advisory services that its subsidiaries provide to individual and institutional investors that invest in a broad range of investment solutions across equity, fixed income, multi-asset, and alternative capabilities. We also provide certain investment advisory clients with related administrative services, including distribution, mutual fund transfer agent, accounting, and shareholder services; participant recordkeeping and transfer agent services for defined contribution retirement plans; brokerage; trust services; and non-discretionary advisory services.
The investment solutions are provided in a number of vehicles including the T. Rowe Price U.S. mutual funds ("U.S. mutual funds"), subadvised funds, separately managed accounts, collective investment trusts, exchange-traded funds, and other sponsored products. The other sponsored products include: open-ended investment products offered to investors outside the U.S., products offered through variable annuity life insurance plans in the U.S., affiliated private investment funds, business development companies, an interval fund, and collateralized loan obligations.
Investment advisory fees depend largely on the total value and composition of assets under our management. Accordingly, fluctuations in financial markets and in the composition of assets under management impact our revenues and results of operations.
BASIS OF PREPARATION.
These consolidated financial statements have been prepared by management in accordance with accounting principles generally accepted in the United States. These principles require that we make certain estimates and assumptions. Actual results may vary from our estimates. In 2024, we are reporting performance-based advisory fees in a separate line of the consolidated income statement to increase transparency. As such, investment advisory fees for prior periods were recast to reflect the new presentation and ensure comparability. Additionally, the contingent consideration liability of zero at December 31, 2024 and $13.4 million at December 31, 2023, was combined with accounts payable and accrued expenses as the carrying value is immaterial. Details on the contingent consideration liability can be found in Note 5.
U.S. INFLATION REDUCTION LEGISLATION.
On August 16, 2022, the U.S. enacted the Inflation Reduction Act of 2022 ("IRA"). The IRA establishes new tax provisions and various incentives and tax credits. Among other things, the IRA created a 15% minimum tax on adjusted book income effective for taxable years beginning after December 31, 2022, as well as an excise tax of 1% on stock repurchases, net of stock issuances, for publicly traded companies effective for net stock repurchases made after December 31, 2022. The impact of the IRA’s provisions is not material to our financial position and results of operations.
NEWLY ISSUED BUT NOT YET ADOPTED ACCOUNTING GUIDANCE.
In December 2023, the FASB issued Accounting Standards Update No. 2023-09 - Income Taxes (Topic 740) - Improvements to Income Tax Disclosures, which requires public entities, on an annual basis, to provide disclosure of specific categories in the rate reconciliation, as well as disclosure of income taxes paid disaggregated by jurisdiction. This amendment is effective for the firm on January 1, 2025. We do not believe the additional disclosure requirements will have a material impact on our consolidated financial statements.
In November 2024, the FASB issued Accounting Standards Update No. 2024-03 - Income Statement- Reporting Comprehensive Income- Expense Disaggregation Disclosures (Subtopic 220-4): Disaggregation of Income Statement Expenses, which requires disclosures of additional information and disaggregation of certain expenses included in the income statement. The guidance is effective for the firm on January 1, 2027, and allows for either a prospective or retrospective approach on adoption. We are currently evaluating the impact that the adoption will have on our financial statements and have not yet determined our transition approach.
We have considered all other newly issued accounting guidance that is applicable to our operations and the preparation of our consolidated statements, including those we have not yet adopted. We do not believe that any such guidance has or will have a material effect on our financial position or results of operations.
SUMMARY OF SIGNIFICANT ACCOUNTING POLICIES.
Consolidation
Our consolidated financial statements include the accounts of all wholly-owned subsidiaries, majority-owned entities that are entitled to a disproportionate allocation of income, or carried interest, of affiliated private investment funds ("carried interest entities"), and investment products in which we have a controlling interest. We are deemed to have a controlling interest when we own the majority of a voting interest entity ("VOE") or are deemed to be the primary beneficiary of a variable interest entity ("VIE"). We perform an analysis of our investments to determine if the investment entity is a VOE or a VIE. Our analysis involves judgment and considers several factors, including an entity’s legal organization, capital structure, the rights of the equity investment holders, our ownership interest in the entity, and our contractual involvement with the entity. We continually review and reconsider our VOE or VIE conclusions upon the occurrence of certain events, such as changes to our ownership interest, changes to an entity’s legal structure, or amendments to governing documents. All material accounts and transactions between consolidated entities are eliminated in consolidation.
Variable interest entities
VIEs are entities that, by design: (i) lack sufficient equity to permit the entity to finance its activities independently or (ii) have equity holders that do not have the power to direct the activities of the entity that most significantly impact the entity’s economic performance, the obligation to absorb the entity’s losses, or the rights to receive the entity’s residual returns. We consolidate a VIE when we are the primary beneficiary, which is the party that has both (i) the power to direct the activities of the VIE that most significantly impact its economic performance and (ii) the obligation to absorb losses of the entity or the right to receive benefits from the VIE that could potentially be significant.
Our Luxembourg-based SICAV funds, and other investment products regulated outside the U.S., that we provide seed capital were determined to be VIEs and are consolidated when we are the primary beneficiary. Certain of the investment partnerships we have an interest in were determined to be VIEs and are not consolidated as we concluded that we are not the primary beneficiary.
We have determined that our carried interest entities are VIEs and T. Rowe Price is the primary beneficiary. Further, our carried interest entities hold interests in the general partners of certain affiliated private investment funds that are VIEs, though these carried interest entities were determined to not be the primary beneficiary. Therefore, these affiliated private investment funds are not consolidated.
Redeemable non-controlling interests
We recognize redeemable non-controlling interests for the portion of the net assets of our consolidated investment products held by unrelated third-party investors as their interests are convertible to cash and other assets at their option. As such, we reflect redeemable non-controlling interests as temporary equity in our consolidated balance sheets.
Non-controlling interests in consolidated entities
We recognize non-controlling interests in the consolidated carried interest entities as a component of permanent equity in our consolidated balance sheets. The non-controlling interests represent the minority interest held by limited partnerships controlled by employees, one of which is a member of our Board of Directors. Income (loss) is allocated to these non-controlling interests based on the contractual arrangements that govern the allocation of income (loss) and recognized as compensation expense.
Investments in T. Rowe Price money market mutual funds
We do not consider our investments in T. Rowe Price money market mutual funds when performing our consolidation analysis as the guidance provides a scope exception for interests in entities that are required to comply with, or operate in accordance with, requirements similar to those in Rule 2a-7 of the Investment Company Act of 1940 for registered money market funds.
Cash equivalents
Cash equivalents consist primarily of short-term, highly liquid investments in T. Rowe Price money market mutual funds. The cost of these funds is equivalent to fair value.
Investments
Investments held at fair value
Investments in sponsored products have been made for both general corporate investment purposes and to provide seed capital for newly formed sponsored investment products. Those investments that we do not consolidate are carried at fair value using the quoted closing NAV per share of each fund as of the balance sheet date. The underlying portfolio investments held by our consolidated investment products retain investment company specialized accounting in consolidation; are considered securities held in a trading account for cash flow reporting purposes; and are valued in accordance with the valuation and pricing policy used to value our assets under management which is further described in the Revenue Recognition policy below.
We elected to value certain interests in investment partnerships, for which market prices or quotations are not readily available, at fair value using the NAV per share as a practical expedient.
Changes in the fair values of all these investments are reflected in non-operating income in our consolidated statements of income.
Equity method investments
Equity method investments consist of investments in entities, including sponsored investment products and investments in affiliated private investments funds, for which we have the ability to exercise significant influence over the operating and financial policies of the investee. The carrying values of these investments are adjusted to reflect our proportionate share of the investee's net income or loss, any unrealized gain or loss resulting from the translation of foreign-denominated financial statements into U.S. dollars, and dividends received. Our proportionate share of income or loss is included in non-operating income in our consolidated statements of income.
As permitted under existing accounting guidance, we adopted a policy by which we recognize our share of UTI Asset Management Company Limited’s ("UTI") and other certain investment partnership earnings on a quarter lag as current financial information is not available in a timely manner. The basis difference between our carrying value and our proportionate share of UTI’s book value is primarily related to consideration paid in excess of the stepped-up basis of assets and liabilities on the date of purchase.
Investments in affiliated private investment funds - carried interest
Investments in affiliated private investment funds - carried interest represent interests in general partners of affiliated private investment funds that are contractually entitled to a disproportionate allocation of income, which is also referred to as carried interest. We account for these investments as financial instruments under ASC 323, Investments – Equity Method and Joint Ventures ("ASC 323") since the general partner has significant governance rights in the investment funds in which it invests, which demonstrate significant influence. The income earned is recognized as capital-allocation based income in our consolidated statements of income.
Held to Maturity
Investments in rated notes of certain European collateralized loan obligation funds are designated as held-to-maturity and carried on the balance sheet at amortized cost.
Concentration of risk
Concentration of credit risk in accounts receivable is believed to be minimal in that our clients generally have substantial assets, including those in the investment portfolios we manage for them.
Our investments held at fair value expose us to market risk, that is, the potential future loss of value that would result from a decline in the fair value of each investment or its underlying net assets. The underlying holdings of our assets under management are also subject to market risk, which may arise from changes in equity prices, credit ratings, foreign currency exchange rates, and interest rates.
Leases
We review new arrangements at inception to evaluate whether we have the right to obtain substantially all the economic benefits of and have the right to control the use of an asset. If we determine that an arrangement qualifies as a lease, we recognize a lease liability and a corresponding asset on the lease’s commencement date. The lease liability is initially measured at the present value of the future minimum lease payments over the lease term using the rate implicit in the arrangement or, if not available, our incremental borrowing rate. An operating lease asset is measured initially at the value of the lease liability less any lease incentives received and initial direct costs incurred.
Our leases qualify as operating leases and consist primarily of real estate leases for corporate offices, data centers, and other facilities. We measure our operating lease liabilities using an estimated incremental borrowing rate as an implicit rate cannot be readily determinable from any of our operating lease arrangements. Since we do not have any outstanding corporate borrowings, we estimate our incremental borrowing rate using an estimated credit rating and available market information. Additionally, certain of our leases contain options to extend or terminate the lease term that, if exercised, would result in the remeasurement of the operating lease liability.
Our operating leases contain both lease and non-lease components. Non-lease components are distinct elements of a contract that are not related to securing the use of the lease assets, such as common area maintenance and other management costs. We elected to measure the lease liability of our real estate operating leases by combining the lease and non-lease components into one single lease component. As such, we included the fixed payments and any payments that depend on a rate or index related to our lease and non-lease components in measuring the operating lease liability.
We recognize operating lease expense on a straight-line basis over the lease term as part of technology, occupancy, and facility costs in our consolidated statements of income.
Property, equipment and software
Property, equipment and software is stated at cost net of accumulated depreciation and amortization computed using the straight-line method. Provisions for depreciation and amortization are based on the following weighted-average estimated useful lives: computer and communications software and equipment, 3 years; buildings and improvements, 33 years; leasehold improvements, 9 years; and furniture and other equipment, 6 years.
Intangible assets
Intangible assets consist primarily of acquired investment advisory agreements and trade name. The fair values of the acquired investment advisory agreements were based on the net present value of estimated future cash flows attributable to each agreement, and included significant assumptions related to revenue, discount rate, and effective tax rate. The investment advisory agreement intangible assets are amortized using the straight-line method over their estimated useful lives unless the asset was determined to have an indefinite life as there is no foreseeable limit on the contract period. The weighted average remaining useful life of definite-lived intangibles assets is approximately 3.7 years.
Definite-lived intangible assets are tested when there is an indication of impairment. Impairment is indicated when the carrying value of the asset is not recoverable and exceeds its fair value. If indicators are present, we perform a recoverability test by comparing the estimated undiscounted future cash flows attributable to the asset group in question to the asset group’s carrying amount. If the undiscounted estimated future cash flows are less than the carrying amount of the asset, the asset’s cost is adjusted to fair value and an impairment loss is recognized. The fair value is determined using a discounted cash flow analysis where estimated future cash flows are discounted to arrive at a single present value amount. This approach includes inputs that require significant management judgment, the most relevant of which included revenue growth, discount rates, and effective tax rates.
The trade name fair value was determined using the relief from royalty method based on net present value of estimated cash flows, which include significant assumptions about royalty rate, revenue growth rate, discount rate and effective tax rate. Additionally, we identified the trade name intangible asset as indefinite-lived as there is no foreseeable limit on use of the acquired name.
Indefinite-lived intangible assets are tested for impairment annually in the fourth quarter or more frequently when an event occurs or circumstances change that more likely than not reduce the fair value of the indefinite-lived intangible
asset below its carrying value. The fair value for each asset is determined using a discounted cash flow analysis where estimated future cash flows were discounted to arrive at a single present value amount. This approach includes inputs that require significant management judgment, the most relevant of which include revenue growth, discount rates, and effective tax rates.
Goodwill
We internally conduct, manage, and report our operations as one investment advisory business. This reflects how the chief operating decision maker allocates resources and assesses performance. Accordingly, we have one reporting unit - investment advisory business, consistent with our single operating segment, to which all goodwill has been assigned.
We evaluate the carrying amount of goodwill in our consolidated balance sheets for possible impairment on an annual basis, in the fourth quarter, using a fair value approach. Our evaluations have indicated that no impairment exists.
Revenue recognition
Our revenue is earned from investment advisory, administrative, and distribution services we provide to our clients. Each distinct service we promise in our agreements is considered a performance obligation and is the basis for determining when we recognize revenue. The fees are allocated to each distinct performance obligation and we recognize revenue when, or as, we satisfy our promises. The consideration for our services is generally variable and included in net revenues, when it is improbable that a significant reversal could occur in the future. For certain client agreements, we have the discretion to hire a third party to provide services to our clients. In these circumstances, we are generally deemed to control the services before transferring them to our clients, and accordingly present the revenues gross of the related third-party costs. The timing of when we bill our clients and related payment terms vary in accordance with agreed-upon contractual terms. For the majority of our agreements, billing occurs after we have recognized revenue, which results in accounts receivable and accrued revenue. For an insignificant portion of our contracts, billing occurs in advance of providing services, which results in deferred revenue within the accounts payable and accrued expenses line of our consolidated balance sheets.
Taxes billed to our clients based on our fees for services rendered are not included in revenues.
Investment advisory fees
The majority of our investment advisory agreements, including those with the U.S. mutual funds, have a single performance obligation as the promised services are not separately identifiable from other promises in the agreements and, therefore, are not distinct. Substantially all performance obligations for providing advisory services are satisfied over time and revenue is recognized as time passes.
Investment advisory agreements with sponsored investment products regulated outside the U.S. generally have two performance obligations; one for investment management and one for distribution. For these agreements, we allocate the management fee to each performance obligation using our best estimate of the standalone fee of each of these services. The performance obligation for providing investment management services, like our other advisory contracts, is satisfied over time and revenue is recognized as time passes. The performance obligation for distribution is satisfied at the point in time when an investor makes an investment into the product. Accordingly, a portion of the investment advisory fees earned from these products relate to distribution performance obligations that were satisfied during prior periods. These distribution fees are reported within the investment advisory fees line of our consolidated statements of income.
The management fee for our investment advisory agreements are based on our assets under management, which change based on fluctuations in financial markets and net cash flows from investors, and represents variable consideration. Therefore, investment advisory fees are generally constrained, and excluded from revenue, until the asset values on which our client is billed are no longer subject to financial market volatility. Investment advisory fees for certain investment products are presented net of fees waived pursuant to the contractual expense limitations of the product. Our assets under management are valued in accordance with valuation and pricing processes for each major type of investment. Fair values used in our processes are primarily determined from quoted market prices; prices furnished by dealers who make markets in such securities; or from data provided by independent pricing
services that considers yield or price of investments of comparable quality, coupon, maturity, and type. Investments for which market prices are not readily available are not a material portion of our total assets under management.
We provide all services to the U.S. mutual funds under contracts that are subject to periodic review and approval by the funds’ Boards. Regulations require that the funds’ shareholders also approve material changes to investment advisory contracts.
Investment advisory fees also include fees earned from affiliated private investment funds or private accounts that are determined either monthly or quarterly and are generally based on the fund’s or account's net asset value or invested capital. Investment advisory fees earned from CLOs include senior collateral management fees and subordinated collateral management fees, which are generally determined quarterly based on the sum of collateral principal amounts and the aggregate principal amount of all defaulted obligations. If amounts distributable on any payment date are insufficient to pay the collateral management fee according to the priority of payments, any shortfall is deferred and payable on subsequent payment dates.
Performance-Based Fees
We recognize performance-based incentive fees in connection with the investment advisory agreements from certain sponsored product and separately managed and subadvised accounts. We are entitled to receive performance-based incentive fees when the return on investment assets exceeds a certain benchmark return. In such arrangements, these incentive fees are recognized at the end of the measurement period when the performance benchmark or contractual outperformance has been achieved. Performance-based incentive fees are considered a form of variable consideration, and as such, these fees are subject to potential reversal up until the end of the measurement period (which is generally one year) when the performance-based incentive fees become fixed, determinable, and are not subject to significant reversal. There are no significant judgments made when determining the performance-based incentive fees.
Administrative, distribution, and servicing fees
Administrative fees
The administrative services we provide include distribution, mutual fund transfer agent, accounting and shareholder services; participant recordkeeping and transfer agent services for defined contribution retirement plans; brokerage; trust services; and non-discretionary advisory services.
The administrative service agreements with the U.S. mutual funds for accounting oversight, transfer agency, and recordkeeping services generally have one performance obligation as the promised services in each agreement are not separately identifiable from other promises in the agreement and, therefore, are not distinct. The fees for performing these services are earned based on a per participant fee and represent variable consideration. The fees are generally constrained and are recognized as revenue when costs are incurred to perform the services.
Other administrative service agreements for participant recordkeeping and transfer agent services for defined contribution retirement plans; brokerage services, and trust services generally have one performance obligation as the promised services in each agreement are not separately identifiable from other performance obligations in the contract and, therefore, are not distinct. Our performance obligation in each agreement is satisfied over time and revenue is recognized as time passes. The fees for these services vary by contract and are both fixed and variable.
Distribution and servicing fees
The agreements for distribution and servicing fees earned from 12b-1 plans of the Advisor Class, R Class, and Variable Annuity II Class shares of the U.S. mutual funds have one performance obligation, as distribution services are not separately identifiable from shareholder servicing promises in the agreements and, therefore, are not distinct. Our performance obligation is satisfied at the point in time when an investor makes an investment into these share classes of the U.S. mutual funds. The fees for these distribution and servicing agreements are based on the assets under management in these share classes, which change based on fluctuations in financial markets, and represent variable consideration. These fees are generally constrained, and excluded from revenue, until the asset values on which our client is billed are not subject to financial market volatility. Accordingly, the majority of the distribution and servicing revenue relates to distribution and servicing obligations that were satisfied during prior periods.
We also recognize the corresponding costs paid to the third-party financial intermediaries that distribute these funds' share classes within the distribution and servicing costs line of the consolidated statements of income. The fee revenue that we recognize from the funds and the expense that we recognize for the fees paid to third-party intermediaries are equal in amount and, therefore, do not impact our net operating income.
Capital allocation-based income
This represents the income earned from general partner investments in affiliated private investment funds with arrangements that are entitled to a disproportionate allocation of income, which is also known as carried interest. These investments are accounted for under ASC 323 and the income recognized in capital allocation-based income in our consolidated statements of income represents the proportionate share of the income or loss assuming the funds were liquidated as of each reporting date pursuant to the fund's governing agreements. Capital allocation-based income will fluctuate period-to-period to reflect the adjustment to accrued carried interest for the change in value of the affiliated funds' underlying investments assuming the value was realized as of the end of the period, regardless of whether the fund's underlying investments have been realized. The realization of accrued carried interest occurs over a number of years. Since this income is accounted for under ASC 323, it is outside the scope of ASC 606, Revenue Recognition. A portion of this income is allocated to non-controlling interest holders and is reflected as compensation expense.
Advertising
Costs of advertising are expensed the first time that the advertising takes place.
Long-term incentive compensation
We maintain two stockholder-approved employee long-term incentive plans (2020 Long-Term Incentive Plan and 2012 Long-Term Incentive Plan (collectively, the LTI Plans), and two stockholder-approved non-employee director plans (2017 Non-Employee Director Equity Plan and 2007 Non-Employee Director Equity Plan, collectively the Director Plans). We believe our stock-based compensation programs align the interests of our employees and directors with those of our common stockholders. As of December 31, 2024, a total of 8,671,495 shares were available for future grant under the 2020 Long-Term Incentive Plan and the 2017 Non-Employee Director Equity Plan (2017 Plan).
Under our LTI Plans, we have issued restricted stock units to employees that settle in shares of our common stock after vesting. Vesting of these awards is based on the individual continuing to render service over an average five-year graded schedule. All restricted stock unit holders receive non-forfeitable cash dividend equivalents on our dividend payable date. We are also authorized to grant qualified incentive and nonqualified fixed stock options with a maximum term of 10 years. We have not granted options to employees since 2015.
We grant performance-based restricted stock units to certain executive officers in which the number of restricted stock units ultimately retained is determined based on achievement of certain performance thresholds. The number of restricted stock units retained is also subject to similar time-based vesting requirements as the other restricted stock units described above. Cash dividend equivalents are accrued and paid to the holders of performance-based restricted stock units only after the performance period has lapsed and the performance thresholds have been met.
Effective July 2024, the 2020 Long-Term Incentive Plan was amended to provide certain employees the opportunity to receive 50% of their annual long-term incentive award in the form of restricted fund units. Vesting of restricted fund units is based on the individual continuing to render service over an average five-year graded schedule. These awards are settled in cash upon vesting.
Under the Director Plans, we may grant options with a maximum term of 10 years, restricted shares, and restricted stock units to non-employee directors. Under the 2017 Plan, awards generally vest over one year and, in the case of restricted stock units, are settled upon the non-employee directors’ departure from the Board. For restricted shares, cash dividends are accrued and paid only after the award vests. Restricted stock unit holders receive dividend equivalents in the form of unvested stock units that vest over the same period as the underlying award. We have not granted options to non-employee directors since 2016. As of December 31, 2024, non-employee directors held 83,485 vested stock units and an additional 7,413 stock units that will generally vest over the next six months. These units will convert to common shares upon their separation from the Board. Non-employee directors also held 8,970 restricted stock awards expected to vest over the next six months.
Our long-term incentive award values are converted to units on the grant-date using the closing market price of our common stock for restricted stock units and awards. For restricted fund units, the award value is converted using the closing market price of one or more hypothetical funds selected by employees from a group of sponsored investment products prior to the grant date. We recognize the grant-date fair value of all long-term incentive awards as compensation expense ratably over the awards' requisite service period. Compensation expense recognized for performance-based restricted units includes an estimate regarding the probability of the performance thresholds being met. For restricted fund units, the units are remeasured against the hypothetical funds chosen by the unit holder each reporting period and the adjustment reported in compensation expense. We account for forfeitures as they occur.
Earnings per share
We compute our basic and diluted earnings per share under the two-class method, which considers our outstanding restricted shares and stock units, on which we pay non-forfeitable dividends as if they were a separate class of stock.
Comprehensive income
The components of comprehensive income are presented in a separate statement following our consolidated statements of income and include net income and the change in our currency translation adjustments. The currency translation adjustments result from translating our proportionate share of the financial statements of our equity method investment in UTI, and certain consolidated investment products into U.S. dollars. Assets and liabilities are translated into U.S. dollars using year-end exchange rates, and revenues and expenses are translated using weighted-average exchange rates for the period.
The changes in accumulated balances of each component of other comprehensive income, the deferred tax impacts of each component, and information about significant items reclassified out of accumulated other comprehensive income are presented in the notes to the consolidated financial statements. The notes also indicate the line item of our consolidated statements of income in which the significant reclassifications were recognized.
We reclassify income tax effects relating to currency translation adjustments to tax expense when there is a reduction in our ownership interest in the related investment. The amount of the reclassification depends on the investment’s accounting treatment before and after the change in ownership percentage.
NOTE 2 – CASH EQUIVALENTS.
Cash equivalent investments in the T. Rowe Price money market mutual funds aggregate to $2,309.8 million at December 31, 2024, and $1,678.1 million at December 31, 2023. Dividends earned on these investments totaled $128.3 million in 2024, $101.3 million in 2023, and $30.0 million in 2022.
NOTE 3 – INFORMATION ABOUT RECEIVABLES, REVENUES, AND SERVICES.
Revenues earned during the years ended December 31, 2024, 2023 and 2022, are included in the table below along with details of investment advisory fees earned from clients by their underlying asset class. We have also included average assets under management by asset class, on which we earn the investment advisory fees.
| | | | | | | | | | | | | | | | | |
| (in millions) | 2024 | | 2023 | | 2022 |
| Investment advisory fees | | | | | |
| Equity | $ | 3,864.7 | | | $ | 3,442.3 | | | $ | 3,758.4 | |
| Fixed income, including money market | 410.7 | | | 400.4 | | | 426.3 | |
| Multi-asset | 1,814.1 | | | 1,583.4 | | | 1,508.9 | |
| Alternatives | 310.2 | | | 283.4 | | | 269.1 | |
| Total investment advisory fees | $ | 6,399.7 | | | $ | 5,709.5 | | | $ | 5,962.7 | |
| Performance-based advisory fees | 59.3 | | | 38.2 | | | 6.4 | |
| Capital allocation-based income | 46.6 | | | 161.9 | | | (54.3) | |
| Total administrative, distribution, and servicing fees | 588.0 | | | 550.9 | | | 573.6 | |
| Net revenues | $ | 7,093.6 | | | $ | 6,460.5 | | | $ | 6,488.4 | |
| | | | | |
Average AUM (in billions): | | | | | |
| Equity | $ | 804.3 | | | $ | 705.2 | | | $ | 763.6 | |
| Fixed income, including money market | 178.6 | | | 169.3 | | | 173.4 | |
| Multi-asset | 529.0 | | | 442.3 | | | 418.7 | |
| Alternatives | 50.0 | | | 45.5 | | | 42.7 | |
| Average AUM | $ | 1,561.9 | | | $ | 1,362.3 | | | $ | 1,398.4 | |
Total net revenues earned from sponsored investment products totaled $5,859.8 million in 2024, $5,327.9 million in 2023, and $5,326.3 million in 2022. Accounts receivable from these products aggregate to $602.0 million at December 31, 2024 and $533.9 million at December 31, 2023.
Investors that we serve are primarily domiciled in the U.S.; investment advisory clients outside the U.S. account for 8.8% at December 31, 2024 and 8.6% at December 31, 2023 of assets under management.
NOTE 4 – INVESTMENTS.
The carrying values of investments that are not part of the consolidated investment products at December 31 are as follows:
| | | | | | | | | | | |
| (in millions) | 2024 | | 2023 |
| Investments held at fair value | | | |
| T. Rowe Price investment products | | | |
| Discretionary investments | $ | 258.8 | | | $ | 246.4 | |
| Seed capital | 262.8 | | | 247.8 | |
| Deferred compensation liabilities economic hedges | 992.8 | | | 806.6 | |
| Investment partnerships and other investments | 62.6 | | | 69.7 | |
| Investments in affiliated collateralized loan obligations | 6.3 | | | 8.4 | |
| Equity method investments | | | |
| T. Rowe Price investment products | | | |
| Discretionary investments | 60.8 | | | 5.3 | |
| Seed capital | 128.8 | | | 91.1 | |
| Deferred compensation liabilities economic hedges | 88.4 | | | 21.0 | |
| Investment in UTI Asset Management Company Limited (India) | 173.5 | | | 164.5 | |
| Investments in affiliated private investment funds - carried interest | 426.9 | | | 519.9 | |
| Investments in affiliated private investment funds - seed/co-investment | 269.9 | | | 253.4 | |
| Other investment partnerships and investments | 162.1 | | | 2.2 | |
| Held to maturity | | | |
| Investments in affiliated collateralized loan obligations | 61.1 | | | 94.1 | |
| Certificates of deposit | 44.7 | | | 23.3 | |
| U.S. Treasury note | 1.0 | | | 1.0 | |
| Total | $ | 3,000.5 | | | $ | 2,554.7 | |
INVESTMENTS AT FAIR VALUE
The investment partnerships are carried at fair value using net asset value ("NAV") per share as a practical expedient. Our interests in these partnerships are generally not redeemable and are subject to significant transferability restrictions. The underlying investments of these partnerships have contractual terms through 2029, though we may receive distributions of liquidating assets over a longer term. The investment strategies of these partnerships include growth equity, buyout, venture capital, and real estate.
During 2024, we recognized $51.3 million of net unrealized gains on investments held at fair value that were still held at December 31, 2024. For 2023, we recognized $86.7 million of net unrealized gains on investments held at fair value that were still held at December 31, 2023. For 2022, we recognized $240.5 million of net unrealized losses on investments held at fair value that were still held at December 31, 2022.
Dividends, including capital gain distributions, earned on the sponsored investment products held at fair value, totaled $67.6 million in 2024, $38.2 million in 2023, and $45.3 million in 2022.
During each of the last three years, certain investment products in which we provided initial seed capital at the time of formation were deconsolidated, as we no longer had a controlling interest. Depending on our ownership interest, we are now reporting our residual interests in these investment products as either an equity method investment or an investment held at fair value. Additionally, during 2024 and 2023, certain investment products that were being accounted for as either equity method or fair value investments were consolidated, as we regained a controlling interest. The net impact of these changes on our consolidated balance sheets and statements of income as of the dates the portfolios were deconsolidated or reconsolidated is detailed below.
| | | | | | | | | | | | | | | | | |
| (in millions) | 2024 | | 2023 | | 2022 |
| Net decrease in assets of consolidated investment products | $ | (673.9) | | | $ | (663.8) | | | $ | (256.9) | |
| Net decrease in liabilities of consolidated investment products | $ | (20.5) | | | $ | (29.7) | | | $ | (12.8) | |
| Net decrease in redeemable non-controlling interests | $ | (272.8) | | | $ | (479.2) | | | $ | (147.2) | |
| | | | | |
| Gains recognized upon deconsolidation | $ | (0.4) | | | $ | — | | | $ | 3.0 | |
The gains recognized upon deconsolidation were the result of reclassifying currency translation adjustments accumulated on certain investment products with non-USD functional currencies from accumulated other comprehensive income to non-operating income.
VARIABLE INTEREST ENTITIES.
Our fair value and equity method investments at December 31, 2024 and 2023, include interests in variable interest entities that we do not consolidate as we are not deemed the primary beneficiary. Our maximum risk of loss related to our involvement with these entities is as follows:
| | | | | | | | | | | |
| (in millions) | 2024 | | 2023 |
| Investment carrying values | $ | 955.9 | | | $ | 919.3 | |
| Unfunded capital commitments | 202.5 | | | 94.1 | |
| Accounts receivable | 96.2 | | | 92.1 | |
| $ | 1,254.6 | | | $ | 1,105.5 | |
The unfunded capital commitments, totaling $202.5 million at December 31, 2024 and $94.1 million at December 31, 2023, relate primarily to the affiliated private investment funds and the investment partnerships in which we have an existing investment. In addition to such amounts, a percentage of prior distributions may be called under certain circumstances.
Investments in affiliated private investment funds - carried interest represent interests in the general partners of affiliated private investment funds that are entitled to a disproportionate allocation of income or carried interest. The carried interest entities that hold these interests in the general partners of affiliated private investment funds are considered variable interest entities and are consolidated as T. Rowe Price is determined to be the primary beneficiary. The total assets, liabilities and non-controlling interests of these carried interest entities as of December 31 are as follows:
| | | | | | | | | | | |
| (in millions) | 2024 | | 2023 |
| Assets | $ | 467.7 | | | $ | 564.7 | |
| Liabilities | $ | 0.4 | | | $ | 1.9 | |
| Non-controlling interest | $ | 160.7 | | | $ | 192.0 | |
INVESTMENTS IN AFFILIATED COLLATERALIZED LOAN OBLIGATIONS.
These investments represent European CLOs that invest in 5% vertical strips in each class of rated notes and subordinated notes. Certain investments in the debt tranches of the CLOs are measured at amortized cost as investments held to maturity and included in investments in our consolidated balance sheets. The subordinated note tranches of these investments are held at fair value and any gain or loss is included in non-operating income (loss) in the consolidated statements of income. Certain of the investments in the debt tranches of the CLOs have been pledged as collateral against repurchase agreements.
There is debt associated with our long-term investments in affiliated collateralized loan obligations (“CLOs”). This debt is carried at $59.1 million at December 31, 2024 and $89.4 million at December 31, 2023, and is reported in accounts payable and accrued expenses in our consolidated balance sheets. The debt outstanding is related to repurchase agreements of €56.9 million at December 31, 2024, compared to €65.5 million at December 31, 2023 (equivalent to $59.1 million at December 31, 2024 and $72.3 million at December 31, 2023 at the respective EUR spot rates) that are collateralized by the CLO investments. The debt included no outstanding note facilities at December 31, 2024, compared to $17.1 million at December 31, 2023, that are collateralized by first priority security interests in the assets of a consolidated subsidiary that is party to the notes. The note facilities bear interest at rates based on EURIBOR plus the initial margin, which equals all-in rates ranging from 1.15% to 12.09% as of December 31, 2024. The debt matures on various dates through 2035 or if the investments are paid back in full or cancelled, whichever is sooner.
NOTE 5 – FAIR VALUE MEASUREMENTS.
We determine the fair value of our cash equivalents and certain investments using the following broad levels of inputs as defined by related accounting standards:
Level 1 – quoted prices in active markets for identical financial instruments accessible at the reporting date.
Level 2 – observable inputs other than Level 1 quoted prices including, but not limited to, quoted prices for similar financial instruments in active markets, quoted prices for identical or similar financial instruments in inactive markets, interest rates and yield curves, implied volatilities, and credit spreads. These inputs are based on market data obtained from independent sources.
Level 3 – unobservable inputs reflecting our own assumptions based on the best information available. The inputs into the determination of fair value require significant management judgment or estimation. Investments in this category generally include investments for which there is not an actively-traded market.
These levels are not necessarily an indication of the risk or liquidity associated with our investments. The following table summarizes our investments that are recognized in our consolidated balance sheets at December 31 using fair value measurements determined based on the differing levels of inputs. This table excludes investments held by consolidated investment products which are presented separately on our consolidated balance sheets and are detailed in Note 6.
| | | | | | | | | | | | | | | | | | | | | | | | | | | | | | | | | | | |
| 2024 | | 2023 |
| (in millions) | Level 1 | | Level 2 | | Level 3 | | Level 1 | | Level 2 | | Level 3 |
| T. Rowe Price investment products | | | | | | | | | | | |
| Cash equivalents held in money market funds | $ | 2,309.8 | | | $ | — | | | $ | — | | | $ | 1,678.1 | | | $ | — | | | $ | — | |
| Discretionary investments | 258.8 | | | — | | | — | | | 246.4 | | | — | | | — | |
| Seed capital | 209.4 | | | 53.4 | | | — | | | 206.0 | | | 41.8 | | | — | |
| Deferred compensation liabilities economic hedges | 992.8 | | | — | | | — | | | 806.6 | | | — | | | — | |
| Other investments | 0.1 | | | — | | | — | | | 0.7 | | | — | | | — | |
| Investments in affiliated collateralized loan obligations | — | | | 6.3 | | | — | | | — | | | 8.4 | | | — | |
| Total | $ | 3,770.9 | | | $ | 59.7 | | | $ | — | | | $ | 2,937.8 | | | $ | 50.2 | | | $ | — | |
| | | | | | | | | | | |
| Contingent consideration liability | $ | — | | | $ | — | | | $ | — | | | $ | — | | | $ | — | | | $ | 13.4 | |
The fair value hierarchy level table above does not include the investment partnerships and other investments for which fair value is estimated using their NAV per share as a practical expedient. The carrying value of these investments as disclosed in Note 4 were $62.5 million at December 31, 2024 and $69.0 million at December 31, 2023.
As part of the purchase consideration for our acquisition of OHA in December 2021, there was contingent consideration in an amount up to $900.0 million as part of an earnout cash payment that may be due starting in 2025 and ending in 2027, upon satisfying or exceeding certain defined revenue targets. These defined revenue
targets are evaluated on a cumulative basis beginning at the end of 2024, with the ability to extend two additional years if the defined revenue targets are not achieved. The earnout amount is subject to a proportional reduction if OHA's actual revenue at the end of the earnout period does not meet the defined revenue targets and could result in no earnout payout if OHA's actual revenue falls below 75% of the defined revenue target. About 22% of the earnout is conditioned upon continued service with T. Rowe Price and was excluded from the purchase consideration and deemed compensatory. The fair value of the earnout deemed compensatory is remeasured each reporting period and recognized over the related service period. For the year ended December 31, 2024, 2023,and 2022, the amounts recognized as part of compensation expense in our consolidated statements of income were immaterial.
The change in the contingent consideration liability, included in accounts payable and accrued expenses, is measured at fair value for which we used Level 3 inputs to determine fair value is as follows:
| | | | | | | | | | | |
| | | | Year-ended |
| (in millions) | | | | 12/31/2024 | 12/31/2023 |
| Balance at beginning of the year | | | | $ | 13.4 | | $ | 95.8 | |
| | | | | |
| Unrealized gains, included in earnings | | | | (13.4) | | (82.4) | |
| Balance at end of the year | | | | $ | — | | $ | 13.4 | |
The fair value of the contingent consideration is calculated using the Monte Carlo simulation methodology of valuation. The most significant assumptions used relate to the discount rates and from changes pertaining to the achievement of the defined financial targets.
In addition, simultaneously with the OHA acquisition, a Value Creation Agreement was entered into whereby certain employees of OHA will receive incentive payments equal to 10% of the appreciated value of the OHA business on the fifth anniversary of the acquisition date, subject to an annualized preferred return to T. Rowe Price. This arrangement is treated as a post-combination compensation expense. This arrangement will be remeasured at fair value at each reporting date and recognized over the related service period. For the year ended December 31, 2024, 2023, and 2022, the amounts recognized as part of compensation expense in our consolidated statements of income were immaterial.
In 2024, 2023, and 2022, we recognized impairment charges on certain of our identified intangible assets. As part of the impairment recognition, a fair value measurement was determined for these intangible assets. See Note 9 for further discussion of the impairments.
NOTE 6 – CONSOLIDATED INVESTMENT PRODUCTS.
The investment products that we consolidate in our consolidated financial statements are generally those products we provided initial seed capital at the time of their formation and have a controlling interest. Our U.S. mutual funds and certain other products are considered voting interest entities, while those regulated outside the U.S. are considered variable interest entities.
The following table details the net assets of the consolidated investment products at December 31:
| | | | | | | | | | | | | | | | | | | | | | | | | | | | | | | | | | | |
| 2024 | | 2023 |
| (in millions) | VOE | | VIE | | Total | | VOE | | VIE | | Total |
Cash and cash equivalents(1) | $ | 7.2 | | | $ | 55.9 | | | $ | 63.1 | | | $ | 25.7 | | | $ | 51.5 | | | $ | 77.2 | |
Investments(2) | 470.8 | | | 1,465.4 | | | 1,936.2 | | | 718.0 | | | 1,129.0 | | | 1,847.0 | |
| Other assets | 10.4 | | | 34.3 | | | 44.7 | | | 11.2 | | | 23.9 | | | 35.1 | |
| Total assets | 488.4 | | | 1,555.6 | | | 2,044.0 | | | 754.9 | | | 1,204.4 | | | 1,959.3 | |
| Liabilities | 15.9 | | | 46.2 | | | 62.1 | | | 19.0 | | | 35.2 | | | 54.2 | |
| Net assets | $ | 472.5 | | | $ | 1,509.4 | | | $ | 1,981.9 | | | $ | 735.9 | | | $ | 1,169.2 | | | $ | 1,905.1 | |
| | | | | | | | | | | |
| Attributable to T. Rowe Price Group | $ | 348.5 | | | $ | 689.4 | | | $ | 1,037.9 | | | $ | 589.9 | | | $ | 721.1 | | | $ | 1,311.0 | |
| Attributable to redeemable non-controlling interests | 124.0 | | | 820.0 | | | 944.0 | | | 146.0 | | | 448.1 | | | 594.1 | |
| $ | 472.5 | | | $ | 1,509.4 | | | $ | 1,981.9 | | | $ | 735.9 | | | $ | 1,169.2 | | | $ | 1,905.1 | |
(1) Cash and cash equivalents includes $4.9 million and $16.2 million at December 31, 2024 and 2023, respectively, of investments in
T. Rowe Price money market mutual funds.
(2) Consolidated investment products invest $9.3 million and $6.2 million at December 31, 2024 and 2023, respectively, in other sponsored investment products.
Although we can generally redeem our net interest in the consolidated investment products at any time, we cannot directly access or sell the assets held by these products to obtain cash for general operations. Additionally, the assets of these investment products are not available to our general creditors.
Since third-party investors in these investment products have no recourse to our credit, our overall risk related to the net assets of consolidated investment products is limited to valuation changes associated with our net interest. However, we are required to recognize the valuation changes associated with all underlying investments held by these products in our consolidated statements of income and disclose the portion attributable to unrelated third-party investors as net income attributable to redeemable non-controlling interests.
The operating results of the consolidated investment products, are reflected in our consolidated statements of income for the year ended December 31 as follows:
| | | | | | | | | | | | | | | | | | | | | | | | | | | | | | | | | | | | | | | | | | | | | | | | | | | | | |
| 2024 | | 2023 | | 2022 |
| (in millions) | VOE | | VIE | | Total | | VOE | | VIE | | Total | | VOE | | VIE | | Total |
| Operating expenses reflected in net operating income | $ | (2.4) | | | $ | (7.4) | | | $ | (9.8) | | | $ | (3.7) | | | $ | (7.4) | | | $ | (11.1) | | | $ | (0.5) | | | $ | (7.7) | | | $ | (8.2) | |
| Net gains (losses) reflected in non-operating income | 41.7 | | | 88.6 | | | 130.3 | | | 52.4 | | | 112.2 | | | 164.6 | | | (13.4) | | | (190.1) | | | (203.5) | |
| Impact on income before taxes | $ | 39.3 | | | $ | 81.2 | | | $ | 120.5 | | | $ | 48.7 | | | $ | 104.8 | | | $ | 153.5 | | | $ | (13.9) | | | $ | (197.8) | | | $ | (211.7) | |
| | | | | | | | | | | | | | | | | |
| Net income (loss) attributable to T. Rowe Price Group | $ | 31.4 | | | $ | 53.4 | | | $ | 84.8 | | | $ | 40.9 | | | $ | 65.6 | | | $ | 106.5 | | | $ | (9.5) | | | $ | (93.9) | | | $ | (103.4) | |
| Net income (loss) attributable to redeemable non-controlling interests | 7.9 | | | 27.8 | | | 35.7 | | | 7.8 | | | 39.2 | | | 47.0 | | | (4.4) | | | (103.9) | | | (108.3) | |
| $ | 39.3 | | | $ | 81.2 | | | $ | 120.5 | | | $ | 48.7 | | | $ | 104.8 | | | $ | 153.5 | | | $ | (13.9) | | | $ | (197.8) | | | $ | (211.7) | |
The operating expenses of these consolidated products are reflected in other operating expenses. In preparing our consolidated financial statements, we eliminated operating expenses of $3.6 million in 2024, $2.1 million in 2023, and $2.0 million in 2022, against the investment advisory and administrative fees earned from these products. The net gains (losses) reflected in non-operating income includes dividend and interest income and realized and unrealized gains and losses on the underlying securities held by the consolidated investment products.
The following table details the impact of these consolidated investment products on the individual lines of our consolidated statements of cash flows.
| | | | | | | | | | | | | | | | | | | | | | | | | | | | | | | | | | | | | | | | | | | | | | | | | | | | | |
| 2024 | | 2023 | | 2022 |
| (in millions) | VOE | | VIE | | Total | | VOE | | VIE | | Total | | VOE | | VIE | | Total |
| Net cash provided by (used in) operating activities | $ | (239.4) | | | $ | (394.4) | | | $ | (633.8) | | | $ | (517.5) | | | $ | (371.4) | | | $ | (888.9) | | | $ | (84.1) | | | $ | 6.9 | | | $ | (77.2) | |
| Net cash provided by (used in) investing activities | (14.7) | | | (1.1) | | | (15.8) | | | (32.7) | | | (24.1) | | | (56.8) | | | 0.1 | | | (8.8) | | | (8.7) | |
| Net cash provided by (used in) financing activities | 235.6 | | | 402.3 | | | 637.9 | | | 559.7 | | | 343.7 | | | 903.4 | | | 92.9 | | | 1.5 | | | 94.4 | |
| FX impact on cash | — | | | (2.4) | | | (2.4) | | | — | | | 0.4 | | | 0.4 | | | — | | | 9.5 | | | 9.5 | |
| Net change in cash and cash equivalents during period | (18.5) | | | 4.4 | | | (14.1) | | | 9.5 | | | (51.4) | | | (41.9) | | | 8.9 | | | 9.1 | | | 18.0 | |
| Cash and cash equivalents at beginning of year | 25.7 | | | 51.5 | | | 77.2 | | | 16.2 | | | 102.9 | | | 119.1 | | | 7.3 | | | 93.8 | | | 101.1 | |
| Cash and cash equivalents at end of year | $ | 7.2 | | | $ | 55.9 | | | $ | 63.1 | | | $ | 25.7 | | | $ | 51.5 | | | $ | 77.2 | | | $ | 16.2 | | | $ | 102.9 | | | $ | 119.1 | |
The net cash provided by financing activities includes $31.7 million in 2024, $544.6 million in 2023 and $142.8 million in 2022, of net subscriptions we made into the consolidated investment products, net of dividends received. These cash flows were eliminated in consolidation.
FAIR VALUE MEASUREMENTS.
We determine the fair value of investments held by consolidated investment products using the following broad levels of inputs as defined by related accounting standards:
Level 1 – quoted prices in active markets for identical financial instruments accessible at the reporting date.
Level 2 – observable inputs other than Level 1 quoted prices including, but not limited to, quoted prices for similar financial instruments in active markets, quoted prices for identical or similar financial instruments in inactive markets, interest rates and yield curves, implied volatilities, and credit spreads. These inputs are based on market data obtained from independent sources.
Level 3 – unobservable inputs reflecting our own assumptions based on the best information available. The inputs into the determination of fair value require significant management judgment or estimation. Investments in this category generally include investments for which there is not an actively-traded market. There are no level 3 investments at December 31, 2024 and 2023.
These levels are not necessarily an indication of the risk or liquidity associated with these investment holdings. The following table summarizes the investment holdings held by our consolidated investment products using fair value measurements determined based on the differing levels of inputs as of December 31.
| | | | | | | | | | | | | | | | | | | | | | | | | | | |
| 2024 | | 2023 |
| (in millions) | Level 1 | | Level 2 | | | | Level 1 | | Level 2 | | |
| Assets | | | | | | | | | | | |
| Cash equivalents | $ | 6.3 | | | $ | — | | | | | $ | 17.2 | | | $ | 8.0 | | | |
| Equity securities | 452.3 | | | 285.4 | | | | | 365.1 | | | 213.6 | | | |
| Fixed income securities | — | | | 1,173.5 | | | | | — | | | 1,241.9 | | | |
| Other investments | 1.6 | | | 23.4 | | | | | 3.6 | | | 22.8 | | | |
| $ | 460.2 | | | $ | 1,482.3 | | | | | $ | 385.9 | | | $ | 1,486.3 | | | |
| | | | | | | | | | | |
| Liabilities | $ | (1.7) | | | $ | (14.5) | | | | | $ | (5.1) | | | $ | (16.2) | | | |
NOTE 7 – LEASES.
All of our leases are operating leases and primarily consist of real estate leases for corporate offices, data centers, and other facilities.
At December 31, 2024, the weighted-average remaining lease term on our leases is approximately 10.2 years and the weighted-average discount rate used to measure the lease liabilities is 3.4%.
Operating lease expense was $42.2 million in 2024, $52.4 million in 2023, and $50.0 million in 2022. Charges related to our operating leases that are variable, including certain maintenance charges and other management-related costs, and not included in the measurement of the lease liabilities, were $14.1 million in 2024. We made lease payments of $59.6 million during 2024.
Our future undiscounted cash flows related to our operating leases, and the reconciliation to the operating lease liability as of December 31, 2024, are as follows:
| | | | | |
| (in millions) | 2024 |
| 2025 | $ | 31.9 | |
| 2026 | 40.5 | |
| 2027 | 40.6 | |
| 2028 | 36.5 | |
| 2029 | 24.3 | |
| Thereafter | 155.6 | |
| Total future undiscounted cash flows | 329.4 | |
| Less: imputed interest to be recognized in lease expense | (50.7) | |
| Operating lease liabilities, as reported | $ | 278.7 | |
In December 2020, we announced that we signed a letter of intent for a long-term lease for our global headquarters in a different downtown location in Baltimore, Maryland, and plan to relocate in early 2025.
NOTE 8 – PROPERTY, EQUIPMENT AND SOFTWARE.
Property, equipment and software at December 31 consists of:
| | | | | | | | | | | |
| (in millions) | 2024 | | 2023 |
| Computer and communications software and equipment | $ | 1,680.3 | | | $ | 1,497.3 | |
| Buildings and improvements | 493.2 | | | 490.7 | |
| Leasehold improvements | 414.0 | | | 260.9 | |
| Furniture and other equipment | 225.3 | | | 207.8 | |
| Land | 25.7 | | | 25.7 | |
| | | |
| 2,838.5 | | | 2,482.4 | |
| Less accumulated depreciation and amortization | 1,861.5 | | | 1,675.8 | |
| Total | $ | 977.0 | | | $ | 806.6 | |
Compensation and related costs attributable to the development of computer software for internal use, totaling $182.0 million in 2024, $156.1 million in 2023, and $134.6 million in 2022, have been capitalized.
NOTE 9 - GOODWILL AND INTANGIBLE ASSETS.
Goodwill and intangible assets consist of the following at December 31:
| | | | | | | | | | | |
| |
| (in millions) | 2024 | | 2023 |
| Goodwill | $ | 2,642.8 | | | $ | 2,642.8 | |
| Indefinite-lived intangible assets - trade name | 86.0 | | | 117.1 | |
| Indefinite-lived intangible assets - investment advisory agreements | 65.6 | | | 65.6 | |
| Definite-lived intangible assets - investment advisory agreements | 216.5 | | | 324.6 | |
| Total | $ | 3,010.9 | | | $ | 3,150.1 | |
We evaluate the carrying amount of goodwill in our consolidated balance sheets for possible impairment on an annual basis in the fourth quarter using a fair value approach. We did not record any impairment charges for goodwill for the years ended December 31, 2024, 2023, or 2022.
We recognized impairments of indefinite-lived intangibles of $31.1 million in 2024, no impairments in 2023, and $116.8 million in 2022. The $31.1 million impairment in 2024 was attributable to the trade name. Of the $116.8 million in impairments in 2022, $99.2 million was attributable to investment advisory agreements and $17.6 million for the trade name. The impairments in 2024 and 2022 were the result of reduced growth expectations for both management and incentive fees and a higher discount rate.
Definite-lived investment advisory agreement intangible assets consisted of the following at December 31 :
| | | | | | | | | | | | | | |
| (in millions) | | 2024 | | 2023 |
| Gross carrying amount | | $ | 613.9 | | | $ | 613.9 | |
| Accumulated amortization & impairments | | (397.4) | | | (289.3) | |
| Net carrying amount | | $ | 216.5 | | | $ | 324.6 | |
| | | | |
| Remaining weighted-average estimated useful life | | 3.7 | | 5.5 |
We recognized insignificant impairments of definite-lived intangibles in 2024 and 2023, and $58.3 million in 2022. The 2022 impairments resulted from reduced growth expectations for both management and incentive fees and a higher discount rate.
Amortization and impairment expense for the definite-lived investment advisory agreement intangible assets was $108.1 million in 2024, $122.5 million in 2023, and $166.8 million in 2022, respectively. Estimated amortization expense for the definite-lived investment advisory agreements intangible assets for the five succeeding years is as follows:
| | | | | |
| (in millions) | 2024 |
| 2025 | $ | 77.1 | |
| 2026 | 61.8 | |
| 2027 | 42.9 | |
| 2028 | 12.7 | |
| 2029 | 9.7 | |
NOTE 10 – INCOME TAXES.
INCOME TAX PROVISION.
The provision for income taxes consists of:
| | | | | | | | | | | | | | | | | |
| (in millions) | 2024 | | 2023 | | 2022 |
| Current income taxes | | | | | |
| U.S. federal | $ | 634.7 | | | $ | 554.0 | | | $ | 574.7 | |
| State and local | 112.4 | | | 68.1 | | | 115.4 | |
| Foreign | 24.7 | | | 23.9 | | | 15.5 | |
| Deferred income taxes (benefits) | (88.0) | | | 8.6 | | | (207.0) | |
| Total | $ | 683.8 | | | $ | 654.6 | | | $ | 498.6 | |
Deferred income taxes (benefits) arise from temporary differences between taxable income for financial statement and income tax return purposes. The deferred income taxes (benefits) recognized as part of our provision for income taxes is related to:
| | | | | | | | | | | | | | | | | |
| (in millions) | 2024 | | 2023 | | 2022 |
| Property, equipment and software | $ | (60.3) | | | $ | (43.2) | | | $ | (64.1) | |
| Accrued, deferred, and long-term incentive compensation | (14.2) | | | (28.6) | | | 11.8 | |
| Operating lease assets | (1.7) | | | (6.3) | | | 24.8 | |
| Operating lease liabilities | 5.0 | | | 3.8 | | | (24.3) | |
| Acquisition-related retention liability | (12.9) | | | (14.8) | | | (13.6) | |
| Contingent consideration liability | 3.1 | | | 15.4 | | | 32.4 | |
| Acquired investments | (27.9) | | | (19.5) | | | (73.0) | |
| Unrealized gains (losses) recognized in non-operating income | 16.8 | | | 43.8 | | | (114.6) | |
| Net operating losses | (11.2) | | | (31.5) | | | (11.0) | |
| Change in valuation allowance | 16.1 | | | 86.4 | | | 16.4 | |
| | | | | |
| | | | | |
| | | | | |
| Other | (0.8) | | | 3.1 | | | 8.2 | |
| Total net deferred income taxes (benefits) | $ | (88.0) | | | $ | 8.6 | | | $ | (207.0) | |
The following table reconciles the statutory federal income tax rate to our effective income tax rate.
| | | | | | | | | | | | | | | | | |
| 2024 | | 2023 | | 2022 |
| Statutory U.S. federal income tax rate | 21.0 | % | | 21.0 | % | | 21.0 | % |
| | | | | |
| | | | | |
State income taxes for current year, net of federal income tax benefits(1) | 2.9 | | | 2.3 | | | 3.4 | |
Net income attributable to redeemable non-controlling interests(2) | (0.3) | | | (0.5) | | | 1.3 | |
| Net excess tax benefits from stock-based compensation plans activity | (0.2) | | | 0.1 | | | (0.4) | |
| Valuation allowance | 0.2 | | | 3.4 | | | — | |
| Other items | 0.7 | | | — | | | 0.3 | |
| Effective income tax rate | 24.3 | % | | 26.3 | % | | 25.6 | % |
(1) State income tax benefits are reflected in the total benefits for net income attributable to redeemable non-controlling interests and stock-based compensation plans activity.
(2) Net income attributable to redeemable non-controlling interests represents the portion of earnings held in the firm's consolidated investment products, which are not taxable to the firm despite being included in pre-tax income.
DEFERRED TAX ASSETS (LIABILITIES).
The net deferred tax assets recognized in our consolidated balance sheets in other assets as of December 31 relate to the following:
| | | | | | | | | | | |
| (in millions) | 2024 | | 2023 |
| Deferred tax assets | | | |
| Accrued, deferred, and long-term incentive compensation | $ | 317.7 | | | $ | 303.5 | |
| Property, equipment and software | 90.9 | | | 30.6 | |
| Acquired investments | 66.4 | | | 40.3 | |
| Net operating loss carry-forwards | 53.7 | | | 42.5 | |
| Operating lease liability | 39.8 | | | 44.8 | |
| | | |
| | | |
| | | |
| | | |
| | | |
| Other | 12.9 | | | 16.0 | |
| Total deferred tax assets | 581.4 | | | 477.7 | |
| Valuation allowance | (118.9) | | | (102.8) | |
| Total deferred tax assets, net of valuation allowance | 462.5 | | | 374.9 | |
| | | |
| Deferred tax liabilities | | | |
| Contingent consideration liability | (50.9) | | | (47.8) | |
| Unrealized gains (losses) recognized in non-operating income | (50.0) | | | (33.2) | |
| Operating lease assets | (41.1) | | | (42.8) | |
| Acquisition-related retention liability | (26.6) | | | (39.5) | |
| | | |
| | | |
| | | |
| | | |
| Other | (15.9) | | | (17.8) | |
| Total deferred tax liabilities | (184.5) | | | (181.1) | |
| Net deferred tax assets | $ | 278.0 | | | $ | 193.8 | |
We had operating loss carryforwards before tax of $220.0 million at December 31, 2024 and $173.4 million at December 31, 2023. The increase in operating loss carryforwards from 2023 is primarily related to operating losses generated by our United Kingdom subsidiary. Almost all of the operating loss carryforwards are attributable to the United Kingdom and do not expire. However, the amount of annual profits that can be relieved by losses carried forward is limited to 50%, subject to an annual allowance of GBP 5 million per group.
We consider the need for valuation allowances against our deferred tax assets to the extent that we believe that these assets are more likely than not to be realized. The valuation allowances total $118.9 million at December 31, 2024 and $102.8 million at December 31, 2023. The increase of $16.1 million in the valuation allowances was due to the uncertainty of generating sufficient taxable income in future periods in certain foreign jurisdictions. Any additional or reversal of valuation allowances in future periods will be dependent on the generation of sufficient taxable income. The future change in the valuation allowance could materially increase or decrease our income tax expenses in future periods.
We intend to repatriate earnings of T. Rowe Price foreign subsidiaries to the U.S. in an amount not to exceed these subsidiaries' previously taxed earnings and profits ("PTEP"), which are estimated to be approximately $989 million at December 31, 2024. These earnings as well as our pro rata share of the earnings of foreign corporations in which T. Rowe Price owns 10% or more were subject to the repatriation tax enacted with the U.S. tax reform and are treated as PTEP. As such, we did not record a deferred tax liability with respect to the U.S. federal or foreign withholding taxes as the PTEP should not be taxed in these jurisdictions.
OTHER DISCLOSURES.
Other assets include tax refund receivables of $52.4 million at December 31, 2024, and $81.0 million at December 31, 2023.
Cash outflows from operating activities include net income taxes paid of $723.2 million in 2024, $632.0 million in 2023, and $794.2 million in 2022.
In 2024, stock-based compensation plans activity decreased income tax expense by $4.5 million. In 2023 and 2022, stock-based compensation plans activity increased income tax expense by $3.4 million and decreased income tax expense by $7.1 million, respectively. These income tax impacts were recognized in the income tax provision.
UNRECOGNIZED TAX BENEFITS.
The following table summarizes the changes in our unrecognized tax benefits.
| | | | | | | | | | | | | | | | | |
| (in millions) | 2024 | | 2023 | | 2022 |
| Balance at beginning of year | $ | 42.7 | | | $ | 35.4 | | | $ | 29.3 | |
| Changes in tax positions related to | | | | | |
| Current year | 4.2 | | | 7.8 | | | 5.5 | |
| Prior years | (2.9) | | | 0.5 | | | 1.3 | |
| Expired statute of limitations | (1.0) | | | (1.0) | | | (0.7) | |
| Balance at end of year | $ | 43.0 | | | $ | 42.7 | | | $ | 35.4 | |
If recognized, these tax benefits would affect our effective tax rate; however, we do not expect that unrecognized tax benefits for tax positions taken with respect to 2024 and prior years will significantly change in 2025. As of January 2025, the U.S. Internal Revenue Service ("IRS") has concluded examinations related to federal tax obligations through the year 2023.
A net interest payable related to our unrecognized tax benefits of $8.6 million at December 31, 2024, and $5.2 million at December 31, 2023, are recognized in our consolidated balance sheets. Our accounting policy with respect to interest and penalties arising from income tax settlements is to recognize them as part of our provision for income taxes. Interest recognized as part of our provision for income taxes was not material.
NOTE 11 – STOCKHOLDERS' EQUITY.
SHARE REPURCHASES.
The Board of Directors has authorized the future repurchase of up to 18,377,353 common shares as of December 31, 2024.
Accounts payable and accrued expenses includes liabilities of $2.3 million at December 31, 2024 for common stock repurchases that settled during the first week of January 2025.
RESTRICTED CAPITAL.
Our consolidated stockholders' equity at December 31, 2024, includes about $393 million that is restricted as to use by various regulations and agreements arising in the ordinary course of our business.
NOTE 12 – LONG-TERM INCENTIVE COMPENSATION.
SHARES AUTHORIZED FOR STOCK-BASED COMPENSATION PROGRAMS.
At December 31, 2024, a total of 15,425,350 shares of unissued common stock were authorized for issuance under our stock-based compensation plans. Additionally, a total of 2,991,898 shares are authorized for issuance under a plan whereby substantially all employees may acquire common stock through payroll deductions at prevailing market prices.
STOCK OPTIONS.
The following table summarizes the status of, and changes in, our stock options during 2024.
| | | | | | | | | | | | | | | | | |
| Options | | Weighted-
average
exercise
price | | Weighted-average
remaining
contractual
term in
years |
| Outstanding at December 31, 2023 | 1,476,104 | | | $ | 75.39 | | | |
| | | | | |
| Exercised | (812,959) | | | $ | 76.72 | | | |
| | | | | |
| Expired | (1,768) | | | $ | 76.75 | | | |
| Outstanding and exercisable at December 31, 2024 | 661,377 | | | $ | 73.76 | | | 0.5 |
| | | | | |
There was no stock option-based compensation expense in 2024, 2023, or 2022.
The total intrinsic value of options exercised was $27.7 million in 2024, $30.6 million in 2023, and $40.3 million in 2022. At December 31, 2024, the aggregate intrinsic value of in-the-money options outstanding was $26.0 million.
RESTRICTED SHARES AND STOCK UNITS.
The following table summarizes the status of, and changes in, our restricted stock units during 2024.
| | | | | | | | | | | | | |
| | | Restricted
stock
units | | Weighted-
average
fair value |
| Nonvested at December 31, 2023 | | | 6,476,170 | | | $ | 127.94 | |
| Time-based grants | | | 1,597,968 | | | $ | 122.56 | |
| Performance-based grants | | | 98,668 | | | $ | 123.00 | |
| Vested (value at vest date was $240.0 million) | | | (1,956,869) | | | $ | 133.11 | |
| | | | | |
| Forfeited | | | (214,358) | | | $ | 128.24 | |
| Nonvested at December 31, 2024 | | | 6,001,579 | | | $ | 124.73 | |
Nonvested at December 31, 2024 includes performance-based restricted stock units of 359,941. These nonvested performance-based restricted units include 35,500 units for which the performance period has lapsed, and the performance threshold has been met.
Compensation and related costs includes expenses for restricted shares granted to directors and restricted stock units of $247.3 million in 2024, $265.6 million in 2023, and $285.4 million in 2022.
FUTURE STOCK-BASED COMPENSATION EXPENSE.
The following table presents the compensation expense to be recognized over the remaining vesting periods of the stock-based awards outstanding at December 31, 2024. Estimated future compensation expense will change to reflect future grants, changes in the probability of performance thresholds being met, and adjustments for actual forfeitures.
| | | | | |
| (in millions) | |
| First quarter 2025 | $ | 53.2 | |
| Second quarter 2025 | 52.1 | |
| Third quarter 2025 | 51.5 | |
| Fourth quarter 2025 | 44.7 | |
| 2026 | 100.4 | |
| 2027 through 2030 | 67.2 | |
| Total | $ | 369.1 | |
RESTRICTED FUND UNITS.
We granted $103.3M of restricted fund units in December 2024. Below is a roll forward of the restricted fund units liability which is reported in deferred compensation liabilities on the consolidated balance sheet.
| | | | | |
| (in millions) | 2024 |
| Balance at beginning of year | $ | — | |
| Amortization of grant date value | 14.8 | |
| Amortization of market appreciation (depreciation) | (0.1) | |
| |
| |
| Balance at end of year | $ | 14.7 | |
The following table presents the compensation expense to be recognized over the remaining vesting periods of the restricted fund units outstanding at December 31, 2024. Estimated future compensation expense will change to reflect future grants, changes in the market value of the restricted fund units which is based on selected hypothetical investments, and adjustments for actual forfeitures.
| | | | | | | |
| (in millions) | | | |
| First quarter 2025 | | | $ | 11.7 | |
| Second quarter 2025 | | | 11.3 | |
| Third quarter 2025 | | | 11.2 | |
| Fourth quarter 2025 | | | 9.2 | |
| 2026 | | | 22.9 | |
| 2027 through 2030 | | | 21.6 | |
| Total | | | $ | 87.9 | |
NOTE 13 – EARNINGS PER SHARE CALCULATIONS.
The following table presents the reconciliation of net income attributable to T. Rowe Price Group Inc. to net income allocated to our common stockholders and the weighted-average shares that are used in calculating the basic and diluted earnings per share on our common stock. Weighted-average common shares outstanding assuming dilution reflects the potential dilution, determined using the treasury stock method, that could occur if outstanding stock options were exercised and non-participating stock awards vested.
| | | | | | | | | | | | | | | | | |
| (in millions) | 2024 | | 2023 | | 2022 |
| Net income attributable to T. Rowe Price Group Inc. | $ | 2,100.1 | | | $ | 1,788.7 | | | $ | 1,557.9 | |
| Less: net income allocated to outstanding restricted stock and stock unit holders | 55.8 | | | 44.4 | | | 36.1 | |
| Net income allocated to common stockholders | $ | 2,044.3 | | | $ | 1,744.3 | | | $ | 1,521.8 | |
| | | | | |
| Weighted-average common shares | | | | | |
| Outstanding | 222.8 | | | 224.1 | | | 226.0 | |
| Outstanding assuming dilution | 223.3 | | | 224.8 | | | 227.1 | |
For the past three years, no stock options have been excluded from the calculation of diluted earnings per common share as none of the options' inclusion would be anti-dilutive.
NOTE 14 – OTHER COMPREHENSIVE INCOME AND ACCUMULATED OTHER COMPREHENSIVE INCOME.
The following table presents the impact of the components of other comprehensive income or loss on deferred tax benefits (income taxes).
| | | | | | | | | | | | | | | | | |
| (in millions) | 2024 | | 2023 | | 2022 |
| Net deferred tax benefits (income taxes) on: | | | | | |
| Currency translation adjustments | $ | 3.7 | | | $ | (2.0) | | | $ | 4.2 | |
| | | | | |
| Reclassification adjustment recognized in the provision for income taxes upon deconsolidation of investment products | — | | | 0.1 | | | 0.8 | |
| | | | | |
| | | | | |
| | | | | |
| | | | | |
| | | | | |
| | | | | |
| | | | | |
| Total net deferred tax benefits | $ | 3.7 | | | $ | (1.9) | | | $ | 5.0 | |
The changes in each component of accumulated other comprehensive income (loss), including reclassification are presented below.
| | | | | | | | | | | | | | | | | | | | | | | | |
| | | | | | |
| (in millions) | | Equity method investments | | Consolidated investment products - variable interest entities | | Total currency translation adjustments | | | | |
| Balances at December 31, 2021 | | $ | (36.7) | | | $ | 10.2 | | | $ | (26.5) | | | | | |
| | | | | | | | | | |
| | | | | | | | | | |
| | | | | | | | | | |
| Other comprehensive income (loss) before reclassifications and income taxes | | (14.6) | | | (13.9) | | | (28.5) | | | | | |
| Reclassification adjustments recognized in non-operating income | | — | | | (3.0) | | | (3.0) | | | | | |
| | (14.6) | | | (16.9) | | | (31.5) | | | | | |
| Net deferred tax benefits (income taxes) | | 0.8 | | | 4.2 | | | 5.0 | | | | | |
| Other comprehensive income (loss) | | (13.8) | | | (12.7) | | | (26.5) | | | | | |
| Balances at December 31, 2022 | | (50.5) | | | (2.5) | | | (53.0) | | | | | |
| Other comprehensive income (loss) before reclassifications and income taxes | | (1.6) | | | 9.0 | | | 7.4 | | | | | |
| | | | | | | | | | |
| | | | | | | | | | |
| Net deferred tax benefits (income taxes) | | 0.2 | | | (2.1) | | | (1.9) | | | | | |
| Other comprehensive income (loss) | | (1.4) | | | 6.9 | | | 5.5 | | | | | |
| Balances at December 31, 2023 | | (51.9) | | | 4.4 | | | (47.5) | | | | | |
| | | | | | | | | | |
| | | | | | | | | | |
| | | | | | | | | | |
| Other comprehensive income (loss) before reclassifications and income taxes | | 0.7 | | | (9.0) | | | (8.3) | | | | | |
| Reclassification adjustments recognized in non-operating income | | — | | | 0.4 | | | 0.4 | | | | | |
| | 0.7 | | | (8.6) | | | (7.9) | | | | | |
| Net deferred tax benefits (income taxes) | | 1.7 | | | 2.0 | | | 3.7 | | | | | |
| Other comprehensive income (loss) | | 2.4 | | | (6.6) | | | (4.2) | | | | | |
| | | | | | | | | | |
| Balances at December 31, 2024 | | $ | (49.5) | | | $ | (2.2) | | | $ | (51.7) | | | | | |
The other comprehensive income (loss) in the table above excludes $(5.0) million in 2024, $12.7 million in 2023, and $(21.0) million in 2022 of other comprehensive income (loss) related to redeemable non-controlling interests held in our consolidated investment products.
NOTE 15 – SEGMENT REPORTING.
We have one reportable segment: investment management services. We derive our revenue and net income globally and manage business activities on a consolidated basis.
We derive our revenues and net income from investment advisory services provided to individual and institutional investors globally. We also provide certain ancillary administrative services, including mutual fund transfer agent, fund and portfolio accounting, distribution, and shareholder services; participant recordkeeping and transfer agent services for defined contribution retirement plans; and other advisory services. Our revenues and net income depend largely on the total value and composition of our assets under management, as such, the consideration for our services is generally variable and recognized over time.
Our chief operating decision maker (CODM) is the chief executive officer. The CODM utilizes consolidated net income attributable to T. Rowe Price as reported on the consolidated income statement to assess performance and allocate resources. Based on this metric, the CODM decides either to reinvest profits into the business based on our strategic priorities and/or return cash to stockholders through dividends and share repurchases.
We determined there are no significant segment expenses that require a separate disclosure, as the major categories of expenses regularly reviewed by the CODM to manage operations are disclosed in the consolidated statements of income. Quarterly reviews of expenses highlight those influenced by financial markets, such as distribution and servicing costs, as well as those that are both qualitatively and quantitatively significant.
NOTE 16 – COMMITMENTS AND CONTINGENCIES.
COMMITMENTS.
T. Rowe Price has committed $360 million for investments in future OHA product launches through 2026.
CONTINGENCIES.
Various claims against us arise in the ordinary course of business, including employment-related claims. In the opinion of management, after consultation with counsel, the likelihood of an adverse determination in one or more of these pending ordinary course of business claims that would have a material adverse effect on our financial position or results of operations is remote.
NOTE 17 – OTHER DISCLOSURES.
RETIREMENT PLANS.
Compensation and related costs includes expense recognized for our defined contribution retirement plans of $162.0 million in 2024, $152.5 million in 2023, and $130.2 million in 2022.
SUPPLEMENTAL SAVINGS PLAN.
The supplemental savings plan provides certain senior officers the opportunity to defer payment on up to 50% of their annual cash incentive, limited to $2 million annually. The amounts deferred are adjusted in accordance with the hypothetical investments chosen by the officer from a list of T. Rowe Price products. The officer must specify if they would like to receive payment as a lump sum or up to ten annual installments upon separation of service. Additionally, the officer may elect to receive a lump sum payment while still employed in as little as five years.
Below is a roll forward of the supplement savings plan liability which is reported in deferred compensation liabilities on the consolidated balance sheets.
| | | | | | | | | | | |
| (in millions) | 2024 | | 2023 |
| Balance at beginning of the year | $ | 895.0 | | | $ | 761.2 | |
| Deferrals (including taxes) | 53.4 | | | 52.8 | |
| Market appreciation (depreciation) | 104.3 | | | 123.2 | |
| Distributions | (46.7) | | | (42.2) | |
| Balance at end of the year | $ | 1,006.0 | | | $ | 895.0 | |
REPORT OF INDEPENDENT REGISTERED PUBLIC ACCOUNTING FIRM
To the Stockholders and Board of Directors
T. Rowe Price Group, Inc.:
Opinion on the Consolidated Financial Statements
We have audited the accompanying consolidated balance sheets of T. Rowe Price Group, Inc. and subsidiaries (the Company) as of December 31, 2024 and 2023, the related consolidated statements of income, comprehensive income, stockholders’ equity, and cash flows for each of the years in the three-year period ended December 31, 2024, and the related notes (collectively, the consolidated financial statements). In our opinion, the consolidated financial statements present fairly, in all material respects, the financial position of the Company as of December 31, 2024 and 2023, and the results of its operations and its cash flows for each of the years in the three-year period ended December 31, 2024, in conformity with U.S. generally accepted accounting principles.
We also have audited, in accordance with the standards of the Public Company Accounting Oversight Board (United States) (PCAOB), the Company’s internal control over financial reporting as of December 31, 2024, based on criteria established in Internal Control–Integrated Framework (2013) issued by the Committee of Sponsoring Organizations of the Treadway Commission, and our report dated February 14, 2025 expressed an unqualified opinion on the effectiveness of the Company’s internal control over financial reporting.
Basis for Opinion
These consolidated financial statements are the responsibility of the Company’s management. Our responsibility is to express an opinion on these consolidated financial statements based on our audits. We are a public accounting firm registered with the PCAOB and are required to be independent with respect to the Company in accordance with the U.S. federal securities laws and the applicable rules and regulations of the Securities and Exchange Commission and the PCAOB.
We conducted our audits in accordance with the standards of the PCAOB. Those standards require that we plan and perform the audit to obtain reasonable assurance about whether the consolidated financial statements are free of material misstatement, whether due to error or fraud. Our audits included performing procedures to assess the risks of material misstatement of the consolidated financial statements, whether due to error or fraud, and performing procedures that respond to those risks. Such procedures included examining, on a test basis, evidence regarding the amounts and disclosures in the consolidated financial statements. Our audits also included evaluating the accounting principles used and significant estimates made by management, as well as evaluating the overall presentation of the consolidated financial statements. We believe that our audits provide a reasonable basis for our opinion.
Critical Audit Matter
The critical audit matter communicated below is a matter arising from the current period audit of the consolidated financial statements that was communicated or required to be communicated to the audit committee and that:
(1) relates to accounts or disclosures that is material to the consolidated financial statements and (2) involved our especially challenging, subjective, or complex judgments. The communication of a critical audit matter does not alter in any way our opinion on the consolidated financial statements, taken as a whole, and we are not, by communicating the critical audit matter below, providing a separate opinion on the critical audit matter or on the accounts or disclosures to which it relates.
Evaluation of the completeness and accuracy of assets under management data used in the calculation of investment advisory fee revenue
As discussed in Note 1 to the consolidated financial statements, the Company recognizes fees for its investment advisory agreements based on a percentage of its assets under management (AUM). AUM data represents a significant input to the calculation of investment advisory fees. The Company recognized $6.4 billion in investment advisory fees during the year ended December 31, 2024, which included revenue related to T. Rowe U.S. mutual funds (Funds).
We identified the evaluation of the completeness and accuracy of AUM data for the Funds as a critical audit matter as AUM data is transmitted through multiple information technology (IT) systems used in the calculation of investment advisory fee revenue. Given the Company's use of multiple IT systems, the nature and extent of audit effort involved in performing procedures to evaluate the completeness and accuracy of AUM data required the use of IT professionals with specialized skills and knowledge.
The following are the primary procedures we performed to address the critical audit matter. We evaluated the design and tested the operating effectiveness of certain controls over the Company’s revenue processes, including manual controls over the completeness and accuracy of AUM data. We involved IT professionals with specialized skills and knowledge, who assisted in the testing of general IT controls and the interface of data between multiple IT systems used to maintain AUM data. To assess the AUM data, we (1) compared AUM used in the calculation of a sample of investment advisory fees to the source IT systems, and (2) for a selection of Funds, compared AUM on select dates from the source IT system to the audited Fund financial statements.
/s/ KPMG LLP
We have served as the Company’s auditor since 2001.
Baltimore, Maryland
February 14, 2025
Item 9.Changes in and Disagreements with Accountants on Accounting and Financial Disclosure.
None.
Item 9A. Controls and Procedures.
Our management, including our principal executive and principal financial officers, have evaluated the effectiveness of our disclosure controls and procedures as of December 31, 2024. Based on that evaluation, our principal executive and principal financial officers have concluded that our disclosure controls and procedures as of December 31, 2024, are effective at the reasonable assurance level to ensure that the information required to be disclosed by us in the reports that we file or submit under the Securities Exchange Act of 1934, including our Form 10-K annual report, is recorded, processed, summarized and reported, within the time periods specified in the Securities and Exchange Commission’s rules and forms, and to ensure that information required to be disclosed by us in the reports that we file or submit under the Exchange Act is accumulated and communicated to our management, including our principal executive and principal financial officers, or persons performing similar functions, as appropriate to allow timely decisions regarding required disclosure.
Our management, including our principal executive and principal financial officers, have evaluated any change in our internal control over financial reporting that occurred during the fourth quarter of 2024, and has concluded that there was no change during the fourth quarter of 2024 that has materially affected, or is reasonably likely to materially affect, our internal control over financial reporting.
Management’s report on our internal control over financial reporting and the attestation report of KPMG LLP follow after Item 9C.
Item 9B. Other Information.
None.
Item 9C. Disclosure Regarding Foreign Jurisdictions that Prevent Inspections.
Not applicable.
REPORT OF MANAGEMENT ON INTERNAL CONTROL OVER FINANCIAL REPORTING
To the Stockholders of T. Rowe Price Group, Inc.:
We, together with other members of management of T. Rowe Price Group, Inc., (the Company) are responsible for establishing and maintaining adequate internal control over the Company’s financial reporting. Internal control over financial reporting is the process designed under our supervision, and effected by the Company’s Board of Directors, management, and other personnel, to provide reasonable assurance regarding the reliability of financial reporting and the preparation of the Company’s financial statements for external purposes in accordance with accounting principles generally accepted in the United States of America.
There are inherent limitations in the effectiveness of internal control over financial reporting, including the possibility that misstatements may not be prevented or detected. Accordingly, even effective internal controls over financial reporting can provide only reasonable assurance with respect to financial statement preparation. Furthermore, the effectiveness of internal controls can change with circumstances.
Management has evaluated the effectiveness of internal control over financial reporting as of December 31, 2024, in relation to criteria described in Internal Control–Integrated Framework (2013) issued by the Committee of Sponsoring Organizations of the Treadway Commission (COSO). Based on management’s assessment, we believe that the Company’s internal control over financial reporting was effective as of December 31, 2024.
KPMG LLP, an independent registered public accounting firm, has audited our financial statements that are included in this annual report and expressed an unqualified opinion thereon. KPMG has also expressed an unqualified opinion on the effective operation of our internal control over financial reporting as of December 31, 2024.
February 14, 2025
/s/ Robert W. Sharps
Chief Executive Officer and President
/s/ Jennifer B. Dardis
Vice President, Chief Financial Officer and Treasurer
REPORT OF INDEPENDENT REGISTERED PUBLIC ACCOUNTING FIRM
To the Stockholders and Board of Directors
T. Rowe Price Group, Inc.:
Opinion on Internal Control Over Financial Reporting
We have audited T. Rowe Price Group, Inc. and subsidiaries’ (the Company) internal control over financial reporting as of December 31, 2024, based on criteria established in Internal Control–Integrated Framework (2013) issued by the Committee of Sponsoring Organizations of the Treadway Commission. In our opinion, the Company maintained, in all material respects, effective internal control over financial reporting as of December 31, 2024, based on criteria established in Internal Control–Integrated Framework (2013) issued by the Committee of Sponsoring Organizations of the Treadway Commission.
We also have audited, in accordance with the standards of the Public Company Accounting Oversight Board (United States) (PCAOB), the consolidated balance sheets of the Company as of December 31, 2024 and 2023, the related consolidated statements of income, comprehensive income, stockholders’ equity, and cash flows for each of the years in the three-year period ended December 31, 2024, and the related notes (collectively, the consolidated financial statements), and our report dated February 14, 2025 expressed an unqualified opinion on those consolidated financial statements.
Basis for Opinion
The Company’s management is responsible for maintaining effective internal control over financial reporting and for its assessment of the effectiveness of internal control over financial reporting, included in the accompanying Report of Management on Internal Control Over Financial Reporting. Our responsibility is to express an opinion on the Company’s internal control over financial reporting based on our audit. We are a public accounting firm registered with the PCAOB and are required to be independent with respect to the Company in accordance with the U.S. federal securities laws and the applicable rules and regulations of the Securities and Exchange Commission and the PCAOB.
We conducted our audit in accordance with the standards of the PCAOB. Those standards require that we plan and perform the audit to obtain reasonable assurance about whether effective internal control over financial reporting was maintained in all material respects. Our audit of internal control over financial reporting included obtaining an understanding of internal control over financial reporting, assessing the risk that a material weakness exists, and testing and evaluating the design and operating effectiveness of internal control based on the assessed risk. Our audit also included performing such other procedures as we considered necessary in the circumstances. We believe that our audit provides a reasonable basis for our opinion.
Definition and Limitations of Internal Control Over Financial Reporting
A company’s internal control over financial reporting is a process designed to provide reasonable assurance regarding the reliability of financial reporting and the preparation of financial statements for external purposes in accordance with generally accepted accounting principles. A company’s internal control over financial reporting includes those policies and procedures that (1) pertain to the maintenance of records that, in reasonable detail, accurately and fairly reflect the transactions and dispositions of the assets of the company; (2) provide reasonable assurance that transactions are recorded as necessary to permit preparation of financial statements in accordance with generally accepted accounting principles, and that receipts and expenditures of the company are being made only in accordance with authorizations of management and directors of the company; and (3) provide reasonable assurance regarding prevention or timely detection of unauthorized acquisition, use, or disposition of the company’s assets that could have a material effect on the financial statements.
Because of its inherent limitations, internal control over financial reporting may not prevent or detect misstatements. Also, projections of any evaluation of effectiveness to future periods are subject to the risk that controls may become inadequate because of changes in conditions, or that the degree of compliance with the policies or procedures may deteriorate.
/s/ KPMG LLP
Baltimore, Maryland
February 14, 2025
PART III
Item 10. Directors, Executive Officers and Corporate Governance.
Information required by this item as to the identification of our executive officers is furnished in a separate item at the end of Part I of this Report. Other information required by this item is incorporated by reference from the definitive proxy statement required to be filed pursuant to Regulation 14A not later than 120 days after December 31, 2024 for the 2025 Annual Meeting of our stockholders.
Item 11. Executive Compensation.
Information required by this item is incorporated by reference from the definitive proxy statement required to be filed pursuant to Regulation 14A not later than 120 days after December 31, 2024 for the 2025 Annual Meeting of our stockholders.
Item 12. Security Ownership of Certain Beneficial Owners and Management and Related Stockholder Matters.
Information required by this item is incorporated by reference from the definitive proxy statement required to be filed pursuant to Regulation 14A not later than 120 days after December 31, 2024 for the 2025 Annual Meeting of our stockholders.
Item 13. Certain Relationships and Related Transactions, and Director Independence.
Information required by this item is incorporated by reference from the definitive proxy statement required to be filed pursuant to Regulation 14A not later than 120 days after December 31, 2024 for the 2025 Annual Meeting of our stockholders.
Item 14. Principal Accountant Fees and Services.
Information required by this item is incorporated by reference from the definitive proxy statement required to be filed pursuant to Regulation 14A not later than 120 days after December 31, 2024 for the 2025 Annual Meeting of our stockholders.
PART IV
Item 15. Exhibits, Financial Statement Schedules.
| | | | | | | | | | | |
| The following documents are filed as part of this report. |
| | | |
| (1) | Financial Statements: See Item 8 of Part II of this report. |
| | | |
| (2) | Financial Statement Schedules: None. |
| | | |
| (3) | The following exhibits required by Item 601 of Regulation S-K are filed herewith, except for Exhibit 32 that is furnished herewith. Management contracts and compensatory plans and arrangements are identified with an asterisk (*). |
| | | |
| | 3(i) | | |
| | | |
| 3.1 | | |
| | | |
| 4.1 | | |
| | | |
| 10.01.1 | | |
| | | |
| | | | | | | | | | | |
| 10.01.2 | | |
| | | |
| 10.01.3 | | |
| | | |
| 10.02 | | |
| | | |
| 10.03 | | |
| | | |
| 10.04 | | |
| | | |
| 10.05 | | |
| | | |
| 10.06 | * | |
| | | |
| 10.07 | * | |
| | | |
| 10.08 | * | |
| | | |
| 10.09 | * | |
| | | |
| 10.10.1 | * | |
| | | |
| 10.10.2 | * | |
| | | |
| 10.10.3 | * | |
| | | |
| 10.10.4 | * | |
| | | |
| 10.10.5 | * | |
| | | |
| 10.10.6 | * | |
| | | |
| 10.10.7 | * | |
| | | |
| 10.10.8 | * | |
| | | |
| | | | | | | | | | | |
| 10.10.9 | * | |
| | | |
| 10.10.10 | * | |
| | | |
| 10.10.11 | * | |
| | | |
| 10.10.12 | * | |
| | | |
| 10.10.13 | * | |
| | | |
| 10.10.14 | * | |
| | | |
| 10.11 | * | |
| | | |
| 10.12 | * | |
| | | |
| 10.13 | * | |
| | | |
| 10.14 | * | |
| | | |
| 10.15.1 | * | |
| | | |
| 10.15.2 | * | |
| | | |
| 10.16.1 | * | |
| | | |
| 10.16.2 | * | |
| | | |
| 10.17 | | |
| | | |
| 10.18 | * | |
| | | |
| 10.19.1 | | |
| | | |
| 10.19.2 | | |
| | | |
| 10.20 | * | |
| | | |
| | | | | | | | | | | |
| 10.21 | | |
| | | |
| 10.22 | * | |
| | | |
| 10.23 | * | |
| | | |
| 10.24 | * | |
| | | |
| 10.25 | * | |
| | | |
| 10.26 | * | |
| | | |
| 10.27 | * | |
| | | |
| 10.28 | * | |
| | | |
| 10.29 | * | |
| | | |
| 10.30 | * | |
| | | |
| 10.31 | * | |
| | | |
| 10.32 | * | |
| | | |
| 10.33 | * | |
| | | |
| 10.34 | * | |
| | | |
| 10.35 | * | |
| | | |
| 10.36.1 | * | |
| | | |
| 10.36.2 | * | |
| | | |
| 10.36.3 | * | |
| | | |
| 10.36.4 | * | |
| | | |
| 10.36.5 | * | |
| | | |
| 19 | | |
| | | |
| 21 | | |
| | | |
| 23 | | |
| | | |
| | | |
| | | |
| 31(i).1 | | |
| | | |
| 31(i).2 | | |
| | | |
| 32 | | |
| | | |
| 97.1 | * | |
| | | |
| 97.2 | * | |
| | | |
| | | | | | | | | | | |
| 101 | | The following series of unaudited XBRL-formatted documents are collectively included herewith as Exhibit 101. The financial information is extracted from T. Rowe Price Group’s consolidated financial statements and notes that are included in this Form 10-K Report. |
| | | |
| 101.INS | | XBRL Instance Document - the instance document does not appear in the Interactive Data File because its XBRL tags are embedded within the Inline XBRL document. |
| | | |
| 101.SCH | | XBRL Taxonomy Extension Schema Document. |
| | | |
| 101.CAL | | XBRL Taxonomy Calculation Linkbase Document. |
| | | |
| 101.LAB | | XBRL Taxonomy Label Linkbase Document. |
| | | |
| 101.PRE | | XBRL Taxonomy Presentation Linkbase Document. |
| | | |
| 101.DEF | | XBRL Taxonomy Definition Linkbase Document. |
Item 16. Form 10-K Summary.
None.
SIGNATURES
Pursuant to the requirements of Section 13 of the Securities Exchange Act of 1934, the registrant has duly caused this report to be signed on its behalf by the undersigned, thereunto duly authorized, on February 14, 2025.
T. Rowe Price Group, Inc.
By: /s/ Robert W. Sharps, Chief Executive Officer and President (Principal Executive Officer)
Pursuant to the requirements of the Securities Exchange Act of 1934, this report has been signed below by the following persons on behalf of the registrant and in the capacities indicated on February 14, 2025.
/s/ Robert W. Sharps, Chair of the Board of Directors, Chief Executive Officer, and President (Principal Executive Officer)
/s/ Glenn R. August, Director
/s/ Mark S. Bartlett, Director
/s/ William P. Donnelly, Director
/s/ Dina Dublon, Director
/s/ Robert F. MacLellan, Director
/s/ Eileen P. Rominger, Director
/s/ Cynthia F. Smith, Director
/s/ Robert J. Stevens, Director
/s/ Sandra S. Wijnberg, Director
/s/ Alan D. Wilson, Director
/s/ Jennifer B. Dardis, Vice President, Chief Financial Officer and Treasurer (Principal Financial Officer)
/s/ Jessica M. Hiebler, Vice President (Principal Accounting Officer)