UNITED STATES
SECURITIES AND EXCHANGE COMMISSION
Washington, D.C. 20549
FORM N-CSR
CERTIFIED SHAREHOLDER REPORT OF REGISTERED
MANAGEMENT INVESTMENT COMPANIES
Investment Company Act File number: 811-10045
Calvert Impact Fund, Inc.
(Exact Name of Registrant as Specified in Charter)
1825 Connecticut Avenue NW, Suite 400, Washington, DC 20009
(Address of Principal Executive Offices)
Maureen A. Gemma
Two International Place, Boston, Massachusetts 02110
(Name and Address of Agent for Service)
(202) 238-2200
(Registrant’s telephone number)
September 30
Date of Fiscal Year End
March 31, 2021
Date of Reporting Period
| Item 1. | Report to Stockholders. |


| % Average Annual Total Returns1,2 | Class Inception Date | Performance Inception Date | Six Months | One Year | Five Years | Since Inception |
| Class A at NAV | 10/31/2013 | 10/31/2013 | (0.70)% | 7.07% | 3.36% | 3.11% |
| Class A with 3.75% Maximum Sales Charge | — | — | (4.44) | 3.03 | 2.57 | 2.58 |
| Class I at NAV | 10/31/2013 | 10/31/2013 | (0.58) | 7.33 | 3.68 | 3.45 |
| Class R6 at NAV | 02/01/2019 | 10/31/2013 | (0.55) | 7.38 | 3.71 | 3.47 |
| ICE BofA Green Bond Index - Hedged USD | — | — | (0.83)% | 5.27% | 4.05% | 4.04% |
| % Total Annual Operating Expense Ratios3 | Class A | Class I | Class R6 |
| Gross | 0.79% | 0.54% | 0.49% |
| Net | 0.73 | 0.48 | 0.43 |
| Country Allocation (% of total investments) | |
| United States | 70.0% |
| France | 6.2 |
| Netherlands | 5.7 |
| Canada | 4.2 |
| Luxembourg | 1.9 |
| South Korea | 1.7 |
| Italy | 1.7 |
| Sweden | 1.3 |
| Germany | 1.0 |
| Brazil | 1.0 |
| Finland | 1.0 |
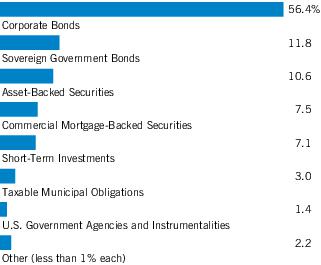
| Other (less than 1.0% each) | 4.3 |
| Total | 100.0% |
| 1 | ICE BofA Green Bond Index - Hedged USD tracks the performance of securities issued for qualified “green” purposes. Qualifying bonds must have a clearly designated use of proceeds that is solely applied toward projects or activities that promote climate change mitigation or adaptation or other environmental sustainability purposes. ICE® BofA® indices are not for redistribution or other uses; provided “as is”, without warranties, and with no liability. Eaton Vance has prepared this report and ICE Data Indices, LLC does not endorse it, or guarantee, review, or endorse Eaton Vance’s products. BofA® is a licensed registered trademark of Bank of America Corporation in the United States and other countries. Unless otherwise stated, index returns do not reflect the effect of any applicable sales charges, commissions, expenses, taxes or leverage, as applicable. It is not possible to invest directly in an index. |
| 2 | Total Returns at NAV do not include applicable sales charges. If sales charges were deducted, the returns would be lower. Total Returns shown with maximum sales charge reflect the stated maximum sales charge. Unless otherwise stated, performance does not reflect the deduction of taxes on Fund distributions or redemptions of Fund shares.Performance prior to the inception date of a class may be linked to the performance of an older class of the Fund. This linked performance is adjusted for any applicable sales charge, but is not adjusted for class expense differences. If adjusted for such differences, the performance would be different. The performance of Class R6 is linked to Class I. Performance since inception for an index, if presented, is the performance since the Fund’s or oldest share class’ inception, as applicable. Performance presented in the Financial Highlights included in the financial statements is not linked.Calvert Research and Management became the investment adviser to the Fund on December 31, 2016. Performance reflected prior to such date is that of the Fund’s former investment adviser. |
| 3 | Source: Fund prospectus. Net expense ratios reflect a contractual expense reimbursement that continues through 1/31/22. Without the reimbursement, performance would have been lower. The expense ratios for the current reporting period can be found in the Financial Highlights section of this report. |
| Fund profile subject to change due to active management. |
| Beginning Account Value (10/1/20) | Ending Account Value (3/31/21) | Expenses Paid During Period* (10/1/20 – 3/31/21) | Annualized Expense Ratio | |
| Actual | ||||
| Class A | $1,000.00 | $ 993.00 | $3.63 ** | 0.73% |
| Class I | $1,000.00 | $ 994.20 | $2.39 ** | 0.48% |
| Class R6 | $1,000.00 | $ 994.50 | $2.14 ** | 0.43% |
| Hypothetical | ||||
| (5% return per year before expenses) | ||||
| Class A | $1,000.00 | $1,021.29 | $3.68 ** | 0.73% |
| Class I | $1,000.00 | $1,022.54 | $2.42 ** | 0.48% |
| Class R6 | $1,000.00 | $1,022.79 | $2.17 ** | 0.43% |
| * | Expenses are equal to the Fund's annualized expense ratio for the indicated Class, multiplied by the average account value over the period, multiplied by 182/365 (to reflect the one-half year period). The Example assumes that the $1,000 was invested at the net asset value per share determined at the close of business on September 30, 2020. |
| ** | Absent a waiver and/or reimbursement of expenses by an affiliate, expenses would be higher. |
| Asset-Backed Securities — 10.7% |
| Security | Principal Amount (000's omitted) | Value | |
| Helios Issuer, LLC: | |||
| Series 2017-1A, Class A, 4.94%, 9/20/49(1) | $ | 2,492 | $ 2,646,338 |
| Series 2017-1A, Class C, 8.00%, 9/20/49(1) | 5,346 | 5,464,688 | |
| Series 2020-AA, Class A, 2.98%, 6/20/47(1) | 5,712 | 5,915,651 | |
| Mosaic Solar Loan Trust: | |||
| Series 2018-1A, Class A, 4.01%, 6/22/43(1) | 810 | 875,670 | |
| Series 2018-1A, Class B, 2.00%, 6/22/43(1) | 2,806 | 2,783,449 | |
| Series 2019-1A, Class A, 4.37%, 12/21/43(1) | 1,054 | 1,155,077 | |
| Series 2019-2A, Class A, 2.88%, 9/20/40(1) | 3,271 | 3,424,955 | |
| Series 2019-2A, Class B, 3.28%, 9/20/40(1) | 4,172 | 4,336,116 | |
| Series 2019-2A, Class C, 4.35%, 9/20/40(1) | 1,182 | 1,184,943 | |
| Series 2020-1A, Class A, 2.10%, 4/20/46(1) | 1,888 | 1,910,412 | |
| Series 2020-1A, Class B, 3.10%, 4/20/46(1) | 2,170 | 2,267,326 | |
| Series 2020-2A, Class B, 2.21%, 8/20/46(1) | 2,635 | 2,632,186 | |
| Series 2021-1A, Class B, 2.05%, 12/20/46(1) | 1,290 | 1,274,538 | |
| Mosaic Solar Loans LLC: | |||
| Series 2017-1A, Class A, 4.45%, 6/20/42(1) | 623 | 680,302 | |
| Series 2017-2A, Class A, 3.82%, 6/22/43(1) | 68 | 73,208 | |
| Series 2017-2A, Class C, 2.00%, 6/22/43(1) | 1,261 | 1,266,583 | |
| SolarCity LMC Series I, LLC, Series 2013-1, Class A, 4.80%, 11/20/38(1) | 151 | 159,253 | |
| SolarCity LMC Series II, LLC, Series 2014-1, Class A, 4.59%, 4/20/44(1) | 3,559 | 3,565,613 | |
| SolarCity LMC Series III, LLC: | |||
| Series 2014-2, Class A, 4.02%, 7/20/44(1) | 2,891 | 2,935,300 | |
| Series 2014-2, Class B, 5.44%, 7/20/44(1) | 167 | 164,847 | |
| Spruce ABS Trust, Series 2016-E1, Class A, 4.32%, 6/15/28(1) | 58 | 58,828 | |
| Sunnova Helios II Issuer, LLC: | |||
| Series 2018-1A, Class B, 7.71%, 7/20/48(1) | 830 | 867,970 | |
| Series 2021-A, Class A, 1.80%, 2/20/48(1) | 2,519 | 2,495,806 | |
| Series 2021-A, Class B, 3.15%, 2/20/48(1) | 851 | 825,633 | |
| Sunnova Sol II Issuer, LLC, Series 2020-2A, Class B, 5.47%, 11/1/55(1) | 3,449 | 3,460,999 | |
| Sunnova Sol Issuer, LLC, Series 2020-1A, Class A, 3.35%, 2/1/55(1) | 2,931 | 3,015,837 | |
| Sunrun Atlas Issuer, LLC, Series 2019-2, Class A, 3.61%, 2/1/55(1) | 1,966 | 2,081,311 | |
| Sunrun Callisto Issuer, LLC, Series 2015-1A, Class B, 5.38%, 7/20/45(1) | 780 | 779,354 | |
| Sunrun Vulcan Issuer, LLC, Series 2021-1A, Class A, 2.46%, 1/30/52(1) | 4,000 | 3,983,224 | |
| Sunrun Xanadu Issuer, LLC, Series 2019-1A, Class A, 3.98%, 6/30/54(1) | 2,140 | 2,289,665 | |
| TES, LLC, Series 2017-1A, Class A, 4.33%, 10/20/47(1) | 2,499 | 2,608,868 | |
| Tesla Auto Lease Trust: | |||
| Series 2018-B, Class A, 3.71%, 8/20/21(1) | 376 | 376,816 | |
| Security | Principal Amount (000's omitted) | Value | |
| Tesla Auto Lease Trust: (continued) | |||
| Series 2018-B, Class C, 4.36%, 10/20/21(1) | $ | 1,875 | $ 1,896,236 |
| Series 2019-A, Class A2, 2.13%, 4/20/22(1) | 1,099 | 1,106,446 | |
| Series 2019-A, Class A4, 2.20%, 11/21/22(1) | 1,535 | 1,572,164 | |
| Series 2019-A, Class B, 2.41%, 12/20/22(1) | 3,270 | 3,354,194 | |
| Series 2019-A, Class E, 5.48%, 5/22/23(1) | 1,545 | 1,632,137 | |
| Series 2020-A, Class A3, 0.68%, 12/20/23(1) | 1,000 | 1,005,353 | |
| Series 2020-A, Class C, 1.68%, 2/20/24(1) | 2,000 | 2,028,207 | |
| Series 2020-A, Class D, 2.33%, 2/20/24(1) | 1,695 | 1,735,290 | |
| Series 2020-A, Class E, 4.64%, 8/20/24(1) | 973 | 1,025,245 | |
| Series 2021-A, Class D, 1.34%, 3/20/25(1) | 3,500 | 3,496,502 | |
| Vivint Solar Financing V LLC, Series 2018-1A, Class A, 4.73%, 4/30/48(1) | 1,440 | 1,550,699 | |
| Vivint Solar Financing VII, LLC, Series 2020-1A, Class A, 2.21%, 7/31/51(1) | 5,155 | 5,094,397 | |
| Total Asset-Backed Securities (identified cost $91,034,468) | $ 93,057,636 | ||
| Commercial Mortgage-Backed Securities — 7.6% |
| Security | Principal Amount (000's omitted) | Value | |
| Federal Home Loan Mortgage Corp. Multifamily Structured Pass Through Certificates: | |||
| Series KG02, Class A2, 2.412%, 8/25/29 | $ | 4,050 | $ 4,229,273 |
| Series KG03, Class A2, 1.297%, 6/25/30(2) | 1,360 | 1,297,172 | |
| Series KG04, Class A1, 0.845%, 6/25/30 | 3,829 | 3,674,653 | |
| Federal National Mortgage Association: | |||
| Series 2017-M13, Class A2, 2.939%, 9/25/27(2) | 4,150 | 4,524,771 | |
| Series 2018-M4, Class A2, 3.046%, 3/25/28(2) | 7,445 | 8,164,273 | |
| Series 2018-M8, Class A2, 3.325%, 6/25/28(2) | 923 | 1,028,344 | |
| Series 2018-M13, Class A2, 3.697%, 9/25/30(2) | 3,780 | 4,341,434 | |
| Series 2019-M1, Class A2, 3.555%, 9/25/28(2) | 6,805 | 7,675,797 | |
| Series 2019-M9, Class A2, 2.937%, 4/25/29 | 4,514 | 4,918,370 | |
| Series 2019-M22, Class A2, 2.522%, 8/25/29 | 12,893 | 13,616,014 | |
| Series 2020-M1, Class A2, 2.444%, 10/25/29 | 7,842 | 8,224,210 | |
| Series 2020-M20, Class A2, 1.435%, 10/25/29 | 4,250 | 4,139,855 | |
| Total Commercial Mortgage-Backed Securities (identified cost $63,879,362) | $ 65,834,166 | ||
| Common Stocks — 0.3% |
| Security | Shares | Value | |
| Independent Power and Renewable Electricity Producers — 0.3% | |||
| NextEra Energy Partners, L.P. | 34,128 | $ 2,487,249 | |
| Total Common Stocks (identified cost $2,184,079) | $ 2,487,249 | ||
| Corporate Bonds — 56.6% |
| Security | Principal Amount (000's omitted)* | Value | |
| Basic Materials — 0.8% | |||
| LG Chem, Ltd.: | |||
| 3.25%, 10/15/24(1) | 1,550 | $ 1,679,684 | |
| 3.625%, 4/15/29(1) | 5,125 | 5,551,308 | |
| $ 7,230,992 | |||
| Communications — 1.0% | |||
| Verizon Communications, Inc., 1.50%, 9/18/30 | 8,984 | $ 8,259,098 | |
| $ 8,259,098 | |||
| Consumer, Cyclical — 0.9% | |||
| Aptiv PLC, 5.40%, 3/15/49 | 1,000 | $ 1,225,866 | |
| Tesla, Inc., 5.30%, 8/15/25(1)(3) | 4,696 | 4,878,440 | |
| Toyota Motor Credit Corp., 2.15%, 2/13/30 | 1,500 | 1,490,960 | |
| $ 7,595,266 | |||
| Consumer, Non-cyclical — 3.2% | |||
| Coca-Cola Femsa SAB de CV, 1.85%, 9/1/32 | 3,470 | $ 3,184,402 | |
| Conservation Fund (The), Green Bonds, 3.474%, 12/15/29 | 2,345 | 2,435,368 | |
| Kaiser Foundation Hospitals, 3.15%, 5/1/27 | 1,208 | 1,319,802 | |
| Koninklijke Philips NV, 0.50%, 5/22/26(4) | EUR | 11,650 | 14,007,876 |
| PepsiCo, Inc., 2.875%, 10/15/49 | 6,700 | 6,496,808 | |
| $ 27,444,256 | |||
| Energy — 2.5% | |||
| Hanwha Energy USA Holdings Corp., 2.375%, 7/30/22(1) | 2,500 | $ 2,559,240 | |
| TerraForm Power Operating, LLC: | |||
| 4.75%, 1/15/30(1) | 17,294 | 17,994,753 | |
| 5.00%, 1/31/28(1) | 867 | 937,162 | |
| $ 21,491,155 | |||
| Financial — 23.5% | |||
| Alexandria Real Estate Equities, Inc., 2.00%, 5/18/32 | 5,000 | $ 4,649,440 | |
| Banco BTG Pactual S.A., 2.75%, 1/11/26(1) | 9,500 | 9,010,750 | |
| Security | Principal Amount (000's omitted)* | Value | |
| Financial (continued) | |||
| Bank of America Corp.: | |||
| 2.456% to 10/22/24, 10/22/25(5) | 15,088 | $ 15,823,169 | |
| 3.499% to 5/17/21, 5/17/22(5) | 7,282 | 7,309,221 | |
| Bank of Nova Scotia (The), 2.375%, 1/18/23 | 6,600 | 6,832,071 | |
| Boston Properties, L.P., 3.40%, 6/21/29(3) | 3,700 | 3,892,399 | |
| Canadian Imperial Bank of Commerce, 0.95%, 10/23/25 | 6,000 | 5,890,858 | |
| Citigroup, Inc.: | |||
| 0.50%, 1/29/22(4) | EUR | 14,064 | 16,613,036 |
| 1.678% to 5/15/23, 5/15/24(5) | 7,075 | 7,222,866 | |
| Commonwealth Bank of Australia, 3.25%, 3/31/22 | AUD | 2,020 | 1,579,659 |
| Cooperatieve Rabobank UA, 1.106% to 2/24/26, 2/24/27(1)(5) | 9,000 | 8,799,045 | |
| DBS Group Holdings Ltd., 0.838%, (3 mo. USD LIBOR + 0.62%), 7/25/22(1)(6) | 3,640 | 3,660,992 | |
| Digital Dutch Finco BV, 1.50%, 3/15/30(4) | EUR | 6,300 | 7,797,727 |
| Digital Euro Finco LLC, 2.50%, 1/16/26(4) | EUR | 8,700 | 11,238,828 |
| HAT Holdings I, LLC/HAT Holdings II, LLC: | |||
| 3.75%, 9/15/30(1) | 5,062 | 4,891,158 | |
| 5.25%, 7/15/24(1) | 13,000 | 13,448,240 | |
| 6.00%, 4/15/25(1) | 76 | 80,275 | |
| ING Groep NV: | |||
| 1.40% to 7/1/25, 7/1/26(1)(5) | 7,600 | 7,568,537 | |
| 4.625%, 1/6/26(1) | 2,175 | 2,467,498 | |
| JPMorgan Chase & Co., 0.653% to 9/16/23, 9/16/24(5) | 10,500 | 10,524,247 | |
| Kimco Realty Corp., 2.70%, 10/1/30 | 2,500 | 2,491,995 | |
| Metropolitan Life Global Funding I, 0.95%, 7/2/25(1) | 5,200 | 5,146,757 | |
| Mitsubishi UFJ Financial Group, Inc., 2.527%, 9/13/23(7) | 1,100 | 1,150,709 | |
| National Australia Bank, Ltd., 3.625%, 6/20/23 | 2,867 | 3,070,184 | |
| PNC Financial Services Group, Inc. (The), 2.20%, 11/1/24 | 9,903 | 10,402,500 | |
| Prologis Euro Finance, LLC, 0.375%, 2/6/28 | EUR | 6,700 | 7,906,715 |
| Prologis, L.P., 1.25%, 10/15/30 | 4,114 | 3,736,862 | |
| Prudential Financial, Inc., 1.50%, 3/10/26 | 2,000 | 2,022,354 | |
| Regency Centers, L.P., 3.75%, 6/15/24(3) | 2,000 | 2,147,562 | |
| Royal Bank of Canada, 0.25%, 5/2/24(4) | EUR | 8,600 | 10,205,848 |
| Sumitomo Mitsui Financial Group, Inc., 0.508%, 1/12/24 | 3,000 | 2,987,941 | |
| Welltower, Inc., 2.70%, 2/15/27 | 4,000 | 4,175,351 | |
| $204,744,794 | |||
| Government - Multinational — 4.6% | |||
| Asian Development Bank: | |||
| 1.875%, 8/10/22 | 1,500 | $ 1,534,878 | |
| 2.125%, 3/19/25 | 750 | 792,704 | |
| 2.375%, 8/10/27 | 750 | 796,876 | |
| 3.125%, 9/26/28 | 800 | 888,271 | |
| European Bank for Reconstruction & Development, 1.625%, 9/27/24 | 2,635 | 2,730,794 | |
| Security | Principal Amount (000's omitted)* | Value | |
| Government - Multinational (continued) | |||
| European Investment Bank: | |||
| 1.00%, 11/14/42(4) | EUR | 3,400 | $ 4,518,743 |
| 2.375%, 5/24/27 | 10,503 | 11,228,755 | |
| 2.50%, 10/15/24(3) | 1,000 | 1,068,735 | |
| 3.30%, 2/3/28 | AUD | 1,300 | 1,103,626 |
| International Bank for Reconstruction & Development: | |||
| 0.625%, 11/22/27 | EUR | 3,550 | 4,405,506 |
| 2.125%, 3/3/25 | 4,000 | 4,226,568 | |
| 3.125%, 11/20/25 | 4,150 | 4,562,626 | |
| International Finance Corp., 2.125%, 4/7/26 | 1,547 | 1,632,622 | |
| Nordic Investment Bank, 2.25%, 9/30/21 | 950 | 959,887 | |
| $ 40,450,591 | |||
| Government - Regional — 0.5% | |||
| Kommuninvest I Sverige AB, 0.375%, 6/19/24(1) | 4,785 | $ 4,768,220 | |
| $ 4,768,220 | |||
| Industrial — 2.5% | |||
| Johnson Controls International plc/Tyco Fire & Security Finance SCA, 1.75%, 9/15/30 | 5,000 | $ 4,693,431 | |
| Owens Corning, 3.95%, 8/15/29 | 11,132 | 12,263,248 | |
| Xylem, Inc.: | |||
| 1.95%, 1/30/28 | 3,400 | 3,398,671 | |
| 2.25%, 1/30/31 | 1,571 | 1,543,501 | |
| $ 21,898,851 | |||
| Technology — 4.2% | |||
| Apple, Inc., 0.50%, 11/15/31 | EUR | 22,438 | $ 26,912,427 |
| NXP B.V./NXP Funding, LLC NXP USA, Inc., 3.40%, 5/1/30(1) | 1,911 | 2,021,008 | |
| SK Hynix, Inc., 2.375%, 1/19/31(1) | 8,000 | 7,581,103 | |
| $ 36,514,538 | |||
| Utilities — 12.9% | |||
| AES Corp. (The), 2.45%, 1/15/31(1) | 18,302 | $ 17,513,264 | |
| Avangrid, Inc.: | |||
| 3.15%, 12/1/24 | 3,953 | 4,252,602 | |
| 3.80%, 6/1/29 | 8,100 | 8,922,521 | |
| Brookfield Renewable Partners ULC, 3.33%, 8/13/50 | CAD | 4,000 | 2,939,031 |
| Clearway Energy Operating, LLC, 4.75%, 3/15/28(1) | 3,047 | 3,172,933 | |
| Consolidated Edison Co. of New York, Inc., 3.35%, 4/1/30 | 1,833 | 1,963,448 | |
| Enel Finance International NV: | |||
| 1.00%, 9/16/24(4) | EUR | 4,250 | 5,177,403 |
| 1.125%, 9/16/26(4) | EUR | 4,100 | 5,081,904 |
| Liberty Utilities Finance GP 1, 2.05%, 9/15/30(1) | 12,994 | 12,200,264 | |
| Security | Principal Amount (000's omitted)* | Value | |
| Utilities (continued) | |||
| MidAmerican Energy Co.: | |||
| 3.15%, 4/15/50 | 1,350 | $ 1,329,216 | |
| 3.65%, 8/1/48 | 4,490 | 4,764,619 | |
| 4.25%, 7/15/49 | 2,890 | 3,400,071 | |
| NextEra Energy Operating Partners, L.P.: | |||
| 4.25%, 9/15/24(1) | 257 | 271,456 | |
| 4.50%, 9/15/27(1) | 6,214 | 6,734,422 | |
| Niagara Mohawk Power Corp., 1.96%, 6/27/30(1) | 3,782 | 3,619,118 | |
| Northern States Power Co.: | |||
| 2.25%, 4/1/31 | 2,310 | 2,310,227 | |
| 2.60%, 6/1/51 | 6,100 | 5,478,968 | |
| NSTAR Electric Co., 3.25%, 5/15/29 | 3,000 | 3,218,055 | |
| Pattern Energy Operations, L.P./Pattern Energy Operations, Inc., 4.50%, 8/15/28(1) | 9,916 | 10,095,727 | |
| Public Service Co. of Colorado: | |||
| 3.20%, 3/1/50 | 5,000 | 5,019,857 | |
| 4.10%, 6/15/48 | 1,000 | 1,135,314 | |
| Terraform Global Operating, LLC, 6.125%, 3/1/26(1) | 1,595 | 1,640,553 | |
| Tucson Electric Power Co., 1.50%, 8/1/30 | 2,500 | 2,318,433 | |
| $112,559,406 | |||
| Total Corporate Bonds (identified cost $487,885,343) | $492,957,167 | ||
| High Social Impact Investments — 0.2% |
| Security | Principal Amount (000's omitted) | Value | |
| Calvert Impact Capital, Inc., Community Investment Notes, 1.50%, 12/15/23(8)(9) | $ | 1,700 | $ 1,650,989 |
| Total High Social Impact Investments (identified cost $1,700,000) | $ 1,650,989 | ||
| Preferred Stocks — 0.7% |
| Security | Shares | Value | |
| Real Estate Management & Development — 0.7% | |||
| Brookfield Property Partners, L.P.: | |||
| Series A, 5.75% | 92,000 | $ 2,284,360 | |
| Series A2, 6.375% | 169,100 | 4,347,561 | |
| Total Preferred Stocks (identified cost $6,575,394) | $ 6,631,921 | ||
| Senior Floating-Rate Loans(10) — 0.3% |
| Borrower/Description | Principal Amount (000's omitted) | Value | |
| Industrial Equipment — 0.3% | |||
| EWT Holdings III Corp.: | |||
| Term Loan, 3/17/28(11) | $ | 1,175 | $ 1,171,328 |
| Term Loan, 2.609%, (1 mo. USD LIBOR + 2.50%), 12/20/24 | 1,994 | 1,993,785 | |
| Total Senior Floating-Rate Loans (identified cost $3,170,693) | $ 3,165,113 | ||
| Sovereign Government Bonds — 11.9% |
| Security | Principal Amount (000's omitted)* | Value | |
| Canada — 1.3% | |||
| Province of Ontario Canada: | |||
| 1.95%, 1/27/23 | CAD | 3,200 | $ 2,622,895 |
| 2.65%, 2/5/25 | CAD | 5,000 | 4,225,710 |
| South Coast British Columbia Transportation Authority, 2.65%, 10/29/50 | CAD | 5,490 | 4,099,698 |
| $ 10,948,303 | |||
| Chile — 0.2% | |||
| Chile Government International Bond, 2.55%, 1/27/32 | 1,500 | $ 1,515,300 | |
| $ 1,515,300 | |||
| Finland — 0.9% | |||
| Kuntarahoitus Oyj: | |||
| 0.05%, 9/6/29(4) | EUR | 3,750 | $ 4,461,496 |
| 1.375%, 9/21/21(1) | 3,500 | 3,519,380 | |
| $ 7,980,876 | |||
| France — 6.2% | |||
| French Republic Government Bond OAT: | |||
| 0.50%, 6/25/44(1)(4) | EUR | 8,000 | $ 9,194,991 |
| 1.75%, 6/25/39(1)(4) | EUR | 30,790 | 44,613,839 |
| $ 53,808,830 | |||
| Germany — 1.0% | |||
| Kreditanstalt fuer Wiederaufbau: | |||
| 0.75%, 9/30/30 | 3,034 | $ 2,760,605 | |
| 1.75%, 9/14/29 | 2,200 | 2,211,045 | |
| 2.00%, 9/29/22 | 3,965 | 4,072,238 | |
| $ 9,043,888 | |||
| Security | Principal Amount (000's omitted)* | Value | |
| Italy — 0.5% | |||
| Italy Buoni Poliennali Del Tesoro, 1.50%, 4/30/45(1)(4) | EUR | 3,600 | $ 4,243,935 |
| $ 4,243,935 | |||
| Netherlands — 1.0% | |||
| Nederlandse Waterschapsbank NV: | |||
| 1.00%, 5/28/30(1) | 2,400 | $ 2,226,288 | |
| 2.125%, 11/15/21(1) | 1,280 | 1,295,162 | |
| 2.375%, 3/24/26(1) | 1,700 | 1,810,766 | |
| 3.125%, 12/5/22(1) | 500 | 523,988 | |
| Netherlands Government Bond, 0.50%, 1/15/40(1)(4) | EUR | 2,400 | 2,991,128 |
| $ 8,847,332 | |||
| Sweden — 0.8% | |||
| Sweden Government International Bond, 0.125%, 9/9/30(1) | SEK | 61,500 | $ 6,914,115 |
| $ 6,914,115 | |||
| Total Sovereign Government Bonds (identified cost $103,537,459) | $103,302,579 | ||
| Taxable Municipal Obligations — 3.0% |
| Security | Principal Amount (000's omitted) | Value | |
| General Obligations — 1.0% | |||
| Massachusetts, Green Bonds, 3.277%, 6/1/46 | $ | 8,240 | $ 8,830,313 |
| $ 8,830,313 | |||
| Water and Sewer — 2.0% | |||
| District of Columbia Water & Sewer Authority, Green Bonds, 4.814%, 10/1/2114 | $ | 1,665 | $ 2,165,882 |
| Massachusetts Water Pollution Abatement Trust, 5.192%, 8/1/40(12) | 150 | 172,262 | |
| Narragansett Bay Commission, RI, Wastewater System Revenue, Green Bonds: | |||
| 2.094%, 9/1/30 | 620 | 618,202 | |
| 2.184%, 9/1/31 | 500 | 501,105 | |
| 2.264%, 9/1/32 | 445 | 447,265 | |
| 2.344%, 9/1/33 | 1,445 | 1,457,008 | |
| New York City Municipal Water Finance Authority, NY, (Water and Sewer System), 5.882%, 6/15/44(12) | 605 | 878,502 | |
| San Francisco City and County Public Utilities Commission, CA, Water Revenue, Green Bonds, 3.303%, 11/1/39 | 10,705 | 11,326,104 | |
| $ 17,566,330 | |||
| Total Taxable Municipal Obligations (identified cost $24,913,995) | $ 26,396,643 | ||
| U.S. Government Agencies and Instrumentalities — 1.4% |
| Security | Principal Amount (000's omitted) | Value | |
| U.S. International Development Finance Corp.: | |||
| 1.79%, 10/15/29 | $ | 4,342 | $ 4,577,383 |
| 2.36%, 10/15/29 | 2,813 | 3,038,387 | |
| 3.16%, 6/1/33 | 171 | 187,583 | |
| 3.22%, 9/15/29 | 676 | 757,177 | |
| 3.52%, 9/20/32 | 3,121 | 3,482,977 | |
| Total U.S. Government Agencies and Instrumentalities (identified cost $11,123,187) | $ 12,043,507 | ||
| U.S. Government Agency Mortgage-Backed Securities — 0.5% |
| Security | Principal Amount (000's omitted) | Value | |
| Federal National Mortgage Association: | |||
| Pool #AN1879, 2.65%, 6/1/26 | $ | 1,833 | $ 1,957,718 |
| Pool #AN1909, 2.68%, 7/1/26 | 2,000 | 2,141,751 | |
| Total U.S. Government Agency Mortgage-Backed Securities (identified cost $3,884,808) | $ 4,099,469 | ||
| Short-Term Investments — 7.1% | |||
| Other — 7.1% | |||
| Description | Units | Value | |
| Calvert Cash Reserves Fund, LLC, 0.07%(13) | 61,418,581 | $ 61,424,723 | |
| Total Other (identified cost $61,424,723) | $ 61,424,723 | ||
| Securities Lending Collateral — 0.0%(14) | |||
| Security | Shares | Value | |
| State Street Navigator Securities Lending Government Money Market Portfolio, 0.03%(15) | 261,478 | $ 261,478 | |
| Total Securities Lending Collateral (identified cost $261,478) | $ 261,478 | ||
| Total Short-Term Investments (identified cost $61,686,201) | $ 61,686,201 | ||
| Total Investments — 100.3% (identified cost $861,574,989) | $873,312,640 | ||
| Other Assets, Less Liabilities — (0.3)% | $ (2,935,266) | ||
| Net Assets — 100.0% | $870,377,374 | ||
| The percentage shown for each investment category in the Schedule of Investments is based on net assets. | ||
| * | In U.S. dollars unless otherwise indicated. | |
| (1) | Security exempt from registration under Rule 144A of the Securities Act of 1933, as amended. These securities may be sold in certain transactions in reliance on an exemption from registration (normally to qualified institutional buyers). At March 31, 2021, the aggregate value of these securities is $328,683,135 or 37.8% of the Fund's net assets. | |
| (2) | Weighted average fixed-rate coupon that changes/updates monthly. Rate shown is the rate at March 31, 2021. | |
| (3) | All or a portion of this security was on loan at March 31, 2021. The aggregate market value of securities on loan at March 31, 2021 was $867,385. | |
| (4) | Security exempt from registration under Regulation S of the Securities Act of 1933, as amended, which exempts from registration securities offered and sold outside the United States. Security may not be offered or sold in the United States except pursuant to an exemption from, or in a transaction not subject to, the registration requirements of the Securities Act of 1933, as amended. At March 31, 2021, the aggregate value of these securities is $140,146,754 or 16.1% of the Fund's net assets. | |
| (5) | Security converts to variable rate after the indicated fixed-rate coupon period. | |
| (6) | Variable rate security. The stated interest rate represents the rate in effect at March 31, 2021. | |
| (7) | Represents an investment in an issuer that may be deemed to be an affiliate effective March 1, 2021 (see Note 8). | |
| (8) | May be deemed to be an affiliated company (see Note 8). | |
| (9) | Restricted security. Total market value of restricted securities amounts to $1,650,989, which represents 0.2% of the net assets of the Fund as of March 31, 2021. | |
| (10) | Senior floating-rate loans (Senior Loans) often require prepayments from excess cash flows or permit the borrowers to repay at their election. The degree to which borrowers repay, whether as a contractual requirement or at their election, cannot be predicted with accuracy. As a result, the actual remaining maturity may be substantially less than the stated maturities shown. However, Senior Loans will typically have an expected average life of approximately two to four years. Senior Loans typically have rates of interest which are redetermined periodically by reference to a base lending rate, plus a spread. These base lending rates are primarily the London Interbank Offered Rate ("LIBOR") and secondarily, the prime rate offered by one or more major United States banks (the "Prime Rate"). Base lending rates may be subject to a floor, or minimum rate. Senior Loans are generally subject to contractual restrictions that must be satisfied before they can be bought or sold. | |
| (11) | This Senior Loan will settle after March 31, 2021, at which time the interest rate will be determined. | |
| (12) | Build America Bond. Represents taxable municipal obligation issued pursuant to the American Recovery and Reinvestment Act of 2009 or other legislation providing for the issuance of taxable municipal debt on which the issuer receives federal support. | |
| (13) | Affiliated investment company, available to Calvert portfolios and funds, which invests in high quality, U.S. dollar denominated money market instruments. The rate shown is the annualized seven-day yield as of March 31, 2021. | |
| (14) | Amount is less than 0.05%. | |
| (15) | Represents investment of cash collateral received in connection with securities lending. |
| Country Allocation (% of Total Investments) | |
| United States | 70.0% |
| France | 6.2 |
| Netherlands | 5.7 |
| Canada | 4.2 |
| Other (less than 3.0% each) | 13.9 |
| Total | 100.0% |
| Currency Purchased | Currency Sold | Counterparty | Settlement Date | Unrealized Appreciation | Unrealized (Depreciation) | ||
| EUR | 6,301,517 | USD | 7,514,000 | State Street Bank and Trust Company | 5/28/21 | $ — | $ (116,188) |
| USD | 1,703,910 | AUD | 2,144,812 | State Street Bank and Trust Company | 5/28/21 | 74,421 | — |
| USD | 1,133,435 | AUD | 1,464,814 | State Street Bank and Trust Company | 5/28/21 | 20,565 | — |
| USD | 14,441,250 | CAD | 18,097,355 | State Street Bank and Trust Company | 5/28/21 | 39,538 | — |
| USD | 172,647,844 | EUR | 141,869,766 | State Street Bank and Trust Company | 5/28/21 | 6,096,566 | — |
| USD | 10,305,916 | EUR | 8,415,452 | State Street Bank and Trust Company | 5/28/21 | 426,401 | — |
| USD | 9,485,652 | EUR | 7,954,560 | State Street Bank and Trust Company | 5/28/21 | 147,213 | — |
| USD | 7,261,780 | EUR | 6,188,403 | State Street Bank and Trust Company | 5/28/21 | — | (3,238) |
| USD | 7,449,909 | SEK | 61,714,020 | State Street Bank and Trust Company | 5/28/21 | 380,182 | — |
| $7,184,886 | $(119,426) | ||||||
| Description | Number of Contracts | Position | Expiration Date | Notional Amount | Value/ Unrealized Appreciation (Depreciation) |
| Interest Rate Futures | |||||
| U.S. 2-Year Treasury Note | 30 | Long | 6/30/21 | $ 6,621,797 | $ (6,847) |
| U.S. 5-Year Treasury Note | 405 | Long | 6/30/21 | 49,976,367 | (639,837) |
| U.S. Long Treasury Bond | (145) | Short | 6/21/21 | (22,416,094) | 687,706 |
| U.S. Ultra 10-Year Treasury Note | (365) | Short | 6/21/21 | (52,445,937) | 1,845,148 |
| U.S. Ultra-Long Treasury Bond | (51) | Short | 6/21/21 | (9,242,156) | 466,074 |
| $2,352,244 |
| Description | Acquisition Date | Cost |
| Calvert Impact Capital, Inc., Community Investment Notes, 1.50%, 12/15/23 | 12/14/20 | $1,700,000 |
| Abbreviations: | |
| LIBOR | – London Interbank Offered Rate |
| Currency Abbreviations: | |
| AUD | – Australian Dollar |
| CAD | – Canadian Dollar |
| EUR | – Euro |
| SEK | – Swedish Krona |
| USD | – United States Dollar |
| March 31, 2021 | |
| Assets | |
| Investments in securities of unaffiliated issuers, at value (identified cost $797,361,122) - including $867,385 of securities on loan | $ 809,086,219 |
| Investments in securities of affiliated issuers, at value (identified cost $64,213,867) | 64,226,421 |
| Receivable for variation margin on open futures contracts | 180,927 |
| Receivable for open forward foreign currency exchange contracts | 7,184,886 |
| Deposits at broker for futures contracts | 1,651,580 |
| Deposits for derivatives collateral - forward foreign currency exchange contracts | 840,000 |
| Receivable for investments sold | 5,773 |
| Receivable for capital shares sold | 5,485,086 |
| Interest receivable | 4,124,827 |
| Dividends and interest receivable - affiliated | 13,469 |
| Securities lending income receivable | 175 |
| Receivable from affiliate | 31,772 |
| Directors' deferred compensation plan | 98,572 |
| Total assets | $892,929,707 |
| Liabilities | |
| Cash collateral due to broker | $ 840,000 |
| Payable for open forward foreign currency exchange contracts | 119,426 |
| Due to custodian - foreign currency, at value (cost $10,264) | 9,895 |
| Payable for investments purchased | 19,145,495 |
| Payable for capital shares redeemed | 1,508,202 |
| Distributions payable | 23,410 |
| Deposits for securities loaned | 261,478 |
| Payable to affiliates: | |
| Investment advisory fee | 181,807 |
| Administrative fee | 87,267 |
| Distribution and service fees | 17,810 |
| Sub-transfer agency fee | 13,765 |
| Directors' deferred compensation plan | 98,572 |
| Accrued expenses | 245,206 |
| Total liabilities | $ 22,552,333 |
| Net Assets | $870,377,374 |
| Sources of Net Assets | |
| Paid-in capital | $ 855,906,926 |
| Distributable earnings | 14,470,448 |
| Total | $870,377,374 |
| Class A Shares | |
| Net Assets | $ 83,664,715 |
| Shares Outstanding | 5,194,544 |
| Net Asset Value and Redemption Price Per Share (net assets ÷ shares of beneficial interest outstanding) | $ 16.11 |
| Maximum Offering Price Per Share (100 ÷ 96.25 of net asset value per share) | $ 16.74 |
| March 31, 2021 | |
| Class I Shares | |
| Net Assets | $780,977,779 |
| Shares Outstanding | 48,425,140 |
| Net Asset Value, Offering Price and Redemption Price Per Share (net assets ÷ shares of beneficial interest outstanding) | $ 16.13 |
| Class R6 Shares | |
| Net Assets | $ 5,734,880 |
| Shares Outstanding | 355,410 |
| Net Asset Value, Offering Price and Redemption Price Per Share (net assets ÷ shares of beneficial interest outstanding) | $ 16.14 |
| Six Months Ended | |
| March 31, 2021 | |
| Investment Income | |
| Dividend income | $ 221,867 |
| Dividend income - affiliated issuers | 18,257 |
| Interest and other income (net of foreign taxes withheld of $9,725) | 7,502,467 |
| Interest income - affiliated issuers | 13,921 |
| Securities lending income, net | 3,184 |
| Total investment income | $ 7,759,696 |
| Expenses | |
| Investment advisory fee | $ 935,083 |
| Administrative fee | 448,840 |
| Distribution and service fees: | |
| Class A | 102,069 |
| Directors' fees and expenses | 15,052 |
| Custodian fees | 14,893 |
| Transfer agency fees and expenses | 277,632 |
| Accounting fees | 85,356 |
| Professional fees | 24,968 |
| Registration fees | 66,097 |
| Reports to shareholders | 27,991 |
| Miscellaneous | 23,248 |
| Total expenses | $ 2,021,229 |
| Waiver and/or reimbursement of expenses by affiliate | $ (122,264) |
| Net expenses | $ 1,898,965 |
| Net investment income | $ 5,860,731 |
| Realized and Unrealized Gain (Loss) | |
| Net realized gain (loss): | |
| Investment securities | $ (6,620) |
| Futures contracts | 5,053,443 |
| Foreign currency transactions | 9,187 |
| Forward foreign currency exchange contracts | (4,326,692) |
| Net realized gain | $ 729,318 |
| Change in unrealized appreciation (depreciation): | |
| Investment securities | $ (21,954,005) |
| Investment securities - affiliated issuers | (52,642) |
| Futures contracts | 2,391,354 |
| Foreign currency | (14,973) |
| Forward foreign currency exchange contracts | 5,686,582 |
| Net change in unrealized appreciation (depreciation) | $(13,943,684) |
| Net realized and unrealized loss | $(13,214,366) |
| Net decrease in net assets from operations | $ (7,353,635) |
| Six Months Ended March 31, 2021 (Unaudited) | Year Ended September 30, 2020 | |
| Increase (Decrease) in Net Assets | ||
| From operations: | ||
| Net investment income | $ 5,860,731 | $ 9,208,527 |
| Net realized gain (loss) | 729,318 | (6,172,077) |
| Net change in unrealized appreciation (depreciation) | (13,943,684) | 22,198,727 |
| Net increase (decrease) in net assets from operations | $ (7,353,635) | $ 25,235,177 |
| Distributions to shareholders: | ||
| Class A | $ (680,251) | $ (1,392,425) |
| Class I | (6,256,990) | (9,054,002) |
| Class R6 | (42,388) | (22,346) |
| Total distributions to shareholders | $ (6,979,629) | $ (10,468,773) |
| Capital share transactions: | ||
| Class A | $ 7,002,742 | $ 17,390,289 |
| Class I | 261,735,481 | 233,793,006 |
| Class R6 | 2,624,777 | 2,598,426 |
| Net increase in net assets from capital share transactions | $271,363,000 | $253,781,721 |
| Net increase in net assets | $257,029,736 | $268,548,125 |
| Net Assets | ||
| At beginning of period | $ 613,347,638 | $ 344,799,513 |
| At end of period | $870,377,374 | $613,347,638 |
| Class A | ||||||
| Six Months Ended March 31, 2021 (Unaudited) | Year Ended September 30, | |||||
| 2020 | 2019 | 2018 | 2017 | 2016 | ||
| Net asset value — Beginning of period | $ 16.36 | $ 15.87 | $ 14.82 | $ 15.32 | $ 15.64 | $ 15.14 |
| Income (Loss) From Operations | ||||||
| Net investment income(1) | $ 0.11 | $ 0.28 | $ 0.34 | $ 0.27 | $ 0.26 | $ 0.25 |
| Net realized and unrealized gain (loss) | (0.22) | 0.55 | 1.05 | (0.39) | (0.16) | 0.53 |
| Total income (loss) from operations | $ (0.11) | $ 0.83 | $ 1.39 | $ (0.12) | $ 0.10 | $ 0.78 |
| Less Distributions | ||||||
| From net investment income | $ (0.14) | $ (0.32) | $ (0.34) | $ (0.27) | $ (0.26) | $ (0.25) |
| From net realized gain | — | (0.02) | — | (0.11) | (0.16) | (0.03) |
| Total distributions | $ (0.14) | $ (0.34) | $ (0.34) | $ (0.38) | $ (0.42) | $ (0.28) |
| Net asset value — End of period | $ 16.11 | $ 16.36 | $ 15.87 | $ 14.82 | $ 15.32 | $ 15.64 |
| Total Return(2) | (0.70)% (3) | 5.27% | 9.53% | (0.80)% | 0.71% | 5.21% |
| Ratios/Supplemental Data | ||||||
| Net assets, end of period (000’s omitted) | $83,665 | $77,991 | $58,422 | $42,611 | $38,011 | $28,987 |
| Ratios (as a percentage of average daily net assets):(4) | ||||||
| Total expenses | 0.76% (5) | 0.79% | 0.86% | 0.99% | 1.04% | 1.12% |
| Net expenses | 0.73% (5) | 0.73% | 0.77% | 0.85% | 0.88% | 0.88% |
| Net investment income | 1.35% (5) | 1.77% | 2.21% | 1.83% | 1.71% | 1.64% |
| Portfolio Turnover | 8% (3) | 26% | 21% | 16% | 43% | 243% |
| (1) | Computed using average shares outstanding. |
| (2) | Returns are historical and are calculated by determining the percentage change in net asset value with all distributions reinvested and do not reflect the effect of sales charges, if any. |
| (3) | Not annualized. |
| (4) | Total expenses do not reflect amounts reimbursed and/or waived by the adviser and certain of its affiliates, if applicable. Net expenses are net of all reductions and represent the net expenses paid by the Fund. |
| (5) | Annualized. |
| Class I | ||||||
| Six Months Ended March 31, 2021 (Unaudited) | Year Ended September 30, | |||||
| 2020 | 2019 | 2018 | 2017 | 2016 | ||
| Net asset value — Beginning of period | $ 16.38 | $ 15.89 | $ 14.83 | $ 15.32 | $ 15.63 | $ 15.13 |
| Income (Loss) From Operations | ||||||
| Net investment income(1) | $ 0.13 | $ 0.32 | $ 0.38 | $ 0.33 | $ 0.32 | $ 0.31 |
| Net realized and unrealized gain (loss) | (0.22) | 0.55 | 1.06 | (0.40) | (0.15) | 0.53 |
| Total income (loss) from operations | $ (0.09) | $ 0.87 | $ 1.44 | $ (0.07) | $ 0.17 | $ 0.84 |
| Less Distributions | ||||||
| From net investment income | $ (0.16) | $ (0.36) | $ (0.38) | $ (0.31) | $ (0.32) | $ (0.31) |
| From net realized gain | — | (0.02) | — | (0.11) | (0.16) | (0.03) |
| Total distributions | $ (0.16) | $ (0.38) | $ (0.38) | $ (0.42) | $ (0.48) | $ (0.34) |
| Net asset value — End of period | $ 16.13 | $ 16.38 | $ 15.89 | $ 14.83 | $ 15.32 | $ 15.63 |
| Total Return(2) | (0.58)% (3) | 5.53% | 9.84% | (0.48)% | 1.15% | 5.60% |
| Ratios/Supplemental Data | ||||||
| Net assets, end of period (000’s omitted) | $780,978 | $532,149 | $285,796 | $113,097 | $23,641 | $23,908 |
| Ratios (as a percentage of average daily net assets):(4) | ||||||
| Total expenses | 0.51% (5) | 0.54% | 0.61% | 0.74% | 0.68% | 0.67% |
| Net expenses | 0.48% (5) | 0.48% | 0.48% | 0.50% | 0.50% | 0.50% |
| Net investment income | 1.59% (5) | 2.00% | 2.47% | 2.24% | 2.09% | 2.01% |
| Portfolio Turnover | 8% (3) | 26% | 21% | 16% | 43% | 243% |
| (1) | Computed using average shares outstanding. |
| (2) | Returns are historical and are calculated by determining the percentage change in net asset value with all distributions reinvested and do not reflect the effect of sales charges, if any. |
| (3) | Not annualized. |
| (4) | Total expenses do not reflect amounts reimbursed and/or waived by the adviser and certain of its affiliates, if applicable. Net expenses are net of all reductions and represent the net expenses paid by the Fund. |
| (5) | Annualized. |
| Class R6 | |||
| Six Months Ended March 31, 2021 (Unaudited) | Year Ended September 30, | Period Ended September 30, | |
| 2020 | 2019 (1) | ||
| Net asset value — Beginning of period | $ 16.39 | $ 15.90 | $ 15.01 |
| Income (Loss) From Operations | |||
| Net investment income(2) | $ 0.13 | $ 0.32 | $ 0.26 |
| Net realized and unrealized gain (loss) | (0.22) | 0.55 | 0.89 |
| Total income (loss) from operations | $ (0.09) | $ 0.87 | $ 1.15 |
| Less Distributions | |||
| From net investment income | $ (0.16) | $ (0.36) | $ (0.26) |
| From net realized gain | — | (0.02) | — |
| Total distributions | $ (0.16) | $ (0.38) | $ (0.26) |
| Net asset value — End of period | $16.14 | $16.39 | $15.90 |
| Total Return(3) | (0.55)% (4) | 5.58% | 7.68% (4) |
| Ratios/Supplemental Data | |||
| Net assets, end of period (000’s omitted) | $ 5,735 | $ 3,208 | $ 581 |
| Ratios (as a percentage of average daily net assets):(5) | |||
| Total expenses | 0.46% (6) | 0.49% | 0.54% (6) |
| Net expenses | 0.43% (6) | 0.43% | 0.43% (6) |
| Net investment income | 1.64% (6) | 1.99% | 2.49% (6) |
| Portfolio Turnover | 8% (4) | 26% | 21% (7) |
| (1) | For the period from the commencement of operations, February 1, 2019, to September 30, 2019. |
| (2) | Computed using average shares outstanding. |
| (3) | Returns are historical and are calculated by determining the percentage change in net asset value with all distributions reinvested and do not reflect the effect of sales charges, if any. |
| (4) | Not annualized. |
| (5) | Total expenses do not reflect amounts reimbursed and/or waived by the adviser and certain of its affiliates, if applicable. Net expenses are net of all reductions and represent the net expenses paid by the Fund. |
| (6) | Annualized. |
| (7) | For the year ended September 30, 2019. |
| Asset Description | Level 1 | Level 2 | Level 3 | Total |
| Asset-Backed Securities | $ — | $ 93,057,636 | $ — | $ 93,057,636 |
| Commercial Mortgage-Backed Securities | — | 65,834,166 | — | 65,834,166 |
| Common Stocks | 2,487,249 (1) | — | — | 2,487,249 |
| Corporate Bonds | — | 492,957,167 | — | 492,957,167 |
| High Social Impact Investments | — | 1,650,989 | — | 1,650,989 |
| Preferred Stocks | 6,631,921 | — | — | 6,631,921 |
| Senior Floating-Rate Loans | — | 3,165,113 | — | 3,165,113 |
| Sovereign Government Bonds | — | 103,302,579 | — | 103,302,579 |
| Taxable Municipal Obligations | — | 26,396,643 | — | 26,396,643 |
| U.S. Government Agencies and Instrumentalities | — | 12,043,507 | — | 12,043,507 |
| U.S. Government Agency Mortgage-Backed Securities | — | 4,099,469 | — | 4,099,469 |
| Short-Term Investments: | ||||
| Other | — | 61,424,723 | — | 61,424,723 |
| Securities Lending Collateral | 261,478 | — | — | 261,478 |
| Total Investments | $ 9,380,648 | $863,931,992 | $ — | $873,312,640 |
| Forward Foreign Currency Exchange Contracts | $ — | $ 7,184,886 | $ — | $ 7,184,886 |
| Futures Contracts | 2,998,928 | — | — | 2,998,928 |
| Total | $12,379,576 | $871,116,878 | $ — | $883,496,454 |
| Liability Description | ||||
| Forward Foreign Currency Exchange Contracts | $ — | $ (119,426) | $ — | $ (119,426) |
| Futures Contracts | (646,684) | — | — | (646,684) |
| Total | $ (646,684) | $ (119,426) | $ — | $ (766,110) |
| (1) | The level classification by major category of investments is the same as the category presentation in the Schedule of Investments. |
| Aggregate cost | $861,406,277 |
| Gross unrealized appreciation | $ 30,717,046 |
| Gross unrealized depreciation | (9,392,979) |
| Net unrealized appreciation | $ 21,324,067 |
| Risk | Derivative | Statement of Assets and Liabilities Caption | Assets | Liabilities |
| Foreign exchange | Forward foreign currency exchange contracts | Receivable/Payable for open forward foreign currency exchange contracts | $ 7,184,886 | $ (119,426) |
| Interest rate | Futures contracts | Distributable earnings | 2,998,928 (1) | (646,684) (1) |
| Total | $10,183,814 | $(766,110) | ||
| Derivatives not subject to master netting agreement | $ 2,998,928 | $(646,684) | ||
| Total Derivatives subject to master netting agreement | $ 7,184,886 | $(119,426) | ||
| (1) | Only the current day's variation margin is reported within the Statement of Assets and Liabilities as Receivable or Payable for variation margin on open futures contracts, as applicable. |
| Counterparty | Derivative Assets Subject to Master Netting Agreement | Derivatives Available for Offset | Non-cash Collateral Received(a) | Cash Collateral Received(a) | Net Amount of Derivative Assets(b) | Total Cash Collateral Received |
| State Street Bank and Trust Company | $7,184,886 | $(119,426) | $(6,545,039) | $(520,421) | $ — | $840,000 |
| Counterparty | Derivative Liabilities Subject to Master Netting Agreement | Derivatives Available for Offset | Non-cash Collateral Pledged(a) | Cash Collateral Pledged(a) | Net Amount of Derivative Liabilities(c) | Total Cash Collateral Pledged |
| State Street Bank and Trust Company | $(119,426) | $119,426 | $ — | $ — | $ — | $ — |
| (a) | In some instances, the total collateral received and/or pledged may be more than the amount shown due to overcollateralization. |
| (b) | Net amount represents the net amount due from the counterparty in the event of default. |
| (c) | Net amount represents the net amount payable to the counterparty in the event of default. |
| Statement of Operations Caption | Foreign exchange | Interest rate | Total |
| Net realized gain (loss): | |||
| Forward foreign currency exchange contracts | $ (4,326,692) | $ — | $(4,326,692) |
| Futures contracts | — | 5,053,443 | 5,053,443 |
| Total | $(4,326,692) | $5,053,443 | $ 726,751 |
| Change in unrealized appreciation (depreciation): | |||
| Forward foreign currency exchange contracts | $ 5,686,582 | $ — | $ 5,686,582 |
| Futures contracts | — | 2,391,354 | 2,391,354 |
| Total | $ 5,686,582 | $2,391,354 | $ 8,077,936 |
| Futures Contracts — Long | Futures Contracts — Short | Forward Foreign Currency Exchange Contracts* |
| $37,300,000 | $72,374,000 | $176,600,000 |
| * | The average notional amount for forward foreign currency exchange contracts is based on the absolute value of notional amounts of currency purchased and currency sold. |
| Remaining Contractual Maturity of the Transactions | |||||
| Overnight and Continuous | <30 days | 30 to 90 days | >90 days | Total | |
| Corporate Bonds | $261,478 | $ — | $ — | $ — | $261,478 |
| Name | Value, beginning of period | Purchases | Sales proceeds | Net realized gain (loss) | Change in unrealized appreciation (depreciation) | Value, end of period | Interest/ Dividend income | Principal amount/Units, end of period |
| Corporate Bonds | ||||||||
| Mitsubishi UFJ Financial Group, Inc., 2.527%, 9/13/23(1) | $ — | $ — | $ — | $ — | $ (9,695) | $ 1,150,709 | $ 2,675 | $ 1,100,000 |
| High Social Impact Investments | ||||||||
| Calvert Impact Capital, Inc., Community Investment Notes, 1.50%, 12/15/20(2) | 1,189,991 | — | (1,196,055) | — | 6,064 | — | 3,738 | — |
| Calvert Impact Capital, Inc., Community Investment Notes, 1.50%, 12/15/23(2) | — | 1,700,000 | — | — | (49,011) | 1,650,989 | 7,508 | 1,700,000 |
| Short-Term Investments | ||||||||
| Calvert Cash Reserves Fund, LLC | 3,019,064 | 235,972,905 | (177,567,246) | — | — | 61,424,723 | 18,257 | 61,418,581 |
| Totals | $ — | $ (52,642) | $64,226,421 | $32,178 |
| (1) | May be deemed to be an affiliated issuer as of March 1, 2021 (see Note 2). |
| (2) | Restricted security. |
| Six Months Ended March 31, 2021 (Unaudited) | Year Ended September 30, 2020 | ||||
| Shares | Amount | Shares | Amount | ||
| Class A | |||||
| Shares sold | 983,799 | $ 16,126,442 | 2,062,278 | $ 32,912,680 | |
| Reinvestment of distributions | 39,349 | 644,319 | 82,759 | 1,321,476 | |
| Shares redeemed | (596,460) | (9,768,019) | (1,058,461) | (16,843,867) | |
| Net increase | 426,688 | $ 7,002,742 | 1,086,576 | $ 17,390,289 | |
| Class I | |||||
| Shares sold | 21,011,573 | $ 344,564,301 | 19,929,297 | $ 319,155,887 | |
| Reinvestment of distributions | 374,237 | 6,131,402 | 547,153 | 8,759,879 | |
| Shares redeemed | (5,448,585) | (88,960,222) | (5,971,478) | (94,122,760) | |
| Net increase | 15,937,225 | $261,735,481 | 14,504,972 | $233,793,006 | |
| Class R6 | |||||
| Shares sold | 178,198 | $ 2,928,251 | 198,342 | $ 3,220,456 | |
| Reinvestment of distributions | 1,295 | 21,226 | 1,195 | 19,204 | |
| Shares redeemed | (19,834) | (324,700) | (40,354) | (641,234) | |
| Net increase | 159,659 | $ 2,624,777 | 159,183 | $ 2,598,426 | |
| Number of Shares(1) | ||||
| For | Against | Abstain (2) | Broker Non-Votes(2) | |
| 26,411,844.597 | 335,168.298 | 1,359,413.554 | 0 | |
| Fund | Investment Adviser | Investment Sub-Adviser |
| Calvert Green Bond Fund | Calvert Research and Management | None |
| Officers |
| Hope L. Brown Chief Compliance Officer |
| Maureen A. Gemma Vice President, Secretary and Chief Legal Officer |
| James F. Kirchner Treasurer |
| Directors |
| Alice Gresham Bullock Chairperson |
| Richard L. Baird, Jr. |
| Cari M. Dominguez |
| John G. Guffey, Jr. |
| Miles D. Harper, III |
| Joy V. Jones |
| John H. Streur* |
| Anthony A. Williams |
| *Interested Director and President |
| Privacy Notice | April 2021 |
| FACTS | WHAT DOES EATON VANCE DO WITH YOUR PERSONAL INFORMATION? |
| Why? | Financial companies choose how they share your personal information. Federal law gives consumers the right to limit some but not all sharing. Federal law also requires us to tell you how we collect, share, and protect your personal information. Please read this notice carefully to understand what we do. |
| What? | The types of personal information we collect and share depend on the product or service you have with us. This information can include:■ Social Security number and income ■ investment experience and risk tolerance ■ checking account number and wire transfer instructions |
| How? | All financial companies need to share customers’ personal information to run their everyday business. In the section below, we list the reasons financial companies can share their customers’ personal information; the reasons Eaton Vance chooses to share; and whether you can limit this sharing. |
| Reasons we can share your personal information | Does Eaton Vance share? | Can you limit this sharing? |
| For our everyday business purposes — such as to process your transactions, maintain your account(s), respond to court orders and legal investigations, or report to credit bureaus | Yes | No |
| For our marketing purposes — to offer our products and services to you | Yes | No |
| For joint marketing with other financial companies | No | We don’t share |
| For our investment management affiliates’ everyday business purposes — information about your transactions, experiences, and creditworthiness | Yes | Yes |
| For our affiliates’ everyday business purposes — information about your transactions and experiences | Yes | No |
| For our affiliates’ everyday business purposes — information about your creditworthiness | No | We don’t share |
| For our investment management affiliates to market to you | Yes | Yes |
| For our affiliates to market to you | No | We don’t share |
| For nonaffiliates to market to you | No | We don’t share |
| To limit our sharing | Call toll-free 1-800-368-2745 or email: CRMPrivacy@calvert.comPlease note:If you are a new customer, we can begin sharing your information 30 days from the date we sent this notice. When you are no longer our customer, we continue to share your information as described in this notice. However, you can contact us at any time to limit our sharing. |
| Questions? | Call toll-free 1-800-368-2745 or email: CRMPrivacy@calvert.com |
| Privacy Notice — continued | April 2021 |
| Who we are | |
| Who is providing this notice? | Eaton Vance Management, Eaton Vance Distributors, Inc., Eaton Vance Trust Company, Eaton Vance Management (International) Limited, Eaton Vance Advisers International Ltd., Eaton Vance Global Advisors Limited, Eaton Vance Management’s Real Estate Investment Group, Boston Management and Research, Calvert Research and Management, Eaton Vance and Calvert Fund Families and our investment advisory affiliates (“Eaton Vance”) (see Investment Management Affiliates definition below) |
| What we do | |
| How does Eaton Vance protect my personal information? | To protect your personal information from unauthorized access and use, we use security measures that comply with federal law. These measures include computer safeguards and secured files and buildings. We have policies governing the proper handling of customer information by personnel and requiring third parties that provide support to adhere to appropriate security standards with respect to such information. |
| How does Eaton Vance collect my personal information? | We collect your personal information, for example, when you■ open an account or make deposits or withdrawals from your account ■ buy securities from us or make a wire transfer ■ give us your contact informationWe also collect your personal information from others, such as credit bureaus, affiliates, or other companies. |
| Why can’t I limit all sharing? | Federal law gives you the right to limit only■ sharing for affiliates’ everyday business purposes — information about your creditworthiness ■ affiliates from using your information to market to you ■ sharing for nonaffiliates to market to youState laws and individual companies may give you additional rights to limit sharing. See below for more on your rights under state law. |
| Definitions | |
| Investment Management Affiliates | Eaton Vance Investment Management Affiliates include registered investment advisers, registered broker- dealers, and registered and unregistered funds. Investment Management Affiliates does not include entities associated with Morgan Stanley Wealth Management, such as Morgan Stanley Smith Barney LLC and Morgan Stanley & Co. |
| Affiliates | Companies related by common ownership or control. They can be financial and nonfinancial companies.■ Our affiliates include companies with a Morgan Stanley name and financial companies such as Morgan Stanley Smith Barney LLC and Morgan Stanley & Co. |
| Nonaffiliates | Companies not related by common ownership or control. They can be financial and nonfinancial companies.■ Eaton Vance does not share with nonaffiliates so they can market to you. |
| Joint marketing | A formal agreement between nonaffiliated financial companies that together market financial products or services to you.■ Eaton Vance doesn’t jointly market. |
| Other important information | |
| Vermont: Except as permitted by law, we will not share personal information we collect about Vermont residents with Nonaffiliates unless you provide us with your written consent to share such information.California: Except as permitted by law, we will not share personal information we collect about California residents with Nonaffiliates and we will limit sharing such personal information with our Affiliates to comply with California privacy laws that apply to us. | |


Global Water Fund

| % Average Annual Total Returns1,2 | Class Inception Date | Performance Inception Date | Six Months | One Year | Five Years | Ten Years |
| Class A at NAV | 05/31/2007 | 05/31/2007 | 33.63% | 112.82% | 16.34% | 4.34% |
| Class A with 4.75% Maximum Sales Charge | — | — | 27.23 | 102.67 | 15.23 | 3.83 |
| Class C at NAV | 07/31/2007 | 05/31/2007 | 33.14 | 111.32 | 15.50 | 3.43 |
| Class C with 1% Maximum Sales Charge | — | — | 32.14 | 110.32 | 15.50 | 3.43 |
| Class I at NAV | 05/31/2007 | 05/31/2007 | 33.82 | 113.50 | 16.70 | 4.76 |
| MSCI ACWI Index | — | — | 19.93% | 54.60% | 13.21% | 9.14% |
| Calvert Global Energy Research Spliced Benchmark | — | — | 35.27 | 116.51 | 18.85 | 6.50 |
| Calvert Global Energy Research Index | — | — | 35.27 | 116.51 | — | — |
| Ardour Global Alternative Energy Index | — | — | 47.07 | 170.91 | 28.55 | 10.76 |
| % Total Annual Operating Expense Ratios3 | Class A | Class C | Class I |
| Gross | 1.54% | 2.29% | 1.29% |
| Net | 1.24 | 1.99 | 0.99 |
| Top 10 Holdings (% of net assets)* | |
| Infineon Technologies AG | 1.5% |
| Universal Display Corp. | 1.4 |
| Delta Electronics, Inc. | 1.4 |
| First Solar, Inc. | 1.3 |
| SolarEdge Technologies, Inc. | 1.3 |
| Nordex SE | 1.2 |
| Umicore S.A. | 1.2 |
| EnerSys | 1.2 |
| Power Integrations, Inc. | 1.1 |
| Sino-American Silicon Products, Inc. | 1.1 |
| Total | 12.7% |
| * | Excludes cash and cash equivalents. |
| % Average Annual Total Returns1,2 | Class Inception Date | Performance Inception Date | Six Months | One Year | Five Years | Ten Years |
| Class A at NAV | 09/30/2008 | 09/30/2008 | 25.47% | 58.63% | 11.81% | 8.30% |
| Class A with 4.75% Maximum Sales Charge | — | — | 19.51 | 51.13 | 10.73 | 7.77 |
| Class C at NAV | 09/30/2008 | 09/30/2008 | 24.99 | 57.44 | 10.98 | 7.45 |
| Class C with 1% Maximum Sales Charge | — | — | 23.99 | 56.44 | 10.98 | 7.45 |
| Class I at NAV | 01/31/2014 | 09/30/2008 | 25.64 | 59.08 | 12.16 | 8.60 |
| MSCI ACWI Index | — | — | 19.93% | 54.60% | 13.21% | 9.14% |
| Calvert Global Water Research Spliced Benchmark | — | — | 26.41 | 60.40 | 13.58 | 10.42 |
| Calvert Global Water Research Index | — | — | 26.41 | 60.40 | 13.58 | — |
| S-Network Global Water Index | — | — | 17.05 | 40.16 | 11.85 | 9.58 |
| % Total Annual Operating Expense Ratios3 | Class A | Class C | Class I |
| Gross | 1.34% | 2.09% | 1.09% |
| Net | 1.24 | 1.99 | 0.99 |
| Top 10 Holdings (% of net assets)* | |
| Ecolab, Inc. | 2.0% |
| Xylem, Inc. | 1.9 |
| IDEX Corp. | 1.8 |
| Pentair PLC | 1.8 |
| Lixil Corp. | 1.6 |
| Rexnord Corp. | 1.6 |
| Kurita Water Industries, Ltd. | 1.6 |
| Evoqua Water Technologies Corp. | 1.6 |
| Tetra Tech, Inc. | 1.6 |
| American Water Works Co., Inc. | 1.5 |
| Total | 17.0% |
| * | Excludes cash and cash equivalents. |
| 1 | MSCI ACWI Index is an unmanaged free-float-adjusted market-capitalization-weighted index designed to measure the equity market performance of developed and emerging markets. MSCI indexes are net of foreign withholding taxes. Source: MSCI. MSCI data may not be reproduced or used for any other purpose. MSCI provides no warranties, has not prepared or approved this report, and has no liability hereunder.The Calvert Global Energy Research Spliced Benchmark is comprised of the Ardour Global Alternative Energy Index prior to October 4, 2016 and the Calvert Global Energy Research Index thereafter. The Calvert Global Energy Research Index includes companies that manage energy use in a sustainable manner or that are actively engaged in facilitating the transition to a more sustainable economy through the reduction of greenhouse gas emissions and the expanded use of renewable energy sources. The Calvert Global Energy Research Index incepted on July 15, 2016; accordingly, the five and ten years returns are not available. The Ardour Global Alternative Energy Index measures the performance of stocks engaged in the field of alternative energy including solar, bioenergy, wind, hydro, and geothermal power sources.The Calvert Global Water Research Spliced Benchmark is comprised of the S-Network Global Water Index prior to May 31, 2016 and the Calvert Global Water Research Index thereafter. The Calvert Global Water Research Index includes stocks of companies that manage water use in a sustainable manner or that are actively engaged in expanding access to water, improving water quality, promoting the efficient use of water, or providing solutions that address other global water challenges. The Calvert Global Water Research Index incepted on February 5, 2016; accordingly, the five and ten years returns are not available. The S-Network Global Water Index measures the performance of stocks involved in water infrastructure, including utilities, and water technology development.Unless otherwise stated, index returns do not reflect the effect of any applicable sales charges, commissions, expenses, taxes or leverage, as applicable. It is not possible to invest directly in an index. |
| 2 | Total Returns at NAV do not include applicable sales charges. If sales charges were deducted, the returns would be lower. Total Returns shown with maximum sales charge reflect the stated maximum sales charge. Unless otherwise stated, performance does not reflect the deduction of taxes on Fund distributions or redemptions of Fund shares. |
| For Calvert Global Water Fund, performance prior to the inception date of a class may be linked to the performance of an older class of the Fund. This linked performance is adjusted for any applicable sales charge, but is not adjusted for class expense differences. If adjusted for such differences, the performance would be different. The performance of Class I for the Calvert Global Water Fund is linked to Class A. Performance presented in the Financial Highlights included in the financial statements is not linked.Effective October 4, 2016, the Calvert Global Energy Solutions Fund changed its investment objective and principal investment strategies to track the Calvert Global Energy Research Index and implement the Calvert Principles for Responsible Investment. Prior to October 4, 2016, the Fund employed an active management strategy. Performance prior to October 4, 2016 reflects the Fund’s performance under its former investment objective and policies. In connection with such changes, the Fund changed its secondary benchmark from Ardour Global Alternative Energy Index to Calvert Global Energy Research Index.Effective April 11, 2016, the Calvert Global Water Fund changed its investment objective and principal investment strategies to track the Calvert Global Water Research Index and implement the Calvert Principles for Responsible Investment. Prior to April 11, 2016, the Fund employed an active management strategy. Performance prior to April 11, 2016 reflects the Fund’s performance under its former investment objective and policies. In connection with such changes, the Fund changed its secondary benchmark from S-Network Global Water Index to Calvert Global Water Research Index.Calvert Research and Management became the investment adviser to each Fund on December 31, 2016. Performance reflected prior to such date is that of each Fund’s former investment adviser. | |
| 3 | Source: Fund prospectus. Net expense ratios reflect a contractual expense reimbursement that continues through 1/31/22. Without the reimbursement, performance would have been lower. The expense ratios for the current reporting period can be found in the Financial Highlights section of this report. |
| Beginning Account Value (10/1/20) | Ending Account Value (3/31/21) | Expenses Paid During Period* (10/1/20 – 3/31/21) | Annualized Expense Ratio | |
| Actual | ||||
| Class A | $1,000.00 | $1,336.30 | $ 7.22** | 1.24% |
| Class C | $1,000.00 | $1,331.40 | $11.57 ** | 1.99% |
| Class I | $1,000.00 | $1,338.20 | $ 5.77** | 0.99% |
| Hypothetical | ||||
| (5% return per year before expenses) | ||||
| Class A | $1,000.00 | $1,018.75 | $ 6.24** | 1.24% |
| Class C | $1,000.00 | $1,015.01 | $10.00 ** | 1.99% |
| Class I | $1,000.00 | $1,020.00 | $ 4.99** | 0.99% |
| * | Expenses are equal to the Fund's annualized expense ratio for the indicated Class, multiplied by the average account value over the period, multiplied by 182/365 (to reflect the one-half year period). The Example assumes that the $1,000 was invested at the net asset value per share determined at the close of business on September 30, 2020. |
| ** | Absent a waiver and/or reimbursement of expenses by an affiliate, expenses would be higher. |
| Beginning Account Value (10/1/20) | Ending Account Value (3/31/21) | Expenses Paid During Period* (10/1/20 – 3/31/21) | Annualized Expense Ratio | |
| Actual | ||||
| Class A | $1,000.00 | $1,254.70 | $ 6.97** | 1.24% |
| Class C | $1,000.00 | $1,249.90 | $11.16 ** | 1.99% |
| Class I | $1,000.00 | $1,256.40 | $ 5.57** | 0.99% |
| Hypothetical | ||||
| (5% return per year before expenses) | ||||
| Class A | $1,000.00 | $1,018.75 | $ 6.24** | 1.24% |
| Class C | $1,000.00 | $1,015.01 | $10.00 ** | 1.99% |
| Class I | $1,000.00 | $1,020.00 | $ 4.99** | 0.99% |
| * | Expenses are equal to the Fund's annualized expense ratio for the indicated Class, multiplied by the average account value over the period, multiplied by 182/365 (to reflect the one-half year period). The Example assumes that the $1,000 was invested at the net asset value per share determined at the close of business on September 30, 2020. |
| ** | Absent a waiver and/or reimbursement of expenses by an affiliate, expenses would be higher. |
| Common Stocks — 99.0% |
| Security | Shares | Value | |
| Australia — 0.6% | |||
| AusNet Services(1) | 865,519 | $ 1,209,776 | |
| $ 1,209,776 | |||
| Austria — 0.6% | |||
| Verbund AG | 17,376 | $ 1,262,176 | |
| $ 1,262,176 | |||
| Belgium — 1.2% | |||
| Umicore S.A. | 45,796 | $ 2,429,681 | |
| $ 2,429,681 | |||
| Brazil — 1.0% | |||
| Omega Geracao S.A.(2) | 148,600 | $ 1,037,545 | |
| Sao Martinho S.A. | 187,552 | 988,300 | |
| $ 2,025,845 | |||
| Canada — 3.7% | |||
| Boralex, Inc., Class A | 36,606 | $ 1,151,165 | |
| Brookfield Renewable Partners L.P. | 34,108 | 1,453,001 | |
| Canadian Solar, Inc.(1)(2) | 25,414 | 1,261,297 | |
| Innergex Renewable Energy, Inc. | 64,418 | 1,126,174 | |
| Northland Power, Inc. | 40,954 | 1,484,407 | |
| TransAlta Renewables, Inc. | 72,290 | 1,183,262 | |
| $ 7,659,306 | |||
| China — 4.7% | |||
| BYD Co., Ltd., Class H | 53,000 | $ 1,146,748 | |
| China Everbright Environment Group, Ltd. | 2,078,037 | 1,410,619 | |
| China Longyuan Power Group Corp., Ltd., Class H | 882,000 | 1,204,600 | |
| Xinjiang Goldwind Science & Technology Co., Ltd., Class H | 987,100 | 1,872,856 | |
| Xinyi Solar Holdings, Ltd. | 1,254,000 | 2,078,565 | |
| Yadea Group Holdings, Ltd.(3) | 474,000 | 1,055,919 | |
| Zhuzhou CRRC Times Electric Co., Ltd., Class H | 239,500 | 898,481 | |
| $ 9,667,788 | |||
| Denmark — 2.7% | |||
| Novozymes A/S, Class B | 20,535 | $ 1,313,967 | |
| Orsted A/S(3) | 6,813 | 1,100,064 | |
| ROCKWOOL International A/S, Class B | 3,176 | 1,336,766 | |
| Vestas Wind Systems A/S | 8,748 | 1,804,596 | |
| $ 5,555,393 | |||
| Finland — 0.9% | |||
| Metsa Board Oyj | 97,981 | $ 1,066,869 | |
| Neste Oyj | 16,458 | 874,014 | |
| $ 1,940,883 | |||
| Security | Shares | Value | |
| France — 5.0% | |||
| Albioma S.A. | 22,625 | $ 1,108,828 | |
| Cie de Saint-Gobain(2) | 25,304 | 1,494,239 | |
| Danone S.A. | 16,087 | 1,101,124 | |
| Engie S.A.(2) | 75,657 | 1,074,731 | |
| Legrand S.A. | 15,605 | 1,449,830 | |
| Neoen S.A.(1)(2)(3) | 24,891 | 1,247,798 | |
| Nexans S.A.(2) | 14,042 | 1,242,482 | |
| Schneider Electric SE | 10,193 | 1,552,752 | |
| $ 10,271,784 | |||
| Germany — 8.4% | |||
| Bayerische Motoren Werke AG | 12,775 | $ 1,325,746 | |
| Daimler AG | 13,641 | 1,217,455 | |
| Deutsche Post AG | 22,254 | 1,220,874 | |
| Encavis AG(1) | 51,100 | 968,552 | |
| Evonik Industries AG | 35,070 | 1,240,950 | |
| Infineon Technologies AG | 72,675 | 3,092,145 | |
| Nordex SE(2) | 79,456 | 2,549,462 | |
| OSRAM Licht AG(2) | 16,338 | 1,018,740 | |
| Siemens AG | 10,061 | 1,653,138 | |
| Siemens Energy AG(2) | 39,164 | 1,406,356 | |
| SMA Solar Technology AG(2) | 28,748 | 1,691,135 | |
| $ 17,384,553 | |||
| Greece — 0.5% | |||
| Terna Energy S.A. | 69,451 | $ 1,026,724 | |
| $ 1,026,724 | |||
| Ireland — 1.3% | |||
| CRH PLC | 25,169 | $ 1,179,932 | |
| Kingspan Group PLC | 17,298 | 1,463,396 | |
| $ 2,643,328 | |||
| Italy — 3.1% | |||
| Enel SpA | 183,875 | $ 1,829,069 | |
| ERG SpA | 39,637 | 1,178,392 | |
| Falck Renewables SpA | 151,597 | 1,084,440 | |
| Snam SpA | 212,697 | 1,179,178 | |
| Terna Rete Elettrica Nazionale SpA | 158,404 | 1,196,280 | |
| $ 6,467,359 | |||
| Japan — 7.5% | |||
| Daikin Industries, Ltd. | 7,400 | $ 1,495,974 | |
| Ferrotec Holdings Corp. | 94,800 | 1,904,997 | |
| GS Yuasa Corp.(1) | 73,900 | 2,011,831 | |
| Hitachi Metals, Ltd.(1) | 69,500 | 1,147,232 | |
| Meidensha Corp. | 88,500 | 1,931,533 | |
| Mitsubishi Electric Corp. | 93,500 | 1,428,965 | |
| Security | Shares | Value | |
| Japan (continued) | |||
| Nidec Corp. | 8,600 | $ 1,048,579 | |
| Nippon Express Co., Ltd. | 14,800 | 1,103,961 | |
| Nissan Motor Co., Ltd.(2) | 203,400 | 1,136,324 | |
| Sumitomo Chemical Co., Ltd. | 226,900 | 1,177,220 | |
| Yokogawa Electric Corp. | 59,400 | 1,097,283 | |
| $ 15,483,899 | |||
| Netherlands — 0.7% | |||
| Signify NV(1)(2)(3) | 26,707 | $ 1,373,626 | |
| $ 1,373,626 | |||
| New Zealand — 1.8% | |||
| Infratil, Ltd. | 238,291 | $ 1,187,760 | |
| Mercury NZ, Ltd. | 282,075 | 1,281,917 | |
| Meridian Energy, Ltd. | 323,351 | 1,218,976 | |
| $ 3,688,653 | |||
| Norway — 1.2% | |||
| Norsk Hydro ASA | 196,766 | $ 1,263,820 | |
| Scatec ASA(3) | 43,495 | 1,317,902 | |
| $ 2,581,722 | |||
| Portugal — 0.6% | |||
| EDP Renovaveis S.A. | 57,864 | $ 1,235,314 | |
| $ 1,235,314 | |||
| Singapore — 1.0% | |||
| City Developments, Ltd. | 200,400 | $ 1,191,902 | |
| Maxeon Solar Technologies, Ltd.(2) | 28,213 | 890,402 | |
| $ 2,082,304 | |||
| South Korea — 2.1% | |||
| Ecopro BM Co., Ltd. | 14,496 | $ 2,101,794 | |
| LG Chem, Ltd. | 1,501 | 1,074,149 | |
| LG Display Co., Ltd.(2) | 56,178 | 1,138,102 | |
| $ 4,314,045 | |||
| Spain — 4.0% | |||
| Acciona S.A. | 7,819 | $ 1,313,855 | |
| Atlantica Sustainable Infrastructure PLC | 33,053 | 1,210,731 | |
| Ence Energia y Celulosa S.A.(2) | 197,505 | 986,182 | |
| Iberdrola S.A. | 87,670 | 1,131,550 | |
| Red Electrica Corp. S.A. | 65,917 | 1,169,231 | |
| Siemens Gamesa Renewable Energy S.A. | 37,564 | 1,456,897 | |
| Solaria Energia y Medio Ambiente S.A.(2) | 51,463 | 1,091,478 | |
| $ 8,359,924 | |||
| Security | Shares | Value | |
| Sweden — 1.1% | |||
| Fabege AB | 79,360 | $ 1,070,430 | |
| Nibe Industrier AB, Class B | 40,348 | 1,251,328 | |
| $ 2,321,758 | |||
| Switzerland — 2.1% | |||
| ABB, Ltd. | 50,620 | $ 1,539,934 | |
| Gurit Holding AG | 772 | 1,958,242 | |
| Landis+Gyr Group AG | 13,998 | 941,711 | |
| $ 4,439,887 | |||
| Taiwan — 5.8% | |||
| Chroma ATE, Inc. | 150,000 | $ 999,370 | |
| Delta Electronics, Inc. | 283,000 | 2,886,204 | |
| Everlight Electronics Co., Ltd. | 1,191,000 | 1,936,733 | |
| OptoTech Corp.(2) | 1,868,200 | 1,755,226 | |
| Simplo Technology Co., Ltd. | 165,000 | 2,156,470 | |
| Sino-American Silicon Products, Inc. | 384,000 | 2,288,416 | |
| $ 12,022,419 | |||
| Thailand — 1.5% | |||
| BCPG PCL | 1,955,637 | $ 922,129 | |
| CK Power PCL(2) | 5,895,400 | 922,764 | |
| Energy Absolute PCL NVDR | 615,400 | 1,225,842 | |
| $ 3,070,735 | |||
| United Kingdom — 4.0% | |||
| Croda International PLC | 12,786 | $ 1,118,727 | |
| easyJet PLC(2) | 79,622 | 1,073,721 | |
| John Laing Group PLC(3) | 263,096 | 1,136,133 | |
| Johnson Matthey PLC | 28,286 | 1,175,000 | |
| Linde PLC | 4,539 | 1,271,555 | |
| Smart Metering Systems PLC | 112,695 | 1,290,544 | |
| United Utilities Group PLC | 92,339 | 1,179,943 | |
| $ 8,245,623 | |||
| United States — 31.9% | |||
| 3M Co. | 6,334 | $ 1,220,435 | |
| AAON, Inc. | 14,073 | 985,251 | |
| Acuity Brands, Inc. | 9,178 | 1,514,370 | |
| AES Corp. (The) | 41,318 | 1,107,736 | |
| Alaska Air Group, Inc. | 16,863 | 1,167,088 | |
| Alphabet, Inc., Class A(2) | 543 | 1,119,948 | |
| Ameresco, Inc., Class A(2) | 17,126 | 832,837 | |
| American Superconductor Corp.(2) | 46,132 | 874,663 | |
| Aptiv PLC | 9,492 | 1,308,947 | |
| BorgWarner, Inc. | 27,740 | 1,286,026 | |
| Brookfield Renewable Corp., Class A | 30,437 | 1,424,452 | |
| Clearway Energy, Inc., Class C | 45,617 | 1,283,662 | |
| Security | Shares | Value | |
| United States (continued) | |||
| Covanta Holding Corp. | 82,783 | $ 1,147,372 | |
| Cree, Inc.(2) | 11,162 | 1,206,947 | |
| Cummins, Inc. | 4,354 | 1,128,165 | |
| Eaton Corp. PLC | 11,238 | 1,553,991 | |
| Emerson Electric Co. | 17,034 | 1,536,807 | |
| EnerSys | 26,295 | 2,387,586 | |
| Enphase Energy, Inc.(2) | 7,595 | 1,231,605 | |
| Enviva Partners L.P. | 20,254 | 978,876 | |
| First Solar, Inc.(2) | 31,758 | 2,772,473 | |
| General Mills, Inc. | 20,160 | 1,236,211 | |
| Gibraltar Industries, Inc.(2) | 12,225 | 1,118,710 | |
| Hannon Armstrong Sustainable Infrastructure Capital, Inc. | 19,736 | 1,107,190 | |
| Ingersoll Rand, Inc.(2) | 28,578 | 1,406,323 | |
| International Business Machines Corp. | 9,323 | 1,242,383 | |
| Itron, Inc.(2) | 9,712 | 860,969 | |
| Johnson Controls International PLC | 25,477 | 1,520,213 | |
| Livent Corp.(2) | 123,214 | 2,134,066 | |
| Microsoft Corp. | 4,745 | 1,118,729 | |
| NextEra Energy Partners, L.P. | 18,118 | 1,320,440 | |
| NextEra Energy, Inc. | 15,100 | 1,141,711 | |
| ON Semiconductor Corp.(2) | 32,339 | 1,345,626 | |
| Ormat Technologies, Inc. | 14,967 | 1,175,358 | |
| Owens Corning | 15,064 | 1,387,244 | |
| Power Integrations, Inc. | 28,100 | 2,289,588 | |
| Renewable Energy Group, Inc.(2) | 15,915 | 1,051,027 | |
| Rockwell Automation, Inc. | 5,715 | 1,516,990 | |
| SolarEdge Technologies, Inc.(2) | 9,286 | 2,669,168 | |
| SunPower Corp.(2) | 35,394 | 1,183,929 | |
| Sunrun, Inc.(2) | 22,874 | 1,383,419 | |
| Tenneco, Inc., Class A(2) | 79,908 | 856,614 | |
| Tesla, Inc.(2) | 2,642 | 1,764,671 | |
| Trane Technologies PLC | 9,299 | 1,539,542 | |
| Universal Display Corp. | 12,493 | 2,957,968 | |
| Waste Management, Inc. | 9,997 | 1,289,813 | |
| Whirlpool Corp. | 5,833 | 1,285,302 | |
| $ 65,972,441 | |||
| Total Common Stocks (identified cost $154,819,424) | $204,736,946 | ||
| High Social Impact Investments — 0.1% |
| Security | Principal Amount (000's omitted) | Value | |
| Calvert Impact Capital, Inc., Community Investment Notes, 1.50%, 12/15/23(4)(5) | $ | 200 | $ 194,234 |
| ImpactAssets, Inc., Global Sustainable Agriculture Notes, 2.07%, 11/3/22(5)(6) | 53 | 49,390 | |
| ImpactAssets, Inc., Microfinance Plus Notes, 0.46%, 11/3/22(5)(6) | 68 | 56,533 | |
| Total High Social Impact Investments (identified cost $321,000) | $ 300,157 | ||
| Rights — 0.0%(7) |
| Security | Shares | Value | |
| Italy — 0.0%(7) | |||
| Snam SpA, Exp. 4/7/21(2) | 172,198 | $ 177 | |
| Total Rights (identified cost $0) | $ 177 | ||
| Warrants — 0.0%(7) |
| Security | Shares | Value | |
| Thailand — 0.0%(7) | |||
| BCPG PCL, Exp. 11/13/22(2) | 52,656 | $ 11,289 | |
| BCPG PCL, Exp. 11/13/23(2) | 52,656 | 11,290 | |
| Total Warrants (identified cost $0) | $ 22,579 | ||
| Short-Term Investments — 0.9% |
| Other — 0.4% | |||
| Description | Units | Value | |
| Calvert Cash Reserves Fund, LLC, 0.07%(8) | 814,587 | $ 814,668 | |
| Total Other (identified cost $814,668) | $ 814,668 | ||
| Securities Lending Collateral — 0.5% | |||
| Security | Shares | Value | |
| State Street Navigator Securities Lending Government Money Market Portfolio, 0.03%(9) | 1,083,996 | $ 1,083,996 | |
| Total Securities Lending Collateral (identified cost $1,083,996) | $ 1,083,996 | ||
| Total Short-Term Investments (identified cost $1,898,664) | $ 1,898,664 | ||
| Total Investments — 100.0% (identified cost $157,039,088) | $206,958,523 | |
| Other Assets, Less Liabilities — (0.0)%(7) | $ (100,023) | |
| Net Assets — 100.0% | $206,858,500 |
| The percentage shown for each investment category in the Schedule of Investments is based on net assets. | ||
| (1) | All or a portion of this security was on loan at March 31, 2021. The aggregate market value of securities on loan at March 31, 2021 was $3,411,497. | |
| (2) | Non-income producing security. | |
| (3) | Security exempt from registration under Rule 144A of the Securities Act of 1933, as amended. These securities may be sold in certain transactions in reliance on an exemption from registration (normally to qualified institutional buyers). At March 31, 2021, the aggregate value of these securities is $7,231,442 or 3.5% of the Fund's net assets. | |
| (4) | May be deemed to be an affiliated company (see Note 7). | |
| (5) | Restricted security. Total market value of restricted securities amounts to $300,157, which represents 0.1% of the net assets of the Fund as of March 31, 2021. | |
| (6) | Notes carry an interest rate that varies by period and is contingent on the performance of the underlying portfolio of loans to borrowers. The coupon rate shown represents the rate in effect at March 31, 2021. |
| (7) | Amount is less than 0.05% or (0.05)%, as applicable. |
| (8) | Affiliated investment company, available to Calvert portfolios and funds, which invests in high quality, U.S. dollar denominated money market instruments. The rate shown is the annualized seven-day yield as of March 31, 2021. |
| (9) | Represents investment of cash collateral received in connection with securities lending. |
| Economic Sectors | % of Net Assets |
| Industrials | 32.9% |
| Utilities | 23.2 |
| Information Technology | 21.8 |
| Materials | 9.9 |
| Consumer Discretionary | 6.0 |
| Consumer Staples | 1.6 |
| Energy | 1.4 |
| Real Estate | 1.1 |
| Communication Services | 0.6 |
| Financials | 0.5 |
| High Social Impact Investments | 0.1 |
| Total | 99.1% |
| Description | Acquisition Dates | Cost |
| Calvert Impact Capital, Inc., Community Investment Notes, 1.50%, 12/15/23 | 12/14/20 | $200,000 |
| ImpactAssets, Inc., Global Sustainable Agriculture Notes, 2.07%, 11/3/22 | 11/13/15 | 53,000 |
| ImpactAssets, Inc., Microfinance Plus Notes, 0.46%, 11/3/22 | 11/13/15 | 68,000 |
| Abbreviations: | |
| NVDR | – Non-Voting Depository Receipt |
| PCL | – Public Company Limited |
| Common Stocks — 99.3% |
| Security | Shares | Value | |
| Australia — 2.3% | |||
| Reece, Ltd.(1) | 332,133 | $ 4,339,018 | |
| Reliance Worldwide Corp., Ltd. | 2,218,638 | 7,597,910 | |
| $ 11,936,928 | |||
| Brazil — 3.2% | |||
| Cia de Saneamento Basico do Estado de Sao Paulo ADR(1) | 859,885 | $ 6,302,957 | |
| Cia de Saneamento de Minas Gerais | 1,793,592 | 4,811,676 | |
| Cia de Saneamento do Parana, PFC Shares | 6,954,882 | 5,461,448 | |
| $ 16,576,081 | |||
| Canada — 1.5% | |||
| Gildan Activewear, Inc. | 78,767 | $ 2,410,582 | |
| Nutrien, Ltd. | 50,563 | 2,723,892 | |
| Stantec, Inc.(1) | 55,309 | 2,367,808 | |
| $ 7,502,282 | |||
| Chile — 1.9% | |||
| Aguas Andinas S.A., Class A | 17,014,740 | $ 5,262,142 | |
| Inversiones Aguas Metropolitanas S.A. | 5,446,162 | 4,268,825 | |
| $ 9,530,967 | |||
| China — 4.5% | |||
| Beijing Enterprises Water Group, Ltd. | 14,359,452 | $ 5,467,399 | |
| China Everbright Environment Group, Ltd. | 3,676,666 | 2,495,805 | |
| China Lesso Group Holdings, Ltd. | 2,126,578 | 4,596,552 | |
| China Water Affairs Group, Ltd.(1) | 6,070,421 | 4,980,009 | |
| Guangdong Investment, Ltd. | 3,491,427 | 5,704,560 | |
| $ 23,244,325 | |||
| Denmark — 0.5% | |||
| Novozymes A/S, Class B | 40,616 | $ 2,598,883 | |
| $ 2,598,883 | |||
| Finland — 1.8% | |||
| Kemira Oyj | 428,648 | $ 6,584,786 | |
| Valmet Oyj | 68,811 | 2,505,457 | |
| $ 9,090,243 | |||
| France — 4.1% | |||
| Accor S.A.(2) | 57,659 | $ 2,172,353 | |
| Eurofins Scientific SE(2) | 29,081 | 2,779,570 | |
| L'Oreal S.A. | 7,956 | 3,047,794 | |
| Suez S.A. | 311,548 | 6,598,277 | |
| Veolia Environnement S.A. | 263,353 | 6,756,203 | |
| $ 21,354,197 | |||
| Security | Shares | Value | |
| Germany — 1.1% | |||
| GEA Group AG | 67,834 | $ 2,782,262 | |
| Henkel AG & Co. KGaA, PFC Shares | 25,307 | 2,845,359 | |
| $ 5,627,621 | |||
| Italy — 1.6% | |||
| ACEA SpA | 169,885 | $ 3,712,996 | |
| Interpump Group SpA | 92,302 | 4,651,981 | |
| $ 8,364,977 | |||
| Japan — 9.5% | |||
| Ebara Corp. | 110,956 | $ 4,527,292 | |
| Hitachi Zosen Corp.(1) | 566,527 | 4,589,166 | |
| Hulic Reit, Inc. | 1,200 | 1,882,351 | |
| Kitz Corp. | 589,700 | 3,422,934 | |
| Kurita Water Industries, Ltd. | 192,242 | 8,259,611 | |
| Lixil Corp. | 301,300 | 8,384,959 | |
| METAWATER Co., Ltd. | 169,934 | 3,401,191 | |
| Nihon Trim Co., Ltd. | 118,200 | 4,391,882 | |
| Sekisui Chemical Co., Ltd. | 133,000 | 2,560,959 | |
| TOTO, Ltd. | 77,700 | 4,782,124 | |
| Tsukishima Kikai Co., Ltd. | 247,700 | 2,876,672 | |
| $ 49,079,141 | |||
| Netherlands — 1.4% | |||
| Aalberts NV | 93,291 | $ 4,718,058 | |
| Arcadis NV(2) | 57,563 | 2,343,487 | |
| $ 7,061,545 | |||
| Singapore — 0.4% | |||
| City Developments, Ltd. | 373,000 | $ 2,218,460 | |
| Hyflux, Ltd.(1)(2)(3) | 16,595,483 | 0 | |
| $ 2,218,460 | |||
| South Korea — 0.9% | |||
| Coway Co., Ltd. | 37,145 | $ 2,158,073 | |
| LG Chem, Ltd. | 3,664 | 2,622,040 | |
| $ 4,780,113 | |||
| Spain — 1.0% | |||
| Acciona S.A. | 12,767 | $ 2,145,285 | |
| Iberdrola S.A. | 240,236 | 3,100,707 | |
| $ 5,245,992 | |||
| Switzerland — 4.4% | |||
| Geberit AG | 8,577 | $ 5,458,791 | |
| Georg Fischer AG | 3,486 | 4,658,807 | |
| Roche Holding AG PC | 9,674 | 3,133,826 | |
| SGS S.A. | 908 | 2,579,989 | |
| Security | Shares | Value | |
| Switzerland (continued) | |||
| Sika AG | 10,200 | $ 2,916,734 | |
| Sulzer AG | 35,509 | 3,999,717 | |
| $ 22,747,864 | |||
| Taiwan — 0.7% | |||
| Taiwan Semiconductor Manufacturing Co., Ltd. | 159,294 | $ 3,354,603 | |
| $ 3,354,603 | |||
| Thailand — 1.6% | |||
| TTW PCL, Foregin Shares | 11,583,200 | $ 4,378,360 | |
| WHA Utilities and Power PCL, Foreign Shares | 27,039,300 | 3,882,014 | |
| $ 8,260,374 | |||
| United Kingdom — 8.6% | |||
| CNH Industrial NV(1)(2) | 164,834 | $ 2,578,004 | |
| Croda International PLC | 29,244 | 2,558,740 | |
| Ferguson PLC | 44,384 | 5,301,887 | |
| Halma PLC | 78,744 | 2,576,240 | |
| Mondi PLC | 101,781 | 2,594,731 | |
| Pennon Group PLC | 509,693 | 6,849,115 | |
| Polypipe Group PLC(2) | 521,735 | 3,992,861 | |
| Rotork PLC | 853,115 | 4,193,121 | |
| Severn Trent PLC | 214,934 | 6,836,493 | |
| United Utilities Group PLC | 557,245 | 7,120,692 | |
| $ 44,601,884 | |||
| United States — 48.3% | |||
| Advanced Drainage Systems, Inc. | 41,961 | $ 4,338,348 | |
| Aegion Corp.(2) | 129,862 | 3,733,532 | |
| American States Water Co. | 80,574 | 6,093,006 | |
| American Water Works Co., Inc. | 53,209 | 7,977,093 | |
| Badger Meter, Inc. | 68,355 | 6,361,800 | |
| Ball Corp. | 33,016 | 2,797,776 | |
| Brookfield Renewable Corp., Class A | 50,409 | 2,359,141 | |
| California Water Service Group | 105,929 | 5,968,040 | |
| Cantel Medical Corp.(2) | 29,337 | 2,342,266 | |
| Chemed Corp. | 10,106 | 4,646,941 | |
| CMS Energy Corp. | 45,559 | 2,789,122 | |
| Cousins Properties, Inc. | 68,051 | 2,405,603 | |
| Danaher Corp. | 13,828 | 3,112,406 | |
| Ecolab, Inc. | 49,016 | 10,492,855 | |
| Energy Recovery, Inc.(2) | 349,251 | 6,405,263 | |
| Entegris, Inc. | 24,172 | 2,702,430 | |
| Essential Utilities, Inc. | 159,897 | 7,155,391 | |
| Evoqua Water Technologies Corp.(2) | 307,621 | 8,090,432 | |
| Flowserve Corp. | 119,288 | 4,629,567 | |
| Forterra, Inc.(2) | 148,918 | 3,462,343 | |
| Security | Shares | Value | |
| United States (continued) | |||
| Fortune Brands Home & Security, Inc. | 57,351 | $ 5,495,373 | |
| Franklin Electric Co., Inc. | 55,791 | 4,404,142 | |
| Gorman-Rupp Co. (The) | 100,394 | 3,324,045 | |
| Hawkins, Inc. | 188,603 | 6,321,973 | |
| Hyatt Hotels Corp., Class A | 23,343 | 1,930,466 | |
| IDEX Corp. | 45,549 | 9,534,317 | |
| IDEXX Laboratories, Inc.(2) | 5,442 | 2,662,825 | |
| Intel Corp. | 52,649 | 3,369,536 | |
| Itron, Inc.(2) | 20,244 | 1,794,631 | |
| Levi Strauss & Co., Class A | 88,794 | 2,123,065 | |
| Lindsay Corp. | 24,792 | 4,130,843 | |
| Masco Corp. | 91,222 | 5,464,198 | |
| Middlesex Water Co. | 75,999 | 6,005,441 | |
| Minerals Technologies, Inc. | 27,676 | 2,084,556 | |
| Mondelez International, Inc., Class A | 57,809 | 3,383,561 | |
| Mueller Industries, Inc. | 96,387 | 3,985,602 | |
| Mueller Water Products, Inc., Class A | 306,830 | 4,261,869 | |
| NIKE, Inc., Class B | 24,374 | 3,239,061 | |
| Nucor Corp. | 43,593 | 3,499,210 | |
| Parker-Hannifin Corp. | 9,639 | 3,040,430 | |
| Pentair PLC | 152,960 | 9,532,467 | |
| Procter & Gamble Co. (The) | 27,485 | 3,722,294 | |
| Rexnord Corp. | 176,641 | 8,318,025 | |
| Roper Technologies, Inc. | 7,698 | 3,104,911 | |
| Sherwin-Williams Co. (The) | 4,398 | 3,245,768 | |
| SJW Group | 88,258 | 5,559,371 | |
| Tetra Tech, Inc. | 59,520 | 8,078,054 | |
| Trimble, Inc.(2) | 36,381 | 2,830,078 | |
| Valmont Industries, Inc. | 18,266 | 4,341,280 | |
| Watts Water Technologies, Inc., Class A | 66,806 | 7,937,221 | |
| Xylem, Inc. | 91,201 | 9,592,521 | |
| York Water Co. (The) | 112,833 | 5,525,432 | |
| $249,705,921 | |||
| Total Common Stocks (identified cost $361,286,523) | $512,882,401 | ||
| High Social Impact Investments — 0.2% |
| Security | Principal Amount (000's omitted) | Value | |
| Calvert Impact Capital, Inc., Community Investment Notes, 1.50%, 12/15/23(4)(5) | $ | 630 | $ 611,837 |
| ImpactAssets, Inc., Global Sustainable Agriculture Notes, 2.07%, 11/3/22(5)(6) | 284 | 264,657 | |
| ImpactAssets, Inc., Microfinance Plus Notes, 0.46%, 11/3/22(5)(6) | 366 | 304,278 | |
| Total High Social Impact Investments (identified cost $1,280,000) | $ 1,180,772 | ||
| Short-Term Investments — 2.2% |
| Other — 0.2% | |||
| Description | Units | Value | |
| Calvert Cash Reserves Fund, LLC, 0.07%(7) | 1,147,290 | $ 1,147,405 | |
| Total Other (identified cost $1,147,405) | $ 1,147,405 | ||
| Securities Lending Collateral — 2.0% | |||
| Security | Shares | Value | |
| State Street Navigator Securities Lending Government Money Market Portfolio, 0.03%(8) | 10,217,434 | $ 10,217,434 | |
| Total Securities Lending Collateral (identified cost $10,217,434) | $ 10,217,434 | ||
| Total Short-Term Investments (identified cost $11,364,839) | $ 11,364,839 | ||
| Total Investments — 101.7% (identified cost $373,931,362) | $525,428,012 | |
| Other Assets, Less Liabilities — (1.7)% | $ (8,720,700) | |
| Net Assets — 100.0% | $516,707,312 |
| The percentage shown for each investment category in the Schedule of Investments is based on net assets. | ||
| (1) | All or a portion of this security was on loan at March 31, 2021. The aggregate market value of securities on loan at March 31, 2021 was $15,456,160. | |
| (2) | Non-income producing security. | |
| (3) | For fair value measurement disclosure purposes, security is categorized as Level 3 (see Note 1A). | |
| (4) | May be deemed to be an affiliated company (see Note 7). | |
| (5) | Restricted security. Total market value of restricted securities amounts to $1,180,772, which represents 0.2% of the net assets of the Fund as of March 31, 2021. | |
| (6) | Notes carry an interest rate that varies by period and is contingent on the performance of the underlying portfolio of loans to borrowers. The coupon rate shown represents the rate in effect at March 31, 2021. | |
| (7) | Affiliated investment company, available to Calvert portfolios and funds, which invests in high quality, U.S. dollar denominated money market instruments. The rate shown is the annualized seven-day yield as of March 31, 2021. | |
| (8) | Represents investment of cash collateral received in connection with securities lending. | |
| Economic Sectors | % of Net Assets |
| Industrials | 45.1% |
| Utilities | 27.7 |
| Materials | 10.5 |
| Information Technology | 4.5 |
| Consumer Discretionary | 4.1 |
| Health Care | 3.6 |
| Consumer Staples | 2.5 |
| Real Estate | 1.3 |
| High Social Impact Investments | 0.2 |
| Total | 99.5% |
| Description | Acquisition Dates | Cost |
| Calvert Impact Capital, Inc., Community Investment Notes, 1.50%, 12/15/23 | 12/14/20 | $630,000 |
| ImpactAssets, Inc., Global Sustainable Agriculture Notes, 2.07%, 11/3/22 | 11/13/15 | 284,000 |
| ImpactAssets, Inc., Microfinance Plus Notes, 0.46%, 11/3/22 | 11/13/15 | 366,000 |
| Abbreviations: | |
| ADR | – American Depositary Receipt |
| PC | – Participation Certificate |
| PCL | – Public Company Limited |
| PFC Shares | – Preference Shares |
| March 31, 2021 | ||
| Global Energy Solutions Fund | Global Water Fund | |
| Assets | ||
| Investments in securities of unaffiliated issuers, at value (identified cost $156,024,420 and $372,153,957, respectively) - including $3,411,497 and $15,456,160, respectively, of securities on loan | $ 205,949,621 | $ 523,668,770 |
| Investments in securities of affiliated issuers, at value (identified cost $1,014,668 and $1,777,405, respectively) | 1,008,902 | 1,759,242 |
| Cash | 7,809 | — |
| Cash denominated in foreign currency, at value (cost $77,065 and $228,011, respectively) | 76,854 | 225,750 |
| Receivable for capital shares sold | 852,262 | 446,143 |
| Dividends and interest receivable | 264,326 | 1,407,746 |
| Dividends and interest receivable - affiliated | 955 | 2,917 |
| Securities lending income receivable | 13,599 | 2,419 |
| Tax reclaims receivable | 115,555 | 393,286 |
| Receivable from affiliate | 34,947 | 26,825 |
| Directors' deferred compensation plan | 53,426 | 284,925 |
| Total assets | $208,378,256 | $528,218,023 |
| Liabilities | ||
| Payable for investments purchased | $ 26,154 | $ — |
| Payable for capital shares redeemed | 55,197 | 295,922 |
| Deposits for securities loaned | 1,083,996 | 10,217,434 |
| Payable to affiliates: | ||
| Investment advisory fee | 127,379 | 313,030 |
| Administrative fee | 20,381 | 51,842 |
| Distribution and service fees | 28,232 | 82,621 |
| Sub-transfer agency fee | 15,249 | 27,881 |
| Directors' deferred compensation plan | 53,426 | 284,925 |
| Accrued expenses | 109,742 | 237,056 |
| Total liabilities | $ 1,519,756 | $ 11,510,711 |
| Net Assets | $206,858,500 | $516,707,312 |
| Sources of Net Assets | ||
| Paid-in capital | $ 211,434,432 | $ 388,965,774 |
| Distributable earnings (Accumulated loss) | (4,575,932) | 127,741,538 |
| Total | $206,858,500 | $516,707,312 |
| Class A Shares | ||
| Net Assets | $ 94,127,348 | $ 226,628,475 |
| Shares Outstanding | 7,434,675 | 8,399,785 |
| Net Asset Value and Redemption Price Per Share (net assets ÷ shares of beneficial interest outstanding) | $ 12.66 | $ 26.98 |
| Maximum Offering Price Per Share (100 ÷ 95.25 of net asset value per share) | $ 13.29 | $ 28.33 |
| Class C Shares | ||
| Net Assets | $ 10,459,384 | $ 41,621,244 |
| Shares Outstanding | 882,001 | 1,678,886 |
| Net Asset Value and Offering Price Per Share* (net assets ÷ shares of beneficial interest outstanding) | $ 11.86 | $ 24.79 |
| March 31, 2021 | ||
| Global Energy Solutions Fund | Global Water Fund | |
| Class I Shares | ||
| Net Assets | $102,271,768 | $248,457,593 |
| Shares Outstanding | 7,946,703 | 9,147,935 |
| Net Asset Value, Offering Price and Redemption Price Per Share (net assets ÷ shares of beneficial interest outstanding) | $ 12.87 | $ 27.16 |
| On sales of $50,000 or more, the offering price of Class A shares is reduced. | |
| * | Redemption price per share is equal to the net asset value less any applicable contingent deferred sales charge. |
| Six Months Ended March 31, 2021 | ||
| Global Energy Solutions Fund | Global Water Fund | |
| Investment Income | ||
| Dividend income (net of foreign taxes withheld of $96,947 and $316,082, respectively) | $ 949,639 | $ 4,209,341 |
| Dividend income - affiliated issuers | 563 | 540 |
| Interest income | 379 | 1,838 |
| Interest income - affiliated issuers | 1,707 | 6,920 |
| Securities lending income, net | 97,754 | 15,846 |
| Total investment income | $ 1,050,042 | $ 4,234,485 |
| Expenses | ||
| Investment advisory fee | $ 628,663 | $ 1,703,626 |
| Administrative fee | 100,586 | 281,365 |
| Distribution and service fees: | ||
| Class A | 104,457 | 259,437 |
| Class C | 47,426 | 206,585 |
| Directors' fees and expenses | 3,026 | 9,967 |
| Custodian fees | 17,343 | 18,391 |
| Transfer agency fees and expenses | 132,646 | 307,485 |
| Accounting fees | 26,453 | 57,369 |
| Professional fees | 15,062 | 25,216 |
| Registration fees | 26,880 | 33,219 |
| Reports to shareholders | 8,014 | 23,841 |
| Miscellaneous | 14,281 | 19,826 |
| Total expenses | $ 1,124,837 | $ 2,946,327 |
| Waiver and/or reimbursement of expenses by affiliate | $ (138,832) | $ (157,674) |
| Net expenses | $ 986,005 | $ 2,788,653 |
| Net investment income | $ 64,037 | $ 1,445,832 |
| Realized and Unrealized Gain (Loss) | ||
| Net realized gain (loss): | ||
| Investment securities | $ 13,592,013 | $ 19,172,119 |
| Investment securities - affiliated issuers | (12) | (101) |
| Foreign currency transactions | 2,243 | 57,807 |
| Net realized gain | $13,594,244 | $ 19,229,825 |
| Change in unrealized appreciation (depreciation): | ||
| Investment securities | $ 25,280,380 | $ 83,068,918 |
| Investment securities - affiliated issuers | (4,417) | (11,349) |
| Foreign currency | (3,961) | (32,683) |
| Net change in unrealized appreciation (depreciation) | $25,272,002 | $ 83,024,886 |
| Net realized and unrealized gain | $38,866,246 | $102,254,711 |
| Net increase in net assets from operations | $38,930,283 | $103,700,543 |
| Global Energy Solutions Fund | Global Water Fund | |||
| Six Months Ended March 31,2021 (Unaudited) | Year Ended September 30, 2020 | Six Months Ended March 31,2021 (Unaudited) | Year Ended September 30, 2020 | |
| Increase (Decrease) in Net Assets | ||||
| From operations: | ||||
| Net investment income | $ 64,037 | $ 727,040 | $ 1,445,832 | $ 2,974,014 |
| Net realized gain | 13,594,244 | 8,877,835 | 19,229,825 | 5,551,449 |
| Net change in unrealized appreciation (depreciation) | 25,272,002 | 19,963,491 | 83,024,886 | 11,179,783 |
| Net increase in net assets from operations | $ 38,930,283 | $ 29,568,366 | $103,700,543 | $ 19,705,246 |
| Distributions to shareholders: | ||||
| Class A | $ (576,225) | $ (529,616) | $ (1,611,609) | $ (1,611,283) |
| Class C | (12,463) | (26,519) | (12,508) | (108,693) |
| Class I | (567,285) | (359,921) | (2,142,987) | (2,089,882) |
| Total distributions to shareholders | $ (1,155,973) | $ (916,056) | $ (3,767,104) | $ (3,809,858) |
| Capital share transactions: | ||||
| Class A | $ 10,787,944 | $ (1,151,504) | $ 1,429,688 | $ (7,542,026) |
| Class C | 166,199 | (956,642) | (6,937,404) | (12,448,296) |
| Class I | 42,185,691 | 11,184,843 | 12,826,533 | 2,202,758 |
| Net increase (decrease) in net assets from capital share transactions | $ 53,139,834 | $ 9,076,697 | $ 7,318,817 | $ (17,787,564) |
| Net increase (decrease) in net assets | $ 90,914,144 | $ 37,729,007 | $107,252,256 | $ (1,892,176) |
| Net Assets | ||||
| At beginning of period | $ 115,944,356 | $ 78,215,349 | $ 409,455,056 | $ 411,347,232 |
| At end of period | $206,858,500 | $115,944,356 | $516,707,312 | $409,455,056 |
| Global Energy Solutions Fund — Class A | ||||||
| Six Months Ended March 31, 2021 (Unaudited) | Year Ended September 30, | |||||
| 2020 | 2019 | 2018 | 2017 | 2016 | ||
| Net asset value — Beginning of period | $ 9.54 | $ 7.08 | $ 6.95 | $ 7.23 | $ 6.23 | $ 5.76 |
| Income (Loss) From Operations | ||||||
| Net investment income(1) | $ (—)(2) | $ 0.06 | $ 0.08 | $ 0.10 | $ 0.08 | $ 0.08(3) |
| Net realized and unrealized gain (loss) | 3.20 | 2.48 | 0.15 | (0.29) | 0.98 | 0.40 |
| Total income (loss) from operations | $ 3.20 | $ 2.54 | $ 0.23 | $ (0.19) | $ 1.06 | $ 0.48 |
| Less Distributions | ||||||
| From net investment income | $ (0.08) | $ (0.08) | $ (0.10) | $ (0.09) | $ (0.06) | $ (0.01) |
| Total distributions | $ (0.08) | $ (0.08) | $ (0.10) | $ (0.09) | $ (0.06) | $ (0.01) |
| Net asset value — End of period | $ 12.66 | $ 9.54 | $ 7.08 | $ 6.95 | $ 7.23 | $ 6.23 |
| Total Return(4) | 33.63% (5) | 36.12% | 3.60% | (2.73)% | 17.28% | 8.38% |
| Ratios/Supplemental Data | ||||||
| Net assets, end of period (000’s omitted) | $94,127 | $62,428 | $47,596 | $51,502 | $58,695 | $70,317 |
| Ratios (as a percentage of average daily net assets):(6) | ||||||
| Total expenses | 1.41% (7) | 1.54% | 1.72% | 1.69% | 1.94% | 2.06% |
| Net expenses | 1.24% (7) | 1.24% | 1.26% | 1.28% | 1.38% | 1.85% |
| Net investment income (loss) | (0.01)% (7) | 0.76% | 1.27% | 1.34% | 1.26% | 1.33% (3) |
| Portfolio Turnover | 20% (5) | 45% | 40% | 38% | 133% | 89% |
| (1) | Computed using average shares outstanding. |
| (2) | Amount is less than $(0.005). |
| (3) | Amount includes a non-recurring refund for overbilling of prior years' custody out-of-pocket fees. This amounted to $0.005 per share and 0.08% of average net assets. |
| (4) | Returns are historical and are calculated by determining the percentage change in net asset value with all distributions reinvested and do not reflect the effect of sales charges, if any. |
| (5) | Not annualized. |
| (6) | Total expenses do not reflect amounts reimbursed and/or waived by the adviser and certain of its affiliates, if applicable. Net expenses are net of all reductions and represent the net expenses paid by the Fund. |
| (7) | Annualized. |
| Global Energy Solutions Fund — Class C | ||||||
| Six Months Ended March 31, 2021 (Unaudited) | Year Ended September 30, | |||||
| 2020 | 2019 | 2018 | 2017 | 2016 | ||
| Net asset value — Beginning of period | $ 8.92 | $ 6.63 | $ 6.50 | $ 6.76 | $ 5.82 | $ 5.42 |
| Income (Loss) From Operations | ||||||
| Net investment income (loss)(1) | $ (0.04) | $ (—)(2) | $ 0.02 | $ 0.04 | $ 0.03 | $ 0.03(3) |
| Net realized and unrealized gain (loss) | 3.00 | 2.32 | 0.16 | (0.26) | 0.92 | 0.37 |
| Total income (loss) from operations | $ 2.96 | $ 2.32 | $ 0.18 | $ (0.22) | $ 0.95 | $ 0.40 |
| Less Distributions | ||||||
| From net investment income | $ (0.02) | $ (0.03) | $ (0.05) | $ (0.04) | $ (0.01) | $ — |
| Total distributions | $ (0.02) | $ (0.03) | $ (0.05) | $ (0.04) | $ (0.01) | $ — |
| Net asset value — End of period | $ 11.86 | $ 8.92 | $ 6.63 | $ 6.50 | $ 6.76 | $ 5.82 |
| Total Return(4) | 33.14% (5) | 35.03% | 2.85% | (3.31)% | 16.38% | 7.38% |
| Ratios/Supplemental Data | ||||||
| Net assets, end of period (000’s omitted) | $10,459 | $ 7,841 | $6,752 | $9,996 | $11,938 | $13,213 |
| Ratios (as a percentage of average daily net assets):(6) | ||||||
| Total expenses | 2.16% (7) | 2.29% | 2.48% | 2.44% | 2.78% | 2.87% |
| Net expenses | 1.99% (7) | 1.99% | 2.01% | 2.03% | 2.13% | 2.69% |
| Net investment income (loss) | (0.77)% (7) | (0.01)% | 0.38% | 0.59% | 0.55% | 0.45% (3) |
| Portfolio Turnover | 20% (5) | 45% | 40% | 38% | 133% | 89% |
| (1) | Computed using average shares outstanding. |
| (2) | Amount is less than $(0.005). |
| (3) | Amount includes a non-recurring refund for overbilling of prior years' custody out-of-pocket fees. This amounted to $0.004 per share and 0.07% of average net assets. |
| (4) | Returns are historical and are calculated by determining the percentage change in net asset value with all distributions reinvested and do not reflect the effect of sales charges, if any. |
| (5) | Not annualized. |
| (6) | Total expenses do not reflect amounts reimbursed and/or waived by the adviser and certain of its affiliates, if applicable. Net expenses are net of all reductions and represent the net expenses paid by the Fund. |
| (7) | Annualized. |
| Global Energy Solutions Fund — Class I | ||||||
| Six Months Ended March 31, 2021 (Unaudited) | Year Ended September 30, | |||||
| 2020 | 2019 | 2018 | 2017 | 2016 | ||
| Net asset value — Beginning of period | $ 9.70 | $ 7.20 | $ 7.07 | $ 7.34 | $ 6.35 | $ 5.88 |
| Income (Loss) From Operations | ||||||
| Net investment income(1) | $ 0.02 | $ 0.08 | $ 0.11 | $ 0.15 | $ 0.13 | $ 0.11(2) |
| Net realized and unrealized gain (loss) | 3.25 | 2.52 | 0.14 | (0.31) | 0.97 | 0.41 |
| Total income (loss) from operations | $ 3.27 | $ 2.60 | $ 0.25 | $ (0.16) | $ 1.10 | $ 0.52 |
| Less Distributions | ||||||
| From net investment income | $ (0.10) | $ (0.10) | $ (0.12) | $ (0.11) | $ (0.11) | $ (0.05) |
| Total distributions | $ (0.10) | $ (0.10) | $ (0.12) | $ (0.11) | $ (0.11) | $(0.05) |
| Net asset value — End of period | $ 12.87 | $ 9.70 | $ 7.20 | $ 7.07 | $ 7.34 | $ 6.35 |
| Total Return(3) | 33.82% (4) | 36.40% | 3.89% | (2.33)% | 17.66% | 8.76% |
| Ratios/Supplemental Data | ||||||
| Net assets, end of period (000’s omitted) | $102,272 | $45,676 | $23,867 | $19,178 | $ 5,503 | $ 910 |
| Ratios (as a percentage of average daily net assets):(5) | ||||||
| Total expenses | 1.15% (6) | 1.29% | 1.47% | 1.43% | 1.66% | 3.83% |
| Net expenses | 0.99% (6) | 0.99% | 0.98% | 0.93% | 0.97% | 1.40% |
| Net investment income | 0.28% (6) | 1.08% | 1.60% | 2.00% | 1.99% | 1.74% (2) |
| Portfolio Turnover | 20% (4) | 45% | 40% | 38% | 133% | 89% |
| (1) | Computed using average shares outstanding. |
| (2) | Amount includes a non-recurring refund for overbilling of prior years' custody out-of-pocket fees. This amounted to $0.006 per share and 0.09% of average net assets. |
| (3) | Returns are historical and are calculated by determining the percentage change in net asset value with all distributions reinvested and do not reflect the effect of sales charges, if any. |
| (4) | Not annualized. |
| (5) | Total expenses do not reflect amounts reimbursed and/or waived by the adviser and certain of its affiliates, if applicable. Net expenses are net of all reductions and represent the net expenses paid by the Fund. |
| (6) | Annualized. |
| Global Water Fund — Class A | ||||||
| Six Months Ended March 31, 2021 (Unaudited) | Year Ended September 30, | |||||
| 2020 | 2019 | 2018 | 2017 | 2016 | ||
| Net asset value — Beginning of period | $ 21.67 | $ 20.70 | $ 20.00 | $ 19.92 | $ 17.71 | $ 14.87 |
| Income (Loss) From Operations | ||||||
| Net investment income(1) | $ 0.07 | $ 0.14 | $ 0.23 | $ 0.23 | $ 0.20 | $ 0.03(2) |
| Net realized and unrealized gain | 5.43 | 1.02 | 0.70 | 0.04 | 2.01 | 2.81 |
| Total income from operations | $ 5.50 | $ 1.16 | $ 0.93 | $ 0.27 | $ 2.21 | $ 2.84 |
| Less Distributions | ||||||
| From net investment income | $ (0.19) | $ (0.19) | $ (0.23) | $ (0.19) | $ — | $ —(3) |
| Total distributions | $ (0.19) | $ (0.19) | $ (0.23) | $ (0.19) | $ — | $ —(3) |
| Net asset value — End of period | $ 26.98 | $ 21.67 | $ 20.70 | $ 20.00 | $ 19.92 | $ 17.71 |
| Total Return(4) | 25.47% (5) | 5.57% | 4.86% | 1.34% | 12.48% | 19.13% |
| Ratios/Supplemental Data | ||||||
| Net assets, end of period (000’s omitted) | $226,628 | $180,956 | $181,139 | $201,243 | $235,266 | $278,517 |
| Ratios (as a percentage of average daily net assets):(6) | ||||||
| Total expenses | 1.31% (7) | 1.34% | 1.38% | 1.39% | 1.46% | 1.63% |
| Net expenses | 1.24% (7) | 1.24% | 1.25% | 1.28% | 1.28% | 1.51% |
| Net investment income | 0.56% (7) | 0.70% | 1.17% | 1.14% | 1.11% | 0.22% (2) |
| Portfolio Turnover | 15% (5) | 35% | 28% | 40% | 34% | 103% |
| (1) | Computed using average shares outstanding. |
| (2) | Amount includes a non-recurring refund for overbilling of prior years' custody out-of-pocket fees. This amounted to $0.002 per share and 0.01% of average net assets. |
| (3) | Amount is less than $0.005. |
| (4) | Returns are historical and are calculated by determining the percentage change in net asset value with all distributions reinvested and do not reflect the effect of sales charges, if any. |
| (5) | Not annualized. |
| (6) | Total expenses do not reflect amounts reimbursed and/or waived by the adviser and certain of its affiliates, if applicable. Net expenses are net of all reductions and represent the net expenses paid by the Fund. |
| (7) | Annualized. |
| Global Water Fund — Class C | ||||||
| Six Months Ended March 31, 2021 (Unaudited) | Year Ended September 30, | |||||
| 2020 | 2019 | 2018 | 2017 | 2016 | ||
| Net asset value — Beginning of period | $ 19.84 | $ 18.98 | $ 18.32 | $ 18.28 | $ 16.37 | $ 13.84 |
| Income (Loss) From Operations | ||||||
| Net investment income (loss)(1) | $ (0.02) | $ (0.02) | $ 0.08 | $ 0.07 | $ 0.07 | $ (0.08)(2) |
| Net realized and unrealized gain | 4.98 | 0.92 | 0.66 | 0.03 | 1.84 | 2.61 |
| Total income from operations | $ 4.96 | $ 0.90 | $ 0.74 | $ 0.10 | $ 1.91 | $ 2.53 |
| Less Distributions | ||||||
| From net investment income | $ (0.01) | $ (0.04) | $ (0.08) | $ (0.06) | $ — | $ — |
| Total distributions | $ (0.01) | $ (0.04) | $ (0.08) | $ (0.06) | $ — | $ — |
| Net asset value — End of period | $ 24.79 | $ 19.84 | $ 18.98 | $ 18.32 | $ 18.28 | $ 16.37 |
| Total Return(3) | 24.99% (4) | 4.75% | 4.08% | 0.61% | 11.67% | 18.28% |
| Ratios/Supplemental Data | ||||||
| Net assets, end of period (000’s omitted) | $41,621 | $39,358 | $50,369 | $58,455 | $67,096 | $71,334 |
| Ratios (as a percentage of average daily net assets):(5) | ||||||
| Total expenses | 2.06% (6) | 2.09% | 2.13% | 2.14% | 2.17% | 2.35% |
| Net expenses | 1.99% (6) | 1.99% | 2.01% | 2.03% | 2.03% | 2.25% |
| Net investment income (loss) | (0.20)% (6) | (0.08)% | 0.43% | 0.40% | 0.41% | (0.52)% (2) |
| Portfolio Turnover | 15% (4) | 35% | 28% | 40% | 34% | 103% |
| (1) | Computed using average shares outstanding. |
| (2) | Amount includes a non-recurring refund for overbilling of prior years' custody out-of-pocket fees. This amounted to $0.002 per share and 0.01% of average net assets. |
| (3) | Returns are historical and are calculated by determining the percentage change in net asset value with all distributions reinvested and do not reflect the effect of sales charges, if any. |
| (4) | Not annualized. |
| (5) | Total expenses do not reflect amounts reimbursed and/or waived by the adviser and certain of its affiliates, if applicable. Net expenses are net of all reductions and represent the net expenses paid by the Fund. |
| (6) | Annualized. |
| Global Water Fund — Class I | ||||||
| Six Months Ended March 31, 2021 (Unaudited) | Year Ended September 30, | |||||
| 2020 | 2019 | 2018 | 2017 | 2016 | ||
| Net asset value — Beginning of period | $ 21.83 | $ 20.85 | $ 20.15 | $ 20.08 | $ 17.79 | $ 15.02 |
| Income (Loss) From Operations | ||||||
| Net investment income(1) | $ 0.10 | $ 0.20 | $ 0.29 | $ 0.36 | $ 0.30 | $ 0.13(2) |
| Net realized and unrealized gain (loss) | 5.48 | 1.02 | 0.70 | (0.02) | 1.99 | 2.80 |
| Total income from operations | $ 5.58 | $ 1.22 | $ 0.99 | $ 0.34 | $ 2.29 | $ 2.93 |
| Less Distributions | ||||||
| From net investment income | $ (0.25) | $ (0.24) | $ (0.29) | $ (0.27) | $ — | $ (0.16) |
| Total distributions | $ (0.25) | $ (0.24) | $ (0.29) | $ (0.27) | $ — | $ (0.16) |
| Net asset value — End of period | $ 27.16 | $ 21.83 | $ 20.85 | $ 20.15 | $ 20.08 | $17.79 |
| Total Return(3) | 25.64% (4) | 5.83% | 5.18% | 1.68% | 12.87% | 19.68% |
| Ratios/Supplemental Data | ||||||
| Net assets, end of period (000’s omitted) | $248,458 | $189,141 | $179,839 | $170,996 | $16,094 | $ 4,637 |
| Ratios (as a percentage of average daily net assets):(5) | ||||||
| Total expenses | 1.06% (6) | 1.09% | 1.13% | 1.14% | 1.12% | 1.56% |
| Net expenses | 0.99% (6) | 0.99% | 0.97% | 0.93% | 0.93% | 1.08% |
| Net investment income | 0.82% (6) | 0.97% | 1.48% | 1.78% | 1.61% | 0.80% (2) |
| Portfolio Turnover | 15% (4) | 35% | 28% | 40% | 34% | 103% |
| (1) | Computed using average shares outstanding. |
| (2) | Amount includes a non-recurring refund for overbilling of prior years' custody out-of-pocket fees. This amounted to $0.003 per share and 0.02% of average net assets. |
| (3) | Returns are historical and are calculated by determining the percentage change in net asset value with all distributions reinvested and do not reflect the effect of sales charges, if any. |
| (4) | Not annualized. |
| (5) | Total expenses do not reflect amounts reimbursed and/or waived by the adviser and certain of its affiliates, if applicable. Net expenses are net of all reductions and represent the net expenses paid by the Fund. |
| (6) | Annualized. |
| Asset Description | Level 1 | Level 2 | Level 3 | Total |
| Common Stocks | ||||
| Australia | $ — | $ 1,209,776 | $ — | $ 1,209,776 |
| Austria | — | 1,262,176 | — | 1,262,176 |
| Belgium | — | 2,429,681 | — | 2,429,681 |
| Brazil | 2,025,845 | — | — | 2,025,845 |
| Canada | 7,659,306 | — | — | 7,659,306 |
| China | — | 9,667,788 | — | 9,667,788 |
| Denmark | — | 5,555,393 | — | 5,555,393 |
| Finland | — | 1,940,883 | — | 1,940,883 |
| France | — | 10,271,784 | — | 10,271,784 |
| Germany | — | 17,384,553 | — | 17,384,553 |
| Greece | — | 1,026,724 | — | 1,026,724 |
| Ireland | — | 2,643,328 | — | 2,643,328 |
| Italy | — | 6,467,359 | — | 6,467,359 |
| Japan | — | 15,483,899 | — | 15,483,899 |
| Netherlands | — | 1,373,626 | — | 1,373,626 |
| New Zealand | — | 3,688,653 | — | 3,688,653 |
| Norway | — | 2,581,722 | — | 2,581,722 |
| Portugal | — | 1,235,314 | — | 1,235,314 |
| Singapore | 890,402 | 1,191,902 | — | 2,082,304 |
| South Korea | — | 4,314,045 | — | 4,314,045 |
| Spain | 1,210,731 | 7,149,193 | — | 8,359,924 |
| Sweden | — | 2,321,758 | — | 2,321,758 |
| Switzerland | — | 4,439,887 | — | 4,439,887 |
| Asset Description | Level 1 | Level 2 | Level 3 | Total |
| Taiwan | $ — | $ 12,022,419 | $ — | $ 12,022,419 |
| Thailand | — | 3,070,735 | — | 3,070,735 |
| United Kingdom | 1,271,555 | 6,974,068 | — | 8,245,623 |
| United States | 65,972,441 | — | — | 65,972,441 |
| Total Common Stocks | $79,030,280 | 125,706,666 (1) | $ — | $204,736,946 |
| High Social Impact Investments | $ — | $ 300,157 | $ — | $ 300,157 |
| Rights | — | 177 | — | 177 |
| Warrants | 22,579 | — | — | 22,579 |
| Short-Term Investments: | ||||
| Other | — | 814,668 | — | 814,668 |
| Securities Lending Collateral | 1,083,996 | — | — | 1,083,996 |
| Total Investments | $80,136,855 | $126,821,668 | $ — | $206,958,523 |
| (1) | Includes foreign equity securities whose values were adjusted to reflect market trading of comparable securities or other correlated instruments that occurred after the close of trading in their applicable foreign markets. |
| Asset Description | Level 1 | Level 2 | Level 3(1) | Total |
| Common Stocks | ||||
| Australia | $ — | $ 11,936,928 | $ — | $ 11,936,928 |
| Brazil | 16,576,081 | — | — | 16,576,081 |
| Canada | 7,502,282 | — | — | 7,502,282 |
| Chile | — | 9,530,967 | — | 9,530,967 |
| China | — | 23,244,325 | — | 23,244,325 |
| Denmark | — | 2,598,883 | — | 2,598,883 |
| Finland | — | 9,090,243 | — | 9,090,243 |
| France | — | 21,354,197 | — | 21,354,197 |
| Germany | — | 5,627,621 | — | 5,627,621 |
| Italy | — | 8,364,977 | — | 8,364,977 |
| Japan | — | 49,079,141 | — | 49,079,141 |
| Netherlands | — | 7,061,545 | — | 7,061,545 |
| Singapore | — | 2,218,460 | 0 | 2,218,460 |
| South Korea | — | 4,780,113 | — | 4,780,113 |
| Spain | — | 5,245,992 | — | 5,245,992 |
| Switzerland | — | 22,747,864 | — | 22,747,864 |
| Taiwan | — | 3,354,603 | — | 3,354,603 |
| Thailand | — | 8,260,374 | — | 8,260,374 |
| United Kingdom | 2,578,004 | 42,023,880 | — | 44,601,884 |
| United States | 249,705,921 | — | — | 249,705,921 |
| Total Common Stocks | $276,362,288 | $236,520,113 (2) | $ 0 | $512,882,401 |
| High Social Impact Investments | $ — | $ 1,180,772 | $ — | $ 1,180,772 |
| Asset Description | Level 1 | Level 2 | Level 3(1) | Total |
| Short-Term Investments: | ||||
| Other | $ — | $ 1,147,405 | $ — | $ 1,147,405 |
| Securities Lending Collateral | 10,217,434 | — | — | 10,217,434 |
| Total Investments | $286,579,722 | $238,848,290 | $ 0 | $525,428,012 |
| (1) | None of the unobservable inputs for Level 3 assets, individually or collectively, had a material impact on the Fund. |
| (2) | Includes foreign equity securities whose values were adjusted to reflect market trading of comparable securities or other correlated instruments that occurred after the close of trading in their applicable foreign markets. |
| Global Energy Solutions | Global Water | |
| Class A | $ 16 | $ 78 |
| Class C | 240 | 530 |
| Global Energy Solutions | Global Water | |
| Purchases | $82,989,504 | $74,985,387 |
| Sales | 32,073,800 | 70,764,702 |
| Global Energy Solutions | Global Water | |
| Deferred capital losses: | ||
| Short-term | $ — | $16,661,603 |
| Long-term | 67,682,110 | 22,136,192 |
| Global Energy Solutions | Global Water | |
| Aggregate cost | $157,426,391 | $378,728,928 |
| Gross unrealized appreciation | $ 50,720,704 | $ 163,872,531 |
| Gross unrealized depreciation | (1,188,572) | (17,173,447) |
| Net unrealized appreciation | $ 49,532,132 | $146,699,084 |
| Global Energy Solutions | Global Water | |
| Securities on Loan | $ 3,411,497 | $ 15,456,160 |
| Collateral Received: | ||
| Cash | 1,083,996 | 10,217,434 |
| U.S. government and/or agencies securities | 2,522,468 | 5,972,030 |
| Total Collateral Received | $3,606,464 | $16,189,464 |
| Global Energy Solutions | Remaining Contractual Maturity of the Transactions | ||||
| Overnight and Continuous | <30 days | 30 to 90 days | >90 days | Total | |
| Common Stocks | $1,083,996 | $ — | $ — | $ — | $1,083,996 |
| Global Water | Remaining Contractual Maturity of the Transactions | ||||
| Overnight and Continuous | <30 days | 30 to 90 days | >90 days | Total | |
| Common Stocks | $10,217,434 | $ — | $ — | $ — | $10,217,434 |
| Name | Value, beginning of period | Purchases | Sales proceeds | Net realized gain (loss) | Change in unrealized appreciation (depreciation) | Value, end of period | Interest/ Dividend income | Principal amount/Units, end of period |
| High Social Impact Investments | ||||||||
| Calvert Impact Capital, Inc., Community Investment Notes, 1.50%, 12/15/20(1) | $ 262,231 | $ — | $ (263,568) | $ — | $ 1,337 | $ — | $ 824 | $ — |
| Calvert Impact Capital, Inc., Community Investment Notes, 1.50%, 12/15/23(1) | — | 200,000 | — | — | (5,766) | 194,234 | 883 | 200,000 |
| Short-Term Investments | ||||||||
| Calvert Cash Reserves Fund, LLC | 258,630 | 23,874,284 | (23,318,246) | (12) | 12 | 814,668 | 563 | 814,587 |
| Totals | $ (12) | $ (4,417) | $1,008,902 | $2,270 |
| (1) | Restricted security. |
| Name | Value, beginning of period | Purchases | Sales proceeds | Net realized gain (loss) | Change in unrealized appreciation (depreciation) | Value, end of period | Interest/ Dividend income | Principal amount/Units, end of period |
| High Social Impact Investments | ||||||||
| Calvert Impact Capital, Inc., Community Investment Notes, 1.50%, 12/15/20(1) | $1,317,403 | $ — | $ (1,324,116) | $ — | $ 6,713 | $ — | $ 4,138 | $ — |
| Calvert Impact Capital, Inc., Community Investment Notes, 1.50%, 12/15/23(1) | — | 630,000 | — | — | (18,163) | 611,837 | 2,782 | 630,000 |
| Short-Term Investments | ||||||||
| Calvert Cash Reserves Fund, LLC | 1,005,664 | 17,214,745 | (17,073,004) | (101) | 101 | 1,147,405 | 540 | 1,147,290 |
| Totals | $(101) | $ (11,349) | $1,759,242 | $7,460 |
| (1) | Restricted security. |
| Six Months Ended March 31, 2021 (Unaudited) | Year Ended September 30, 2020 | ||||
| Shares | Amount | Shares | Amount | ||
| Class A | |||||
| Shares sold | 1,535,975 | $ 19,032,032 | 754,608 | $ 5,816,261 | |
| Reinvestment of distributions | 44,331 | 530,636 | 63,936 | 495,506 | |
| Shares redeemed | (785,026) | (9,822,988) | (1,071,928) | (8,061,751) | |
| Converted from Class C | 94,827 | 1,048,264 | 79,273 | 598,480 | |
| Net increase (decrease) | 890,107 | $ 10,787,944 | (174,111) | $ (1,151,504) | |
| Class C | |||||
| Shares sold | 201,057 | $ 2,360,799 | 118,738 | $ 859,345 | |
| Reinvestment of distributions | 1,094 | 12,290 | 3,456 | 25,163 | |
| Shares redeemed | (97,800) | (1,158,626) | (176,751) | (1,242,670) | |
| Converted to Class A | (101,561) | (1,048,264) | (84,574) | (598,480) | |
| Net increase (decrease) | 2,790 | $ 166,199 | (139,131) | $ (956,642) | |
| Class I | |||||
| Shares sold | 4,469,237 | $ 57,808,494 | 2,478,591 | $ 19,373,804 | |
| Reinvestment of distributions | 46,193 | 561,712 | 44,987 | 353,601 | |
| Shares redeemed | (1,277,510) | (16,184,515) | (1,128,620) | (8,542,562) | |
| Net increase | 3,237,920 | $ 42,185,691 | 1,394,958 | $11,184,843 | |
| Six Months Ended March 31, 2021 (Unaudited) | Year Ended September 30, 2020 | ||||
| Shares | Amount | Shares | Amount | ||
| Class A | |||||
| Shares sold | 537,509 | $ 13,628,659 | 1,009,457 | $ 20,886,003 | |
| Reinvestment of distributions | 58,166 | 1,458,802 | 67,917 | 1,499,614 | |
| Shares redeemed | (686,892) | (17,179,495) | (1,566,924) | (31,683,730) | |
| Converted from Class C | 141,692 | 3,521,722 | 88,411 | 1,756,087 | |
| Net increase (decrease) | 50,475 | $ 1,429,688 | (401,139) | $ (7,542,026) | |
| Class C | |||||
| Shares sold | 90,942 | $ 2,135,861 | 165,165 | $ 3,190,157 | |
| Reinvestment of distributions | 497 | 11,475 | 4,561 | 92,739 | |
| Shares redeemed | (241,542) | (5,563,018) | (744,118) | (13,975,105) | |
| Converted to Class A | (154,587) | (3,521,722) | (96,329) | (1,756,087) | |
| Net decrease | (304,690) | $ (6,937,404) | (670,721) | $(12,448,296) | |
| Class I | |||||
| Shares sold | 1,159,735 | $ 29,597,229 | 2,263,617 | $ 46,188,116 | |
| Reinvestment of distributions | 77,478 | 1,954,775 | 81,579 | 1,811,063 | |
| Shares redeemed | (751,691) | (18,725,471) | (2,308,016) | (45,796,421) | |
| Net increase | 485,522 | $ 12,826,533 | 37,180 | $ 2,202,758 | |
| Number of Shares(1) | ||||
| For | Against | Abstain (2) | Broker Non-Votes(2) | |
| Calvert Global Energy Solutions Fund | 6,162,072.948 | 173,240.088 | 627,741.898 | 0 |
| Calvert Global Water Fund | 9,460,532.116 | 181,951.057 | 677,630.546 | 0 |
| Fund | Investment Adviser | Investment Sub-Adviser |
| Calvert Global Energy Solutions Fund | Calvert Research and Management | None |
| Fund | Investment Adviser | Investment Sub-Adviser |
| Calvert Global Water Fund | Calvert Research and Management | None |
| Officers |
| Hope L. Brown Chief Compliance Officer |
| Maureen A. Gemma Vice President, Secretary and Chief Legal Officer |
| James F. Kirchner Treasurer |
| Directors |
| Alice Gresham Bullock Chairperson |
| Richard L. Baird, Jr. |
| Cari M. Dominguez |
| John G. Guffey, Jr. |
| Miles D. Harper, III |
| Joy V. Jones |
| John H. Streur* |
| Anthony A. Williams |
| *Interested Director and President |
| Privacy Notice | April 2021 |
| FACTS | WHAT DOES EATON VANCE DO WITH YOUR PERSONAL INFORMATION? |
| Why? | Financial companies choose how they share your personal information. Federal law gives consumers the right to limit some but not all sharing. Federal law also requires us to tell you how we collect, share, and protect your personal information. Please read this notice carefully to understand what we do. |
| What? | The types of personal information we collect and share depend on the product or service you have with us. This information can include:■ Social Security number and income ■ investment experience and risk tolerance ■ checking account number and wire transfer instructions |
| How? | All financial companies need to share customers’ personal information to run their everyday business. In the section below, we list the reasons financial companies can share their customers’ personal information; the reasons Eaton Vance chooses to share; and whether you can limit this sharing. |
| Reasons we can share your personal information | Does Eaton Vance share? | Can you limit this sharing? |
| For our everyday business purposes — such as to process your transactions, maintain your account(s), respond to court orders and legal investigations, or report to credit bureaus | Yes | No |
| For our marketing purposes — to offer our products and services to you | Yes | No |
| For joint marketing with other financial companies | No | We don’t share |
| For our investment management affiliates’ everyday business purposes — information about your transactions, experiences, and creditworthiness | Yes | Yes |
| For our affiliates’ everyday business purposes — information about your transactions and experiences | Yes | No |
| For our affiliates’ everyday business purposes — information about your creditworthiness | No | We don’t share |
| For our investment management affiliates to market to you | Yes | Yes |
| For our affiliates to market to you | No | We don’t share |
| For nonaffiliates to market to you | No | We don’t share |
| To limit our sharing | Call toll-free 1-800-368-2745 or email: CRMPrivacy@calvert.comPlease note:If you are a new customer, we can begin sharing your information 30 days from the date we sent this notice. When you are no longer our customer, we continue to share your information as described in this notice. However, you can contact us at any time to limit our sharing. |
| Questions? | Call toll-free 1-800-368-2745 or email: CRMPrivacy@calvert.com |
| Privacy Notice — continued | April 2021 |
| Who we are | |
| Who is providing this notice? | Eaton Vance Management, Eaton Vance Distributors, Inc., Eaton Vance Trust Company, Eaton Vance Management (International) Limited, Eaton Vance Advisers International Ltd., Eaton Vance Global Advisors Limited, Eaton Vance Management’s Real Estate Investment Group, Boston Management and Research, Calvert Research and Management, Eaton Vance and Calvert Fund Families and our investment advisory affiliates (“Eaton Vance”) (see Investment Management Affiliates definition below) |
| What we do | |
| How does Eaton Vance protect my personal information? | To protect your personal information from unauthorized access and use, we use security measures that comply with federal law. These measures include computer safeguards and secured files and buildings. We have policies governing the proper handling of customer information by personnel and requiring third parties that provide support to adhere to appropriate security standards with respect to such information. |
| How does Eaton Vance collect my personal information? | We collect your personal information, for example, when you■ open an account or make deposits or withdrawals from your account ■ buy securities from us or make a wire transfer ■ give us your contact informationWe also collect your personal information from others, such as credit bureaus, affiliates, or other companies. |
| Why can’t I limit all sharing? | Federal law gives you the right to limit only■ sharing for affiliates’ everyday business purposes — information about your creditworthiness ■ affiliates from using your information to market to you ■ sharing for nonaffiliates to market to youState laws and individual companies may give you additional rights to limit sharing. See below for more on your rights under state law. |
| Definitions | |
| Investment Management Affiliates | Eaton Vance Investment Management Affiliates include registered investment advisers, registered broker- dealers, and registered and unregistered funds. Investment Management Affiliates does not include entities associated with Morgan Stanley Wealth Management, such as Morgan Stanley Smith Barney LLC and Morgan Stanley & Co. |
| Affiliates | Companies related by common ownership or control. They can be financial and nonfinancial companies.■ Our affiliates include companies with a Morgan Stanley name and financial companies such as Morgan Stanley Smith Barney LLC and Morgan Stanley & Co. |
| Nonaffiliates | Companies not related by common ownership or control. They can be financial and nonfinancial companies.■ Eaton Vance does not share with nonaffiliates so they can market to you. |
| Joint marketing | A formal agreement between nonaffiliated financial companies that together market financial products or services to you.■ Eaton Vance doesn’t jointly market. |
| Other important information | |
| Vermont: Except as permitted by law, we will not share personal information we collect about Vermont residents with Nonaffiliates unless you provide us with your written consent to share such information.California: Except as permitted by law, we will not share personal information we collect about California residents with Nonaffiliates and we will limit sharing such personal information with our Affiliates to comply with California privacy laws that apply to us. | |


| % Average Annual Total Returns1,2 | Class Inception Date | Performance Inception Date | Six Months | One Year | Five Years | Ten Years |
| Class A at NAV | 10/01/2004 | 10/01/2004 | 36.34% | 65.27% | 14.64% | 11.71% |
| Class A with 4.75% Maximum Sales Charge | — | — | 29.88 | 57.45 | 13.53 | 11.17 |
| Class C at NAV | 04/01/2005 | 10/01/2004 | 35.82 | 64.07 | 13.79 | 10.83 |
| Class C with 1% Maximum Sales Charge | — | — | 34.82 | 63.07 | 13.79 | 10.83 |
| Class I at NAV | 04/29/2005 | 10/01/2004 | 36.50 | 65.68 | 15.04 | 12.26 |
| Class R6 at NAV | 02/01/2019 | 10/01/2004 | 36.52 | 65.77 | 15.06 | 12.27 |
| Russell 2000® Index | — | — | 48.05% | 94.85% | 16.34% | 11.67% |
| % Total Annual Operating Expense Ratios3 | Class A | Class C | Class I | Class R6 |
| Gross | 1.22% | 1.97% | 0.97% | 0.91% |
| Net | 1.21 | 1.96 | 0.96 | 0.90 |
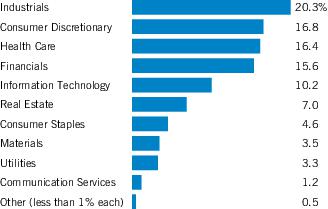
| Top 10 Holdings (% of net assets)* | |
| AZEK Co., Inc. (The) | 2.5% |
| Minerals Technologies, Inc. | 2.3 |
| National Vision Holdings, Inc. | 2.3 |
| ACI Worldwide, Inc. | 2.2 |
| Performance Food Group Co. | 2.2 |
| Mueller Water Products, Inc., Class A | 2.2 |
| Terminix Global Holdings, Inc. | 2.1 |
| Pinnacle Financial Partners, Inc. | 2.0 |
| Community Bank System, Inc. | 2.0 |
| Chemed Corp. | 2.0 |
| Total | 21.8% |
| * | Excludes cash and cash equivalents. |
| 1 | Russell 2000® Index is an unmanaged index of 2,000 U.S. small-cap stocks. Unless otherwise stated, index returns do not reflect the effect of any applicable sales charges, commissions, expenses, taxes or leverage, as applicable. It is not possible to invest directly in an index. |
| 2 | Total Returns at NAV do not include applicable sales charges. If sales charges were deducted, the returns would be lower. Total Returns shown with maximum sales charge reflect the stated maximum sales charge. Unless otherwise stated, performance does not reflect the deduction of taxes on Fund distributions or redemptions of Fund shares.Performance prior to the inception date of a class may be linked to the performance of an older class of the Fund. This linked performance is adjusted for any applicable sales charge, but is not adjusted for class expense differences. If adjusted for such differences, the performance would be different. The performance of Class R6 is linked to Class I. Performance presented in the Financial Highlights included in the financial statements is not linked.Calvert Research and Management became the investment adviser to the Fund on December 31, 2016. Performance reflected prior to such date is that of the Fund’s former investment adviser. |
| 3 | Source: Fund prospectus. Net expense ratios reflect a contractual expense reimbursement that continues through 1/31/22. Without the reimbursement, performance would have been lower. The expense ratios for the current reporting period can be found in the Financial Highlights section of this report. |
| Fund profile subject to change due to active management. |
| Beginning Account Value (10/1/20) | Ending Account Value (3/31/21) | Expenses Paid During Period* (10/1/20 – 3/31/21) | Annualized Expense Ratio | |
| Actual | ||||
| Class A | $1,000.00 | $1,363.40 | $ 6.95 | 1.18% |
| Class C | $1,000.00 | $1,358.20 | $11.35 | 1.93% |
| Class I | $1,000.00 | $1,365.00 | $ 5.48 | 0.93% |
| Class R6 | $1,000.00 | $1,365.20 | $ 5.13 | 0.87% |
| Hypothetical | ||||
| (5% return per year before expenses) | ||||
| Class A | $1,000.00 | $1,019.05 | $ 5.94 | 1.18% |
| Class C | $1,000.00 | $1,015.31 | $ 9.70 | 1.93% |
| Class I | $1,000.00 | $1,020.29 | $ 4.68 | 0.93% |
| Class R6 | $1,000.00 | $1,020.59 | $ 4.38 | 0.87% |
| * | Expenses are equal to the Fund's annualized expense ratio for the indicated Class, multiplied by the average account value over the period, multiplied by 182/365 (to reflect the one-half year period). The Example assumes that the $1,000 was invested at the net asset value per share determined at the close of business on September 30, 2020. |
| Common Stocks — 99.3% |
| Security | Shares | Value | |
| Aerospace & Defense — 2.3% | |||
| Hexcel Corp. | 380,474 | $ 21,306,544 | |
| Mercury Systems, Inc.(1) | 533,122 | 37,665,069 | |
| $ 58,971,613 | |||
| Auto Components — 4.1% | |||
| Dana, Inc. | 1,451,087 | $ 35,304,947 | |
| Dorman Products, Inc.(1) | 428,033 | 43,933,307 | |
| Visteon Corp.(1) | 187,423 | 22,856,235 | |
| $ 102,094,489 | |||
| Banks — 10.8% | |||
| Commerce Bancshares, Inc. | 547,305 | $ 41,929,036 | |
| Community Bank System, Inc. | 652,276 | 50,042,615 | |
| First Citizens Bancshares, Inc., Class A | 17,822 | 14,895,093 | |
| Glacier Bancorp, Inc. | 479,209 | 27,353,250 | |
| Independent Bank Corp. | 358,739 | 30,202,236 | |
| Pinnacle Financial Partners, Inc. | 573,777 | 50,871,069 | |
| South State Corp. | 602,415 | 47,295,601 | |
| Stock Yards Bancorp, Inc. | 180,745 | 9,228,840 | |
| $ 271,817,740 | |||
| Biotechnology — 1.3% | |||
| Emergent BioSolutions, Inc.(1) | 342,821 | $ 31,851,499 | |
| $ 31,851,499 | |||
| Building Products — 4.3% | |||
| AZEK Co., Inc. (The)(1) | 1,513,710 | $ 63,651,505 | |
| CSW Industrials, Inc. | 318,595 | 43,010,325 | |
| $ 106,661,830 | |||
| Capital Markets — 1.2% | |||
| Cohen & Steers, Inc. | 450,278 | $ 29,416,662 | |
| $ 29,416,662 | |||
| Chemicals — 3.5% | |||
| Minerals Technologies, Inc. | 777,821 | $ 58,585,478 | |
| Sensient Technologies Corp. | 371,012 | 28,938,936 | |
| $ 87,524,414 | |||
| Commercial Services & Supplies — 2.8% | |||
| Casella Waste Systems, Inc., Class A(1) | 242,399 | $ 15,409,304 | |
| Herman Miller, Inc. | 713,132 | 29,345,382 | |
| Kimball International, Inc., Class B | 744,070 | 10,416,980 | |
| Security | Shares | Value | |
| Commercial Services & Supplies (continued) | |||
| Viad Corp. | 387,847 | $ 16,192,612 | |
| $ 71,364,278 | |||
| Diversified Consumer Services — 2.5% | |||
| Stride, Inc.(1) | 346,592 | $ 10,435,885 | |
| Terminix Global Holdings, Inc.(1) | 1,099,740 | 52,424,606 | |
| $ 62,860,491 | |||
| Electronic Equipment, Instruments & Components — 1.2% | |||
| National Instruments Corp. | 711,597 | $ 30,730,316 | |
| $ 30,730,316 | |||
| Energy Equipment & Services — 0.4% | |||
| Core Laboratories NV | 326,974 | $ 9,413,581 | |
| $ 9,413,581 | |||
| Equity Real Estate Investment Trusts (REITs) — 7.0% | |||
| CubeSmart | 1,101,276 | $ 41,661,271 | |
| EastGroup Properties, Inc. | 199,698 | 28,612,730 | |
| Essential Properties Realty Trust, Inc. | 1,753,296 | 40,027,748 | |
| Rexford Industrial Realty, Inc. | 493,745 | 24,884,748 | |
| STORE Capital Corp. | 1,205,342 | 40,378,957 | |
| $ 175,565,454 | |||
| Food & Staples Retailing — 2.7% | |||
| Chefs' Warehouse, Inc. (The)(1) | 475,336 | $ 14,478,734 | |
| Performance Food Group Co.(1) | 944,790 | 54,429,352 | |
| $ 68,908,086 | |||
| Food Products — 1.8% | |||
| J&J Snack Foods Corp. | 72,618 | $ 11,403,205 | |
| Nomad Foods, Ltd.(1) | 1,273,612 | 34,973,385 | |
| $ 46,376,590 | |||
| Gas Utilities — 1.6% | |||
| ONE Gas, Inc. | 519,314 | $ 39,940,440 | |
| $ 39,940,440 | |||
| Health Care Equipment & Supplies — 7.0% | |||
| Envista Holdings Corp.(1) | 975,218 | $ 39,788,894 | |
| Haemonetics Corp.(1) | 422,178 | 46,865,980 | |
| ICU Medical, Inc.(1) | 205,788 | 42,277,087 | |
| Integra LifeSciences Holdings Corp.(1) | 429,573 | 29,679,199 | |
| Tandem Diabetes Care, Inc.(1) | 191,514 | 16,901,110 | |
| $ 175,512,270 | |||
| Security | Shares | Value | |
| Health Care Providers & Services — 6.7% | |||
| Addus HomeCare Corp.(1) | 192,129 | $ 20,094,772 | |
| AMN Healthcare Services, Inc.(1) | 403,997 | 29,774,579 | |
| Apria, Inc.(1) | 485,052 | 13,547,502 | |
| Chemed Corp. | 106,457 | 48,951,058 | |
| LHC Group, Inc.(1) | 239,329 | 45,762,098 | |
| R1 RCM, Inc.(1) | 454,976 | 11,228,808 | |
| $ 169,358,817 | |||
| Health Care Technology — 1.4% | |||
| Inovalon Holdings, Inc., Class A(1) | 1,193,325 | $ 34,343,894 | |
| $ 34,343,894 | |||
| Hotels, Restaurants & Leisure — 2.1% | |||
| Choice Hotels International, Inc. | 289,191 | $ 31,027,302 | |
| Wyndham Hotels & Resorts, Inc. | 304,020 | 21,214,516 | |
| $ 52,241,818 | |||
| Household Durables — 1.4% | |||
| Tempur Sealy International, Inc. | 975,217 | $ 35,653,934 | |
| $ 35,653,934 | |||
| Independent Power and Renewable Electricity Producers — 0.5% | |||
| Sunnova Energy International, Inc.(1) | 321,407 | $ 13,119,834 | |
| $ 13,119,834 | |||
| Insurance — 3.6% | |||
| AMERISAFE, Inc. | 605,229 | $ 38,734,656 | |
| RLI Corp. | 178,985 | 19,969,356 | |
| Selective Insurance Group, Inc. | 443,118 | 32,143,780 | |
| $ 90,847,792 | |||
| Interactive Media & Services — 1.2% | |||
| CarGurus, Inc.(1) | 1,270,545 | $ 30,277,087 | |
| $ 30,277,087 | |||
| Leisure Products — 1.1% | |||
| Brunswick Corp. | 279,790 | $ 26,683,572 | |
| $ 26,683,572 | |||
| Machinery — 6.1% | |||
| Allison Transmission Holdings, Inc. | 732,564 | $ 29,910,588 | |
| Lydall, Inc.(1) | 310,668 | 10,481,938 | |
| Middleby Corp.(1) | 180,775 | 29,963,456 | |
| Mueller Water Products, Inc., Class A | 3,907,774 | 54,278,981 | |
| Woodward, Inc. | 228,334 | 27,543,931 | |
| $ 152,178,894 | |||
| Security | Shares | Value | |
| Professional Services — 1.8% | |||
| CBIZ, Inc.(1) | 1,375,635 | $ 44,928,239 | |
| $ 44,928,239 | |||
| Road & Rail — 1.6% | |||
| Landstar System, Inc. | 237,435 | $ 39,191,021 | |
| $ 39,191,021 | |||
| Semiconductors & Semiconductor Equipment — 2.3% | |||
| Ambarella, Inc.(1) | 238,308 | $ 23,923,740 | |
| Silicon Laboratories, Inc.(1) | 240,608 | 33,942,571 | |
| $ 57,866,311 | |||
| Software — 6.7% | |||
| ACI Worldwide, Inc.(1) | 1,447,741 | $ 55,086,545 | |
| Altair Engineering, Inc., Class A(1) | 247,001 | 15,454,853 | |
| CDK Global, Inc. | 653,555 | 35,331,183 | |
| Envestnet, Inc.(1) | 532,612 | 38,470,565 | |
| nCino, Inc.(1) | 201,060 | 13,414,723 | |
| Olo, Inc., Class A(1) | 372,050 | 9,818,399 | |
| $ 167,576,268 | |||
| Specialty Retail — 3.5% | |||
| Asbury Automotive Group, Inc.(1) | 44,214 | $ 8,688,051 | |
| Lithia Motors, Inc., Class A | 52,471 | 20,468,413 | |
| National Vision Holdings, Inc.(1) | 1,325,263 | 58,086,277 | |
| $ 87,242,741 | |||
| Textiles, Apparel & Luxury Goods — 2.1% | |||
| Capri Holdings, Ltd.(1) | 747,650 | $ 38,130,150 | |
| Steven Madden, Ltd. | 404,177 | 15,059,635 | |
| $ 53,189,785 | |||
| Trading Companies & Distributors — 1.5% | |||
| Applied Industrial Technologies, Inc. | 215,052 | $ 19,606,291 | |
| Herc Holdings, Inc.(1) | 166,457 | 16,867,088 | |
| $ 36,473,379 | |||
| Water Utilities — 1.2% | |||
| Middlesex Water Co. | 385,075 | $ 30,428,627 | |
| $ 30,428,627 | |||
| Total Common Stocks (identified cost $1,959,978,990) | $2,490,611,766 | ||
| High Social Impact Investments — 0.1% |
| Security | Principal Amount (000's omitted) | Value | |
| Calvert Impact Capital, Inc., Community Investment Notes, 1.50%, 12/15/23(2)(3) | $ | 2,520 | $ 2,447,348 |
| ImpactAssets, Inc., Global Sustainable Agriculture Notes, 2.07%, 11/3/22(3)(4) | 152 | 141,647 | |
| ImpactAssets, Inc., Microfinance Plus Notes, 0.46%, 11/3/22(3)(4) | 195 | 162,115 | |
| Total High Social Impact Investments (identified cost $2,867,000) | $ 2,751,110 | ||
| Short-Term Investments — 0.7% | |||
| Description | Units | Value | |
| Calvert Cash Reserves Fund, LLC, 0.07%(5) | 18,338,733 | $ 18,340,567 | |
| Total Short-Term Investments (identified cost $18,340,567) | $ 18,340,567 | ||
| Total Investments — 100.1% (identified cost $1,981,186,557) | $2,511,703,443 | ||
| Other Assets, Less Liabilities — (0.1)% | $ (2,827,835) | ||
| Net Assets — 100.0% | $2,508,875,608 | ||
| The percentage shown for each investment category in the Schedule of Investments is based on net assets. | ||
| (1) | Non-income producing security. | |
| (2) | May be deemed to be an affiliated company (see Note 7). | |
| (3) | Restricted security. Total market value of restricted securities amounts to $2,751,110, which represents 0.1% of the net assets of the Fund as of March 31, 2021. | |
| (4) | Notes carry an interest rate that varies by period and is contingent on the performance of the underlying portfolio of loans to borrowers. The coupon rate shown represents the rate in effect at March 31, 2021. | |
| (5) | Affiliated investment company, available to Calvert portfolios and funds, which invests in high quality, U.S. dollar denominated money market instruments. The rate shown is the annualized seven-day yield as of March 31, 2021. | |
| Description | Acquisition Dates | Cost |
| Calvert Impact Capital, Inc., Community Investment Notes, 1.50%, 12/15/23 | 12/14/20 | $2,520,000 |
| ImpactAssets, Inc., Global Sustainable Agriculture Notes, 2.07%, 11/3/22 | 11/13/15 | 152,000 |
| ImpactAssets, Inc., Microfinance Plus Notes, 0.46%, 11/3/22 | 11/13/15 | 195,000 |
| March 31, 2021 | |
| Assets | |
| Investments in securities of unaffiliated issuers, at value (identified cost $1,960,325,990) | $ 2,490,915,528 |
| Investments in securities of affiliated issuers, at value (identified cost $20,860,567) | 20,787,915 |
| Cash | 2,443,038 |
| Receivable for investments sold | 15,723,882 |
| Receivable for capital shares sold | 10,486,364 |
| Dividends and interest receivable | 2,243,397 |
| Dividends and interest receivable - affiliated | 12,921 |
| Securities lending income receivable | 29 |
| Directors' deferred compensation plan | 278,716 |
| Total assets | $2,542,891,790 |
| Liabilities | |
| Payable for investments purchased | $ 21,904,801 |
| Payable for capital shares redeemed | 9,578,138 |
| Payable to affiliates: | |
| Investment advisory fee | 1,435,097 |
| Administrative fee | 253,252 |
| Distribution and service fees | 82,117 |
| Sub-transfer agency fee | 31,886 |
| Directors' deferred compensation plan | 278,716 |
| Accrued expenses | 452,175 |
| Total liabilities | $ 34,016,182 |
| Net Assets | $2,508,875,608 |
| Sources of Net Assets | |
| Paid-in capital | $ 1,875,078,350 |
| Distributable earnings | 633,797,258 |
| Total | $2,508,875,608 |
| Class A Shares | |
| Net Assets | $ 274,361,270 |
| Shares Outstanding | 8,405,523 |
| Net Asset Value and Redemption Price Per Share (net assets ÷ shares of beneficial interest outstanding) | $ 32.64 |
| Maximum Offering Price Per Share (100 ÷ 95.25 of net asset value per share) | $ 34.27 |
| Class C Shares | |
| Net Assets | $ 29,199,267 |
| Shares Outstanding | 1,060,709 |
| Net Asset Value and Offering Price Per Share* (net assets ÷ shares of beneficial interest outstanding) | $ 27.53 |
| Class I Shares | |
| Net Assets | $ 2,127,503,288 |
| Shares Outstanding | 60,032,505 |
| Net Asset Value, Offering Price and Redemption Price Per Share (net assets ÷ shares of beneficial interest outstanding) | $ 35.44 |
| March 31, 2021 | |
| Class R6 Shares | |
| Net Assets | $77,811,783 |
| Shares Outstanding | 2,194,879 |
| Net Asset Value, Offering Price and Redemption Price Per Share (net assets ÷ shares of beneficial interest outstanding) | $ 35.45 |
| On sales of $50,000 or more, the offering price of Class A shares is reduced. | |
| * | Redemption price per share is equal to the net asset value less any applicable contingent deferred sales charge. |
| Six Months Ended | |
| March 31, 2021 | |
| Investment Income | |
| Dividend income (net of foreign taxes withheld of $1,427) | $ 11,767,963 |
| Dividend income - affiliated issuers | 11,253 |
| Interest income | 984 |
| Interest income - affiliated issuers | 18,991 |
| Securities lending income, net | 59,511 |
| Total investment income | $ 11,858,702 |
| Expenses | |
| Investment advisory fee | $ 6,904,346 |
| Administrative fee | 1,218,414 |
| Distribution and service fees: | |
| Class A | 296,533 |
| Class C | 115,059 |
| Directors' fees and expenses | 38,325 |
| Custodian fees | 22,190 |
| Transfer agency fees and expenses | 772,664 |
| Accounting fees | 197,849 |
| Professional fees | 28,555 |
| Registration fees | 137,034 |
| Reports to shareholders | 110,566 |
| Miscellaneous | 40,012 |
| Total expenses | $ 9,881,547 |
| Net investment income | $ 1,977,155 |
| Realized and Unrealized Gain (Loss) | |
| Net realized gain (loss): | |
| Investment securities | $ 140,410,953 |
| Investment securities - affiliated issuers | (312) |
| Net realized gain | $140,410,641 |
| Change in unrealized appreciation (depreciation): | |
| Investment securities | $ 438,074,957 |
| Investment securities - affiliated issuers | (59,585) |
| Net change in unrealized appreciation (depreciation) | $438,015,372 |
| Net realized and unrealized gain | $578,426,013 |
| Net increase in net assets from operations | $580,403,168 |
| Six Months Ended March 31, 2021 (Unaudited) | Year Ended September 30, 2020 | |
| Increase (Decrease) in Net Assets | ||
| From operations: | ||
| Net investment income | $ 1,977,155 | $ 1,595,996 |
| Net realized gain (loss) | 140,410,641 | (37,030,670) |
| Net change in unrealized appreciation (depreciation) | 438,015,372 | 22,960,899 |
| Net increase (decrease) in net assets from operations | $ 580,403,168 | $ (12,473,775) |
| Distributions to shareholders: | ||
| Class A | $ — | $ (2,242,958) |
| Class C | — | (200,001) |
| Class I | (2,198,171) | (7,919,039) |
| Class R6 | (92,105) | (509,400) |
| Total distributions to shareholders | $ (2,290,276) | $ (10,871,398) |
| Capital share transactions: | ||
| Class A | $ 19,124,269 | $ 23,635,745 |
| Class C | 5,754,481 | 3,231,774 |
| Class I | 431,563,173 | 761,543,484 |
| Class R6 | 16,510,871 | 9,673,290 |
| Net increase in net assets from capital share transactions | $ 472,952,794 | $ 798,084,293 |
| Net increase in net assets | $1,051,065,686 | $ 774,739,120 |
| Net Assets | ||
| At beginning of period | $ 1,457,809,922 | $ 683,070,802 |
| At end of period | $2,508,875,608 | $1,457,809,922 |
| Class A | ||||||
| Six Months Ended March 31, 2021 (Unaudited) | Year Ended September 30, | |||||
| 2020 | 2019 | 2018 | 2017 | 2016 | ||
| Net asset value — Beginning of period | $ 23.94 | $ 25.35 | $ 26.61 | $ 25.70 | $ 21.76 | $ 22.04 |
| Income (Loss) From Operations | ||||||
| Net investment income (loss)(1) | $ (—)(2) | $ (0.01) | $ 0.02 | $ (0.04) | $ (0.05) | $ 0.03(3) |
| Net realized and unrealized gain (loss) | 8.70 | (1.08) | (0.04) (4) | 4.34 | 4.32 | 1.53 |
| Total income (loss) from operations | $ 8.70 | $ (1.09) | $ (0.02) | $ 4.30 | $ 4.27 | $ 1.56 |
| Less Distributions | ||||||
| From net investment income | $ — | $ — | $ — | $ —(5) | $ — | $ (0.01) |
| From net realized gain | — | (0.32) | (1.24) | (3.39) | (0.33) | (1.83) |
| Total distributions | $ — | $ (0.32) | $ (1.24) | $ (3.39) | $ (0.33) | $ (1.84) |
| Net asset value — End of period | $ 32.64 | $ 23.94 | $ 25.35 | $ 26.61 | $ 25.70 | $ 21.76 |
| Total Return(6) | 36.34% (7) | (4.38)% | 0.61% | 18.55% | 19.74% | 7.66% |
| Ratios/Supplemental Data | ||||||
| Net assets, end of period (000’s omitted) | $274,361 | $185,777 | $172,277 | $158,921 | $137,860 | $170,294 |
| Ratios (as a percentage of average daily net assets):(8) | ||||||
| Total expenses | 1.18% (9) | 1.22% | 1.25% | 1.28% | 1.36% | 1.42% |
| Net expenses | 1.18% (9) | 1.21% | 1.23% | 1.28% | 1.36% | 1.37% |
| Net investment income (loss) | (0.02)% (9) | (0.03)% | 0.07% | (0.17)% | (0.22)% | 0.12% (3) |
| Portfolio Turnover | 36% (7) | 44% | 45% | 51% | 137% | 150% |
| (1) | Computed using average shares outstanding. |
| (2) | Amount is less than $(0.005). |
| (3) | Amount includes a non-recurring refund for overbilling of prior years' custody out-of-pocket fees. This amounted to $0.001 per share and 0.01% of average net assets. |
| (4) | The per share amount is not in accord with the net realized and unrealized gain (loss) for the period because of the timing of Fund share transactions and the amount of the per share realized and unrealized gains and losses at such time. |
| (5) | Amount is less than $0.005. |
| (6) | Returns are historical and are calculated by determining the percentage change in net asset value with all distributions reinvested and do not reflect the effect of sales charges, if any. |
| (7) | Not annualized. |
| (8) | Total expenses do not reflect amounts reimbursed and/or waived by the adviser and certain of its affiliates, if applicable. Net expenses are net of all reductions and represent the net expenses paid by the Fund. |
| (9) | Annualized. |
| Class C | ||||||
| Six Months Ended March 31, 2021 (Unaudited) | Year Ended September 30, | |||||
| 2020 | 2019 | 2018 | 2017 | 2016 | ||
| Net asset value — Beginning of period | $ 20.27 | $ 21.63 | $ 22.90 | $ 22.58 | $ 19.30 | $ 19.88 |
| Income (Loss) From Operations | ||||||
| Net investment loss(1) | $ (0.10) | $ (0.16) | $ (0.14) | $ (0.20) | $ (0.21) | $ (0.12)(2) |
| Net realized and unrealized gain (loss) | 7.36 | (0.92) | (0.04) (3) | 3.77 | 3.82 | 1.37 |
| Total income (loss) from operations | $ 7.26 | $ (1.08) | $ (0.18) | $ 3.57 | $ 3.61 | $ 1.25 |
| Less Distributions | ||||||
| From net realized gain | $ — | $ (0.28) | $ (1.09) | $ (3.25) | $ (0.33) | $ (1.83) |
| Total distributions | $ — | $ (0.28) | $ (1.09) | $ (3.25) | $ (0.33) | $ (1.83) |
| Net asset value — End of period | $ 27.53 | $ 20.27 | $ 21.63 | $ 22.90 | $ 22.58 | $ 19.30 |
| Total Return(4) | 35.82% (5) | (5.10)% | (0.12)% | 17.66% | 18.82% | 6.89% |
| Ratios/Supplemental Data | ||||||
| Net assets, end of period (000’s omitted) | $29,199 | $16,992 | $14,775 | $18,945 | $16,691 | $16,842 |
| Ratios (as a percentage of average daily net assets):(6) | ||||||
| Total expenses | 1.93% (7) | 1.97% | 2.01% | 2.03% | 2.22% | 2.31% |
| Net expenses | 1.93% (7) | 1.96% | 1.99% | 2.03% | 2.12% | 2.12% |
| Net investment loss | (0.76)% (7) | (0.78)% | (0.68)% | (0.91)% | (0.99)% | (0.63)% (2) |
| Portfolio Turnover | 36% (5) | 44% | 45% | 51% | 137% | 150% |
| (1) | Computed using average shares outstanding. |
| (2) | Amount includes a non-recurring refund for overbilling of prior years' custody out-of-pocket fees. This amounted to $0.001 per share and 0.01% of average net assets. |
| (3) | The per share amount is not in accord with the net realized and unrealized gain (loss) for the period because of the timing of Fund share transactions and the amount of the per share realized and unrealized gains and losses at such time. |
| (4) | Returns are historical and are calculated by determining the percentage change in net asset value with all distributions reinvested and do not reflect the effect of sales charges, if any. |
| (5) | Not annualized. |
| (6) | Total expenses do not reflect amounts reimbursed and/or waived by the adviser and certain of its affiliates, if applicable. Net expenses are net of all reductions and represent the net expenses paid by the Fund. |
| (7) | Annualized. |
| Class I | ||||||
| Six Months Ended March 31, 2021 (Unaudited) | Year Ended September 30, | |||||
| 2020 | 2019 | 2018 | 2017 | 2016 | ||
| Net asset value — Beginning of period | $ 26.00 | $ 27.49 | $ 28.73 | $ 27.51 | $ 23.18 | $ 23.34 |
| Income (Loss) From Operations | ||||||
| Net investment income(1) | $ 0.04 | $ 0.06 | $ 0.09 | $ 0.05 | $ 0.06 | $ 0.13(2) |
| Net realized and unrealized gain (loss) | 9.44 | (1.17) | (0.02) (3) | 4.67 | 4.62 | 1.63 |
| Total income (loss) from operations | $ 9.48 | $ (1.11) | $ 0.07 | $ 4.72 | $ 4.68 | $ 1.76 |
| Less Distributions | ||||||
| From net investment income | $ (0.04) | $ (0.05) | $ (0.06) | $ (0.08) | $ (0.02) | $ (0.09) |
| From net realized gain | — | (0.33) | (1.25) | (3.42) | (0.33) | (1.83) |
| Total distributions | $ (0.04) | $ (0.38) | $ (1.31) | $ (3.50) | $ (0.35) | $ (1.92) |
| Net asset value — End of period | $ 35.44 | $ 26.00 | $ 27.49 | $ 28.73 | $ 27.51 | $ 23.18 |
| Total Return(4) | 36.50% (5) | (4.12)% | 0.92% | 18.92% | 20.29% | 8.15% |
| Ratios/Supplemental Data | ||||||
| Net assets, end of period (000’s omitted) | $2,127,503 | $1,211,029 | $461,237 | $257,089 | $93,724 | $96,664 |
| Ratios (as a percentage of average daily net assets):(6) | ||||||
| Total expenses | 0.93% (7) | 0.97% | 1.00% | 1.04% | 0.92% | 0.94% |
| Net expenses | 0.93% (7) | 0.96% | 0.95% | 0.92% | 0.90% | 0.92% |
| Net investment income | 0.23% (7) | 0.22% | 0.34% | 0.19% | 0.23% | 0.58% (2) |
| Portfolio Turnover | 36% (5) | 44% | 45% | 51% | 137% | 150% |
| (1) | Computed using average shares outstanding. |
| (2) | Amount includes a non-recurring refund for overbilling of prior years' custody out-of-pocket fees. This amounted to $0.001 per share and 0.01% of average net assets. |
| (3) | The per share amount is not in accord with the net realized and unrealized gain (loss) for the period because of the timing of Fund share transactions and the amount of the per share realized and unrealized gains and losses at such time. |
| (4) | Returns are historical and are calculated by determining the percentage change in net asset value with all distributions reinvested and do not reflect the effect of sales charges, if any. |
| (5) | Not annualized. |
| (6) | Total expenses do not reflect amounts reimbursed and/or waived by the adviser and certain of its affiliates, if applicable. Net expenses are net of all reductions and represent the net expenses paid by the Fund. |
| (7) | Annualized. |
| Class R6 | |||
| Six Months Ended March 31, 2021 (Unaudited) | Year Ended September 30, | Period Ended September 30, | |
| 2020 | 2019 (1) | ||
| Net asset value — Beginning of period | $ 26.01 | $ 27.50 | $ 24.93 |
| Income (Loss) From Operations | |||
| Net investment income(2) | $ 0.05 | $ 0.07 | $ 0.07 |
| Net realized and unrealized gain (loss) | 9.44 | (1.16) | 2.50 |
| Total income (loss) from operations | $ 9.49 | $ (1.09) | $ 2.57 |
| Less Distributions | |||
| From net investment income | $ (0.05) | $ (0.07) | $ — |
| From net realized gain | — | (0.33) | — |
| Total distributions | $ (0.05) | $ (0.40) | $ — |
| Net asset value — End of period | $ 35.45 | $ 26.01 | $ 27.50 |
| Total Return(3) | 36.52% (4) | (4.07)% | 10.31% (4) |
| Ratios/Supplemental Data | |||
| Net assets, end of period (000’s omitted) | $77,812 | $44,012 | $34,782 |
| Ratios (as a percentage of average daily net assets):(5) | |||
| Total expenses | 0.87% (6) | 0.91% | 0.93% (6) |
| Net expenses | 0.87% (6) | 0.90% | 0.90% (6) |
| Net investment income | 0.30% (6) | 0.28% | 0.37% (6) |
| Portfolio Turnover | 36% (4) | 44% | 45% (7) |
| (1) | For the period from the commencement of operations, February 1, 2019, to September 30, 2019. |
| (2) | Computed using average shares outstanding. |
| (3) | Returns are historical and are calculated by determining the percentage change in net asset value with all distributions reinvested and do not reflect the effect of sales charges, if any. |
| (4) | Not annualized. |
| (5) | Total expenses do not reflect amounts reimbursed and/or waived by the adviser and certain of its affiliates, if applicable. Net expenses are net of all reductions and represent the net expenses paid by the Fund. |
| (6) | Annualized. |
| (7) | For the year ended September 30, 2019. |
| Asset Description | Level 1 | Level 2 | Level 3 | Total |
| Common Stocks | $ 2,490,611,766(1) | $ — | $ — | $ 2,490,611,766 |
| High Social Impact Investments | — | 2,751,110 | — | 2,751,110 |
| Short-Term Investments | — | 18,340,567 | — | 18,340,567 |
| Total Investments | $2,490,611,766 | $21,091,677 | $ — | $2,511,703,443 |
| (1) | The level classification by major category of investments is the same as the category presentation in the Schedule of Investments. |
| Aggregate cost | $1,990,030,792 |
| Gross unrealized appreciation | $ 528,436,137 |
| Gross unrealized depreciation | (6,763,486) |
| Net unrealized appreciation | $ 521,672,651 |
| Name | Value, beginning of period | Purchases | Sales proceeds | Net realized gain (loss) | Change in unrealized appreciation (depreciation) | Value, end of period | Interest/ Dividend income | Principal amount/Units, end of period |
| High Social Impact Investments | ||||||||
| Calvert Impact Capital, Inc., Community Investment Notes, 1.50%, 12/15/20(1) | $ 2,502,849 | $ — | $ (2,515,603) | $ — | $ 12,754 | $ — | $ 7,861 | $ — |
| Calvert Impact Capital, Inc., Community Investment Notes, 1.50%, 12/15/23(1) | — | 2,520,000 | — | — | (72,652) | 2,447,348 | 11,130 | 2,520,000 |
| Short-Term Investments | ||||||||
| Calvert Cash Reserves Fund, LLC | 20,895,723 | 481,259,621 | (483,814,778) | (312) | 313 | 18,340,567 | 11,253 | 18,338,733 |
| Totals | $(312) | $ (59,585) | $20,787,915 | $30,244 |
| (1) | Restricted security. |
| Six Months Ended March 31, 2021 (Unaudited) | Year Ended September 30, 2020 | ||||
| Shares | Amount | Shares | Amount | ||
| Class A | |||||
| Shares sold | 1,570,135 | $ 46,459,728 | 2,505,463 | $ 59,082,941 | |
| Reinvestment of distributions | — | — | 84,645 | 2,165,230 | |
| Shares redeemed | (955,502) | (28,231,205) | (1,652,197) | (38,244,903) | |
| Converted from Class C | 32,195 | 895,746 | 25,804 | 632,477 | |
| Net increase | 646,828 | $ 19,124,269 | 963,715 | $ 23,635,745 | |
| Class C | |||||
| Shares sold | 331,197 | $ 8,422,919 | 359,892 | $ 7,284,269 | |
| Reinvestment of distributions | — | — | 8,772 | 191,136 | |
| Shares redeemed | (70,712) | (1,772,692) | (183,232) | (3,611,154) | |
| Converted to Class A | (38,080) | (895,746) | (30,252) | (632,477) | |
| Net increase | 222,405 | $ 5,754,481 | 155,180 | $ 3,231,774 | |
| Six Months Ended March 31, 2021 (Unaudited) | Year Ended September 30, 2020 | ||||
| Shares | Amount | Shares | Amount | ||
| Class I | |||||
| Shares sold | 20,995,991 | $ 676,148,470 | 41,335,024 | $1,041,863,042 | |
| Reinvestment of distributions | 60,642 | 1,893,863 | 268,712 | 7,448,686 | |
| Shares redeemed | (7,601,122) | (246,479,160) | (11,802,177) | (287,768,244) | |
| Net increase | 13,455,511 | $ 431,563,173 | 29,801,559 | $ 761,543,484 | |
| Class R6 | |||||
| Shares sold | 665,515 | $ 21,785,201 | 686,828 | $ 16,652,531 | |
| Reinvestment of distributions | 2,905 | 90,727 | 18,383 | 509,400 | |
| Shares redeemed | (165,641) | (5,365,057) | (277,774) | (7,488,641) | |
| Net increase | 502,779 | $ 16,510,871 | 427,437 | $ 9,673,290 | |
| Number of Shares(1) | ||||
| For | Against | Abstain (2) | Broker Non-Votes(2) | |
| 38,698,736.767 | 279,542.359 | 1,125,466.152 | 0 | |
| Fund | Investment Adviser | Investment Sub-Adviser |
| Calvert Small-Cap Fund | Calvert Research and Management | None |
| Officers |
| Hope L. Brown Chief Compliance Officer |
| Maureen A. Gemma Vice President, Secretary and Chief Legal Officer |
| James F. Kirchner Treasurer |
| Directors |
| Alice Gresham Bullock Chairperson |
| Richard L. Baird, Jr. |
| Cari M. Dominguez |
| John G. Guffey, Jr. |
| Miles D. Harper, III |
| Joy V. Jones |
| John H. Streur* |
| Anthony A. Williams |
| *Interested Director and President |
| Privacy Notice | April 2021 |
| FACTS | WHAT DOES EATON VANCE DO WITH YOUR PERSONAL INFORMATION? |
| Why? | Financial companies choose how they share your personal information. Federal law gives consumers the right to limit some but not all sharing. Federal law also requires us to tell you how we collect, share, and protect your personal information. Please read this notice carefully to understand what we do. |
| What? | The types of personal information we collect and share depend on the product or service you have with us. This information can include:■ Social Security number and income ■ investment experience and risk tolerance ■ checking account number and wire transfer instructions |
| How? | All financial companies need to share customers’ personal information to run their everyday business. In the section below, we list the reasons financial companies can share their customers’ personal information; the reasons Eaton Vance chooses to share; and whether you can limit this sharing. |
| Reasons we can share your personal information | Does Eaton Vance share? | Can you limit this sharing? |
| For our everyday business purposes — such as to process your transactions, maintain your account(s), respond to court orders and legal investigations, or report to credit bureaus | Yes | No |
| For our marketing purposes — to offer our products and services to you | Yes | No |
| For joint marketing with other financial companies | No | We don’t share |
| For our investment management affiliates’ everyday business purposes — information about your transactions, experiences, and creditworthiness | Yes | Yes |
| For our affiliates’ everyday business purposes — information about your transactions and experiences | Yes | No |
| For our affiliates’ everyday business purposes — information about your creditworthiness | No | We don’t share |
| For our investment management affiliates to market to you | Yes | Yes |
| For our affiliates to market to you | No | We don’t share |
| For nonaffiliates to market to you | No | We don’t share |
| To limit our sharing | Call toll-free 1-800-368-2745 or email: CRMPrivacy@calvert.comPlease note:If you are a new customer, we can begin sharing your information 30 days from the date we sent this notice. When you are no longer our customer, we continue to share your information as described in this notice. However, you can contact us at any time to limit our sharing. |
| Questions? | Call toll-free 1-800-368-2745 or email: CRMPrivacy@calvert.com |
| Privacy Notice — continued | April 2021 |
| Who we are | |
| Who is providing this notice? | Eaton Vance Management, Eaton Vance Distributors, Inc., Eaton Vance Trust Company, Eaton Vance Management (International) Limited, Eaton Vance Advisers International Ltd., Eaton Vance Global Advisors Limited, Eaton Vance Management’s Real Estate Investment Group, Boston Management and Research, Calvert Research and Management, Eaton Vance and Calvert Fund Families and our investment advisory affiliates (“Eaton Vance”) (see Investment Management Affiliates definition below) |
| What we do | |
| How does Eaton Vance protect my personal information? | To protect your personal information from unauthorized access and use, we use security measures that comply with federal law. These measures include computer safeguards and secured files and buildings. We have policies governing the proper handling of customer information by personnel and requiring third parties that provide support to adhere to appropriate security standards with respect to such information. |
| How does Eaton Vance collect my personal information? | We collect your personal information, for example, when you■ open an account or make deposits or withdrawals from your account ■ buy securities from us or make a wire transfer ■ give us your contact informationWe also collect your personal information from others, such as credit bureaus, affiliates, or other companies. |
| Why can’t I limit all sharing? | Federal law gives you the right to limit only■ sharing for affiliates’ everyday business purposes — information about your creditworthiness ■ affiliates from using your information to market to you ■ sharing for nonaffiliates to market to youState laws and individual companies may give you additional rights to limit sharing. See below for more on your rights under state law. |
| Definitions | |
| Investment Management Affiliates | Eaton Vance Investment Management Affiliates include registered investment advisers, registered broker- dealers, and registered and unregistered funds. Investment Management Affiliates does not include entities associated with Morgan Stanley Wealth Management, such as Morgan Stanley Smith Barney LLC and Morgan Stanley & Co. |
| Affiliates | Companies related by common ownership or control. They can be financial and nonfinancial companies.■ Our affiliates include companies with a Morgan Stanley name and financial companies such as Morgan Stanley Smith Barney LLC and Morgan Stanley & Co. |
| Nonaffiliates | Companies not related by common ownership or control. They can be financial and nonfinancial companies.■ Eaton Vance does not share with nonaffiliates so they can market to you. |
| Joint marketing | A formal agreement between nonaffiliated financial companies that together market financial products or services to you.■ Eaton Vance doesn’t jointly market. |
| Other important information | |
| Vermont: Except as permitted by law, we will not share personal information we collect about Vermont residents with Nonaffiliates unless you provide us with your written consent to share such information.California: Except as permitted by law, we will not share personal information we collect about California residents with Nonaffiliates and we will limit sharing such personal information with our Affiliates to comply with California privacy laws that apply to us. | |

| Item 2. | Code of Ethics. |
Not required in this filing.
| Item 3. | Audit Committee Financial Expert. |
Not required in this filing.
| Item 4. | Principal Accountant Fees and Services. |
Not required in this filing.
| Item 5. | Audit Committee of Listed Registrants. |
Not applicable.
| Item 6. | Schedule of Investments. |
Please see schedule of investments contained in the Report to Shareholders included under Item 1 of this Form N-CSR.
| Item 7. | Disclosure of Proxy Voting Policies and Procedures for Closed-End Management Investment Companies. |
Not applicable.
| Item 8. | Portfolio Managers of Closed-End Management Investment Companies. |
Not applicable.
| Item 9. | Purchases of Equity Securities by Closed-End Management Investment Company and Affiliated Purchasers. |
Not applicable.
| Item 10. | Submission of Matters to a Vote of Security Holders. |
No material changes.
| Item 11. | Controls and Procedures. |
(a) The registrant’s principal executive and principal financial officers have concluded that the registrant’s disclosure controls and procedures (as defined in Rule 30a-3(c) under the Investment Company Act of 1940 Act, as amended (the “1940 Act”)) are effective, based on the evaluation of these controls and procedures required by Rule 30a-3(b) under the 1940 Act and Rules 13a-15(b) or 15d-15(b) under the Securities Exchange Act of 1934 (“Exchange Act”), as of a date within 90 days of the filing date of this report.
(b) There was no change in the registrant’s internal control over financial reporting (as defined in Rule 30a-3(d) under the 1940 Act) that occurred during the period covered by this report that has materially affected, or is reasonably likely to materially affect, the registrant’s internal control over financial reporting.
| Item 12. | Disclosure of Securities Lending Activities for Closed-End Management Investment Companies |
Not applicable.
| Item 13. | Exhibits. |
(a)(1) | Registrant’s Code of Ethics- Not applicable (please see Item 2) | |
| President’s Section 302 certification. | ||
| Treasurer’s Section 302 certification. | ||
| Combined Section 906 certification. | ||
Signatures
Pursuant to the requirements of the Securities Exchange Act of 1934 and the Investment Company Act of 1940, the registrant has duly caused this report to be signed on its behalf by the undersigned, thereunto duly authorized.
| Calvert Impact Fund, Inc. | ||
| By: | /s/ John H. Streur | |
| John H. Streur | ||
| President | ||
| Date: | May 21, 2021 | |
Pursuant to the requirements of the Securities Exchange Act of 1934 and the Investment Company Act of 1940, this report has been signed below by the following persons on behalf of the registrant and in the capacities and on the dates indicated.
| By: | /s/ John H. Streur | |
| John H. Streur | ||
| President | ||
| Date: | May 21, 2021 | |
| By: | /s/ James F. Kirchner | |
| James F. Kirchner | ||
| Treasurer | ||
| Date: | May 21, 2021 | |