UNITED STATES
SECURITIES AND EXCHANGE COMMISSION
Washington, D.C. 20549
FORM 10-K
| | x | | ANNUAL REPORT PURSUANT TO SECTION 13 OR 15(d) OF THE SECURITIES EXCHANGE ACT OF 1934 |
For the fiscal year ended
March 31, 2008
or
| | ¨ | | TRANSITION REPORT PURSUANT TO SECTION 13 OR 15(d) OF THE SECURITIES EXCHANGE ACT OF 1934 |
Commission File Number: 000-32373
Napster, Inc.
(Exact name of registrant as specified in its charter)
| | |
| Delaware | | 77-0551214 |
(State or other jurisdiction of incorporation) | | (I.R.S. Employer Identification Number) |
9044 Melrose Ave.
Los Angeles, CA 90069
(Address of principal executive offices, including zip code)
Registrant’s telephone number, including area code: (310) 281-5000
Securities registered pursuant to Section 12(b) of the Act:
| | |
| Title of Each Class | | Name of Each Exchange on Which Registered |
Common Stock, $0.001 par value Rights to Purchase Series A Participating Preferred Stock, $0.001 par value | | The NASDAQ Stock Market LLC (Nasdaq Global Market) The NASDAQ Stock Market LLC (Nasdaq Global Market) |
Securities registered pursuant to Section 12(g) of the Act: None
Indicate by check mark if the registrant is a well-known seasoned issuer, as defined in Rule 405 of the Securities Act. Yes ¨ No x
Indicate by check mark if the registrant is not required to file reports pursuant to Section 13 or Section 15(d) of the Act. Yes ¨ No x
Indicate by check mark whether the Registrant (1) has filed all reports required to be filed by Section 13 or 15(d) of the Securities Exchange Act of 1934 during the preceding 12 months (or for such shorter period that the Registrant was required to file such reports), and (2) has been subject to such filing requirements for the past 90 days. Yes x No ¨
Indicate by check mark if disclosure of delinquent filers pursuant to Item 405 of Regulation S-K is not contained herein, and will not be contained, to the best of registrant’s knowledge, in definitive proxy or information statements incorporated by reference in Part III of this Form 10-K or any amendment to this Form 10-K. ¨
Indicate by check mark whether the Registrant is a large accelerated filer, an accelerated filer, a non-accelerated filer, or a smaller reporting company. See the definition of “large accelerated filer”, “accelerated filer” and “smaller reporting company” in Rule 12b-2 of the Exchange Act (Check one):
| | | | | | |
Large accelerated filer ¨ | | Accelerated filer x | | Non-accelerated filer ¨ | | Smaller reporting company ¨ |
Indicate by check mark whether the Registrant is a shell company (as defined in Rule 12b-2 of the Exchange Act). Yes ¨ No x
As of September 28, 2007, the aggregate market value of voting and non-voting common equity held by non-affiliates of the registrant was approximately $145 million. For this computation, Napster has excluded the market value of all common stock beneficially owned by all executive officers and directors of Napster as a group. As of May 31, 2008, the number of outstanding shares of common stock of the registrant was approximately 47,800,000.
DOCUMENTS INCORPORATED BY REFERENCE
Portions of our definitive proxy statement for the 2008 annual meeting of stockholders, expected to be held on September 18, 2008, have been incorporated by reference into Part III of this annual report.
NAPSTER, INC.
INDEX TO ANNUAL REPORT ON FORM 10-K
FOR THE FISCAL YEAR ENDED MARCH 31, 2008
i
INTRODUCTION AND NOTE ON FORWARD LOOKING STATEMENTS
We are a Delaware corporation, and our principal executive offices are located at 9044 Melrose Avenue, Los Angeles, California 90069.
Forward-Looking Statements
In addition to current and historical information, this Annual Report contains forward-looking statements within the meaning of the Private Securities Litigation Reform Act of 1995. These statements relate to our future operations, prospects, potential products, services, developments and business strategies. These statements can, in some cases, be identified by the use of terms such as “may,” “will,” “should,” “could,” “would,” “intend,” “expect,” “plan,” “anticipate,” “believe,” “estimate,” “predict,” “project,” “potential,” or “continue” or the negative of such terms or other comparable terminology. This Report includes, among others, forward-looking statements regarding:
| | • | | growth in broadband Internet connectivity and consumer adoption of portable electronic devices driving growth in the online music industry and improving consumers’ access to digital media; |
| | • | | our belief that the new open DRM-free standard should increase consumer interest in paid online music; |
| | • | | our ability to successfully enter into additional strategic partnerships; |
| | • | | our ability to control our subscriber cost and customer turnover; |
| | • | | our ability to build the Napster brand; |
| | • | | our competitive advantages; |
| | • | | our ability to continue to innovate by investing in new services and technologies; |
| | • | | our expectations regarding our future financial results, including with respect to service revenues, gross margins, research and development expenditures, sales and marketing expense and general and administrative expenses; |
| | • | | our expectations that our existing cash resources will be sufficient to fund our operations for at least the next twelve months; and |
| | • | | our expectations that we will incur net losses for at least the next twelve months and may continue to experience net losses thereafter. |
These statements involve certain known and unknown risks, and uncertainties that could cause our actual results to differ materially from those expressed or implied in our forward-looking statements. Such risks and uncertainties include, among others, those listed in Part I Item 1A, “Risk Factors” of this Annual Report on Form 10-K. We do not intend, and undertake no obligation, to update any of our forward-looking statements after the date of this Report to reflect actual results or future events or circumstances.
The name “Napster”, our tagline, Napster.com, Napster Light, Napster To Go and Napster Mobile are trademarks of Napster, Inc. or its subsidiaries in the United States and/or other countries. Other trademarks and tradenames appearing in this Report are the property of their respective holders.
ii
PART I
Napster, a pioneer in digital music, offers interactive music services that enable fans to sample, listen to, subscribe to and purchase from one of the world’s largest and most diverse online music catalogs utilizing secure and legal platforms anytime, anywhere. Napster users have access to songs from all major labels and thousands of independent labels, and have many ways to discover, share, acquire and enjoy new music and old favorites.
Subscribers to the Napster service receive unlimited access to our more than 6 million song catalog. Subscribers can either stream or download music with high quality sound and enjoy their music in an advertising-free environment. In addition, subscribers can access many features including radio, Billboard charts and community features, and are able to enjoy their music on a variety of media including personal computers, CDs, MP3 players, music-enabled cellular phones and digital media devices for the living room. All Napster users, whether subscribers or not, may listen to free music clips and may purchase full length music downloads.
Napster is headquartered in Los Angeles, and Napster services are currently available in the Americas, Japan and Europe.
Until December 17, 2004, Napster was known as “Roxio, Inc.”, and we operated our business in two divisions, the consumer software division (“CSD”) and the online music distribution division, also known as the Napster division.
On December 17, 2004, we completed the sale of substantially all of the assets and liabilities of CSD to Sonic Solutions, a California corporation (“Sonic”), including all of the capital stock of certain international subsidiaries. Since the sale of CSD, we have focused exclusively on our online music distribution business under the Napster brand and, since January 3, 2005, have been traded on the Nasdaq Stock Market under the symbol “NAPS”.
Napster was incorporated in Delaware in August 2000. We maintain executive offices and principal facilities at 9044 Melrose Avenue, Los Angeles, California 90069. Our telephone number is 310-281-5000.
For financial information about our single segment and geographic areas, please see Note 11 to our consolidated financial statements included in Item 8 of this Report.
Industry Background
Consumers are fundamentally changing the way that they interact with content, as traditional methods of delivery are being rapidly replaced by newer digital technologies that offer a much greater degree of freedom and flexibility. This trend has been fueled by the rapid growth of Internet usage by consumers, particularly as a result of broadband connections that enable content to be transferred securely at increasing speeds, and a number of powerful new technologies for compressing and sharing digital content using a personal computer or other digital media device. Content can now be enjoyed just about anywhere there is an Internet connection without any special software downloads, can be “burned” to CDs easily and affordably, or transferred to a growing number of portable consumer devices, including MP3 players, music-enabled cell phones, personal digital assistants (“PDAs”) and digital media devices for the living room. The increasing adoption of these portable consumer devices increases the demand for content as consumers look to “fill up” their players with music, personal photos and videos. Furthermore, consumers can now enjoy and acquire content directly over-the-air (“OTA”) via advanced wireless networks and download content directly to music-enabled cell phones. Finally, the format used for digital music distribution is evolving to become more user friendly and increasingly device compatible. With the increased availability of compatible music, consumers are embracing technologies and services that allow them to conveniently obtain, manage and move digital content in an easy and affordable manner. When referring to the digital download business alone, without even considering growth in digital musical subscriptions, Forrester Research Inc’s report “The End of the Music Industry As We Know It”, dated February 15, 2008, stated that the revenue of digital audio downloads would rise from $1.7 billion in 2007 to $4.8 billion by year-end 2012.
1
The growth of consumer Internet connectivity, particularly broadband and the deployment of third generation (“3G”) mobile networks, has increased consumer access to digital media.
Broadband personal computer (“PC”) Internet connections enable consumers to transfer data more quickly than on traditional dial-up connections. More devices are also being made with Internet connectivity built in—including both portable devices and digital media devices in the living room. Data transfer speed becomes increasingly important as the size of the information being transferred grows. The deployment of 3G mobile networks now allows consumers to access music and other content anytime and anywhere and to download it at broadband speeds to their music-enabled cell phone. We believe these trends, along with other new technologies, will improve consumers’ access to digital media. As transfer speed for digital media to consumers’ PCs via the Internet, to other non-PC Internet connected devices and to consumers’ music-enabled cell phones via 3G networks continues to improve, we believe that consumers will continue to seek products and services that help them quickly and easily find and access content, manage their own collection of digital assets, and help them enjoy, access and move their music collection from their PCs to other media such as CDs, DVDs and digital entertainment devices, including portable MP3 players and music-enabled cell phones.
Portable devices, including MP3 players and music-enabled cell phones, have proliferated and their uses have increased.
Portable digital music devices have revolutionized the way consumers listen to music. Many users are playing back digital music, spoken word and video content via consumer electronics devices such as portable MP3 players. The market for portable MP3 players is rapidly expanding. According to the music trade body International Federation of the Phonographic Industry, in its report entitled “Digital Music Report 2008”, portable player sales totaled around 140 million in 2007, an increase of 15 percent over the previous year. With the movement by labels to embrace the distribution of MP3 tracks free of digital rights management (“DRM”), services like Napster’s MP3 store can now distribute content that plays on this entire installed base, including the iPod and iPhone. In addition, a number of device manufacturers, including most of the major mobile phone manufacturers, have incorporated, or announced that they plan to incorporate, Microsoft’s Windows Media Digital Rights Management 10 technology (“WMDRM10”) into portable MP3 players and mobile phones. WMDRM10 technology allows users to extend their online music subscriptions to their portable MP3 players and mobile phones, providing them greater flexibility in the use of their music collections. The use of these devices has created demand for services that can provide permanent or limited access to content to “fill” these devices. Finally, many mobile phone carriers can now distribute music OTA to large and growing installed bases of music-enabled handsets, including those that do not support sophisticated DRM schemes like WMDRM10. In 2007, the shipment of these music-enabled cell phones far surpassed the number of stand-alone portable music players shipped, according to MultiMedia Intelligence’s article dated March 24, 2008.
Digital music rights management has evolved, expanding hardware compatibility and thereby reducing constraints on how consumers may use their digital content.
Prior to 2007, record labels had licensed digital music for distribution subject to specific requirements that all downloaded songs contained DRM. As is common in new technology industries, key market leaders each chose different, sometimes proprietary, approaches to DRM, which caused compatibility issues. During 2007 the record labels agreed to allow DRM-free distribution of permanent downloads in certain circumstances. The new open DRM-free standard should increase consumer interest in paid online music and may also drive increased competition. It will also allow service providers to reach a very large base of compatible devices, including virtually all MP3 players and music phones.
2
Our Solution and Products
We deliver online music to our customers as individual downloads and through subscriptions accessible via the Internet and wireless devices.
We offer web-based music subscription services, Napster and Napster To Go, which provide consumers in the United States with unlimited, high fidelity, access to over 6 million tracks for monthly fees of $12.95 and $14.95, respectively. Napster subscribers enjoy unlimited access to CD-quality music and have access to over 50 interactive radio stations, hundreds of pre-programmed playlists, unlimited dynamically created playlists with automix feature, extensive community features, personalization features, message boards, historical Billboard chart information and enhanced programming. In addition, all Napster subscribers enjoy community features, such as the ability to send song links to friends, and our subscribers can browse other subscribers’ published collections. Napster To Go subscribers also have the ability to transfer an unlimited amount of music from Napster to their choice of up to three compatible MP3 players for the entire term of their subscription without having to purchase individual tracks and albums a la carte. We offer both the Napster and Napster To Go subscription services in the United States, Canada, Germany, the United Kingdom and Japan at fees that are based on the local currency and vary accordingly. The feature sets and track availability in each country may vary slightly.
During fiscal 2007 we launched a wireless music service branded Napster Mobile. In conjunction with Ericsson, the leading telecommunications equipment supplier, we offer ringtones, OTA downloads with dual delivery and wallpapers via a variety of mobile carriers, including Cingular/ATT, Swisscom, O2 UK, TIM, and SunComm. Using Napster Mobile, customers in 8 global markets are able to purchase music downloads from our full music catalog using their mobile phone handset and have the songs delivered OTA to their handsets with a copy sent to their PCs as well. Napster Mobile is available in Japan through distribution agreements that our Japanese Joint Venture has entered into with Japanese wireless telecommunications suppliers NTT DoCoMo and KDDI.
We also provide a web-based MP3 store where customers in the United States (including those who are not subscribers) can preview song clips and purchase individual tracks for $0.99 each or albums starting at $6.95. Our MP3 store offers the largest major label MP3 catalog in the industry as well as the largest library of independent music available anywhere. Our MP3 catalog exceeds 6 million tracks, and all content is licensed from major music companies, including EMI Recorded Music, Sony BMG, Universal Music Group and Warner Music Group, as well as thousands of independent labels, on a non-exclusive basis. MP3 store customers buy downloads in the user-friendly, DRM-free, MP3 format, which is compatible with virtually any MP3 player or music phone, including the iPod and iPhone. International users and U.S. mobile users can access our extensive catalog to purchase DRM downloads via their PCs or mobile phones.
3
Our Strategy
Our objective is to become the leading global provider of consumer digital music services. We intend to pursue the following key strategic initiatives to accomplish our objective:
Continue to Pursue and Execute Strategic Partnerships
We intend to enter into additional strategic partnerships with the goal of delivering the best experience for consumers and keeping control of our subscriber acquisition costs. Strategic partnerships allow us to enhance, expand upon and complement our product offerings and increase our distribution by joining with companies that have significantly greater resources and complementary expertise to ours. To date, we have entered into strategic partnerships with mobile companies (Ericsson, Cingular/AT&T, Swisscom), hardware companies (Sony, Sandisk, Gateway, Toshiba, Creative Labs, Lenovo), retailers (Tower Records Japan, Circuit City, Radio Shack), entertainment companies (AOL, XM) and others.
Continue to Innovate by Investing in New Services and Technologies
We plan to continue to innovate by investing in product development to improve our services, expand the breadth of our service offerings, and maintain compatibility with popular technology standards. We plan to enable paid subscribers to enjoy their subscriptions on an increased number of and variety of devices. We also plan to expand our product offerings with new and innovative services related to the acquisition of digital music content.
Continue to control our subscriber acquisition cost and customer turnover
We have substantially reduced subscriber acquisition cost over the last year as we have moved away from offline advertising to targeted online spend where we can achieve lower acquisition cost per trialer. We have also increased our focus on our strategic distribution partners where we have shifted away from an earlier framework of giving advances and guaranteed market development funds to a more variable based cost model where we pay bounties only when we acquire subscribers. With this performance based variable cost approach we have lowered our overall marketing spend. We will continue to emphasize marketing approaches that minimize the cost to acquire new subscribers.
We have also reduced customer turnover substantially over the last year. We believe that improvements to our product, such as improved programming and personalization, have helped keep our subscribers more engaged in the service. Improved compatibility with MP3 players has also contributed to a much better user experience. We expect that the availability of additional compatible music-enabled cell phones and further improvements to our product and user experience will help us continue to maintain our low turnover levels going forward.
Sales, Marketing and Support
We have an integrated marketing program and communication strategy with the goal of driving brand awareness and increasing the number of visitors who come to Napster. We primarily focus our marketing efforts on online marketing, where we can most cost effectively reach our target audience of 25-40 year-olds, as well as strategic partnerships where we can market our service with complementary products. We also maintain an online marketing program that includes advertising placements on a number of web sites (including affiliate partners) and search engines.
We enter into partner programs directly with PC, MP3 player and phone manufacturers, whereby our Napster music service and/or software is either preloaded on the storage media or in the device box. We also have relationships with a number of direct-to-consumer retailers, such as Circuit City, and wireless carriers, such as AT&T/Cingular. Marketing efforts initiated via these relationships range from the sale of Napster retail products, such as prepaid download cards, to more extensive promotions, including inclusion in the retail chain’s or wireless carrier’s own advertising efforts, special promotions and in-store displays. We also enter into relationships with online entertainment companies, such as AOL, whereby our partners include links to our service from pages on their website.
4
We expect that our advertising and promotional efforts will continue to focus on building the Napster brand and aggressively supporting our products, such as Napster, Napster To Go, Napster Mobile and the Napster MP3 Store.
Product Development
We have considerable in-house engineering skill in the areas of digital media delivery, content management, and digital rights management. We have built and maintain (i) a distribution system tailored to manage digital media files and the associated metadata and associated usage rights; (ii) a scalable e-commerce and media delivery infrastructure, which can support a range of business models for the delivery of digital music (and other digital media content like video and audiobooks) including a la carte and subscription services; and (iii) a digital rights management platform for Napster’s subscription service that provides security for the digital media assets, as well as the ability to tailor usage rights and offerings to end consumers. The digital rights management capability supports subscriptions—the ability to download an unlimited amount of content to a set number of portable devices, and to continue to allow users access to that content as long as they continue to pay their subscription fee. We intend to continue development of improved distribution systems and additional features of our service.
Research and development expenses for our Napster business totaled $9.7 million in the year ended March 31, 2008 (“fiscal 2008”), $11.0 million in the year ended March 31, 2007 (“fiscal 2007”) and $13.1 million in the year ended March 31, 2006 (“fiscal 2006”).
Customers
We offer our online music services directly to end users through our website, affiliate network and partners that have procured site licenses. We also sell prepaid cards through our retail partners and bundle our services with OEM partners, such as Sony, Sandisk, Gateway, Creative Labs and Samsung. We have licensed certain merchandising rights to select third parties and expect to continue to do so in the future.
Competition
The markets we are targeting are highly competitive, and we expect competition to increase in the future. Increased competition may result in price reductions and loss of market share, which could reduce our future revenues and otherwise harm our business. Primary competitors for online music services include Apple Inc.’s iTunes Music Store, RealNetworks, Inc.’s Rhapsody, Microsoft’s Zune Marketplace and eMusic. Other competitors include online and offline retailers such as Amazon.com and WalMart, satellite radio providers such as XM and Sirius, carrier-branded music services offered directly by mobile operators such as Verizon (via its V-cast service) and Sprint (through its Music Store,), music services offered by certain handset manufacturers such as Nokia and third-party branded music services, such as Jamba, offered by mobile operators. We also face competition from general purpose consumer online services such as Yahoo, My Space Music, MSN and Google, each of which provides access to music-related content and services; from websites targeted to music related content, such as Last.fm and pandora.com; and from social networking sites, such as iMeem. Internationally we currently compete with Puretracks, Omnifone’s Music Station, 3 Music Store and Vodafone’s music offerings, among others, as well as with a number of the other competitors described above. Our digital music distribution business also faces competition from “free” peer-to-peer services, such as LimeWire, Kazaa, Morpheus, BitTorrent and a variety of similar services that allow computer users to connect with each other and to copy many types of program files, including music and other media, from one another’s hard drives, all without securing licenses from content providers.
We believe that the principal competitive factors affecting the market for our services include compatibility with popular hardware devices, song quality, search capability, personalization, programming, price and performance, other features, quality of customer support and brand. We believe that we compete more favorably than many of our current competitors with respect to some or all of these factors.
5
Seasonality
Our service revenues may be impacted by softness in customer acquisitions during the summer months, when consumers spend less time online, and by increase in new customer acquisitions during the winter holidays.
Intellectual Property
Our success and ability to compete depend substantially upon our intellectual property. As of June 1, 2008, we had 30 pending United States and foreign patent applications. These applications cover online music distribution functionality and peer-to-peer technology. As of June 1, 2008, we had 17 United States and foreign patents issued, with terms ending in 2017 through 2028.
Employees
As of March 31, 2008, Napster had 133 employees, of which 13 provide support to the online music service (maintaining content and providing customer care), 28 were in sales and marketing, 56 were in engineering and product development and 36 were in finance, administration and operations.
Our future performance depends, in significant part, upon our ability to attract new personnel and retain existing personnel in key areas including engineering, technical support and sales. None of our employees is represented by a collective bargaining agreement. We have not experienced any work stoppages, and we consider our relations with our employees to be good.
Investor Information
Our website is located at http://www.napster.com. Our investor relations website is located at http://investor.napster.com. We make available free of charge on our investor relations website under “SEC Filings” our Annual Reports on Form 10-K, Quarterly Reports on Form 10-Q, Current Reports on Form 8-K and any amendments to those reports as soon as reasonably practicable after we electronically file or furnish such materials to the U.S. Securities and Exchange Commission (“SEC”). Further, a copy of this Report is located at the SEC’s Public Reference Room at 100 F Street, NE, Washington, D.C. 20549. Information on the operation of the Public Reference Room can be obtained by calling the SEC at 1-800-SEC-0330. The SEC maintains an Internet site that contains reports, proxy and information statements and other information regarding our filings at http://www.sec.gov.
6
Investing in our common stock involves a high degree of risk. You should carefully consider the risks described below and the other information in this annual report. If any of the following risks occur, our business could be materially harmed, and our financial condition and results of operations could be materially and adversely affected. As a result, the price of our common stock could decline, and you could lose all or part of your investment.
Our digital music distribution business has a limited operating history and a history of losses and may not be successful.
On May 19, 2003, we acquired substantially all of the ownership interests of Napster, LLC (f/k/a Pressplay). We used the Pressplay-branded service as a technology platform to roll-out our online music services division in October 2003. The business models, technologies and market for digital music services are relatively new and unproven. Prior to our acquisition of Napster, LLC, consumer adoption and usage of the Pressplay-branded service had not been significant. You should consider our business and prospects in light of the risks, expenses and difficulties encountered by companies in their early stage of development.
Our digital music distribution business has experienced significant net losses since its inception and, given the significant operating expenditures associated with our business plan, we expect to incur net losses for at least the next twelve months and may continue to experience net losses thereafter. No assurance can be made that our paid Napster service will ever contribute net income to our statement of operations. During the period beginning April 1, 2003, just prior to our acquisition of Pressplay in May 2003, through March 31, 2008, we incurred approximately $208.8 million of after tax losses from our digital music distribution business.
The success of our paid Napster service depends upon our ability to add new subscribers and retain existing subscribers.
We cannot assure you that we will be able to attract new subscribers or that existing subscribers will continue to subscribe. Trial subscribers and users of our free music service may choose not to become paid subscribers, and paid subscribers may decide to cancel their subscriptions, for many reasons including a perception that they do not use the services enough to justify the expense or that the service does not provide enough value or availability of content relative to our competition. In addition, any reduction in our current level of marketing and advertising expenditures may result in a reduction in the number of new trial and paid subscribers.
The early stages of subscription services such as ours are characterized by higher than normal churn rates. Existing paid subscribers may cancel their subscriptions to the Napster service for many reasons, including those described above in this risk factor. In addition, there is significant seasonality in our subscriber numbers, primarily due to softness in customer acquisition during the summer months when consumers spend less time online. While we have successfully reduced churn in the past, we cannot guarantee that we will be able to maintain or further reduce subscriber cancellation levels.
If we are unable to add new paid subscribers and retain customers we may be unable to achieve a profitable business model.
We experience fluctuations in our quarterly operating results, which may cause our stock price to decline.
Our quarterly operating results may fluctuate from quarter to quarter. We cannot reliably predict future revenue and margin trends and such trends may cause us to adjust our operations. Other factors that could affect our quarterly operating results include:
| | • | | timing of service introductions; |
| | • | | consumer adoption of new services; |
| | • | | seasonal fluctuations in sales of our prepaid cards and bundled hardware promotions, as well as other products and services; |
| | • | | potential declines in selling prices of music as a result of competitive pressures; |
7
| | • | | changes in the mix of our revenues and our users represented by our various services; |
| | • | | fluctuations in traffic levels on our websites, which can be significant as a result of business, financial and other news events; |
| | • | | adverse changes in the level of economic activity in the United States or other major economies in which we do business, or in industries, such as the music industry, on which we are particularly dependent; |
| | • | | expenses incurred in connection with the development of our digital music distribution services; |
| | • | | expenses related to, and the financial impact of, possible acquisitions of other businesses; |
| | • | | foreign currency exchange rate fluctuations; |
| | • | | expenses incurred in connection with strategic partnerships we have entered into or may enter into in the future; and |
| | • | | fluctuating and unpredictable demand for advertising. |
We rely on the value of the Napster brand, and our revenues could suffer if we are not able to maintain its high level of recognition in the digital music sector.
We believe that maintaining and expanding the Napster brand is an important aspect of our efforts to attract and expand our user and advertiser base. We employ a broad branding program to ensure that our position in the digital music sector continues to be strongly associated with the Napster name. Promotion and enhancement of the Napster brand will depend in part on our ability to provide consistently high-quality products and services. If we are not able to successfully maintain or enhance consumer awareness of the Napster brand or, even if we are successful in our branding efforts, if we are unable to maintain or enhance customer awareness of the Napster brand in a cost effective manner, our business, operating results and financial condition would be harmed.
We face significant competition from traditional retail music distributors, from emerging paid online and mobile music services delivered electronically such as ours, and from “free” online and peer-to-peer services.
We face significant competition from traditional retail music distributors, as well as online retailers such as Amazon.com. These retailers may include regional and national mall-based music chains, international chains, deep-discount retailers, mass merchandisers, consumer electronics outlets, mail order, record clubs, independent operators and online physical retail music distributors, some of which have greater financial and other resources than we do. To the extent that consumers choose to purchase media in non-electronic formats, it may reduce our sales, reduce our gross margins, increase our operating expenses and decrease our profit margins in specific markets.
Our digital music distribution services’ competitors currently include Apple Inc.’s iTunes Music Store, RealNetworks, Inc’s Rhapsody America, Microsoft’s Zune Marketplace and eMusic. Other competitors include online and offline retailers such as Amazon.com and WalMart, satellite radio providers such as XM and Sirius, carrier branded music services offered directly by mobile operators such as Verizon (via its V-cast service) and Sprint (through its Music Store) and music services offered by certain handset manufacturers such as Nokia. We also face competition from general purpose consumer online services such as Yahoo, My Space Music, MSN and Google, each of which provides access to music-related content and services; from websites targeted to music related content, such as Last.fm and pandora.com; and from social networking sites, such as iMeem. Internationally we currently compete with Puretracks, Omnifone’s Music Station, 3 Music Store and Vodafone’s music offerings, among others, as well as with a number of the other competitors described above.
8
Our digital music distribution business also faces significant competition from “free” peer-to-peer services, such as LimeWire, Kazaa, Morpheus, BitTorrent and a variety of similar services that allow computer users to connect with each other and to copy many types of program files, including music and other media, from one another’s hard drives, all without securing licenses from content providers. While the U.S. Supreme Court has found that Grokster, a former peer-to-peer file sharing program, may have violated copyright laws, the court did not establish that such services are necessarily liable for copyright infringement, opting instead for a fact-based analysis of the services’ efforts to promote copyright infringement. Additionally, enforcement efforts against those in violation have not effectively shut down these services, and there can be no assurance that these services will ever be shut down. We are also impacted by free services operated out of foreign jurisdictions, such as Russia, where copyright and other laws may be less stringently interpreted and/or enforced. The ongoing presence of these “free” services substantially impairs the marketability of legitimate services, regardless of the ultimate resolution of their legal status. Finally, several high profile peer-to-peer services, such as LimeWire, have started to or announced their intention to move to legally (or partially legally) licensed business models, while still using their peer-to-peer architecture. Many of these entities are well financed with significant installed user bases and if they are successful in moving their businesses to legal models, it could significantly increase our competitive pressure.
Many of our competitors have significantly more resources than we do, and some of our competitors may be able to leverage their experience in providing digital music distribution services or similar services to their customers in other businesses. We or our competitors may be able to secure limited exclusive rights to content from time to time. If our competitors secure significant exclusive content, it could harm the ability of our online music services to compete effectively in the marketplace.
In particular, some of our competitors offer other goods and services and may be willing and able to offer music services at a lower price than we can in order to promote the sale of these goods and services. If we lower our prices, our gross margins and operating results may be adversely affected. If we do not lower our prices, we may be unable to compete with discount services. This could harm the ability of our online music services to compete effectively in the marketplace.
Our advertising-supported music website competes, directly and indirectly, for advertisers, viewers, members, and content providers with publishers and distributors of traditional off-line media, such as television, radio and print, including those targeted to music, many of which have established or may establish websites, as well as a number of the entities listed above who provide free or ad-based access to music.
Digital music distribution services in general are new and rapidly evolving and may not prove to be a profitable or even viable business model.
Digital music distribution services are a relatively new business model for delivering digital media over the Internet. It is too early to predict whether consumers will accept, in significant numbers, digital music services and accordingly whether the services will be financially viable. If digital music distribution services do not prove to be popular with consumers, or if these services cannot sustain any such popularity, our business and prospects would be harmed.
The emerging mobile music market faces significant, unique challenges.
We believe that growth in the mobile music services market is important to the future growth in our general digital music distribution services. We are investing in this area but face significant and unique challenges that could adversely affect our business.
There are a number of challenges that could impact the adoption rate of mobile platforms as a leading method of digital music purchase, including the rate of adoption of compatible mobile handsets, availability of high speed mobile data networks, adoption by mobile consumers of mobile data plans, development of content and digital rights management standards and technologies acceptable to content licensors and consumers, any pricing differential (both wholesale and retail) between content purchased over-the-air to a mobile device and purchased by other means, and the impact on the economics of the mobile music business of certain issued patents.
9
The success of our mobile music business is also currently contingent upon our ability to enter into strategic partnerships with leading mobile carriers. We cannot guarantee our ability to enter into or maintain these types of relationships. Additionally, certain major mobile carriers and handset manufacturers create and operate their own mobile music services that they offer directly to the consumer. Should this direct-to-consumer model become more prevalent, it could jeopardize our ability to competitively market our services.
If we are unsuccessful in meeting the challenges and complexities of mobile music distribution or are unsuccessful in securing additional customers for our services, our results of operations could be harmed.
We rely on content provided by third parties, which may not be available to us on commercially reasonable terms or at all.
We rely on third-party content providers, including music publishers and music labels, to offer online music content that can be delivered to users of our digital music distribution services. Rights to provide this content to our customers, particularly publishing rights, are difficult to obtain and require significant time and expense. In order to provide a compelling service, we must continue to be able to license a wide variety of music content to our customers with attractive usage rights such as CD recording, output to MP3 players, portable subscription, wireless and other rights. In addition, if we do not have sufficient breadth and depth of the titles necessary to satisfy increased demand arising from growth in our subscriber base, our subscriber satisfaction will be affected adversely.
Under copyright law, we are required to pay licensing fees for compositions embodied in digital sound recordings and for the sound recordings themselves that we deliver in our Napster service. U.S. copyright law generally does not specify the rate and terms of the licenses, which are determined by voluntary negotiations among the parties or, for certain compulsory publishing licenses where voluntary negotiations are unsuccessful, by a copyright royalty board (“CRB”), an administrative judicial proceeding supervised by the United States Copyright Office. Past copyright proceedings have resulted in rates for statutory webcasting that were significantly in excess of rates requested by webcasters. Currently, there is a CRB proceeding for mechanical licenses for digital distribution, including in a subscription context. The parties engaged in the CRB proceeding have agreed to a partial settlement thereof and have asked the judges to approve a process by which they will receive and consider the proposal. However, we cannot predict the outcome of the CRB proceedings. We may also elect to attempt to directly license compositions for our services, either alone or in concert with other affected companies. Further, the continued availability of blanket licenses for compositions used in international versions of the services is not assured, and for certain additional international services may be unclear. Therefore, our ability to negotiate appropriate licenses is uncertain.
Pending the outcome of the CRB proceeding, we are currently operating under a standstill agreement and the partial settlement mentioned above until rates are finalized. Although a decision has been rendered by a United States district court that permanent downloads do not implicate a performance right that would trigger payment of public performance royalties to societies such as ASCAP or BMI, that decision could be appealed and the performing rights societies have not conceded the argument or entered into any agreements on that basis. In Canada, a recent tribunal ruling fixed certain rates and other requirements that are applicable to our Canadian digital music services. However, there is still some uncertainty with respect to the mechanics of its implementation, the result of which may hinder our ability to operate in Canada. In addition to certain other negotiations, European Union tribunals and/or negotiations are currently in process, which will set rates for subscription music services and services that deliver digital downloads of music, and the outcome of these negotiations and proceedings will also likely affect our business in ways that we cannot predict. Napster accrues for the cost of these fees, based on contracted or statutory rates, when established, or management’s best estimates based on facts and circumstances regarding the specific music services and agreements in similar geographies or with similar agencies. If the final agreed rates differ significantly from management’s estimate, the actual amount paid and expensed could differ materially from the recorded amounts. The differing types and large quantity of licenses that we must obtain creates significant complexities for our business and, as the licensing situation evolves in the different countries in which we operate, these requirements may significantly impact or hinder our ability to execute our business plans.
10
Our success depends on our digital music distribution services’ interoperability with our customers’ music playback hardware.
In order for the paid Napster service to be successful, we must design our service to interoperate effectively with a variety of hardware products, including PCs, portable MP3 players, music-enabled cell phones and other mobile devices, home stereos, set top boxes and car stereos. We depend on significant cooperation with manufacturers of these products and with software manufacturers that create the operating systems for such hardware devices to achieve our design objectives and to offer a service that is attractive to our customers. Currently, there are a limited number of devices that offer the portable subscription functionality that is required to support our Napster To Go and Napster Mobile services and certain current manufacturers may not be able to profitably continue to offer existing devices. Our subscription service is not currently compatible with the Apple lines of products, which include the iPod music player, the current equipment market leader, and the iPhone. If we cannot successfully design our service to interoperate with the music playback devices that our customers own, or if music-enabled devices fail to grow significantly over time, our business will be harmed.
We may not successfully develop new products and services.
The success of our digital music distribution services will depend on our ability to develop leading-edge media and digital distribution products and services. Our business and operating results will be harmed if we fail to develop products and services that achieve widespread market acceptance or that fail to generate significant revenues or gross profits to offset our development and operating costs. We may not timely and successfully identify, develop and market new product and service opportunities.
Additionally, we may not be able to add new content such as video, spoken word or other content as quickly or as efficiently as our competitors or at all. If we introduce new products and services, they may not attain broad market acceptance or contribute meaningfully to our revenues or profitability. Competitive or technological developments may require us to make substantial, unanticipated investments in new products and technologies, and we may not have sufficient resources to make these investments.
Because the markets for our products and services are changing rapidly, we must develop new offerings quickly. Delays and cost overruns could affect our ability to respond to technological changes, evolving industry standards, competitive developments or customer requirements. Our products also may contain undetected errors that could cause increased development costs, loss of revenues, adverse publicity, reduced market acceptance of our products or services or lawsuits by customers.
We must maintain and add to our strategic marketing relationships in order to be successful.
We depend on a number of strategic relationships with third parties to co-market our services. We have entered into co-marketing agreements with infrastructure providers, mobile carriers, retailers, hardware manufacturers and other companies to broaden the distribution of our brand and our services. There is no guarantee that we will be able to renew existing agreements or enter into new agreements on acceptable terms, or at all. If we cannot maintain existing strategic relationships or enter into new relationships, our ability to market our services will be harmed.
In addition, because of the rapidly evolving nature of digital music distribution and our short history of operations, we often enter into strategic agreements where the financial impact on our business and operations is uncertain. We cannot guarantee that any of these agreements will result in the desired benefits to our business or result in significant additional revenue.
11
Our network is subject to security and stability risks that could harm our business and reputation and expose us to litigation or liability.
Online and mobile commerce and communications depend on the ability to transmit confidential information and licensed intellectual property securely over private and public networks. Any compromise of our ability to transmit such information and data securely or reliably, and any costs associated with preventing or eliminating such problems, could harm our business. Online transmissions are subject to a number of security and stability risks, including:
| | • | | our own or licensed encryption and authentication technology, and access and security procedures, may be compromised, breached or otherwise be insufficient to ensure the security of customer information or our music content; |
| | • | | we could experience unauthorized access, computer viruses, system interference or destruction, “denial of service” attacks and other disruptive problems, whether intentional or accidental, that may inhibit or prevent access to our websites or use of our products and services; |
| | • | | someone could circumvent our security measures and misappropriate our, our partners’ or our customers’ intellectual property, interrupt our operations, or jeopardize our licensing arrangements, which are contingent on our sustaining appropriate security protections; |
| | • | | our computer systems could fail and lead to service interruptions; |
| | • | | our mobile partners’ wireless networks or other infrastructure could fail; |
| | • | | we may be unable to scale our infrastructure with increases in customer demand; or |
| | • | | our network of facilities may be affected by a natural disaster, terrorist attack or other catastrophic events. |
The occurrence of any of these or similar events could damage our business, hurt our ability to distribute products and services and collect revenue, threaten the proprietary or confidential nature of our technology, harm our reputation and expose us to litigation or liability. We may be required to expend significant capital or other resources to protect against the threat of security breaches, hacker attacks or system malfunctions or to alleviate problems caused by such breaches, attacks or failures.
If we fail to manage expansion effectively, we may not be able to successfully manage our business, which could cause us to fail to meet our customer demand or to attract new customers, which would adversely affect our revenue.
Our ability to successfully offer our products and services and implement our business plan in a rapidly evolving market requires an effective planning and management process. We plan to continue to increase the scope of our digital music distribution operations domestically and internationally. This anticipated growth in future operations may place a significant strain on our management resources that could distract management’s attention and result in our failure to execute our business plan.
We may be unable to adequately protect our proprietary rights.
Our inability to protect our proprietary rights, and the costs of failing to do so, could harm our business. Our success and ability to compete partly depend on the superiority, uniqueness or value of our technology, including both internally developed technology and technology licensed from third parties. To protect our proprietary rights, we rely on a combination of patent, trademark, copyright and trade secret laws, confidentiality agreements with our employees and third parties, and protective contractual provisions. These efforts to protect our intellectual property rights may not be effective in preventing misappropriation of our technology. These efforts also may not prevent the development and design by others of products or technologies similar to, competitive with or superior to those we develop. Any of these results could reduce the value of our intellectual property. We may be forced to litigate to enforce or defend our intellectual property rights and to protect our trade secrets. Any such litigation could be very costly and could distract our management from focusing on operating our business.
12
A significant portion of the revenues from our digital music distribution business is derived from international revenues. Economic, political, regulatory and other risks associated with international revenues and operations could have an adverse effect on our revenues.
Because we operate in the Americas, Japan and Europe, our business is subject to risks associated with doing business internationally. Revenues from international operations have represented a significant portion of our total net revenues from our digital music distribution business. We anticipate that revenues from international operations will continue to represent a substantial portion of our total net revenues as we expand our Napster and Napster Mobile services abroad and enter into additional joint venture arrangements and other strategic partnerships, if any, with international partners. Accordingly, our future revenues could decrease based on a variety of factors, including:
| | • | | disputes with our international joint venture partners; |
| | • | | dilution of our interest and degree of control over our joint venture |
| | • | | mismanagement or fraud by our international joint venture partners; |
| | • | | changes in foreign currency exchange rates; |
| | • | | seasonal fluctuations in sales of our prepaid cards as well as other products and services internationally; |
| | • | | changes in a specific country’s or region’s political or economic condition, particularly in emerging markets; |
| | • | | unexpected changes in foreign laws and regulatory requirements; |
| | • | | difficulty of effective enforcement of contractual provisions in local jurisdictions; |
| | • | | trade protection measures and import or export licensing requirements; |
| | • | | potentially adverse tax consequences including changes to the VAT collection scheme; |
| | • | | difficulty in managing widespread sales operations; and |
| | • | | less effective protection of intellectual property in foreign jurisdictions. |
We depend on key personnel who may not continue to work for us.
Our success substantially depends on the continued employment of certain executive officers and key employees, including, for example, Christopher Gorog, our Chief Executive Officer. The loss of his services could harm our business. If Mr. Gorog were to leave our company, we could face substantial difficulty in hiring a qualified successor and could experience a loss in productivity while any such successor obtains the necessary training and experience.
To grow our business, we must be able to hire and retain sufficient qualified technical, sales, marketing and administrative personnel.
Our future success depends in part on our ability to attract and retain engineering, sales, marketing, finance, administrative and customer support personnel. If we fail to retain and hire a sufficient number of these employees, we will not be able to maintain and expand our business. We cannot assure you that we will be able to hire and retain a sufficient number of qualified personnel to meet our business objectives.
13
We may be subject to intellectual property infringement claims, which are costly to defend and could limit our ability to use certain technologies in the future.
Many parties are actively developing streaming media and digital distribution-related technologies, e-commerce and other web-related technologies, as well as a variety of online business methods and models. We believe that these parties will continue to take steps to protect these technologies, including, but not limited to, seeking patent protection. As a result, disputes regarding the ownership of these technologies and rights associated with streaming media, digital distribution and online businesses are likely to arise in the future and may be very costly. In addition to existing patents and intellectual property rights, we anticipate that additional third-party patents related to our products and services will be issued in the future. If a blocking patent has been issued or is issued in the future, we would need to either obtain a license or design around the patent. We may not be able to obtain such a license on acceptable terms, if at all, or design around the patent, which could harm our business.
Companies in the technology and content-related industries have frequently been subjected to litigation regarding intellectual property rights. In addition, we believe these industries are experiencing an increased level of litigation to determine the applicability of current laws to, and the impact of new technologies on, the use and distribution of content over the Internet and through new devices, especially in the music industry. From time to time, we receive claims and inquiries from third parties alleging that our internally developed technology, or technology we license from third parties, may infringe their proprietary rights, especially patents. Third parties have also asserted and most likely will continue to assert claims against us alleging infringement of copyrights, trademark rights, or other proprietary rights, or alleging unfair competition or violations of privacy rights. As we continue to develop and introduce products and services that provide or enable the provision of content, our litigation risk may increase. As a result, we could be required to spend significant amounts of time and money to defend ourselves against such claims. If any of these claims were to prevail, we could be forced to pay damages, comply with injunctions, or stop distributing our products and services while we re-engineer them or seek licenses to necessary technology, which might not be available on reasonable terms, or at all. We could also be subject to claims for indemnification resulting from infringement claims made against our customers and strategic partners, which could increase our defense costs and potential damages. Any of these events could require us to change our business practices and could harm our business.
A decline in current levels of consumer spending could reduce our sales.
Our business is directly affected by the level of consumer spending. One of the primary factors that affects consumer spending is the general state of the local economies in which we operate. Lower levels of consumer spending in regions in which we have significant operations could have a negative impact on our business, financial condition or results of operations.
We may need additional capital, and we cannot be sure that additional financing will be available.
Although we currently anticipate that our available funds and expected cash flows from operations will be sufficient to meet our cash needs for at least the next twelve months, we may require additional financing. Our ability to obtain financing will depend, among other things, on our development efforts, business plans, operating performance and condition of the capital markets at the time we seek financing. We expect to experience operating losses from our digital music distribution business in at least the short-term. We cannot assure you that additional financing will be available to us on favorable terms when required, or at all. If we raise additional funds through the issuance of equity, equity-linked or debt securities, those securities may have rights, preferences or privileges senior to the rights of our common stock, and our stockholders may experience dilution.
14
We are subject to risks associated with governmental regulation and legal uncertainties.
Few existing laws or regulations specifically apply to the Internet, other than laws and regulations generally applicable to businesses. Certain United States export controls and import controls of other countries, including controls on the use of encryption technologies, may apply to our products. Many laws and regulations, however, are pending and may be adopted in the United States, individual states, and local jurisdictions and other countries with respect to the Internet. In addition, as we conduct more business via mobile platforms in multiple countries, our business will likely be impacted by additional laws and regulations that are applicable to the mobile space. These laws may relate to many areas that impact our business, including content issues (such as obscenity, indecency and defamation), copyright and other intellectual property rights, digital rights management, encryption, caching of content by server products, personal privacy, taxation, e-mail, sweepstakes, promotions, prepaid card expiration, escheatment, network and information security and the convergence of traditional communication services with Internet communications, including the future availability of broadband transmission capability and wireless networks. These types of regulations are likely to differ between countries and other political and geographic divisions. Other countries and political organizations are likely to impose or favor more and/or different regulations than that which has been proposed in the United States, thus furthering the complexity of regulation. In addition, state and local governments may impose regulations in addition to, inconsistent with, or stricter than federal regulations. The adoption of such laws or regulations, and uncertainties associated with their validity, interpretation, applicability and enforcement, may affect the available distribution channels for and costs associated with our products and services and may affect the growth of the Internet. Such laws or regulations may harm our business. Our products and services may also become subject to investigation and regulation of foreign data protection and e-commerce authorities, including those in the European Union. Such activities could result in additional product and distribution costs for us in order to comply with such regulations.
We do not know for certain how existing laws governing issues such as property ownership, copyright and other intellectual property issues, digital rights management, taxation, security, illegal or obscene content, retransmission of media, personal privacy and data protection apply to the Internet. The vast majority of such laws were adopted before the advent of the Internet and related technologies and do not address the unique issues associated with the Internet and related technologies. Most of the laws that relate to the Internet have not yet been interpreted. In addition to potential legislation from local, state and federal governments, labor guild agreements and other laws and regulations that impose fees, royalties or unanticipated payments regarding the distribution of media over the Internet may directly or indirectly affect our business. While we and our customers may be directly affected by such agreements, we are not a party to such agreements and have little ability to influence the degree to which such agreements favor or disfavor Internet distribution or our business models. Changes to or the interpretation of these laws and the entry into such industry agreements could:
| | • | | limit the growth of the Internet; |
| | • | | create uncertainty in the marketplace that could reduce demand for our products and services; |
| | • | | increase our cost of doing business; |
| | • | | expose us to increased litigation risk, substantial defense costs and significant liabilities associated with content available on our websites or distributed or accessed through our products or services, with our provision of products and services and with the features or performance of our products and websites; |
| | • | | lead to increased product development costs or otherwise harm our business; or |
| | • | | decrease the rate of growth of our user base and limit our ability to effectively communicate with and market to our user base. |
15
The Child Online Protection Act and the Child Online Privacy Protection Act impose civil and criminal penalties on persons distributing material harmful to minors (e.g., obscene material) over the Internet to persons under the age of 17, or collecting personal information from children under the age of 13. While we do not knowingly distribute harmful materials to minors or collect personal information from children under the age of 13, the manner in which these Acts may be interpreted and enforced cannot be fully determined, and future legislation similar to these Acts could subject us to potential liability if we were deemed to be non-compliant with such rules and regulations, which in turn could harm our business.
There are a large number of legislative proposals before the United States Congress and various state legislatures regarding intellectual property, digital rights management, copy protection requirements, privacy, email marketing and security issues related to our business. Furthermore, as part of our regular business activities now, and in the past, we engage in the issuance of gift cards redeemable for our services. It is possible that money received by us for the sale of gift cards could be subject to state and federal escheatment, or unclaimed property, laws in the future. If this were the case, our business could be adversely impacted. It is not possible to predict whether or when such legislation may be adopted, and certain proposals, if adopted, could materially and adversely affect our business through a decrease in user registration and revenue, and influence how and whether we can communicate with our customers.
We may be subject to assessment of additional sales and other taxes for the sale of our products, license of technology or provision of services.
We do not currently collect sales or other taxes on the sale of our products, license of technology or provision of services in states and countries other than those in which we have offices or employees. Our business would be harmed if one or more states or any foreign country were to require us to collect sales or other taxes from past sales or income related to products, licenses of technology or provision of services.
We may be subject to market risk and legal liability in connection with the data collection capabilities of our products and services.
Many of our products are interactive Internet or mobile applications which by their very nature require communication between a client and server to operate. To provide better consumer experiences and to operate effectively, our products send information to servers. Many of the services we provide also require that a user provide certain information to us. We post an extensive privacy policy concerning the collection, use and disclosure of user data involved in interactions between our client and server products. Any failure by us to comply with our posted privacy policy and existing or new legislation regarding privacy issues could impact the market for our products and services, subject us to litigation and harm our business.
If, in the future, we conclude that our internal control over financial reporting is not effective, or if our auditors conclude that our internal control over financial reporting is not effective, investors could lose confidence in the reliability of our financial statements, which could result in a decrease in the value of our common stock.
As directed by Section 404 of the Sarbanes-Oxley Act of 2002, the Securities and Exchange Commission (“SEC”) adopted rules requiring public companies to include a report of management on the company’s internal control over financial reporting in their annual reports on Form 10-K. This report is required to contain an assessment by management of the effectiveness of such company’s internal control over financial reporting. There is a risk that in the future we may identify internal control deficiencies that suggest that our controls are no longer effective. This could result in an adverse reaction in the financial markets due to a loss of confidence in the reliability of our financial statements, which could cause the market price of our common stock to decline and make it more difficult for us to finance our operations.
16
The effectiveness of our disclosure and internal controls may be limited.
Our disclosure controls and procedures and internal control over financial reporting may not prevent all errors and misrepresentations. In the event that there are errors or misrepresentations in our historical financial statements or the SEC disagrees with our accounting, we may need to restate our financial statements. For example, in November 2004 we restated our financial statements in order to correct the valuation of a previously issued warrant and to adjust the purchase accounting of our former subsidiary, MGI Software, and in May 2005 we restated our financial statements to reallocate the tax benefit of certain operating losses from our discontinued operations to our continuing operations. Any system of internal controls can only provide reasonable assurance that all control objectives are met. Some of the potential risks involved could include, but are not limited to, management judgments, simple errors or mistakes, willful misconduct regarding controls or misinterpretation. There is no guarantee that existing controls will prevent or detect all material issues or be effective in future conditions, which could materially and adversely impact our financial results in the future.
Provisions in our agreements, charter documents, stockholder rights plan and Delaware law may delay or prevent acquisition of us, which could decrease the value of our stock.
Our certificate of incorporation and bylaws and Delaware law contain provisions that could make it more difficult for a third party to acquire us without the consent of our board of directors. These provisions include a classified board of directors and limitations on actions by our stockholders by written consent. In addition, our board of directors has the right to issue preferred stock without stockholder approval, which could be used to dilute the stock ownership of a potential hostile acquirer. Delaware law also imposes some restrictions on mergers and other business combinations between us and any holder of 15% or more of our outstanding common stock. In addition, we have adopted a stockholder rights plan that makes it more difficult for a third party to acquire us without the approval of our board of directors. Although we believe these provisions provide for an opportunity to receive a higher bid by requiring potential acquirers to negotiate with our board of directors, these provisions apply even if the offer may be considered beneficial by some stockholders.
Negative conditions in the global credit markets may impair the liquidity of a portion of our investment portfolio.
Our short-term investments include one AAA rated auction-rate security of $3.0 million par value. The underlying assets of this security are student loans generally guaranteed by the U.S. government.The recent negative conditions in the global credit markets have prevented most investors from liquidating their holdings of auction rate securities, because the amount of securities submitted for sale has exceeded the amount of purchase orders for such securities. If the credit market does not improve, auctions for our invested amounts may fail. If an auction fails for a security in which we have invested, we may be unable to liquidate our auction rate security at par, should we need or desire to access the funds invested in that security. In the event we need or desire to access these funds, we will not be able to do so until a future auction on this investment is successful or a buyer is found outside the auction process. If a buyer is found but is unwilling to purchase the investment at par, we may incur a loss. As of March 31, 2008, the market value of the auction-rate security we owned was valued at par; however, future rating downgrades of the security issuer or the third-parties insuring such investments may require us to adjust the carrying value of these investments through an impairment charge.
17
We may be required to recognize impairment charges related to goodwill and amortizable intangible assets.
Our goodwill or amortizable intangible assets may become impaired and we may be required to record a significant charge to earnings. We test our goodwill for impairment at least annually and we review our amortizable intangible assets for impairment whenever events or changes in circumstances indicate the carrying value may not be recoverable. Factors that may be considered a change in circumstances indicating that the carrying value of our goodwill or amortizable intangible assets may not be recoverable include a decline in stock price and market capitalization, future cash flows, and slower growth rates in our industry. We may be required to record a significant charge to earnings in our financial statements during the period in which any impairment of our goodwill or amortizable intangible assets is identified resulting in an impact on our results of operations.
| ITEM 1B. | UNRESOLVED STAFF COMMENTS |
None.
Our principal executive offices are located in Los Angeles, California. The table below lists our principal leased or licensed facilities as of June 1, 2008.
| | | | | | |
Location | | Description | | Approximate
Square Footage | | Lease
Expiration |
Los Angeles, California | | Corp. Headquarters | | 15,000 | | October 2011 |
San Diego, California | | Office | | 6,900 | | May 2010 |
We believe that our leased facilities are adequate to meet our current needs and that additional facilities will be available to meet our development and expansion needs on commercially reasonable terms.
18
The information relating to legal proceedings contained in Note 12 to the Consolidated Financial Statements included in this Annual Report is incorporated into Item 3 of this annual report by this reference.
| ITEM 4. | SUBMISSION OF MATTERS TO A VOTE OF SECURITY HOLDERS |
None.
19
EXECUTIVE OFFICERS OF THE REGISTRANT
The following table sets forth certain information with respect to our executive officers:
| | | | |
Name | | Age | | Position |
Wm. Christopher Gorog | | 55 | | Chief Executive Officer and Chairman of the Board of Directors |
Bradford D. Duea | | 39 | | President |
Christopher Allen | | 42 | | Chief Operating Officer |
Suzanne M. Colvin | | 44 | | Vice President, Finance and Interim Chief Financial Officer |
Wm. Christopher Goroghas served as our chief executive officer and director since September 2000. From September 2000 through May 2003, Mr. Gorog also served as our president. In September 2001, Mr. Gorog was elected chairman of our Board of Directors. From February 1999 to September 2000, Mr. Gorog served as a consultant in the entertainment and media industry, including serving as advisor to J.H. Whitney, an asset management company, in HOB Entertainment, Inc.’s acquisition of Universal Concerts. From November 1995 to February 1999, Mr. Gorog served as president of new business development at Universal Studios, an entertainment company. From January 1995 to November 1995, Mr. Gorog served as executive vice president of group operations at Universal Studios. Mr. Gorog earned a B.A.S. in Telecommunications and Film from San Diego State University.
Bradford D. Duea has served as our president since January 2004. Prior to that, from February 2001 through January 2004, Mr. Duea served in various roles with us, including vice president of business development and vice president of worldwide OEM sales. From January 2000 to February 2001, Mr. Duea served as vice president, corporate development and corporate secretary of People Support, Inc., a provider of electronic customer relationship management solutions. From September 1996 to January 2000, Mr. Duea was an associate of O’Melveny & Myers LLP, a law firm. Mr. Duea holds a B.A. in Law and Society from the University of California at Santa Barbara, an M.B.A. in Finance and International Business from the University of Southern California, and a J.D. from the University of San Diego.
Christopher Allenhas served as our chief operating officer since August 6, 2007. Mr. Allen most recently served as vice president, product strategy, design, and marketing for Blockbuster Online. Prior to Blockbuster, Mr. Allen served as vice president of product strategy and marketing at Yahoo! Music. Mr. Allen joined Yahoo! Music in 2004 with that company's acquisition of Musicmatch. From early 2000 to 2004, Mr. Allen served as senior vice president of marketing and strategic planning at Musicmatch. Prior to early 2000, Mr. Allen was a co-founder and head of product marketing and strategic planning at Kablink, an online photo service company. Previously, he spent more than 10 years in product management at pioneering companies AT&T and NCR working on data warehouse decision support, predictive analysis, and business intelligence/CRM initiatives. Mr. Allen received a B.S. in electrical engineering from the University of Notre Dame, an M.S. in electrical engineering and computer science from the Georgia Institute of Technology, and an M.B.A. from the University of San Diego.
Suzanne M. Colvin has served as our vice president, finance, since April 2004 and became our interim CFO in January 2008. From July 1999 to April 2004, Ms. Colvin served as vice president, finance at Exodus Communications and its successor companies Cable & Wireless America and Savvis Communications. From June 1998 to July 1999, Ms. Colvin was vice president, finance, controller for Cohesive Technology Solutions, an IT Services firm that was acquired by Exodus Communications in July 1999. Ms. Colvin began her professional career as an auditor at Price Waterhouse where she worked for 8 years in their San Jose California High Technology Practice. Ms. Colvin received a B.S. in Business Administration with a concentration in Accounting from California Polytechnic State University, San Luis Obispo, and she holds an active CPA certification.
20
PART II
| ITEM 5. | MARKET FOR REGISTRANT’S COMMON EQUITY, RELATED STOCKHOLDER MATTERS AND ISSUER PURCHASES OF EQUITY SECURITIES |
Dividend Policy
We have never declared or paid any cash dividends on our capital stock. We currently intend to retain all available funds and any future earnings for use in the operation and expansion of our business and do not anticipate paying any cash dividends in the foreseeable future.
Price Range of Common Stock
Our common stock is listed on the Nasdaq Global Market under the symbol “NAPS”. The approximate number of holders of record of our common stock as of May 31, 2008 was 750.
Our common stock was first listed on the Nasdaq National Market on May 4, 2001. The range of high and low sales prices of our common stock, as reported by the Nasdaq Global Market (and previously the National Market System), for fiscal 2007 and 2008 is as follows:
| | | | | | |
Quarter Ended | | High | | Low |
June 30, 2006 | | $ | 5.10 | | $ | 2.95 |
September 30, 2006 | | $ | 4.49 | | $ | 2.55 |
December 31, 2006 | | $ | 4.92 | | $ | 3.51 |
March 31, 2007 | | $ | 4.49 | | $ | 3.55 |
June 30, 2007 | | $ | 4.46 | | $ | 3.33 |
September 30, 2007 | | $ | 3.41 | | $ | 2.45 |
December 31, 2007 | | $ | 3.71 | | $ | 1.89 |
March 31, 2008 | | $ | 2.12 | | $ | 1.33 |
21
Company Stock Price Performance
Set forth below is a line graph comparing the percentage change in the cumulative total return on our common stock with the cumulative total return of the Nasdaq Composite Index for the Nasdaq Stock Market (U.S. Companies), and the S&P North American Technology Internet Index for the period commencing on March 31, 2003 and ending on March 31, 2008. The graph assumes that $100 was invested in Napster common stock and in each of the other indexes on March 31, 2003 and that all dividends were reinvested.
The comparisons in the graph below are based on historical data (with Napster common stock prices based on the closing price on the dates indicated) and are not intended to forecast the possible future performance of our common stock.
The following performance graph shall not be deemed to be soliciting material or to be filed with the Securities and Exchange Commission under the Securities Act of 1933, as amended, or the Securities Exchange Act of 1934, as amended, or incorporated by reference in any document so filed.
Comparison of Cumulative Total Return
Among Napster, the Nasdaq Composite Index, and the S&P North American Technology Internet Index for the Nasdaq Stock Market (U.S. Companies)
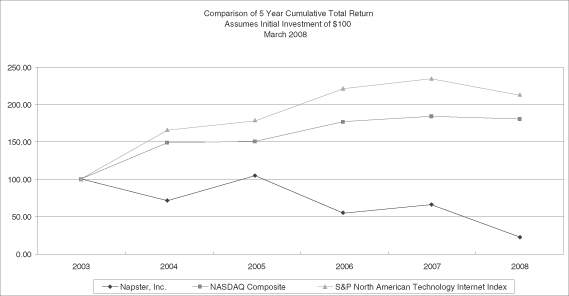
The above indexes are the most comparable indexes to the indexes used in the prior years. Both of the indexes used in the prior year report ceased to exist.
In accordance with the terms applicable to restricted stock awards to our employees, we require our employees to deliver shares of our common stock to us in order to satisfy any applicable tax withholding requirements that arise in connection with the vesting of their restricted stock awards. During the three months ended March 31, 2008, our employees delivered 816 shares of our common stock to us to satisfy tax-withholding obligations with respect to restricted stock awards that vested during such period.
22
| ITEM 6. | SELECTED FINANCIAL DATA |
The following selected consolidated financial data of Napster reflect our historical operating results and balance sheet data. Our consolidated statement of operations data set forth below for the years ended March 31, 2008, 2007, 2006, 2005, and 2004 and the consolidated balance sheet data as of March 31, 2008, 2007, 2006, 2005 and 2004 are derived from consolidated financial statements. The audited consolidated statements of operations for the years ended March 31, 2008, 2007 and 2006 and the audited consolidated balance sheets as of March 31, 2008 and 2007 are included elsewhere in this Report. This selected historical consolidated financial data is not necessarily indicative of our future performance and should be read in conjunction with those financial statements and the notes thereto and with “Management’s Discussion and Analysis of Financial Condition and Results of Operations” also included elsewhere in this Report.
The following selected financial information reflects our online music division as a continuing operation and our previously owned consumer software division as a discontinued operation.
| | | | | | | | | | | | | | | | | | | | |
| | | Year Ended March 31, | |
| | | 2008 | | | 2007 | | | 2006 | | | 2005 | | | 2004 | |
| | | (in thousands, except per share amounts) | |
Net revenues | | $ | 127,452 | | | $ | 111,081 | | | $ | 94,691 | | | $ | 46,729 | | | $ | 11,964 | |
Cost of revenues(1) | | | 91,106 | | | | 78,646 | | | | 69,208 | | | | 37,550 | | | | 10,530 | |
| | | | | | | | | | | | | | | | | | | | |
Gross margin | | | 36,346 | | | | 32,435 | | | | 25,483 | | | | 9,179 | | | | 1,434 | |
| | | | | | | | | | | | | | | | | | | | |
Operating expenses: | | | | | | | | | | | | | | | | | | | | |
Research and development(1) | | | 9,685 | | | | 11,045 | | | | 13,137 | | | | 12,112 | | | | 11,952 | |
Sales and marketing(1) | | | 17,963 | | | | 34,213 | | | | 51,741 | | | | 39,249 | | | | 15,701 | |
General and administrative(1) | | | 23,284 | | | | 24,311 | | | | 20,881 | | | | 23,953 | | | | 22,055 | |
Restructuring charges | | | — | | | | — | | | | — | | | | — | | | | 1,119 | |
Amortization of intangible assets | | | 4,169 | | | | 271 | | | | 1,265 | | | | 1,936 | | | | 2,172 | |
| | | | | | | | | | | | | | | | | | | | |
Total operating expenses | | | 55,101 | | | | 69,840 | | | | 87,024 | | | | 77,250 | | | | 52,999 | |
| | | | | | | | | | | | | | | | | | | | |
Loss from continuing operations | | | (18,755 | ) | | | (37,405 | ) | | | (61,541 | ) | | | (68,071 | ) | | | (51,565 | ) |
Other income, net | | | 3,458 | | | | 4,018 | | | | 2,811 | | | | 1,091 | | | | 634 | |
| | | | | | | | | | | | | | | | | | | | |
Loss before income tax benefit (provision) | | | (15,297 | ) | | | (33,387 | ) | | | (58,730 | ) | | | (66,980 | ) | | | (50,931 | ) |
Income tax benefit (provision) | | | (1,155 | ) | | | (1,257 | ) | | | 1,160 | | | | 15,547 | | | | 4,515 | |
Loss from unconsolidated entity | | | — | | | | (1,991 | ) | | | (289 | ) | | | — | | | | — | |
| | | | | | | | | | | | | | | | | | | | |
Loss from continuing operations, after income taxes | | | (16,452 | ) | | | (36,635 | ) | | | (57,859 | ) | | | (51,433 | ) | | | (46,416 | ) |
Income (loss) from discontinued operations, net of tax effect | | | — | | | | (191 | ) | | | 2,914 | | | | 21,927 | | | | 2,003 | |
| | | | | | | | | | | | | | | | | | | | |
Net loss | | $ | (16,452 | ) | | $ | (36,826 | ) | | $ | (54,945 | ) | | $ | (29,506 | ) | | $ | (44,413 | ) |
| | | | | | | | | | | | | | | | | | | | |
Basic and diluted net loss per share: | | | | | | | | | | | | | | | | | | | | |
Net loss per share from continuing operations | | $ | (0.38 | ) | | $ | (0.85 | ) | | $ | (1.35 | ) | | $ | (1.43 | ) | | $ | (1.69 | ) |
Net income (loss) per share from discontinued operations | | $ | — | | | $ | (0.00 | ) | | $ | 0.07 | | | $ | 0.61 | | | $ | 0.07 | |
| | | | | | | | | | | | | | | | | | | | |
Basic and diluted net loss per share | | $ | (0.38 | ) | | $ | (0.85 | ) | | $ | (1.28 | ) | | $ | (0.82 | ) | | $ | (1.62 | ) |
| | | | | | | | | | | | | | | | | | | | |
Weighted average shares used in computing net loss per share Basic and diluted | | | 43,537 | | | | 43,187 | | | | 42,989 | | | | 36,065 | | | | 27,496 | |
| | | | | | | | | | | | | | | | | | | | |
23
| (1) | | Amounts reported in continuing operations include stock-based compensation expense as follows (in thousands): |
| | | | | | | | | | | | | | | |
| | | Year Ended March 31, |
| | | 2008 | | 2007 | | 2006 | | 2005 | | 2004 |
Cost of revenues | | $ | 81 | | $ | 36 | | $ | 5 | | $ | — | | $ | — |
Research and development | | | 1,004 | | | 754 | | | 164 | | | 5 | | | 12 |
Sales and marketing | | | 521 | | | 518 | | | 74 | | | 34 | | | 54 |
General and administrative | | | 2,558 | | | 3,177 | | | 699 | | | 637 | | | 838 |
| | | | | | | | | | | | | | | |
| | $ | 4,164 | | $ | 4,485 | | $ | 942 | | $ | 676 | | $ | 904 |
| | | | | | | | | | | | | | | |
| |
| | | March 31, |
| | | 2008 | | 2007 | | 2006 | | 2005 | | 2004 |
| | | (in thousands) |
Consolidated Balance Sheet Data: | | | | | | | | | | | | | | | |
Working capital | | $ | 35,061 | | $ | 41,042 | | $ | 74,406 | | $ | 131,535 | | $ | 35,373 |
Total assets | | | 116,307 | | | 121,729 | | | 155,541 | | | 220,882 | | | 201,987 |
Long-term capital lease | | | 8 | | | 13 | | | 17 | | | 30 | | | 68 |
Total stockholders’ equity | | | 72,301 | | | 84,706 | | | 115,773 | | | 171,393 | | | 143,020 |
24
| ITEM 7. | MANAGEMENT’S DISCUSSION AND ANALYSIS OF FINANCIAL CONDITION AND RESULTS OF OPERATIONS |
The following discussion should be read in conjunction with the financial statements and notes thereto included elsewhere in this Report. The following discussion contains forward-looking statements that involve risks and uncertainties. Our actual results could differ materially from the results contemplated by these forward-looking statements due to certain factors, including those discussed in Item IA, “Risk Factors”, and elsewhere in this Report.
As discussed further in the “Executive Summary” section below, we completed the sale of our Consumer Software Division (“CSD”) in December 2004. Unless otherwise indicated, Management’s Discussion and Analysis of Financial Condition and Results of Operations relate to our continuing operations.
Overview
This overview provides our perspective on the following individual sections of Management’s Discussion and Analysis:
| | • | | Executive Summary—a high level discussion of the business including a discussion of our strategy, opportunities, challenges and risks. |
| | • | | Significant Transactions—a discussion of our significant acquisitions and divestitures. |
| | • | | Critical Accounting Policies and Estimates—a discussion of accounting policies that require critical judgments and estimates. |
| | • | | Results of Operations—an analysis of our consolidated results of operations for the years presented in our financial statements. |
| | • | | Liquidity and Capital Resources—an analysis of cash flows, sources and uses of cash, and contractual obligations. |
| | • | | Recent Accounting Pronouncements—information on recent accounting pronouncements. |
Executive Summary
Napster, a pioneer in digital music, offers interactive music services that enable fans to sample, listen to, subscribe to and purchase from one of the world’s largest and most diverse online music catalogs utilizing secure and legal platforms anytime, anywhere. Napster users have access to songs from all major labels and thousands of independent labels, and have many ways to discover, share, acquire and enjoy new music and old favorites.
Subscribers to the Napster service receive unlimited access to our more than 6 million song catalog. Subscribers can either stream or download music with high quality sound and enjoy their music in an advertising-free environment. In addition, subscribers can access many features including radio, Billboard charts and community features, and are able to enjoy their music on a variety of media including personal computers, CDs, MP3 players, music-enabled cellular phones, PDAs and digital media devices for the living room.
All Napster users, whether subscribers or not, may listen to free music clips and may purchase full length music downloads. We offer downloads in the user-friendly, DRM-free, MP3 format, which is compatible with virtually any MP3 player or music phone, including the iPod and iPhone, in the United States. Outside the United States, we currently offer DRM downloads only.
Napster Mobile, our service available over certain carrier wireless networks, gives members access to our extensive song catalog via over-the-air downloads, ringtones, wallpapers as well as other personalization products.
Napster services are currently available in the Americas, Europe and Japan.
25
Until December 17, 2004, Napster was known as “Roxio, Inc.”, and we operated our business in two divisions, CSD and the online music distribution division, also known as Napster. On December 17, 2004, we completed the sale of substantially all of the assets and liabilities of CSD to Sonic Solutions, a California corporation (“Sonic”), including all of the capital stock of certain international subsidiaries. Since the sale of CSD, we have focused exclusively on our online music distribution business under the Napster brand and, since January 3, 2005, have been traded on the Nasdaq Stock Market under the symbol “NAPS”.
Napster was incorporated in Delaware in August 2000. Napster is headquartered in Los Angeles.
We derive our primary revenues from online subscriptions and permanent music downloads. The paid Napster service offers subscribers on-demand web access to a wide variety of music that can be streamed or downloaded as well as the ability to purchase individual tracks or albums on an a la carte basis. Subscription and permanent download fees are paid by end user customers in advance either via credit card, online payment systems or redemption of pre-paid cards, gift certificates or promotional codes. Napster’s Mobile service, offering over-the-air downloads, is paid by each applicable partner based on actual usage. Napster also periodically licenses merchandising rights and resells hardware that our end users may utilize to store and replay their digital music content.
From the acquisition of Pressplay on May 19, 2003 through the end of fiscal 2007, our digital music distribution business operated at a loss and with negative cash flow. During fiscal 2008, we operated at a loss, but achieved a positive cash flow. We expect to continue to operate at a loss in the near term due to our significant investments to enhance service capabilities, market our products and grow worldwide. We expect our existing cash resources to be sufficient to fund our operations for at least the next twelve months.
The market for digital music is rapidly growing and we expect our digital music distribution business to continue to grow as the industry expands. This market is highly competitive and we expect competition to continue to increase in the future as the market expands. We believe that our unique technology and feature set positions us ahead of many of our competitors. Our overall strategy is to continue to pursue and execute strategic partnerships, continue to innovate by investing in new services and technologies and continue to control our subscriber acquisition cost and customer turnover.
Significant Transactions
Strategic Partnership with AOL
On January 11, 2007, we entered into an Asset Purchase Agreement with AOL Music Now, LLC and AOL, LLC, collectively referred to as “AOL” and an Advertising Agreement with AOL, LLC, collectively the “Agreement”. Under the terms of the Agreement, all of the subscribers to the AOL Music Now service, together with certain related assets and liabilities, were transferred to Napster on March 15, 2007. Additionally, we were granted certain exclusive advertising rights throughout the AOL Music Channel for one year, and AOL guaranteed to deliver a minimum amount of advertising impressions to the Company. Under the terms of the Agreement, we paid a total of approximately $11.2 million to AOL, of which $8.0 million was allocated to customer intangible and $4.4 million to advertising activities that were completed in fiscal 2008, offset by $1.2 million of unearned fees.
Investment in Unconsolidated Entity
On October 14, 2005, we entered into a Joint Venture Operating Agreement with Tower Records Japan, Inc. ("Tower Japan"), relating to the formation and operation of a Japan-based joint venture company (the “Joint Venture") for the purpose of operating the Napster music service in Japan. During 2006, we contributed 308.7 million Japanese yen ($2.4 million as of the dates of the contributions) in exchange for a 31.5% ownership interest and Tower Japan contributed a total of 671.3 million Japanese yen for a 68.5% ownership interest. Tower Japan is obligated to arrange or provide debt or equity funding, including through an unsecured revolving line of credit. Napster has no obligation to fund future losses or make additional contributions other than the investment described above. Napster and Tower Japan have customary shareholder rights in the Joint Venture, including veto rights, rights to appoint directors and officers and rights of first refusal.
26
Under the terms of this agreement, we licensed intellectual property rights to the Joint Venture, including platform technology and trademarks, in exchange for certain royalties. Tower Japan is also obligated to support the Joint Venture’s marketing and advertising activities. The Joint Venture has exclusive rights to operate the Napster service in Japan, and launched its service during October 2006.
Critical Accounting Policies and Estimates
The preparation of financial statements in conformity with generally accepted accounting principles requires management to make estimates and assumptions that affect the amounts reported in the consolidated financial statements and accompanying notes. Note 1 to the Consolidated Financial Statements provides a summary of our significant accounting policies. Certain of these policies require substantial judgment on the part of management. On an ongoing basis, we evaluate significant estimates used in preparing our financial statements, including those related to:
| | • | | music publishing rights and music royalty accruals, |
| | • | | capitalized software development costs, |
| | • | | goodwill and long-lived intangible asset impairment |
| | • | | fair value of short-term investments, |
Actual results could differ from these estimates. These critical accounting policies and the effect that changes in management’s estimates could have on our consolidated financial statements are further described below.
Revenue Recognition
We recognize revenues in accordance with Staff Accounting Bulletin 104, “Revenue Recognition in Financial Statements”, EITF 00-21 “Revenue Arrangements with Multiple Deliverables” (“EITF 00-21”), and EITF 99-19, “Reporting Revenue Gross as a Principal versus Net as an Agent” (“EITF 99-19”). In general, we recognize revenue, net of sales related taxes, when there is persuasive evidence of an arrangement, the fee is fixed or determinable, the product or services have been delivered and collectability of the resulting receivable is reasonably assured.
Music subscriptions are paid in advance, typically for monthly or annual periods. Music subscription revenues are recognized ratably on a daily basis over the subscription period. Revenues from sales of individual songs or albums by download are recognized at the time the music is delivered, digitally, to the end user. Revenues from pre-paid cards and promotions are deferred and then generally recognized as (i) tracks are downloaded by the end users, or (ii) if redeemed for a subscription, over the subscription period. In cases where prepaid promotions are not expected to be redeemed, revenue is recognized when we have no further obligation to provide services or refund the associated prepayments (“breakage”). Effective in October 2006, revenue from prepaid cards is recognized ratably over the usage period, including estimated breakage based on historical experience. Prior to October 2006 we did not have sufficient historical experience to estimate prepaid card breakage rates, and recognized prepaid card breakage only when our obligation to honor the redemption of the prepaid card had legally expired. Revenues from licensing of Napster trademarks are recognized upon receipt of royalty reports from the licensee or, for prepaid royalties, when we provide or have no further obligation to provide services.
27
We have arrangements whereby customers pay one price for multiple products and services. In some cases, these arrangements involve a combination of hardware and services. In other cases, the customer pays a single price for multiple music downloads and months of music subscriptions. For arrangements with multiple deliverables, revenue is recognized upon the delivery of the separate units in accordance with EITF 00-21. Consideration from multiple element arrangements is allocated among the separate elements based on their relative fair values. In the event that there is no objective and reliable evidence of fair value, the revenue recognized upon delivery is the total arrangement consideration less the fair value of the undelivered items. The maximum revenue recognized on a delivered element is limited to the amount that is not contingent upon the delivery of additional items.
We have arrangements with certain customers whereby the customer provides goods or services to us. Our revenue and the charges for the goods or services provided by a customer are accounted for in accordance with EITF 01-09, “Accounting for Consideration Given by a Vendor to a Customer”, including subsequent interpretations. The costs of separately identifiable goods or services received by us from a customer are valued at the cost we would incur to procure the same goods or services from a non-customer third party. If the goods or services cannot be separated, the total consideration is recorded as a reduction of revenues. Consideration paid to customers under these arrangements that exceeds the separately identifiable value of the goods or services provided would be reflected as a reduction of the customer’s revenue.
We recognize revenue gross or net in accordance with EITF 99-19. In most arrangements, we contract directly with the end user customers, are the primary obligor and carry all collectability risk. Revenue in these arrangements is recorded on a gross basis. In some cases, we utilize third parties to sell products or services directly to end user customers, and we carry no collectability risk. In some cases, we pay certain costs for the third party and are reimbursed at cost plus a small mark-up. In both of those instances, we report the revenue net of the amounts paid to the third party.
Management exercises significant judgment in determining the fair value of multiple elements within revenue arrangements or separately identified goods or services, in assessing when prepaid promotions or royalties no longer involve a future obligation and in estimating future breakage rates. These estimates represent our best estimates, but changes in circumstances relating to the products and services sold in these arrangements could have a material impact on our financial position and results of operations.
Music Publishing Rights and Music Royalty Accruals
Under copyright law we are required to pay licensing fees for compositions embodied in digital sound recordings and for the sound recordings themselves that we deliver in our Napster service. Copyright law may not specify the rate and terms of the licenses, which are often determined by voluntary negotiations among the parties or, for certain compulsory publishing licenses where voluntary negotiations are unsuccessful, by arbitration. There are certain geographies and agencies where we do not have finalized rates to be applied to the current or historic sales of compositions within our digital music offerings. We accrue for the cost of these fees in accordance with Statement of Financial Accounting Standards (“SFAS”) No. 5, “Accounting for Contingencies” (“SFAS No. 5”), based on contracted or statutory rates, when established, or management’s best estimates based on facts and circumstances regarding the specific music services and agreements in similar geographies or with similar agencies. While Napster bases its estimates on historical experience and on various other assumptions that management believes to be reasonable under the circumstances, actual results may differ significantly from these estimates under different assumptions or conditions and, as a result, could have a material impact on our financial position and results of operations.
Capitalized Software Development Costs
Internal use software.Software development costs incurred as part of an approved project plan that result in additional functionality to internal use software are capitalized and amortized on a straight-line basis over the estimated useful life of the software, generally three years.
28
Software held for sale.Development costs of computer software to be sold, leased or otherwise marketed are subject to capitalization beginning when a product’s technological feasibility has been established and ending when a product is available for general release to customers. We have not capitalized any such software development costs as technological feasibility is generally not established until a working model is completed, at which time substantially all development is complete.
Management applies significant judgment when determining whether products under development are technologically feasible or whether it is probable that they will result in additional functionality. These judgments include assessments of our development progress and expected performance. Additionally, the future realizability of capitalized software costs is subject to regular review by management, who consider expected future benefits. The estimates of expected future benefits include judgments about growth in demand for our products, performance by our strategic partners and fair values for related services. Changes in these estimates could require us to write down the carrying value of these capitalized amounts, which could materially impact our financial position and results of operations.
Goodwill and Long-Lived Intangible Asset Impairment
We account for goodwill and identifiable intangible assets in accordance with SFAS No. 142, “Goodwill and Other Intangible Assets” (“SFAS No. 142”). We evaluate the carrying value of goodwill on an annual basis and more frequently if certain impairment indicators are present. We will adjust the carrying value if the asset’s value has been impaired.
Identifiable intangible assets are amortized over their estimated useful lives reflecting the pattern in which the economic benefits of the intangible assets are consumed. When circumstances warrant, Napster periodically evaluates any possible impairment of long-lived assets, including intangible assets other than goodwill.
Management exercises significant judgment in evaluating the carrying value of goodwill and determining the pattern of economic benefits for intangible assets. Changes in these estimates could require us to write down the carrying value of goodwill and long-lived intangible assets, which could materially impact our financial position and results of operations.
Fair Value of Short-term Investments
We classify our short-term investments into categories in accordance with the provisions of SFAS No. 115 “Accounting for Certain Investments in Debt and Equity Securities”. Short-term investments are classified as available-for-sale, which are reported at fair market value with the related unrealized gains and losses, net of taxes, included in other comprehensive income (loss). The fair value of our cash equivalents and investments are based on quoted market prices or management’s estimates based on the best information available in the circumstances.
We review our investment portfolio to identify and evaluate investments that have indications of other than temporary impairment. Factors considered in determining whether a loss is temporary include the magnitude of the decline in market value, the length of time the market value has been below cost (or adjusted cost), credit quality, and our ability and intent to hold the securities for a period of time sufficient to allow for any anticipated recovery in market value. Changes in these estimates could require us to write down the carrying value of these investments, which could materially impact our financial position and results of operations.
29
Income Taxes
We account for income taxes in accordance with SFAS No. 109, “Accounting for Income Taxes.” As part of the process of preparing our consolidated financial statements we are required to determine our income taxes in each of the jurisdictions in which we operate. This process involves determining our current tax expense together with assessing temporary differences resulting from differing treatment of items for tax and accounting purposes. These differences result in deferred tax assets and liabilities, which are included within our consolidated balance sheet. We must assess the likelihood that our deferred tax assets will be recovered from various means, including future taxable income, and, to the extent we believe that recovery is not more likely than not, we must establish a valuation allowance. To the extent we establish a valuation allowance or increase this allowance in a period, we must include an expense within the tax provision in the statement of operations. The above process is computed separately for each jurisdiction of continuing operations, the discontinued operation and elements of other comprehensive income.
Significant management judgment is required in determining our provision for income taxes, our deferred tax assets and liabilities and any valuation allowance recorded against our net deferred tax assets. As of March 31, 2008, we have recorded a full valuation allowance against our deferred tax assets, net of reversing deferred tax liabilities, due to uncertainties related to our ability to utilize our deferred tax assets, primarily consisting of net operating losses and accrued liabilities and other provisions not currently deductible for tax purposes. The timing of the reversal of the remaining deferred tax liability related to the election to step up the tax basis of the Pressplay goodwill is indefinite. The valuation allowance is based on our estimates of taxable income by jurisdiction in which we operate and the period over which our deferred tax assets will be recoverable. In the event that actual results differ from these estimates or we adjust these estimates in future periods, we may need to establish an additional valuation allowance, which could materially impact our financial position and results of operations.
Contingencies
We account for contingent liabilities in accordance with SFAS No. 5, pursuant to which contingent liabilities are recorded when it is probable that a liability has been incurred and the amount of the liability can be reasonably estimated.
Management applies significant judgment when estimating probable amounts of contingent liabilities. Future negotiations regarding the contingent obligations could cause the ultimate obligation to be less than or greater than the amount estimated. Changes in these estimates could require us to take additional charges or benefits in future periods, which could materially impact our financial position and results of operations.
Equity Instruments
Effective April 1, 2006, we adopted the provisions of SFAS No. 123 (revised 2004), “Share-Based Payment” (“SFAS No. 123(R)”), which requires the measurement and recognition of compensation expense for all stock-based awards issued to employees and directors based on estimated fair values, under the modified prospective method. Under SFAS No. 123(R), compensation expense for all share-based compensation awards is recognized on a straight-line basis over the period the employee performs the related services, generally the vesting period, net of estimated forfeitures. Napster estimates forfeitures based on historical experience and revises the rates, if necessary, in subsequent periods if actual forfeitures differ from previous estimates.
Management applies significant judgment when determining estimated forfeiture rates. While Napster bases its estimates on historical experience and on various other assumptions that management believes to be reasonable under the circumstances, actual results may differ significantly from these estimates under different assumptions or conditions and, as a result, could have a material impact on our financial position and results of operations.
30
Results of Operations
Fiscal 2008 as compared to fiscal 2007
The following table sets forth our results as a percentage of total net revenues for the periods indicated. These operating results are not necessarily indicative of the results for any future period.
| | | | | | |
| | | As a Percentage of Net Revenues
For the Year Ended March 31, | |
| | | 2008 | | | 2007 | |
Net revenues | | 100 | % | | 100 | % |
Cost of revenues | | 71 | % | | 71 | % |
| | | | | | |
Gross margin | | 29 | % | | 29 | % |
| | | | | | |
Operating expenses: | | | | | | |
Research and development | | 8 | % | | 10 | % |
Sales and marketing | | 14 | % | | 31 | % |
General and administrative | | 18 | % | | 22 | % |
Amortization of intangible assets | | 3 | % | | — | % |
| | | | | | |
Total operating expenses | | 43 | % | | 63 | % |
| | | | | | |
Loss from continuing operations | | (14 | )% | | (34 | )% |
Other income, net | | 3 | % | | 4 | % |
| | | | | | |
Loss before income tax benefit | | (11 | )% | | (30 | )% |
Income tax benefit (provision) | | (1 | )% | | (1 | )% |
Loss from unconsolidated entity | | — | % | | (2 | )% |
| | | | | | |
Net loss | | (12 | )% | | (33 | )% |
| | | | | | |
Net Revenues
The following table sets forth, for the periods indicated, the summary of our revenues by revenue type:
| | | | | | | | | | | | |
| | | Year Ended
March 31, | | As a Percentage of Net Revenues
For the Year Ended March 31, | |
| | | 2008 | | 2007 | | 2008 | | | 2007 | |
| | | (in thousands) | | | | | | |
Online music revenues: | | | | | | | | | | | | |
Service | | $ | 126,483 | | $ | 110,380 | | 99 | % | | 99 | % |
Product and trademark license | | | 969 | | | 701 | | 1 | % | | 1 | % |
| | | | | | | | | | | | |
Total online music revenues | | $ | 127,452 | | $ | 111,081 | | 100 | % | | 100 | % |
| | | | | | | | | | | | |
Service Revenues
Service revenues are comprised of the amounts we directly charged end users, net of refunds, our net proceeds from third parties that resell our services and for which we are required to report revenue “net” in accordance with EITF 99-19, royalties received on service revenues earned through our joint venture partnership, and other amounts received from third parties for the right to promote or distribute our services, net of any consideration paid to those customers in accordance with EITF 01-09.
31
Service revenues increased $16.1 million for fiscal 2008 compared to fiscal 2007 primarily due to a $21.9 million increase in revenues attributable to our subscribers offset by a $2.6 million decrease in revenues attributable to non-subscribers and a $3.2 million decrease in non-recurring service revenue items. Revenue from subscribers increased substantially due to the full year benefit of the AOL Music now subscribers that were transitioned in March 2007. It also increased due to organic growth as we added 21% more new paid subscribers world-wide during fiscal 2008 than fiscal 2007. Revenue from non-subscribers decreased slightly because our marketing campaigns focused on our subscription business. Non-recurring breakage revenue totaled $2.9 million in fiscal 2008 and was comprised of $1.9 million of subscription breakage revenue, $800,000 of royalty breakage revenue and approximately $200,000 of other service revenue.
We ended fiscal 2008 with 761,000 subscribers compared to 830,000 at the end of fiscal 2007. The March 31, 2007 subscribers included 225,000 subscribers transitioned from AOL Music now during mid-March 2007. These transitioned subscribers had an average subscription value that was lower than our previous average service revenue per subscriber. Adjusted for these subscriber additions, our average service revenue per subscriber was relatively flat year over year.
Since we are beginning fiscal 2009 with a lower subscriber base than the beginning of fiscal 2008, we anticipate that fiscal 2009 growth in service revenues will depend in part on consumer interest in new products, as well as growth and adoption of new compatible wireless handset devices. Near term, service revenues will be impacted by normal summer seasonality.
Product and License Revenues
Product and license revenues for fiscal 2008 increased $268,000 compared to fiscal 2007, primarily due to $700,000 of non-recurring trademark license revenue offset by the timing of hardware promotional programs. We expect that product and license revenues will continue to be a small portion of net revenues and fluctuate depending on our product promotions and trademark licenses that we enter into each quarter.
Geographic Revenues
The following table sets forth, for the periods indicated, the summary of our revenues by geography based on the entity that received the revenue:
| | | | | | | | | | | | |
| | | Year Ended
March 31, | | As a Percentage of Net Revenues
For the Year Ended March 31, | |
| | | 2008 | | 2007 | | 2008 | | | 2007 | |
| | | (in thousands) | | | | | | |
Revenues: | | | | | | | | | | | | |
North America | | $ | 104,191 | | $ | 92,227 | | 82 | % | | 83 | % |
Europe | | | 23,261 | | | 18,854 | | 18 | % | | 17 | % |
| | | | | | | | | | | | |
Net revenues | | $ | 127,452 | | $ | 111,081 | | 100 | % | | 100 | % |
| | | | | | | | | | | | |
North America revenue increased in fiscal 2008 compared to fiscal 2007 primarily due to growth in subscriber revenue offset by the fact that non-recurring revenue for fiscal 2008 declined $1.4 million compared to fiscal 2007.
European revenue increased in fiscal 2008 compared to fiscal 2007 primarily because our German operation launched in mid fiscal 2007 and we had a full year benefit of this business’ growth during fiscal 2008. This growth was offset by $1.1 million of non-recurring promotional revenue in fiscal 2007 compared to zero in fiscal 2008.
We anticipate that the proportion of revenue outside of the United States will fluctuate as a result of continued marketing activities and initiatives focused on world-wide customer growth.
32
Gross Margin
The following table sets forth, for the periods indicated, our gross margin:
| | | | | | | | | | | | | | |
| | | Year Ended
March 31, | | | As a Percentage of Related Revenues
For the Year Ended March 31, | |
| | | 2008 | | | 2007 | | | 2008 | | | 2007 | |
| | | (in thousands) | | | | | | | |
Gross margin: | | | | | | | | | | | | | | |
Service | | $ | 36,767 | | | $ | 34,177 | | | 29 | % | | 31 | % |
Product and trademark license | | | (421 | ) | | | (1,742 | ) | | (43 | )% | | (249 | )% |
| | | | | | | | | | | | | | |
Total gross margin | | $ | 36,346 | | | $ | 32,435 | | | 29 | % | | 29 | % |
| | | | | | | | | | | | | | |
Service gross margin is the profit from revenues after deducting the cost of royalties to content providers and publishers, technical support, bandwidth and hosting costs, depreciation and amortization of infrastructure and certain identifiable intangible assets related to the delivery of the services, and any other direct costs of providing the services. Product and trademark license gross margin is the profit from revenues after deducting the cost of product sold, order fulfillment services, product shipping costs and any other direct expenses to deliver the product or trademark licenses.
Service gross margin decreased two percentage points in fiscal 2008 compared to fiscal 2007 primarily due to the non-recurring breakage revenues and associated cost of revenues recognized in both years. Excluding non-recurring revenues and their associated cost of revenues, service gross margin for fiscal 2008 and 2007 was 28% and 27%, respectively. The improvement was due to the shift of our revenue mix to a larger proportion of higher-margin subscriptions. Non-recurring items excluded from the above calculation are the $2.9 million and $6.1 million of non-recurring breakage revenue for fiscal 2008 and 2007, respectively, as well as the associated $870,000 cost of revenues for fiscal 2008.
Product and trademark license gross margin as a percentage of related revenue during fiscal 2008 compared to fiscal 2007 varies primarily due to the terms of hardware promotions and the volume of trademark licenses in each period. Product and trademark license margin was negative in both fiscal 2008 and 2007 because we offered product bundles where the end user could purchase an MP3 player at a deeply discounted price with the purchase of an extended subscription. A portion of the bundle price in these arrangements has been allocated to service revenue in accordance with EITF 00-21. The improvement in product and trademark license gross margin for fiscal 2008 compared to fiscal 2007 is also due to $700,000 of the non-recurring trademark license revenue recognized in the second quarter of fiscal 2008 that had no associated cost of revenues.
Service headcount dedicated to maintaining content and providing customer care was 13 at both March 31, 2008 and 2007.
We anticipate that gross margins will fluctuate in the future depending on product mix, high margin non-recurring revenue items and low margin hardware promotions.
Operating Expenses
We classify operating expenses as research and development, sales and marketing and general and administrative. Each category includes related expenses for salaries, employee benefits, incentive compensation, stock-based compensation, travel, telephone, communications, facility costs and professional fees. Our sales and marketing expenses include additional expenditures specific to the marketing group, such as public relations, advertising, trade shows, marketing collateral materials and subscriber acquisition and retention costs, as well as expenditures specific to the sales group, such as commissions and referral fees paid to marketing partners. In addition, we include amortization of certain identifiable intangible assets as operating expenses.
33
The following table sets forth, for the periods indicated, our operating expenses:
| | | | | | | | | | | | |
| | | Year Ended
March 31, | | As a Percentage of Net Revenues
For the Year Ended March 31, | |
| | | 2008 | | 2007 | | 2008 | | | 2007 | |
| | | (in thousands) | | | | | | |
Research and development | | $ | 9,685 | | $ | 11,045 | | 8 | % | | 10 | % |
Sales and marketing | | | 17,963 | | | 34,213 | | 14 | % | | 31 | % |
General and administrative | | | 23,284 | | | 24,311 | | 18 | % | | 22 | % |
Amortization of intangible assets | | | 4,169 | | | 271 | | 3 | % | | — | % |
| | | | | | | | | | | | |
Total operating expenses | | $ | 55,101 | | $ | 69,840 | | 43 | % | | 63 | % |
| | | | | | | | | | | | |
Research and Development
Research and development (“R&D”) expenses consist primarily of salary, benefits (including stock-based compensation) and contractors’ fees for our development and other costs associated with the minor enhancements of existing products, development of new services or development of new features for existing services.
R&D expenses decreased for fiscal 2008 compared to fiscal 2007. The decrease can be attributed to lower headcount, increased utilization of our internal resources on capitalizable projects and fewer outside contractors in fiscal 2008. Those decreases were offset by higher stock-based compensation expense as more stock grants were issued in fiscal 2008 and by a one-time reimbursement from Napster Japan for R&D projects recognized as a reduction in R&D costs in fiscal 2007.
Research and development headcount was 56 at March 31, 2008 and 60 at March 31, 2007.
We expect R&D spend to remain relatively flat in the future, while our actual operating expense will vary depending on whether the costs of the development initiatives must be capitalized under U.S. generally accepted accounting principles capitalization rules.
Sales and Marketing
Sales and marketing expenses consist primarily of salary and benefits (including stock-based compensation) for sales and marketing personnel, referral fees paid to marketing partners, other subscriber acquisition and retention costs, as well as costs associated with advertising and promotions.
Sales and marketing expenses decreased in fiscal 2008 compared to fiscal 2007 primarily due to a $14.5 million reduction in fixed cost marketing programs and a shift to variable cost marketing programs with strategic distribution partners who are paid only when we acquire new trial or paying subscribers. The remaining $1.8 million decrease in fiscal 2008 is attributable to reduced personnel costs, since we need fewer employees and outside contractors to manage the current sales and marketing programs and the fact that we centralized our European sales and marketing activities in February 2007.
Sales and marketing headcount was 28 at March 31, 2008 and 27 at March 31, 2007.
We expect to keep overall marketing spend at a reduced run rate. However, sales and marketing expenses, which are primarily driven by our partner based variable cost model, will fluctuate depending on new subscriber growth.
General and Administrative
General and administrative expenses consist primarily of salary and benefits (including stock-based compensation) for executive and administrative personnel, professional services, administrative outsources and other general corporate activities.
34
General and administrative expenses decreased for fiscal 2008 compared to fiscal 2007 primarily due to a decrease of approximately $1.1 million in personnel related expenses because of lower headcount and associated costs, a decrease of approximately $600,000 in stock-based compensation, offset by an approximately $700,000 net increase in administrative outsource fees. The decrease in stock-based compensation is a result of an out-of-period adjustment totaling $650,000 recorded in fiscal 2007 to record adjustments related to stock-based compensation on options issued primarily from fiscal 2002 to 2005.
General and administrative headcount, including all corporate general and administrative employees, was 36 at March 31, 2008 and 38 at March 31, 2007.
We expect controllable general and administrative expenses to remain steady near term. Overall general and administrative expenses will fluctuate depending on the costs we incur to evaluate and defend against recent legal and other claims, and the costs of other administrative fees that increase as our revenues grow.
Amortization of Intangible Assets
Beginning March 2007, we had amortization expense related to the customer intangible acquired through the Asset Purchase Agreement with AOL. Future amortization expense will reflect the pattern in which the economic benefits of the AOL customer intangible asset are consumed.
Loss from Unconsolidated Entity
The loss from unconsolidated entity represents our 31.5% portion of the loss incurred by Napster Japan during the periods presented, limited to the extent of our cumulative equity contributions. We do not expect to record further losses from Napster Japan unless we contribute additional capital in the future. Napster, LLC has no obligation to fund future losses or provide additional capital contributions to Napster Japan. In the event that Napster Japan issues additional equity ownership in the future and we do not participate in the financing, our ownership interest in Napster Japan would be diluted.
Other Income, Net
Other income, net, consists primarily of interest income on our cash, cash equivalents and short-term investments, realized gains (losses) due to foreign currency fluctuations, interest expense and other miscellaneous income.
Other income, net, decreased approximately $560,000 in fiscal 2008 compared to fiscal 2007 due primarily to lower interest rates on our cash, cash equivalents and short-term investments balance and higher foreign currency remeasurement losses, offset by a $638,000 benefit recognized upon the resolution of contingencies related to the Roxio spin off from Adaptec in the first quarter of fiscal 2008.
We expect interest and investment income, net, to vary in the future due to investment rate changes, foreign currency fluctuations and other non-recurring items.
Income Tax Benefit
We have recorded a valuation allowance to reduce deferred tax assets to the amount we believe is more likely than not to be realized. In the event that deferred tax assets would be realizable in the future in excess of the net recorded amount, an adjustment to the valuation allowance on deferred tax assets would increase income in the period such determination was made.
During January 2005, following the divestiture of CSD, which utilized substantially all of our tax operating losses, Napster made a tax election to step up the basis in the Pressplay goodwill for tax purposes. As a result, the Pressplay goodwill is deductible for tax purposes, which creates a tax timing difference that is presented as a deferred tax liability and deferred tax expense. As realization of this taxable temporary difference is not assured, a net tax expense related to this item is recorded.
35
The tax provisions for fiscal 2008 and 2007 represent primarily state franchise taxes, foreign taxes and the timing difference related to the Pressplay goodwill. In the near term, we expect to continue to incur minimal income taxes as we are anticipating losses from operations.
We are subject to various tax rates in the jurisdictions in which we do business. Our tax provision does not take into account any future benefit from loss carryforwards, which may be realized if we again achieve profitability and begin generating taxable income.
Income from Discontinued Operations
Napster had no ongoing activity in the discontinued operations during fiscal 2008 and 2007. The loss from discontinued operations in fiscal 2007 is comprised of an additional charge related to adjustments to stock-based compensation on options issued primarily from fiscal 2002 to 2005 offset by the net tax benefit from the favorable resolution of previously provided tax contingencies related to CSD.
Fiscal 2007 as compared to fiscal 2006
The following table sets forth our results as a percentage of total net revenues for the periods indicated. These operating results are not necessarily indicative of the results for any future period.
| | | | | | |
| | | As a Percentage of Net Revenues
For the Year Ended March 31, | |
| | | 2007 | | | 2006 | |
Net revenues | | 100 | % | | 100 | % |
Cost of revenues | | 71 | % | | 73 | % |
| | | | | | |
Gross margin | | 29 | % | | 27 | % |
| | | | | | |
Operating expenses: | | | | | | |
Research and development | | 10 | % | | 14 | % |
Sales and marketing | | 31 | % | | 55 | % |
General and administrative | | 22 | % | | 22 | % |
Amortization of intangible assets | | — | % | | 1 | % |
| | | | | | |
Total operating expenses | | 63 | % | | 92 | % |
| | | | | | |
Loss from continuing operations | | (34 | )% | | (65 | )% |
Other income, net | | 4 | % | | 3 | % |
| | | | | | |
Loss before income tax benefit | | (30 | )% | | (62 | )% |
Income tax benefit (provision) | | (1 | )% | | 1 | % |
Loss from unconsolidated entity | | (2 | )% | | — | % |
| | | | | | |
Loss from continuing operations, after income taxes | | (33 | )% | | (61 | )% |
Income from discontinued operations, net of tax effect | | — | % | | 3 | % |
| | | | | | |
Net loss | | (33 | )% | | (58 | )% |
| | | | | | |
36
Net Revenues
The following table sets forth, for the periods indicated, the summary of our revenues from continuing operations by revenue type:
| | | | | | | | | | | | |
| | | Year Ended
March 31, | | As a Percentage of Net Revenues
For the Year Ended March 31, | |
| | | 2007 | | 2006 | | 2007 | | | 2006 | |
| | | (in thousands) | | | | | | |
Online music revenues: | | | | | | | | | | | | |
Service | | $ | 110,380 | | $ | 90,784 | | 99 | % | | 96 | % |
Product and license | | | 701 | | | 3,907 | | 1 | % | | 4 | % |
| | | | | | | | | | | | |
Total online music revenues | | $ | 111,081 | | $ | 94,691 | | 100 | % | | 100 | % |
| | | | | | | | | | | | |
Service Revenues
Service revenues increased for fiscal 2007 compared to fiscal 2006 primarily due to growth in our subscriber base, international expansion and new revenue streams, offset by a decrease in revenue from music downloads. During fiscal 2007 we had a full year revenue benefit from the fiscal 2006 paid subscriber growth. Additionally, the Napster music service was launched in Germany during December 2005 and in Japan during October 2006. This increase in our subscriber base and international expansion drove an $18.8 million increase in subscription service revenues. We also began marketing new revenue streams such as advertising during May 2006 and our Napster Mobile music service during August 2006. New revenue streams contributed $1.5 million of net revenue during fiscal 2007.
The service revenues in fiscal 2007 also included (a) approximately $4.0 million of non-recurring revenues related to prepaid cards that were sold previously and that we estimate will never be redeemed and for which we have no further obligation (“prepaid card breakage”) and (b) a decrease of approximately $4.7 million in download revenue, because our growing base of subscription customers do not need to purchase individual song tracks.
For the purpose of paid subscriber calculations, we included university subscribers, Japanese subscribers, Napster Mobile subscribers and the over 225,000 AOL Music Now subscribers as of their March 15, 2007 transition date.
Product and License Revenues
Product and license revenues for fiscal 2007 decreased $3.2 million compared to fiscal 2006 primarily due to the timing of hardware promotional programs. Fiscal 2006 included a single hardware promotion that resulted in $2.9 million of revenue, which was not continued in 2007.
Geographic Revenues
The following table sets forth, for the periods indicated, the summary of our revenues from continuing operations by geography:
| | | | | | | | | | | | |
| | | Year Ended
March 31, | | As a Percentage of Net Revenues
For the Year Ended March 31, | |
| | | 2007 | | 2006 | | 2007 | | | 2006 | |
| | | (in thousands) | | | | | | |
Revenues: | | | | | | | | | | | | |
North America | | $ | 92,227 | | $ | 83,054 | | 83 | % | | 88 | % |
Europe | | | 18,854 | | | 11,637 | | 17 | % | | 12 | % |
| | | | | | | | | | | | |
Net revenues | | $ | 111,081 | | $ | 94,691 | | 100 | % | | 100 | % |
| | | | | | | | | | | | |
37
The revenue increase in North America for fiscal 2007 compared to fiscal 2006 was primarily due to a $12.3 million increase in subscriber revenue, the $4.0 million in prepaid card breakage, the $1.5 million of revenue from new revenue streams, offset by the $3.2 million decrease in product revenue and a $5.4 million decrease in download revenue. The increase in service revenue was primarily due to the paid subscriber increase in the past two years.
The increase in revenue in Europe for fiscal 2007 compared to fiscal 2006 was primarily related to the launch of music service in Germany in December 2005.
Gross Margin
The following table sets forth, for the periods indicated, our gross margin from continuing operations:
| | | | | | | | | | | | | | |
| | | Year Ended
March 31, | | | As a Percentage of Related Revenues
For the Year Ended March 31, | |
| | | 2007 | | | 2006 | | | 2007 | | | 2006 | |
| | | (in thousands) | | | | | | | |
Gross margin: | | | | | | | | | | | | | | |
Service | | $ | 34,177 | | | $ | 26,316 | | | 31 | % | | 29 | % |
Product and trademark license | | | (1,742 | ) | | | (833 | ) | | (249 | )% | | (21 | )% |
| | | | | | | | | | | | | | |
Total gross margin | | $ | 32,435 | | | $ | 25,483 | | | 29 | % | | 27 | % |
| | | | | | | | | | | | | | |
Service gross margin is the profit from revenues after deducting the cost of royalties to content providers and publishers, technical support, bandwidth and hosting costs, depreciation and amortization of infrastructure and certain identifiable intangible assets related to the delivery of the services, and any other direct costs of providing the services. Product and license gross margin is the profit from revenues after deducting the cost of product sold, order fulfillment services, product shipping costs and any other direct expenses to deliver the product or trademark licenses.
Service gross margin as a percentage of related revenue improved in fiscal 2007 compared to fiscal 2006 primarily due to the non-recurring prepaid card breakage revenues, which had no associated direct costs. Excluding non-recurring revenues, service gross margin for fiscal 2007 decreased one percentage point from fiscal 2006. This change was primarily due to increased license fees and additional ongoing expenditures for service infrastructure, offset in part by a change in revenue mix from download revenues to subscription revenues, which have a higher gross margin.
Product and license gross margin dollars decreased for fiscal 2007 compared to fiscal 2006 primarily due to the terms of hardware promotions.
Service headcount dedicated to maintaining content and providing customer care was 13 and 12 at March 31, 2007 and 2006, respectively.
Operating Expenses
We classify operating expenses as research and development, sales and marketing and general and administrative. Each category includes related expenses for salaries, employee benefits, incentive compensation, stock-based compensation, travel, telephone, communications, facility costs and professional fees. Our sales and marketing expenses include additional expenditures specific to the marketing group, such as public relations, advertising, trade shows, marketing collateral materials and subscriber acquisition costs, as well as expenditures specific to the sales group, such as commissions and referral fees paid to marketing partners. In addition, we include amortization of certain identifiable intangible assets as operating expenses.
38
The following table sets forth, for the periods indicated, our operating expenses from continuing operations:
| | | | | | | | | | | | |
| | | Year Ended
March 31, | | As a Percentage of Net Revenues
For the Year Ended March 31, | |
| | | 2007 | | 2006 | | 2007 | | | 2006 | |
| | | (in thousands) | | | | | | |
Research and development | | $ | 11,045 | | $ | 13,137 | | 10 | % | | 14 | % |
Sales and marketing | | | 34,213 | | | 51,741 | | 31 | % | | 55 | % |
General and administrative | | | 24,311 | | | 20,881 | | 22 | % | | 22 | % |
Amortization of intangible assets | | | 271 | | | 1,265 | | — | % | | 1 | % |
| | | | | | | | | | | | |
Total operating expenses | | $ | 69,840 | | $ | 87,024 | | 63 | % | | 92 | % |
| | | | | | | | | | | | |
Research and Development
Research and development (“R&D”) expenses consist primarily of salary, benefits (including stock-based compensation) and contractors’ fees for our development and other costs associated with the minor enhancements of existing products, development of new services or development of new features for existing services.
R&D expenses decreased for fiscal 2007 compared to fiscal 2006 primarily due to net lower headcount costs and lower depreciation. Headcount and contractor costs decreased in fiscal 2007 following the release of new products in mid-fiscal 2006, and because we dedicated a portion of our research and development efforts in 2007 on reimbursable projects for Napster Japan. The reduction in headcount costs was offset by the increase in stock-based compensation expense. Depreciation decreased because capital assets were fully depreciated in mid-fiscal 2007.
Research and development headcount was 60 at March 31, 2007 and 63 at March 31, 2006.
Sales and Marketing
Sales and marketing expenses consist primarily of salary and benefits (including stock-based compensation) for sales and marketing personnel, referral fees paid to marketing partners, other subscriber acquisition costs, as well as costs associated with advertising and promotions.
Sales and marketing expenses decreased for fiscal 2007 compared to fiscal 2006 due primarily to the reduction in marketing programs. We had substantially reduced our spend and our subscriber acquisition cost over the last year as we had moved away from offline advertising to targeted online spend where we can achieve very low cost per trialer as per our internal targets. We had also increased our focus on our strategic distribution partners where we had moved from our original model of giving advances and guaranteed market development funds to a more variable cost model where we pay bounties only when we acquire subscribers.
Sales and marketing headcount was 27 at March 31, 2007 and 32 at March 31, 2006.
General and Administrative
General and administrative expenses consist primarily of salary and benefits (including stock-based compensation) for executive and administrative personnel, professional services, administrative outsources and other general corporate activities.
General and administrative expenses increased for fiscal 2007 compared to fiscal 2006 primarily due to approximately $1.5 million higher professional and administrative outsource fees and $2.5 million of stock-based compensation, offset by an approximately $600,000 decrease in personnel related expense.
General and administrative headcount, including all corporate general and administrative employees, was 38 at March 31, 2007 and March 31, 2006.
39
Amortization of Intangible Assets
Beginning March 2007, we had amortization expense related to the customer intangible acquired through the Asset Purchase Agreement with AOL. Amortization of intangible assets for fiscal 2006 consisted of amortization expense related to the intangible assets recorded in connection with our acquisition of Napster’s name in December 2002 and Napster, LLC, formerly known as Pressplay, in May 2003. Those intangible assets were fully amortized as of March 31, 2006.
Loss from Unconsolidated Entity
The loss from unconsolidated entity represents our 31.5% portion of the loss incurred by Napster Japan during the periods presented, limited to the extent of our cumulative equity contributions.
Other Income, Net
Other income, net, consists primarily of interest income on our cash, cash equivalents and short-term investments, realized gains (losses) due to foreign currency fluctuations, interest expense, change in the fair value of the hedge and other miscellaneous income.
Other income, net, increased $1.2 million in fiscal 2007 compared to fiscal 2006 due to (1) $1.0 million higher investment income due to higher interest rates, (2) approximately $650,000 lower hedge discount expense in fiscal 2007 following the sale of our shares of Sonic common stock in fiscal 2006, (3) an approximately $650,000 increase in foreign currency gains and (4) a $100,000 decrease in interest expense following pay down and termination of our line of credit, offset by the $1.2 million gain on the sale of the Sonic common stock in fiscal 2006, which did not recur in fiscal 2007.
Income Tax Benefit
We have recorded a valuation allowance to reduce deferred tax assets to the amount we believe is more likely than not to be realized. In the event that deferred tax assets would be realizable in the future in excess of the net recorded amount, an adjustment to the valuation allowance on deferred tax assets would increase income in the period such determination was made.
During January 2005, following the divestiture of CSD, which utilized substantially all of our tax operating losses, Napster made a tax election to step up the basis in the Pressplay goodwill for tax purposes. As a result, the Pressplay goodwill is deductible for tax purposes, which creates a tax timing difference that is presented as a deferred tax liability and deferred tax expense. As realization of this taxable temporary difference is not assured, a net tax expense related to this item is recorded.
The tax provisions for fiscal 2007 and 2006 represent primarily state franchise taxes, foreign taxes and the timing difference related to the Pressplay goodwill. The tax benefit in continuing operations in fiscal 2006 included a $2.5 million tax benefit corresponding to the tax provision for the discontinued operations $5.4 million gain on divestiture.
Income from Discontinued Operations
Napster had no ongoing activity in the discontinued operations during fiscal 2007 and 2006. The loss from discontinued operations in fiscal 2007 is comprised of an additional charge related to adjustments to stock-based compensation on options issued primarily from fiscal 2002 to 2005 offset by the net tax benefit from the favorable resolution of previously provided tax contingencies related to CSD. During March 2006, Napster and Sonic settled all adjustments described in the divestiture agreement and Napster recognized an additional $4.5 million gain on the divestiture, net of taxes.
40
Liquidity and Capital Resources
We ended fiscal 2008 with $69.8 million in cash, cash equivalents and short-term investments. These amounts consist principally of commercial paper, asset-backed securities, corporate securities, municipal securities and U.S. government agencies securities. This balance represents a $3.3 million increase compared to March 31, 2007.
Our primary ongoing source of cash is receipts from revenues. The primary uses of cash are payroll (salaries and related benefits), general operating expenses (marketing, travel and office rent), payments to content providers, payments for products held for resale, and purchases of property and equipment, including software development costs.
We have significant non-cash expenditures, such as depreciation and amortization, amortization of prepaid marketing expenses, stock based compensation charges and deferred tax expense. We also have significant non-cash changes in working capital, such as accruals for music publishing fees, for which rates have not been finalized and thus only partial payments are being made. If we had been required to make regular quarterly payments of the music publishing fees, our cash flows in fiscal 2008 would have been a burn of approximately $1.9 million. When music publishing rates are finalized, we will be obligated to make retroactive payments for certain unpaid music publishing fees since the inception of Pressplay. As of March 31, 2008, we had accrued approximately $11 million for these fees, which, once finalized, are likely to be payable during calendar 2009.
The municipal securities we held at March 31, 2008 were comprised of one $3.0 million, AAA rated, auction rate security with underlying assets of student loans guaranteed by the U.S. government. That investment was valued at face value and classified as a current asset. We were unable to sell this security in April 2008 due to auction failure. As a result, the funds associated with these failed auctions will not be accessible until the issuer calls the security, a successful auction occurs, a buyer is found outside of the auction process, or the security matures. We do not believe the carrying value of this auction rate security was impaired as of March 31, 2008. This security was reported at par value as of May 31, 2008. At this time, we have not obtained sufficient evidence to conclude that this investment will not be settled in the short term, although the market for this investment is presently uncertain. While the recent auction failure may limit our ability to liquidate this investment for some period of time, we do not believe the auction failures will materially impact our ability to fund our working capital needs, capital expenditures, or other business requirements.
Our working capital was $35.1 million at March 31, 2008.
Financial Position
We believe that the liquidity provided by existing cash, cash equivalents and short-term investments will provide sufficient capital to meet our requirements for at least the next 12 months. We operate and will continue to operate in the near term at a loss, but because of our significant non-cash expenses and changes in working capital, we have had net positive cash flows.
41
Cash Flow Changes
The following table sets forth, for the periods indicated, the components of cash flow activities (in thousands):
| | | | | | | | | | | | |
| | | For the Year Ended March 31, | |
| | | 2008 | | | 2007 | | | 2006 | |
Net loss | | $ | (16,452 | ) | | $ | (36,826 | ) | | $ | (54,945 | ) |
Non-cash gain on sale of businesses | | | — | | | | — | | | | (6,540 | ) |
Non-cash expenses | | | 15,851 | | | | 12,459 | | | | 9,996 | |
Changes in operating assets and liabilities: | | | | | | | | | | | | |
Deferred revenue | | | (1,358 | ) | | | (6,616 | ) | | | 4,603 | |
Accrued liabilities | | | 7,280 | | | | 2,486 | | | | 6,019 | |
Other working capital changes | | | (1,116 | ) | | | (133 | ) | | | (3,661 | ) |
| | | | | | | | | | | | |
Net cash provided by (used in) operating activities | | $ | 4,205 | | | $ | (28,630 | ) | | $ | (44,528 | ) |
| | | | | | | | | | | | |
Net cash provided by (used in) investing activities | | $ | (2,025 | ) | | $ | 11,484 | | | $ | (28,366 | ) |
Net cash used in financing activities | | $ | (450 | ) | | $ | (4 | ) | | $ | (14,910 | ) |
Cash provided by (used in) operating activities is driven by our net loss, adjusted for non-cash items, and change in operating assets and liabilities. Non-cash adjustments include depreciation and amortization, amortization of prepaid marketing expenses, stock-based compensation expense, deferred income taxes and loss in unconsolidated entities. Other cash changes in operating assets and liabilities include the deferral of revenue, vendor prepayments, and ongoing payment and collection of trade payables and receivables.
Cash provided by (used in) investing activities is primarily attributable to capital expenditures, purchases and sales of short-term investments, investment in (return on investment from) unconsolidated entity and proceeds from divestitures.
Cash provided by (used in) financing activities is driven by our financing activities relating to employee stock plans, principal payments of long-term debts and equity financing.
Fiscal 2008 as compared to fiscal 2007
The $32.8 million increase in net cash provided by operating activities in fiscal 2008 compared to fiscal 2007 is due to (1) the $20.4 million lower net loss in fiscal 2008, (2) $3.4 million of additional non-cash expenses in fiscal 2008, related primarily to amortization of assets recorded as part of the customer acquisition in March 2007, (3) $4.3 million less non cash revenues recognized in fiscal 2008, related primarily to prepaid card breakage revenue recognized in fiscal 2007, and (4) $4.7 million of increased accruals for music publishing and content fees on higher revenues in fiscal 2008.
The decrease in net cash provided by investing activities in fiscal 2008 compared to fiscal 2007 is primarily due to the fact that, after funding the $1.4 million of capital expenditures in fiscal 2008, we moved available funds from cash-equivalent investments to favorable yield short-term investments. During fiscal 2007, we received the $2.2 million cash receipt from Sonic related to the divestiture of CSD in short-term investments and utilized approximately net $9.3 million of short-term investments to fund operations (after paying approximately $11.1 million to purchase AOL customer intangible assets).
Financing activities in both fiscal 2008 and 2007 were due to Employee Stock Purchase Plan contributions offset by the repurchase of stock for required minimum tax withholding on employee stock plan activity.
42
Fiscal 2007 as compared to fiscal 2006
The decrease in net cash used in operating activities in fiscal 2007 is primarily due to a lower net loss in fiscal 2007 compared to fiscal 2006. Additionally, the decrease in deferred revenue in fiscal 2007 compared to fiscal 2006 was primarily due to the non-recurring prepaid card breakage recognized during fiscal 2007. Changes in other working capital items were primarily related to timing of receipts and payments.
The increase in net cash provided by investing activities in fiscal 2007 compared to fiscal 2006 was primarily due to the fact that we liquidated approximately $20 million of investments to fund operating cash flows during fiscal 2007 and had invested approximately $20 million of proceeds from the divestiture of CSD in fiscal 2006. Other than investment liquidation or new investments, the fiscal 2007 change in investing cash flows included a $2.2 million cash receipt from Sonic related to the divestiture of CSD, offset by an $11.1 million payment to AOL pursuant to the AOL agreement. Fiscal 2006 investing cash flows also included our $2.7 million USD equivalent investment in our Japan Joint Venture and $4.1 million more capital expenditures than in fiscal 2007.
The only financing activities in fiscal 2007 were related to employee stock plans and principal payments on capital lease obligations. In fiscal 2006 we repaid the $15 million outstanding balance under our $17.0 million line of credit.
Contractual obligations
At March 31, 2008, we had fixed non-cancelable contractual obligations including capital leases, operating leases and other non-cancelable contractual obligations as follows (in thousands):
| | | | | | | | | | | | |
| | | Non-
Cancelable
Capital Leases | | Non-
Cancelable
Operating
Leases | | Other Non-
Cancelable
Contractual
Obligations | | Total |
Less than one year | | $ | 6 | | $ | 1,012 | | $ | 1,836 | | $ | 2,854 |
1- 3 years | | | 8 | | | 1,985 | | | — | | | 1,993 |
3- 5 years | | | — | | | — | | | — | | | — |
More than 5 years | | | — | | | — | | | — | | | — |
| | | | | | | | | | | | |
| | $ | 14 | | $ | 2,997 | | $ | 1,836 | | $ | 4,847 |
| | | | | | | | | | | | |
We also have fixed rate commitments to pay fees and royalties on music delivered to our customers, as well as various arrangements with product vendors and other marketing partners to pay fees when new customers from their sites subscribe to our services.
At March 31, 2008 we had no indebtedness for borrowed money.
We expect that as our existing capital leases and operating leases terminate over the next few years, we will enter into new agreements which will result in new obligations.
Off-Balance Sheet Arrangements
As of March 31, 2008, we did not have any off-balance-sheet arrangements, as defined in Item 303(a)(4)(ii) of SEC Regulation S-K.
43
Recent Accounting Pronouncements
For recent accounting pronouncements, see Note 1—Description of Business and Summary of Significant Accounting Policies to the consolidated financial statements appearing in Item 15 of this Report, which are incorporated by reference into this Item 7.
44
| ITEM 7A. | QUANTITATIVE AND QUALITATIVE DISCLOSURES ABOUT MARKET RISK |
Interest rate risk
The primary objective of our investment activities is to preserve principal while at the same time maximizing the income we receive from our investments without significantly increasing risk. We maintain our cash, cash equivalents and short-term investments with high quality financial institutions and, as part of our cash management process, we perform periodic evaluations of the relative credit standing of these financial institutions. Amounts deposited with these institutions may exceed federal depository insurance limits. In addition, the portfolio of investments conforms to our policy regarding concentration of investments, maximum maturity and quality of investment.
Some of the securities in which we have invested may be subject to market risk. This means that a change in prevailing interest rates may cause the principal amount of the investment to fluctuate. For example, if we hold a security that was issued with a fixed interest rate at the then-prevailing rate and the prevailing interest rate later rises, the principal amount of our investment will probably decline in value. To reduce this risk, we maintain our portfolio of cash equivalents and short-term investments in a variety of securities, including commercial paper, asset-backed securities, corporate securities, municipal securities and money market funds. In general, money market funds are not subject to interest rate risk because the interest paid on these funds fluctuates with the prevailing interest rate. All of our short-term investments mature in less than one year.
At March 31, 2008, all $37.2 million of our short-term investments are subject to market risk and mature within one year. The weighted-average yield of those short-term investments was 4.39% at March 31, 2008. Our cash equivalents are invested in commercial paper and money market funds, which are not considered “subject to market risk” because those funds are not subject to significant interest rate risk due to their short maturities.
We do not currently hold any variable interest rate debt. Accordingly, we have not been exposed to near-term adverse changes in interest rates or other market prices. We may, however, experience such adverse changes if we incur debt or hold other derivative financial instruments in the future.
Financial instruments that potentially subject us to significant concentrations of credit risk consist principally of cash, cash equivalents, and short-term investments.
Market risk
At March 31, 2008, we held a $3.0 million investment in one AAA rated auction rate municipal security, for which the underlying assets are student loans guaranteed by the U.S. government. See Liquidity and Capital Resources appearing in Item 7 of this Report.
Exchange rate risk
We market our Napster service in the Americas, Europe and Japan, resulting in transactions denominated in U.S. dollars, Canadian dollars, Chilean pesos, United Kingdom pounds, Euro, Swiss Francs and Japanese Yen. As such, our financial results could be affected by factors such as changes in foreign currency exchange rates or weak economic conditions in foreign markets.
Transactions denominated in currencies other than the functional currency of the legal entity are remeasured to the functional currency of the legal entity at the period-end exchange rates. Any associated currency re-measurement gains and losses are recognized in current operations.
For our foreign subsidiaries whose functional currency is the local currency, we translate assets and liabilities to U.S. dollars using period-end exchange rates and translate revenues and expenses using average exchange rates during the period. Exchange gains and losses arising from translation of foreign entity financial statements are included as a component of other comprehensive income (loss).
Cash and cash equivalents are predominantly denominated in U.S. dollars. As of March 31, 2008 we held the equivalent of $2.9 million U.S. dollar of cash and cash equivalents in United Kingdom pounds, $1.7 million in Euro and $427,000 in other foreign currencies.
45
| ITEM 8. | CONSOLIDATED FINANCIAL STATEMENTS AND SUPPLEMENTARY DATA |
The Consolidated Financial Statements and Supplementary Data required by this Item are set forth at the pages indicated in Item 15(a).
Unaudited Quarterly Results of Operations
| | | | | | | | | | | | | | | | | | | | | | | | | | | | | | | | |
| | | Three Months Ended | |
| | | Mar. 31,
2008 | | | Dec. 31,
2007 | | | Sep. 30,
2007 | | | June 30,
2007 | | | Mar. 31,
2007 | | | Dec. 31,
2006 | | | Sep. 30,
2006 | | | June 30,
2006 | |
| | | (in thousands, except per share data) | |
Net revenues | | $ | 30,782 | | | $ | 32,798 | | | $ | 31,618 | | | $ | 32,254 | | | $ | 29,133 | | | $ | 28,372 | | | $ | 25,460 | | | $ | 28,116 | |
Gross margin | | $ | 8,152 | | | $ | 9,946 | | | $ | 9,445 | | | $ | 8,803 | | | $ | 7,964 | | | $ | 8,543 | | | $ | 6,934 | | | $ | 8,994 | |
Net loss from continuing operations | | $ | (4,298 | ) | | $ | (2,826 | ) | | $ | (5,084 | ) | | $ | (4,244 | ) | | $ | (7,543 | ) | | $ | (10,272 | ) | | $ | (9,002 | ) | | $ | (9,818 | ) |
Net loss | | $ | (4,298 | ) | | $ | (2,826 | ) | | $ | (5,084 | ) | | $ | (4,244 | ) | | $ | (8,496 | ) | | $ | (9,510 | ) | | $ | (9,002 | ) | | $ | (9,818 | ) |
Net loss per share from continuing operations: | | | | | | | | | | | | | | | | | | | | | | | | | | | | | | | | |
Basic and diluted | | $ | (0.10 | ) | | $ | (0.06 | ) | | $ | (0.12 | ) | | $ | (0.10 | ) | | $ | (0.17 | ) | | $ | (0.24 | ) | | $ | (0.21 | ) | | $ | (0.23 | ) |
Net loss per share: | | | | | | | | | | | | | | | | | | | | | | | | | | | | | | | | |
Basic and diluted | | $ | (0.10 | ) | | $ | (0.06 | ) | | $ | (0.12 | ) | | $ | (0.10 | ) | | $ | (0.20 | ) | | $ | (0.22 | ) | | $ | (0.21 | ) | | $ | (0.23 | ) |
Weighted average shares used in computing net loss per share: | | | | | | | | | | | | | | | | | | | | | | | | | | | | | | | | |
Basic and diluted | | | 43,631 | | | | 43,567 | | | | 43,540 | | | | 43,408 | | | | 43,239 | | | | 43,217 | | | | 43,197 | | | | 43,097 | |
| ITEM 9. | CHANGES IN AND DISAGREEMENTS WITH ACCOUNTANTS ON ACCOUNTING AND FINANCIAL DISCLOSURE |
None.
46
| ITEM 9A. | CONTROLS AND PROCEDURES |
Evaluation of disclosure controls and procedures.
Our management has evaluated, with the participation of our Chief Executive Officer and our interim Chief Financial Officer, the effectiveness of our disclosure controls and procedures (as defined in Rule 13a-15(e) and Rule 15d-15(e) under the Securities Exchange Act of 1934, as amended) as of the end of the period covered by this Annual Report on Form 10-K. Based on this evaluation, our Chief Executive Officer and our interim Chief Financial Officer have concluded that our disclosure controls and procedures were effective to ensure that information we are required to disclose in reports that we file or submit under the Securities Exchange Act (i) is recorded, processed, summarized and reported within the time periods specified in Securities and Exchange Commission rules and forms, and (ii) is accumulated and communicated to our management, including our Chief Executive Officer and our interim Chief Financial Officer, as appropriate, to allow timely decisions regarding required disclosure.
Management’s Annual Report on Internal Control Over Financial Reporting.
Management of our Company is responsible for establishing and maintaining adequate internal control over financial reporting as such term is defined in Rules 13a-15(f) and 15(d)-15(f) under the Securities Exchange Act of 1934, as amended. Our internal control over financial reporting is designed to provide reasonable assurance regarding the reliability of financial reporting and the preparation of financial statements for external purposes in accordance with generally accepted accounting principles. Internal control over financial reporting includes those policies and procedures that:
| | • | | pertain to the maintenance of records that, in reasonable detail, accurately and fairly reflect the transactions and dispositions of the assets of our Company; |
| | • | | provide reasonable assurance that transactions are recorded as necessary to permit preparation of financial statements in accordance with generally accepted accounting principles, and that receipts and expenditures of our Company are being made only in accordance with the authorization of management and directors of our Company; and |
| | • | | provide reasonable assurance regarding prevention or timely detection of unauthorized acquisition, use or disposition of our Company’s assets that could have a material effect on the financial statements. |
Because of its inherent limitations, internal control over financial reporting may not prevent or detect misstatements. Also, projections of any evaluation of effectiveness to future periods are subject to the risk that controls may become inadequate because of changes in conditions, or that the degree of compliance with the policies or procedures may deteriorate.
Management assessed the effectiveness of our internal control over financial reporting as of March 31, 2008. In making this assessment, our management used the criteria set forth inInternal Control-Integrated Framework issued by the Committee of Sponsoring Organizations of the Treadway Commission (“COSO”).
Based on our assessment of internal controls over financial reporting, management has concluded that, as of March 31, 2008, our internal control over financial reporting was effective.
Attestation Report of the Registered Public Accounting Firm.
PricewaterhouseCoopers, LLP, the independent registered public accounting firm that audited the financial statements included in this Annual Report on Form 10-K, has issued an attestation report on our internal control over financial reporting, which is included herein, on page F-2.
Changes in Internal Control over Financial Reporting.
During the quarter ended March 31, 2008 there were no changes in our internal control over financial reporting that have materially affected, or are reasonably likely to materially affect, our internal control over financial reporting.
| ITEM 9B. | OTHER INFORMATION |
None.
47
PART III
| ITEM 10. | DIRECTORS, EXECUTIVE OFFICERS AND CORPORATE GOVERNANCE |
Information in response to this item is incorporated herein by reference to our definitive proxy statement for our 2008 annual meeting of stockholders expected to be held on September 18, 2008. Information concerning our executive officers is included in Part I.
| ITEM 11. | EXECUTIVE COMPENSATION |
Information in response to this item is incorporated herein by reference to our definitive proxy statement for our 2008 annual meeting of stockholders expected to be held on September 18, 2008.
| ITEM 12. | SECURITY OWNERSHIP OF CERTAIN BENEFICIAL OWNERS AND MANAGEMENT AND RELATED STOCKHOLDER MATTERS |
Except as provided below, information in response to this item is incorporated herein by reference to our definitive proxy statement for our 2008 annual meeting of stockholders expected to be held on September 18, 2008.
Equity Compensation Plan Information
We currently maintain six equity compensation plans: the Amended and Restated 2000 Stock Option Plan (the “2000 Plan”), the Amended and Restated 2001 Stock Plan (the “2001 Plan”), the Amended and Restated 2001 Directors Option Plan (the “Directors Plan”), the Amended and Restated 2001 Employee Stock Purchase Plan (the “ESPP”), the 2002 Stock Plan (the “2002 Plan”) and the 2003 Stock Plan (the “2003 Plan”).
Equity Compensation Plans Approved by Stockholders. Each of our 2000 Plan, 2001 Plan, Directors Plan and ESPP was approved by Adaptec, our sole stockholder at the time each plan was adopted. The 2003 Plan was approved by our stockholders at our annual meeting of stockholders on September 18, 2003.
Under each of the 2000 Plan, 2001 Plan and 2003 Plan (the “Plans”), our Board of Directors, or a committee of the Board, may grant stock options and restricted stock awards to employees and consultants of Napster or our subsidiaries and to Napster directors. The purchase price of any shares of our common stock subject to an award granted under any of these plans will be determined by our Board or a committee of the Board at the time of grant. Awards granted under these plans may be fully vested at grant or subject to a vesting schedule determined by our Board or a committee of the Board. Each option granted under these plans will expire not more than ten years after its date of grant. Unvested shares of restricted stock are subject to cancellation or to repurchase by Napster upon the termination of the holder’s employment or service.
On October 24, 2005, the Board of Directors terminated the authority to grant additional awards under the Directors Plan.
Employees participating in the ESPP may purchase common stock at the end of each purchase period at a purchase price equal to 85% of the lower of the fair market value of the stock at the beginning or the end of the purchase period. Employees generally may contribute up to 10% of their base compensation to the purchase of stock under the plan, but may purchase no more than 750 shares of stock each purchase period. The plan operates in overlapping 24-month offering periods, and each offering period consists of four six-month purchase periods.
48
Equity Compensation Plan Not Approved by Stockholders. The 2002 Plan did not require approval of, and has not been approved by, our stockholders. The 2002 Plan allows our Board of Directors, or a committee of the Board, to grant stock options and restricted stock awards to employees and consultants of Napster or our subsidiaries. Employees who are Napster officers and Napster directors are not eligible to receive awards under the 2002 Plan. To date, only stock options have been granted under the 2002 Plan. The purchase price of any shares of our common stock subject to an award granted under the 2002 Plan will be determined by our Board or a committee of the Board at the time of grant and may be less than the fair market value of the underlying stock at that time. Stock awards granted under the 2002 Plan may be fully vested at grant or subject to a vesting schedule determined by our Board or a committee of the Board. Each option granted under the 2002 Plan will expire not more than ten years after its date of grant.
Summary Table. The following table sets forth, for each of Napster’s equity compensation plans, the number of our shares of common stock subject to outstanding options, the weighted-average exercise price of outstanding options, and the number of shares remaining available for future award grants as of March 31, 2008.
| | | | | | | | |
Plan category | | Number of shares
of Napster common
stock to be issued
upon exercise of
outstanding
options(1) | | Weighted average
exercise price of
outstanding
options(2) | | Napster common
stock remaining
available for
future issuance
under equity
compensation
plans (excluding
shares reflected
in the first
column) | |
Equity compensation plans approved by stockholders | | 2,731,058 | | $ | 8.39 | | 8,940,612 | (3), (4) |
Equity compensation plans not approved by stockholders | | 34,375 | | $ | 14.09 | | 568,906 | (5) |
| | | | | | | | |
| | 2,765,433 | | $ | 8.46 | | 9,509,518 | |
| | | | | | | | |
| (1) | | This column does not reflect shares that may be acquired under the ESPP in the current purchase period because that number is not determinable until the end of the period. |
| (2) | | This column does not reflect the price of shares that may be acquired under the ESPP in the current purchase period because that price is not determinable until the end of the period. |
| (3) | | Of these shares, 437,278 were available under the ESPP, 1,722,266 shares were available under the 2000 Plan, 5,774,818 shares were available under the 2001 Plan, and 1,006,250 shares were available under the 2003 Plan. The shares available under the Plans are, subject to certain other limits under the Plans, generally available for any type of award authorized under the applicable plan, including options, restricted stock and stock bonuses. |
| (4) | | On April 1 of each year during the term of the 2001 Plan, the total number of shares available for award purposes under the 2001 Plan will increase by the lesser of 2,000,000 shares or 6% of the total number of common shares issued and outstanding as of the immediately preceding March 31, or a lesser number determined by the Board of Directors. On April 1 of each year during the term of the ESPP, the total number of shares available for purchase under the ESPP will increase by the lesser of 100,000 shares or 1.5% of the total number of common shares issued and outstanding as of the immediately preceding March 31, or a lesser number determined by the Board of Directors. Accordingly, on April 1, 2008, the aggregate number of shares available for issuance under the 2001 Plan increased by 2,000,000 shares and the aggregate number of shares available for issuance under the ESPP increased by 100,000 shares. The information presented in this table was calculated as of March 31, 2008 and does not reflect these increases, or any possible future increases, to the number of shares available under these plans. |
| (5) | | All of these shares are available for option and restricted stock award grants under the 2002 Plan. |
49
| ITEM 13. | CERTAIN RELATIONSHIPS AND RELATED TRANSACTIONS, AND DIRECTOR INDEPENDENCE |
Information in response to this item is incorporated herein by reference to our definitive proxy statement for our 2008 annual meeting of stockholders expected to be held on September 18, 2008
| ITEM 14. | PRINCIPAL ACCOUNTANT FEES AND SERVICES |
Information in response to this item is incorporated herein by reference to our definitive proxy statement for our 2008 annual meeting of stockholders expected to be held on September 18, 2008.
50
PART IV
| ITEM 15. | EXHIBITS AND FINANCIAL STATEMENT SCHEDULE |
(a) The following documents are filed as part of this annual report:
| | | | See Index to Financial Statements at page F-1 of this Form 10-K. |
| | 2. | | Financial Statement Schedule |
| | | | Schedule II—Valuation and Qualifying Accounts and Reserves. |
| | | | All other schedules have been omitted because the required information is not present or not present in amounts sufficient to require the submission of the schedules, or because the information required is included in the consolidated financial statements or the notes thereto. |
| | | | The exhibits listed in the accompanying index to exhibits are filed as part of this Form 10-K. |
51
NAPSTER, INC.
INDEX TO CONSOLIDATED FINANCIAL STATEMENTS
F-1
NAPSTER, INC.
REPORT OF INDEPENDENT REGISTERED PUBLIC ACCOUNTING FIRM
To the Board of Directors and Stockholders of Napster, Inc.:
In our opinion, the accompanying consolidated balance sheets and the related consolidated statements of operations, changes in stockholders’ equity, and cash flows present fairly, in all material respects, the financial position of Napster, Inc. and its subsidiaries at March 31, 2008 and 2007, and the results of their operations and their cash flows for each of the three years in the period ended March 31, 2008 in conformity with accounting principles generally accepted in the United States of America. In addition, in our opinion, the financial statement schedule listed in the index appearing under item 15(a)(2) presents fairly, in all material respects, the information set forth therein when read in conjunction with the related consolidated financial statements. Also in our opinion, the Company maintained, in all material respects, effective internal control over financial reporting as of March 31, 2008, based on criteria established inInternal Control—Integrated Framework issued by the Committee of Sponsoring Organizations of the Treadway Commission (COSO). The Company’s management is responsible for these financial statements and financial statement schedule, for maintaining effective internal control over financial reporting and for its assessment of the effectiveness of internal control over financial reporting, included in Management’s Report on Internal Control over Financial Reporting appearing under Item 9A. Our responsibility is to express opinions on these financial statements, on the financial statement schedule and on the Company’s internal control over financial reporting based on our integrated audits. We conducted our audits in accordance with the standards of the Public Company Accounting Oversight Board (United States). Those standards require that we plan and perform the audits to obtain reasonable assurance about whether the financial statements are free of material misstatement and whether effective internal control over financial reporting was maintained in all material respects. Our audits of the financial statements included examining, on a test basis, evidence supporting the amounts and disclosures in the financial statements, assessing the accounting principles used and significant estimates made by management, and evaluating the overall financial statement presentation. Our audit of internal control over financial reporting included obtaining an understanding of internal control over financial reporting, assessing the risk that a material weakness exists, and testing and evaluating the design and operating effectiveness of internal control based on the assessed risk. Our audits also included performing such other procedures as we considered necessary in the circumstances. We believe that our audits provide a reasonable basis for our opinions.
As discussed in Note 1 to the consolidated financial statements, during the year ended March 31, 2007, the Company changed the manner in which it accounts for stock compensation.
A company’s internal control over financial reporting is a process designed to provide reasonable assurance regarding the reliability of financial reporting and the preparation of financial statements for external purposes in accordance with generally accepted accounting principles. A company’s internal control over financial reporting includes those policies and procedures that (i) pertain to the maintenance of records that, in reasonable detail, accurately and fairly reflect the transactions and dispositions of the assets of the company; (ii) provide reasonable assurance that transactions are recorded as necessary to permit preparation of financial statements in accordance with generally accepted accounting principles, and that receipts and expenditures of the company are being made only in accordance with authorizations of management and directors of the company; and (iii) provide reasonable assurance regarding prevention or timely detection of unauthorized acquisition, use, or disposition of the company’s assets that could have a material effect on the financial statements.
F-2
Because of its inherent limitations, internal control over financial reporting may not prevent or detect misstatements. Also, projections of any evaluation of effectiveness to future periods are subject to the risk that controls may become inadequate because of changes in conditions, or that the degree of compliance with the policies or procedures may deteriorate.
/s/ PricewaterhouseCoopers LLP
Los Angeles, CA
June 11, 2008
F-3
NAPSTER, INC.
CONSOLIDATED BALANCE SHEETS
(In thousands, except per share data)
| | | | | | | | |
| | | March 31, | |
| | | 2008 | | | 2007 | |
ASSETS | | | | | | | | |
Current assets: | | | | | | | | |
Cash and cash equivalents | | $ | 32,628 | | | $ | 30,069 | |
Short-term investments | | | 37,164 | | | | 36,414 | |
Accounts receivable, net of allowance for doubtful accounts of $16 at March 31, 2008 and $10 at March 31, 2007 | | | 2,365 | | | | 1,418 | |
Prepaid expenses and other current assets | | | 2,289 | | | | 6,547 | |
| | | | | | | | |
Total current assets | | | 74,446 | | | | 74,448 | |
Property and equipment, net | | | 3,358 | | | | 4,736 | |
Goodwill | | | 34,658 | | | | 34,658 | |
Identifiable intangible assets, net | | | 3,560 | | | | 7,729 | |
Other assets | | | 285 | | | | 158 | |
| | | | | | | | |
Total assets | | $ | 116,307 | | | $ | 121,729 | |
| | | | | | | | |
LIABILITIES AND STOCKHOLDERS’ EQUITY | | | | | | | | |
Current liabilities: | | | | | | | | |
Accounts payable | | $ | 1,745 | | | $ | 2,231 | |
Accrued liabilities | | | 31,166 | | | | 23,574 | |
Deferred revenues | | | 6,474 | | | | 7,601 | |
| | | | | | | | |
Total current liabilities | | | 39,385 | | | | 33,406 | |
Long-term liabilities | | | | | | | | |
Deferred income taxes | | | 4,593 | | | | 3,548 | |
Other long-term liabilities | | | 28 | | | | 69 | |
| | | | | | | | |
Total liabilities | | | 44,006 | | | | 37,023 | |
| | | | | | | | |
Commitments and contingencies (Note 12) | | | | | | | | |
Stockholders’ equity: | | | | | | | | |
Common stock, $0.001 par value; Authorized: 100,000 shares; Issued and outstanding: 46,122 shares at March 31, 2008 and 44,770 shares at March 31, 2007 | | | 46 | | | | 45 | |
Additional paid-in capital | | | 266,447 | | | | 262,730 | |
Accumulated deficit | | | (194,646 | ) | | | (178,194 | ) |
Accumulated other comprehensive income | | | 454 | | | | 125 | |
| | | | | | | | |
Total stockholders’ equity | | | 72,301 | | | | 84,706 | |
| | | | | | | | |
Total liabilities and stockholders’ equity | | $ | 116,307 | | | $ | 121,729 | |
| | | | | | | | |
The accompanying notes are an integral part of these consolidated financial statements.
F-4
NAPSTER, INC.
CONSOLIDATED STATEMENTS OF OPERATIONS
(In thousands, except per share data)
| | | | | | | | | | | | |
| | | Year Ended March 31, | |
| | | 2008 | | | 2007 | | | 2006 | |
Net revenues | | $ | 127,452 | | | $ | 111,081 | | | $ | 94,691 | |
Cost of revenues (1) | | | 91,106 | | | | 78,646 | | | | 69,208 | |
| | | | | | | | | | | | |
Gross margin | | | 36,346 | | | | 32,435 | | | | 25,483 | |
Operating expenses: | | | | | | | | | | | | |
Research and development (1) | | | 9,685 | | | | 11,045 | | | | 13,137 | |
Sales and marketing (1) | | | 17,963 | | | | 34,213 | | | | 51,741 | |
General and administrative (1) | | | 23,284 | | | | 24,311 | | | | 20,881 | |
Amortization of intangible assets | | | 4,169 | | | | 271 | | | | 1,265 | |
| | | | | | | | | | | | |
Total operating expenses | | | 55,101 | | | | 69,840 | | | | 87,024 | |
| | | | | | | | | | | | |
Loss from continuing operations | | | (18,755 | ) | | | (37,405 | ) | | | (61,541 | ) |
Other income, net | | | 3,458 | | | | 4,018 | | | | 2,811 | |
| | | | | | | | | | | | |
Loss before income tax benefit (provision) | | | (15,297 | ) | | | (33,387 | ) | | | (58,730 | ) |
Income tax benefit (provision) | | | (1,155 | ) | | | (1,257 | ) | | | 1,160 | |
Loss from unconsolidated entity | | | — | | | | (1,991 | ) | | | (289 | ) |
| | | | | | | | | | | | |
Loss from continuing operations, after income taxes | | | (16,452 | ) | | | (36,635 | ) | | | (57,859 | ) |
Income (loss) from discontinued operations, net of tax effect (1) | | | — | | | | (191 | ) | | | 2,914 | |
| | | | | | | | | | | | |
Net loss | | $ | (16,452 | ) | | $ | (36,826 | ) | | $ | (54,945 | ) |
| | | | | | | | | | | | |
Basic and diluted net loss per share: | | | | | | | | | | | | |
Net loss per share from continuing operations | | $ | (0.38 | ) | | $ | (0.85 | ) | | $ | (1.35 | ) |
Net income per share from discontinued operations | | $ | — | | | $ | — | | | $ | 0.07 | |
| | | | | | | | | | | | |
Basic and diluted net loss per share | | $ | (0.38 | ) | | $ | (0.85 | ) | | $ | (1.28 | ) |
| | | | | | | | | | | | |
Weighted average shares used in computing net income (loss) per share Basic and diluted | | | 43,537 | | | | 43,187 | | | | 42,989 | |
| | | | | | | | | | | | |
(1) Amounts reported include stock-based compensation expense as follows: | |
Cost of revenues | | $ | 81 | | | $ | 36 | | | $ | 5 | |
Research and development | | | 1,004 | | | | 754 | | | | 164 | |
Sales and marketing | | | 521 | | | | 518 | | | | 74 | |
General and administrative | | | 2,558 | | | | 3,177 | | | | 699 | |
Discontinued operations | | | — | | | | 953 | | | | — | |
The accompanying notes are an integral part of these consolidated financial statements.
F-5
NAPSTER, INC.
CONSOLIDATED STATEMENT OF CHANGES IN
STOCKHOLDERS’ EQUITY
(in thousands)
| | | | | | | | | | | | | | | | | | | | | | | | | |
| | | Common Stock | | Additional
Paid-in
Capital | | | Deferred
Stock-Based
Compensation | | | Accumulated
Deficit | | | Accumulated
Other
Comprehensive
Income (Loss) | | | Total
Stockholders’
Equity | |
| | | Shares | | Amount | | | | | |
Balance at March 31, 2005 | | 42,961 | | | 43 | | | 256,586 | | | | (533 | ) | | | (86,423 | ) | | | 1,720 | | | | 171,393 | |
Net loss | | — | | | — | | | — | | | | — | | | | (54,945 | ) | | | — | | | | (54,945 | ) |
Foreign currency translation adjustment | | — | | | — | | | — | | | | — | | | | — | | | | (1,169 | ) | | | (1,169 | ) |
Unrealized loss on short-term investments | | — | | | — | | | — | | | | — | | | | — | | | | (718 | ) | | | (718 | ) |
| | | | | | | | | | | | | | | | | | | | | | | | | |
Total comprehensive loss | | | | | | | | | | | | | | | | | | | | | | | | (56,832 | ) |
| | | | | | | | | | | | | | | | | | | | | | | | | |
Issuance of common stock under employee stock plans, net | | 865 | | | 1 | | | 3,538 | | | | (3,269 | ) | | | — | | | | — | | | | 270 | |
Amortization of deferred stock-based compensation | | — | | | — | | | — | | | | 868 | | | | — | | | | — | | | | 868 | |
Stock-based compensation related to stock awards issued to non-employees | | — | | | — | | | 74 | | | | — | | | | — | | | | — | | | | 74 | |
| | | | | | | | | | | | | | | | | | | | | | | | | |
Balance at March 31, 2006 | | 43,826 | | | 44 | | | 260,198 | | | | (2,934 | ) | | | (141,368 | ) | | | (167 | ) | | | 115,773 | |
Net loss | | — | | | — | | | — | | | | — | | | | (36,826 | ) | | | — | | | | (36,826 | ) |
Foreign currency translation adjustment | | — | | | — | | | — | | | | — | | | | — | | | | 199 | | | | 199 | |
Unrealized gain on short-term investments | | — | | | — | | | — | | | | — | | | | — | | | | 93 | | | | 93 | |
| | | | | | | | | | | | | | | | | | | | | | | | | |
Total comprehensive loss | | | | | | | | | | | | | | | | | | | | | | | | (36,534 | ) |
| | | | | | | | | | | | | | | | | | | | | | | | | |
Reversal of deferred stock-based compensation upon adoption of SFAS No. 123(R) | | — | | | — | | | (2,934 | ) | | | 2,934 | | | | — | | | | — | | | | — | |
Option exercises | | 24 | | | — | | | 97 | | | | — | | | | — | | | | — | | | | 97 | |
Issuance of common stock under employee stock plans, net of cancellations and share repurchases | | 920 | | | 1 | | | (69 | ) | | | — | | | | — | | | | — | | | | (68 | ) |
Stock-based compensation related to stock awards | | — | | | — | | | 5,438 | | | | — | | | | — | | | | — | | | | 5,438 | |
| | | | | | | | | | | | | | | | | | | | | | | | | |
Balance at March 31, 2007 | | 44,770 | | | 45 | | | 262,730 | | | | — | | | | (178,194 | ) | | | 125 | | | | 84,706 | |
Net loss | | — | | | — | | | — | | | | — | | | | (16,452 | ) | | | — | | | | (16,452 | ) |
Foreign currency translation adjustment | | — | | | — | | | — | | | | — | | | | — | | | | 246 | | | | 246 | |
Unrealized gain on short-term investments | | — | | | — | | | — | | | | — | | | | — | | | | 83 | | | | 83 | |
| | | | | | | | | | | | | | | | | | | | | | | | | |
Total comprehensive loss | | | | | | | | | | | | | | | | | | | | | | | | (16,123 | ) |
| | | | | | | | | | | | | | | | | | | | | | | | | |
Issuance of common stock under employee stock plans, net of cancellations and share repurchases | | 1,352 | | | 1 | | | (447 | ) | | | — | | | | — | | | | — | | | | (446 | ) |
Stock-based compensation related to stock awards | | — | | | — | | | 4,164 | | | | — | | | | — | | | | — | | | | 4,164 | |
| | | | | | | | | | | | | | | | | | | | | | | | | |
Balance at March 31, 2008 | | 46,122 | | $ | 46 | | $ | 266,447 | | | $ | — | | | $ | (194,646 | ) | | $ | 454 | | | $ | 72,301 | |
| | | | | | | | | | | | | | | | | | | | | | | | | |
The accompanying notes are an integral part of these consolidated financial statements.
F-6
NAPSTER, INC.
CONSOLIDATED STATEMENTS OF CASH FLOWS
(in thousands)
| | | | | | | | | | | | |
| | | Year Ended March 31, | |
| | | 2008 | | | 2007 | | | 2006 | |
Cash flows from operating activities: | | | | | | | | | | | | |
Net loss | | $ | (16,452 | ) | | $ | (36,826 | ) | | $ | (54,945 | ) |
Adjustments to reconcile net loss to net cash provided by (used in) operating activities: | | | | | | | | | | | | |
Depreciation and amortization | | | 6,850 | | | | 3,474 | | | | 4,699 | |
Amortization of prepaid marketing expenses | | | 3,792 | | | | 630 | | | | 1,932 | |
Stock-based compensation charges | | | 4,164 | | | | 5,438 | | | | 942 | |
Other non-cash charges | | | — | | | | — | | | | 524 | |
Change in fair market value of investment hedge | | | — | | | | — | | | | 684 | |
Gain on sale of businesses | | | — | | | | — | | | | (6,540 | ) |
Deferred tax expense | | | 1,045 | | | | 926 | | | | 926 | |
Loss from unconsolidated entity | | | — | | | | 1,991 | | | | 289 | |
Change in operating assets and liabilities, net of effects of acquisition and divestiture: | | | | | | | | | | | | |
Accounts receivable | | | (920 | ) | | | (364 | ) | | | 1,074 | |
Prepaid expenses and other current and long term assets | | | 405 | | | | 1,397 | | | | (1,422 | ) |
Accounts payable | | | (567 | ) | | | (1,098 | ) | | | (3,260 | ) |
Accrued liabilities | | | 7,280 | | | | 2,486 | | | | 6,019 | |
Deferred revenues | | | (1,358 | ) | | | (6,616 | ) | | | 4,603 | |
Other current and long-term liabilities | | | (34 | ) | | | (68 | ) | | | (53 | ) |
| | | | | | | | | | | | |
Net cash provided by (used in) operating activities | | | 4,205 | | | | (28,630 | ) | | | (44,528 | ) |
| | | | | | | | | | | | |
Cash flows from investing activities: | | | | | | | | | | | | |
Purchases of property, equipment and other assets | | | (1,354 | ) | | | (924 | ) | | | (5,003 | ) |
Proceeds from sale of Consumer Software Division, net | | | — | | | | 2,200 | | | | — | |
Purchase of AOL Music Now assets | | | — | | | | (11,050 | ) | | | — | |
Purchases of short-term investments | | | (85,747 | ) | | | (86,191 | ) | | | (159,456 | ) |
Proceeds from maturities and sale of short-term investments | | | 85,076 | | | | 107,226 | | | | 138,807 | |
Return on investment from (investment in) unconsolidated entity | | | — | | | | 223 | | | | (2,714 | ) |
| | | | | | | | | | | | |
Net cash provided by (used in) investing activities | | | (2,025 | ) | | | 11,484 | | | | (28,366 | ) |
| | | | | | | | | | | | |
Cash flows from financing activities: | | | | | | | | | | | | |
Principal payment of capital lease obligation and line of credit | | | (4 | ) | | | (33 | ) | | | (15,112 | ) |
Repurchase of common stock under employee stock plans | | | (561 | ) | | | (218 | ) | | | — | |
Issuance of common stock under employee stock plans | | | 115 | | | | 247 | | | | 202 | |
| | | | | | | | | | | | |
Net cash used in financing activities | | | (450 | ) | | | (4 | ) | | | (14,910 | ) |
| | | | | | | | | | | | |
Effect of exchange rates on cash | | | 829 | | | | 407 | | | | (800 | ) |
Change in cash and cash equivalents | | | 2,559 | | | | (16,743 | ) | | | (88,604 | ) |
Cash and cash equivalents at beginning of period | | | 30,069 | | | | 46,812 | | | | 135,416 | |
| | | | | | | | | | | | |
Cash and cash equivalents at end of period | | $ | 32,628 | | | $ | 30,069 | | | $ | 46,812 | |
| | | | | | | | | | | | |
The accompanying notes are an integral part of these consolidated financial statements.
F-7
NAPSTER, INC.
CONSOLIDATED STATEMENTS OF CASH FLOWS—(Continued)
(in thousands)
| | | | | | | | | | |
| | | Year Ended March 31, | |
| | | 2008 | | 2007 | | 2006 | |
Supplemental cash flow information: | | | | | | | | | | |
Cash paid for interest | | $ | 15 | | $ | 32 | | $ | 161 | |
| | | | | | | | | | |
Cash paid for income taxes | | $ | 89 | | $ | 245 | | $ | 295 | |
| | | | | | | | | | |
Non-cash disclosure of investing activities: | | | | | | | | | | |
Unrealized gains (losses) on short-term investments, net | | $ | 83 | | $ | 93 | | $ | (718 | ) |
| | | | | | | | | | |
The accompanying notes are an integral part of these consolidated financial statements.
F-8
NAPSTER, INC.
NOTES TO CONSOLIDATED FINANCIAL STATEMENTS
NOTE 1—DESCRIPTION OF BUSINESS AND SUMMARY OF SIGNIFICANT ACCOUNTING POLICIES
Description of business
Napster was incorporated in Delaware in August 2000 and is a leading provider of online music for the consumer market. Our digital music distribution services enable fans to sample, listen to, subscribe to and purchase from one of the world’s largest and most diverse online music catalogs utilizing a secure and legal platform. Napster users have access to songs from all major labels and thousands of independent labels, and are able to stream or download those songs either over the Internet or over wireless networks.
Subscribers to the Napster service are given unlimited access to our more than 6 million song catalog, and have the ability to download music with high quality sound, enjoy their music in an advertising-free environment and access many features including radio, Billboard charts and many community features via the web and portable devices. In addition, Napster subscribers are able to enjoy their music on a variety of media across personal computers (including directly from a web browser with no software required on PC, Mac and Linux platforms), CD, MP3 players, music-enabled cellular phones, PDAs and digital media devices for the living room.
Napster Mobile, our service available over certain carrier wireless networks, gives members access to our extensive song catalog via over-the-air downloads, ringtones, wallpapers, as well as personalization products.
Napster services are currently available in the Americas, Europe and Japan.
Liquidity and Capital Resources
Napster has incurred losses and negative cash flows from operations for the period from the inception of the Company’s music distribution business in fiscal 2004 to the end of fiscal 2007. For the year ended March 31, 2008, we incurred an after tax net loss of approximately $16.5 million but achieved positive cash flow. We expect to continue to operate at a loss near term due to our significant investments to enhance service capabilities, market our products and grow worldwide. We expect our existing cash resources will be adequate to fund our operations for at least the next twelve months.
Consolidation and basis of presentation
The accompanying consolidated financial statements present the results of operations, financial position, changes in stockholders’ equity and cash flows applicable to the operations of Napster and its wholly or majority-owned subsidiaries, after elimination of intercompany accounts and transactions. Napster owns 100% of all subsidiaries other than Napster, LLC, of which it owns 99.6%. There is no minority interest in Napster, LLC during the periods presented because the Company is obliged to fund all operating losses of the entity. Investments in entities where Napster does not have control but exerts significant influence are recorded on the equity basis of accounting in accordance with Accounting Principles Board Opinion No. 18, “The Equity Method of Accounting for Investments in Common Stock” (“APB No. 18“).
Foreign currency translation
The functional currency for Napster’s foreign subsidiaries is the respective local currency. These subsidiaries consist of entities in the United Kingdom, Germany and Luxembourg. For these entities, Napster translates assets and liabilities to U.S. dollars using period-end exchange rates and translates revenues and expenses using average exchange rates during the period. Exchange gains and losses arising from translation of foreign entity financial statements are included as a component of other comprehensive loss.
Transactions denominated in currencies other than the functional currency of the legal entity are remeasured to the functional currency of the legal entity at the period-end exchange rates. Any associated currency re-measurement gains and losses are recognized in current operations.
F-9
NAPSTER, INC.
NOTES TO CONSOLIDATED FINANCIAL STATEMENTS—(Continued)
Use of estimates
The preparation of financial statements in accordance with generally accepted accounting principles requires management to make estimates and assumptions that affect the reported amounts of assets and liabilities and the disclosure of contingent assets and liabilities at the date of the financial statements, and the reported amounts of revenues and expenses during the reporting period. Actual results could differ from those estimates.
Cash, cash equivalents and short-term investments
Cash equivalents and short-term investments consist primarily of money market funds, corporate bonds, municipal securities, U.S. government securities, asset-backed securities and commercial paper. Napster classifies its short-term investments into categories in accordance with the provisions of SFAS No. 115 “Accounting for Certain Investments in Debt and Equity Securities”. Short-term investments are classified as available-for-sale, which are reported at fair market value with the related unrealized gains and losses, net of taxes, included in other comprehensive income (loss). The fair value of the Napster’s cash equivalents and investments are based on quoted market prices or estimates based on the best information available in the circumstances.
Napster considers all highly liquid investments purchased with an original maturity or remaining maturity at the date of purchase of three months or less to be cash equivalents, and investments maturing in three to twelve months to be short-term investments. Available-for-sale investments maturing in more than twelve months are classified as short-term investments as the amounts represent the investment of cash that will be available to fund current operations.
Realized gains and losses are computed using the specific identification method. Realized gains and losses, declines in the value of securities judged to be other than temporary, and interest and dividends on all securities are included in interest and other income, net. Napster reviews its investment portfolio to identify and evaluate investments that have indications of other than temporary impairment. Factors considered in determining whether a loss is temporary include the magnitude of the decline in market value, the length of time the market value has been below cost (or adjusted cost), credit quality, and Napster’s ability and intent to hold the securities for a period of time sufficient to allow for any anticipated recovery in market value.
Fair value of financial instruments
The carrying values of Napster’s financial instruments, including accounts receivable, accounts payable and accrued liabilities, approximate fair market value due to their short maturities.
Concentrations of credit risk
Financial instruments that potentially subject Napster to significant concentrations of credit risk consist principally of cash, cash equivalents and short-term investments.
Napster maintains its cash, cash equivalents and short-term investments with high quality financial institutions and, as part of its cash management process, performs periodic evaluations of the relative credit standing of these financial institutions. Amounts deposited with these institutions may exceed federal depository insurance limits. In addition, the portfolio of investments conforms to Napster’s policy regarding concentration of investments, maximum maturity and quality of investment.
F-10
NAPSTER, INC.
NOTES TO CONSOLIDATED FINANCIAL STATEMENTS—(Continued)
Prepaid Marketing Expenses
Napster recognizes up front advance payments for marketing fees in prepaid expenses and other current assets. Prepaid marketing expenses consist of amounts paid to strategic marketing partners and media placement firms for future marketing services and benefits. These prepayments are expensed as marketing services are received, based on fair values of the services received, limited to the contractual value, or based on the fair value of the benefits received. The recoverability of these balances is subject to regular review by management.
Advertising costs
Advertising costs are expensed as incurred and were approximately $5.2 million, $22.5 million and $38.0 million in fiscal 2008, 2007 and 2006, respectively.
Property and equipment
Property and equipment are stated at cost and depreciated or amortized using the straight-line method over the estimated useful lives of the assets, or the lease term if shorter.
Capitalized software development costs
Internal use software. Software development costs incurred as part of an approved project plan that result in additional functionality to internal use software are capitalized and amortized on a straight-line basis over the estimated useful life of the software, generally three years.
Software held for sale. Development costs of computer software to be sold, leased or otherwise marketed are subject to capitalization beginning when a product’s technological feasibility has been established and ending when a product is available for general release to customers. We have not capitalized any such software development costs as technological feasibility is generally not established until a working model is completed, at which time substantially all development is complete.
Goodwill and identifiable intangible assets
Napster accounts for goodwill and identifiable intangible assets in accordance with SFAS No. 142, “Goodwill and Other Intangible Assets” (“SFAS No. 142”). Napster evaluates the carrying value of goodwill on an annual basis and more frequently if certain impairment indicators are present. Napster will adjust the carrying value if the asset’s value has been impaired.
Identifiable intangible assets are amortized over their estimated useful lives reflecting the pattern in which the economic benefits of the intangible assets are consumed. When circumstances warrant, Napster periodically evaluates any possible impairment of long-lived assets, including intangible assets other than goodwill.
Investment in unconsolidated subsidiary
Under APB No. 18, Napster records its investment at the amount of capital contributed plus its percentage interest in the joint venture’s income or loss. Any cumulative loss recorded by Napster is limited to its contributed capital because it is not obligated to provide additional capital contributions to the joint venture. The joint venture is a variable interest entity in accordance with Financial Accounting Standard Board Interpretation 46(R), “Consolidation of Variable Interest Entities, an interpretation of ARB No. 51”.
F-11
NAPSTER, INC.
NOTES TO CONSOLIDATED FINANCIAL STATEMENTS—(Continued)
Accrued publishing fees
Under copyright law we are required to pay licensing fees for compositions embodied in digital sound recordings and for the sound recordings themselves that we deliver in our Napster service. Copyright law may not specify the rate and terms of the licenses, which are often determined by voluntary negotiations among the parties or, for certain compulsory licenses where voluntary negotiations are unsuccessful, by arbitration. There are certain geographies and agencies where we do not have finalized rates to be applied to the current or historic sales of compositions within our digital music offerings. We accrue for the cost of these fees in accordance with SFAS No. 5, “Accounting for Contingencies”, based on contracted or statutory rates, when established, or management’s best estimates based on facts and circumstances regarding the specific music services and agreements in similar geographies or with similar agencies. To the extent negotiated rates are significantly different than management’s current estimates, our financial statements may be affected.
Revenue recognition
Napster recognizes revenues in accordance with Staff Accounting Bulletin 104, “Revenue Recognition in Financial Statements” (“SAB 104”), EITF 00-21 “Revenue Arrangements with Multiple Deliverables” (“EITF 00-21”), and EITF 99-19, “Reporting Revenue Gross as a Principal versus Net as an Agent” (“EITF 99-19”). In general, Napster recognizes revenue, net of sales related taxes, when there is persuasive evidence of an arrangement, the fee is fixed or determinable, the product or services have been delivered and collectability of the resulting receivable is reasonably assured.
Music subscriptions are paid in advance, typically for monthly or annual periods. Music subscription revenues are recognized ratably on a daily basis over the subscription period. Revenues from sales of individual songs or albums by download are recognized at the time the music is delivered, digitally, to the end user. Revenues from pre-paid cards and promotions are deferred and then generally recognized as (i) tracks are downloaded by the end users, or (ii) if redeemed for a subscription, over the subscription period. In cases where prepaid promotions are not expected to be redeemed, revenue is recognized when Napster has no further obligation to provide services or refund the associated prepayments (“breakage“). Effective in October 2006, revenue from prepaid cards is recognized ratably over the usage period, including estimated breakage based on historical experience. Prior to October 2006 we did not have sufficient historical experience to estimate prepaid card breakage rates, and recognized prepaid card breakage only when our obligation to honor the redemption of the prepaid card had legally expired. Revenues from licensing of Napster trademarks are recognized upon receipt of royalty reports from the licensee or, for prepaid royalties, when the Company provides or has no further obligation to provide services.
Napster has arrangements whereby customers pay one price for multiple products and services. In some cases, these arrangements involve a combination of hardware and services. In other cases, the customer pays a single price for multiple music downloads and months of music subscriptions. For arrangements with multiple deliverables, revenue is recognized upon the delivery of the separate units in accordance with EITF 00-21. Consideration from multiple element arrangements is allocated among the separate elements based on their relative fair values. In the event that there is no objective and reliable evidence of fair value, the revenue recognized upon delivery is the total arrangement consideration less the fair value of the undelivered items. The maximum revenue recognized on a delivered element is limited to the amount that is not contingent upon the delivery of additional items.
F-12
NAPSTER, INC.
NOTES TO CONSOLIDATED FINANCIAL STATEMENTS—(Continued)
Napster has arrangements with certain customers whereby the customer provides goods or services to Napster. Our revenue and the charges for the goods or services provided by a customer are accounted for in accordance with EITF 01-09, “Accounting for Consideration Given by a Vendor to a Customer”, including subsequent interpretations. The costs of separately identifiable goods or services received by Napster from a customer are valued at the cost Napster would incur to procure the same goods or services from a non-customer third party. If the goods or services cannot be separated, the total consideration is recorded as a reduction of revenues. Consideration paid to customers under these arrangements that exceeds the separately identifiable value of the goods or services provided would be reflected as a reduction of the customer’s revenue.
Napster recognizes revenue gross or net in accordance with EITF 99-19. In most arrangements, Napster contracts directly with the end user customers, is the primary obligor and carries all collectability risk. Revenue in these arrangements is recorded on a gross basis. In some cases, Napster utilizes third parties to sell products or services directly to end user customers, and Napster carries no collectability risk. In some cases, Napster pays certain costs for the third party and is reimbursed at cost plus a small mark-up. In both of those instances, Napster reports the revenue net of the amount paid to the third party.
Income taxes
We account for income taxes in accordance with SFAS No. 109, “Accounting for Income Taxes” (“SFAS No. 109”.) Deferred taxes result from differences between the financial and tax bases of Napster’s assets and liabilities and are adjusted for changes in tax rates and tax laws when changes are enacted. Valuation allowances are recorded to reduce deferred tax assets when it is more likely than not that a tax benefit will not be realized by Napster.
In accordance with SFAS No. 109, we have recognized a tax benefit in continuing operations and an equal offsetting additional tax provision in the discontinued operation in each period that continuing operations had a loss that can be applied to offset income from the discontinued operation.
On April 1, 2007, the Company adopted the provisions of FASB Interpretation 48, “Accounting for Uncertainty in Income Taxes—an interpretation of FASB Statement No. 109” (“FIN 48”), which prescribes a recognition threshold and measurement process for recording in the financial statements uncertain tax positions taken or expected to be taken in a tax return. Additionally, FIN 48 provides guidance on the recognition, classification, accounting in interim periods and disclosure requirements for uncertain tax positions. The adoption of FIN 48 resulted in no adjustment to beginning accumulated deficit.
The Company files its tax returns as prescribed by the tax laws of the jurisdictions in which it operates. The Company is currently open to audit under the statute of limitations by the Internal Revenue Service for the years ended March 31, 2006 through 2008. State income tax returns for the Company and its subsidiaries are open to audit under the statute of limitations for the years ended March 31, 2006 through 2008. The Company’s foreign operations are open to audit under statute of limitations for the years ended March 31, 2004 through 2008.
The Company recognizes interest and/or penalties related to uncertain tax positions in income tax expense. No additional interest and penalties were accrued upon adoption of FIN 48. The Company does not anticipate significant changes to total uncertain tax positions due to the settlement of examinations or the expirations of statutes of limitations during the next twelve months.
F-13
NAPSTER, INC.
NOTES TO CONSOLIDATED FINANCIAL STATEMENTS—(Continued)
Comprehensive income
SFAS No. 130, “Reporting Comprehensive Income”, requires the disclosure of comprehensive income (loss) to reflect changes in equity that result from transactions and economic events from non-owner sources. Accumulated other comprehensive loss for the periods presented represents foreign currency translations associated with Napster’s international operations and unrealized gains and losses on available for sale securities.
Net income (loss) per share
Basic net income (loss) per share is computed using the weighted-average number of common shares outstanding during the period, less unvested restricted stock as required by SFAS No. 128, “Earnings per Share”, because issued and outstanding unvested restricted stock must be returned to the Company if vesting does not occur. Diluted net income (loss) per share is computed using the weighted-average number of common and dilutive potential shares outstanding during the period. Dilutive potential shares have consisted of warrants, common stock issuable upon exercise of stock options and unvested restricted stock, computed using the treasury stock method.
Dilutive potential shares excluded from the calculation because their effect would have been anti-dilutive totaled 5.2 million in fiscal 2008, 5.5 million in fiscal 2007 and 5.1 million in fiscal 2006.
Stock-based compensation
Effective April 1, 2006, Napster adopted the provisions of SFAS No. 123 (revised 2004), “Share-Based Payment” (“SFAS No. 123(R)”), which requires the measurement and recognition of compensation expense for all stock-based awards issued to employees and directors based on estimated fair values. SFAS No. 123(R) supersedes Napster’s previous accounting under Accounting Principles Board Opinion No. 25, “Accounting for Stock Issued to Employees” (“APB No. 25”), for periods beginning April 1, 2006.
Napster adopted SFAS No. 123(R) using the modified prospective method, which requires the application of the accounting standard as of April 1, 2006, the first day of the Company’s fiscal year. In accordance with the modified-prospective transition method, Napster’s consolidated financial statements for prior periods have not been restated to reflect, and do not include, the impact of adopting SFAS No. 123(R). Effective April 1, 2006, stock-based compensation expense includes compensation expense for (1) all stock-based compensation awards granted prior to but not vested as of April 1, 2006, based on the grant date fair value estimated in accordance with the original provisions of SFAS No. 123, “Accounting for Stock-Based Compensation” (“SFAS No. 123”), and (2) all stock-based compensation awards granted or modified after April 1, 2006 based on the grant-date fair value estimated in accordance with the provisions of SFAS No. 123(R).
Prior to the adoption of SFAS No. 123(R), Napster presented deferred compensation as a separate component of stockholders’ equity. In accordance with the provisions of SFAS No. 123(R), on April 1, 2006, Napster reclassified the balance of deferred compensation expense to additional paid-in capital on its consolidated balance sheet.
Under SFAS No. 123(R), compensation expense for all share-based compensation awards is recognized on a straight-line basis over the period the employee performs the related services, generally the vesting period of four years, net of estimated forfeitures. The application of the estimated forfeiture rate under SFAS No. 123(R) to unvested restricted stock awards as of April 1, 2006 was not material. Napster estimates forfeitures based on historical experience and revises the rates, if necessary, in subsequent periods if actual forfeitures differ from previous estimates.
F-14
NAPSTER, INC.
NOTES TO CONSOLIDATED FINANCIAL STATEMENTS—(Continued)
Prior to adopting SFAS No. 123(R), Napster accounted for stock-based compensation to employees in accordance with intrinsic value method specified in APB No. 25. Under APB No. 25, compensation expense is recognized based on the difference, if any, on the measurement date between the fair value of Napster’s common stock and the amount an employee must pay to acquire the common stock. The compensation expense is recognized over the periods the employee performs the related services, generally the vesting period of four years.
Napster accounts for equity instruments issued to non-employees in accordance with the provisions of SFAS No. 123 and EITF 96-18, “Accounting for Equity Instruments that Are Issued to Other than Employees for Acquiring, or in Conjunction with Selling, Goods or Services”, which requires that such equity instruments are recorded at their fair value on the measurement date, which is typically the date of grant.
In November 2005, the FASB issued FASB Staff Position No. FAS 123(R)-3, “Transition Election Related to Accounting for Tax Effects of Share-Based Payment Awards” (“FSP 123R-3”). The Company has elected to adopt the alternative transition method provided in the FSP 123R-3 for calculating the tax effects of stock-based compensation pursuant to SFAS No. 123R. The alternative transition method includes computational guidance to establish the beginning balance of the additional paid-in capital pool (“APIC Pool”) related to the tax effects of employee stock-based compensation, and a simplified method to determine the subsequent impact on the APIC Pool for employee stock-based compensation awards that are vested and outstanding upon adoption of SFAS 123(R).
Recent accounting pronouncements
In September 2006, the FASB issued SFAS No. 157, “Fair Value Measurements” (“SFAS 157”), which addresses how companies should measure fair value when they are required to use a fair value measure for recognition or disclosure purposes under generally accepted accounting principles. The accounting provisions of SFAS 157 will be effective for the Company beginning April 1, 2008. Adoption of this statement is not expected to have a material impact on the Company’s consolidated financial position or results of operations.
In February 2007, the FASB issued SFAS No. 159, “The Fair Value Option for Financial Assets and Financial Liabilities—including an amendment of FASB Statement No. 115” (“SFAS 159”). SFAS 159 gives the Company the irrevocable option to carry most financial assets and liabilities at fair value, with changes in fair value recognized in earnings. SFAS 159 will be effective for the Company’s fiscal year beginning April 1, 2008. Adoption of this statement is not expected to have a material impact on the Company’s consolidated financial position or results of operations.
In December 2007, the FASB issued SFAS No. 141(R), “Business Combinations”, which replaces SFAS No. 141, Business Combination. SFAS No. 141(R) retains the underlying concepts of SFAS No. 141 in that all business combinations are still required to be accounted for at fair value under the acquisition method of accounting, but SFAS No. 141(R) changed the method of applying the acquisition method in a number of significant aspects. SFAS No. 141(R) is effective on a prospective basis for the Company beginning April 1, 2009, with the exception of the accounting for valuation allowances on deferred taxes and acquired tax contingencies under SFAS No. 109, which were effective on the date of issuance of this statement. Early adoption is not allowed. Adoption of this statement is not expected to have a material impact on the Company’s consolidated financial position or results of operations.
In May 2008, the FASB issued FASB Staff Position No. FAS 142-3, “Determination of the Useful Life of Intangible Assets” (“FSP FAS 142-3”). FSP FAS 142-3 amends the factors that should be considered in developing renewal or extension assumptions used to determine the useful life of a recognized intangible asset under SFAS No. 142. FSP FAS 142-3 will be effective for the Company’s fiscal year beginning April 1, 2009. Adoption of this statement is not expected to have a material impact on the Company’s consolidated financial position or results of operations.
F-15
NAPSTER, INC.
NOTES TO CONSOLIDATED FINANCIAL STATEMENTS—(Continued)
NOTE 2—ASSET ACQUISITION AND DIVESTITURES
Assets purchased from AOL Music Now, LLC
On January 11, 2007, Napster, LLC, a subsidiary of Napster, entered into an Asset Purchase Agreement with AOL Music Now, LLC and AOL, LLC, respectively, collectively referred to as “AOL” and an Advertising Agreement with AOL, LLC, collectively the “Agreement”. Under the terms of the Agreement, Napster, LLC paid $11.2 million to AOL in exchange for all of the subscribers to AOL’s Music Now service, together with certain related assets and liabilities. Additionally, Napster, LLC was granted certain exclusive advertising rights throughout the AOL Music Channel for one year, and AOL guaranteed to deliver a minimum amount of advertising impressions to the Company.
Napster LLC accounted for the assets acquired based on their fair value. The allocation of the purchase price to the net assets acquired is summarized below (in thousands):
| | | | |
Allocation of purchase price: | | | | |
Customer intangible | | $ | 8,000 | |
Prepaid marketing | | | 4,422 | |
Unearned Fees | | | (1,228 | ) |
| | | | |
Net assets acquired | | $ | 11,194 | |
| | | | |
Divestiture
On December 17, 2004 Napster sold substantially all of the assets and liabilities constituting the consumer software division (“CSD”), including all of the capital stock of certain international subsidiaries historically included in CSD to Sonic Solutions, a California corporation (“Sonic”).
Napster had no ongoing activity in the discontinued operation during fiscal 2008, 2007 and 2006. The loss from discontinued operations in fiscal 2007 is comprised of an additional charge related to stock-based compensation on options issued primarily from fiscal 2002 to 2005, offset by the net tax benefit from the favorable resolution of previously provided tax contingencies related to CSD. During March 2006, Napster and Sonic settled all adjustments described in the divestiture agreement and Napster recognized an additional $4.5 million gain on the divestiture, net of taxes.
NOTE 3—CASH, CASH EQUIVALENTS AND INVESTMENTS
Cash and cash equivalents
Napster’s cash and cash equivalents consist of the following (in thousands):
| | | | | | |
| | | March 31, |
| | | 2008
Fair Value | | 2007
Fair Value |
Cash | | $ | 11,512 | | $ | 13,238 |
| | | | | | |
Cash equivalents: | | | | | | |
Commercial paper | | | 5,243 | | | 6,657 |
Corporate securities | | | — | | | 1,507 |
Money market securities | | | 15,873 | | | 8,667 |
| | | | | | |
Total cash equivalents | | | 21,116 | | | 16,831 |
| | | | | | |
Total cash and cash equivalents | | $ | 32,628 | | $ | 30,069 |
| | | | | | |
F-16
NAPSTER, INC.
NOTES TO CONSOLIDATED FINANCIAL STATEMENTS—(Continued)
Short-term investments
Napster’s short-term investments consist of the following (in thousands):
| | | | | | |
| | | March 31, |
| | | 2008
Fair Value | | 2007
Fair Value |
Commercial paper | | $ | 15,070 | | $ | 15,096 |
Asset backed securities | | | 296 | | | 5,188 |
Corporate securities | | | 14,775 | | | 13,924 |
Municipal securities | | | 3,052 | | | 2,206 |
U.S. government agencies securities | | | 3,971 | | | — |
| | | | | | |
Total short-term investments | | $ | 37,164 | | $ | 36,414 |
| | | | | | |
All $37.2 million and $36.4 million of short-term investments at March 31, 2008 and 2007, respectively, mature in less than one year.
Realized gains and losses, amortization and accretion on cash equivalents and short-term investments, net, totaled $1.4 million, $1.4 million and $1.8 million in fiscal 2008, 2007 and 2006, respectively. Gross realized losses on short-term investments in fiscal 2008, 2007 and 2006 were not significant. Additionally, gross unrealized gains on cash equivalents and short-term investments were $88,000 and $2,000 as of March 31, 2008 and March 31, 2007, respectively, and gross unrealized losses were $23,000 and $20,000 as of March 31, 2008 and March 31, 2007, respectively.
Napster has determined that the gross unrealized losses on its available-for-sale securities as of March 31, 2008 are temporary in nature and no realizable impairment has occurred.
At March 31, 2008, Napster held a $3.0 million investment in one AAA rated municipal auction rate security that was valued at reported market price and classified as current asset. Auction rate securities are collateralized long-term debt instruments that provide liquidity through a Dutch auction process that resets the applicable interest rate at pre-determined intervals, typically every 7, 28 and 35 days. Napster was unable to sell this security in April 2008 due to auction failure. As a result, the funds associated with these failed auctions will not be accessible until the issuer calls the security, a successful auction occurs, a buyer is found outside of the auction process, or the security matures. The underlying assets of the municipal auction rate securities Napster holds are generally student loans which are guaranteed by the U.S. government.
Since December 2007 Napster successfully sold a substantial portion of its auction rate security holdings through the normal auction process without any losses.
Napster does not believe the carrying value of this auction rate security is impaired as of March 31, 2008. At this time, Napster has not obtained sufficient evidence to conclude that this investment will not be settled in the short term, although the market for this investment is presently uncertain.
NOTE 4—BALANCE SHEET DETAIL
Prepaid expenses and other current assets (in thousands)
| | | | | | |
| | | March 31, |
| | | 2008 | | 2007 |
Prepaid marketing expense | | | — | | $ | 3,792 |
Prepaid expenses and other current assets | | | 2,289 | | | 2,755 |
| | | | | | |
Total prepaid expenses and other current assets | | $ | 2,289 | | $ | 6,547 |
| | | | | | |
F-17
NAPSTER, INC.
NOTES TO CONSOLIDATED FINANCIAL STATEMENTS—(Continued)
Property and equipment, net (in thousands)
| | | | | | | | | | |
| | | Useful
Life | | March 31, | |
| | | | 2008 | | | 2007 | |
Computer equipment and software | | 3 - 5 years | | $ | 10,438 | | | $ | 10,086 | |
Furniture and fixtures | | 3 - 8 years | | | 329 | | | | 391 | |
Leasehold improvements | | Life of lease | | | 456 | | | | 625 | |
Capitalized software development costs | | 3 - 5 years | | | 4,340 | | | | 3,756 | |
| | | | | | | | | | |
| | | | | 15,563 | | | | 14,858 | |
Less: Accumulated depreciation and amortization | | | | | (12,205 | ) | | | (10,122 | ) |
| | | | | | | | | | |
Property and equipment, net | | | | $ | 3,358 | | | $ | 4,736 | |
| | | | | | | | | | |
Depreciation expense totaled $2.7 million in fiscal 2008, $3.2 million in fiscal 2007and $3.3 million in fiscal 2006.The amortization of capitalized software development costs, included in depreciation expense, totaled $1.1 million in fiscal 2008, $1.0 million in fiscal 2007 and $217,000 in fiscal 2006. Unamortized capitalized software development costs were $1.7 million and $2.2 million at March 31, 2008 and 2007, respectively.
Accrued liabilities (in thousands)
| | | | | | |
| | | March 31, |
| | | 2008 | | 2007 |
Accrued affiliate and content liabilities | | $ | 11,498 | | $ | 9,536 |
Accrued publishing fees | | | 12,218 | | | 6,589 |
Accrued compensation and related expenses | | | 1,365 | | | 1,825 |
Other accrued liabilities | | | 6,085 | | | 5,624 |
| | | | | | |
Total accrued liabilities | | $ | 31,166 | | $ | 23,574 |
| | | | | | |
Accrued publishing fees as of March 31, 2008 and 2007 represent management’s best estimate of the remaining amounts that will be due to publishers for mechanical licenses and performance fees associated with the distribution of digital music. Rates for some of these items have not been finalized with the publishers and are subject to further negotiation or arbitration depending on the geography. Napster accrues for the cost of these licenses and fees based on contracted or statutory rates, when established, or management’s best estimates based on facts and circumstances regarding the specific music services and agreements in similar geographies or with similar agencies. Any rates finalized subsequent to March 31, 2008 and through the filing of this Form 10-K have not materially differed from the rates used in Management’s estimates of these accrued publishing fees as of March 31, 2008.
Deferred revenue (in thousands)
| | | | | | |
| | | March 31, |
| | | 2008 | | 2007 |
Unearned subscription revenue | | $ | 5,363 | | $ | 5,085 |
Unredeemed prepaid card and promotional content | | | 1,096 | | | 957 |
Unearned hardware and license revenue | | | 15 | | | 1,009 |
Other deferred revenue | | | — | | | 550 |
| | | | | | |
Total deferred revenue | | $ | 6,474 | | $ | 7,601 |
| | | | | | |
All deferred revenue and other benefits as of March 31, 2008 are expected to be earned during fiscal 2009 as the services will be delivered or the items otherwise qualify for revenue recognition in accordance with SAB 104. All but approximately $68,000 of deferred revenue and other benefits as of March 31, 2007 were earned during fiscal 2008.
F-18
NAPSTER, INC.
NOTES TO CONSOLIDATED FINANCIAL STATEMENTS—(Continued)
NOTE 5—GOODWILL AND IDENTIFIABLE INTANGIBLE ASSETS
Goodwill
In May 2003, Napster acquired substantially all of the ownership of Napster, LLC, formerly known as Pressplay, a provider of an online music service. Napster recorded a total of $34.7 million of goodwill in connection with the acquisition during fiscal 2004. Napster evaluates the carrying value of goodwill on an annual basis as of each fiscal year-end, and would evaluate it more frequently if certain impairment indicators were present. The analyses at March 31, 2008 and 2007 both indicated that the fair value of the reporting unit was in excess of the carrying value of the reporting unit and, accordingly, no impairment existed.
The first step of the goodwill impairment test compares the fair value of a reporting unit with its carrying amount, including goodwill. The fair value of the reporting unit used for each annual impairment analysis has been based upon management’s best estimates of the reporting unit’s fair value. As a single reporting unit entity, management has historically considered the publicly traded market capitalization of the company in its analysis. In the fiscal 2008 analysis, management estimated the reporting unit’s fair value based on market capitalization, including a control premium in its assessment. In prior year assessments, the Company’s publicly traded market capitalization exceeded its net equity value. As part of its 2008 analysis, management obtained additional support regarding the fair value by evaluating and weighting a discounted cash flow approach and a comparable transaction approach. These approaches supported the fact that the reporting unit’s fair value was in excess of the carrying value.
Identifiable intangible assets, net (in thousands)
| | | | | | | | | | | | |
| | | March 31, |
| | | 2008 | | 2007 |
| | | Gross
Carrying
Amount | | Accumulated
Amortization | | Gross
Carrying
Amount | | Accumulated
Amortization |
Identified intangible assets: | | | | | | | | | | | | |
Patents | | $ | 376 | | $ | 376 | | $ | 376 | | $ | 376 |
Trademarks | | | 5,982 | | | 5,982 | | | 5,982 | | | 5,982 |
Customer intangible | | | 8,000 | | | 4,440 | | | 8,000 | | | 271 |
| | | | | | | | | | | | |
Total | | $ | 14,358 | | $ | 10,798 | | $ | 14,358 | | $ | 6,629 |
| | | | | | | | | | | | |
Net book value | | | | | $ | 3,560 | | | | | $ | 7,729 |
| | | | | | | | | | | | |
Amortization of identifiable intangible assets was $4.2 million in fiscal 2008 and $271,000 in fiscal 2007. The customer intangible is being amortized based on its estimated usage over a five-year period. The estimated amortization expense for the customer intangible is $1.7 million, $895,000, $563,000 and $391,000 for fiscal 2009, 2010, 2011 and 2012, respectively.
F-19
NAPSTER, INC.
NOTES TO CONSOLIDATED FINANCIAL STATEMENTS—(Continued)
NOTE 6—INVESTMENT IN UNCONSOLIDATED ENTITY
On October 14, 2005, the Company entered into a Joint Venture Operating Agreement with Tower Records Japan, Inc. (“Tower Japan”), relating to the formation and operation of a Japan-based joint venture company (the “Joint Venture”) for the purpose of operating the Napster music service online in Japan. During fiscal 2006, the Company contributed 308.7 million Japanese yen ($2.4 million as of the dates of the contributions) in exchange for a 31.5% ownership interest and Tower Japan contributed a total of 671.3 million Japanese yen for a 68.5% ownership interest. Tower Japan is obligated to arrange or provide debt or equity funding, including through an unsecured revolving line of credit. Napster has no obligation to fund future losses or make additional contributions other than the investment described above. The Company and Tower Japan have customary shareholder rights in the Joint Venture, including veto rights, rights to appoint directors and officers and rights of first refusal. The Company’s investment balance in the Joint Venture was zero at both March 31, 2008 and 2007 because the cumulative losses exceeded the equity contributions. The Company made no equity contribution during fiscal 2008 and 2007.
Under the terms of the agreement, the Company licensed platform technology and trademarks to the Joint Venture in exchange for fixed rate royalties. In addition, the Company paid certain expenses on behalf of the Joint Venture that are reimbursable by the Joint Venture. A summary of Napster’s earned and unearned license royalties as well as receivables due from royalty and reimbursement is as follows (in thousands):
| | | | | | | | | |
| | | Year Ended March 31, |
| | | 2008 | | 2007 | | 2006 |
Service license royalty revenue | | $ | 1,424 | | $ | 391 | | $ | — |
| | |
| | | March 31 | | |
| | | 2008 | | 2007 | | |
Other current assets | | $ | 455 | | $ | 331 | | | |
Deferred revenue | | $ | — | | $ | 550 | | | |
NOTE 7—INCOME TAXES
The components of loss before income tax benefit (provision) are as follows (in thousands):
| | | | | | | | | | | | |
| | | Year Ended March 31, | |
| | | 2008 | | | 2007 | | | 2006 | |
Continuing operations: | | | | | | | | | | | | |
Domestic | | $ | (13,532 | ) | | $ | (24,565 | ) | | $ | (57,314 | ) |
Foreign | | | (1,765 | ) | | | (8,822 | ) | | | (1,416 | ) |
| | | | | | | | | | | | |
Loss before income tax benefit (provision) | | $ | (15,297 | ) | | $ | (33,387 | ) | | $ | (58,730 | ) |
| | | | | | | | | | | | |
The components of the income tax benefit (provision) are as follows (in thousands):
| | | | | | | | | | | | |
| | | Year Ended March 31, | |
| | | 2008 | | | 2007 | | | 2006 | |
Federal: | | | | | | | | | | | | |
Current | | $ | (8 | ) | | $ | (206 | ) | | $ | 1,880 | |
Deferred | | | (914 | ) | | | (810 | ) | | | (810 | ) |
Foreign: | | | | | | | | | | | | |
Current | | | (72 | ) | | | (40 | ) | | | (49 | ) |
State: | | | | | | | | | | | | |
Current | | | (30 | ) | | | (85 | ) | | | 255 | |
Deferred | | | (131 | ) | | | (116 | ) | | | (116 | ) |
| | | | | | | | | | | | |
Income tax benefit (provision) | | $ | (1,155 | ) | | $ | (1,257 | ) | | $ | 1,160 | |
| | | | | | | | | | | | |
F-20
NAPSTER, INC.
NOTES TO CONSOLIDATED FINANCIAL STATEMENTS—(Continued)
Significant components of Napster’s deferred tax assets and liabilities are as follows (in thousands):
| | | | | | | | |
| | | March 31, | |
| | | 2008 | | | 2007 | |
Net operating loss carryforwards | | $ | 38,675 | | | $ | 40,298 | |
Research & development | | | 9,859 | | | | 8,253 | |
Accrued liabilities and other provisions | | | 9,340 | | | | 5,073 | |
Deferred revenue | | | 1,308 | | | | 1,123 | |
Compensatory accruals | | | 4,051 | | | | 3,781 | |
Tax credit carryforwards | | | 177 | | | | 1,594 | |
Other, net | | | 65 | | | | 54 | |
| | | | | | | | |
Total | | | 63,475 | | | | 60,176 | |
Less: Valuation allowance | | | (63,475 | ) | | | (60,176 | ) |
| | | | | | | | |
Deferred tax assets | | | — | | | | — | |
Deferred tax liabilities associated with tax deductible goodwill | | | (4,593 | ) | | | (3,548 | ) |
| | | | | | | | |
Net deferred tax liabilities | | $ | (4,593 | ) | | $ | (3,548 | ) |
| | | | | | | | |
Napster has established a valuation allowance against its gross deferred tax assets that are not deemed more likely than not to be recoverable prior to expiration. In establishing the valuation allowance, Napster considered, among other factors, its historical losses of the online music business, and projections for the future. The valuation allowance increased by $3.3 million, $11.7 million, and $25.8 million during fiscal years 2008, 2007 and 2006, respectively. During December 2006 Napster made an election to capitalize research and development expenses. This election resulted in an additional $9.9 million and $8.3 million deferred tax asset in fiscal 2008 and 2007, respectively, against which the Company applied a full valuation allowance.
During January 2005, following the divestiture of CSD, which utilized substantially all of our tax operating losses, Napster decided to make a tax election to step up the basis in Pressplay goodwill for tax purposes. As a result, the Pressplay goodwill is deductible for tax purposes, and in accordance with SFAS No. 109, this tax deduction represents a taxable temporary difference. As of March 31, 2008, due to our history of losses and the fact that this deferred tax liability would reverse only if the business was sold or the goodwill impaired, reversal of the deferred tax liability is not reasonably assured. Accordingly, a deferred tax liability and related expense for this item of approximately $4.6 million has been recorded.
At March 31, 2008, Napster had approximately $86.7 million and $87.1 million in federal and state net operating loss carryforwards with expirations beginning in 2022 and 2012, respectively. In addition, Napster had approximately $11.5 million in foreign net operating loss carryforwards, which can be carried forward indefinitely. Finally, Napster had approximately $177,000 in tax credit carryforwards with expirations beginning in 2022.
The income tax benefit (provision) differs from the amount computed by applying the federal statutory tax rate to the loss from continuing operations as follows:
| | | | | | | | | |
| | | Year Ended March 31, | |
| | | 2008 | | | 2007 | | | 2006 | |
Federal statutory rate | | 35.0 | % | | 35.0 | % | | 35.0 | % |
State tax benefit, net of federal benefit | | 6.1 | % | | 5.6 | % | | 5.0 | % |
Increase in valuation allowance | | (48.1 | )% | | (44.4 | )% | | (38.0 | )% |
| | | | | | | | | |
Effective income tax rate | | (7.0 | )% | | (3.8 | )% | | 2.0 | % |
| | | | | | | | | |
F-21
NAPSTER, INC.
NOTES TO CONSOLIDATED FINANCIAL STATEMENTS—(Continued)
Napster has not accrued income taxes on accumulated undistributed earnings from continuing operations of its non-U.S. subsidiaries, as these earnings will be reinvested indefinitely. Napster does not anticipate that it will incur any material U.S. income or foreign withholding taxes when cash is repatriated to the United States.
Upon the Company’s adoption of FIN48 during the first quarter of fiscal 2008, there was no change to the balance of its liability for uncertain tax positions. The balance, recorded in accrued liabilities, was $173,000 at April 1, 2007, which consists $160,000 for unrecognized tax benefits and $13,000 accrual for interest. At March 31, 2008, the Company’s liability for uncertain tax positions decreased to $24,000. This amount consists of $20,000 for unrecognized tax benefits and a $4,000 accrual for the payment of interest. The decrease in unrecognized tax benefits during the year ended March 31, 2008 was primarily attributable to resolution of previously provided liabilities on a dormant foreign subsidiary when it was officially liquidated by the tax authority during the year.
NOTE 8—LINE OF CREDIT
During fiscal 2007 Napster had an agreement with Silicon Valley Bank to provide a $17.0 million revolving line of credit, collateralized by substantially all of Napster’s assets. Napster had no borrowings under the line during fiscal 2007, and terminated the line during October 2006. Napster was in compliance with all financial covenants under the line of credit at all times.
NOTE 9—STOCKHOLDERS’ EQUITY
Preferred Stock
Napster is authorized to issue 10 million shares of preferred stock, $0.001 par value. No shares of preferred stock were issued or outstanding at March 31, 2008 and 2007.
Common Stock
The Company issues new shares of its common stock to satisfy stock option exercises. As of March 31, 2008, Napster has reserved shares of common stock for future issuance as follows:
| | |
Stock option and award plans | | 11,837,673 |
Employee stock purchase plan (ESPP) | | 437,278 |
| | |
Total reserved shares of common stock for future issance | | 12,274,951 |
| | |
NOTE 10—EMPLOYEE BENEFIT PLANS
Stock Plans
Under various stock plans, the Company may grant incentive and non-qualified stock options, restricted stock awards and other equity based awards to Company employees, officers, directors and consultants. Options generally vest 25% on the first anniversary of the grant and 6.25% per quarter thereafter for the next twelve quarters. Options generally have a term of ten years from the date of grant. The Board of Directors establishes the exercise price of stock options, which generally is not less than the fair market value of the Company’s stock on the date of grant. Restricted stock awards granted to employees generally vest ratably over a four year period in equal annual cliffs, are forfeited if the employee leaves the Company prior to vesting and have full voting rights until forfeited.
F-22
NAPSTER, INC.
NOTES TO CONSOLIDATED FINANCIAL STATEMENTS—(Continued)
On October 24, 2005 the Company amended its Napster, Inc. 2001 Stock Plan to provide, effective January 1, 2006, the granting of restricted stock awards to non-employee directors in lieu of granting stock options. The restricted stock awards granted to non-employee directors vest ratably over a four year period in equal quarterly cliffs, are forfeited upon termination of services on the Board of Directors prior to vesting, and have full voting rights until forfeited.
During fiscal 2004, the Board of Directors granted to the Company’s chief executive officer options to purchase 300,000 shares of common stock. This grant was contingent upon the approval by stockholders. The options were granted at a price below the fair market value on the date of the stockholders’ approval, which resulted in an $897,000 deferred stock compensation charge. This amount is being amortized over the vesting period of the options. Approximately $224,000 of amortization expense was recorded and included in stock-based compensation charges each year from fiscal 2005 to fiscal 2008.
Restricted Stock Awards
The following table summarizes information about restricted stock awards activity under Napster’s stock plans:
| | | | | | | | | | | | | | | | | | |
| | | Year Ended March 31, | | | | | |
| | | 2008 | | 2007 | | 2006 |
| | | Unvested
Shares | | | Weighted
Average
Grant Date
Fair Value | | Unvested
Shares | | | Weighted
Average
Grant Date
Fair Value | | Unvested
Shares | | | Weighted
Average
Grant Date
Fair Value |
Outstanding, beginning of year | | 1,512,247 | | | $ | 4.04 | | 784,810 | | | $ | 4.17 | | — | | | $ | — |
Awarded | | 2,209,855 | | | $ | 3.78 | | 1,304,750 | | | $ | 3.95 | | 1,003,031 | | | $ | 4.14 |
Vested | | (484,659 | ) | | $ | 4.06 | | (197,508 | ) | | $ | 4.17 | | (16,903 | ) | | $ | 3.52 |
Forfeited | | (762,191 | ) | | $ | 4.13 | | (379,805 | ) | | $ | 3.89 | | (201,318 | ) | | $ | 4.13 |
| | | | | | | | | | | | | | | | | | |
Outstanding, end of year | | 2,475,252 | | | $ | 3.78 | | 1,512,247 | | | $ | 4.04 | | 784,810 | | | $ | 4.17 |
| | | | | | | | | | | | | | | | | | |
The total fair value on the vesting date of restricted stock awards that vested during fiscal 2008, 2007 and 2006 was $1.8 million, $658,000 and $59,000, respectively. As of March 31, 2008, there was $5.4 million of total unrecognized compensation expense related to unvested restricted stock awards, which is expected to be recognized over the weighted-average periods of 2.73 years.
Stock Options
The following table summarizes information about stock option activity under Napster’s stock plans:
| | | | | | | | | | | | | | | | | | |
| | | Year Ended March 31, 2008 | | Year Ended March 31, 2007 | | Year Ended March 31, 2006 |
| | | Number
of Shares | | | Weighted
Average
Exercise Price | | Number
of Shares | | | Weighted
Average
Exercise Price | | Number
of Shares | | | Weighted
Average
Exercise Price |
Outstanding, beginning of year | | 3,989,178 | | | $ | 7.66 | | 4,321,637 | | | $ | 7.52 | | 5,016,826 | | | $ | 7.48 |
Granted | | 43,875 | | | $ | 4.17 | | 26,700 | | | $ | 4.05 | | 9,000 | | | $ | 6.25 |
Exercised | | — | | | $ | — | | (23,532 | ) | | $ | 4.13 | | — | | | $ | — |
Forfeited | | (96,450 | ) | | $ | 4.38 | | (130,912 | ) | | $ | 4.57 | | (347,560 | ) | | $ | 5.88 |
Expired | | (1,171,170 | ) | | $ | 5.76 | | (204,715 | ) | | $ | 6.52 | | (356,629 | ) | | $ | 8.61 |
| | | | | | | | | | | | | | | | | | |
Outstanding, end of year | | 2,765,433 | | | $ | 8.46 | | 3,989,178 | | | $ | 7.66 | | 4,321,637 | | | $ | 7.52 |
| | | | | | | | | | | | | | | | | | |
Exercisable, end of year | | 2,593,677 | | | $ | 8.70 | | 3,412,989 | | | $ | 8.10 | | 3,028,677 | | | $ | 8.52 |
| | | | | | | | | | | | | | | | | | |
F-23
NAPSTER, INC.
NOTES TO CONSOLIDATED FINANCIAL STATEMENTS—(Continued)
The following table summarizes information about stock options outstanding as of March 31, 2008:
| | | | | | | | | | | | | | |
| | | Options Outstanding | | Options Exercisable |
Range of Exercise Prices | | Number
Outstanding | | Weighted
Average
Remaining
Contractual Life
(in years) | | Weighted
Average
Exercise
Price | | Number
Exercisable | | Weighted
Average
Remaining
Contractual Life
(in years) | | Weighted
Average
Exercise
Price |
$3.58–$4.86 | | 1,057,870 | | 5.90 | | $ | 4.13 | | 918,613 | | | | $ | 4.13 |
$4.86–$7.21 | | 32,375 | | 5.17 | | $ | 6.42 | | 30,625 | | | | $ | 6.41 |
$7.21–$9.36 | | 950,313 | | 4.07 | | $ | 8.28 | | 919,564 | | | | $ | 8.27 |
$9.36–$14.02 | | 49,250 | | 3.56 | | $ | 13.88 | | 49,250 | | | | $ | 13.88 |
$14.02–$16.55 | | 675,625 | | 3.51 | | $ | 15.20 | | 675,625 | | | | $ | 15.20 |
| | | | | | | | | | | | | | |
| | 2,765,433 | | 4.64 | | $ | 8.46 | | 2,593,677 | | 4.47 | | $ | 8.70 |
| | | | | | | | | | | | | | |
The total intrinsic value of options exercised during the years ended March 31, 2008, 2007 and 2006 was zero, $10,200 and zero, respectively. The aggregate intrinsic value of options outstanding and exercisable as of March 31, 2008 was zero. As of March 31, 2008, there was $315,000 of total unrecognized compensation expense related to stock options, which is expected to be recognized over the weighted-average periods of 1.22 years.
During the years ended March 31, 2008, 2007 and 2006, the Company recorded $1.2 million, $3.9 million and $239,000, respectively, of stock-based compensation related to options. The amount for fiscal 2007 included an out-of-period adjustment totaling $650,000 to continuing operations and $950,000 to discontinued operations to record adjustments related to stock-based compensation on options issued primarily from fiscal 2002 to 2005. Management concluded that this adjustment was immaterial to the fiscal 2007 and all prior periods’ financial statements. This adjustment arose due to management’s determination that its process prior to 2005 for granting certain stock options to employees resulted in incorrect measurement dates for financial statement reporting purposes. Management determined, and the audit committee concurred, that these incorrect measurement dates did not arise due to intentional misconduct.
F-24
NAPSTER, INC.
NOTES TO CONSOLIDATED FINANCIAL STATEMENTS—(Continued)
Prior to the Adoption of SFAS No. 123(R)
The following table illustrates the effect on net loss and net loss per share if Napster had applied the fair value recognition provisions of SFAS No. 123 to stock-based employee compensation in periods prior to the adoption of SFAS 123(R) (in thousands, except per share amounts):
| | | | |
| | | Year Ended March 31, | |
| | | 2006 | |
Net loss, as reported | | $ | (54,945 | ) |
Add: | | | | |
Stock-based employee compensation expense included in reported net loss | | | 868 | |
Deduct: | | | | |
Stock-based employee compensation expense determined under fair value method for all awards | | | (4,209 | ) |
| | | | |
Pro forma net loss | | $ | (58,286 | ) |
| | | | |
Net loss per share: | | | | |
Basic and diluted—as reported | | $ | (1.28 | ) |
Basic and diluted—pro forma | | $ | (1.36 | ) |
Weighted average shares used in computing net loss and pro forma net loss per share: | | | | |
Basic and diluted shares | | | 42,989 | |
NOTE 11—BUSINESS SEGMENT AND GEOGRAPHIC INFORMATION
Effective December 17, 2004, Napster operates in a single segment.
Geographic information
Net revenue, by countries
The following table presents net revenues from continuing operations by country based on the entity that received the revenue (in thousands):
| | | | | | | | | |
| | | Year Ended March 31, |
| | | 2008 | | 2007 | | 2006 |
United States | | $ | 104,191 | | $ | 92,227 | | $ | 83,054 |
Europe | | | 23,261 | | | 18,854 | | | 11,637 |
| | | | | | | | | |
Total revenues | | $ | 127,452 | | $ | 111,081 | | $ | 94,691 |
| | | | | | | | | |
F-25
NAPSTER, INC.
NOTES TO CONSOLIDATED FINANCIAL STATEMENTS—(Continued)
Cash, cash equivalents and investments
The following table presents cash, cash equivalents and short-term investments held in entities organized in the following legal jurisdictions (in thousands):
| | | | | | |
| | | March 31, |
| | | 2008 | | 2007 |
United States | | $ | 66,191 | | $ | 59,647 |
United Kingdom | | | 989 | | | 1,204 |
Luxembourg | | | 2,113 | | | 5,296 |
Germany | | | 499 | | | 336 |
| | | | | | |
Total cash, cash equivalents and investments | | $ | 69,792 | | $ | 66,483 |
| | | | | | |
Napster does not anticipate that it will incur any material U.S. income or foreign withholding taxes when cash is repatriated to the United States.
Long-lived assets
The following table presents long-lived assets, excluding goodwill, identifiable intangible assets and investment in unconsolidated entity, by country based on the location of the assets (in thousands):
| | | | | | |
| | | March 31, |
| | | 2008 | | 2007 |
United States | | $ | 3,616 | | $ | 4,815 |
Other | | | 27 | | | 79 |
| | | | | | |
Total long-lived assets | | $ | 3,643 | | $ | 4,894 |
| | | | | | |
NOTE 12—COMMITMENTS AND CONTINGENCIES
Lease commitments
Napster leases its operating facilities and certain equipment under non-cancelable operating leases, which expire at various dates ranging from fiscal 2009 through fiscal 2012. Rent expense under all operating leases included in continuing operations was $1.2 million, $1.4 million and $1.5 million in fiscal 2008, 2007 and 2006, respectively.
At March 31, 2008, the future minimum lease payments under non-cancelable operating leases total $1.0 million, $860,000 and $1.1 million for fiscal 2009, 2010, and 2011 and later, respectively.
Litigation
Napster and Napster, LLC’s predecessor, Pressplay, have been notified by a number of companies that the Pressplay and Napster digital music services may infringe patents or copyrights owned by those companies. Napster is investigating the nature of these claims and the extent to which royalties may be owed by Napster and Pressplay to these entities. The ultimate resolution of these claims cannot be determined at this time.
F-26
NAPSTER, INC.
NOTES TO CONSOLIDATED FINANCIAL STATEMENTS—(Continued)
On October 8, 2004, SightSound Technologies, Inc. (“SightSound”) filed a lawsuit against Napster and Napster, LLC in U.S. District Court for the Western District of Pennsylvania (Case No. 2:04-cv-1549) alleging infringement of certain of its patents by the Napster service. SightSound is demanding monetary damages and injunctive relief. Napster was served with the complaint in the lawsuit on November 5, 2004. Napster answered the complaint and filed an application with the United States Patent and Trademark Office for reexamination of the patents. The court proceedings have been administratively closed pending the outcome of Napster’s reexamination application. In or around November 2005, SightSound sold the patents in question to a subsidiary of General Electric for an undisclosed amount. The Patent Office rejected all of the claims of each of the patents. In June 2007, General Electric filed an appeal of this decision with the Patent Office.
On August 5, 2005, Ho Keung Tse filed suit against Apple Computer, Inc., Napster, MusicMatch, Inc., Sony Connect, Inc., Yahoo, Inc. and RealNetworks, Inc. in U.S. District Court for the District of Maryland (Case No. 1:05-cv-2149) alleging infringement of U.S. Patent No. 6665797 by the defendants’ respective music distribution services. Mr. Tse is demanding monetary damages and injunctive relief. The defendants have formed a joint defense group and intend to defend themselves vigorously. The defendants were granted change of venue to the District of Northern California (Case No. 4:06- cv-06573-SBA), where, on October 4, 2007, the court stayed the litigation pending the reexamination of the related patent by the United States Patent and Trademark Office.
On December 15, 2005, MCS Music America, on behalf of itself and other publishers filed suit against Napster in U.S. District Court for the Middle District of Tennessee alleging that Napster had unlawfully distributed copyrighted musical compositions owned by the plaintiffs (Case No. 3:05-cv-1053). In November 2006, the plaintiffs sought and were granted a voluntary dismissal without prejudice. On November 15, 2006, Napster filed a complaint for declaratory relief against the former plaintiffs in Case No. 3:05-cv-1053 in the U.S. District Court for the Central District of California (Case No. 2:06-cv-7285). On December 15, 2006, the same plaintiffs re-filed their suit against Napster in U.S. District Court for the Middle District of Tennessee (Case No. 3:06-cv-01197). On March 7, 2007, the judge in the Tennessee case granted Napster’s motion to transfer Case No. 3:06-cv-01197 to the Central District of California as well. MCS is demanding monetary damages and injunctive relief. A portion of this matter was settled for a nominal amount subsequent to March 31, 2008.
On November 20, 2006, Antor Media Corporation filed suit against Napster and others in U.S. District Court for the Eastern District of Texas (Case No. 5:06-cv-270) alleging infringement of U.S. Patent No. 5734961 by the defendants’ respective products and services. Antor is demanding monetary damages and injunctive relief. The defendants have formed a joint defense group and intend to defend themselves vigorously. On December 14, 2007, the United States Patent and Trademark Office issued an office action rejecting all of the claims relating to such patent and limiting Antor’s time to appeal such rejection. Antor filed a response to the office action on February 14, 2008, and the parties await further action.
On December 29, 2006, Intertainer, Inc. filed suit against Napster and others in U.S. District Court for the Eastern District of Texas (Case No. 2:06-cv-549) alleging infringement of U.S. Patent No. 6925469 by the defendants’ respective products and services. Intertainer is demanding monetary damages and injunctive relief. Napster has joined a joint defense group, and the parties intend to defend themselves vigorously. On February 13, 2008, the United States Patent and Trademark Office issued an order rejecting all of the claims on the patent. On March 12, 2008, the court stayed the litigation pending the reexamination of the patent by the Patent Office.
F-27
NAPSTER, INC.
NOTES TO CONSOLIDATED FINANCIAL STATEMENTS—(Continued)
On September 11, 2007, Premier International Associates filed suit against Napster and others in U.S. District Court for the Eastern District of Texas (Case no. 2: 07-cv-396) alleging infringement of U.S. Patent Nos. 6,243,725 and 6,763,345 by the defendants’ products and services. Premier is demanding monetary damages and injunctive relief. Napster has joined a joint defense group, and the parties intend to defend themselves vigorously. The United States Patent and Trademark Office is currently re-examining the related patents, and the court has ordered a stay in the litigation pending the outcome of the re-exam.
On November 16, 2007, MOEAC, Inc. filed suit against Napster and others in U.S. District Court for the Western District of Wisconsin (Case no. 07-c-0654-S) alleging infringement of U.S. Patent nos. 6,232,539 and 7,205,471 by certain of Napster’s products and services. MOAEC is demanding monetary damages and injunctive relief. Napster is reviewing the claims and intends to defend itself vigorously.
For each of the above matters, management believes that it is not currently possible to estimate the impact, if any, that the ultimate resolution of these matters will have on Napster’s business, results of operations, financial position or cash flows.
Napster is a party to other litigation matters and claims from time to time in the ordinary course of its operations, including copyright infringement litigation for which it is entitled to indemnification by content providers. While the results of such litigation and claims cannot be predicted with certainty, Napster believes that the final outcome of such matters will not have a material adverse impact on its business, financial position, cash flows or results of operations.
Indemnification
In December 2004, as part of the sale of substantially all of the assets and liabilities of CSD to Sonic, Napster agreed to indemnify Sonic for unpaid tax liabilities with respect to any tax year ended on or before December 17, 2004 (or for any other tax year to the extent allocable to the portion of such period beginning before and ending on December 17, 2004), to the extent such tax liabilities neither are reflected in the closing working capital calculation pursuant to the sale agreement nor create a realized reduction in Sonic’s tax liabilities. Napster also agreed to indemnify Sonic for damages that relate to certain other tax-related matters, as described in the sale agreement. No limitation is set forth on the period of time by which a claim must be made pursuant to the foregoing indemnities nor is there a specified limitation on the maximum amount of potential future payments.
Obligations to content providers
Napster has certain royalty commitments associated with the licensing of music content for distribution to customers. Future payments under these content agreements are due to partners based upon net revenue and online music distribution volumes.
F-28
SCHEDULE II
VALUATION AND QUALIFYING ACCOUNTS AND RESERVES
(In thousands)
| | | | | | | | | | |
Description | | Beginning of
Period | | Additions | | Deductions | | End
of Period |
Deferred tax valuation allowance: | | | | | | | | | | |
Year ended March 31, 2006 | | $ | 22,648 | | 25,843 | | — | | $ | 48,491 |
Year ended March 31, 2007 | | $ | 48,491 | | 11,685 | | — | | $ | 60,176 |
Year ended March 31, 2008 | | $ | 60,176 | | 3,299 | | — | | $ | 63,475 |
F-29
SIGNATURES AND POWER OF ATTORNEY
Pursuant to the requirements of Section 13 or 15(d) of the Securities Exchange Act of 1934, as amended, the registrant has duly caused this report to be signed on its behalf by the undersigned, thereunto duly authorized.
| | | | | | | | |
NAPSTER, INC. | | | | | | |
| | | | |
By: | | /s/ WM. CHRISTOPHER GOROG | | | | By: | | /s/ SUZANNE M. COLVIN |
| | Wm. Christopher Gorog Chief Executive Officer and Chairman of the Board of Directors (Principal Executive Officer) Date: June 11, 2008 | | | | | | Suzanne M. Colvin Vice President, Finance, and Interim Chief
Financial Officer (Principal Financial and Accounting Officer) Date: June 11, 2008 |
Pursuant to the requirements of the Securities Exchange Act of 1934, this report has been signed below by the following persons on behalf of the registrant and in the capacities and on the dates indicated. Each person whose signature appears below hereby authorizes and appoints Wm. Christopher Gorog and Suzanne M. Colvin, or either of them, as attorneys-in-fact and agents to execute and file with the applicable regulatory authorities any amendment to this report on his behalf individually and in each capacity stated below.
| | | | |
Name | | Title | | Date |
/s/ WM. CHRISTOPHER GOROG Wm. Christopher Gorog | | Chief Executive Officer and Chairman of the Board of Directors (Principal Executive Officer) | | June 11, 2008 |
| | |
/s/ SUZANNE M. COLVIN Suzanne M. Colvin | | Vice President, Finance, and Interim Chief Financial Officer (Principal Financial and Accounting Officer) | | June 11, 2008 |
| | |
/s/ VERNON E. ALTMAN Vernon E. Altman | | Director | | June 11, 2008 |
| | |
/s/ RICHARD J. BOYKO Richard J. Boyko | | Director | | June 11, 2008 |
| | |
/s/ PHILIP J. HOLTHOUSE Philip J. Holthouse | | Director | | June 11, 2008 |
| | |
/s/ JOSEPH C. KACZOROWSKI Joseph C. Kaczorowski | | Director | | June 11, 2008 |
| | |
/s/ ROSS LEVINSOHN Ross Levinsohn | | Director | | June 11, 2008 |
| | |
/s/ BRIAN C. MULLIGAN Brian C. Mulligan | | Director | | June 11, 2008 |
| | |
/s/ ROBERT RODIN Robert Rodin | | Director | | June 11, 2008 |
NAPSTER, INC.
INDEX TO EXHIBITS
| | |
Exhibit Number | | Description of Exhibit |
| 2.1 | | Purchase Agreement dated May 19, 2003 among the Registrant, UMG Duet Holdings, Inc. and SMEI Duet Holdings, Inc. (1) |
| 2.2 | | AOL Asset Purchase Agreement dated January 11, 2007 by and between AOL LLC, AOL Music Now LLC and Napster, LLC**† (2) |
| 2.3 | | Amendment No. 1 dated March 14, 2007 to AOL Asset Purchase Agreement by and between AOL LLC, AOL Music Now LLC and Napster, LLC**† (2) |
| 2.4 | | Letter Agreement dated March 14, 2007 amending that certain AOL Asset Purchase Agreement by and between AOL LLC, AOL Music Now LLC and Napster, LLC, as amended† (2) |
| 3.1 | | Amended and Restated Certificate of Incorporation of the Registrant* (3) |
| 3.2 | | Second Amended and Restated Bylaws of the Registrant* (4) |
| 3.3 | | Certificate of Designation of Rights, Preferences and Privileges of Series A Participating Preferred Stock of Roxio, Inc. (5) |
| 4.1 | | Form of Common Stock Certificate of the Registrant (6) |
| 4.2 | | Preferred Stock Rights Agreement dated May 18, 2001 between the Registrant and Mellon Investor Services, LLC, including the Certificate of Designation, the Form of Rights Certificate and the Summary of Rights attached thereto as Exhibits A, B, and C, respectively (5) |
| 4.3 | | Form of Purchase Agreement dated June 18, 2003 by and between the Registrant and certain Purchasers set forth on the signature page thereto (7) |
| 4.4 | | Form of Purchase Agreement dated January 12, 2004 by and between Roxio, Inc. and certain Purchasers set forth on the signature page thereto (8) |
| 4.5 | | Common Stock Purchase Agreement dated June 17, 2004 between the Registrant and Best Buy Enterprise Services Inc. (9) |
| 4.6 | | Registration Rights Agreement dated June 17, 2004 between the Registrant and Best Buy Enterprise Services Inc. (9) |
| 4.7 | | Form of Purchase Agreement dated January 20, 2005 by and between the Registrant and certain Investors (10) |
| 10.1 | | 2003 Stock Plan* (11) |
| 10.2 | | Form of 2003 Stock Plan Agreements* (12) |
| 10.3 | | 2002 Stock Plan* (13) |
| 10.4 | | Amended and Restated Napster, Inc. 2001 Stock Plan* (14) |
| 10.5 | | Form of Napster, Inc. Amended and Restated 2001 Stock Plan Restricted Stock Award Agreement* (15) |
| 10.6 | | Amended and Restated 2001 Employee Stock Purchase Plan* (11) |
| 10.7 | | Form of 2001 Stock Plan Option Agreements* (16) |
| 10.8 | | Amended and Restated 2001 Director Option Plan* (17) |
| 10.9 | | Form of 2001 Director Option Plan Agreements* (16) |
| 10.10 | | Form of Amended and Restated 2001 Stock Plan Director Restricted Stock Award Agreement (14) |
| 10.11 | | Amended and Restated 2000 Stock Option Plan* (3) |
| 10.12 | | Form of 2000 Stock Option Plan Agreements* (18) |
| | |
Exhibit Number | | Description of Exhibit |
| 10.13 | | Form of Indemnification Agreement between the Registrant and each of its directors and executive officers* (3) |
| 10.14 | | Amended and Restated Employment Agreement dated May 12, 2008, between the Registrant and Wm. Christopher Gorog * (19) |
| 10.15 | | Employment Agreement effective November 14, 2003 between Nand Gangwani and the Registrant* (20) |
| 10.16 | | Letter Agreement dated November 8, 2006 between Nand Gangwani and the Registrant* (21) |
| 10.17 | | Employment Separation and General Release Agreement dated December 7, 2007, between Nand Gangwani and the Registrant* (22) |
| 10.18 | | Employment Agreement dated January 29, 2004 between Bradford D. Duea and the Registrant* (12) |
| 10.19 | | Letter Agreement dated November 8, 2006 between Bradford D. Duea and the Registrant* (21) |
| 10.20 | | Employment Agreement dated January 29, 2004 between Laura B. Goldberg and the Registrant* (12) |
| 10.21 | | Amended and Restated Offer Letter dated August 2, 2007 between Christopher Allen and the Registrant* (23) |
| 10.22 | | Standard Industrial/Commercial Single-Tenant Lease dated September 7, 2001 between the Registrant and Fox & Fields (24) |
| 10.23 | | Lease Extension and Lease Guaranty of Registrant dated January 5, 2005 between Registrant and Fox & Fields (24) |
| 10.24 | | Second Lease Extension and Lease Guaranty dated November 8, 2006 between the Registrant and Fox & Fields (25) |
| 10.25 | | Third Lease Extension and Lease Guaranty dated April 11, 2008 between the Registrant and Fox & Fields |
| 10.26 | | Amended and Restated LLC Operating Agreement of Napster, LLC dated May 19, 2003 by and between Registrant, UMG Duet Holdings, Inc. and SMEI Duet Holdings, Inc. (17) |
| 10.27 | | Joint Venture Operating Agreement dated October 14, 2005 between Napster, LLC and Tower Records Japan, Inc., Nikko Principal Investments Japan, Ltd. and Napster Japan, Inc.** (26) |
| 10.28 | | License Agreement dated October 14, 2005 between Napster, LLC and Tower Records Japan, Inc. ** (26) |
| 10.29 | | AOL Advertising Insertion Order dated January 11, 2007 by and between AOL LLC and Napster,
LLC **(2) |
| 10.30 | | Executive Compensation Summary |
| 10.31 | | Non-Employee Director Compensation Summary |
| 14.1 | | Amended and Restated Napster Code of Conduct (27) |
| 21.1 | | List of Subsidiaries |
| 23.1 | | Consent of Independent Registered Public Accounting Firm |
| 31.1 | | Certification of Chief Executive Officer required pursuant to Section 302 of the Sarbanes-Oxley Act of 2002 |
| 31.2 | | Certification of Chief Financial Officer required pursuant to Section 302 of the Sarbanes-Oxley Act of 2002 |
| 32.1 | | Certification pursuant to 18 U.S.C. Section 1350, as adopted pursuant to Section 906 of the Sarbanes-Oxley Act of 2002 |
| * | | Management contract or compensatory plan or arrangement required to be filed as an exhibit to the Registrant’s Annual Report on Form 10-K. |
| ** | | Pursuant to 17 CFR 240.24b-2, confidential information has been omitted and has been filed separately with the Securities and Exchange Commission pursuant to a Confidential Treatment Application filed with the Commission. |
| † | | Certain exhibits, schedules, appendices and annexes to these agreements have been omitted from this filing pursuant to Item 601(b)(2) of Regulation S-K. The Registrant will furnish copies of any of these exhibits, schedules, appendices or annexes to the Securities and Exchange Commission upon request. |
| (1) | | Incorporated by reference to the Registrant’s Current Report on Form 8-K as filed with the Securities and Exchange Commission on May 19, 2003. |
| (2) | | Incorporated by reference to the Registrant’s Annual Report on Form 10-K as filed with the Securities and Exchange Commission on June 6, 2007. |
| (3) | | Incorporated by reference to Amendment No. 4 to the Registrant’s Registration Statement on Form 10 (No. 000-32373) as filed with the Securities and Exchange Commission on April 23, 2001. |
| (4) | | Incorporated by reference to the Registrant’s Current Report on Form 8-K as filed with the Securities and Exchange Commission on December 14, 2007. |
| (5) | | Incorporated by reference to the Registrant’s Registration Statement on Form 8-A as filed with the Securities and Exchange Commission on June 5, 2001. |
| (6) | | Incorporated by reference to the Registrant’s Current Report on Form 8-K as filed with the Securities and Exchange Commission on December 23, 2004. |
| (7) | | Incorporated by reference to the Registrant’s Current Report on Form 8-K as filed with the Securities and Exchange Commission on June 20, 2003. |
| (8) | | Incorporated by reference to the Registrant’s Current Report on Form 8-K as filed with the Securities and Exchange Commission on January 13, 2004. |
| (9) | | Incorporated by reference to the Registrant’s Registration Statement on Form S-3 (No. 333-117520) as filed with the Securities and Exchange Commission on July 20, 2004. |
| (10) | | Incorporated by reference to the Registrant’s Current Report on Form 8-K as filed with the Securities and Exchange Commission on January 21, 2005. |
| (11) | | Incorporated by reference to the Registrant’s Proxy Statement on Schedule 14A for the 2003 Annual Meeting of Stockholders as filed with the Securities and Exchange Commission on August 18, 2003. |
| (12) | | Incorporated by reference to the Registrant’s Annual Report on Form 10-K as filed with the Securities and Exchange Commission on June 14, 2004. |
| (13) | | Incorporated by reference to the Registrant’s Registration Statement on Form S-8 (No. 333-81522) as filed with the Securities and Exchange Commission on January 28, 2002. |
| (14) | | Incorporated by reference to the Registrant’s Current Report on Form 8-K as filed with the Securities and Exchange Commission on October 28, 2005. |
| (15) | | Incorporated by reference to the Registrant’s Current Report on Form 8-K as filed with the Securities and Exchange Commission on June 6, 2005. |
| (16) | | Incorporated by reference to Amendment No. 3 to the Registrant’s Registration Statement on Form 10 (No. 000-32373) as filed with the Securities and Exchange Commission on April 9, 2001. |
| (17) | | Incorporated by reference to the Registrant’s Annual Report on Form 10-K as filed with the Securities and Exchange Commission on June 30, 2003. |
| (18) | | Incorporated by reference to the Registrant’s Registration Statement on Form 10 (No. 000-32373) as filed with the Securities and Exchange Commission on February 21, 2001. |
| (19) | | Incorporated by reference to the Registrant’s Current Report on Form 8-K as filed with the Securities and Exchange Commission on May 16, 2008. |
| (20) | | Incorporated by reference to the Registrant’s Quarterly Report on Form 10-Q as filed with the Securities and Exchange Commission on February 17, 2004. |
| (21) | | Incorporated by reference to the Registrant’s Current Report on Form 8-K as filed with the Securities and Exchange Commission on November 8, 2006. |
| (22) | | Incorporated by reference to the Registrant’s Current Report on Form 8-K as filed with the Securities and Exchange Commission on December 10, 2007. |
| (23) | | Incorporated by reference to the Registrant’s Current Report on Form 8-K as filed with the Securities and Exchange Commission on August 3, 2007. |
| (24) | | Incorporated by reference to the Registrant’s Registration Statement on Form S-3 (No. 333-122658) as filed with the Securities and Exchange Commission on February 9, 2005. |
| (25) | | Incorporated by reference to the Registrant’s Quarterly Report on Form 10-Q as filed with the Securities and Exchange Commission on February 8, 2007. |
| (26) | | Incorporated by reference to the Registrant’s Quarterly Report on Form 10-Q as filed with the Securities and Exchange Commission on February 8, 2006. |
| (27) | | Incorporated by reference to the Registrant’s Annual Report on Form 10-K as filed with the Securities and Exchange Commission on June 9, 2006. |