UNITED STATES
SECURITIES AND EXCHANGE COMMISSION
Washington, D.C. 20549
FORM 10-K
(Mark One)
| | | | | |
| ý | ANNUAL REPORT PURSUANT TO SECTION 13 OR 15(d) OF THE SECURITIES EXCHANGE ACT OF 1934 |
For the fiscal year ended December 31, 2024
| | | | | |
| Or |
| o | TRANSITION REPORT PURSUANT TO SECTION 13 OR 15(d) OF THE SECURITIES EXCHANGE ACT OF 1934 |
For the transition period from to
Commission file number: 001-41850
BEYOND, INC.
(Exact name of registrant as specified in its charter)
| | | | | | | | | | | |
| Delaware | | 87-0634302 |
| (State or other jurisdiction of incorporation or organization) | | (I.R.S. Employer Identification Number) |
| 433 W. Ascension Way, 3rd Floor | | |
| Murray, | Utah | | 84123 |
| (Address of principal executive offices) | | (Zip code) |
(801) 947-3100
(Registrant's telephone number, including area code)
Securities registered pursuant to Section 12(b) of the Act:
| | | | | | | | |
| Title of each class | Trading Symbol(s) | Name of each exchange on which registered |
| Common Stock, $0.0001 par value per share | BYON | New York Stock Exchange |
Securities registered pursuant to Section 12(g) of the Act: None
Indicate by check mark if the registrant is a well-known seasoned issuer, as defined in Rule 405 of the Securities Act. Yes o No ý
Indicate by check mark if the registrant is not required to file reports pursuant to Section 13 or Section 15(d) of the Act. Yes o No ý
Indicate by check mark whether the registrant (1) has filed all reports required to be filed by Section 13 or 15(d) of the Securities Exchange Act of 1934 during the preceding 12 months (or for such shorter period that the registrant was required to file such reports), and (2) has been subject to such filing requirements for the past 90 days. Yes ý No o
Indicate by check mark whether the registrant has submitted electronically every Interactive Data File required to be submitted pursuant to Rule 405 of Regulation S-T (§232.405 of this chapter) during the preceding 12 months (or for such shorter period that the registrant was required to submit such files). Yes ý No o
Indicate by check mark whether the registrant is a large accelerated filer, an accelerated filer, a non-accelerated filer, a smaller reporting company, or an emerging growth company. See the definitions of "large accelerated filer," "accelerated filer," "smaller reporting company," and "emerging growth company" in Rule 12b-2 of the Exchange Act.
| | | | | | | | | | | |
| Large accelerated filer | x | Accelerated filer | o |
| Non-accelerated filer | o | Smaller reporting company | o |
| | Emerging growth company | o |
If an emerging growth company, indicate by check mark if the registrant has elected not to use the extended transition period for complying with any new or revised financial accounting standards provided pursuant to Section 13(a) of the Exchange Act. o
Indicate by check mark whether the registrant has filed a report on and attestation to its management's assessment of the effectiveness of its internal control over financial reporting under Section 404(b) of the Sarbanes-Oxley Act (15 U.S.C. 7262(b)) by the registered public accounting firm that prepared or issued its audit report. ý
If securities are registered pursuant to Section 12(b) of the Act, indicate by check mark whether the financial statements of the registrant included in the filing reflect the correction of an error to previously issued financial statements. o
Indicate by check mark whether any of those error corrections are restatements that required a recovery analysis of incentive-based compensation received by any of the registrant's executive officers during the relevant recovery period pursuant to §240.10D-1(b). o
Indicate by check mark whether the registrant is a shell company (as defined in Rule 12b-2 of the Act). Yes o No ý
The aggregate market value of voting and non-voting common equity held by non-affiliates of the registrant as of the last business day of the registrant's most recently completed second quarter (June 28, 2024), was approximately $0.6 billion based upon the last sales price reported by the New York Stock Exchange. For purposes of this disclosure, shares of Common Stock held by directors and certain officers and by others who may be deemed to be affiliates of the registrant have been excluded. The exclusion of such shares is not intended to, and shall not, constitute a determination as to which persons or entities may be affiliates as that term is defined in the federal securities laws.
There were 53,144,790 shares of the Registrant's common stock, par value $0.0001, outstanding on February 21, 2025.
DOCUMENTS INCORPORATED BY REFERENCE
Certain information required by Part III of Form 10-K is incorporated by reference to the Registrant's proxy statement for the 2025 Annual Stockholders Meeting, which will be filed with the Securities and Exchange Commission within 120 days after the end of the fiscal year to which this Report relates.
TABLE OF CONTENTS
| | | | | | | | |
| | |
| | |
| | |
| Part I | |
| Item 1. | | |
| Item 1A. | | |
| Item 1B. | | |
| Item 1C. | | |
| Item 2. | | |
| Item 3. | | |
| Item 4. | | |
| | |
| Part II | |
| Item 5. | | |
| Item 6. | | |
| Item 7. | | |
| Item 7A. | | |
| Item 8. | | |
| Item 9. | | |
| Item 9A. | | |
| Item 9B. | | |
| Item 9C. | | |
| | |
| Part III | |
| Item 10. | | |
| Item 11. | | |
| Item 12. | | |
| Item 13. | | |
| Item 14. | | |
| | |
| Part IV | |
| Item 15. | | |
| Item 16. | | |
| | |
| |
Bed Bath & Beyond, Overstock.com, Beyond+, Welcome Rewards, and Zulily are registered trademarks of Beyond, Inc. Other service marks, trademarks and trade names which may be referred to herein are the property of their respective owners.
SPECIAL CAUTIONARY NOTE REGARDING FORWARD-LOOKING STATEMENTS
This Annual Report on Form 10-K (this "Annual Report") and the information incorporated herein by reference, and our other public documents and statements our officers and representatives may make from time to time, contain forward-looking statements within the meaning of the federal securities laws. These statements are intended to be covered by the safe harbor provisions of these laws. You can find many of these statements by looking for words such as "may," "would," "could," "should," "will," "expect," "anticipate," "predict," "project," "potential," "continue," "contemplate," "seek," "assume," "believe," "intend," "plan," "forecast," "goal," "estimate," or other similar terms or expressions or the negative of these terms or expressions, although not all forward-looking statements contain these identifying terms or expressions.
These forward-looking statements involve known and unknown risks and uncertainties and relate to future events or our future financial or operating performance. These forward-looking statements are not historical facts, and are based on current expectations, estimates and projections about our industry and business, and on management's beliefs and certain assumptions made by management, many of which, by their nature, are inherently uncertain and beyond our control. Accordingly, you are cautioned that any such forward-looking statements are not guarantees of future performance and are subject to assumptions, risks, uncertainties, and other important factors that are difficult to predict, and that actual results and outcomes may be materially different from the results, performance, achievements, or outcomes expressed or implied by any of our forward-looking statements for a variety of reasons, including the risks, uncertainties and assumptions described in this Annual Report, especially under the headings "Summary of Risk Factors," "Risk Factors," "Legal Proceedings," and "Management's Discussion and Analysis of Financial Condition and Results of Operations." Although we believe that our assumptions and expectations reflected in the forward-looking statements are reasonable as of the date of this Annual Report, we cannot guarantee or offer any assurance of future results, levels of activity, performance, achievements or events. Our forward-looking statements contained in this report speak only as of the date of this Annual Report and, except as required by law, we undertake no obligation to update forward-looking statements to reflect events or circumstances occurring after the date of this Annual Report or any changes in our expectations or any change in any events, conditions or circumstances on which any of our forward-looking statements are based.
SUMMARY RISK FACTORS
Our business is subject to numerous risks and uncertainties, including those described in Part I, Item 1A. "Risk Factors" in this Annual Report on Form 10-K. You should carefully consider these risks and uncertainties when investing in our common stock. The principal risks and uncertainties affecting our business include the following:
•We depend on third-party companies to perform functions critical to our business, and any failure or increased cost on their part could have a material adverse effect on our business.
•We face intense competition and may not be able to compete successfully against existing or future competitors.
•We may not timely identify or effectively respond to consumer needs, expectations or trends, which could adversely affect our relationship with our customers, the demand for our products and services, and our market share.
•Our business depends on effective marketing, including marketing via email, search engine marketing, influencer marketing, and social media marketing. Our competitors have and may continue to cause us to increase our marketing costs and decrease certain other types of marketing, and have and may continue to outspend us on marketing or be more efficient in their spend.
•Economic factors, including recessions, other economic downturns, inflation, our exposure to the U.S. housing market, and decreases in consumer spending, have affected and could continue to adversely affect us.
•Tariffs, bans, or other measures or events that increase the effective price of products or limit our ability to access products we or our suppliers or fulfillment partners import into the United States could have a material adverse effect on our business.
•Our changing business model and use of the Overstock brand, Bed Bath & Beyond brand, Zulily brand, and Beyond brand, could negatively impact our business.
•The changing job market, the changes in our leadership team, the change in our compensation approach, changing job structures, or any inability to attract, retain and engage key personnel could affect our ability to successfully grow our business.
•We rely upon paid and natural search engines to rank our product offerings, and our financial results may suffer if we are unable to maintain our prior rankings in natural searches.
•If we are not profitable and/or are unable to generate sufficient positive cash flow from operations, our ability to continue in business will depend on our ability to raise additional capital, obtain financing or monetize significant assets, and we may be unable to do so.
•Our business depends on the Internet, our infrastructure and transaction-processing systems, and catastrophic events could adversely affect our operating results.
•Compliance with ever-evolving federal, state, and foreign laws and other requirements relating to the handling of information about individuals necessitates significant expenditure and resources, and any failure by us, our vendors or our business partners to comply may result in significant liability, negative publicity, and/or an erosion of trust, which could materially adversely affect our business, results of operations, and financial condition.
•If we or our third-party providers experience cyberattacks or data security incidents, there may be damage to our brand and reputation, material financial penalties, and legal liability, which would materially adversely affect our business, results of operations, and financial condition.
•Failure to comply with, or changes in, laws, regulations and enforcement activities may adversely affect the products, services and markets in which we operate.
•From time to time we are subject to various legal proceedings which could adversely affect our business, financial condition or results of operations.
•Damage to our reputation or brand image could adversely affect our sales and results of operations.
•If we do not successfully optimize and operate our fulfillment center or customer service operations, our business could be harmed.
•If we fail to effectively utilize technological advancements, including in artificial intelligence, our business and financial performance could be negatively impacted.
•Global conflict could negatively impact our business, results of operations, and financial condition.
•Product safety and quality concerns could have a material adverse impact on our revenue and profitability.
•We depend on our suppliers' and fulfillment partners' representations regarding product safety, content and quality, product compliance with various laws and regulations, including registration and/or reporting obligations, and for proper labeling of products.
•We have an evolving business model, which increases the complexity of our business.
•Investment in new business strategies, acquisitions, dispositions, partnerships, or other transactions could disrupt our ongoing business, present risks not originally contemplated and materially adversely affect our business, reputation, results of operations and financial condition.
PART I
ITEM 1. BUSINESS
The following description of our business contains forward-looking statements relating to future events or our future financial or operating performance that involve risks and uncertainties, as set forth above under "Special Note Regarding Forward-Looking Statements." Our actual results could differ materially from those anticipated in these forward-looking statements as a result of certain factors described in this Annual Report, including those set forth under "Special Cautionary Note Regarding Forward-Looking Statements" Item 1A under the heading "Risk Factors," or elsewhere in this Annual Report.
Introduction
Beyond, Inc, is an e-commerce affinity marketing company with a singular focus: connecting consumers with products and services they love. As the owner of the iconic Bed Bath & Beyond, Overstock and Zulily brands, as well as several other brands, we strive to curate an exceptional online shopping experience. Our suite of premier online retail brands allow us to offer a comprehensive array of products and add-on services, catering to customers in the United States and Canada along with customers in Mexico through trademark licensing. Our e-commerce platform, which is also accessible through our mobile app, includes www.bedbathandbeyond.com, www.bedbathandbeyond.ca, www.overstock.com, and www.zulily.com, and is collectively referred to as the "Website." The Website is targeted at customers seeking a diverse array of top-tier, on-trend products at competitive prices. From furniture, bedding, and bath essentials to patio and outdoor furniture, area rugs, tabletop and cookware, décor, storage, jewelry, watches, and fashion – we offer an extensive range of products at a smart value. In addition to products, we also offer an increasing number of add-on services across our platforms, including warranties, shipping insurance, installation services, and access to home loans.
Our company, based in Murray, Utah, was founded as a Utah limited liability company in 1997, reorganized as a C corporation in the State of Utah in 1998, and reincorporated in Delaware in 2002. We launched our initial website in March 1999. In November 2023, we changed our corporate name from Overstock.com, Inc. to Beyond, Inc., and transferred the principal listing of our common stock from the Nasdaq Global Market to the New York Stock Exchange. As used herein, "Beyond", "the Company", "we", "our" and similar terms include Beyond, Inc. and its controlled subsidiaries, unless the context indicates otherwise.
Our Business
Our mission revolves around delivering an unparalleled shopping experience for products and services, tailored especially for our target audience – discerning consumers who seek seamless support in their search for high-quality, stylish products at competitive prices. Our commitment extends to providing a diverse range of offerings that cater to varied budget requirements.
In an ever-evolving market, our focus is on standing out in the online sphere by offering products and services for the home. We believe that our competitive edge lies in the following:
•Simplified Customer Experience: We prioritize an easy, user-friendly interface, emphasizing price, value, and quality. Our extensive product range is delivered in a personalized format, accessible seamlessly through our mobile app, and complemented by our dedicated customer service team.
•Cutting-edge Technologies: Our proprietary technologies and strategic technical alliances enhance the overall shopping experience, providing our customers with an intuitive and streamlined experience.
•Specialized Logistics: Our logistics capabilities are finely tuned to the demands of the furniture and home furnishings category, which we have honed over decades of e-commerce expertise.
•Strategic Partnerships: We foster long-term, mutually beneficial relationships with third-party manufacturers, distributors, and suppliers, collectively referred to as our "partners". This network forms the backbone of our supply chain, allowing us to pursue our goal of consistently meeting customer demands. In addition to our partners, we've entered into a collaborative partnership with Kirkland's Home brand that will allow us to bring back the brick & mortar experience to our customers by providing Kirkland's, Inc. with an exclusive license to operate Bed Bath & Beyond neighborhood stores. We also partner with third parties to provide various financial products and services.
•Customer Loyalty Programs: Our customer engagement and retention are bolstered by our Beyond+ membership program and our Welcome Rewards loyalty program, enhancing the overall value proposition for our customers.
We endeavor to continually expand our product assortment, which as of the date of this Annual Report, reaches into the millions, to keep pace with current trends and evolving customer preferences. The vast majority of our retail transactions are fulfilled through our network of partners, who benefit from the access we provide to a large customer base and a suite of convenient services, including marketing, order fulfillment, customer service, and returns handling. Our asset-light supply chain allows us to ship directly to customers from our partners or our warehouses, which primarily handle orders from our partners' owned inventory.
Additional Offerings
We offer additional products or services that may complement our primary retail offerings but are not significant to our revenues, including:
•Business Advertising Opportunities: Providing businesses with a platform to showcase their products or services on our Website, fostering additional exposure and opportunities for collaboration.
•Marketplace Services: Offering a unique service to our partners, enabling them to showcase and sell their products on third-party sites through our Marketplace, creating additional avenues for sales and visibility.
•International Sales Support: Facilitating international sales for certain customers outside the United States through third-party logistics providers, broadening our reach and enhancing global accessibility.
•Supplier Oasis Integration: Our Supplier Oasis platform, a singular integration point that empowers our partners to efficiently manage their products, inventory, and sales channels. This streamlined interface also provides access to multi-channel fulfillment services through our expansive distribution network, enhancing operational efficiency for our valued partners.
Manufacturer, Distributor, and Supplier Relationships
We proactively cultivate and nurture relationships with manufacturers, distributors, and suppliers to help provide an uninterrupted stream of diverse product offerings for our customers. While our manufacturers, distributors, and suppliers regularly update us on available product quantities, our arrangements with them typically do not guarantee the sustained availability of these products over a predetermined period. Our relationships are generally non-exclusive. This allows us the flexibility to exercise discretion in selecting and changing suppliers based on our evolving product assortment needs. The terms under which products are sold through our Website are predominantly in our discretion.
Sales and Marketing
We employ a diverse array of strategies to market to and engage our retail consumer audience, using both traditional and digital channels. Our outreach includes targeted direct mail as well as online initiatives, encompassing search engine marketing, display ads, affiliate marketing, e-mail campaigns, and social media promotions. Additionally, we enhance brand visibility through comprehensive advertising efforts across television, video ads, streaming video and audio platforms, social media channels, and strategic event sponsorships.
Customer Service
Our commitment to delivering unparalleled customer service extends across our channels, including our app and Website. Staffed by a team of dedicated in-house and outsourced professionals, our customer service department seeks to provide prompt and thorough responses to customer inquiries via phone, SMS, instant online chat, and e-mail, regarding product information, order details, shipping status, returns, and various other customer queries.
In addition to our in-house services, we have trusted partners who independently manage their customer service requests that are held to our high standards, as outlined in their agreements with us.
Technology
We use our internally developed Website alongside a dynamic blend of proprietary technologies, open source solutions, and commercially licensed technologies to bolster our operational capabilities. We maintain connectivity to the Internet through partnerships with multiple telecommunications companies, in order to promote seamless access.
Our primary computer infrastructure is in a data center in Utah. We leverage additional data centers and tap into the resources of public cloud providers which play a pivotal role in functions such as backups, redundancy measures, development
and testing environments, disaster recovery protocols, and the overarching support of our corporate systems infrastructure. On December 20, 2024, we consummated the sale of our corporate headquarters located at 799 West Coliseum Way, Midvale, Utah, for $52.0 million. As part of the sale, we negotiated a lease agreement with the Buyer that allows us to continue to occupy and use the headquarters' data center, comprising approximately 5,000 square feet within the main building at the headquarters, and permit the data center to continue to be served by the existing building generators. See Item 2—"Properties."
Competition
E-commerce is intensely competitive and has relatively low barriers to entry. We believe that competition in this industry is based predominantly on:
•price;
•product and services quality and assortment;
•shopping convenience and product findability;
•website organization and experience;
•order processing and fulfillment;
•order delivery time and accuracy;
•customer service;
•website functionality on mobile devices;
•brand recognition; and
•brand reputation.
We compete with a diverse range of discount general retailers, off-price and club retailers, private sales platforms, specialty retailers, and liquidators in the online pure-play, brick-and-mortar, and omni-channel retail spheres, where the potential exists for competitors to emulate our strategies and target our customer base.
Our current and potential e-commerce competitors include entities that may have greater brand recognition, longer operating histories, larger customer bases, and significantly greater financial, marketing, and other resources than we do. Further, any of them may enter into strategic or commercial relationships with larger, more established and well-financed companies, including exclusive distribution arrangements with our vendors or service suppliers that could deny us access to key products or needed services at competitive prices or at all, or acquisitions of our suppliers or service providers, which could have the same effect. Many of them do or could devote greater resources to marketing and promotional campaigns and devote substantially more resources to their websites and systems development than we do. Many have supply chain operations that decrease product shipping times to their customers, have options for in-store product pick-up, allow in-store returns, or offer other delivery and returns options that we do not have. New technologies, the continued enhancement of existing technologies, developments in related areas such as same-day product deliveries, and the development of proprietary delivery systems increase competitive pressures on us.
Intellectual Property and Trade Secrets
We regard our domain names and other intellectual property as critical to our success. We rely on a combination of laws and regulations, including via contractual restrictions with our employees, customers, suppliers, affiliates, and others to establish and protect our proprietary rights, including the law pertaining to trade secrets.
Government Regulation and Legal Matters
We are subject to a wide variety of laws, rules, mandates, and regulations, some of which apply or may apply to us as a result of our business, and others of which apply to us for other reasons, such as our status as a publicly-held company or the places in which we operate. Our business is subject to general business regulations and laws, and regulations and laws specifically governing the internet, e-commerce, and other financial products and services we offer or may offer. Existing and future laws and regulations, directives (including executive orders) and changing enforcement priorities, may result in increasing expenses and may impede our growth. Applicable and potentially applicable regulations and laws include without limitation regulations and laws regarding taxation, business licensing or certification requirements, advertising practices, online services, the use of cryptocurrency, intellectual property rights, privacy, encryption, restrictions on pricing or discounts, and the U.S. Foreign Corrupt Practices Act and other applicable U.S. and foreign laws prohibiting corrupt payments to government officials and other third parties, privacy, consumer and data protection, pricing, content, copyrights, distribution, mobile communications, electronic device certification, electronic waste, energy consumption, environmental regulation, electronic contracts and other communications, competition, employment, import and export matters including tariffs and the importation of specified or proscribed items and importation quotas, information reporting requirements, access to our services and facilities, the design and operation of websites, health, safety, and sanitation standards, the characteristics and quality of products and services, product labeling and unfair and deceptive trade practices.
From time to time, we receive claims and become subject to regulatory investigations or other governmental actions, including consumer protection, employment, intellectual property, and other commercial litigation related to the conduct of our business. We periodically prosecute lawsuits to enforce our legal rights. These matters and other types of claims could result in legal expenses, fines, adverse judgments or settlements and increase the cost of doing business. They could also require us to change our business practices in expensive and significant ways. In addition, litigation could result in legal outcomes or interpretations of the law that may limit our current or future business, require us to change our business practices, or increase our costs or otherwise adversely impact our business.
For further information, see (Item 1A—"Risk Factors") and the information set forth under Item 8 of Part II, "Financial Statements and Supplementary Data"—Note 15—Commitments and Contingencies, Legal proceedings and contingencies, contained in the "Notes to Consolidated Financial Statements" of this Annual Report.
Human Capital Management
On December 31, 2024, we had approximately 610 full-time employees. We have never had a work stoppage and none of our employees are represented by a labor union. We consider our employee relations to be good. Competition for qualified personnel in our industry is high. Beyond places great value on its human capital management and knows its people are critical to driving the business to success. We focus on our human capital management in many ways, including the following.
Inclusion & Belonging
We embrace inclusion and belonging and collaboration in our workforce, our ways of thinking, and our decision-making. We know that fostering an inclusive culture delivers better business outcomes. We are committed to creating a workplace that values and celebrates the unique backgrounds, perspectives, and experiences of our employees. Our commitments to improving workplace practices include: (1) increasing employee engagement of our team at all levels, (2) continuing real and meaningful gender and race dialogue within our Company, (3) valuing the varied and broad voices of our employees, (4) fostering inclusion and safety within our workforce, (5) continuing to condemn all forms of discrimination and harassment, (6) encouraging our employees to vote by utilizing their flexible time away or voting time off, and (7) fostering an inclusive work environment where every employee feels valued and respected. Among the many ways we demonstrate these commitments are through our hiring and development practices, flexible and working-parent-friendly programs, anti-discrimination policies, a focus on pay equity, and promoting mentorship programs to support career growth for all employees.
We view inclusion and belonging as a competitive advantage that drives innovation, creativity, and success. We are dedicated to creating a workplace where everyone has the opportunity to thrive, and we believe that our commitment to inclusion and belonging will contribute to our long-term growth and sustainability. Through our commitments, actions, words, investments, and values, we promote a work environment that enables employees to feel safe to express their ideas and perspectives and feel they belong within our team.
Workforce Compensation & Pay Equity
The total rewards philosophy of Beyond is to create and maintain competitive programs that attract, motivate, develop, and retain employees based on the prevailing industry and geographic labor markets where the Company does business. Our competitive compensation programs consist of cash and non-cash compensation based on relevant pay factors designed to balance market competitiveness and cost containment to incentivize achievement of financial performance goals and business objectives and to aid in retaining human capital. We designed our total rewards to link the market competitiveness of an employee's compensation with overall Company performance, aligning employees' financial interests with the interests of the Company and its stockholders.
Elements of our compensation package for all non-executive employees consists of base salary or wages, short-term bonus incentives to reward the achievement of key financial performance goals and business objectives, and for eligible key contributors, long-term equity incentives that align to the interests of the Company and its stockholders.
We monitor changes in the value of each employee's job annually and adjust base pay and short-term incentives based on a combination of factors, including, but not limited to, employee performance to pre-determined goals and the Company's overall performance against broader financial and operational goals and objectives. We determine external market competitiveness by gathering salary information from professionally managed third-party salary surveys and by determining pay for individual employees based on their skill level, experience, education, and any other relevant compensatory factors. We balance internal pay equity with external pay equity to ensure compensation is fairly and equitably dispersed and in compliance with applicable laws, regulations, or other legal requirements.
Management is committed to the proposition that the total rewards of every employee in pay and benefits are distributed regardless of their race, gender, gender identity, sexual orientation, religion, national origin, color, veteran status, age, or disability. To further this commitment, we define appropriate metrics to track progress.
We offer all employees the ability to save for retirement by matching dollar for dollar up to 6% of their savings into a qualified savings plan up to certain pre-determined limits set by the IRS.
Our intention is to offer every employee fair and equitable cash compensation and competitive non-cash benefits to help employees manage the wealth, health, and wellness of both themselves and their families.
Talent Acquisition & Retention
We work diligently to attract the best talent from a diverse range of sources. We prioritize hiring local talent in the Salt Lake City market to support the current and future demands of our business. We also recruit talent from twenty-six states across the United States and the Republic of Ireland. We endeavor to establish relationships with universities, professional associations, and industry groups to proactively attract talent. We look for ways to improve our recruiting process regularly and ensure each applicant feels welcome and comfortable through the recruiting process. Our panel interviews are set up with a diverse group of interviewers to ensure for the best candidate experience.
We have a strong employee value proposition that leverages our culture, shared alignment to critical business and financial objective and goals, collaborative and flexible working environment, shared sense of purpose, desire to do the right thing and innovative work to attract talent to our company. We empower employees to find new and better ways of doing things and the scale of our business means that careers can develop in exciting and unexpected directions. To ensure the long-term continuity of our business, we actively manage the development of existing talent to fill the roles that are most critical to the on-going success of our Company.
Our employees have an average tenure of seven years overall, with an average tenure of six and a half years in our customer service and warehouse departments.
Employee Safety & Wellness
Creating a culture where all employees feel supported and valued is a key part of our Company mission. We continue to evolve our programs to meet our employees' wealth, health, and wellness needs, which we believe is essential to attract and retain employees of the highest caliber, and we offer a competitive benefits package focused on fostering work/life integration. We offer comprehensive benefit options to our employees and their families to live healthier and more secure lives. Some of the various insurances we offer include medical, dental, and vision, among others, along with health savings accounts, flexible
spending accounts and generous 401(k) matching and employee stock purchase plan (ESPP) programs. In addition to these more traditional benefits offerings, we also expanded our employee assistance program (EAP) to better align with our national employee base. We offer family planning services including fertility coverage to assist potential parents. We offer paid parental leave for all new parents who have been with the Company for at least 90-days to ensure they are able to adjust. We also offer a caregiver benefit to parents who need to travel for work, which allows employees who have a child under the age of two to travel with the employee. In 2024, we expanded our benefits to include a flexible work schedule by offering flexible time away (unlimited) to all exempt employees, to allow our employees maximum flexibility and trust in our performance-based culture. Additionally, we launched an employee volunteer program, We Go Beyond, pursuant to which each full-time employee spends at least 32 hours a year of work time volunteering for an organization of choice in their community.
Development & Training
We recognize how important it is for our employees to develop and progress in their careers. We provide a variety of resources to help our employees grow in their current roles and build new skills, including online development resources from a competency model development library to hundreds of online courses in our learning management system. We emphasize individual development planning as part of our annual goal setting process, and offer mentoring programs, along with change management and project management upskilling opportunities. We have leadership development resources for all leaders across the organization and continue to build tools for leaders to develop their teams on the job and in roles to create new opportunities to learn and grow. We also encourage higher education and continuing professional education by subsidizing these opportunities for our employees.
Company Culture
We attribute the high levels of employee engagement to our corporate culture. We strive for a work environment that is performance-based, results-driven, inclusive, agile, and collaborative. Our corporate vision, mission, values, leadership principles, and employee qualities help define who we are, where we are going, and the behavior we expect of the Company and our employees to be successful in the organization.
Our values articulate our commitment to an inclusive, outcome-driven work environment, and embody our "becoming" culture and spirit. Our three leadership principles guide our interactions with colleagues, creating a psychologically safe environment for productive and collaborative exchanges for improved outcomes. We strive to clearly define, look for, measure, and develop ten qualities in our employees so that we all become empowered to be effective and valuable contributors in the organization. We believe this culture allows us to attract, develop, engage, and retain highly qualified employees for each role in the organization. Our goal is for every employee to feel they are a valued and empowered member of a winning team, doing meaningful work, in an environment of trust. The Company endeavors to regularly reinforce this culture throughout the entire employee experience.
Oversight & Governance
Our focus on human capital management has been a hallmark of the Company for years, understanding that people truly are a Company's most valuable asset, and that culture is an organization's ultimate competitive advantage. Our 401(k) committee meets quarterly to review the plan and determine if any changes need to be made to the portfolio, in order to best serve our employees. Our board of directors dedicates time in quarterly meetings with management to discuss trends in hiring, engagement, and attrition. Our Compensation Committee is actively involved in determining competitive compensation strategies to help us continually improve in attracting, developing, and retaining top talent for our Company.
Information About Our Executive Officers
The following persons were executive officers of Beyond as of February 25, 2025:
| | | | | | | | | | | | | | | |
| Executive Officers | | | Age | | Position |
| | | | | |
| | | | | |
| | | | | |
| | | | | |
| Adrianne Lee | | | 47 | | Chief Financial & Administrative Officer (Principal Financial Officer and Principal Accounting Officer) |
| Marcus Lemonis | | | 51 | | Executive Chairman of the Board of Directors |
| | | | | |
| Dave Nielsen | | | 55 | | President (Principal Executive Officer) |
| | | | | |
| | | | | |
| | | | | |
| | | | | |
Adrianne Lee was appointed as our Chief Financial & Administrative Officer in February 2024, and previously served as Chief Financial Officer from March 2020 to February 2024. Prior to joining Beyond, Ms. Lee served as Senior Vice President and CFO of North America RAC from December 2018 to March 2020 and as Vice President—Global Financial Planning and Analysis and Corporate Development at The Hertz Corporation from December 2017 to December 2018.
Marcus Lemonis was appointed as the Executive Chairman of the Board of Directors of Beyond, effective February 20, 2024. Mr. Lemonis joined the Board on October 2, 2023, and has served as Chairman of the Board since December 10, 2023. Mr. Lemonis has served as the Chief Executive Officer and Chairman of the Board of Camping World Holdings, Inc. since 2002.
Dave Nielsen was appointed as our President in June 2024. Prior to that, Mr. Nielsen served as Division Chief Executive Officer, Overstock from February 2024 to June 2024, Interim Chief Executive Officer and President from November 2023 to February 2024, President from May 2019 to November 2023, and Chief Sourcing and Operations Officer from October 2018 to May 2019. Mr. Nielsen served as Chief Executive Officer and board member for Global Access from July 2015 to October 2018. Mr. Nielsen originally joined Beyond in 2009 and previously served as our Senior Vice President of Business Development, Senior Vice President and General Merchandise Manager and Co-President.
Available Information
We make our Annual Report on Form 10-K, Quarterly Reports on Form 10-Q, Current Reports on Form 8-K and amendments to those reports filed or furnished pursuant to Section 13(a) or 15(d) of the Exchange Act, available free of charge through the Investor Relations section of our main website, www.beyond.com, as soon as reasonably practicable after we electronically file such material with, or furnish it to, the Securities and Exchange Commission (the "SEC"). The SEC also maintains a website at www.sec.gov that contains reports, proxy and information statements, and other information filed by us. Our Internet Website and the information contained therein or connected thereto are not a part of or incorporated into this Annual Report on Form 10-K.
ITEM 1A. RISK FACTORS
Any investment in our securities involves a high degree of risk. Please consider the following risk factors carefully. If any one or more of the following risks were to occur, it could have a material adverse effect on our business, prospects, financial condition and results of operations, and the market price of our securities could decrease significantly. Statements below to the effect that an event could or would harm our business (or have an adverse effect on our business or similar statements) mean that the event could or would have a material adverse effect on our business, prospects, financial condition and results of operations, which in turn could or would have a material adverse effect on the market price of our securities. Many of the risks we face involve more than one type of risk. Consequently, you should carefully read all of the risk factors below, and in any reports we file with the SEC after we file this Annual Report, before making any decision to acquire or hold our securities.
Risks Relating to Our Company and its Operational, Litigation and Regulatory Environment
We depend on third-party companies to perform functions critical to our business, and any failure or increased cost on their part could have a material adverse effect on our business.
We depend on third-party companies, including third-party carriers, insurers, warranty providers, and a large number of independent fulfillment partners whose products we offer for sale on our Website, to perform functions critical to our business and our ability to deliver products and services to our customers on time and at a reasonable cost. We depend on our carriers, insurers, warranty providers, and fulfillment partners to perform traditional retail operations such as maintaining inventory, preparing merchandise for shipment to our customers, delivering purchased merchandise on a timely and cost-effective basis, insuring the products, and offering warranty services associated with products. We also depend on the delivery and product assembly services that we and they utilize, on the payment processors that facilitate our customers' payments for their purchases, and on other third parties (including SaaS, IaaS, and other cloud-based third-party service providers) over which we have no control, for the operation of our business. Difficulties with any of our significant fulfillment partners or third-party carriers, insurers, warranty providers, delivery or product assembly services, payment processors or any of the third-party service providers involved in our business, regardless of the reason, could have a material adverse effect on our financial results, business and prospects.
We face intense competition and may not be able to compete successfully against existing or future competitors.
The online retail market is evolving rapidly and is intensely competitive. Barriers to entry can be minimal, and current and new competitors can launch new websites at a relatively low cost. We currently compete with numerous competitors, including:
•online retailers with or without discount departments, including Amazon.com, AliExpress (part of the Alibaba Group), eBay, Temu, and Rakuten.com;
•online shopping services, including Google Shopping, Facebook, Instagram, and TikTok;
•online specialty retailers such as Wayfair, Build.com, Houzz, Hayneedle, Rugs.com, Groupon, and World Market;
•furniture specialists including Bob's Discount Furniture, Havertys, Raymour & Flanigan, At Home, Tuesday Morning, Living Spaces, Nebraska Furniture Mart, RC Willey, and Rooms To Go;
•traditional general merchandise and specialty retailers and liquidators including Ashley Furniture, Best Buy, Big Lots, Costco, Crate and Barrel, Ethan Allen, Gilt, Home Depot, HomeGoods, Hudson's Bay Company, IKEA, J.C. Penney Company, Kirkland's, Kohl's, Lands' End, Lowe's, Macy's, Nordstrom, Pottery Barn, Arhaus, RH, Ross Stores, Saks Fifth Avenue, Sears, T.J. Maxx, Target, Walmart, West Elm, and Williams-Sonoma, all of which also have an online presence; and
•online liquidators such as SmartBargains.
We expect that existing and future traditional manufacturers and retailers will continue to add or improve their e-commerce offerings, and that our existing and future e-commerce competitors, including Amazon, will continue to increase their offerings, their delivery capabilities, and the ways in which they entice and enable shoppers to purchase goods, including their mobile technology and the voice-activated shopping services offered by Amazon. Further, large marketplace websites and sites which aggregate marketplace sellers with a large product selection are becoming increasingly popular. We may not be able to place our products on these sites to take advantage of their internal search platforms and some shoppers may begin their searches at these websites rather than utilize traditional search engines at all. Many of our competitors specialize in one or more of the areas in which we offer products. For example, our furniture offerings compete with numerous retail furniture websites
and traditional furniture retail specialists. We also face competition from shopping services such as Google Shopping, which offers products from Walmart, Costco, Target and many other retailers. Competition from our competitors, many of whom have longer operating histories, larger customer bases, greater brand recognition, greater access to capital and significantly greater financial, marketing and other resources than we do, affects us and has had and could continue to have a material adverse effect on our financial results, business and prospects.
We may not timely identify or effectively respond to consumer needs, expectations or trends, which could adversely affect our relationship with our customers, the demand for our products and services, and our market share.
The success of our business depends in part on our ability to identify and respond promptly to evolving trends in demographics, shifts in consumer preferences, expectations and needs, changes in the macroeconomic environment, and unexpected weather conditions, natural disasters, or public health issues (including pandemics and related impacts) that impact our customers, while also managing appropriate inventory levels and maintaining an excellent customer experience. It is difficult to successfully predict the products and services our customers will demand. As our customers expect a more personalized experience, our ability to collect, use, retain, and protect relevant customer data is important to our ability to effectively meet their expectations. Our ability to collect and use that data, however, is subject to a number of external factors, including the impact of legislation or regulations governing data privacy, data-driven technologies such as artificial intelligence, and data security, as well as customer expectations around data collection, retention, and use. In addition, each of our primary customer groups has different needs and expectations, many of which evolve as the demographics in a particular customer group change. Customer preferences and expectations related to sustainability of products and operations are also changing. In addition, as the impacts of COVID-19 have subsided, customers have shifted more of their spending back to travel, dining and other experiences, compared to the historic levels of home improvement spending we saw during the heights of the pandemic. If we do not successfully differentiate the shopping experience to attract our customers and meet their individual needs and expectations, it may adversely impact our sales and our market share.
Customer expectations about the methods by which they purchase and receive products or services are also becoming more demanding. Customers routinely and increasingly use technology and a variety of electronic devices and digital platforms to rapidly compare products and prices, read product reviews, determine real-time product availability, and purchase products, and new channels and tools to expand the customer experience appear and change rapidly. We must continually anticipate and adapt to these changes in the shopping and purchasing process by continuing to adjust and enhance the customer experience as well as our delivery options. We cannot guarantee that our current or future fulfillment options will be maintained and implemented successfully or that we will be able to meet customer expectations on delivery or pickup times, options and costs.
Failure to provide a relevant and effective customer experience in a timely manner that keeps pace with technological developments and dynamic customer expectations, preferences, and trends or to differentiate the customer experience could adversely affect our relationship with our customers, the demand for our products and services, and our market share.
Our business depends on effective marketing, including marketing via email, search engine marketing, influencer marketing, and social media marketing. Our competitors have and may continue to cause us to increase our marketing costs and decrease certain other types of marketing, and have and may continue to outspend us on marketing or be more efficient in their spend.
We depend on effective marketing and inflow of customer traffic. We depend on search engine marketing, email, and other e-commerce marketing methods to promote our site and offerings and to generate a substantial portion of our revenue. If a significant portion of our target customers no longer utilize email, or if we are unable to effectively and economically deliver email or marketing materials through other channels to our potential customers, whether for legal, regulatory or other reasons, it would have a material adverse effect on our business. For example, some email services have features that organize incoming emails into categories and such categorization or similar inbox organizational features may result in our emails being delivered in a less prominent location in a customer’s inbox or viewed as “spam” by our customers and may reduce the likelihood of that customer opening our emails. Actions by third parties to block, impose restrictions on or charge for the delivery of emails or other messages could also adversely impact our business. From time to time, Internet service providers or other third parties may block bulk email transmissions or otherwise experience technical difficulties that result in our inability to successfully deliver emails or other messages to third parties.
We also rely on social media and influencers for marketing purposes, and anything that limits our ability or our customers' ability or desire to utilize social media could have a material adverse effect on our business, including changes to the terms of social networking services to limit promotional communications, any restrictions that would limit our ability or our customers' ability to send communications through their services, disruptions or downtime experienced by these social
networking services, or decline in or cessation of the use of or engagement with social networking services, including due to legislation, regulation, or directives (including executive orders).
In addition to competing with us for customers, suppliers, and employees, our competitors have and may continue to directly increase our operating costs, by driving up the cost of various forms of online advertising. Furthermore, our competitors may outspend us or be more efficient on various forms of advertising or marketing, making our marketing efforts less effective. We may elect to decrease our use of search engine marketing or other forms of marketing from time to time in order to decrease our costs, which may have a material adverse effect on our financial results and business. We may also elect to spend additional amounts on search engine marketing or other forms of marketing from time to time in order to increase traffic to our Website, or to take other strategic actions to increase traffic and/or conversion, and such increased spending may not be effective on a cost-benefit basis, or at all. If we are unable to develop, improve, implement and maintain effective and efficient cost-effective advertising and marketing programs, it would have a material adverse effect on our financial results and business.
Economic factors, including recessions, other economic downturns, inflation, our exposure to the U.S. housing market, and decreases in consumer spending, have affected and could continue to adversely affect us.
Various economic conditions, including recessions, other economic downturns, inflation, weaknesses in the U.S. housing market, and decreased consumer discretionary spending have adversely affected and could further adversely affect our financial performance. We believe that our sales of home-related products are affected by the strength of the U.S. housing market and overall consumer sentiment on discretionary goods. Recessions or other economic downturns, in particular in the U.S. housing market, have negatively impacted our sales in the past, and could have a material adverse effect on our financial results, business, and prospects in the future. Similarly, a substantial portion of the products and services we offer are products or services that consumers may view as discretionary items rather than necessities. As a result, our results of operations are sensitive to changes in macroeconomic conditions that impact consumer spending, including discretionary spending. Difficult macroeconomic conditions also impact our customers' ability to obtain consumer credit and therefore their purchasing power. Other factors, including consumer confidence in the economy, employment levels, interest rates, inflation, fuel and energy costs, tax rates, and consumer debt levels could reduce consumer spending or change consumer purchasing habits. Any of the foregoing could have a material adverse effect on our financial results, business, and prospects.
Tariffs, bans, or other measures or events that increase the effective price of products or limit our ability to access products we or our suppliers or fulfillment partners import into the United States could have a material adverse effect on our business.
We and many of our suppliers and fulfillment partners source a large percentage of the products we offer on our Website from China and other countries. President Donald J. Trump has advocated for greater restrictions on international trade in general, including increased tariffs on certain goods imported into the United States, particularly from China. If the United States imposes tariffs or bans on imports, or if other factors that are outside of our control increase the prices of imported products sold on our Website or limit our ability to access products sold on our Website, the increased prices and/or supply chain challenges could have a material adverse effect on our financial results, business and prospects.
Our changing business model and use of the Overstock brand, Bed Bath & Beyond brand, Zulily brand, and Beyond brand, could negatively impact our business.
Our business has undergone a number of changes in the recent past, including our company name changing from Overstock.com, Inc. to Beyond, Inc., our purchase of the Bed Bath & Beyond and Zulily brands, changing our company ticker symbol from OSTK to BYON, and transferring the listing of our common stock from the Nasdaq Stock Market LLC to the New York Stock Exchange. These changes, along with others, may cause negative impacts to our business, including customer and stockholder confusion about our brands, the need for higher promotional discounting or marketing costs to acquire and maintain customers, diversion of the attention of management or key personnel, employee fatigue resulting from implementation efforts, disruptions to existing business relationships, and other unforeseen costs, expenses, losses, disruptions, delays, or negative impacts that could have a material adverse effect on our financial results, business and prospects.
The changing job market, the changes in our leadership team, the change in our compensation approach, changing job structures, or any inability to attract, retain and engage key personnel could affect our ability to successfully grow our business.
Our performance is substantially dependent on the continued service and performance of our senior management, our board of directors, and other key personnel. In 2024, we underwent significant changes to our executive management team and board of directors, structural changes to our organization, and changes to our workforce with reductions in force. Additionally, in 2024, we adjusted our approach to our executives' equity compensation from a fully time-based approach to a fully performance-based approach.
With many businesses allowing employees to work remotely, we are forced to compete with businesses in other locations and states to attract and retain key employees. We recently sold our corporate headquarters and announced that local employees will be asked to increase their onsite work from three days each week to four days each week at a new location. We also announced the elimination of our 9-80 schedule (where employees were permitted to work nine-hour days, rather than standard eight-hour days, and take every other Friday off from work). Changes in leadership, structural changes to our organization, reductions in force, changed approach to performance-based compensation, and changes in job structures could create consequences such as a lack of or decreased productivity, a lack of engagement, employee dissatisfaction, and employee fatigue, any of which could impair our ability to recruit, hire, and retain employees. Our success depends on our ability to identify, attract, recruit, hire, train, engage, retain, and motivate highly-skilled personnel necessary to successfully operate our business. Our failure to do any of the foregoing could have a material adverse effect on our financial results, business and prospects.
We rely upon paid and natural search engines to rank our product offerings, and our financial results may suffer if we are unable to maintain our prior rankings in natural searches.
We rely on paid and natural search engines to attract consumer interest in our product offerings, including Google, Bing, and Yahoo!. Changes to their ranking algorithms and competition from other retailers to attract consumer interest may adversely affect our product offerings in paid and/or natural searches. Search engine companies change their natural search engine algorithms periodically and online retailers compete to rank well with these search engine companies. Our ranking in natural searches may be adversely affected by those changes, as has occurred from time to time, which has led us to pursue revenue growth in other more expensive marketing channels. Google's search engine is dominant in our business and has historically been a significant source of traffic to our website. Search engine companies may also determine that we are not in compliance with their guidelines from time to time, as has occurred in the past, and they may penalize us in their search algorithms as a result. In recent years, we have experienced declines in our rankings in Google's natural search engine, which has required us to utilize more expensive marketing channels or otherwise compensate for the loss of some of the natural search traffic. Any future declines in our rankings in Google's natural search engine could have a material adverse effect on our business.
If we are not profitable and/or are unable to generate sufficient positive cash flow from operations, our ability to continue in business will depend on our ability to raise additional capital, obtain financing or monetize significant assets, and we may be unable to do so.
At December 31, 2024, our accumulated deficit was $740.5 million. We experienced significant losses in years leading up to 2020. Although our financial results were significantly better in 2020 and 2021, we incurred additional losses in 2022 through 2024, which included significant non-cash losses on our equity method investments and a write-down loss on our corporate headquarters. If we are unable to successfully manage our business in the future, our ability to continue in business could depend on our ability to raise sufficient additional capital, obtain sufficient financing, or sell or otherwise monetize significant assets. Additionally, we may not be able to raise capital on acceptable terms or at all. The occurrence of any of the foregoing risks would have a material adverse effect on our financial results, business and prospects.
Our business depends on the Internet, our infrastructure and transaction-processing systems, and catastrophic events could adversely affect our operating results.
We are completely dependent on our infrastructure and on the availability, reliability and security of the Internet and related systems. Although we have migrated and continue to migrate some of our computer systems and operations to the public cloud, a substantial majority of our computer and communications infrastructure is running in our private cloud on hardware that is located at a single facility, which we sold on December 20, 2024. As part of the sale, we entered into a lease agreement that allows us to continue to occupy and use the data center at the facility.
Our systems and operations, and those of the third parties that we rely on, are vulnerable to damage or interruption from natural disasters or extreme weather events (such as earthquakes, floods, fires and droughts), including those related to, or exacerbated by, climate change, other types of fires or floods, power loss, telecommunications failure, software or hardware malfunctions, terrorist attacks, cyberattacks, acts of war, break-ins, and similar events. The adverse effects of any such catastrophic event would be exacerbated if experienced at the same time as another unexpected and adverse event, such as a pandemic. Current events, including political events, social activism, tension and potential for violence, may impact our workforce, customers, properties and the communities where we operate. If our customers and employees do not perceive our response to be appropriate or adequate for a particular region or for our company as a whole, we could suffer damage to our reputation and brand, which could adversely affect our business. As a consequence of these or other catastrophic events, we may experience interruption to our operations or losses of property, equipment and/or inventory, which could adversely affect our revenue and profitability.
Our back-up facility by itself is not adequate to support fulfillment of sales orders. Our servers and applications are vulnerable to malware, physical or electronic break-ins, internal sabotage, and other disruptions, the occurrence of any of which could lead to interruptions, delays, loss of critical data or the inability to accept and fulfill customer orders. Any internal or critical third-party system interruption that results in the unavailability of our websites or our mobile app or reduced performance of our transaction systems could interrupt or substantially reduce our ability to conduct our business. We have experienced periodic systems interruptions due to server failure, application failure, power failure and intentional cyberattacks in the past, and may experience additional interruptions or failures in the future. Any failure or impairment of our infrastructure or of the availability of the Internet or related systems caused by any source, including the housing or maintenance of our hardware by a third party (including the purchaser of the facility where it is now located), or any inability to access or protect our hardware in a timely manner, could have a material adverse effect on our financial results, business and prospects. In addition, the occurrence of any event that would adversely affect e-commerce or discourage or prevent consumers from shopping online or via mobile apps could significantly decrease the volume of our sales.
Compliance with ever-evolving federal, state, and foreign laws and other requirements relating to the handling of information about individuals necessitates significant expenditure and resources, and any failure by us, our vendors or our business partners to comply may result in significant liability, negative publicity, and/or an erosion of trust, which could materially adversely affect our business, results of operations, and financial condition.
In connection with running our business, we receive, store, use and otherwise process information that relates to individuals and/or constitutes "personal data," "personal information," "personally identifiable information," or similar terms under applicable data privacy laws (collectively, "Personal Information"), including from and about actual, former and prospective customers as well as our employees and business contacts. We also depend on a number of third party vendors in relation to the operation of our business, a number of which process Personal Information on our behalf. In addition, we share Personal Information with, and obtain Personal Information from, certain business partners pursuant to commercial arrangements.
We, our vendors and our business partners are subject to a variety of federal, state and foreign data privacy laws, rules, regulations, industry standards and other requirements. These requirements, and their application, interpretation and amendment are constantly evolving. It is also possible that new laws, regulations and other requirements, or amendments to or changes in interpretations of existing laws, regulations and other requirements, may require us to incur significant costs, implement new processes, or change our handling of information and business operations, which could ultimately hinder our ability to grow our business by extracting value from our data assets. For example, in the United States, the Federal Trade Commission and state regulators enforce a variety of data privacy issues, such as promises made in privacy policies or failures to appropriately protect information about individuals, as unfair or deceptive acts or practices in or affecting commerce in violation of the Federal Trade Commission Act or similar state laws.
In addition, in recent years, certain states have adopted or modified data privacy and security laws and regulations that may apply to our business. For example, the California Consumer Privacy Act ("CCPA") requires businesses that process personal information of California residents to, among other things: provide certain disclosures to California residents regarding the business's collection, use, and disclosure of their personal information; receive and respond to requests from California residents to access, delete, and correct their personal information, or to opt-out of certain disclosures of their personal information; and enter into specific contractual provisions with service providers that process California resident personal information on the business's behalf. The enactment of the CCPA is prompting a wave of similar legislative developments in other states in the United States, which creates a patchwork of overlapping but different state laws. For example, since the
CCPA went into effect, numerous state laws that share similarities with the CCPA are now in effect. Similar laws have been proposed in many other states and at the federal level as well.
Additionally, laws, regulations, and standards covering marketing, advertising, and other activities conducted by telephone, email, mobile devices, and the internet may be or become applicable to our business, such as the Telephone Consumer Protection Act (the "TCPA"), the Controlling the Assault of Non-Solicited Pornography and Marketing Act of 2003 (the "CAN-SPAM Act"), and similar state consumer protection and communication privacy laws. For example, we send text messages to customers as part of our business operations. The actual or perceived improper sending of text messages may subject us to potential risks, including liabilities or claims relating to consumer protection laws such as the TCPA, which imposes significant restrictions on the ability to make telephone calls or send text messages to mobile telephone numbers without the prior consent of the person being contacted.
We may also be subject to international privacy laws such as the European Union General Data Protection Regulation and the UK General Data Protection Regulation, as well as laws and regulations in other jurisdictions. These laws contain significant privacy requirements that may impose restrictions on our ability to collect, use, and otherwise process Personal Information.
Even though we believe we are generally in compliance with applicable laws, rules and regulations relating to privacy and data security, these laws are in some cases relatively new and the interpretation and application of these laws are uncertain. Any failure or perceived failure by us (or in some cases, our vendors and business partners) to comply with data privacy laws, rules, regulations, industry standards and other requirements could result in proceedings or actions against us by individuals, consumer rights groups, government agencies, or others. We could incur significant costs in investigating and defending such claims and, if found liable, pay significant damages or fines or be required to make changes to our business. Further, these proceedings and any subsequent adverse outcomes may subject us to significant negative publicity and an erosion of trust. If any of these events were to occur, our business, results of operations, and financial condition could be materially adversely affected.
If we or our third-party providers experience cyberattacks or data security incidents, there may be damage to our brand and reputation, material financial penalties, and legal liability, which would materially adversely affect our business, results of operations, and financial condition.
We rely on our computer systems, hardware, software, technology infrastructure and online sites and networks and those of our for both internal and external operations that are critical to our business (collectively, "IT Systems"). We own and manage some of these IT Systems but also rely on third parties for a range of IT Systems and related products and services, including but not limited to our suppliers, banks, credit card processors, delivery services, and public cloud providers. We and certain of our third-party providers collect, maintain and process data about customers, employees, business partners and others, including personal information, confidential and proprietary intellectual property, financial information, trade secrets, and other business information (collectively, "Confidential Information").
Our business involves the storage and transmission of Confidential Information, and we face numerous and evolving cybersecurity risks that could threaten the confidentiality, integrity and availability of our IT Systems and Confidential Information, including from diverse threat actors, such as state-sponsored organizations, opportunistic hackers and hacktivists, as well as through diverse attack vectors, such as social engineering or phishing, malware (e.g., ransomware), malfeasance by insiders, human or technological error, and as a result of malicious code embedded in open-source software, or misconfigurations, bugs or other vulnerabilities in commercial software that is integrated into our or our third parties’ IT Systems, products or services. Because we make extensive use of third party suppliers and service providers, such as banks, credit card processors, delivery services and cloud services that support our internal and customer-facing operations, successful cyberattacks that disrupt or result in unauthorized access to third party IT Systems can materially impact our operations and financial results. Moreover, we have acquired and continue to acquire companies with cybersecurity vulnerabilities or unsophisticated security measures, which exposes us to significant cybersecurity, operational, and financial risks. Remote and hybrid working arrangements at our company (and at many third-party providers) also increase cybersecurity risks due to the challenges associated with managing remote computing assets and security vulnerabilities that are present in many non-corporate and home networks. Additionally, any integration of artificial intelligence in our or any service providers' or business partners' operations, products or services is expected to pose new or unknown cybersecurity risks and challenges.
Cyberattacks are expected to accelerate on a global basis in frequency and magnitude as threat actors are becoming increasingly sophisticated in using techniques and tools—including artificial intelligence—that circumvent security controls, evade detection and remove forensic evidence. As a result, we may be unable to detect, investigate, remediate or recover from
future attacks or incidents, or to avoid a material adverse impact to our IT Systems, Confidential Information or business. There can also be no assurance that our cybersecurity risk management program and processes, including our policies, controls or procedures, will be fully implemented, complied with or effective in protecting our IT Systems and Confidential Information. Furthermore, given the nature of complex systems, software and services like ours, and the scanning tools that we deploy across our networks and products, we regularly identify and track security vulnerabilities. We are unable to comprehensively apply patches or confirm that measures are in place to mitigate all such vulnerabilities, or that patches will be applied before vulnerabilities are exploited by a threat actor.
We and certain of our third-party providers and business partners have experienced a variety of cyber-attacks, which have increased in number and variety over time. Any adverse impact to the availability, integrity or confidentiality of our IT Systems or Confidential Information can result in significant legal and financial exposure (such as class actions), regulatory investigations, damage to our reputation that cause us to lose existing or future customers, a loss of confidence in our security measures, and significant incident response, system restoration or remediation and future compliance costs, any of which could have a material adverse effect on our financial results, operations results, and business. Moreover, any insurance coverage we may carry may be inadequate to cover the expenses and other potential financial exposure we could face due to a cyber-attack or data breach and there can be no assurance that applicable insurance will be available to us in the future on economically reasonable terms or at all.
Moreover, as we accept debit and credit cards for payment, we are subject to the Payment Card Industry Data Security Standard ("PCI-DSS"), issued by the Payment Card Industry Security Standards Council. PCI-DSS contains compliance guidelines with regard to our security surrounding the physical and electronic storage, processing and transmission of cardholder data. If we are unable to comply with the security standards established by banks and the payment card industry, we may be subject to fines, restrictions and expulsion from card acceptance programs, which could materially and adversely affect our business.
We are subject to payment-related risks that could increase our operating costs, expose us to fraud or theft, subject us to potential liability, and potentially disrupt our business.
We accept or have accepted payments using a variety of methods, including credit and debit cards, electronic payments, digital wallets, loan programs including installment loans, and gift cards, and we may offer new payment options over time. Acceptance of these payment options subjects us to rules, regulations, contractual obligations and compliance requirements, including payment network rules and operating guidelines, data security standards and certification requirements, and rules governing electronic funds transfers. These requirements may change over time or be reinterpreted, making compliance more difficult, costly, or uncertain. For certain payment methods, including credit and debit cards, we pay interchange fees and other costs to accept these payments, and we may also incur losses, all of which may increase over time and raise our operating costs. We rely on third parties to provide payment processing services, including the processing of credit cards, debit cards, and other forms of electronic payment. If these companies become unable to provide these services to us, or if their systems are compromised, it could potentially disrupt our business. The payment methods that we offer, and the selling channels in which we operate, also subject us to potential fraud and theft by threat actors, who are becoming increasingly more sophisticated, seeking to obtain unauthorized access to or exploit weaknesses that may exist in our sales, payments and payment processing systems. If we fail to comply with applicable rules or requirements for the payment methods we accept, or if payment-related data is compromised due to a breach or misuse of data, we may be liable for costs incurred by payment card issuing banks and other third parties or we may be subject to fines and higher transaction fees, or our ability to accept or facilitate certain types of payments may be impaired. In addition, our customers could lose confidence in certain payment types, or may expect or demand payment methods that we do not currently offer, which could result in competitive disadvantages or require a shift to other payment types or potential changes to our payment systems that may result in higher costs. As a result, our business and operating results could be adversely affected.
We have significant deferred tax assets and may not be able to realize these assets in the future.
We have established a valuation allowance for our net deferred tax assets, primarily due to recent operating losses, forecasted near-term losses, and uncertainty regarding our future taxable income. Determining whether a valuation allowance for deferred tax assets is appropriate requires judgment and an evaluation of all positive and negative evidence. At each reporting period, we assess the need for, or the sufficiency of a valuation allowance against deferred tax assets. We intend to maintain a valuation allowance on our net deferred tax assets until there is sufficient evidence to support the reversal of all or some portion of the allowance.
We may be required to recognize losses relating to our equity method investments.
At December 31, 2024, we held equity method investments totaling approximately $78.2 million. The underlying equity interests are in entities that are in the startup or development stages. Equity method interests are inherently risky because we do not have the ability to influence the business decisions underlying those investments and because the markets for the technologies or products these companies are developing are typically in the early stages and may never materialize. Since these investments are in companies that are in the early startup or development stages, even if their technology or products are viable, they may not be able to obtain the capital or resources necessary to successfully bring their technology or products to market. We have recognized losses related to these equity method securities in the past and may in the future recognize additional losses. Additionally, due to tax law limitations around deductibility of capital and investment losses, we may not be able to recognize a tax benefit on these losses when they occur. Any such loss could be material and could have a material adverse effect on our financial results.
If governmental entities or providers of consumer devices and internet browsers further restrict or regulate the use of "cookie" tracking technologies, the amount or accuracy of online user information we collect could decrease, which could harm our business and operating results.
Various federal, state and international governmental entities have enacted or are considering enacting legislation or regulations that could significantly restrict the ability of companies to use proprietary or third-party "cookies" and other methods of online tracking for behavioral advertising. For example, some governmental agencies have regulated the level of consumer notice and consent required before a company can employ cookies or other electronic tracking tools or the use of data gathered with such tools. Additionally, some providers of consumer devices and web browsers have implemented or plan to implement methods of making it easier for Internet users to prevent the placement of cookies, to block other tracking technologies or to require new permissions from users for certain activities, which have impacted us in the past and have the potential to significantly reduce the effectiveness of such practices and technologies in the future. Any further restriction on the use of cookies and other online tracking and advertising practices could lower the quality of the data we collect, negatively impact our targeted marketing capabilities, increase costs associated with developing or transitioning to new technologies or methods, and could impact our ability to compete. Increased restrictions on tracking technologies could also lead to increased compliance, legal, and regulatory risks, increased costs associated with the management thereof, and increased costs associated with potential fines, penalties, claims. defense costs, reputational harm, or other associated costs. Such restrictions on tracking could also limit our ability to effectively retain existing customers or acquire new customers and consequently, materially adversely affect our business, financial condition and operating results.
If the legal, regulatory, or tax treatment of our company changes adversely, it could impact our ability to conduct business and, accordingly, our financial results.
New or revised laws, regulations, or court decisions may subject us to additional requirements and new disclosures that could increase the cost of doing business, increase scrutiny for the way decisions are made, decrease our revenues, increase our expenses, or impact our business model. For example, various jurisdictions around the world have enacted or are considering revenue-based taxes such as digital advertising taxes, data collection taxes, and other targeted taxes, which could lead to inconsistent and potentially overlapping tax regimes that could increase our expenses. Other new or revised legal, regulatory, or tax treatment could expose us to additional risk, increase the cost of doing business online, and increase internal costs necessary to capture data, report data, and collect and remit taxes. Any of these items could have a material adverse effect on our business and financial results.
Failure to comply with, or changes in, laws, regulations and enforcement activities may adversely affect the products, services and markets in which we operate.
From time to time, we are subject to claims, individual and class action lawsuits, arbitration proceedings, government and regulatory investigations, inquiries, actions or requests, and other proceedings alleging violations of laws, rules, and regulations with respect to taxation, advertising practices, online services, intellectual property rights, privacy, consumer and data protection, pricing, content, copyrights, distribution, mobile communications, electronic device certification, electronic waste, energy consumption, environmental regulation, electronic contracts and other communications, competition, employment (including diversity, equity and inclusion), labor rights, import and export matters including tariffs and the importation of specified or proscribed items and importation quotas, information reporting requirements (including sustainability reporting), access to our services and facilities, the design and operation of websites, health, safety, and sanitation standards, the characteristics and quality of products and services, product labeling and unfair and deceptive trade practices. There may be changes to the laws, regulation, standards, directives (including executive orders), and enforcement priorities that
affect our operations in substantial and unpredictable ways at the federal and state level in the United States and in other countries in which our services are or may be used. Changes to laws, regulations and standards, including interpretation and enforcement of such laws, regulations and standards could increase the cost of doing business or otherwise change how or where we want to do business. In addition, changes to laws, regulations and standards could affect our merchants and software partners and could result in material effects on the way we operate and the cost to operate our business. Failure to comply with such laws, regulations and standards could result in harm to our members, employees and partners in the supply chain, significant costs to satisfy compliance, remediation or compensatory requirements, or the imposition of severe penalties or restrictions on operations by governmental agencies or courts that could adversely affect our reputation, business, financial condition, and results of operations.
From time to time we are subject to various legal proceedings which could adversely affect our business, financial condition or results of operations.
We are involved in various litigation matters from time to time. For more information regarding our material legal proceedings, please see Item 8 of Part II, "Financial Statements and Supplementary Data"—Note 15—Commitments and Contingencies, subheading Legal Proceedings and Contingencies, contained in the "Notes to Consolidated Financial Statements" of this Annual Report. Such matters can be time-consuming, divert management's attention and resources and cause us to incur significant expenses. Our insurance or indemnities may not cover all claims that may be asserted against us, and any claims asserted against us, regardless of merit or eventual outcome, may harm our reputation. If we are unsuccessful in our defense in these litigation matters, or any other legal proceeding, we may be forced to pay damages or fines, enter into consent decrees or change our business practices, any of which could adversely affect our business, financial condition and results of operations.
Damage to our reputation or brand image could adversely affect our sales and results of operations.
Our reputation is largely based on public perceptions. Incidents that erode trust or confidence in us could adversely affect our reputation and thereby impact our business, particularly if the incidents result in rapid or significant adverse publicity, protests, litigation, boycotts, governmental inquiries, or other stakeholder responses. This could include incidents regarding our actions or inactions on issues related to corporate social responsibility or environmental, social, and governance (“ESG”) matters, and any perceived lack of transparency about such matters. We have established, and may continue to establish, various goals and initiatives on ESG matters, including with respect to sustainability and diversity, equity, and inclusion topics. We cannot guarantee that we will achieve these goals and initiatives. Any failure, or perceived failure, by us to achieve these goals and initiatives could adversely affect our reputation. Further, stakeholder expectations regarding ESG matters continue to evolve and are not uniform, and our pursuit of our goals and initiatives could adversely impact our reputation due to such differing expectations. In turn, damage to our reputation or brand image could, among other things, adversely impact our customer loyalties and sales, our supply chain relationships and business opportunities, our ability to attract and retain talent sufficient to meet business needs, and results of operations. Any of the foregoing can be further exacerbated by changes to laws, regulation, standards, directives (including executive orders), and enforcement priorities. See "—Failure to comply with, or changes in, laws, regulations and enforcement activities may adversely affect the products, services and markets in which we operate."
Regulatory changes or actions may alter the nature of an investment in us or restrict the use of cryptocurrencies and blockchain technology in a manner that adversely affects our business, prospects and operations.
As cryptocurrencies and blockchain technology have grown in both popularity and market size, governments around the world have reacted differently to them, with certain governments deeming them illegal while others have allowed their use and trade. Governments may in the future regulate, curtail or outlaw the ability for acquisition, use or redemption of cryptocurrencies and blockchain technology. Governments may take regulatory action that may increase the cost and/or subject cryptocurrency companies or blockchain technology to additional regulation. Similar actions by governments or regulatory bodies could result in restriction of the acquisition, ownership, holding, selling, use or trading of our securities.
In the United States and certain other jurisdictions, certain cryptocurrencies may be securities and subject to the securities laws of the relevant jurisdictions. If we fail to comply with any relevant laws, regulations or prohibitions that may be applicable to us, we could face regulatory or other enforcement actions and potential fines or other consequences. The rapidly evolving regulatory landscape with respect to cryptocurrency and blockchain technology may subject us to inquiries or investigations from regulators and governmental authorities, require us to make product changes, restrict or discontinue product offerings, and implement additional and potentially costly controls. If we fail to comply with regulations, requirements,
prohibitions or other obligations applicable to us, we could face regulatory or other enforcement actions and potential fines and other consequences.
Cryptocurrencies have in the past and may in the future experience periods of extreme price volatility. Fluctuations in the value of any cryptocurrencies or other digital assets that we might hold could also lead to volatility in our financial results and could have an adverse impact on our business. These uncertainties, including accounting and tax developments, or other requirements relating to cryptocurrency or blockchain technology could expose us to litigation, regulatory action and possible liability, and have an adverse effect on our business.
If we do not successfully optimize and operate our fulfillment center or customer service operations, our business could be harmed.
We have expanded, contracted, and otherwise modified our fulfillment centers, warehouses, and customer service operations from time to time in the past, and expect that we will continue to do so. If we do not successfully optimize and operate our fulfillment center and customer service operations, it could significantly limit our ability to meet customer demand, customer shipping or return time expectations, or result in excessive costs and expenses for the size of our business. We may not be able to staff at optimal levels or manage our operations in an optimal way, which could result in reduced customer satisfaction and excess or insufficient inventory or warehousing capacity. Our failure to manage our fulfillment center or customer service operations optimally could adversely affect our financial results and customer experience and could have a material adverse effect on our financial results, business and prospects.
If we fail to effectively utilize technological advancements, including in artificial intelligence, our business and financial performance could be negatively impacted.
Our industry is highly competitive and is undergoing rapid changes due to technological advancement in areas such as artificial intelligence (AI). Our future success depends in part on our ability to effectively utilize these technological advancements. Our competitors may outpace us in incorporating AI into their product offerings and engagement with customers, which could affect our competitiveness and operational outcomes. Our efforts to utilize these technological advancements may not be successful, may result in substantial integration and maintenance costs, and may expose us to additional risks. For example, Personal Information that may be used in relation to AI could subject us to data privacy and cybersecurity risks. For more information, see "Risks Relating to Our Company and its Operational, Litigation, and Regulatory Environment." Additionally, the content, analyses, or recommendations generated by AI programs, if deficient, inaccurate, or biased, could adversely impact our business, financial condition, and operational results, as well as our reputation. Moreover, ethical concerns associated with AI could lead to brand damage, competitive disadvantages, or legal repercussions. Any problems with our implementation or use of AI or other technological advancements could negatively impact our business or results of our operations.
Global conflict could negatively impact our business, results of operations, and financial condition.
Global conflict could increase costs and limit availability of fuel, energy, and other resources we depend upon for our business operations and could also limit product assortment availability. For example, while we do not operate in Russia or Ukraine, the tensions between the United States and Russia and the other effects of the ongoing conflict in Ukraine, have resulted in many broader economic impacts such as the United States imposing sanctions and bans against Russia and Russian products imported into the United States. Such sanctions and bans have impacted and may continue to impact commodity pricing such as fuel and energy costs, making it more expensive for us and our partners to deliver products to our customers. Conflict in the Middle East has resulted in reduced access to shipping ports, which in turn has increased shipping times and costs. Further, we and many of our suppliers and fulfillment partners source a large percentage of the products we offer on our Website from China. Relations between the United States and China have become increasingly strained and if tensions were to escalate, it could limit or delay our ability to provide a full assortment of furniture and home furnishings on our Website. Sanctions, bans, trade restrictions, or other economic actions in response to present or future conflicts could result in an increase in costs, further disruptions to our supply chain, and a lack of consumer confidence resulting in reduced demand. Any of the foregoing could negatively impact our business, results of operations, and financial condition.
We are partially self-insured with respect to our employees' health insurance. If the actual costs of these claims exceed the amounts we have accrued for them, we would incur additional expense.
Since January 1, 2017, we have been partially self-insured with respect to our employees' health insurance, except to the extent of stop-loss coverage that limits our losses both on a per employee basis and an aggregate basis. The actual costs of
our employees' health insurance claims could exceed our estimates of those costs for a number of reasons, including more claims or larger claims than we expect, and increases in the costs of healthcare generally. If the actual cost of our employees' health insurance claims and related expenses exceeds the amounts we have accrued, we may be required to record additional charges for these claims and/or to establish additional cash reserves, which could have a material adverse effect on our financial results, business and prospects.
We may be unable to protect our proprietary technology and to obtain trademark protection for our marks.
Our success depends to a significant degree upon the protection of our software and other proprietary intellectual property rights. We rely on a combination of laws, regulations, and contractual restrictions with our employees, customers, suppliers, affiliates, and others to establish and protect our proprietary rights, including the law pertaining to trade secrets. Despite these precautions, it may be possible for a third party to copy or otherwise obtain and use our intellectual property or trade secrets without authorization. In addition, we cannot ensure that others will not independently develop similar intellectual property. Third parties have in the past recruited and may in the future recruit our employees who have had access to our proprietary technologies, processes and operations. These recruiting efforts expose us to the risk that such employees and those hiring them will misappropriate and exploit our intellectual property and trade secrets. We may be unable to protect against such risks, in the United States or elsewhere, which could have a material adverse effect on our business. Although we have registered some of our, and are pursuing the registration of other key trademarks in the United States and some other countries, some of our trademarks and trade names may not be eligible to receive registered trademark protection. In addition, effective trademark protection may not be available or we may not seek protection in every country in which we market or sell our products and services, including in the United States. Our competitors might adopt product or service marks like our marks or might try to prevent us from using our marks. Any claim by another party against us, or customer confusion related to our trademarks, or our failure to obtain trademark registration, could have a material adverse effect on our financial results, business and prospects.
We are currently subject to claims that we have infringed intellectual property rights of third parties and may be subjected to additional infringement claims in the future.
We have been in the past and may in the future be subject to claims that we have infringed the intellectual property rights of others, by offering allegedly infringing products or otherwise. We have contested and expect to continue to contest claims we consider unfounded rather than settling such claims, even when we expect the costs of contesting the claims could potentially exceed the cost of settlement. Any claims may result in significant expenditure of our financial and managerial resources and may result in us needing to make significant damages or settlement payments or changes to our business. We could be prohibited from using software or business processes, or required to obtain licenses from third parties, which could be expensive or unavailable. Any such difficulties could have a material adverse effect on our financial results, business and prospects.
Product safety and quality concerns could have a material adverse impact on our revenue and profitability.
If the products we sell fail to meet, or are alleged to fail to meet, applicable safety standards or our customers’ expectations regarding safety and quality, we could be exposed to increased legal risk and damage to our reputation. Failure to take appropriate actions in relation to product-related issues (for example, product recalls), could lead to violations of laws and regulations and leave us susceptible to government enforcement actions or private litigation. Recalls of products, particularly when combined with lack of available alternatives or difficulty in sourcing sufficient volumes of replacement products, could also have a material adverse impact on our revenue and profitability.
We depend on our suppliers' and fulfillment partners' representations regarding product safety, content and quality, product compliance with various laws and regulations, including registration and/or reporting obligations, and for proper labeling of products.
We rely on our suppliers' and fulfillment partners' representations of product safety, content and quality, product compliance with various laws and regulations, including registration and/or reporting obligations, and proper labeling of products. Issues or concerns regarding product safety, compliance, registration and/or reporting, labeling, content or quality could result in consumer or governmental claims and could adversely affect our financial results and business. Any indemnity agreement we may have with a supplier or fulfillment partner of a product may be inadequate or inapplicable, and any insurance coverage we may carry may be inadequate. Even unsuccessful claims could result in the expenditure of funds and management time and could have a negative impact on our business. The occurrence of any of the foregoing could have a material adverse effect on our financial results, business and prospects.
We have an evolving business model, which increases the complexity of our business.
We are modifying and expanding the types of products and services offered for sale on our websites, may further expand offerings in the future, and we do not know whether any of our modifications or expansions will be successful. From time to time, we have also modified aspects of our business model relating to our product mix and the mix of direct versus partner sourcing of the products offered for sale. Products purchased for direct sale come with additional risks and uncertainties, including costs to maintain inventory, risk of loss from theft or otherwise, and risks associated with the marketing and labeling of products. In addition, we continue to experiment with new technologies to enhance the customer experience and iterate on delivery of new features. The additions and modifications to our business have increased the complexity of our business and have impacted, and may in the future materially impact, our management, personnel, operations, systems, technical performance, financial resources, and internal control and reporting functions. Further, our efforts to right-size our cost structure and create a more flexible technology stack may result in the introduction of technologies that are less mature or stable, which could cause problems in our website or back-end logistics systems or compliance efforts. Further, any new business, products or services, technology, or website we launch that is not favorably received by consumers could damage our reputation and our brand. The occurrence of any of the foregoing could have a material adverse effect on our financial results, business, prospects, and the trading prices of our securities.
Investment in new business strategies, acquisitions, dispositions, partnerships, or other transactions could disrupt our ongoing business, present risks not originally contemplated and materially adversely affect our business, reputation, results of operations and financial condition.
We have invested, and in the future may invest, in new business strategies, acquisitions, dispositions, partnerships, or other transactions. We intend for these initiatives to drive efficiencies and improve margins. Such endeavors may involve significant risks and uncertainties, including distraction of management from current operations, greater-than-expected liabilities and expenses, new claims or litigation, economic, political, legal and regulatory challenges associated with operating in new businesses, regions or countries, inadequate return on capital, unrealized benefits or unanticipated delays in realized benefits, potential impairment of tangible and intangible assets, and significant write-offs. Investment, acquisition, disposition and partnership transactions are exposed to additional risks, including the imposition of onerous conditions that could delay or prevent us from completing a transaction or otherwise limit our ability to fully realize the anticipated benefits of a transaction. Rapid, significant, and disruptive technological changes impact the industries in which we operate or in which we may in the future operate, including in areas such as tokenization, virtual currencies or cryptocurrencies, blockchain technologies, and the success of new business strategies, acquisitions, dispositions, partnerships, or other transactions will depend, in part, on our ability to adapt and respond effectively to these changes. In addition, any new investments or acquisitions may require us to raise additional capital, including debt or equity securities. These transactions may impose additional restrictions on our ability to operate and/or may be dilutive to you. In the event that additional liquidity is required from outside sources, we may not be able to raise the capital on terms acceptable to us or at all. If we are unable to raise additional capital when desired, our business, financial condition, and results of operations could be adversely affected.
These new ventures are inherently risky and may not be successful. If we do not successfully manage and execute these initiatives, or if they are inadequate or ineffective, we may fail to meet our financial goals and achieve anticipated benefits, improvements may be delayed, not sustained or not realized, and our business, operations and competitive position could be adversely affected.
If Pelion is not successful in managing the Medici Ventures, L.P. fund or has to resign if there is a change in the interpretation or application of the Investment Advisers Act of 1940 (the "Advisers Act"), we would be unable to realize the anticipated benefits of this arrangement.
As the general partner of the Medici Ventures, L.P. fund, Pelion has control over the limited partnership and its activities, including day-to-day operations and investment decisions. Pelion is able to sell investments of the limited partnership at any time, make additional investments, modify, amend or change existing investments, make new investments and otherwise control the activities of the limited partnership.
The success of the Medici Ventures, L.P. fund depends on Pelion's ability to successfully manage the activities of the Medici Ventures, L.P. fund portfolio companies and its existing and future portfolio company investments. Pelion may not be successful in managing these investments and we may not receive the benefits we anticipate of the transaction with Pelion. Moreover, even if successful in managing the Partnership, Pelion has the right to withdraw as general partner under certain circumstances, including certain changes in Pelion's status under the Advisers Act. The occurrence of such an event is beyond
our control, and, as a result, there can be no assurance that Pelion will remain as general partner for the term contemplated. If Pelion is no longer serving as the general partner, we will have the right under the partnership agreement to appoint a new general partner; however, it may not be possible to accomplish this in a timely manner, which could result in the termination of the partnership. Even if a new general partner is appointed in a timely manner, it may be unable to manage the activities of the Medici Ventures, L.P. fund and its portfolio company investments, which would prevent us from receiving the anticipated benefits of the partnership.
Our international business efforts could adversely affect us.
We sell products in international markets and are seeking to expand our international sales. International sales and transactions are subject to inherent risks and challenges that could adversely affect us, including:
•the need to develop new supplier and manufacturer relationships and create new logistics capabilities;
•the need to comply with additional U.S. and foreign laws and regulations;
•changes in international laws, regulatory requirements, taxes and tariffs;
•our limited experience with different local cultures and standards;
•geopolitical events, such as war and terrorist attacks;
•the risk that the products we offer may not appeal to customers in international markets, whether due to the products themselves, the time to deliver, a lack of brand recognition, or another reason; and
•the additional resources and management attention required for such expansion.
Our international business operations could expose us to penalties for non-compliance with laws applicable to international business and trade, including the U.S. Foreign Corrupt Practices Act, which could have a material adverse effect on our business. Foreign data protection, privacy and other laws and regulations are different and often more restrictive than those in the United States. Compliance with such laws and regulations will result in additional costs and may necessitate changes to our business practices, which may adversely affect our business. A lack of brand recognition, increased costs associated with shipping products cross-border, increased times to deliver products to customers, or other matters that may reduce customer demand, could adversely affect our business. To the extent that we make purchases or sales denominated in foreign currencies, we are subject to foreign currency risks, which could have a material adverse effect on our financial results, business and prospects.
We have entered into license agreements granting certain third parties the right to use certain of our trademarks, which could damage our brand and reputation.
We have entered into license agreements with several third parties, pursuant to which we have authorized these licensees to use certain of our trademarks on certain products and certain store locations. Any failure of these third parties to deliver products at of reasonably comparable quality and price to the products we offer in connection with these trademarks, to offer good customer experiences consistent with our brands, or any breach of our licensing agreements by a licensee could negatively impact our objectives, consistency with our brands, could have a material adverse effect on our financial results, business and prospects.
Risks Relating to Our Common Stock
The trading price of our common stock may be adversely affected by short-selling activities involving our common stock.
The trading price of our common stock has been and may continue to be volatile. Our stock price fluctuations may be due in part to short-selling activity related to our common stock. Short selling is the practice of selling securities that the seller does not own, but rather has borrowed or intends to borrow from a third party with the intention of buying identical securities at a later date to return to the lender. A short seller hopes to profit from a decline in the value of the securities between the sale of the borrowed securities and the purchase of the replacement shares, as the short seller expects to pay less in that purchase than it received in the sale. It is therefore in the short seller’s interest for the price of the stock to decline, and some short sellers publish, or arrange for the publication of, opinions or characterizations regarding the relevant issuer, often involving misrepresentations of the issuer’s business prospects and similar matters calculated to create negative market momentum, which may permit them to obtain profits for themselves as a result of selling the stock short.
As a public entity, we may be the subject of concerted efforts by short sellers to spread negative information in order to gain a market advantage. The practice of short-selling activity may adversely affect our common stock price, which in turn could adversely affect our ability to raise capital and could have a material adverse effect on our financial results, business and
prospects. In addition, the publication of misinformation may also result in further lawsuits, the uncertainty and expense of which could adversely impact our business, financial condition, and reputation. There are no assurances that we will not face short sellers’ efforts or similar tactics, and the market price of our common stock may decline as a result of their actions.
Significant fluctuations in our quarterly operating results may adversely affect the market prices of our common stock, and you may lose all or a part of your investment.
Our revenues and operating results have varied in the past and may continue to vary significantly from quarter to quarter due to a number of factors, many of which are outside our control. In addition to the other risk factors described in this report, factors that have caused and/or could cause our quarterly operating results to fluctuate and in turn affect the market prices of our common stock include:
•increases in the cost of advertising and changes in our sales and marketing expenditures;
•our inability to attract new customers and retain existing customers or encourage repeat purchases;
•the extent to which our existing and future marketing campaigns are successful;
•price competition, particularly in the costs of marketing and product pricing;
•the amount and timing of operating costs and capital expenditures;
•the amount and timing of our purchases of inventory;
•our inability to manage distribution operations or provide adequate levels of customer service;
•increases in the cost of fuel, transportation or distribution;
•our inability to implement technology changes or integrate operations and technologies from acquisitions or other business combinations;
•our efforts to offer new lines of products and services;
•our inability to attract users to our website;
•macroeconomic and geopolitical factors; and
•losses associated with our equity method investments.
Any of the foregoing could have a material adverse effect on our financial results and business and our ability to raise capital and could have a material adverse effect on the holders of our common stock.
Future sales or other distributions of our stock may depress our stock price or subject us to limitations on our ability to use our net operating and tax credit carryforwards.
Sales or other distributions of a substantial number of shares of our common stock, in the public market or otherwise, by us or by a significant stockholder, have in the past and could in the future, depress the trading price of our common stock and impair our ability to raise capital through the sale of additional equity securities. The transfer of ownership of a significant portion of our outstanding shares of stock in the public market or otherwise, by us or by a significant stockholder, within a rolling three-year period could adversely affect our ability to use our net operating losses and tax credit carryforwards to offset future taxable net income.
In addition, we may issue additional shares of our common or preferred stock from time to time in the future in amounts that may be significant. We have sold common stock including under our "at the market" sales agreement and in follow-on underwritten offerings in the past and may do so in the future. We also previously issued a class of preferred stock that was publicly traded and may in the future issue preferred stock that is publicly traded. The sale of substantial amounts of our common or any preferred stock, by us or a significant stockholder, or the perception that these sales may occur, could adversely affect the trading prices of our securities.
Anti-takeover provisions contained in our amended and restated certificate of incorporation and amended and restated bylaws, and provisions of Delaware law, could impair a takeover attempt.
Our amended and restated certificate of incorporation, amended and restated bylaws and Delaware law contain provisions which could have the effect of rendering more difficult, delaying, or preventing an acquisition deemed undesirable by our Board of Directors. Among other things, our amended and restated certificate of incorporation and amended and restated bylaws include provisions:
•limiting the ability of our stockholders to call and bring business before special meetings;
•only permitting the Board of Directors to fix the number of directors and to fill vacancies;
•prohibiting cumulative voting in the election of directors;
•prohibit stockholder action by written consent, which requires all stockholder actions to be taken at a meeting of our stockholders;
•requiring advance notice of stockholder proposals for business to be conducted at meetings of our stockholders and for nominations of candidates for election to our Board of Directors; and
•designating a state court located in the State of Delaware as the sole and exclusive forum for specified matters.
These provisions, alone or together, could delay or prevent hostile takeovers and changes in control or changes in our management.
Any provision of our amended and restated certificate of incorporation, amended and restated bylaws or Delaware law that has the effect of delaying, preventing or deterring a change in control could limit the opportunity for our stockholders to receive a premium for their shares of our common stock or other securities and could also affect the price that some investors are willing to pay for our common stock or other securities.
We are subject to rules and regulations established from time to time by the SEC and the NYSE regarding our internal control over financial reporting. If we fail to establish and maintain effective internal control over financial reporting and disclosure controls and procedures, we may not be able to accurately report our financial results, or report them in a timely manner.
We are subject to the rules and regulations established from time to time by the SEC and the New York Stock Exchange (the "NYSE"). These rules and regulations require, among other things, that we establish and periodically evaluate procedures with respect to our internal control over financial reporting. For example, we are required to assess the effectiveness of our internal control over financial reporting pursuant to Section 404 of the Sarbanes-Oxley Act of 2002 (the "Sarbanes-Oxley Act"). Such reporting obligations place a considerable strain on our financial and management systems, processes and controls, as well as on our personnel.
If we identify material weaknesses in our internal control over financial reporting or if we are unable to comply with the requirements applicable to us as a public company, in a timely manner, including the requirements of Section 404 of the Sarbanes-Oxley Act, we may be unable to accurately report our financial results, or report them within the timeframes required by the SEC. We could also become subject to sanctions or investigations by the SEC or other regulatory authorities. In addition, if we are unable to assert that our internal control over financial reporting is effective, or if our independent registered public accounting firm is unable to express an opinion as to the effectiveness of our internal control over financial reporting, when required, investors may lose confidence in the accuracy and completeness of our financial reports, we may face restricted access to the capital markets, and our stock price may be adversely affected.
We are subject to the risk of possibly becoming an investment company under the Investment Company Act.
The Investment Company Act regulates certain companies that invest in, hold or trade securities. Primarily as a result of a portion of our assets consisting of indirectly-held minority investment positions through the Medici Ventures, L.P. fund, we are subject to the risk of inadvertently becoming an investment company. Because registration under the Investment Company Act would make it impractical for us to operate our business, we need to avoid becoming subject to the registration requirements of the Investment Company Act. To do so, we may structure transactions in a less advantageous manner than if we did not have Investment Company Act concerns, or we may avoid otherwise economically desirable transactions and/or strategic initiatives due to those concerns. In addition, events beyond our control, including significant appreciation or depreciation in the value of certain of our holdings or adverse developments with respect to our ownership of certain of our subsidiaries, could result in us inadvertently becoming an investment company. If it were established that we were an investment company, there would be a risk, among other material adverse consequences, that we could become subject to monetary penalties or injunctive relief, or both, in an action brought by the SEC, that we would be unable to enforce contracts with third parties or that third parties could seek to obtain rescission of transactions with us undertaken during the period it was established that we were an unregistered investment company. If it were established that we were an investment company, it would have a material adverse effect on our business and financial operations and our ability to continue our business.
If securities analysts do not continue to publish research or reports about our business or if they downgrade our stock or our sector, or if there is any fluctuation in our credit rating, our stock price and trading volume could decline.
The trading market for common stock relies in part on the research and reports that industry or financial analysts publish about us or our business. We do not control these analysts. Securities and industry analysts may not publish research about us. If securities or industry analysts do not continue coverage of us, the trading price of our common stock would likely be negatively impacted. Furthermore, if one or more of the analysts who do cover us downgrade our stock or our industry, or the stock of any of our competitors, or publish inaccurate or unfavorable research about our business, the price of our stock could decline. If one or more of these analysts stops covering us or fails to publish reports on us regularly, we could lose visibility in the market, which in turn could cause our stock price or trading volume to decline.
Additionally, any fluctuation in the credit rating of us or our subsidiaries may impact our ability to access debt markets in the future or increase our cost of future debt which could have a material adverse effect on our operations and financial condition, which in return may adversely affect the trading price of shares of our common stock.
ITEM 1B. UNRESOLVED STAFF COMMENTS
None.
ITEM 1C. CYBERSECURITY
Cybersecurity Risk Management and Strategy
Our company recognizes the critical importance of cybersecurity in our digital operations and has established a risk management program to address both internal and external cybersecurity threats. This program, guided by industry frameworks like NIST CSF and overseen by experienced leadership teams, integrates advanced security tools and practices into our broader enterprise risk management system, actively involving our Executive team and Board of Directors (the "Board") in its oversight. This does not imply that we meet any particular technical standards, specifications, or requirements, only that we use NIST CSF and similar frameworks as a guide to help us identify, assess, and manage cybersecurity risks relevant to our business.
Despite our efforts and resource allocation, we acknowledge the challenges posed by the evolving nature of cyber threats and the limitations in fully mitigating these risks. We have not observed any significant impacts from known cybersecurity threats, including as a result of any previous cybersecurity incidents, that have materially affected our operational results and strategic or financial condition. Criteria used to determine the materiality of an incident includes, but is not limited to, evaluating the scope, nature, type, systems, data, operational impact, and pervasiveness of the incident. Materiality also considers both quantitative and qualitative factors in determining impact. Nevertheless, given the unpredictable nature of cyber threats, we cannot assure that potential future impacts will not have a material impact. See "Risk Factors – If we or our third-party providers experience cyberattacks or data security incidents, there may be damage to our brand and reputation, material financial penalties, and legal liability, which would materially adversely affect our business, results of operations, and financial condition."
Key elements of our cybersecurity risk management program include, but are not limited to, the following:
•risk assessments designed to help identify material risks from cybersecurity threats to our critical systems and information;
•a security team principally responsible for managing (1) our cybersecurity risk assessment processes, (2) our security controls, and (3) our response to cybersecurity incidents;
•the use of external service providers, where appropriate, to assess, test or otherwise assist with aspects of our security processes;
•cybersecurity awareness training of our employees, including incident response personnel and senior management;
•a cybersecurity incident response plan that includes procedures for responding to cybersecurity incidents; and
•a third-party risk management process for key service providers based on our assessment of their criticality to our operations and respective risk profile.
Cybersecurity Governance
Our Board of Directors oversees the organization's preparedness for cyber threats as part of its risk oversight function. This involves working to understand our risk profile, reviewing our cybersecurity processes, and maintaining an incident response plan. The Board strives to engage in active participation in continuous cybersecurity strategy improvement. In March 2023, the Board enhanced its cybersecurity expertise with the addition of Joanna Burkey. Ms. Burkey has an extensive cybersecurity background and has served as Chief Information Security Officer (CISO) at both HP and Siemens.
The Audit Committee, designated as the responsible body for risk management and compliance oversight, endeavors to ensures information flow of risk by regularly reporting its activities to the Board, including those related to cybersecurity. Our cybersecurity program is led by our Chief Information Security Officer (CISO), who has over 20 years of experience in the cybersecurity field, and who is primarily responsible for assessing and managing material risks from cybersecurity threats. Their expertise is supported by industry certifications, regular participation in leading advanced training programs, and advisement roles. The CISO leads a dedicated team of security professionals who provide coverage of critical program capabilities. Our CISO and larger cybersecurity risk management team take steps to stay informed about and monitor efforts to prevent, detect, mitigate, and remediate cybersecurity risks and incidents through various means, which may include briefings from internal security personnel; threat intelligence and other information obtained from governmental, public or private
sources, including external consultants engaged by us; and alerts and reports produced by security tools deployed in our IT environment.
Our CISO provides regular reports to the Audit and Technology Committees, senior management, and relevant stakeholders, for the purpose of keeping them informed on evolving cyber threats, ongoing assessments, and any significant findings. This collaborative approach is intended to support informed decision-making, and timely response to potential risks, safeguarding our critical assets and valuable information.
ITEM 2. PROPERTIES
We lease various properties in the United States and internationally. We use our properties for corporate office space, data centers, and warehouse and fulfillment space. As of December 31, 2024, we operated the following facilities (square feet in thousands):
| | | | | | | | | | | | | | | | | | | | |
| | | United States | | International | | Total |
| | | | | | |
| Leased facilities | | 442 | | | 13 | | | 455 | |
| | | | | | |
On December 20, 2024, we consummated the sale of our corporate headquarters located at 799 West Coliseum Way, Midvale, Utah to Salt Lake County, a body corporate and politic of the State of Utah. The transaction included an 18.6 acre parcel of land with improvements including the corporate headquarters building, and the sales price was $52.0 million.
As part of the sale, we negotiated a lease agreement with the buyer that allows us to continue to occupy and use the headquarters' data center, comprising approximately 5,000 square feet within the main building at the headquarters, and permit the data center to continue to be served by the existing building generators. Among other terms, this data center lease has an initial term of five years, subject to our right to terminate upon providing 30 days' notice to the buyer.
ITEM 3. LEGAL PROCEEDINGS
From time to time, we are involved in, or become subject to litigation or other legal proceedings concerning consumer protection, employment, privacy, intellectual property, claims under the securities laws, and other commercial matters related to the conduct and operation of our business and the sale of products on our Website. We also prosecute lawsuits to enforce our legal rights. In connection with such litigation or other legal proceedings, we have been in the past and we may be in the future subject to equitable remedies relating to the operation of our business or judgments requiring us to pay significant damages or associated costs. Such litigation could be costly and time consuming and could divert or distract our management and key personnel from our business operations. Due to the uncertainty of litigation and depending on the amount and the timing, an unfavorable resolution of some or all of such matters could materially affect our business, results of operations, financial position, or cash flows. For additional details, see the information set forth under Item 8 of Part II, "Financial Statements and Supplementary Data"—Note 15—Commitments and Contingencies, subheading Legal Proceedings and Contingencies, contained in the "Notes to Consolidated Financial Statements" of this Annual Report on Form 10-K, which is incorporated by reference in answer to this Item.
ITEM 4. MINE SAFETY DISCLOSURES
Not applicable.
PART II
ITEM 5. MARKET FOR REGISTRANT'S COMMON EQUITY, RELATED STOCKHOLDER MATTERS AND ISSUER PURCHASES OF EQUITY SECURITIES
Market information
The principal U.S. trading market for our common stock is the New York Stock Exchange. Our common stock is traded under the symbol "BYON."
Holders
As of February 21, 2025, there were 387 holders of record of our common stock. Many of our shares of common stock are held by brokers and other institutions on behalf of the beneficial owners.
Dividends
We have never declared or paid any cash dividends on our common stock. We currently intend to retain any earnings for future growth and do not anticipate paying any cash dividends on our common stock in the foreseeable future. Any future determination to pay any dividends on our common stock will be at the discretion of our Board of Directors and will depend on our results of operations, financial conditions, contractual and legal restrictions and other factors the Board of Directors deems relevant.
As discussed below under "—Preferred Stock Conversion," we converted all of our then-outstanding Series A-1 and Series B preferred stock into common stock on June 10, 2022, and did not pay a cash dividend prior to conversion in 2022. At December 31, 2024, 2023, and 2022, we had no preferred stock outstanding.
Recent sales of unregistered securities
None.
Issuer purchases of equity securities
See Note 17—Stockholders' Equity in the "Notes to Consolidated Financial Statements" included in Item 8 of Part II, "Financial Statements and Supplementary Data" of this Annual Report on Form 10-K for information regarding our authorized share repurchase program. There were no repurchases made during the three months ended December 31, 2024. As of December 31, 2024, the approximate dollar value of shares that may yet be purchased under the stock repurchase program is $69.9 million.
Preferred Stock Conversion
On May 12, 2022, Beyond stockholders voted to approve separate proposals to approve the amendment of the Company's Amended and Restated Certificate of Designation for both classes of its preferred stock to provide that each share of our Series A-1 and Series B preferred stock would be automatically converted into 0.90 of a share of our common stock (the "Conversion"). On June 10, 2022, in connection with the completion of the Conversion, the Company issued 4,097,697 shares of our common stock in exchange for the outstanding Series A-1 and Series B preferred stock on that date. As the fair value of our common stock issued exceeded the fair value of the Series A-1 and Series B preferred stock exchanged on the Conversion date, we recognized a non-cash deemed dividend to our preferred stockholders of $1.7 million due to the excess fair value per share compared to the conversion ratio. Following the Conversion, the Company eliminated the Series A-1 and Series B preferred stock class by filing Certificates of Elimination with the Delaware Secretary of State. The shares of preferred stock previously designated as Series A-1 and Series B preferred stock returned to the status of authorized and undesignated shares of preferred stock under our certificate of incorporation.
COMPARISON OF 5-YEAR CUMULATIVE TOTAL RETURN
The following graph shows a comparison of the cumulative total stockholder return on our common stock with the cumulative total returns of NYSE Composite TR, the S&P 500 Index, and the S&P Retail Select Index. The graph tracks the performance of a $100 investment in our common stock and in each of the indexes during the last five fiscal years ended December 31, 2024. Data for the NYSE Composite TR, the S&P 500 Index, and the S&P Retail Select Index assume reinvestment of dividends. Stockholder returns over the indicated period are based on historical data and should not be considered indicative of future stockholder returns. They do not necessarily reflect management's opinion that such indices are an appropriate measure of the relative performance of the stock involved, and they are not intended to forecast or be indicative of possible future performance of the Company's common stock.
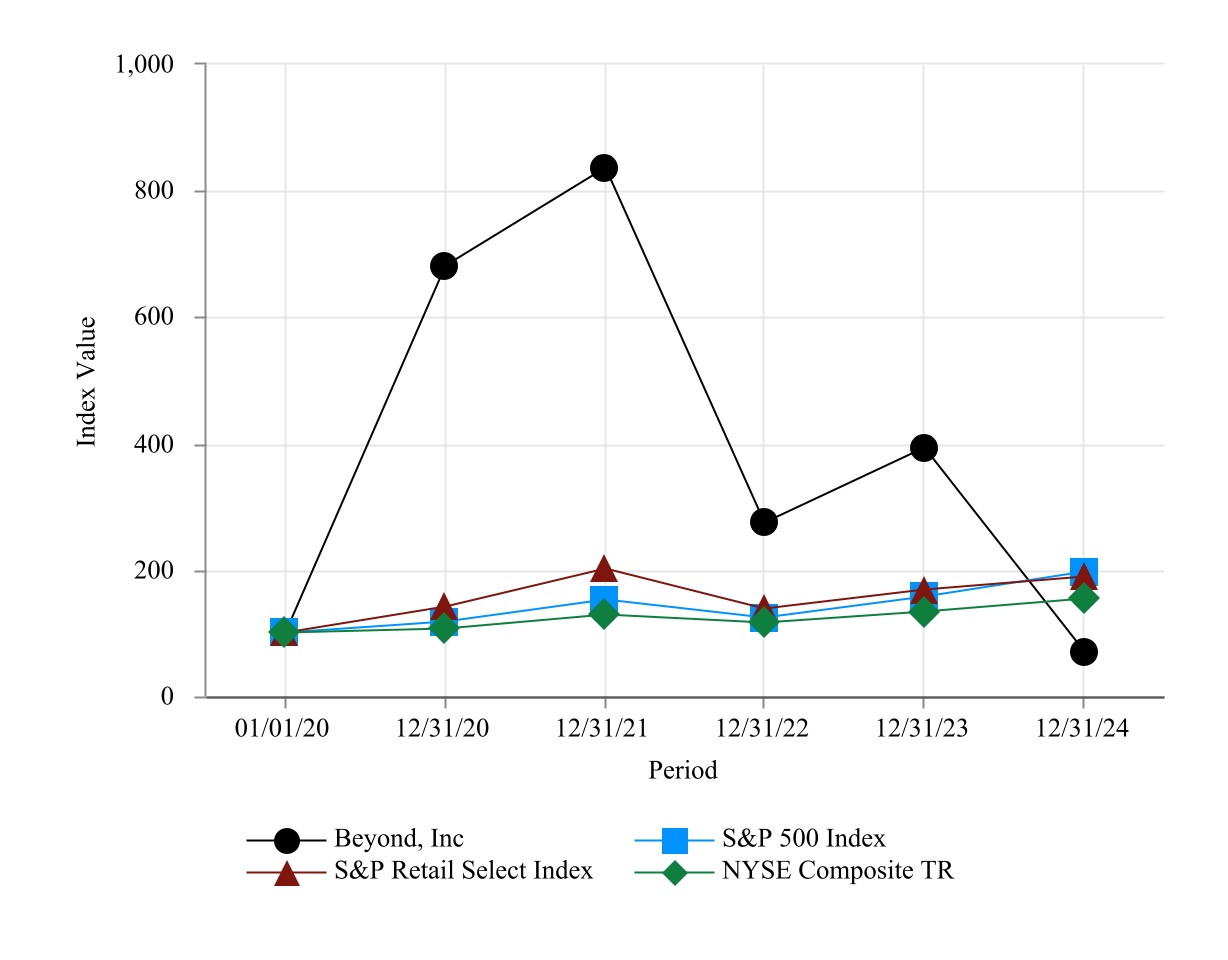
Prepared by Zacks Investment Research, Inc. Used with permission. All rights reserved. Copyright 1980-2025.
Index Data: Copyright Standard and Poor's, Inc. Used with permission. All rights reserved.
ITEM 6.
[Reserved.]
ITEM 7. MANAGEMENT'S DISCUSSION AND ANALYSIS OF FINANCIAL CONDITION AND RESULTS OF OPERATIONS
The following discussion and analysis contains forward-looking statements relating to future events or our future financial or operating performance that involve risks and uncertainties, as set forth above under "Special Cautionary Note Regarding Forward-Looking Statements." or in Item 1A under the heading "Risk Factors" or included elsewhere in this Annual Report on Form 10-K. In addition, our future results may be significantly different from our historical results.
Overview
We are an e-commerce affinity marketing company that owns or has ownership interests in various retail brands with the aim of offering a comprehensive array of products and services that enable its customers to unlock their homes' potential through its vast data cooperative. In addition, we also offer an increasing number of add-on services across our platforms, including warranties, shipping insurance, installation services, and access to home loans. We will also be expanding our global loyalty program, Beyond +, to encompass all affiliated entities across our cooperative in order to incentivize customer retention within our growing ecosystem. We currently own Overstock, Bed Bath & Beyond, and Zulily. As used herein, "Beyond," "the Company," "we," "our" and similar terms include Beyond, Inc. and its controlled subsidiaries, unless the context indicates otherwise.
Through our Bed Bath & Beyond brand, we aim to provide an extensive array of home-related products tailored specifically for our target customers - consumers who seek comprehensive support throughout their shopping journey, aspiring to discover quality, stylish products at competitive prices that align with their budget requirements. We regularly refresh our product assortment to reflect the evolving preferences of our customers and aim to stay aligned with current trends. The mission of this brand is to achieve category-leading ownership of four distinct rooms of the home: the bedroom, the bathroom, the kitchen, and the patio, and our goal is for our assortment to include not only core legacy categories like bedding and kitchenware, but also adjacent categories like bedroom and outdoor furniture and rugs. Leveraging an asset-light supply chain, we offer direct shipping to customers from both our suppliers and our leased warehouse.
Bed Bath & Beyond's strategic priorities include assortment curation to elevate product quality levels and improve ease of selection, as well as the addition of aspirational brands to elevate the curated shopping experience. Our goal is to elevate our website and customer engagement by fostering emotional connections, building trust, and delivering compelling, value-driven experiences.
Through our Overstock brand, we aim to provide a wide array of quality goods at discounted prices, and a treasure hunt-like experience for our target customers - consumers who are highly engaged, very accustomed to purchasing online, and actively seeking great deals. The mission of this brand is to delight our customers by offering them deals on products they will love. Our product assortment includes home categories such as indoor and outdoor furniture, rugs, décor, and lighting, as well as lifestyle categories such as jewelry and watches, apparel and accessories, sports and outdoor, and beauty and wellness.
Zulily's primary focus is attracting a loyal customer base with flash sales on women's, children's, and men's apparel, footwear, beauty, and wellness. The Zulily acquisition has provided the opportunity to expand our customer base with a younger demographic that shops more frequently with us than our other Beyond brands. Our marketing mix is also diversified and favors a social-first approach that is less reliant on search engine marketing.
Executive Commentary
This executive commentary is intended to provide investors with a view of our business through the eyes of our management. As an executive commentary, it necessarily focuses on selected aspects of our business. This executive commentary is intended as a supplement to, but not a substitute for, the more detailed discussion of our business included elsewhere herein. Investors are cautioned to read our entire "Management's Discussion and Analysis of Financial Condition and Results of Operations," and our interim and audited financial statements, and the discussion of our business and risk factors and other information included elsewhere or incorporated in this report. This executive commentary includes forward-looking statements, and investors are cautioned to read "Special Cautionary Note Regarding Forward-Looking Statements."
Our cash and cash equivalents balance decreased from $302.6 million as of December 31, 2023 to $159.2 million as of December 31, 2024, a decrease of $143.4 million, primarily as the result of net cash outflows from operating activities of $174.3 million, payments on long-term debt of $34.8 million, disbursement for Kirkland's notes receivable of $17.0 million, and expenditures for property and equipment of $14.3 million; offset by $51.4 million in proceeds from the sale of our corporate headquarters and $43.0 million in net proceeds from the sales of our common stock pursuant to our "at-the-market" public offering, net of offering costs.
Revenue decreased 11% in 2024 compared to 2023. This decrease was primarily due to an 8% decrease in orders delivered and a 3% decrease in average order value. The decrease in orders delivered was driven by a decline in website visits and conversion influenced in part by a shift in consumer spending preferences and macroeconomic factors impacting consumer sentiment. The decrease in average order value was largely driven by orders mixing into categories with lower average unit retail price.
Gross profit decreased 21% in 2024 compared to 2023 primarily due to a decrease in gross margin. Gross margin decreased to 20.8% in 2024, compared to 23.4% in 2023, primarily due to increased promotional discounting, increased carrier costs, and decreased marketing allowance.
Sales and marketing expenses as a percentage of revenue increased to 17.1% in 2024 compared to 14.4% in 2023, primarily due to increased performance marketing expense and brand advertising.
Technology expenses decreased $2.6 million in 2024 compared to 2023, primarily due to a reduction in staff-related expenses, partially offset by one-time restructuring costs.
General and administrative expenses decreased $16.0 million in 2024 compared to 2023, primarily due to a reduction in staff-related and third-party expenses, partially offset by one-time restructuring costs.
Customer service and merchant fees increased $1.6 million in 2024 compared to 2023, primarily due to normalized service capacity in 2024 after understaffing in the second half of 2023, partially offset by decreased credit card costs driven by a decrease in order volume.
Additional commentary related to macroeconomic trends
We continue to monitor recent macroeconomic trends and geopolitical events, including, without limitation, tariffs, bans, or other measures or events that increase the effective price of products, higher interest rates, inflation, and existing and future laws and regulations, directives (including executive orders). These events have and may continue to negatively impact consumer confidence and consumer spending which have and may continue to adversely affect our business and our results of operations. Due to the uncertain and constantly evolving nature and volatility of these trends and events, we cannot currently predict their long-term impact on our operations and financial results. Nevertheless, as of December 31, 2024, the challenges arising from these events have not adversely affected our liquidity or capacity to service our debt, nor have these conditions required us to reduce our capital expenditures.
Liquidity and Capital Resources
Overview
We believe that our cash and cash equivalents currently on hand and expected cash flows from future operations will be sufficient to continue operations for at least the next twelve months. We continue to monitor, evaluate, and manage our operating plans, forecasts, and liquidity considering the most recent developments driven by macroeconomic conditions, such as supply chain challenges, inflation, rising interest rates, tariffs, bans, or other measures or events that increase the effective price of products, and other geopolitical events. We proactively seek opportunities to improve the efficiency of our operations and have in the past and may in the future take steps to realize internal cost savings, including aligning our staffing needs, creating a more variable cost structure to better support our current and expected future levels of operations and process streamlining.
We periodically evaluate opportunities to repurchase our equity securities, obtain credit facilities, or issue additional debt or equity securities, which may impact our future operations and liquidity. In addition, we may, from time to time, consider the investment in, or acquisition of, complementary businesses, products, services, or technologies to expand our business, any of which might affect our liquidity requirements or cause us to issue additional debt or equity securities that would be dilutive to stockholders.
Our future capital requirements will depend on many factors, including, but not limited to, our growth, our ability to execute on our business strategy, our ability to realize the benefits of any investment in new business strategies, acquisitions, or other transactions, and consumer sentiment towards our offerings. In the event that additional liquidity is required from outside sources, we may not be able to raise the capital on terms acceptable to us or at all. If we are unable to raise additional capital when desired, our business, financial condition, and results of operations could be adversely affected.
Current sources of liquidity
Our principal sources of liquidity are existing cash and cash equivalents, and accounts receivable, net. At December 31, 2024, we had cash and cash equivalents of $159.2 million and accounts receivable, net of allowance for credit losses of $15.8 million.
Cash flow information is as follows (in thousands):
| | | | | | | | | | | |
| | Year ended December 31, |
| | 2024 | | 2023 |
| Cash provided by (used in): | | | |
| Operating activities | $ | (174,304) | | | $ | (18,586) | |
| Investing activities | 24,926 | | | (44,630) | |
| Financing activities | 32,722 | | | (5,492) | |
On June 10, 2024, we entered into a Capital on DemandTM Sales Agreement (the "Sales Agreement") with JonesTrading Institutional Services LLC ("JonesTrading"), under which we from time to time conduct "at the market" public offerings of our common stock. Under the Sales Agreement, JonesTrading, acting as our agent, may offer our common stock in the market on a daily basis or otherwise as we request from time to time. As of December 31, 2024, we had $156.1 million remaining available under our "at the market" sales program. We have no obligation to sell additional shares under the Sales Agreement, but we may do so from time to time. Under the agreement, we will pay JonesTrading up to a 2% sales commission on all sales. For the year ended December 31, 2024, we sold 7,002,375 shares of our common stock pursuant to the Sales Agreement and have recognized $43.0 million in proceeds, net of $879,000 of offering costs, including commissions paid to JonesTrading.
Future liquidity commitments
In October 2024, we entered into a strategic business relationship with Kirkland's Stores, Inc. in which we provided $17.0 million in debt financing, including an $8.5 million convertible promissory note and an $8.5 million non-convertible promissory note. On February 5, 2025, Kirkland's stockholders approved and we funded our additional commitment of $8.0 million in exchange for Kirkland's common stock.
In January 2025, we entered into an asset purchase agreement with BBBY Acquisition Co. LLC to acquire the rights of the Buy Buy Baby brand, as well as assets, information and content related to the associated Buy Buy Baby website for a total purchase price of $5.0 million payable at the closing of the transaction following a due diligence period. We funded the transaction in February 2025.
Operating activities
Cash received from customers generally corresponds to our net revenue as our customers primarily use credit cards to buy from us, causing our receivables from these sales transactions to settle quickly. Our payment terms with our partners generally extend beyond the amount of time necessary to collect proceeds from our customers.
The $174.3 million of net cash used by operating activities during the year ended December 31, 2024 was primarily due to loss from operating activities, adjusted for non-cash items of $143.5 million and cash used by changes in operating assets and liabilities of $30.8 million.
The $18.6 million of net cash used by operating activities during the year ended December 31, 2023 was primarily due to loss from operating activities, adjusted for non-cash items, of $60.1 million, offset by cash provided by changes in operating assets and liabilities of $41.5 million.
Investing activities
The $24.9 million of net cash provided by investing activities during the year ended December 31, 2024 was primarily due to proceeds from the sale of our corporate headquarters of $51.4 million and proceeds received from the sale of the Wamsutta trademark of $10.3 million, offset by disbursement for Kirkland's notes receivable of $17.0 million, expenditures for property and equipment of $14.3 million, and purchases of intangible assets of $6.0 million.
The $44.6 million of net cash used in investing activities during the year ended December 31, 2023 was primarily due to purchases of intangible assets of $25.8 million related to Bed Bath & Beyond and expenditures for property and equipment of $19.2 million.
Financing activities
The $32.7 million of net cash provided by financing activities during the year ended December 31, 2024 was primarily due to net proceeds from the sales of our common stock pursuant to our "at the market" public offering, net of offering costs of $43.0 million and proceeds from our revolving line of credit of $25.0 million, offset by payments on our long-term debt in conjunction with the sale of our corporate headquarters of $34.8 million and payment of taxes withheld upon vesting of employee stock awards of $3.3 million.
The $5.5 million of net cash used in financing activities during the year ended December 31, 2023 was primarily due to payments of taxes withheld upon vesting of employee stock awards of $3.8 million and payments on long-term debt of $3.6 million.
Contractual Obligations and Commitments
The following table summarizes our contractual obligations as of December 31, 2024 and the effect such obligations and commitments are expected to have on our liquidity and cash flow in future periods (in thousands):
| | | | | | | | | | | | | | | | | | | | | | | | | | | | | | | | |
| | | Payments due by period |
| Contractual Obligations | | Total | | Less than 1 year | | 1-3 years | | 3-5 years | | More than 5 years |
| Operating leases (1) | | $ | 9,813 | | | $ | 1,749 | | | $ | 2,368 | | | $ | 2,199 | | | $ | 3,497 | |
| | | | | | | | | | |
| | | | | | | | | | |
| | | | | | | | | | |
| | | | | | | | | | |
| | | | | | | | | | |
___________________________________________
(1) Represents the future minimum lease payments under non-cancellable operating leases. For information regarding our operating lease obligations, see Item 8 of Part II, "Financial Statements and Supplementary Data"—Note 13—Leases contained in the "Notes to Consolidated Financial Statements" of this Annual Report on Form 10-K.
Tax contingencies
We are involved in various tax matters, the outcomes of which are uncertain. As of December 31, 2024, and 2023, tax contingencies were $3.7 million for both periods presented, which are included in our reconciliation of unrecognized tax benefits (see Item 8 of Part II, "Financial Statements and Supplementary Data"—Note 23—Income Taxes contained in the "Notes to Consolidated Financial Statements" of this Annual Report on Form 10-K). Changes in federal, foreign, state, and local tax laws may increase our tax contingencies. The timing of the resolution of income tax contingencies is highly uncertain, and the amounts ultimately paid, if any, upon resolution of issues raised by the taxing authorities may differ from the amounts accrued. It is reasonably possible that within the next 12 months we will receive additional assessments by various tax authorities. These assessments may or may not result in changes to our contingencies related to positions on prior years' tax filings.
Borrowings
In March 2020, we entered into two loan agreements. The loan agreements provided for a $34.5 million Senior Note and a $13.0 million Mezzanine Note. In January 2024, we repaid the entire balance under the Mezzanine Note, and in December 2024, in connection with the sale of our corporate headquarters, repaid the remaining $34.5 million balance under the Senior Note. For additional information, please see Item 8 of Part II, "Financial Statements and Supplementary Data"—Note 12—Borrowings contained in the "Notes to Consolidated Financial Statements" of this Annual Report on Form 10-K
In October 2024, we entered into a Loan and Security Agreement (the "Loan Agreement") with BMO Bank N.A. (in such capacity, "BMO"), pursuant to which BMO agreed to lend us up to $25.0 million on a one-year revolving line of credit to aid us in securing strategic ventures. In connection with the Loan Agreement, BMO issued a revolving line of credit promissory note (the "Revolving Note") and granted a lien on the cash collateral account specified in the Loan Agreement (the "Cash Collateral Account"). The revolving line of credit bears interest on the unpaid principal balance at an annual rate equal to the Secured Overnight Financing Rate, or SOFR rate, for a one-month interest period plus 1.00%, established by the Federal Reserve Bank of New York. We are obligated to pay certain commitment fees on undrawn amounts under the Loan Agreement in amounts specified in the Loan Agreement. The Loan Agreement and Revolving Note will terminate on October 18, 2025 and loans thereunder may be borrowed, repaid, and reborrowed up to such date.
Results of Operations
Our Annual Report on Form 10-K for the year ended December 31, 2023, filed on February 23, 2024, includes a discussion and analysis of our year-over-year changes, financial condition, and results of operations for the years ended December 31, 2023 and 2022 in Item 7 of Part II, "Management's Discussion and Analysis of Financial Condition and Results of Operations."
Net revenue, costs of goods sold, gross profit and gross margin
The following table summarizes our net revenue, costs of goods sold, gross profit and gross margin for the years ended December 31, 2024 and 2023 (in thousands):
| | | | | | | | | | | |
| | Year ended December 31, |
| 2024 | | 2023 |
| Net revenue | $ | 1,394,964 | | | $ | 1,561,122 | |
| Cost of goods sold (1) | | | |
| Product costs and other cost of goods sold | 1,104,800 | | | 1,195,093 | |
| | | |
| | | |
| Gross profit (1) | $ | 290,164 | | | $ | 366,029 | |
| Year-over-year percentage change | | | |
| Net revenue | (10.6) | % | | |
| | | |
| | | |
| | | |
| | | |
| Gross profit (1) | (20.7) | % | | |
| Percent of net revenue | | | |
| Cost of goods sold (1) | | | |
| Product costs and other cost of goods sold | 79.2 | % | | 76.6 | % |
| | | |
| | | |
| Gross margin (1) | 20.8 | % | | 23.4 | % |
___________________________________________
(1) In the first quarter of fiscal 2024, we changed our presentation for merchant fees associated with customer payments made by credit cards and other payment methods and customer service costs. Under the new presentation, we include such expenses in a separate line in operating expenses, labeled, "Customer service and merchant fees," whereas previously, these expenses were included in "Merchant fees, customer service, and other" as a component of Cost of goods sold. All periods presented have been adjusted to reflect this change in presentation. See Note 2—Accounting Policies and Supplemental Disclosures in the "Notes to Consolidated Financial Statements" included in Item 8 of Part II, "Financial Statements and Supplementary Data" of this Annual Report on Form 10-K.
The 11% decrease in net revenue for the year ended December 31, 2024, as compared to the same period in 2023, was primarily due to an 8% decrease in orders delivered and a 3% decrease in average order value. The decrease in orders delivered was driven by a decline in website visits and conversion influenced in part by a shift in consumer spending preferences and macroeconomic factors impacting consumer sentiment. The decrease in average order value was largely driven by orders mixing into categories with lower average unit retail price.
Estimate of unearned product revenue on undelivered product
Our revenue related to merchandise sales is recognized upon delivery to our customers. As we ship high volumes of packages through multiple carriers, it is not practical for us to track the actual delivery date of each shipment. Therefore, we use estimates to determine which shipments are delivered and, therefore, recognized as revenue at the end of the period. Our delivery date estimates are based on average shipping transit times. We review and update our estimates on a quarterly basis based on our actual transit time experience. However, actual shipping times may differ from our estimates, which can be further impacted by uncertainty, volatility, and any disruption to our carriers caused by certain macroeconomic conditions, such as supply chain challenges, inflation, rising interest rates, climate and weather events, or geopolitical events.
The following table shows the effect that hypothetical changes in the estimate of average shipping transit times would have had on the reported amount of revenue and income before taxes (in thousands):
| | | | | | | | | | | |
| | Year Ended December 31, 2024 |
| Change in the Estimate of Average Transit Times (Days) | Increase (Decrease)
Revenue | | Increase (Decrease) Income Before Income Taxes |
| 2 | $ | (4,486) | | | $ | (613) | |
| 1 | $ | (2,387) | | | $ | (326) | |
| As reported | As reported | | As reported |
| (1) | $ | 3,653 | | | $ | 499 | |
| (2) | $ | 8,032 | | | $ | 1,098 | |
Gross profit and gross margin
Our overall gross margins fluctuate based on factors such as competitive pricing; discounting; product mix of sales; advertising revenue and our marketing allowance program; and operational and fulfillment costs which include costs incurred to operate and staff our warehouses, including rent and depreciation expense associated with these facilities, costs to receive, inspect, pick, and prepare customer order for delivery, and direct and indirect labor costs including payroll, payroll-related benefits, and stock-based compensation, all of which we include as costs in calculating gross margin.
In the first quarter of fiscal 2024, we changed our presentation for merchant fees associated with customer payments made by credit cards and other payment methods and customer service costs. Under the new presentation, we include such expenses in a separate line in operating expenses, labeled, "Customer service and merchant fees," whereas previously, these expenses were included in "Merchant fees, customer service, and other" as a component of Cost of goods sold. All periods presented have been adjusted to reflect this change in presentation. See Note 2—Accounting Policies and Supplemental Disclosures in the "Notes to Consolidated Financial Statements" included in Item 8 of Part II, "Financial Statements and Supplementary Data" of this Annual Report on Form 10-K.
Gross margins for the past eight quarterly periods and years ending December 31, 2024 and 2023 were:
| | | | | | | | | | | | | | | | | | | | | | | | | | | | | |
| Q1 | | Q2 | | Q3 | | Q4 | | FY |
| 2024 | 19.5 | % | | 20.1 | % | | 21.2 | % | | 23.0 | % | | 20.8 | % |
| 2023 | 26.7 | % | | 25.5 | % | | 22.2 | % | | 19.2 | % | | 23.4 | % |
Gross profit for the year ended December 31, 2024 decreased 21% compared to the same period in 2023, primarily due to a decrease in gross margin. Gross margin decreased to 20.8% for the year ended December 31, 2024, compared to 23.4% for the same period in 2023, primarily due to increased promotional discounting, increased carrier costs, and decreased marketing allowance.
Operating expenses
Sales and marketing expenses
We use a variety of online advertising channels to attract new and repeat customers, including search engine marketing, personalized emails, mobile app, loyalty program, affiliate marketing, display banners, and social media. We also build our brand awareness through linear and streaming TV advertising.
Costs associated with our discounted shipping and other promotions, such as coupons, are not included in sales and marketing expense. Rather, they are accounted for as a reduction in revenue as they reduce the amount of consideration we expect to receive in exchange for goods or services and therefore affect net revenues and gross margin. We consider these promotions to be an effective marketing tool.
The following table summarizes our sales and marketing expenses for the years ended December 31, 2024 and 2023 (in thousands):
| | | | | | | | | | | | | | | |
| | Year ended December 31, | | | | |
| | 2024 | | 2023 | | | | |
| Sales and marketing expenses | $ | 238,564 | | | $ | 224,547 | | | | | |
| Advertising expense included in sales and marketing expenses | 228,083 | | | 214,907 | | | | | |
| Year-over-year percentage change | | | | | | | |
| Sales and marketing expenses | 6.2 | % | | | | | | |
| Advertising expense included in sales and marketing expenses | 6.1 | % | | | | | | |
| Percentage of net revenue | | | | | | | |
| Sales and marketing expenses | 17.1 | % | | 14.4 | % | | | | |
| Advertising expense included in sales and marketing expenses | 16.4 | % | | 13.8 | % | | | | |
The 270 basis point increase in sales and marketing expenses as a percent of net revenues for the year ended December 31, 2024, as compared to the same period in 2023, was primarily due to increased performance marketing expense and brand advertising.
Technology expenses
We seek to deploy our capital resources efficiently in technology to support operations including private and public cloud, web services, customer support solutions, and product search, and in technology to enhance the customer experience, including machine learning algorithms, improving our process efficiency, modernizing and expanding our systems, and supporting and expanding our logistics infrastructure. We expect to continue to incur technology expenses to support these efforts and these expenditures may continue to be material.
The frequency and variety of cyberattacks on our Website, enterprise systems, services, and on third parties we use to support our technology continues to increase. The impact of such attacks, their costs, and the costs we incur to protect ourselves against future attacks, have not been material to date. However, we consider the risk introduced by cyberattacks to be serious and will continue to incur costs related to efforts to protect ourselves against them.
The following table summarizes our technology expenses for the years ended December 31, 2024 and 2023 (in thousands):
| | | | | | | | | | | | | | | |
| | Year ended December 31, | | | | |
| | 2024 | | 2023 | | | | |
| Technology expenses | $ | 114,584 | | | $ | 117,154 | | | | | |
| Year-over-year percentage change | | | | | | | |
| Technology expenses | (2.2) | % | | | | | | |
| Technology expenses as a percent of net revenue | 8.2 | % | | 7.5 | % | | | | |
The $2.6 million decrease in technology expenses for the year ended December 31, 2024, as compared to the same period in 2023, was primarily due to a reduction in staff-related expenses, partially offset by one-time restructuring costs.
General and administrative expenses
The following table summarizes our general and administrative expenses for the years ended December 31, 2024 and 2023 (in thousands):
| | | | | | | | | | | | | | | |
| | Year ended December 31, | | | | |
| | 2024 | | 2023 | | | | |
| General and administrative expenses | $ | 74,399 | | | $ | 90,410 | | | | | |
| Year-over-year percentage change | | | | | | | |
| General and administrative expenses | (17.7) | % | | | | | | |
| General and administrative expenses as a percent of net revenue | 5.3 | % | | 5.8 | % | | | | |
The $16.0 million decrease in general and administrative expenses for the year ended December 31, 2024, as compared to the same period in 2023, was primarily due to a reduction in staff-related and third-party expenses, partially offset by one-time restructuring costs.
Customer service and merchant fees
In the first quarter of fiscal 2024, we changed our presentation for merchant fees associated with customer payments made by credit cards and other payment methods and customer service costs. Under the new presentation, we include such expenses in a separate line in operating expenses, labeled, "Customer service and merchant fees," whereas previously, these expenses were included in "Merchant fees, customer service, and other" as a component of Cost of goods sold. All periods presented have been adjusted to reflect this change in presentation. See Note 2—Accounting Policies and Supplemental Disclosures in the "Notes to Consolidated Financial Statements" included in Item 8 of Part II, "Financial Statements and Supplementary Data" of this Annual Report on Form 10-K.
Customer service and merchant fees include customer service costs and merchant processing fees associated with customer payments made by credit cards and other payment methods and other variable fees. Customer service and merchant fees as a percent of revenue may vary due to several factors, such as our ability to effectively manage customer service and merchant fees.
The following table summarizes our customer service and merchant fees for the years ended December 31, 2024 and 2023 (in thousands):
| | | | | | | | | | | | | | | |
| | Year ended December 31, | | | | |
| | 2024 | | 2023 | | | | |
| Customer service and merchant fees | $ | 53,586 | | | $ | 52,023 | | | | | |
| Year-over-year percentage change | | | | | | | |
| Customer service and merchant fees | 3.0 | % | | | | | | |
| Customer service and merchant fees as a percent of net revenue | 3.8 | % | | 3.3 | % | | | | |
The $1.6 million increase in customer service and merchant fees for the year ended December 31, 2024 as compared to the same period in 2023, was primarily due to normalized service capacity in 2024 after understaffing in the second half of 2023, partially offset by decreased credit card costs driven by a decrease in order volume.
Non-operating income (expense)
Interest income, net
The $5.2 million decrease in interest income, net for the year ended December 31, 2024, as compared to the same period in 2023, was primarily due to a decrease in balance in our cash equivalents which resulted in less interest income earned.
Other expense, net
The $86.1 million decrease in other expense, net for the year ended December 31, 2024, as compared to the same period in 2023, was primarily due to a $62.7 million decrease in loss recognized from our equity method securities and a $22.5 million decrease in write-down of assets held for sale.
Income taxes
Our effective tax rate for the years ended December 31, 2024 and 2023 was (0.3)% and (15.7%), respectively. Our effective tax rate is affected by recurring items such as research tax credits and non-recurring items such as changes in valuation allowances. In addition, relative changes in expenses or losses for which tax benefits are limited or not recognized, fluctuations in our stock price, changes in laws, regulations, and administrative practices can impact our rate. Our effective tax rate is also affected to a lesser extent by tax rates in foreign jurisdictions and the relative amount of income we earn in those jurisdictions, which we expect to be fairly consistent in the near term. Our effective tax rate differs from the statutory federal income tax rate of 21% primarily due to the impacts of the valuation allowance against our deferred tax assets, net of deferred tax liabilities.
The OECD has issued Pillar Two model rules introducing a new global minimum tax of 15% intended to be effective on January 1, 2024. While the U.S. has not yet adopted the Pillar Two rules, various other governments around the world are enacting such legislation. As currently designed, we expect Pillar Two will ultimately apply to us. Considering we do not currently have material operations in jurisdictions with tax rates lower than the Pillar Two minimum, these rules are not expected to materially increase our global tax costs based on how we currently do business. There remains uncertainty as to the final Pillar Two model rules. We will continue to monitor U.S. and global legislative action related to Pillar Two for potential impacts.
As we repatriate foreign earnings for use in the United States, the distributions will generally be exempt from federal and foreign income taxes but may be subject to certain state taxes. As of December 31, 2024, the cumulative amount of foreign earnings considered permanently reinvested upon which taxes have not been provided, and the corresponding unrecognized deferred tax liability, was not material.
Critical Accounting Policies and Estimates
The preparation of financial statements in conformity with U.S. generally accepted accounting principles ("GAAP") requires estimates and assumptions that affect the reported amounts of assets and liabilities, revenues and expenses, and related disclosures of contingent assets and liabilities in the consolidated financial statements and accompanying notes. The SEC has defined a company's critical accounting policies as the ones that are most important to the portrayal of the company's financial condition and results of operations, and which require the company to make its most difficult and subjective judgments, often as a result of the need to make estimates of matters that are inherently uncertain. Based on this definition, we have identified the critical accounting policies, estimates and judgments addressed below. We also have other key accounting policies, which involve the use of estimates, judgments, and assumptions that are significant to understanding our results. For additional information, see Item 8 of Part II, "Financial Statements and Supplementary Data"—Note 2—Accounting Policies and Supplemental Disclosures. We believe that our estimates, assumptions, and judgments are reasonable. We evaluate our estimates and assumptions on an ongoing basis. Actual results may differ significantly from these estimates. Our critical accounting policies are as follows:
•valuation of certain equity method securities carried at fair value.
Valuation of certain equity method securities carried at fair value
We measured certain equity method securities at fair value at the reporting date. In the absence of quoted market prices (e.g., a privately held entity), the fair value was determined in good faith under our valuation policy and process using generally accepted valuation approaches. We utilized an independent third party valuation firm to assist us in determining the fair value of our direct minority interest in tZERO using a market approach. The market approach relied upon market transaction valuations of the subject company, adjusted for changes in enterprise value for guideline public companies. The fair value determination of our direct minority interest in tZERO required the use of significant unobservable inputs (Level 3 inputs) as shown in the table within Note 2—Accounting Policies and Supplemental Disclosures, Equity securities accounted for under the equity method under ASC 323. Due to the inherent uncertainty of determining the fair value of Level 3 securities that do not have a readily available market value, the determination of fair value required significant judgment or estimation and changes in the estimates and assumptions used in the valuation models could materially affect the determination of fair value for these assets.
ITEM 7A. QUANTITATIVE AND QUALITATIVE DISCLOSURES ABOUT MARKET RISK
We are exposed to market risk for the effect of interest rate changes, foreign currency fluctuations, and changes in the market values of our investments. Information relating to quantitative and qualitative disclosures about these market risks is set forth below.
Interest Rate Sensitivity
The fair value of our cash and cash equivalents (highly-liquid instruments with an original maturity of 90 days or less at the date of purchase) would not be significantly affected by either an increase or decrease in interest rates due mainly to the short-term nature of these instruments.
Interest on the revolving line of credit incurred pursuant to the Credit Agreement described herein would accrue based on market rates plus 1.00%, for a one-month interest period; however, we do not expect that any changes in prevailing interest rates will have a material impact on our results of operations.
Foreign Currency Risk
Most of our sales and operating expenses are denominated in U.S. dollars, and therefore, our total revenue and operating expenses are not currently subject to significant foreign currency risk.
Inflation
Increases in commodity and shipping prices and energy and labor costs have resulted in inflationary pressures across various parts of our business and operations, including our partners and supply chain. We continue to monitor the impact of inflation in order to minimize its effects on our customers. We work with our partners to limit the amount of cost increases that are passed on through higher pricing. If costs borne by ourselves or our partners were to be subject to incremental inflationary pressures, we may not be able to fully offset such higher costs through pricing actions or other cost efficiency measures. Our inability or failure to do so could harm our business, financial condition and results of operations.
Investment Risk
The fair values of our equity and debt securities may be subject to fluctuations due to volatility of the stock market in general, investment-specific circumstances, and changes in general economic conditions. At December 31, 2024, our recorded value in equity securities of private companies was $78.2 million, compared to $155.9 million at December 31, 2023. At December 31, 2024, $21.6 million of our equity securities and $25.8 million of our debt securities are of private companies, recorded at fair value using Level 3 inputs. Our fair value assessment of private companies includes a review of recent operating results and trends, recent sales/acquisitions of the equity securities, and other publicly available data. Valuations of private companies are inherently more complex due to the lack of readily available market data. As such, we believe that market sensitivities are not practicable. For our equity interest in Medici Ventures, L.P., we record our proportionate share of the entity's reported net income or loss, which reflects the fair value changes of the underlying investments of the entity and any other income or losses of the entity.
ITEM 8. FINANCIAL STATEMENTS AND SUPPLEMENTARY DATA
INDEX TO CONSOLIDATED FINANCIAL STATEMENTS
Report of Independent Registered Public Accounting Firm
To the Stockholders and Board of Directors
Beyond, Inc.:
Opinion on the Consolidated Financial Statements
We have audited the accompanying consolidated balance sheets of Beyond, Inc. and subsidiaries (the Company) as of December 31, 2024 and 2023, the related consolidated statements of operations, comprehensive loss, changes in stockholders' equity, and cash flows for each of the years in the three-year period ended December 31, 2024, and the related notes and financial statement schedule II (collectively, the consolidated financial statements). In our opinion, the consolidated financial statements present fairly, in all material respects, the financial position of the Company as of December 31, 2024 and 2023, and the results of its operations and its cash flows for each of the years in the three-year period ended December 31, 2024, in conformity with U.S. generally accepted accounting principles.
We also have audited, in accordance with the standards of the Public Company Accounting Oversight Board (United States) (PCAOB), the Company's internal control over financial reporting as of December 31, 2024, based on criteria established in Internal Control – Integrated Framework (2013) issued by the Committee of Sponsoring Organizations of the Treadway Commission, and our report dated February 25, 2025 expressed an unqualified opinion on the effectiveness of the Company's internal control over financial reporting.
Basis for Opinion
These consolidated financial statements are the responsibility of the Company's management. Our responsibility is to express an opinion on these consolidated financial statements based on our audits. We are a public accounting firm registered with the PCAOB and are required to be independent with respect to the Company in accordance with the U.S. federal securities laws and the applicable rules and regulations of the Securities and Exchange Commission and the PCAOB.
We conducted our audits in accordance with the standards of the PCAOB. Those standards require that we plan and perform the audit to obtain reasonable assurance about whether the consolidated financial statements are free of material misstatement, whether due to error or fraud. Our audits included performing procedures to assess the risks of material misstatement of the consolidated financial statements, whether due to error or fraud, and performing procedures that respond to those risks. Such procedures included examining, on a test basis, evidence regarding the amounts and disclosures in the consolidated financial statements. Our audits also included evaluating the accounting principles used and significant estimates made by management, as well as evaluating the overall presentation of the consolidated financial statements. We believe that our audits provide a reasonable basis for our opinion.
Critical Audit Matter
The critical audit matter communicated below is a matter arising from the current period audit of the consolidated financial statements that was communicated or required to be communicated to the audit committee and that: (1) relates to accounts or disclosures that are material to the consolidated financial statements and (2) involved our especially challenging, subjective, or complex judgments. The communication of a critical audit matter does not alter in any way our opinion on the consolidated financial statements, taken as a whole, and we are not, by communicating the critical audit matter below, providing a separate opinion on the critical audit matter or on the accounts or disclosures to which it relates.
Valuation of certain equity method securities
As discussed in Notes 2 and 9 to the consolidated financial statements, the Company values certain equity method securities using a market transaction backsolve approach adjusted for enterprise value changes in guideline public companies. As of December 31, 2024, the Company reported the carrying amount of its equity method securities was $78.2 million, a portion of which related to certain equity method securities valued using this approach.
We identified the valuation of certain equity method securities using a market transaction backsolve approach adjusted for enterprise value changes in guideline public companies as a critical audit matter. A high degree of subjective auditor judgment was required in evaluating the selection of the percentage change in enterprise value for guideline public companies. The valuation was sensitive to reasonably possible changes to this assumption.
The following are the primary procedures we performed to address this critical audit matter. We evaluated the design and tested the operating effectiveness of certain internal controls related to the Company's fair value determination process for equity method securities carried at fair value, including a control related to the development of the percentage change in
enterprise value for guideline public companies. We involved valuation professionals with specialized skills and knowledge, who assisted in evaluating the selected percentage change in enterprise value for guideline public companies by comparing the selected percentage change to a range of percentages independently developed using publicly available data for comparable entities.
/s/ KPMG LLP
We have served as the Company's auditor since 2009.
Salt Lake City, Utah
February 25, 2025
Beyond, Inc.
Consolidated Balance Sheets
(in thousands, except per share data)
| | | | | | | | | | | |
| December 31,
2024 | | December 31,
2023 |
| Assets | | | |
| Current assets: | | | |
| Cash and cash equivalents | $ | 159,169 | | | $ | 302,605 | |
| Restricted cash | 26,924 | | | 144 | |
| | | |
| Accounts receivable, net of allowance for credit losses of $2,236 and $1,298 | 15,847 | | | 19,420 | |
| | | |
| Inventories | 11,546 | | | 13,040 | |
| Prepaids and other current assets | 14,021 | | | 14,864 | |
| | | |
| Total current assets | 227,507 | | | 350,073 | |
| Property and equipment, net | 23,544 | | | 27,577 | |
| | | |
| Intangible assets, net | 30,246 | | | 25,254 | |
| Goodwill | 6,160 | | | 6,160 | |
| Equity securities, including securities measured at fair value of $21,640 and $41,046 | 78,186 | | | 155,873 | |
| Operating lease right-of-use assets | 6,858 | | | 3,468 | |
| Other long-term assets, net | 29,453 | | | 12,951 | |
| Property and equipment, net held for sale | — | | | 54,462 | |
| Total assets | $ | 401,954 | | | $ | 635,818 | |
| Liabilities and Stockholders' Equity | | | |
| Current liabilities: | | | |
| Accounts payable | $ | 81,939 | | | $ | 106,070 | |
| Accrued liabilities | 73,614 | | | 73,682 | |
| Unearned revenue | 43,095 | | | 49,597 | |
| Operating lease liabilities, current | 1,342 | | | 2,814 | |
| Short-term debt, net | 24,871 | | | — | |
| Current debt, net held for sale | — | | | 232 | |
| Total current liabilities | 224,861 | | | 232,395 | |
| | | |
| | | |
| Operating lease liabilities, non-current | 6,452 | | | 940 | |
| Other long-term liabilities | 7,909 | | | 9,107 | |
| Long-term debt, net held for sale | — | | | 34,244 | |
| Total liabilities | 239,222 | | | 276,686 | |
| Commitments and Contingencies (Note 15) | | | |
| Stockholders' equity: | | | |
| Preferred stock, $0.0001 par value, authorized shares - 5,000, issued and outstanding - none | — | | | — | |
| | | |
| | | |
| | | |
| Common stock, $0.0001 par value, authorized shares - 100,000 | | | |
| Issued shares - 59,560 and 51,770 | | | |
| Outstanding shares - 53,069 and 45,414 | 5 | | | 5 | |
| Additional paid-in capital | 1,072,869 | | | 1,007,649 | |
| Accumulated deficit | (740,466) | | | (481,671) | |
| Accumulated other comprehensive loss | — | | | (506) | |
| Treasury stock at cost - 6,491 and 6,356 | (169,676) | | | (166,345) | |
| | | |
| | | |
| Total stockholders' equity | 162,732 | | | 359,132 | |
| Total liabilities and stockholders' equity | $ | 401,954 | | | $ | 635,818 | |
See accompanying notes to consolidated financial statements.
Beyond, Inc.
Consolidated Statements of Operations
(in thousands, except per share data)
| | | | | | | | | | | | | | | | | |
| | Year Ended December 31, |
| | 2024 | | 2023 | | 2022 |
| | | | | |
| Net revenue | $ | 1,394,964 | | | $ | 1,561,122 | | | $ | 1,929,334 | |
| | | | | |
| | | | | |
| | | | | |
| Cost of goods sold | 1,104,800 | | | 1,195,093 | | | 1,421,721 | |
| | | | | |
| | | | | |
| Gross profit | 290,164 | | | 366,029 | | | 507,613 | |
| Operating expenses: | | | | | |
| Sales and marketing | 238,564 | | | 224,547 | | | 215,477 | |
| Technology | 114,584 | | | 117,154 | | | 121,158 | |
| General and administrative | 74,399 | | | 90,410 | | | 79,701 | |
| Customer service and merchant fees | 53,586 | | | 52,023 | | | 64,269 | |
| | | | | |
| | | | | |
| Total operating expenses | 481,133 | | | 484,134 | | | 480,605 | |
| Operating income (loss) | (190,969) | | | (118,105) | | | 27,008 | |
| Interest income, net | 6,765 | | | 12,007 | | | 2,965 | |
| Other expense, net | (73,907) | | | (160,024) | | | (63,825) | |
| Loss before income taxes | (258,111) | | | (266,122) | | | (33,852) | |
| Provision for income taxes | 684 | | | 41,720 | | | 1,384 | |
| | | | | |
| | | | | |
| | | | | |
| | | | | |
| Net loss | $ | (258,795) | | | $ | (307,842) | | | $ | (35,236) | |
| Net loss per share of common stock: | | | | | |
| | | | | |
| | | | | |
| Basic | $ | (5.56) | | | $ | (6.81) | | | $ | (0.83) | |
| | | | | |
| | | | | |
| | | | | |
| Diluted | $ | (5.56) | | | $ | (6.81) | | | $ | (0.83) | |
| Weighted average shares of common stock outstanding: | | | | | |
| Basic | 46,542 | | | 45,214 | | | 44,323 | |
| Diluted | 46,542 | | | 45,214 | | | 44,323 | |
See accompanying notes to consolidated financial statements.
Beyond, Inc.
Consolidated Statements of Comprehensive Loss
(in thousands)
| | | | | | | | | | | | | | | | | |
| | Year Ended December 31, |
| | 2024 | | 2023 | | 2022 |
| Net loss | $ | (258,795) | | | $ | (307,842) | | | $ | (35,236) | |
| Other comprehensive income: | | | | | |
| Unrealized gain on cash flow hedges, net of tax of $0, $0 and $0 | 506 | | | 16 | | | 15 | |
| Other comprehensive income | 506 | | | 16 | | | 15 | |
| Comprehensive loss | $ | (258,289) | | | $ | (307,826) | | | $ | (35,221) | |
| | | | | |
| | | | | |
See accompanying notes to consolidated financial statements.
| | | | | | | | | | | | | | | | | |
Beyond, Inc.
Consolidated Statements of Changes in Stockholders' Equity
(in thousands) |
| Year Ended December 31, |
| | 2024 | | 2023 | | 2022 |
| Equity attributable to stockholders of Beyond, Inc. | | | | | |
| Shares of common stock issued | | | | | |
| Balance at beginning of year | 51,770 | | | 51,102 | | | 46,625 | |
| Common stock issued upon vesting of restricted stock | 441 | | | 550 | | | 295 | |
| Common stock issued for ESPP purchases | 119 | | | 118 | | | 84 | |
| | | | | |
| Conversion of preferred stock | — | | | — | | | 4,098 | |
| Common stock sold through offerings | 7,002 | | | — | | | — | |
| Other | 228 | | | — | | | — | |
| Balance at end of year | 59,560 | | | 51,770 | | | 51,102 | |
| Shares of treasury stock | | | | | |
| Balance at beginning of year | 6,356 | | | 6,151 | | | 3,602 | |
| Repurchases of common stock | — | | | — | | | 2,461 | |
| Tax withholding upon vesting of employee stock awards | 135 | | | 205 | | | 88 | |
| | | | | |
| | | | | |
| Balance at end of year | 6,491 | | | 6,356 | | | 6,151 | |
| Total shares of common stock outstanding | 53,069 | | | 45,414 | | | 44,951 | |
| Common stock | | | | | |
| Balance at beginning of year | $ | 5 | | | $ | 5 | | | $ | 4 | |
| Conversion and elimination of preferred stock | — | | | — | | | 1 | |
| Balance at end of year | $ | 5 | | | $ | 5 | | | $ | 5 | |
| Shares of Series A-1 preferred stock issued | | | | | |
| Balance at beginning of year | — | | | — | | | 4,204 | |
| Conversion and elimination of preferred stock | — | | | — | | | (4,204) | |
| | | | | |
| | | | | |
| | | | | |
| Balance at end of year | — | | | — | | | — | |
| Shares of treasury stock | | | | | |
| Balance at beginning of year | — | | | — | | | — | |
| Repurchases of shares | — | | | — | | | 7 | |
| Conversion and elimination of preferred stock | — | | | — | | | (7) | |
| Balance at end of year | — | | | — | | | — | |
| Total shares of Series A-1 preferred stock outstanding | — | | | — | | | — | |
| Shares of Series B Preferred stock issued and outstanding | | | | | |
| Balance at beginning of year | — | | | — | | | 357 | |
| | | | | |
| Conversion and elimination of preferred stock | — | | | — | | | (357) | |
| Balance at end of year | — | | | — | | | — | |
| Preferred stock | $ | — | | | $ | — | | | $ | — | |
| | | | | |
| Continued on the following page |
| | | | | | | | | | | | | | | | | |
Beyond, Inc.
Consolidated Statements of Changes in Stockholders' Equity
(in thousands) |
| Year Ended December 31, |
| 2024 | | 2023 | | 2022 |
| Additional paid-in capital | | | | | |
| Balance at beginning of year | $ | 1,007,649 | | | $ | 982,718 | | | $ | 960,544 | |
| Stock-based compensation to employees and directors | 19,255 | | | 23,018 | | | 18,318 | |
| Common stock issued for ESPP purchases | 1,472 | | | 1,913 | | | 2,779 | |
| | | | | |
| Conversion and elimination of preferred stock | — | | | — | | | 1,043 | |
| | | | | |
| | | | | |
| | | | | |
| Common stock sold through offerings, net | 42,993 | | | — | | | — | |
| | | | | |
| Other | 1,500 | | | — | | | 34 | |
| Balance at end of year | $ | 1,072,869 | | | $ | 1,007,649 | | | $ | 982,718 | |
| Accumulated deficit | | | | | |
| Balance at beginning of year | $ | (481,671) | | | $ | (173,829) | | | $ | (136,590) | |
| | | | | |
| Net loss | (258,795) | | | (307,842) | | | (35,236) | |
| Dividend issued upon conversion and elimination of preferred stock | — | | | — | | | (1,697) | |
| Conversion and elimination of preferred stock | — | | | — | | | (306) | |
| | | | | |
| | | | | |
| Balance at end of year | $ | (740,466) | | | $ | (481,671) | | | $ | (173,829) | |
| Accumulated other comprehensive loss | | | | | |
| Balance at beginning of year | $ | (506) | | | $ | (522) | | | $ | (537) | |
| Net other comprehensive income | 506 | | | 16 | | | 15 | |
| Balance at end of year | $ | — | | | $ | (506) | | | $ | (522) | |
| Treasury stock | | | | | |
| Balance at beginning of year | $ | (166,345) | | | $ | (162,546) | | | $ | (79,035) | |
| Repurchases of common stock and Series A-1 preferred stock | — | | | — | | | (80,117) | |
| Tax withholding upon vesting of employee stock awards | (3,331) | | | (3,799) | | | (3,700) | |
| Conversion and elimination of preferred stock | — | | | — | | | 306 | |
| | | | | |
| | | | | |
| Balance at end of year | $ | (169,676) | | | $ | (166,345) | | | $ | (162,546) | |
| | | | | |
| | | | | |
|
| |
| | | | | |
| | | | | |
| | | | | |
| | | | | |
| | | | | |
| | | | | |
| | | | | |
| | | | | |
| | | | | |
| | | | | |
| | | | | |
| | | | | |
| | | | | |
| | | | | |
| Total stockholders' equity | $ | 162,732 | | | $ | 359,132 | | | $ | 645,826 | |
See accompanying notes to consolidated financial statements.
| | |
Beyond, Inc. Consolidated Statements of Cash Flows (in thousands) |
| | | | | | | | | | | | | | | | | | | |
| | Year Ended December 31, |
| | 2024 | | 2023 | | 2022 | | |
| Cash flows from operating activities: | | | | | | | |
| Net loss | $ | (258,795) | | | $ | (307,842) | | | $ | (35,236) | | | |
| | | | | | | |
| Adjustments to reconcile net loss to net cash used in operating activities: | | | | | | | |
| | | | | | | |
| | | | | | | |
| Depreciation and amortization | 19,062 | | | 19,447 | | | 16,706 | | | |
| Non-cash operating lease cost | 3,451 | | | 4,737 | | | 5,304 | | | |
| Stock-based compensation to employees and directors | 19,255 | | | 23,018 | | | 18,318 | | | |
| (Increase) decrease in deferred income taxes, net | 283 | | | 41,349 | | | (1,404) | | | |
| | | | | | | |
| | | | | | | |
| Gain on sale of intangible assets | (10,275) | | | — | | | — | | | |
| | | | | | | |
| | | | | | | |
| Gain on disposal of cryptocurrencies | — | | | (6,361) | | | — | | | |
| Write-down of assets held for sale | 3,385 | | | 25,875 | | | — | | | |
| | | | | | | |
| Loss from equity method securities | 77,687 | | | 140,404 | | | 63,923 | | | |
| Loss on debt securities carried at fair value | 2,430 | | | — | | | — | | | |
| | | | | | | |
| | | | | | | |
| | | | | | | |
| | | | | | | |
| | | | | | | |
| Other non-cash adjustments | (14) | | | (693) | | | 185 | | | |
| Changes in operating assets and liabilities: | | | | | | | |
| | | | | | | |
| Accounts receivable, net | 3,573 | | | (1,727) | | | 3,805 | | | |
| Inventories | 1,494 | | | (6,514) | | | (1,389) | | | |
| | | | | | | |
| Prepaids and other current assets | 1,293 | | | 1,889 | | | 4,076 | | | |
| Other long-term assets, net | (2,175) | | | (757) | | | (1,116) | | | |
| Accounts payable | (24,172) | | | 32,555 | | | (28,821) | | | |
| Accrued liabilities | (31) | | | 10,442 | | | (36,625) | | | |
| Unearned revenue | (6,502) | | | 5,117 | | | (14,907) | | | |
| Operating lease liabilities | (2,819) | | | (5,094) | | | (5,527) | | | |
| Other long-term liabilities | (1,434) | | | 5,569 | | | 173 | | | |
| | | | | | | |
| | | | | | | |
| Net cash used in operating activities | (174,304) | | | (18,586) | | | (12,535) | | | |
| Cash flows from investing activities: | | | | | | | |
| Proceeds from the sale of assets held for sale | 51,441 | | | — | | | — | | | |
| | | | | | | |
| | | | | | | |
| | | | | | | |
| Proceeds from the sale of intangible assets | 10,275 | | | — | | | — | | | |
| Disbursement for notes receivable | (17,000) | | | (10,000) | | | — | | | |
| Expenditures for property and equipment | (14,315) | | | (19,181) | | | (14,899) | | | |
| Purchase of intangible assets | (6,044) | | | (25,816) | | | — | | | |
| | | | | | | |
| | | | | | | |
| | | | | | | |
| Purchase of equity securities | — | | | — | | | (18,920) | | | |
| Proceeds from the disposal of cryptocurrencies | — | | | 9,804 | | | — | | | |
| Capital distribution from investment | — | | | 4 | | | 1,224 | | | |
| | | | | | | |
| Other investing activities, net | 569 | | | 559 | | | (439) | | | |
| | | | | | | |
| | | | | | | |
| Net cash provided by (used in) investing activities | 24,926 | | | (44,630) | | | (33,034) | | | |
| | |
| Continued on the following page | | |
| | | | | | | | | | | | | | | | | | | |
Beyond, Inc. Consolidated Statements of Cash Flows (in thousands) | | |
| Year Ended December 31, | | |
| 2024 | | 2023 | | 2022 | | |
| Cash flows from financing activities: | | | | | | | |
| | | | | | | |
| | | | | | | |
| Proceeds from sale of common stock, net of offering costs | 42,993 | | | — | | | — | | | |
| | | | | | | |
| | | | | | | |
| Proceeds from short-term debt | 25,000 | | | — | | | — | | | |
| | | | | | | |
| Proceeds from employee stock purchase plan | 1,472 | | | 1,913 | | | 924 | | | |
| | | | | | | |
| | | | | | | |
| | | | | | | |
| | | | | | | |
| | | | | | | |
| Payments on long-term debt | (34,782) | | | (3,606) | | | (3,447) | | | |
| | | | | | | |
| | | | | | | |
| Payments of taxes withheld upon vesting of employee stock awards | (3,331) | | | (3,799) | | | (3,700) | | | |
| Repurchase of shares | — | | | — | | | (80,117) | | | |
| Other financing activities, net | 1,370 | | | — | | | — | | | |
| | | | | | | |
| | | | | | | |
| Net cash provided by (used in) financing activities | 32,722 | | | (5,492) | | | (86,340) | | | |
| Net decrease in cash, cash equivalents, and restricted cash | (116,656) | | | (68,708) | | | (131,909) | | | |
| Cash, cash equivalents, and restricted cash, beginning of year | 302,749 | | | 371,457 | | | 503,366 | | | |
| | | | | | | |
| | | | | | | |
| Cash, cash equivalents, and restricted cash, end of year | $ | 186,093 | | | $ | 302,749 | | | $ | 371,457 | | | |
| | | | | | | |
| | | | | | | |
| | | | | | | |
| | | | | | | |
| | | | | | | |
| | | | | | | |
| | | | | | | |
| | | | | | | |
| | | | | | | |
| | | | | | | |
| | | | | | | |
| | | | | | | |
| | | | | | | |
| | | | | | | |
| | | | | | | |
| | | | | | | |
| | | | | | | |
| | | | | | | |
See accompanying notes to consolidated financial statements.
Beyond, Inc.
Notes to Consolidated Financial Statements
1. BASIS OF PRESENTATION
Business and organization
As used herein, "Beyond," "the Company," "we," "our" and similar terms include Beyond, Inc. and its controlled subsidiaries, unless the context indicates otherwise. We were formed on May 5, 1997 as D2-Discounts Direct, a limited liability company ("LLC"). On December 30, 1998, we were reorganized as a C Corporation in the State of Utah and reincorporated in Delaware in May 2002. On October 25, 1999, we changed our name to Overstock.com, Inc. and on November 6, 2023, we changed our name to Beyond, Inc.
Beyond, Inc. is an e-commerce affinity marketing company with a singular focus: connecting consumers with products and services they love. As the owner of the iconic Bed Bath & Beyond, Overstock and Zulily brands, as well as several other brands, we strive to curate an exceptional online shopping experience. Our suite of premier online retail brands allow us to offer a comprehensive array of products and add-on services, catering to customers in the United States and Canada along with customers in Mexico through trademark licensing. Our e-commerce platform, which is also accessible through our mobile app, includes www.bedbathandbeyond.com, www.bedbathandbeyond.ca, www.overstock.com, and www.zulily.com, and is collectively referred to as the "Website." From furniture, bedding, and bath essentials to patio and outdoor furniture, area rugs, tabletop and cookware, décor, storage, jewelry, watches, and fashion – we offer an extensive range of products at a smart value. In addition to products, we also offer an increasing number of add-on services across our platforms, including warranties, shipping insurance, installation services, and access to home loans.
Basis of presentation
We have prepared the accompanying consolidated financial statements pursuant to generally accepted accounting principles in the United States ("GAAP"). Preparing financial statements requires us to make estimates and assumptions that affect the amounts that are reported in the consolidated financial statements and accompanying disclosures. Although these estimates are based on our best knowledge of current events and actions that we may undertake in the future, our actual results may be different from our estimates. The results of operations presented herein are not necessarily indicative of our results for any future period.
2. ACCOUNTING POLICIES AND SUPPLEMENTAL DISCLOSURES
Principles of consolidation
The accompanying consolidated financial statements include our accounts and the accounts of our wholly-owned subsidiaries. All intercompany account balances and transactions have been eliminated in consolidation.
Use of estimates
The preparation of financial statements in conformity with GAAP requires estimates and assumptions that affect the reported amounts of assets and liabilities, revenues and expenses, and related disclosures of contingent liabilities in our consolidated financial statements and accompanying notes. Estimates are used for, but not limited to, receivables valuation, revenue recognition, loyalty program reward point and gift card breakage, sales returns, inventory valuation, asset useful lives, equity and debt securities valuation, income taxes, stock-based compensation, performance-based compensation, self-funded health insurance liabilities, and contingencies. Although these estimates are based on our best knowledge of current events and actions that we may undertake in the future, our accounting of these estimates may change from period to period. To the extent there are differences between these estimates and actual results, our consolidated financial statements may be materially affected.
Change in presentation in the income statement
In the first quarter of fiscal 2024, the Company changed the presentation for merchant fees associated with customer payments made by credit cards and other payment methods and customer service costs. Under the new presentation, the Company includes such expenses in a separate line in operating expenses labeled, "Customer service and merchant fees", whereas previously, these expenses were included in Cost of goods sold.
The Company concluded that such a change in presentation is preferable in the circumstances because the treatment of these costs as operating expenses is aligned with the changes in business and strategy. The change will also provide greater transparency in the Company's external disclosures and related communications with the market.
This change in accounting policy has been applied retrospectively, and the consolidated statements of operations reflect the effect of this accounting principle change for all periods presented. This change in presentation had no impact on Loss before income taxes, Net loss, or Net loss per share of common stock basic or diluted. The consolidated balance sheets, consolidated statements of comprehensive loss, consolidated statements of changes in stockholders' equity, and consolidated statements of cash flows were not impacted by this accounting policy change.
The change in presentation to the Company's consolidated statements of operations were as follows (in thousands):
| | | | | | | | | | | | | | | | | | | | | | | | | | | | | | | | | | | |
| Year ended December 31, 2023 | | Year ended December 31, 2022 |
| Previously reported | | Effect of change | | As adjusted | | Previously reported | | Effect of change | | As adjusted |
| Cost of goods sold | $ | 1,247,116 | | | $ | (52,023) | | | $ | 1,195,093 | | | $ | 1,485,990 | | | $ | (64,269) | | | $ | 1,421,721 | |
| Gross profit | 314,006 | | | 52,023 | | | 366,029 | | | 443,344 | | | 64,269 | | | 507,613 | |
| Customer service and merchant fees | — | | | 52,023 | | | 52,023 | | | — | | | 64,269 | | | 64,269 | |
Supplemental cash flow information
The following table shows supplemental cash flow information (in thousands):
| | | | | | | | | | | | | | | | | | | | |
| | Year Ended December 31, |
| | 2024 | | 2023 | | 2022 |
| Supplemental disclosures of cash flow information: | | | | | | |
| Cash paid during the period: | | | | | | |
| Interest paid, net of amounts capitalized | | $ | 1,489 | | | $ | 1,598 | | | $ | 1,777 | |
| Income taxes (refunded) paid, net | | (132) | | | 556 | | | 2,562 | |
| Non-cash investing and financing activities: | | | | | | |
| Purchases of property and equipment included in accounts payable and accrued liabilities | | $ | 4 | | | $ | 211 | | | $ | 2,527 | |
| | | | | | |
| | | | | | |
| | | | | | |
| | | | | | |
| | | | | | |
| | | | | | |
| | | | | | |
| | | | | | |
| | | | | | |
| | | | | | |
| | | | | | |
See also Note 13—Leases for additional supplemental disclosures of cash flow information related to our leases.
Cash equivalents
We classify all highly liquid instruments, including instruments with an original maturity of three months or less at the time of purchase, as cash equivalents.
Restricted cash
We consider cash that is legally restricted and cash that is held as compensating balances for credit arrangements as restricted cash.
Fair value of financial instruments
We account for our assets and liabilities using a hierarchy of valuation techniques based on whether the inputs to those valuation techniques are observable or unobservable. Observable inputs reflect market data obtained from independent sources, while unobservable inputs reflect our market assumptions. These two types of inputs have created the fair-value hierarchy below. This hierarchy requires us to minimize the use of unobservable inputs and to use observable market data, if available, when determining fair value.
•Level 1—Quoted prices for identical instruments in active markets;
•Level 2—Quoted prices for similar instruments in active markets, quoted prices for identical or similar instruments in markets that are not active, and model-derived valuations in which all significant inputs and significant value drivers are observable in active markets; and
•Level 3—Valuations derived from valuation techniques in which one or more significant inputs or significant value drivers are unobservable.
Our assets that are adjusted to fair value on a recurring basis are cash equivalents, which fair values are determined using quoted market prices from daily exchange traded markets on the closing price as of the balance sheet date and are classified as Level 1. Our recurring fair value measurements using unobservable inputs (Level 3) include our equity securities under ASC 323 accounted for under the fair value option, available-for-sale debt securities, and our debt securities carried at fair value. Our other financial instruments, including cash, restricted cash, accounts receivable, accounts payable, accrued liabilities, and debt are carried at cost, which approximates their fair value. Certain assets, including long-lived assets, certain equity securities under ASC 323, goodwill, and other intangible assets, are measured at fair value on a nonrecurring basis; that is, the assets are not measured at fair value on an ongoing basis, but are subject to fair value adjustments using fair value measurements with unobservable inputs (Level 3).
Accounts receivable, net
Accounts receivable consist primarily of trade amounts due from customers in the United States and uncleared credit card transactions at period end. Accounts receivables are recorded at invoiced amounts and do not bear interest. We maintain an allowance for expected credit losses based upon our business customers' financial condition and payment history, our historical collection experience, and any future expected economic conditions.
Inventories
Inventories include merchandise acquired for resale and processed returns which are accounted for using a standard costing system which approximates the first-in-first-out ("FIFO") method of accounting and are valued at the lower of cost and net realizable value. Inventory valuation requires us to make judgments, based on currently available information, about the likely method of disposition, such as through sales to individual customers, returns to product vendors, liquidations, and expected recoverable values of each disposition category.
Prepaids and other current assets
Prepaids and other current assets represent expenses paid prior to receipt of the related goods or services, including advertising, license fees, maintenance, packaging, insurance, prepaid inventories, other miscellaneous costs, and cryptocurrencies.
Property and equipment, net
Property and equipment are recorded at cost and stated net of depreciation and amortization. Property and equipment are depreciated using the straight-line method over the estimated useful lives of the related assets as follows:
| | | | | |
| | Life
(years) |
| Building | 40 |
| Land improvements | 20 |
| Building machinery and equipment | 15-20 |
| Furniture and equipment | 5-7 |
| Computer hardware | 3-4 |
| Computer software, including internal-use software and website development | 2-4 |
Leasehold improvements are amortized over the shorter of the term of the related leases or estimated useful lives.
Included in property and equipment is the capitalized cost of internal-use software and website development, including software used to upgrade and enhance our Website and processes supporting our business. We capitalize costs incurred during the application development stage of internal-use software and amortize these costs over the estimated useful life. Costs incurred related to design or maintenance of internal-use software are expensed as incurred.
Upon sale or retirement of assets, cost and related accumulated depreciation and amortization are removed from the balance sheet and the resulting gain or loss is reflected in our consolidated statements of operations.
Valuation of assets held for sale
We classify assets and liabilities to be sold (disposal group) as held for sale in the period when all of the applicable criteria are met, including: (i) management commits to a plan to sell, (ii) the disposal group is available to sell in its present condition, (iii) there is an active program to locate a buyer, (iv) the disposal group is being actively marketed at a reasonable price in relation to its fair value, (v) significant changes to the plan to sell are unlikely, and (vi) the sale of the disposal group is generally probable of being completed within one year. Assets and liabilities held for sale are presented separately within the Consolidated balance sheets with any adjustments necessary to measure the disposal group at the lower of its carrying value or fair value less costs to sell. Depreciation of property and equipment is not recorded while these assets are classified as held for sale. The fair value of a disposal group, less any costs to sell, is assessed each reporting period it remains classified as held for sale and any remeasurement to the lower of carrying value or fair value less costs to sell is reported as an adjustment to the carrying value of the disposal group recorded in Other expense, net in our consolidated statements of operations. We measured our assets held for sale at fair value based on Level 1 inputs. See Note 4—Assets Held for Sale for further information.
Equity securities accounted for under the equity method under ASC 323
At December 31, 2024, we held minority interests in privately held entities, Medici Ventures, L.P., tZERO, and SpeedRoute, LLC ("SpeedRoute"), accounted for under the equity method under ASC Topic 323, Investments—Equity Method and Joint Ventures ("ASC 323"), which are included in Equity securities in our consolidated balance sheets. We can exercise significant influence, but not control, over these entities through holding more than a 20% voting interest.
Based on the nature of our ownership interests and the extent of our contributed capital, we held a variable interest in Medici Ventures, L.P. and SpeedRoute, both of which meet the definition of variable interest entities; however, we are not the primary beneficiary of these entities for purposes of consolidation as we do not have the power (either explicit or implicit), through voting rights or otherwise, to direct the activities of Medici Ventures, L.P. or SpeedRoute that most significantly impact their economic performance. Our investments in these variable interest entities totaled $60.5 million as of December 31, 2024, representing our maximum exposures to loss.
We record our proportionate share of Medici Ventures, L.P.'s net assets assuming the entity (i) liquidated its net assets at their book values and (ii) distributed the proceeds to the investors based on the distribution waterfall in the investment agreement, which reflects the fair value changes of the underlying investments of the entity, any investor-level adjustments, and any other operating income or losses of the entity, in Other expense, net in our consolidated statements of operations with corresponding adjustments to the carrying value of the asset. If such events or circumstances have occurred that may indicate the fair value of our equity interest is less than its carrying value, we estimate the fair value of our equity interest and recognize an impairment loss equal to the difference between the fair value of the security and its carrying value which is recorded in Other expense, net in our consolidated statements of operations. There is no difference between the carrying amount of our investment in the entity and the amount of underlying equity we have in the entity's net assets.
We have elected to apply the fair value option for valuing our direct minority interests in tZERO and SpeedRoute as we determined that accounting for our direct minority interests in tZERO and SpeedRoute under the fair value option would approximate the same valuation approach used by Medici Ventures, L.P. for valuing our indirect interest in tZERO and SpeedRoute and would be the most meaningful and transparent option for evaluating our continued exposure to the economics of tZERO and SpeedRoute. The fair value was determined in good faith under our valuation policy and process using generally accepted valuation approaches through the use of a third-party valuation firm. Our assessment includes a review of recent operating results and trends, recent sales/acquisitions of the equity securities, and other publicly available data.
The methods and significant assumptions to estimate the fair value of our direct minority interests in tZERO under the fair value option include using a market approach. The market approach relied upon market transaction valuations of the subject company, adjusted for changes in enterprise value for guideline public companies. Due to the last Series B financing round led by the Intercontinental Exchange, the valuation technique used to value our direct interest in tZERO was a blended market approach using a transaction backsolve adjusted for enterprise value changes in guideline public companies, with an option pricing model and a guideline public company method. The methods and significant assumptions to estimate the fair value of our direct minority interests in SpeedRoute under the fair value option include using a market approach based on latest market transaction valuations.
The following table summarizes the valuation techniques and significant unobservable inputs used in the fair value measurement of our Level 3 equity securities:
| | | | | | | | | | | | | | | | | | | | | | | | | | |
| Investment | | Fair Value | | Valuation Technique | | Unobservable Inputs | | Inputs |
| tZERO | | $ | 17,720 | | | Blended market approach - transaction backsolve adjusted for enterprise value changes in guideline public companies, with an option pricing model method and guideline public company method | | Term to liquidity | | 4.0 years |
| | | | | | Volatility | | 110% |
| | | | | | Percentage change in enterprise value for guideline public companies | | (82.4)% |
| SpeedRoute | | 3,920 | | | Market approach - latest transactions | | N/A | | N/A |
| Total | | $ | 21,640 | | | | | | | |
A significant change in the term to liquidity, volatility, or percentage change in enterprise value for guideline public companies inputs could result in a significant change in the fair value measurement.
Leases
We determine if an arrangement is a lease at inception. We account for lease agreements as either operating or finance leases depending on certain defined criteria. Operating leases are recognized in Operating lease right-of-use ("ROU") assets, Operating lease liabilities, current, and Operating lease liabilities, non-current on our consolidated balance sheets. Finance leases are included in Other long-term assets, net, Other current liabilities, and Other long-term liabilities on our consolidated balance sheets. Lease assets and liabilities are recognized based on the present value of the future minimum lease payments over the lease term at the commencement date. As most of our leases do not provide an implicit rate, we use our incremental borrowing rate based on the information available at the commencement date in determining the present value of future payments. In certain of our lease agreements, we receive rent holidays and other incentives. We recognize lease costs on a straight-line basis over the lease term without regard to deferred payment terms, such as rent holidays, that defer the
commencement date of required payments. Our lease terms may include options to extend or terminate the lease, and we adjust our measurement of the lease when it is reasonably certain that we will exercise that option. Lease payments used in measurement of the lease liability typically do not include executory costs, such as taxes, insurance, and maintenance, unless those costs can be reasonably estimated at lease commencement. Leasehold improvements are capitalized at cost and amortized over the lesser of their expected useful life or the life of the lease, without assuming renewal features, if any, are exercised. We do not separate lease and non-lease components for our leases.
Treasury stock
We account for treasury stock of our common shares under the cost method and include treasury stock as a component of stockholders' equity.
Goodwill
Goodwill represents the excess of the purchase price paid over the fair value of the net assets acquired in business combinations. Goodwill is not amortized but is tested for impairment at least annually or when we deem that a triggering event has occurred. When evaluating whether goodwill is impaired, we make a qualitative assessment to determine if it is more likely than not that the fair value of a reporting unit is less than its carrying amount. If the qualitative assessment determines that it is more likely than not that its fair value is less than its carrying amount, we compare the fair value of the reporting unit to which the goodwill is assigned to its carrying amount. If the carrying amount exceeds its fair value, an impairment loss is recognized in an amount equal to the excess of the carrying amount over the fair value of the reporting unit, not to exceed the carrying amount of the goodwill. We completed our annual goodwill impairment test as of December 31, 2024 by performing a qualitative assessment and concluded that the estimated fair value of the reporting units exceeded their carrying amount. There were no impairments to goodwill recorded during the years ended December 31, 2024, 2023 and 2022 and no other changes to the carrying amount of goodwill during the years ended December 31, 2024 and 2023. Our goodwill balance was $6.2 million as of December 31, 2024 and 2023.
Intangible assets other than goodwill
We capitalize and amortize intangible assets other than goodwill over their estimated useful lives unless such lives are indefinite. Intangible assets other than goodwill acquired separately from third parties are capitalized at cost, including any related direct acquisition costs, while such assets acquired as part of a business combination are capitalized at their acquisition-date fair value. Indefinite-lived intangible assets are tested for impairment annually or more frequently when events or circumstances indicate that the carrying value more likely than not exceeds its fair value. In addition, we routinely evaluate the remaining useful life of intangible assets not being amortized to determine whether events or circumstances continue to support an indefinite useful life, including any legal, regulatory, contractual, competitive, economic, or other factors that may limit their useful lives. Definite-lived intangible assets are amortized using the straight-line method of amortization over their useful lives, with the exception of certain intangibles (such as acquired customer lists) which are amortized using an accelerated method of amortization based on estimated customer attrition rates. These definite-lived intangible assets are reviewed for impairment whenever events or changes in circumstances indicate that their carrying amount may not be recoverable as described below under Impairment of long-lived assets.
Impairment of long-lived assets
We review property and equipment, right-of-use assets, and other long-lived assets, including intangible assets other than goodwill, for impairment whenever events or changes in circumstances indicate that the carrying amount of an asset group may not be recoverable. Recoverability is measured by a comparison of the assets' carrying amount to future undiscounted net cash flows the asset group is expected to generate. Cash flow forecasts are based on trends of historical performance and management's estimate of future performance, giving consideration to existing and anticipated competitive and economic conditions. If such asset group is considered to be impaired, the impairment to be recognized is measured by the amount by which the carrying amount of the assets exceeds their fair values. There were no impairments to long-lived assets recorded during the years ended December 31, 2024, 2023 and 2022.
Available-for-sale debt securities
During the year ended December 31, 2023, we invested $10.0 million in GrainChain, Inc. in the form of a convertible promissory note (the "Note"). The Note bears interest at an annual interest rate of 5% and accrued interest is recorded in Interest income, net in our consolidated statements of operations. The Note has a maturity date of January 3, 2025 at which time the
outstanding principal and any unpaid accrued interest will automatically convert into shares of a newly created series of preferred stock issued by GrainChain, Inc. The Note has not converted as the Company is in active discussions regarding our interests in GrainChain. The fair value of the Note, including accrued interest, was $11.0 million at December 31, 2024, which is included in Other long-term assets, net on our consolidated balance sheets.
Based on the nature of our indirect ownership interests in GrainChain, Inc. through Medici Ventures, L.P. and the extent of our contributed capital, we held a variable interest in GrainChain, Inc., which meets the definition of a variable interest entity; however, we are not the primary beneficiary of this entity for purposes of consolidation as we do not have the power (either explicit or implicit), through voting rights or otherwise, to direct the activities of GrainChain, Inc. that most significantly impact its economic performance. Our maximum exposure to loss in this variable interest entity totaled $30.6 million as of December 31, 2024, representing our direct and indirect interest in GrainChain, Inc.
Debt securities carried at fair value
In October 2024, the Company entered into a strategic business relationship with Kirkland's Stores, Inc. ("Kirkland's") which includes, among other things, entry into a secured Term Loan Credit Agreement ("Credit Agreement"). The Company provided $17.0 million in debt financing to Kirkland's, including an $8.5 million convertible promissory note and an $8.5 million non-convertible promissory note (collectively, the "Notes"). The Credit Agreement bears interest on the unpaid principal balance at an annual rate equal to the Secured Overnight Financing Rate, or SOFR rate, for a one-month, two-month or six-month SOFR period (depending on which option is elected) plus 2.75%, established by the Federal Reserve Bank of New York. The $8.5 million convertible promissory note (plus accrued interest) (the "Conversion Amount") can be converted into Kirkland's common stock at a conversion price of $1.85 per share in an amount not to exceed 19.9% of the outstanding shares at the Company's election. The Company has also committed to invest $8.0 million in Kirkland's common stock pursuant to Subscription Agreement and Investor Rights Agreement (collectively the "Subscription Agreement"), subject to receiving approval of Kirkland's stockholders. Subsequent to year end, stockholders of Kirkland's approved the additional $8.0 million investment in exchange for Kirkland's common stock. See Note 26—Subsequent Events for further information.
We have elected to present the Notes at fair value, which was $14.8 million at December 31, 2024. The balance of the Notes is included in Other long-term assets, net on our consolidated balance sheets.
Other long-term assets, net
Other long-term assets, net consist primarily of long-term prepaid expenses, deposits, available-for-sale debt securities, and debt securities carried at fair value.
Revenue recognition
Revenue is recognized when, or as, control of a promised product or service transfers to a customer, in an amount that reflects the consideration to which the Company expects to be entitled in exchange for transferring those products or services. Revenue excludes taxes that have been assessed by governmental authorities and that are directly imposed on revenue-producing transactions between the Company and its customers, including sales and use taxes. Revenue recognition is evaluated through the following five-step process:
1) identification of the contract with a customer;
2) identification of the performance obligations in the contract;
3) determination of the transaction price;
4) allocation of the transaction price to the performance obligations in the contract; and
5) recognition of revenue when or as a performance obligation is satisfied.
Product Revenue
We derive our revenue primarily through our Website but may also derive revenue from sales of merchandise through other channels. Our revenue is derived primarily from merchandise sold at a point in time and shipped to customers. Merchandise sales are fulfilled with inventory sourced through our partners or from our owned inventory. The vast majority of our sales, however, are fulfilled from inventory sourced through our partners.
Revenue is recognized when control of the product passes to the customer, typically at the date of delivery of the merchandise to the customer or the date a service is provided and is recognized in an amount that reflects the expected consideration to be received in exchange for such goods or services. As such, customer orders are recorded as unearned revenue prior to delivery of products or services ordered. As we ship high volumes of packages through multiple carriers, we use estimates to determine which shipments are delivered and, therefore, recognized as revenue at the end of the period. Our delivery date estimates are based on average shipping transit times, which are calculated using the following factors: (i) the type of shipping carrier (as carriers have different in-transit times); (ii) the fulfillment source (either our warehouses, those warehouses we control, or those of our partners); (iii) the delivery destination; and (iv) actual transit time experience, which shows that delivery date is typically one to seven business days from the date of shipment. We review and update our estimates on a quarterly basis based on our actual transit time experience. However, actual shipping times may differ from our estimates.
Generally, we require authorization from credit card or other payment vendors whose services we offer to our customers (such as PayPal, Apple Pay, Klarna), or verification of receipt of payment, before we ship products to consumers or business purchasers. We generally receive payments from our customers before our payments to our suppliers are due. We do not recognize assets associated with costs to obtain or fulfill a contract with a customer.
Shipping and handling is considered a fulfillment activity, as it takes place prior to the customer obtaining control of the merchandise, and fees charged to customers are included in net revenue upon completion of our performance obligation. We present revenue net of sales taxes, discounts, and expected refunds.
Our merchandise sales contracts include terms that could cause variability in the transaction price for items such as discounts, credits, or sales returns. Accordingly, the transaction price for product sales includes estimates of variable consideration to the extent it is probable that a significant reversal of revenue recognized will not occur. At the time of sale, we estimate a sales return liability for the variable consideration based on historical experience, which is recorded within Accrued liabilities in the consolidated balance sheet. We record an allowance for returns based on current period revenues and historical returns experience. We analyze actual historical returns, current economic trends and changes in order volume and acceptance of our products when evaluating the adequacy of the sales returns allowance in any accounting period.
We evaluate the criteria outlined in ASC 606-10-55, Principal versus Agent Considerations, in determining whether it is appropriate to record the gross amount of merchandise sales and related costs or the net amount earned as commissions. When we are the principal in a transaction and control the specific good or service before it is transferred to the customer, revenue is recorded gross; otherwise, revenue is recorded on a net basis. Through contractual terms with our partners, we have the ability to control the promised goods or services and as a result record the majority of our revenue on a gross basis.
Loyalty program
We have a customer membership program called Beyond+ for which we sell annual memberships. For Beyond+ memberships, we record membership fees as unearned revenue and we recognize revenue ratably over the membership period.
Members earn dollars for qualifying purchases made on our Bed Bath & Beyond website. As such, the initial transaction price giving rise to the reward dollar is allocated to each separate performance obligation based upon its relative standalone selling price. In determining the stand-alone selling price, we incorporate assumptions about the redemption rates of loyalty points. We recognize revenue for loyalty program reward dollars when customers redeem such rewards as part of a purchase on our Bed Bath & Beyond website.
We record the standalone value of reward dollars earned in unearned revenue at the time the reward dollars are earned. Loyalty program reward dollars expire 90 days after the customer's membership expires. We recognize estimated reward dollar breakage, to which we expect to be entitled, over the expected redemption period in proportion to actual redemptions by customers.
We also drive customer loyalty and trip frequency through the Welcome Rewards loyalty program, which provides customers with exclusive benefits and offers across the Bed Bath & Beyond website.
Advertising Revenue
Advertising revenues are derived primarily from sponsored links and display advertisements that are placed on our Website, distributed via email, or sent out as direct mailers. Advertising revenue is recognized in revenue when the advertising services are rendered. Advertising revenues were less than 3% of total net revenues for all periods presented.
Unearned Revenue
When the timing of our provision of goods or services is different from the timing of the payments made by our customers, we recognize a contract liability (customer payment precedes performance).
Customer orders are recorded as unearned revenue when payment is received prior to delivery of products or services ordered. We record amounts received for Beyond+ membership fees as unearned revenue and we recognize it ratably over the membership period. We record loyalty program reward dollars earned from purchases as unearned revenue at the time they are earned based upon the relative standalone selling price of the loyalty program reward dollar and we recognize it as revenue in proportion to the estimated pattern of rights exercised by the customer. If reward dollars are not redeemed, we recognize revenue upon expiration. In addition, we sell gift cards and record related unearned revenue at the time of the sale. We sell gift cards without expiration dates and we recognize revenue from a gift card upon redemption of the gift card. The unredeemed portion of our gift cards are recognized in revenue over the expected redemption period based upon the estimated pattern of rights exercised by the customer, if the gift cards are not subject to escheat laws.
Sales returns allowance
Revenue is recorded net of estimated returns. We record an allowance for returns based on current period revenues and historical returns experience. We analyze actual historical returns, current economic trends and changes in order volume and acceptance of our products when evaluating the adequacy of the sales returns allowance in any accounting period.
Cost of goods sold
Our cost of goods sold includes product costs, warehousing costs, outbound shipping costs, and handling and fulfillment costs, and is recorded in the same period in which related revenues have been recorded.
Advertising expense
We expense the costs of producing advertisements the first time the advertising takes place and expense the cost of communicating advertising in the period during which the advertising space or airtime is used. Internet advertising expenses are recognized as incurred based on the terms of the individual agreements, which are generally: 1) a commission for traffic driven to our Website that generates a sale or 2) a referral fee based on the number of clicks on keywords or links to our Website generated during a given period. Advertising expense is included in Sales and marketing expenses in our consolidated statements of operations. Prepaid advertising is included in Prepaids and other current assets in our consolidated balance sheets.
Stock-based compensation
We measure compensation expense for our outstanding unvested restricted stock awards at fair value on the date of grant and recognize compensation expense over the service period for awards at the greater of a straight-line basis or on an accelerated schedule when vesting of the share-based awards exceeds a straight-line basis. When an award is forfeited prior to the vesting date, we recognize an adjustment for the previously recognized expense in the period of the forfeiture. See Note 18—Stock-Based Awards.
We use the Black-Scholes option pricing model to determine the fair value of our employee stock purchase plan shares. The determination of the fair value of stock-based payment awards on the date of grant using an option pricing model is affected by our stock price and assumptions regarding a number of complex and subjective variables. These variables include our expected stock price volatility over the expected term of the awards, actual and projected employee stock option exercise behaviors, a risk-free interest rate and any expected dividends.
We use the Monte-Carlo valuation model to determine the fair value of the portion of our performance shares and performance share options with market conditions. The determination of the fair value of stock-based payment awards on the date of grant using the Monte-Carlo valuation model is affected by our stock price and assumptions regarding a number of complex and subjective variables. These variables include our expected stock price volatility, a risk-free interest rate, the probability of reaching the stock price performance targets, and a 20-trading-day average stock price. The portion of our performance shares with performance conditions are measured at fair value on the date of grant and the probability of the awards meeting the performance condition is not included in the grant date fair value, but is assessed quarterly for expense recognition. Compensation expense for these awards are recognized using a graded vesting schedule over the requisite service
period. To the extent that a market-based vesting award is forfeited following completion of the requisite service period, compensation expense for accounting purposes is not reversed.
Loss contingencies
In the normal course of business, we are involved in legal proceedings and other potential loss contingencies. We accrue a liability for such matters when it is probable that a loss has been incurred and the amount, or range of amounts, can be reasonably estimated. When only a range of probable loss can be estimated, the most probable amount in the range is accrued. If no amount within this range is a better estimate than any other amount within the range, the minimum amount in the range is accrued. We expense legal fees as incurred (See Note 15—Commitments and Contingencies).
Income taxes
Income taxes are accounted for under the asset and liability method, which requires the recognition of deferred tax assets and liabilities for the expected future tax consequences of events that have been included in the financial statements. Under this method, deferred tax assets and liabilities are determined on the basis of the differences between the financial statements and tax bases of assets and liabilities using enacted tax rates in effect for the year in which the differences are expected to reverse. The effect of a change in tax rates on deferred tax assets and liabilities is recognized in income in the period that includes the enactment date.
We recognize deferred tax assets to the extent that we believe these assets are more likely than not to be realized. In evaluating our ability to recover our deferred tax assets within the jurisdiction from which they arise, we consider all available positive and negative evidence, including projected future taxable income, scheduled reversals of our deferred tax liabilities, tax planning strategies, and results of recent operations. Our projections of future taxable income are subject to changes in how we do business, economic outlook, political climate, and other conditions such as supply chain challenges, inflation, rising interest rates, geopolitical events, and other macroeconomic conditions, and judgment is required in determining our ability to use our deferred tax assets.
We record uncertain tax positions in accordance with ASC 740 on the basis of a two-step process whereby (1) we determine whether it is more likely than not that the tax positions will be sustained on the basis of the technical merits of the position and (2) for those tax positions that meet the more-likely-than-not recognition threshold, we recognize the largest amount of tax benefit that is more than 50 percent likely to be realized upon ultimate settlement with the related tax authority. We recognize interest and penalties related to unrecognized tax benefits within the income tax expense line in the accompanying consolidated income statements. Accrued interest and penalties are included within the related tax liability line in our consolidated balance sheets.
Net loss per share
Basic net loss per common share is computed by dividing net loss attributable to common shares by the weighted average number of common shares outstanding during the period.
Diluted net loss per share is computed by dividing net loss attributable to common shares by the weighted average number of common and potential common shares outstanding during the period. Potential common shares, comprising incremental common shares issuable from the employee stock purchase plan and restricted stock awards are included in the calculation of diluted net loss per common share to the extent such shares are dilutive.
Recently adopted accounting standards
In November 2023, the FASB issued ASU 2023-07, Segment Reporting (Topic 280): Improvements to Reportable Segment Disclosures, which requires public entities to disclose information about their reportable segments' significant expenses and other segment items on an interim and annual basis. For public entities, ASU 2023-07 is required to be adopted for annual periods beginning after December 15, 2023 and for interim periods within fiscal years beginning after December 15, 2024, with early adoption permitted. The Company adopted the provisions of this ASU as of January 1, 2024, with respect to the annual disclosures beginning with the year ended December 31, 2024 and interim disclosures beginning with the three months ended March 31, 2025, including the presentation of the comparable prior periods. The adoption of this ASU resulted in additional segment reporting disclosures in the Company's consolidated financial statements.
Recently issued accounting standards
In December 2023, the FASB issued ASU 2023-09, Income Taxes (Topic 740): Improvements to Income Tax Disclosures, which requires public entities to disclose disaggregated information about a reporting entity's effective tax rate reconciliation as well as additional information on income taxes paid. For public entities, ASU 2023-09 is required to be adopted for annual periods beginning after December 15, 2024, with early adoption permitted. This ASU will result in us including the additional required disclosures when adopted and does not otherwise have a material impact on the Company's consolidated financial statements.
In November 2024, the FASB issued ASU 2024-03, Income Statement—Reporting Comprehensive Income—Expense Disaggregation Disclosures (Subtopic 220-40), which requires public entities to disclose disaggregated information about certain income statement line items in the notes to the financial statements. For public entities, ASU 2024-03 is required to be adopted for annual periods beginning after December 15, 2026 and for interim periods beginning after December 15, 2027, with early adoption permitted. This ASU will result in us including the additional required disclosures when adopted and does not otherwise have a material impact on the Company's consolidated financial statements.
3. FAIR VALUE MEASUREMENT
The following tables summarize our assets and liabilities measured at fair value on a recurring basis using the following levels of inputs as of December 31, 2024 and 2023, as indicated (in thousands):
| | | | | | | | | | | | | | | | | | | | | | | |
| | Fair Value Measurements at December 31, 2024 |
| | Total | | Level 1 | | Level 2 | | Level 3 |
| Assets: | | | | | | | |
| Cash equivalents—Money market mutual funds | $ | 21,799 | | | $ | 21,799 | | | $ | — | | | $ | — | |
| Equity securities, at fair value | 21,640 | | | — | | | — | | | 21,640 | |
| Available-for-sale debt securities (1) | 10,985 | | | — | | | — | | | 10,985 | |
| Debt securities, at fair value (1) | 14,814 | | | — | | | — | | | 14,814 | |
| | | | | | | |
| Total assets | $ | 69,238 | | | $ | 21,799 | | | $ | — | | | $ | 47,439 | |
| | | | | | | |
| | | | | | | |
| | | | | | | |
| | | | | | | |
| | | | | | | | | | | | | | | | | | | | | | | |
| | Fair Value Measurements at December 31, 2023 |
| | Total | | Level 1 | | Level 2 | | Level 3 |
| Assets: | | | | | | | |
| Cash equivalents—Money market mutual funds | $ | 246,425 | | | $ | 246,425 | | | $ | — | | | $ | — | |
| Equity securities, at fair value | 41,046 | | | — | | | — | | | 41,046 | |
| Available-for-sale debt securities (1) | 10,484 | | | — | | | — | | | 10,484 | |
| Trading securities held in a "rabbi trust" (1) | 496 | | | 496 | | | — | | | — | |
| Total assets | $ | 298,451 | | | $ | 246,921 | | | $ | — | | | $ | 51,530 | |
| Liabilities: | | | | | | | |
| | | | | | | |
| Deferred compensation accrual "rabbi trust" (2) | $ | 513 | | | $ | 513 | | | $ | — | | | $ | — | |
| Total liabilities | $ | 513 | | | $ | 513 | | | $ | — | | | $ | — | |
___________________________________________
(1) Included in Prepaids and other current assets and Other long-term assets, net in the consolidated balance sheets.
(2) Included in Accrued liabilities and Other long-term liabilities in the consolidated balance sheets.
The following table provides activity for our Level 3 investments during the periods presented (in thousands):
| | | | | |
| Amount |
| |
| |
| |
| Level 3 investments at December 31, 2022 | $ | 82,787 | |
| Increase due to purchases of Level 3 investments | 10,000 | |
| Decrease in fair value of Level 3 investments | (41,741) | |
| Accrued interest on Level 3 investments | 484 | |
| Level 3 investments at December 31, 2023 | 51,530 | |
| Increase due to purchases of Level 3 investments | 17,000 | |
| Decrease in fair value of Level 3 investments | (21,836) | |
| Accrued interest on Level 3 investments | 745 | |
| Level 3 investments at December 31, 2024 | $ | 47,439 | |
4. ASSETS HELD FOR SALE
In December 2023, the Company committed to a plan to sell its corporate headquarters and associated building loan on the corporate headquarters (the disposal group). In September 2024, the Company entered into an agreement with Salt Lake County, a body corporate and politic of the State of Utah, to sell the Company's corporate headquarters and on December 20, 2024 (the "Closing Date"), consummated the final agreement to sell its corporate headquarters for a total sales price of $52.0 million. As a result, the Company recognized an additional write-down loss for the year ended December 31, 2024 of $3.4 million which is included in Other expense, net in its consolidated statements of operations.
In connection with the sale of the corporate headquarters, the Company entered into a lease agreement that allows the Company to continue to occupy and use the corporate headquarter's data center, comprising of approximately 5,000 square feet within the main building, and permit the data center to be served by the existing building generators (the "Data Center Lease"). Among other terms, the Data Center Lease has an initial term of five years, subject to the Company's right to terminate upon providing 30 days' notice to Salt Lake County.
The corporate headquarters was previously subject to a loan obtained by the Company from LoanCore Capital Markets LLC, with an approximate balance amount owed at closing of $34.5 million, that was repaid through a defeasance process on the Closing Date, including through the purchase of certain securities which were substituted as collateral for such loan.
5. ACCOUNTS RECEIVABLE, NET
Accounts receivable, net consist of the following (in thousands):
| | | | | | | | | | | |
| | December 31, |
| | 2024 | | 2023 |
| Credit card receivables, trade | $ | 9,614 | | | $ | 12,081 | |
| Accounts receivable, trade | 5,282 | | | 4,084 | |
| Other receivables | 3,187 | | | 4,553 | |
| | | |
| 18,083 | | | 20,718 | |
| Less: allowance for credit losses | (2,236) | | | (1,298) | |
| Total accounts receivable, net | $ | 15,847 | | | $ | 19,420 | |
6. PREPAIDS AND OTHER CURRENT ASSETS
Prepaids and other current assets consist of the following (in thousands):
| | | | | | | | | | | |
| | December 31, |
| | 2024 | | 2023 |
| Prepaid maintenance | $ | 8,924 | | | $ | 8,282 | |
| Prepaid other | 3,221 | | | 4,206 | |
| | | |
| Other current assets | 1,876 | | | 2,376 | |
| | | |
| | | |
| Total prepaids and other current assets | $ | 14,021 | | | $ | 14,864 | |
7. PROPERTY AND EQUIPMENT, NET
Property and equipment, net (excluding assets held for sale) consist of the following (in thousands):
| | | | | | | | | | | |
| | December 31, |
| | 2024 | | 2023 |
| Computer hardware and software, including internal-use software and website development | $ | 202,005 | | | $ | 249,208 | |
| | | |
| | | |
| Furniture and equipment | 4,098 | | | 10,919 | |
| | | |
| | | |
| Leasehold improvements | 1,466 | | | 1,795 | |
| 207,569 | | | 261,922 | |
| Less: accumulated depreciation | (184,025) | | | (234,345) | |
| Total property and equipment, net | $ | 23,544 | | | $ | 27,577 | |
Capitalized costs associated with internal-use software and website development, both developed internally and acquired externally, and depreciation of costs for the same periods associated with internal-use software and website development consist of the following (in thousands):
| | | | | | | | | | | | | | | | | |
| Year ended December 31, |
| 2024 | | 2023 | | 2022 |
| Capitalized internal-use software and website development | $ | 12,517 | | | $ | 11,296 | | | $ | 7,915 | |
| Depreciation of internal-use software and website development | 11,354 | | | 7,758 | | | 6,571 | |
Depreciation expense is classified within the corresponding operating expense categories in the consolidated statements of operations as follows (in thousands):
| | | | | | | | | | | | | | | | | |
| Year ended December 31, |
| | 2024 | | 2023 | | 2022 |
| Cost of goods sold | $ | 396 | | | $ | 711 | | | $ | 682 | |
| Technology | 17,150 | | | 14,414 | | | 12,233 | |
| | | | | |
| General and administrative | 464 | | | 3,751 | | | 3,742 | |
| Total depreciation | $ | 18,010 | | | $ | 18,876 | | | $ | 16,657 | |
During the years ended December 31, 2024 and 2023, we retired $58.6 million and $8.6 million, respectively, of fully depreciated property and equipment that were removed from service in 2024 and 2023.
8. INTANGIBLE ASSETS, NET
On March 6, 2024, we entered into an Intellectual Property Asset Purchase Agreement with Zulily ABC, LLC ("Zulily") to acquire certain intellectual property related to the Zulily brand. The aggregate purchase price, inclusive of direct acquisition-related expenses totaled $4.6 million which has been allocated to two major asset categories consisting of $3.9 million for trade names, with an indefinite useful life, and $676,000 for customer lists, with an estimated useful life of five years.
On March 31, 2024, we entered into an Asset Purchase Agreement with Indo Count Global, Inc. to sell certain intellectual property related to the Wamsutta brand which was acquired as part of our purchase of the Bed Bath & Beyond brand in June 2023, for a total sales price of $10.3 million in cash plus the assumption of certain liabilities. On April 18, 2024, we closed the transaction and received $10.3 million in cash proceeds. For the year ended December 31, 2024, we recognized the entire $10.3 million as a gain on the sale which is included in Other expense, net in our consolidated statements of operations.
Intangible assets, net consist of the following (in thousands):
| | | | | | | | | | | |
| December 31, |
| | 2024 | | 2023 |
| Intangible assets subject to amortization, gross (1) | $ | 6,239 | | | $ | 5,331 | |
| Less: accumulated amortization of intangible assets | (3,145) | | | (2,114) | |
| Intangible assets subject to amortization, net | 3,094 | | | 3,217 | |
| Intangible assets not subject to amortization | 27,152 | | | 22,037 | |
| Total intangible assets, net | $ | 30,246 | | | $ | 25,254 | |
___________________________________________(1) At December 31, 2024, the weighted average remaining useful life for intangible assets subject to amortization, gross was 3.4 years.
9. EQUITY SECURITIES
Equity securities consist of the following (in thousands):
| | | | | | | | | | | |
| December 31, |
| 2024 | | 2023 |
| Equity securities accounted for under the equity method under ASC 323 | $ | 56,546 | | | $ | 114,827 | |
| Equity securities accounted for under the equity method under the fair value option | 21,640 | | | 41,046 | |
| | | |
| Total equity securities | $ | 78,186 | | | $ | 155,873 | |
The following table includes our equity securities accounted for under the equity method (ASC 323) and related ownership interest as of December 31, 2024:
| | | | | |
| Ownership
interest |
| Medici Ventures, L.P. | 99% |
| tZERO Group, Inc. | 28% |
| SpeedRoute, LLC | 49% |
| |
| |
| |
| |
| |
| |
| |
| |
| |
| |
| |
The carrying amount of our equity method securities was $78.2 million at December 31, 2024, which is included in Equity securities on our consolidated balance sheets, of which $21.6 million is valued under the fair value option (tZERO and SpeedRoute). These investments are valued using Level 3 inputs, which represents 31.3% of assets measured at fair value. For our investments in Medici Ventures, L.P., tZERO, and SpeedRoute there is no difference in the carrying amount of the assets and liabilities and our maximum exposure to loss, and there is no difference between the carrying amount of our investment in Medici Ventures, L.P. and the amount of underlying equity we have in the entity's net assets.
The following table summarizes the net loss recognized on equity method securities recorded in Other expense, net in our consolidated statements of operations (in thousands):
| | | | | | | | | | | | | | | | | |
| Years ended December 31, |
| 2024 | | 2023 | | 2022 |
| Net loss recognized on our proportionate share of the net assets of our equity method securities | $ | (58,281) | | | $ | (98,663) | | | $ | (25,435) | |
| Decrease in fair value of equity method securities held under fair value option | (19,406) | | | (41,741) | | | (38,488) | |
| | | | | |
Regulation S-X Rules 4-08(g) and 3-09
In accordance with SEC Rules 4-08(g) and 3-09 of Regulation S-X, we must determine which, if any, of our equity method securities is a "significant subsidiary". Regulation S-X mandates the use of three different tests to determine if any of our equity securities are significant subsidiaries: the investment test, the asset test, and the income test. The table below provides the summarized financial information required by Rule 4-08(g) for those equity method securities in aggregate that have met the significance criteria, presented on a quarterly lag (in thousands):
| | | | | | | | | | | |
| December 31, |
| Balance Sheet | 2024 | | 2023 |
| Assets | $ | 63,546 | | | $ | 98,544 | |
| Liabilities | (17,985) | | | (17,166) | |
| Equity | $ | (45,561) | | | $ | (81,378) | |
| | | | | | | | | | | | | | | | | |
| Years ended December 31, |
| Results of Operations | 2024 | | 2023 | | 2022 |
| Revenues | $ | 12,086 | | | $ | 26,404 | | | $ | 31,187 | |
| Pre-tax loss | (20,778) | | | (19,895) | | | (37,619) | |
| Net loss | (20,777) | | | (20,169) | | | (37,477) | |
In accordance with Rule 3-09 of Regulation S-X, separate audited financial statements of Medici Ventures, L.P. for the periods ended September 30, 2024, 2023 and 2022, their fiscal year-ends, are being included as Exhibit 99.3, Exhibit 99.2, and Exhibit 99.1, respectively, and as such are excluded from the table above. In addition, tZERO was deemed not significant for the year ended December 31, 2024, but was significant for the years ended December 31, 2023 and 2022. In accordance with Rule 3-09 of Regulation S-X, separate audited financial statements for tZERO for the years ended December 31, 2023 and 2022, are being included as Exhibit 99.4
10. OTHER LONG-TERM ASSETS, NET
Other long-term assets, net consist of the following (in thousands):
| | | | | | | | | | | |
| | December 31, |
| | 2024 | | 2023 |
| Debt securities carried at fair value | $ | 14,814 | | | $ | — | |
| Available-for-sale debt securities | 10,985 | | | 10,484 | |
| Prepaid other, long-term portion | 3,242 | | | 1,748 | |
| Other long-term assets | 412 | | | 719 | |
| Total other long-term assets, net | $ | 29,453 | | | $ | 12,951 | |
11. ACCRUED LIABILITIES
Accrued liabilities consist of the following (in thousands):
| | | | | | | | | | | |
| | December 31, |
| | 2024 | | 2023 |
| | | |
| Accrued marketing expenses | $ | 27,935 | | | $ | 18,830 | |
| Accounts payable accruals | 12,743 | | | 11,079 | |
| Allowance for returns | 9,526 | | | 8,651 | |
| Accrued compensation and other related costs | 8,345 | | | 12,912 | |
| Sales and other taxes payable | 6,205 | | | 7,034 | |
| Accrued freight | 4,962 | | | 8,478 | |
| Other accrued expenses | 3,898 | | | 6,698 | |
| Total accrued liabilities | $ | 73,614 | | | $ | 73,682 | |
12. BORROWINGS
2020 loan agreements
In March 2020, we entered into two loan agreements. The loan agreements provide a $34.5 million Senior Note, carrying interest at an annual rate of 4.242%, and a $13.0 million Mezzanine Note, carrying interest at an annual rate of 5.002%. The loans carry a blended annual interest rate of 4.45%. The Senior Note is for a 10-year term (stated maturity date is March 6, 2030) and requires interest only payments, with the principal amount and any then unpaid interest due and payable at the end of the 10-year term. The Mezzanine Note has a stated 10-year term, though the agreement requires principal and interest payments monthly over approximately a 46-month payment period. Our debt issuance costs and debt discount are amortized using the straight-line basis which approximates the effective interest method.
In January 2024, we repaid the entire balance under the Mezzanine Note and in December 2024, in connection with the sale of our corporate headquarters, repaid the remaining $34.5 million balance under the Senior Note. See Note 4—Assets Held for Sale for further information.
Revolving line of credit
In October 2024, the Company entered into a Loan and Security Agreement (the "Loan Agreement") with BMO Bank N.A. (in such capacity, "BMO"), pursuant to which BMO agrees to lend the Company up to $25.0 million on a one-year revolving line of credit to aid the Company in securing strategic ventures. In connection with the Loan Agreement, BMO issued a revolving line of credit promissory note (the "Revolving Note") and granted a lien on the cash collateral account specified in the Loan Agreement (the "Cash Collateral Account"). The revolving line of credit bears interest on the unpaid principal balance at an annual rate equal to the Secured Overnight Financing Rate, or SOFR rate, for a one-month interest period plus 1.00%, established by the Federal Reserve Bank of New York. The Company is obligated to pay certain commitment fees on undrawn amounts under the Loan Agreement in amounts specified in the Loan Agreement. The Loan Agreement and Revolving Note will terminate on October 18, 2025 and loans thereunder may be borrowed, repaid, and reborrowed up to such date.
As of December 31, 2024, the outstanding balance on the line of credit was $25.0 million, net of $129,000 of capitalized debt issuance costs. Our total outstanding debt on the line of credit is included in Short-term debt, net on our consolidated balance sheets.
The Loan Agreement is subject to limited affirmative covenants and negative covenants, including the requirement that the Company maintain cash in the Cash Collateral Account in an amount that is three percent greater than BMO's aggregate commitments under the Loan Agreement. We are in compliance with our debt covenants and continue to monitor our ongoing compliance with our debt covenants.
13. LEASES
We have operating leases for warehouses, office space, and data centers. Our leases have remaining lease terms of one year to eight years, some of which may include options to extend the leases perpetually, and some of which may include options to terminate the leases within one year. Variable lease costs include executory costs, such as taxes, insurance, and maintenance.
Due to the sale of our corporate headquarters, in October 2024, we entered into a sublease agreement to rent the third floor of an office building in Murray, Utah consisting of approximately 36,516 square feet of space that will be used as the Company's new corporate headquarters. The sublease commenced in December 2024 for an initial term of 100 months expiring in March 2033.
The components of lease expense were as follows (in thousands):
| | | | | | | | | | | | | | | | | | |
| Years ended December 31, | |
| 2024 | | 2023 | | 2022 | |
| Operating lease cost | $ | 3,240 | | | $ | 5,257 | | | $ | 5,975 | | |
| | | | | | |
| Variable lease cost | 906 | | | 1,300 | | | 1,489 | | |
The following tables provides a summary of other information related to leases (in thousands):
| | | | | | | | | | | | | | | | | |
| Years ended December 31, |
| 2024 | | 2023 | | 2022 |
| Cash payments included in operating cash flows from lease arrangements | $ | 3,253 | | | $ | 5,500 | | | $ | 6,237 | |
| Right-of-use assets obtained in exchange for new operating lease liabilities | 7,170 | | | 836 | | | 437 | |
| | | | | |
The following table provides a summary of balance sheet information related to leases:
| | | | | | | | | | | |
| December 31, |
| 2024 | | 2023 |
| Weighted-average remaining lease term—operating leases | 6.65 years | | 1.57 years |
| Weighted-average discount rate—operating leases | 6 | % | | 7 | % |
Maturity of lease liabilities under our non-cancellable operating leases as of December 31, 2024, are as follows (in thousands):
| | | | | | | | |
| Payments due by period | | |
| 2025 | | $ | 1,749 | |
| 2026 | | 1,241 | |
| 2027 | | 1,127 | |
| 2028 | | 1,085 | |
| 2029 | | 1,114 | |
| Thereafter | | 3,497 | |
| Total lease payments | | 9,813 | |
| Less interest | | 2,019 | |
| Present value of lease liabilities | | $ | 7,794 | |
14. OTHER LONG-TERM LIABILITIES
Other long-term liabilities consist of the following (in thousands):
| | | | | | | | | | | |
| | December 31, |
| | 2024 | | 2023 |
| Unearned revenue, long-term portion | $ | 4,583 | | | $ | 5,583 | |
| Income taxes payable, long-term portion | 3,675 | | | 3,684 | |
| Other long-term liabilities | (349) | | | (160) | |
| Total other long-term liabilities | $ | 7,909 | | | $ | 9,107 | |
15. COMMITMENTS AND CONTINGENCIES
Legal proceedings and contingencies
From time to time, we are involved in litigation concerning consumer protection, employment, intellectual property, claims under the securities laws, and other commercial matters related to the conduct and operation of our business and the sale of products on our Website. In connection with such litigation, we have been in the past and we may be in the future subject to judgments requiring us to pay significant damages or associated costs. In some instances, other parties may have contractual indemnification obligations to us. However, such contractual obligations may prove unenforceable or non-collectible, and if we cannot enforce or collect on indemnification obligations, we may bear the full responsibility for damages, fees, and costs resulting from such litigation. As a result of such litigation, we may also be subject to penalties and equitable remedies that could force us to alter important business practices. Such litigation could be costly and time consuming and could divert or distract our management and key personnel from our business operations. Due to the uncertainty of litigation and depending on the amount and the timing, an unfavorable resolution of some or all of such matters could materially affect our business, results of operations, financial position, or cash flows. The nature of the loss contingencies relating to claims that have been asserted against us are described below.
On September 27, 2019, a purported securities class action lawsuit was filed against us and several of our former executives in the United States District Court of Utah, alleging violations under Section 10(b), Rule 10b-5, Section 20(a), and Section 20A of the Securities Exchange Act of 1934, as amended (the "Exchange Act"). Several similar lawsuits were filed shortly thereafter, all of which were consolidated into a single lawsuit with the original complaint. The Court appointed The Mangrove Partners Master Fund Ltd. as lead plaintiff in January 2020. In March 2020, lead plaintiff filed amended consolidated complaint. On September 28, 2020, the court granted our motion to dismiss the amended consolidated complaint. The plaintiffs filed another amended complaint in January 2021. On September 20, 2021, the court granted our motion to dismiss that complaint and entered judgment in our favor. Lead plaintiff appealed that decision to the United States Court of Appeals for the Tenth Circuit. On October 18, 2021, lead plaintiff filed a Notice of Appeal, appealing the ruling of the district court to the United States Court of Appeals for the Tenth Circuit. On October 15, 2024, the Tenth Circuit affirmed the District Court's order dismissing the case in its entirety. The matter is now closed.
On November 22, 2019, a stockholder derivative suit was filed against us and certain past and present directors and officers of ours in the United States District Court for the District of Delaware, with allegations that include: (i) breach of fiduciary duties, (ii) unjust enrichment, (iii) insider selling and misappropriation of the Company's information, and (iv) contribution under Sections 10(b) and 21D of the Exchange Act. On December 17, 2019, a similar lawsuit was filed in the same court, naming the same defendants, bringing similar claims, and seeking similar relief. These cases were consolidated into a single lawsuit in January 2020. In March 2020, the court entered a stay on litigation, pending the outcome of the securities class action motion to dismiss. On October 15, 2024, the Tenth Circuit affirmed the district court's order dismissing the securities class action in its entirety. On January 21, 2025, plaintiffs filed a notice of voluntary dismissal of this consolidated derivative suit. The matter is now closed.
We establish liabilities when a particular contingency is probable and estimable which are included in Accrued liabilities in our consolidated balance sheets. At December 31, 2024 and 2023, our established liabilities were not material.
16. INDEMNIFICATIONS AND GUARANTEES
During our normal course of business, we have made certain indemnities, commitments, and guarantees under which we may be required to make payments in relation to certain transactions. These indemnities include, but are not limited to, indemnities to various lessors in connection with facility leases for certain claims arising from such facility or lease, the
environmental indemnity we entered into in favor of the lenders under our prior loan agreements, customary indemnification arrangements in underwriting agreements and similar agreements, and indemnities to our directors and officers to the maximum extent permitted under the laws of the State of Delaware. The duration of these indemnities, commitments, and guarantees varies, and in certain cases, is indefinite. In addition, the majority of these indemnities, commitments, and guarantees do not provide for any limitation of the maximum potential future payments we could be obligated to make. As such, we are unable to estimate with any reasonableness our potential exposure under these items. We have not recorded any liability for these indemnities, commitments, and guarantees in the accompanying consolidated balance sheets. We do, however, accrue losses for any known contingent liability, including those that may arise from indemnification provisions, when future payment is both probable and reasonably estimable.
17. STOCKHOLDERS' EQUITY
Common Stock
Each share of common stock has the right to one vote. The holders of common stock are also entitled to receive dividends declared by the Board of Directors out of funds legally available, subject to prior rights of holders of all classes of stock outstanding having priority rights as to dividends.
Preferred stock conversion
On May 12, 2022, Beyond stockholders voted to approve separate proposals to approve the amendment of the Company's Amended and Restated Certificate of Designation for both classes of its preferred stock to provide that each share of our Series A-1 and Series B preferred stock be automatically converted into 0.90 of a share of our common stock (the "Conversion"). On June 10, 2022, in connection with the completion of the Conversion, the Company issued 4,097,697 shares of our common stock in exchange for the outstanding Series A-1 and Series B preferred stock on that date. As the fair value of our common stock issued exceeded the fair value of the Series A-1 and Series B preferred stock exchanged on the Conversion date, we recognized a non-cash deemed dividend to our preferred stockholders of $1.7 million due to the excess fair value per share compared to the conversion ratio. Following the Conversion, the Company eliminated the Series A-1 and Series B preferred stock classes by filing Certificates of Elimination with the Delaware Secretary of State.
JonesTrading Sales Agreement
We entered into a Capital on DemandTM Sales Agreement (the "Sales Agreement") dated June 10, 2024 with JonesTrading Institutional Services LLC ("JonesTrading"), under which we conducted and may in the future conduct "at the market" public offerings of our common stock. Under the Sales Agreement, JonesTrading, acting as our sales agent or principal, may offer our common stock in the market on a daily basis or otherwise as we request from time to time. We have no obligation to sell additional shares under the Sales Agreement, but we may do so from time to time. For the year ended December 31, 2024, we sold 7,002,375 shares of our common stock pursuant to the Sales Agreement and have recognized $43.0 million in proceeds, net of $879,000 of offering costs, including commissions paid to JonesTrading.
Common and Preferred Stock Repurchase Program
On August 17, 2021, we announced that our Board of Directors had approved a stock repurchase program (the "Repurchase Program"), pursuant to which we may, from time to time, purchase shares of our outstanding common stock for an aggregate repurchase price not to exceed $100.0 million at any time through December 31, 2023. On December 21, 2023, we announced that our Board of Directors approved an extension and expansion of the Repurchase Program for an additional two years and expanded the repurchase amount by $50.0 million, for a total repurchase amount of up to $150.0 million of our common stock. The Repurchase Program expires in December 2025.
Repurchases under the Repurchase Program may be effected through open market purchases. The Repurchase Committee designated by the Board of Directors will determine the actual timing, number, and value of any shares repurchased under the Repurchase Program in its discretion using factors including, but not limited to, our stock price and trading volume, general market conditions, and the ongoing assessment of our capital needs. There is no assurance of the number or aggregate price of any shares that we will ultimately repurchase under the Repurchase Program, which may be extended, suspended, or terminated at any time by the Board of Directors.
For the years ended December 31, 2024 and 2023, we did not repurchase any shares of our common stock under the Repurchase Program. For the year ended December 31, 2022, we repurchased $79.8 million of our common stock and $306,000 of our Series A-1 preferred stock under the Repurchase Program at average prices of $32.41 and $42.16 per share, respectively. For the year ended December 31, 2022, we retired 7,244 shares of our Series A-1 preferred stock treasury stock which had been previously repurchased under the Repurchase Program. The retirement increased Accumulated deficit by $306,000. As of December 31, 2024, we had $69.9 million available for future share repurchases under our current repurchase authorization through December 31, 2025.
18. STOCK-BASED AWARDS
We have equity incentive and compensatory plans that provide for the grant of stock-based awards, including restricted stock and performance shares, to employees and board members and provide employees the ability to purchase shares of our common stock through an employee stock purchase plan. Employee accounting applies to equity incentives and compensation granted by the Company to its own employees. When an award is forfeited prior to the vesting date, we recognize an adjustment for the previously recognized expense in the period of the forfeiture.
Stock-based compensation expense is classified within the corresponding operating expense categories on our consolidated statements of operations as follows (in thousands):
| | | | | | | | | | | | | | | | | |
| Years ended December 31, |
| | 2024 | | 2023 | | 2022 |
| Cost of goods sold | $ | 7 | | | $ | 37 | | | $ | 132 | |
| Sales and marketing | 594 | | | 796 | | | 693 | |
| Technology | 6,263 | | | 8,733 | | | 7,659 | |
| General and administrative | 12,391 | | | 13,452 | | | 9,834 | |
| Total stock-based compensation expense | $ | 19,255 | | | $ | 23,018 | | | $ | 18,318 | |
Beyond restricted stock unit awards
The Beyond, Inc. Amended and Restated 2005 Equity Incentive Plan provides for the grant of restricted stock units and other types of equity awards to employees and directors of the Company. The Compensation Committee of the Board of Directors approves grants of restricted stock unit awards to our officers, board members and employees. These restricted stock unit awards generally vest over three years at 33.3% at the end of the first year, 33.3% at the end of the second year and 33.4% at the end of the third year; subject to the recipient's continuing service to us. During the first quarter of fiscal 2024, we changed our vesting schedule for newly granted restricted stock units from three years to four years. These restricted stock unit awards will vest at 25% each year. For the year ended December 31, 2024, we granted 212,950 restricted stock awards with a cumulative grant date fair value of $6.9 million under the new vesting schedule.
The cost of restricted stock units is determined using the fair value of our common stock on the date of the grant and compensation expense is either recognized on a straight-line basis over the vesting schedule or on an accelerated schedule when vesting of restricted stock awards exceeds a straight-line basis. The cumulative amount of compensation expense recognized at any point in time is at least equal to the portion of the grant date fair value of the award that is vested at that date.
Performance Shares
During the year ended December 31, 2024, we granted 1,512,500 performance-based shares ("PSUs") to our executive management team. A portion of each grant of PSUs (25%) is eligible to vest based on our net revenue performance and the remaining portion (75%) is eligible to vest based on our stock price performance. The PSUs tied to stock price performance will be eligible to vest in three installments upon the achievement of three separate stock price hurdles during the three-year period following the grant date, with 33% of the PSUs earned if the average per-share closing price of our common stock over any 20 consecutive trading day period equals or exceeds $40.00 per share (but in no event prior to the first anniversary of the grant date), 33% of the PSUs earned if the average per-share closing price of our common stock over any 20 consecutive trading day period equals or exceeds $50.00 per share (but in no event prior to the second anniversary of the grant date), and 34% of the PSUs earned if the average per share closing price of our common stock over any 20 consecutive trading day period equals or exceeds $60.00 per share (but in no event prior to the third anniversary of the grant date), in each case subject to the recipient’s
continued service through the vesting date. If a stock price hurdle is not achieved during the three years following the grant date, the portion of the award tied to such stock price hurdle will be forfeited.
The PSUs tied to net revenue performance will vest based on our net revenue over three years, with one-third of the PSUs eligible to vest on each of the first, second, and third anniversaries of the grant date, subject to the recipient’s continued service through the vesting date. To be eligible to vest in any tranche of the PSUs tied to net revenue performance, we must meet the GAAP net revenue goal established for the applicable year.
For the portion of the PSUs that vest based on our net revenue performance, we recognize expense as compensation cost, the fair value on the date of grant over the performance period, taking into account the probability that we will satisfy the performance goals. For the portion of the PSUs that vest based on stock price hurdles, which is a market condition, we use a Monte Carlo valuation model to estimate the fair value as of the date of grant and expense compensation cost over the vesting period regardless of whether the market condition is ultimately satisfied.
Weighted-average assumptions used in the Monte Carlo valuation model were as follows:
| | | | | | | | | | | | | | | |
| | December 31, 2024 | | | | |
| | | | | | | | | | | |
| Expected volatility | 72.27 | % | | | | | | | | | | |
| Risk-free interest rate | 4.33 | % | | | | | | | | | | |
| Expected term | 2.99 years | | | | | | | | | | |
| Expected dividend yield | 0.00 | % | | | | | | | | | | |
| | | | | | | | | | | |
Stock-based compensation related to the PSUs is included in the stock-based compensation expense table above combined with the expense associated with our restricted stock units, performance share options, and ESPP. Stock-based compensation related to the PSUs was $5.9 million for the year ended December 31, 2024.
Performance Share Options
During the year ended December 31, 2024, we granted a performance-based option to purchase 2,250,000 shares of our common stock to our Executive Chairman of the Board of Directors (the "Performance Share Option"). The Performance Share Option will be eligible to vest in three installments upon the achievement of three separate stock price hurdles during the four-year period following the grant date, with 500,000 of the shares subject to the Performance Share Option, having an exercise price of $45.00 per share, becoming vested if the average per-share closing price of our common stock over any 20 consecutive trading day period following the grant date but on or prior to the second anniversary of the grant date equals or exceeds $45.00 per share (but in no event will this tranche vest prior to the first anniversary of the grant date); 750,000 of the shares subject to the Performance Share Option, having an exercise price of $50.00 per share, becoming vested if the average per-share closing price of our common stock over any 20 consecutive trading day period following the grant date but on or prior to the third anniversary of the grant date equals or exceeds $50.00 per share (but in no event will this tranche vest prior to the second anniversary of the grant date); and 1,000,000 of the shares subject to the Performance Share Option, having an exercise price of $60.00 per share, becoming vested if the average per-share closing price of our common stock over any 20 consecutive trading day period following the grant date but on or prior to the fourth anniversary of the grant date equals or exceeds $60.00 per share (but in no event will this tranche vest prior to the third anniversary of the grant date), in each case subject to the Executive Chairman's continued service through the vesting date. If a stock price hurdle is not achieved during the performance period following the grant date, the portion of the award tied to such stock price hurdle will be forfeited.
The fair value of the Performance Share Option is determined using a Monte Carlo valuation model to estimate the fair value as of the date of grant and we will expense compensation cost over the vesting period regardless of whether the market condition is ultimately satisfied.
Weighted-average assumptions used in the Monte Carlo valuation model were as follows:
| | | | | | | | | | | | | | | |
| | December 31, 2024 | | | | |
| | | | | | | | | | | |
| Expected volatility | 75.42 | % | | | | | | | | | | |
| Risk-free interest rate | 4.42 | % | | | | | | | | | | |
| Expected term | 3.75 years | | | | | | | | | | |
| Expected dividend yield | 0.00 | % | | | | | | | | | | |
| | | | | | | | | | | |
Stock-based compensation related to the Performance Share Option is included in stock-based compensation expense table above combined with the expense associated with our restricted stock units, PSUs, and ESPP. Stock-based compensation related to the performance share options was $2.4 million for the year ended December 31, 2024.
The following table summarizes restricted stock unit, PSU, and Performance Share Option award activity (in thousands, except fair value data):
| | | | | | | | | | | | | | | | | | | | | | | | | | | | | | | | | | | |
| | 2024 | | 2023 | | 2022 |
| | Units | | Weighted
Average
Grant Date
Fair Value | | Units | | Weighted
Average
Grant Date
Fair Value | | Units | | Weighted
Average
Grant Date
Fair Value |
| Outstanding—beginning of year | 984 | | | $ | 29.60 | | | 781 | | | $ | 50.17 | | | 663 | | | $ | 56.37 | |
| Granted at fair value | 4,068 | | | 10.68 | | | 1,101 | | | 20.92 | | | 618 | | | 42.75 | |
| Vested | (441) | | | 35.33 | | | (550) | | | 40.27 | | | (295) | | | 43.32 | |
| Forfeited | (1,047) | | | 18.89 | | | (348) | | | 31.43 | | | (205) | | | 57.77 | |
| Outstanding—end of year | 3,564 | | | $ | 20.98 | | | 984 | | | $ | 29.60 | | | 781 | | | $ | 50.17 | |
At December 31, 2024, 2.5 million shares of stock remained available for future grants under the Plan.
Employee Stock Purchase Plan
The 2021 Employee Stock Purchase Plan (the "ESPP") grants our eligible employees a right to purchase shares of our common stock at a discount through payroll deductions of up to 25% of eligible compensation, subject to a cap of $21,250 in any calendar year. The ESPP provides for consecutive 24-month offering periods beginning March 1 and September 1 of each year. Each offering period shall consist of four consecutive six-month purchase periods. The first offering period under the ESPP commenced on September 1, 2021, with the first purchase date occurring on February 28, 2022.
On each purchase date, participating employees will purchase shares of our common stock at a price per share equal to 85% of the lesser of the fair market value of our common stock on (i) the offering date of the offering period or (ii) the purchase date (the "look-back" period). If the stock price of our common stock on any purchase date in an offering period is lower than the stock price on the offering date of that offering period, every participant in the offering will automatically be withdrawn from the offering after the purchase of shares on such purchase date and automatically enrolled in a new offering period commencing immediately subsequent to such purchase date.
The maximum number of shares of common stock that may be issued under the ESPP in aggregate is 3.0 million shares. For the years ended December 31, 2024 and 2023, 119,425 shares and 117,687 shares, respectively were purchased at an average price per share of $12.23 and $16.25, respectively. At December 31, 2024, approximately 2.7 million shares of common stock remained available under the ESPP.
The ESPP is considered a compensatory plan and the fair value of the discount and the look-back period will be estimated using the Black-Scholes option pricing model and expense will be recognized straight-line over the 24-month offering period. We recognized $1.1 million, $1.7 million and $2.4 million in share-based compensation expense related to the ESPP for the years ended December 31, 2024, 2023 and 2022, respectively, which are included in the stock compensation expense table above combined with the expense associated with our restricted stock units.
19. EMPLOYEE RETIREMENT PLAN
We have a 401(k) defined contribution plan which permits participating employees to defer a portion of their compensation, subject to limitations established by the Internal Revenue Code. During the years ended December 31, 2024, 2023 and 2022, employees who completed 3 months of service and are 21 years of age or older are qualified to participate in the plan which matches 100% of the first 6% of each participant's contributions to the plan subject to IRS limits. Matching contributions vest immediately. Participant contributions also vest immediately. Our matching contribution totaled $4.3 million, $5.0 million and $5.7 million for the years ended December 31, 2024, 2023 and 2022, respectively. We made no discretionary contributions to eligible participants for the years ended December 31, 2024, 2023 and 2022, respectively.
20. REVENUE AND CONTRACT LIABILITY
Unearned revenue
Unearned revenue consists of the following (in thousands):
| | | | | | | | | | | |
| | December 31, |
| | 2024 | | 2023 |
| Loyalty program membership fees and reward points | $ | 13,918 | | | $ | 16,449 | |
| In store credits | 11,462 | | | 11,947 | |
| Unearned product revenue on undelivered product | 11,192 | | | 14,821 | |
| Unearned product revenue on unshipped orders | 3,610 | | | 4,098 | |
| Other | 2,913 | | | 2,282 | |
| Total unearned revenue | $ | 43,095 | | | $ | 49,597 | |
The following table provides information about unearned revenue from contracts with customers, including significant changes in unearned revenue balances during the period (in thousands):
| | | | | |
| Amount |
| Unearned revenue at December 31, 2022 | $ | 44,480 | |
| Increase due to deferral of revenue at period end, net | 35,290 | |
| Decrease due to beginning contract liabilities recognized as revenue | (30,173) | |
| Unearned revenue at December 31, 2023 | 49,597 | |
| Increase due to deferral of revenue at period end, net | 32,802 | |
| Decrease due to beginning contract liabilities recognized as revenue | (39,304) | |
| Unearned revenue at December 31, 2024 | $ | 43,095 | |
Our total unearned revenue related to outstanding loyalty program rewards was $11.1 million and $12.1 million at December 31, 2024 and 2023, respectively. Breakage income related to loyalty program rewards and gift cards is recognized in Net revenue in our consolidated statements of operations. Breakage included in revenue was $7.2 million, $5.1 million, and $4.4 million for the years ended December 31, 2024, 2023, and 2022, respectively. The timing of revenue recognition of these reward dollars is driven by actual customer activities, such as redemptions and expirations. At December 31, 2024 and 2023, we had an additional $4.6 million and $5.6 million, respectively, of unearned contract revenue classified within Other long-term liabilities on our consolidated balance sheets.
Sales returns allowance
The following table provides additions to and deduction from the sales returns allowance, which is included in our Accrued liabilities balance in our consolidated balance sheets (in thousands):
| | | | | |
| Amount |
| Allowance for returns at December 31, 2021 | $ | 13,923 | |
| Additions to the allowance | 161,492 | |
| Deductions from the allowance | (165,193) | |
| Allowance for returns at December 31, 2022 | 10,222 | |
| Additions to the allowance | 121,939 | |
| Deductions from the allowance | (123,510) | |
| Allowance for returns at December 31, 2023 | 8,651 | |
| Additions to the allowance | 105,353 | |
| Deductions from the allowance | (104,478) | |
| Allowance for returns at December 31, 2024 | $ | 9,526 | |
21. INTEREST INCOME, NET
Interest income, net consisted of the following (in thousands):
| | | | | | | | | | | | | | | | | |
| | Years ended December 31, |
| | 2024 | | 2023 | | 2022 |
| Interest income | $ | 8,968 | | | $ | 13,769 | | | $ | 4,903 | |
| Interest expense | (2,203) | | | (1,762) | | | (1,938) | |
| Total interest income, net | $ | 6,765 | | | $ | 12,007 | | | $ | 2,965 | |
22. OTHER EXPENSE, NET
Other expense, net consisted of the following (in thousands):
| | | | | | | | | | | | | | | | | |
| | Years ended December 31, |
| | 2024 | | 2023 | | 2022 |
| Gain on sale of intangible assets | $ | 10,275 | | | $ | — | | | $ | — | |
| Gain on disposal of cryptocurrencies | — | | | 6,361 | | | — | |
| Loss from equity method securities | (77,687) | | | (140,404) | | | (63,923) | |
| | | | | |
| Write-down of assets held for sale | (3,385) | | | (25,875) | | | — | |
| Loss on debt securities carried at fair value | (2,430) | | | — | | | — | |
| Loss on equity securities | — | | | (36) | | | (137) | |
| | | | | |
| | | | | |
| | | | | |
| Other | (680) | | | (70) | | | 235 | |
| Total other expense, net | $ | (73,907) | | | $ | (160,024) | | | $ | (63,825) | |
23. INCOME TAXES
For financial reporting purposes, loss before income taxes includes the following components (in thousands):
| | | | | | | | | | | | | | | | | |
| | Years ended December 31, |
| | 2024 | | 2023 | | 2022 |
| United States loss | $ | (259,395) | | | $ | (267,058) | | | $ | (35,272) | |
| Foreign income | 1,284 | | | 936 | | | 1,420 | |
| Total loss before income taxes | $ | (258,111) | | | $ | (266,122) | | | $ | (33,852) | |
The provision for income taxes for 2024, 2023 and 2022 consists of the following (in thousands):
| | | | | | | | | | | | | | | | | |
| | Years ended December 31, |
| | 2024 | | 2023 | | 2022 |
| Current: | | | | | |
| Federal | $ | — | | | $ | (55) | | | $ | 802 | |
| State | 167 | | | 369 | | | 1,874 | |
| Foreign | 233 | | | 58 | | | 112 | |
| Total current | 400 | | | 372 | | | 2,788 | |
| Deferred: | | | | | |
| Federal | 119 | | | 37,160 | | | (1,275) | |
| State | 118 | | | 4,201 | | | (50) | |
| Foreign | 47 | | | (13) | | | (79) | |
| Total deferred | 284 | | | 41,348 | | | (1,404) | |
| Total provision for income taxes | $ | 684 | | | $ | 41,720 | | | $ | 1,384 | |
The provision for income taxes for 2024, 2023 and 2022 differ from the amounts computed by applying the U.S. federal income tax rate of 21% to loss before income taxes for the following reasons (in thousands):
| | | | | | | | | | | | | | | | | |
| | Year ended December 31, |
| | 2024 | | 2023 | | 2022 |
| U.S. federal income tax benefit at statutory rate | $ | (54,203) | | | $ | (55,886) | | | $ | (7,109) | |
| State income tax expense, net of federal benefit | (9,444) | | | (12,297) | | | (1,170) | |
| | | | | |
| Research and development credit | (2,071) | | | (3,245) | | | (2,956) | |
| Global intangible low-tax income | 360 | | | (736) | | | 919 | |
| Other, net | 391 | | | (1) | | | (67) | |
| Non-deductible executive compensation | 1,286 | | | 762 | | | 905 | |
| | | | | |
| Stock-based compensation expense | 728 | | | 2,477 | | | 219 | |
| Change in valuation allowance | 63,637 | | | 110,646 | | | 10,643 | |
| Total provision for income taxes | $ | 684 | | | $ | 41,720 | | | $ | 1,384 | |
The components of our deferred tax assets and liabilities as of December 31, 2024 and 2023 are as follows (in thousands):
| | | | | | | | | | | |
| | December 31, |
| | 2024 | | 2023 |
| Deferred tax assets: | | | |
| Net operating loss carryforwards | $ | 73,925 | | | $ | 29,440 | |
| Basis difference in equity securities | 53,335 | | | 34,729 | |
| Capitalized software development | 33,064 | | | 25,840 | |
| Research and development tax credits | 26,040 | | | 24,202 | |
| Unearned revenue | 7,324 | | | 7,925 | |
| Accrued expenses | 3,325 | | | 4,275 | |
| Reserves and other | 2,270 | | | 2,551 | |
| Operating lease liabilities | 1,902 | | | 861 | |
| Other tax credits and carryforwards | 261 | | | 270 | |
| Property and equipment, net held for sale | — | | | 6,484 | |
| Intangible assets | — | | | 117 | |
| Gross deferred tax assets | 201,446 | | | 136,694 | |
| Valuation allowance | (195,742) | | | (132,105) | |
| Total deferred tax assets | 5,704 | | | 4,589 | |
| Deferred tax liabilities: | | | |
| | | |
| Property and equipment, net | (3,378) | | | (3,125) | |
| Operating lease right-of-use assets | (1,664) | | | (786) | |
| Intangible assets | (487) | | | — | |
| Prepaid expenses | (368) | | | (587) | |
| Total deferred tax liabilities | (5,897) | | | (4,498) | |
| Total deferred tax assets (liabilities), net | $ | (193) | | | $ | 91 | |
At December 31, 2024, we have federal net operating loss carryforwards with no expiration date of approximately $283.2 million; the utilization of these net operating loss carryforwards is limited to 80% of taxable income in any given year. We have state net operating loss carryforwards with no expiration date of approximately $115.2 million; the utilization of these net operating loss carryforwards is limited to 80% of taxable income in the state in any given year. We also have state net operating loss carryforwards of approximately $169.0 million that expire between 2033 and 2044.
At December 31, 2024, we have federal research credit carryforwards of approximately $30.9 million that expire between 2031 and 2044. We also have state research credit carryforwards of approximately $9.9 million that expire between 2025 and 2038. Ownership changes under Internal Revenue Code Section 382 could limit the amount of net operating losses or credit carryforwards that can be used in the future.
Each quarter we assess on a jurisdictional basis whether it is more likely than not that our deferred tax assets will be realized under ASC Topic 740. We have no carryback ability, and therefore we must rely on future taxable income, including tax planning strategies and future reversals of taxable temporary differences, to recover our deferred tax assets. We assess available positive and negative evidence to estimate whether we will generate sufficient future taxable income to use our existing deferred tax assets. A significant piece of objective negative evidence evaluated as of December 31, 2024, is our cumulative loss position over a three-year period. Such objective negative evidence limits our ability to consider other more subjective evidence such as our projections for future growth. On the basis of this evaluation we intend to maintain a valuation allowance against our deferred tax assets for the U.S. jurisdiction, not supported by reversals of taxable temporary differences. For the year ended December 31, 2024, the total increase in the valuation allowance was $63.6 million. We intend to continue maintaining a valuation allowance on our net U.S. deferred tax assets until there is sufficient evidence to support the reversal of all or some portion of these allowances. The amount of the deferred tax asset considered realizable could be adjusted if objective negative evidence in the form of cumulative losses is no longer present and additional weight is given to subjective evidence such as our projections for growth. We will continue to monitor the need for a valuation allowance against our deferred tax assets on a quarterly basis.
A reconciliation of the beginning and ending unrecognized tax benefits, excluding interest and penalties, as of December 31, 2024, 2023 and 2022 is as follows (in thousands):
| | | | | | | | | | | | | | | | | |
| | Year ended December 31, |
| | 2024 | | 2023 | | 2022 |
| Beginning balance | $ | 15,020 | | | $ | 13,488 | | | $ | 11,961 | |
| Additions for tax positions related to the current year | 1,121 | | | 1,258 | | | 1,083 | |
| Additions (reductions) for tax positions taken in prior years | (452) | | | 274 | | | 444 | |
| | | | | |
| | | | | |
| Ending balance | $ | 15,689 | | | $ | 15,020 | | | $ | 13,488 | |
Included in the balance of unrecognized tax benefits as of December 31, 2024, 2023 and 2022, are approximately $15.7 million, $15.0 million, and $13.5 million, respectively, of tax benefits that, if recognized, and the valuation allowance against our net deferred tax assets were released, would affect the effective tax rate. We believe it is reasonably possible that these unrecognized tax benefits will continue to increase in the future.
Accrued interest and penalties on unrecognized tax benefits as of December 31, 2024 and 2023 were $1.4 million and $1.3 million, respectively.
We are subject to taxation in the United States and various state and foreign jurisdictions. Tax years beginning in 2020 are subject to examination by taxing authorities, although net operating loss and credit carryforwards from all years are subject to examinations and adjustments for at least three years following the year in which the attributes are used.
As we repatriate foreign earnings for use in the United States, the distributions will generally be exempt from federal and foreign income taxes but may be subject to certain state taxes. As of December 31, 2024, the cumulative amount of foreign earnings considered permanently reinvested upon which taxes have not been provided, and the corresponding unrecognized deferred tax liability, was not material.
24. NET LOSS PER SHARE
The following table sets forth the computation of basic and diluted net loss per common share for the periods indicated (in thousands, except per share data):
| | | | | | | | | | | | | | | | | |
| | Year ended December 31, |
| | 2024 | | 2023 | | 2022 |
| Numerator: | | | | | |
| Net loss | $ | (258,795) | | | $ | (307,842) | | | $ | (35,236) | |
| | | | | |
| | | | | |
| Less: Preferred stock dividends—issued | — | | | — | | | 1,697 | |
| | | | | |
| | | | | |
| Net loss attributable to common stockholders | $ | (258,795) | | | $ | (307,842) | | | $ | (36,933) | |
| | | | | |
| | | | | |
| | | | | |
| | | | | |
| | | | | |
| | | | | |
| | | | | |
| | | | | |
| Denominator: | | | | | |
| | | | | |
| | | | | |
| Weighted average shares of common shares outstanding—basic | 46,542 | | | 45,214 | | | 44,323 | |
| | | | | |
| | | | | |
| Weighted average shares of common shares outstanding—diluted | 46,542 | | | 45,214 | | | 44,323 | |
| | | | | |
| | | | | |
| | | | | |
| | | | | |
| | | | | |
| | | | | |
| | | | | |
| Net loss per share of common stock: | | | | | |
| Basic | $ | (5.56) | | | $ | (6.81) | | | $ | (0.83) | |
| Diluted | $ | (5.56) | | | $ | (6.81) | | | $ | (0.83) | |
The following shares were excluded from the calculation of diluted shares outstanding as their effect would have been anti-dilutive (in thousands):
| | | | | | | | | | | | | | | | | |
| | Year ended December 31, |
| | 2024 | | 2023 | | 2022 |
| Restricted stock units, PSUs, and Performance Share Option | 2,647 | | | 984 | | | 781 | |
| Employee stock purchase plan | 190 | | | 186 | | | 116 | |
25. BUSINESS SEGMENTS
Segment Operations: We currently have one reportable segment, which is our Retail business. The reportable segment is comprised of our Overstock.com operating segment and our Bed Bath & Beyond operating segment, which are aggregated into a single reportable Retail segment due to their similar economic characteristics and business activities. The Bed Bath & Beyond operating segment includes results from our Zulily brand, which are not material to the business and are not separately reviewed by the Chief Operating Decision Maker. The reporting segment primarily derives revenues from e-commerce sales of home furnishing merchandise through our suite of websites and mobile apps.
The accounting policies of the Retail segment are the same as those described in the summary of significant accounting policies. The Chief Operating Decision Maker (CODM), who is our Executive Chairman of the Board of Directors, makes resource allocation decisions based on reports that focus predominantly on Net Revenues, Gross Profit, Sales and Marketing as a percentage of Gross Profit, Technology, and General & Administrative expenses as a percentage of Gross Profit, as well as Operating Income (Loss) measured under GAAP, as reported on our Consolidated Statement of Operations. The CODM also receives our Consolidated Cash and Cash Equivalents balance as a measure of liquidity as reported on our Consolidated Balance Sheet. The CODM uses Operating Income (Loss) to evaluate income generated from segment resources in deciding whether to reinvest profits into the retail segment or into other parts of the entity, such as to make acquisitions or investments. The CODM also uses Operating Income (Loss) to monitor budget versus actual results. The monitoring of budgeted versus actual results is used in assessing performance of the segment and in establishing bonus metrics.
Cost of Goods Sold, Sales & Marketing, Technology, General & Administrative, and Customer Service and Merchant Fees, as reported on our Consolidated Statement of Operations, are significant expenses evaluated by our CODM. The measure of segments assets is reported on the Consolidated Balance Sheet as Cash and Cash Equivalents.
26. SUBSEQUENT EVENTS
Buy Buy Baby
On January 30, 2025, the Company entered into an asset purchase agreement with BBBY Acquisition Co. LLC to acquire the rights of the Buy Buy Baby brand, as well as assets, information and content related to the associated Buy Buy Baby website, including trademarks, domain names, data, information, content, select contractual rights, and goodwill associated with the brand for a total purchase price of $5.0 million payable at the closing of the transaction following a due diligence period. In addition, we are assuming an immaterial amount of outstanding payable liabilities owed to existing Buy Buy Baby merchandise vendors through supplier transition agreements signed directly with the vendors. On February 21, 2025, we closed the transaction and paid the total purchase price of $5.0 million at closing.
Kirkland's Stores, Inc.
On February 5, 2025, the stockholders of Kirkland's voted to approve the conversion of $8.5 million of Kirkland's convertible debt (plus accrued interest) held by the Company into shares of Kirkland's common stock. Further, Kirkland's stockholders also voted to approve the Company’s incremental $8 million investment in Kirkland's in exchange for receiving shares in Kirkland's common stock pursuant to a Subscription Agreement and Investor Rights Agreement. Upon the approval of the Conversion and the Subscription Agreement, the Company owns a total of approximately 40% of Kirkland’s outstanding shares of common stock leaving the $8.5 million of Kirkland's non-convertible promissory note (plus accrued interest) remaining.
The Container Store Group, Inc.
On January 31, 2025, the Company terminated the agreements entered into with The Container Store Group in October 2024 as previously disclosed in our Form 10-Q for the quarter ended September 30, 2024 filed with the SEC on October 25, 2024.
Schedule II
Valuation and Qualifying Accounts
(in thousands)
| | | | | | | | | | | | | | | | | | | | | | | | | |
| Balance at
Beginning of
Year | | Charged to
Expense | | Deductions | | | | Balance at
End of Year |
| Year ended December 31, 2024 | | | | | | | | | |
| Deferred tax valuation allowance | $ | 132,105 | | | $ | 63,637 | | | $ | — | | | | | $ | 195,742 | |
| Allowance for sales returns | 8,651 | | | 105,353 | | | 104,478 | | | | | 9,526 | |
| Allowance for doubtful accounts | 1,298 | | | 938 | | | — | | | | | 2,236 | |
| Year ended December 31, 2023 | | | | | | | | | |
| Deferred tax valuation allowance | $ | 21,459 | | | $ | 110,646 | | | $ | — | | | | | $ | 132,105 | |
| Allowance for sales returns | 10,222 | | | 121,939 | | | 123,510 | | | | | 8,651 | |
| Allowance for doubtful accounts | 3,223 | | | (1,925) | | | — | | | | | 1,298 | |
| Year ended December 31, 2022 | | | | | | | | | |
| Deferred tax valuation allowance | $ | 11,384 | | | $ | 10,075 | | | $ | — | | | | | $ | 21,459 | |
| Allowance for sales returns | 13,923 | | | 161,492 | | | 165,193 | | | | | 10,222 | |
| Allowance for doubtful accounts | 2,429 | | | 794 | | | — | | | | | 3,223 | |
ITEM 9. CHANGES IN AND DISAGREEMENTS WITH ACCOUNTANTS ON ACCOUNTING AND FINANCIAL DISCLOSURE
None.
ITEM 9A. CONTROLS AND PROCEDURES
Evaluation of Disclosure Controls and Procedures
We carried out an evaluation of our disclosure controls and procedures as required by Rule 13a-15(e) and 15d-15(e) of the Exchange Act under the supervision and with the participation of our principal executive officer and principal financial officer, as of the end of the period covered by this report. Based on this evaluation, our principal executive officer and principal financial officer concluded that our disclosure controls and procedures were effective at the level of reasonable assurance.
Limitations on Disclosure Controls and Procedures
In designing and evaluating our disclosure controls and procedures, management recognizes that any controls and procedures, no matter how well designed and operated, can provide only reasonable assurance of achieving the desired control objectives. Management does not expect, however, that our disclosure controls and procedures will prevent or detect all error and fraud. Any control system, no matter how well designed and operated, is based upon certain assumptions and can provide only reasonable, not absolute, assurance that its objectives will be met. Further, no evaluation of controls can provide absolute assurance that misstatements due to error or fraud will not occur or that all control issues and instances of fraud, if any, within the Company have been detected.
Changes in Internal Control Over Financial Reporting
There were no changes in our internal control over financial reporting that occurred during the quarter ended December 31, 2024, that have materially affected, or are reasonably likely to materially affect, our internal control over financial reporting.
Management's Report on Internal Control over Financial Reporting
Management of the Company is responsible for establishing and maintaining adequate internal control over financial reporting as defined in Rules 13a-15(f) and 15d-15(f) under the Exchange Act.
Management has assessed the effectiveness of our internal control over financial reporting as of December 31, 2024. In making our assessment of the effectiveness of internal control over financial reporting, management used the criteria set forth in Internal Control—Integrated Framework (2013) issued by the Committee of Sponsoring Organizations of the Treadway Commission ("COSO"). Based on this assessment, management has concluded that, as of December 31, 2024, our internal control over financial reporting was effective.
The effectiveness of our internal control over financial reporting as of December 31, 2024 has been audited by KPMG LLP, an independent registered public accounting firm, as stated in their report which is included below.
Report of Independent Registered Public Accounting Firm
To the Stockholders and Board of Directors
Beyond, Inc.:
Opinion on Internal Control Over Financial Reporting
We have audited Beyond, Inc. and subsidiaries' (the Company) internal control over financial reporting as of December 31, 2024, based on criteria established in Internal Control - Integrated Framework (2013) issued by the Committee of Sponsoring Organizations of the Treadway Commission. In our opinion, the Company maintained, in all material respects, effective internal control over financial reporting as of December 31, 2024, based on criteria established in Internal Control - Integrated Framework (2013) issued by the Committee of Sponsoring Organizations of the Treadway Commission.
We also have audited, in accordance with the standards of the Public Company Accounting Oversight Board (United States) (PCAOB), the consolidated balance sheets of the Company as of December 31, 2024 and 2023, the related consolidated statements of operations, comprehensive loss, changes in stockholders' equity, and cash flows for each of the years in the three-year period ended December 31, 2024, and the related notes and financial statement schedule II (collectively, the consolidated financial statements), and our report dated February 25, 2025 expressed an unqualified opinion on those consolidated financial statements.
Basis for Opinion
The Company's management is responsible for maintaining effective internal control over financial reporting and for its assessment of the effectiveness of internal control over financial reporting, included in the accompanying Management's Report on Internal Control over Financial Reporting. Our responsibility is to express an opinion on the Company's internal control over financial reporting based on our audit. We are a public accounting firm registered with the PCAOB and are required to be independent with respect to the Company in accordance with the U.S. federal securities laws and the applicable rules and regulations of the Securities and Exchange Commission and the PCAOB.
We conducted our audit in accordance with the standards of the PCAOB. Those standards require that we plan and perform the audit to obtain reasonable assurance about whether effective internal control over financial reporting was maintained in all material respects. Our audit of internal control over financial reporting included obtaining an understanding of internal control over financial reporting, assessing the risk that a material weakness exists, and testing and evaluating the design and operating effectiveness of internal control based on the assessed risk. Our audit also included performing such other procedures as we considered necessary in the circumstances. We believe that our audit provides a reasonable basis for our opinion.
Definition and Limitations of Internal Control Over Financial Reporting
A company's internal control over financial reporting is a process designed to provide reasonable assurance regarding the reliability of financial reporting and the preparation of financial statements for external purposes in accordance with generally accepted accounting principles. A company's internal control over financial reporting includes those policies and procedures that (1) pertain to the maintenance of records that, in reasonable detail, accurately and fairly reflect the transactions and dispositions of the assets of the company; (2) provide reasonable assurance that transactions are recorded as necessary to permit preparation of financial statements in accordance with generally accepted accounting principles, and that receipts and expenditures of the company are being made only in accordance with authorizations of management and directors of the company; and (3) provide reasonable assurance regarding prevention or timely detection of unauthorized acquisition, use, or disposition of the company's assets that could have a material effect on the financial statements.
Because of its inherent limitations, internal control over financial reporting may not prevent or detect misstatements. Also, projections of any evaluation of effectiveness to future periods are subject to the risk that controls may become inadequate because of changes in conditions, or that the degree of compliance with the policies or procedures may deteriorate.
/s/ KPMG LLP
Salt Lake City, Utah
February 25, 2025
ITEM 9B. OTHER INFORMATION
(a) Disclosure in lieu of reporting on a Current Report on Form 8-K.
None.
(b) Insider trading arrangements and policies.
On November 11, 2024, Dave Nielsen, President of the Company, adopted a trading plan intended to satisfy the affirmative defense of Rule 10b5-1(c) to sell up to 5,528 shares of Beyond, Inc. common stock between March 5, 2025 and December 31, 2025, subject to certain conditions.
On November 11, 2024, Adrianne Lee, Chief Financial & Administrative Officer of the Company, adopted a trading plan intended to satisfy the affirmative defense of Rule 10b5-1(c) to sell up to 4,400 shares of Beyond, Inc. common stock between March 5, 2025 and December 31, 2025, subject to certain conditions.
In the fourth quarter of 2024, other than Mr. Nielsen and Ms. Lee, no director or officer of the Company adopted or terminated a "Rule 10b5-1 trading arrangement" or "non-Rule 10b5-1 trading arrangement," as each term is defined in Item 408(a) of Regulation S-K.
ITEM 9C. DISCLOSURE REGARDING FOREIGN JURISDICTIONS THAT PREVENT INSPECTIONS
Not applicable.
PART III
ITEM 10. DIRECTORS, EXECUTIVE OFFICERS AND CORPORATE GOVERNANCE
Information regarding our Executive Officers required by Item 10 of Part III is set forth in Part I, Item 1 Business under "Information About Our Executive Officers." We have adopted a Code of Business Conduct and Ethics ("Code"), which applies to all employees of the Company, including our principal executive officer, principal financial officer, and principal accounting officer or controller, or persons performing similar functions. We intend to disclose any amendments to the Code and any waivers granted to our principal executive officer, principal financial officer or principal accounting officer or other persons to the extent required by applicable rules or regulations in the Investor Relations section of our Website, www.beyond.com. We will provide a copy of the Code to any person without any charge upon request in writing addressed to Beyond, Inc. Attn: Investor Relations, 433 West Ascension Way, 3rd Floor, Murray, UT 84123.
The remaining information required by this Item be included in our definitive proxy statement for our 2025 annual meeting of stockholders, which proxy statement will be filed with the SEC not later than 120 days after the close of our fiscal year ended December 31, 2024, and is incorporated herein by reference.
ITEM 11. EXECUTIVE COMPENSATION
The information required by this Item be included in our definitive proxy statement for our 2025 annual meeting of stockholders, which proxy statement will be filed with the SEC not later than 120 days after the close of our fiscal year ended December 31, 2024, and is incorporated herein by reference.
ITEM 12. SECURITY OWNERSHIP OF CERTAIN BENEFICIAL OWNERS AND MANAGEMENT AND RELATED STOCKHOLDER MATTERS
The information required by this Item be included in our definitive proxy statement for our 2025 annual meeting of stockholders, which proxy statement will be filed with the SEC not later than 120 days after the close of our fiscal year ended December 31, 2024, and is incorporated herein by reference.
ITEM 13. CERTAIN RELATIONSHIPS AND RELATED TRANSACTIONS, AND DIRECTOR INDEPENDENCE
The information required by this Item be included in our definitive proxy statement for our 2025 annual meeting of stockholders, which proxy statement will be filed with the SEC not later than 120 days after the close of our fiscal year ended December 31, 2024, and is incorporated herein by reference.
ITEM 14. PRINCIPAL ACCOUNTING FEES AND SERVICES
Our independent registered public accounting firm is KPMG LLP, Salt Lake City, Utah, Auditor Firm ID: 185.
The remaining information required by this Item be included in our definitive proxy statement for our 2025 annual meeting of stockholders, which proxy statement will be filed with the SEC not later than 120 days after the close of our fiscal year ended December 31, 2024, and is incorporated herein by reference.
PART IV
ITEM 15. EXHIBITS, FINANCIAL STATEMENT SCHEDULES
(a) The following documents are filed as part of this Annual Report on Form 10-K:
(1) Financial Statements:
The financial statements are filed as part of this Annual Report on Form 10-K under "Item 8. Financial Statements and Supplementary Data."
(2) Financial Statement Schedules:
Schedule II Valuation and Qualifying Accounts is provided in "Item 8. Financial Statements and Supplementary Data." Other schedules have been omitted as they are either not required, not applicable, or the information has otherwise been shown in the consolidated financial statements or notes thereto under "Item 8. Financial Statements and Supplementary Data."
(3) Exhibits:
See exhibits listed under Part (b) below.
(b) Exhibits
| | | | | | | | | | | | | | | | | | | | | | | | | | | | | | | | | | | | | | |
| Exhibit Number | | Exhibit Description | | Form | | File No. | | Exhibit | | Filing Date | | Filed Herewith |
| 2.1* | | | | 8-K | | 000-49799 | | 2.1 | | June 13, 2023 | | |
| | | | | | | | | | | | |
| 3.1 | | | | 10-Q | | 000-49799 | | 3.1 | | July 29, 2014 | | |
| | | | | | | | | | | | |
| 3.2 | | | | 8-K | | 000-49799 | | 3.2 | | November 6, 2023 | | |
| | | | | | | | | | | | |
| 3.3 | | | | 8-K | | 001-41850 | | 3.1 | | May 24, 2024 | | |
| | | | | | | | | | | | |
| 3.4 | | | | 8-K | | 001-41850 | | 3.3 | | May 24, 2024 | | |
| | | | | | | | | | | | |
| | | | | | | | | | | | |
| | | | | | | | | | | | |
| | | | | | | | | | | | |
| | | | | | | | | | | | |
| | | | | | | | | | | | |
| | | | | | | | | | | | |
| | | | | | | | | | | | |
| | | | | | | | | | | | |
| | | | | | | | | | | | |
| | | | | | | | | | | | |
| | | | | | | | | | | | |
| | | | | | | | | | | | |
| | | | | | | | | | | | |
| | | | | | | | | | | | |
| 4.1 | | | | S-1/A | | 333-83728 | | 4.1 | | May 6, 2002 | | |
| | | | | | | | | | | | |
| | | | | | | | | | | | |
| | | | | | | | | | | | |
| | | | | | | | | | | | |
| | | | | | | | | | | | |
| | | | | | | | | | | | |
| | | | | | | | | | | | |
| 4.2 | | | | | | | | | | | | X |
| | | | | | | | | | | | |
| 4.3 | | | | S-3ASR | | 333-280076 | | 4.3 | | June 10, 2024 | | |
| | | | | | | | | | | | |
| | | | | | | | | | | | |
| | | | | | | | | | | | |
| | | | | | | | | | | | |
| | | | | | | | | | | | |
| | | | | | | | | | | | |
| | | | | | | | | | | | |
| | | | | | | | | | | | |
| | | | | | | | | | | | |
10.1(a) | | | | 10-K | | 000-49799 | | 10.1 | | March 18, 2019 | | |
| | | | | | | | | | | | |
10.2(a) | | | | 8-K | | 000-49799 | | 10.1 | | May 23, 2023 | | |
| | | | | | | | | | | | |
| | | | | | | | | | | | |
| | | | | | | | | | | | |
| | | | | | | | | | | | | | | | | | | | | | | | | | | | | | | | | | | | | | |
| Exhibit Number | | Exhibit Description | | Form | | File No. | | Exhibit | | Filing Date | | Filed Herewith |
10.3(a) | | | | 8-K | | 001-41850 | | 10.1 | | May 24, 2024 | | |
| | | | | | | | | | | | |
| | | | | | | | | | | | |
| | | | | | | | | | | | |
| | | | | | | | | | | | |
| | | | | | | | | | | | |
| | | | | | | | | | | | |
| | | | | | | | | | | | |
| | | | | | | | | | | | |
| | | | | | | | | | | | |
| | | | | | | | | | | | |
| | | | | | | | | | | | |
| | | | | | | | | | | | |
| | | | | | | | | | | | |
| | | | | | | | | | | | |
| | | | | | | | | | | | |
| | | | | | | | | | | | |
| | | | | | | | | | | | |
| | | | | | | | | | | | |
10.4(a) | | | | 10-Q | | 001-41850 | | 10.1 | | May 8, 2024 | | |
| | | | | | | | | | | | |
10.5(a) | | | | 10-Q | | 001-41850 | | 10.4 | | July 31, 2024 | | |
| | | | | | | | | | | | |
10.6(a) | | | | 8-K | | 001-41850 | | 10.2 | | May 24, 2024 | | |
| | | | | | | | | | | | |
| 10.7 | | | | 8-K | | 001-41850 | | 10.1 | | September 17, 2024 | | |
| | | | | | | | | | | | |
10.8(a) | | | | 10-K | | 000-49799 | | 10.16 | | March 13, 2020 | | |
| | | | | | | | | | | | |
10.9(a) | | | | 8-K | | 000-49799 | | 10.1 | | March 24, 2023 | | |
| | | | | | | | | | | | |
| 10.10 | | Transaction Agreement, dated as of January 25, 2021, by and among Overstock.com, Inc., Medici Ventures, Inc., Pelion MV GP, L.L.C. and Pelion, Inc., as guarantor | | 8-K | | 000-49799 | | 10.1 | | January 25, 2021 | | |
| | | | | | | | | | | | |
| 10.11 | | | | 8-K | | 000-49799 | | 10.1 | | April 26, 2021 | | |
| | | | | | | | | | | | |
| 10.12 | | First Amendment, dated August 30, 2021, to the Medici Ventures, L.P. Limited Partnership Agreement, dated April 23, 2021, between Overstock.com, Inc., and Pelion MV GP, L.L.C. | | 10-Q | | 000-49799 | | 10.1 | | November 4, 2021 | | |
| | | | | | | | | | | | |
10.13(a) | | | | DEF 14A | | 000-49799 | | Annex A | | March 25, 2021 | | |
| | | | | | | | | | | | |
10.14(a) | | | | 10-Q | | 001-41850 | | 10.1 | | May 8, 2024 | | |
| | | | | | | | | | | | |
10.15(a) | | | | 10-Q | | 001-41850 | | 10.1 | | May 8, 2024 | | |
| | | | | | | | | | | | |
| | | | | | | | | | | | | | | | | | | | | | | | | | | | | | | | | | | | | | |
| Exhibit Number | | Exhibit Description | | Form | | File No. | | Exhibit | | Filing Date | | Filed Herewith |
10.16(a) | | | | 10-Q | | 001-41850 | | 10.1 | | July 31, 2024 | | |
| | | | | | | | | | | | |
10.17(a) | | | | 10-Q | | 001-41850 | | 10.1 | | May 8, 2024 | | |
| | | | | | | | | | | | |
| 10.18 | | | | | | | | | | | | X |
| | | | | | | | | | | | |
| 10.19 | | | | | | | | | | | | X |
| | | | | | | | | | | | |
| 10.20 | | | | | | | | | | | | X |
| | | | | | | | | | | | |
| 10.21 | | | | | | | | | | | | X |
| | | | | | | | | | | | |
| 10.22 | | | | | | | | | | | | X |
| | | | | | | | | | | | |
| 10.23 | | | | | | | | | | | | X |
| | | | | | | | | | | | |
| 10.24 | | | | | | | | | | | | X |
| | | | | | | | | | | | |
| 19 | | | | | | | | | | | | X |
| | | | | | | | | | | | |
| 21 | | | | 10-K | | 001-41850 | | 21 | | February 23, 2024 | | |
| | | | | | | | | | | | |
| 23.1 | | | | | | | | | | | | X |
| | | | | | | | | | | | |
| 23.2 | | | | | | | | | | | | X |
| | | | | | | | | | | | |
| 23.3 | | | | | | | | | | | | X |
| | | | | | | | | | | | |
| 23.4 | | | | | | | | | | | | X |
| | | | | | | | | | | | |
| 23.5 | | | | | | | | | | | | X |
| | | | | | | | | | | | |
| | | | | | | | | | | | | | | | | | | | | | | | | | | | | | | | | | | | | | |
| Exhibit Number | | Exhibit Description | | Form | | File No. | | Exhibit | | Filing Date | | Filed Herewith |
| 24 | | Powers of Attorney (see signature page) | | | | | | | | | | X |
| | | | | | | | | | | | |
| 31.1 | | | | | | | | | | | | X |
| | | | | | | | | | | | |
| 31.2 | | | | | | | | | | | | X |
| | | | | | | | | | | | |
| 32.1 | | | | | | | | | | | | X |
| | | | | | | | | | | | |
| 32.2 | | | | | | | | | | | | X |
| | | | | | | | | | | | |
| 97 | | | | 10-K | | 001-41850 | | 97 | | February 23, 2024 | | |
| | | | | | | | | | | | |
| 99.1 | | | | 10-K | | 000-49799 | | 99.2 | | February 24, 2023 | | |
| | | | | | | | | | | | |
| 99.2 | | | | 10-K | | 001-41850 | | 99.3 | | February 23, 2024 | | |
| | | | | | | | | | | | |
| 99.3 | | | | | | | | | | | | X |
| | | | | | | | | | | | |
| 99.4 | | | | 10-K/A | | 001-41850 | | 99.5 | | October 31, 2024 | | |
| | | | | | | | | | | | |
| | | | | | | | | | | | |
| | | | | | | | | | | | |
| | | | | | | | | | | | | | | | | | | | | | | | | | | | | | | | | | | | | | |
| Exhibit Number | | Exhibit Description | | Form | | File No. | | Exhibit | | Filing Date | | Filed Herewith |
| 101 | | The following financial statements from the Company's Annual Report on Form 10-K for the year ended December 31, 2024 formatted in Inline XBRL: (i) Consolidated Balance Sheets at December 31, 2024 and 2023; (ii) Consolidated Statements of Operations for the years ended December 31, 2024, 2023, and 2022; (iii) Consolidated Statements of Comprehensive Loss for the years ended December 31, 2024, 2023, and 2022; (iv) Consolidated Statements of Changes in Stockholders' Equity for the years ended December 31, 2024, 2023, and 2022; (v) Consolidated Statements of Cash Flows for the years ended December 31, 2024, 2023, and 2022; and (vi) Notes to Consolidated Financial Statements | | | | | | | | | | X |
| 104 | | The cover page from the Company's Annual Report on Form 10-K for the year ended December 31, 2024, formatted in Inline XBRL (included as Exhibit 101) | | | | | | | | | | X |
__________________________________________
*Certain schedules and exhibits have been omitted pursuant to Item 601(a)(5) of Regulation S-K. The Reporting Company agrees to furnish supplementally a copy of any omitted schedule or exhibit to the SEC upon request.
(a)Management contract or compensatory plan or arrangement.
ITEM 16. FORM 10-K SUMMARY
Not applicable.
SIGNATURES
Pursuant to the requirements of Section 13 or 15(d) of the Securities Exchange Act of 1934, the registrant has duly caused this report to be signed on its behalf by the undersigned, thereunto duly authorized, on February 25, 2025.
| | | | | | | | | | | | | | |
| | | BEYOND, INC. |
| | | By: | | /s/ DAVID J. NIELSEN |
| | | | David J. Nielsen |
| | | | President (Principal Executive Officer) |
| | | | |
| | | | |
| | | | |
| | | | |
Pursuant to the requirements of the Securities Exchange Act of 1934, as amended, this report has been signed below by the following persons on behalf of the registrant and in the capacities and on the dates indicated.
POWER OF ATTORNEY
KNOW ALL PERSONS BY THESE PRESENTS, that each person whose signature appears below constitutes and appoints each of David J. Nielsen and Adrianne B. Lee, his or her attorneys-in-fact, each with the power of substitution, for him or her in any and all capacities, to sign any amendments to this Annual Report on Form 10-K and to file the same, with exhibits thereto and other documents in connection therewith, with the Securities and Exchange Commission, hereby ratifying and conforming all that said attorney-in-fact, or his or their substitute or substitutes, may do or cause to be done by virtue hereof.
| | | | | | | | | | | | | | |
| Signature | | Title | | Date |
| | | | | |
| /s/ DAVID J. NIELSEN | | President (Principal Executive Officer) | | February 25, 2025 |
| David J. Nielsen | | | |
| | | | |
| | | | |
| | | |
| | | | |
| /s/ MARCUS A. LEMONIS | | Executive Chairman of the Board of Directors | | February 25, 2025 |
| Marcus A. Lemonis | | | |
| | | | |
| /s/ ADRIANNE B. LEE | | Chief Financial & Administrative Officer (Principal Financial Officer and Principal Accounting Officer) | | February 25, 2025 |
| Adrianne B. Lee | | | |
| | | | |
| /s/ JOANNA C. BURKEY | | Director | | February 25, 2025 |
| Joanna C. Burkey | | | |
| | | | |
| /s/ BARCLAY F. CORBUS | | Director | | February 25, 2025 |
| Barclay F. Corbus | | | |
| | | | |
| /s/ JOSEPH J. TABACCO, JR. | | Director | | February 25, 2025 |
| Joseph J. Tabacco, Jr. | | | |
| | | | |
| /s/ ROBERT J. SHAPIRO | | Director | | February 25, 2025 |
| Robert J. Shapiro | | | |
| | | | |
| /s/ WILLIAM B. NETTLES, JR. | | Director | | February 25, 2025 |
| William B. Nettles, Jr. | | | |