Exhibit 99.2

Exhibit 99.2
Prudential Financial, Inc.
Investor Day
December 5, 2006
Investor Day 12.05.06
0
Forward-Looking Statements
Certain of the statements included in this presentation constitute forward-looking statements within the meaning of the U.S. Private Securities Litigation Reform Act of 1995. It is possible that actual results may differ materially from any expectations or predictions expressed in this presentation. Words such as “expects,” “believes,” “anticipates,” “includes,” “plans,” “assumes,” “estimates,” “projects,” “intends,” “should,” “will,” “shall,” or variations of such words are generally part of forward-looking statements. Forward-looking statements are made based on management’s current expectations and beliefs concerning future developments and their potential effects upon Prudential Financial, Inc. and its subsidiaries. There can be no assurance that future developments affecting Prudential Financial, Inc. and its subsidiaries will be those anticipated by management. These forward-looking statements are not a guarantee of future performance and involve risks and uncertainties, and there are certain important factors that could cause actual results to differ, possibly materially, from expectations or estimates reflected in such forward-looking statements, including, among others: (1) general economic, market and political conditions, including the performance and fluctuations of stock, real estate, and other financial markets; (2) interest rate fluctuations; (3) reestimates of our reserves for future policy benefits and claims; (4) differences between actual experience regarding mortality, morbidity, persistency, surrender experience, interest rates or market returns and the assumptions we use in pricing our products, establishing liabilities and reserves or for other purposes; (5) changes in our assumptions related to deferred policy acquisition costs, valuation of business acquired or goodwill; (6) changes in our claims-paying or credit ratings; (7) investment losses and defaults; (8) competition in our product lines and for personnel; (9) changes in tax law; (10) economic, political, currency and other risks relating to our international operations; (11) fluctuations in foreign currency exchange rates and foreign securities markets; (12) regulatory or legislative changes; (13) adverse determinations in litigation or regulatory matters and our exposure to contingent liabilities, including in connection with our divestiture or winding down of businesses; (14) domestic or international military actions, natural or man-made disasters including terrorist activities or pandemic disease, or other events resulting in catastrophic loss of life; (15) ineffectiveness of risk management policies and procedures in identifying, monitoring and managing risks; (16) effects of acquisitions, divestitures and restructurings, including possible difficulties in integrating and realizing the projected results of acquisitions; (17) changes in statutory or U.S. GAAP accounting principles, practices or policies; (18) changes in assumptions for retirement expense; (19) Prudential Financial, Inc.’s primary reliance, as a holding company, on dividends or distributions from its subsidiaries to meet debt payment obligations and continue share repurchases, and the applicable regulatory restrictions on the ability of the subsidiaries to pay such dividends or distributions; and (20) risks due to the lack of legal separation between our Financial Services Businesses and our Closed Block Business.
Prudential Financial, Inc. does not intend, and is under no obligation, to update any particular forward-looking statement included in this presentation.
Prudential Financial, Inc. of the United States is not affiliated with Prudential PLC which is headquartered in the United Kingdom.
Investor Day 12.05.06
Non–GAAP Measure Adjusted operating income is a non-GAAP measure of performance of our Financial Services Businesses. Adjusted operating income excludes “Realized investment gains (losses), net,” as adjusted, and related charges and adjustments. A significant element of realized losses is impairments and losses from sales of credit-impaired securities, the timing of which depends largely on market credit cycles and can vary considerably across periods. The timing of other sales that would result in gains or losses is largely subject to our discretion and influenced by market opportunities. Realized investment gains (losses) representing profit or loss of certain of our businesses which primarily originate investments for sale or syndication to unrelated investors, and those associated with terminating hedges of foreign currency earnings and current period yield adjustments are included in adjusted operating income. Realized investment gains and losses from products that are free standing derivatives or contain embedded derivatives, and from associated derivative portfolios that are part of an economic hedging program related to the risk of those products, are included in adjusted operating income. Adjusted operating income also excludes investment gains and losses on trading account assets supporting insurance liabilities and changes in experience-rated contractholder liabilities due to asset value changes, because these recorded changes in asset and liability values will ultimately accrue to contractholders. Trends in the underlying profitability of our businesses can be more clearly identified without the fluctuating effects of these transactions. In addition, adjusted operating income excludes the results of divested businesses, which are not relevant to our ongoing operations. Discontinued operations, which is presented as a separate component of net income under GAAP, is also excluded from adjusted operating income.
We believe that the presentation of adjusted operating income as we measure it for management purposes enhances understanding of the results of operations of the Financial Services Businesses by highlighting the results from ongoing operations and the underlying profitability of our businesses. However, adjusted operating income is not a substitute for income determined in accordance with GAAP, and the excluded items are important to an understanding of our overall results of operations. The schedules on the following two pages provide a reconciliation of adjusted operating income for the Financial Services Businesses to income from continuing operations in accordance with GAAP. ROE based on adjusted operating income is determined by dividing adjusted operating income after-tax (giving effect to the direct equity adjustment for earnings per share calculation), annualized for interim periods, by average attributed equity excluding unrealized gains and losses on investments. An alternative measure to ROE based on adjusted operating income is return on average equity based on income from continuing operations. Return on average equity based on income from continuing operations represents income from continuing operations after-tax as determined in accordance with GAAP (giving effect to the direct equity adjustment for earnings per share calculation), annualized for interim periods, divided by average total attributed equity for the Financial Services Businesses. Return on average equity based on income from continuing operations is 14.10% and 18.07% for the nine months ended September 30, 2006 and 2005, respectively, and 15.52%, 9.29%, 5.43% and 3.97% for the years ended December 31, 2005, 2004, 2003 and 2002, respectively. Our expectations of Common Stock earnings per share and return on equity are based on after-tax adjusted operating income. Because we do not predict future realized investment gains / losses or recorded changes in asset and liability values that will ultimately accrue to contractholders, we cannot provide a measure of our Common Stock earnings per share or return on equity expectations based on income from continuing operations of the Financial Services Businesses, which is the GAAP measure most comparable to adjusted operating income. For additional information about adjusted operating income and the comparable GAAP measure please refer to our Annual Report on Form 10-K for the year ended December 31, 2005 and our Quarterly Report on Form 10-Q for the quarter ended September 30, 2006, on the Investor Relations Web site at www.investor.prudential.com. Additional historical information relating to the Company’s financial performance, including its third quarter 2006 Quarterly Financial Supplement, is also located on the Investor Relations website. The information referred to above and on the prior page, as well as the risks of our businesses described in our Annual Report on Form 10-K for the year ended December 31, 2005, should be considered by readers when reviewing forward-looking statements contained in this presentation. Investor Day 12.05.06 2

Prudential Financial, Inc.
FINANCIAL HIGHLIGHTS
| | | | | | | | | | | | | | | | | | | | | | | | |
| (in millions, except per share data) | | Year ended December 31,
| | | Nine months ended
| |
| | 2002
| | | 2003
| | | 2004
| | | 2005
| | | Sept 30, 2005
| | | Sept 30, 2006
| |
Financial Services Businesses: | | | | | | | | | | | | | | | | | | | | | | | | |
Pre-tax adjusted operating income by division: | | | | | | | | | | | | | | | | | | | | | | | | |
Insurance Division | | $ | 545 | | | $ | 788 | | | $ | 991 | | | $ | 1,227 | | | $ | 862 | | | $ | 1,010 | |
Investment Division | | | 282 | | | | 289 | | | | 355 | | | | 707 | | | | 711 | | | | 808 | |
International Insurance and Investments Division | | | 757 | | | | 803 | | | | 994 | | | | 1,416 | | | | 1,039 | | | | 1,168 | |
Corporate and other operations | | | 148 | | | | 90 | | | | 176 | | | | 202 | | | | 126 | | | | 78 | |
| | |
|
|
| |
|
|
| |
|
|
| |
|
|
| |
|
|
| |
|
|
|
Total pre-tax adjusted operating income | | | 1,732 | | | | 1,970 | | | | 2,516 | | | | 3,552 | | | | 2,738 | | | | 3,064 | |
Income taxes, applicable to adjusted operating income | | | 582 | | | | 644 | | | | 680 | | | | 1,120 | | | | 830 | | | | 883 | |
| | |
|
|
| |
|
|
| |
|
|
| |
|
|
| |
|
|
| |
|
|
|
Financial Services Businesses after-tax adjusted operating income | | | 1,150 | | | | 1,326 | | | | 1,836 | | | | 2,432 | | | | 1,908 | | | | 2,181 | |
| | |
|
|
| |
|
|
| |
|
|
| |
|
|
| |
|
|
| |
|
|
|
Items excluded from adjusted operating income: | | | | | | | | | | | | | | | | | | | | | | | | |
Realized investment gains (losses), net, and related charges and adjustments | | | (856 | ) | | | (204 | ) | | | 4 | | | | 561 | | | | 563 | | | | (40 | ) |
Investment gains (losses) on trading account assets supporting insurance liabilities, net | | | — | | | | — | | | | (55 | ) | | | (33 | ) | | | (41 | ) | | | (8 | ) |
Change in experience-rated contractholder liabilities due to asset value changes | | | — | | | | — | | | | 1 | | | | (44 | ) | | | (10 | ) | | | 28 | |
Sales practices remedies and costs | | | (20 | ) | | | — | | | | — | | | | — | | | | — | | | | — | |
Divested businesses | | | (10 | ) | | | (171 | ) | | | (24 | ) | | | (16 | ) | | | (5 | ) | | | 13 | |
| | |
|
|
| |
|
|
| |
|
|
| |
|
|
| |
|
|
| |
|
|
|
Total items excluded from adjusted operating income, before income taxes | | | (886 | ) | | | (375 | ) | | | (74 | ) | | | 468 | | | | 507 | | | | (7 | ) |
Income taxes, not applicable to adjusted operating income | | | (494 | ) | | | (122 | ) | | | (58 | ) | | | (401 | ) | | | (480 | ) | | | (31 | ) |
| | |
|
|
| |
|
|
| |
|
|
| |
|
|
| |
|
|
| |
|
|
|
Total items excluded from adjusted operating income, after income taxes | | | (392 | ) | | | (253 | ) | | | (16 | ) | | | 869 | | | | 987 | | | | 24 | |
| | |
|
|
| |
|
|
| |
|
|
| |
|
|
| |
|
|
| |
|
|
|
Income from continuing operations (after-tax) of Financial Services Businesses before extraordinary gain on acquisition and cumulative effect of accounting change | | | 758 | | | | 1,073 | | | | 1,820 | | | | 3,301 | | | | 2,895 | | | | 2,205 | |
Income (loss) from discontinued operations, net of taxes | | | (79 | ) | | | (48 | ) | | | (88 | ) | | | (82 | ) | | | (53 | ) | | | 46 | |
Extraordinary gain on acquisition, net of taxes | | | — | | | | — | | | | 21 | | | | — | | | | — | | | | — | |
Cumulative effect of accounting change, net of taxes | | | — | | | | — | | | | (79 | ) | | | — | | | | — | | | | — | |
| | |
|
|
| |
|
|
| |
|
|
| |
|
|
| |
|
|
| |
|
|
|
Net income of Financial Services Businesses | | | 679 | | | | 1,025 | | | | 1,674 | | | | 3,219 | | | | 2,842 | | | | 2,251 | |
| | |
|
|
| |
|
|
| |
|
|
| |
|
|
| |
|
|
| |
|
|
|
Earnings per share of Common Stock (diluted): | | | | | | | | | | | | | | | | | | | | | | | | |
Financial Services Businesses after-tax adjusted operating income | | $ | 2.06 | | | $ | 2.53 | | | $ | 3.61 | | | $ | 4.83 | | | $ | 3.76 | | | $ | 4.48 | |
Items excluded from adjusted operating income: | | | | | | | | | | | | | | | | | | | | | | | | |
Realized investment gains (losses), net, and related charges and adjustments | | | (1.48 | ) | | | (0.37 | ) | | | 0.01 | | | | 1.08 | | | | 1.07 | | | | (0.08 | ) |
Investment gains (losses) on trading account assets supporting insurance liabilities, net | | | — | | | | — | | | | (0.10 | ) | | | (0.06 | ) | | | (0.08 | ) | | | (0.02 | ) |
Change in experience-rated contractholder liabilities due to asset value changes | | | — | | | | — | | | | — | | | | (0.08 | ) | | | (0.02 | ) | | | 0.06 | |
Sales practices remedies and costs | | | (0.03 | ) | | | — | | | | — | | | | — | | | | — | | | | — | |
Divested businesses | | | (0.02 | ) | | | (0.31 | ) | | | (0.05 | ) | | | (0.04 | ) | | | (0.01 | ) | | | 0.03 | |
| | |
|
|
| |
|
|
| |
|
|
| |
|
|
| |
|
|
| |
|
|
|
Total items excluded from adjusted operating income, before income taxes | | | (1.53 | ) | | | (0.68 | ) | | | (0.14 | ) | | | 0.90 | | | | 0.96 | | | | (0.01 | ) |
Income taxes, not applicable to adjusted operating income | | | (0.86 | ) | | | (0.22 | ) | | | (0.11 | ) | | | (0.76 | ) | | | (0.92 | ) | | | (0.06 | ) |
| | |
|
|
| |
|
|
| |
|
|
| |
|
|
| |
|
|
| |
|
|
|
Total items excluded from adjusted operating income, after income taxes | | | (0.67 | ) | | | (0.46 | ) | | | (0.03 | ) | | | 1.66 | | | | 1.88 | | | | 0.05 | |
| | |
|
|
| |
|
|
| |
|
|
| |
|
|
| |
|
|
| |
|
|
|
Income from continuing operations (after-tax) of Financial Services Businesses before extraordinary gain on acquisition and cumulative effect of accounting change | | | 1.39 | | | | 2.07 | | | | 3.58 | | | | 6.49 | | | | 5.64 | | | | 4.53 | |
Income (loss) from discontinued operations, net of taxes | | | (0.14 | ) | | | (0.09 | ) | | | (0.16 | ) | | | (0.15 | ) | | | (0.10 | ) | | | 0.09 | |
Extraordinary gain on acquisition, net of taxes | | | — | | | | — | | | | 0.04 | | | | — | | | | — | | | | — | |
Cumulative effect of accounting change, net of taxes | | | — | | | | — | | | | (0.15 | ) | | | — | | | | — | | | | — | |
| | |
|
|
| |
|
|
| |
|
|
| |
|
|
| |
|
|
| |
|
|
|
Net income of Financial Services Businesses | | | 1.25 | | | | 1.98 | | | | 3.31 | | | | 6.34 | | | | 5.54 | | | | 4.62 | |
| | |
|
|
| |
|
|
| |
|
|
| |
|
|
| |
|
|
| |
|
|
|
Weighted average number of outstanding Common shares (diluted basis) | | | 578.0 | | | | 548.4 | | | | 531.2 | | | | 520.9 | | | | 524.5 | | | | 497.8 | |
| | | | | | |
Reconciliation to Consolidated Net Income of Prudential Financial, Inc: | | | | | | | | | | | | | | | | | | | | | | | | |
Net income of Financial Services Businesses (above) | | $ | 679 | | | $ | 1,025 | | | $ | 1,674 | | | $ | 3,219 | | | $ | 2,842 | | | $ | 2,251 | |
Net income (loss) of Closed Block Business | | | (485 | ) | | | 239 | | | | 582 | | | | 321 | | | | 334 | | | | 140 | |
| | |
|
|
| |
|
|
| |
|
|
| |
|
|
| |
|
|
| |
|
|
|
Consolidated net income | | | 194 | | | | 1,264 | | | | 2,256 | | | | 3,540 | | | | 3,176 | | | | 2,391 | |
| | |
|
|
| |
|
|
| |
|
|
| |
|
|
| |
|
|
| |
|
|
|
Direct equity adjustments for earnings per share calculations | | $ | 43 | | | $ | 60 | | | $ | 84 | | | $ | 82 | | | $ | 63 | | | $ | 51 | |


Prudential Financial, Inc.
COMBINED STATEMENTS OF OPERATIONS - FINANCIAL SERVICES BUSINESSES
| | | | | | | | | | | | | | | | | | | | | | | | |
(in millions) | | Year ended December 31,
| | | Nine months ended
| |
| | 2002
| | | 2003
| | | 2004
| | | 2005
| | | Sept 30, 2005
| | | Sept 30, 2006
| |
Revenues (1): | | | | | | | | | | | | | | | | | | | | | | | | |
| | | | | | |
Premiums | | $ | 7,195 | | | $ | 7,848 | | | $ | 8,736 | | | $ | 10,128 | | | $ | 7,678 | | | $ | 7,694 | |
| | | | | | |
Policy charges and fee income | | | 1,815 | | | | 1,978 | | | | 2,385 | | | | 2,529 | | | | 1,900 | | | | 1,912 | |
Net investment income | | | 5,020 | | | | 4,913 | | | | 5,728 | | | | 6,810 | | | | 5,000 | | | | 5,618 | |
Asset management fees, commissions and other income | | | 3,979 | | | | 3,258 | | | | 3,065 | | | | 3,608 | | | | 2,660 | | | | 3,044 | |
| | |
|
|
| |
|
|
| |
|
|
| |
|
|
| |
|
|
| |
|
|
|
Total revenues | | | 18,009 | | | | 17,997 | | | | 19,914 | | | | 23,075 | | | | 17,238 | | | | 18,268 | |
| | |
|
|
| |
|
|
| |
|
|
| |
|
|
| |
|
|
| |
|
|
|
Benefits and Expenses (1): | | | | | | | | | | | | | | | | | | | | | | | | |
| | | | | | |
Insurance and annuity benefits | | | 7,662 | | | | 8,158 | | | | 8,897 | | | | 9,990 | | | | 7,551 | | | | 7,818 | |
Interest credited to policyholders’ account balances | | | 1,730 | | | | 1,718 | | | | 2,220 | | | | 2,516 | | | | 1,884 | | | | 2,045 | |
Interest expense | | | 195 | | | | 200 | | | | 296 | | | | 568 | | | | 388 | | | | 663 | |
Deferral of acquisition costs | | | (1,064 | ) | | | (1,270 | ) | | | (1,528 | ) | | | (1,801 | ) | | | (1,362 | ) | | | (1,492 | ) |
Amortization of acquisition costs | | | 739 | | | | 533 | | | | 766 | | | | 910 | | | | 738 | | | | 431 | |
General and administrative expenses | | | 7,015 | | | | 6,688 | | | | 6,747 | | | | 7,340 | | | | 5,301 | | | | 5,739 | |
| | |
|
|
| |
|
|
| |
|
|
| |
|
|
| |
|
|
| |
|
|
|
Total benefits and expenses | | | 16,277 | | | | 16,027 | | | | 17,398 | | | | 19,523 | | | | 14,500 | | | | 15,204 | |
| | |
|
|
| |
|
|
| |
|
|
| |
|
|
| |
|
|
| |
|
|
|
Adjusted operating income before income taxes | | | 1,732 | | | | 1,970 | | | | 2,516 | | | | 3,552 | | | | 2,738 | | | | 3,064 | |
| | |
|
|
| |
|
|
| |
|
|
| |
|
|
| |
|
|
| |
|
|
|
Items excluded from adjusted operating income before income taxes: | | | | | | | | | | | | | | | | | | | | | | | | |
Realized investment gains (losses), net, and related adjustments | | | (862 | ) | | | (161 | ) | | | 62 | | | | 669 | | | | 667 | | | | (70 | ) |
Related charges | | | 6 | | | | (43 | ) | | | (58 | ) | | | (108 | ) | | | (104 | ) | | | 30 | |
| | |
|
|
| |
|
|
| |
|
|
| |
|
|
| |
|
|
| |
|
|
|
Total realized investment gains (losses), net, and related charges and adjustments | | | (856 | ) | | | (204 | ) | | | 4 | | | | 561 | | | | 563 | | | | (40 | ) |
| | |
|
|
| |
|
|
| |
|
|
| |
|
|
| |
|
|
| |
|
|
|
Investment gains (losses) on trading account assets supporting insurance liabilities, net | | | — | | | | — | | | | (55 | ) | | | (33 | ) | | | (41 | ) | | | (8 | ) |
Change in experience-rated contractholder liabilities due to asset value changes | | | — | | | | — | | | | 1 | | | | (44 | ) | | | (10 | ) | | | 28 | |
Sales practices remedies and costs | | | (20 | ) | | | — | | | | — | | | | — | | | | — | | | | — | |
Divested businesses | | | (10 | ) | | | (171 | ) | | | (24 | ) | | | (16 | ) | | | (5 | ) | | | 13 | |
| | |
|
|
| |
|
|
| |
|
|
| |
|
|
| |
|
|
| |
|
|
|
Total items excluded from adjusted operating income before income taxes | | | (886 | ) | | | (375 | ) | | | (74 | ) | | | 468 | | | | 507 | | | | (7 | ) |
| | |
|
|
| |
|
|
| |
|
|
| |
|
|
| |
|
|
| |
|
|
|
Income from continuing operations before income taxes, extraordinary gain on acquisition and cumulative effect of accounting change | | | 846 | | | | 1,595 | | | | 2,442 | | | | 4,020 | | | | 3,245 | | | | 3,057 | |
Income tax expense | | | 88 | | | | 522 | | | | 622 | | | | 719 | | | | 350 | | | | 852 | |
| | |
|
|
| |
|
|
| |
|
|
| |
|
|
| |
|
|
| |
|
|
|
Income from continuing operations before extraordinary gain on acquisition and cumulative effect of accounting change | | | 758 | | | | 1,073 | | | | 1,820 | | | | 3,301 | | | | 2,895 | | | | 2,205 | |
| | |
|
|
| |
|
|
| |
|
|
| |
|
|
| |
|
|
| |
|
|
|
| (1) | | Revenues exclude realized investment gains, net of losses and related charges and adjustments, investment gains, net of losses, on trading account assets supporting insurance liabilities, and revenues of divested businesses. Benefits and expenses exclude charges related to realized investment gains, net of losses; changes in experience-rated contractholder liabilities due to asset value changes, benefits and expenses of divested businesses, and sales practices remedies and costs. |

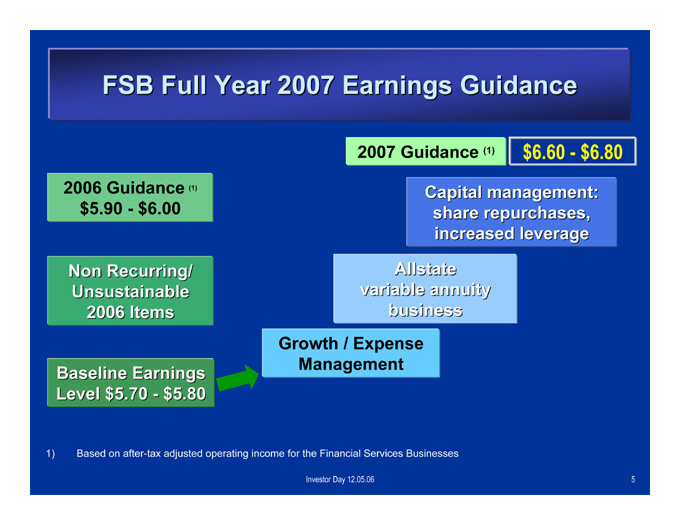
FSB Full Year 2007 Earnings Guidance
2006 Guidance (1) $5.90 - $6.00
Non Recurring/ Unsustainable 2006 Items
Baseline Earnings Level $5.70 - $5.80
2007 Guidance (1) $6.60 - $6.80
Capital management: share repurchases, increased leverage
Allstate variable annuity business Growth / Expense Management
1) Based on after-tax adjusted operating income for the Financial Services Businesses
Investor Day 12.05.06
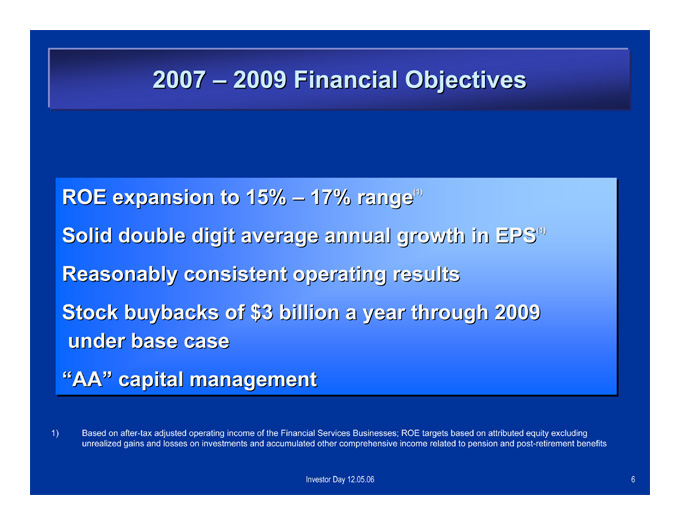
2007 – 2009 Financial Objectives
ROE expansion to 15% – 17% range(1)
Solid double digit average annual growth in EPS(1) Reasonably consistent operating results Stock buybacks of $3 billion a year through 2009 under base case “AA” capital management
1) Based on after-tax adjusted operating income of the Financial Services Businesses; ROE targets based on attributed equity excluding unrealized gains and losses on investments and accumulated other comprehensive income related to pension and post-retirement benefits
Investor Day 12.05.06

Summary
History of successful execution as public company
Well positioned in high return, growth businesses: International, Domestic Retirement & Savings
Rely on high value-added business models to drive superior results
Maintain disciplined capital management
Expect to achieve optimal capital structure under base case within 2 – 3 years
Prudential’s goal is to achieve “differentiated” financial returns through 2009 and beyond: ROE, EPS growth
Investor Day 12.05.06