
Exhibit 99.1
PRUDENTIAL FINANCIAL, INC. INVESTOR DAY 2009

PRUDENTIAL FINANCIAL, INC. INVESTOR DAY 2009
ERIC DURANT
SENIOR VICE PRESIDENT, INVESTOR RELATIONS
Forward-Looking Statements
Certain of the statements included in this presentation constitute forward-looking statements within the meaning of the U. S. Private Securities Litigation Reform Act of 1995. It is possible that actual results may differ materially from any expectations or predictions expressed in this presentation. Words such as “expects,” “believes,” “anticipates,” “includes,” “plans,” “assumes,” “estimates,” “projects,” “intends,” “should,” “will,” “shall,” or variations of such words are generally part of forward-looking statements. Forward-looking statements are made based on management’s current expectations and beliefs concerning future developments and their potential effects upon Prudential Financial, Inc. and its subsidiaries. There can be no assurance that future developments affecting Prudential Financial, Inc. and its subsidiaries will be those anticipated by management. These forward-looking statements are not a guarantee of future performance and involve risks and uncertainties, and there are certain important factors that could cause actual results to differ, possibly materially, from expectations or estimates reflected in such forward-looking statements, including, among others: (1) general economic, market and political conditions, including the performance and fluctuations of fixed income, equity, real estate and other financial markets, particularly in light of severe economic conditions and the severe stress experienced by the global financial markets since the second half of 2007; (2) the availability and cost of external financing for our operations, which has been affected by the stress experienced by the global financial markets; (3) interest rate fluctuations; (4) reestimates of our reserves for future policy benefits and claims; (5) differences between actual experience regarding mortality, morbidity, persistency, surrender experience, interest rates or market returns and the assumptions we use in pricing our products, establishing liabilities and reserves or for other purposes; (6) changes in our assumptions related to deferred policy acquisition costs, valuation of business acquired or goodwill; (7) changes in our claims-paying or credit ratings; (8) investment losses, defaults and counterparty non-performance; (9) competition in our product lines and for personnel; (10) changes in tax law; (11) economic, political, currency and other risks relating to our international operations; (12) fluctuations in foreign currency exchange rates and foreign securities markets; (13) regulatory or legislative changes, including government actions in response to the stress experienced by the global financial markets; (14) adverse determinations in litigation or regulatory matters and our exposure to contingent liabilities, including in connection with our divestiture or winding down of businesses; (15) domestic or international military actions, natural or man-made disasters including terrorist activities or pandemic disease, or other events resulting in catastrophic loss of life; (16) ineffectiveness of risk management policies and procedures in identifying, monitoring and managing risks; (17) effects of acquisitions, divestitures and restructurings, including possible difficulties in integrating and realizing the projected results of acquisitions; (18) changes in statutory or U.S. GAAP accounting principles, practices or policies; (19) changes in assumptions for retirement expense; (20) Prudential Financial, Inc.’s primary reliance, as a holding company, on dividends or distributions from its subsidiaries to meet debt payment obligations and the ability of the subsidiaries to pay such dividends or distributions in light of our ratings objectives and/or applicable regulatory restrictions; and (21) risks due to the lack of legal separation between our Financial Services Businesses and our Closed Block Business. As noted above, the period since the second half of 2007 has been characterized by extreme adverse market and economic conditions. The foregoing risks are even more pronounced in these unprecedented market and economic conditions. Prudential Financial, Inc. does not intend, and is under no obligation, to update any particular forward-looking statement included in this presentation.
Prudential Financial, Inc. of the United States is not affiliated with Prudential PLC which is headquartered in the United Kingdom.
3 Investor Day 12.10.09
Non–GAAP Measures
This presentation includes references to “adjusted operating income.” Adjusted operating income is a non-GAAP measure of performance of our Financial Services Businesses. Adjusted operating income excludes “Realized investment gains (losses), net,” as adjusted, and related charges and adjustments. A significant element of realized investment gains and losses are impairments and credit-related and interest rate-related gains and losses. Impairments and losses from sales of credit-impaired securities, the timing of which depends largely on market credit cycles, can vary considerably across periods. The timing of other sales that would result in gains or losses, such as interest rate-related gains or losses, is largely subject to our discretion and influenced by market opportunities as well as our tax and capital profile.
Realized investment gains (losses) representing profit or loss of certain of our businesses which primarily originate investments for sale or syndication to unrelated investors, and those associated with terminating hedges of foreign currency earnings and current period yield adjustments are included in adjusted operating income. Realized investment gains and losses from products that are free standing derivatives or contain embedded derivatives, and from associated derivative portfolios that are part of an economic hedging program related to the risk of those products, are included in adjusted operating income. Adjusted operating income excludes gains and losses from changes in value of certain assets and liabilities related to foreign currency exchange movements that have been economically hedged, as well as gains and losses on certain investments that are classified as other trading account assets and debt that is carried at fair value.
Adjusted operating income also excludes investment gains and losses on trading account assets supporting insurance liabilities and changes in experience-rated contractholder liabilities due to asset value changes, because these recorded changes in asset and liability values are expected to ultimately accrue to contractholders. Trends in the underlying profitability of our businesses can be more clearly identified without the fluctuating effects of these transactions. In addition, adjusted operating income excludes the results of divested businesses, which are not relevant to our ongoing operations. Discontinued operations, which is presented as a separate component of net income under GAAP, is also excluded from adjusted operating income.
We believe that the presentation of adjusted operating income as we measure it for management purposes enhances understanding of the results of operations of the Financial Services Businesses by highlighting the results from ongoing operations and the underlying profitability of our businesses. However, adjusted operating income is not a substitute for income determined in accordance with GAAP, and the adjustments made to derive adjusted operating income are important to an understanding of our overall results of operations. The schedules on the following pages provide a reconciliation of adjusted operating income to income from continuing operations in accordance with GAAP.
Return on equity (“ROE”) based on adjusted operating income is determined by dividing adjusted operating income after-tax (giving effect to the direct equity adjustment for earnings per share calculation), annualized for interim periods, by average attributed equity for the Financial Services Businesses excluding accumulated other comprehensive income related to unrealized gains and losses on investments and accumulated other comprehensive income related to pension and postretirement benefits.
Our expectations of Common Stock earnings per share and ROE are based on after-tax adjusted operating income. Because we do not predict future realized investment gains / losses or recorded changes in asset and liability values that are expected to ultimately accrue to contractholders, we cannot provide a measure of our Common Stock earnings per share or ROE expectations based on income from continuing operations of the Financial Services Businesses, which is the GAAP measure most comparable to adjusted operating income.
For additional information about adjusted operating income and the comparable GAAP measure please refer to our Annual Report on Form 10-K for the year ended December 31, 2008 and our Quarterly Report on Form 10-Q for the quarter ended September 30, 2009 located on the Investor Relations Web site at www.investor.prudential.com. Additional historical information relating to the Company’s financial performance, including its third quarter 2009 Quarterly Financial Supplement, is also located on the Investor Relations website.
The information referred to above and on the prior page, as well as the risks of our businesses described in our Annual Report on Form 10-K for the year ended December 31, 2008 and our Quarterly Report on Form 10-Q for the quarter ended September 30, 2009, should be considered by readers when reviewing forward-looking statements contained in this presentation.
4 Investor Day 12.10.09
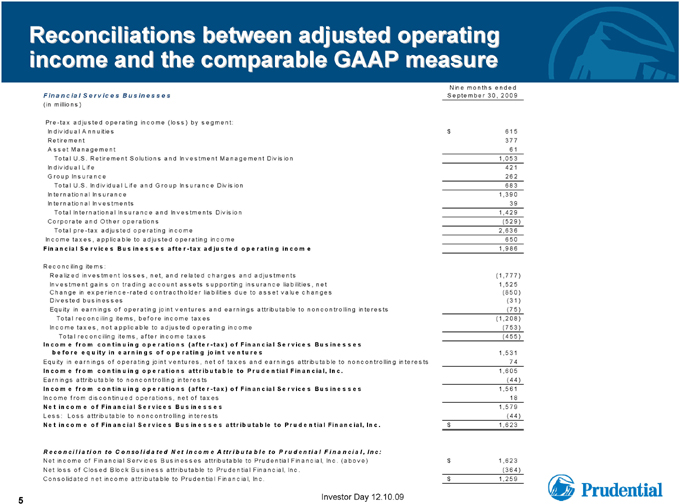
Reconciliations between adjusted operating income and the comparable GAAP measure
Financial Services Businesses Nine months ended September 30, 2009 (in millions) Pre-tax adjusted operating income (loss) by segment: Individual Annuities 615$ Retirement 377 Asset Management 61 Total U.S. Retirement Solutions and Investment Management Division 1,053 Individual Life 421 Group Insurance 262 Total U.S. Individual Life and Group Insurance Division 683 International Insurance 1,390 International Investments 39 Total International Insurance and Investments Division 1,429 Corporate and Other operations (529) Total pre-tax adjusted operating income 2,636 Income taxes, applicable to adjusted operating income 650 Financial Services Businesses after-tax adjusted operating income 1,986 Reconciling items: Realized investment losses, net, and related charges and adjustments (1,777) Investment gains on trading account assets supporting insurance liabilities, net 1,525 Change in experience-rated contractholder liabilities due to asset value changes (850) Divested businesses (31) Equity in earnings of operating joint ventures and earnings attributable to noncontrolling interests (75) Total reconciling items, before income taxes (1,208) Income taxes, not applicable to adjusted operating income (753) Total reconciling items, after income taxes (455) Income from continuing operations (after-tax) of Financial Services Businesses before equity in earnings of operating joint ventures 1,531 Equity in earnings of operating joint ventures, net of taxes and earnings attributable to noncontrolling interests 74 Income from continuing operations attributable to Prudential Financial, Inc. 1,605 Earnings attributable to noncontrolling interests (44) Income from continuing operations (after-tax) of Financial Services Businesses 1,561 Income from discontinued operations, net of taxes 18 Net income of Financial Services Businesses 1,579 Less: Loss attributable to noncontrolling interests (44) Net income of Financial Services Businesses attributable to Prudential Financial, Inc. $1,623 Reconciliation to Consolidated Net Income Attributable to Prudential Financial, Inc: Net income of Financial Services Businesses attributable to Prudential Financial, Inc. (above) $1,623 Net loss of Closed Block Business attributable to Prudential Financial, Inc. (364) Consolidated net income attributable to Prudential Financial, Inc. $1,259
5 Investor Day 12.10.09
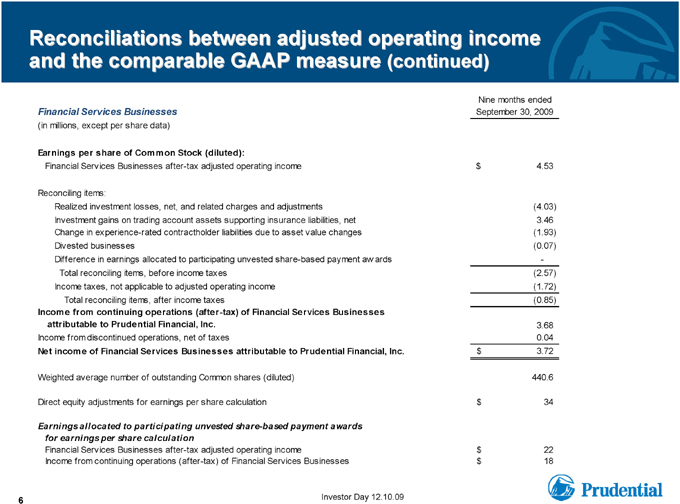
Reconciliations between adjusted operating income and the comparable GAAP measure (continued)
Nine months ended
Financial Services Businesses September 30, 2009 (in millions, except per share data)
Earnings per share of Common Stock (diluted):
Financial Services Businesses after-tax adjusted operating income $ 4.53
Reconciling items:
Realized investment losses, net, and related charges and adjustments (4.03) Investment gains on trading account assets supporting insurance liabilities, net 3.46 Change in experience-rated contractholder liabilities due to asset value changes (1.93) Divested businesses (0.07) Difference in earnings allocated to participating unvested share-based payment awards - Total reconciling items, before income taxes (2.57) Income taxes, not applicable to adjusted operating income (1.72) Total reconciling items, after income taxes (0.85)
Income from continuing operations (after-tax) of Financial Services Businesses attributable to Prudential Financial, Inc. 3.68 Income from discontinued operations, net of taxes 0.04
Net income of Financial Services Businesses attributable to Prudential Financial, Inc. $ 3.72 Weighted average number of outstanding Common shares (diluted) 440.6 Direct equity adjustments for earnings per share calculation $ 34
Earnings allocated to participating unvested share-based payment awards for earnings per share calculation
Financial Services Businesses after-tax adjusted operating income $ 22 Income from continuing operations (after-tax) of Financial Services Businesses $ 18
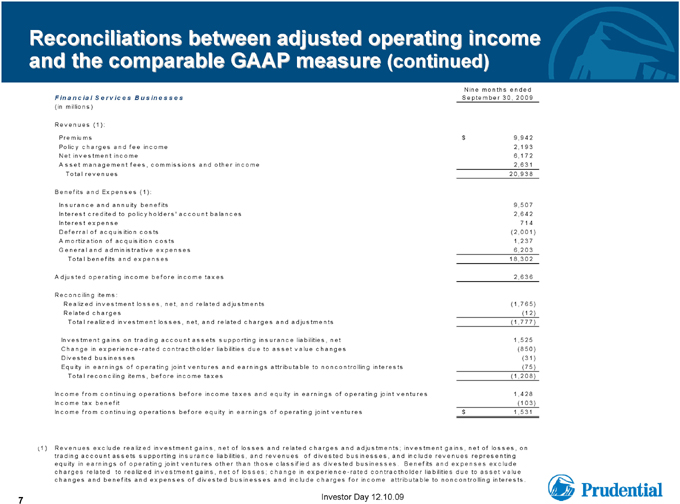
Reconciliations between adjusted operating income and the comparable GAAP measure (continued)
Financial Services Businesses Nine months ended September 30, 2009 (in millions) Revenues (1): Premiums $9,942 Policy charges and fee income 2,193 Net investment income 6,172 Asset management fees, commissions and other income 2,631 Total revenues 20,938 Benefits and Expenses (1): Insurance and annuity benefits 9,507 Interest credited to policyholders’ account balances 2,642 Interest expense 714 Deferral of acquisition costs (2,001) Amortization of acquisition costs 1,237 General and administrative expenses 6,203 Total benefits and expenses 18,302 Adjusted operating income before income taxes 2,636 Reconciling items: Realized investment losses, net, and related adjustments (1,765) Related charges (12) Total realized investment losses, net, and related charges and adjustments (1,777) Investment gains on trading account assets supporting insurance liabilities, net 1,525 Change in experience-rated contractholder liabilities due to asset value changes (850) Divested businesses (31) Equity in earnings of operating joint ventures and earnings attributable to noncontrolling interests (75) Total reconciling items, before income taxes (1,208) Income from continuing operations before income taxes and equity in earnings of operating joint ventures 1,428 Income tax benefit (103) Income from continuing operations before equity in earnings of operating joint ventures $1,531
(1) Revenues exclude realized investment gains, net of losses and related charges and adjustments; investment gains, net of losses, on trading account assets supporting insurance liabilities, and revenues of divested businesses, and include revenues representing equity in earnings of operating joint ventures other than those classified as divested businesses. Benefits and expenses exclude charges related to realized investment gains, net of losses; change in experience-rated contractholder liabilities due to asset value changes and benefits and expenses of divested businesses and include charges for income attributable to noncontrolling interests.
7 Investor Day 12.10.09

PRUDENTIAL FINANCIAL, INC.
JOHN STRANGFELD
CHAIRMAN AND CEO
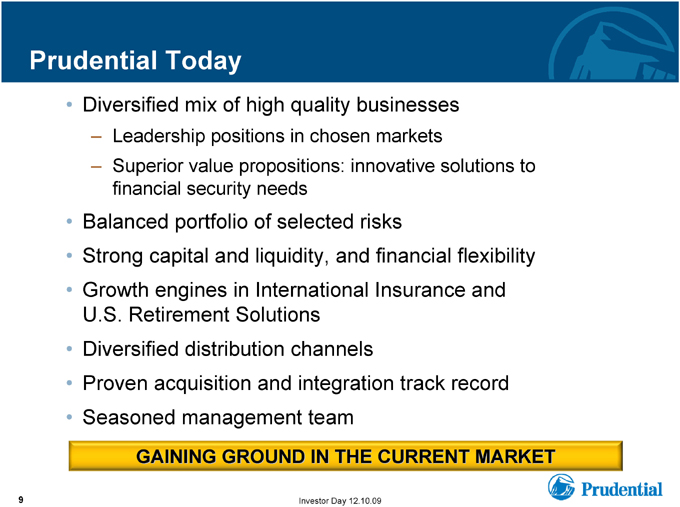
Prudential Today
• Diversified mix of high quality businesses
– Leadership positions in chosen markets
– Superior value propositions: innovative solutions to financial security needs
• Balanced portfolio of selected risks
• Strong capital and liquidity, and financial flexibility
• Growth engines in International Insurance and U.S. Retirement Solutions
• Diversified distribution channels
• Proven acquisition and integration track record
• Seasoned management team
GAINING GROUND IN THE CURRENT MARKET
9 Investor Day 12.10.09
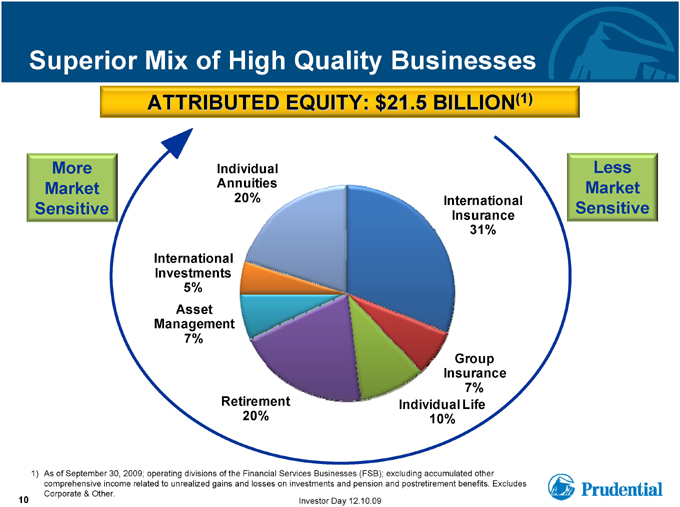
Superior Mix of High Quality Businesses
ATTRIBUTED EQUITY: $21.5 BILLION(1)
More Market Sensitive
Individual Annuities 20%
International Investments 5%
Asset Management 7%
Retirement 20%
International Insurance 31%
Group Insurance 7%
Individual Life 10%
Less Market Sensitive
1) As of September 30, 2009; operating divisions of the Financial Services Businesses (FSB); excluding accumulated other comprehensive income related to unrealized gains and losses on investments and pension and postretirement benefits. Excludes Corporate & Other.
10 Investor Day 12.10.09
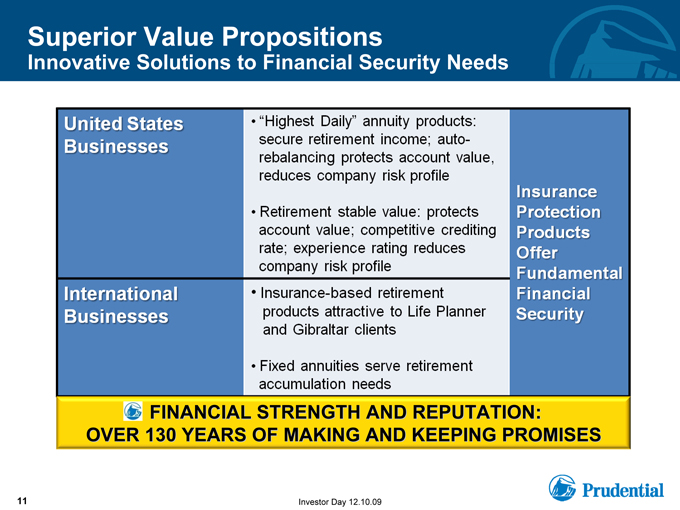
Superior Value Propositions
Innovative Solutions to Financial Security Needs
United States Businesses
International Businesses
“Highest Daily” annuity products: secure retirement income; auto-rebalancing protects account value, reduces company risk profile
Retirement stable value: protects account value; competitive crediting rate; experience rating reduces company risk profile
Insurance-based retirement products attractive to Life Planner and Gibraltar clients
Fixed annuities serve retirement accumulation needs
Insurance
Protection
Products
Offer
Fundamental
Financial
Security
F®ANCIAL STRENGTH AND REPUTATION: OVER 130 YEARS OF MAKING AND KEEPING PROMISES
11
Investor Day 12.10.09
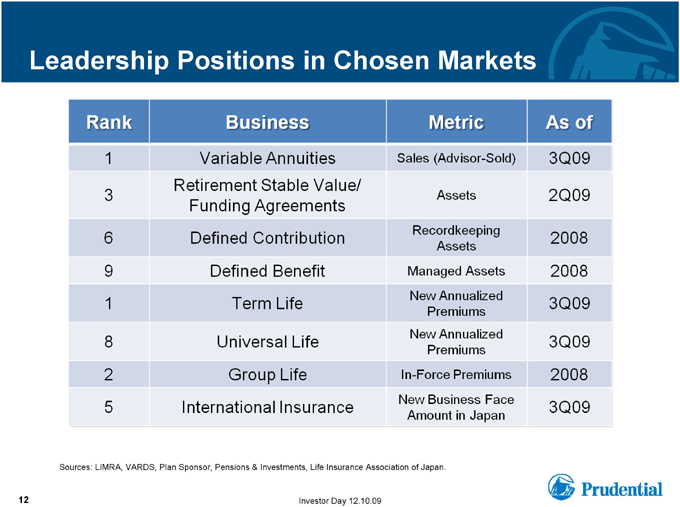
Leadership Positions in Chosen Markets
Rank
Business
Metric
As of
1 Variable Annuities
Sales (Advisor-Sold)
3Q09
3 Retirement Stable Value/ Funding Agreements
Assets
2Q09
6 Defined Contribution
Recordkeeping Assets
2008
9 Defined Benefit
Managed Assets
2008
1 Term Life
New Annualized Premiums
3Q09
8 Universal Life
New Annualized Premiums
3Q09
2 Group Life
In-Force Premiums
2008
5 International Insurance
New Business Face Amount in Japan
3Q09
12
Sources: LIMRA, VARDS, Plan Sponsor, Pensions & Investments, Life Insurance Association of Japan.
Investor Day 12.10.09
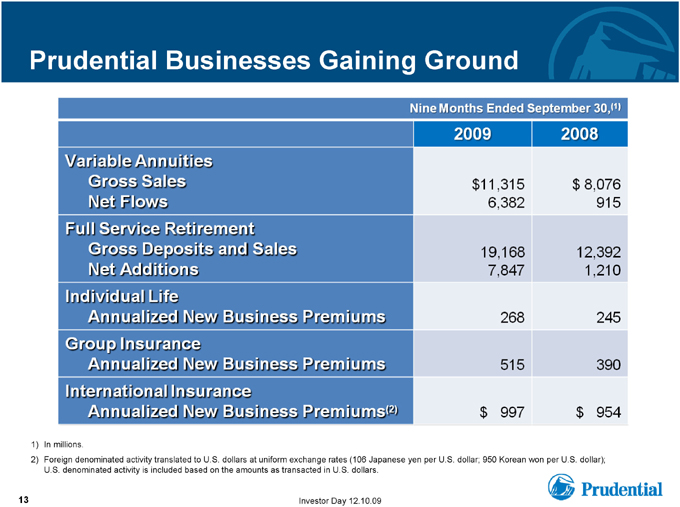
Prudential Businesses Gaining Ground
Nine Months Ended September 30,(1)
Variable Annuities Gross Sales Net Flows
Full Service Retirement Gross Deposits and Sales Net Additions
Individual Life
Annualized New Business Premiums
Group Insurance
Annualized New Business Premiums
International Insurance
Annualized New Business Premiums(2)
2009
$11,315 6,382
19,168 7,847
268 515
$ 997
2008
$ 8,076 915
12,392 1,210
245
390
$ 954
1) In millions.
2) Foreign denominated activity translated to U.S. dollars at uniform exchange rates (106 Japanese yen per U.S. dollar; 950 Korean won per U.S. dollar); U.S. denominated activity is included based on the amounts as transacted in U.S. dollars.
13
Investor Day 12.10.09
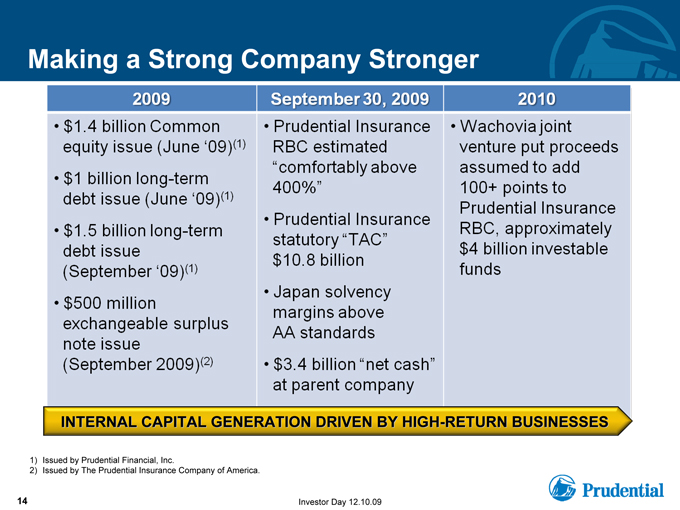
Making a Strong Company Stronger
2009
$1.4 billion Common equity issue (June ‘09)(1)
$1 billion long-term debt issue (June ‘09)(1)
$1.5 billion long-term debt issue (September ‘09)(1)
$500 million exchangeable surplus note issue (September 2009)(2)
September 30, 2009
Prudential Insurance RBC estimated “comfortably above 400%”
Prudential Insurance statutory “TAC” $10.8 billion
Japan solvency margins above AA standards
$3.4 billion “net cash” at parent company
2010
Wachovia joint venture put proceeds assumed to add 100+ points to Prudential Insurance RBC, approximately $4 billion investable funds
INTERNAL CAPITAL GENERATION DRIVEN BY HIGH-RETURN BUSINESSES
1) Issued by Prudential Financial, Inc.
2) Issued by The Prudential Insurance Company of America.
14
Investor Day 12.10.09
Summary
• Weathering the storm: not just intact, but stronger
• Gaining ground: strong sales and flows across the board
• Diversified portfolio of businesses with a superior financial outlook
• Bolstered capital and liquidity position
• Positioned for organic business growth and acquisition opportunities
15 Investor Day 12.10.09

PRUDENTIAL FINANCIAL, INC.
SUSTAINABLE FINANCIAL STRENGTH
SUPPORTING PRUDENTIAL’S VALUE PROPOSITIONS AND GROWTH
MARK GRIER
VICE CHAIRMAN
Risk Selection and Management Support Sustained Financial Strength
• Risk management begins with business selection
• High value-added business models
• Risks diversified across exposure types, geography and markets
• Product risk mitigation features support attractive value propositions
• Enhanced stress scenario risk mitigation
• High quality investment portfolio
• Bolstered capital and liquidity enhances ability to pursue business opportunities; provides buffer against adverse scenarios
17 Investor Day 12.10.09
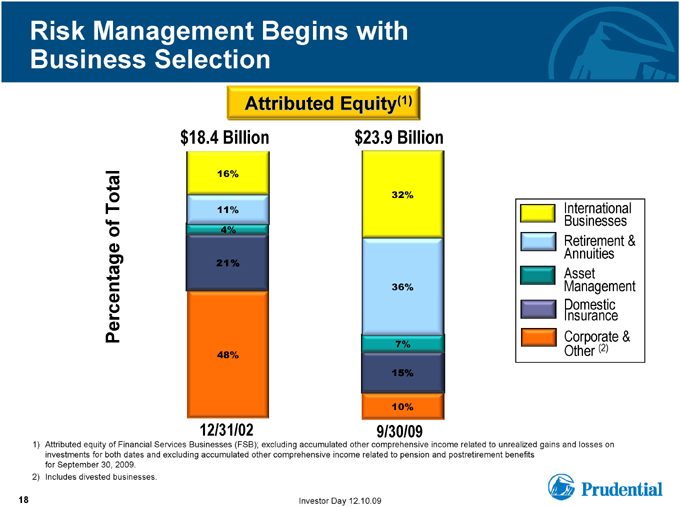
Risk Management Begins with Business Selection
Attributed Equity(1)
$18.4 Billion $23.9 Billion
16%
32%
Total 11% of 4%
21%
Percentage 36%
7% 48% 15%
10%
12/31/02 9/30/09
International Businesses Retirement & Annuities Asset Management Domestic Insurance Other Corporate (2) &
1) Attributed equity of Financial Services Businesses (FSB); excluding accumulated other comprehensive income related to unrealized gains and losses on investments for both dates and excluding accumulated other comprehensive income related to pension and postretirement benefits for September 30, 2009.
2) Includes divested businesses.
18 Investor Day 12.10.09
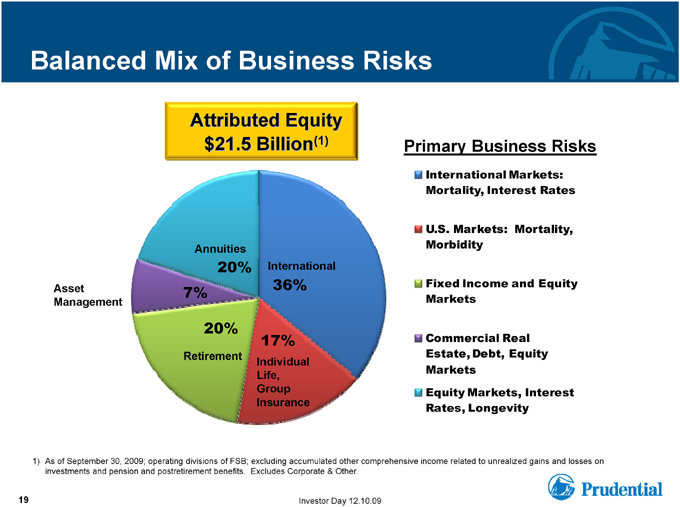
Balanced Mix of Business Risks
Attributed Equity
$21.5 Billion(1)
Asset Management
Annuities
20%
7%
20%
Retirement
International
36%
17%
Individual Life, Group Insurance
Primary Business Risks
International Markets: Mortality, Interest Rates
U.S. Markets: Mortality, Morbidity
Fixed Income and Equity Markets
Commercial Real Estate, Debt, Equity Markets Equity Markets, Interest Rates, Longevity
1) As of September 30, 2009; operating divisions of FSB; excluding accumulated other comprehensive income related to unrealized gains and losses on investments and pension and postretirement benefits. Excludes Corporate & Other.
19 Investor Day 12.10.09

Product Risk Mitigation Features Support Attractive Value Propositions
Product-Based Risk Mitigation
Variable Annuity Living Benefits:
Auto-rebalancing, age requirements, asset allocation requirements
Full Service Retirement Stable Value:
Investment experience passed through to clients via crediting rates; plan sponsor level withdrawal restrictions
Group Insurance:
Experience rated Life and Disability for mid to large case markets
Value Proposition
Guaranteed lifetime income,
market participation, flexible access to account value
Principal guarantee with
competitive crediting rate
highly attractive to
pre-retiree market
Competitive rates appeal to cost-conscious employers
20
Investor Day 12.10.09
Managing Stress Scenario Risk
• Hedging programs
• Capital hedge for annuities
• Modeling for “tail risk,” statutory capital vulnerability
• Contingent sources of liquidity
• Consideration of “headline risk”
• Selective exposure to market-sensitive investments and business activities
21 Investor Day 12.10.09
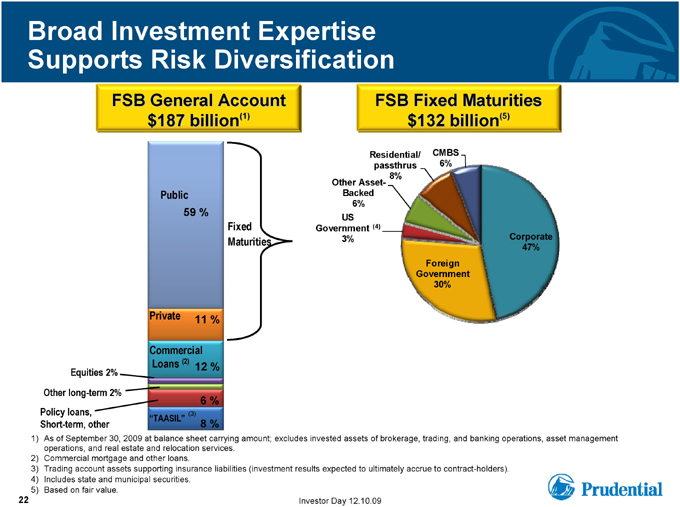
Broad Investment Expertise Supports Risk Diversification
FSB General Account $187 billion(1)
Public
59 %
Fixed Maturities
Private 11 %
Commercial Loans (2)
12 %
Equities 2% Other long-term 2%
6 %
Policy loans, (3) “TAASIL” Short-term, other 8 %
FSB Fixed Maturities $132 billion(5)
Residential/ CMBS passthrus 6% 8% Other Asset-Backed 6% US
Government (4)
3% Corporate 47% Foreign Government 30%
1) As of September 30, 2009 at balance sheet carrying amount; excludes invested assets of brokerage, trading, and banking operations, asset management operations, and real estate and relocation services.
2) Commercial mortgage and other loans.
3) Trading account assets supporting insurance liabilities (investment results expected to ultimately accrue to contract-holders).
4) Includes state and municipal securities.
5) Based on fair value.
22 Investor Day 12.10.09
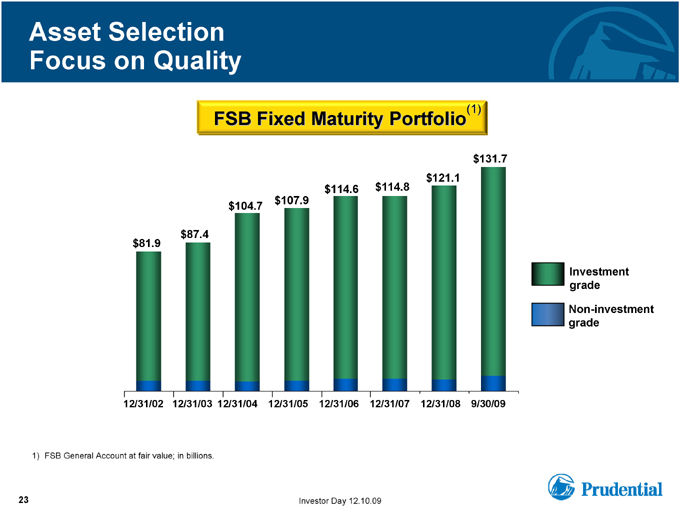
Asset Selection Focus on Quality
FSB Fixed Maturity Portfolio
$131.7 $121.1 $114.6 $114.8 $107.9 $104.7
$87.4
$81.9
12/31/02 12/31/03 12/31/04 12/31/05 12/31/06 12/31/07 12/31/08 9/30/09
Investment
grade
Non-investment
grade
1) FSB General Account at fair value; in billions.
23 Investor Day 12.10.09
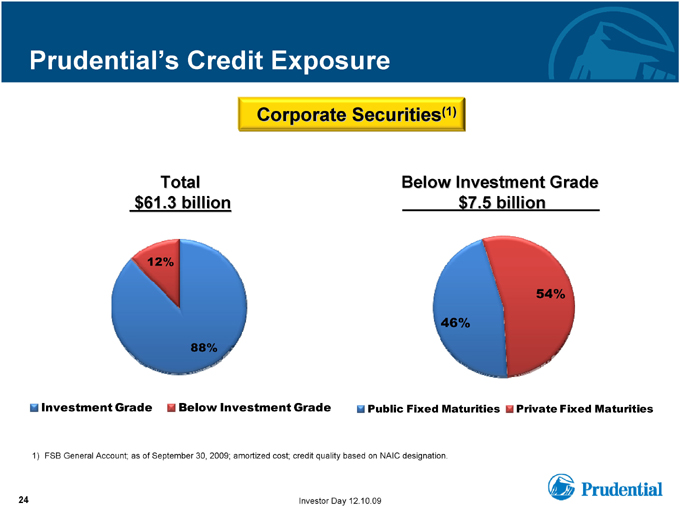
Total $61.3 billion
Below Investment Grade $7.5 billion
12%
54% 46% 88%
Investment Grade Below Investment Grade Public Fixed Maturities Private Fixed Maturities
Prudential’s Credit Exposure
Corporate Securities(1)
1) FSB General Account; as of September 30, 2009; amortized cost; credit quality based on NAIC designation.
24 Investor Day 12.10.09
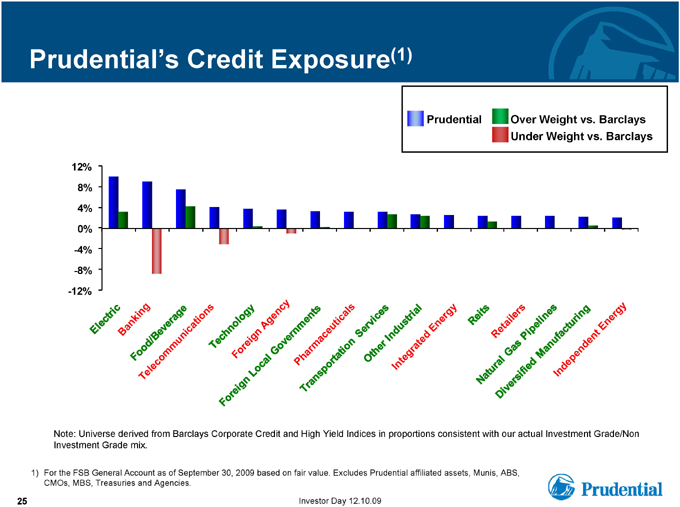
Prudential’s Credit Exposure(1)
Prudential Over Weight vs. Barclays Under Weight vs. Barclays
Electric
Banking
Food/Beverage
Telecommunications
Technology
Foreign Agency
Foreign Local Governments
Pharmaceuticals
Transportation Services
Other Industrial
Integrated Energy
Reits
Retailers
Natural Gas Pipelines
Diversified Manufacturing
Independent Energy
12%
-8%
-4%
0%
4%
8%
-12%
Note: Universe derived from Barclays Corporate Credit and High Yield Indices in proportions consistent with our actual Investment Grade/Non Investment Grade mix.
1) For the FSB General Account as of September 30, 2009 based on fair value. Excludes Prudential affiliated assets, Munis, ABS, CMOs, MBS, Treasuries and Agencies.
25 Investor Day 12.10.09
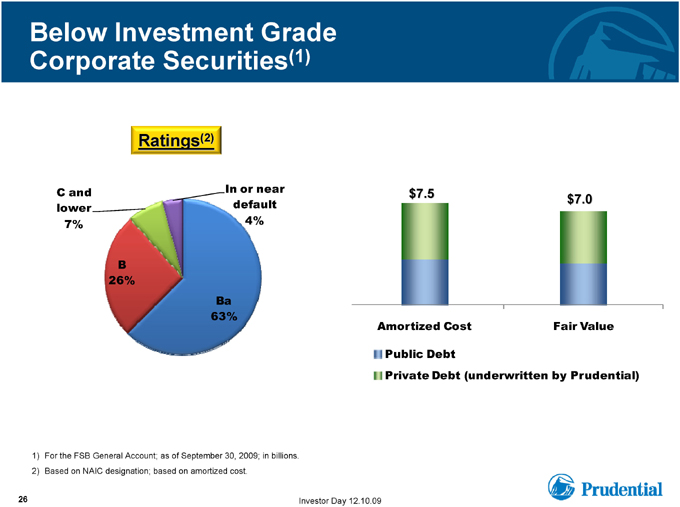
Below Investment Grade Corporate Securities(1)
Ratings(2)
C and lower 7%
In or near default 4%
B 26%
Ba 63%
$7.5 $7.0
Amortized Cost Fair Value Public Debt Private Debt (underwritten by Prudential)
1) For the FSB General Account; as of September 30, 2009; in billions.
2) Based on NAIC designation; based on amortized cost.
26 Investor Day 12.10.09
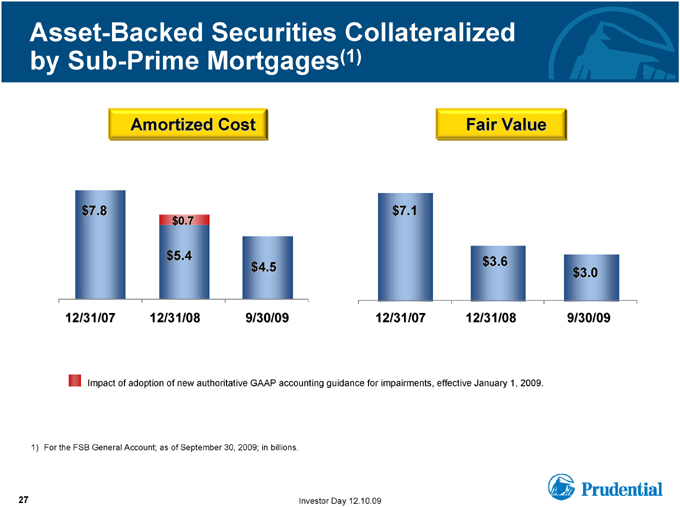
Asset-Backed Securities Collateralized by Sub-Prime Mortgages(1)
Amortized Cost
$7.8 $0.7
$5.4 $4.5
12/31/07 12/31/08 9/30/09
Fair Value
$7.1
$3.6 $3.0
12/31/07 12/31/08 9/30/09
Impact of adoption of new authoritative GAAP accounting guidance for impairments, effective January 1, 2009.
1) For the FSB General Account; as of September 30, 2009; in billions.
27 Investor Day 12.10.09
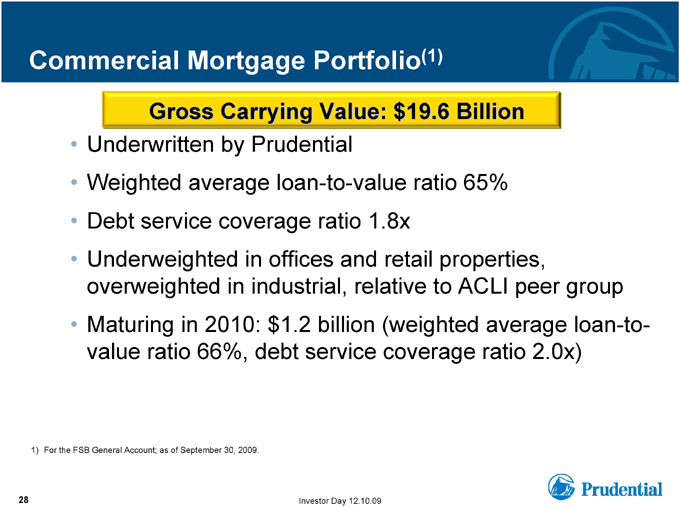
Commercial Mortgage Portfolio(1)
Gross Carrying Value: $19.6 Billion
• Underwritten by Prudential
• Weighted average loan-to-value ratio 65%
• Debt service coverage ratio 1.8x
• Underweighted in offices and retail properties, overweighted in industrial, relative to ACLI peer group
• Maturing in 2010: $1.2 billion (weighted average loan-to-value ratio 66%, debt service coverage ratio 2.0x)
1) For the FSB General Account; as of September 30, 2009.
28 Investor Day 12.10.09
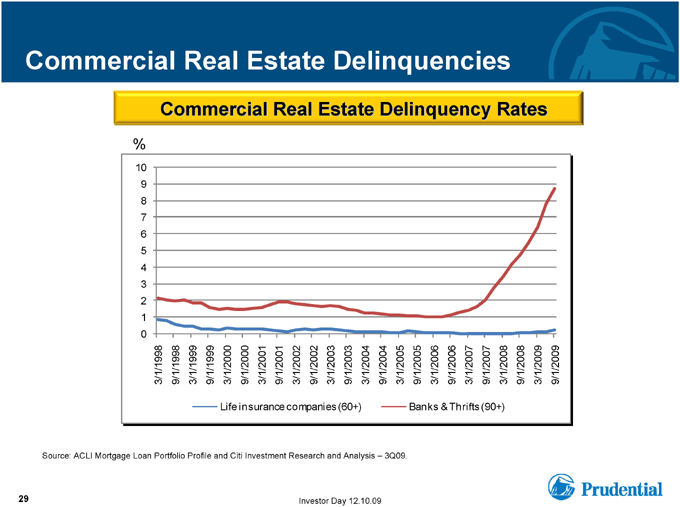
Commercial Real Estate Delinquencies
Commercial Real Estate Delinquency Rates
%
10 9 8 7 6 5 4 3 2 1 0
3/1/1998 9/1/1998 3/1/1999 9/1/1999 3/1/2000 9/1/2000 3/1/2001 9/1/2001 3/1/2002 9/1/2002 3/1/2003 9/1/2003 3/1/2004 9/1/2004 3/1/2005 9/1/2005 3/1/2006 9/1/2006 3/1/2007 9/1/2007 3/1/2008 9/1/2008 3/1/2009 9/1/2009 Life insurance companies (60+) Banks & Thrifts (90+)
Source: ACLI Mortgage Loan Portfolio Profile and Citi Investment Research and Analysis – 3Q09.
29 Investor Day 12.10.09
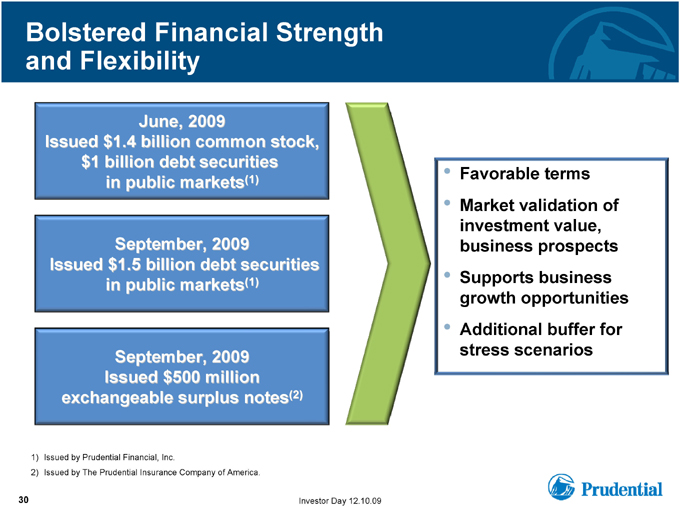
Bolstered Financial Strength and Flexibility
June, 2009
Issued $1.4 billion common stock, $1 billion debt securities in public markets(1)
September, 2009
Issued $1.5 billion debt securities in public markets(1)
September, 2009 Issued $500 million exchangeable surplus notes(2)
Favorable terms
Market validation of investment value, business prospects
Supports business growth opportunities
Additional buffer for stress scenarios
1) Issued by Prudential Financial, Inc.
2) Issued by The Prudential Insurance Company of America.
30 Investor Day 12.10.09
Sustainable Financial Strength
• Balanced portfolio of businesses and risks
• Product risk mitigation features support attractive value propositions, help manage company’s risk profile
• Enhanced management of stress scenario risks
• High quality, diversified investment portfolio
• Recent securities issues bolstered financial strength and flexibility
31 Investor Day 12.10.09

PRUDENTIAL’S INTERNATIONAL BUSINESSES
EDWARD P. BAIRD
EXECUTIVE VICE PRESIDENT AND
CHIEF OPERATING OFFICER, INTERNATIONAL
Key Elements of
Our International Strategy
• Concentrate on a limited number of attractive countries
• Continue building proprietary distribution: recruiting and selection
• Target the affluent and mass affluent consumer
• Historical focus on life insurance
• Needs-based selling
• Growth through complementary distribution channels and opportunistic acquisitions
• Increasing emphasis on meeting retirement needs
33 Investor Day 12.10.09
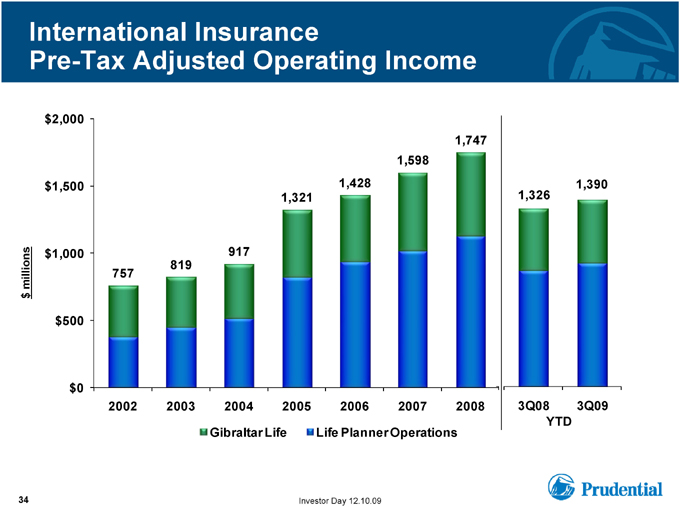
International Insurance
Pre-Tax Adjusted Operating Income
$2,000
1,747 1,598 $1,500 1,428 1,326 1,390 1,321
$1,000 917 819 millions 757 $
$500
$0
2002 2003 2004 2005 2006 2007 2008 3Q08 3Q09 YTD
Gibraltar Life
Life Planner Operations
34 Investor Day 12.10.09
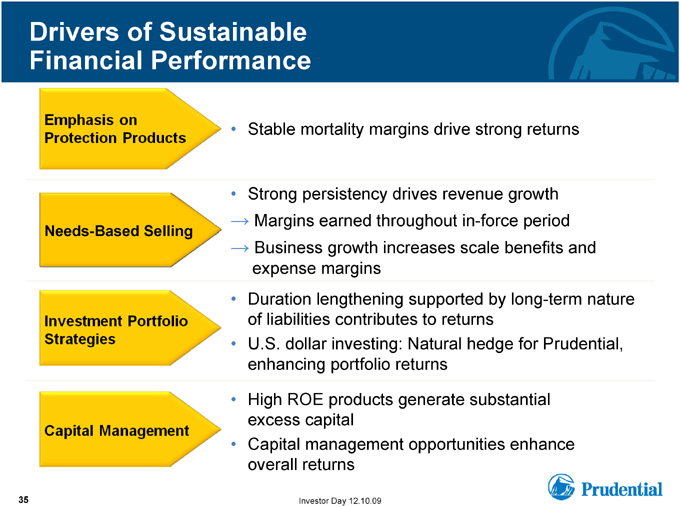
Drivers of Sustainable Financial Performance
Emphasis on Protection Products
• Stable mortality margins drive strong returns
• Strong persistency drives revenue growth
Margins earned throughout in-force period
Needs-Based Selling
Business growth increases scale benefits and expense margins
• Duration lengthening supported by long-term nature of liabilities contributes to returns
Investment Portfolio Strategies
• U.S. dollar investing: Natural hedge for Prudential, enhancing portfolio returns
• High ROE products generate substantial excess capital
Capital Management
• Capital management opportunities enhance overall returns
35 Investor Day 12.10.09
Life Planner Business Model Needs-Based Selling
Identify protection needs before discussing products
Protection life insurance purchased as solution to identified need
Life Planner maintains contact with client, as trusted professional
36
Investor Day 12.10.09
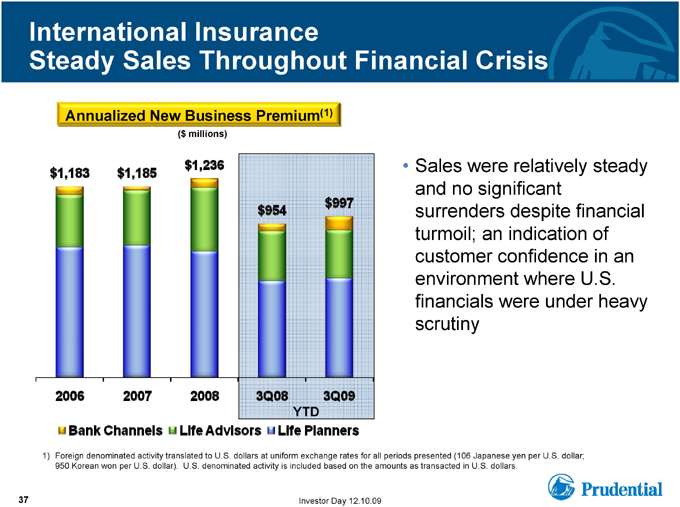
International Insurance
Steady Sales Throughout Financial Crisis
Annualized New Business Premium(1)
($ millions)
YTD
$1,183 $1,185 $1,236 $954 $997
2006 2007 2008 3Q08 3Q09
Bank Channels Life Advisors Life Planners
• Sales were relatively steady and no significant surrenders despite financial turmoil; an indication of customer confidence in an environment where U.S. financials were under heavy scrutiny
1) Foreign denominated activity translated to U.S. dollars at uniform exchange rates for all periods presented (106 Japanese yen per U.S. dollar; 950 Korean won per U.S. dollar). U.S. denominated activity is included based on the amounts as transacted in U.S. dollars.
37 Investor Day 12.10.09
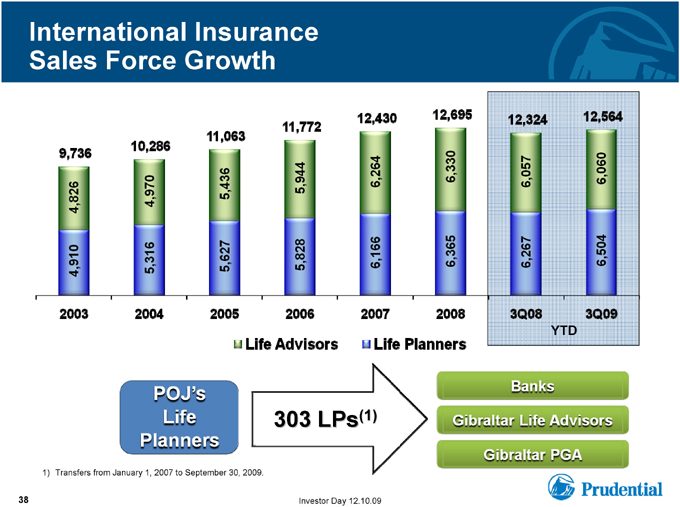
International Insurance Sales Force Growth
9,736 10,286 11,063 11,772 12,430 12,695 12,324 12,564
4,826 4,970 5,436 5,944 6,264 6,330 6,057 6,060
4,910 5,316 5,627 5,828 6,166 6,365 6,267 6,504
2003 2004 2005 2006 2007 2008 3Q08 3Q09 YTD
Life Advisors Life Planners
POJ’s Life Planners
303 LPs(1)
Banks
Gibraltar Life Advisors
Gibraltar PGA
1) Transfers from January 1, 2007 to September 30, 2009.
Investor Day 12.10.09
38
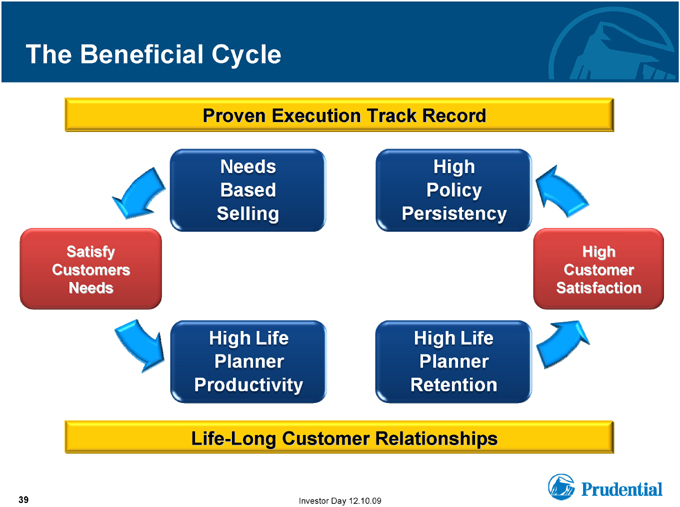
The Beneficial Cycle
Proven Execution Track Record
Needs Based Selling
High Policy Persistency
High Life Planner Productivity
High Planner Retention
Satisfy High Customers Customer Needs Satisfaction
Life-Long Customer Relationships
39 Investor Day 12.10.09
Gibraltar Life: “Prudentialized” Traditional Model Japanese Life Insurance Company
• Life Planner training principles adapted to traditional field force
• Needs-based selling of protection and retirement products; introduce products targeted to customer base
• Maintain and cultivate strong affinity group relationships
• Developing bank channel distribution
40 Investor Day 12.10.09
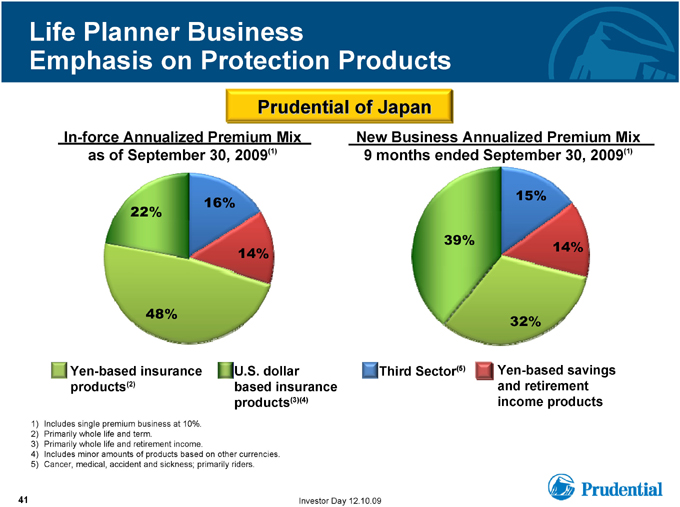
Life Planner Business
Emphasis on Protection Products
Prudential of Japan
In-force Annualized Premium Mix as of September 30, 2009(1)
16% 22%
14%
48%
Yen-based insurance U.S. dollar products(2) based insurance products(3)(4)
New Business Annualized Premium Mix 9 months ended September 30, 2009(1)
15% 39% 14% 32%
Third Sector(5) Yen-based savings and retirement income products
1) Includes single premium business at 10%.
2) Primarily whole life and term.
3) Primarily whole life and retirement income.
4) Includes minor amounts of products based on other currencies.
5) Cancer, medical, accident and sickness; primarily riders.
41 Investor Day 12.10.09
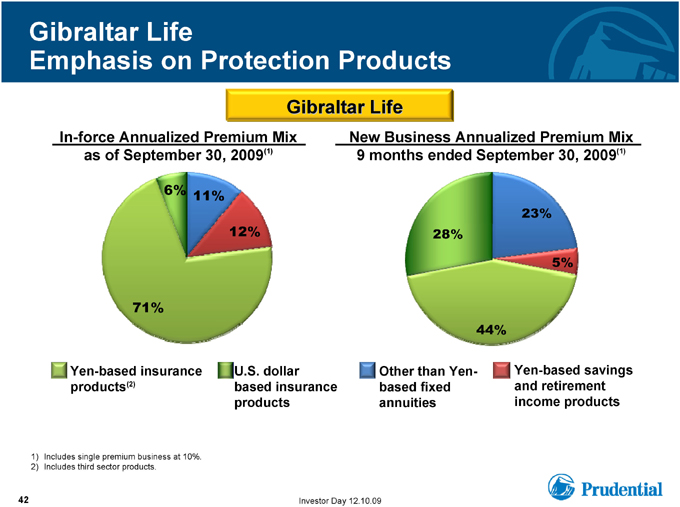
Gibraltar Life
Emphasis on Protection Products
Gibraltar Life
In-force Annualized Premium Mix as of September 30, 2009(1)
6% 11% 12%
71%
Yen-based insurance U.S. dollar products(2) based insurance products
New Business Annualized Premium Mix 9 months ended September 30, 2009(1)
23% 28% 5%
44%
Other than Yen- Yen-based savings based fixed and retirement annuities income products
1) Includes single premium business at 10%.
2) Includes third sector products.
42 Investor Day 12.10.09
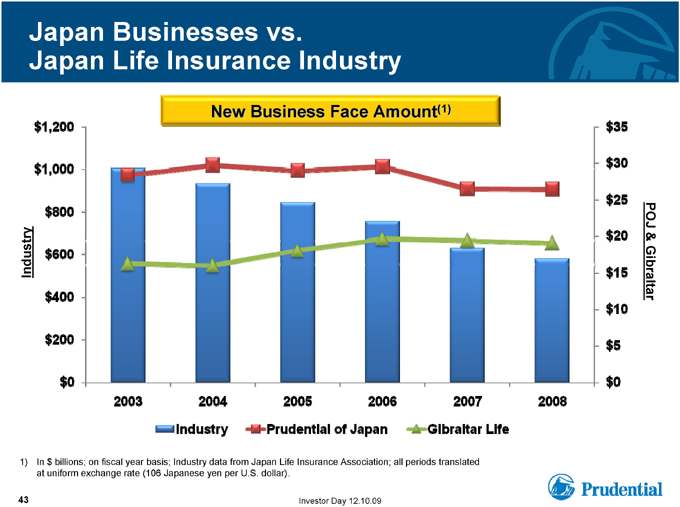
Japan Businesses vs. Japan Life Insurance Industry
New Business Face Amount(1)
Industry
$1,200 $1,000 $800 $600 $400 $200 $0
2003 2004 2005 2006 2007 2008
$35 $30 $25 $20 $15 $10 $5 $0
POJ & Gibraltar
Industry
Prudential of Japan
Gibraltar Life
1) In $ billions; on fiscal year basis; Industry data from Japan Life Insurance Association; all periods translated at uniform exchange rate (106 Japanese yen per U.S. dollar).
43 Investor Day 12.10.09
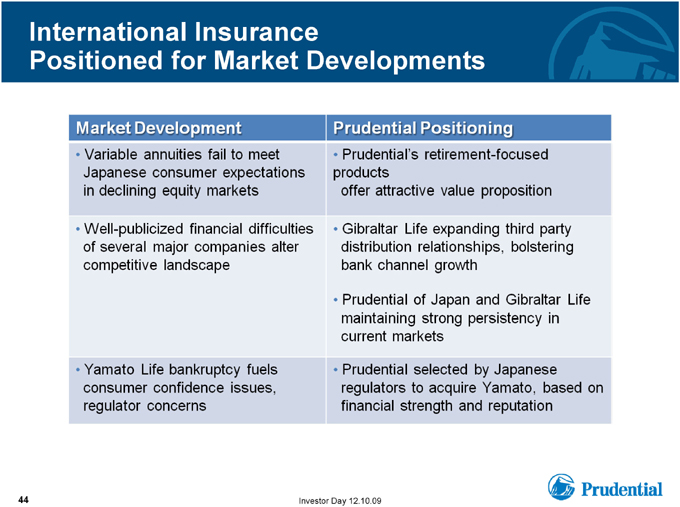
International Insurance
Positioned for Market Developments
Market Development
Variable annuities fail to meet Japanese consumer expectations in declining equity markets
Well-publicized financial difficulties of several major companies alter competitive landscape
Yamato Life bankruptcy fuels consumer confidence issues, regulator concerns
Prudential Positioning
Prudential’s retirement-focused products offer attractive value proposition
Gibraltar Life expanding third party distribution relationships, bolstering bank channel growth
Prudential of Japan and Gibraltar Life maintaining strong persistency in current markets
Prudential selected by Japanese regulators to acquire Yamato, based on financial strength and reputation
44 Investor Day 12.10.09
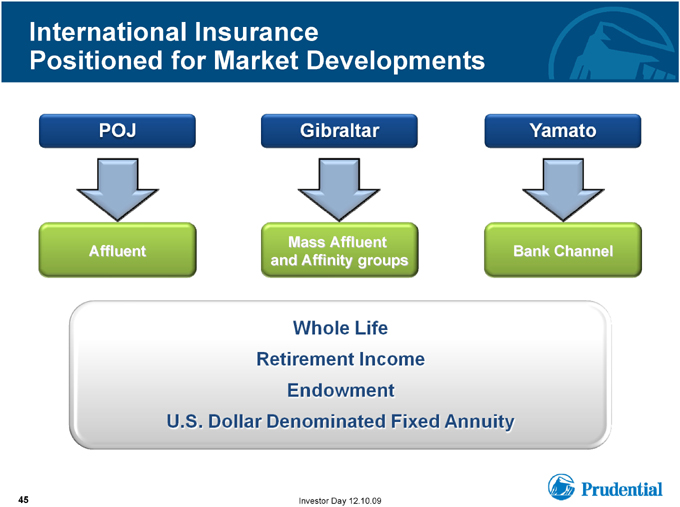
International Insurance
Positioned for Market Developments
POJ
Gibraltar
Yamato
Affluent
Mass Affluent and Affinity groups
Bank Channel
Whole Life
Retirement Income
Endowment
U.S. Dollar Denominated Fixed Annuity
45 Investor Day 12.10.09
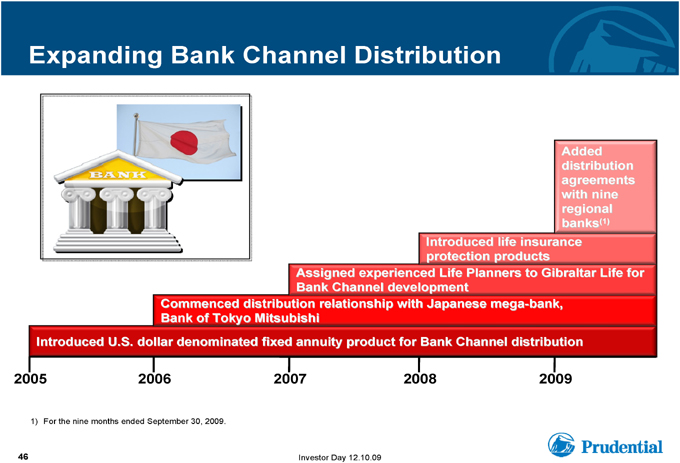
Expanding Bank Channel Distribution
Added distribution agreements with nine regional banks(1)
Introduced life insurance protection products
Assigned experienced Life Planners to Gibraltar Life for Bank Channel development
Commenced distribution relationship with Japanese mega-bank, Bank of Tokyo Mitsubishi
Introduced U.S. dollar denominated fixed annuity product for Bank Channel distribution
2005 2006 2007 2008 2009
1) For the nine months ended September 30, 2009.
46 Investor Day 12.10.09
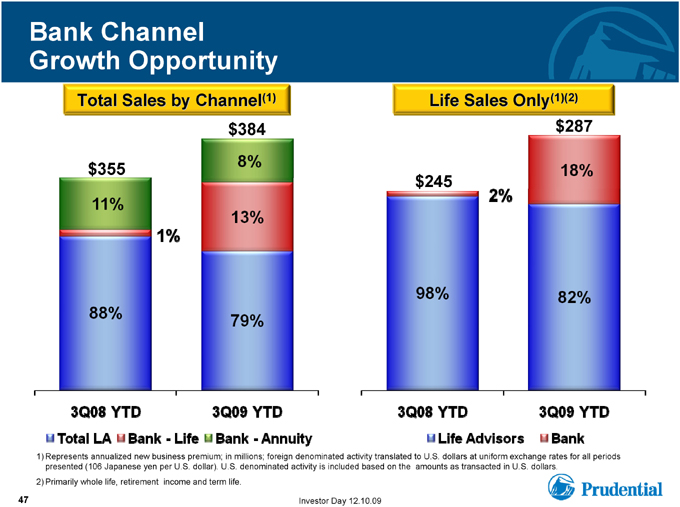
Bank Channel Growth Opportunity
Total Sales by Channel(1)
$355 11% 88%
1%
3Q08 YTD
$384 8% 13% 79%
3Q09 YTD
Total LA
Bank - Life
Bank - Annuity
Life Sales Only(1)(2)
$245 98%
2%
3Q08 YTD
$287 18% 82%
3Q09 YTD
Life Advisors
Bank
1) Represents annualized new business premium; in millions; foreign denominated activity translated to U.S. dollars at uniform exchange rates for all periods presented (106 Japanese yen per U.S. dollar). U.S. denominated activity is included based on the amounts as transacted in U.S. dollars.
2) Primarily whole life, retirement income and term life.
47 Investor Day 12.10.09
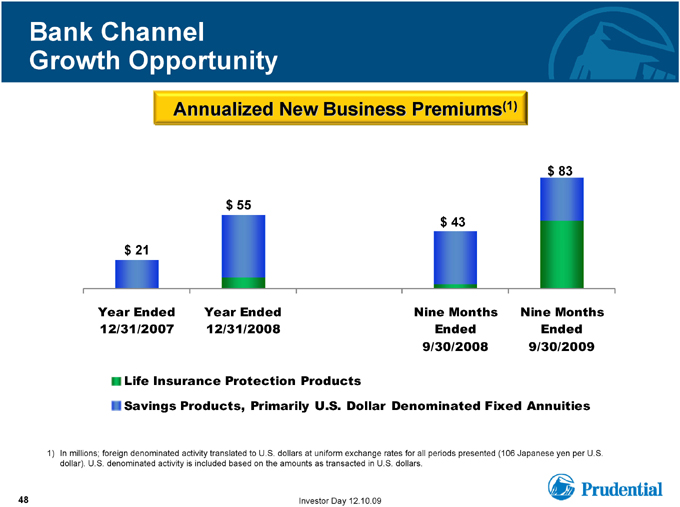
Bank Channel
Growth Opportunity
Annualized New Business Premiums(1)
$ 83
$ 55 $ 43
$ 21
Year Ended 12/31/2007
Year Ended 12/31/2008
Nine Months Ended 9/30/2008
Nine Months Ended 9/30/2009
Life Insurance Protection Products
Savings Products, Primarily U.S. Dollar Denominated Fixed Annuities
1) In millions; foreign denominated activity translated to U.S. dollars at uniform exchange rates for all periods presented (106 Japanese yen per U.S. dollar). U.S. denominated activity is included based on the amounts as transacted in U.S. dollars.
48 Investor Day 12.10.09
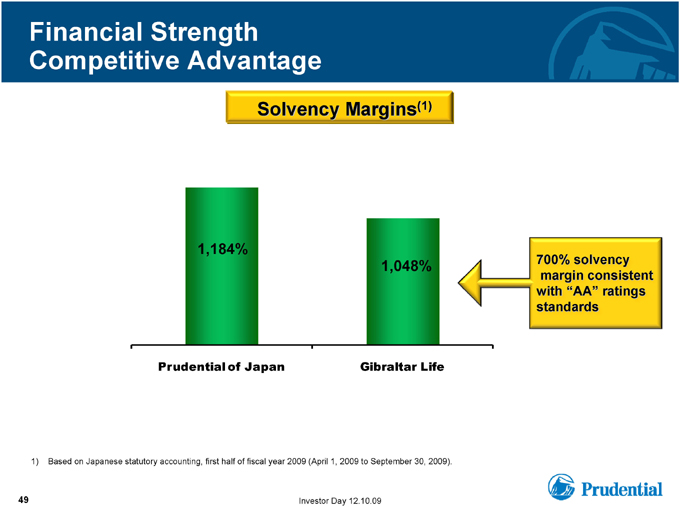
Financial Strength Competitive Advantage
Solvency Margins(1)
1,184%
1,048% 700% solvency margin consistent with “AA” ratings standards
Prudential of Japan Gibraltar Life
1) Based on Japanese statutory accounting, first half of fiscal year 2009 (April 1, 2009 to September 30, 2009).
49 Investor Day 12.10.09
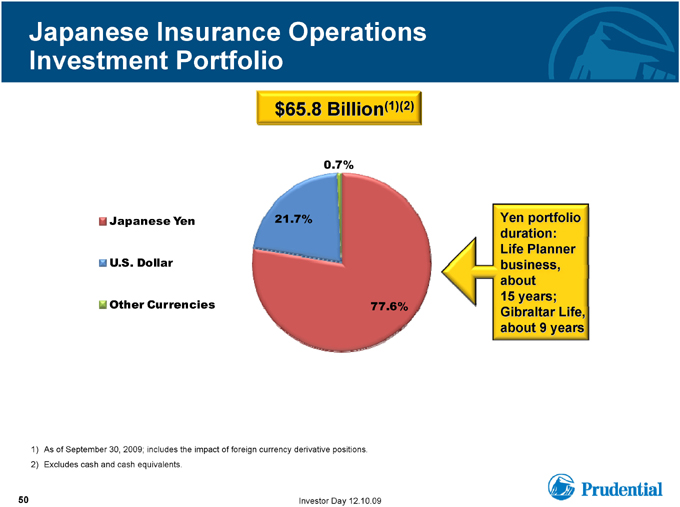
Japanese Insurance Operations
Investment Portfolio
$65.8 Billion(1)(2)
0.7%
Japanese Yen 21.7% Yen portfolio duration: Life Planner
U.S. Dollar business, about 15 years;
Other Currencies 77.6%
Gibraltar Life, about 9 years
1) As of September 30, 2009; includes the impact of foreign currency derivative positions.
2) Excludes cash and cash equivalents.
50 Investor Day 12.10.09
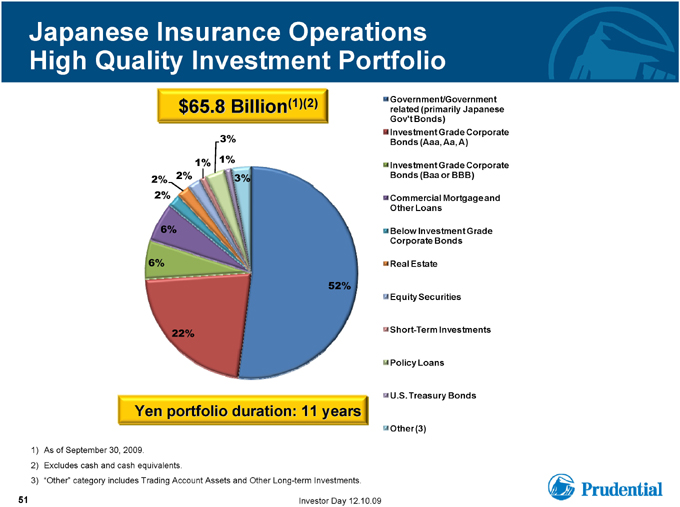
Japanese Insurance Operations
High Quality Investment Portfolio
$65.8 Billion(1)(2)
3%
1% 1%
2% 2% 3% 2%
6%
6%
52%
22%
Government/Government related (primarily Japanese Gov’t Bonds)
Investment Grade Corporate Bonds (Aaa, Aa, A)
Investment Grade Corporate Bonds (Baa or BBB)
Commercial Mortgage and Other Loans
Below Investment Grade Corporate Bonds
Real Estate
Equity Securities
Short-Term Investments
Policy Loans
U.S. Treasury Bonds
Other (3)
Yen portfolio duration: 11 years
1) As of September 30, 2009.
2) Excludes cash and cash equivalents.
3) “Other” category includes Trading Account Assets and Other Long-term Investments.
51 Investor Day 12.10.09
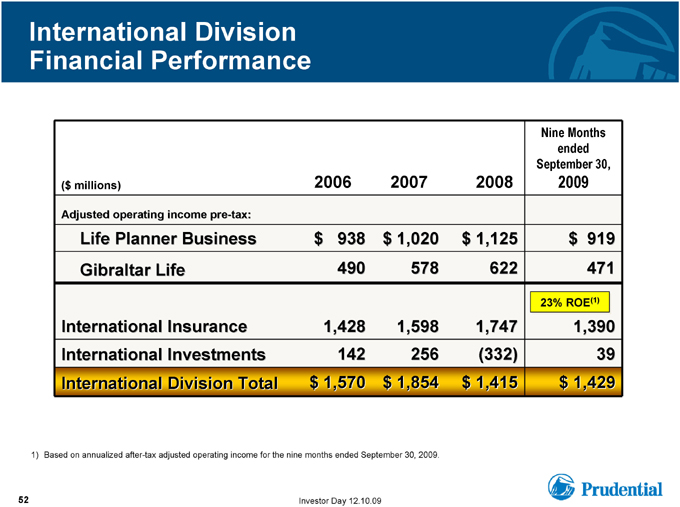
International Division
Financial Performance
Nine Months ended September 30,
($ millions) 2006 2007 2008 2009
Adjusted operating income pre-tax:
Life Planner Business $ 938 $ 1,020 $ 1,125 $ 919
Gibraltar Life 490 578 622 471
23% ROE(1)
International Insurance 1,428 1,598 1,747 1,390
International Investments 142 256 (332) 39
International Division Total $ 1,570 $ 1,854 $ 1,415 $ 1,429
1) Based on annualized after-tax adjusted operating income for the nine months ended September 30, 2009.
52 Investor Day 12.10.09

PRUDENTIAL’S U.S. BUSINESSES
BERNARD WINOGRAD
EXECUTIVE VICE PRESIDENT AND CHIEF OPERATING OFFICER, U. S.
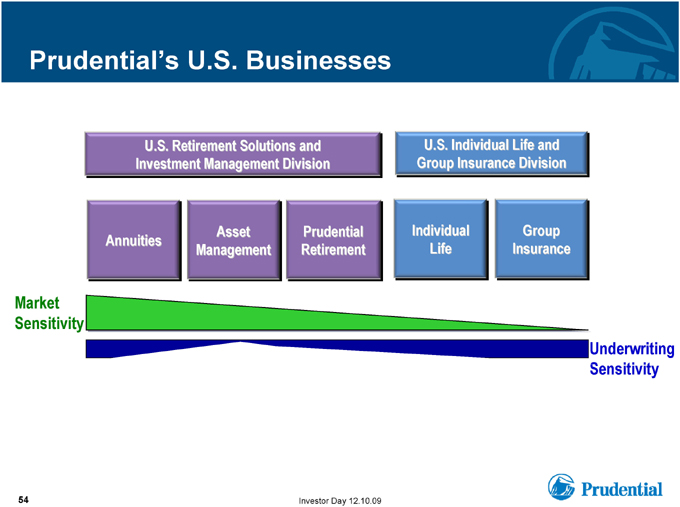
Prudential’s U.S. Businesses
U.S. Retirement Solutions and Investment Management Division
U.S. Individual Life and Group Insurance Division
Asset Prudential Individual Group Annuities Management Retirement Life Insurance
Market Sensitivity
Underwriting Sensitivity
54 Investor Day 12.10.09

Attributed Equity of U.S. Businesses(1)
Attributed Equity
$13.8 billion
11% 15% 31% 11% 32%
1) As of September 30, 2009.
U.S. Retirement Solutions and Investment Management Division
Individual Annuities $4.3 billion Retirement $4.4 billion Asset Management $1.5 billion
U.S. Individual Life and Group Insurance Division
Individual Life $2.0 billion Group Insurance $1.6 billion
55 Investor Day 12.10.09
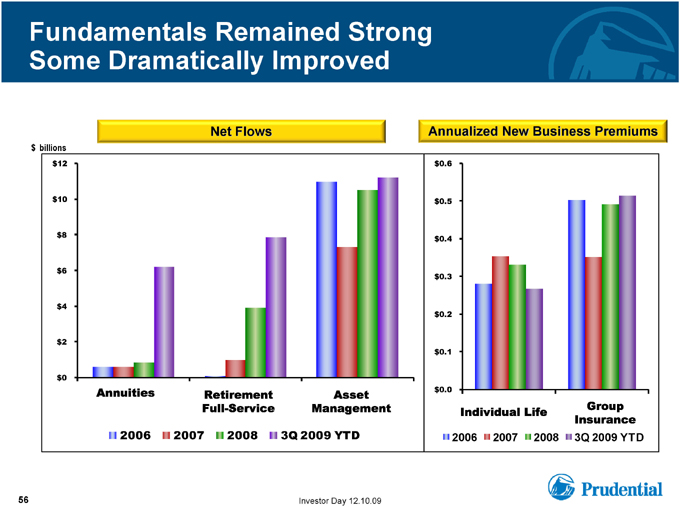
Fundamentals Remained Strong Some Dramatically Improved
Net Flows
$ billions
$12 $10 $8 $6 $4 $2 $0
Annuities
Retirement Full-Service
Asset Management
2006 2007 2008 3Q 2009 YTD
Annualized New Business Premiums
$0.6 $0.5 $0.4 $0.3 $0.2 $0.1 $0.0
Individual Life
Group Insurance
2006 2007 2008 3Q 2009 YTD
56 Investor Day 12.10.09
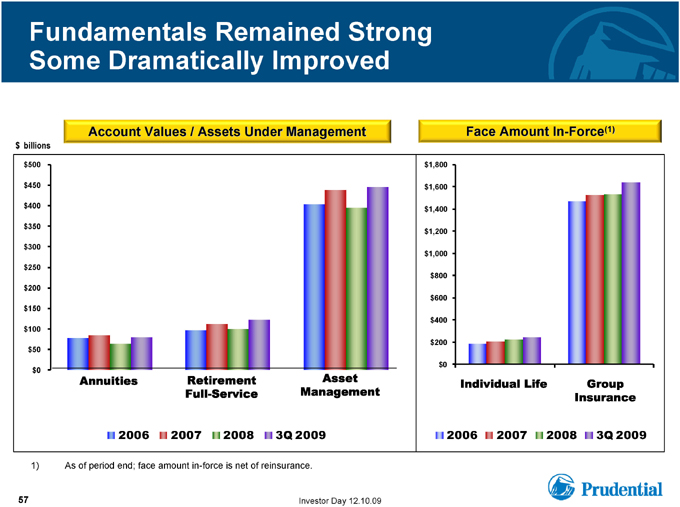
Fundamentals Remained Strong Some Dramatically Improved
Account Values / Assets Under Management
$ billions $500 $450 $400 $350 $300 $250 $200 $150 $100 $50
$0
Annuities Retirement Asset
Full Service Management
2006 2007 2008 3Q 2009
Face Amount In-Force(1)
$1,800 $1,600 $1,400 $1,200 $1,000 $800 $600 $400 $200
$0
Individual Life Group
Insurance
2006 2007 2008 3Q 2009
1) As of period end; face amount in-force is net of reinsurance.
57 Investor Day 12.10.09
U.S. Markets
Legacy of The Meltdown
• Greater client focus on retirement income security and wealth protection
• Increased client and adviser emphasis on “trusted partner” for transfer of financial risks
• Severe market conditions differentiated providers and products
• Retrenchment of weakened competitors
• Growth opportunities for the strongest companies
58 Investor Day 12.10.09
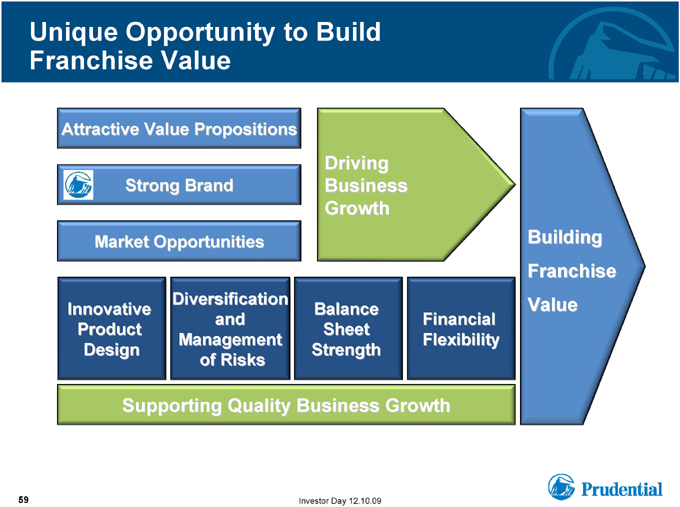
Unique Opportunity to Build Franchise Value
Attractive Value Propositions
Driving Strong Brand Business Growth
Market Opportunities Building Franchise Diversification Value Innovative Balance and Financial Product Sheet Management Flexibility Design Strength of Risks
Supporting Quality Business Growth
59 Investor Day 12.10.09

Serving the Security-Focused Customer
Product
Attractions
Prudential Sales(1)
Individual Life: Term
Protection at affordable cost
9%
Individual Life: Universal Life
No-lapse guarantees
43%
Group Life Insurance
Protection at affordable cost
41%
Variable Annuities
Living benefits: Guaranteed income for life
40%
Retirement Full Service: Stable Value
Account value guarantee with competitive crediting rate
4%
1) For the nine months ended September 30, 2009 compared to corresponding 2008 period. Individual Life and Group Life based on annualized new business premiums; Variable Annuities based on gross sales; Retirement Full Service Stable Value based on account values at end of period.
60 Investor Day 12.10.09 Prudential
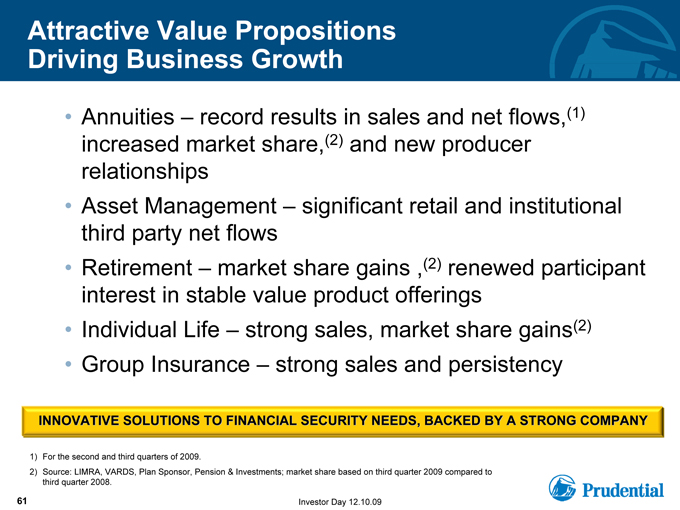
Attractive Value Propositions Driving Business Growth
• Annuities – record results in sales and net flows,(1) increased market share,(2) and new producer relationships
• Asset Management – significant retail and institutional third party net flows
• Retirement – market share gains ,(2) renewed participant interest in stable value product offerings
• Individual Life – strong sales, market share gains(2)
• Group Insurance – strong sales and persistency
INNOVATIVE SOLUTIONS TO FINANCIAL SECURITY NEEDS, BACKED BY A STRONG COMPANY
1) For the second and third quarters of 2009.
2) Source: LIMRA, VARDS, Plan Sponsor, Pension & Investments; market share based on third quarter 2009 compared to third quarter 2008.
61 Investor Day 12.10.09
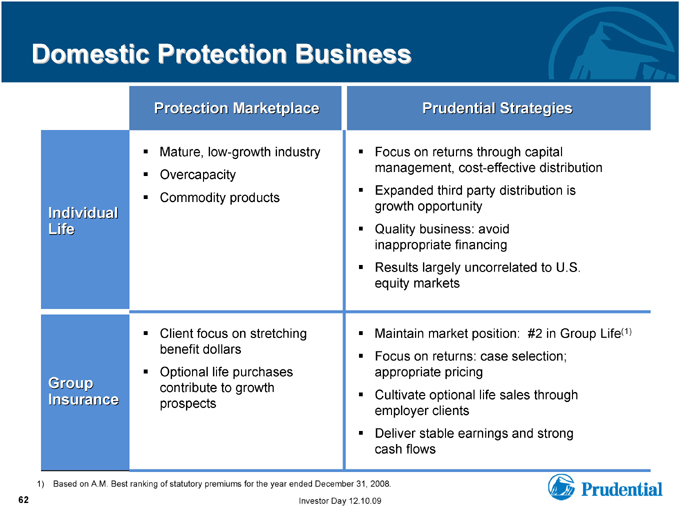
Domestic Protection Business
Protection Marketplace Prudential Strategies
Mature, low-growth industry Focus on returns through capital management, cost-effective distribution Overcapacity Expanded third party distribution is Commodity products Individual growth opportunity Life Quality business: avoid inappropriate financing Results largely uncorrelated to U.S. equity markets
Client focus on stretching Maintain market position: #2 in Group Life(1) benefit dollars Focus on returns: case selection; Optional life purchases appropriate pricing Group contribute to growth Insurance Cultivate optional life sales through prospects employer clients Deliver stable earnings and strong cash flows
1) Based on A.M. Best ranking of statutory premiums for the year ended December 31, 2008.
62 Investor Day 12.10.09
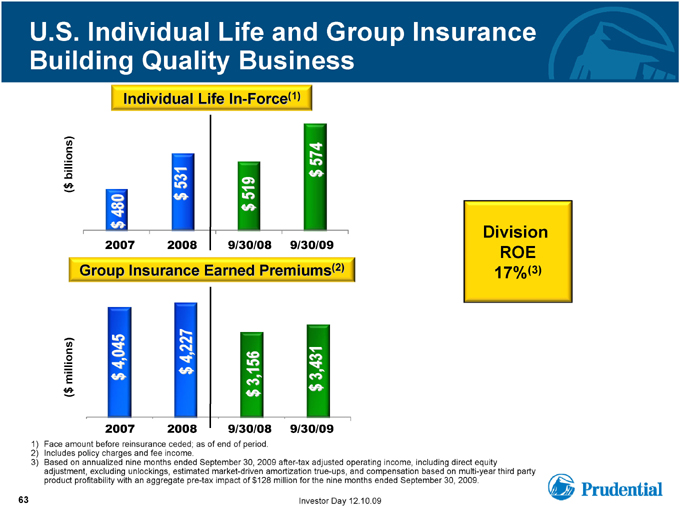
U.S. Individual Life and Group Insurance Building Quality Business
Individual Life In-Force(1)
($ millions) ($ billions)
$ 4,045 Group $ 480
2007 2007
2008 $ 4,227 Insurance 2008 $ 531 $ 3,156 Earned $ 519
9/30/08 9/30/08
9/30/09 $ 3,431 Premiums 9/30/09 $ 574
Division ROE 17%(3)
1) Face amount before reinsurance ceded; as of end of period.
2) Includes policy charges and fee income.
3) Based on annualized nine months ended September 30, 2009 after-tax adjusted operating income, including direct equity adjustment, excluding unlockings, estimated market-driven amortization true-ups, and compensation based on multi-year third party product profitability with an aggregate pre-tax impact of $128 million for the nine months ended September 30, 2009.
63 Investor Day 12.10.09
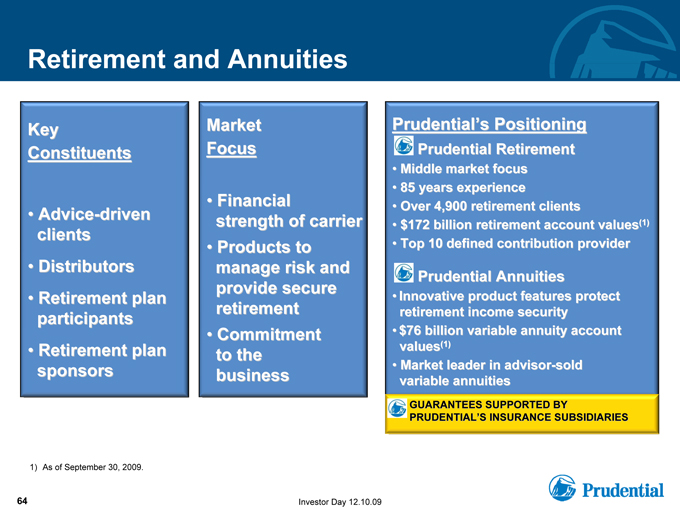
Retirement and Annuities
Key
Constituents
• Advice-driven clients
• Distributors
• Retirement plan participants
• Retirement plan sponsors
1) As of September 30, 2009.
Market Focus
• Financial strength of carrier
• Products to manage risk and provide secure retirement
• Commitment to the business
Prudential’s Positioning
Prudential Retirement
• Middle market focus
• 85 years experience
• Over 4,900 retirement clients
• $172 billion retirement account values(1)
• Top 10 defined contribution provider
Prudential Annuities
• Innovative product features protect retirement income security
• $76 billion variable annuity account values(1)
• Market leader in advisor-sold variable annuities
GUARANTEES SUPPORTED BY PRUDENTIAL’S INSURANCE
SUBSIDIARIES
64 Investor Day 12.10.09
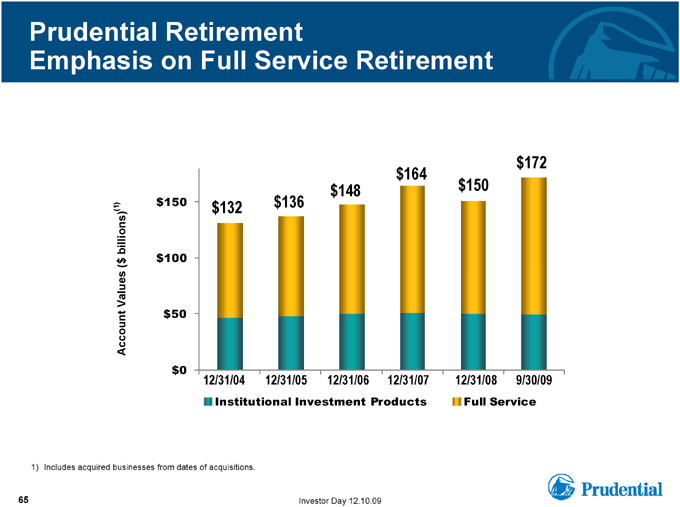
Prudential Retirement
Emphasis on Full Service Retirement
$132 $136 $148 $164 $150 $172
$150 $100 $50 $0
Account Values ($ billions)(1)
12/31/04 12/31/05 12/31/06 12/31/07 12/31/08 9/30/09
Institutional Investment Products Full Service
1) Includes acquired businesses from dates of acquisitions.
65 Investor Day 12.10.09
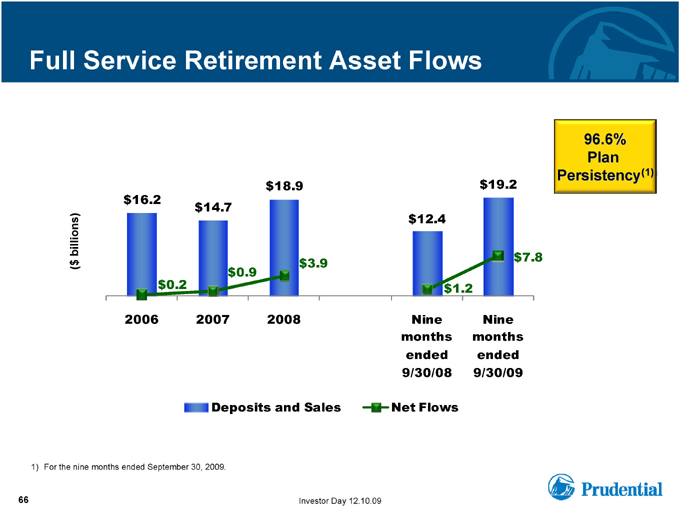
Full Service Retirement Asset Flows
($ billions)
$16.2 $0.2 $14.7 $0.9 $18.9 $3.9
2006 2007 2008
$12.4 $1.2 $19.2 $7.8
Nine months ended 9/30/08
Nine months ended 9/30/09
96.6% Plan Persistency(1)
Deposits and Sales
Net Flows
1) For the nine months ended September 30, 2009.
66 Investor Day 12.10.09
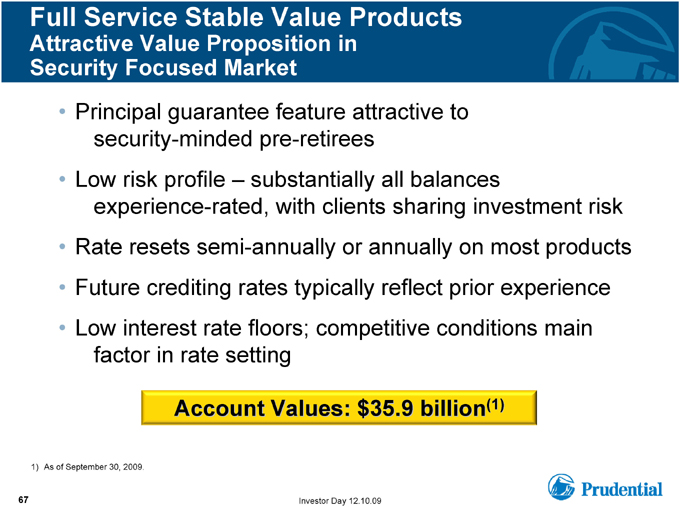
Full Service Stable Value Products
Attractive Value Proposition in Security Focused Market
• Principal guarantee feature attractive to security-minded pre-retirees
• Low risk profile – substantially all balances experience-rated, with clients sharing investment risk
• Rate resets semi-annually or annually on most products
• Future crediting rates typically reflect prior experience
• Low interest rate floors; competitive conditions main
factor in rate setting
Account Values: $35.9 billion(1)
1) As of September 30, 2009.
67 Investor Day 12.10.09
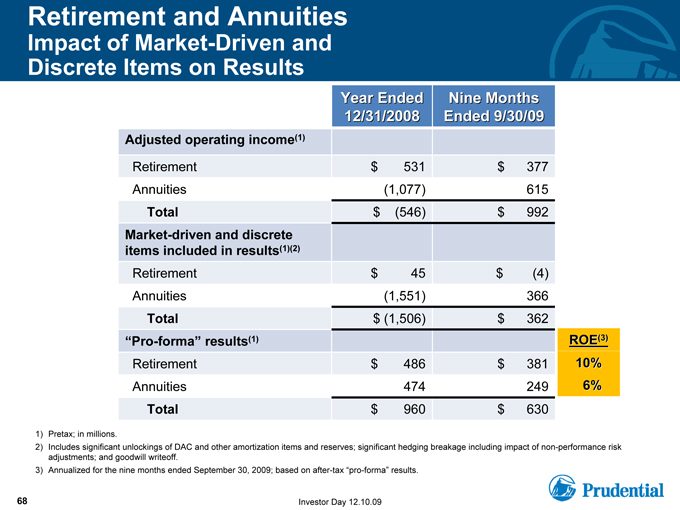
Retirement and Annuities
Impact of Market-Driven and
Discrete Items on Results
Year Ended 12/31/2008
Nine Months Ended 9/30/09
Adjusted operating income(1)
Retirement
$531
$377
Annuities
(1,077)
615
Total
$(546)
$992
Market-driven and discrete items included in results(1)(2)
Retirement
$45
$(4)
Annuities
(1,551)
366
Total
$(1,506)
$362
ROE(3)
“Pro-forma” results(1)
10%
Retirement
$486
$381
6%
Annuities
474
249
Total
$960
$630
1) Pretax; in millions.
2) Includes significant unlockings of DAC and other amortization items and reserves; significant hedging breakage including impact of non-performance risk adjustments; and goodwill writeoff.
3) Annualized for the nine months ended September 30, 2009; based on after-tax “pro-forma” results.
68 Investor Day 12.10.09
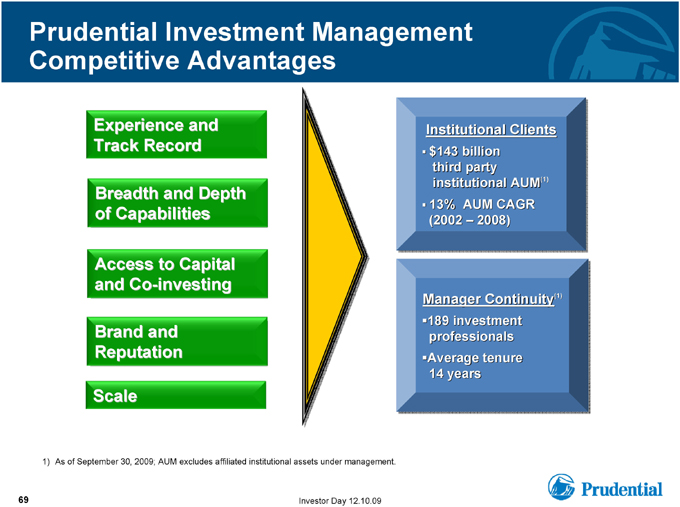
Prudential Investment Management Competitive Advantages
Experience and Track Record
Breadth and Depth of Capabilities
Access to Capital and Co-investing
Brand and Reputation
Scale
Institutional Clients
$143 billion third party institutional AUM(1)
13% AUM CAGR (2002 - 2008)
Manager Continuity(1)
189 investment professionals
Average tenure 14 years
1) As of September 30, 2009; AUM excludes affiliated institutional assets under management.
69 Investor Day 12.10.09
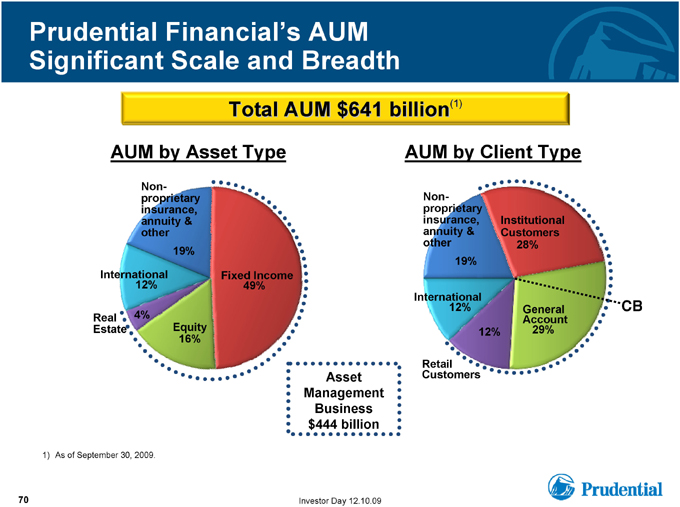
Prudential Financial’s AUM
Significant Scale and Breadth
Total AUM $641 billion(1)
AUM by Asset Type
Non-Proprietary insurance, annuity & other 19%
International 12%
Fixed Income 49%
Real Estate 4%
Equity 16%
AUM by Client Type
Non-proprietary insurance, annuity & other 19%
Institutional Customers 28%
International 12%
General Account 29%
12%
Retail Customers
Asset Management Business $444 billion
1) As of September 30, 2009.
70 Investor Day 12.10.09

Broad Asset Class Capabilities
Assets Under Management
$444 Billion(1)
Public Fixed Income 48% Public Equity 29% 11% Private Fixed Income
5% 7% Real Estate
Commercial Mortgages
Asset Management Revenue
$1.7 Billion(2)
Public
Equity Fixed 24% Income Real Estate
9% Public 44% Fixed 12% Income Private Fixed 11% Income
Commercial Mortgages
1) As of September 30, 2009.
2) For the year ended December 31, 2008; percentages based on segment revenues excluding mutual fund distribution revenues and revenues not associated with operating activities.
3) Includes revenue from management of public fixed income securities by Jennison Associates.
71 Investor Day 12.10.09
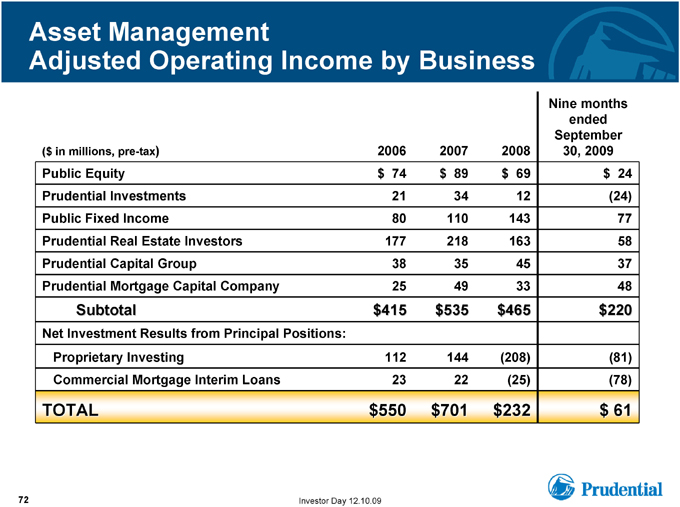
Asset Management
Adjusted Operating Income by Business
($ in millions, pre-tax) 2006 2007 2008
Nine months ended September 30, 2009
Public Equity $ 74 $ 89 $ 69 $ 24
Prudential Investments 21 34 12 (24)
Public Fixed Income 80 110 143 77
Prudential Real Estate Investors 177 218 163 58
Prudential Capital Group 38 35 45 37
Prudential Mortgage Capital Company 25 49 33 48
Subtotal $415 $535 $465 $220
Net Investment Results from Principal Positions:
Proprietary Investing 112 144 (208) (81)
Commercial Mortgage Interim Loans 23 22 (25) (78)
TOTAL $550 $701 $232 $ 61
72 Investor Day 12.10.09
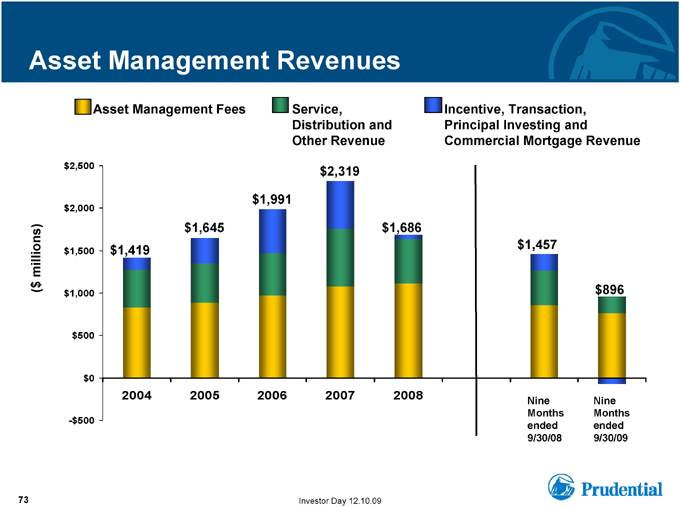
Asset Management Revenues
Asset Management Fees
Service Distribution and Other Revenue
Incentive, Transaction, Principal Investing and Commercial Mortgage Revenue
-$500 $0 $500 $1,000 $1,500 $2,000 $2,500
($ millions)
$1,419 $1,645 $1,991 $2,319 $1,686 $1,457 $896
2004 2005 2006 2007 2008
Nine months ended 9/30/08
Nine Months ended 9/30/09
73 Investor Day 12.10.09
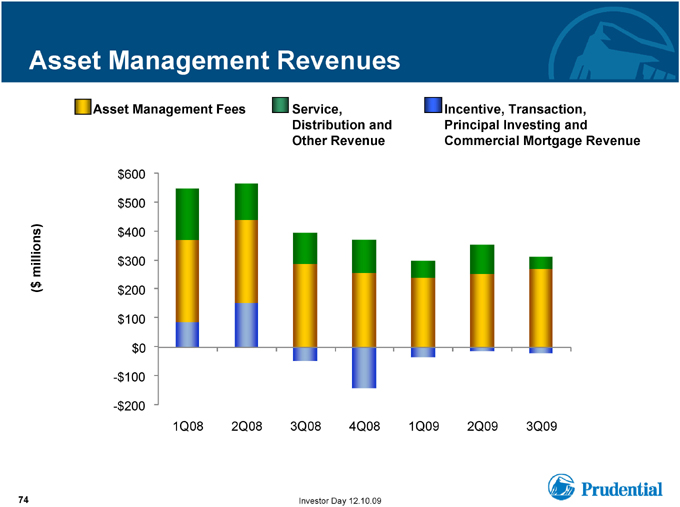
Asset Management Revenues
Asset Management Fees Service, Incentive, Transaction, Distribution and Principal Investing and Other Revenue Commercial Mortgage Revenue
$600
$500
$400 $ millions) $300
($200 $100 $0
-$100
-$200
1Q08 2Q08 3Q08 4Q08 1Q09 2Q09 3Q09
74 Investor Day 12.10.09
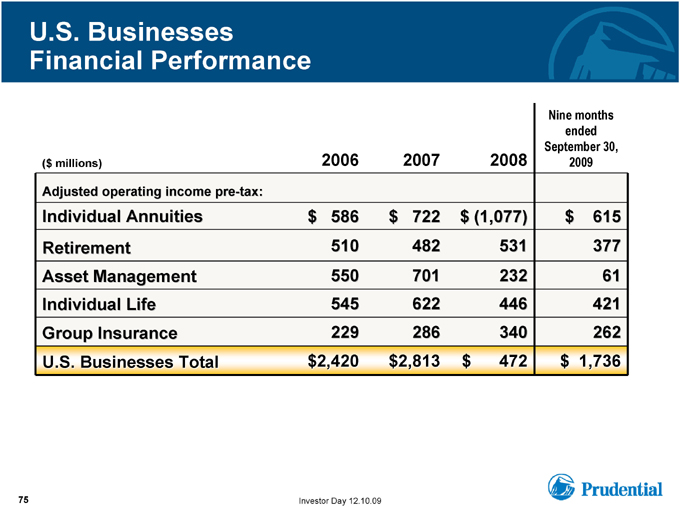
U.S. Businesses Financial Performance
($ millions)
Adjusted operating income pre-tax:
Individual Annuities
Retirement
Asset Management
Individual Life
Group Insurance
U.S. Businesses Total
2006 $586 510 550 545 229 $2,420
2007 $722 482 701 622 286 $2,813
2008 $(1,077) 531 232 446 340 $472
Nine months ended September 30, 2009 $615 377 61 421 262 $1,736
75 Investor Day 12.10.09

PRUDENTIAL FINANCIAL, INC.
INDIVIDUAL ANNUITIES
STEVE PELLETIER
PRESIDENT,
PRUDENTIAL ANNUITIES
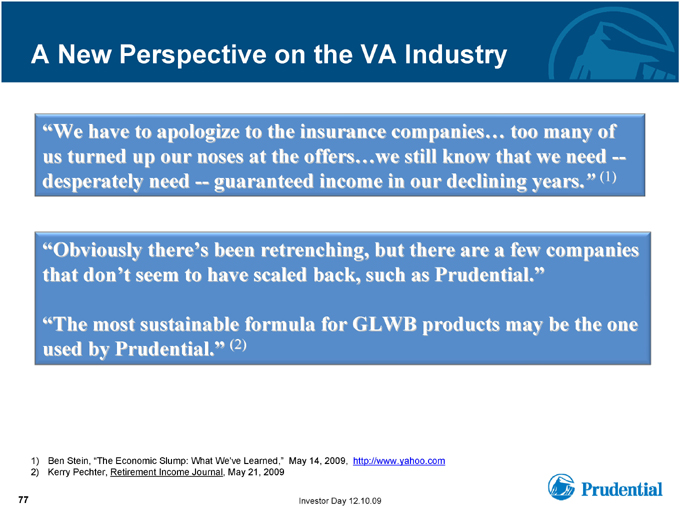
A New Perspective on the VA Industry
“We have to apologize to the insurance companies… too many of us turned up our noses at the offers…we still know that we need —desperately need — guaranteed income in our declining years.” (1)
“Obviously there’s been retrenching, but there are a few companies that don’t seem to have scaled back, such as Prudential.”
“The most sustainable formula for GLWB products may be the one used by Prudential.” (2)
1) Ben Stein, “The Economic Slump: What We’ve Learned,” May 14, 2009, http://www.yahoo.com
2) Kerry Pechter, Retirement Income Journal, May 21, 2009
77 Investor Day 12.10.09
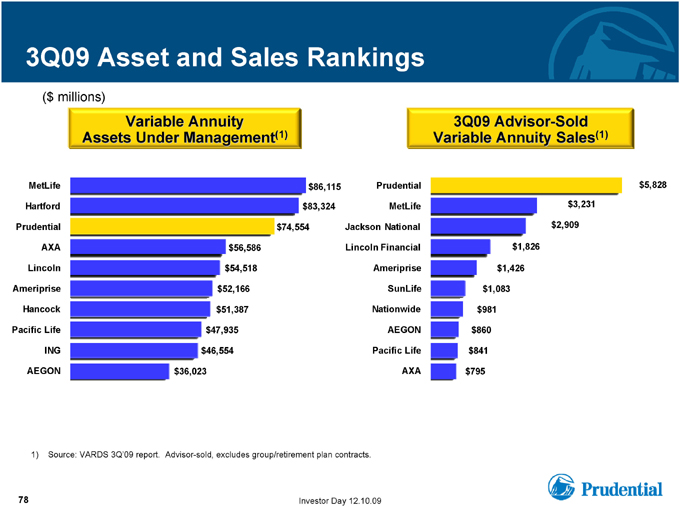
3Q09 Asset and Sales Rankings
($ millions)
Variable Annuity Assets Under Management(1)
MetLife $86,115 Hartford $83,324
Prudential $74,554 AXA $56,586 Lincoln $54,518 Ameriprise $52,166 Hancock $51,387 Pacific Life $47,935 ING $46,554 AEGON $36,023
3Q09 Advisor-Sold Variable Annuity Sales(1)
Prudential $5,828 MetLife $3,231 Jackson National $2,909 Lincoln Financial $1,826
Ameriprise $1,426 SunLife $1,083 Nationwide $981 AEGON $860 Pacific Life $841 AXA $795
1) Source: VARDS 3Q’09 report. Advisor-sold, excludes group/retirement plan contracts.
78 Investor Day 12.10.09
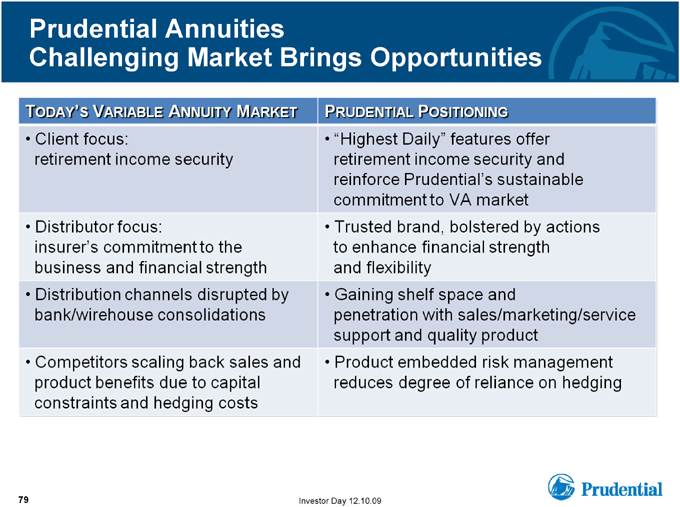
Prudential Annuities
Challenging Market Brings Opportunities
TODAY’S VARIABLE ANNUITY MARKET
Client focus:
retirement income security
Distributor focus:
insurer’s commitment to the
business and financial strength
Distribution channels disrupted by bank/wirehouse consolidations
Competitors scaling back sales and product benefits due to capital constraints and hedging costs
PRUDENTIAL POSITIONING
“Highest Daily” features offer retirement income security and reinforce Prudential’s sustainable commitment to VA market
Trusted brand, bolstered by actions to enhance financial strength and flexibility
Gaining shelf space and penetration with sales/marketing/service support and quality product
Product embedded risk management reduces degree of reliance on hedging
79 Investor Day 12.10.09

A Distinctive Value Proposition for Retirement-Focused Clients
PRUDENTIAL ANNUITIES SM
THE HIGHEST DAILY COMPANY SM
80 Investor Day 12.10.09

Serving Today’s Client Needs Award Winning Benefits and Service
2005 2006 2007 2008 2009
Awarded “Best Living Benefits” by
Boomer Market Advisor Magazine for record fifth consecutive year
1st
Place
First place award for service and support to advisors
81 Investor Day 12.10.09
Prudential Annuities A Differentiated Approach
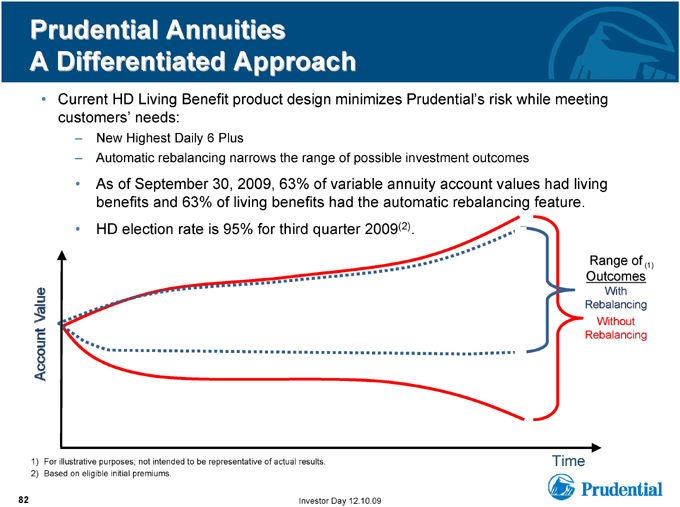
• Current HD Living Benefit product design minimizes Prudential’s risk while meeting customers’ needs:
– New Highest Daily 6 Plus
– Automatic rebalancing narrows the range of possible investment outcomes
• As of September 30, 2009, 63% of variable annuity account values had living benefits and 63% of living benefits had the automatic rebalancing feature.
• HD election rate is 95% for third quarter 2009(2).
Range of (1) Outcomes With Rebalancing Without Rebalancing Account value
1) For illustrative purposes; not intended to be representative of actual results. Time
2) Based on eligible initial premiums.
82 Investor Day 12.10.09
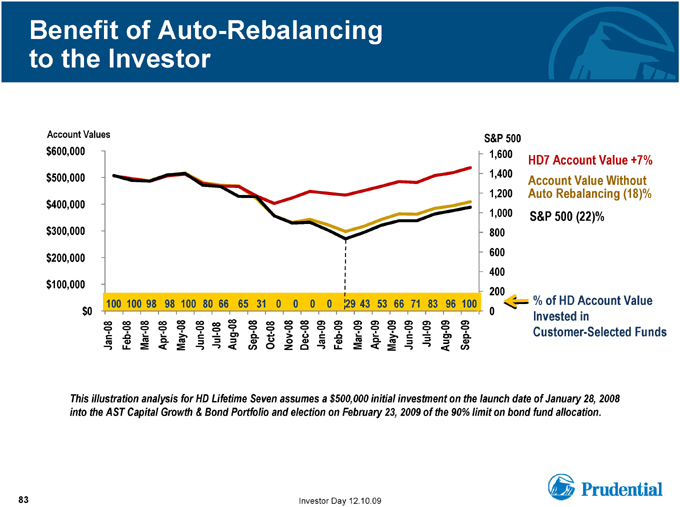
Benefit of Auto-Rebalancing to the Investor
Account Values S&P 500 $600,000 1,600
HD7 Account Value +7% $500,000 1,400 Account Value Without $400,000 1,200 Auto Rebalancing (18)% 1,000 S&P 500 (22)% $300,000 800 600 $200,000 400 $100,000 200
$0 100 100 98 98 100 80 66 65 31 0 0 0 0 29 43 53 66 71 83 96 100 0 % of HD Account Value Invested in
Jan-08 Feb-08 Mar-08 Apr-08 May-08 Jun-08 Jul-08 Aug-08 Sep-08 Oct-08 Nov-08 Dec-08 Jan-09 Feb-09 Mar-09 Apr-09 May-09 Jun-09 Jul-09 Aug-09 Sep-09
Customer-Selected Funds
This illustration analysis for HD Lifetime Seven assumes a $500,000 initial investment on the launch date of January 28, 2008 into the AST Capital Growth & Bond Portfolio and election on February 23, 2009 of the 90% limit on bond fund allocation.
83 Investor Day 12.10.09
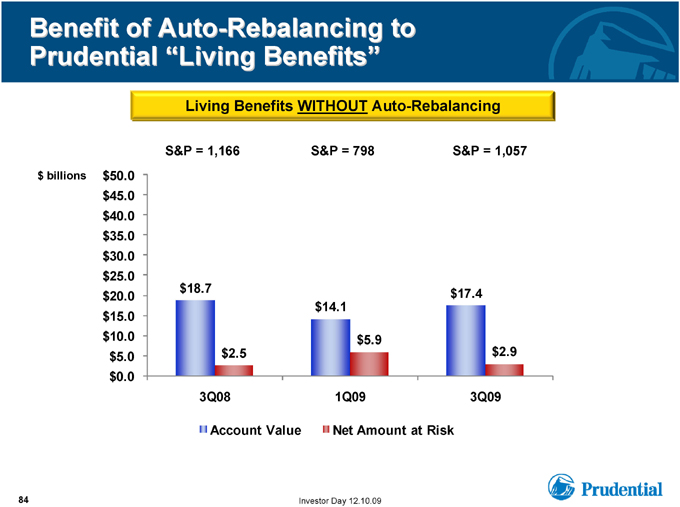
Benefit of Auto-Rebalancing to Prudential “Living Benefits”
Living Benefits WITHOUT Auto-Rebalancing
S&P = 1,166 S&P = 798 S&P = 1,057 $ billions $50.0
$45.0
$40.0
$35.0
$30.0
$25.0 $18.7
$20.0 $17.4
$14.1
$15.0
$10.0 $5.9 $5.0 $2.5 $2.9 $0.0 3Q08 1Q09 3Q09
Account Value Net Amount at Risk
84 Investor Day 12.10.09
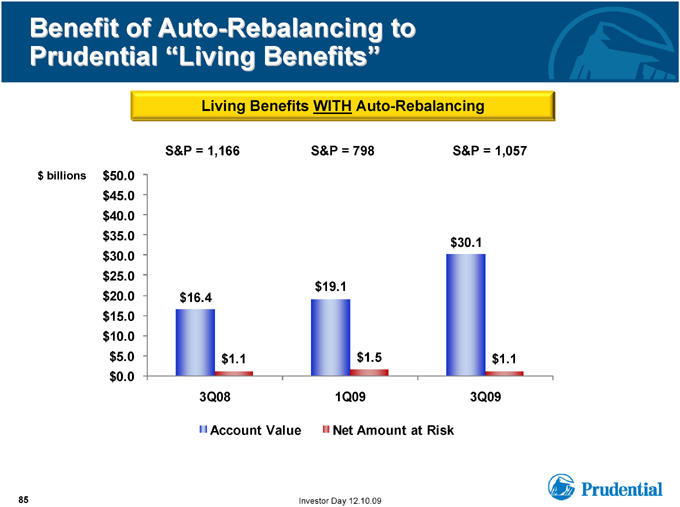
Benefit of Auto-Rebalancing to Prudential “Living Benefits”
Living Benefits WITH Auto-Rebalancing
S&P = 1,166 S&P = 798 S&P = 1,057 $ billions $50.0
$45.0
$40.0
$35.0
$30.1
$30.0
$25.0
$19.1
$20.0 $16.4
$15.0
$10.0 $5.0 $1.1 $1.5 $1.1 $0.0 3Q08 1Q09 3Q09
Account Value Net Amount at Risk
85 Investor Day 12.10.09
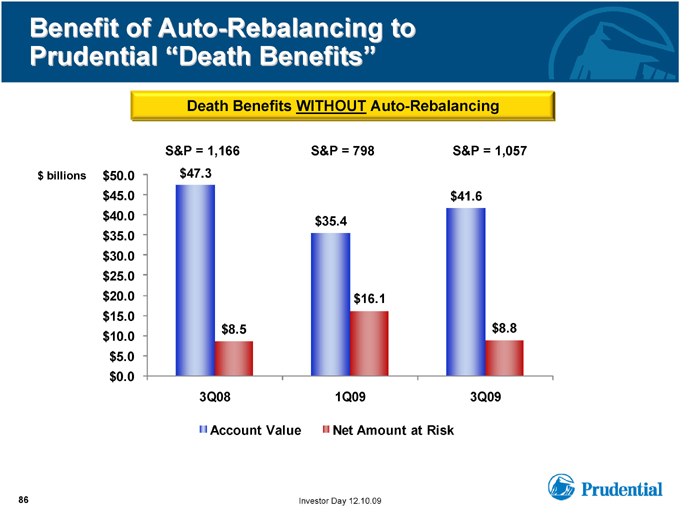
Benefit of Auto-Rebalancing to Prudential “Death Benefits”
Death Benefits WITHOUT Auto-Rebalancing
S&P = 1,166 S&P = 798 S&P = 1,057 $ billions $50.0 $47.3
$45.0 $41.6
$40.0 $35.4
$35.0
$30.0
$25.0
$20.0 $16.1
$15.0 $8.8 $8.5
$10.0 $5.0 $0.0
3Q08 1Q09 3Q09
Account Value Net Amount at Risk
86 Investor Day 12.10.09
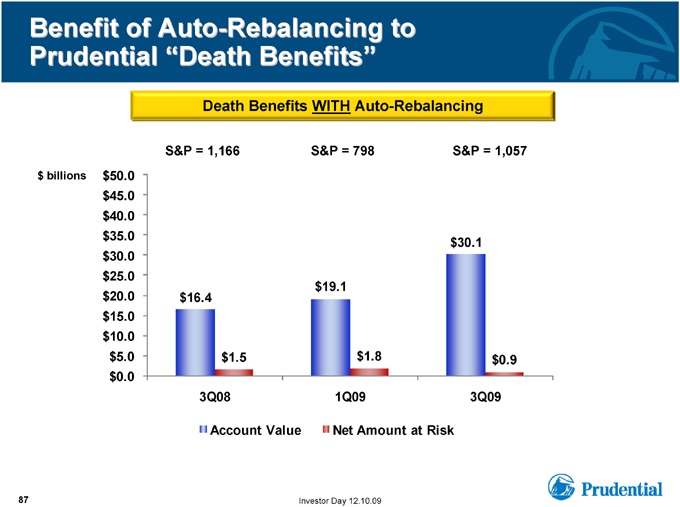
Benefit of Auto-Rebalancing to Prudential “Death Benefits”
Death Benefits WITH Auto-Rebalancing
S&P = 1,166 S&P = 798 S&P = 1,057 $ billions $50.0
$45.0
$40.0
$35.0
$30.1
$30.0
$25.0
$19.1
$20.0 $16.4
$15.0
$10.0 $5.0 $1.5 $1.8 $0.9 $0.0 3Q08 1Q09 3Q09
Account Value Net Amount at Risk
87 Investor Day 12.10.09
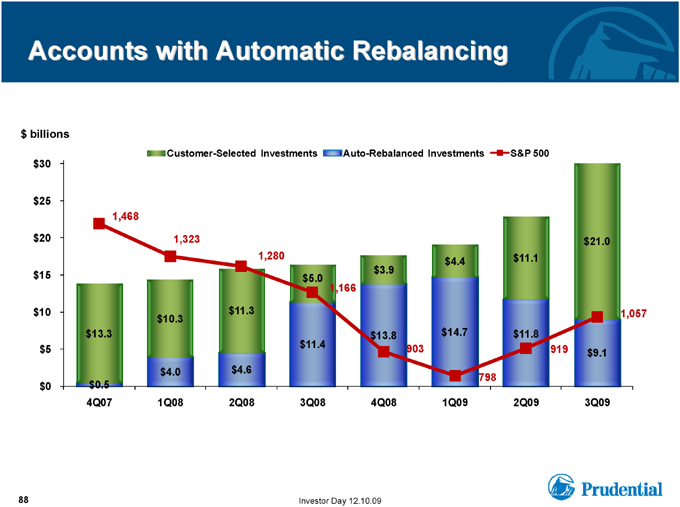
Accounts with Automatic Rebalancing
$ billions
Customer-Selected Investments Auto-Rebalanced Investments S&P 500 $30
$25
1,468
$20 1,323 $21.0 1,280 $11.1
$4.4
$3.9
$15 $5.0 1,166
$10 $11.3 1,057
$10.3
$13.3 $13.8 $14.7 $11.8
$11.4 903
$5 919 $9.1
$4.0 $4.6
798
$0 $0.5
4Q07 1Q08 2Q08 3Q08 4Q08 1Q09 2Q09 3Q09
88 Investor Day 12.10.09
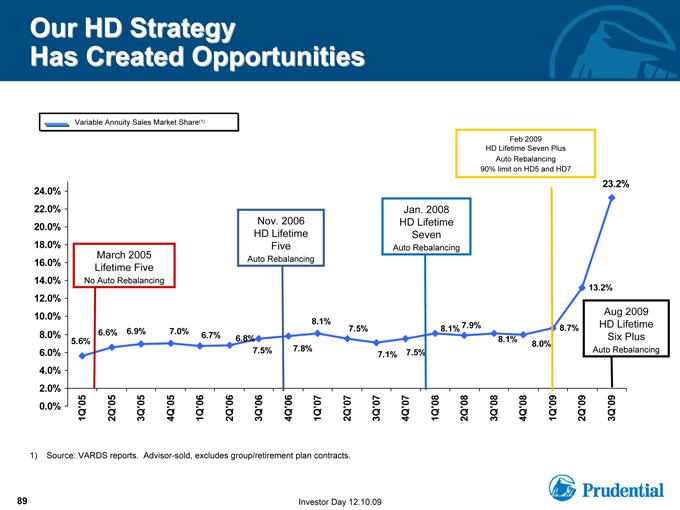
Our HD Strategy Has Created Opportunities
Variable Annuity Sales Market Share(1)
March 2005 Lifetime Five No Auto Rebalancing
Nov. 2006 HD Lifetime Five Auto Rebalancing
Jan. 2008 HD Lifetime Seven Auto Rebalancing
Feb 2009 HD Lifetime Seven Plus Auto Rebalancing 90% limit on HD5 and
HD7
Aug 2009 HD Lifetime Six Plus Auto Rebalancing
0.0% 2.0% 4.0% 6.0% 8.0% 10.0% 12.0% 14.0% 16.0% 18.0% 20.0% 22.0% 24.0%
8.7% 6.8% 8.1% 5.6% 23.2% 13.2% 8.1% 8.1% 8.0% 7.9%
7.1% 7.5% 7.5% 7.5% 7.8% 6.6% 6.9% 7.0% 6.7%
1Q’05 2Q’05 3Q’05 4Q’05
1Q’06 2Q’06 3Q’06 4Q’06
1Q’07 2Q’07 3Q’07 4Q’07
1Q’08 2Q’08 3Q’08 4Q’08
1Q’09 2Q’09 3Q’09
1) Source: VARDS reports. Advisor-sold, excludes group/retirement plan contracts.
89 Investor Day 12.10.09
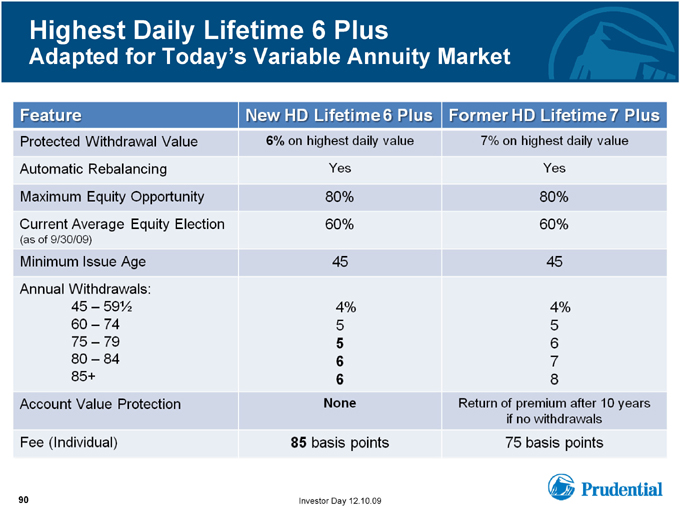
Highest Daily Lifetime 6 Plus Adapted for Today’s Variable Annuity Market
Feature
Protected Withdrawal Value
Automatic Rebalancing
Maximum Equity Opportunity
Current Average Equity Election (as of 9/30/09)
Minimum Issue Age
Annual Withdrawals:
45 - 591/2 60 - 74 75 - 79 80 - - 84 85+
Account Value Protection Fee (Individual)
New HD Lifetime 6 Plus
6% on highest daily value
Yes
80%
60%
45
4%
5 5 6 6
None
85 basis points
Former HD Lifetime 7 Plus
7% on highest daily value
Yes
80%
60%
45
4%
5 6 7 8
Return of premium after 10 years if no withdrawals
75 basis points
90 Investor Day 12.10.09
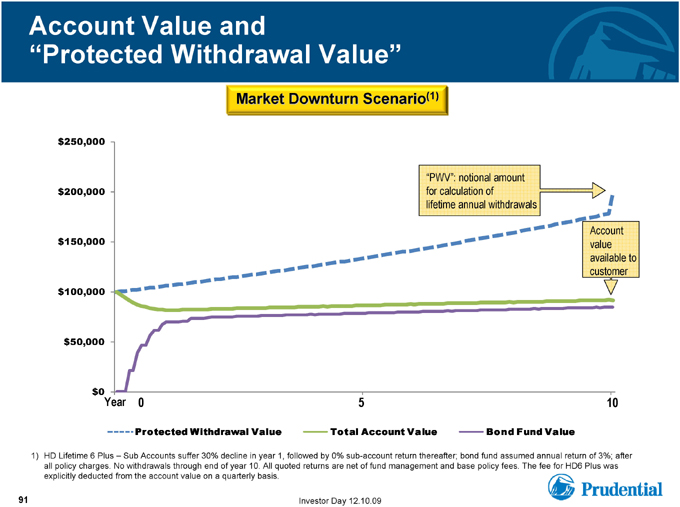
Account Value and “Protected Withdrawal Value”
Market Downturn Scenario(1)
$250,000 $200,000 $150,000 $100,000 $50,000 $0
Year 0 5 10
“PWV”: notional amount for calculation of lifetime annual withdrawals
Account value available to customer
Protected Withdrawal Value
Total Account Value
Bond Fund Value
1) HD Lifetime 6 Plus – Sub Accounts suffer 30% decline in year 1, followed by 0% sub-account return thereafter; bond fund assumed annual return of 3%; after all policy charges. No withdrawals through end of year 10. All quoted returns are net of fund management and base policy fees. The fee for HD6 Plus was explicitly deducted from the account value on a quarterly basis.
91 Investor Day 12.10.09
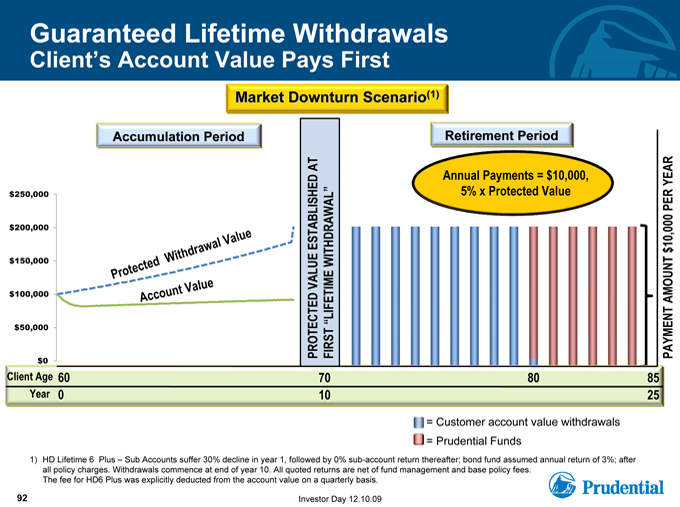
Guaranteed Lifetime Withdrawals
Client’s Account Value Pays First
Market Downturn Scenario(1)
Accumulation Period
$250,000 $200,000 $150,000 $100,000 $50,000 $0
Protected Withdrawal Value
Account Value
PROTECTED VALUE ESTABLISHED AT FIRST “LIFETIME WITHDRAWAL”
Retirement Period
Annual Payments = $10,000, 5% x Protected Value
PAYMENT AMOUNT $10,000 PER YEAR
Client Age 60 70 80 85
Year 0 10 25
= Customer account value withdrawals
= Prudential Funds
1) HD Lifetime 6 Plus – Sub Accounts suffer 30% decline in year 1, followed by 0% sub-account return thereafter; bond fund assumed annual return of 3%; after all policy charges. Withdrawals commence at end of year 10. All quoted returns are net of fund management and base policy fees.
The fee for HD6 Plus was explicitly deducted from the account value on a quarterly basis.
92 Investor Day 12.10.09
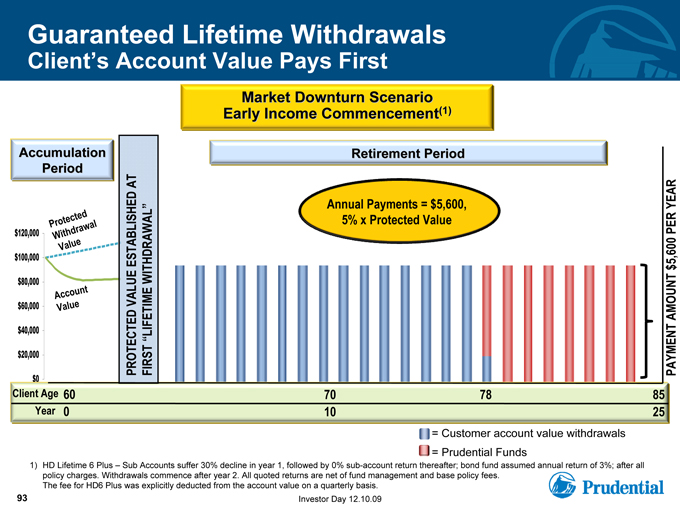
Guaranteed Lifetime Withdrawals Client’s Account Value Pays First
Market Downturn Scenario Early Income Commencement(1)
Retirement Period
Accumulation Period
$0 $20,000 $40,000 $60,000 $80,000 $100,000 $120,000
Client Age 60 70 78 85
Year 0 10 25
PROTECTED VALUE ESTABLISHED AT FIRST “LIFETIME WITHDRAWAL”
Protected Withdrawal Value
Account Value
Annual Payments = $5,600,
5% x Protected Value
PAYMENT AMOUNT $5,600 PER YEAR
= Customer account value withdrawals
= Prudential Funds
1) HD Lifetime 6 Plus – Sub Accounts suffer 30% decline in year 1, followed by 0% sub-account return thereafter; bond fund assumed annual return of 3%; after all policy charges. Withdrawals commence after year 2. All quoted returns are net of fund management and base policy fees.
The fee for HD6 Plus was explicitly deducted from the account value on a quarterly basis.
93 Investor Day 12.10.09
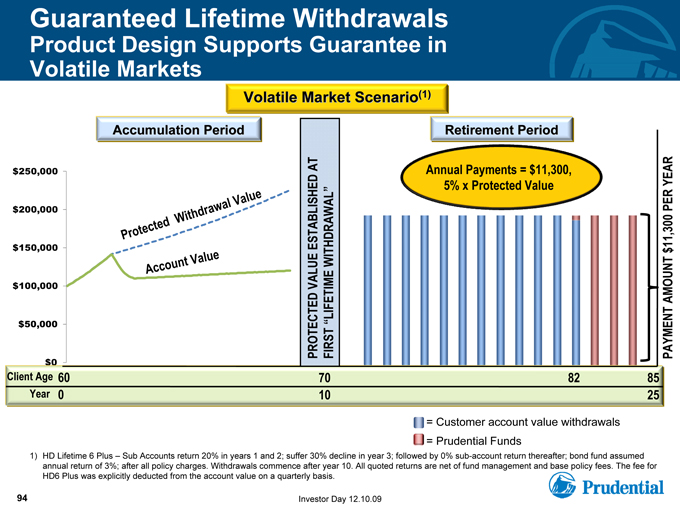
Guaranteed Lifetime Withdrawals Product Design Supports Guarantee in
Volatile Markets
Volatile Market Scenario(1)
Accumulation Period
Retirement Period
Client Age 60 70 82 85
Year 0 10 25
$0 $50,000 $100,000 $150,000 $200,000 $250,000
Protected Withdrawal Value
Account Value
PROTECTED VALUE ESTABLISHED AT FIRST “LIFETIME WITHDRAWAL”
Annual Payments = $ 11,300,
5% x Protected Value
PAYMENT AMOUNT $11,300 PER YEAR
= Customer account value withdrawals
= Prudential Funds
1) HD Lifetime 6 Plus – Sub Accounts return 20% in years 1 and 2; suffer 30% decline in year 3; followed by 0% sub-account return thereafter; bond fund assumed annual return of 3%; after all policy charges. Withdrawals commence after year 10. All quoted returns are net of fund management and base policy fees. The fee for HD6 Plus was explicitly deducted from the account value on a quarterly basis.
94 Investor Day 12.10.09
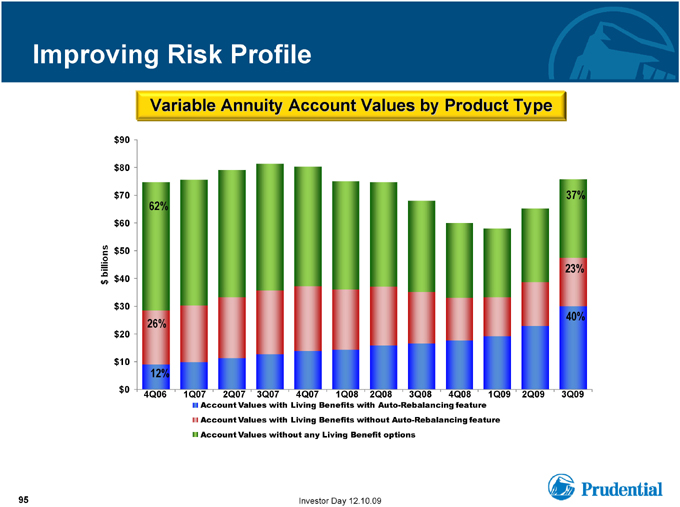
Improving Risk Profile
Variable Annuity Account Values by Product Type
$90
$80
$70 62% 37%
$60
$50 billions 23% $ $40
$30 40%
26%
$20
$10
12%
$0
4Q06 1Q07 2Q07 3Q07 4Q07 1Q08 2Q08 3Q08 4Q08 1Q09 2Q09 3Q09
Account Values with Living Benefits with Auto-Rebalancing feature Account Values with Living Benefits without Auto-Rebalancing feature Account Values without any Living Benefit options
95 Investor Day 12.10.09
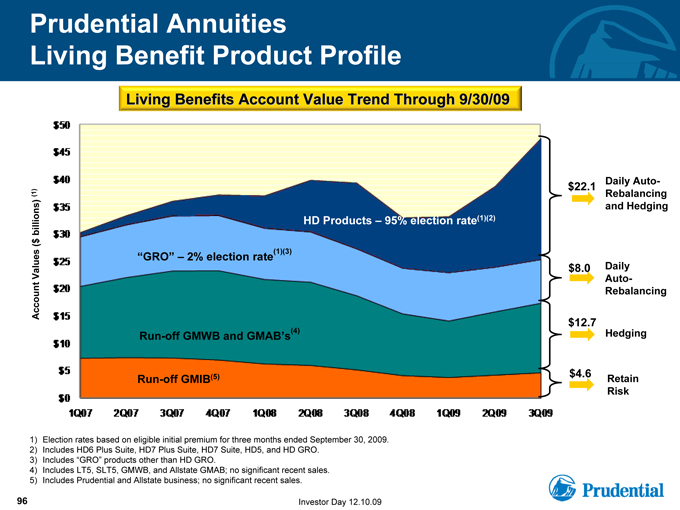
Prudential Annuities
Living Benefit Product Profile
Living Benefits Account Value Trend Through 9/30/09
Daily Auto-
$22.1
(1) | | Rebalancing and Hedging billions) HD Products – 95% election rate(1)(2) $ |
( (1)(3)
“GRO” – 2% election rate Daily Values $8.0 Auto-Account Rebalancing (4) $12.7 Run-off GMWB and GMAB’s Hedging
$50 $45 $40 $35 $30 $25 $20 $15 $10 $5 $0
1Q07 2Q07 3Q07 4Q07 1Q08 2Q08 3Q08 4Q08 1Q09 2Q09 3Q09
Run-off GMIB Retain Risk
1) Election rates based on eligible initial premium for three months ended September 30, 2009.
2) Includes HD6 Plus Suite, HD7 Plus Suite, HD7 Suite, HD5, and HD GRO.
3) Includes “GRO” products other than HD GRO.
4) Includes LT5, SLT5, GMWB, and Allstate GMAB; no significant recent sales.
5) Includes Prudential and Allstate business; no significant recent sales.
96 Investor Day 12.10.09
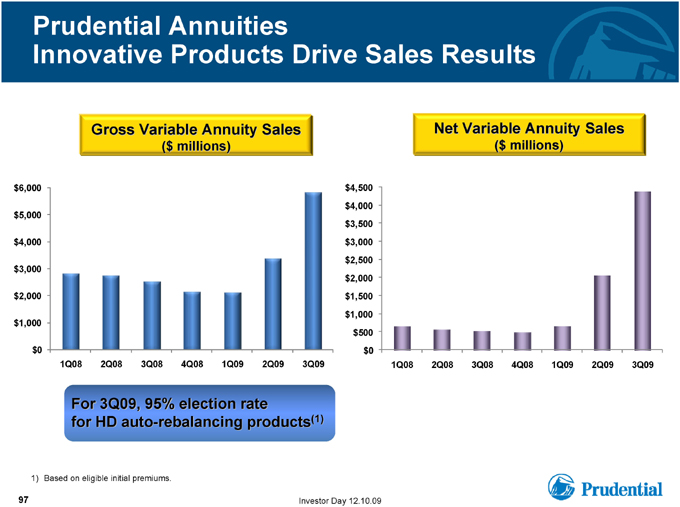
Prudential Annuities
Innovative Products Drive Sales Results
Gross Variable Annuity Sales
($ millions)
$6,000 $5,000 $4,000 $3,000 $2,000 $1,000
$0
1Q08 2Q08 3Q08 4Q08 1Q09 2Q09 3Q09
Net Variable Annuity Sales
($ millions)
$4,500 $4,000 $3,500 $3,000 $2,500 $2,000 $1,500 $1,000 $500 $0
1Q08 2Q08 3Q08 4Q08 1Q09 2Q09 3Q09
For 3Q09, 95% election rate for HD auto-rebalancing products(1)
1) Based on eligible initial premiums.
97 Investor Day 12.10.09
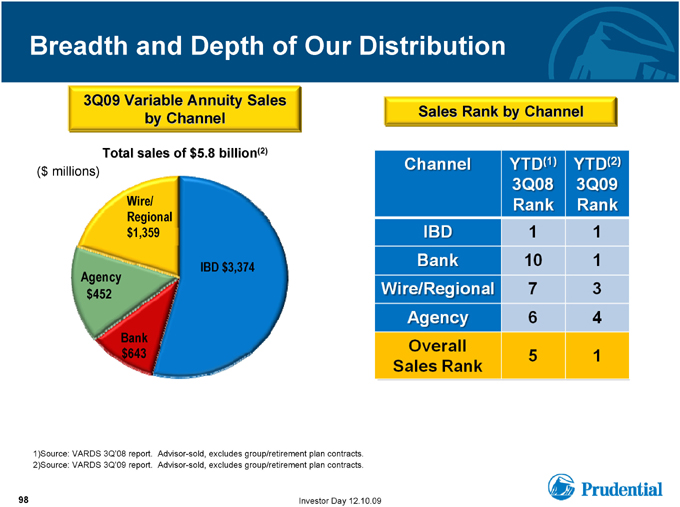
Breadth and Depth of Our Distribution
3Q09 Variable Annuity Sales by Channel
Total sales of $5.8 billion(2)
($ millions)
Wire/ Regional $1,359
IBD $3,374 Agency $452
Bank $643
Sales Rank by Channel
1)Source: VARDS 3Q’08 report. Advisor-sold, excludes group/retirement plan contracts. 2)Source: VARDS 3Q’09 report. Advisor-sold, excludes group/retirement plan contracts.
98 Investor Day 12.10.09
Channel YTD (1) 3Q08 Rank YTD (2) 3Q09 Rank
IBD 1 1
Bank 10 1
Wire/Regional 7 3
Agency 6 4
Overall Sales Rank 5 1
Summary
• “Highest Daily” positioning offers a distinctive and sustainable value proposition for both clients and shareholders
• HD product design includes auto-rebalancing to mitigate Prudential’s risk and cost by protecting account values in adverse markets
• Trusted brand, financial strength and flexibility, and commitment to market bolster appeal to clients and advisers
• Expanding distribution and market share while improving risk profile
99 Investor Day 12.10.09